


Abstract
Non-destructive characterization of electromagnetic (EM) wave propagation properties in drill cores is gaining prominence as a foundation for reliable geophysical inversion, improved rock-physics modeling, and increasingly data-driven mineral exploration workflows. Lab-based rock characterization requires benchmarks that link the density, elastic, electrical, magnetic, and EM properties of studied cores to lithology and mineralization, enabling more accurate interpretation of geophysical data. This study develops a robust high-frequency EM (HFEM) wave velocity measurement technique and incorporates it within a standardized non-destructive framework validated across multiple mineral systems in Newfoundland and Labrador, Canada. The developed method derives EM velocities from two-way travel time through drill cores positioned above a metallic reflector, supported by finite-difference time-domain simulations to optimize antenna frequency and test geometry. A repeatable signal-processing workflow was implemented to enhance reflection picking. Results reveal systematic EM velocity contrasts among host rocks and oxide or sulfide-bearing systems, with oxide-rich and massive sulfide intervals exhibiting higher density, elevated conductivity and susceptibility with strong EM attenuation. The integrated dataset shows that conductivity and magnetic susceptibility significantly influence EM velocity response and detectability limits. The proposed multi-parameter benchmark enables enhanced discrimination of lithological and mineralization controls in mineral exploration workflows and supports more accurate time–depth conversion in HFEM geophysical and ground-penetrating radar (GPR) methods.
1. Introduction
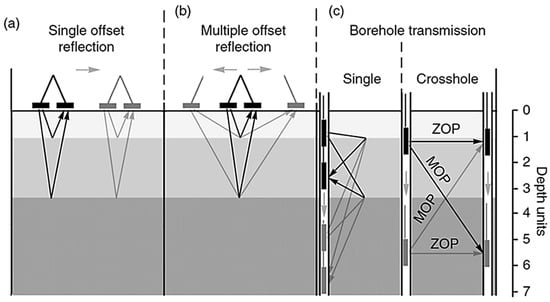
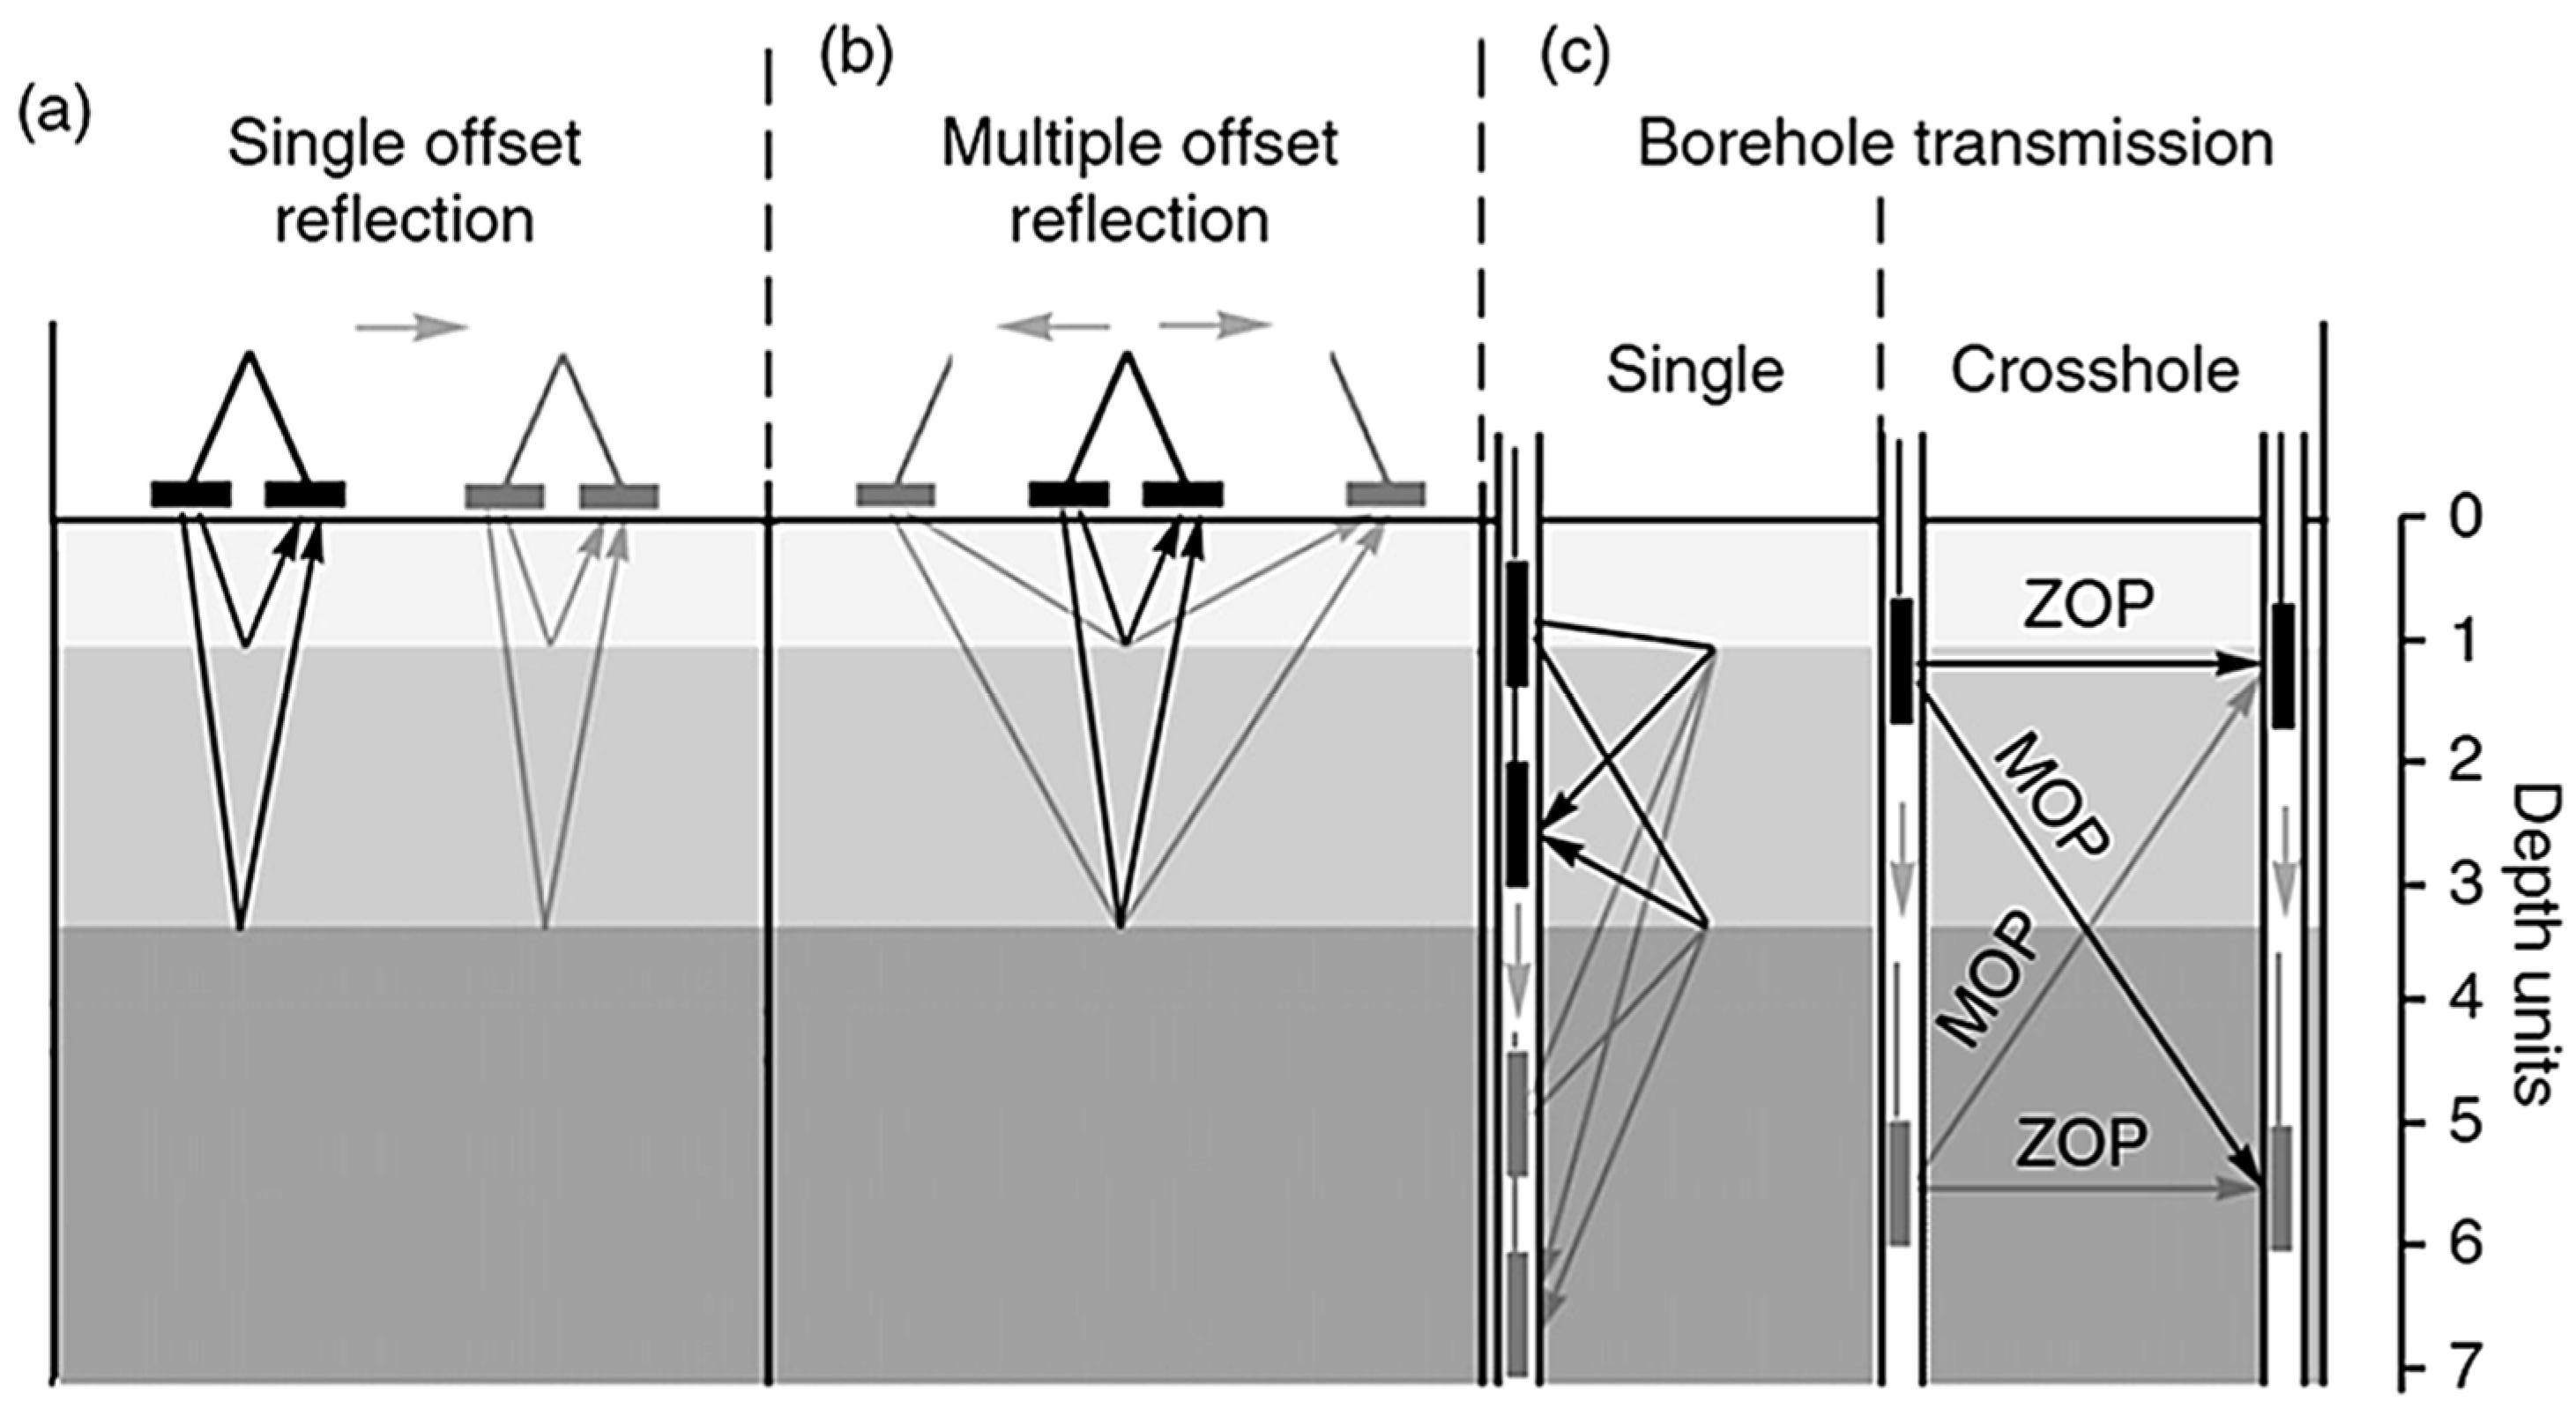
High-frequency electromagnetic (HFEM) and ground-penetrating radar (GPR) techniques are widely used in near-surface geophysics for subsurface exploration, infrastructure assessment, industrial inspection, and mineral exploration. These methods provide high-resolution imaging of shallow geological structures by propagating and reflecting electromagnetic (EM) waves [1,2,3,4,5]. Accurate interpretation of HFEM/GPR data requires reliable time–depth conversion, which depends directly on the EM wave velocity within the investigated medium. Uncertainty in EM velocity remains one of the principal sources of error in depth estimation, structural interpretation, and quantitative inversion. Several approaches have been developed for EM wave velocity estimation (Figure 1) [6,7,8,9].
Figure 1.
Comparison of ground-penetrating radar methods for in situ velocity estimation [6]: (a) single-offset reflection, (b) multi-offset reflection, and (c) borehole transmission (single-hole and cross hole configurations). Arrows indicate antenna movements and wave propagation paths.
Hyperbola fitting is commonly used in common-offset reflection surveys, where distinct point reflectors are present; however, it assumes velocity homogeneity and requires clear hyperbolic diffraction signatures from naturally occurring point reflectors. Alternatively, in the absence of a point reflector, EM velocity values are often taken from the published literature [6,7,8,9], providing rapid but potentially inaccurate estimates due to lithological heterogeneity. Empirical approaches, such as implanted scatterers, provide direct measurements but are invasive.
Multi-offset Common Midpoint (CMP) and Wide-Angle Reflection and Refraction (WARR) surveys estimate velocity by varying antenna separation and analyzing changes in two-way travel time (TWTT) [10]. CMP analysis, using moveout and semblance techniques, enables reliable estimation of velocity and depth estimation and has been widely applied in subsurface moisture studies [10,11]. Transillumination surveys, particularly in borehole environments, provide direct velocity measurements via transmission between opposing antennas [12]. Zero-offset profiling (ZOP) and multi-offset gathers allow tomographic reconstruction of subsurface properties [13].
Although effective under controlled conditions, many of these approaches require multi-offset acquisition, access to multiple boreholes, invasive installations, or complex data processing [14]. In practice, common-offset configurations, in which the transmitter and receiver antennas are maintained at a constant separation, are most frequently used due to operational efficiency and simplicity [7]. However, common-offset acquisition does not inherently permit direct velocity estimation. It therefore relies on assumed dielectric properties or the presence of subsurface point reflectors, which may not be available or representative [15].
To address this limitation, the study introduces a novel approach to directly measure EM wave velocity using an HFEM and rock core samples representative of various geological lithologies. Controlled measurements on homogeneous cores of known lithology and varying lengths validated the method. Optimized for common-offset HFEM setups where conventional velocity estimation is difficult, this method provides consistent and accurate velocity determination while eliminating the need for buried reflectors and minimizing dependence on complex dielectric lab testing [16,17,18,19,20,21,22,23,24,25], which can delay results and alter samples due to atmospheric exposure.
Robust signal-processing techniques were implemented to enhance the reliability of the measured data, to maximize signal clarity, and to isolate primary reflections. In parallel, finite-difference time-domain (FDTD) simulations using gprMax software (v3.1.7) were employed to model wave propagation behavior and assist in designing an optimal experimental configuration and antenna frequencies that maximize resolution and minimize artifacts during core analysis [26].
The applicability of the proposed method was further validated using heterogeneous diamond-drilled core intervals sourced from the Newfoundland and Labrador core storage library, representing varying lithologies and mineralization styles to ensure multi-commodity geological representation. These include magnetite-rich mafic–ultramafic intrusions (Voisey’s Bay) [27,28], Cu-bearing volcaniclastic sequences (Salvage) [29], orogenic Au mineralization hosted by siliciclastic units (Thorburn Lake/Manuels) [30], and Zn–Cu base-metal sulfide occurrences in rhyolitic volcanic settings (Grand Falls) [31].
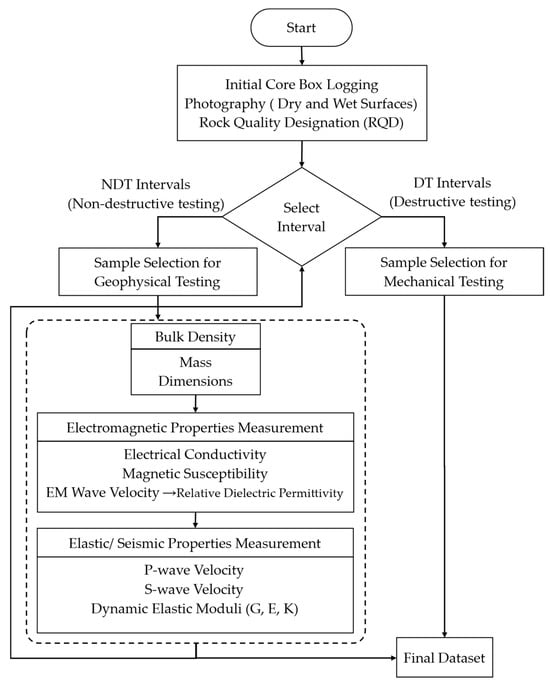
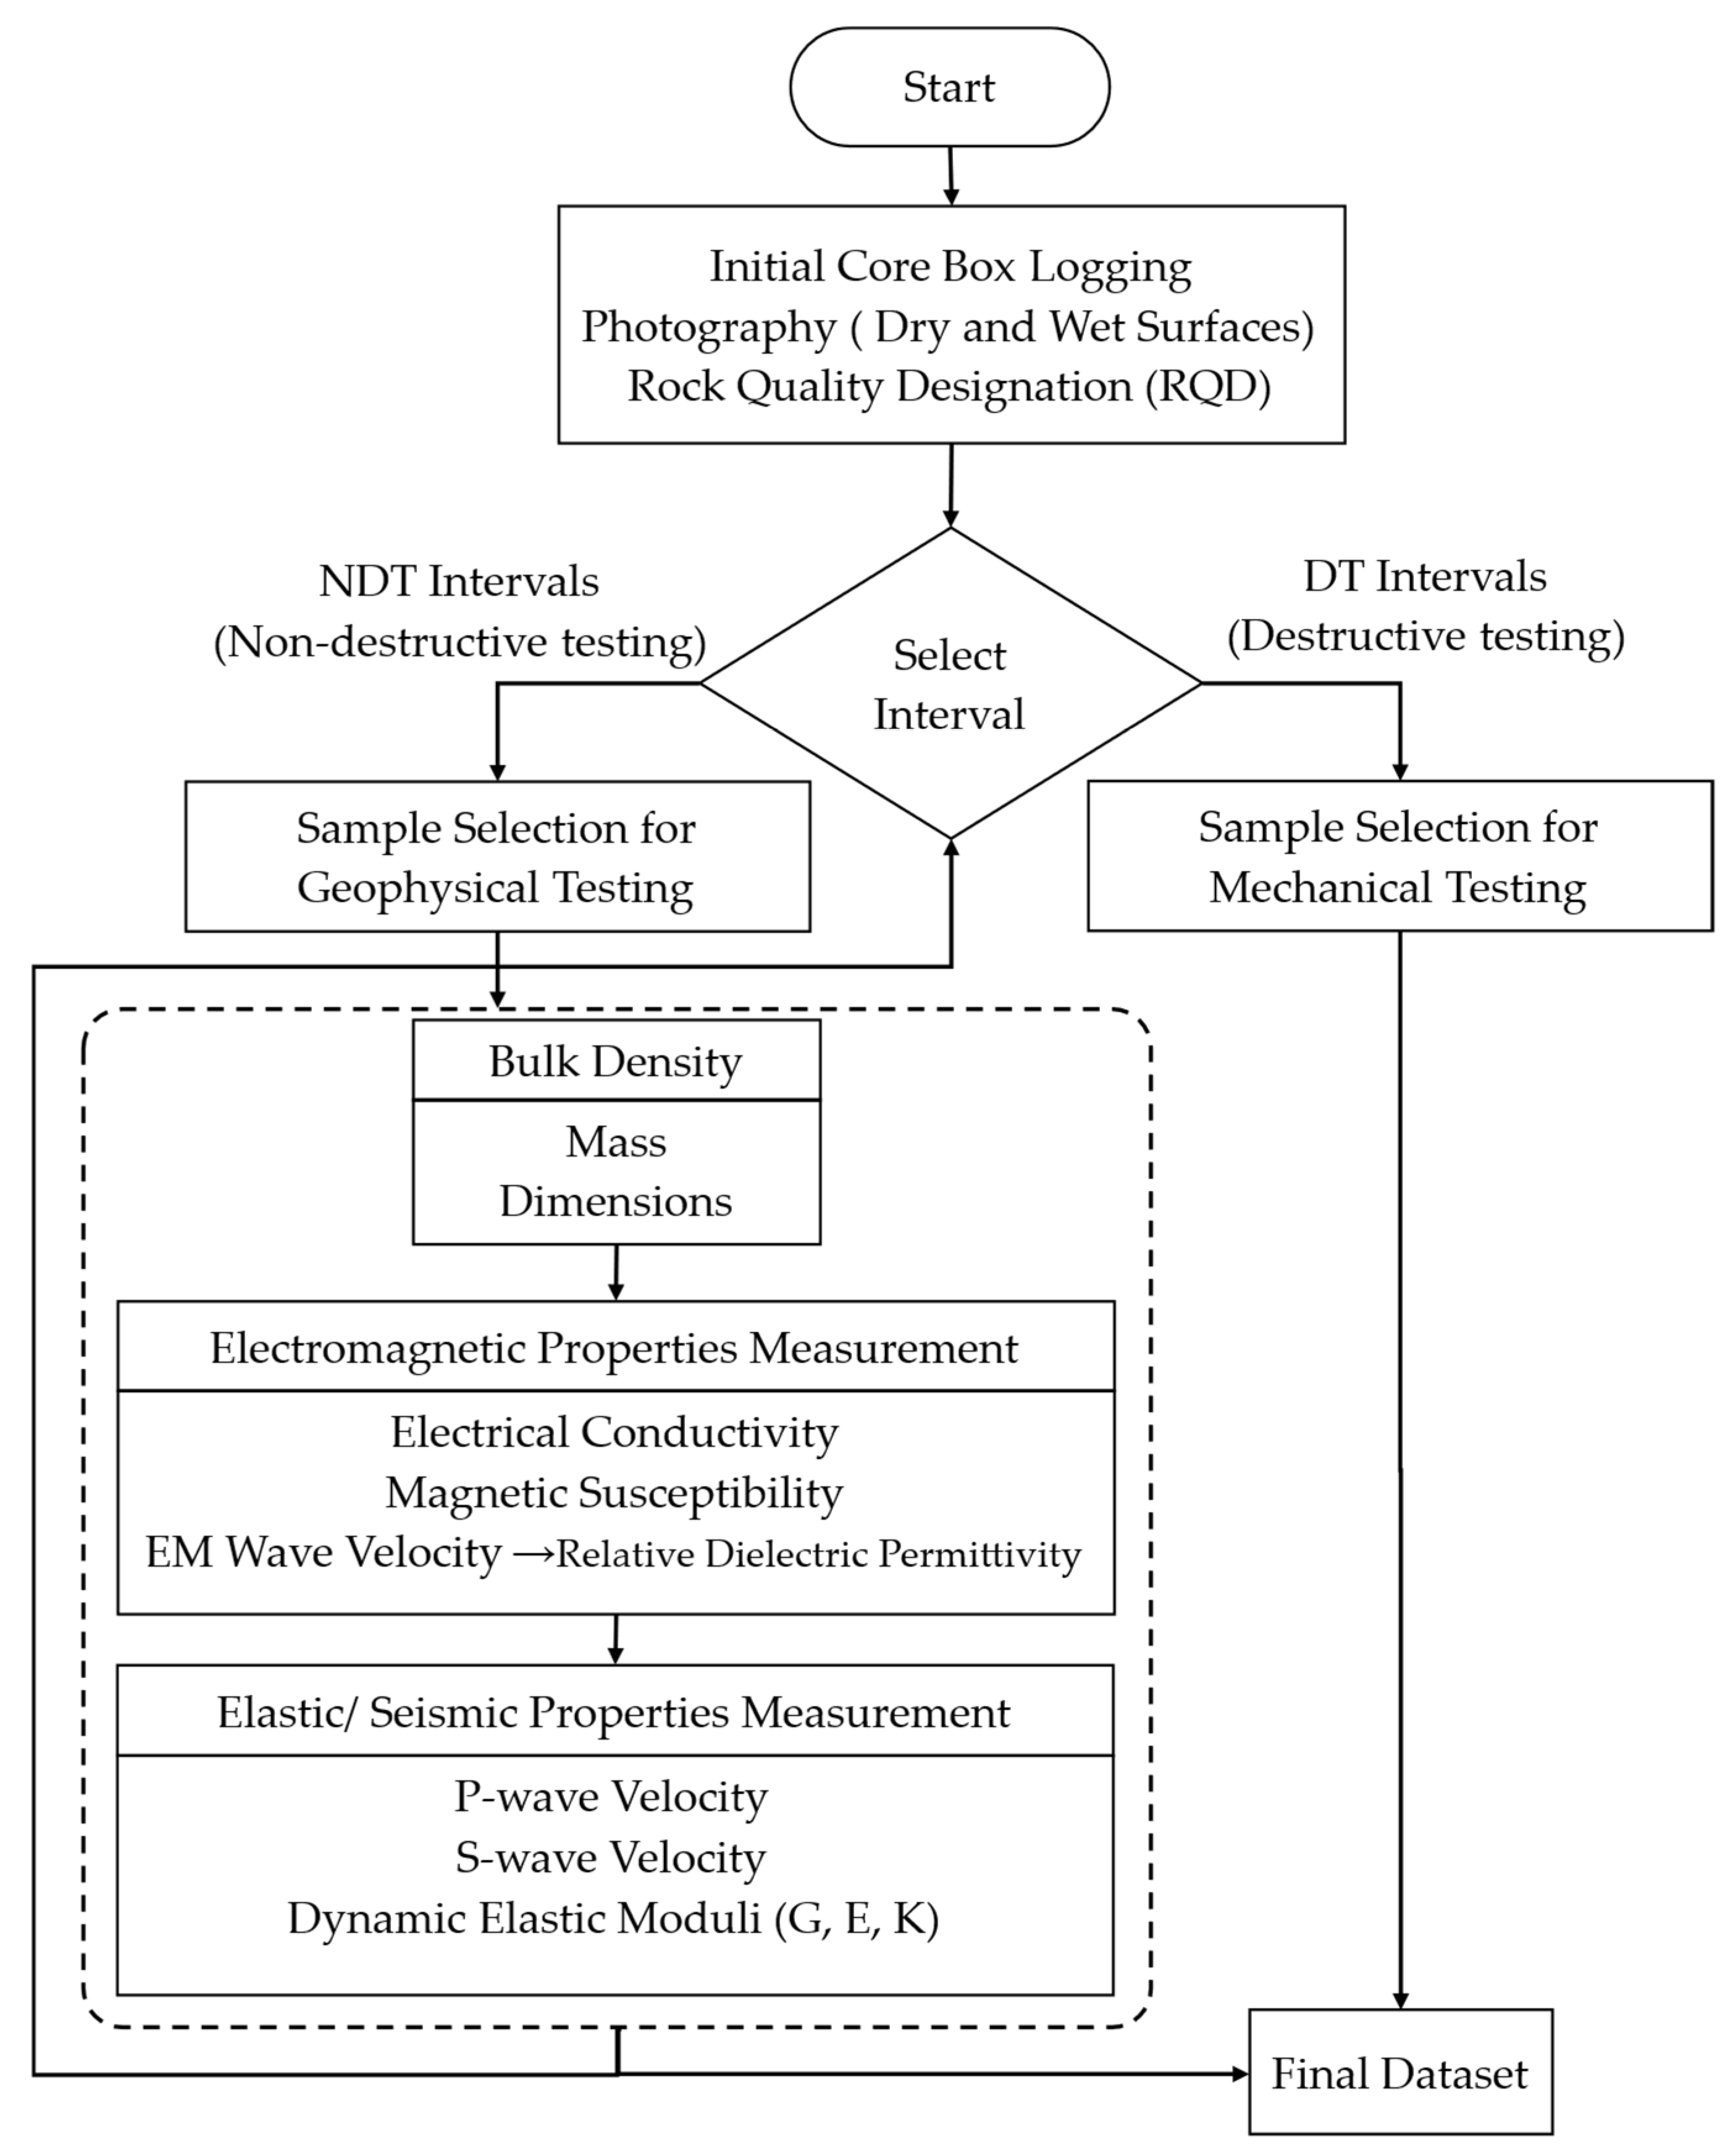
The EM velocity measurements are integrated into a broader non-destructive rock-physics workflow developed at Memorial University’s drilling technology laboratory (DTL) (Figure 2) [32,33,34].
Figure 2.
DTL framework for geophysical characterization of diamond-drilled rocks, showing the developed EM velocity measurement method integrated into the workflow [32,33,34].
By integrating direct EM velocity estimation with elastic, electrical, and magnetic property measurements within a standardized, non-destructive framework, the proposed methodology establishes a multi-parameter benchmark for rock-property characterization [35,36,37,38,39].
This framework supports improved time–depth conversion in common-offset HFEM/GPR surveys and provides calibrated inputs for forward modeling, inversion, and future electromagnetic simulation studies in exploration geophysics. The standardized framework is applied to whole, half, and quarter drill cores. It integrates the developed EM velocity measurement method with electromagnetic properties, bulk density, and elastic/seismic properties [40,41,42,43,44] to enable more accurate rock-property characterization.
2. Materials and Methods
2.1. Velocity of Electromagnetic Waves
The velocity of electromagnetic waves is influenced by the electromagnetic properties of a medium, including conductivity and magnetic susceptibility. For interpreting ground-penetrating radar (GPR) data to locate volcanogenic massive sulfide (VMS) deposits [45,46,47,48], accurate velocity determination is crucial, especially when highly conductive VMS deposits are located within less-conducting media, such as sedimentary rocks. Velocity estimation is essential for converting GPR signal travel time into precise depth measurements, enhancing subsurface evaluations in complex geological settings. The propagation of electromagnetic waves in conductive media was well established in classical electromagnetic theory and is widely documented in standard textbooks [49,50,51,52]. The velocity and attenuation of electromagnetic waves in non-vacuum conditions take the following form:
where v is the electromagnetic (EM) wave velocity, is the attenuation coefficient, μ is the absolute magnetic permeability, ε is the absolute dielectric permittivity, σ is the electrical conductivity, and f is the frequency.
The relative dielectric permittivity (RDP) often represented by is a key parameter that influences the velocity of EM waves in the medium. The RDP in low-loss media, where can be derived from the EM wave velocity in the medium () using the following formula [53,54,55]:
where is the speed of light in vacuum, is the relative magnetic permeability, and is the relative dielectric permittivity. The relative dielectric permittivity is defined as the ratio of the absolute permittivity of the medium to the permittivity of free space, i.e.:
where is the absolute permittivity of the medium and is the permittivity of free space. The absolute magnetic permeability of the medium can be expressed as:
where is the permeability of free space and is the relative magnetic permeability. The magnetic susceptibility is related to relative permeability through:
For good conductors, the situation is slightly more complicated because free charges can move in response to the electric-field component of the electromagnetic wave. This motion generates conduction currents that lead to significant energy dissipation within the medium, resulting in high losses and altered wave propagation behavior. Consequently, the electromagnetic wave velocity can be much lower than “c” for good conductors, and as it travels, it experiences severe attenuation. Since electromagnetic waves are rapidly damped in good conductors, it is typically inefficient to transmit them within these materials over long distances. The velocity of electromagnetic waves in a good conductor where is given by [50]:
In practical applications such as VMS exploration, high conductivity significantly limits wave penetration. This behavior is characterized by the skin depth (δ): The reciprocal of the attenuation coefficient (α), the depth at which the wave amplitude drops to 37%:
where μ is absolute permeability in H/m, σ is conductivity in S/m, and f is frequency in Hz.
In a conventional common-offset GPR survey, assuming a direct path from the transmitter to the reflector and back, with no interference or scattering, the velocity () of an EM wave can be calculated from the recorded two-way travel time of the signal (TWTT), using the distance () of signal propagation [56]:
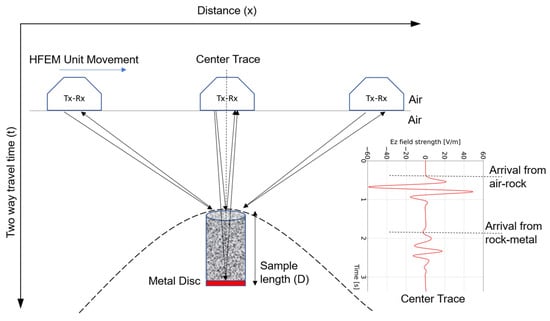
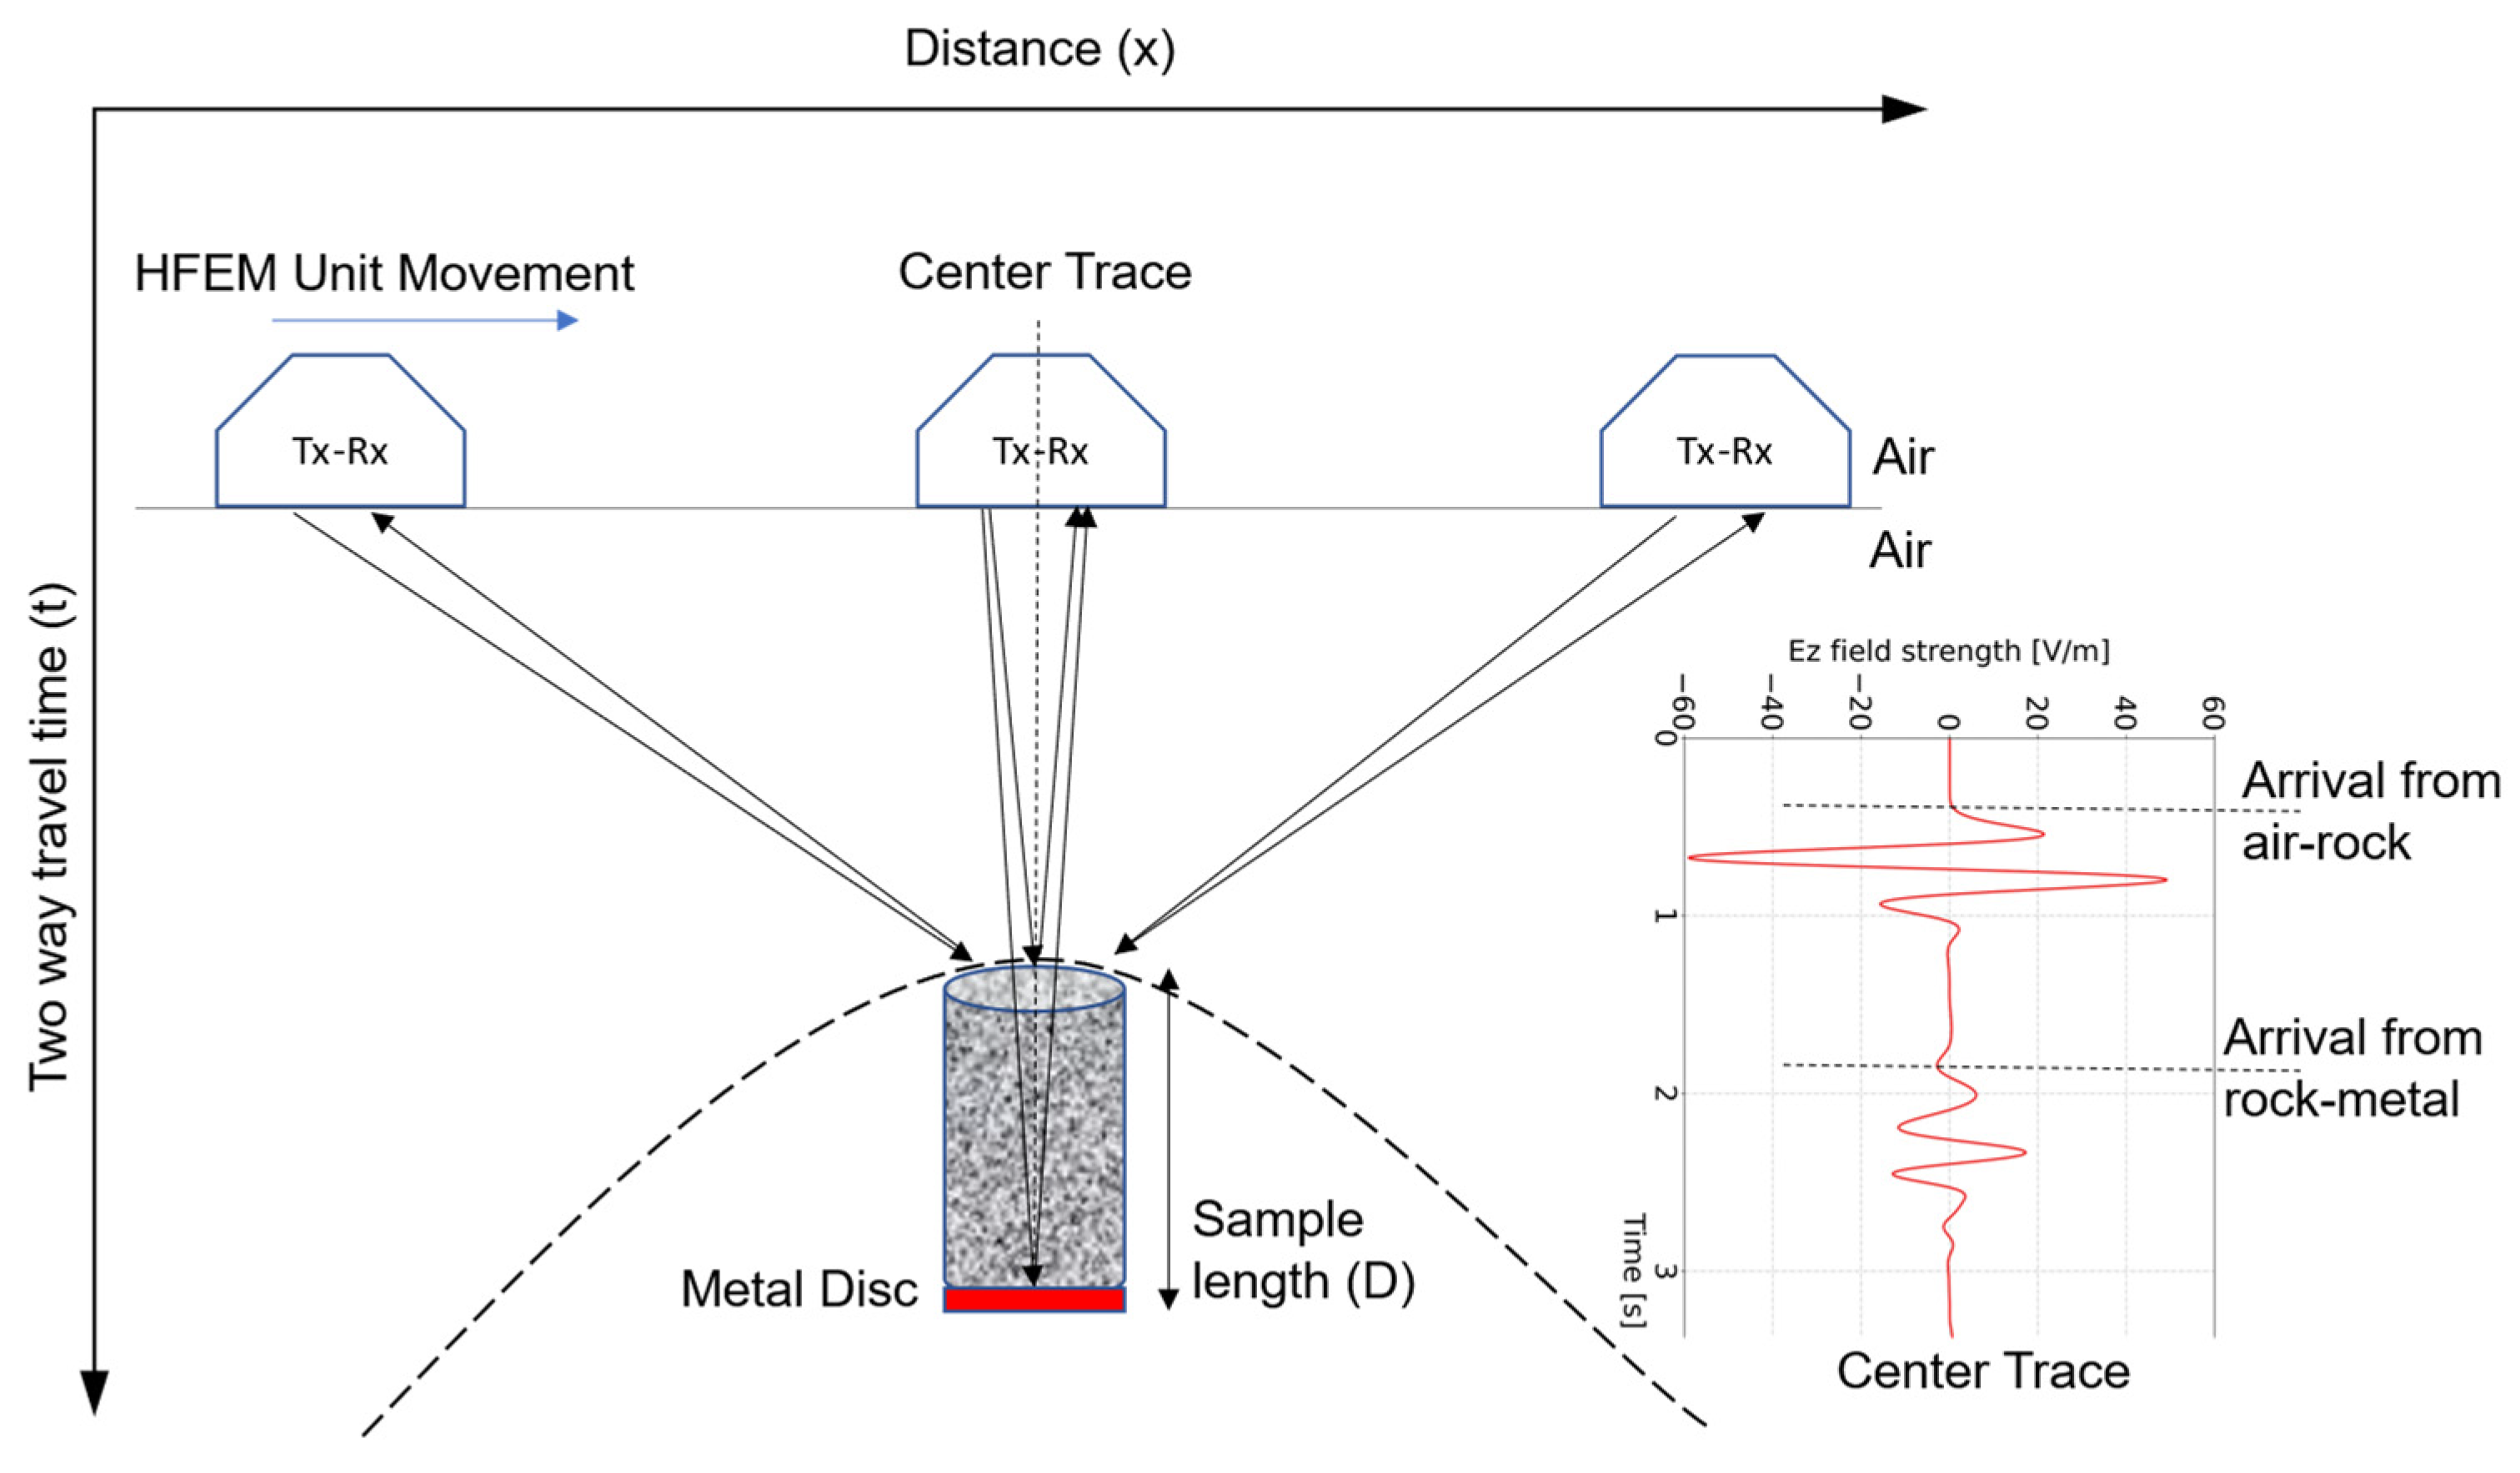
In the present configuration, normal-incidence reflections are recorded from both the air–rock and rock–metal interfaces (Figure 3) when the antenna is positioned directly above the sample.
Figure 3.
Schematic of HFEM data acquisition setup showing HFEM (Tx-Rx) unit movement across a rock core sample placed above a metallic reflector. Arrows indicate the signal path. Reflections are captured at multiple positions to generate a hyperbolic response pattern (Dashed hyperbola). The center trace is used to capture two-way travel times from air–rock and rock–metal boundaries.
Accordingly, the effective travel time through the core is defined as the difference between the corresponding two-way travel times:
where and denotes the arrival times of the air–rock and rock–metal reflections, respectively.
Assuming a nonmagnetic medium (), Equation (2) can be further simplified, and measuring wave travel time through the core allows us to estimate EM wave velocity and RDP ( and ) of the medium:
When a signal is triggered by a GPR unit transmitter, it propagates through different media and reflects at each boundary, producing RDP contrast. For the case of normal incidence, the reflection coefficient R is given by Fresnel’s equation [7,49]:
where and are the relative dielectric permittivities of the first (overlying) and second (underlying) media, respectively. High R values indicate strong reflection (useful for imaging), whereas low R values indicate that most of the energy penetrates. So, a high reflection coefficient is more easily detected in the reflected signals arriving at the receiver of the GPR unit. This allows the dielectric constant of the core to be calculated, possibly leading to material identification when used along with other techniques in the established framework (Figure 2).
2.2. Data Collection Parameters in gprMax
In the numerical simulations, a common-offset configuration was adopted in which the transmitter and receiver were separated by a fixed distance and moved together along the model surface (Figure 3). The antennas are positioned in a predetermined arrangement (i.e., separation and orientation), and measurements are conducted at uniform station intervals (Δx). There are several modifiable parameters to maximize depth penetration and resolution in GPR common-offset surveys [57], even though the RDP of underlying material properties cannot be changed. The key parameters in 2D and 3D common-offset surveys include GPR center frequency, recording time window, temporal sampling interval, station spacing, antenna spacing, line spacing (in 3D models), and antenna orientation [6]. Unlike field survey design, the objective of the simulation was not to optimize acquisition logistics but to ensure numerically stable and physically realistic modeling of electromagnetic wave propagation within the defined computational domain. Therefore, only parameters that directly control numerical resolution, wave propagation distance, and temporal recording duration were considered.
In the present numerical modeling framework, parameter selection includes choosing an appropriate antenna frequency to balance resolution and depth penetration, adjusting the time window to capture reflected signals, modifying the sample interval and number of samples per trace for best data quality, setting the step size for accurate spatial resolution, and applying stacking to improve signal-to-noise ratio and enhanced subsurface feature detection. Each parameter is important for efficiently identifying and characterizing features and structures [57]. Key sampling constraints for HFEM measurements and electromagnetic simulations are listed in Table 1 [58].
Table 1.
Key constraints for laboratory HFEM measurements and electromagnetic simulations.
To ensure complete subsurface imaging, the selected time window should reach 1.5 to 2 times deeper than the target depth. Choosing the optimal operating frequency involves balancing resolution and penetration depth [54].
2.3. Simulation
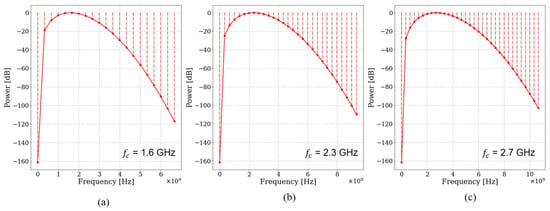
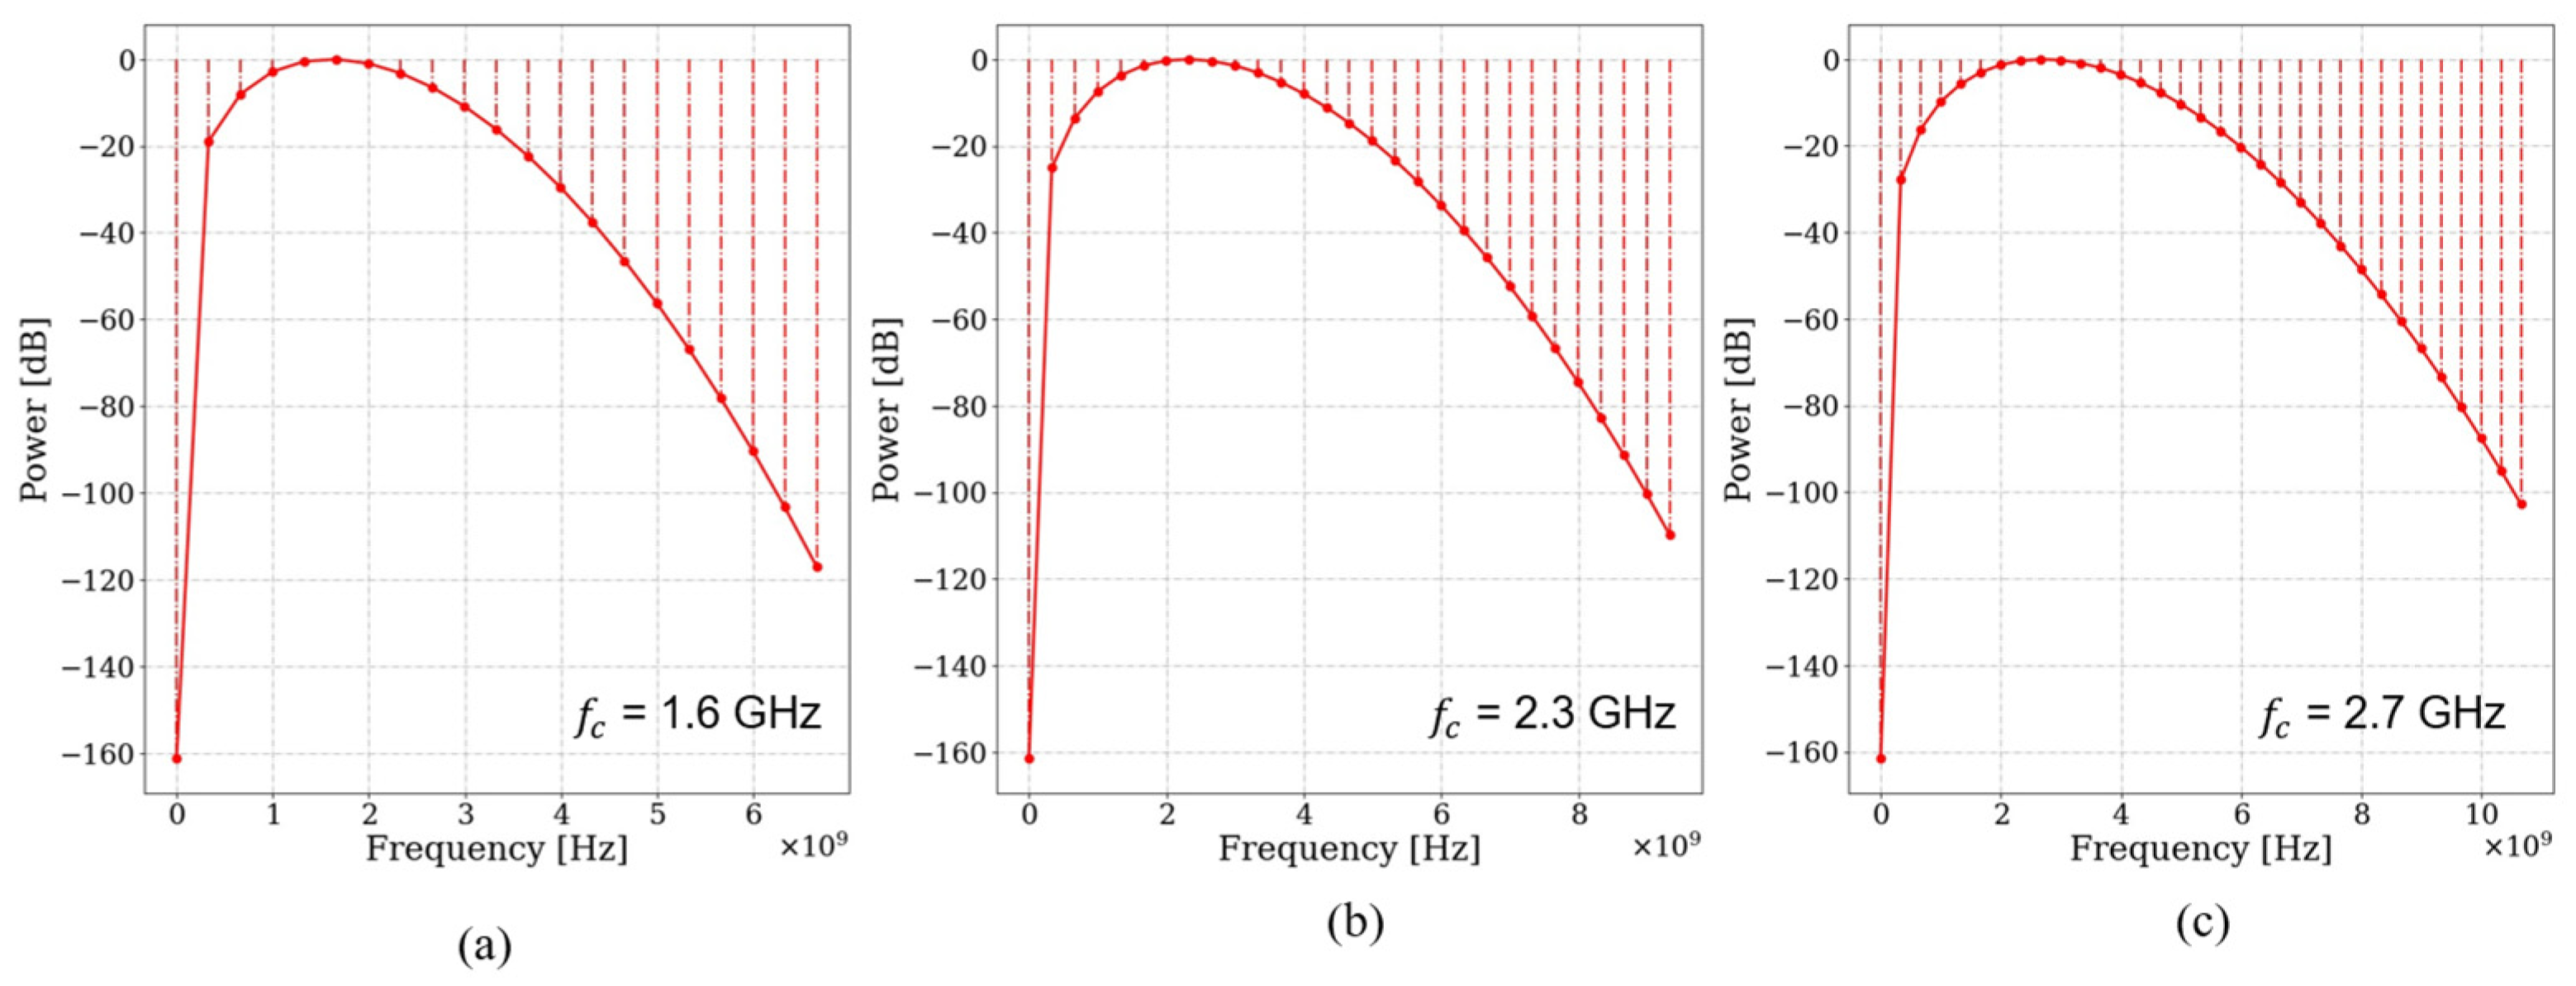
Finite-difference time-domain (FDTD) numerical modeling was carried out using the program gprMax [59,60] to determine an appropriate antenna frequency capable of resolving the top and bottom boundaries of cylindrical drill core samples with a diameter of approximately 47.6 mm (standard NQ core size). This diameter was selected for its widespread use in mineral exploration drilling and therefore represents a practical, representative laboratory scale for evaluating high-frequency electromagnetic wave propagation in intact rock materials. Drill core samples 5 to 20 cm in length were modeled above a metallic disk defined as a perfect electric conductor (PEC). Relative dielectric permittivity values of 5 to 15 were assigned to represent the host rocks used in the experiments, while σ 0, 1 were assumed to isolate the influence of dielectric contrast on boundary resolution and antenna frequency selection before attenuation effects were considered. The sample length range reflects the minimum resolvable thickness using the commercially available high-frequency antennas (1.6, 2.3, and 2.7 GHz) and investigates the influence of increasing propagation distance on dielectric parameter estimation. The model used a 3D domain (X = 0.5 m, Y = 0.5 m, and Z = 0.1 m grid) with a Hertzian dipole source placed 5 cm above the sample. Excitation was via Ricker wavelets shown in Figure 4. The top of the core and the PEC disk beneath each core produced reflections in TWTT radargrams due to dielectric contrast principles (Equation (12)).
Figure 4.
Power spectra of Ricker wavelets for center frequencies of (a) 1.6 GHz, (b) 2.3 GHz, and (c) 2.7 GHz. The spectra demonstrate the broadband nature of the source, with significant energy extending beyond the nominal center frequency.
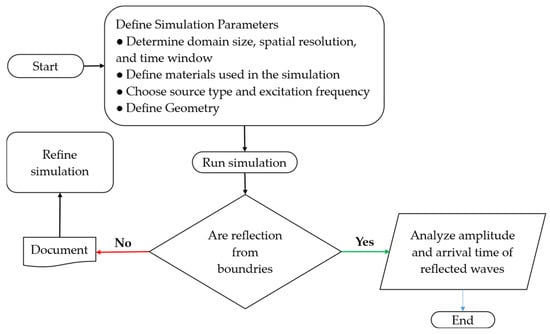
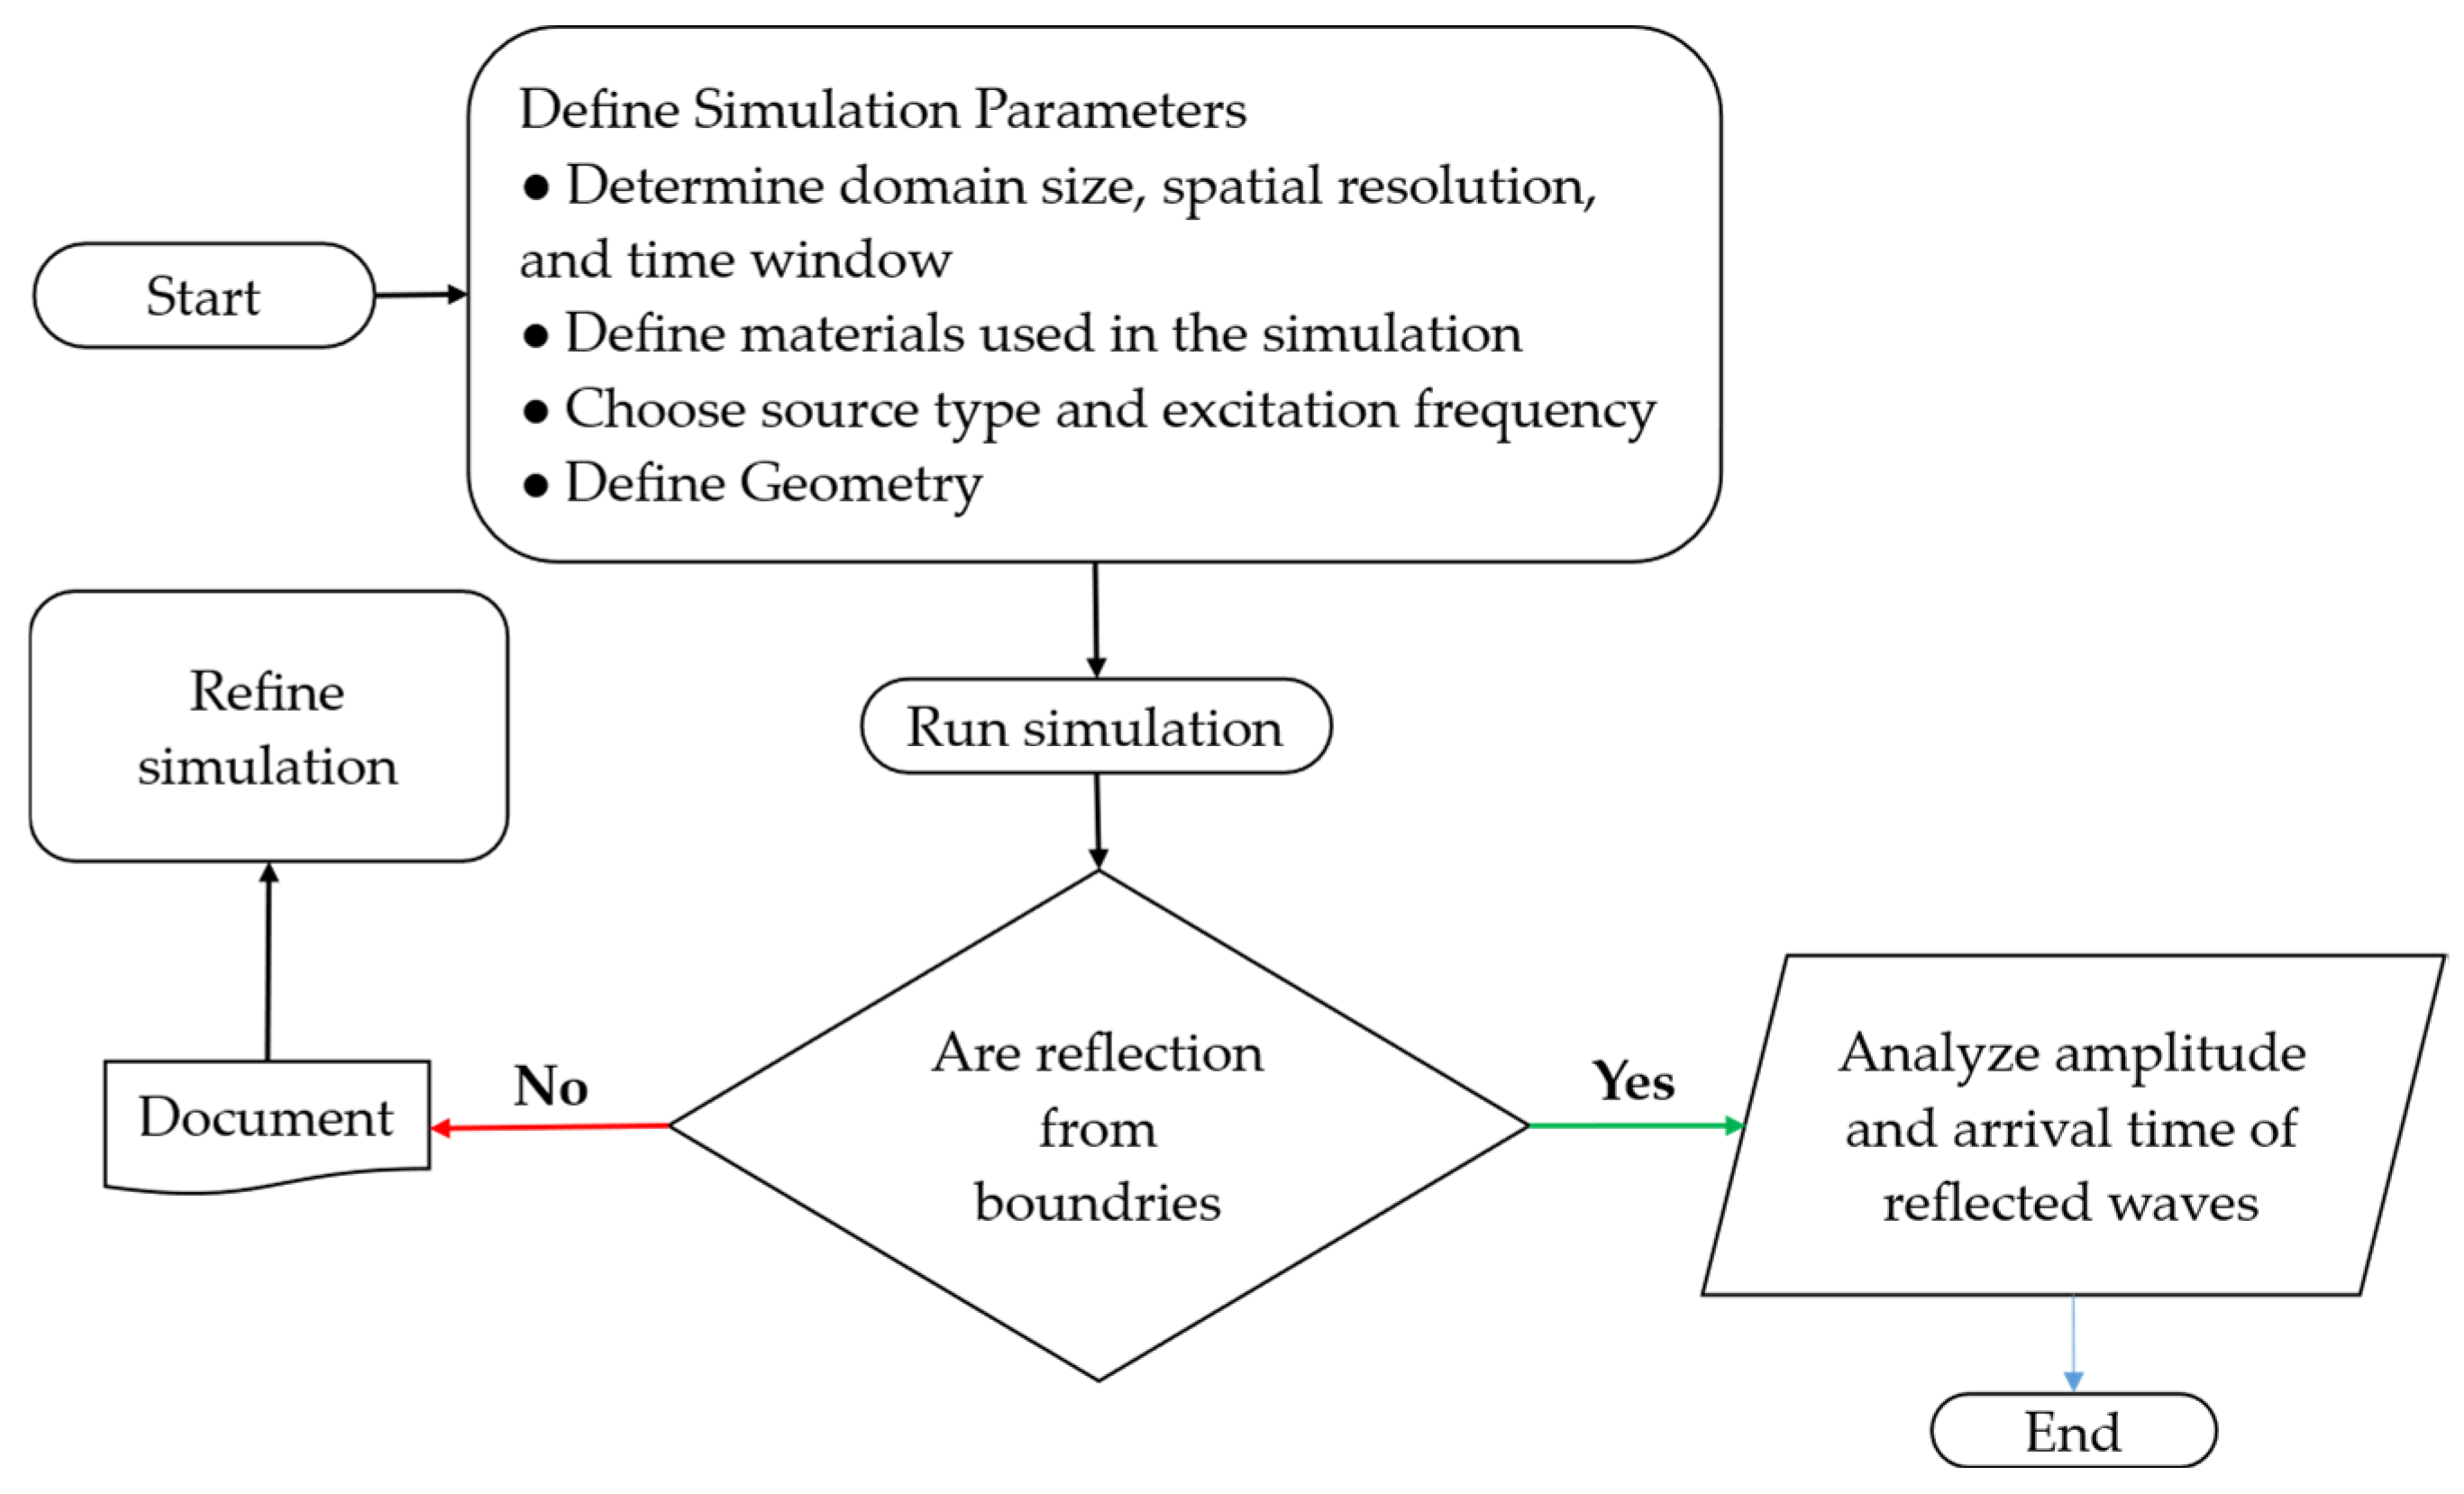
A flowchart was developed to guide iterative simulations aimed at identifying the optimal antenna frequency to resolve the top and bottom boundaries of the sample effectively (Figure 5). Iterative refinements were conducted until distinct reflections from the sample boundaries were achieved, at which point the final parameters were selected for experimental implementation [26].
Figure 5.
Workflow for the gprMax simulations, from defining model parameters to analyzing wave reflections. Iterative refinement was performed until sample boundary reflections were clearly resolved [26].
2.4. Experimental Setup
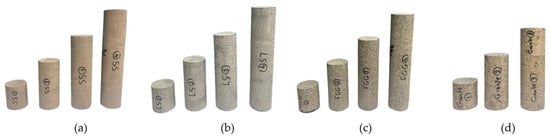
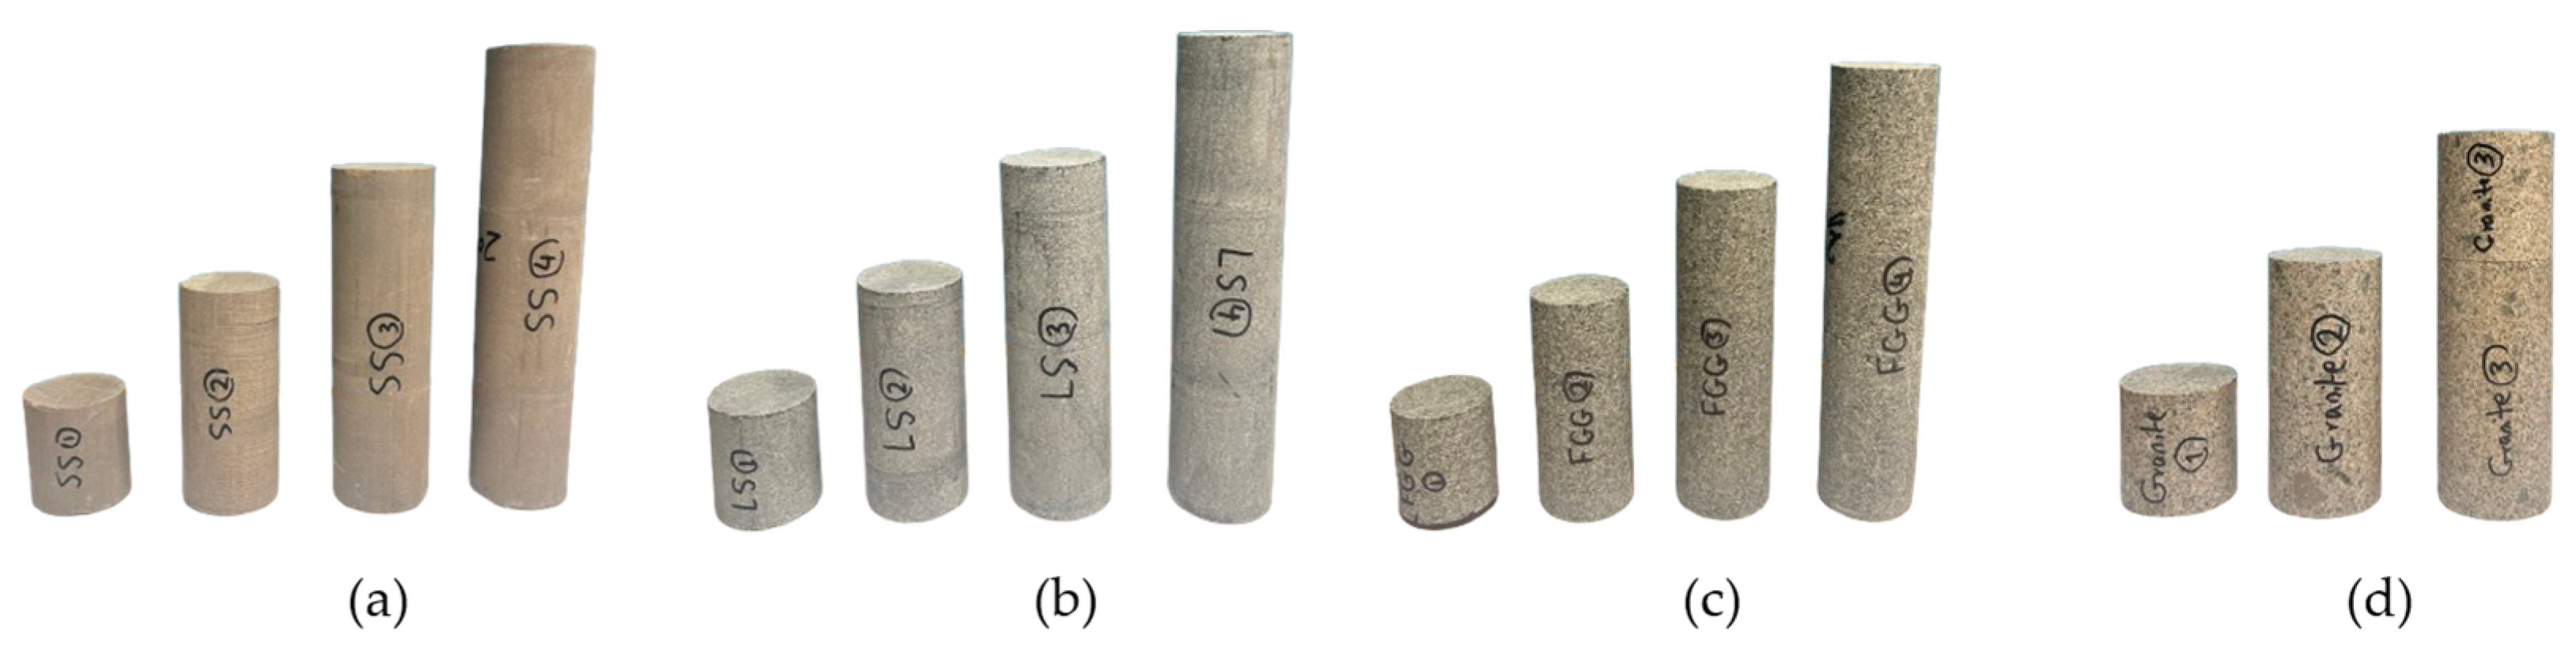
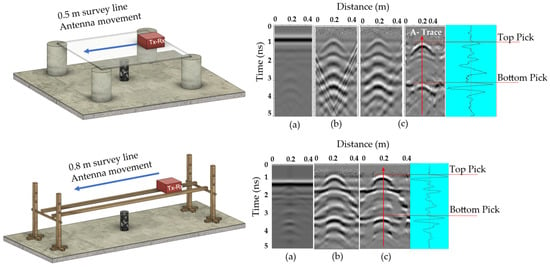
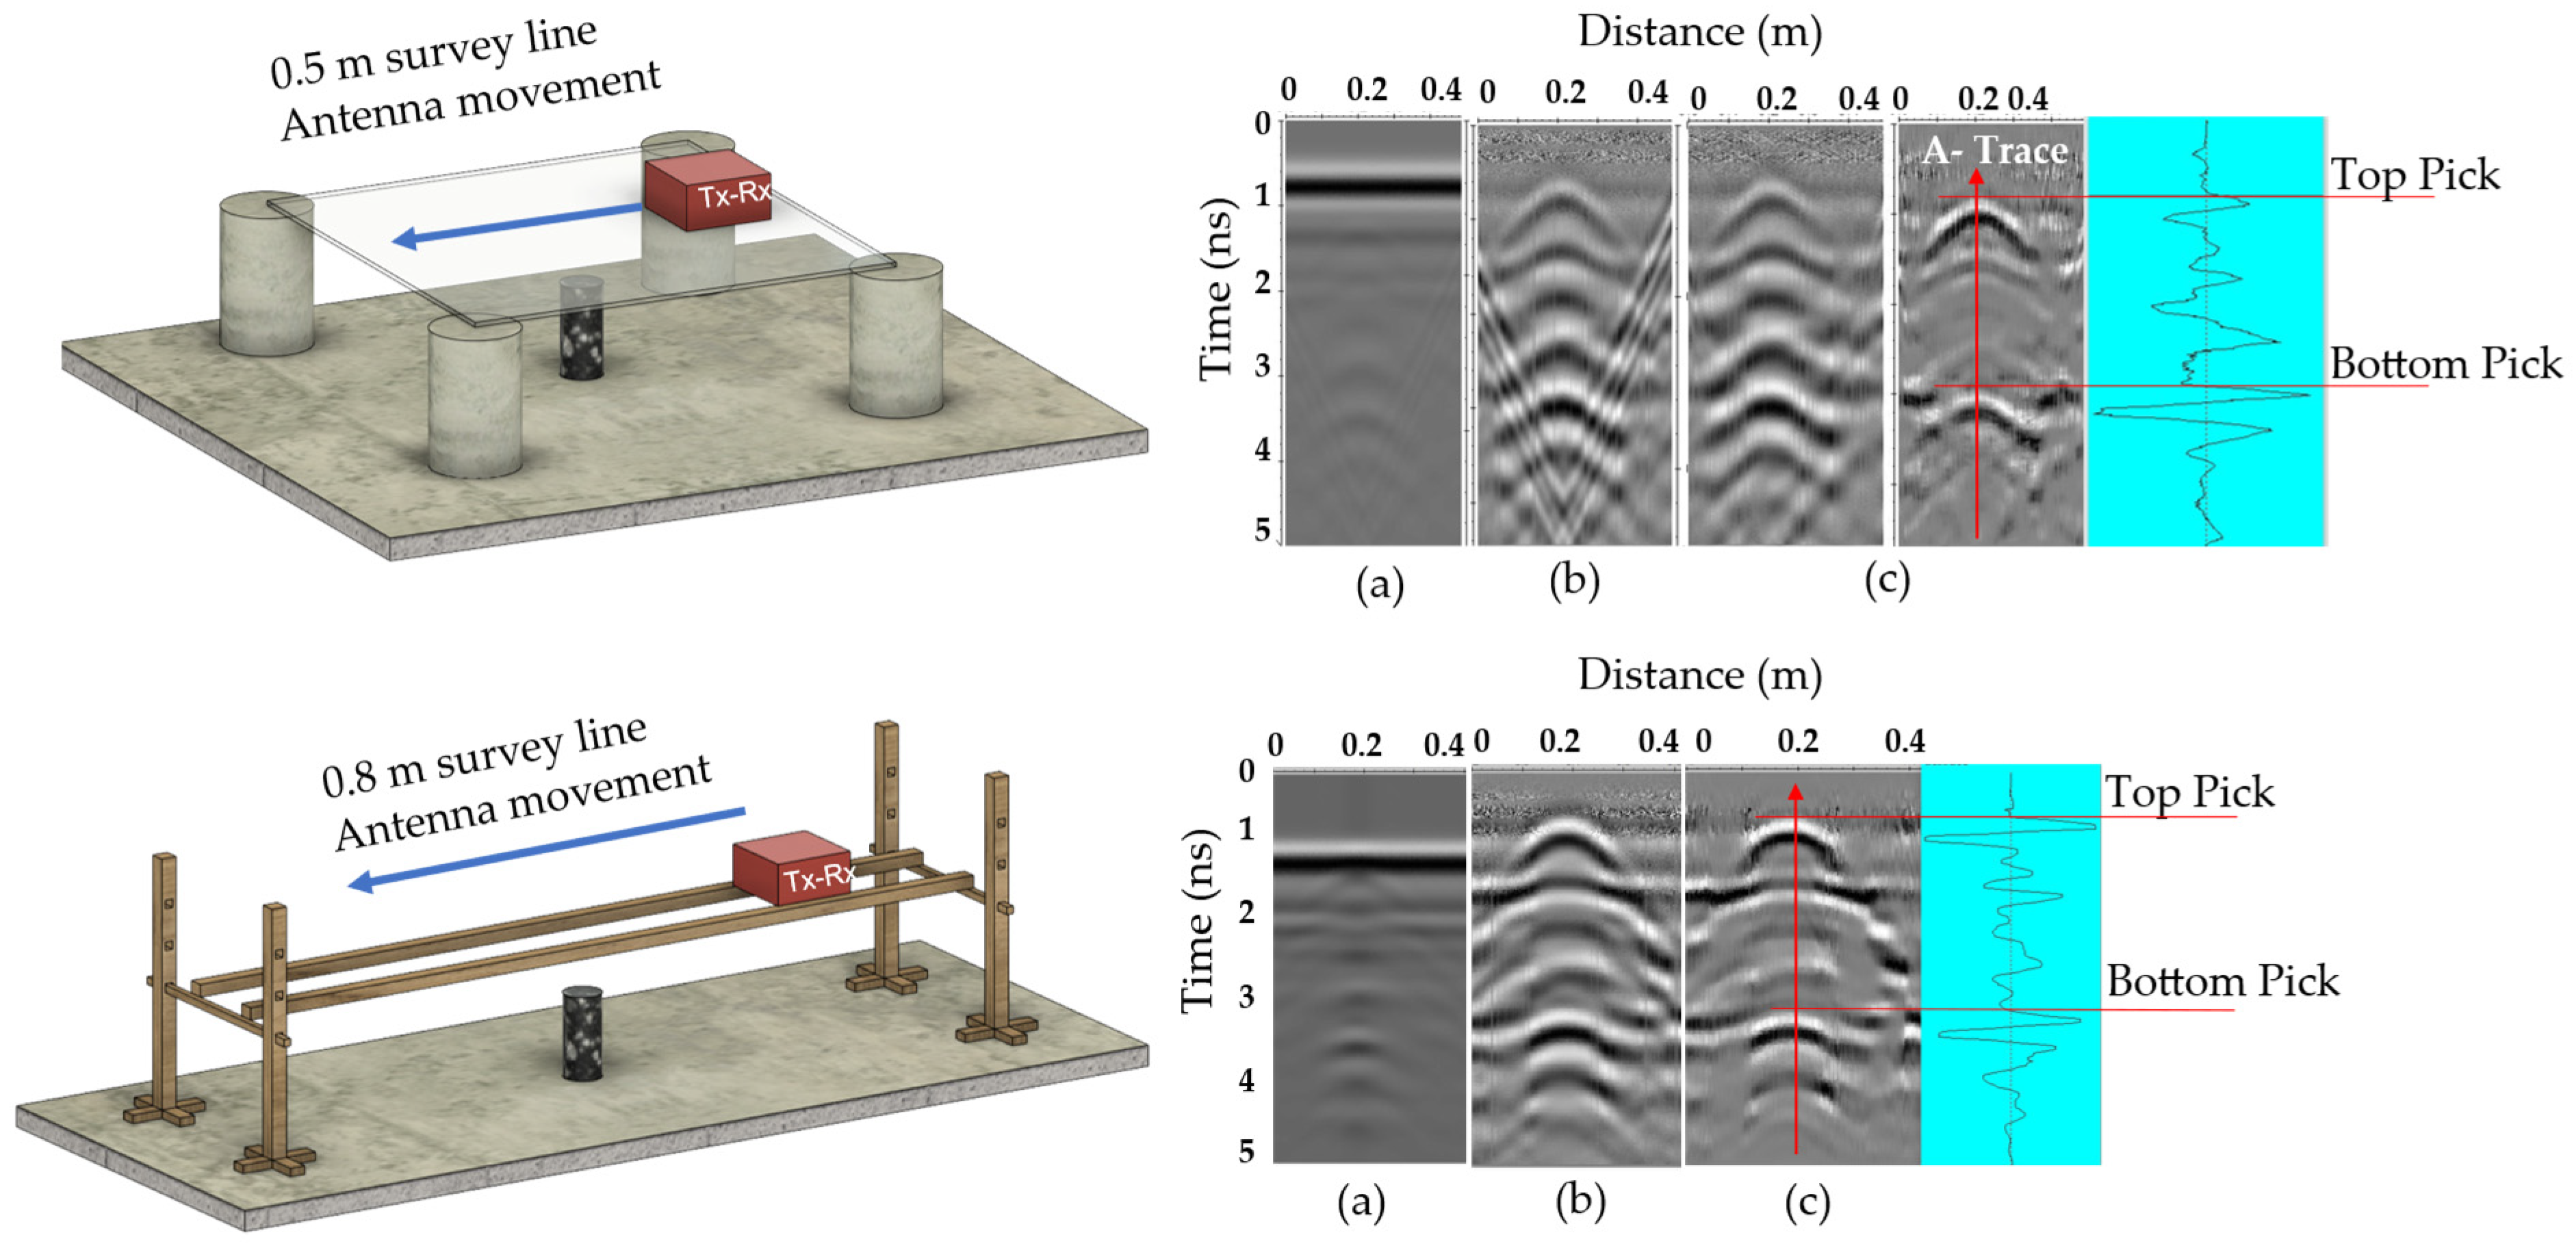
A common-offset reflection survey was performed using DTL-standard NQ-size drill core samples of homogeneous gabbro, sandstone, limestone, and granite, with lengths ranging from 5 to 20 cm (Figure 6), all prepared with flat, parallel end surfaces and oven-dried to remove any residual moisture. The HFEM unit used in this study is a commercially available ground-penetrating radar (GPR) system (StructureScanTM Mini XT/Palm XT, GSSI, Nashua, NH, USA [61]), operating at nominal center frequencies of 2.3 and 2.7 GHz, with internally controlled acquisition parameters, and was used to collect radargrams along the survey line. The initial setup [26] consisted of a glass platform supported by four concrete supports. After processing raw radargrams using the signal-processing steps shown in Figure 7, TWTT data were used to calculate wave velocity. However, early tests revealed signal artifacts caused by reflections from the glass and supports. FDTD modeling confirmed overlapping reflections from glass boundaries and concrete supports produced distorted hyperbolas. The setup was improved by replacing the glass surface with a custom-made wooden rail, introducing an air gap between the antenna and the sample.
Figure 6.
NQ-size drill core samples of (a) sandstone (SS), (b) limestone (LS), (c) fine-grain gabbro (FGG), and (d) granite in four lengths: 5, 10, 15, and 20 cm [26]. Note: Due to material constraints, 5 and 10 cm granite samples were stacked to achieve the 15 and 20 cm lengths, and the effects of this stacking were studied.
Figure 7.
Signal-processing workflow for HFEM data. * F-K migration was initially used but later removed after structural improvements reduced artifacts [26].
Additionally, increasing the spacing between supports reduced multipath effects and enhanced signal clarity (Figure 8). The experimental results were compared with the range of relative dielectric permittivity (RDP) values from the literature (Table 2) [26].
Figure 8.
Top: initial; bottom: refined experimental setups with radargrams: (a) raw, (b) primary, and (c) secondary processing. Blue arrows indicate the direction of antenna movement, and red arrows indicate the A-trace at the hyperbola center used to identify reflection picks [26].
Table 2.
Relative dielectric permittivity (RDP) ranges from literature sources [6,62].
Signal Processing
Radargrams were processed using the signal-processing workflow shown in Figure 7 [63]. Primary filtering included dynamic correction, DC shift/mean subtraction (Dewow), zero-time cut-off, and background removal. Secondary filtering applied a median filter to suppress spikes while preserving edges. FK migration, initially used to detect and remove platform artifacts, was omitted after the setup was refined [26]. Spectral whitening was then applied to enhance deeper reflections and reduce multiples, improving contrast between the target and noise. As illustrated in Figure 8, the developed sequence processing improved signal clarity.
The raw radargram initially showed strong noise and overlapping hyperbolas. After processing, well-defined hyperbola shapes and reflection picks became visible. This demonstrates the effectiveness of the refined configuration and signal-processing steps in enhancing target reflections and suppressing unwanted noise.
2.5. Sulfide-Bearing Drill Cores from Newfoundland and Labrador
After validating the method on homogeneous samples, heterogeneous anisotropic sulfide-bearing drill cores from multiple mineral systems across Newfoundland and Labrador, Canada, were selected to further validate and study the method’s performance under realistic geological conditions, characterized by mineralogical variability, textural complexity, and spatial heterogeneity typical of ore-hosting systems.
Diamond-drilled core intervals representing (i) magnetite-rich units in mafic–ultramafic intrusions (Voisey’s Bay, Ni–Cu site) [27,28], (ii) Cu-bearing volcaniclastic sequences (Salvage, Cu site) [29], (iii) siliciclastic units (Thorburn Lake/Manuels, Au sites) [30], and (iv) Zn–Cu base-metal sulfide occurrences in rhyolitic volcanic settings (Grand Falls, Base metals site) [31] were selected from the Newfoundland and Labrador Geoscience Atlas archives (Table 3). Non-destructive measurements were conducted on whole, half, and quarter cores using the standardized workflow shown in Figure 2, including electrical conductivity, magnetic susceptibility, and EM wave velocity using the developed method. Complementary physical properties (e.g., P-wave velocity and bulk density) were also measured to support interpretation and provide independent validation of the EM measurements within the established geophysical workflow.
Table 3.
Information on heterogeneous sulfide/oxide-bearing and host rock drill core samples from various mineral systems in Newfoundland and Labrador sourced from original reports [27,28,29,30,31].
2.6. Sample Preparation and Benchmark Framework
To support the interpretation of electromagnetic (EM) wave propagation and its relationship to other physical properties, complementary measurements, including bulk density, magnetic susceptibility, electrical conductivity, and P-wave velocity, were adopted from the standardized non-destructive workflow introduced in Figure 2.
Measurements were conducted on diamond-drilled cores (whole, half, and quarter core) from multiple lithologies in Newfoundland and Labrador, with core intervals cleaned, logged, and selected to represent different geological conditions. Magnetic susceptibility and electrical conductivity influence EM attenuation and skin depth (Equation (7)), while bulk density and P-wave velocity vary between host rocks and massive sulfide zones, providing additional context for interpreting and validating the EM measurements.
Bulk density was determined from measured mass using a calibrated digital laboratory scale (precision ± 0.01 g; KERN & Sohn, Balingen, Germany), and geometrically calculated volume using a digital caliper (Mitutoyo Corporation, Kawasaki, Japan). Three repeated measurements; mean values used. Core volume was calculated assuming cylindrical geometry:
where r is the core radius, and L is the measured length.
Bulk density was calculated as:
where is bulk density ( or ), m is mass, and V is volume.
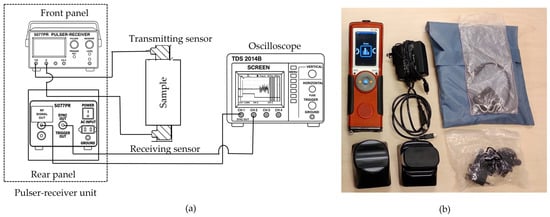
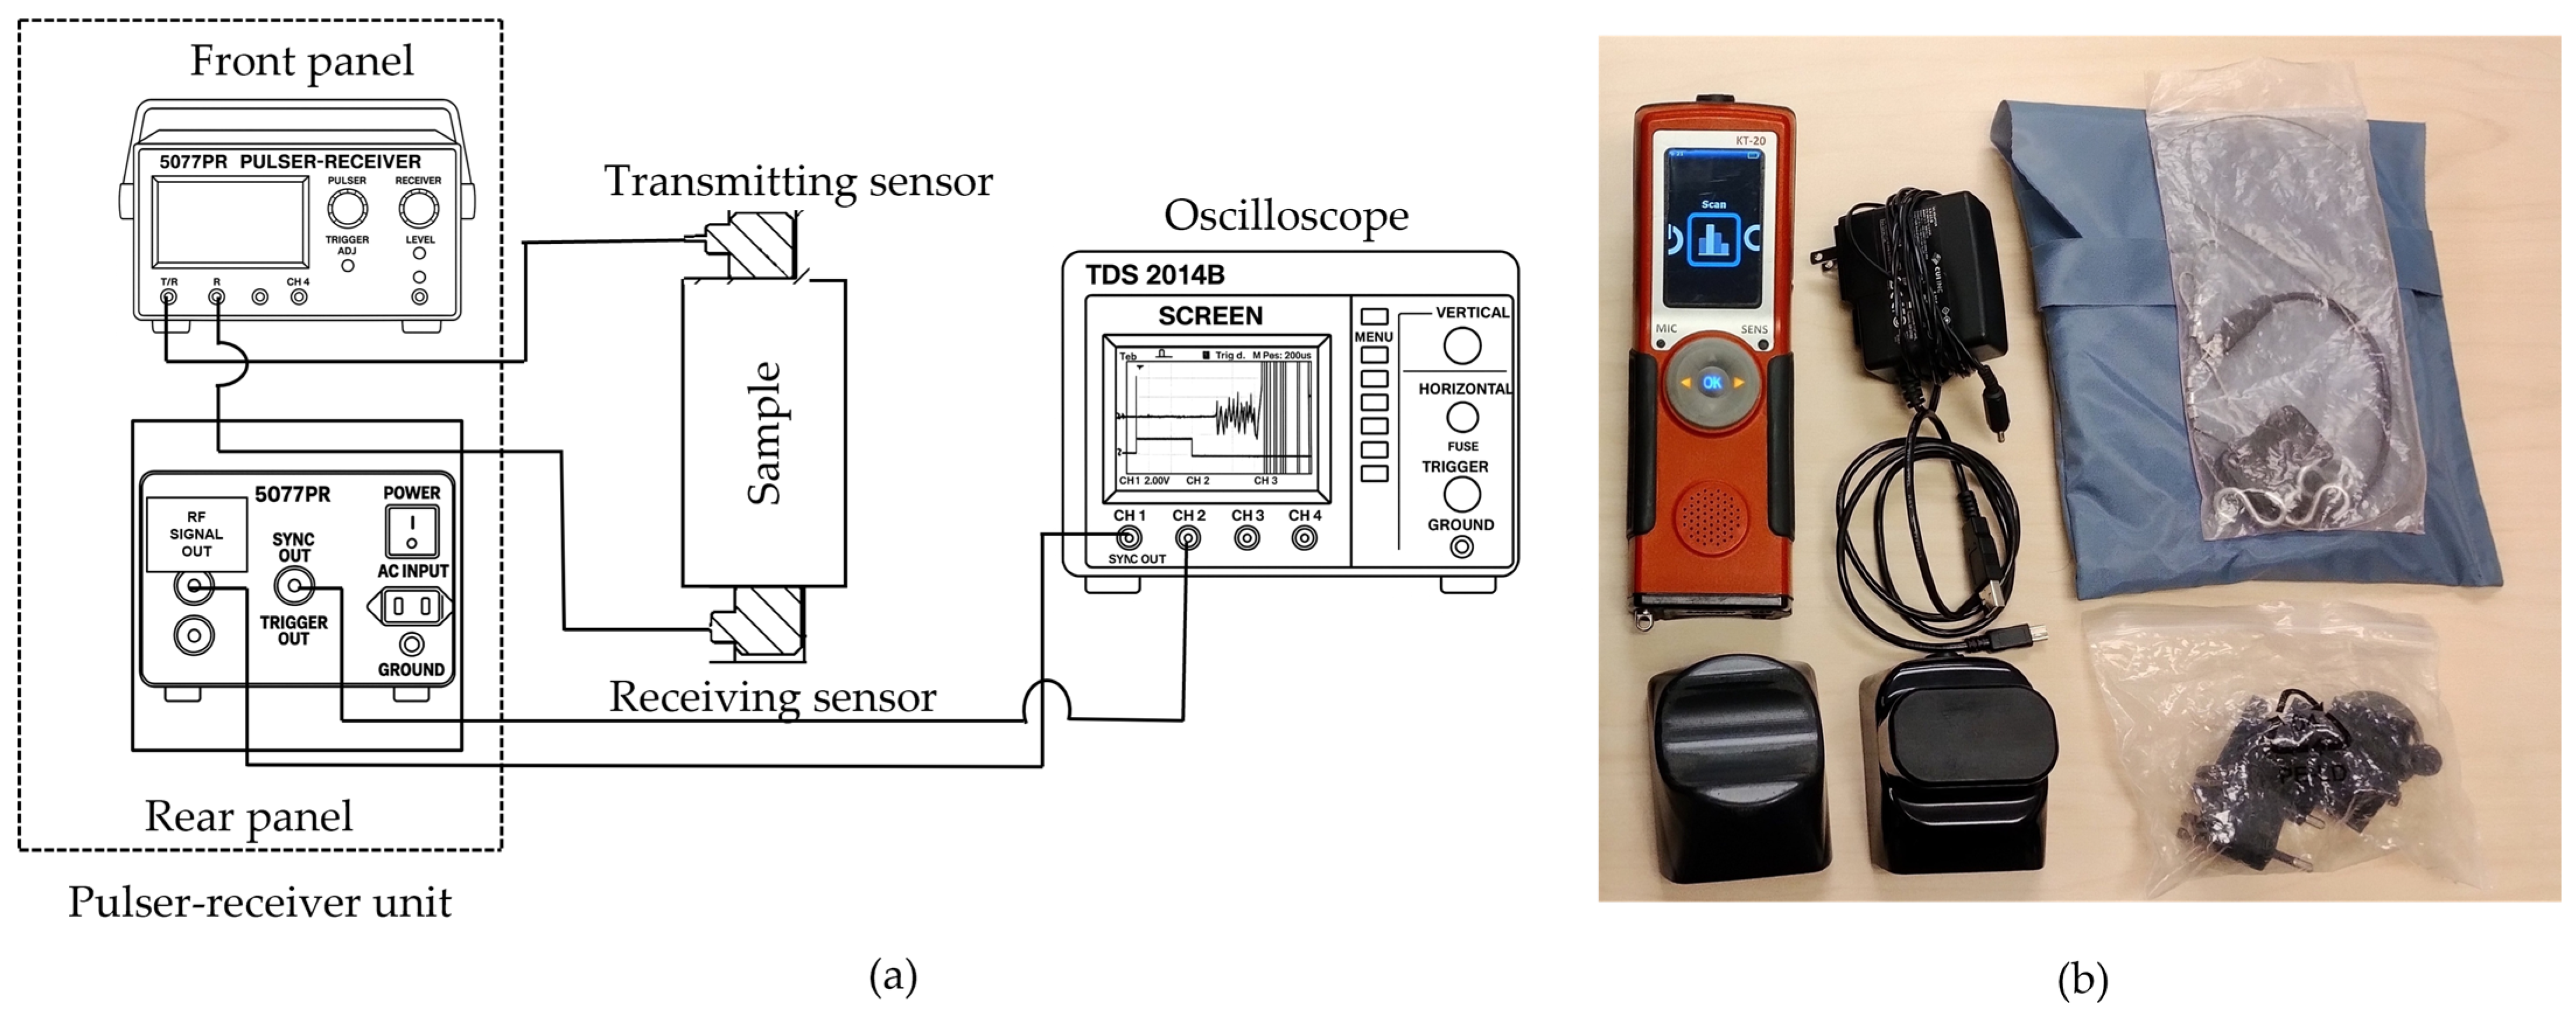
Magnetic susceptibility (k in SI.) and electrical conductivity ( in S/m) were measured using a Terraplus KT-20 Physical Property Measuring System (Terraplus Inc., Richmond Hill, ON, Canada) with curved and flat sensors (10 kHz and 100 kHz), suitable for cylindrical and split drill core geometries (Figure 9), in accordance with the manufacturer’s operating guidelines [33]. At each location, measurements were repeated once for consistency. For whole cores, readings were acquired at two circumferential positions (0° and 180°). For split cores, measurements were performed on both the curved and flat surfaces using the corresponding KT-20 sensors (Terraplus Inc., Richmond Hill, ON, Canada) to account for mineralogical heterogeneity. Ultrasonic pulse velocity (UPV) testing measures compressional (P-wave) and shear (S-wave) velocities by recording stress-wave travel time between transmitting and receiving transducers over known path lengths (Figure 9). Ultrasonic velocities were measured following ASTM D2845-08 [34]. Measurements were conducted using an Olympus 5077R pulser/receiver (Olympus Corporation, Tokyo, Japan), Tektronix TDS1002B oscilloscope (Tektronix Inc., Beaverton, OR, USA), and Panametrics/Evident 1 MHz transducers (Evident Corporation, Waltham, MA, USA), with appropriate couplant. Zero-time calibration was performed before testing, and transducers were placed on the flat ends of the core samples. Measurements were not oriented with respect to foliation or lineation; therefore, anisotropic effects were not considered.
Figure 9.
(a) Ultrasonic pulse velocity (UPV) measurement setup, with transmitting and receiving transducers positioned at opposite ends of the sample; (b) Terraplus KT-20 physical property measurement system used for magnetic susceptibility and electrical conductivity measurements.
As this method follows publicly available standards, further methodological details are referred to ASTM D2845-08. Travel time t was determined from the first-break arrival (Figure 10). Wave velocity was calculated as:
where V is velocity (), L is the path length, and t is the signal travel time.
Figure 10.
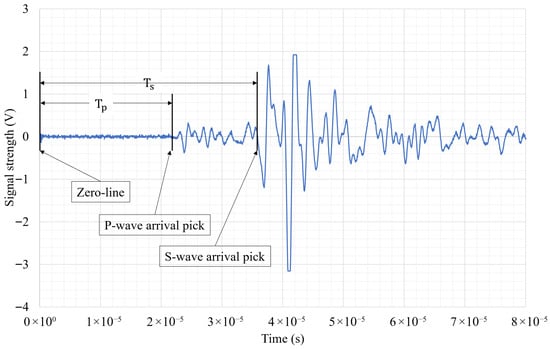
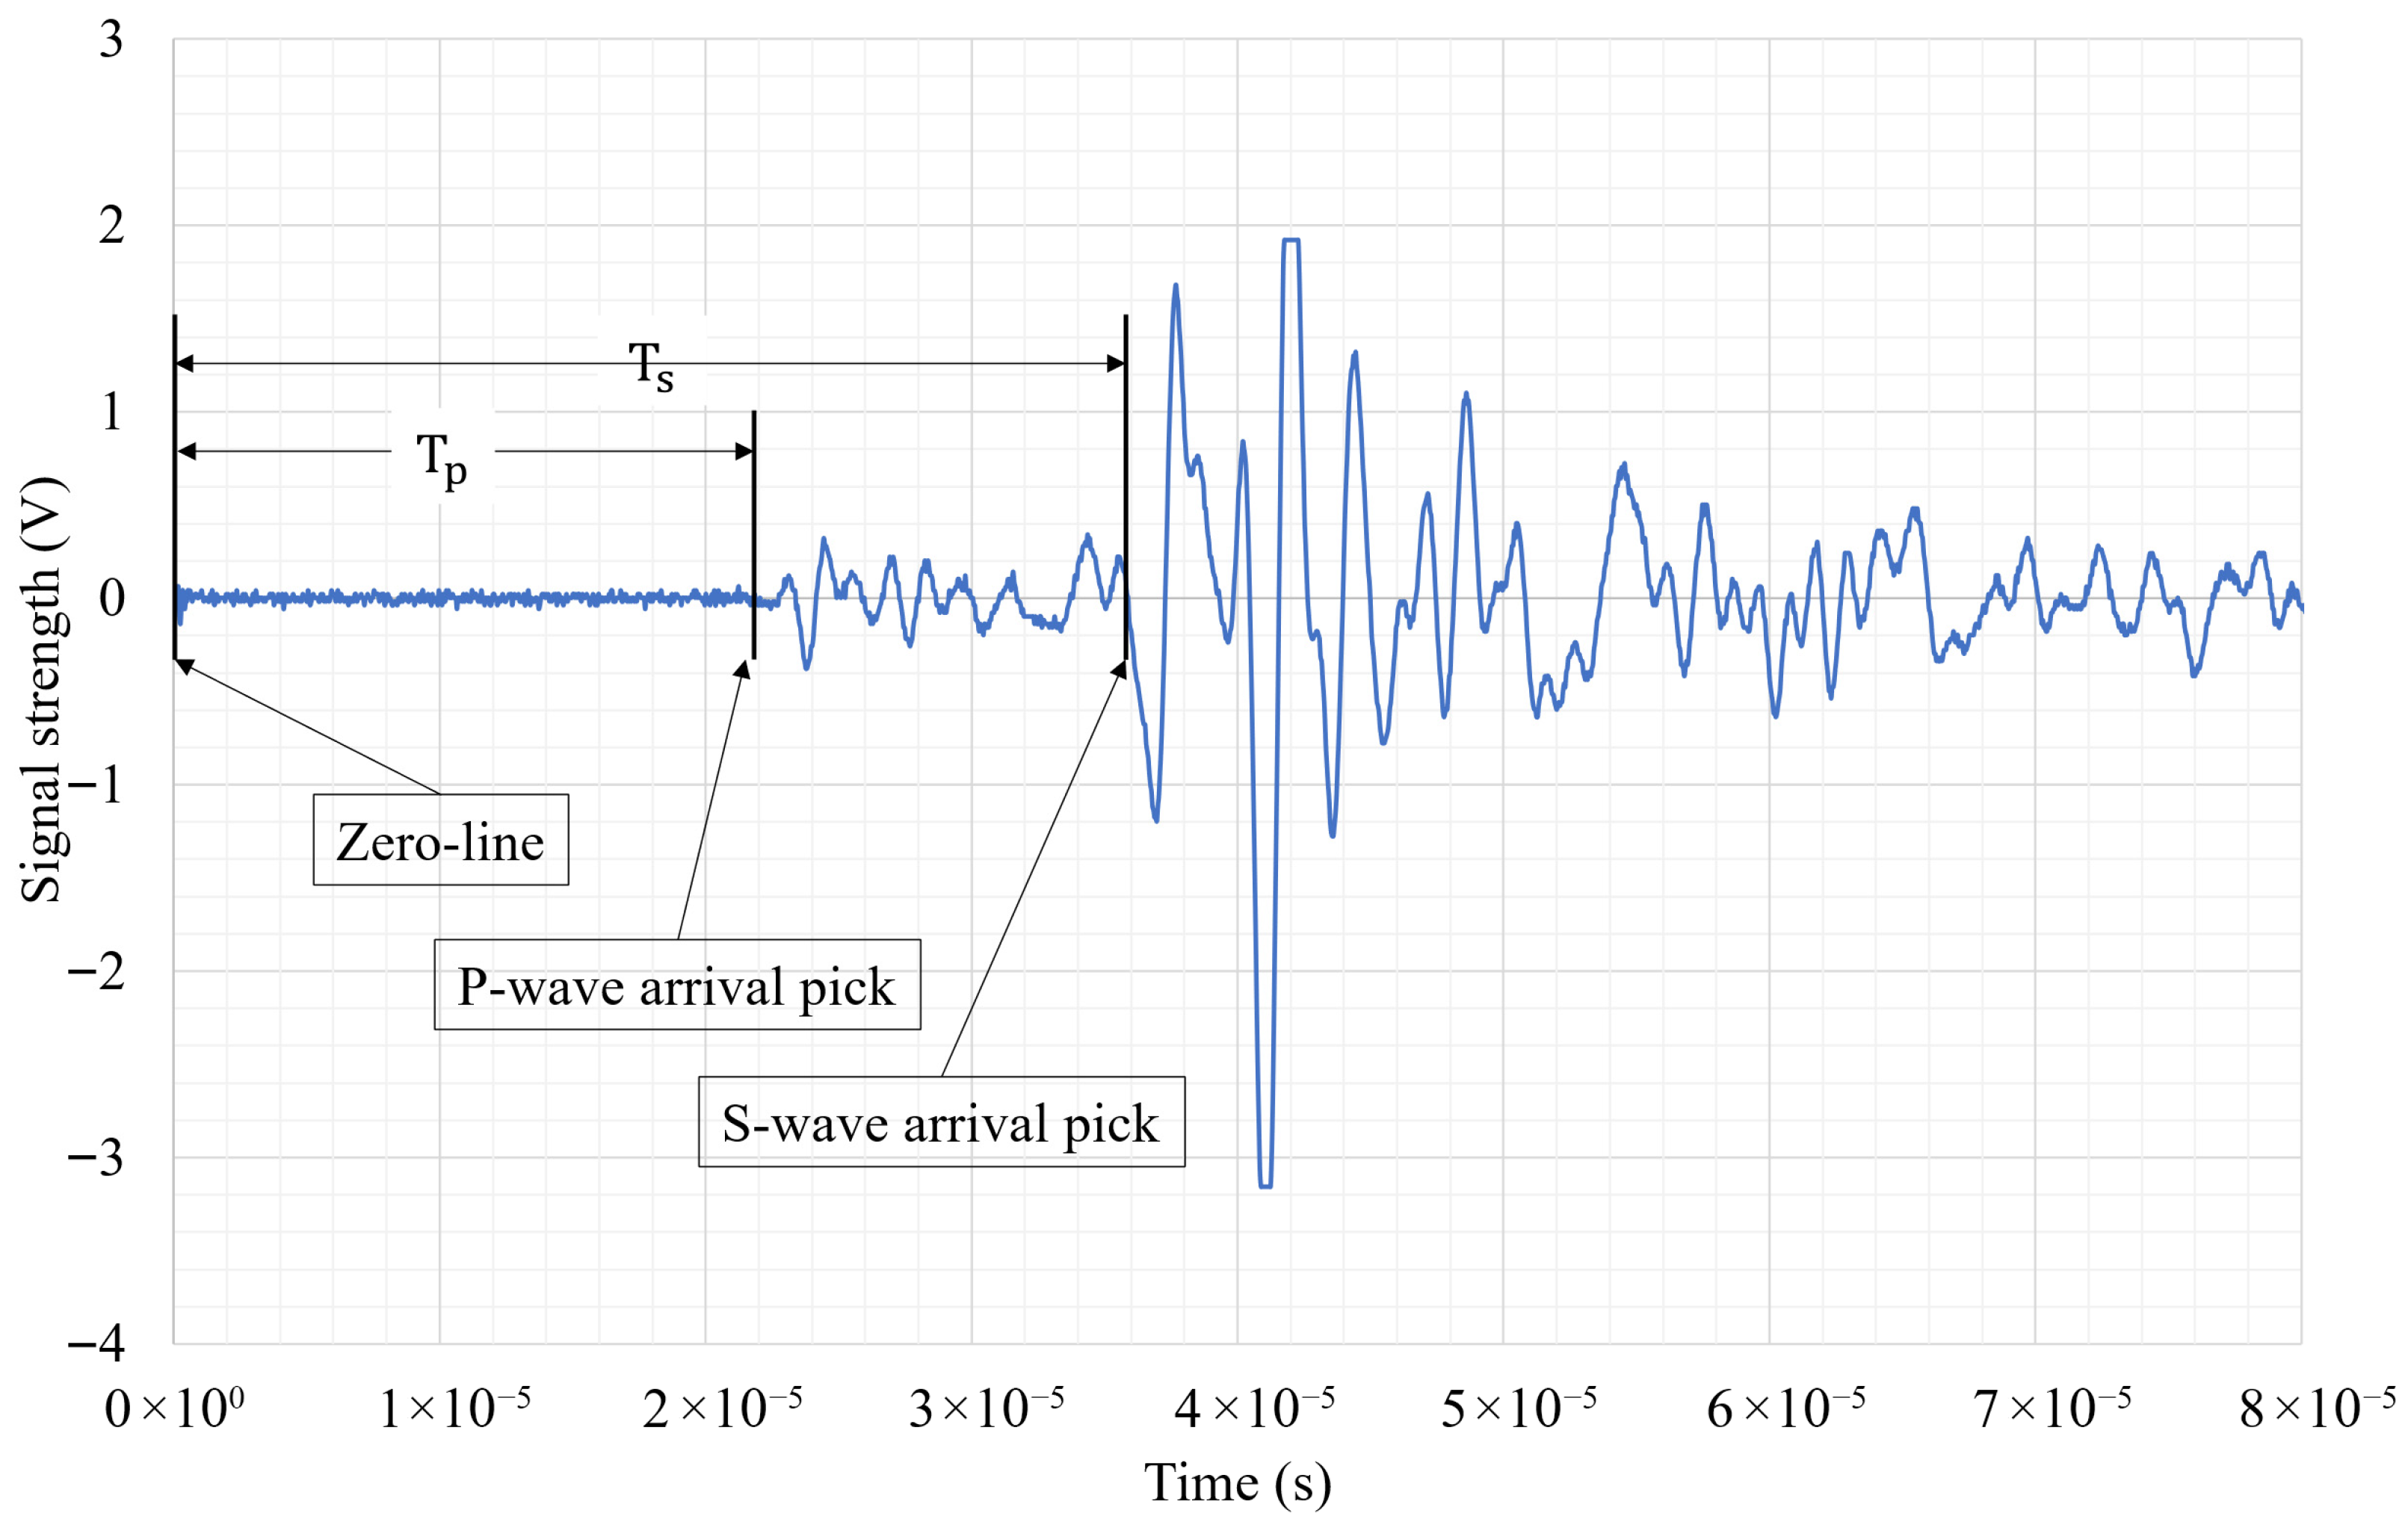
Sample ultrasonic velocities plot, showing arrival times for both P and S wave velocities.
Dynamic elastic properties (shear modulus, G; bulk modulus, K; Young’s modulus, E; Poisson’s ratio, ) were calculated using the measured and , and bulk density :
Integrating these parameters within a standardized non-destructive framework enables robust lithological discrimination and improves calibration for geophysical interpretations. P-wave and S-wave data are plotted in this manuscript to compare the behavior of elastic and electromagnetic waves.
3. Results
3.1. Simulation Results
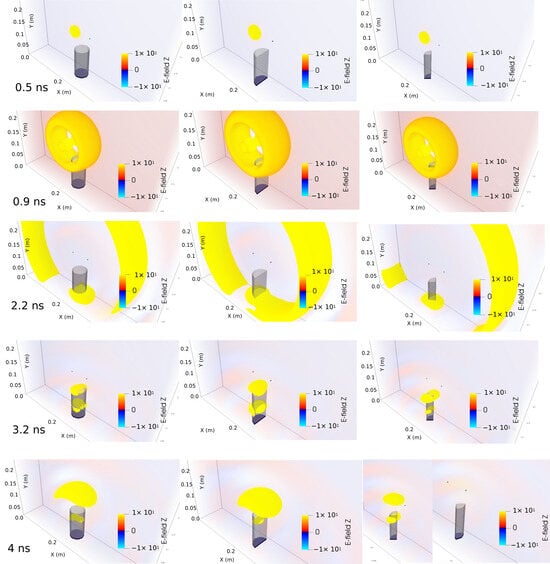
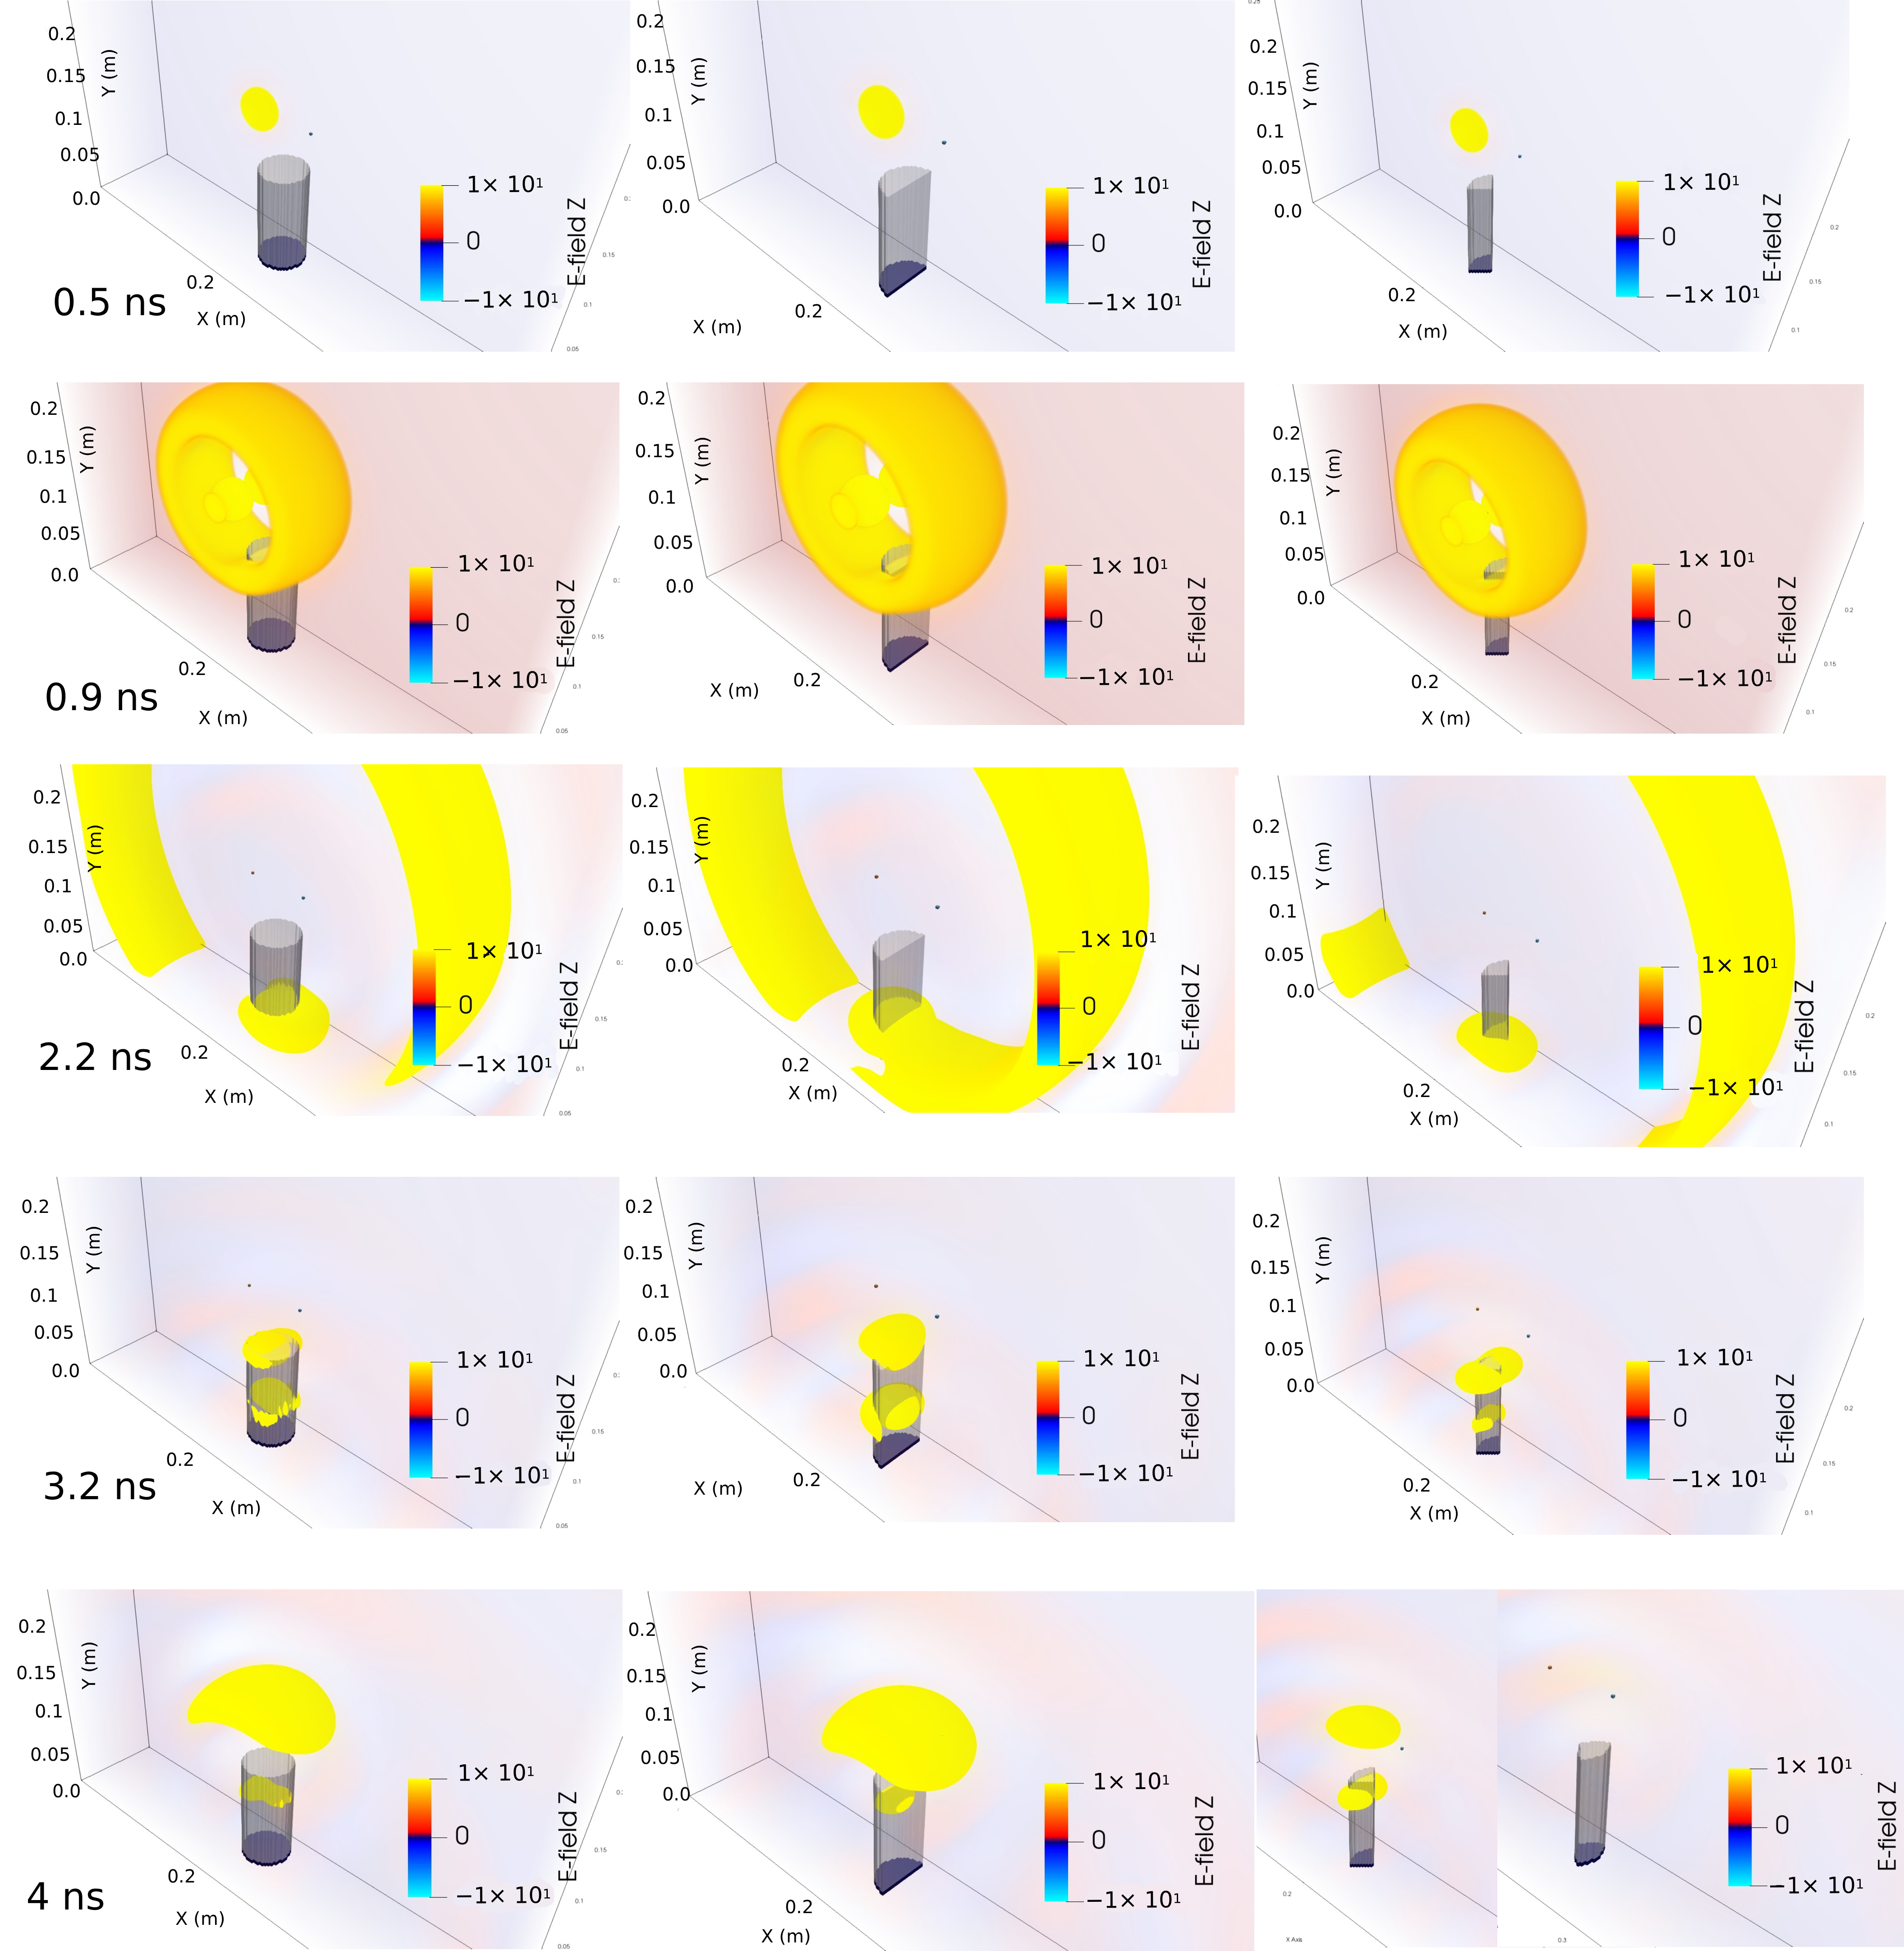
The three-dimensional numerical simulations (Figure 11) were performed using gprMax following a structured, iterative workflow (Figure 5), designed to optimize the experimental configuration. Simulation parameters, including computational domain size, spatial discretization, time window, material properties, source type, excitation frequency, and sample geometry, were defined and systematically refined. After each run, the reflection amplitude and arrival time were evaluated. If reflections from sample boundaries were not clearly resolved, parameters were adjusted and simulations repeated until temporal separation and amplitude stability were achieved.
Figure 11.
gprMax simulation snapshots showing EM wave propagation through a 10 cm, NQ-size sandstone core and reflection from a metal disk at various time steps (0.5–4 ns). Left: whole core, middle: half/split core, and right: quarter core.
The electromagnetic wavelength in a nonmagnetic medium is given by:
where c is the speed of light in vacuum, f is the frequency, and is relative dielectric permittivity.
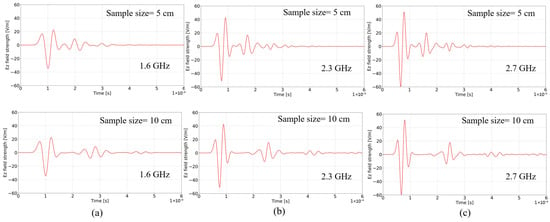
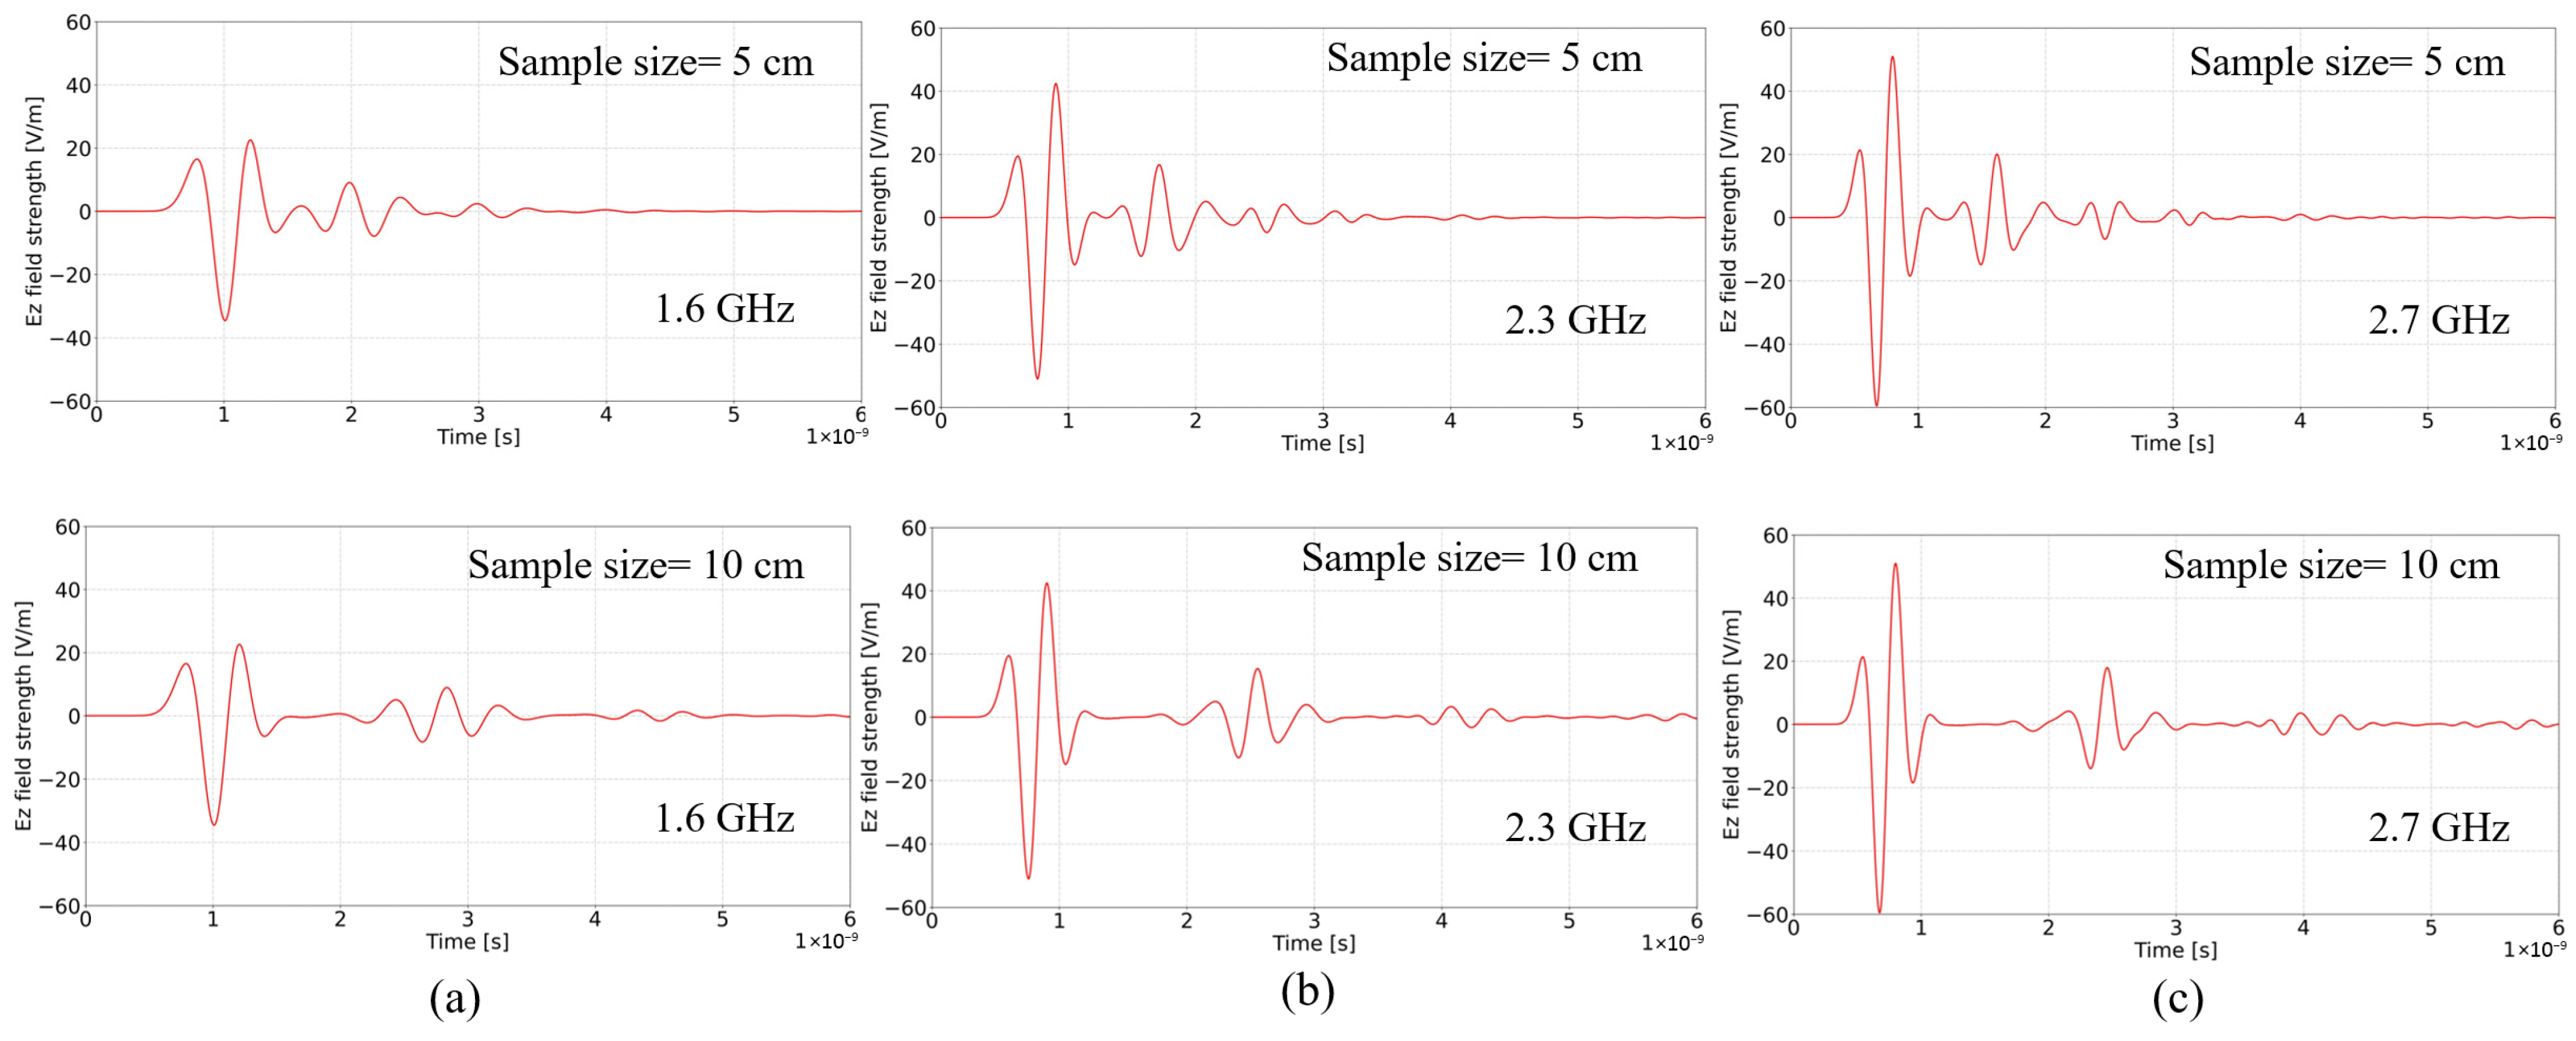
For typical rock relative permittivities ( ≈ 6–12), wavelengths in the 2.3–2.7 GHz range are approximately 3–6 cm. At 1.6 GHz, wavelengths approach 6–8 cm, comparable to or exceeding shorter sample lengths. Simulations show that at 1.6 GHz, broader pulse widths led to partial overlap between incident and reflected arrivals, particularly for 5 cm cores. At 2.3 and 2.7 GHz, shorter wavelengths and narrower wavelets improved temporal separation and boundary resolution. Reflections from the metallic base were distinctly resolved in 10 cm samples and reliably detected in 5 cm samples. These results justify selecting 2.3–2.7 GHz as the optimal operating frequencies for centimeter-scale core analysis. Simulations validated expected propagation paths and timing. Simulation results supported the choice of 2.3 and 2.7 GHz for optimal resolution and helped refine the experimental setup by detecting and eliminating artifact-causing components (Figure 12) [26].
Figure 12.
Time-domain Ez field responses in sandstone at three center frequencies: (a) 1.6 GHz, (b) 2.3 GHz, and (c) 2.7 GHz. Sample lengths: top row: 5 cm, and bottom row: 10 cm. Higher frequencies produce sharper signals and higher reflection amplitudes.
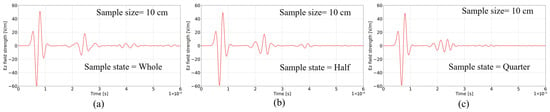
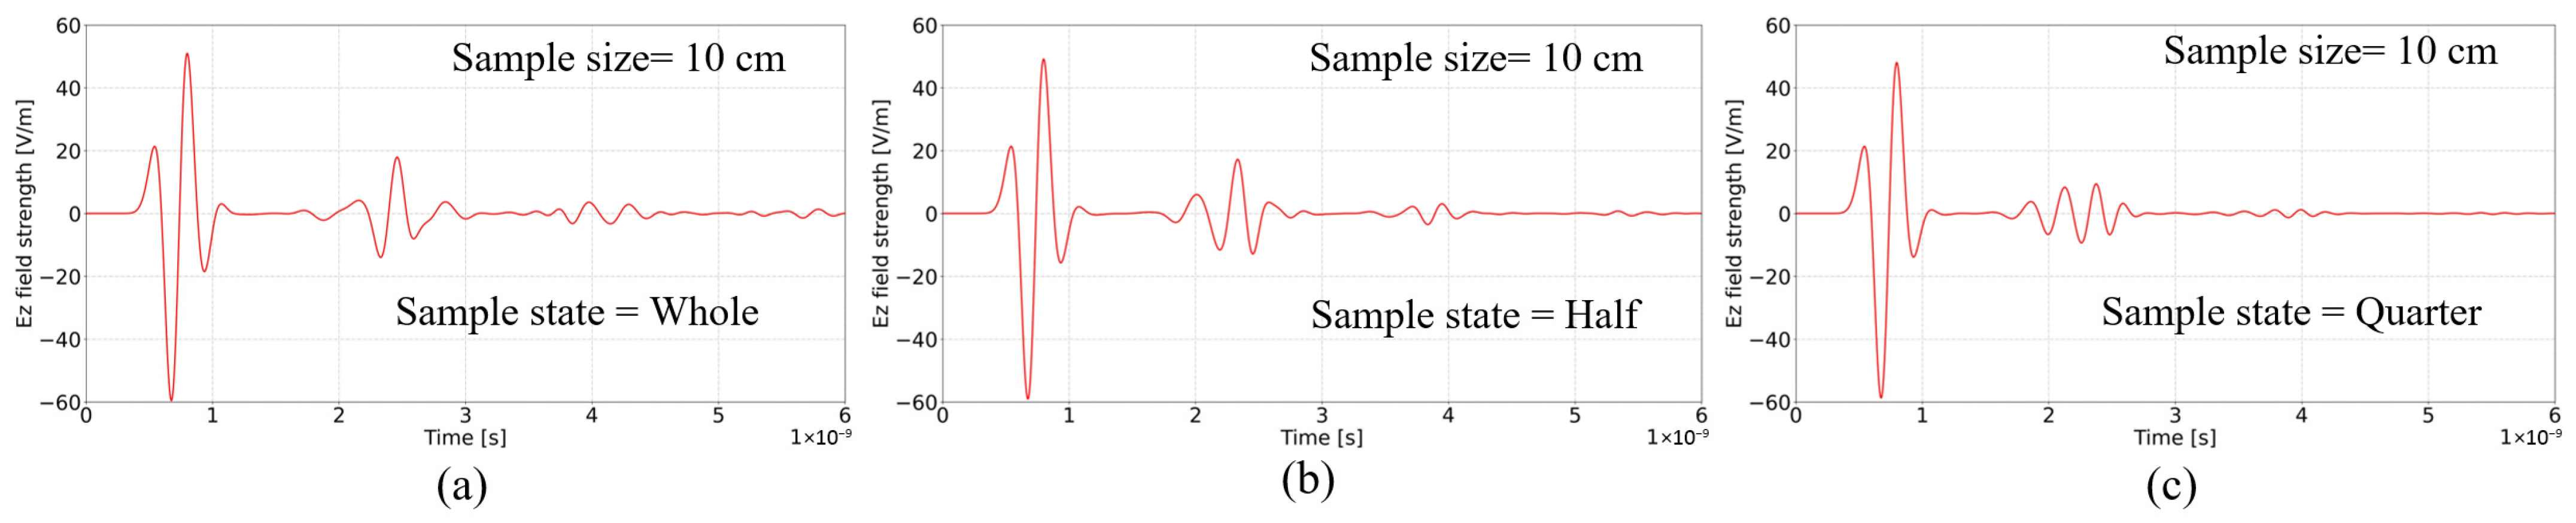
While intrinsic velocity is a bulk property, reflection detectability depends on reflector geometry relative to wavelength. Whole and half cores produced measurable bottom reflections with preserved arrival times (Figure 13). In half cores, amplitude decreased slightly but remained above detection thresholds. In quarter cores, the effective reflecting surface area was significantly reduced. As the reflector dimensions approached the order of the dominant wavelength, diffraction and edge effects reduced the coherent reflection amplitude. In several quarter-core cases, bottom reflections were no longer reliably detectable. This behavior can be interpreted as a wavelength–geometry scaling effect: although internal propagation follows EM principles, measurable reflections require reflector dimensions sufficiently large compared to λ to maintain constructive interference (Figure 13).
Figure 13.
Time-domain Ez field responses in sandstone at three sample states: (a) whole, (b) split/half, and (c) quarter, at 2.7 GHz center frequency.
3.2. Experiments on Homogeneous Samples
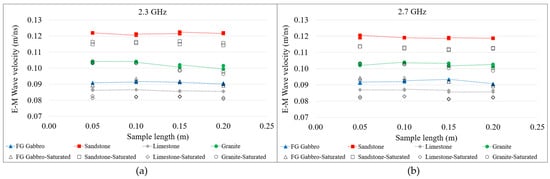
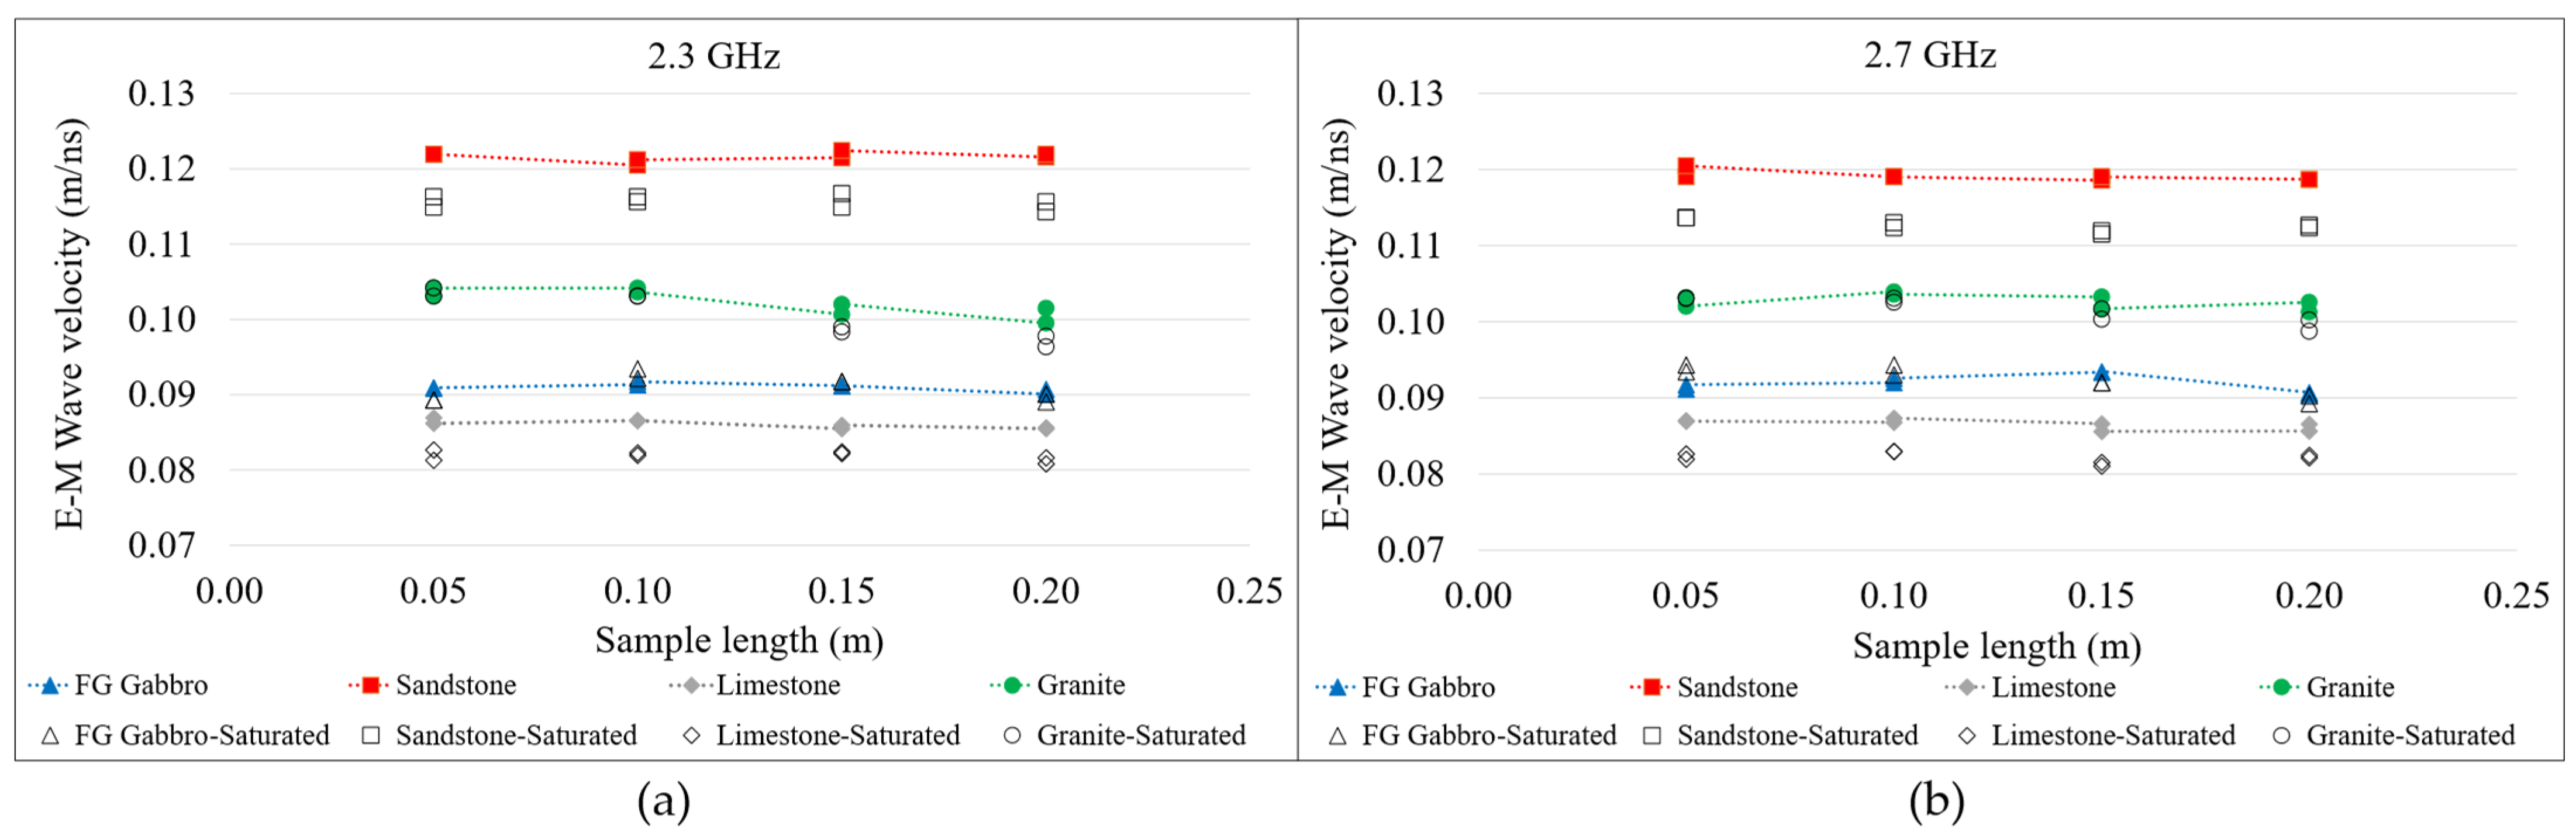
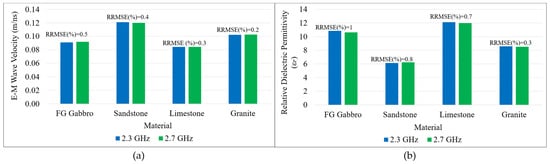
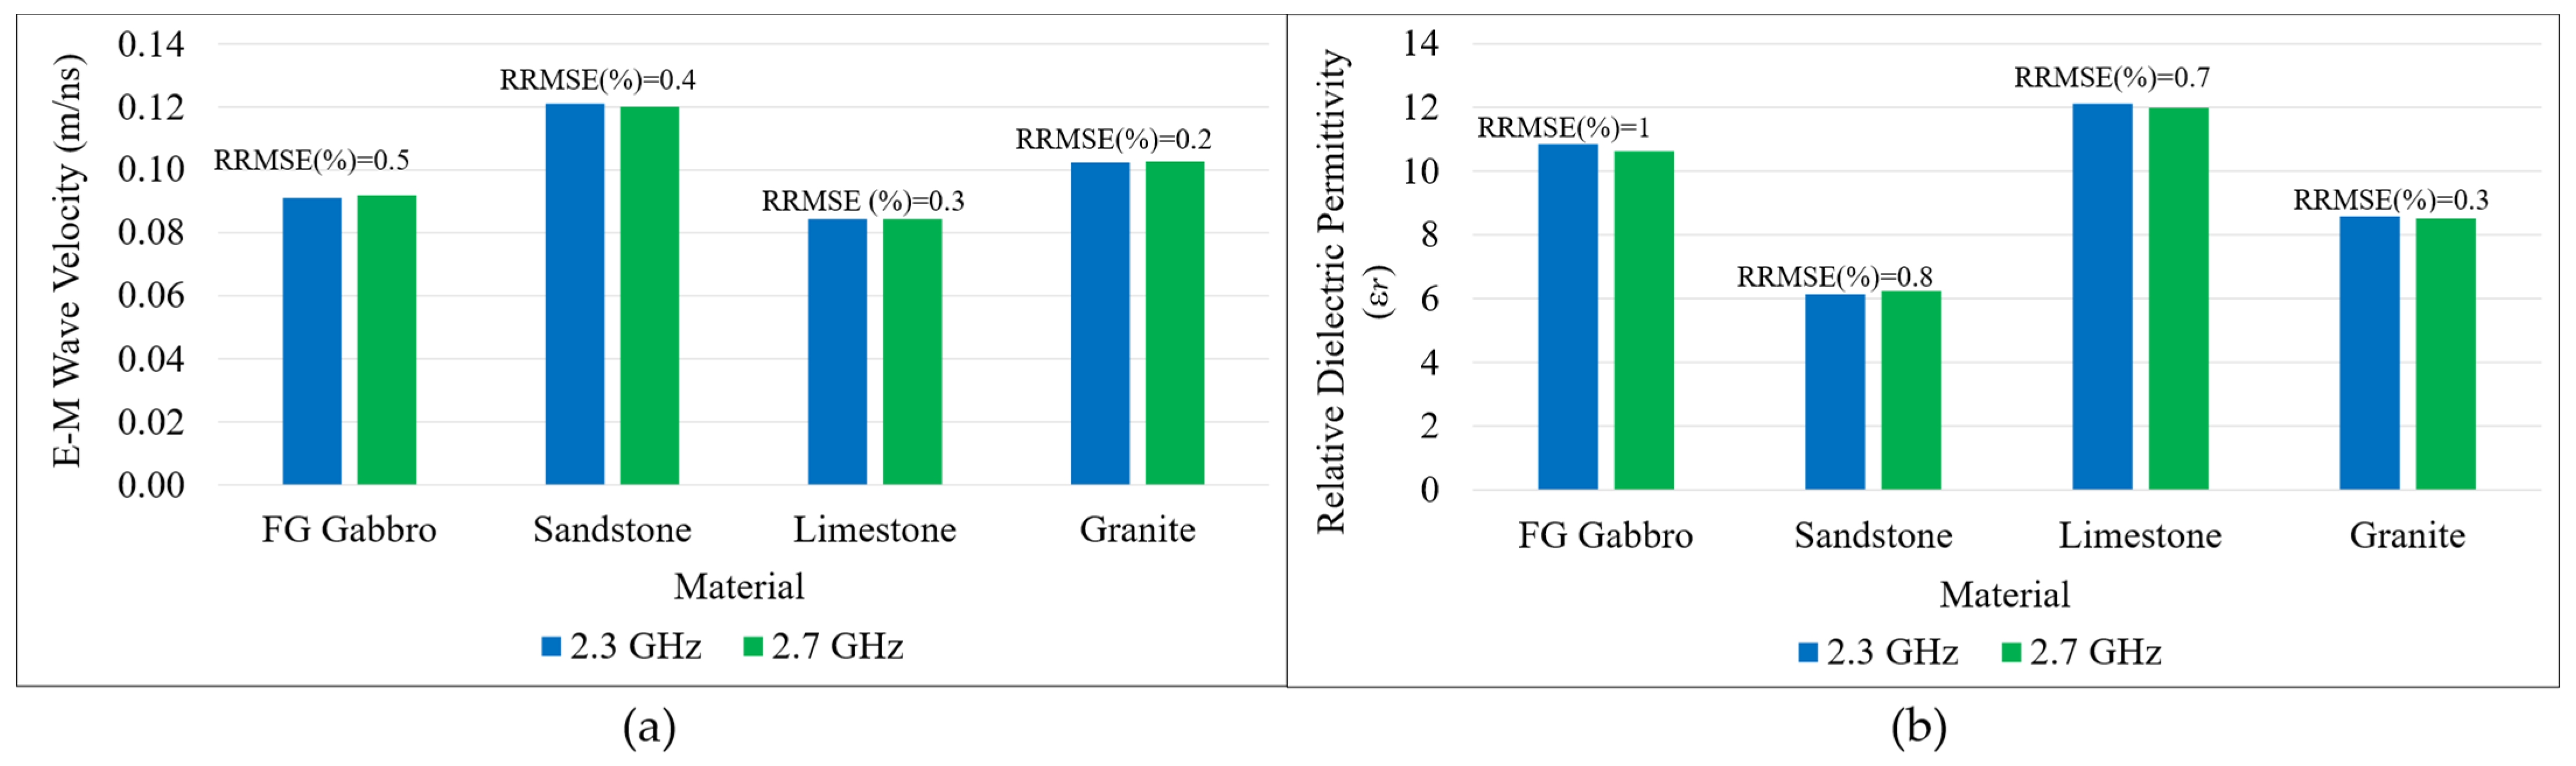
Physical experiments were conducted on sandstone, limestone, granite, and fine-grained gabbro cores, 5, 10, 15, and 20 cm long. As shown in Figure 14, velocities derived using both frequencies remained consistent across lengths and matched the literature’s RDP values (Table 2) [6,26,62]. Average velocity and RDP variations across different sample lengths with the same lithology were <2%, and variations between the two frequencies were also ≤2%, confirming method accuracy (Figure 14 and Figure 15). Samples were also tested in flipped orientations to check anisotropy effects. Results showed negligible differences, suggesting minimal impact on orientation for homogeneous samples. For the 15 cm and 20 cm granite samples, two shorter granite pieces were stacked due to material constraints. Despite careful polishing of the contact surfaces to minimize air gaps, the additional interface resulted in slightly lower calculated velocities than in the 5 cm and 10 cm single-piece samples.
Figure 14.
EM wave velocity versus sample length for sandstone, limestone, fine-grain gabbro, and granite at (a) 2.3 GHz and (b) 2.7 GHz.
Figure 15.
(a) Average EM wave velocities, (b) calculated relative dielectric permittivity for sandstone, limestone, fine-grain gabbro, and granite samples at 2.3 GHz and 2.7 GHz [26].
Saturation experiments at 2.3 and 2.7 GHz demonstrate lithology-dependent behavior (Figure 14). Sandstone and limestone exhibit measurable velocity reductions under water absorption, whereas granite and fine-grained gabbro show negligible change. This response is consistent with dielectric mixing models:
where is porosity, is water permittivity, and is solid permittivity. Because ≈ 80, at GHz frequencies, even moderate water saturation significantly increases bulk permittivity in porous rocks, reducing velocity. The minimal change observed in the granite and gabbro samples reflects their low porosity and limited fluid uptake.
3.3. Method Validation on Heterogeneous Samples
Heterogeneous drill cores (whole, half, and quarter) with diverse lithologies representing oxide/sulfide intervals and host rocks were sourced from multiple mining districts across Newfoundland and Labrador, Canada, and stored at the St. John’s core storage library, NL. Sample dimensions, volume, mass, bulk density, electrical conductivity, magnetic susceptibility, EM wave velocity, and seismic velocity were recorded in accordance with the DTL geophysical rock properties characterization framework (Figure 2, Table 4 and Table 5). After confirming on DTL standard samples that the 2.3 and 2.7 GHz antennas yielded closely comparable EM velocities, differing by less than 2%, measurements on the heterogeneous cores were performed using only the 2.7 GHz antenna, owing to its shorter wavelength and improved boundary resolution. These samples were analyzed to evaluate the proposed method’s ability to capture variations in electromagnetic (EM) wave velocity across different commodity types, mineral assemblages, and host rock lithologies, and to investigate its sensitivity to lithology, mineralogy, density, magnetic susceptibility (MS), and electrical conductivity. The dataset spans a wide range of bulk densities (2.53–4.05 g/cm3), magnetic susceptibilities (0.07–606 × 10−3 SI), and conductivities (0–10.2 S/m), providing a comprehensive cross-commodity comparison (Table 4 and Table 5, Figure 16 and Figure 17).
Table 4.
Measured ranges of density, conductivity, magnetic susceptibility, and EM velocity in heterogeneous sulfide/oxide-bearing and host rock drill core samples from various mineral systems in Newfoundland and Labrador. Numbers in parentheses state the number of samples and sample state (W = whole, H = half, and Q = quarter).
Table 5.
Measured ranges for rock physical properties in heterogeneous sulfide/oxide-bearing and host rock drill core samples from various mineral systems in Newfoundland and Labrador. Numbers in parentheses state the number of samples and sample state (W = whole, H = half, and Q = quarter).
Figure 16.
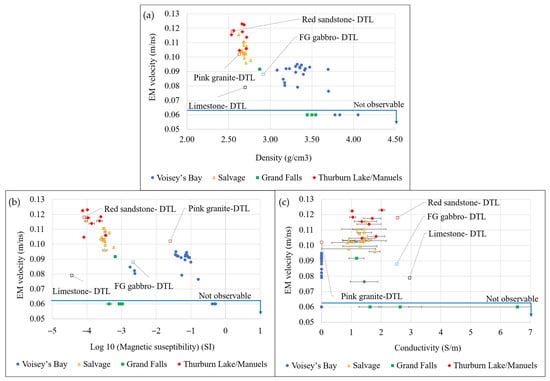
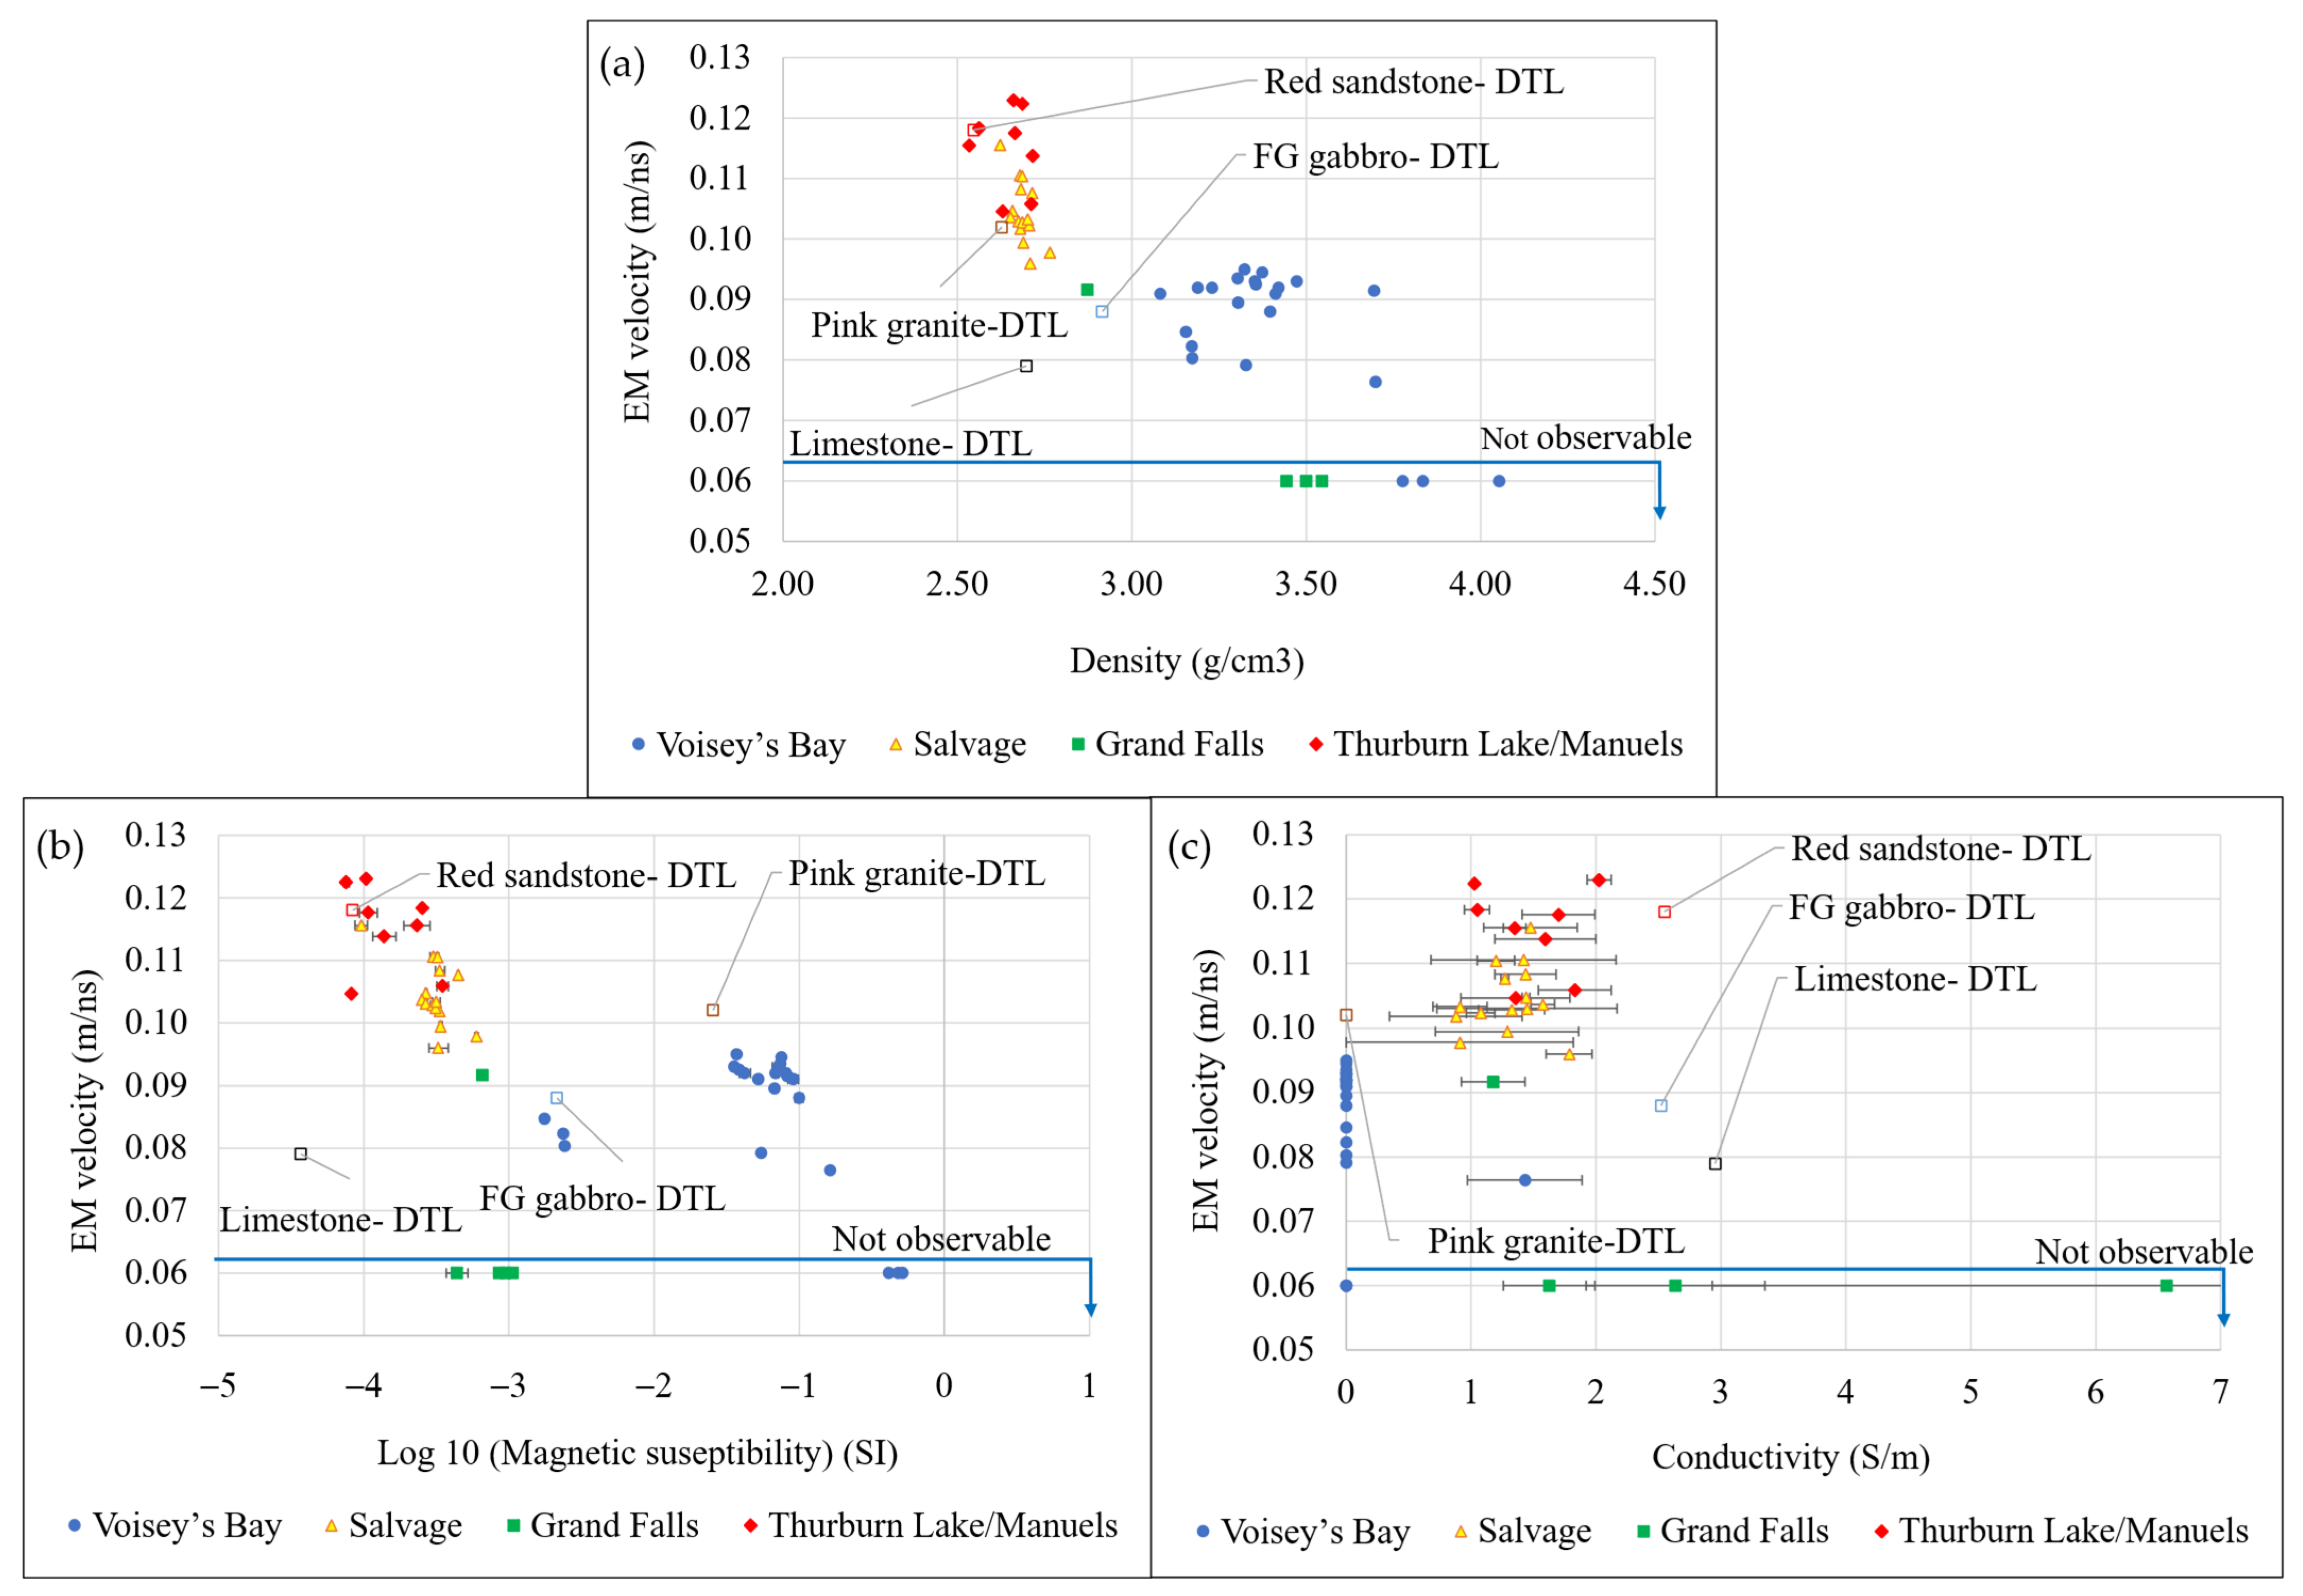
(a) EM wave velocity vs. density, (b) EM wave velocity vs. magnetic susceptibility, and (c) EM wave velocity vs. conductivity for heterogeneous sulfide/oxide-bearing and host rock drill core samples from various mineral systems in Newfoundland and Labrador. Measurements on homogeneous DTL samples are labeled in each graph.
Figure 17.
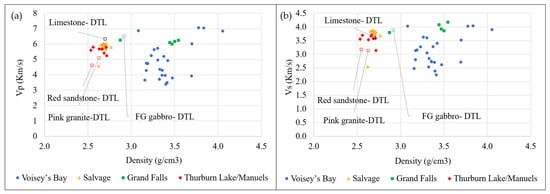
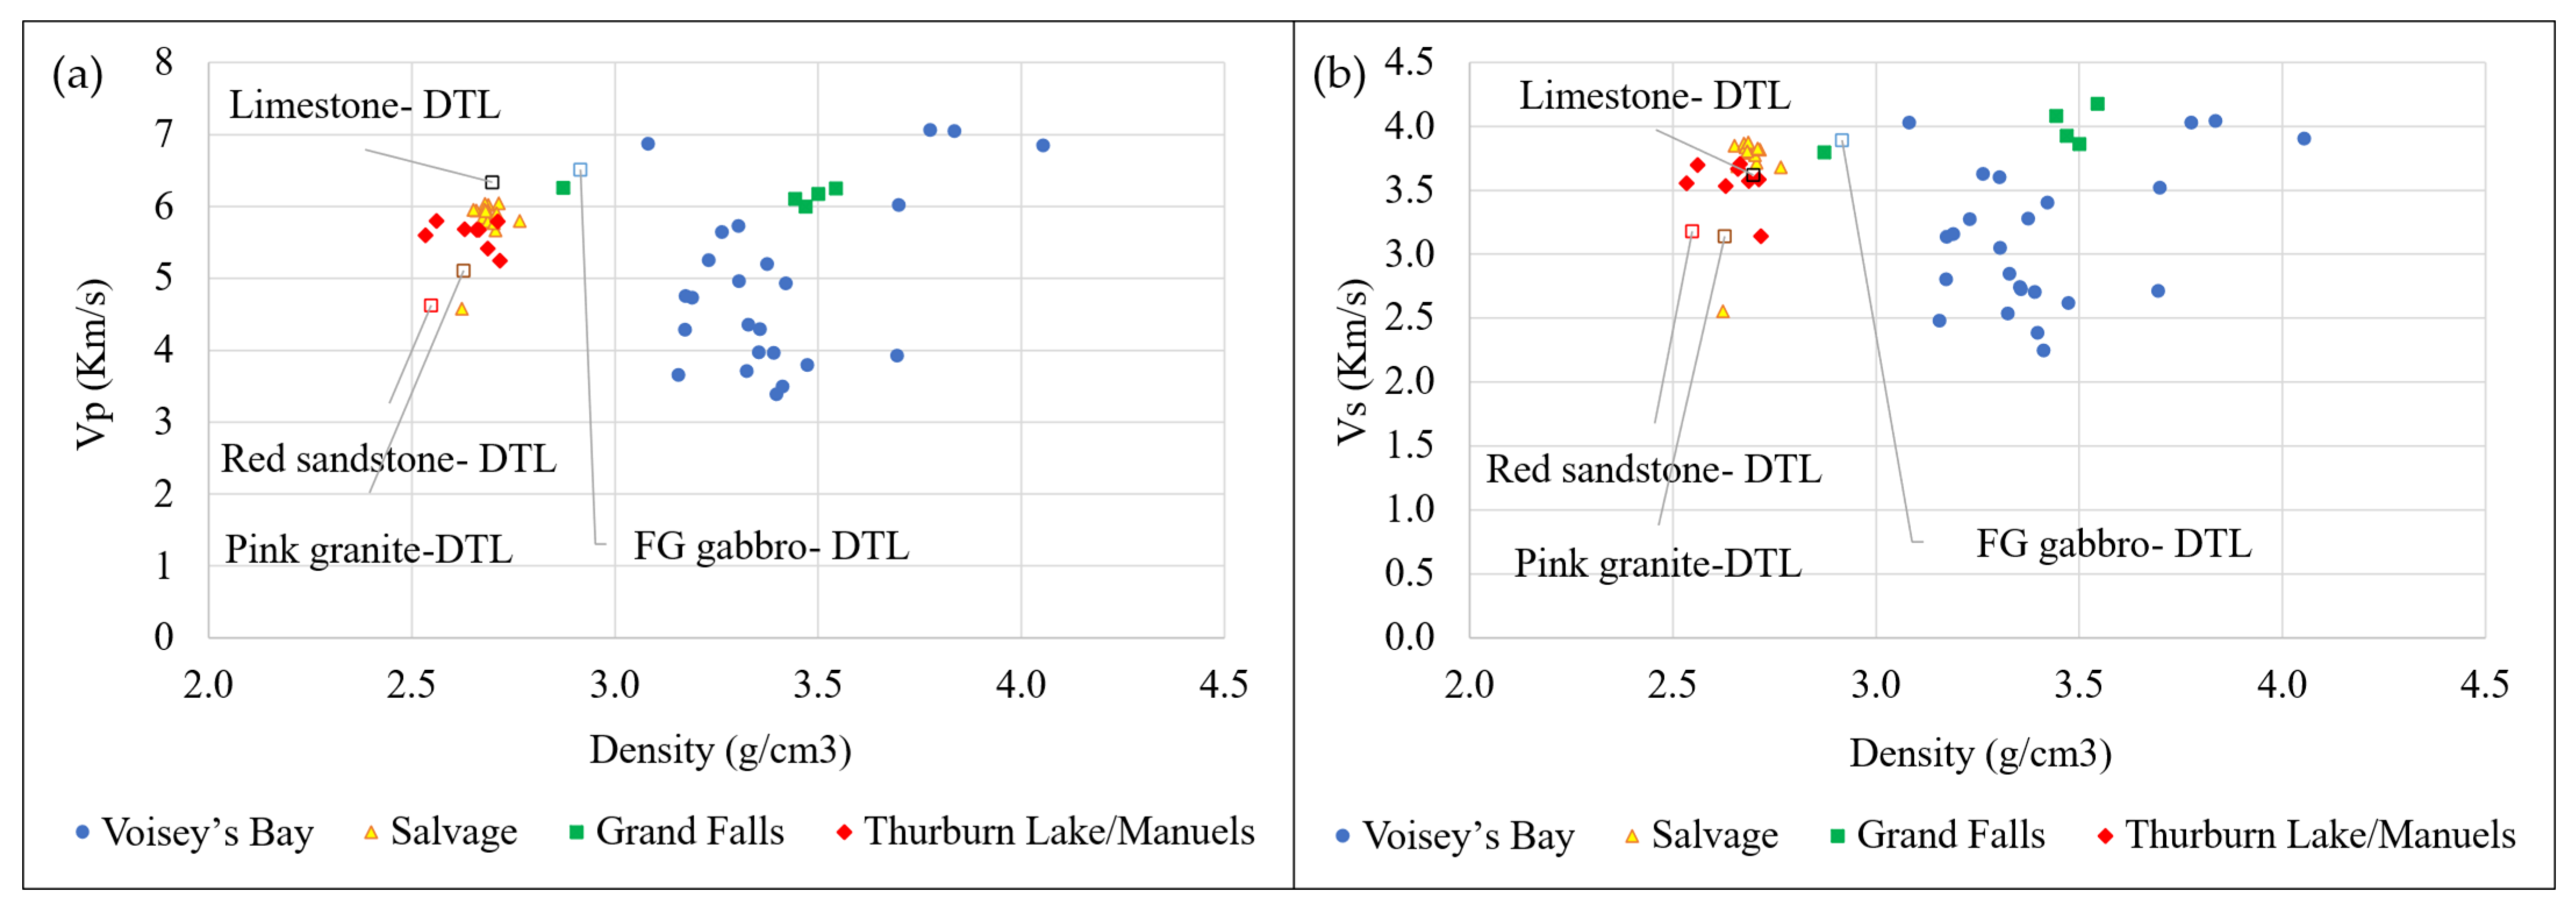
(a) P-wave velocity vs. density, and (b) S-wave velocity vs. density, for heterogeneous sulfide/oxide-bearing and host rock drill core samples from various mineral systems in Newfoundland and Labrador. Measurements on homogeneous DTL samples are labeled in each graph.
The Voisey’s Bay drill core suite comprises olivine gabbro containing 5–15% fine-grained magnetite (with trace to 5% sulfides), and magnetite-rich units (50–85% magnetite). Across samples, bulk density increases systematically with magnetite enrichment, from 3.08 to 3.69 g/cm3 in typical olivine to 3.70–3.78 g/cm3 in 50–75% magnetite intervals and 3.84–4.05 g/cm3 in 80–85% magnetite quarter-core samples, reflecting the high specific gravity of magnetite relative to the host. Elastic properties exhibit a corresponding increase (Table 4, Figure 16).
P-wave velocity (Vp) rises from 3.42 to 5.73 km/s in typical olivine gabbro to 6.02–7.07 km/s in magnetite-enriched intervals, with the highest values recorded in quarter-core samples dominated by magnetite (80–85%), reflecting increased dynamic stiffness (Table 5; Figure 17). Magnetic susceptibility (MS) varies by two orders of magnitude (~1.7–606 × 10−3 SI), peaking in those same intervals (Table 4; Figure 16). EM velocities are measurable in magnetite-bearing gabbro within 0.077–0.094 m/ns but become “non observable” in magnetite-rich (≥50% magnetite) intervals. This behavior is evident in the EM velocity–magnetic susceptibility cross-plot (Figure 16), where samples exceeding ~160 × 10−3 SI fall into a non-detectable EM region. Although bulk density and elastic velocity continue to increase in these intervals, high magnetic susceptibility suppressed EM detectability through attenuation and magnetic loss mechanisms. Thus, while density and Vp positively correlate in oxide- and sulfide-enriched mafic rocks, EM velocity becomes measurement-limited under extreme magnetic conditions.
Cu-bearing intervals from Salvage comprise sandstone–argillite (2–5% chalcopyrite), volcaniclastic sandstone–graywacke (1–2% chalcopyrite), and interlaminated argillite–sandstone–chert sequences with locally brecciated sedimentary textures (0–3% chalcopyrite). Across 15 whole-core samples, bulk densities range narrowly from 2.62 to 2.77 g/cm3, reflecting the relatively uniform mineralogical framework of these sedimentary host rocks. P-wave velocities span 4.69 to 6.07 km/s, with the lowest values recorded in sandstone–graywacke intervals (4.69 km/s) and the highest in argillite–sandstone–chert units (up to 6.07 km/s). Conductivity varies between 0.35 and 2.17 S/m, with slightly elevated values associated with chalcopyrite-bearing intervals. Despite this moderate conductivity range, magnetic susceptibility remains consistently low, between 0.09 and 0.62 × 10⁻³ SI, confirming the absence of strongly magnetic phases.
EM velocity is consistently measurable across all Salvage samples, ranging from 0.096 to 0.116 m/ns. The highest EM velocities (0.107–0.116 m/ns) occur in sandstone–argillite intervals, while slightly lower values (0.096–0.098 m/ns) are observed in argillite–sandstone–chert units. The density–EM velocity cross-plot (Figure 16) shows that these samples form a coherent cluster distinct from that of mafic intrusive rocks. The relatively low magnetic susceptibility and electrical conductivity values enable successful EM velocity measurements in these host rocks, compared to the magnetite-rich sections of olivine gabbro in igneous regions.
The Grand Falls dataset comprises a mafic dyke host and massive-to-semi-massive sulfide intervals dominated by pyrite with subordinate sphalerite and minor chalcopyrite. In contrast to the Salvage siliciclastic suite, the host lithology here is a mafic intrusive unit rather than sedimentary rock. The mafic dyke sample (4–5% pyrite; one whole core) exhibits a density of 2.87 g/cm3, P-wave velocity of 6.26 km/s, conductivity ranging from 0.92 to 1.43 S/m, and magnetic susceptibility of 0.65–0.67 × 10⁻³ SI. EM velocity was measurable in this relatively low-conductivity interval at 0.092 m/ns.
In contrast, the massive and semi-massive sulfide intervals (half-core samples) show significantly elevated densities of 3.44–3.54 g/cm3, reflecting high pyrite contents (~75–95% pyrite with 1–20% sphalerite and minor chalcopyrite). P-wave velocities remain consistently high, ranging from 6.01 to 6.25 km/s, indicating a stiff, sulfide-dominated interval. Magnetic susceptibility remains comparatively low across all intervals (0.37–1.13 × 10⁻³ SI), confirming the absence of magnetite-rich phases. Electrical conductivity provides the strongest lithological contrast. Semi-massive sulfide intervals display conductivities between 0.98 and 3.35 S/m, while the massive sulfide sample reaches a maximum of 10.20 S/m. EM velocity was not measurable in any of the massive or semi-massive sulfide intervals. The conductivity–EM velocity cross-plots demonstrate a sharp reduction in EM detectability as conductivity exceeds ~3 S/m, with complete signal suppression observed in the 10.2 S/m interval. Unlike the magnetite-rich Ni–Cu system at Voisey’s Bay, where EM attenuation is primarily associated with high magnetic susceptibility, the Grand Falls VMS intervals show low magnetic susceptibility but high conductivity. This confirms that attenuation in these samples is predominantly conductivity-driven rather than magnetically controlled.
Quartz–muscovite–illite-rich siliciclastic intervals from Thorburn Lake and Manuels include conglomerate–sandstone units, sandstone–siltstone with minor conglomerate and 1–2% disseminated pyrite, illite–quartz-rich intervals (60–70% quartz), and muscovite-bearing quartz-rich units (~40% quartz). Across whole- and half-core samples, bulk densities range from 2.53 to 2.72 g/cm3, reflecting the relatively uniform siliciclastic mineral assemblage (Figure 16). P-wave velocities fall within 5.25–5.80 km/s, with slightly higher values observed in the conglomerate–sandstone and muscovite-bearing intervals (up to 5.80 km/s). Electrical conductivity spans 0.92–2.12 S/m, remaining within a moderate range despite minor disseminated sulfide content. Magnetic susceptibility is consistently low, between 0.07 and 0.38 × 10⁻³ SI, confirming the absence of magnetite-rich phases and indicating negligible magnetic loss contribution to EM attenuation. EM velocity is consistently measurable across all samples, ranging from 0.105 to 0.124 m/ns. The highest EM velocities (0.113–0.124 m/ns) occur in the illite–quartz-rich intervals, whereas slightly lower values (~0.105–0.106 m/ns) are recorded in sandstone–siltstone containing trace pyrite, and muscovite-bearing units. The combination of low magnetic susceptibility and moderate conductivity enables stable propagation of EM waves in these quartz-dominated siliciclastic rocks.
4. Discussion
4.1. Performance and Robustness of the HFEM Core-Based Velocity Measurement Method
The results demonstrate that the proposed HFEM core-based methodology provides a robust, repeatable, and quantitative means of estimating electromagnetic (EM) wave velocity and relative dielectric permittivity (RDP) for drill core materials across a wide range of lithologies and mineralization styles. Controlled experiments on homogeneous reference lithologies (DTL sandstone, limestone, granite, and gabbro) show velocity variations of less than 2% across sample lengths (5–20 cm) and between antenna frequencies (2.3 and 2.7 GHz). The agreement between experimentally derived RDP values and the literature’s ranges [62] confirms that the method captures physically meaningful bulk EM wave velocity and dielectric properties. More importantly, the consistency of results across flipped core orientations suggests that, for macroscopically homogeneous samples, anisotropy effects are negligible at the tested frequencies and scales. This supports the use of the method as a practical proxy for field-representative EM velocity, particularly in scenarios where conventional velocity estimation techniques are impractical.
4.2. Frequency Selection for Resolution–Attenuation Trade-Offs, and Signal Processing
The gprMax simulations and physical experiments jointly demonstrated that antenna frequency plays a critical role in resolving internal core boundaries and extracting reliable travel times. At 1.6 GHz, overlapping wavelets and insufficient temporal separation between reflections resulted in poor boundary discrimination, consistent with theoretical resolution limits imposed by wavelength and bandwidth. In contrast, 2.3 and 2.7 GHz provided sufficient temporal resolution to clearly resolve the air–core and core–metal interfaces. These frequencies are substantially higher than the range commonly used in many field GPR surveys (e.g., 10–500 MHz) but are commonly employed in other laboratory-based dielectric property measurements. According to Annan’s definition of wave behavior [6], in the propagation-dominant plateau of GPR signals, velocity becomes relatively insensitive to frequency, whereas attenuation continues to increase with frequency. In this context, the high frequencies used here should be viewed as a laboratory-scale choice made to resolve thin internal boundaries rather than as a direct equivalent of most field surveys. The EM velocities and derived dielectric properties remain relevant to lower-frequency GPR applications because they reflect the bulk material response, provided dispersion is limited, but lower-frequency field systems would be expected to trade this high boundary resolution for improved penetration and reduced attenuation and scattering losses. Accordingly, the inability to obtain measurable EM velocities in highly conductive or magnetite-rich samples highlights a fundamental physical limitation rather than a methodological shortcoming, as discussed below [64].
In addition to antenna frequency, the stability of boundary identification depended strongly on the applied signal-processing workflow on all radargrams. Primary processing steps, including static correction, Dewow filtering, and background removal, were essential for correcting antenna-offset effects, suppressing low-frequency drift, and eliminating temporally consistent noise throughout the profile, thereby making signals visible. However, in more heterogeneous samples, these steps alone were not always sufficient to ensure stable and repeatable picking of the top and bottom reflections. Under these conditions, secondary processing became particularly important. Median filtering reduced impulsive noise and short-scale trace-to-trace variability while preserving reflection edges, thereby improving the continuity of the hyperbolic response. Spectral whitening, applied over the 1000 to 4000 MHz band, further enhanced picking stability by compensating for frequency-dependent attenuation with time and partially deconvolving the effective source wavelet. This sharpened the reflection arrivals, improved the contrast between coherent reflections and surrounding diffracted or multiple-energy components, and made the A-trace picks at the hyperbola apex more repeatable.
4.3. Controls of Sample State, Lithology, Mineralogy, and Physical Properties
Across all commodities, bulk density shows a positive relationship with elastic properties, most evident in the Voisey’s Bay and VMS datasets, where magnetite and sulfide contents are highest. In these systems, increasing oxide or sulfide fractions elevate density from ~3.1 g/cm3 in typical olivine gabbro to >4.0 g/cm3 in magnetite-rich units, and from 2.87 g/cm3 in mafic dyke host rocks to 3.44–3.54 g/cm3 in massive sulfide intervals. Correspondingly, P-wave velocity increases from 3.42 to 5.73 km/s in typical gabbro to >6.8 km/s in magnetite-dominant samples and remains consistently high (6.01–6.26 km/s) in sulfide-rich VMS intervals.
Electrical conductivity is an important indicator of massive and semi-massive sulfide mineralization, particularly in the Grand Falls dataset, where values rise to 10.2 S/m in massive sulfide samples. EM velocity remains stable and consistently measurable in siliciclastic and quartz-rich hosts (Salvage; Thorburn Lake/Manuels), where density ranges from 2.53 to 2.77 g/cm3, magnetic susceptibility remains <0.62 × 10⁻³ SI, conductivity is generally ≤2.17 S/m, and EM velocity falls within 0.096–0.124 m/ns. However, EM velocity becomes partially or completely unmeasurable in the most magnetite-rich intervals (MS ≥ ~400 × 10−3 SI) and in highly conductive VMS intervals (conductivity ≥ ~3 S/m, particularly at 10.2 S/m).
The sample state (whole, half, or quarter core) is an important control on EM wave propagation and detectability. The present results indicate that the transition from measurable to non-measurable EM velocity cannot be attributed solely to electrical conductivity or magnetic susceptibility. Although increasing magnetic susceptibility is clearly associated with decreasing EM velocity, the current dataset does not permit a unique detectability threshold to be defined for either parameter because all non-measurable cases occurred in half- or quarter-core samples. For visualization only, these non-detectable samples were assigned an EM velocity of 0.06 m/ns in Figure 16; this is not a measured value. The samples plotted beneath the “not observable” line in Figure 16 reflect the combined influence of material properties and sample state. The reduced cross-section of half- and quarter-cores likely lowers the returned signal amplitude and makes detection more sensitive to attenuation; accordingly, whole cores are recommended for reliable application of the method to heterogeneous materials. Consistent with this interpretation, simulations under low-loss and near-nonmagnetic assumptions (, ) predicted quarter cores to be non-detectable, but half cores to remain detectable. The experimental non-detectability of several half cores indicates that real-sample conductivity and magnetic susceptibility further attenuated the reflected signal below the detection threshold. Additional work on highly conductive and highly magnetic samples in whole-core form is needed to establish more rigorous detectability thresholds.
These results highlighted the fundamentally different sensitivities of physical and electromagnetic wave propagation. While elastic waves are primarily controlled by density and elastic moduli, EM waves are strongly influenced by electrical conductivity and magnetic susceptibility. In sulfide-rich or magnetite-bearing rocks, elevated electrical conductivity and magnetic susceptibility increase attenuation and reduce skin depth (Equation (7)), often to values smaller than the sample thickness. Under these conditions, even with extended time windows to account for potential delays associated with reduced wave velocity, the EM wave energy is significantly attenuated before a coherent reflection from the underlying metal reflector can be detected, rendering velocity estimation infeasible. From an exploration perspective, this behavior is not a limitation but rather a diagnostic feature. The transition from measurable to unmeasurable EM velocity effectively delineates domains of high conductivity and/or magnetic susceptibility, which are commonly associated with massive sulfide mineralization. When integrated with elastic properties, density, electrical conductivity, and magnetic susceptibility in the DTL geophysical characterization framework (Figure 2), the absence of EM velocity becomes an additional indicator of sulfide abundance. With this multi-parameter measurement, the combined response of elastic, electrical, magnetic, and EM properties enables more reliable lithological and mineralogical discrimination.
5. Conclusions
One of the key motivations for this study is the persistent uncertainty in time–depth conversion for common-offset HFEM and GPR surveys. The core-based velocity measurements presented here provide field-representative EM velocities that can be directly applied to survey interpretation in comparable lithologies. This study presents a standardized, non-destructive workflow that integrates a newly developed core-based high-frequency electromagnetic (HFEM) method for direct estimation of EM-wave velocity, along with ultrasonic pulse velocity, bulk density, electrical conductivity, and magnetic susceptibility, for drill core characterization. Controlled tests on homogeneous reference lithologies demonstrate that the HFEM approach provides repeatable EM velocities and relative dielectric permittivity estimates (typically within ~2% across sample lengths and between 2.3 and 2.7 GHz measurement frequency), supporting its use for time–depth conversion in common-offset HFEM/GPR workflows where conventional in situ velocity estimation is impractical. Application to heterogeneous, mineralized drill cores from multiple Newfoundland and Labrador mineral systems shows that host lithologies yield stable, measurable EM velocities, while magnetite-rich intervals and massive-to-semi-massive sulfides frequently exceed practical detectability limits due to strong attenuation controlled by elevated magnetic susceptibility and/or electrical conductivity. The integrated dataset indicates complementary sensitivities: elastic velocities correlate with density, whereas HFEM response is constrained by conductive and magnetic losses, enabling multi-parameter differentiation of lithology and mineralization type.
Author Contributions
Conceptualization and methodology, L.A., A.L. and S.D.B.; investigation, data curation, validation, and visualization, L.A. and P.S.R.; formal analysis and writing—original draft, L.A.; review and editing, L.A., A.L. and S.D.B.; supervision, A.L. and S.D.B.; project administration, S.D.B. and P.S.R.; funding acquisition, S.D.B. All authors have read and agreed to the published version of the manuscript.
Funding
This research was funded by Novamera Inc. through Memorial University of Newfoundland research contracts No. 20241493 and No. 20220331, Mathematics of Information Technology and Complex Systems (MITACS) Accelerate award IT26846, Digital Research Alliance of Canada, and the National Science and Engineering Research Council (NSERC) Alliance Grant ALLRP 597085-24 for the development and optimization of Surgical Mining Technology.
Data Availability Statement
Data will be available upon request.
Acknowledgments
Fellowship funding for L. Abbasian was provided by the School of Graduate Studies at Memorial University and the KEGS Foundation. The St. John’s Core Storage Library and the Department of Natural Resources, Newfoundland and Labrador, are gratefully acknowledged for providing access to rock core samples for this research.
Conflicts of Interest
The authors declare no conflicts of interest.
Nomenclature
The following abbreviations are used in this manuscript:
| Abbreviations | |
| ASTM | American Society for Testing and Materials |
| CMP | Common midpoint |
| CRIM | Complex Refractive Index Model |
| DC | Direct current |
| DTL | Drilling technology laboratory |
| EM | Electromagnetic |
| FDTD | Finite-difference time-domain |
| FK | Frequency–wavenumber |
| GPR | Ground-penetrating radar |
| HFEM | High-frequency electromagnetic |
| MS | Magnetic susceptibility |
| N/A | Not available/not applicable |
| NQ | NQ-size drill core |
| PEC | Perfect electric conductor |
| RQD | Rock quality designation |
| RDP | Relative dielectric permittivity |
| SI | International System of Units |
| TWTT | Two-way travel time |
| UPV | Ultrasonic pulse velocity |
| VMS | Volcanogenic massive sulfide |
| Vp | P-wave (compressional-wave) velocity |
| Vs | S-wave (shear-wave) velocity |
| Tp | P-wave arrival time |
| Ts | S-wave arrival time |
| WARR | Wide Angle reflection and refraction |
| ZOP | Zero-offset profiling |
| 2D/3D | Two-dimensional/three-dimensional |
| Au | Gold |
| Cu | Copper |
| Ni | Nickel |
| Zn | Zinc |
| mag | Magnetite |
| po | Pyrrhotite |
| ccp | Chalcopyrite |
| py | Pyrite |
| sp | Sphalerite |
| sst | Sandstone |
| silst | Siltstone |
| cgt | Conglomerate |
| Qtz | Quartz |
| brcc | Brecciated |
| int-lmn | Interlaminated |
| Symbols/letters | |
| Attenuation coefficient | |
| Skin depth | |
| Δt | Temporal sampling interval |
| Δx | Spatial sampling interval |
| Δz | Target vertical resolution |
| Δl | Characteristic heterogeneity scale |
| Permittivity | |
| f | Frequency |
| Magnetic susceptibility | |
| L | Core length |
| λ | Wavelength |
| m | Mass |
| μ | Magnetic permeability |
| ω | Angular frequency |
| φ | Porosity |
| π | Pi |
| Bulk density | |
| r | Radius |
| R | Reflection coefficient |
| t | Travel time |
| EM wave velocity | |
| c | Speed of light in vacuum |
| Propagation distance | |
| Time window | |
| Subscripts/superscripts | |
| Permittivity of free space | |
| Relative dielectric permittivity | |
| Permittivities of two media | |
| Effective permittivity | |
| Water permittivity | |
| Solid permittivity | |
| Center frequency | |
| Resolution frequency constraint | |
| Depth frequency constraint | |
| μ0 | Permeability of free space |
| Relative magnetic permeability | |
| Travel time through the core | |
| Core thickness | |
| EM wave velocity in the core |
References
- Francke, J. A Review of Selected Ground Penetrating Radar Applications to Mineral Resource Evaluations. J. Appl. Geophys. 2012, 81, 29–37. [Google Scholar] [CrossRef] [Scilit]
- Robert, A.; Versteeg, R.; Sato, M. Dielectric Permittivity of Concrete between 50 Mhz and 1 Ghz and GPR Measurements for Building Materials Evaluation. J. Appl. Geophys. 1998, 40, 89–94. [Google Scholar] [CrossRef] [Scilit]
- Bano, M. Modelling of GPR Waves for Lossy Media Obeying a Complex Power Law of Frequency for Dielectric Permittivity. Geophys. Prospect. 2004, 52, 11–26. [Google Scholar] [CrossRef] [Scilit]
- Monnier, S.; Kinnard, C. Internal Structure and Composition of a Rock Glacier in the Andes (Upper Choapa Valley, Chile) Using Borehole Information and Ground-Penetrating Radar. Ann. Glaciol. 2013, 55, 61–72. [Google Scholar] [CrossRef] [Scilit]
- Jared West, L.; Rippin, D.M.; Murray, T.; Mader, H.M.; Hubbard, B. Dielectric Permittivity Measurements on Ice Cores; Implications for Interpretation of Radar to Yield Glacial Unfrozen Water Content. J. Environ. Eng. Geophys. 2007, 12, 37–45. [Google Scholar] [CrossRef] [Scilit]
- Jol, H.M. Ground Penetrating Radar: Theory and Applications, 1st ed.; Elsevier Science: Amsterdam, The Netherlands; Oxford, UK, 2009; ISBN 978-0-444-53348-7. [Google Scholar]
- Davis, J.L.; Annan, A.P. Ground-Penetrating Radar for High-Resolution Mapping of Soil and Rock Stratigraphy. Geophys. Prospect. 1989, 37, 531–551. [Google Scholar] [CrossRef] [Scilit]
- Olhoeft, G.R. Tables of Room Temperature Electrical Properties for Selected Rocks and Minerals with Dielectric Permittivity Statistics; Open-File Report; U.S. Geological Survey: Reston, VA, USA, 1979; p. 24.
- Martinez, A.; Byrnes, A.P. Modeling Dielectric-Constant Values of Geologic Materials: An Aid to Ground-Penetrating Radar Data Collection and Interpretation. Curr. Res. Earth Sci. 2001, 247, 1–16. [Google Scholar] [CrossRef] [Scilit]
- Jacob, R.W.; Hermance, J.F. Assessing the Precision of GPR Velocity and Vertical Two-Way Travel Time Estimates. J. Environ. Eng. Geophys. 2004, 9, 143–153. [Google Scholar] [CrossRef] [Scilit]
- Nakashima, Y.; Zhou, H.; Sato, M.; Nobes, D.C.; Noon, D.A. Estimation of Groundwater Level by GPR in an Area with Multiple Ambiguous Reflections. J. Appl. Geophys. 2001, 47, 241–249. [Google Scholar] [CrossRef] [Scilit]
- Annan, A.P. Chapter 11. Ground-Penetrating Radar. In Near-Surface Geophysics; Butler, D.K., Ed.; Society of Exploration Geophysicists: Houston, TX, USA, 2005; Volume 13, pp. 357–438. ISBN 978-1-56080-130-6. [Google Scholar]
- Forte, E.; Pipan, M. Review of Multi-Offset GPR Applications: Data Acquisition, Processing and Analysis. Signal Process. 2017, 132, 210–220. [Google Scholar] [CrossRef] [Scilit]
- Mustasaar, M.; Plado, J.; Joeleht, A. Determination of Electromagnetic Wave Velocity in Horizontally Layered Sedimentary Target; a Ground-Penetrating Radar Study from Silurian Limestones, Estonia. Acta Geophys. 2012, 60, 357–370. [Google Scholar] [CrossRef] [Scilit]
- Dou, Q.; Wei, L.; Magee, D.R.; Cohn, A.G. Real-Time Hyperbola Recognition and Fitting in GPR Data. IEEE Trans. Geosci. Remote Sens. 2017, 55, 51–62. [Google Scholar] [CrossRef] [Scilit]
- Tereshchenko, O.V.; Buesink, F.J.K.; Leferink, F.B.J. An Overview of the Techniques for Measuring the Dielectric Properties of Materials. In Proceedings of the 2011 XXXth URSI General Assembly and Scientific Symposium; IEEE: Istanbul, Turkey, 2011; pp. 1–4. [Google Scholar]
- Zheng, Y.; Wang, S.; Feng, J.; Ouyang, Z.; Li, X. Measurement of the Complex Permittivity of Dry Rocks and Minerals: Application of Polythene Dilution Method and Lichtenecker’s Mixture Formulae. Geophys. J. Int. 2005, 163, 1195–1202. [Google Scholar] [CrossRef] [Scilit]
- Chen, L.F.; Neo, C.P.; Ong, C.K.; Varadan, V.V.; Varadan, V.K. Microwave Electronics: Measurement and Materials Characterization, 1st ed.; Wiley: Newark, NJ, USA, 2004; ISBN 978-0-470-84492-2. [Google Scholar]
- Ghodgaonkar, D.K.; Varadan, V.V.; Varadan, V.K. A Free-Space Method for Measurement of Dielectric Constants and Loss Tangents at Microwave Frequencies. IEEE Trans. Instrum. Meas. 1989, 38, 789–793. [Google Scholar] [CrossRef] [Scilit]
- Kumar, S.B.; Raveendranath, U.; Mohanan, P.; Mathew, K.T.; Hajian, M.; Ligthart, L.P. A Simple Free-Space Method for Measuring the Complex Permittivity of Single and Compound Dielectric Materials. Microw. Opt. Technol. Lett. 2000, 26, 117–119. [Google Scholar] [CrossRef] [Scilit]
- Donovan, S.; Klein, O.; Dressel, M.; Holczer, K.; Grüner, G. Microwave Cavity Perturbation Technique: Part II: Experimental Scheme. Int. J. Infrared Milli Waves 1993, 14, 2459–2487. [Google Scholar] [CrossRef] [Scilit]
- Waldron, R.A. Perturbation Theory of Resonant Cavities. Proc. IEE C Monogr. UK 1960, 107, 272. [Google Scholar] [CrossRef] [Scilit]
- Dressel, M.; Klein, O.; Donovan, S.; Grüner, G. Microwave Cavity Perturbation Technique: Part III: Applications. Int. J. Infrared Milli Waves 1993, 14, 2489–2517. [Google Scholar] [CrossRef] [Scilit]
- Klein, O.; Donovan, S.; Dressel, M.; Grüner, G. Microwave Cavity Perturbation Technique: Part I: Principles. Int. J. Infrared Milli Waves 1993, 14, 2423–2457. [Google Scholar] [CrossRef] [Scilit]
- Seleznev, N.V.; Fellah, K.; Phillips, J.; Zulkipli, S.N.; Fournié, B. Matrix Permittivity Measurements for Rock Powders. SPE Reserv. Eval. Eng. 2016, 19, 214–225. [Google Scholar] [CrossRef] [Scilit]
- Abbasian, L.; Leitch, A.; Abugharara, A.N.A.; Butt, S.D. Development of a Methodology to Measure Electromagnetic Wave Velocity for High-Accuracy Time-Depth Conversion in Mineral Exploration. In Proceedings of the 23rd Canadian Rock Mechanics Symposium (RockEng 2025), Montreal, QC, Canada, 17–19 August 2025. [Google Scholar]
- Butler, D.J.; Balch, S. Fourth Year Assessment Report on Geological, Geochemical, Geophysical and Diamond Drilling Exploration for Licences 695M–706M, 708M and 722M–731M on Claims in the Kiglapait Mountains Area, Northern Labrador; LAB/1309; Voisey’s Bay Nickel Company Limited: St. John’s, NL, Canada; Newfoundland and Labrador Geological Survey: St. John’s, NL, Canada, 1999; p. 446.
- Butler, D.J.; Balch, S.; Butt, D.P. Fifth Year Assessment Report on Geological, Geochemical, Geophysical and Diamond Drilling Exploration for Licences 695M-698M, 700M, 702M, 704M–706M, 708M and 722M–730M on Claims in the Kiglapait Mountains Area, Northern Labrador; LAB/1410; Voiseys Bay Nickel Company Limited: St. John’s, NL, Canada; Newfoundland and Labrador Geological Survey: St. John’s, NL, Canada, 2000; p. 755.
- Jacobs, W. Second Year Assessment Report on Diamond Drilling Exploration for Licence 9567M on Claims in the Salvage Area, Northeastern Newfoundland; 002C/12/0153; Falcon Ventures Incorporated: St. John’s, NL, Canada.; Newfoundland and Labrador Geological Survey: St. John’s, NL, Canada, 2005; p. 70.
- Dimmell, P. Fifth, Sixth and Eighth Year Assessment Report on Prospecting and Geochemical and Diamond Drilling Exploration for Licences 13446M, 16633M, and 23023M on Claims in the Thorburn Lake Area, Eastern Newfoundland; 002D/0838; Silver Spruce Resources Incorporated: Bedford, NS, Canada; Newfoundland and Labrador Geological Survey: St. John’s, NL, Canada, 2015.
- Walker, S.; Collins, C. First Year Assessment Report on Diamond Drilling for Licence 2655 on Property in the Point Leamington Area, Newfoundland; 2E/05/0543; Newfoundland and Labrador Geological Survey: St. John’s, NL, Canada, 1986; p. 116.
- ASTM D6032/D6032M-17; Standard Test Method for Determining Rock Quality Designation (RQD) of Rock Core; ASTM. West Conshohocken, PA, USA, 2017. [CrossRef] [Scilit]
- Terraplus Inc. KT-20 Physical Property Measuring System; [Product brochure]; Terraplus Inc.: Richmond Hill, ON, Canada; Available online: http://terraplus.ca/wp-content/uploads/terraplus-Brochures-English/KT-20-Physical-Property-Measuring-System.pdf (accessed on 20 July 2025).
- ASTM D2845-08; Standard Test Method for Laboratory Determination of Pulse Velocities and Ultrasonic Elastic 630 Constants of Rock. ASTM: West Conshohocken, PA, USA, 2008. [CrossRef] [Scilit]
- Best, M.E. Mineral Resources. In Treatise on Geophysics; Elsevier: Amsterdam, The Netherlands, 2015; pp. 525–556. ISBN 978-0-444-53803-1. [Google Scholar]
- Salisbury, M.H.; Milkereit, B.; Bleeker, W. Seismic Imaging of Massive Sulfide Deposits; Part I, Rock Properties. Econ. Geol. Bull. Soc. Econ. Geol. 1996, 91, 821–828. [Google Scholar] [CrossRef] [Scilit]
- Salisbury, M.H.; Bernd, M.; Ascough, G.; Adair, R.; Matthews, L.; Schmitt, D.R.; Mwenifumbo, J.; Eaton, D.W.; Wu, J. Physical Properties and Seismic Imaging of Massive Sulfides. Geophysics 2000, 65, 1882–1889. [Google Scholar] [CrossRef] [Scilit]
- Salisbury, M.H. Application of Seismic Methods to Mineral Exploration. In Mineral Deposits of Canada: A Synthesis of Major Deposit Types, District Metallogeny, the Evolution of Geological Provinces, and Exploration Methods; Goodfellow, W.D., Ed.; Special Publication 5; Geological Association of Canada, Mineral Deposits Division: St. John’s, NL, Canada, 2007; pp. 971–982. [Google Scholar]
- Keller, G.V.; Frischknecht, F.C. Electrical Methods in Geophysical Prospecting; International Series of Monographs on Electromagnetic Waves; Pergamon Press: Oxford, UK, 1966; ISBN 978-0-08-011525-2. [Google Scholar]
- Gustavsson, M.; Ivansson, S.; Moren, P.; Pihl, J. Seismic Borehole Tomography; Measurement System and Field Studies. Proc. IEEE 1986, 74, 339–346. [Google Scholar] [CrossRef] [Scilit]
- McGaughey, W.J.; McCreary, R.G.; Young, R.P.; Maxwell, S.C. Mining Applications of Seismic Tomography. CIM Bull. 1994, 87, 49–56. [Google Scholar]
- Malehmir, A.; Urosevic, M.; Bellefleur, G.; Juhlin, C.; Milkereit, B. Seismic Methods in Mineral Exploration and Mine Planning-Introduction. Geophysics 2012, 77, WC1–WC2. [Google Scholar] [CrossRef] [Scilit]
- Dahle, A.; Gjoystdal, H.; Grammeltvedt, G.; Soyland Hansen, T. Application of Seismic Reflection Methods for Ore Prospecting in Crystalline Rock. First Break 1985, 3, 9–16. [Google Scholar] [CrossRef] [Scilit]
- Eaton, D.; Guest, S.; Milkereit, B.; Bleeker, W.; Crick, D.; Schmitt, D.; Salisbury, M.H. Seismic Imaging of Massive Sulfide Deposits; Part III, Borehole Seismic Imaging of near-Vertical Structures. Econ. Geol. 1996, 91, 835–840. [Google Scholar] [CrossRef] [Scilit]
- Burger, H.R.; Sheehan, A.F.; Jones, C.H. Introduction to Applied Geophysics: Exploring the Shallow Subsurface; Cambridge University Press: Cambridge, UK; New York, NY, USA, 2024; ISBN 978-1-009-43312-9. [Google Scholar]
- Zhou, B.; Fullagar, P.K. Delineation of Sulphide Ore-Zones by Borehole Radar Tomography at Hellyer Mine, Australia. J. Appl. Geophys. 2001, 47, 261–269. [Google Scholar] [CrossRef] [Scilit]
- Bellefleur, G.; Chouteau, M. Massive Sulphide Delineation Using Borehole Radar: Tests at the McConnell Nickel Deposit, Sudbury, Ontario. J. Appl. Geophys. 2001, 47, 45–61. [Google Scholar] [CrossRef] [Scilit]
- Shanks Iii, W.C.P.; Koski, R.A.; Mosier, D.L.; Schulz, K.J.; Morgan, L.A.; Slack, J.F.; Ridley, W.I.; Dusel-Bacon, C.; Seal Ii, R.R.; Piatak, N.M. Volcanogenic Massive Sulfide Occurrence Model; US Geological Survey: Reston, Virginia, 2012.
- Tougaw, D. Applied Electromagnetic Field Theory; Valparaiso University: Valparaiso, IN, USA, 2018. [Google Scholar]
- Ellingson, S.W. Electromagnetics II; LibreTexts: California, CA, USA, 2021; ISBN 9859000006656. [Google Scholar]
- Wait, J.R. Electromagnetic Waves in Stratified Media: Revised Edition Including Supplemented Material; Elsevier: Amsterdam, The Netherlands, 2013; Volume 3, ISBN 1-4831-8425-0. [Google Scholar]
- Stratton, J.A. Electromagnetic Theory; IEEE Press series on electromagnetic wave theory; John Wiley & Sons, Inc: Hoboken, NJ, USA, 2007; ISBN 978-0-470-13153-4. [Google Scholar]
- Baker, G.S.; Jordan, T.E.; Pardy, J. An Introduction to Ground Penetrating Radar (GPR). In Special Paper 432: Stratigraphic Analyses Using GPR; Geological Society of America: Boulder, CO, USA, 2007; Volume 432, pp. 1–18. ISBN 978-0-8137-2432-4. [Google Scholar]
- Annan, A.P. Ground Penetrating Radar: Principles, Procedures & Applications; Sensors & Software Incorporated: Mississauga, ON, Canada, 2003. [Google Scholar]
- Reitz, J.R. Foundations of Electromagnetic Theory; Pearson Education India: Chennai, India, 2009; ISBN 81-317-3342-4. [Google Scholar]
- Puc, U.; Abina, A.; Jeglič, A.; Cevc, P.; Zidanšek, A. Advanced Electromagnetic Sensors for Sustainable Monitoring of Industrial Processes. In Proceedings of the ECOS 2012, Perugia, Italy, 26 June 2012; Volume 4, p. 92. [Google Scholar]
- Conyers, L.B. Ground-Penetrating Radar for Archaeology; AltaMira Press: California, CA, USA, 2013; ISBN 978-0-7591-2350-2. [Google Scholar]
- Abbasian, L.; Butt, S.D. Exploring Ground Penetrating Radar (GPR) Simulation for Imaging and Determining Electromagnetic Wave Velocity in Volcanogenic Massive Sulfide (VMS) Deposits. In Proceedings of the 58th U.S. Rock Mechanics/Geomechanics Symposium; ARMA: Golden, CO, USA, 2024; p. D042S056R007. [Google Scholar]
- Warren, C.; Giannopoulos, A.; Giannakis, I. gprMax: Open Source Software to Simulate Electromagnetic Wave Propagation for Ground Penetrating Radar. Comput. Phys. Commun. 2016, 209, 163–170. [Google Scholar] [CrossRef] [Scilit]
- Giannopoulos, A. Modelling Ground Penetrating Radar by GprMax. Constr. Build. Mater. 2005, 19, 755–762. [Google Scholar] [CrossRef] [Scilit]
- Geophysical Survey Systems Inc. StructureScanTM Mini XT Manual; Geophysical Survey Systems, Inc.: Nashua, NH, USA, 2020. [Google Scholar]
- Telford, W.M.; Geldart, L.P.; Sheriff, R.E. Applied Geophysics; Cambridge University Press: Cambridge, UK, 1990. [Google Scholar]
- Sandmeier, K. ReflexW, version 8.1. Program for the Processing of Seismic, Acoustic or Electromagnetic Reflection, Refraction and Transmission Data. Software Manual. Sandmeier Software: Karlsruhe, Germany, 1998.
- Yuan, W.; Liu, S.; Zhao, Q.; Deng, L.; Lu, Q.; Pan, L.; Li, Z. Application of Ground-Penetrating Radar with the Logging Data Constraint in the Detection of Fractured Rock Mass in Dazu Rock Carvings, Chongqing, China. Remote Sens. 2023, 15, 4452. [Google Scholar] [CrossRef] [Scilit]



Disclaimer/Publisher’s Note: The statements, opinions and data contained in all publications are solely those of the individual author(s) and contributor(s) and not of MDPI and/or the editor(s). MDPI and/or the editor(s) disclaim responsibility for any injury to people or property resulting from any ideas, methods, instructions or products referred to in the content. |
© 2026 by the authors. Licensee MDPI, Basel, Switzerland. This article is an open access article distributed under the terms and conditions of the Creative Commons Attribution (CC BY) license.