Article

Evaluating the Damping Ratio of Tailings by Different Experimental Methods: Case Study of Riotinto Mines


by
Hernán Patiño
,
Fausto Molina-Gómez
and
Rubén Ángel Galindo-Aires
*
Department of Ground Engineering, Universidad Politécnica de Madrid, Calle Profesor Aranguren 3, 28040 Madrid, Spain
*
Author to whom correspondence should be addressed.
Geosciences 2026, 16(5), 173; https://doi.org/10.3390/geosciences16050173
Submission received: 9 March 2026 / Revised: 13 April 2026 / Accepted: 22 April 2026 / Published: 26 April 2026
(This article belongs to the Section Geomechanics)

Abstract

Tailings are unconventional geomaterials that require dynamic characterisation due to seismic hazards at several storage facilities. Due to the anthropic origin of these materials, their dynamic properties differ from those reported for natural soils. In particular, the damping ratio is a relevant parameter that controls the dynamic response of tailings storage facilities. It can be estimated using different experimental methods. The objective of this research is to disclose the results obtained through laboratory tests in which the damping ratio was evaluated independently by Half-Power Bandwidth or the free-vibration decay methods. A comprehensive testing plan comprising resonant column tests and free-vibration decay tests was carried out on three types of tailings from the Riotinto mines (Huelva, Spain): Cerro Salomón Sand (CSS), High-Density Sludge (HDS), and Copper Lamas (CL). These tests were carried out under different effective consolidation pressures and torsional excitations. The results allowed the establishment of a series of relationships between the testing conditions and the identification of differences between the methods for tailings.

1. Introduction

Research on the dynamic behaviour of soils has focused primarily on determining the shear modulus (G), with comparatively less attention devoted to evaluating the damping ratio ( λ or D). Nevertheless, seminal studies by Hardin and Drnevich [1,2], Seed and Idriss [3], among others, have demonstrated that the damping ratio of soils is influenced by several factors, including the plasticity index ( P I ), effective consolidation pressure ( σ 0 ), level of induced angular strain ( γ ), void ratio (e), generated pore water pressure (u), and number of loading cycles (N).
Vucetic and Dobry [4], based on an extensive review of cyclic tests on clays with degree of over-consolidation ( O C R ) values between 1 and 8, showed that PI governs the variation in damping ratio with shear strain, particularly within the strain range γ 10 4 to 10 2 . At low strains, damping is relatively insensitive to PI, whereas at higher strains, soils with higher plasticity exhibit larger damping ratios. Further experimental work by Vucetic et al. [5], based on controlled-strain cyclic simple shear tests, confirmed that damping behaviour cannot be generalised across different clays. For comparable strain levels, some clays exhibited significant increases in damping with γ , whereas others showed limited or negligible variation. These differences were attributed to variations in soil fabric, stress history (e.g., OCR), and mineralogical composition. Zergoun and Vaid [6], using resonant column and cyclic triaxial tests on undisturbed Cloverdale clay, reported that for cyclic stress ratios between 0.46 and 0.79, the damping ratio is practically independent of stress ratio. Brennan et al. [7], based on dynamic centrifuge tests on normally consolidated kaolinitic clay, found damping ratios up to 1.5 times greater than those measured in conventional laboratory tests, suggesting a strong frequency dependency.
Soriano et al. [8], using cyclic simple shear tests, examined the influence of pre-existing static shear stress ( τ o ) combined with cyclic shear stress ( τ c ) on the dynamic behaviour of saturated granular soils. Their results showed that, for a given number of cycles, the interaction between static and cyclic stresses significantly affects damping evolution. Patiño and Galindo [9] extended this approach to soft cohesive soils susceptible to sudden failure and demonstrated that the combination of monotonic and cyclic shear stresses controls the damping ratio. They proposed empirical relationships of the form D ( N , γ c ) , D ( N , G / σ o v ) and D ( N , u / σ o v ) for different τ o / σ o v ratios, as well as design charts for practical damping evaluation.
In granular materials, the damping ratio decreases with increasing confining pressure. Hardin and Drnevich [1] reported that the damping ratio of sandy soils decreases as a power function of the effective consolidation pressure, regardless of strain level. Kuribayashi et al. [10] found that the energy dissipation capacity of normalised Toyoura and Sengenyama sands decreases with increasing mean effective stress. Laird [11] showed that the minimum damping ratio of dry granular soils decreases with increasing effective confining pressure. Zhang et al. [12] demonstrated that both confining stress and geological age significantly influence damping ratio and, consequently, predicted spectral accelerations. Wichtmann and Triantafyllidis [13] showed that for quartzitic clean sands, the damping ratio and threshold strain levels are independent of the uniformity coefficient ( C u ) and median grain size ( D 50 ). Ham et al. [14] demonstrated that in dry clean sands, damping is more strongly affected by particle roundness and surface roughness than by sphericity. Madhusudhan and Kumar [15] found that increasing the degree of saturation from near-dry to fully saturated conditions produces only marginal increases in damping.
Numerous empirical correlations have been proposed to relate the damping ratio to controlling parameters in granular soils. Formulations were proposed by Hardin and Drnevich [1,2], Laird [11], Subramaniam et al. [16], Rollins et al. [17], Molina-Gómez et al. [18] and Patiño and Galindo [19], incorporating various combinations of shear strain, confining pressure, void ratio, soil gradation, number of cycles and pore water pressure.
Schaeffer et al. [20] demonstrated that damping ratios measured using free–free axial resonant column tests may be one to two orders of magnitude higher than those obtained from fixed–free torsional configurations in cohesive soils. Although damping is routinely employed in geotechnical dynamic analyses, relatively few studies have explicitly addressed the distinction between hysteretic and viscous damping mechanisms [21,22,23]. This limitation is particularly significant because different laboratory procedures, such as resonant column tests and free-vibration decay methods, capture different sources of energy dissipation. Consequently, damping values derived from these techniques are not always directly comparable. The authors of [21,22,23] primarily focused on conventional soils, highlighting that damping evaluation is highly dependent on both the testing methodology and the interpretation framework. However, this issue remains insufficiently explored for tailings materials.
This study aims to clarify the differences in damping ratios obtained through various experimental procedures in resonant column testing. To achieve this, an advanced experimental program using the resonant column apparatus on three different types of tailings from the Riotinto mines in Spain was conducted. The damping ratio was estimated using either the Half-Power Bandwidth method or the free-vibration decay method. As a result, the empirical relationships proposed in this study are novel and provide valuable insights into the characterisation of damping ratios using different methodologies.

2. Materials and Methods

2.1. Materials

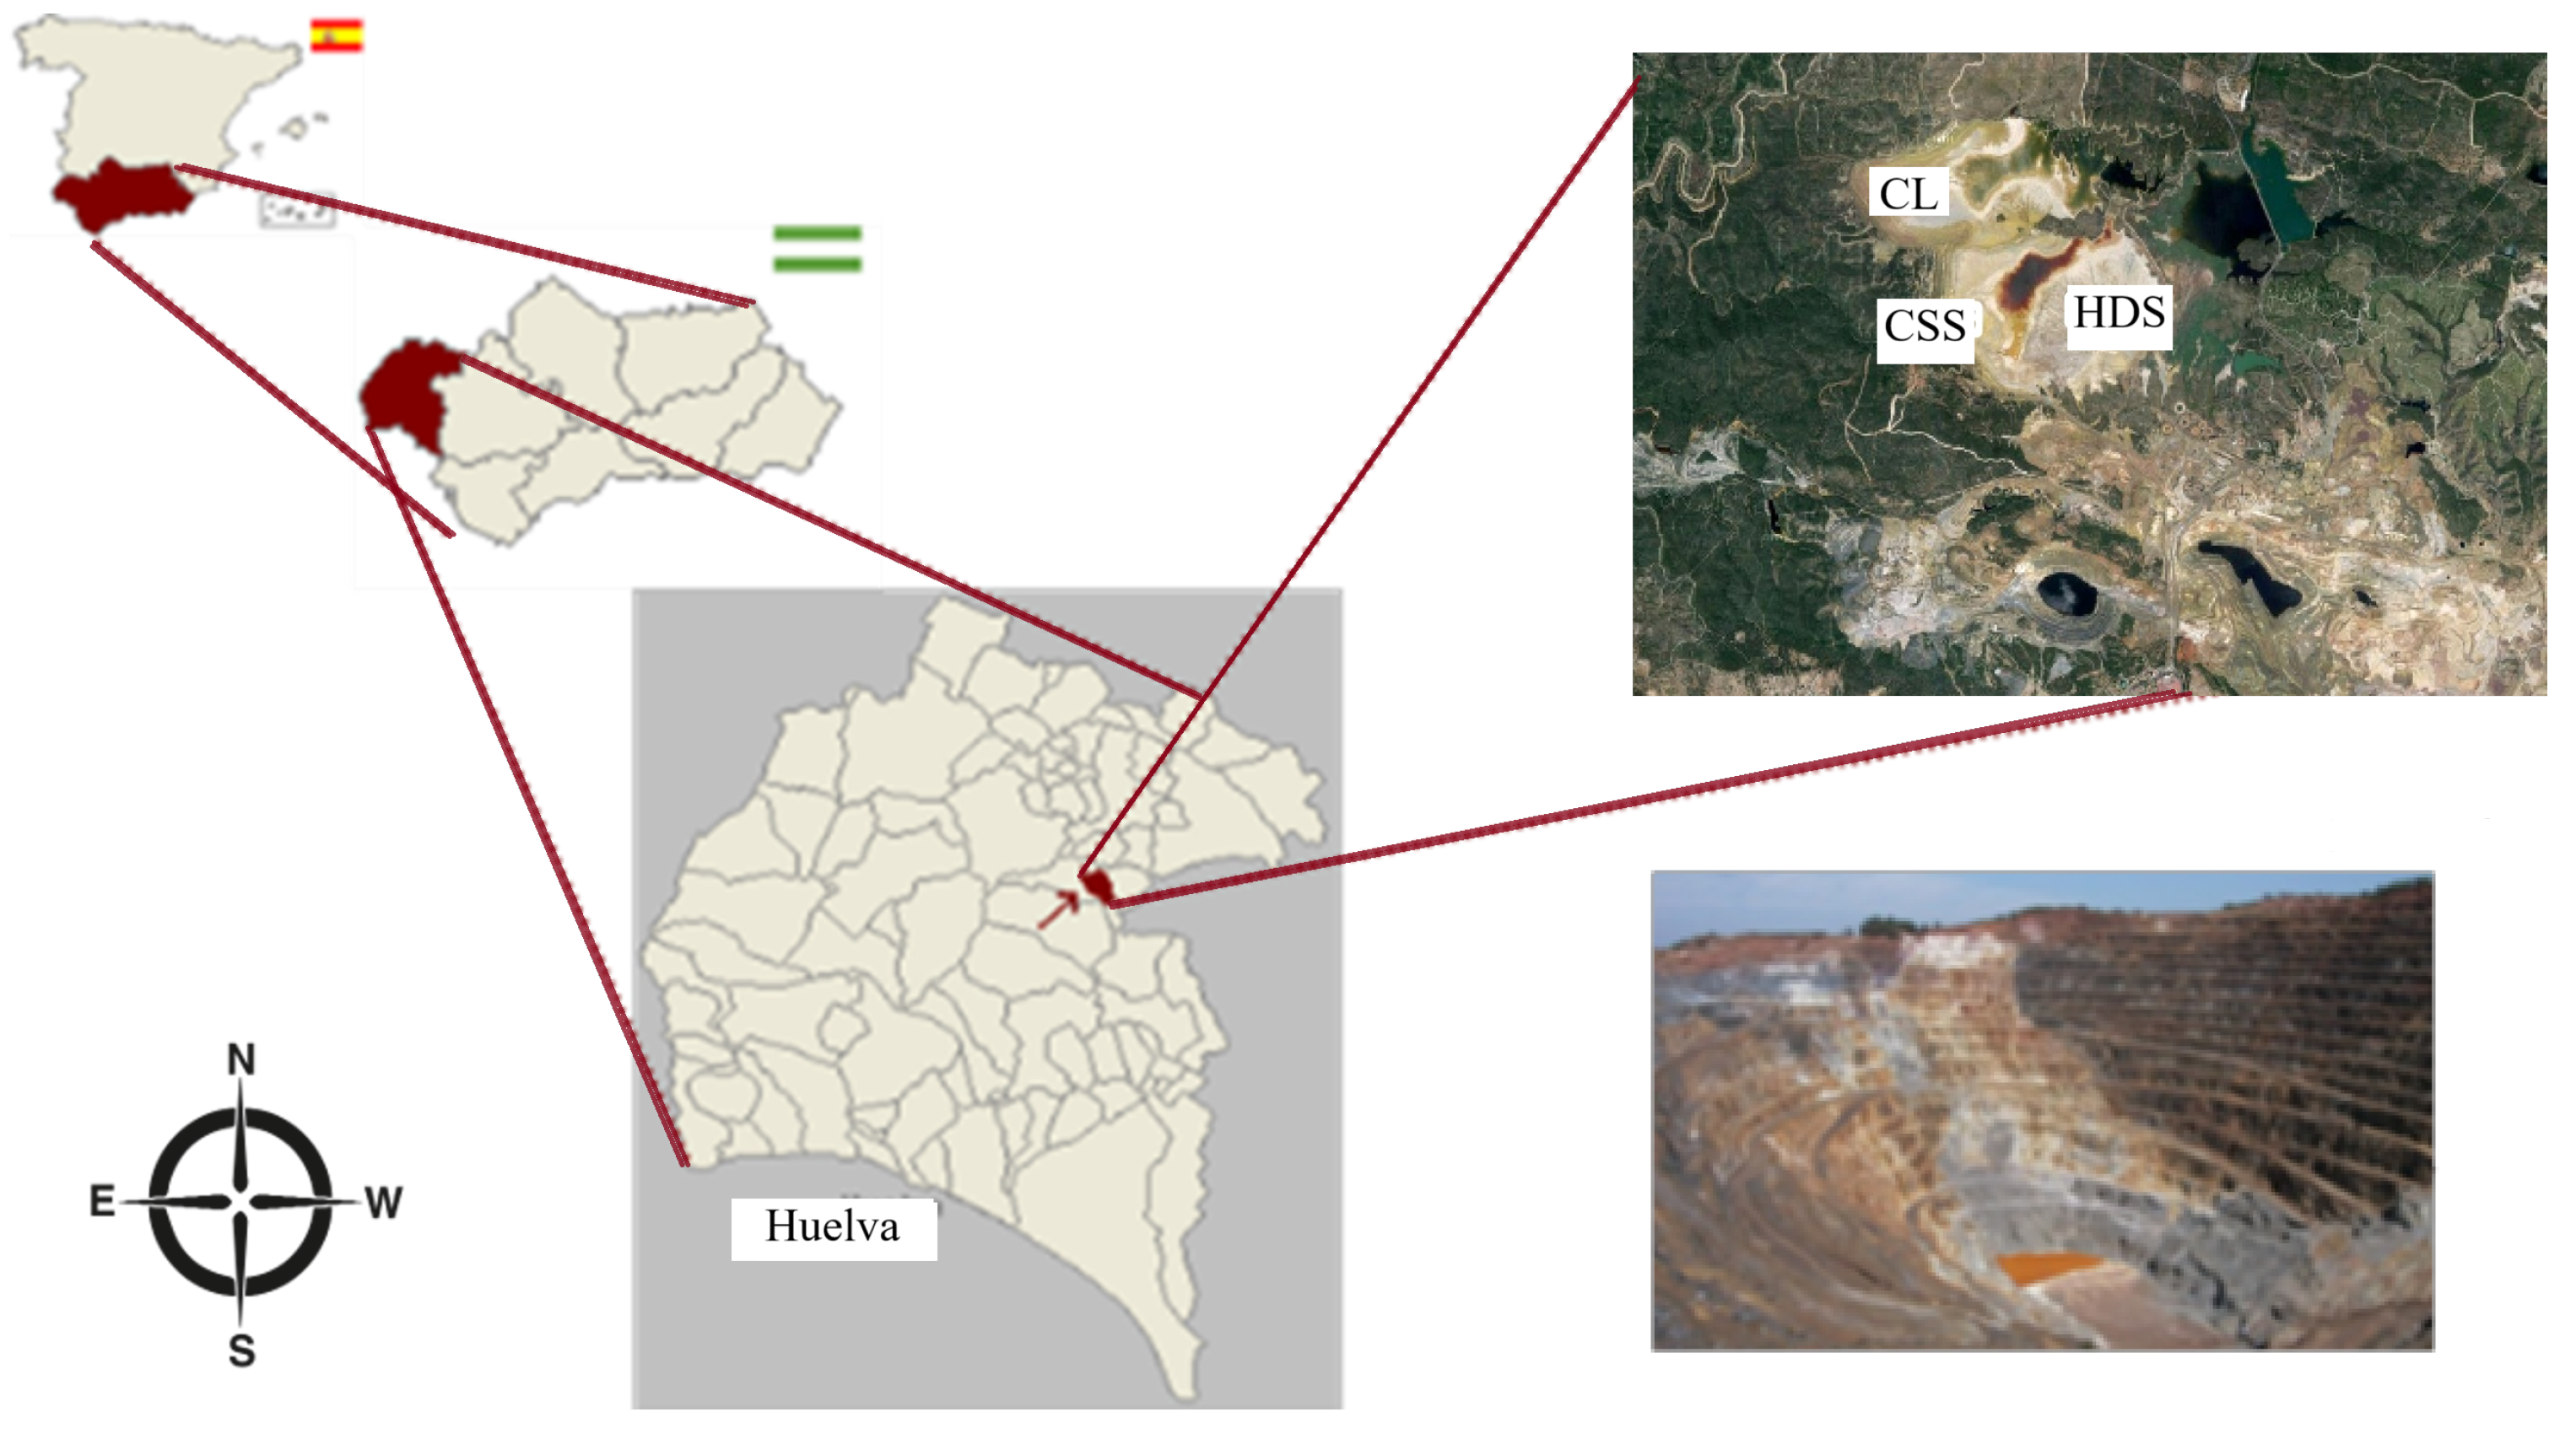
The materials used in this investigation were obtained from tailings deposits associated with the exploitation of the Riotinto mines, located in the central–eastern region of Huelva, Spain (Figure 1). The Riotinto mining district contains one of the most significant deposits of gold, copper and silver in Spain and has been exploited since approximately 2000 BC. Over centuries of mining activity, extensive waste dumps and tailings dams have been generated, currently occupying approximately 1200 hectares. These deposits are of considerable geotechnical interest, particularly in relation to the dynamic behaviour of tailings dams constructed using mining residues such as those examined in this study.
The samples were collected from the surface deposits in the tailings storage area, located at approximately 37°43′48′′ N 6°35′16′′ W. Three distinct materials were investigated, identified on site as Cerro Salomón Sand (CSS), High Density Sludge (HDS) and Copper Lamas (CL). The index properties of the tailings are summarised in Table 1.
CSS and HDS are non-plastic materials (NP), whereas CL exhibits low plasticity with a plasticity index of 7%. The fine fraction (<80 μm) is significantly higher in CL, indicating a predominantly fine-grained structure compared with CSS and HDS materials. X-ray fluorescence analysis revealed that silicon, iron and sulphur are the dominant elements in all three materials, with corresponding oxides present in significant proportions. This mineralogical composition explains the relatively high specific gravity values reported in Table 1. Detailed information on the mineralogical phases obtained from X-ray diffraction analysis is presented in Table 2.
CSS and HDS are predominantly quartzitic materials, whereas CL contains a substantial proportion of phyllosilicates, particularly chlorites, as well as metallic minerals such as pyrite. The markedly different mineralogical compositions are expected to influence the mechanical and damping behaviour of the materials under dynamic loading.

2.2. Resonant-Column Testing and Damping Ratio Estimation

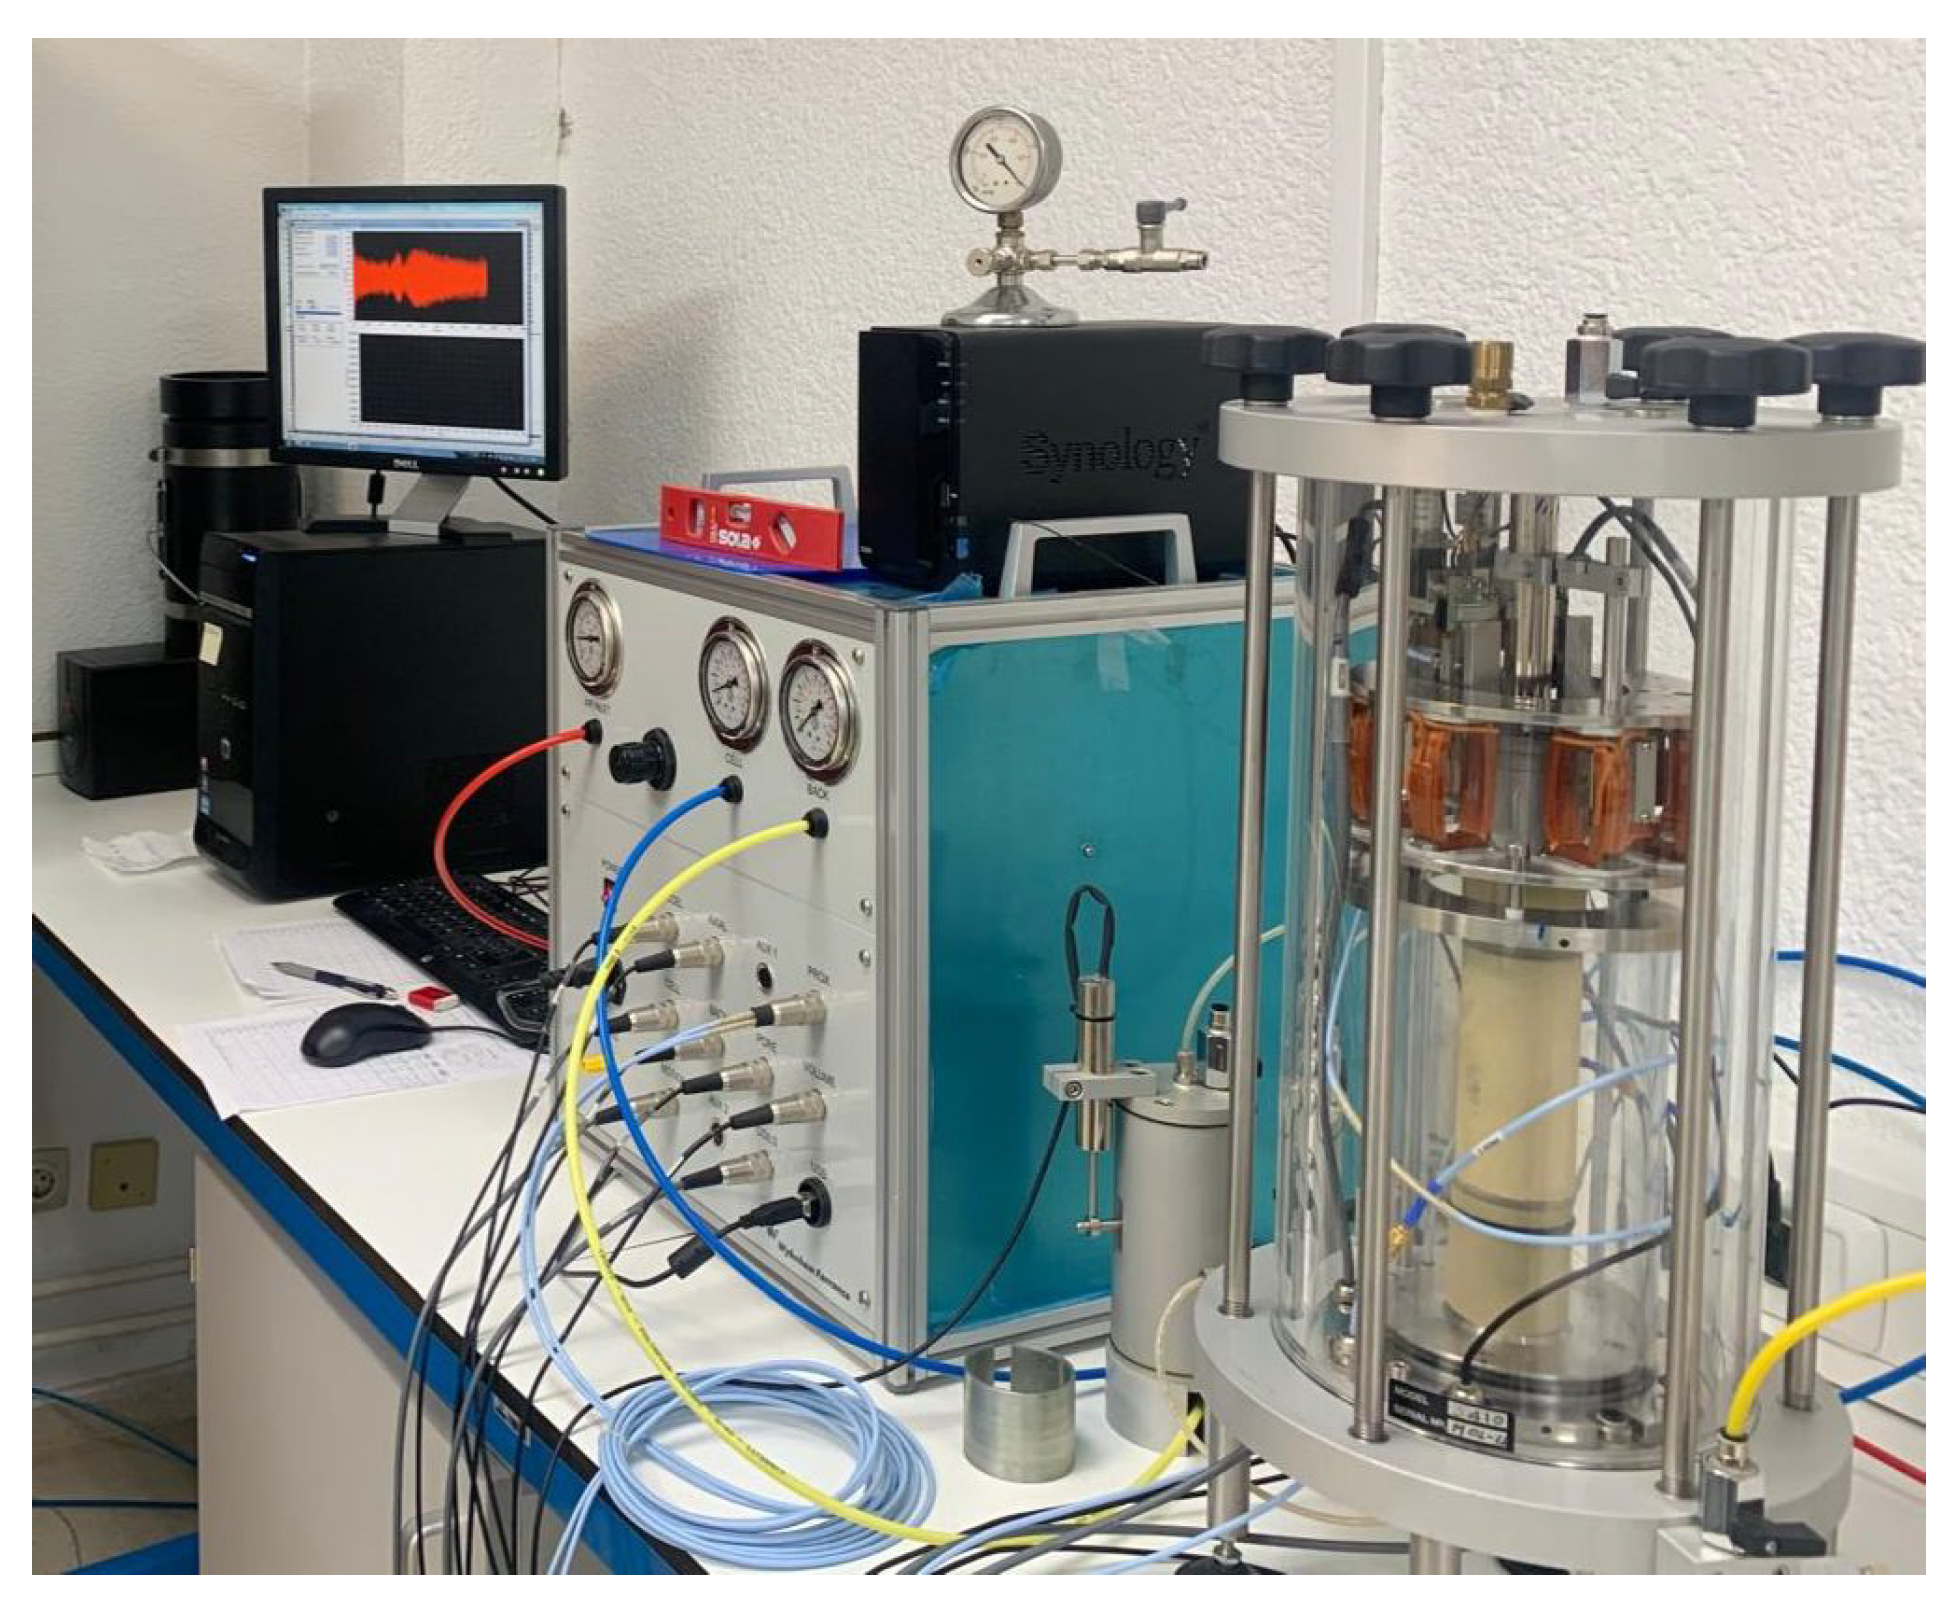
The resonant column apparatus used in this investigation was manufactured by Wykeham Farrance (Italy). This apparatus corresponds to a forced-vibration system with a single torsional degree of freedom, designed to induce vibration in the specimen over a frequency range encompassing its first natural mode. In the present study, specimens were fixed at the base and free at the top, corresponding to a fixed–free boundary condition (Figure 2). The excitation system incorporates an internal floating structure, allowing specimens to undergo significant axial deformation during consolidation without affecting the electronic components. Real-time visualisation of sensor responses is available throughout testing.
The apparatus is fully automated and instrumented to estimate the resonant frequency, shear-wave velocity ( V s ), shear modulus (G), angular strain, and damping ratio. This equipment allows for resonant column, cyclic torsional, and free-decay testing. In resonant column and free-decay modes, the equipment operates at frequencies typically greater than 10 Hz, whereas in cyclic torsional shear mode, the operating frequency is generally below 2 Hz. Control and data acquisition are performed through an integrated electronic unit comprising a power supply, manual and electronic pressure regulators, signal-conditioning modules and a computer interface. Therefore, no external signal generator or oscilloscope is required.
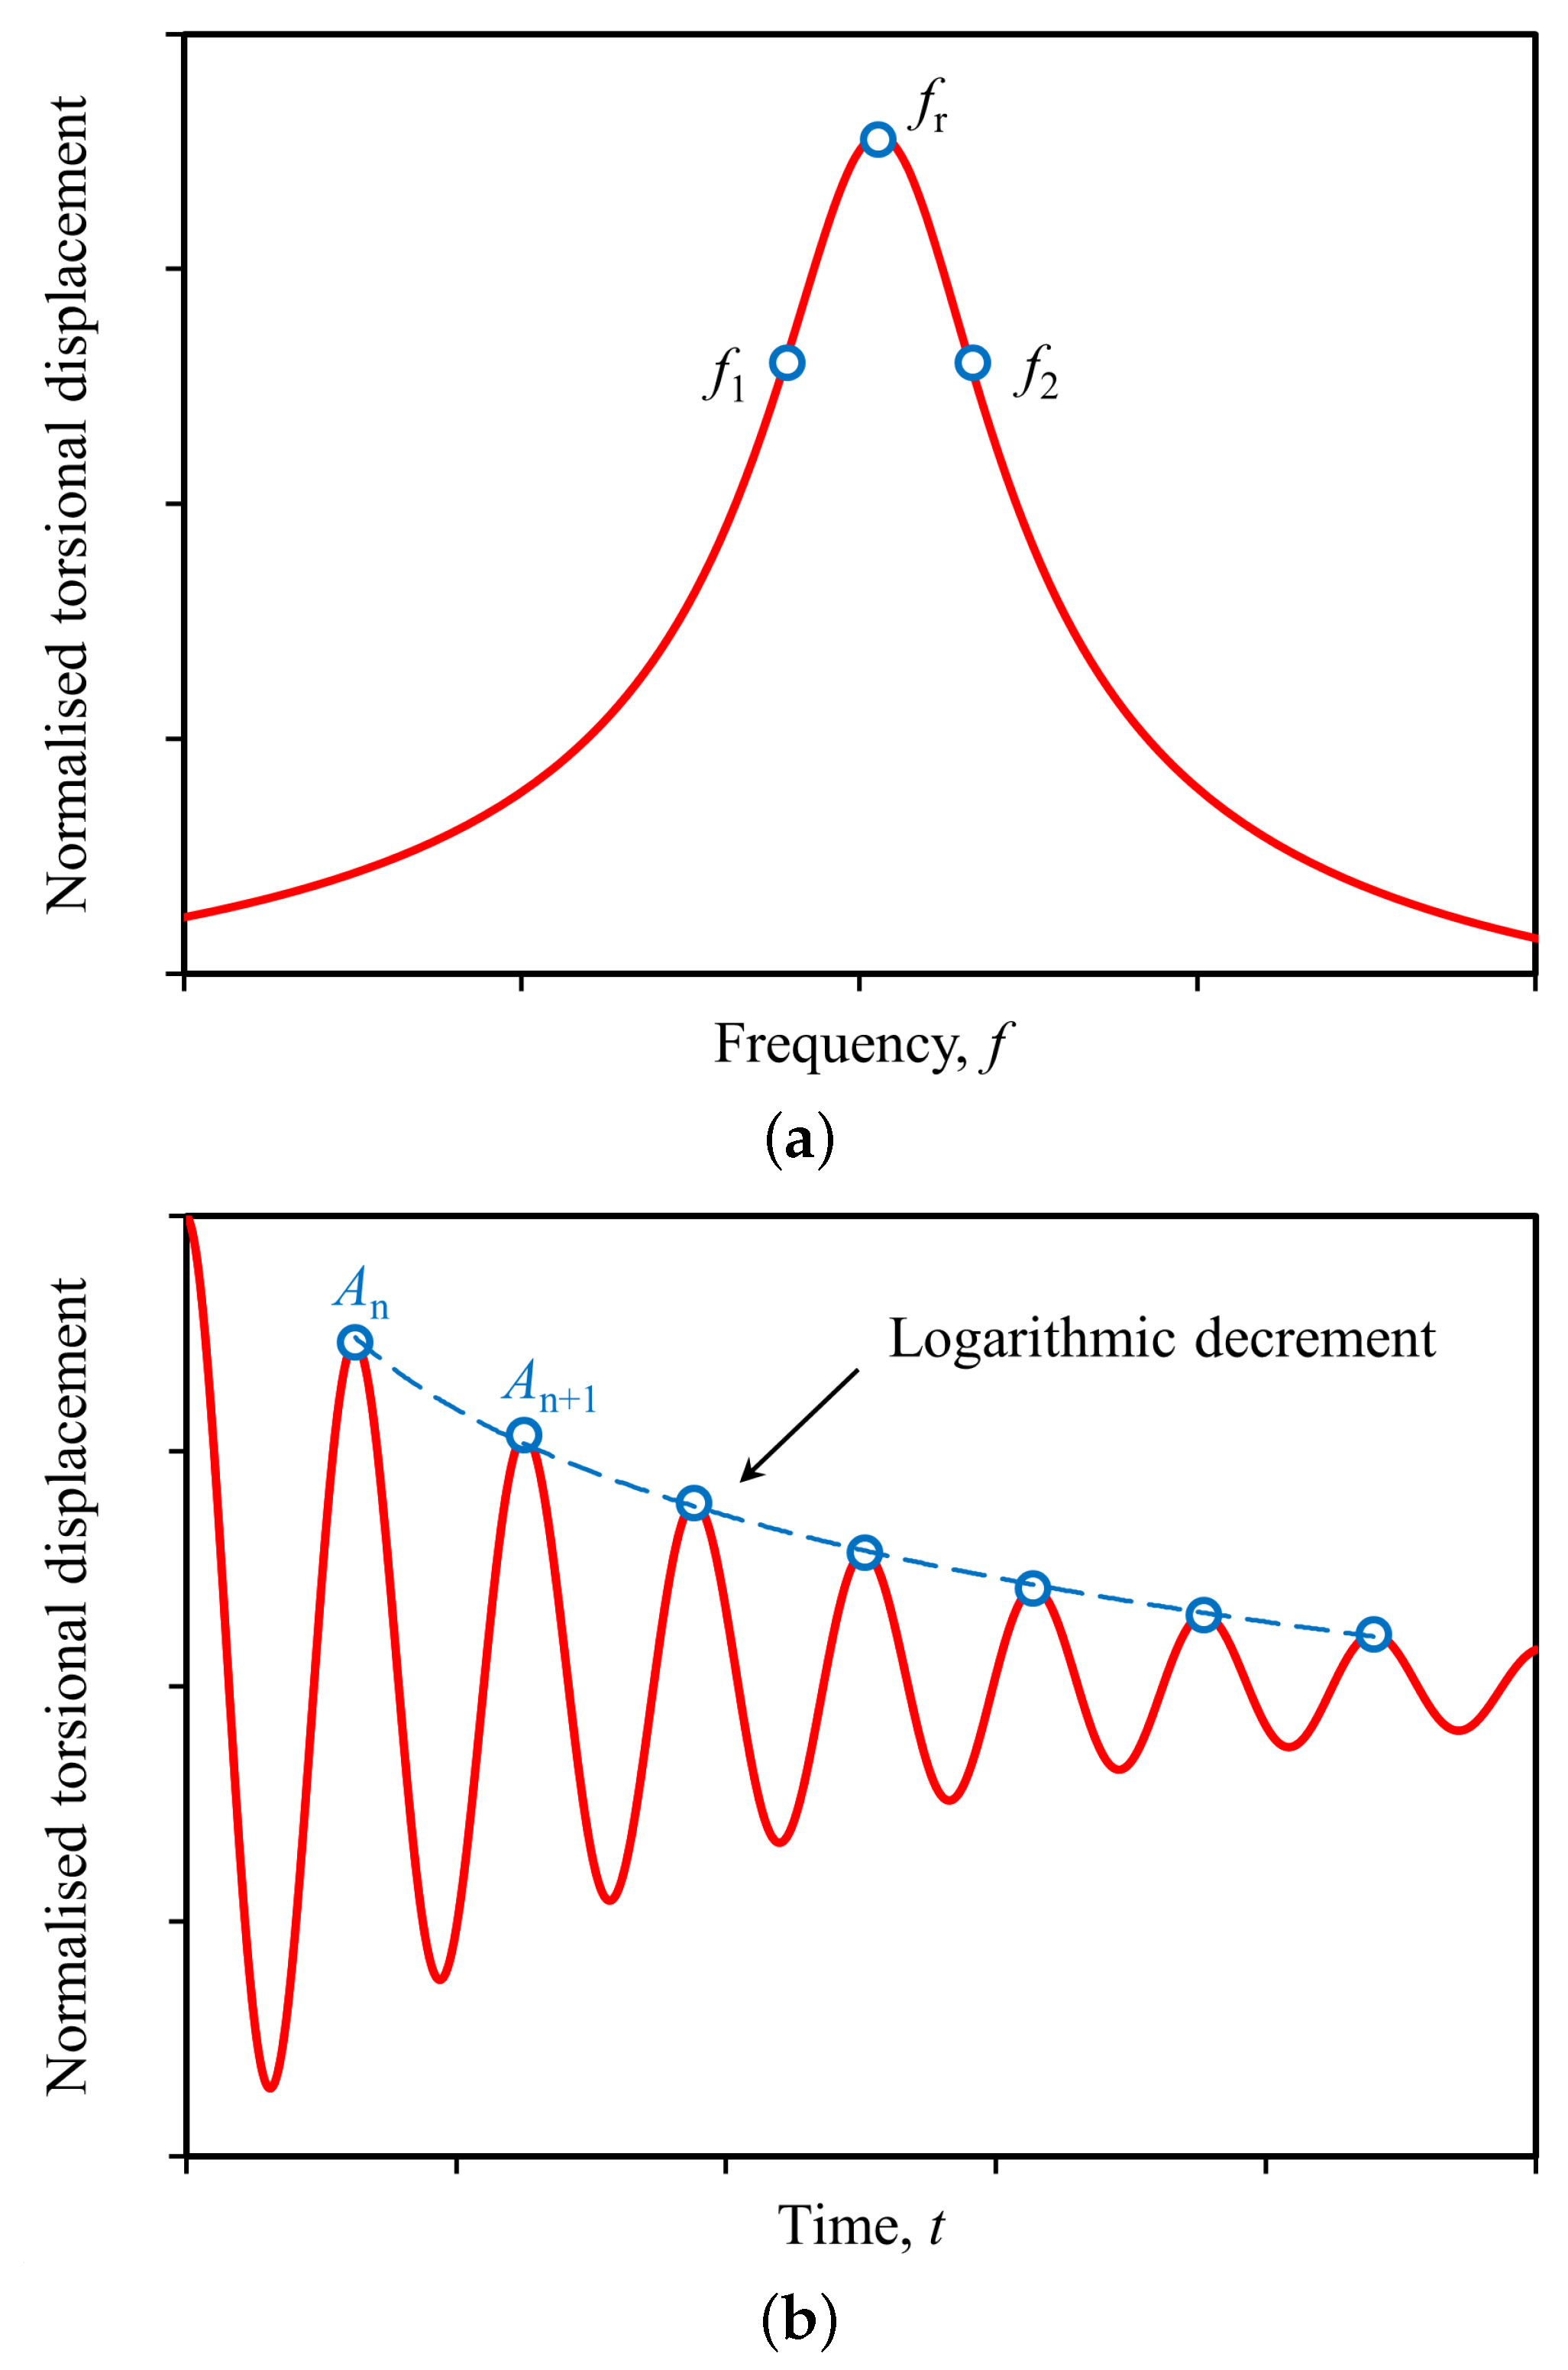
The damping ratio is evaluated using two independent procedures available in the resonant column apparatus, the Half-Power Bandwidth (H-PB) or the free-vibration decay (F-VD) methods. Both approaches assume that the soil specimen behaves as a single-degree-of-freedom torsional oscillator vibrating in its first mode. In this paper, λ is used to denote the damping ratio from the H-PB method, while the symbol D refers to the damping ratio of the F-VD. Figure 3 illustrates the fundamentals of these methods.
In forced-vibration resonant column testing, the specimen is subjected to harmonic excitation over a range of frequencies until resonance is reached. The resonant frequency f r corresponds to the frequency at which the amplitude of vibration is maximum. The damping ratio is obtained from the frequency response curve by identifying the two frequencies, f 1 and f 2 , at which the vibration amplitude decreases to 1 / 2 of the maximum amplitude. These frequencies correspond to the points at which the stored energy in the system is half of that at resonance (see Figure 3a). The damping ratio is then calculated as it is in the H-PB:
λ = f 2 f 1 2 f r
where λ is the viscous damping ratio, f r is the resonant frequency, and f 1 and f 2 are the Half-Power frequencies. This method evaluates damping under steady-state harmonic loading conditions and is particularly suitable for small-strain measurements. It implicitly assumes linear damping and a symmetric resonance curve.
In the F-VD, the specimen is first excited at or near its resonant frequency. The excitation is abruptly stopped, allowing the system to vibrate freely as its amplitude progressively decays due to energy dissipation within the material. The damping ratio is determined from the logarithmic decrement of successive vibration peaks. If A n and A n + 1 are the amplitudes of two successive cycles, the logarithmic decrement δ is defined as:
δ = ln A n A n + 1
Alternatively, when multiple cycles are considered:
δ = 1 n ln A 1 A n + 1
where n is the number of cycles between measured amplitudes.
For lightly damped systems ( D < 0.1 ), the damping ratio may be approximated as:
D = δ 2 π
For improved accuracy, the expression can be written more rigorously as:
D = 1 4 π 2 + δ 2 δ
The F-VD method provides a direct quantification of the energy dissipation rate during transient responses and does not depend on the symmetry of the resonance curve. To optimise the response amplitude, F-VD tests were conducted at the resonant frequency ( f r ) reported in the H-PB, under the same confinement and torsional amplitude conditions.

2.3. Experimental Programme Description

For each material, 108 resonant column tests and 108 free-vibration decay tests were carried out. CSS and HDS specimen dimensions were height h = 100.8 mm and diameter d = 49.7 mm, and CL specimen dimensions were height h = 109.9 mm and diameter d = 49.6 mm.
The general testing conditions for resonant column tests are summarised in Table 3. Chamber pressure ( σ c ), back pressure ( B p ), effective confining pressure ( σ c ), and torsional excitation amplitudes (Te) were systematically varied.
While specimen preparation procedures typically adhere to established international standards, the three types of tailings may become unstable during mounting due to their low plasticity. Patiño et al. [19] provide a detailed description of the specimen preparation methods and a series of non-standard accessories designed to ensure the vertical alignment of the excitation head and strict parallelism of the specimen’s end surfaces during resonant column testing.
The samples were prepared to a target dry density ( γ d ) determined from the homogenised water content ( w h ). Using the mould volume and wet density, the required mass of homogenised material was determined for specimen fabrication. Specimens were prepared to achieve uniform density and moisture distribution prior to installation in the apparatus by the undercompaction moist tamping method [25].
All specimens were saturated with de-aired water by applying an automatic increment of CP and BP under a positive difference of 20 kPa. The increment stopped when a BP of 400 kPa was achieved. This phase lasted over 24 h, ensuring B-values greater than 0.98 due to the complete dissolution of air in the water. B-values confirm the full saturation conditions. After that, the samples were isotropically consolidated under various effective confining stresses ( σ c ): 50, 100, 150, 200, 250, and 300 kPa. Following this, damping assessments were carried out using the H-PB and F-VD methods.

3. Results and Discussion

Table 4 provides a comprehensive overview of the test results, addressing the measured resonant frequency, angular strain, and damping ratios under all test conditions.

3.1. Results of Damping Ratio from Half-Power Bandwidth Method

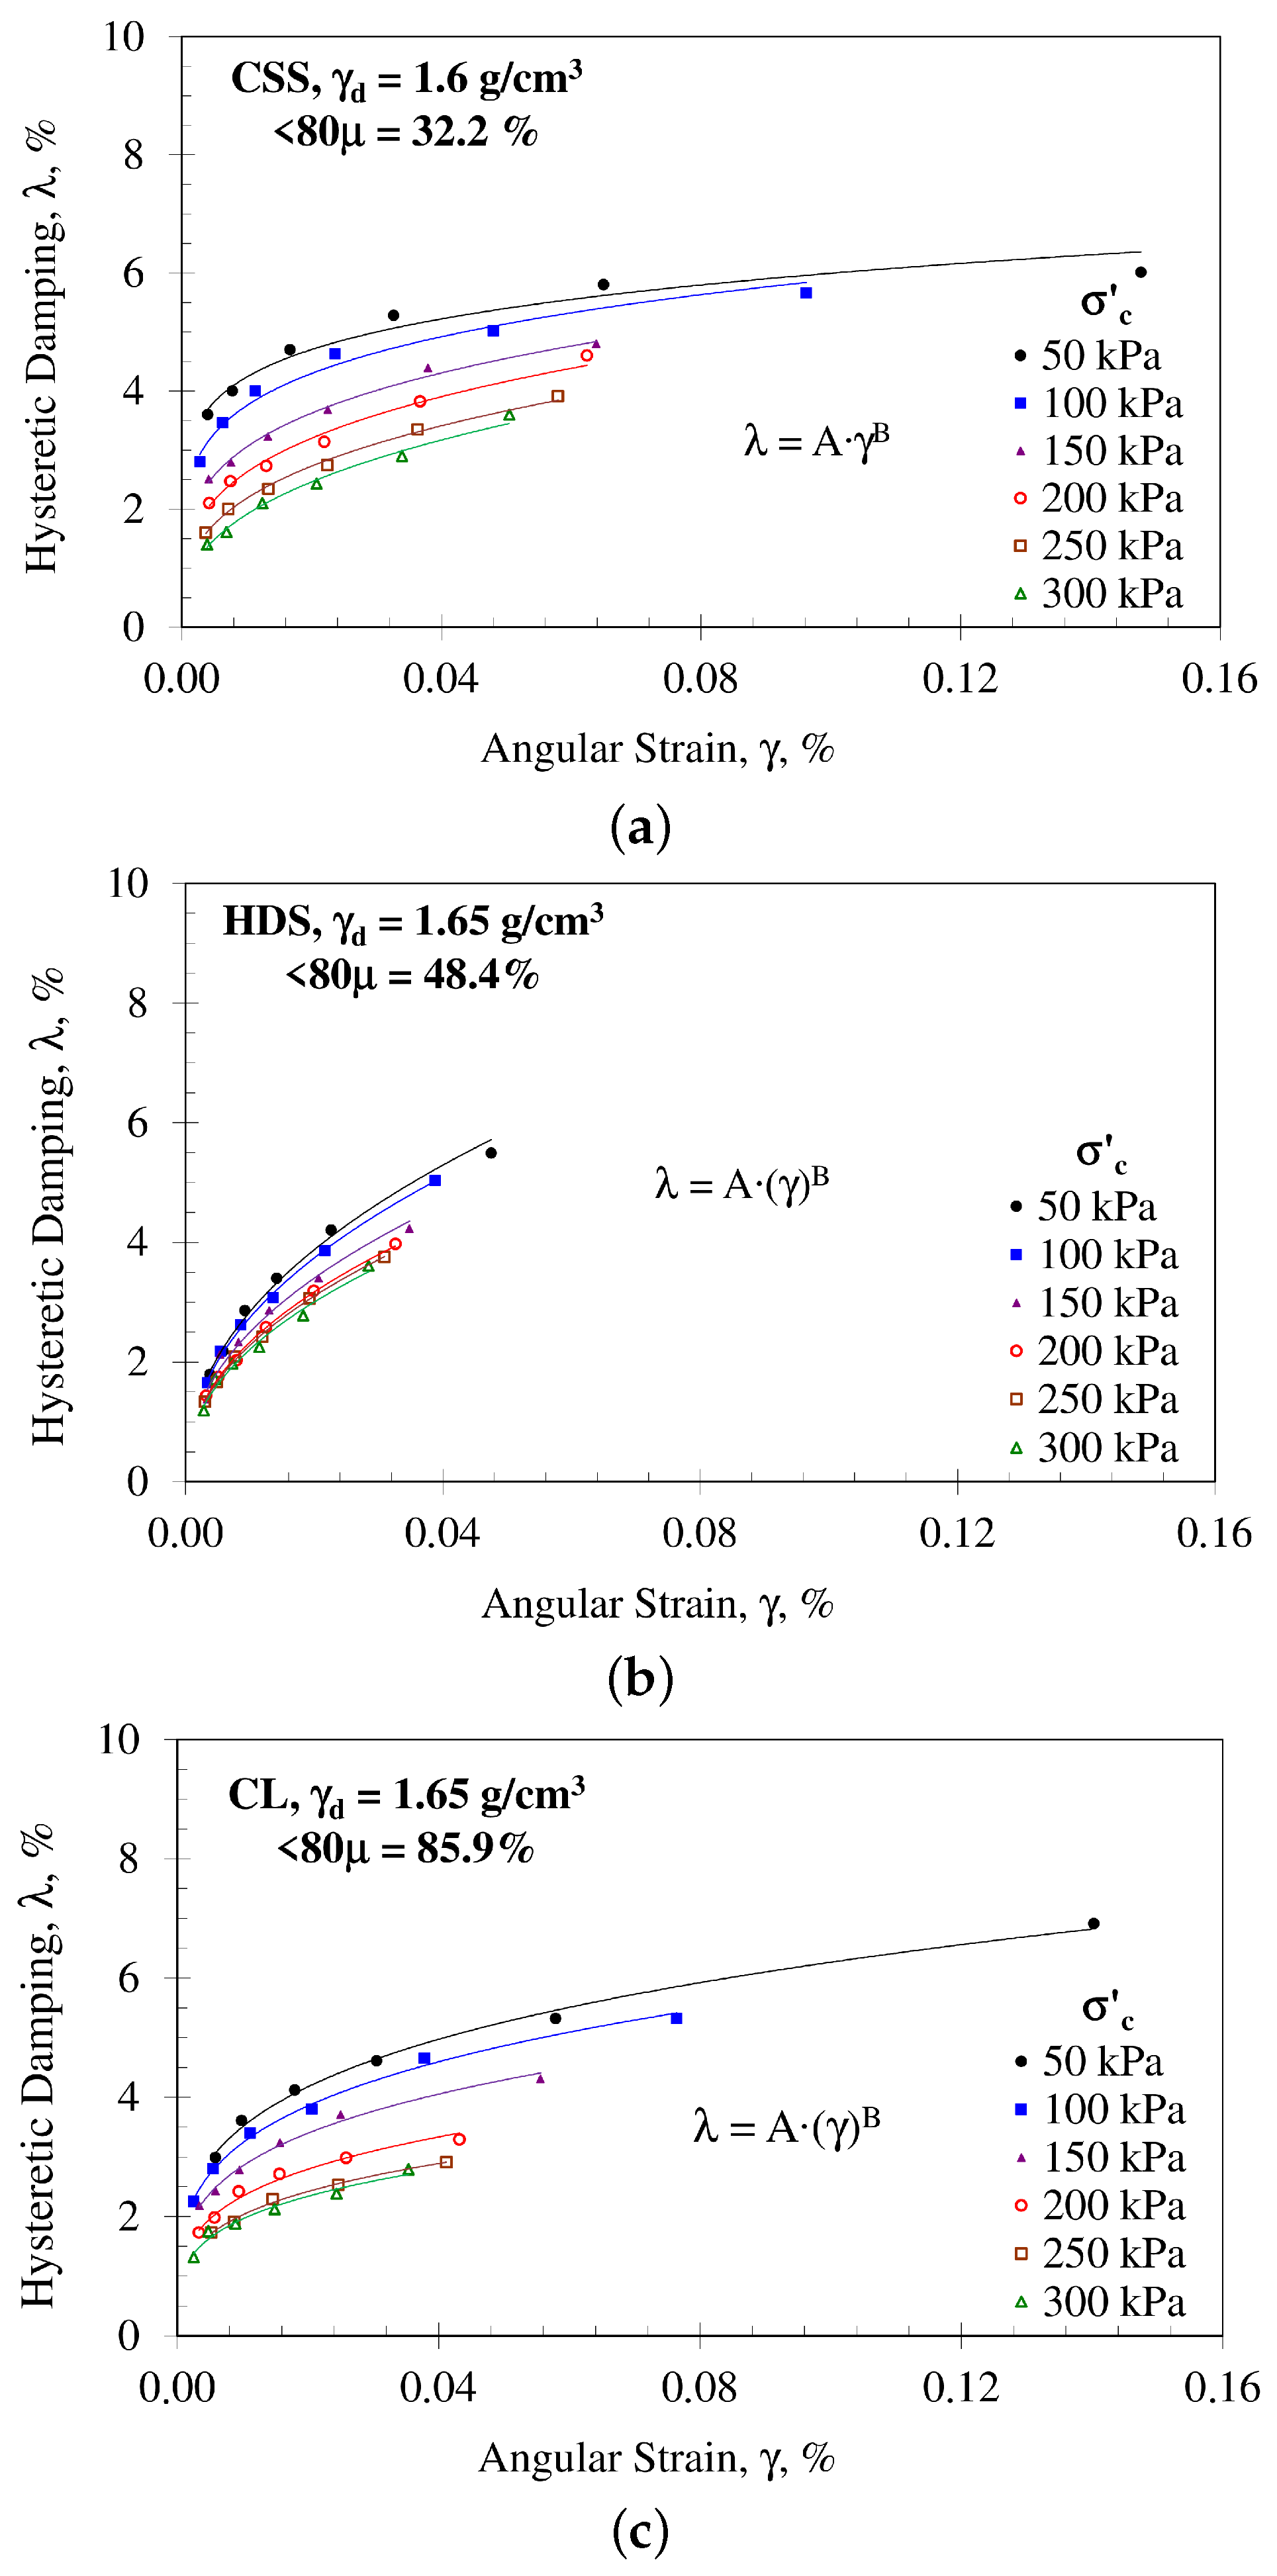
The hysteretic damping ratio values reported in Table 4 and plotted in Figure 4 were obtained from forced-vibration measurements in resonant column mode using the Half-Power Bandwidth (H-PB) method. Figure 4 presents, for each material, the variation in λ with cyclic angular strain γ at different effective consolidation pressures ( σ c ). The results indicate that, across all materials, the effective consolidation pressure clearly influences λ ( γ ) . Hence, at a given strain level, λ decreases markedly with increasing σ c . In addition, for all materials and confinement levels, λ generally increases with increasing γ . The strain dependency is more pronounced at lower σ c . For example, at γ = 0.04 % , increasing σ c from 50 to 300 kPa reduces the absolute λ values by 2.3% (CSS), 1.5% (HDS), and 2.6% (CL).
For modelling purposes, the relationship between hysteretic damping ratio and cyclic angular strain may be approximated, for each material and each effective consolidation pressure level, by a power-law expression:
λ = A γ B
where λ is the hysteretic damping ratio, γ is the cyclic angular strain, and A and B are empirical constants. The fitted values of A and B for each material and σ c are reported in Table 5.
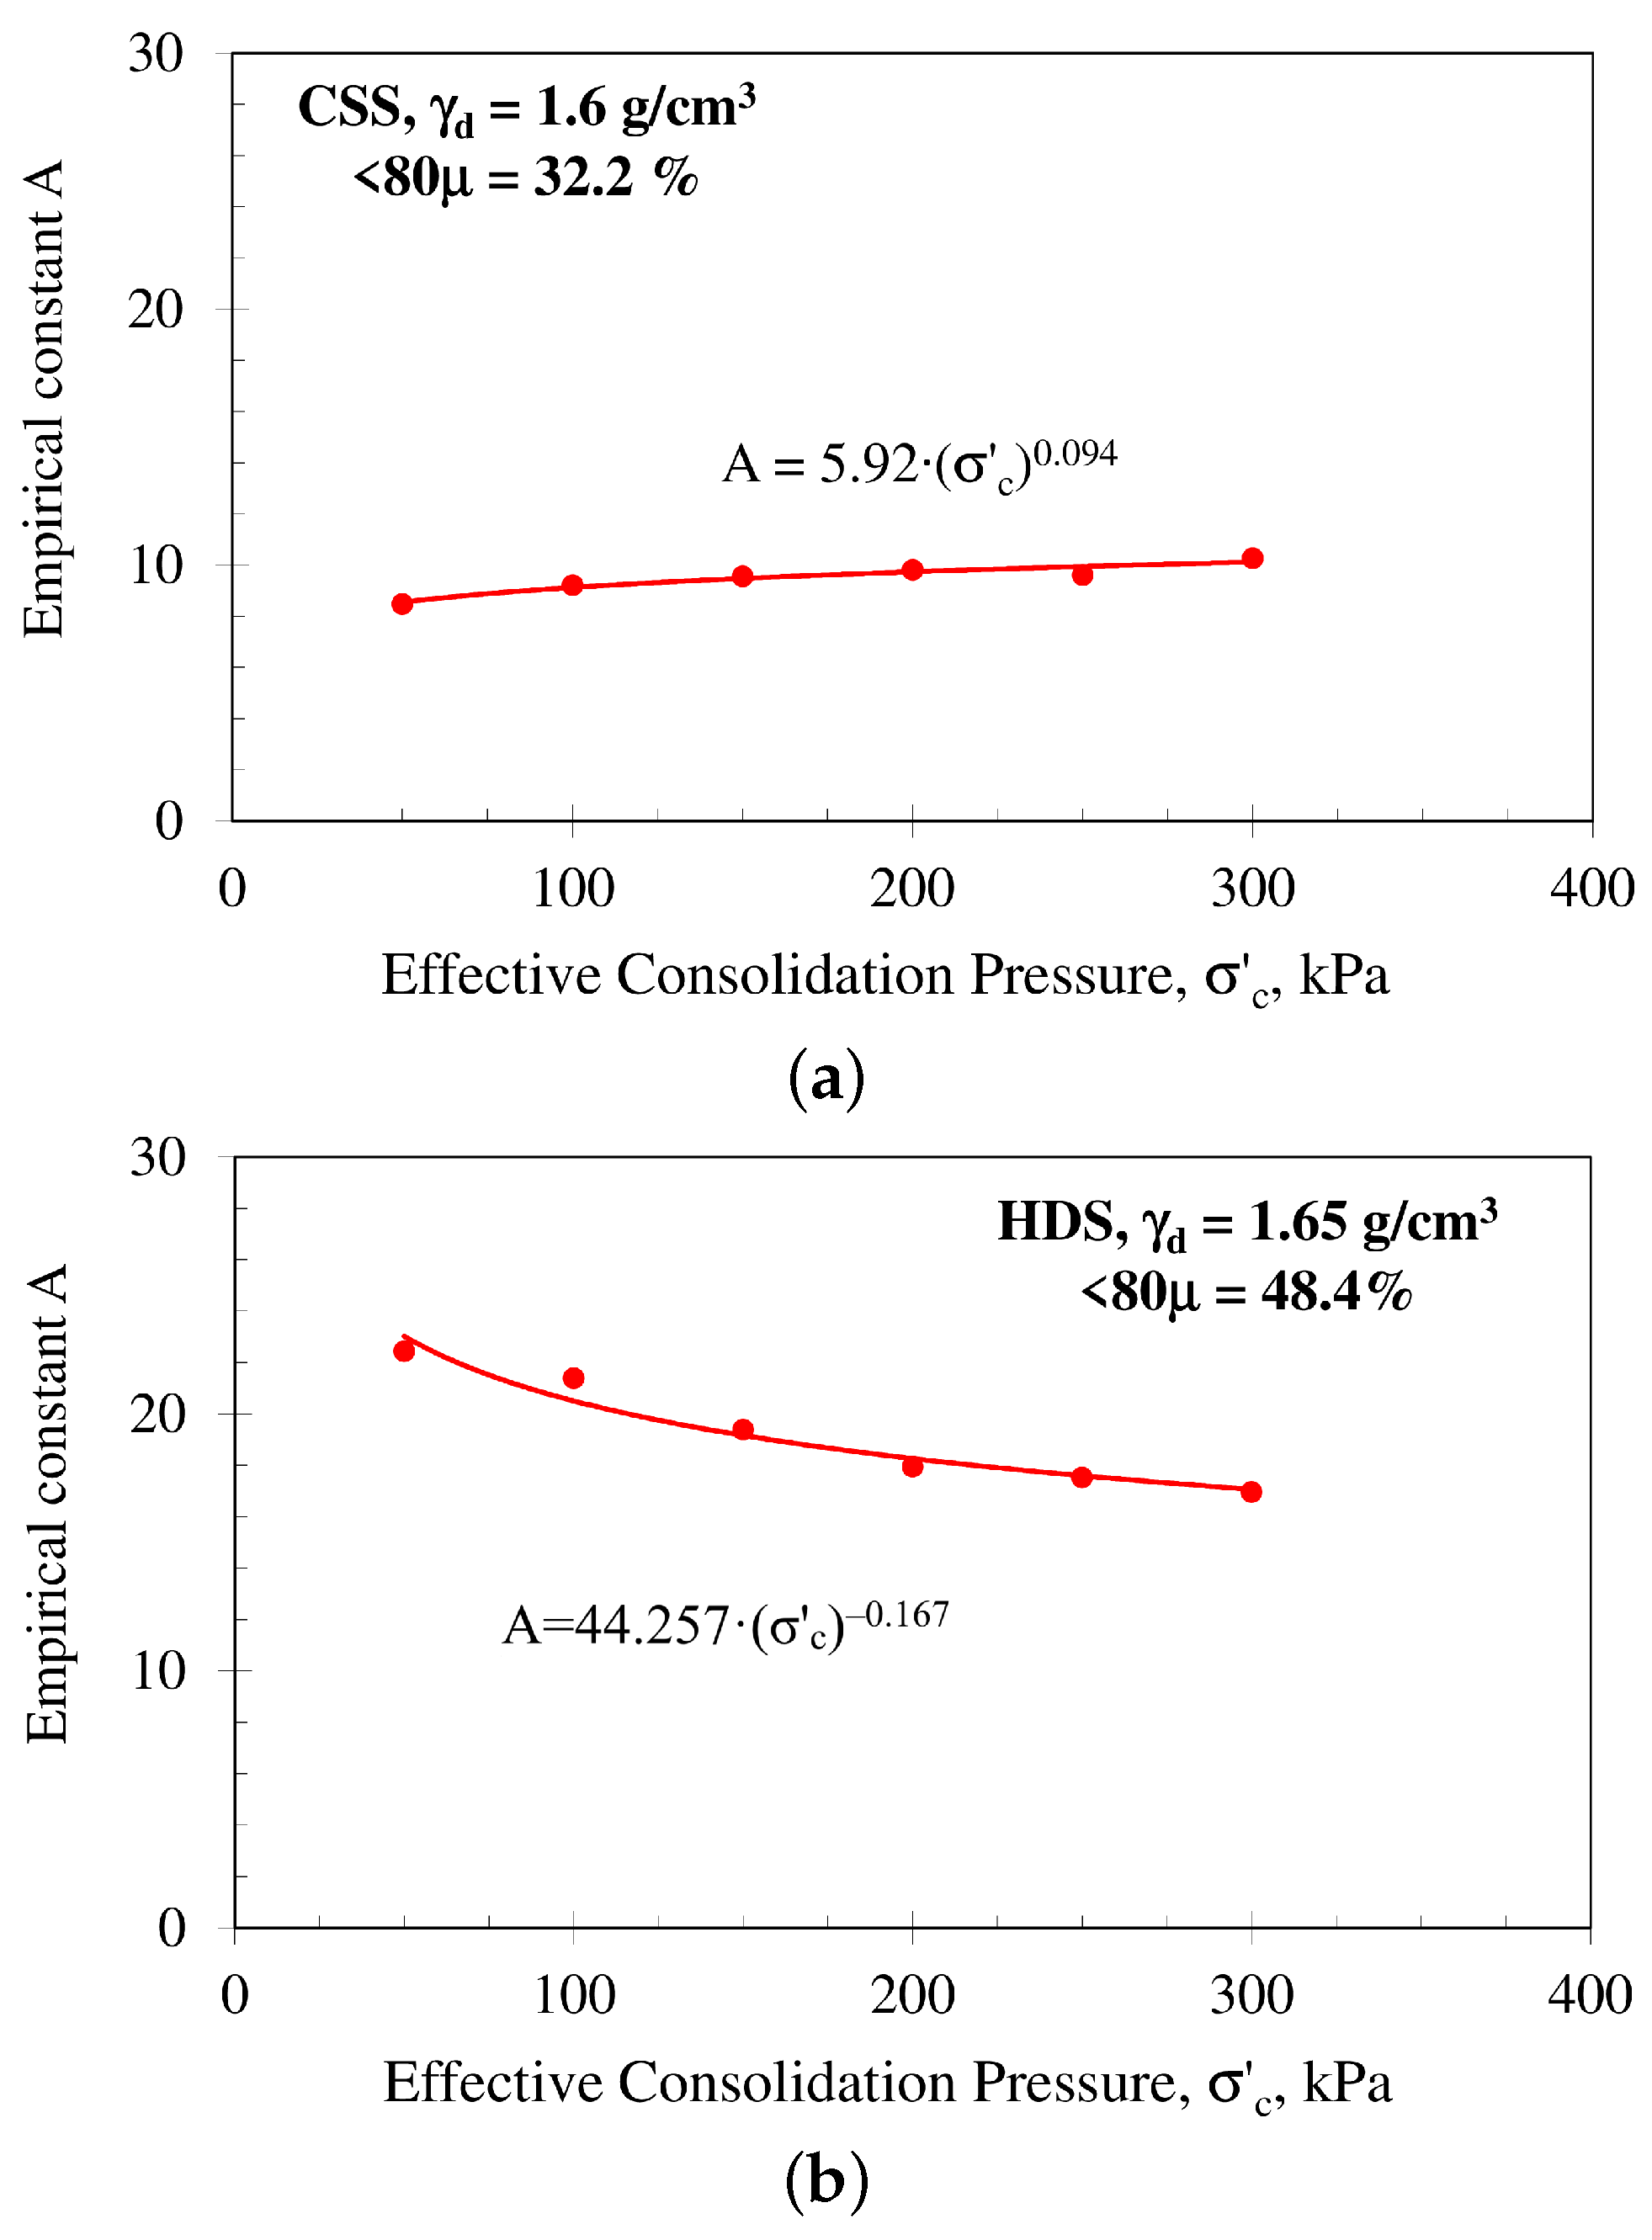
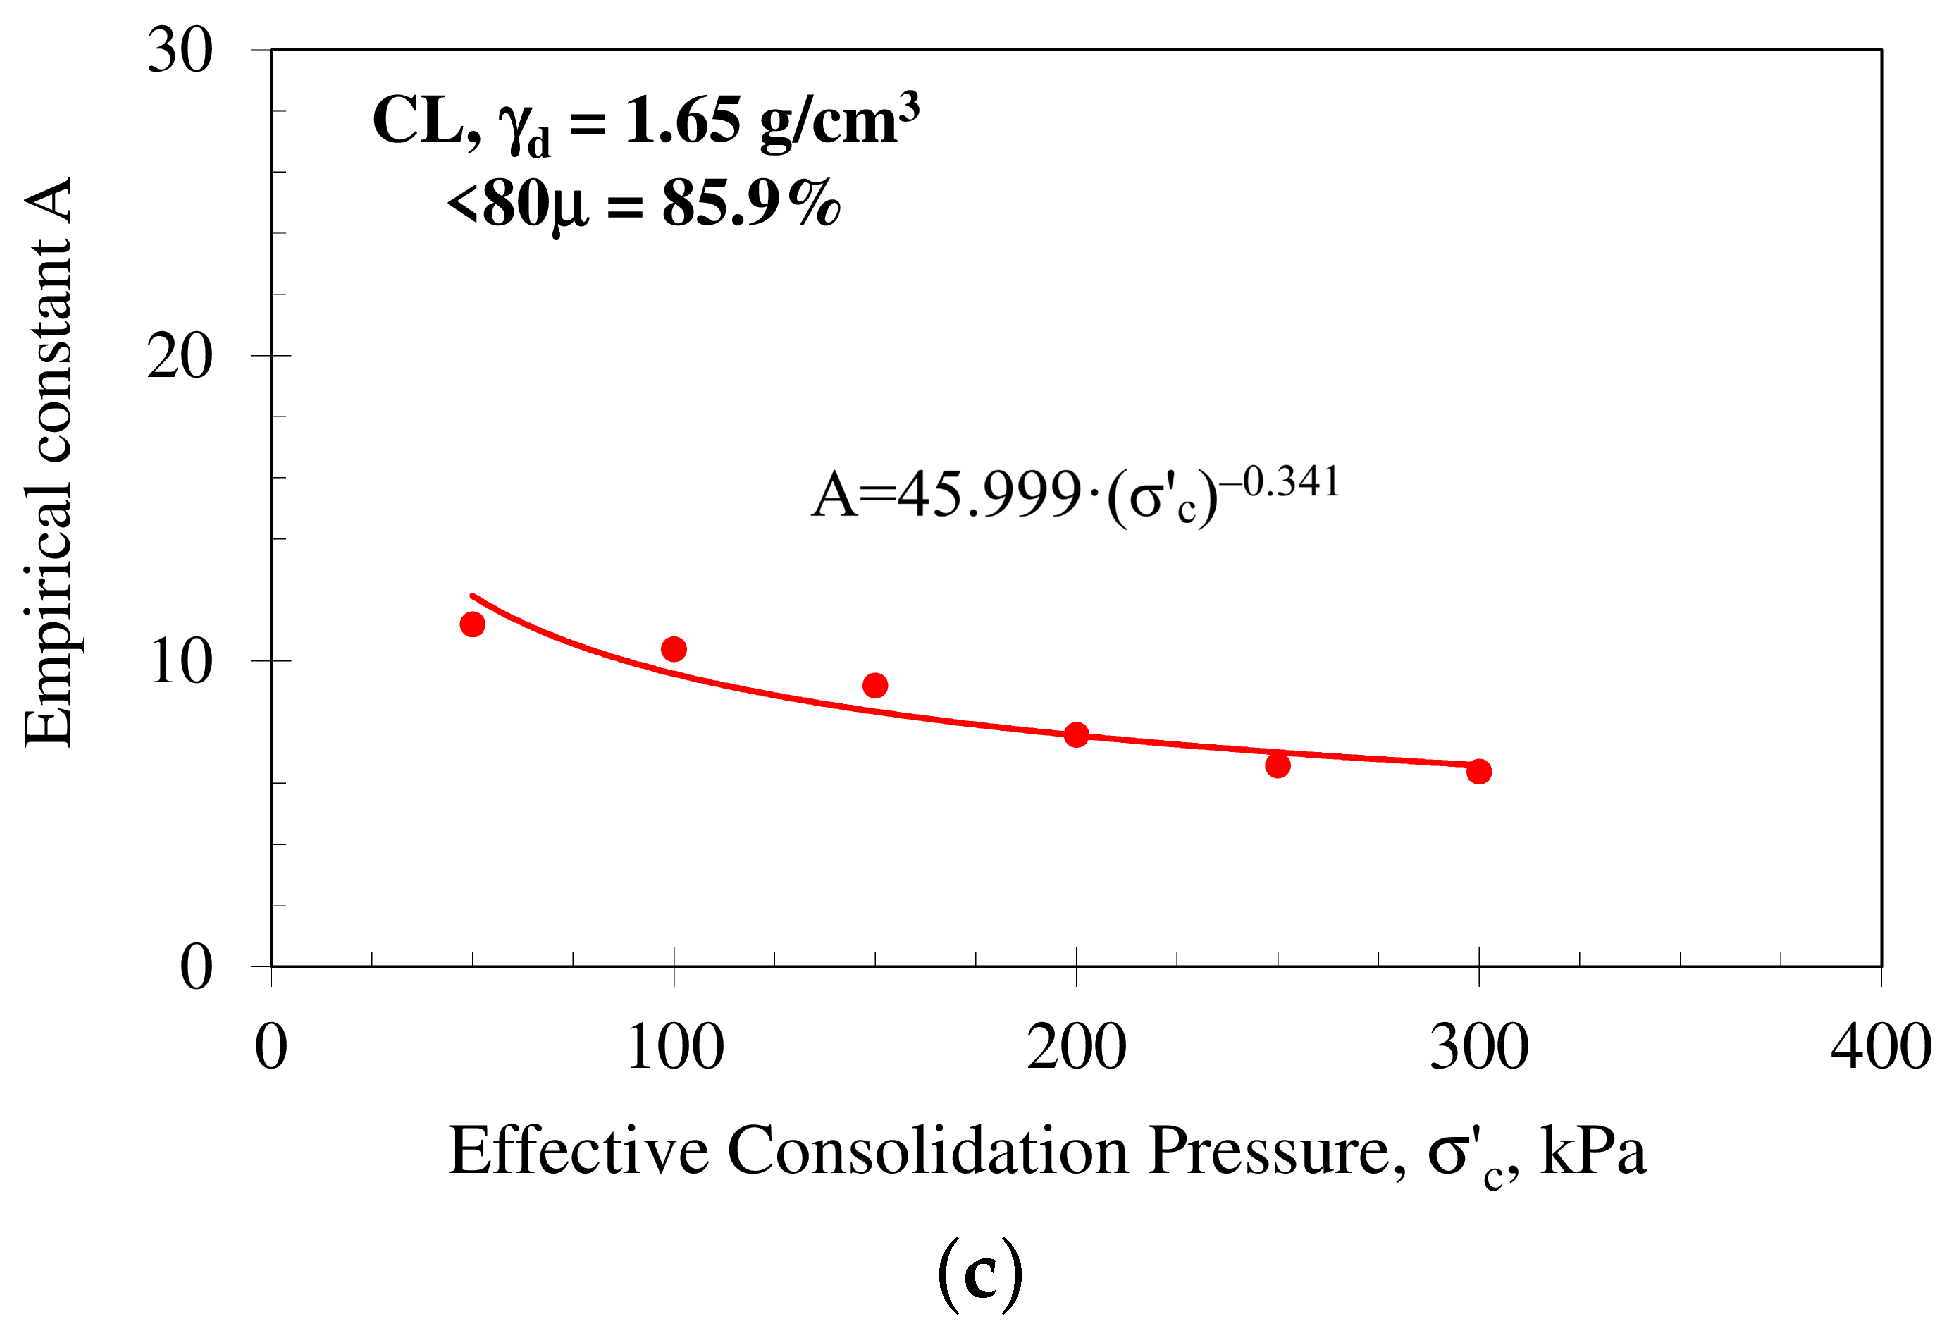
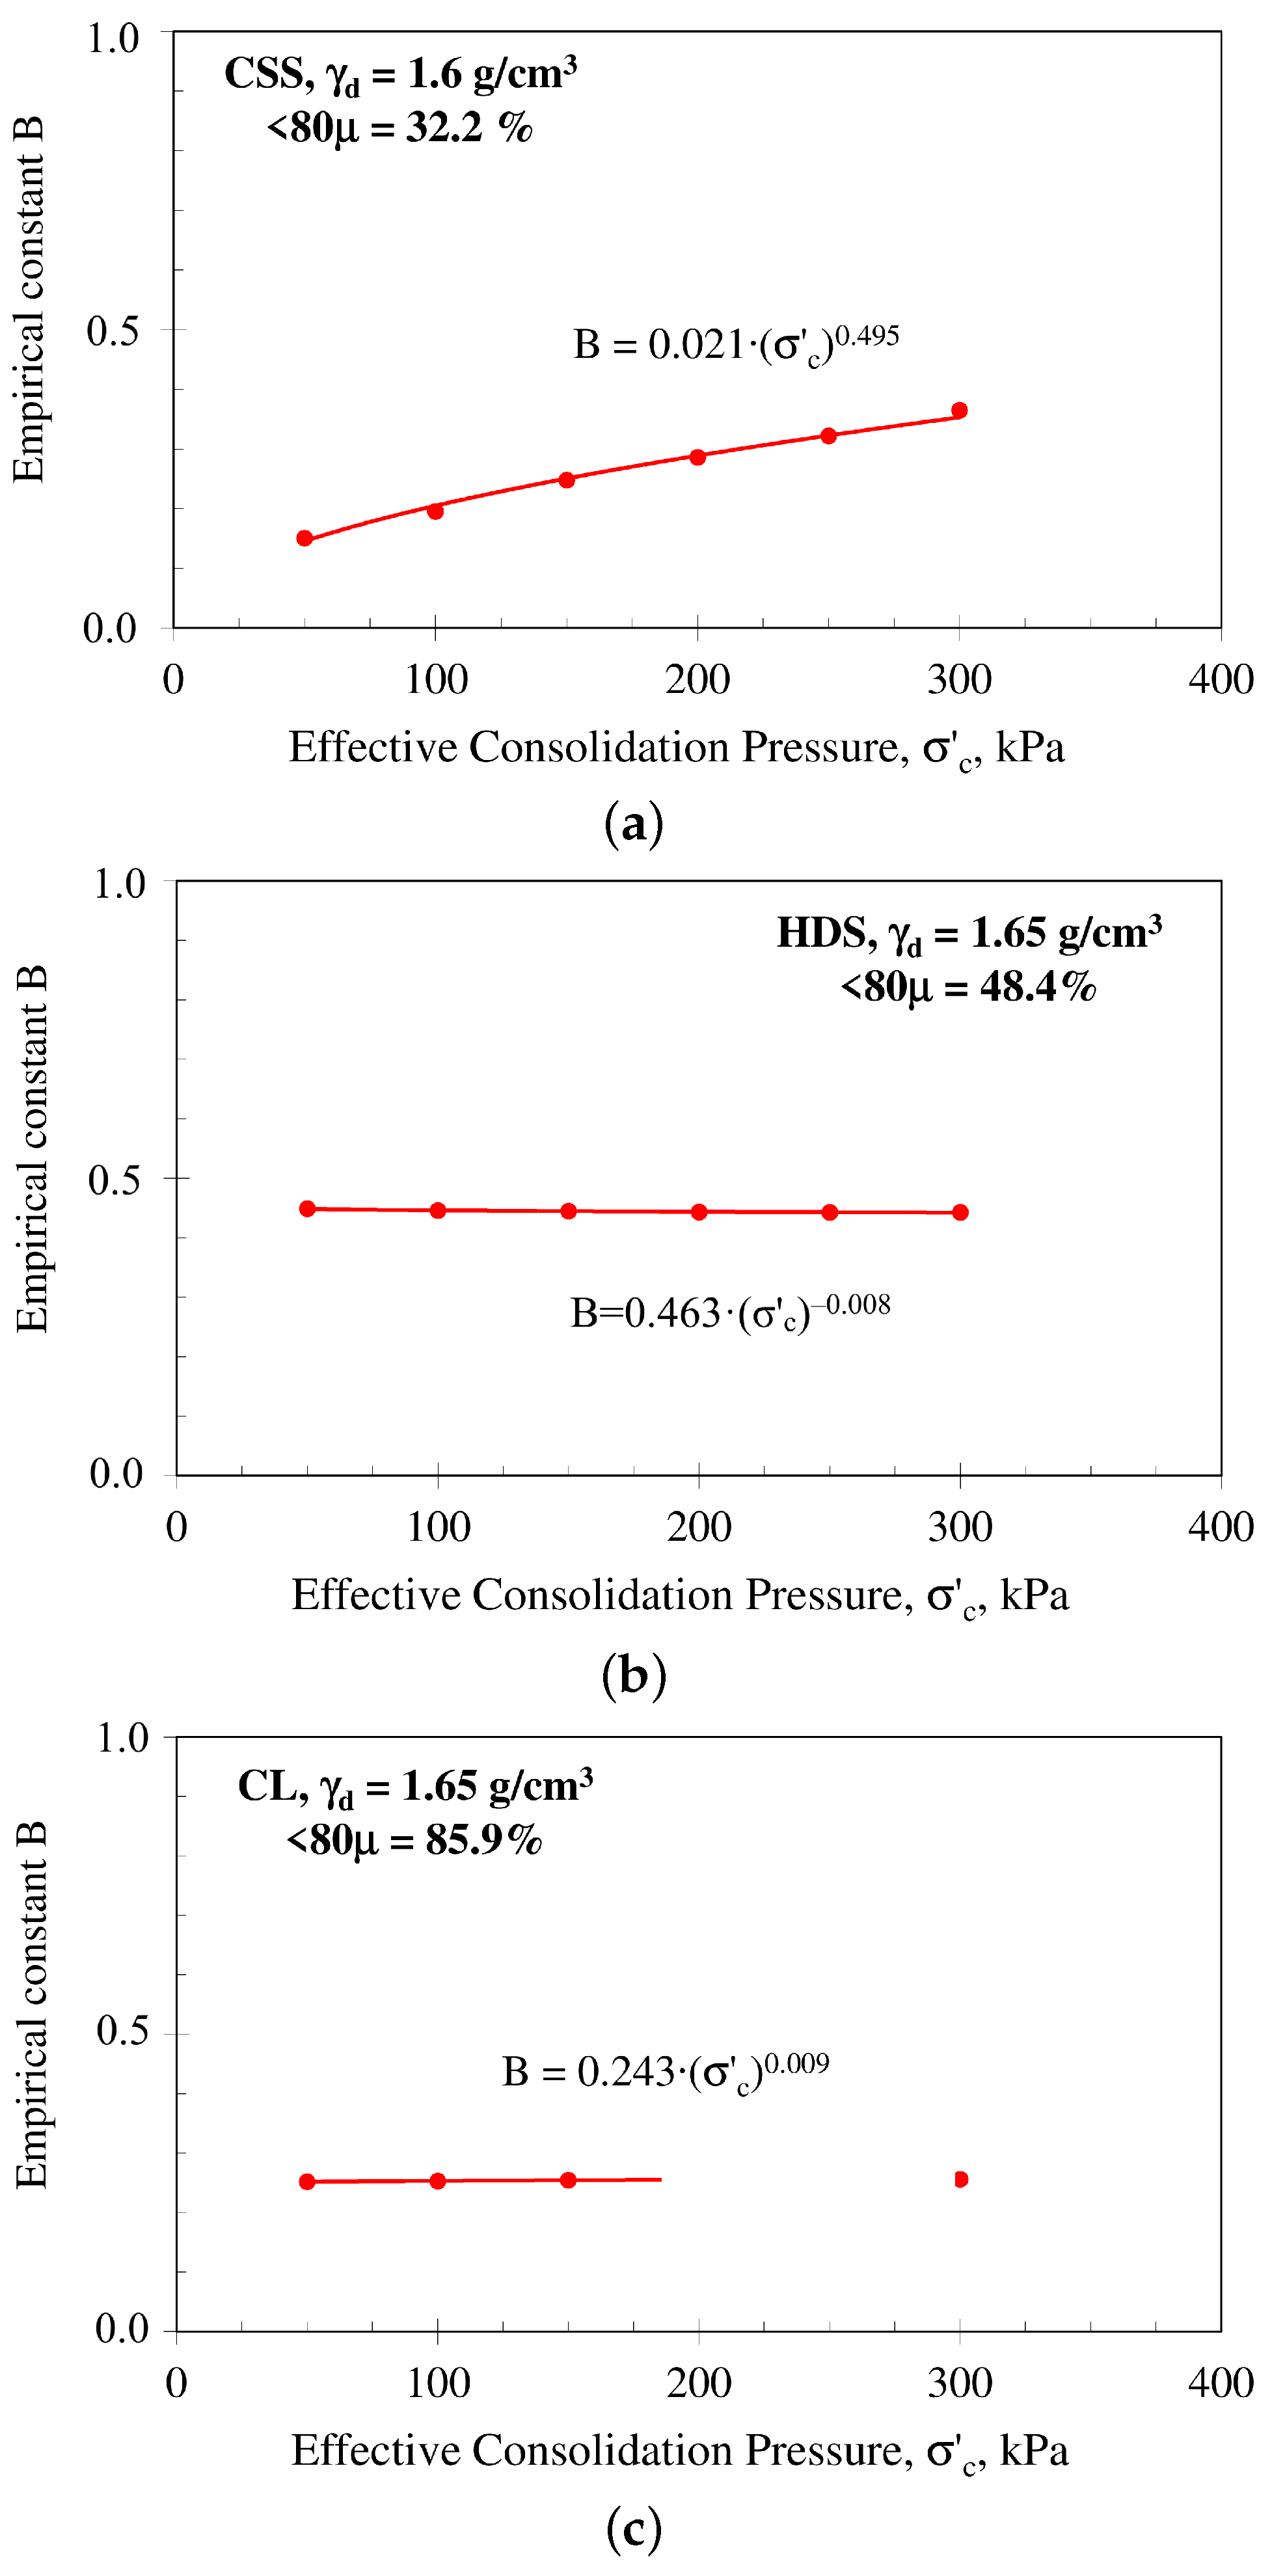
To generalise Equation (6), the parameters A and B were expressed as functions of effective consolidation pressure using power-law relationships:
A = I ( σ c ) J
B = K ( σ c ) L
as illustrated in Figure 5 and Figure 6. Substitution of Equations (7) and (8) into Equation (6) yields the general expression:
λ = I ( σ c ) J γ K ( σ c ) L
where I, J, K and L are empirical constants (Table 6).

3.2. Results of Damping Ratio from Free-Vibration Decay Method

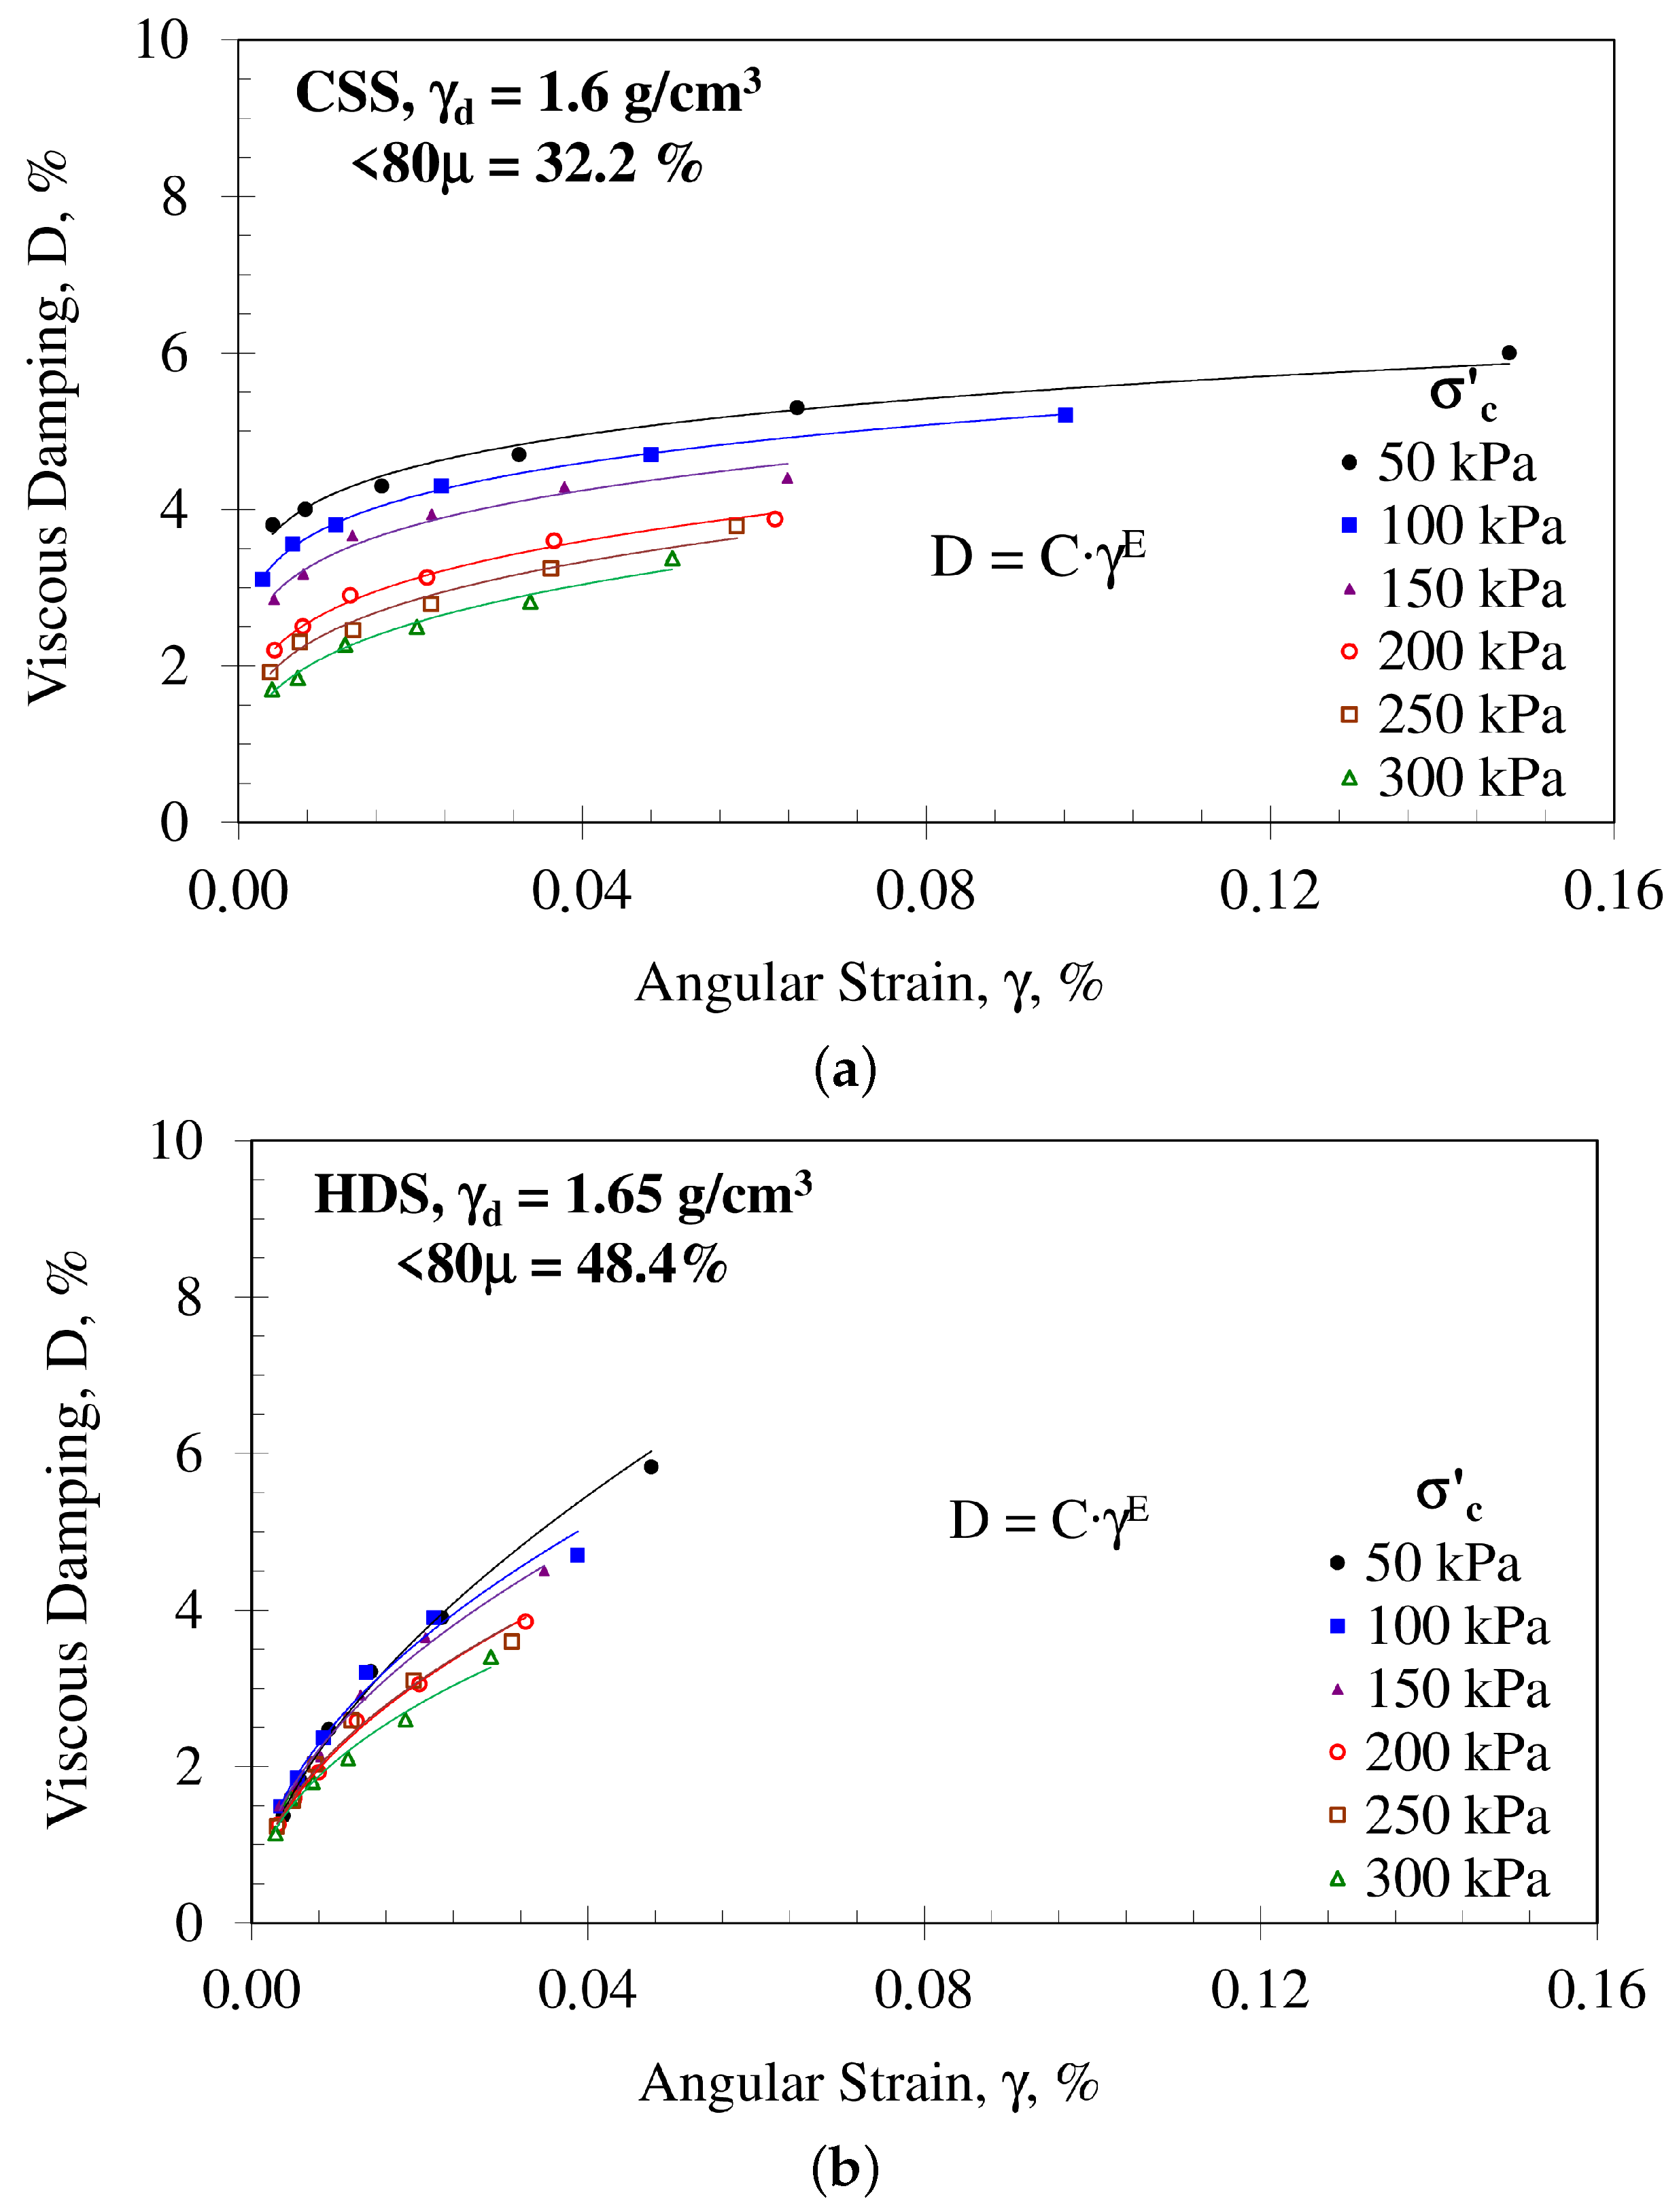
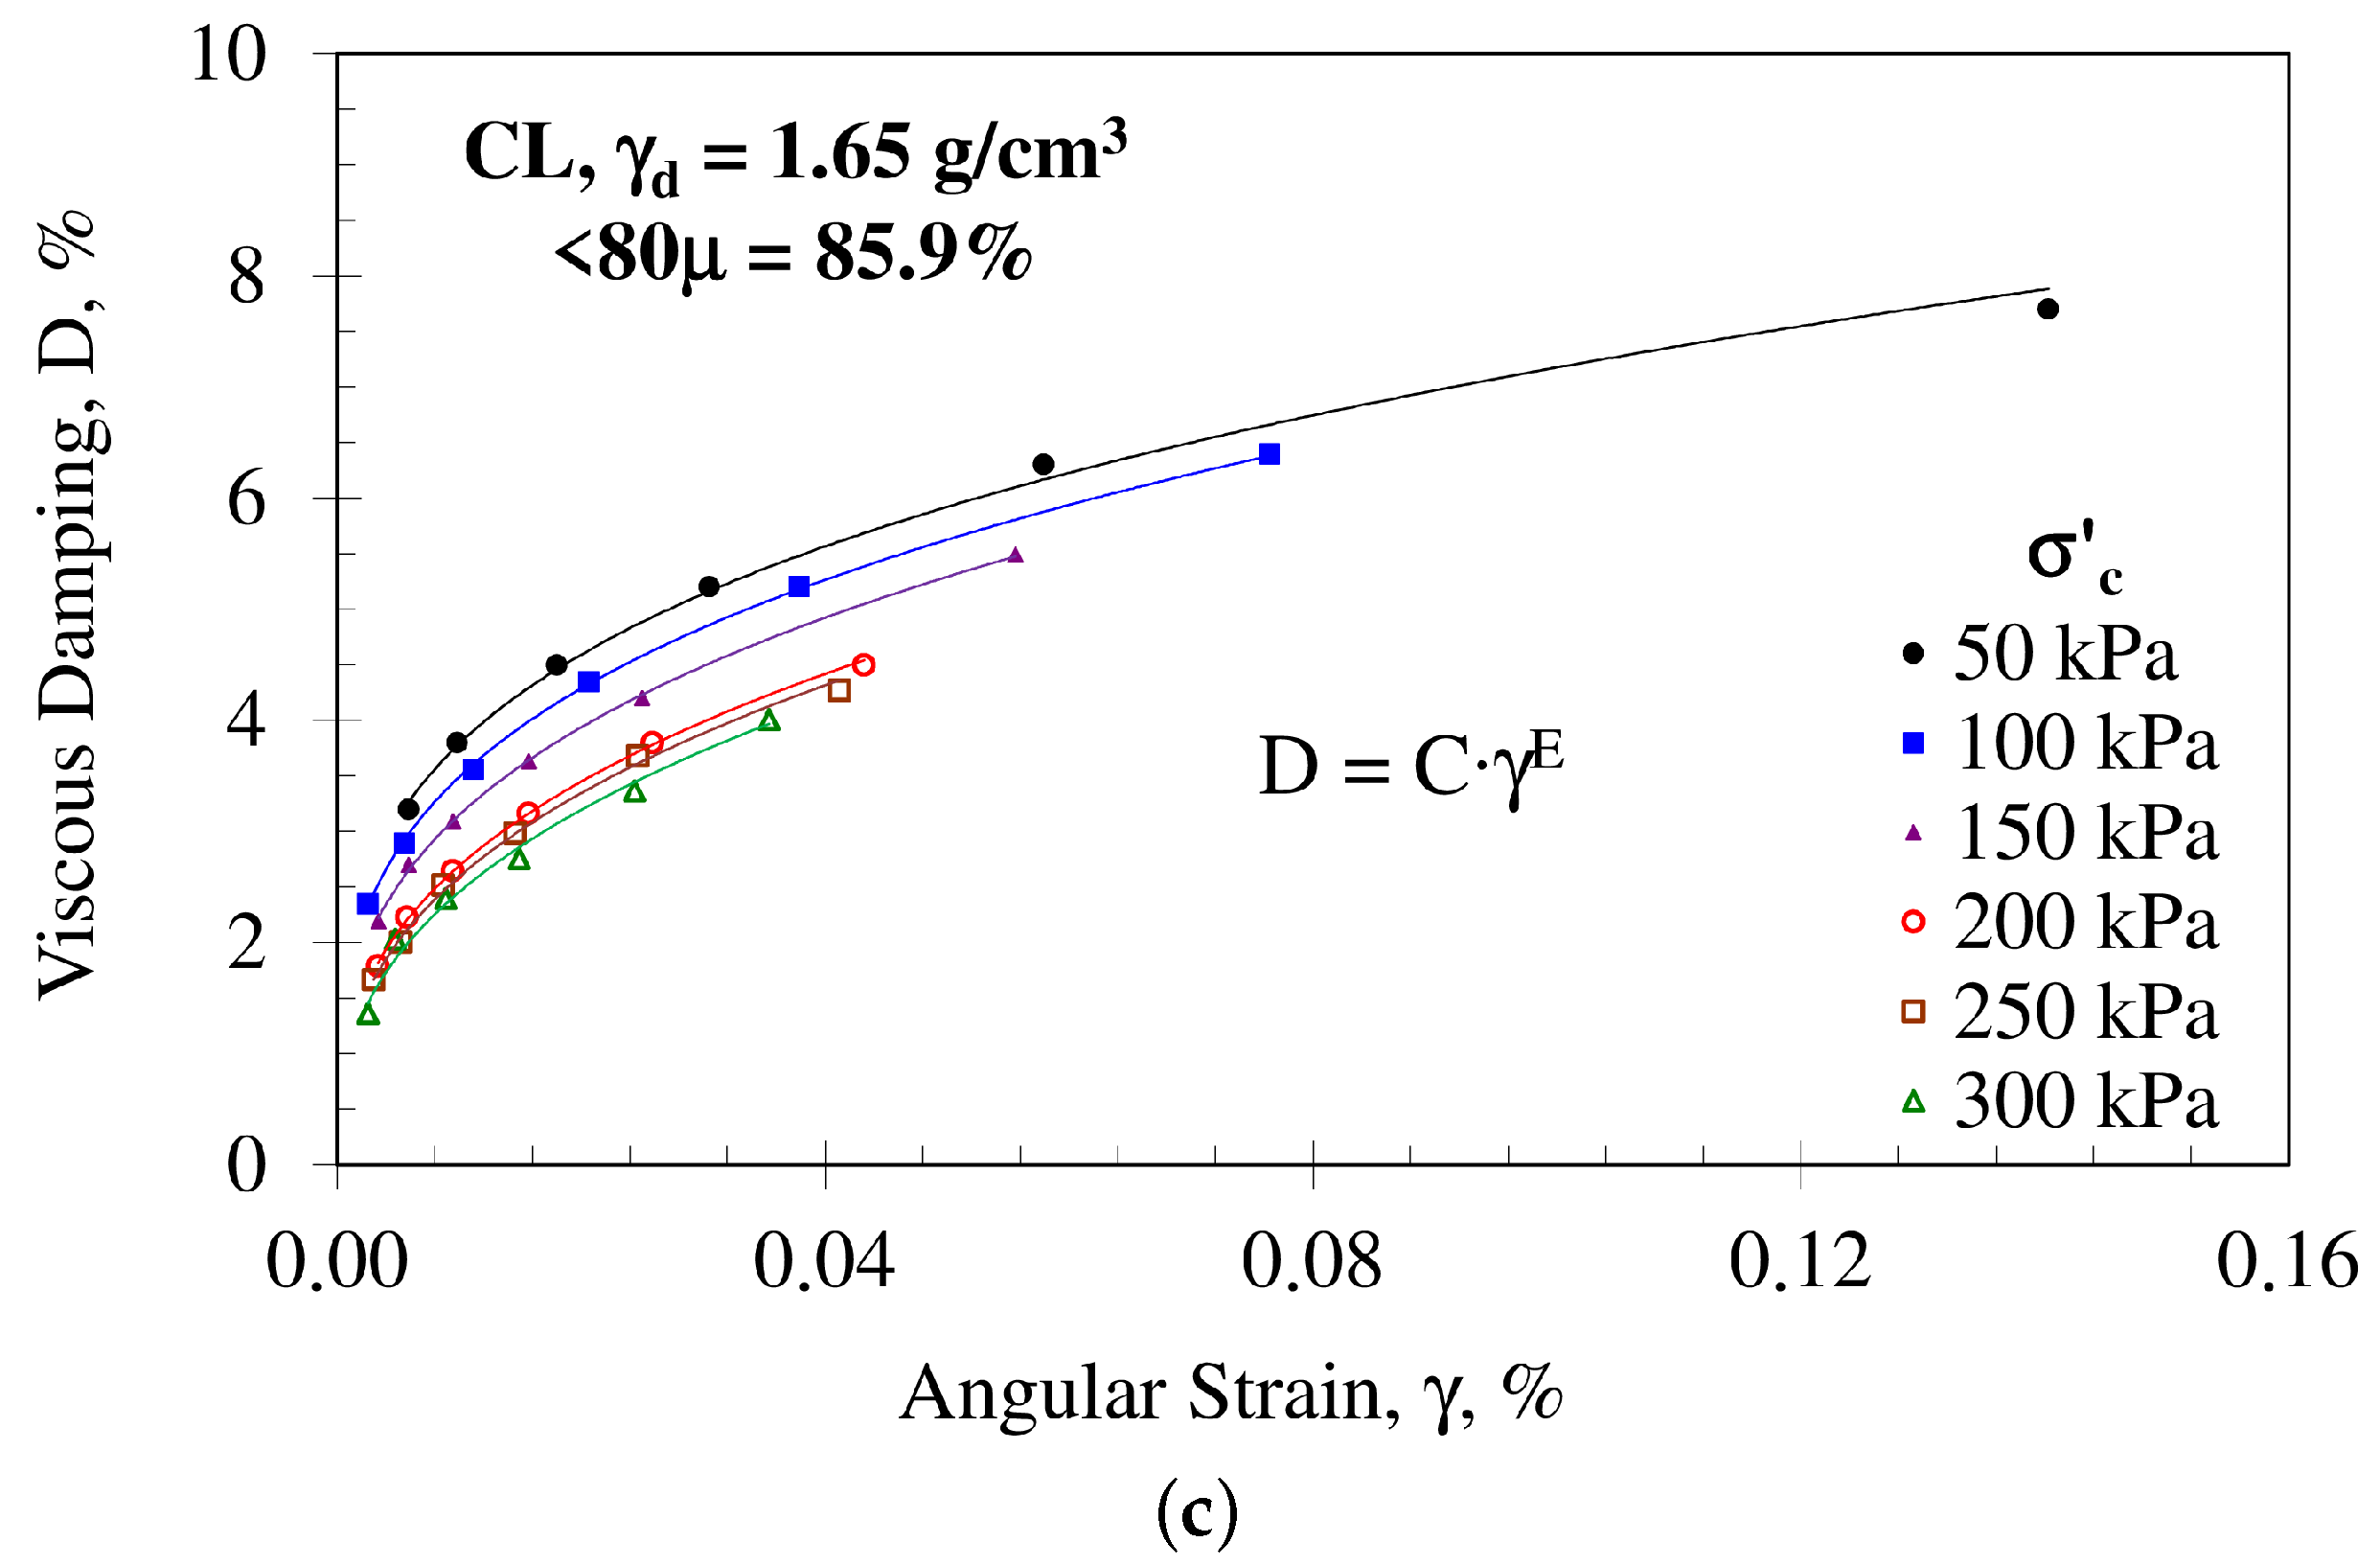
To complement the hysteretic damping analysis, the viscous damping ratio values (D) reported in Table 4 and plotted in Figure 7 were obtained from the decay of free vibrations using the free-vibration decay (F-VD) method. Figure 7 shows the variation in D with cyclic angular strain γ at different effective consolidation pressures σ c . From this figure, it can be observed that for all materials and confinement levels, D generally increases with increasing γ . In addition, at a given strain level, D exhibits systematic variation with σ c , consistent with the confinement dependency observed for λ .
For modelling purposes, the dependence of viscous damping ratio on cyclic angular strain may be approximated by:
D = C γ E
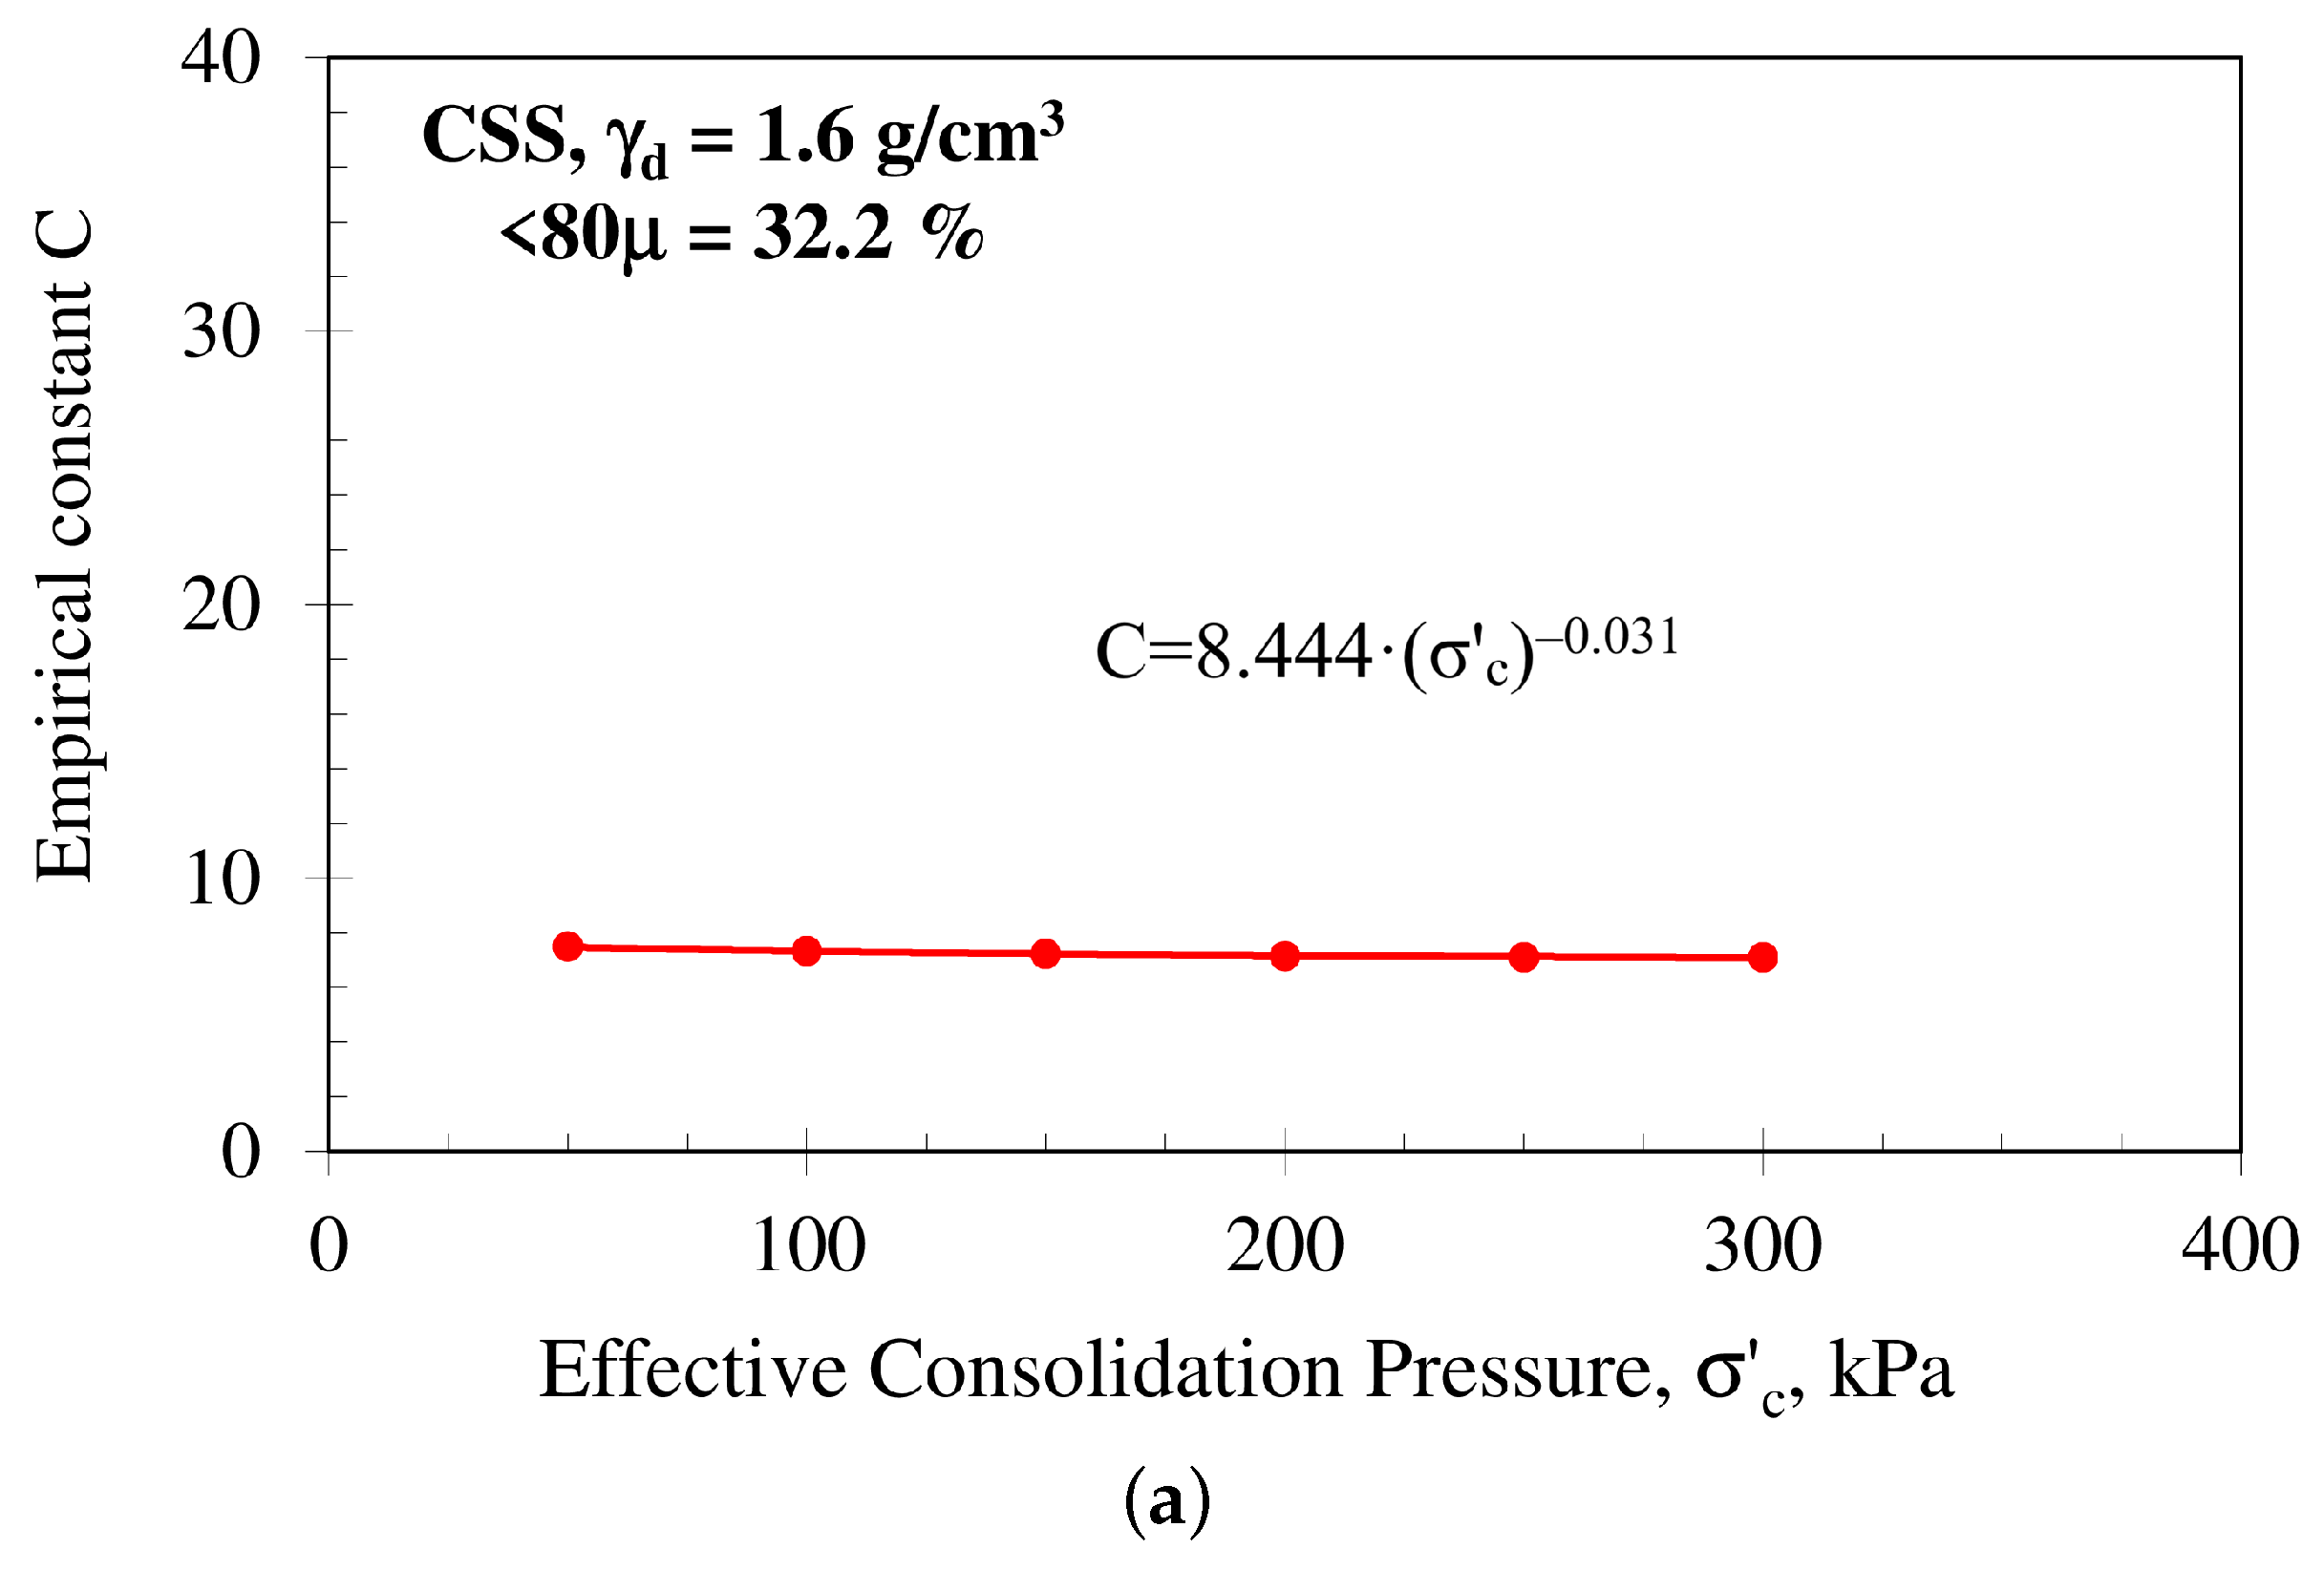
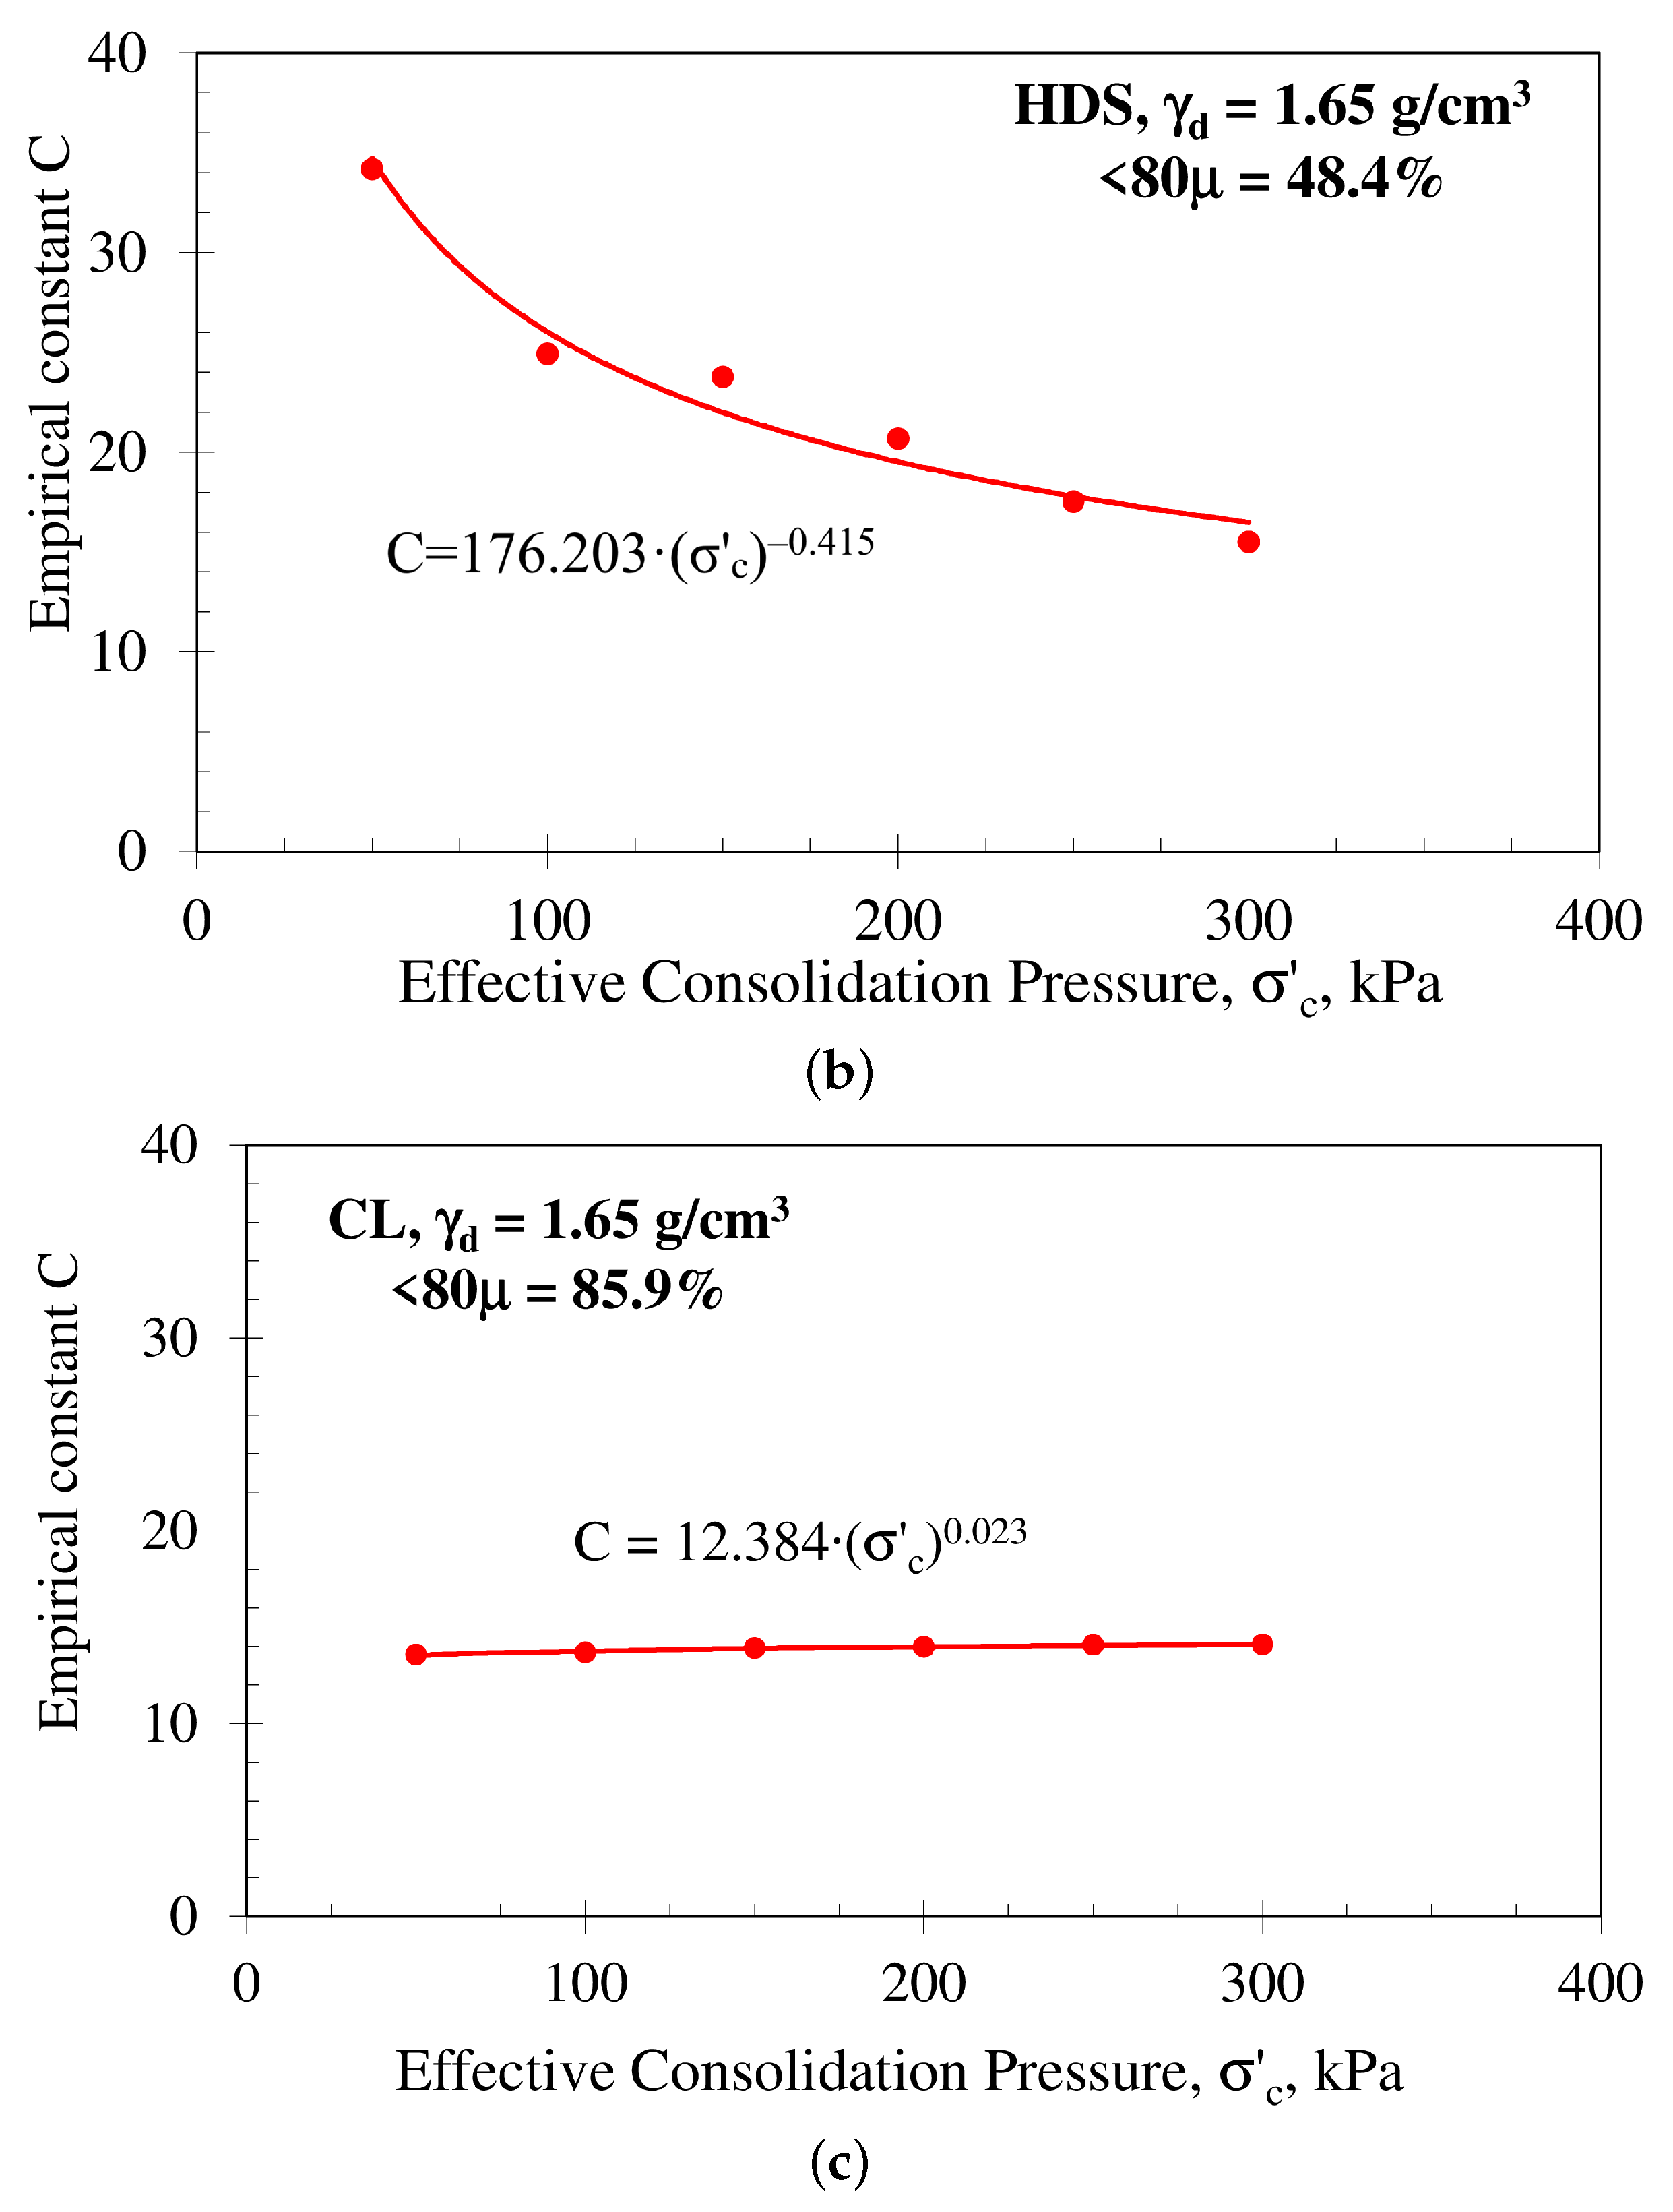
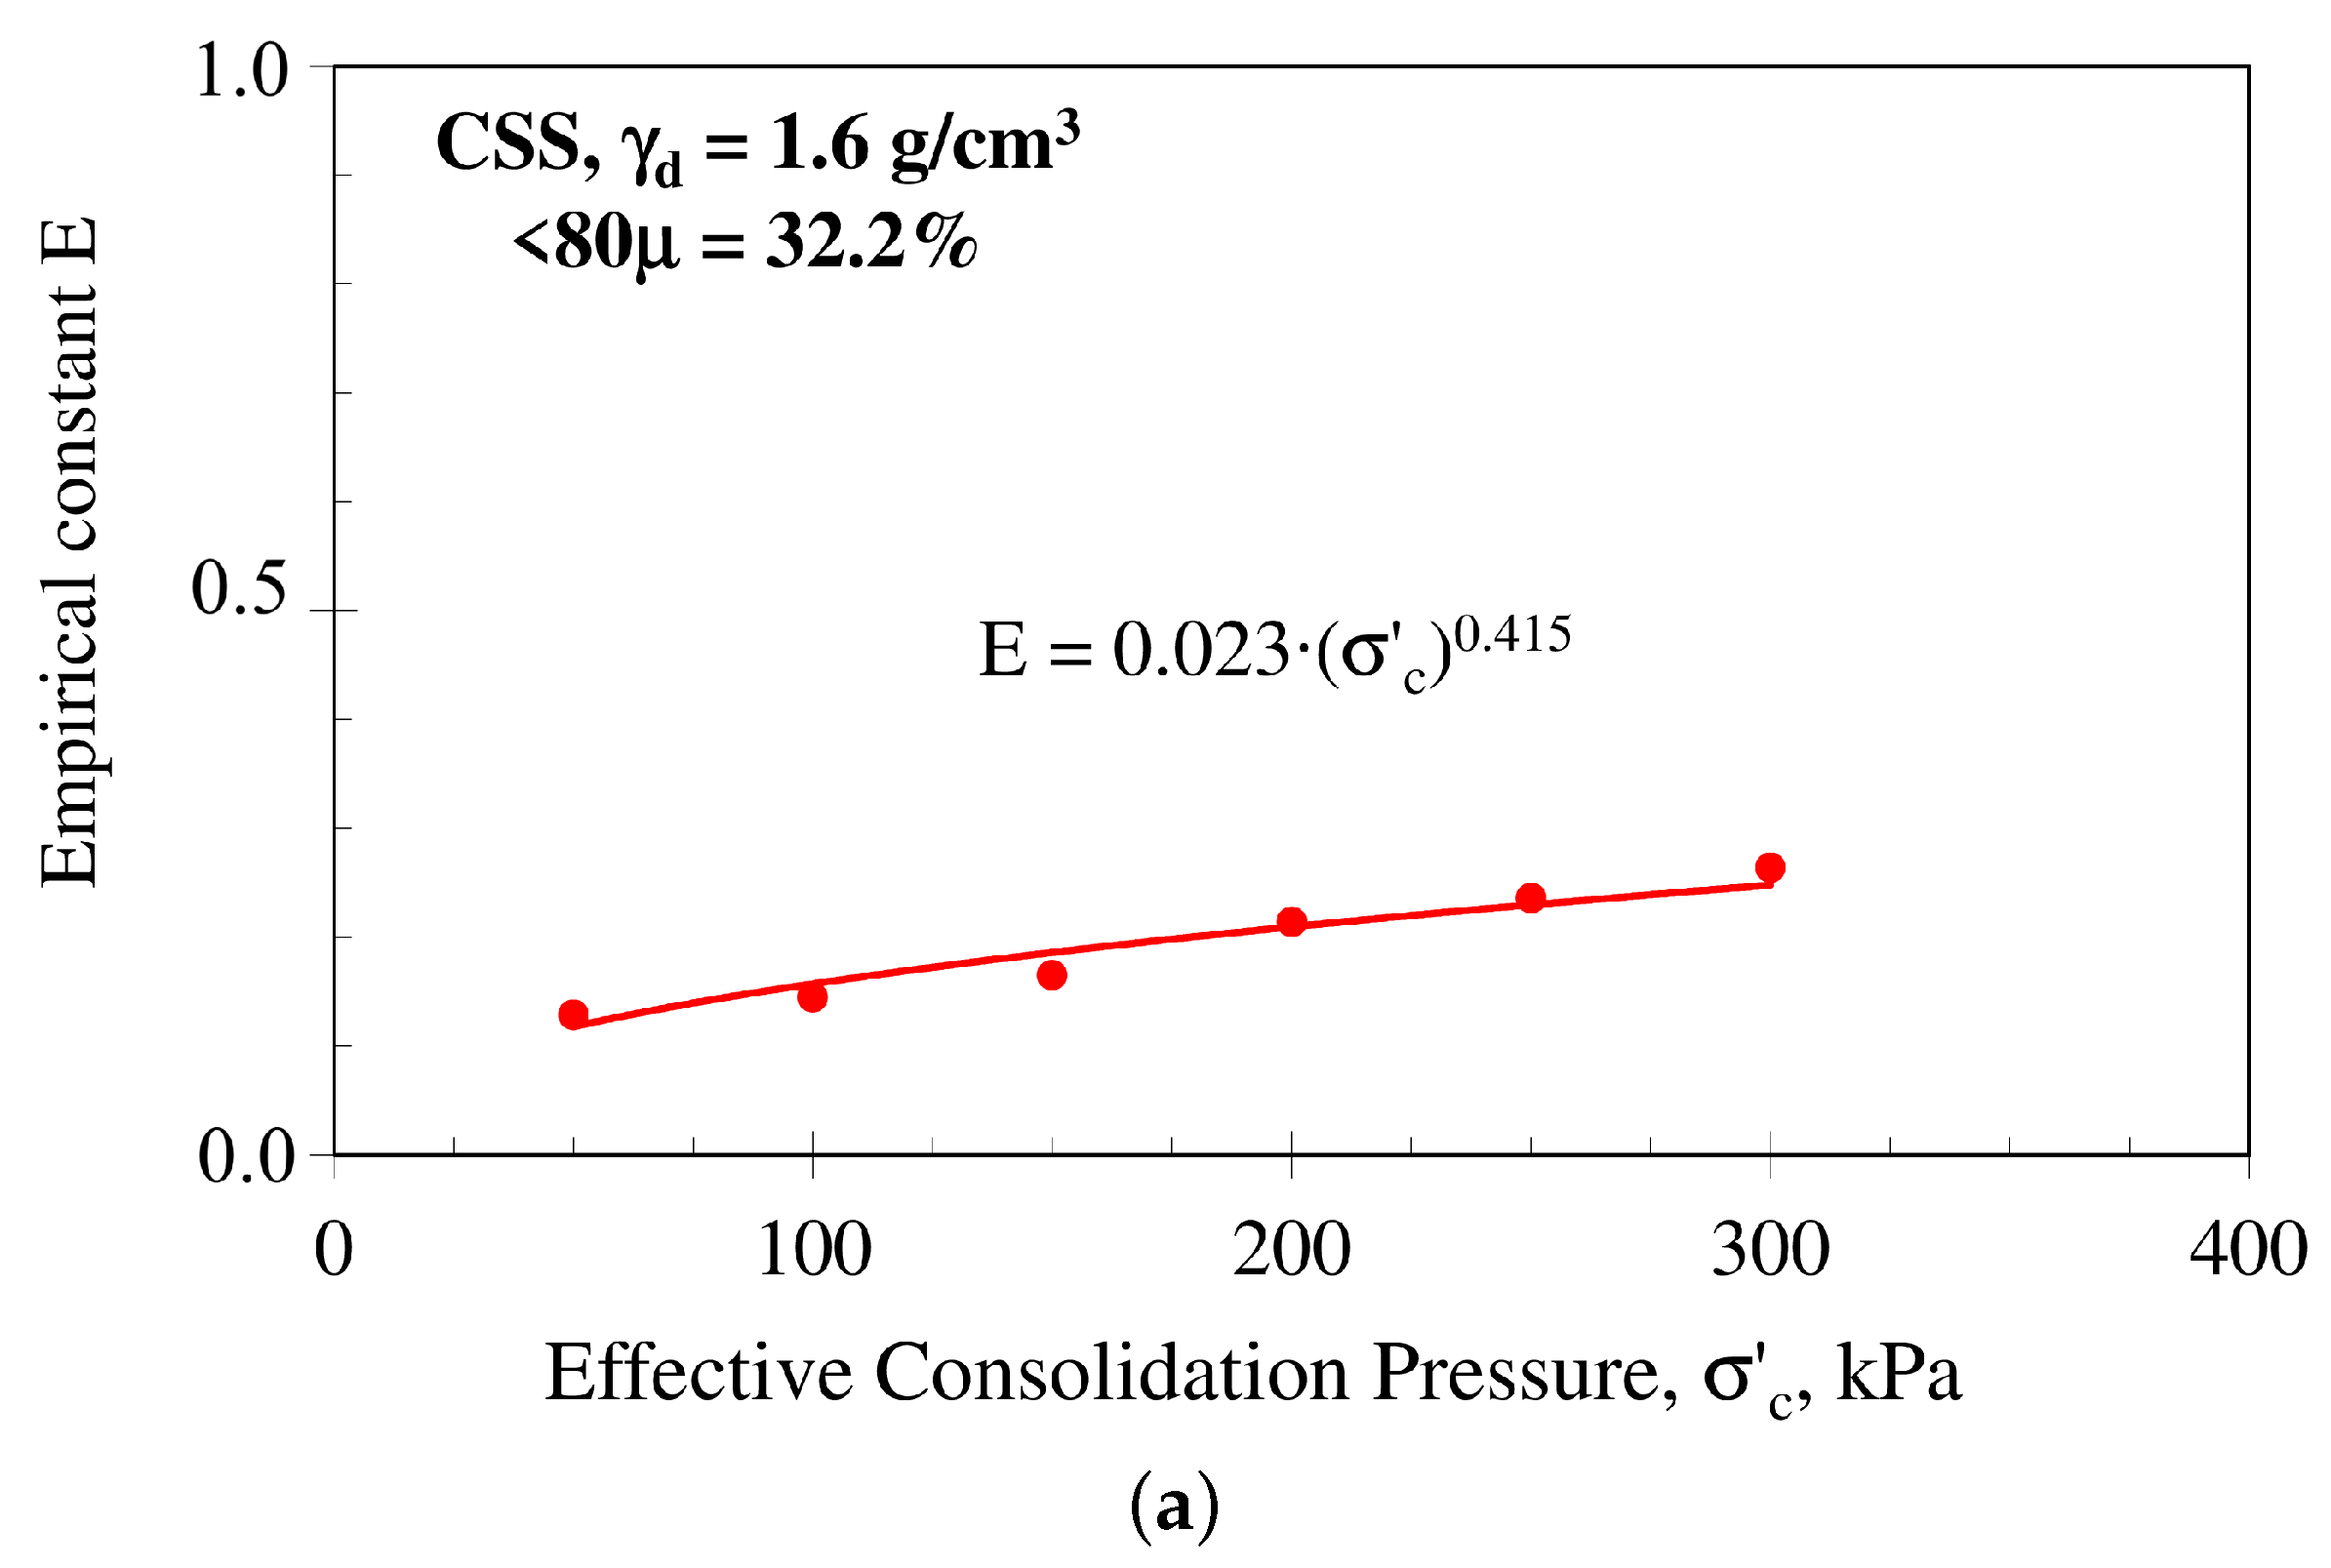
where C and E are empirical constants (Table 5). To generalise Equation (10), the parameters C and E were expressed as functions of effective consolidation pressure:
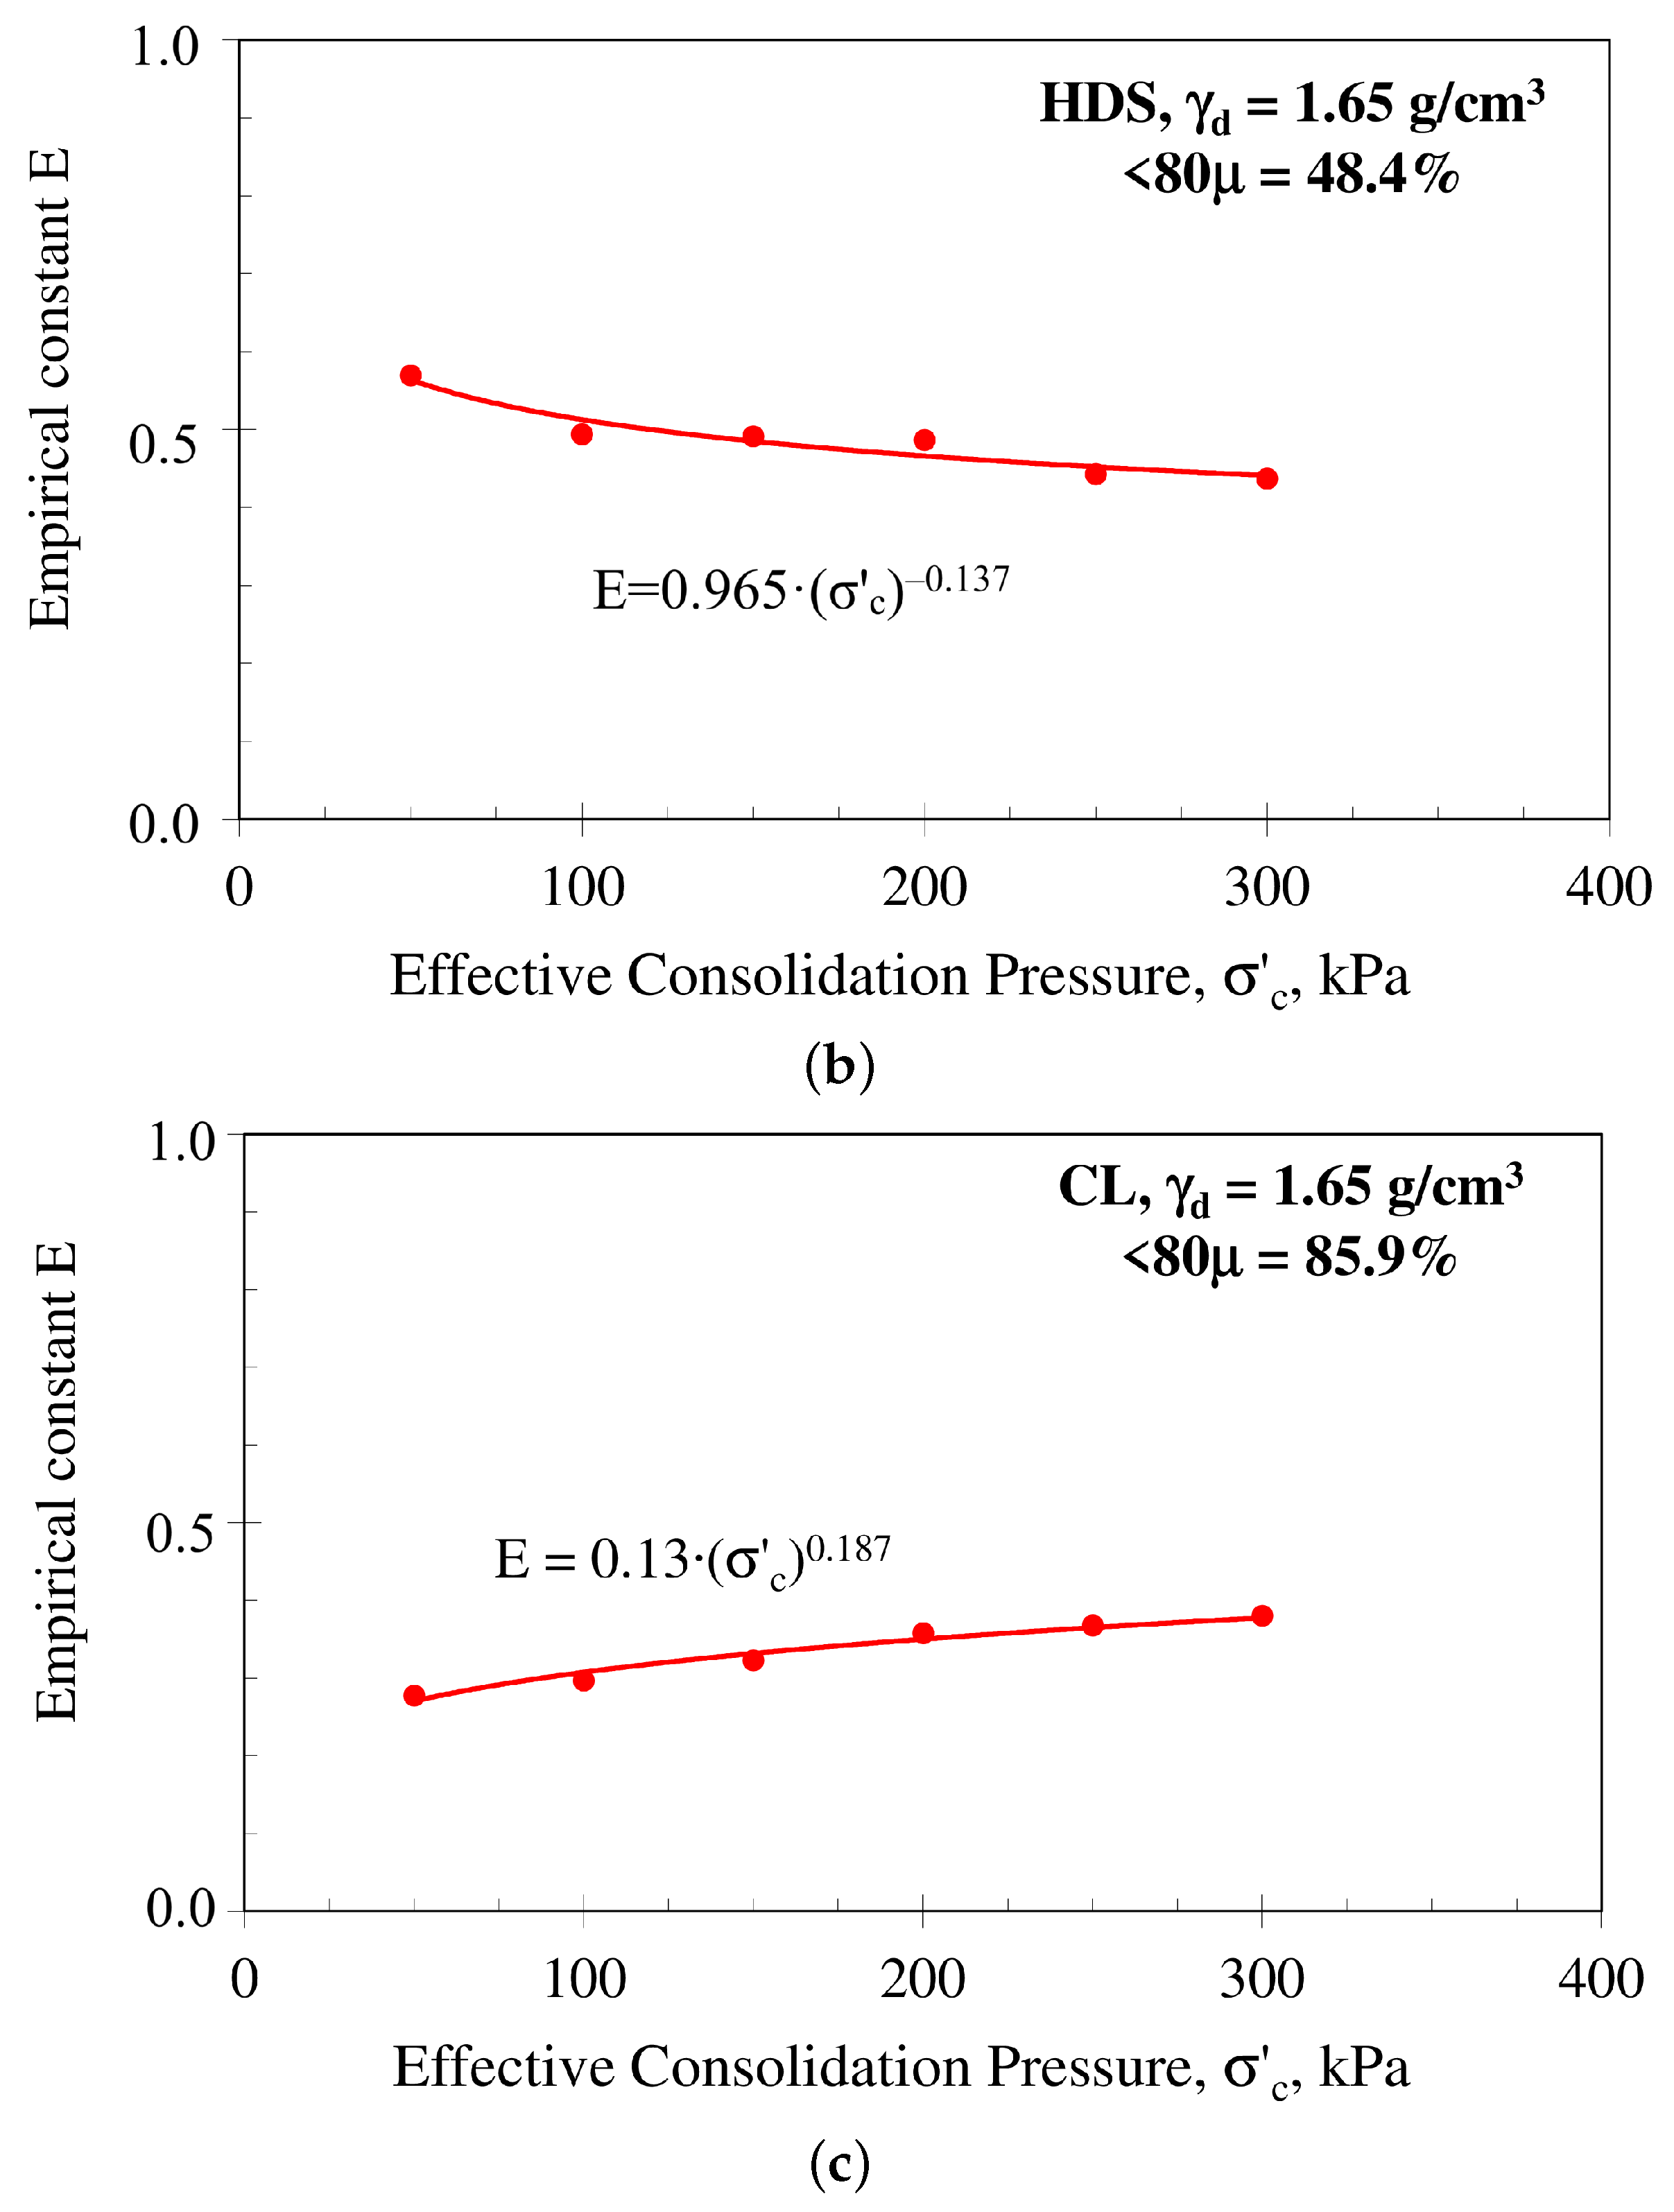
C = M ( σ c ) N
E = O ( σ c ) P
as shown in Figure 8 and Figure 9. Combining Equations (10)–(12) provides:
D = M ( σ c ) N γ O ( σ c ) P
where M, N, O and P are empirical constants (Table 6).

3.3. Relationship Between Viscous and Hysteretic Damping

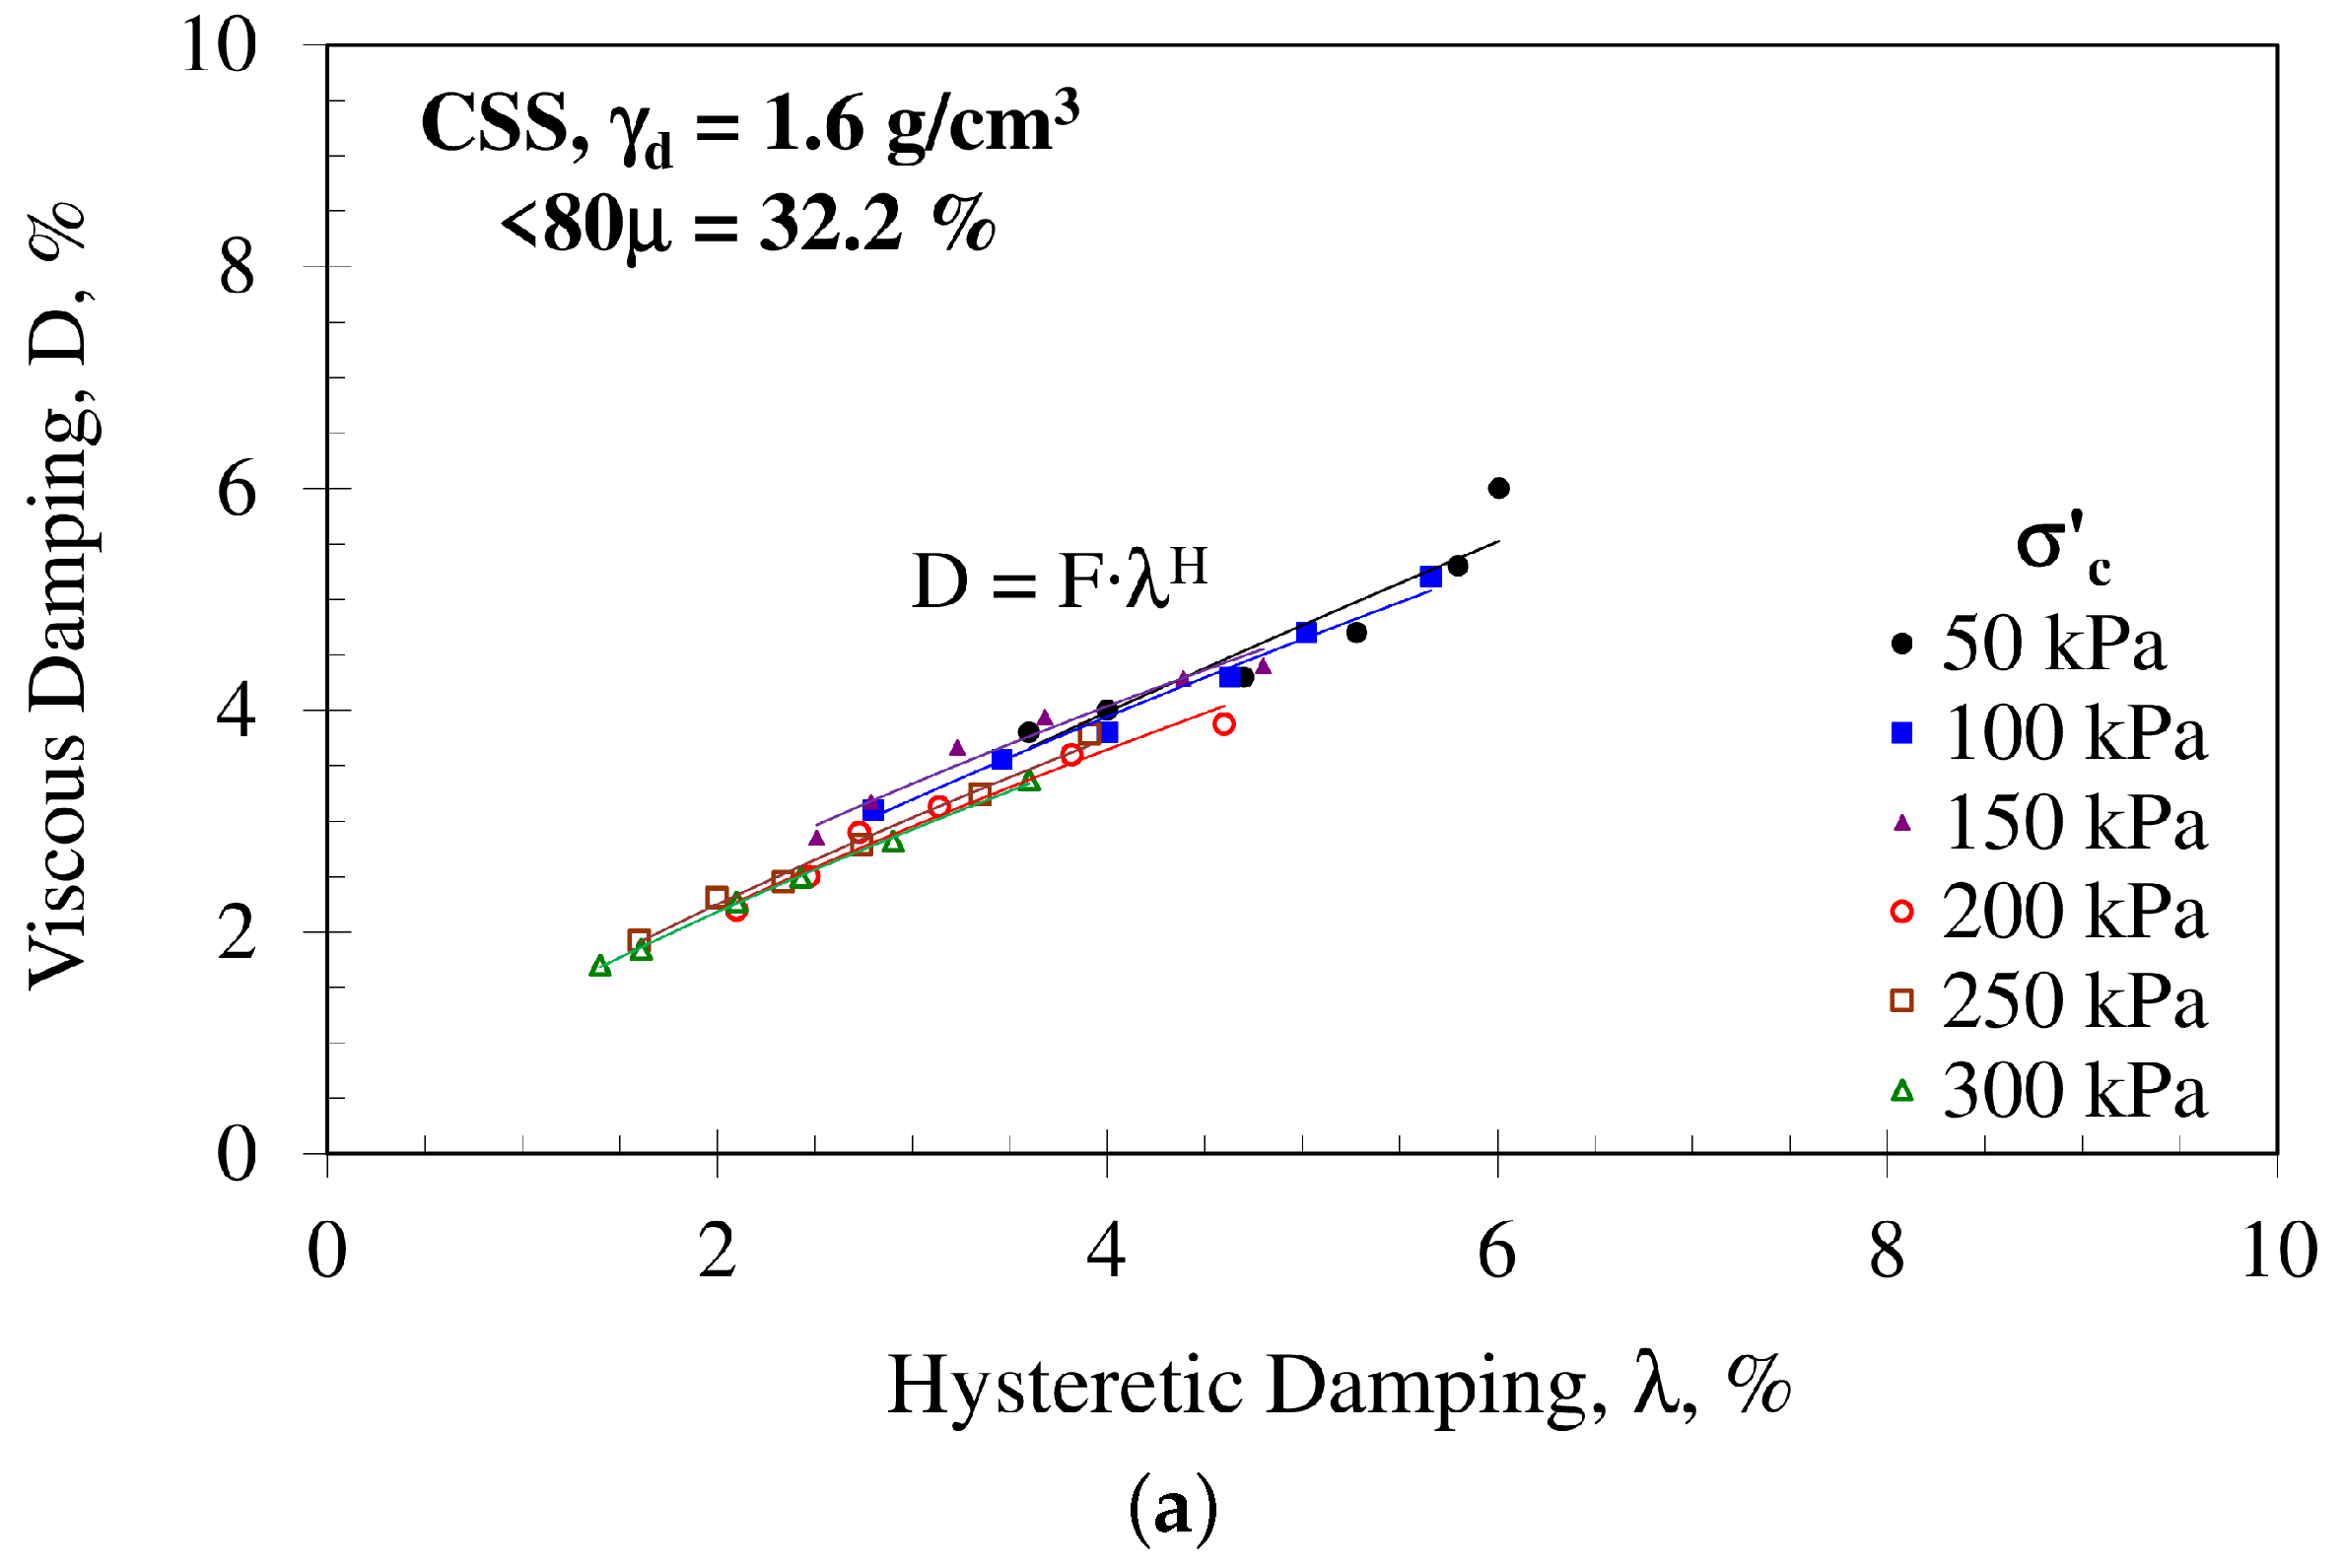
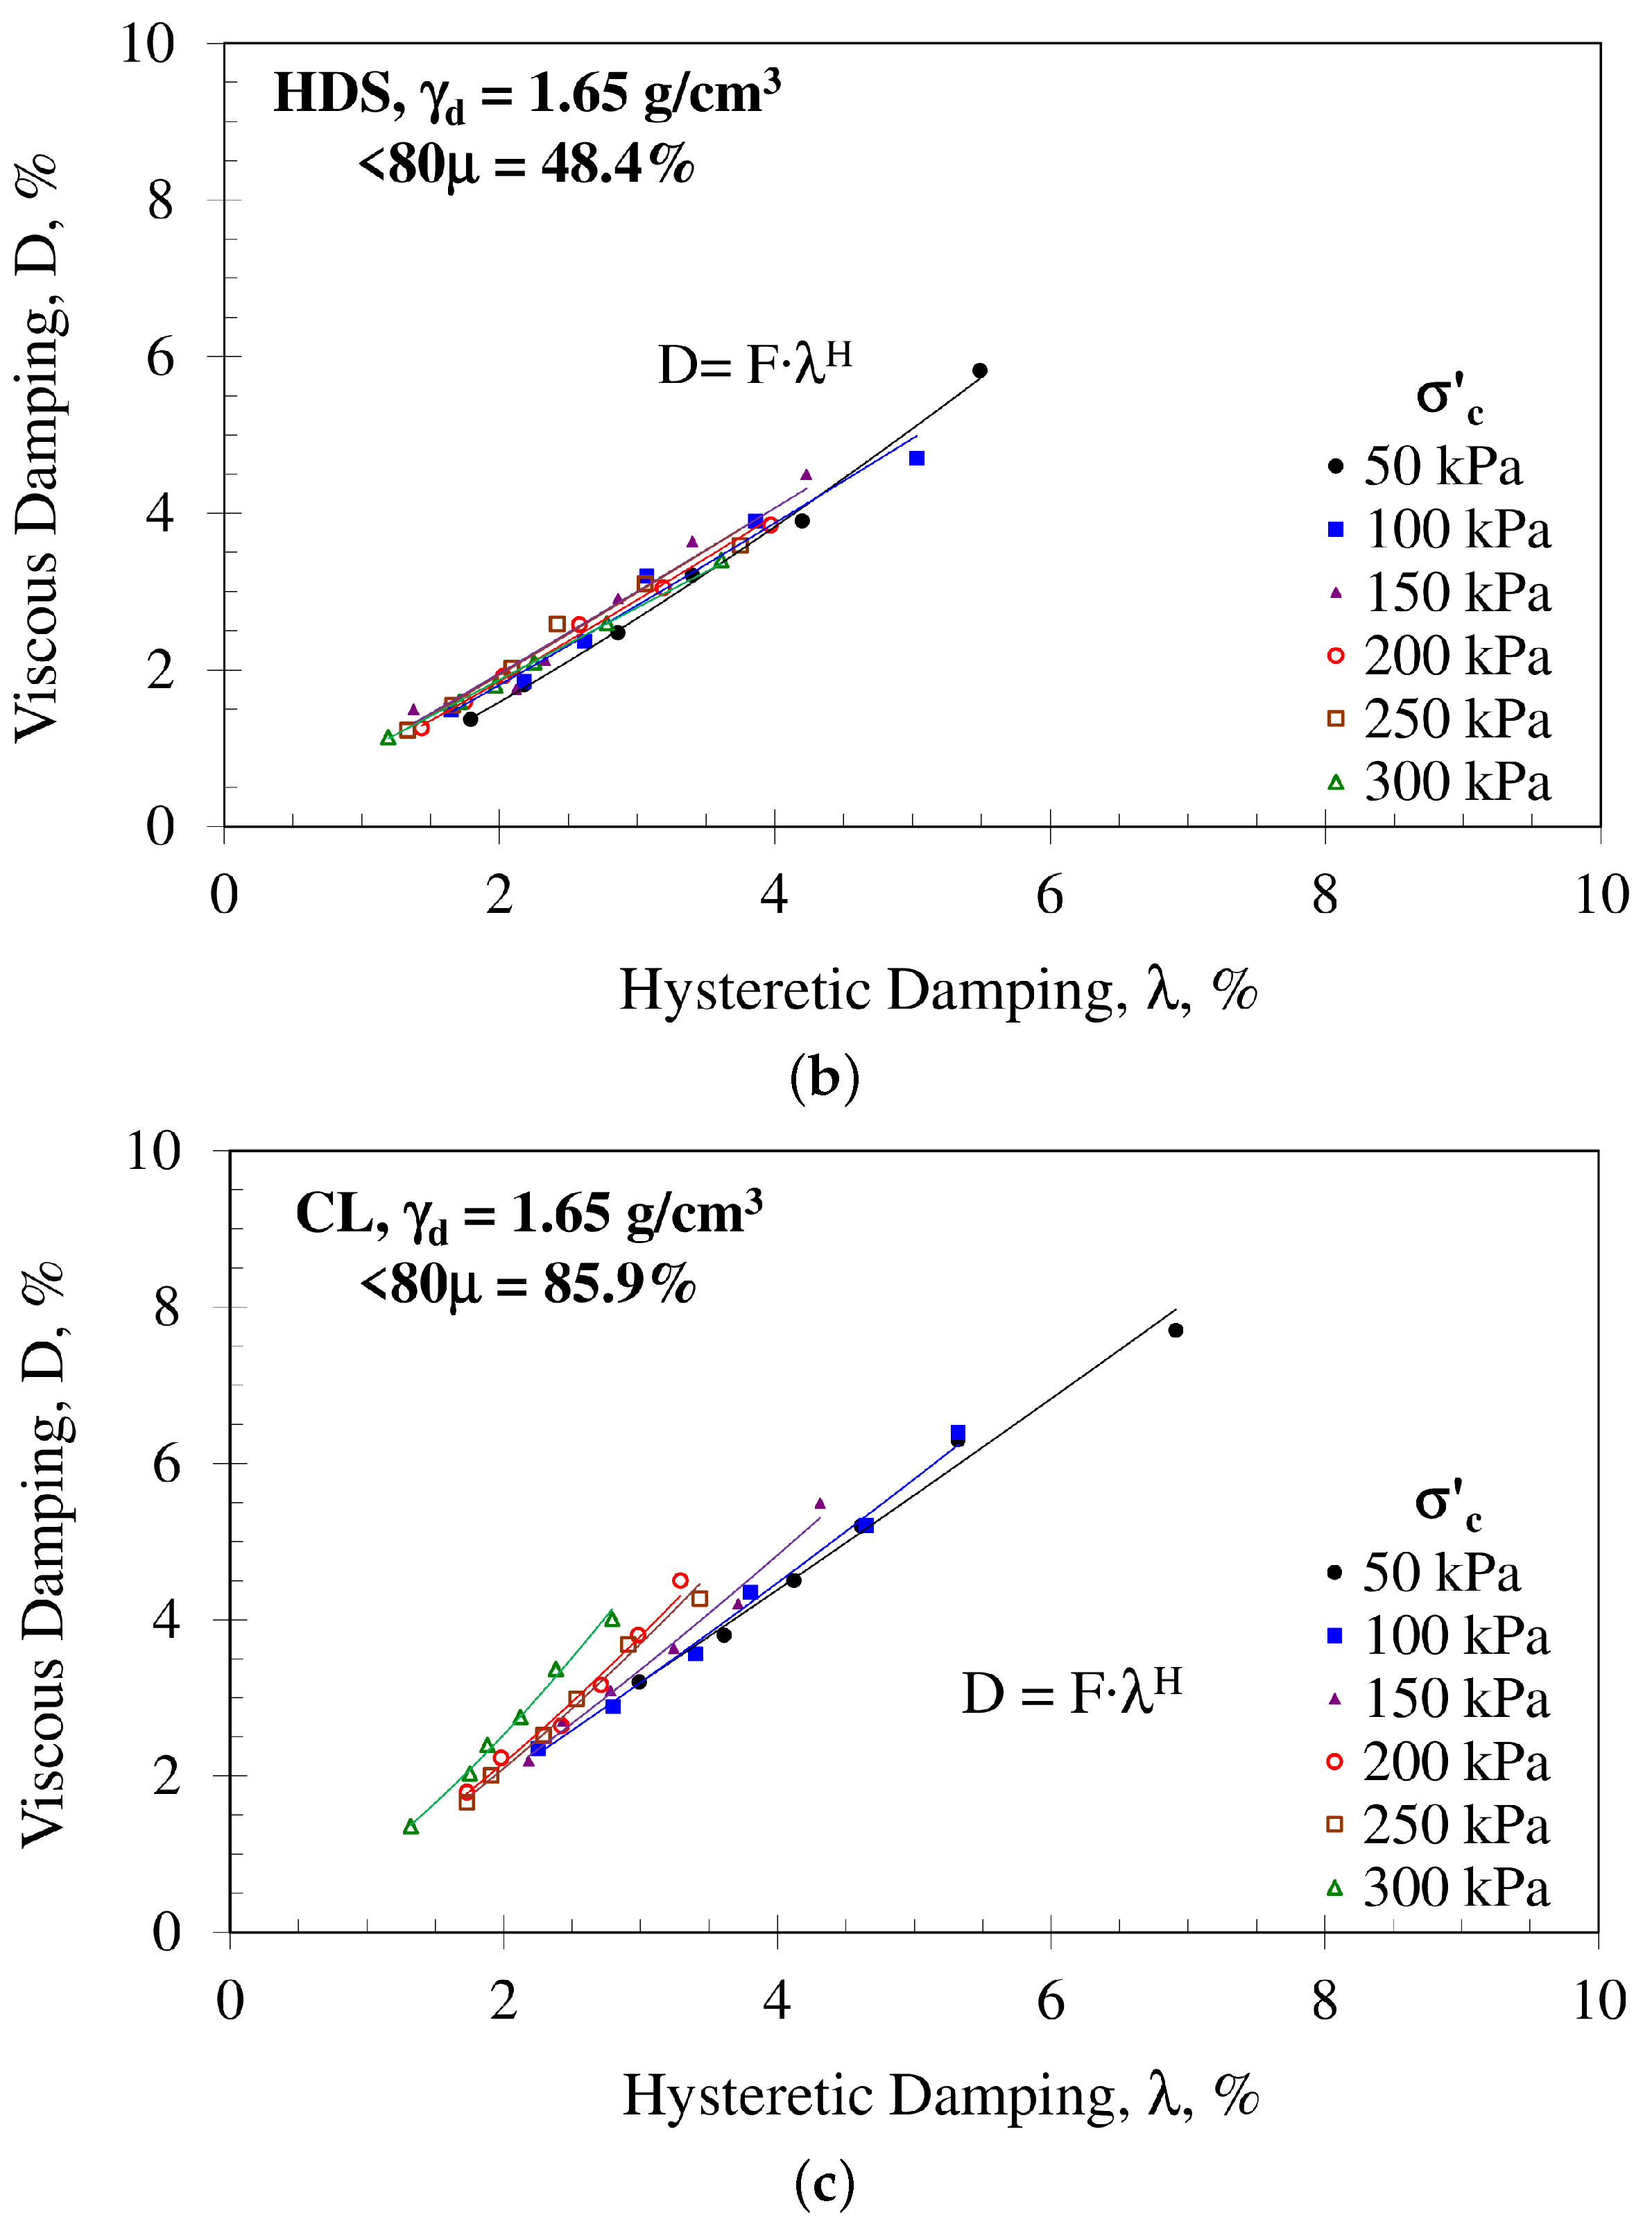
In addition to the empirical functions relating damping ratios to strain and effective consolidation pressure (Equations (9) and (13)), a key outcome of this study is the establishment of relationships between the two damping descriptors, D and λ . Figure 10 presents the variation in D as a function of λ for each material at different σ c values.
For modelling purposes, for each material and effective consolidation pressure level, the relationship may be approximated by:
D = F λ H
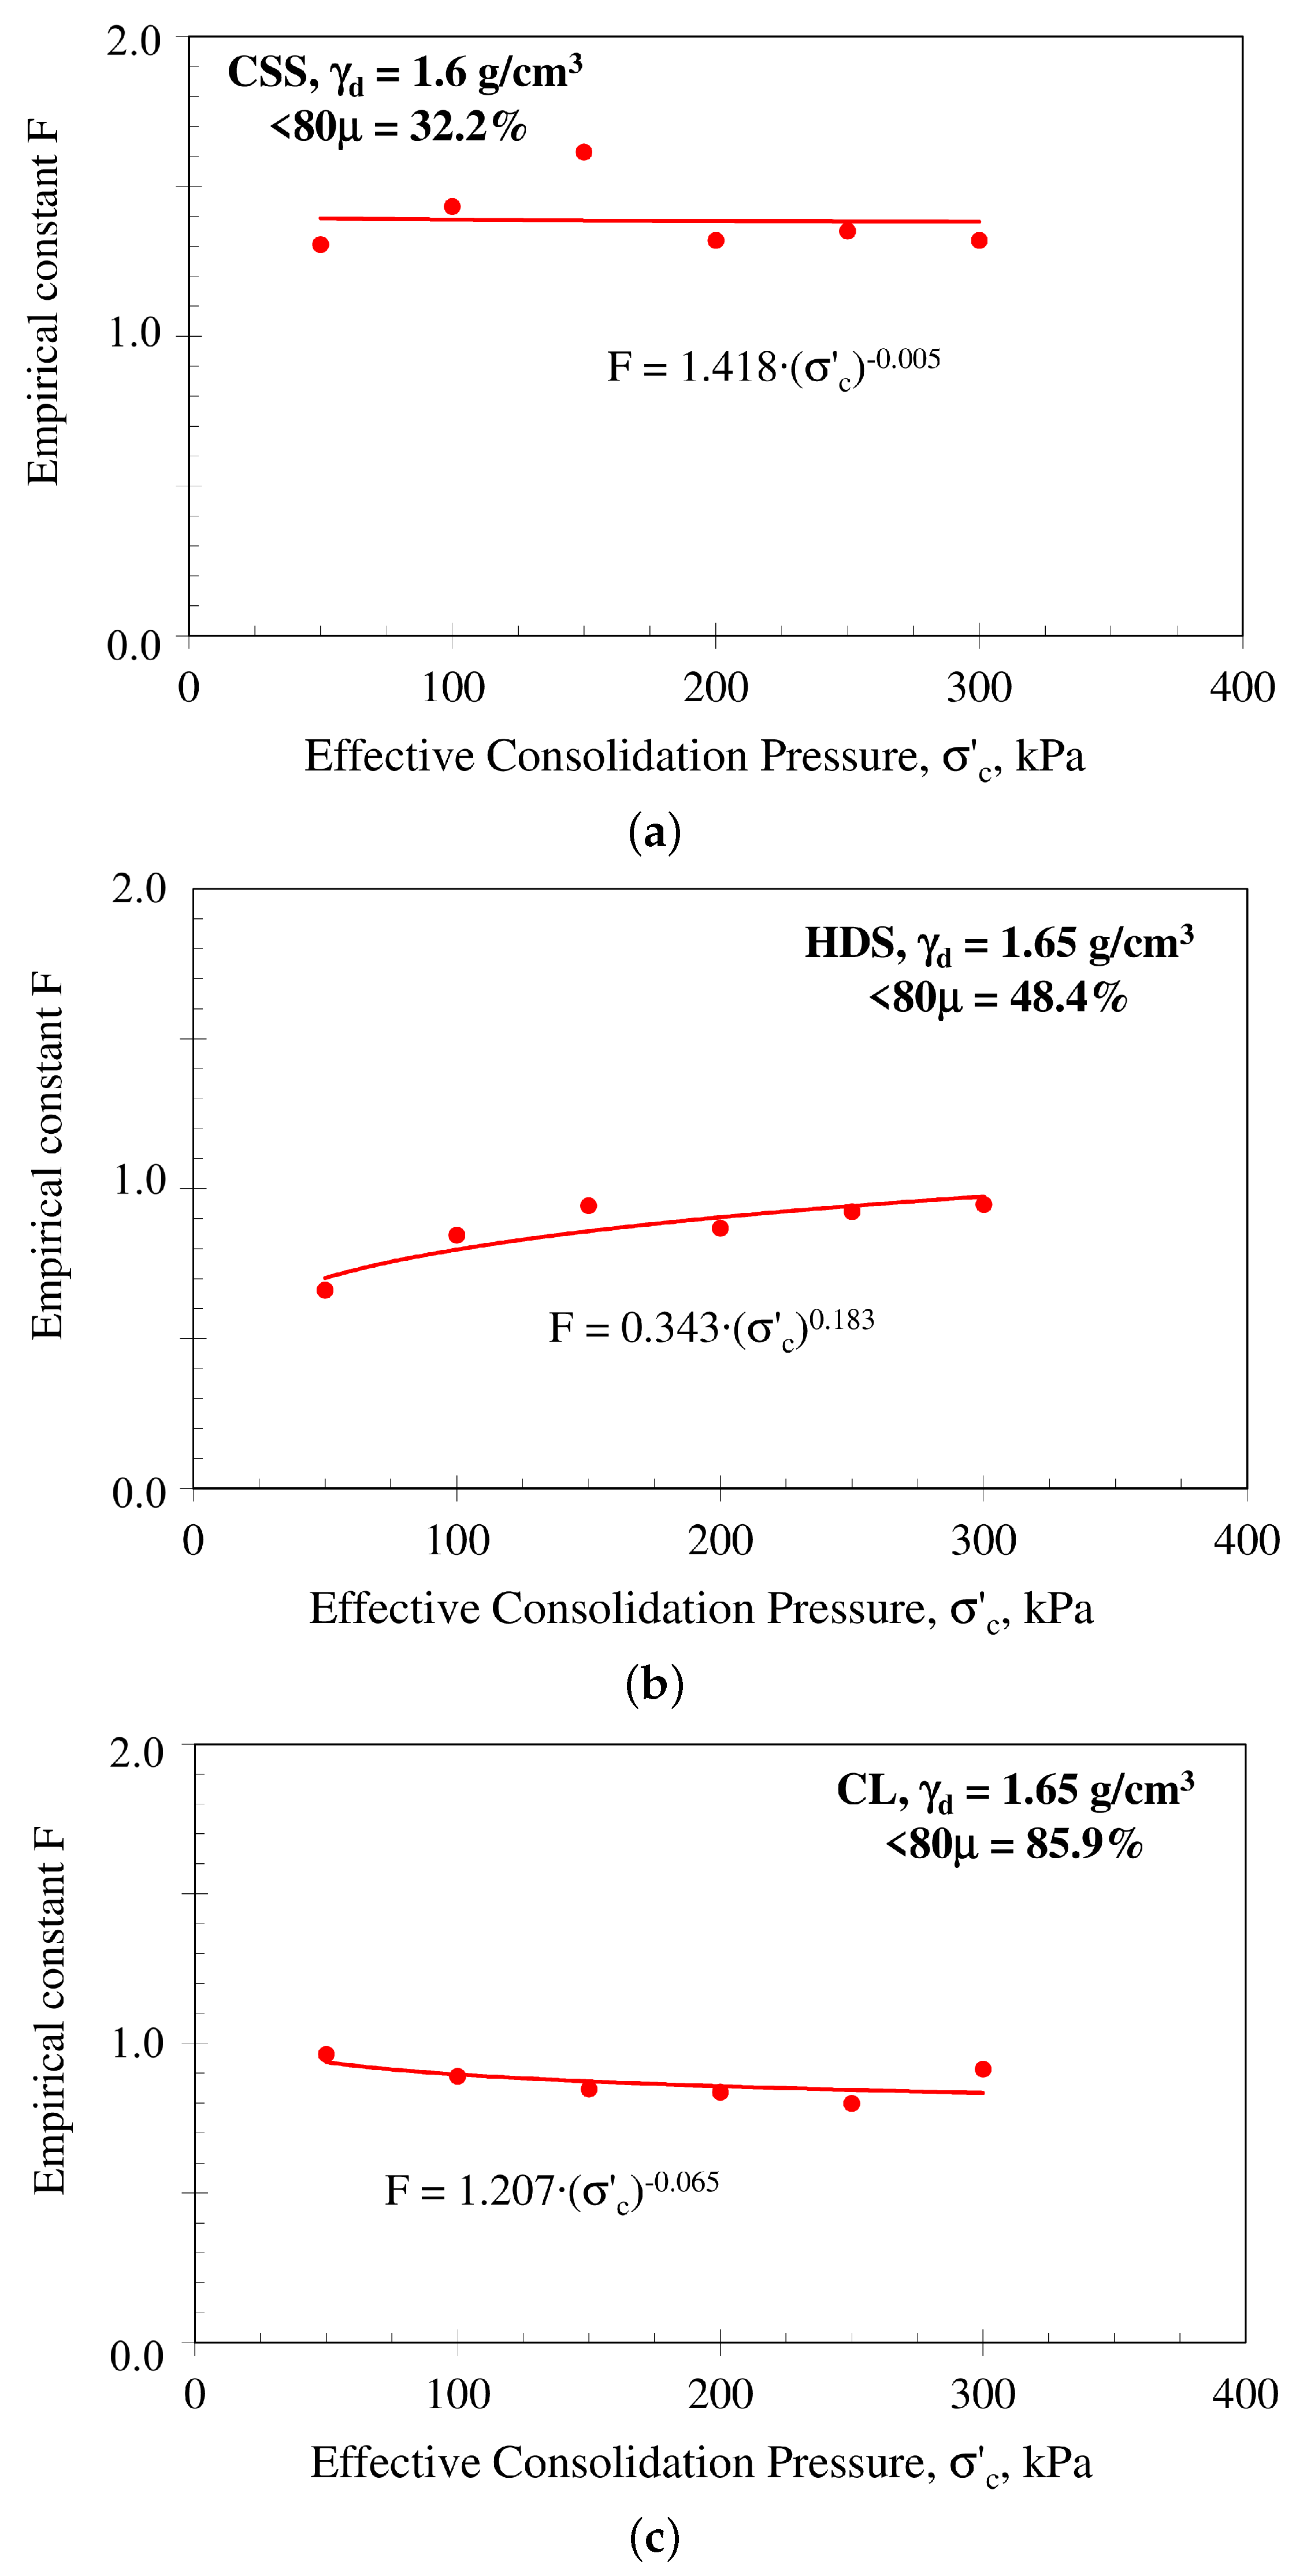
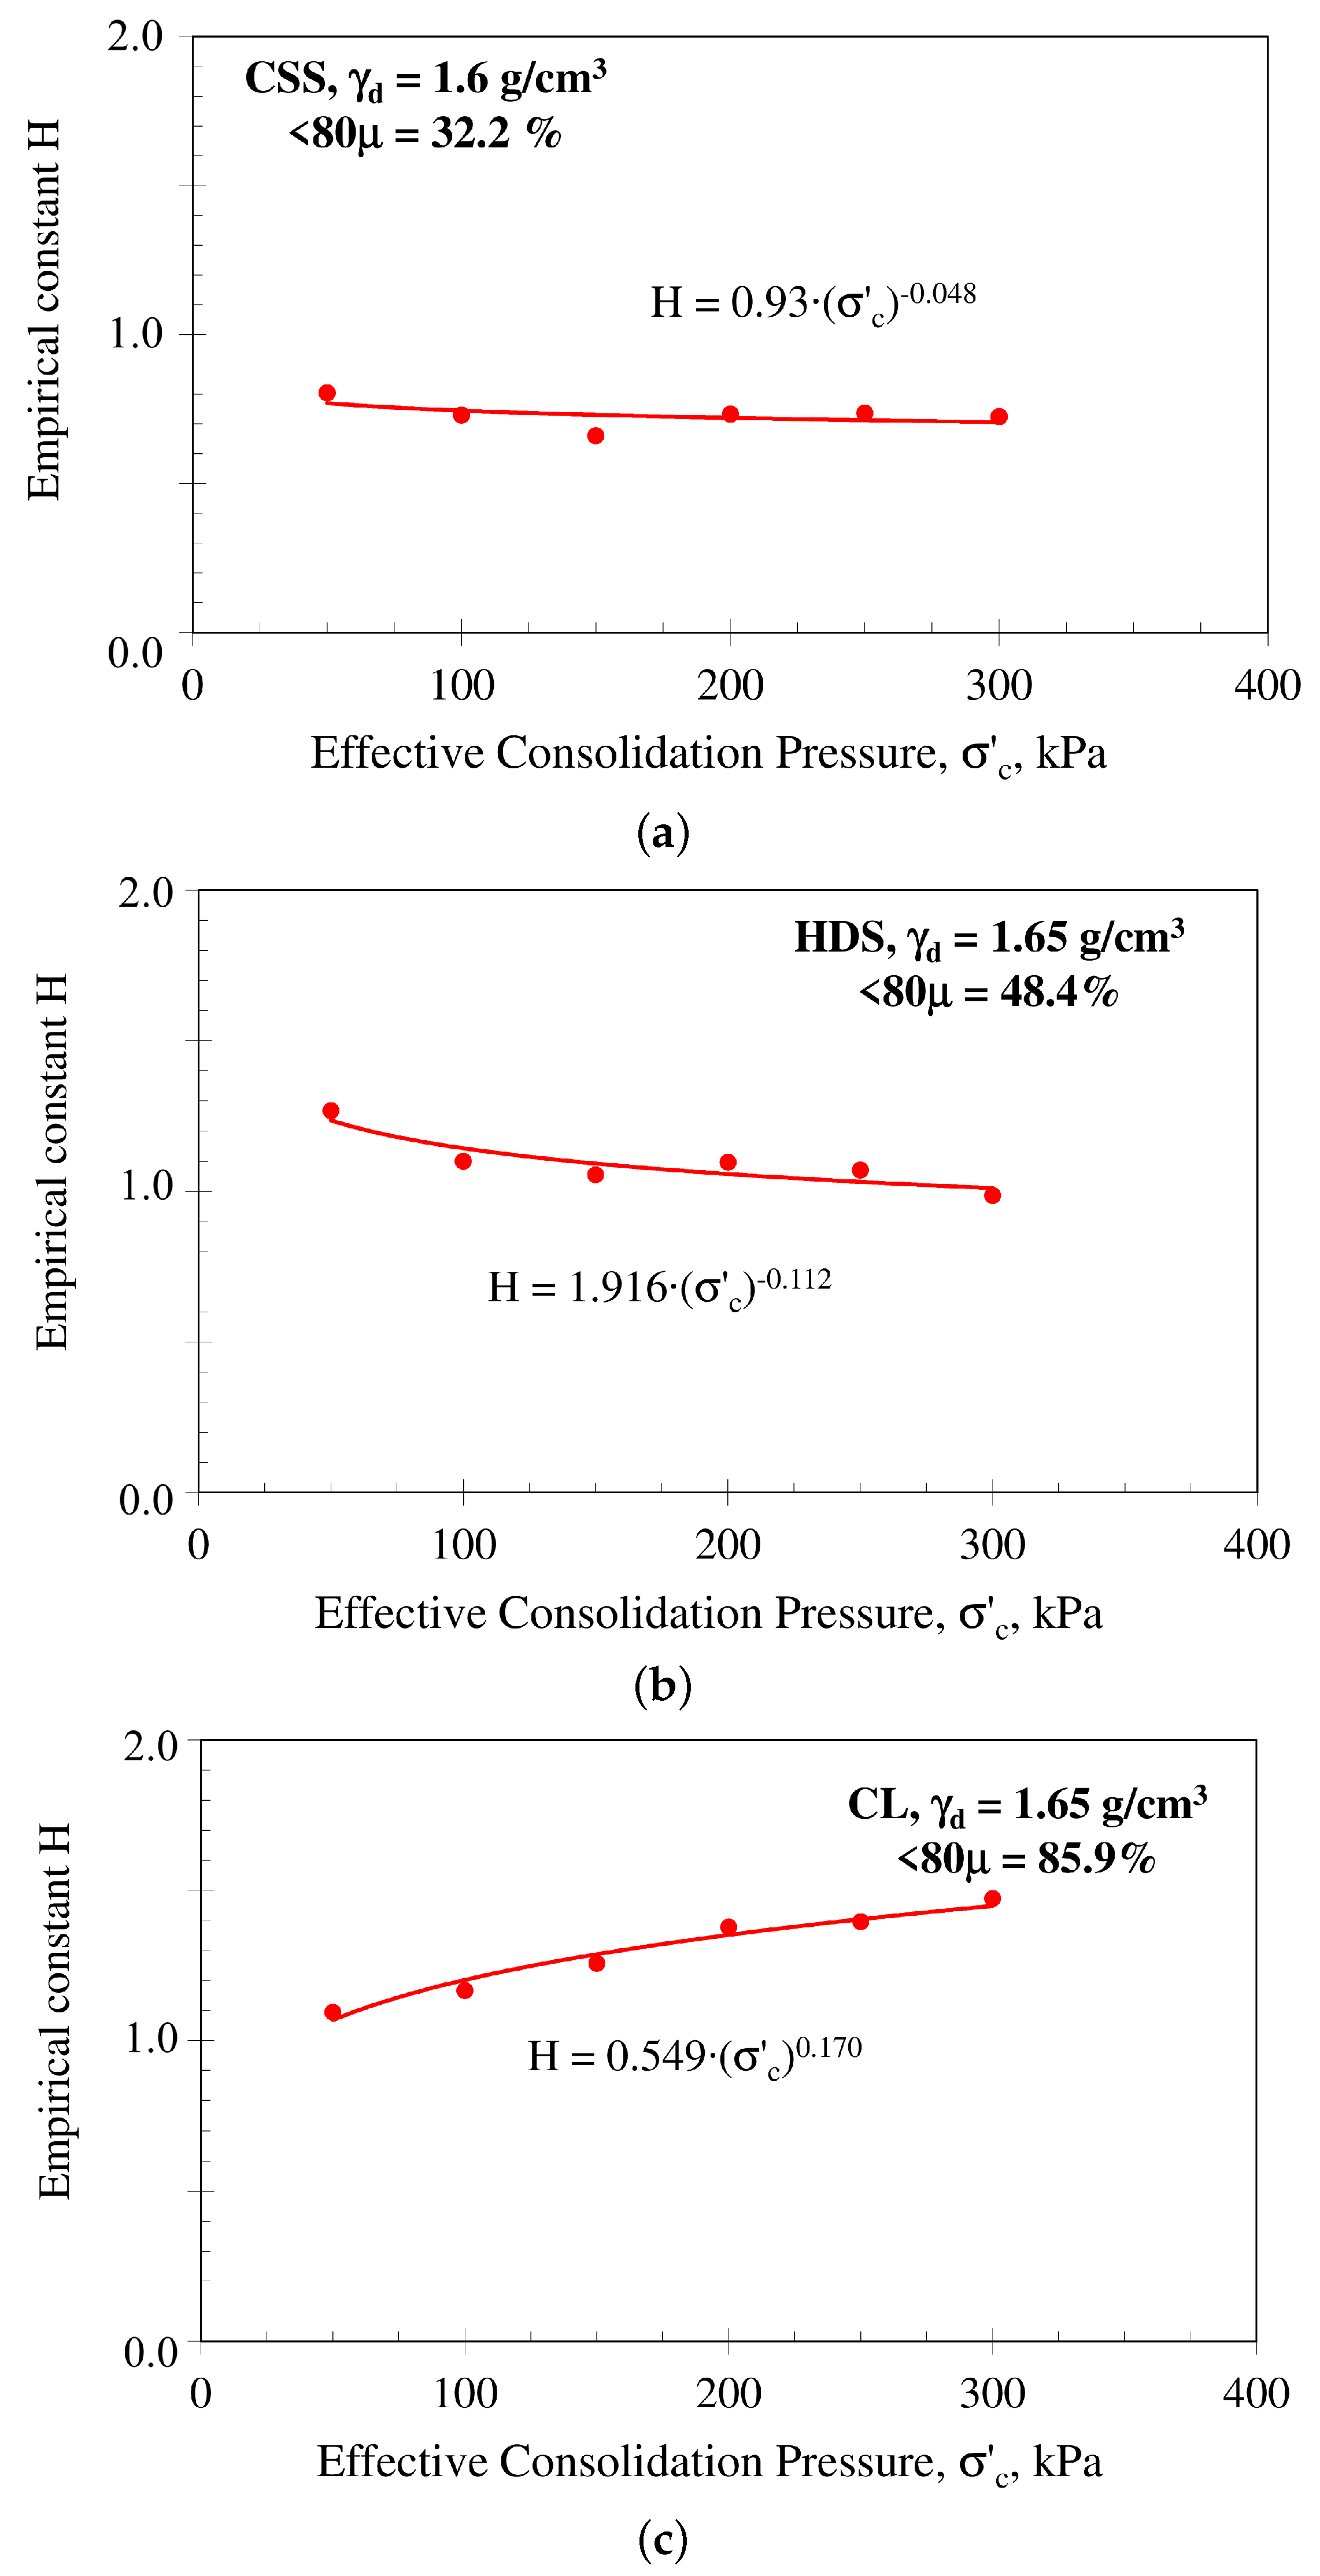
where F and H are empirical constants (Table 7). To generalise Equation (14), the parameters were related to effective consolidation pressure using:
F = Q ( σ c ) R
H = S ( σ c ) T
as shown in Figure 11 and Figure 12. Substituting Equations (15) and (16) into Equation (14) yields:
D = Q ( σ c ) R λ S ( σ c ) T
where Q, R, S and T are empirical constants (Table 8).
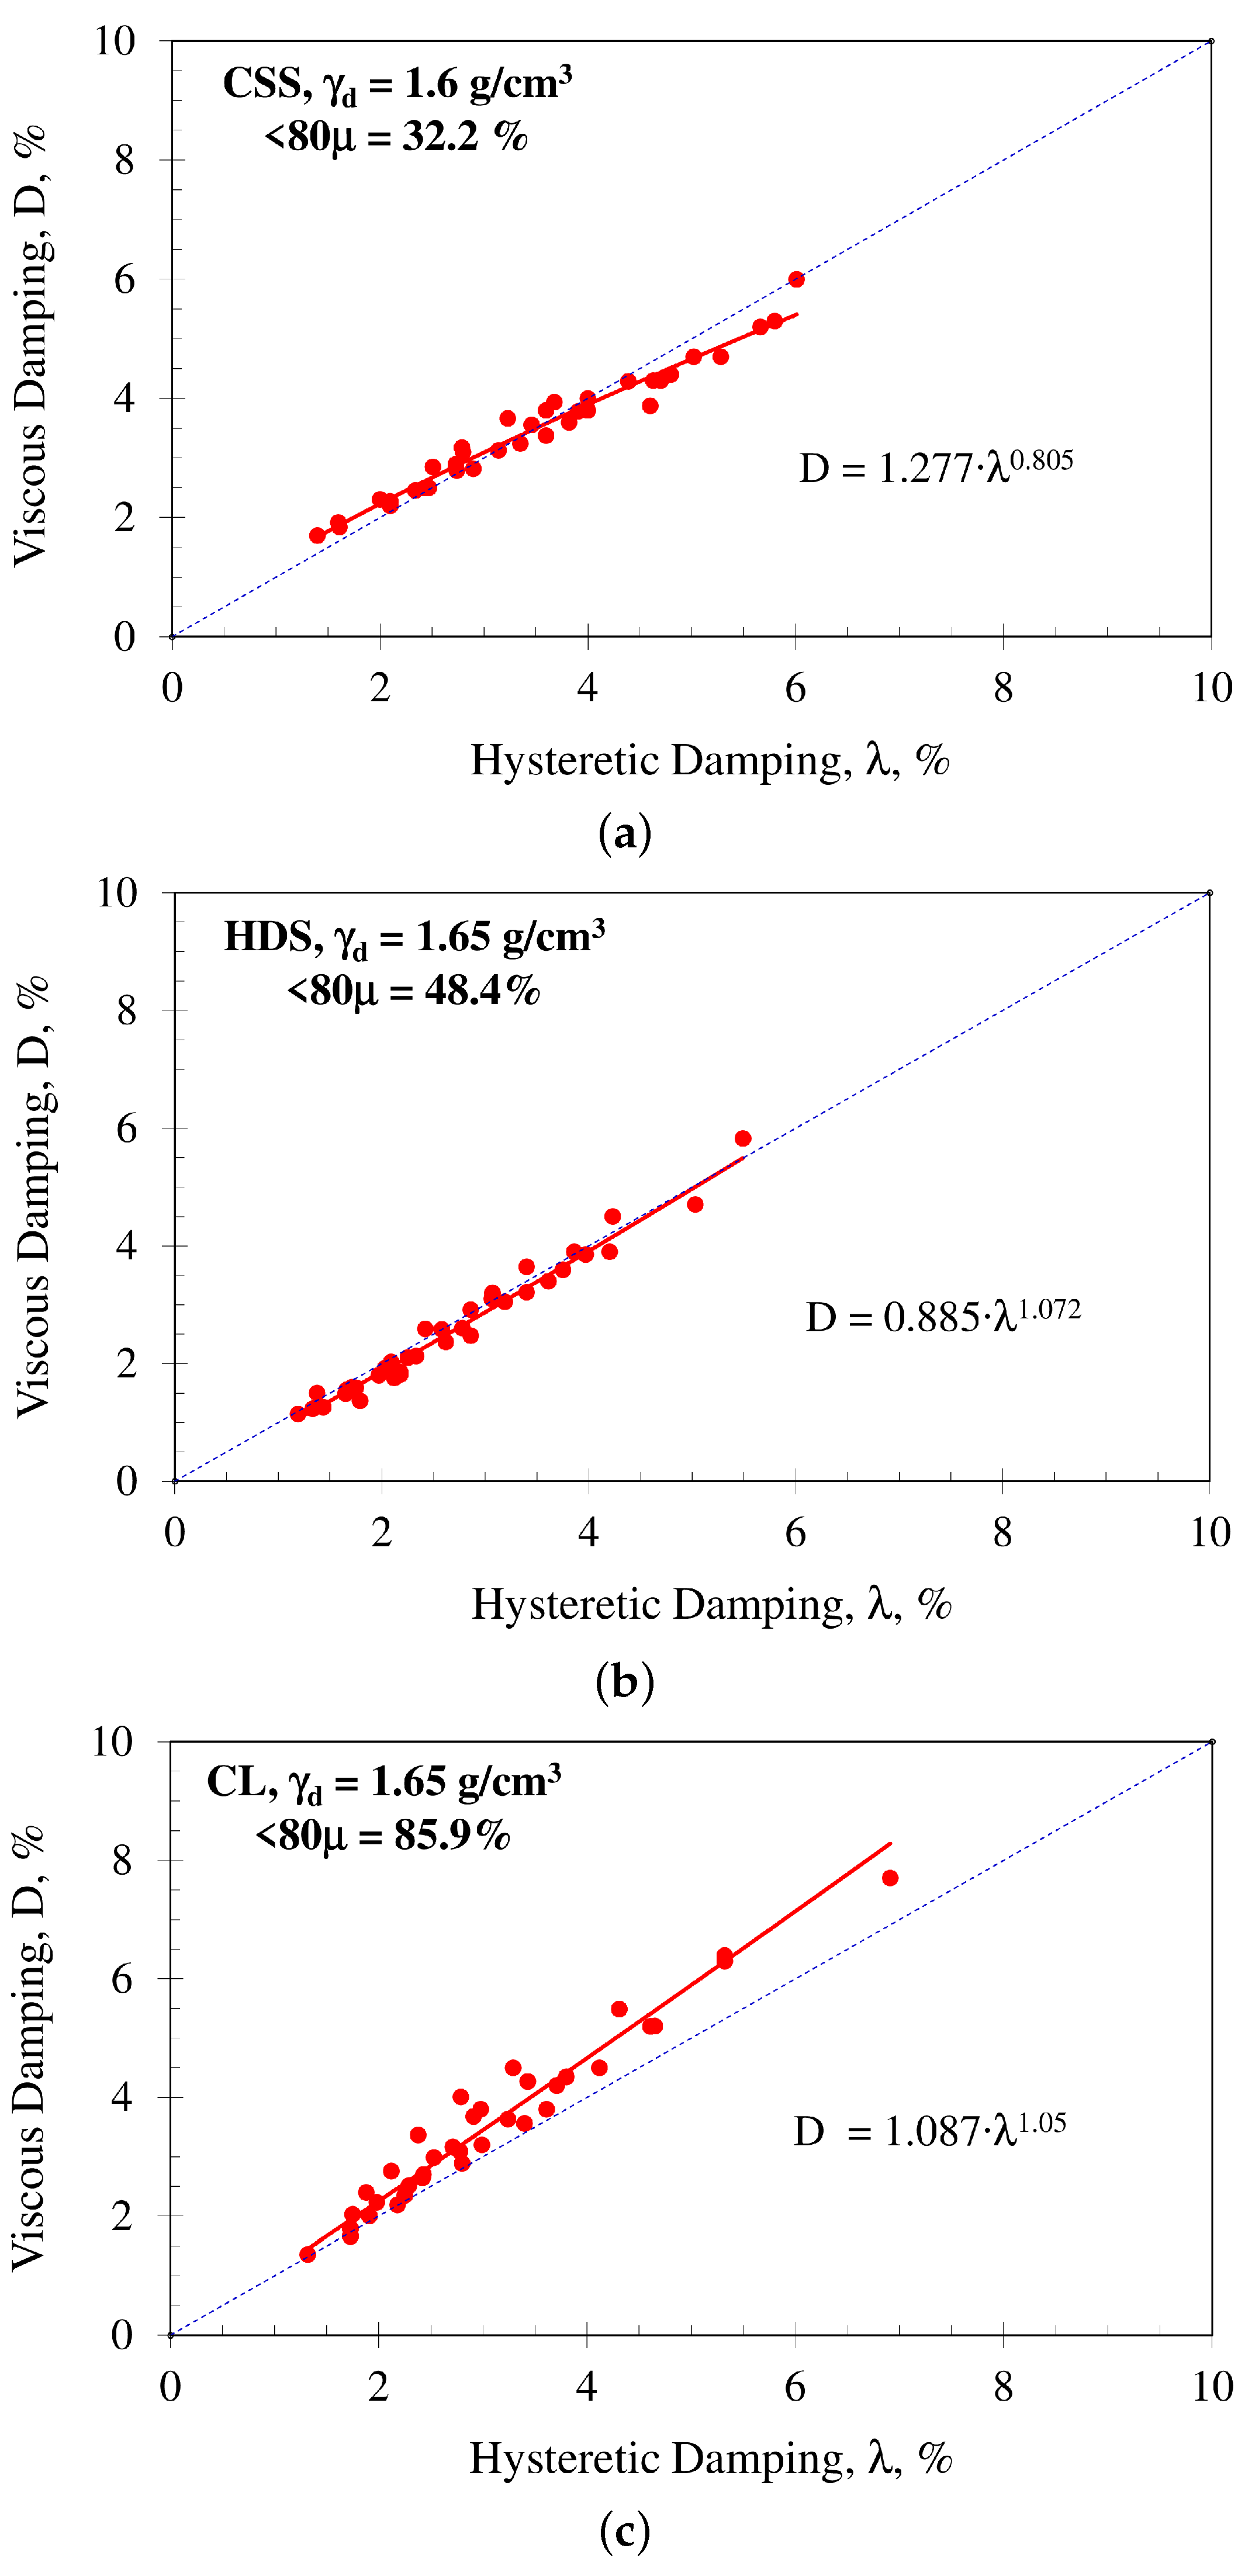
To maximise practical use of the experimental dataset, Figure 13 presents the overall D λ relationship for each material using all results, without discretisation by γ or σ c . This figure indicates that for the predominantly granular materials (i.e., CSS and HDS), D tends to be close to λ . For CSS, a small deviation is observed: for λ < 4 , D is slightly larger than λ , whereas for λ > 4 , D is slightly smaller. For practical purposes, D λ may be adopted for CSS and HDS within the tested ranges. For the tailings with plastic fines (CL), D is generally greater than λ .
Although Equation (17) explicitly accounts for the effect of σ c , the clustering of all results suggests that a simplified global relationship may be adopted:
D = U λ V
where U and V are empirical constants (Table 8). It should be noted that, in general, D depends not only on λ but also on γ and σ c ; however, the ( D , λ ) pairs occupy different regions of Figure 10 while still following the trend described by Equation (18).

3.4. Interpretation and Discussion of the Relationship Between Damping Estimation Methods

Beyond the empirical correlations established in this study, it is important to provide a physical interpretation of the observed relationships between hysteretic damping ( λ ) and viscous damping (D), particularly in light of the distinct behaviours exhibited by granular (CSS and HDS) and cohesive (CL) materials.
For the predominantly granular materials (CSS and HDS), the results indicate that D λ over most of the investigated strain and confinement ranges. This suggests that, under the tested conditions, the viscous damping obtained from free-vibration decay closely approximates the energy dissipated through hysteretic mechanisms during forced vibration. In clean or low-plasticity granular soils, energy dissipation is primarily governed by frictional sliding at particle contacts and minor rearrangement of the soil skeleton. These mechanisms are strain-dependent but exhibit limited time dependence over the frequency range considered (28–118 Hz). Consequently, the viscous damping derived from transient decay provides a consistent approximation of the energy loss per cycle.
In contrast, the cohesive material (CL), characterised by a significant proportion of phyllosilicates and measurable plasticity (PI = 7%), consistently exhibited D > λ . This behaviour may be attributed to the combined influence of interparticle bonding, physico-chemical interactions and internal viscous resistance within the clay matrix. These processes introduce additional time-dependent components into the material response, which are better captured by the free-vibration decay method. As a result, the viscous damping ratio tends to exceed the hysteretic damping estimated from the resonance curve.
The role of effective consolidation pressure further supports this interpretation. Increasing σ c leads to reduced damping in all materials, reflecting the stabilisation of the soil skeleton and the restriction of interparticle slip [14,18,26]. At higher confinement levels, contact stiffness increases and micro-sliding mechanisms become less pronounced, resulting in lower energy dissipation [16,24]. In cohesive material, higher confinement also reduces the contribution of fabric-related rearrangements, although time-dependent mechanisms remain active, which may explain the persistence of D > λ .
The frequency range employed in resonant column testing may also contribute to the observed differences. The forced-vibration response (Half-Power method) is determined at steady-state resonance, whereas the free-vibration decay method captures transient behaviour immediately after excitation removal [20]. If the material exhibits even moderate viscoelastic behaviour, the decay response may include additional damping contributions due to rate effects. This influence is expected to be more significant in materials with higher fines content and greater physico-chemical activity, such as CL.
From a microstructural perspective, the quartz-dominated CSS and HDS materials behave primarily as frictional granular assemblies, where damping is controlled by contact mechanics [24]. Conversely, the mineralogical composition of CL, which includes phyllosilicates and metallic minerals, promotes a more complex interaction network involving particle-to-particle bonding, internal shear within clay platelets and fluid-mediated dissipation. This structural difference provides a consistent explanation for the systematic deviation of CL results from the D = λ line.
Overall, the findings indicate that the equivalence between hysteretic and viscous damping in soils is not universal but depends on soil type, mineralogical composition and stress state. The proposed empirical relationships therefore provide not only practical predictive tools but also insight into the underlying mechanisms governing energy dissipation in different geomaterials.

4. Conclusions

This study investigated the damping ratio of three tailings materials obtained from the Riotinto mining district (Huelva, Spain), identified as Cerro Salomón Sand (CSS), High-Density Sludge (HDS) and Copper Lamas (CL), by comparing two experimental methods. The conclusions are supported by identification and classification tests, with 108 resonant column tests and 108 free-vibration decay tests performed under effective consolidation pressures ranging from 50 to 300 kPa.
The main findings of this research are summarised as follows:
  • CSS and HDS behave as predominantly granular, non-plastic materials with high fines content, whereas CL is classified as a low-plasticity clay. The three materials exhibit unusually high specific gravities due to the heavy minerals associated with the mining process.
  • For the three tailings materials, both the hysteretic damping ratio ( λ ) and viscous damping ratio (D) increase with increasing cyclic angular strain ( γ ), confirming the strong strain dependency of energy dissipation mechanisms.
  • At a given strain level, both λ and D decrease systematically with increasing effective consolidation pressure ( σ c ), indicating that confinement stabilises the soil skeleton and reduces interparticle energy dissipation.
  • The strain dependency of damping is more pronounced at lower confinement levels, suggesting that micro-sliding and structural rearrangement mechanisms are progressively inhibited as σ c increases.
  • Power-law relationships provide accurate representations of the variation of λ and D with γ for each confinement level. Furthermore, the empirical constants governing these expressions can themselves be expressed as functions of σ c , enabling generalised formulations that reproduce experimental behaviour over wide strain and stress ranges.
  • A key contribution of this research is the establishment of direct empirical relationships between viscous and hysteretic damping ratios. For the granular materials (CSS and HDS), D is approximately equal to λ within the investigated ranges, whereas for the cohesive material (CL), D is generally greater than λ . This distinction reflects the different energy dissipation mechanisms governing granular and cohesive soils.
  • The simplified potential-type relationship D = U λ V provides a practical and robust approximation of the interaction between the two damping descriptors. Although both D and λ depend on γ and σ c , the ( D , λ ) pairs follow a consistent mathematical trend, allowing direct estimation of one parameter from the other for the materials studied.
  • The proposed empirical formulations reproduce the experimental results with good accuracy and may significantly reduce the number of laboratory tests required for characterisation. In practical terms, reliable damping estimates can be obtained using a limited number of torsional excitation levels and effective consolidation pressures.
  • From an engineering perspective, the methodology presented herein provides a rational and simplified framework for incorporating damping behaviour into numerical simulations and dynamic analyses, particularly when distinguishing between two experimental methods.
Overall, the results demonstrate that the relationship between viscous and hysteretic damping in soils is soil-type-dependent and influenced by stress state and strain level. The proposed empirical functions offer both practical predictive capability and insight into the mechanisms governing energy dissipation in mining tailings materials. The findings presented here are based on small to medium strain levels typical of resonant column testing; additional studies at larger strains are necessary to explore other conditions and enhance these results.

Author Contributions

Conceptualisation, H.P.; methodology, H.P.; software, H.P. and R.Á.G.-A.; validation, R.Á.G.-A. and F.M.-G.; formal analysis, H.P., R.Á.G.-A. and F.M.-G.; investigation, H.P.; resources, H.P.; data curation, H.P.; writing—original draft preparation, H.P.; writing—review and editing, R.Á.G.-A. and F.M.-G.; visualisation, R.Á.G.-A. and F.M.-G.; supervision, R.Á.G.-A. and F.M.-G.; project administration, H.P.; funding acquisition, H.P. All authors have read and agreed to the published version of the manuscript.

Funding

This publication is part of the project PID2022-139202OB-I00, Neural networks and optimization techniques for the safe design and maintenance of transport infrastructure: volcanic rock geotechnics and Slope Stability (IA-Pyroslope), funded by the State Research Agency of the Ministry of Science, Innovation and Universities and the European Regional Development Fund, MCIN/AEI/10.13039/501100011033/ERDF, EU.

Data Availability Statement

Data generated or analysed during this study are available from the corresponding author upon reasonable request.

Acknowledgments

The authors would like to express their gratitude to the José Entrecanales Ibarra Foundation for donating the essential equipment for this research, particularly the resonant column. The support of EPTISA Engineering Services for sponsoring the research through an agreement with the Agustín de Betancourt Foundation is also acknowledged. Additionally, they are grateful to the UPM for its unwavering support of experimental research, especially to the late Antonio Soriano.

Conflicts of Interest

The authors declare no conflicts of interest.

References

  1. Hardin, B.O.; Drnevich, V.P. Shear modulus and damping in soils: Measurement and parameter effects. J. Soil Mech. Found. Div. ASCE 1972, 98, 603–624. [Google Scholar] [CrossRef] [Scilit]
  2. Hardin, B.O.; Drnevich, V.P. Shear modulus and damping in soils: Design equations and curves. J. Soil Mech. Found. Div. ASCE 1972, 98, 667–692. [Google Scholar] [CrossRef] [Scilit]
  3. Seed, H.B.; Idriss, I.M. Soil Moduli and Damping Factors for Dynamic Response Analyses; Report EERC 70-10; University of California: Berkele, CA, USA, 1970. [Google Scholar]
  4. Vucetic, M.; Dobry, R. Effect of soil plasticity on cyclic response. J. Geotech. Eng. 1991, 117, 89–107. [Google Scholar] [CrossRef] [Scilit]
  5. Vucetic, M.; Lanzo, G.; Doroudian, M. Damping at Small Strains in Cyclic Simple Shear Test. J. Geotech. Geoenviron. Eng. 1998, 124, 585–594. [Google Scholar] [CrossRef] [Scilit]
  6. Zergoun, M.; Vaid, Y.P. Effective stress response of clay to undrained cyclic loading. Can. Geotech. J. 1994, 31, 714–727. [Google Scholar] [CrossRef] [Scilit]
  7. Brennan, A.J.; Thusyanthan, N.I.; Madabhushi, S.P.G. Evaluation of shear modulus and damping in dynamic centrifuge test. J. Geotech. Geoenviron. Eng. 2005, 131, 1488–1498. [Google Scholar] [CrossRef] [Scilit]
  8. Soriano, A.; Patiño, H.; González, J.; Valderrama, M. Cyclic behaviour of saturated sands subject to previous horizontal shear stresses. In Proceedings of the 15th European Conference on Soil Mechanics and Geotechnical Engineering, Athens, Greece, 14 September 2011; IOS Press: Amsterdam, The Netherlands, 2011. [Google Scholar] [CrossRef] [Scilit]
  9. Patiño, H.; Galindo, R. Damping of a soft marine clay subjected to the combination of monotonic and cyclic shear stresses. Eur. J. Environ. Civ. Eng. 2021, 27, 72–95. [Google Scholar] [CrossRef] [Scilit]
  10. Kuribayashi, E.; Iwasaki, T.; Tatsuoka, F. Effects of stress-strain conditions on dynamic properties of sands. Proc. JSCE 1975, 242, 105–114. [Google Scholar] [CrossRef] [Scilit]
  11. Senetakis, K.; Anastasiadis, A.; Pitilakis, K. The Small-Strain Shear Modulus and Damping Ratio of Quartz and Volcanic Sands. Geotech. Test. J. 2012, 35, 20120073. [Google Scholar] [CrossRef] [Scilit]
  12. Zhang, J.; Andrus, R.D.; Juang, C.H. Normalized shear modulus and material damping ratio relationships. J. Geotech. Geoenviron. Eng. 2005, 131, 453–464. [Google Scholar] [CrossRef] [Scilit]
  13. Wichtmann, T.; Triantafyllidis, T. Effect of Uniformity Coefficient on G/Gmax and Damping Ratio of Uniform to Well-Graded Quartz Sands. J. Geotech. Geoenviron. Eng. 2013, 139, 59–72. [Google Scholar] [CrossRef] [Scilit]
  14. Ham, A.; Wang, J.; Stammer, J.G. Relationships between Particle Shape Characteristics and Macroscopic Damping in Dry Sands. J. Geotech. Geoenviron. Eng. 2012, 138, 1002–1011. [Google Scholar] [CrossRef] [Scilit]
  15. Madhusudhan, B.N.; Kumar, J. Damping of Sands for Varying Saturation. J. Geotech. Geoenviron. Eng. 2013, 139, 107–116. [Google Scholar] [CrossRef] [Scilit]
  16. Subramaniam, P.; Banerjee, S.; Ku, T. Shear Modulus and Damping Ratio Model for Cement Treated Clay. Int. J. Geomech. 2019, 19, 06019010. [Google Scholar] [CrossRef] [Scilit]
  17. Rollins, K.M.; Singh, M.; Roy, J. Simplified Equations for Shear-Modulus Degradation and Damping of Gravels. J. Geotech. Geoenviron. Eng. 2020, 146, 04020076. [Google Scholar] [CrossRef] [Scilit]
  18. Molina-Gómez, F.; Viana da Fonseca, A.; Ferreira, C.; Camacho-Tauta, J. Dynamic properties of two historically liquefiable sands in the Lisbon area. Soil Dyn. Earthq. Eng. 2020, 132, 106101. [Google Scholar] [CrossRef] [Scilit]
  19. Patiño, H.; Molina-Gómez, F.; Galindo, R.; Viana da Fonseca, A. Integrated evaluation of stiffness degradation by combining Resonant-Column, Cyclic Triaxial and Cyclic Simple Shear Tests: Application to Riotinto mine tailings. Geomech. Energy Environ. 2025, 41, 100652. [Google Scholar] [CrossRef] [Scilit]
  20. Schaeffer, K.; Bearce, R.; Wang, J. Dynamic Modulus and Damping Ratio Measurements from Free-Free Resonance and Fixed-Free. Geotech. Geoenviron. Eng. 2013, 139, 2145–2155. [Google Scholar] [CrossRef] [Scilit]
  21. Senetakis, K.; Anastasiadis, A.; Pitilakis, K. A comparison of material damping measurements in resonant column using the steady-state and free-vibration decay methods. Soil Dyn. Earthq. Eng. 2015, 74, 10–13. [Google Scholar] [CrossRef] [Scilit]
  22. Xu, Z.; Tao, Y.; Hernandez, L. Novel methods for the computation of small-strain damping ratios of soils from cyclic torsional shear and free-vibration decay testing. Geotechnics 2021, 1, 330–346. [Google Scholar] [CrossRef] [Scilit]
  23. Mog, K.; Anbazhagan, P. Evaluation of the damping ratio of soils in a resonant column using different methods. Soils Found. 2022, 62, 101091. [Google Scholar] [CrossRef] [Scilit]
  24. Patiño, H.; Molina-Gómez, F.; Galindo, R.; Viana da Fonseca, A. Stiffness degradation of non-plastic copper ore tailings. GéOtechnique Lett. 2025, 15, 219–225. [Google Scholar] [CrossRef] [Scilit]
  25. Lade, P.V. Triaxial Testing of Soils, 1st ed.; John Wiley & Sons, Ltd.: Chichester, UK, 2016. [Google Scholar]
  26. Caicedo, B.; Chaparro, M.J.; Castillo Betancourt, J.P.; Cabrera, M.A.; Delage, P.; LognonnÉ, P.H.; Banerdt, B. A micromechanical model for estimating the shear modulus and damping ratio of loose sands under low stresses: Application to a Mars regolith simulant. Géotechnique 2025, 75, 379–392. [Google Scholar] [CrossRef] [Scilit]
Figure 1. Location of Riotinto mines (adapted from [19]).
Geosciences 16 00173 g001
Figure 2. Photograph of the resonant -column apparatus of UPM.
Geosciences 16 00173 g002
Figure 3. Methods to estimate the damping ratio: (a) Half-Power; (b) free-vibration decay.
Geosciences 16 00173 g003
Figure 4. Variation trends in the damping ratio by the H-PB method as a function of the angular strain, for different effective consolidation pressures: (a) CSS tailing; (b) HDS tailing; (c) CL tailing.
Geosciences 16 00173 g004
Figure 5. Variation trends in the empirical constant A with the confinement: (a) CSS tailing; (b) HDS tailing; (c) CL tailing.
Geosciences 16 00173 g005aGeosciences 16 00173 g005b
Figure 6. Variation trends in the empirical constant B with the confinement: (a) CSS tailing; (b) HDS tailing; (c) CL tailing.
Geosciences 16 00173 g006
Figure 7. Variation trends in the damping ratio by the F-VD method as a function of the angular strain, for different effective consolidation pressures: (a) CSS tailing; (b) HDS tailing; (c) CL tailing.
Geosciences 16 00173 g007aGeosciences 16 00173 g007b
Figure 8. Variation trends in the empirical constant C with the confinement: (a) CSS tailing; (b) HDS tailing; (c) CL tailing.
Geosciences 16 00173 g008aGeosciences 16 00173 g008b
Figure 9. Variation trends in the empirical constant E with the confinement: (a) CSS tailing; (b) HDS tailing; (c) CL tailing.
Geosciences 16 00173 g009aGeosciences 16 00173 g009b
Figure 10. Variation between λ and D under different effective consolidation pressure: (a) CSS tailing; (b) HDS tailing; (c) CL tailing.
Geosciences 16 00173 g010aGeosciences 16 00173 g010b
Figure 11. Variation trends in the empirical constant F with the confinement: (a) CSS tailing; (b) HDS tailing; (c) CL tailing.
Geosciences 16 00173 g011
Figure 12. Variation trends in the empirical constant H with the confinement: (a) CSS tailing; (b) HDS tailing; (c) CL tailing.
Geosciences 16 00173 g012
Figure 13. Variation trends between λ and D: (a) CSS tailing; (b) HDS tailing; (c) CL tailing.
Geosciences 16 00173 g013
Table 1. Index properties of the materials tested.
MaterialIn SituPreparation<80 μmLLPLPISpecific γ d
Moisture (%)Moisture (%)(%)(%)(%)(%)Gravity(g/cm3)
CSS8.18.132.7NP3.021.60
HDS14.37.848.5NP2.991.65
CL38.525.085.926.919.972.831.65
Table 2. Mineralogical composition of the materials (%) [24].
Mineral Phase CSSHDSCL
Quartz 928223
PhyllosilicatesChlorites0050
Micas8617
Metallic mineralsPyrite009
Jarosite0120
Table 3. General conditions for damping assessment by H-PB and F-VD methods.
σ c (kPa) B p (kPa) σ c (kPa)Te (V)
450400500.025, 0.05, 0.1, 0.2, 0.4, 0.8
5004001000.025, 0.05, 0.1, 0.2, 0.4, 0.8
5504001500.025, 0.05, 0.1, 0.2, 0.4, 0.8
6004002000.025, 0.05, 0.1, 0.2, 0.4, 0.8
6504002500.025, 0.05, 0.1, 0.2, 0.4, 0.8
7004003000.025, 0.05, 0.1, 0.2, 0.4, 0.8
Table 4. Overview of the test results.
CSSHDSCL
σ c Te f r γ λ D f r γ λ D f r γ λ D
(kPa)(V)(Hz)(%)(%)(%)(Hz)(%)(%)(%)(Hz)(%)(%)(%)
500.02550.080.0043.603.8087.200.0041.791.3754.990.0062.993.20
500.05050.020.0084.004.0084.330.0062.181.8153.120.0103.613.80
500.10047.100.0174.704.3081.000.0092.862.4748.690.0184.124.50
500.20043.550.0335.284.7077.770.0143.403.2145.330.0314.615.20
500.40038.700.0655.805.3069.590.0234.203.9039.090.0585.326.30
500.80027.200.1486.016.0055.970.0485.495.8329.710.1406.917.70
1000.02564.620.0032.803.1091.200.0031.651.4966.790.0032.252.35
1000.05061.020.0063.463.5691.270.0052.181.8565.910.0062.802.89
1000.10058.310.0114.003.8087.070.0092.622.3764.070.0113.403.56
1000.20052.470.0244.634.3084.090.0143.073.2059.900.0213.804.35
1000.40047.790.0485.024.7077.660.0223.863.9054.200.0384.655.20
1000.80040.070.0965.665.2067.910.0395.034.7046.600.0765.326.40
1500.02571.900.0042.512.8599.760.0031.381.5083.230.0032.182.19
1500.05069.700.0082.793.1897.600.0052.121.7681.290.0062.432.70
1500.10067.300.0133.233.6796.500.0082.332.1279.990.0102.783.09
1500.20063.900.0223.683.9492.200.0132.862.9176.200.0163.243.63
1500.40059.500.0384.394.2986.020.0213.403.6470.710.0253.714.20
1500.80052.200.0644.804.4077.100.0354.234.5061.610.0564.315.49
2000.02576.750.0042.102.20107.880.0031.441.2692.240.0031.731.79
2000.05077.120.0082.472.50106.000.0051.751.5990.430.0061.982.23
2000.10074.920.0132.732.90105.000.0082.031.9287.800.0092.422.65
2000.20071.600.0223.143.13100.210.0132.582.5885.900.0162.713.16
2000.40067.330.0373.823.6094.320.0203.193.0580.850.0262.983.80
2000.80061.930.0624.603.8886.030.0333.973.8573.770.0433.294.50
2500.02584.620.0041.601.92113.120.0031.331.23100.220.0031.731.66
2500.05082.300.0072.002.31112.000.0051.661.5597.620.0051.912.00
2500.10081.200.0132.342.46110.000.0082.092.0294.900.0092.292.52
2500.20078.300.0222.742.79106.000.0122.422.5993.100.0152.532.99
2500.40074.500.0363.353.24100.190.0193.063.1088.100.0252.913.68
2500.80069.000.0583.913.7892.200.0313.753.5981.330.0413.434.27
3000.02588.770.0041.401.70118.330.0031.191.15107.880.0031.321.36
3000.05089.600.0071.611.84117.000.0051.711.60106.790.0051.752.03
3000.10087.500.0122.102.27115.410.0071.971.80104.000.0091.882.40
3000.20086.000.0212.432.50111.890.0112.252.10102.000.0152.122.76
3000.40082.000.0342.902.82105.790.0182.782.6097.200.0242.383.37
3000.80075.880.0503.603.3898.550.0283.613.4090.680.0352.794.01
Table 5. Empirical constants of Equations (6) and (10).
CSSHDSCL
σ c
(kPa)
A B C E A B C E A B C E
508.480.157.490.1322.430.4534.190.5711.200.2513.590.28
1009.220.207.320.1421.390.4524.930.4910.380.2513.680.30
1509.570.257.220.1719.380.4423.770.499.200.2513.910.32
2009.820.297.150.2117.950.4420.680.497.590.2613.980.36
2509.610.327.110.2417.530.4417.530.446.580.2614.100.37
30010.270.377.110.2616.960.4415.500.446.370.2614.120.38
Table 6. Empirical constants of Equations (9) and (13).
Material λ FormulationD Formulation
I J K L M N O P
CSS5.920.0940.0210.4958.44−0.0310.0230.415
HDS44.26−0.1670.463−0.008176.20−0.4150.965−0.137
CL46.00−0.3410.2430.00912.380.0230.1300.187
Table 7. Empirical constants of Equation (14).
CSSHDSCL
σ c  (kPa) F H F H F H
501.310.800.661.270.961.09
1001.430.730.841.100.891.17
1501.610.660.941.050.851.26
2001.320.730.871.100.841.38
2501.350.740.921.070.801.40
3001.320.720.950.990.911.47
Table 8. Empirical constants of Equations (17) and (18).
MaterialGeneralised FormulationSimplified Formulation
Q R S T U V
CSS1.418−0.0050.930−0.0481.2770.805
HDS0.3430.1831.916−0.1120.8851.072
CL1.207−0.0650.5490.1701.0871.050
Disclaimer/Publisher’s Note: The statements, opinions and data contained in all publications are solely those of the individual author(s) and contributor(s) and not of MDPI and/or the editor(s). MDPI and/or the editor(s) disclaim responsibility for any injury to people or property resulting from any ideas, methods, instructions or products referred to in the content.