


Abstract
The Late Miocene is known as a period of long-term Cenozoic global cooling and decreasing concentrations of atmospheric CO2. The conditions provide the opportunity to assess the Earth’s climate sensitivity in altering internal and external drivers in a warmer world with similarity to the modern continental configuration. However, relative warmer Sea Surface Temperature (SST), a deepened thermocline, and reduced upwelling may have occurred in the tropics during the Late Miocene global cooling. Here, we present foraminiferal biostratigraphy data from the Middle Miocene–Pliocene succession in the Halang Formation in the Banyumas Basin in Indonesia. An increase in the planktonic foraminifera Trilobatus trilobus and Orbulina universa during the Late Miocene in the Indian Ocean indicates relative surface temperature warming and reduced productivity inferred from assemblage shifts. Reduced productivity was caused by decreasing upwelling intensity during the Late Miocene based on Globigerinella obesa assemblages. Reduced upwelling in the south of Java is supported by elevated numbers of surface/mixed-layer species (i.e., Trilobatus sacculifer and Trilobatus immaturus). We suppose the distribution of enhanced upper-layer stratification in the eastern Indian Ocean was not only driven by oceanic forcing but was also transferred intensively into the Indian Ocean by atmospheric forcing of strengthening equatorial trade winds. Changes in the Walker circulation controlled a reduction in upwelling over the eastern tropical Indian Ocean and a deeper thermocline during the cooling climate in the Late Miocene.
1. Introduction
Global warming-derived climate changes have increased as a scientific concern within the international community and provided knowledge in different aspects of climate research [1,2]. The studies of past climates offer a meaningful history that can be used to predict future climatic changes. Climate changes measured by different instruments have existed for the last few centuries, but not on a geological timescale [3,4]. In this context, proxies in microfossils are needed to interpret paleoenvironment and climatic changes. Biostratigraphic analysis of microfossil assemblages enables the correlation of regional stratigraphic sequence with global geological events. The abundance and heterogeneity of microfossils can reconstruct the past changes in the physical and chemical parameters [5]. Of the calcareous microfossils, planktonic foraminifera have been used for paleoclimatic [6,7,8,9] and biostratigraphic studies [10]. The planktonic foraminifera are known to be outstanding proxies because of their sensitivity to environmental changes [6]. Reconstructing past oceanic conditions using planktonic foraminifera has an advantage due to their abundance and diversity in the warm water of the low to middle latitudes, especially in the equatorial upwelling region [5]. Neogene planktonic foraminifera from south of Java in the equatorial upwelling region have been reported [8,11,12,13], but there are still limited studies on biostratigraphic and paleoenvironmental application in the region.
During the Late Miocene (11.6–5.3 million years ago, Ma), long-term Cenozoic global cooling and decreasing pressures of atmospheric CO2 lay in the earth [14,15]. The conditions provide an opportunity to assess the sensitivity of the Earth’s climate to altering internal and external drivers in a warmer world given the similarity between the Late Miocene continental configuration and the modern one [16,17,18]. It was clear that major global sea surface cooling was recorded in the middle and high latitudes in both hemispheres [14,19]. This process triggered shifts in the global carbon cycle and drove significant ecological changes in both terrestrial and marine environments [17,20,21,22]. Sea Surface Temperature (SST) reconstruction shows global cooling during the Late Miocene with a magnitude of 3–5° in high and mid latitudes and a modest cooling of ~1 °C in the tropics [19], but several existing Late Miocene records could identify higher temperature cooling between 2° and 4 °C in the tropical region [17,23,24]. However, warmer SST, a deepened thermocline and reduced upwelling may have occurred in the tropics during the Late Miocene global cooling [25].
During global cooling in the Last Glacial Maximum (LGM), the thermocline was deeper and upwelling was weaker in the eastern Indian Ocean, where the potential mechanism which triggered the changes in temperature in the Indian Ocean had stronger Walker circulation during the LGM [25]. The situation of warmed SST, deepened thermocline, and reduced upwelling may have existed at the eastern Indian Ocean during global sea surface cooling in the Late Miocene. Biostratigraphic and paleoclimatic studies from the southern Java, particularly the Solo River section, indicate that the Late Miocene was generally cooler, with several cold–warm fluctuations between about 6.5 and 4.8 Ma, a trend likely driven by increased marine productivity resulting from intensified upwelling during the southeast monsoon [8,26].
Today, upwelling across the Java–Sumatra Indian Ocean coasts is a reaction to regional winds affiliated with the monsoonal climate; the strong upwelling occurs during the southeast monsoon (cold climate) and the weak upwelling arises during the northwest monsoon (warm climate) [27,28,29]. Another process that could control upwelling in the region is the Indian Ocean Dipole (IOD) system [6]. In the growing phase of a positive IOD, the upwelling of subsurface cold water across the coasts of Sumatra and Java develops westward and generates a large zonal SST gradient in the central-eastern tropical Indian Ocean [29,30]. Due to the finding that the Late Miocene paleoclimate in the south of Java has several cold–warm cycles roughly between 6.5 ma and 4.8 ma B.P., it is therefore necessary to analyze planktonic foraminifera in the other regions of the south of Java. The objective of this study is to understand the Late Miocene paleoenvironment scenario from the equatorial upwelling region, especially south of Java, based on planktonic foraminifera assemblages. In the present study, we focus on the Miocene–Pliocene planktonic foraminifera in the Halang Formation to establish the new finding of the planktonic foraminifera biostratigraphy, taxa distribution, and its application to the paleoceanography and paleoclimate in the Banyumas Basin.
2. Geological Setting and Paleogeography
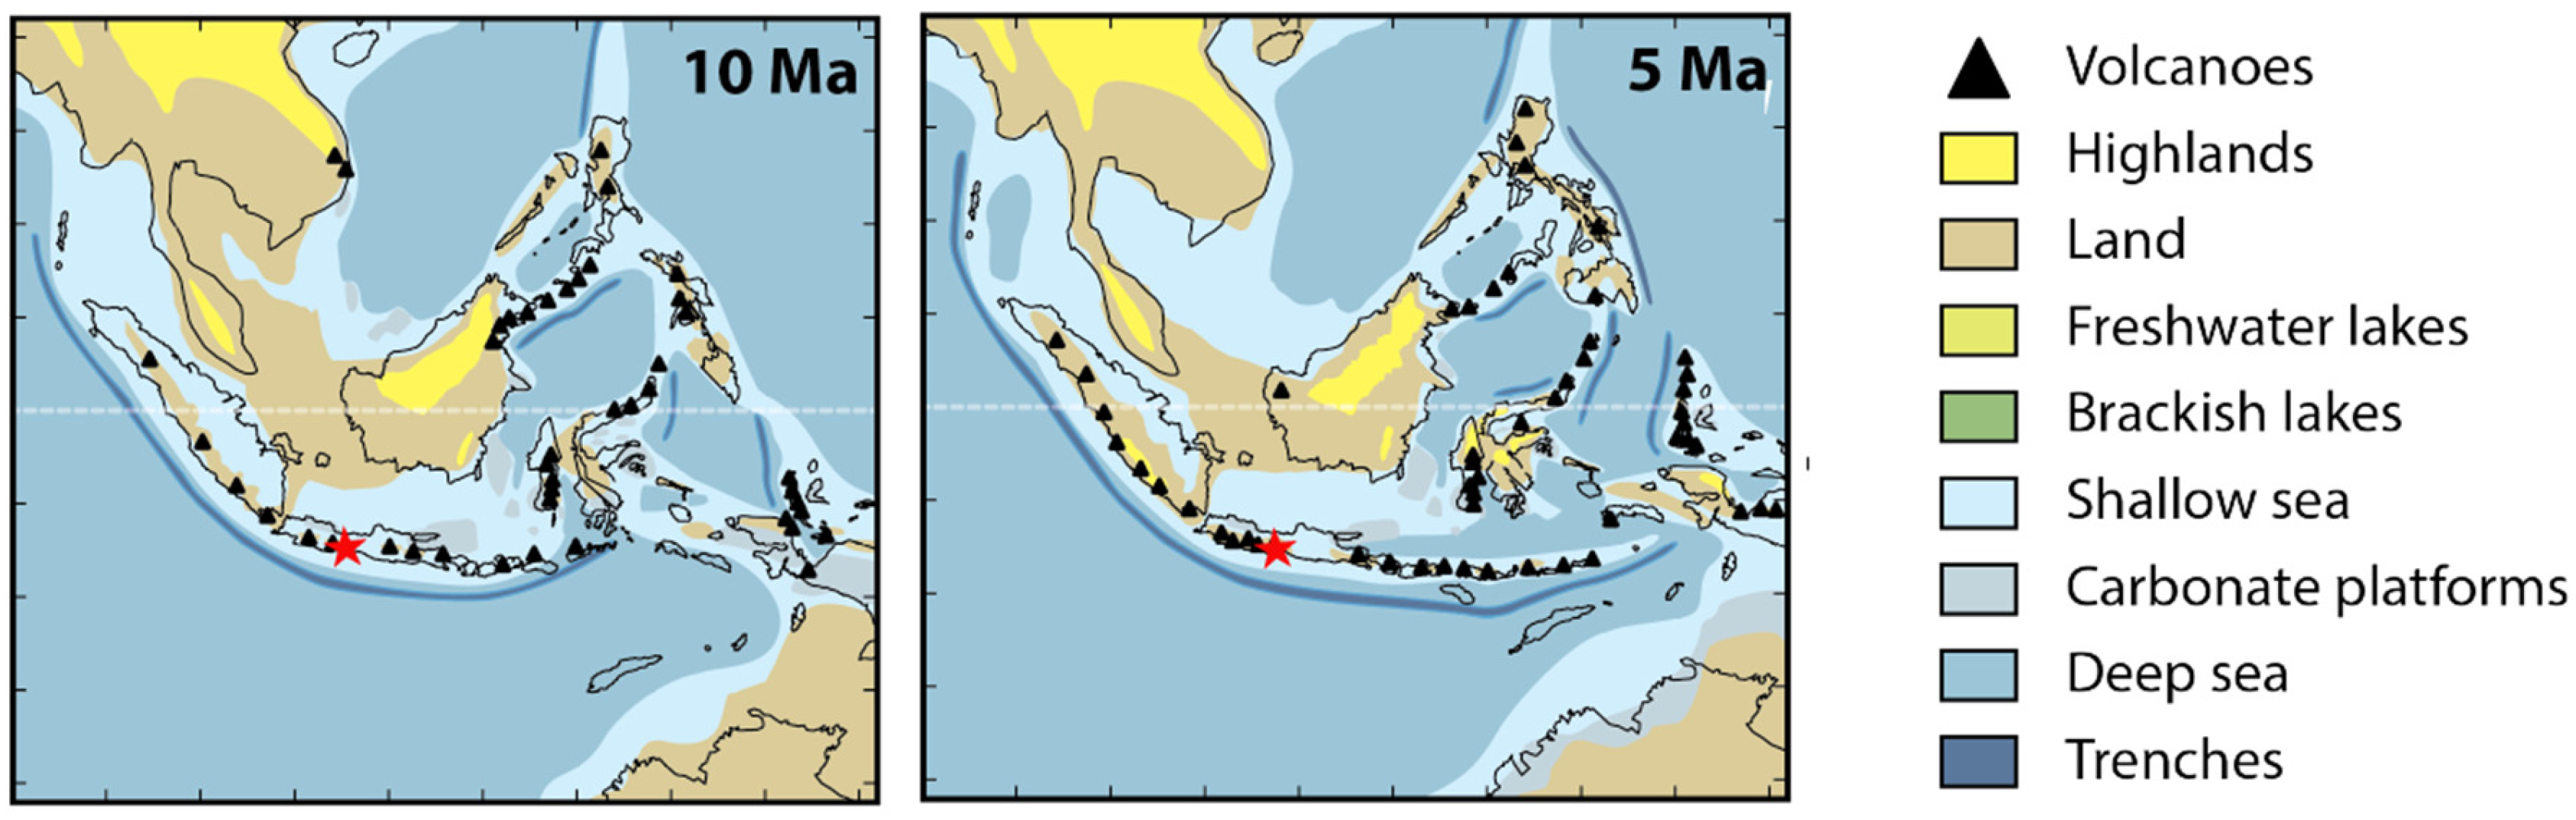
The Banyumas Basin has been suggested as an island arc or volcanic arc flexure basin by [31]. The scientists have also explained the historical development of the basin since the Late Cretaceous [32]. Initially, this area was a subducted zone in a deep sea until the Late Oligocene. Following the orogeny of the southern mountains of Java started during the Late Oligocene, the area developed into a flexure basin situated in the north of the volcanic arc. During the Middle Miocene–Pliocene, a magmatic arc was formed in the center of the basin, supplying vast amounts of material into the basin (Figure 1). Moreover, there was an additional supply from erosion of a remnant volcanic high at the south of the basin. Within this stage, the sediments of the Halang Formation were deposited. In the Pliocene–Pleistocene, the basin changed into a fore arc basin as a new magmatic arc developed in the north. The thickness of sediments deposited in the basin reaches up to 8000 m [33].
Figure 1.
The distribution of land and sea in Indonesia during Late Miocene (10 Ma) and Early Pliocene (5 Ma); images originated from [34] under the CC BY.4.0 license. Approximate location of the Banyumas Basin during the periods is marked by a red star.
The Banyumas basin is situated in the southern part of Java Island, which was mostly a marine environment prior to 5 Ma [34,35] (Figure 1). The basin has been considered as a potential source for hydrocarbons [31,36] as well as an economic mineral resource [37] that is potentially productive. Previously, the turbidites of the Halang Formation in the Banyumas Basin had been associated with submarine fan deposits in the deep marine environment [38,39,40]. However, the finding of a buried Oligocene–Miocene volcanic arc at the center of the basin has raised a new paradigm that the turbidites are flysch, a deposit formed by an orogeny or the uplift of a volcano, and molasse, a deposit related to the reworking process of volcanic remnants [41]. The turbidity current was not generated by the submarine slope but by the flank of the volcano [41,42].
The Halang Formation represented in the study area is one of the rock units forming the stratigraphy of Banyumas Basin [32]. Stratigraphically, the Halang Formation was deposited interfingering with the Kumbang Formation in a similar environment. The Halang Formation consists of siliciclastic turbidite materials, while the Kumbang Formation contains volcanic materials [39]. The Halang Formation consists of interbedded sandstone, claystone, marl, and tuff with breccia intercalation, deposited under influence of turbidity currents and submarine slides [43]. Paleocurrent estimates suggested that the sediments (volcanic products) were derived from the Old Andesite Formation in the southern basin [44].
3. Materials and Methods
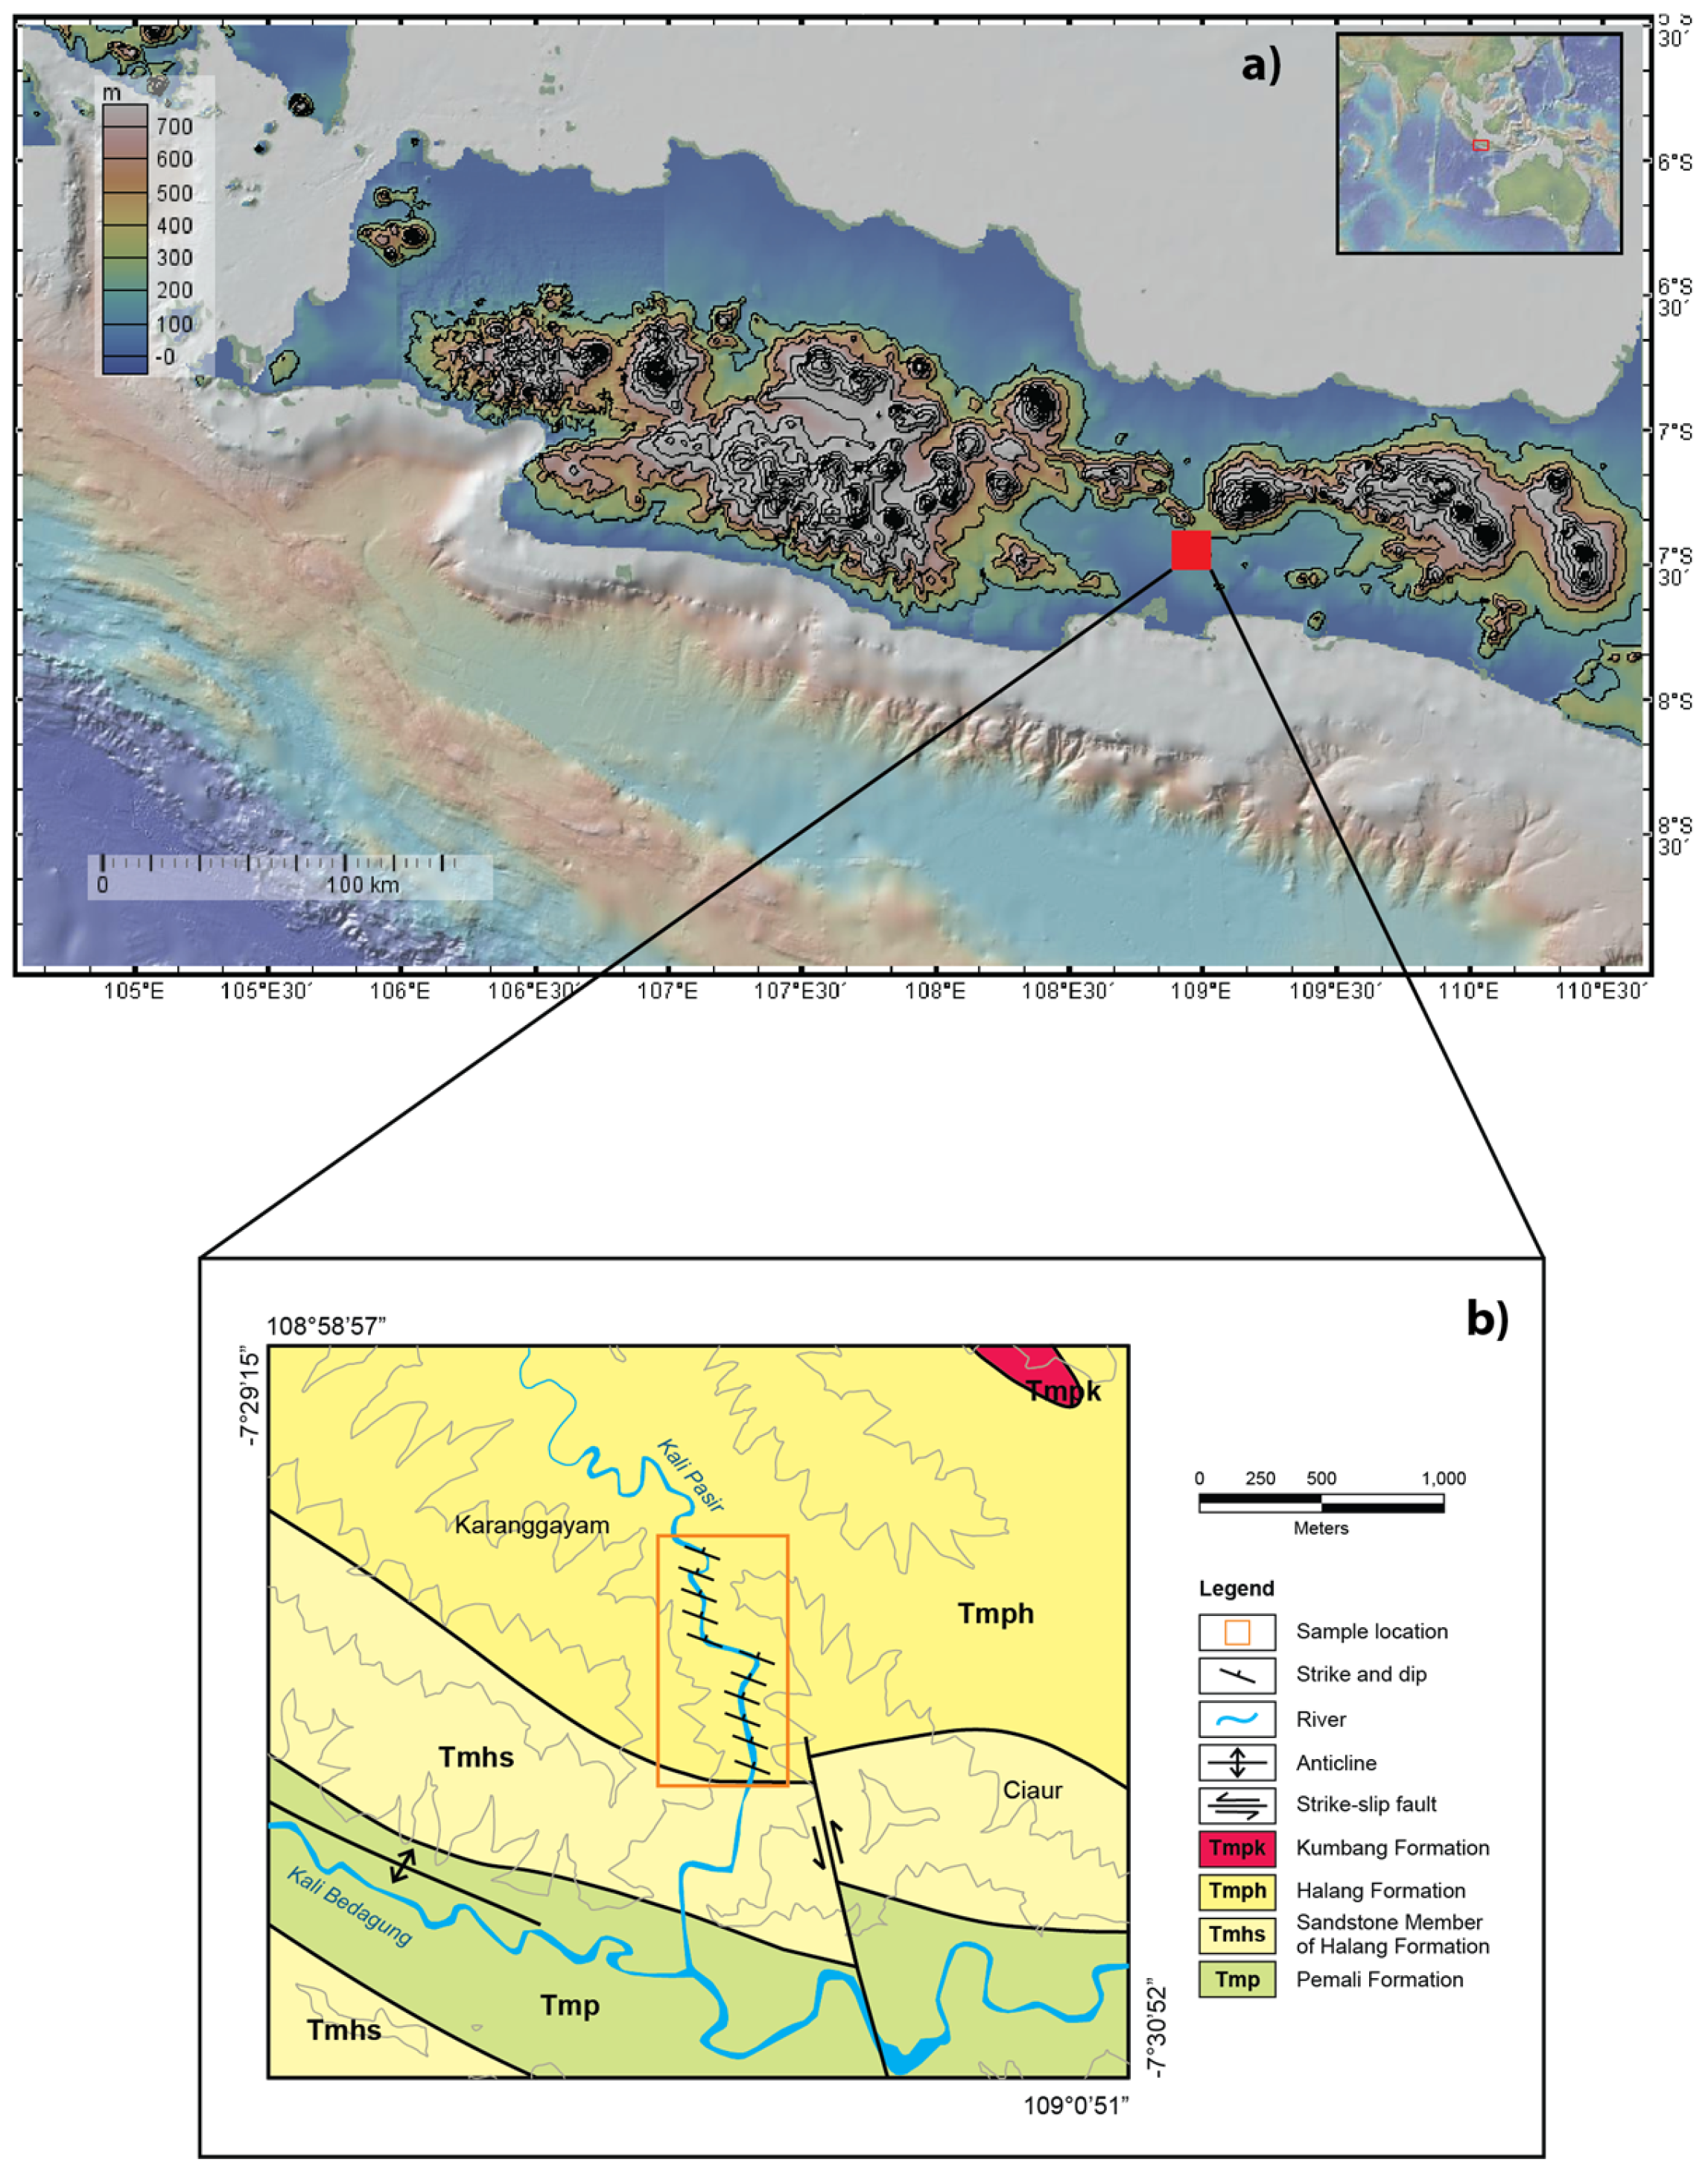
We selected the Kali Pasir section at Banyumas, Central Java (Figure 2). The lithology of the section, which has been described in detail by a previous study [44], consists of dominant mixed sandy and muddy facies with relatively minor mudstone and sandstone facies as a classical turbidite product. The examined section represents the Halang Formation, where classical turbidite depositional processes predominate in the middle to upper intervals. The Kali Pasir section comprises a marine succession approximately 1300 m thick [44]. According to [44], the section was measured, described, and photographed in detail and sampled with an interval of 10 m. Although stratigraphically constrained cluster analysis and diversity indices are useful for detecting short-term cyclicity, these methods were not applied because the sampling resolution (~10 m ≈ ~55 kyr) limits the detection of millennial-scale variability. At this resolution, such analyses would likely not yield meaningful patterns of warm–cold oscillations [45]. Our interpretations therefore focus on 104–106 year trends, which are robustly captured by the current dataset.
Figure 2.
Research area in the Kali Pasir section at Banyumas Basin (108°59′37″ E and 7°29′37″ S). (a) Research area in the Banyumas Basin; (b) geological map and detailed measured section in Halang Formation (redrawn from [44]).
Sample preparation was carried out in the laboratory of sediment analysis of the National Research and Innovation Agency, Indonesia. The samples were soaked for 30 min with Hydrogen Peroxide (H2O2) obtained from Merck (Darmstadt, Germany), decanted, and washed by water in a sieving > 63 μm to retrieve the foraminifera. Samples were treated with 30% H2O2 to remove organic matter. Exposure time was carefully controlled (monitored visually) to minimize dissolution, following concerns raised by previous studies [46,47]. No significant alteration of foraminiferal tests was observed during processing. The samples were dried in an oven at 50 °C for 24 h. We studied a total of 126 samples for their foraminiferal assemblages. We listed the total occurrences of planktonic foraminifera and benthic foraminifera in each sample.
The faunal analysis was carried out quantitatively for >300 specimens per sample (size fraction >100 μm). The planktonic and benthic foraminifera were determined under a binocular microscope SZX16 (Olympus Corporation, Tokyo, Japan) under 100 to 400 magnifications. The faunal analysis of planktonic foraminifera assemblages in the sediment was determined quantitatively from 1 g residue for each sample. Identification of the planktonic foraminifera refers to previous studies [10,48,49,50]. We defined the biostratigraphic zones based on the first and/or the last occurrences of species datum [10]. The paleoenvironmental reconstruction was carried out based on the changes in the planktonic foraminifera assemblages and abundance throughout the section. Photographs of the planktonic foraminifera were taken by scanning electron microscope (SEM-EDS) (JSM-IT200, JEOL Ltd., Tokyo, Japan) located at National Research and Innovation Agency (BRIN) with the voltage of 20 kV for the measurement. Graphs and figures are illustrated by software Kaleidagraph version 5.0 (Synergy Software, Reading, PA, USA) and Adobe Illustrator 30.2.1 (Adobe Inc., San Jose, CA, USA).
Planktonic foraminiferal assemblages reliably track water temperature due to each taxon occupying a relatively stable thermal niche, including warm-water, oligotrophic surface dwellers [51,52], and observations across recent mid-latitude marine heatwaves show assemblages switching from polar–subpolar to subtropical–tropical as upper 100 m waters warm, then reverting as temperatures fall [53]. On glacial–interglacial and millennial scales, tropical Atlantic reconstructions similarly document higher fractions of warm oligotrophic species with enhanced surface stratification during warm phases, and greater prevalence of deep/thermocline dwellers and productivity indicators during cooler periods demonstrating that relative species dominance alone can capture water temperature trends without complex transfer models [52]. Critically, the ecological foundation for this approach is supported by evidence that species temperature preferences have remained broadly stable, reinforcing a uniformitarian relationship between assemblage composition and temperature [51,54].
4. Results
4.1. Planktonic Foraminifera Abundance
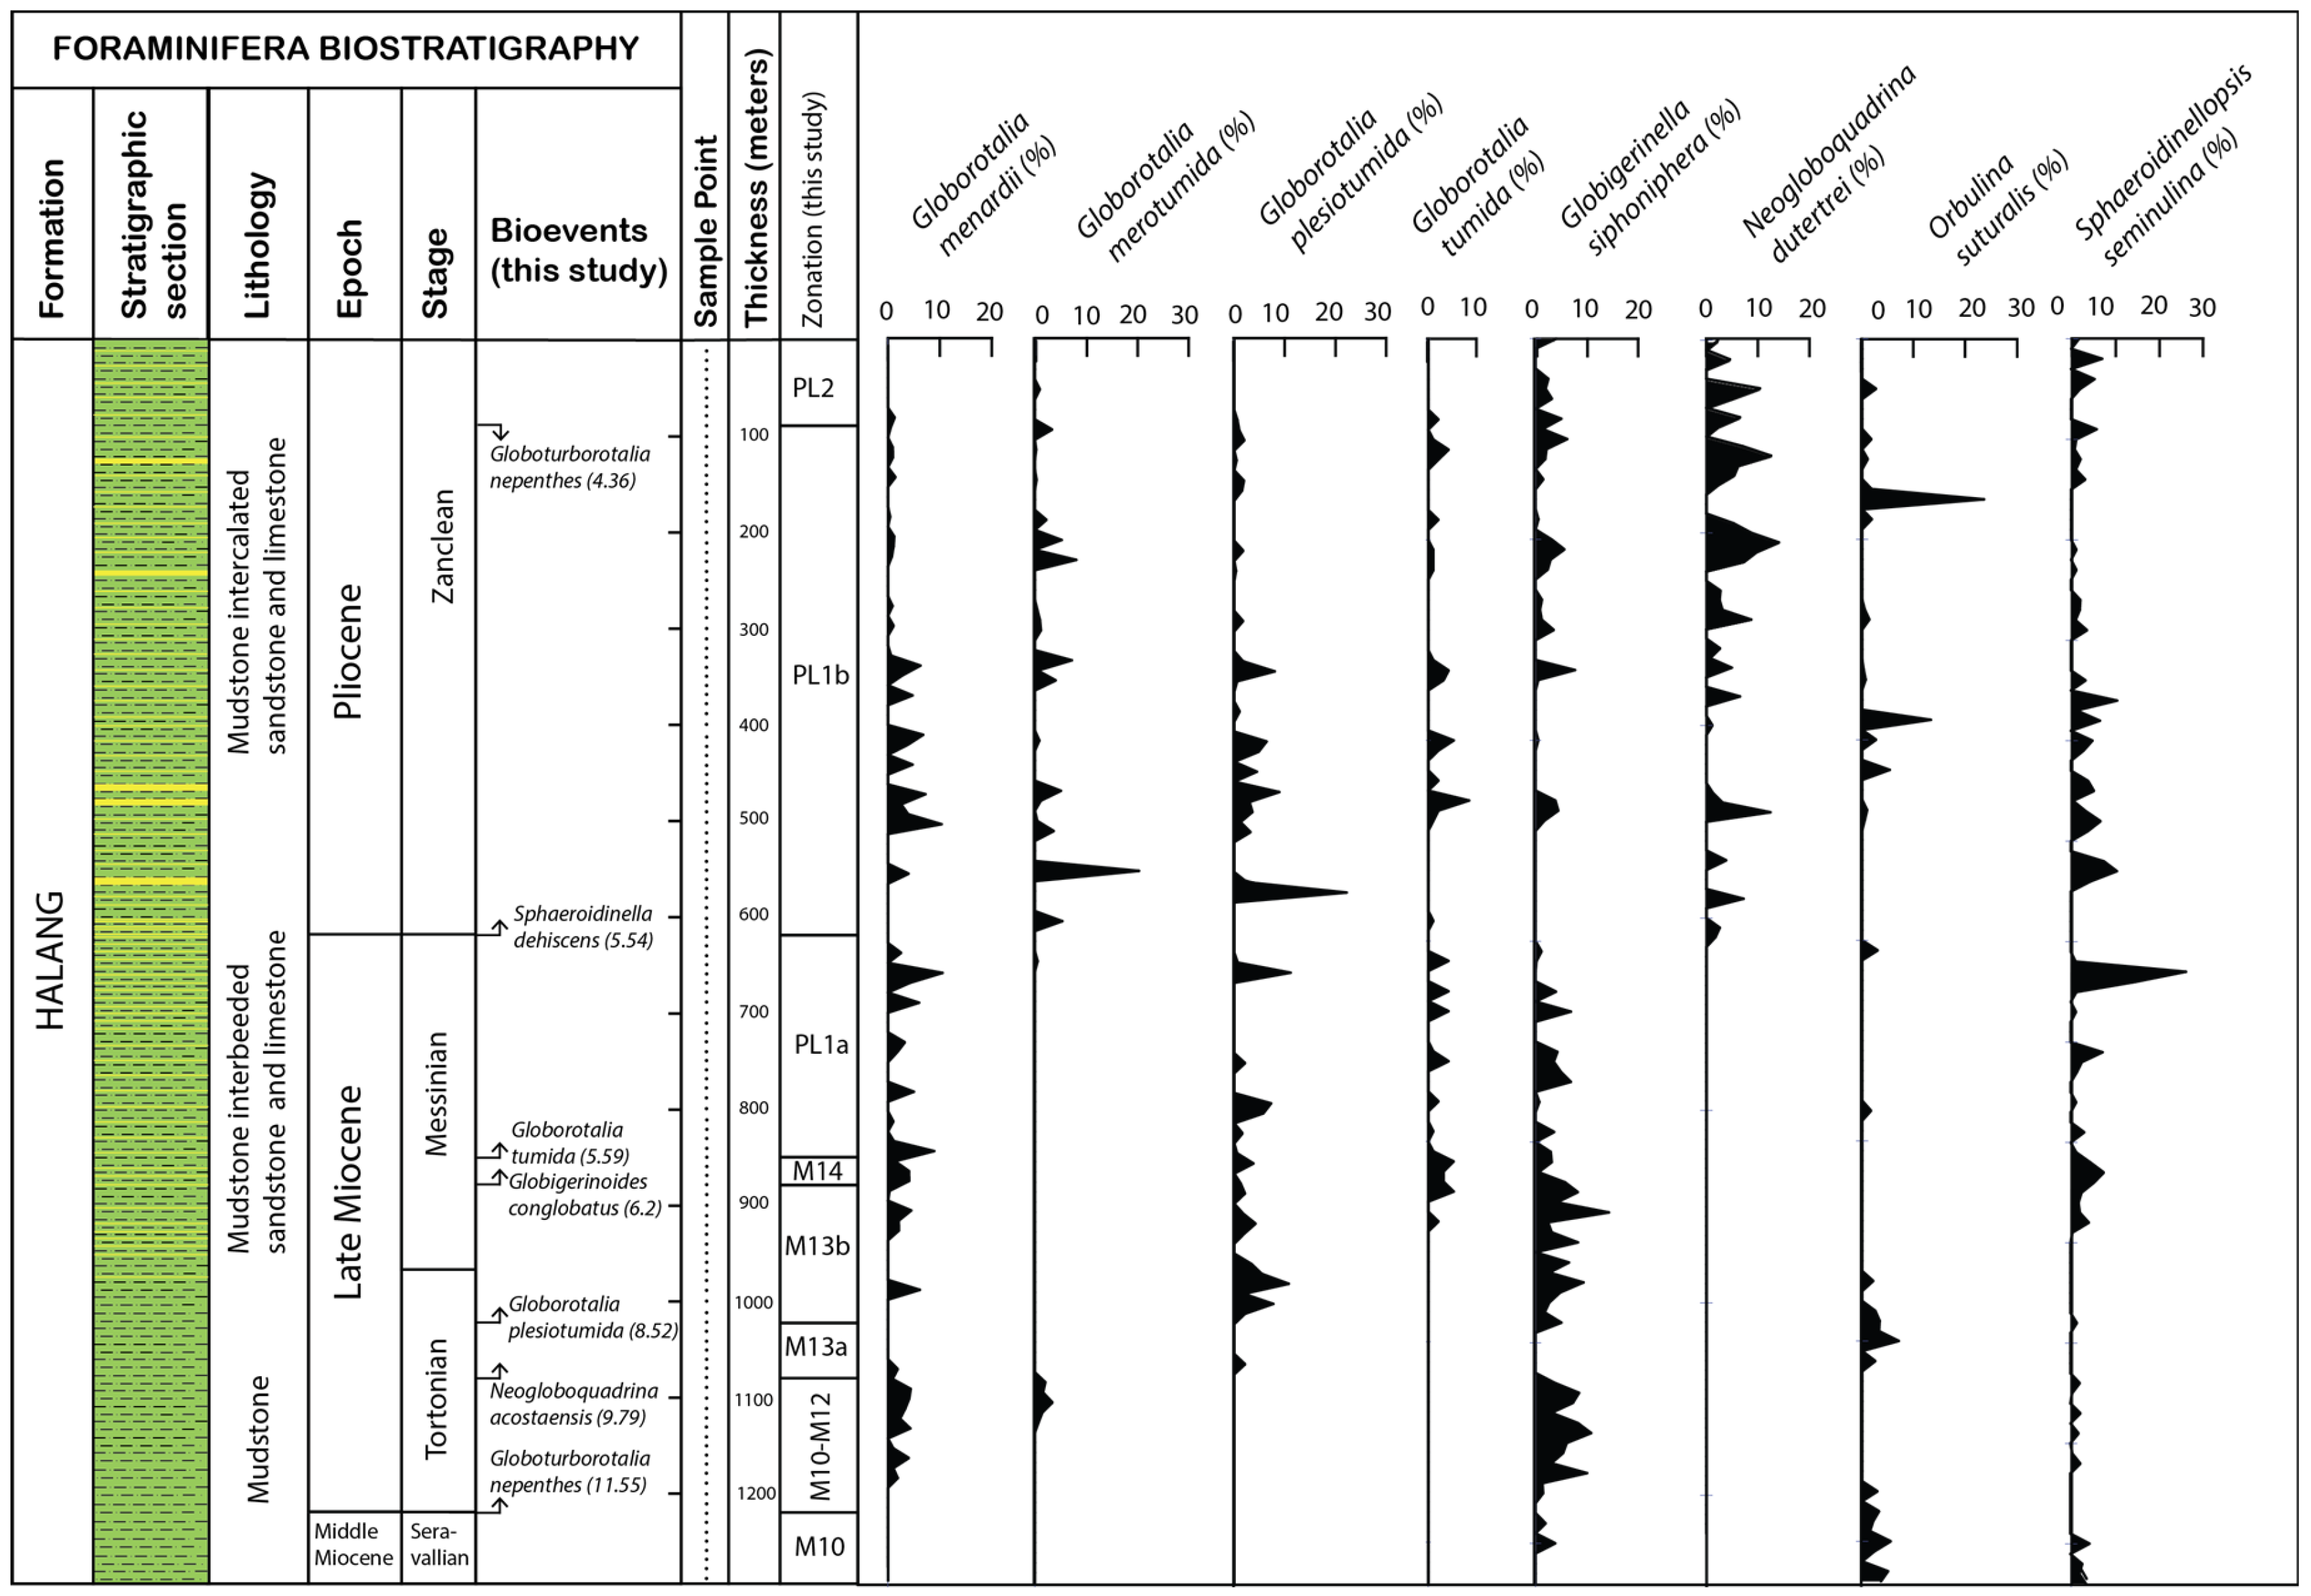
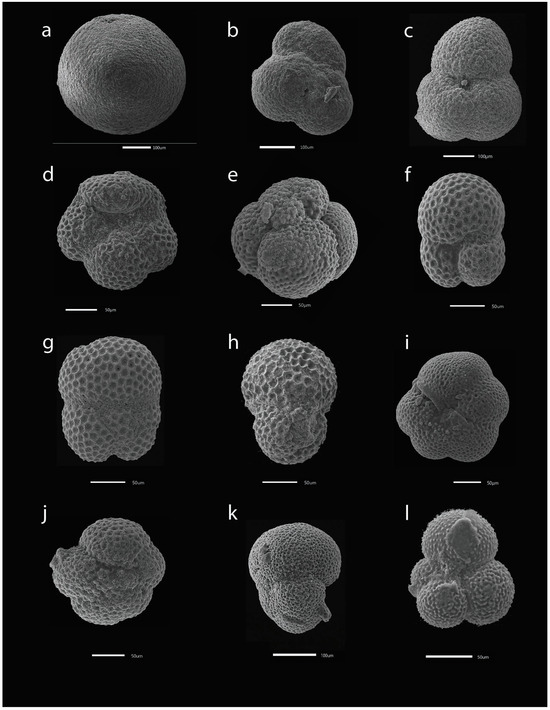
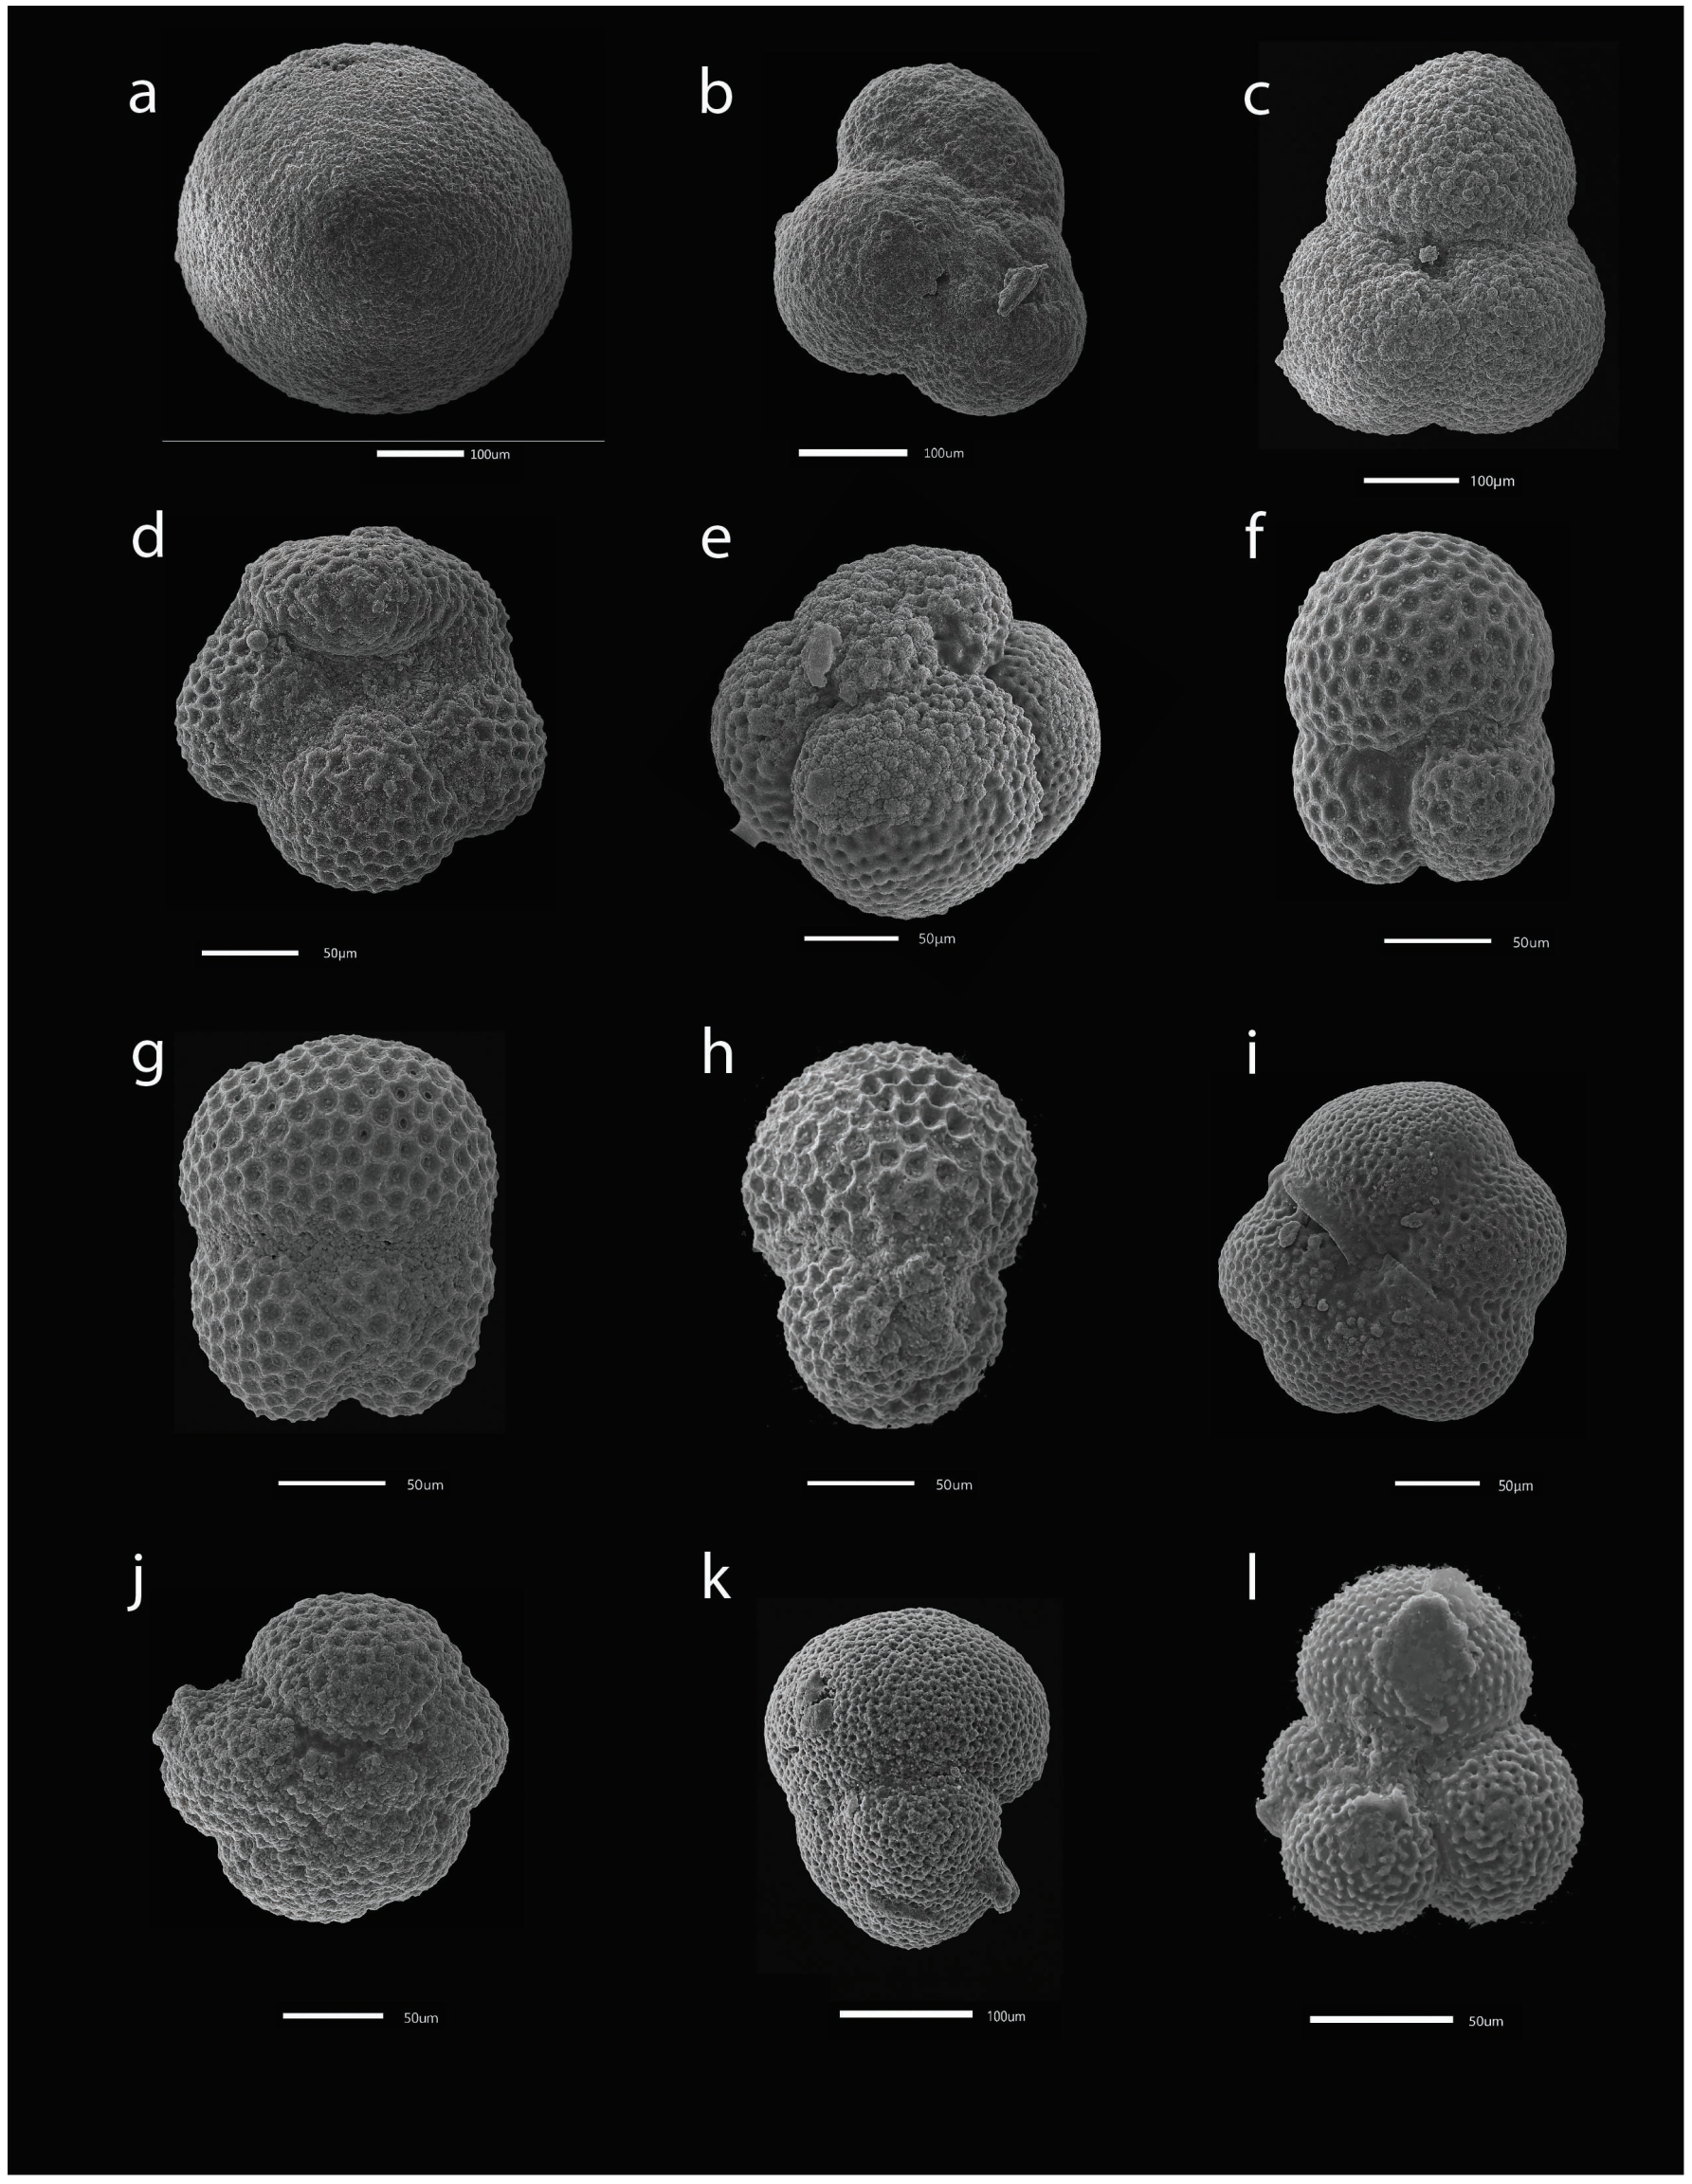
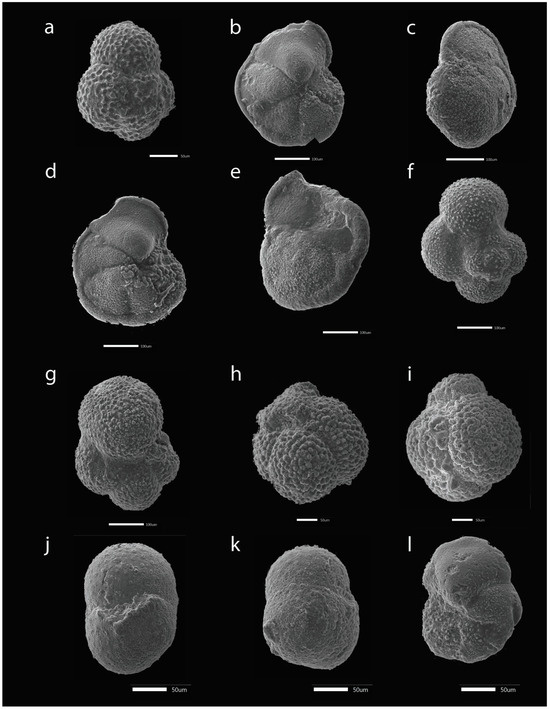
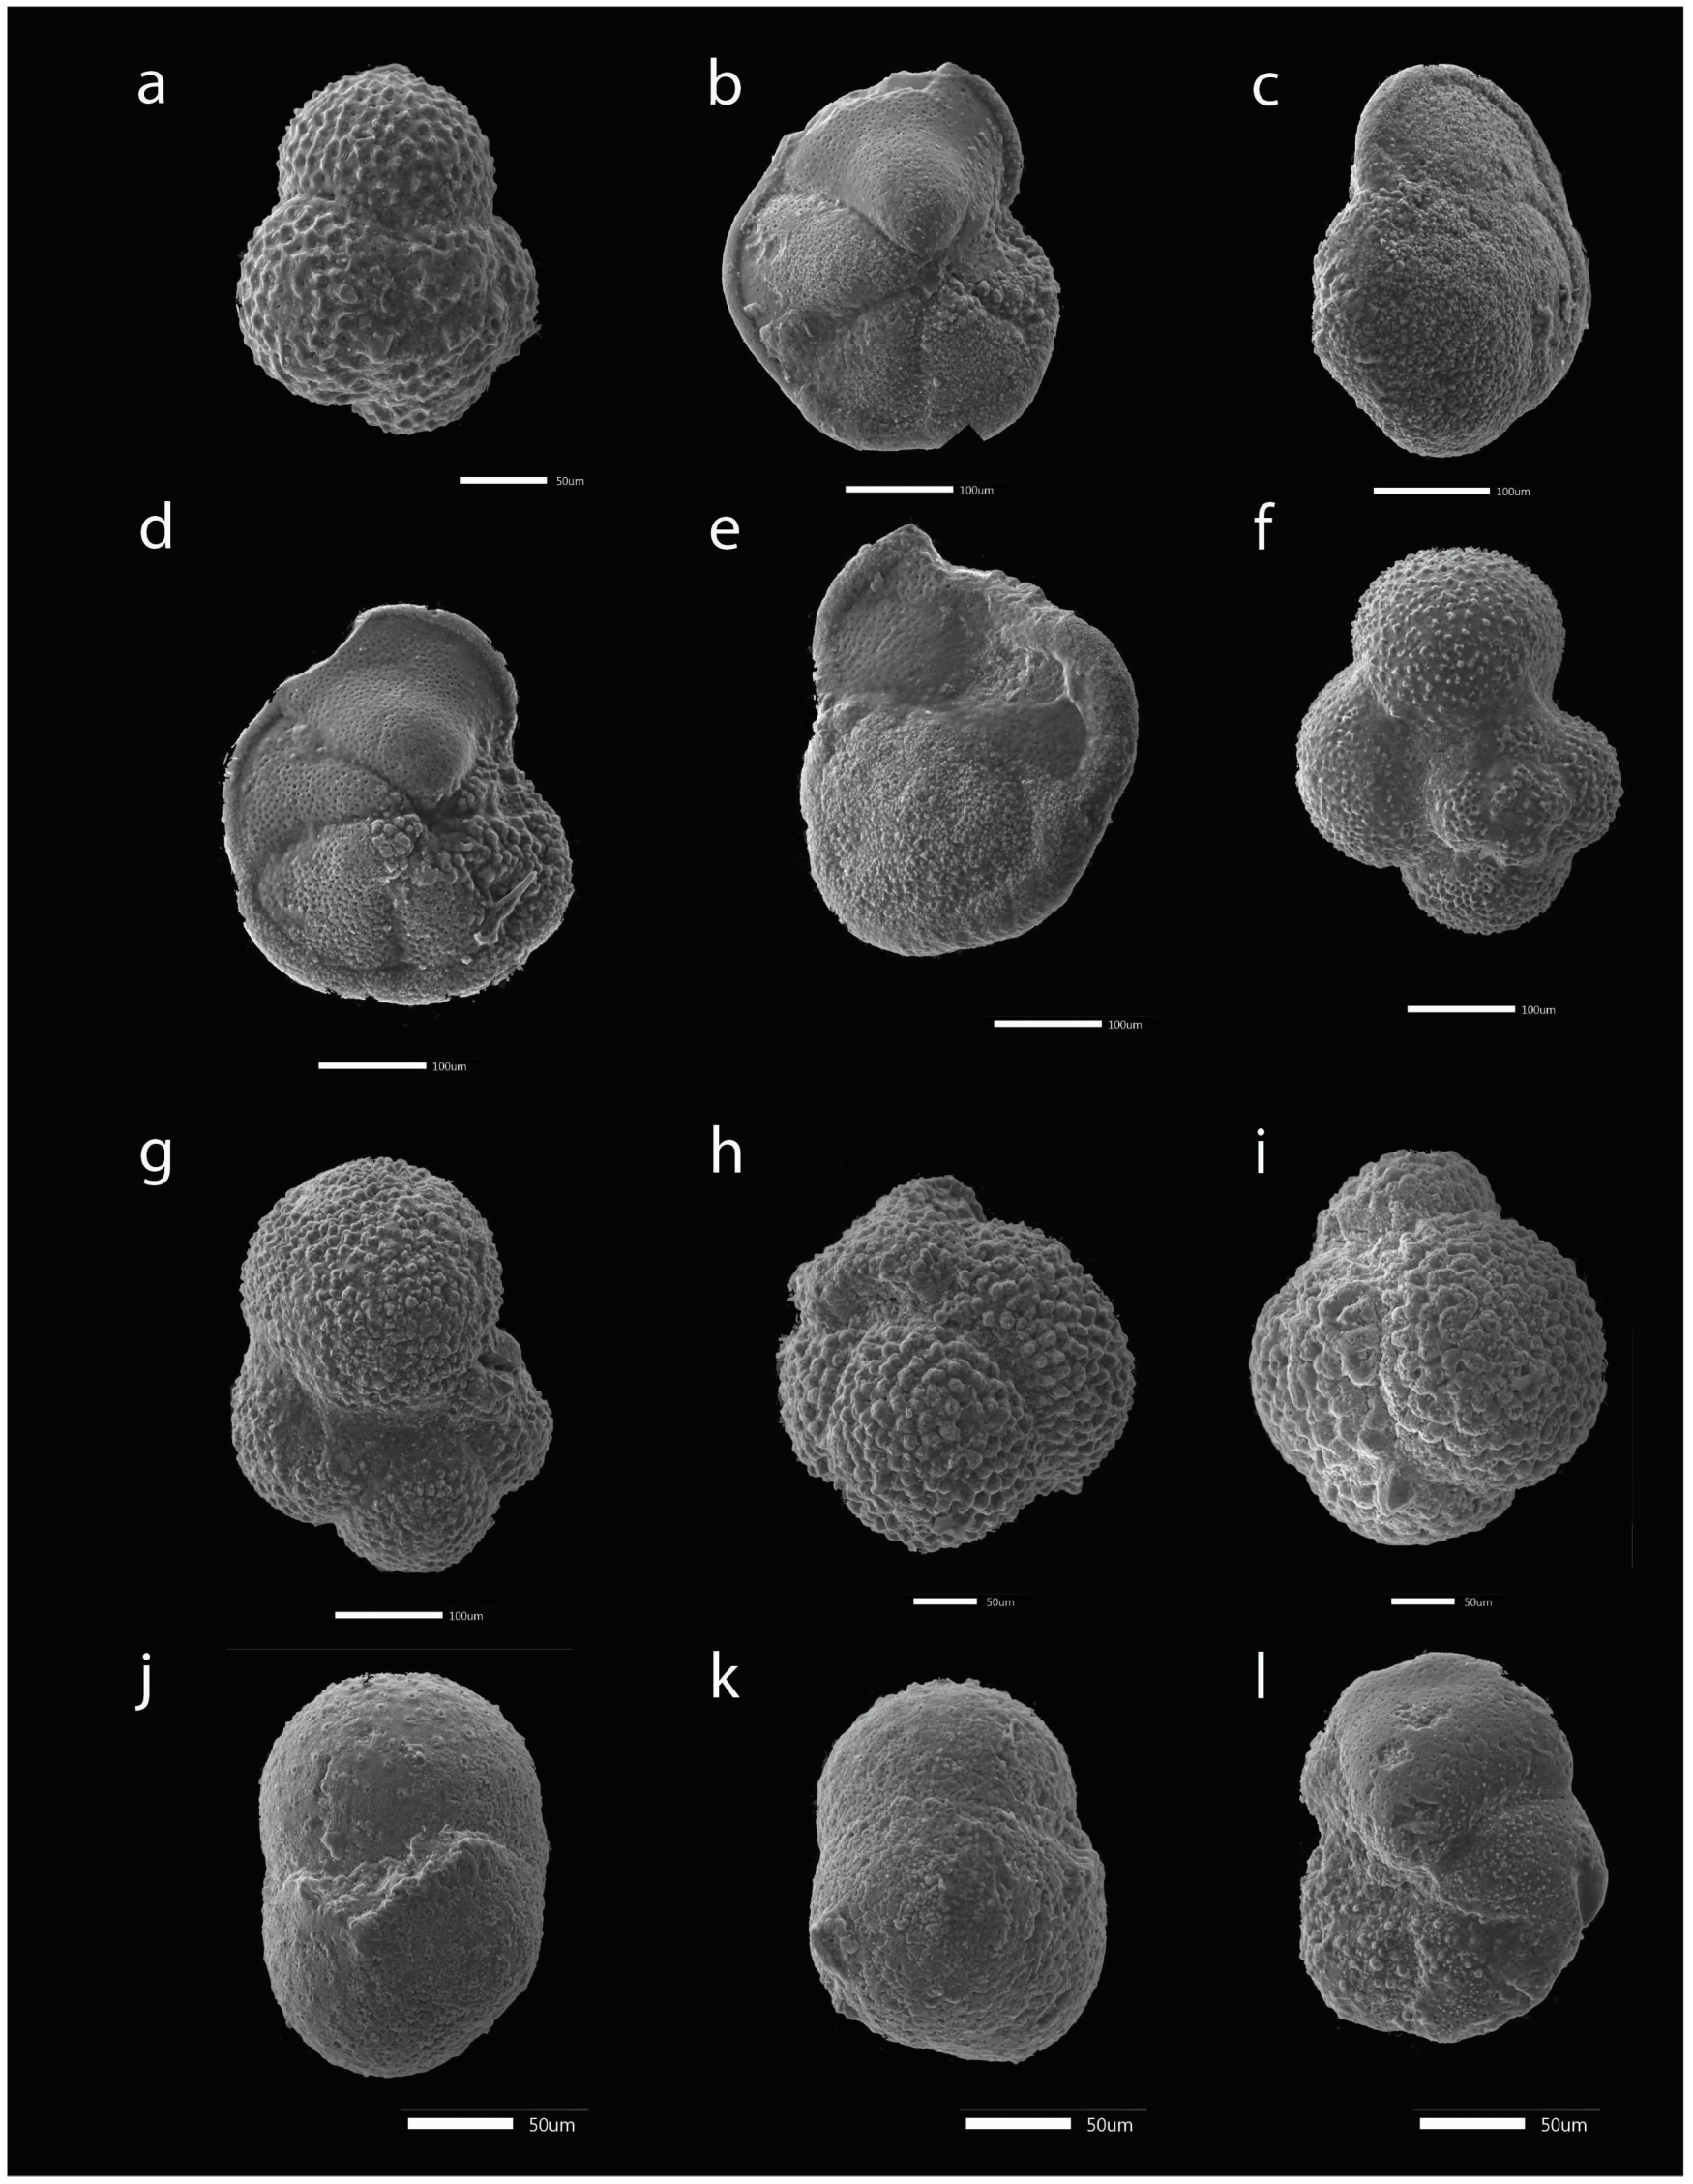
Planktonic foraminifera species strongly dominate the assemblages. Benthic foraminifera species are scarce and often occur as single specimens, so we will not discuss them in detail. A total of 58 planktonic foraminifera species were identified in the Halang Formation in this study. Planktonic foraminifera specimens of the Halang Formation along the section are characterized by good preservation and high abundance. Foraminiferal preservation was evaluated qualitatively based on test integrity and absence of dissolution features. The abundance of planktonic foraminifera species from the Halang Formation along the Kali Pasir section are presented in Figure 3, Figure 4 and Figure 5. Overall, several species dominate the assemblages, including Orbulina universa (Figure 6a), Trilobatus sacculifer (Figure 6b,c), Trilobatus trilobus (Figure 6g,h), Globigerina bulloides (Figure 6l and Figure 7a), Trilobatus immaturus, Neogloboquadrina acostaensis, Globorotalia plesiotumida (Figure 7b,c), Globorotalia tumida (Figure 7d,e) and Globigerinella obesa (Figure 7f,g). Additional minor species are illustrated in Figure 6 and Figure 7, including Dentoglobigerina altispira, (Figure 6f-h), Neogloboquadrina dutertrei (Figure 6i-k), Globigerinoides extremus (Figure 7h,i), (Sphaeroidinellopsis seminulina (Figure 7j,k), Globorotalia margaritae (Figure 7l). The relative abundance of three dominant planktonic foraminifera species, Globigerinella obesa, Trilobatus trilobus and Orbulina universa, ranges within 40–70% in each sample. Reworked taxa (e.g., Fohsella fohsi, Globorotalia miocenica, and Globorotalia pseudomiocenica) are shown in the abundance chart for reference; however, they were excluded from quantitative analyses to avoid bias in paleoceanographic interpretations.
Figure 3.
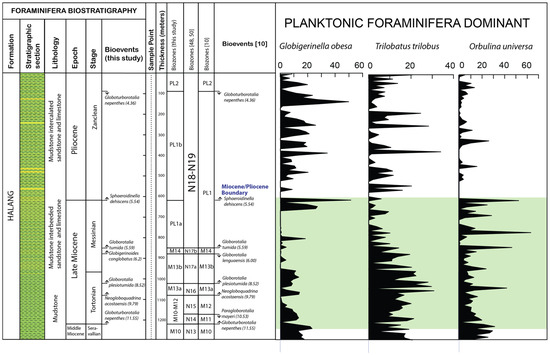
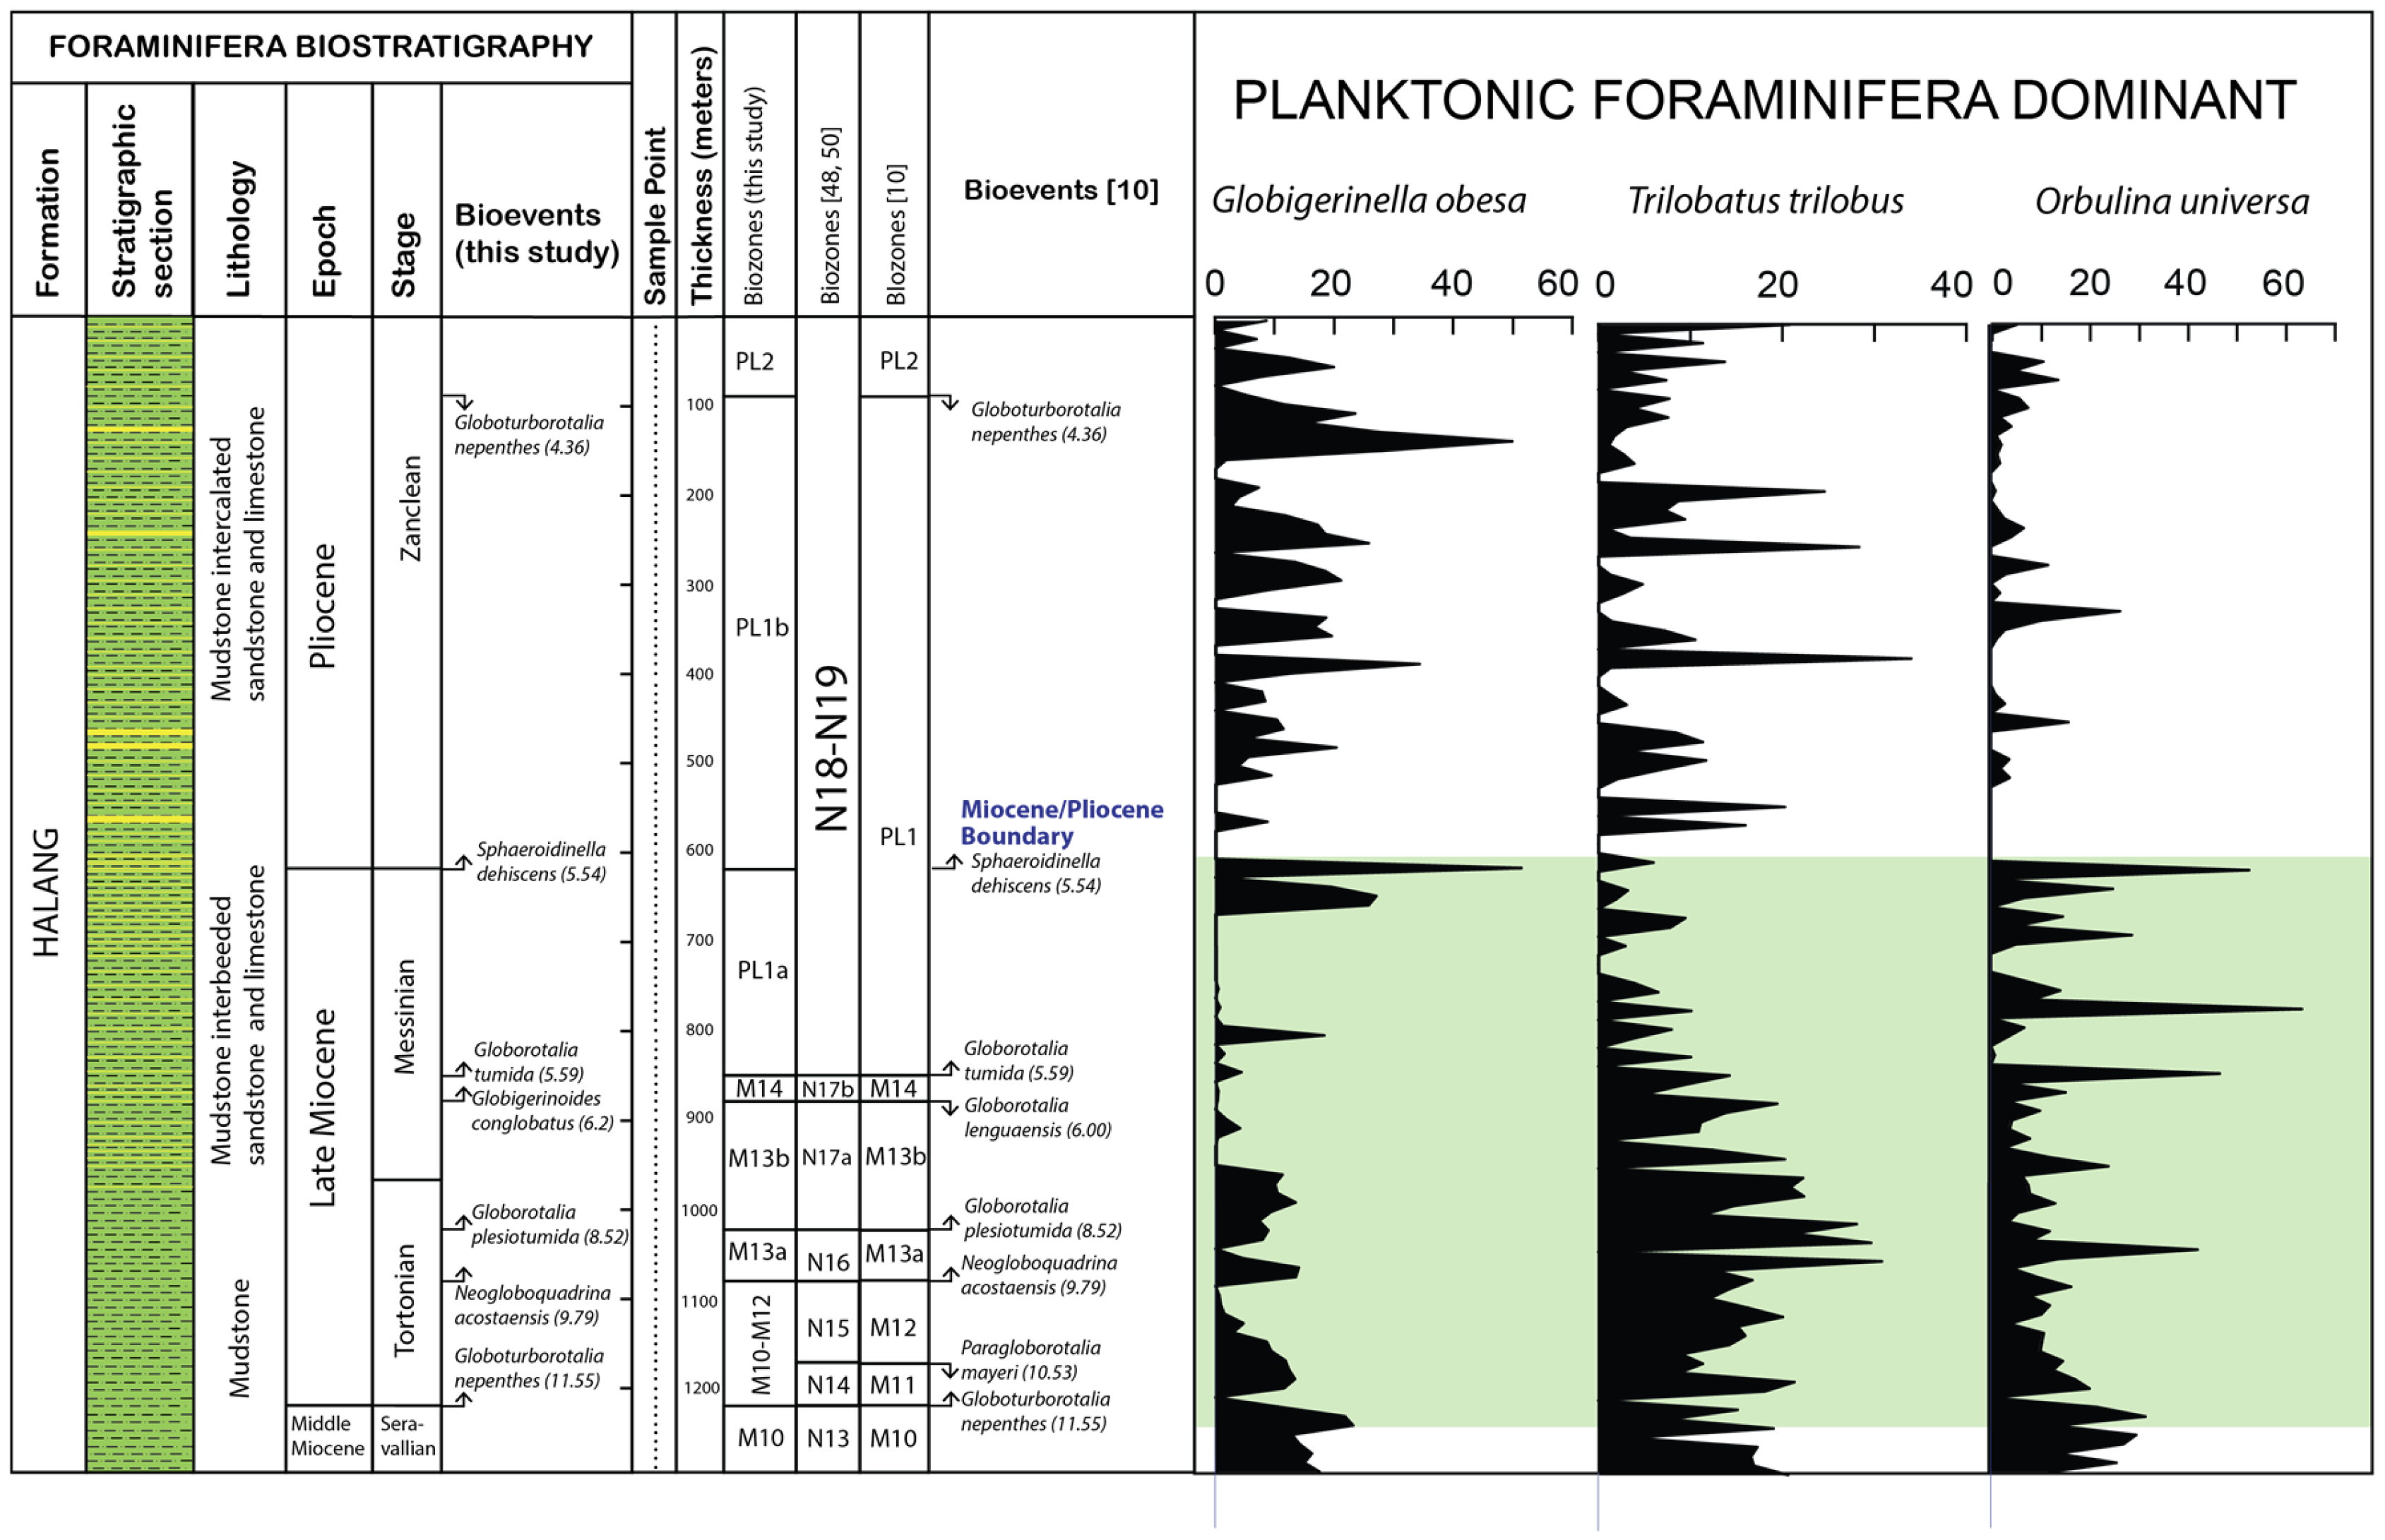
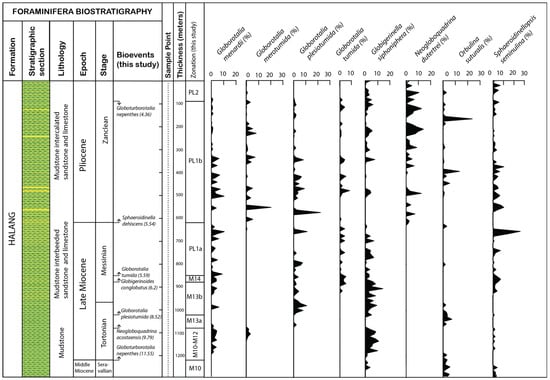
Left panel indicates the Middle Miocene to Early Pliocene planktonic foraminifera biostratigraphy of the Halang Formation at the Kali Pasir section, Banyumas Basin. Seven bio-datums FO Globoturborotalia nepenthes, FO Neogloboquadrina acostaensis, FO Globorotalia plesiotumida, FO Globigerinoides conglobatus, FO Globorotalia tumida, FO Sphaerodinella dehiscens, and LO Globoturborotalia nepenthes) divide the stratigraphy into eight bio-zones (M10, M11, M12, M13a, M13b, M14, PL1 and PL2). Biozones in this study was compared to previous biozones [10,28,50]. Right panel indicates the abundance of the important planktonic foraminifera in the Banyumas Basin. The abundance of mixed-layer species Orbulina universa increased, whereas Trilobatus trilobus shows only tendency to increase during the Late Miocene (green shading). In addition, upwelling indicator of Globigerinella obesa decreased during the Late Miocene (green shading).
Figure 4.
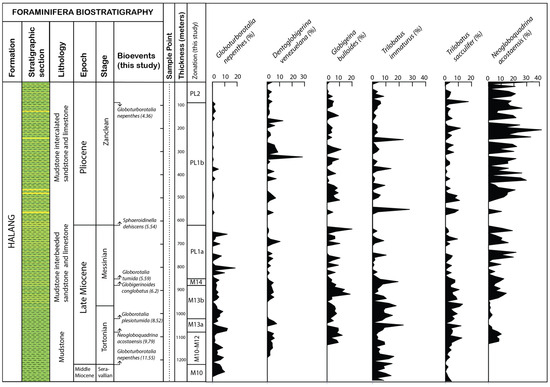
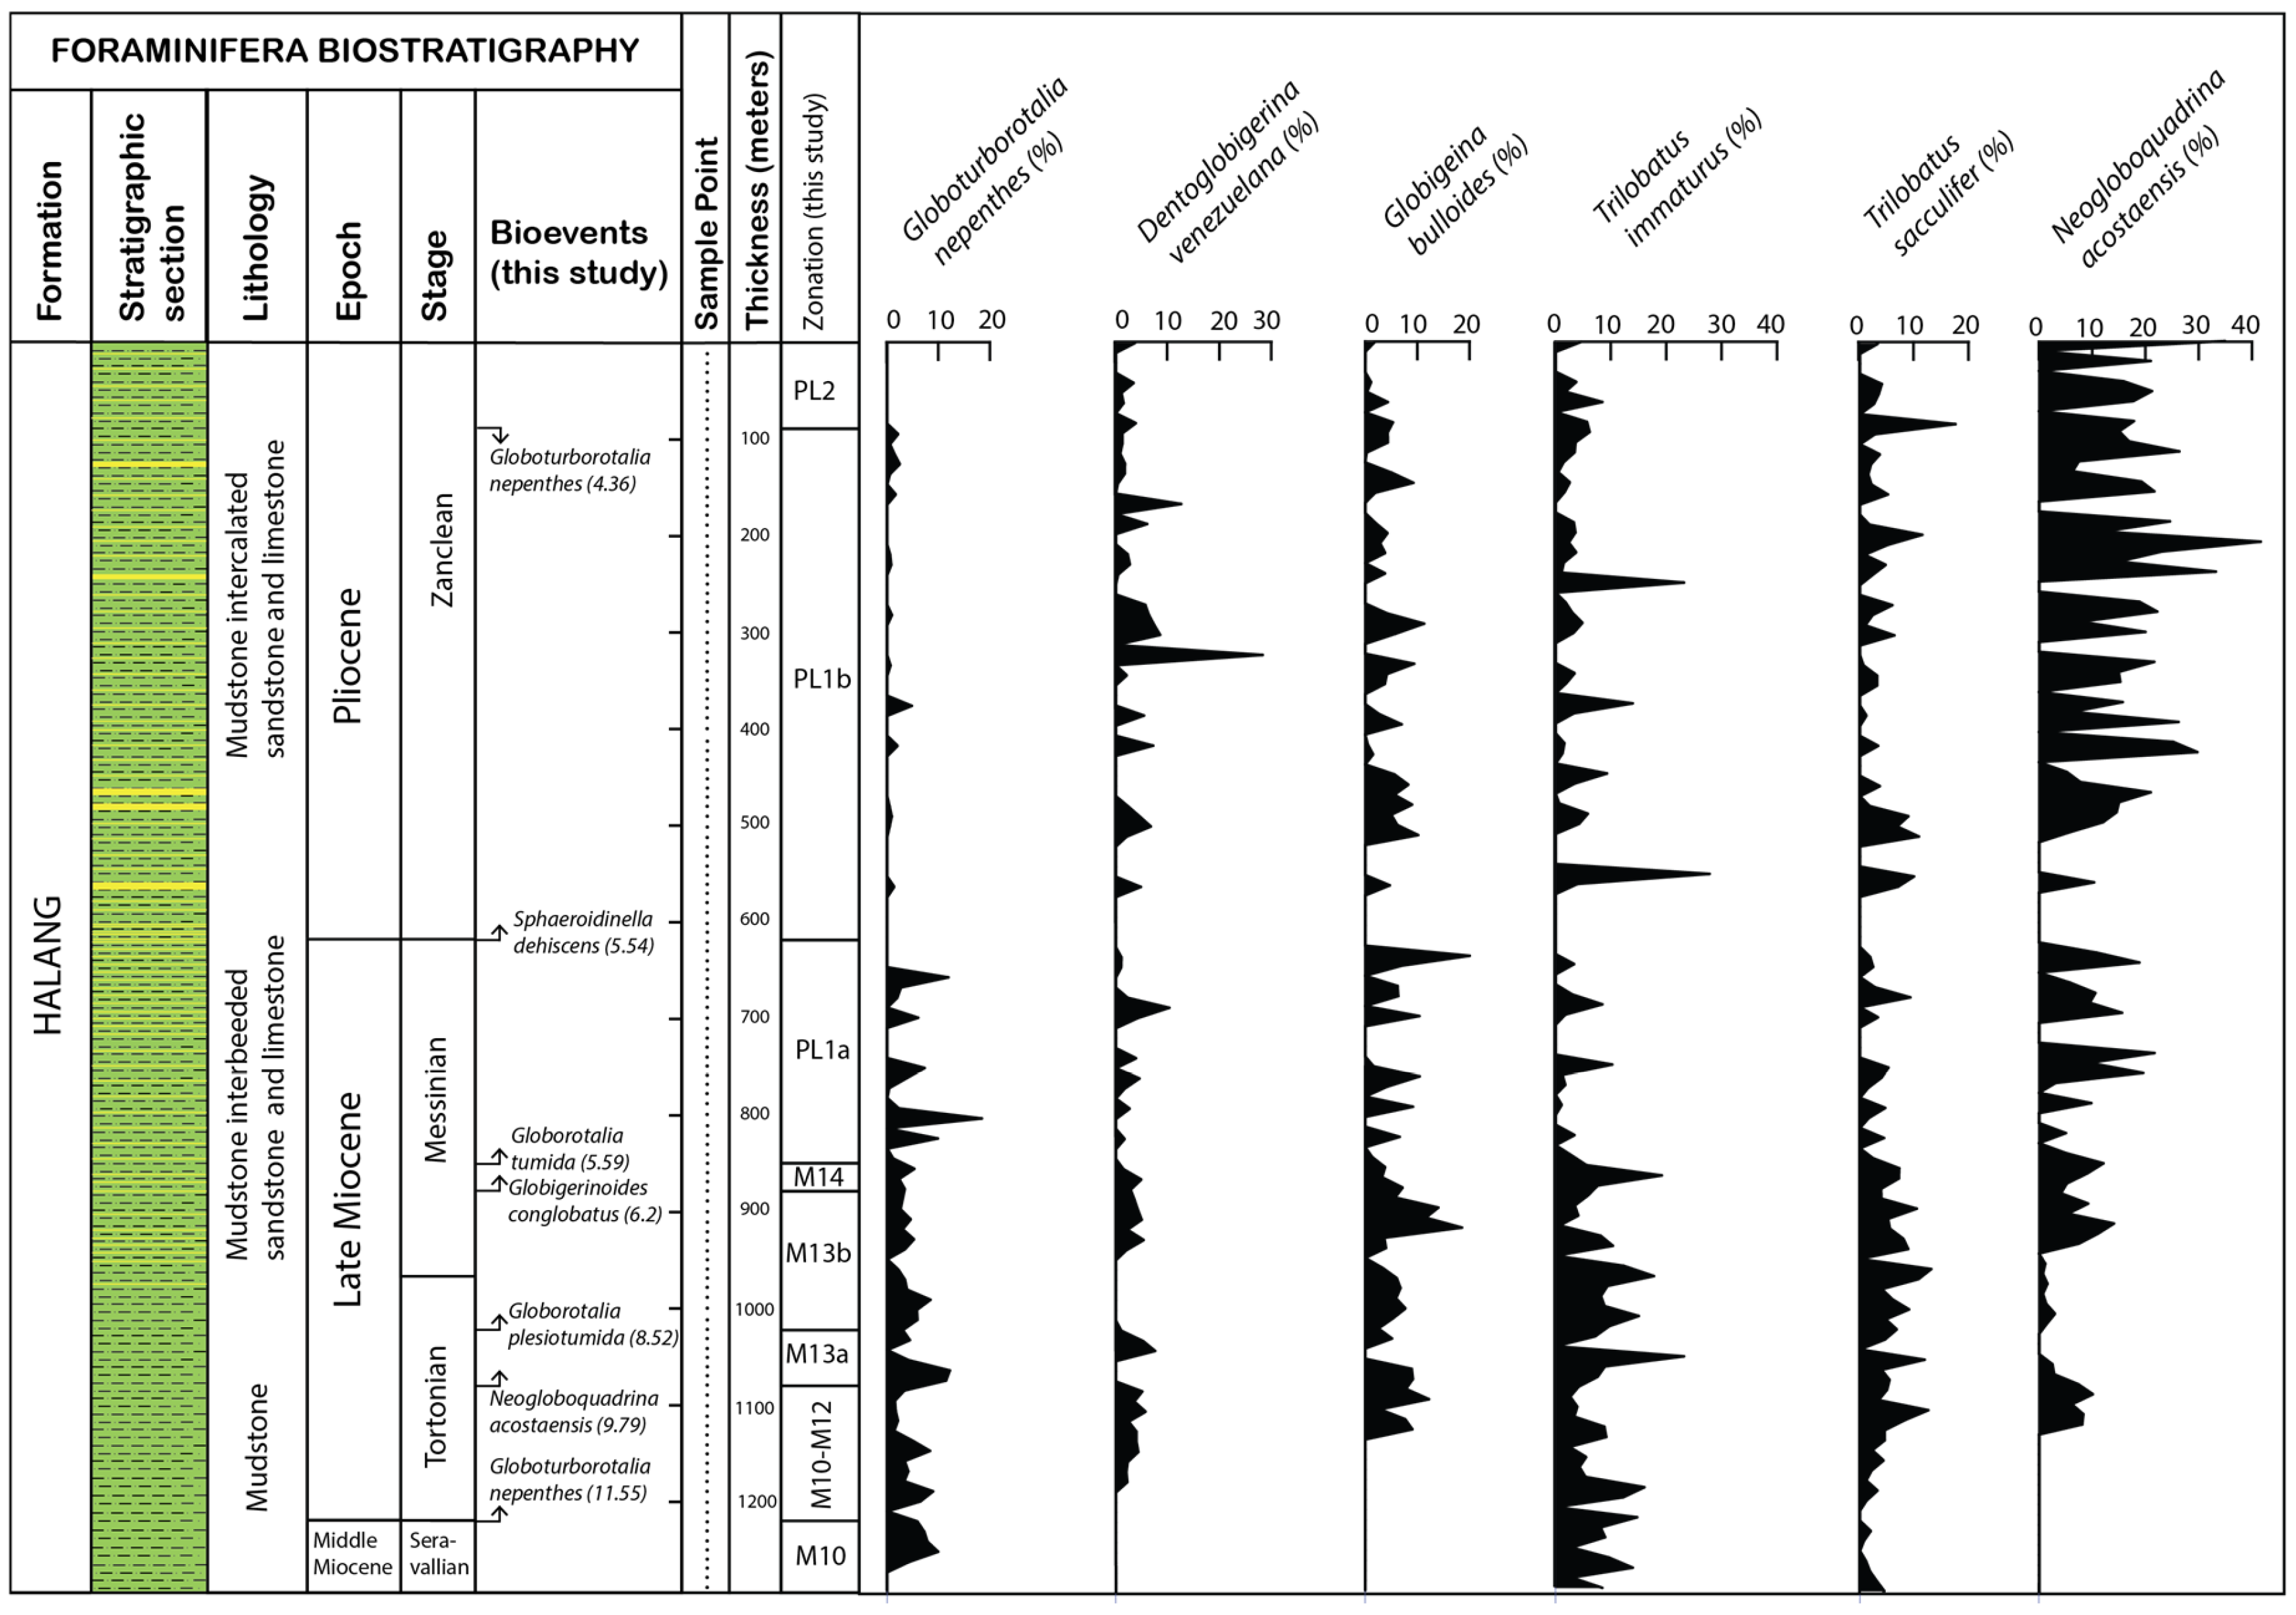
Distribution percentage of the planktonic foraminifera in the Middle Miocene to Pleistocene Halang Formation at the Kali Pasir section, Banyumas, Central Java.
Figure 5.
Distribution percentages of the planktonic foraminifera in the Middle Miocene to Pleistocene Halang Formation at the Kali Pasir section, Banyumas, Central Java.
Figure 6.
Planktonic foraminifera assemblages from the Halang Formation. (a) Ventral view: Orbulina universa, (b,c) dorsal–ventral view: Globigerinoides sacculifer, (d,e) ventral–dorsal view: Dentoglobigerina altispira, (f–h) ventral–dorsal–periphery: Trilobatus trilobus, (i–k) ventral–dorsal–periphery: Neogloboquadrina dutertrei, (l) ventral view: Globigerinoides bulloides.
Figure 7.
Planktonic foraminifera assemblages from the Halang Formation. (a) Dextral view: Globigerina bulloides, (b,c) ventral–dextral view: Globorotalia plesiotumida. (d,e) Ventral–dextral view: Globorotalia tumida, (f,g) dextral–ventral view: Globigerinella obesa, (h,i) ventral–dorsal view: Globigerinoides extremus, (j,k) ventral–dorsal view: Sphaeroidinellopsis seminulina, (l) ventral view: Globorotalia margaritae.
4.2. Planktonic Foraminifera Bio-Zones
Seven bio-datums based on the first occurrence (FO) and the last occurrence (LO) of six marker species (Figure 3) divide the studied section into seven zones ranging from N13/M10 to N19/P2 [10,49,51], which correlate to the Middle Miocene to Early Pliocene ages. Biostratigraphic zones of the Halang Formation along the studied section comprise eight planktic foraminifera bio-zones of [10], which are M10, M11/M12, M13a, M13b, M14, PL1a, PL1b, and PL2 (Figure 3). These zones correlate to N13-N19 from previous bio-zones [48,50]. More detailed information of each bio-zone is described below:
Zone M10
Interval: Sample depth of 1240 m to 1210 m. Thickness: 30 m.
Age: Serravallian
Definition: From the occurrence of Globorotalia praescitula to the first occurrence (FO) of Globoturborotalia nepenthes/11.55 Ma [10].
In this zone, the preservation of planktonic foraminifera is moderate to good. The last appearance of Globorotalia praescitula is not identified but the occurrences of Globigerinoides subquadratus might support the conclusion of the M10 zone [10]. This zone corresponds to the N13 zone of [48,50].
Zone M11-M12
Interval: Sample depth of 1210 m to 1080 m. Thickness: 130 m.
Age: Tortonian
Definition: From the occurrence of the FO Globoturborotalia nepenthes (11.55 Ma) to FO of Neogloboquadrina acostaensis (9.79 Ma) [10]
The lower boundary of M12 identified by Paragloborotalia mayeri is not discovered in our section and the upper boundary of M12 can be identified as the FO Neogloboquadrina acostaensis (9.79 Ma) [10]. Therefore, zone M11-M12 corresponds to the lower part of zone N14 and the lower part of zone N16 [48,49,50].
Zone M13
Interval: Sample depth of 1080 m to 880 m. Thickness: 300 m.
Age: Tortonian–Messinian
Definition: From the occurrence of the FO Neogloboquadrina acostaensis (9.79 Ma) to the FO of Globigerinoides conglobatus (6.2 Ma) [10].
In this study, this zone spans from the FO of Globorotalia acostaensis (1080 m) to the FO of Globorotalia plesiotumida (1020 m/8.62 Ma) [10] as subzone M13a. Sub-zone M13b is identified from the FO Globorotalia plesiotumida to the FO Globigerinoides conglobatus (880 m/6.2 Ma). The M13 zone corresponds to the N16 zone [49,50,51].
Zone M14
Interval: Sample depth of 880 m to 850 m. Thickness: 30 m.
Age: Messinian
Definition: From the occurrence of the FO Globigerinoides conglobatus (6.2 Ma) to the FO of Globorotalia tumida (5.59 Ma) [10].
In this study, zone M14 is identified from the FO of Globigerinoides conglobatus (880 m) to the FO of Globorotalia tumida (850 m). The FO of Globigerinoides conglobatus is defined as the boundary of M14, whereas the marker of Globorotalia lenguaensis [10] cannot be discovered in our section. In the definition of zonation [49], the interval of M14 corresponds to the N17 zonation. This zone (M14) also encompasses the N17b sub-zones [48,50].
Zone PL1
Interval: Sample depth of 880 m to 90 m. Thickness: 790 m.
Age: Messinian–Zanclean
Definition: From the occurrence of the FO Globorotalia tumida (5.59 Ma) to the LO of Globoturborotalia nepenthes (4.36 Ma) [10].
Zone PL1 is the longest zone in the section in the Banyumas basin with a length of 790 m. In this record, the FO of Globorotalia tumida (850 m) occurs at the base of PL1 and the LO of Globoturborotalia nepenthes (90 m) was used to detect the top of the zone. Globigerinoides conglobatus, Globorotalia crassaformis, and Hastigerina pelagica made their first appearance in the lowermost part of the zone, while Pulleniatina primalis and Globorotalia flexuosa occur initially in its middle part. Globorotalia miocenica and Pulleniatina obliquiloculata firstly appear in the upper part of the zone. The PL1 zone corresponds to the N18-N19 zone [48,49,50]. Zone PL1 in our section is divided into two sub-zones, namely PL1a and PL1b (Figure 3). This sub-zone is separated by the FO of Sphaeroidinella dehiscens at 5.54 Ma [10]. The boundary between PL1a and PL1b at the sample depth of 620 m defines the Miocene/Pliocene Boundary in our section at Banyumas Basin.
Zone PL2
Interval: Sample depth of 90 m to the top of section. Thickness: 90 m.
Age: Zanclean
Definition: From the occurrence of the LO of Globoturborotalia nepenthes (4.96 Ma) to the unknown boundary in the top part [10]
In this study, zone PL2 is identified from the LO of Globoturborotalia nepethes (90 m) to the unknown species of the top of zone. Zone PL2 corresponds to the N19 zone according to previous studies [48,49,50].
5. Discussion
5.1. Changes in Depth of Thermocline
The vertical distribution of planktonic foraminifera is strongly influenced by the depth of the thermocline (DOT) in the upper water column [55]. When the thermocline deepens, mixed-layer species tend to dominate, whereas a shoaling thermocline favors thermocline-dwelling taxa [56,57]. Mixed-layer species such as Globigerinoides ruber, Orbulina universa, and Trilobatus sacculifer typically inhabit the surface waters [5], while thermocline dwellers including Globigerina bulloides, Globorotalia menardii, and Neogloboquadrina dutertrei occupy deeper layers below the mixed layer [5,55,57]. The relative abundance of these groups provides a qualitative proxy for DOT variability [55,57,58]. Our data reveal a marked increase in Trilobatus trilobus and Orbulina universa during the Late Miocene, suggesting a deepening of the mixed layer and possibly more stable stratification. Conversely, the decline in Globigerinella obesa as warm-to-temperate planktonic foraminifera associated with nutrient-rich and productive waters [59] may indicate reduced nutrient availability during this interval. Similarly, the decrease in open-ocean thermocline species such as Sphaeroidinellopsis seminulina implies a diminished thermocline habitat, while the concurrent rise in surface-dwelling species such as Trilobatus immaturus and Globigerinoides bolli supports the interpretation of enhanced surface-layer dominance. These faunal shifts collectively indicate significant changes in upper ocean structure and productivity during the Late Miocene, likely linked to regional oceanographic and climatic evolution.
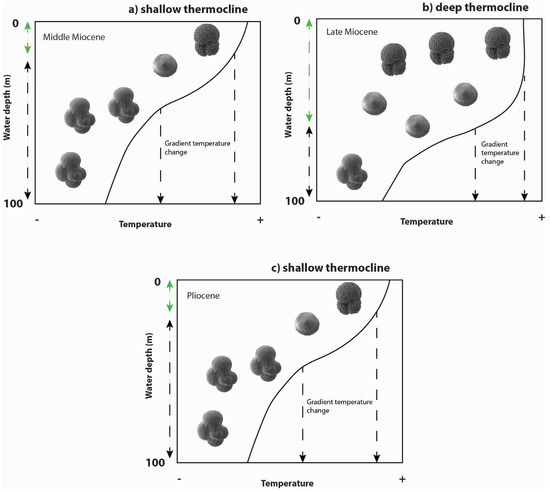
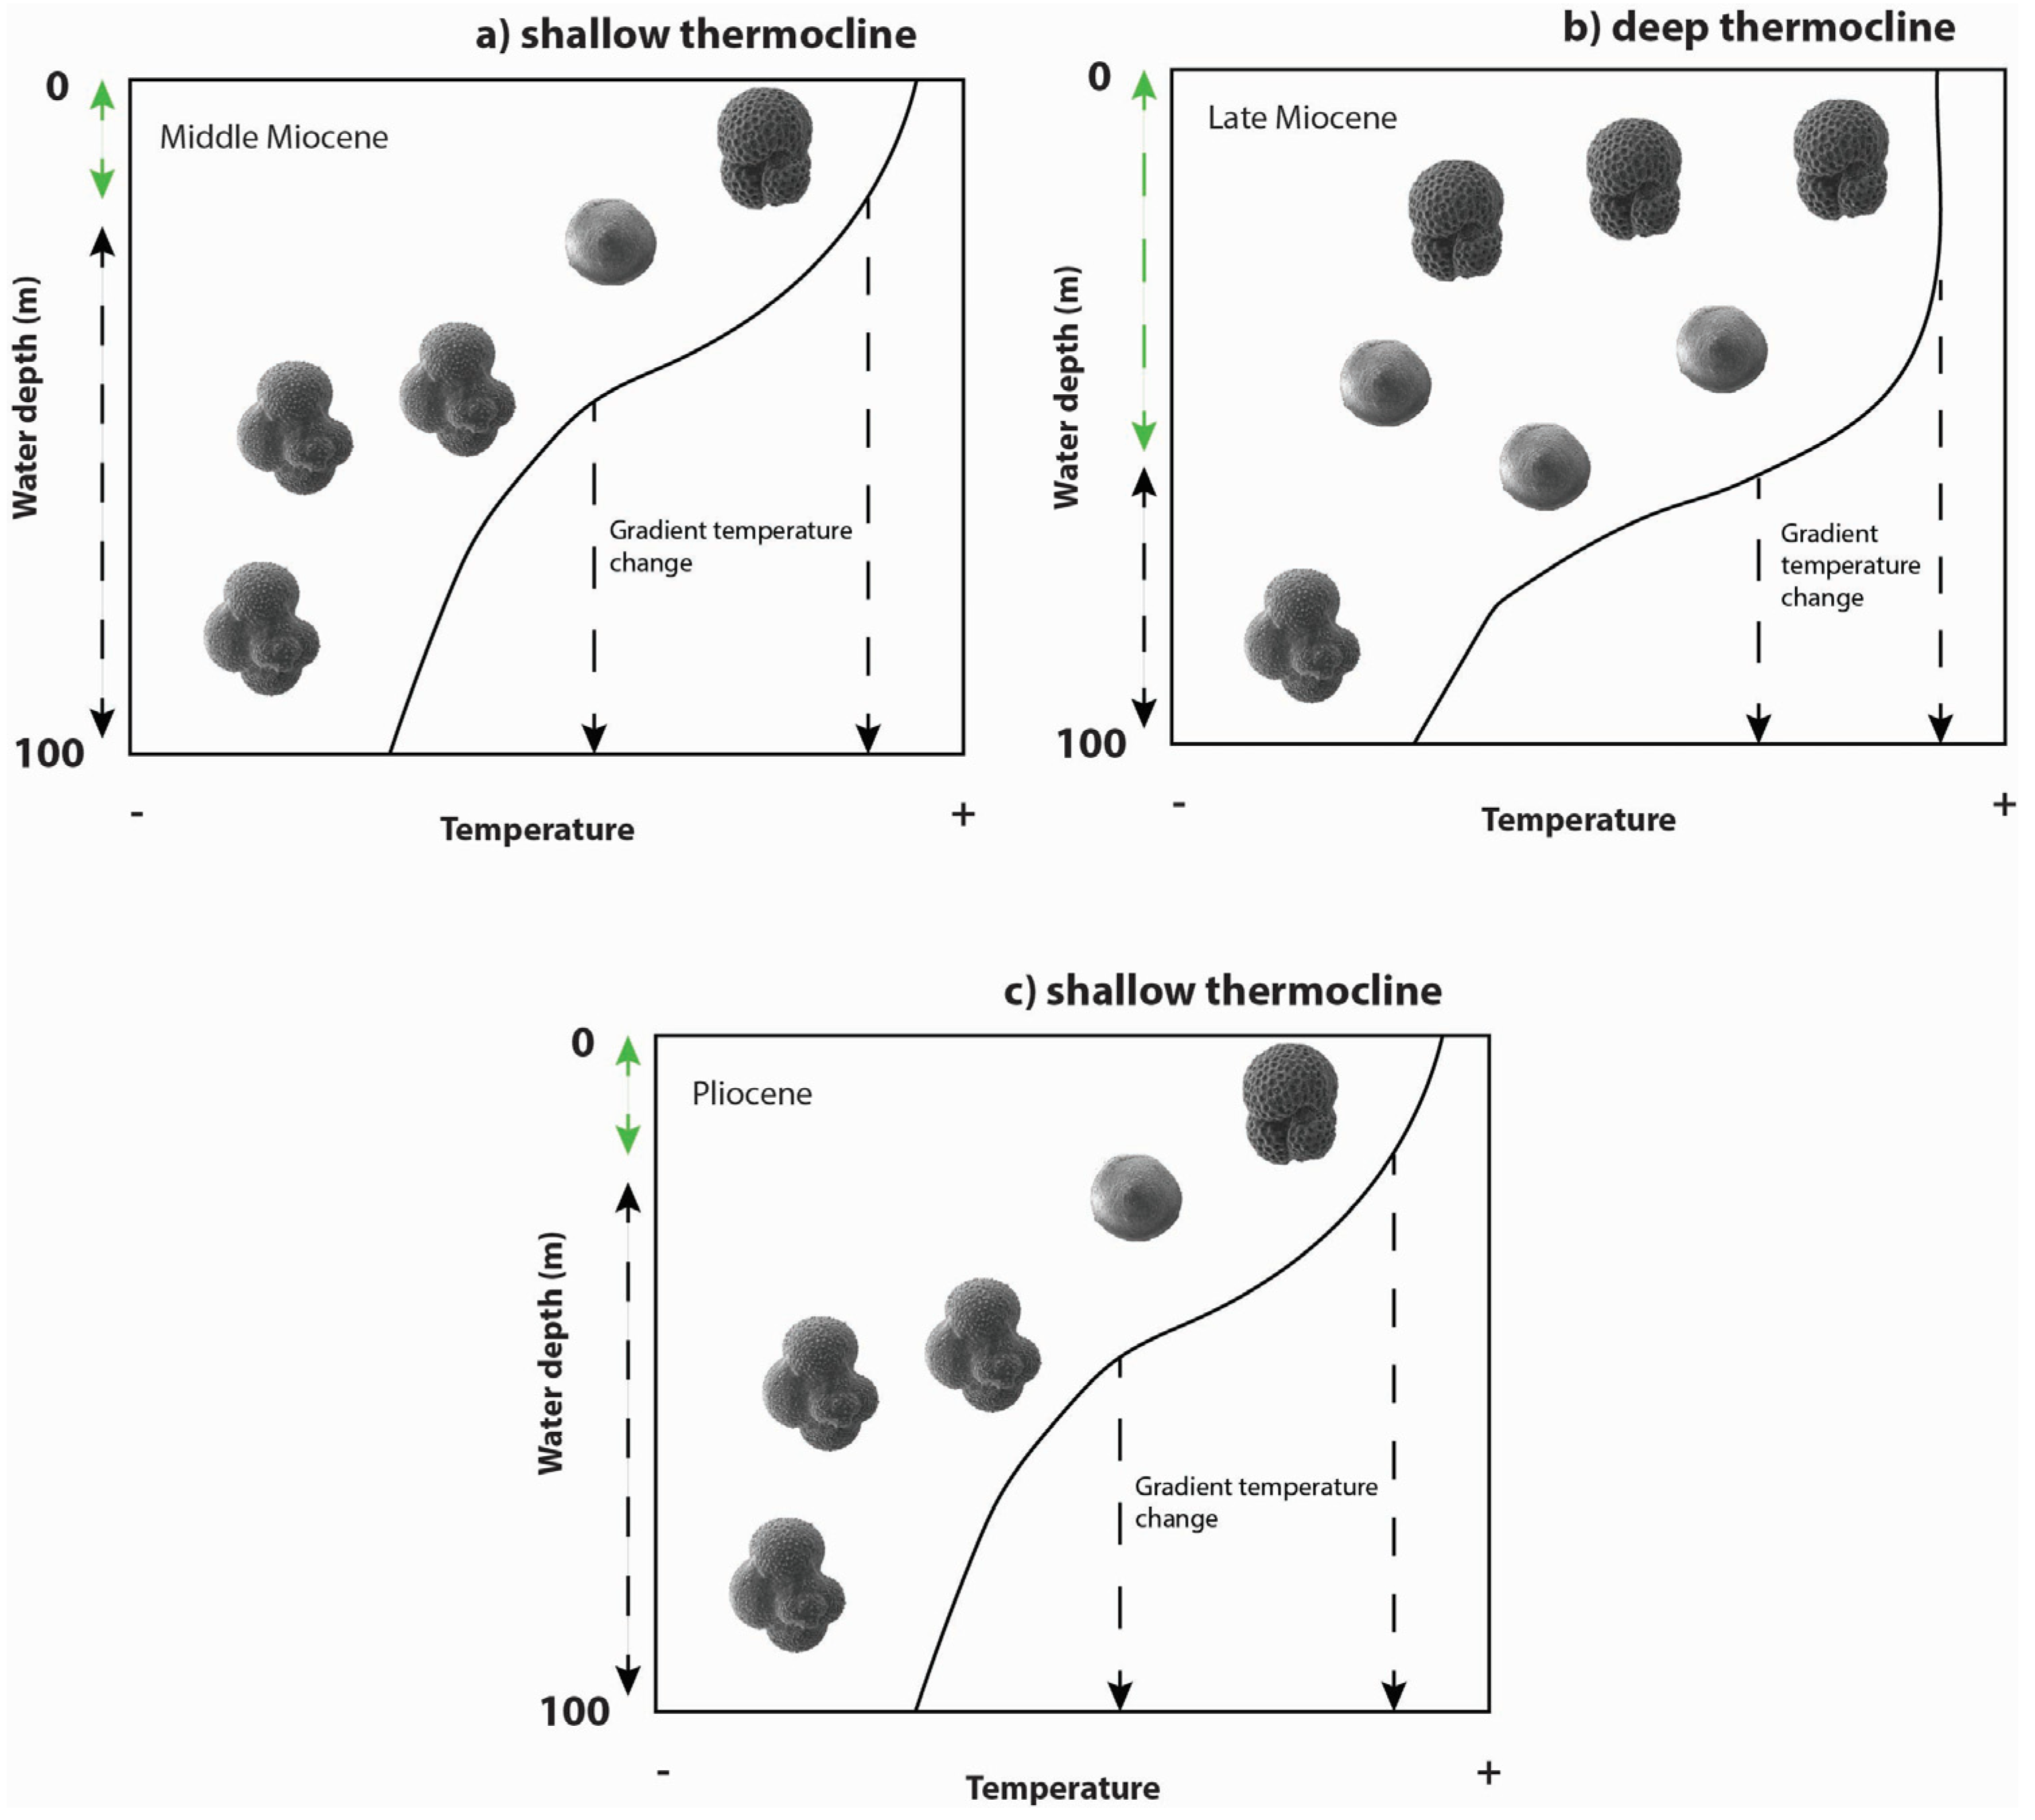
The abundance of mixed-layer-dwelling planktonic foraminifera species in Kali Pasir, Banyumas, increased significantly during the Late Miocene (Figure 3). Subsequently, they fluctuated from the bottom to the upper part of the Pliocene section. Differently, the abundance of thermocline-dwelling species was higher during the Middle Miocene and the Pliocene. These evidences indicate that DOT shoaled during the Middle Miocene and deepened DOT during the Late Miocene as illustrated schematically in Figure 8. Fluctuating changes in DOT during Pliocene reflect complex factors affecting the south of Java region. We suppose that the changes in DOT in the upwelling region were controlled by monsoonal climate variations during the Miocene [60].
Figure 8.
Schematic depth of thermocline changes. (a) Middle Miocene shallow thermocline, (b) Late Miocene deep thermocline, (c) Pliocene shallow thermocline. Middle Miocene and Pliocene are interpreted as shallow thermoclines characterized by elevated percentages of Globigerinella obesa and reduced percentages of Orbulina universa and Trilobatus trilobus. Late Miocene is indicated by reduced percentage of Globigerinella obesa and increased percentage of Orbulina universa and Trilobatus trilobus. Green arrow indicates mixed layer strata and black arrow reflects thermocline layer.
The finding of the DOT deepening during the Late Miocene in the Banyumas Basin is compelling (Figure 3). The deepening of the DOT was supported by the increase in mixed-layer species Trilobatus trilobus and Orbulina universa. According to [60], evidence from the eastern Indian Ocean indicates that between the Middle and Late Miocene, carbonate deposition measured through carbonate mass accumulation rates (MARcarbonate; g cm−2 kyr−1) declined at the Ninety East Ridge, driven by intensification of Indian monsoonal wind and precipitation. An increase in precipitation in the Indian Ocean during the Late Miocene was also indicated by a high amount of terrigenous input in the Andaman Sea [61]. However, stable isotope data show a decrease in δ18O during the Late Miocene in the Solo River, Central Java, that suggests a decrease in temperature due to the closing of the Indonesian Sea or/and global cooling [26]. Based on modern observations, a decrease in temperature could be an impact of rising cool and dry wind patterns from Australia to the south of Java [62,63]. A similar situation may also have driven DOT shoaling and precipitation decrease during the Late Miocene.
5.2. Reduced Upwelling in the South of Java During the Late Miocene
In the modern setting, the mechanism of upwelling along the coast of Java and Sumatra is a response to regional winds associated with the monsoon climate [27]. However, the timing and strength of the upwelling signals are also significantly correlated with the subsequent Indian Ocean Dipole (IOD) peaks [64]. IOD involves prominent changes in the Walker circulation over the Indian Ocean, which weakens during positive IOD events and strengthens during negative IOD periods. In the eastern tropical Indian Ocean, the thermocline deepens and warms when the rainfall increases during the negative IOD and vice versa [65,66]. A more recent study suggested that the sensitivity of thermocline depth and rainfall in the eastern Indian Ocean is strongly associated with temperature change in the region [25].
We record a reduction in upwelling intensity during the Late Miocene based on the decrease in Trilobatus trilobus abundance (Figure 3). Reduced upwelling in the south of Java is supported by an increase in abundance of surface/mixed-layer species (i.e., Trilobatus sacculifer and Trilobatus immaturus) during that period (Figure 3), pointing to a warmer sea surface temperature (SST). However, our records indicate a contrasting result with the Late Miocene global cooling trends in the tropics [67,68]. We hypothesize that Walker circulation changes generated a reduction in upwelling over the eastern tropical Indian Ocean, which was combined with a deeper thermocline during the cooling climate in the Late Miocene. According to [25], an intensified Indian Walker circulation is associated with anomalous upward air movement over the eastern tropical Indian Ocean, accompanied by subsidence over its western counterpart [25]. Notably, our study presents the first recorded evidence of warmer SSTs during the Late Miocene in the eastern Indian Ocean.
5.3. Drivers of Upper Ocean Structural Changes in the Eastern Indian Ocean During the Late Miocene
Reduced upwelling and changes in upper ocean structure during the Late Miocene in the eastern Indian Ocean (Figure 3) may be related to enhanced surface water accumulation in equatorial regions, where throughflow across the narrowing Indonesian Seaway appears to have remained effective during this interval [69]. A thick surface layer associated with a deep thermocline (~170–300 m), characteristic of the Western Pacific Warm Pool (WPWP), occupies much of the tropical–subtropical western Pacific and extends into the eastern Indian Ocean [69]. We propose that the distribution and maintenance of this thickened surface layer in the eastern Indian Ocean were influenced not only by oceanic throughflow but also by atmospheric forcing associated with strengthened equatorial trade winds.
Evidence for enhanced upper-layer stratification in the eastern Indian Ocean is reflected in the increased abundance of Trilobatus trilobus at our study site (Figure 3), indicating persistent surface-layer stability. Intensified trade winds, potentially linked to collision-induced geographic reorganization between Australia, Southeast Asia, and the marginal western Pacific [69], may have promoted zonal redistribution of upper ocean mass. Stronger trade winds could have reinforced the Indian Walker circulation, resulting in a deepened thermocline and enhanced upper-layer stratification in the eastern Indian Ocean, contrasted by relatively shallower thermocline conditions in the western basin.
An increase in organic exports to the Indian Ocean seafloor occurred during the Late Miocene (11.2–8.2 Ma), as documented at the IODP Site U1443 on the Ninety East Ridge by a stepwise rise in Ba/Ti ratios and a sediment color shift from red to green [60]. This pattern has been interpreted as reflecting intensified chemical weathering and increased riverine input linked to summer monsoon-driven circulation. However, our new findings from the Banyumas Basin, based on planktonic foraminiferal assemblages (Figure 3, Figure 4, Figure 5, Figure 6 and Figure 7), indicate thermocline deepening and reduced vertical nutrient supply associated with weakened local upwelling. These structural changes in the upper water column are more consistent with a strengthened Indian Walker circulation than with intensified Indian summer monsoon forcing.
Additionally, changes in benthic foraminiferal assemblages at ~11 Ma indicating the presence of nutrient-rich intermediate water masses in the western equatorial Indian Ocean [70] support a basin-scale zonal reorganization of upper ocean structure. This zonal contrast suggests that enhanced Walker circulation may have driven differential thermocline depth and stratification intensity across the basin, ultimately modulating vertical nutrient flux and organic export to the eastern Indian Ocean seafloor.
6. Conclusions
We established the foraminiferal biostratigraphy from the Middle Miocene–Pliocene succession for the Halang Formation in the Banyumas Basin and reconstructed its paleoenvironmental condition during the Late Miocene. The results show that the depth of thermocline (DOT) deepening was characterized by the increase in abundance of mixed-layer planktonic foraminifera Trilobatus trilobus and the decrease in thermocline-dwelling species, including Globigerinella obesa. Reduced upwelling and enhanced upper-layer stratification in the south of Java are supported by more abundant surface/mixed-layer species (i.e., Trilobatus sacculifer and Trilobatus immaturus) in the Late Miocene. We propose that the distribution of relative warm water into the Indian Ocean is not only driven by oceanic forcing but also atmospheric forcing through the strengthening of equatorial trade winds. Reduced upwelling and a thickened surface layer during the Late Miocene in the eastern Indian Ocean could be related to more intensive warm water pile-up over the equatorial region where surface bypass flow through the narrowing Indonesia seaway appears to remain efficient. An enhanced upper-layer stratification in the eastern Indian Ocean throughout the Late Miocene was also maintained by intensified trade winds caused by collision-induced geographic changes. The trade winds could trigger a strengthening of Indian Walker circulation with warm surface water in the eastern Indian Ocean and cool surface water in the western Indian Ocean.
Author Contributions
Main contributors: M.H. and M.R.P. Member contributors: F.S.Y., R.K., W.E.M.P., A.U.H., L.J., P.P. and H.H. Conceptualization, M.H. and M.R.P.; Methodology, M.H., M.R.P., R.K., F.S.Y. and H.H.; Software, M.H.; Validation, M.H., M.R.P., L.J. and P.P.; Formal Analysis, M.H., W.E.M.P. and A.U.H.; Investigation, M.H., W.E.M.P. and A.U.H.; Resources, M.H. and H.H.; Data Curation, M.H.; Writing—Original Draft Preparation, M.H.; Writing—Review and Editing, M.H., M.R.P., R.K., F.S.Y., L.J., R.K. and H.H.; Visualization, M.H., H.H. and F.S.Y.; Supervision, M.R.P., R.K., L.J. and P.P.; Project Administration, W.E.M.P. and A.U.H.; Funding Acquisition, M.H., and M.R.P. Author P.P. passed away prior to the publication of this manuscript. All authors have read and agreed to the published version of the manuscript.
Funding
This research received funding of Penelitian, Pengabdian Masyarakat, dan Inovasi Institut Teknologi Bandung 2023—grant to M.R.P., ref. no. FITB.PPMI.1-4-2023. Softwares (Kaleidagraph version 5.0 and Adobe Illustrator 30.2.1) used for data analysis funded by Science and Impact Program 2025-grant to M.H., (code project: 0185-IDN-22-0015).
Data Availability Statement
The original data presented in the study are openly available in Zenodo repository at https://doi.org/10.5281/zenodo.17247857.
Acknowledgments
We acknowledge Andry Fauzi for assistance in the Banyumas fieldwork. We show gratitude to Amar for laboratory work. AI Ithenticate v2 was used only to check the structure of English writing.
Conflicts of Interest
The authors declare no conflicts of interest.
References
- Ngcamu, B.S. Climate Change Effects on Vulnerable Populations in the Global South: A Systematic Review. Nat. Hazards 2023, 118, 977–991. [Google Scholar] [CrossRef] [Scilit]
- Ripple, W.J.; Wolf, C.; Gregg, J.W.; Rockström, J.; Mann, M.E.; Oreskes, N.; Lenton, T.M.; Rahmstorf, S.; Newsome, T.M.; Xu, C.; et al. The 2024 State of the Climate Report: Perilous Times on Planet Earth. Bioscience 2024, 74, 812–824. [Google Scholar] [CrossRef] [Scilit]
- Bashiri, B.; Barzandeh, A.; Männik, A.; Raudsepp, U. Variability of Marine Heatwaves’ Characteristics and Assessment of Their Potential Drivers in the Baltic Sea over the Last 42 Years. Sci. Rep. 2024, 14, 22419. [Google Scholar] [CrossRef] [Scilit] [PubMed]
- Kageyama, M.; Braconnot, P.; Chiessi, C.M.; Rehfeld, K.; Ait Brahim, Y.; Dütsch, M.; Gwinneth, B.; Hou, A.; Loutre, M.F.; Hendrizan, M.; et al. Lessons from Paleoclimates for Recent and Future Climate Change: Opportunities and Insights. Front. Clim. 2024, 6, 1511997. [Google Scholar] [CrossRef] [Scilit]
- Katz, M.E.; Cramer, B.S.; Franzese, A.; Hönisch, B.; Miller, K.G.; Rosenthal, Y.; Wright, J.D. Traditional and Emerging Geochemical Proxies in Foraminifera. J. Foraminifer. Res. 2010, 40, 165–192. [Google Scholar] [CrossRef] [Scilit]
- Chaabane, S.; de Garidel-Thoron, T.; Giraud, X.; Schiebel, R.; Beaugrand, G.; Brummer, G.J.; Casajus, N.; Greco, M.; Grigoratou, M.; Howa, H.; et al. The FORCIS Database: A Global Census of Planktonic Foraminifera from Ocean Waters. Sci. Data 2023, 10, 354. [Google Scholar] [CrossRef] [Scilit]
- Spezzaferri, S. Planktonic Foraminiferal Paleoclimatic Implications across the Oligocene-Miocene Transition in the Oceanic Record (Atlantic, Indian and South Pacific). Palaeogeogr. Palaeoclimatol. Palaeoecol. 1995, 114, 43–74. [Google Scholar] [CrossRef] [Scilit]
- Van Gorsel, J.T.; Troelstra, S.R. Late Neogene Planktonic Foraminiferal Biostratigraphy and Climatostratigraphy of the Solo River Section (Java, Indonesia). Mar. Micropaleontol. 1981, 6, 183–209. [Google Scholar] [CrossRef] [Scilit]
- Hendrizan, M.; Kuhnt, W.; Holbourn, A. Variability of Indonesian Throughflow and Borneo Runoff During the Last 14 Kyr. Paleoceanography 2017, 32, 1054–1069. [Google Scholar] [CrossRef] [Scilit]
- Wade, B.S.; Pearson, P.N.; Berggren, W.A.; Pälike, H. Review and Revision of Cenozoic Tropical Planktonic Foraminiferal Biostratigraphy and Calibration to the Geomagnetic Polarity and Astronomical Time Scale. Earth. Sci. Rev. 2011, 104, 111–142. [Google Scholar] [CrossRef] [Scilit]
- Srinivasan, M.S.; Sinha, D.K. Early Pliocene Closing of the Indonesian Seaway: Evidence from North-East Indian Ocean and Tropical Pacific Deep Sea Cores. J. Asian Earth Sci. 1998, 16, 29–44. [Google Scholar] [CrossRef] [Scilit]
- Sharaf, E.F.; Boudagher-Fadel, M.K.; Simo, J.A.T.; Carrol, A.R. A Revision of the Biostratigraphy and Strontium Isotope Dating of Oligocene-Miocene Outcrops in East Java, Indonesia. Ber. Sedimentol. 2014, 30, 45–81. [Google Scholar]
- Luan, X.; Lunt, P. Eocene to Miocene Stratigraphic Controls in the Far East Java Sea: Implications for Stratigraphic Studies. Mar. Geol. 2021, 436, 106479. [Google Scholar] [CrossRef] [Scilit]
- Westerhold, T.; Marwan, N.; Drury, A.J.; Liebrand, D.; Agnini, C.; Anagnostou, E.; Barnet, J.S.K.; Bohaty, S.M.; De Vleeschouwer, D.; Florindo, F.; et al. An Astronomically Dated Record of Earth’s Climate and Its Predictability over the Last 66 Million Years. Science 2020, 369, 1383–1388. [Google Scholar] [CrossRef] [Scilit]
- Rae, J.W.B.; Zhang, Y.G.; Liu, X.; Foster, G.L.; Stoll, H.M.; Whiteford, R.D.M. Atmospheric Cobinf2einf over the Past 66 million Years from Marine Archives. Annu. Rev. Earth Planet. Sci. 2021, 49, 609–641. [Google Scholar] [CrossRef] [Scilit]
- Knorr, G.; Butzin, M.; Micheels, A.; Lohmann, G. A Warm Miocene Climate at Low Atmospheric CO2 Levels. Geophys. Res. Lett. 2011, 38, 1–5. [Google Scholar] [CrossRef] [Scilit]
- Holbourn, A.E.; Kuhnt, W.; Clemens, S.C.; Kochhann, K.G.D.; Jöhnck, J.; Lübbers, J.; Andersen, N. Late Miocene Climate Cooling and Intensification of Southeast Asian Winter Monsoon. Nat. Commun. 2018, 9, 1584. [Google Scholar] [CrossRef] [Scilit]
- Steinthorsdottir, M.; Coxall, H.K.; de Boer, A.M.; Huber, M.; Barbolini, N.; Bradshaw, C.D.; Burls, N.J.; Feakins, S.J.; Gasson, E.; Henderiks, J.; et al. The Miocene: The Future of the Past. Paleoceanogr. Paleoclimatol. 2021, 36, e2020PA004037. [Google Scholar] [CrossRef] [Scilit]
- Herbert, T.D.; Lawrence, K.T.; Tzanova, A.; Peterson, L.C.; Caballero-Gill, R.; Kelly, C.S. Late Miocene Global Cooling and the Rise of Modern Ecosystems. Nat. Geosci. 2016, 9, 843–847. [Google Scholar] [CrossRef] [Scilit]
- Pound, M.J.; Haywood, A.M.; Salzmann, U.; Riding, J.B. Global Vegetation Dynamics and Latitudinal Temperature Gradients during the Mid to Late Miocene (15.97–5.33 Ma). Earth. Sci. Rev. 2012, 112, 1–22. [Google Scholar] [CrossRef] [Scilit]
- Bolton, C.T.; Stoll, H.M. Late Miocene Threshold Response of Marine Algae to Carbon Dioxide Limitation. Nature 2013, 500, 558–562. [Google Scholar] [CrossRef] [Scilit] [PubMed]
- Drury, A.J.; Liebrand, D.; Westerhold, T.; Beddow, H.M.; Hodell, D.A.; Rohlfs, N.; Wilkens, R.H.; Lyle, M.; Bell, D.B.; Kroon, D.; et al. Climate, Cryosphere and Carbon Cycle Controls on Southeast Atlantic Orbital-Scale Carbonate Deposition since the Oligocene (30-0 Ma). Clim. Past 2021, 17, 2091–2117. [Google Scholar] [CrossRef] [Scilit]
- Steinke, S.; Groeneveld, J.; Johnstone, H.; Rendle-Bühring, R. East Asian Summer Monsoon Weakening after 7.5Ma: Evidence from Combined Planktonic Foraminifera Mg/Ca and Δ18O (ODP Site 1146; Northern South China Sea). Palaeogeogr. Palaeoclimatol. Palaeoecol. 2010, 289, 33–43. [Google Scholar] [CrossRef] [Scilit]
- Zhang, Z.; Ramstein, G.; Schuster, M.; Li, C.; Contoux, C.; Yan, Q. Aridification of the Sahara Desert Caused by Tethys Sea Shrinkage during the Late Miocene. Nature 2014, 513, 401–404. [Google Scholar] [CrossRef] [Scilit]
- Mohtadi, M.; Prange, M.; Schefuß, E.; Jennerjahn, T.C. Late Holocene Slowdown of the Indian Ocean Walker Circulation. Nat. Commun. 2017, 8, 1015. [Google Scholar] [CrossRef] [Scilit]
- Akmaludin; Watanabe, K.; Kano, A.; Rahardjo, W. Miocene Warm Tropical Climate: Evidence Based on Oxygen Isotope in Central Java, Indonesia. Int. J. Environ. Earth Sci. 2010, 1, 52–56. [Google Scholar]
- Susanto, R.D.; Gordon, A.L.; Zheng, Q. Upwelling along the Coast of Java and Sumatra and Its Relation to ENSO. Geophys. Res. Lett. 2001, 28, 1599–1602. [Google Scholar] [CrossRef] [Scilit]
- Pfeiffer, M.; Takayanagi, H.; Reuning, L.; Watanabe, T.K.; Ito, S.; Garbe-Schönberg, D.; Watanabe, T.; Wu, C.C.; Shen, C.C.; Zinke, J.; et al. A Sub-Fossil Coral Sr/Ca Record Documents Northward Shifts of the Tropical Convergence Zone in the Eastern Indian Ocean. Clim. Past 2025, 21, 211–237. [Google Scholar] [CrossRef] [Scilit]
- Cahyarini, S.Y.; Pfeiffer, M.; Reuning, L.; Liebetrau, V.; Dullo, W.-C.h.r.; Takayanagi, H.; Anwar, I.P.; Utami, D.A.; Garbe-Schönberg, D.; Hendrizan, M.; et al. Modern and Sub-Fossil Corals Suggest Reduced Temperature Variability in the Eastern Pole of the Indian Ocean Dipole during the Medieval Climate Anomaly. Sci. Rep. 2021, 11, 14952. [Google Scholar] [CrossRef] [Scilit]
- Horii, T.; Ueki, I.; Ando, K. Coastal Upwelling Events along the Southern Coast of Java during the 2008 Positive Indian Ocean Dipole. J. Oceanogr. 2018, 74, 499–508. [Google Scholar] [CrossRef] [Scilit]
- Purwasatriya, E.B.; Surjono, S.S.; Amijaya, D.H. Sejarah Geologi Pembentukan Cekungan Banyumas Serta Implikasinya Terhadap Sistem Minyak Dan Gas Bumi. Din. Rekayasa 2019, 15, 25. [Google Scholar] [CrossRef] [Scilit]
- Purwasatriya, E.B.; Gibran, A.K.; Rizki Aditama, M.; Waluyu, G. Sedimentologi Dan Tektonostratigrafi Formasi Halang Di Cekungan Banyumas Serta Potensinya Untuk Reservoir Hidrokarbon. J. Geol. Sumberd. Miner. 2021, 22, 153–163. [Google Scholar] [CrossRef] [Scilit]
- Setiawan, A.; Zulfakriza, Z.; Nugraha, A.D.; Rosalia, S.; Priyono, A.; Widiyantoro, S.; Sahara, D.P.; Marjiyono, M.; Setiawan, J.H.; Lelono, E.B.; et al. Delineation of Sedimentary Basin Structure beneath the Banyumas Basin, Central Java, Indonesia, Using Ambient Seismic Noise Tomography. Geosci. Lett. 2021, 8, 31. [Google Scholar] [CrossRef] [Scilit]
- Gallagher, S.J.; Auer, G.; Brierley, C.M.; Fulthorpe, C.S.; Hall, R. Cenozoic History of the Indonesian Gateway. Annu. Rev. Earth Planet. Sci. 2024, 52, 581–604. [Google Scholar] [CrossRef] [Scilit]
- Hall, R. Southeast Asia’s Changing Palaeogeography. Blumea—J. Plant Taxon. Plant Geogr. 2009, 54, 148–161. [Google Scholar] [CrossRef] [Scilit]
- Sutadiwiria, Y.; Purwasatriya, E.B.; Cahyaningratri, P.R.; Syavitri, D.; Maulani, M.; Giovany, A.A.; Ramadhan, A.K. Oil to Source Rock Correlation of Besuki Area and Its Role in Petroleum System of Banyumas Basin. Sci. Contrib. Oil Gas. 2022, 45, 153–167. [Google Scholar] [CrossRef] [Scilit]
- Prihatmoko, S.; Idrus, A. Gold Mineralization in the Ajibarang and Majenang Blocks, Central Java, Indonesia: Evidence of Mineral Fertility of the Banyumas Basin. Geol. J. 2022, 57, 1005–1021. [Google Scholar] [CrossRef] [Scilit]
- Praptisih, P.; Kamtono, K. Fasies Turbidit Formasi Halang Di Daerah Ajibarang, Jawa Tengah. J. Geol. Indones. 2011, 6, 13–27. [Google Scholar]
- Rizal, Y.; Lagona, R.; Dwijo Santoso, W. Turbidite Facies Study of Halang Formation on Pangkalan River, Karang Duren-Dermaji Village, Banyumas District, Central Java—Indonesia. IOP Conf. Ser. Earth Environ. Sci. 2017, 71, 012032. [Google Scholar] [CrossRef] [Scilit]
- Rizal, Y.; Tampubolon, R.A.; Santoso, W.D.; Rudyawan, A. Sediment Fasies of Upper Part of Late Miocene Halang Formation in Kali Tajum, Gumelar Area, Banyumas—Central Java, Indonesia. Mod. Appl. Sci. 2019, 13, 8. [Google Scholar] [CrossRef] [Scilit]
- Purwasatriya, E.B.; Surjono, S.S.; Amijaya, D.H. New Paradigm to Understanding Turbidite Sediment in Banyumas Basin. AIP Conf. Proc. 2019, 2094, 020009. [Google Scholar] [CrossRef] [Scilit]
- Herdiansyah, F.; Burhannudinnur, M.; Syavitri, D. An Unique of the Late Miocene Turbidite Succession in Brebes and Banyumas Central Java. AIP Conf. Proc. 2021, 2363, 040002. [Google Scholar] [CrossRef] [Scilit]
- Hidayat, H.; Subagio, S.; Praromadani, Z.S. Interpretasi Struktur Geologi Bawah Permukaan Berdasarkan Updating Data Gaya Berat Cekungan Banyumas, Jawa Tengah. J. Geol. Sumberd. Miner. 2020, 17, 3. [Google Scholar] [CrossRef] [Scilit]
- Hendrizan, M. Nutrient Level Change Based on Calcareous Nannofossil Assemblages During Late Miocene in Banyumas Subbasin. Indones. J. Geosci. 2016, 3, 183–194. [Google Scholar] [CrossRef] [Scilit]
- Glaubke, R.H.; Thirumalai, K.; Schmidt, M.W.; Hertzberg, J.E. Discerning Changes in High-Frequency Climate Variability Using Geochemical Populations of Individual Foraminifera. Paleoceanogr. Paleoclimatol. 2021, 36, e2020PA004065. [Google Scholar] [CrossRef] [Scilit]
- D’onofrio, R.; Luciani, V.; Dickens, G.R.; Wade, B.S.; Turner, S.K. Demise of the Planktic Foraminifer Genus Morozovella during the Early Eocene Climatic Optimum: New Records from Odp Site 1258 (Demerara Rise, Western Equatorial Atlantic) and Site 1263 (Walvis Ridge, South Atlantic). Geosciences 2020, 10, 88. [Google Scholar] [CrossRef] [Scilit]
- Nguyen, T.M.P.; Petrizzo, M.R.; Stassen, P.; Speijer, R.P. Dissolution Susceptibility of Paleocene-Eocene Planktic Foraminifera: Implications for Palaeoceanographic Reconstructions. Mar. Micropaleontol. 2011, 81, 1–21. [Google Scholar] [CrossRef] [Scilit]
- Blow, W.H. Late Middle Eocene to Recent Planktonic Foraminiferal Biostratigraphy. In Proceedings of the First International Conference on Planktonic Microfossils; Brill Academic Publishers: Leiden, The Netherlands, 1969; Volume 1, pp. 199–422. [Google Scholar]
- Bolli, H.M.; Saunders, J.B.; Perch-Nielsen, K. Plankton Stratigraphy, Volume 1: Planktonic Foraminifera, Calcareous Nannofossils and Calpionellida; Cambridge University Press: Cambridge, UK, 1985; Volume 1. [Google Scholar]
- Kennett, J.P.; Srinivasan, M.S. Neogene Planktonic Foraminifera: A Phylogenetic Atlas; Hutchinson Ross: Stroudsberg, PA, USA, 1983; ISBN 9780879330705. [Google Scholar]
- Dowsett, H.; Robinson, M.; Foley, K.; Herbert, T.; Hunter, S.; Andersson, C.; Spivey, W. The Relative Stability of Planktic Foraminifer Thermal Preferences over the Past 3 Million Years. Geosciences 2023, 13, 71. [Google Scholar] [CrossRef] [Scilit]
- Santos, T.P.; Belem, A.L.; Barbosa, C.F.; Dokken, T.; Albuquerque, A.L.S. Paleoceanographic Reconstruction of the Western Equatorial Atlantic during the Last 40 Kyr. Palaeogeogr. Palaeoclimatol. Palaeoecol. 2014, 415, 14–20. [Google Scholar] [CrossRef] [Scilit]
- Lane, M.K.; Fehrenbacher, J.S.; Fisher, J.L.; Fewings, M.R.; Crump, B.C.; Risien, C.M.; Meyer, G.M.L.; Schell, F. Planktonic Foraminiferal Assemblages Reflect Warming during Two Recent Mid-Latitude Marine Heatwaves. Front. Mar. Sci. 2023, 10, 1155761. [Google Scholar] [CrossRef] [Scilit]
- Dowsett, H.; Robinson, M.; Foley, K.; Spivey, W. The Conundrum of Taxonomic Uniformitarianism in Planktic Foraminifera. Palaeontology 2025, 68, e70018. [Google Scholar] [CrossRef] [Scilit]
- Ravelo, A.C.; Fairbanks, R.G.; Philander, S.G.H. Reconstructing Tropical Atlantic Hydrography Using Planktonic Foraminifera and an Ocean Model. Paleoceanography 1990, 5, 409–431. [Google Scholar] [CrossRef] [Scilit]
- Spooner, M.I.; Barrows, T.T.; De Deckker, P.; Paterne, M. Palaeoceanography of the Banda Sea, and Late Pleistocene Initiation of the Northwest Monsoon. Glob. Planet. Change 2005, 49, 28–46. [Google Scholar] [CrossRef] [Scilit]
- Ding, X.; Bassinot, F.; Guichard, F.; Fang, N.Q. Indonesian Throughflow and Monsoon Activity Records in the Timor Sea since the Last Glacial Maximum. Mar. Micropaleontol. 2013, 101, 115–126. [Google Scholar] [CrossRef] [Scilit]
- Xu, J.; Kuhnt, W.; Holbourn, A.; Andersen, N.; Bartoli, G. Changes in the Vertical Profile of Indonesian Throughflow during Termination II: Evidence from the Timor Sea. Paleoceanography 2006, 21, 1–14. [Google Scholar] [CrossRef] [Scilit]
- Spezzaferri, S.; Coxall, H.K.; Olsson, R.K.; Hemleben, C. Chapter 6 Taxonomy, Biostratigraphy, and Phylogeny of Oligocene Globigerina, Globigerinella, and Quiltyella N. Gen. In Atlas of Oligocene Planktonic Foraminifera; Cushman Foundation for Foraminiferal Research Inc.: Glen Allen, VA, USA, 2018; Volume 46. [Google Scholar]
- Lübbers, J.; Kuhnt, W.; Holbourn, A.E.; Bolton, C.T.; Gray, E.; Usui, Y.; Kochhann, K.G.D.; Beil, S.; Andersen, N. The Middle to Late Miocene “Carbonate Crash” in the Equatorial Indian Ocean. Paleoceanogr. Paleoclimatol. 2019, 34, 813–832. [Google Scholar] [CrossRef] [Scilit]
- Chakraborty, A.; Ghosh, A.K. Ocean Upwelling and Intense Monsoonal Activity Based on Late Miocene Diatom Assemblages from Neil Island, Andaman and Nicobar Islands, India. Mar. Micropaleontol. 2016, 127, 26–41. [Google Scholar] [CrossRef] [Scilit]
- Schröder, J.F.; Kuhnt, W.; Holbourn, A.; Beil, S.; Zhang, P.; Hendrizan, M.; Xu, J. Deglacial Warming and Hydroclimate Variability in the Central Indonesian Archipelago. Paleoceanogr. Paleoclimatol. 2018, 33, 974–993. [Google Scholar] [CrossRef] [Scilit]
- Hendrizan, M.; Kuhnt, W.; Holbourn, A.; Cahyarini, S.Y.; Ningsih, N.S. Kalimantan Hydroclimate Variability since the Last Glacial Period. Int. J. Earth Sci. 2023, 112, 615–629. [Google Scholar] [CrossRef] [Scilit]
- Horii, T.; Siswanto, E.; Iskandar, I.; Ueki, I.; Ando, K. Can Coastal Upwelling Trigger a Climate Mode? A Study on Intraseasonal-Scale Coastal Upwelling Off Java and the Indian Ocean Dipole. Geophys. Res. Lett. 2022, 49, e2022GL098733. [Google Scholar] [CrossRef] [Scilit]
- Saji, N.; Goswami, B.; Vinayachandran, P.; Yamagata, T. A Dipole Mode in the Tropical Ocean. Nature 1999, 401, 360–363. [Google Scholar] [CrossRef] [Scilit]
- Qiu, Y.; Cai, W.; Li, L.; Guo, X. Argo Profiles Variability of Barrier Layer in the Tropical Indian Ocean and Its Relationship with the Indian Ocean Dipole. Geophys. Res. Lett. 2012, 39, 1–5. [Google Scholar] [CrossRef] [Scilit]
- Ao, H.; Rohling, E.J.; Zhang, R.; Roberts, A.P.; Holbourn, A.E.; Ladant, J.B.; Dupont-Nivet, G.; Kuhnt, W.; Zhang, P.; Wu, F.; et al. Global Warming-Induced Asian Hydrological Climate Transition across the Miocene–Pliocene Boundary. Nat. Commun. 2021, 12, 6935. [Google Scholar] [CrossRef] [Scilit]
- Martinot, C.; Bolton, C.T.; Sarr, A.C.; Donnadieu, Y.; Garcia, M.; Gray, E.; Tachikawa, K. Drivers of Late Miocene Tropical Sea Surface Cooling: A New Perspective from the Equatorial Indian Ocean. Paleoceanogr. Paleoclimatol. 2022, 37, e2021PA004407. [Google Scholar] [CrossRef] [Scilit]
- Li, Q.; Li, B.; Zhong, G.; McGowran, B.; Zhou, Z.; Wang, J.; Wang, P. Late Miocene Development of the Western Pacific Warm Pool: Planktonic Foraminifer and Oxygen Isotopic Evidence. Palaeogeogr. Palaeoclimatol. Palaeoecol. 2006, 237, 465–482. [Google Scholar] [CrossRef] [Scilit]
- Smart, C.W.; Thomas, E.; Ramsay, A.T.S. Middle–Late Miocene Benthic Foraminifera in a Western Equatorial Indian Ocean Depth Transect: Paleoceanographic Implications. Palaeogeogr. Palaeoclimatol. Palaeoecol. 2007, 247, 402–420. [Google Scholar] [CrossRef] [Scilit]
Disclaimer/Publisher’s Note: The statements, opinions and data contained in all publications are solely those of the individual author(s) and contributor(s) and not of MDPI and/or the editor(s). MDPI and/or the editor(s) disclaim responsibility for any injury to people or property resulting from any ideas, methods, instructions or products referred to in the content. |
© 2026 by the authors. Licensee MDPI, Basel, Switzerland. This article is an open access article distributed under the terms and conditions of the Creative Commons Attribution (CC BY) license.