


Abstract
Conventional ecological risk assessment based on total heavy metal concentrations can identify high-risk areas but cannot determine which pollution sources dominate the risk or which elements drive source-specific risk. We developed a source-oriented framework integrating positive matrix factorization (PMF), GeoDetector-assisted source interpretation, source-resolved ecological risk assessment, and spatial attribution. The framework was applied to 191 topsoil samples from an industrial–mining town in South China for Cr, Zn, Pb, Cd, As, and Hg. PMF resolved three sources: an As-dominated mixed source (F1), an anthropogenic mixed source characterized by Cd–Pb–Zn (F2), and a Cr-rich factor with geological-background-related characteristics (F3). GeoDetector supported source interpretation, with F2 showing the clearest association with human-activity-related environmental stratification. Under the selected three-factor solution, F1, F2, and F3 accounted for 7.8%, 74.5%, and 17.7% of the summed ecological risk across the 191 sampling sites, respectively. Importantly, source composition and risk composition were not equivalent: F2 was compositionally dominated by Zn but its ecological risk was mainly driven by Cd, whereas F3 was dominated by Cr in composition but by Hg in risk. Source dominance became increasingly concentrated in F2 as total risk increased; all high- and very-high-risk sites were F2-dominated. Spatially, F2 showed the strongest clustering (Global Moran’s I = 0.2960), close to that of total risk (0.2711). Of the 12 stable high–high clusters of total risk, 11 were dominated by F2 and 11 by Cd. These results show that source-resolved risk attribution can identify priority sources and risk-driving elements obscured by conventional total-risk assessment, providing a direct basis for differentiated risk management in mixed-contamination areas.
1. Introduction
Soil heavy metals are characterized by persistence and accumulation, and their contamination and ecological effects have long been major concerns in soil environmental management [1]. In industrial–mining areas, soil heavy metals are often influenced by multiple processes, including soil parent materials and geochemical backgrounds, mining and smelting activities, industrial emissions and atmospheric deposition, transportation, and agricultural inputs, resulting in mixed sources and pronounced spatial heterogeneity [2,3,4]. Different sources vary in their elemental compositions and contributions, while individual elements differ in their geochemical backgrounds, bioavailability, and ecological toxicity [5,6]. Consequently, the contribution of a source to heavy metal accumulation does not necessarily reflect its contribution to potential ecological risk [7,8,9]. Conventional potential ecological risk assessments based on total elemental concentrations can identify risk levels and their spatial variations, but they provide limited information on which pollution sources dominate ecological risk and which elements within those sources are primarily responsible. This limitation makes it difficult to trace ecological risks back to specific pollution sources and priority risk elements for targeted management [10,11].
Receptor models provide important tools for quantitatively identifying potential sources of soil heavy metals. Methods such as positive matrix factorization (PMF) and absolute principal component scores–multiple linear regression (APCS-MLR) have been widely applied to identify potential sources and estimate their contributions to individual elemental concentrations [12,13,14]. In recent years, studies have also improved the reliability of source identification and quantitative apportionment by comparing the results of different receptor models or incorporating independent evidence, such as elemental isotope signatures [15,16]. Building on these approaches, source-oriented ecological and health risk assessments have further incorporated source-specific concentration contributions into risk models to quantify the relative contributions of different sources to overall risk and identify priority sources for control [17,18,19]. However, the pollutant composition of a source is not necessarily equivalent to its ecological risk composition. Because potential ecological risk assessment depends on elemental concentrations, background levels, and toxic-response factors, the element accounting for the largest proportion of a source’s mass composition may not be its dominant risk contributor. Similarly, a source with a high mass contribution may not contribute proportionally to the overall ecological risk [20,21]. Therefore, comparing source contribution proportions alone is insufficient to establish risk management priorities. It is also necessary to decompose source-specific ecological risk into individual elemental contributions, thereby distinguishing between which sources contribute most to pollutant accumulation and which sources and elements dominate ecological risk.
Furthermore, existing source-oriented risk studies have compared the overall risk contributions of different sources, identified priority risk sources, and analyzed dominant risk sources at individual sampling sites [8,10,21]. Meanwhile, spatial statistics and geographic information analysis have been used to identify spatial clusters of contamination and risk, delineate priority risk areas, and reveal spatial differences among pollution sources [22,23,24]. Previous studies have also attempted to integrate source apportionment results with spatial zoning and priority management strategies to support differentiated remediation [25]. However, regional source contributions, site-level dominant risk sources, and local high-value spatial clusters represent different levels of risk characterization. Linking these analytical results can help answer three related questions: which sources dominate ecological risk at specific locations, how this dominance changes with increasing total risk, and which sources and elements account for local high–high clusters of total ecological risk. Such integration can translate regional source-specific risk contributions into more spatially explicit risk attribution information.
Another important consideration is that receptor models initially identify latent factors characterized by specific elemental compositions, whereas the actual source types represented by these factors require further interpretation [26]. Conventional source identification generally relies on factor composition, combined with regional geological conditions, industrial facilities, mining activities, agricultural land use, and findings from previous studies [27,28]. When different sources exhibit similar elemental signatures or when natural background contributions overlap spatially with anthropogenic inputs, interpretation based solely on elemental composition may involve considerable uncertainty [29,30]. Spatial environmental information can provide an additional line of evidence for source interpretation. Geogenic sources may exhibit spatial patterns corresponding to parent materials and natural environmental variations, whereas anthropogenic sources may show spatial associations with mining areas, industrial facilities, roads, cropland, and the intensity of human activities [31,32,33]. In recent years, GeoDetector and other spatial analytical methods have been widely used to investigate spatial associations between soil heavy metals and natural or anthropogenic environmental variables, thereby assisting in identifying potential pollution sources and their influencing factors [34]. Therefore, integrating the elemental compositions of PMF factors with their spatial associations with environmental variables can provide supplementary evidence for interpreting potential source characteristics. Nevertheless, statistical associations must still be interpreted in the context of local environmental conditions.
Based on these considerations, this study develops a source-oriented ecological risk assessment framework integrating source apportionment, risk decomposition, and spatial attribution. First, PMF is employed to resolve potential sources from multi-element concentration data, while GeoDetector is used to examine the spatial correspondence between PMF factors and geological background, human activities, and natural environmental variables, providing supplementary evidence for source interpretation. Subsequently, PMF-derived source contributions are incorporated into the Håkanson potential ecological risk index to decompose conventional total ecological risk into source-specific and element-specific contributions at the sampling-site level. The pollutant composition, ecological risk composition, and spatial distribution of each source are then compared. On this basis, the dominant risk source at each sampling site is identified, and changes in source dominance across total ecological risk classes are examined. Global and local spatial autocorrelation analyses are further employed to identify spatially stable risk clusters and attribute local high–high clusters of total ecological risk to specific sources and risk-contributing elements. Thus, this study addresses not only how much ecological risk is contributed by different sources, but also which sources and elements dominate ecological risk at specific locations.
This study focuses on Maba Town, Qujiang District, Shaoguan City, Guangdong Province, China, a typical area affected by combined industrial and mining activities. The analysis is based on the concentrations of Cr, Zn, Pb, Cd, As, and Hg in 191 topsoil samples. Three research questions are addressed: (1) What are the elemental compositions, spatial distributions, and environmental associations of different PMF-derived potential sources, and how do these characteristics support their source interpretation? (2) Are the pollutant compositions of different sources consistent with their ecological risk compositions, and how do source-specific and element-specific risk contributions vary spatially? (3) How does source dominance at the sampling-site level change across total ecological risk levels, and which sources and risk-contributing elements account for local high–high clusters of total ecological risk? By integrating source apportionment, risk decomposition, and spatial attribution into a unified analytical framework, this study aims to advance from identifying pollution sources to identifying the sources and spatial attribution of ecological risk, thereby providing a basis for priority source control and spatially differentiated risk management in complex industrial–mining areas.
2. Materials and Methods
2.1. Study Area
The study area is Maba Town, Qujiang District, Shaoguan City, Guangdong Province, China (24°35′ N–24°45′ N, 113°30′ E–113°43′ E), covering approximately 190.98 km2 in the hilly region of southern China. It has a subtropical monsoon climate, with mean annual precipitation of 1500–1700 mm, most of which occurs from April to September. Topographically, the study area is characterized by higher elevations along the margins and relatively low terrain in the central part, with hills and alluvial valley plains as the dominant landforms. Geologically, the area lies on the southern margin of the Nanling metallogenic belt and is characterized by complex lithological and parent-material conditions. The local soil-background standard for Shaoguan distinguishes seven major parent-material units, including Quaternary sediments, purplish-red sandstone and shale, sandstone and shale, carbonate rocks, granite, acidic volcanic extrusive rocks, and metamorphic rocks, which exhibit substantial differences in geochemical background values.
Maba is also located within a long-established industrial–metallurgical region of Shaoguan. Large-scale steel production in the area dates back to the 1960s, and the Shaoguan iron-and-steel complex remains an important industrial facility in the Maba–Qujiang area. Maba is also located close to the Shaoguan Pb–Zn smelter, which has historically produced lead and zinc, with cadmium and mercury also involved in the smelting system. Its reported annual production capacity is approximately 350,000 t. Previous investigations in Maba and the wider Shaoguan industrial region have documented heavy-metal contamination associated with long-term smelting, industrial emissions, atmospheric deposition, and contaminated irrigation, particularly involving Cd, Pb, Zn, Hg, and As. These long-term industrial activities, together with traffic, agriculture, and the heterogeneous geological background, provide the regional context for mixed-source soil heavy-metal accumulation. The location of the study area and the spatial distribution of the 191 sampling sites are shown in Figure 1.
Figure 1.
Location of the study area and spatial distribution of sampling sites.
2.2. Sample Collection and Analysis
Soil sampling and pretreatment were performed in accordance with the Technical Specifications for Soil Environmental Monitoring (HJ/T 166–2004). A 2 km × 2 km grid was used as the spatial stratification framework for site layout, with several sites placed within each cell. Sampling locations were adjusted where access was restricted in military-controlled areas, industrial compounds, and scenic areas, while sampling density was locally increased in selected grid cells according to project requirements. A total of 191 topsoil samples (0–20 cm) were collected across the study area in March 2025. Based on the land-use/land-cover (LULC) classification, the 191 sampling sites comprised 121 sites (63.35%) in built-up areas, 47 (24.61%) in tree-covered areas, 13 (6.81%) in cropland, and 6 (3.14%) in rangeland. The remaining four sites (2.09%) were located on farmland adjacent to rivers or lakes. The sampling design aimed to achieve relatively even spatial coverage across the study area rather than proportional representation of individual land-cover types. This sampling strategy was intended to preserve location-specific concentration characteristics, including localized contamination peaks that might be diluted by composite sampling. The individual samples were therefore used to characterize contamination and ecological risk at specific locations rather than to estimate average concentrations across the sampling grid cells. All soil samples were naturally air-dried, followed by the removal of plant residues, gravel, and other impurities. The processed soil samples were crushed and sieved through a 2 mm mesh, and a portion of each sample was further ground and sieved through a 0.149 mm (100-mesh) sieve for subsequent experimental analysis.
The total concentrations of the six soil heavy metals were determined using element-specific analytical methods. Cd, Cr, Pb, and Zn were measured by inductively coupled plasma mass spectrometry (ICP-MS; model 7900) in accordance with HJ 1315–2023 [35]. Total Hg and As were determined by atomic fluorescence spectrometry (AFS; model AFS-8530), following GB/T 22105.1–2008 [36] and GB/T 22105.2–2008 [37], respectively. For ICP-MS determination, sample preparation followed the acid digestion procedures specified in HJ 1315–2023, involving HNO3–HCl digestion, subsequent HF–HClO4 treatment, and dilution prior to analysis. For Hg and As determination, soil aliquots were subjected to heated HNO3–HCl digestion according to GB/T 22105.1–2008 and GB/T 22105.2–2008, respectively. The method detection limits (mg kg−1) for the two analytical batches (TJ and HC/B) were 2/4 for Cr, 5/1 for Zn, 1/0.1 for Pb, 0.03/0.01 for Cd, 0.01/0.01 for As, and 0.002/0.002 for Hg, respectively. Quality assurance and quality control included the use of a certified soil reference material (GBW07405) and duplicate sample analyses. Ten percent of the samples were analyzed in duplicate, with relative deviations below 5%. The recoveries of the reference material ranged from 93% to 106%. Concentrations below the method detection limits (MDLs) were replaced with one-half of the corresponding MDLs for subsequent analyses. Among the 191 samples, only one Cd result (sample N0303-130, TJ batch) was reported as below the corresponding MDL (1/191, 0.52%) and was replaced with 0.015 mg kg−1. No samples had Cr, Zn, Pb, As, or Hg concentrations below their respective batch-specific MDLs (0/191, 0% for each element).
2.3. Environmental Variables and Data Processing
A set of environmental variables was compiled to characterize potential natural and anthropogenic controls on the spatial variation in soil heavy metals and PMF-derived source contributions. The variables were grouped into three categories according to their environmental meaning (Table S1).
The first category represented human activities and land-surface conditions, including nighttime light intensity (NTL), Euclidean distance to factories (ED_Fac), Euclidean distance to mining areas (ED_Min), Euclidean distance to roads (ED_Road), Euclidean distance to cropland (ED_Crop), land use/land cover (LULC), and PM10 concentration. NTL was used to characterize the intensity of human activities and urban–industrial disturbance; the four distance variables represented proximity to potential industrial, mining, traffic, and agricultural influences, respectively; LULC characterized differences in surface use and anthropogenic disturbance; and PM10 was included as a proxy for the potential influence of atmospheric particulate deposition.
The second category comprised natural environmental and topographic variables, including elevation (DEM), slope, height above nearest drainage (HAND), average precipitation (Pre_avg), maximum precipitation (Pre_max), and the normalized difference vegetation index (NDVI). These variables were used to characterize terrain conditions, hydrological connectivity, climatic conditions, vegetation cover, and the potential redistribution of heavy metals within the landscape.
The third category represented geological and soil background conditions and included parent material (PM) and soil organic carbon (SOC). Parent material reflects differences in lithological and geochemical background, whereas SOC can influence the adsorption, retention, and accumulation of heavy metals in soil.
Monthly precipitation data for 2023 were obtained from meteorological data assimilation products and temporally aggregated to derive the mean monthly precipitation (Pre_avg) and maximum monthly precipitation (Pre_max) at each grid cell. Selected coarse-resolution raster datasets, including precipitation, nighttime light intensity, and soil organic carbon, were resampled to approximately 30 m before raster values were extracted at the sampling locations. Other raster datasets retained their available spatial resolutions, while vector-based attributes were extracted through spatial overlay. This resampling did not increase the intrinsic spatial information content of the original datasets. PM and LULC were retained as categorical variables, whereas the remaining variables were treated as continuous variables. For GeoDetector analysis, continuous variables were subsequently discretized into categorical strata using the procedure described in Section 2.4.2. The data sources, spatial resolutions, and environmental interpretations of all variables are summarized in Table S1.
2.4. Source Apportionment and Environmental Interpretation
2.4.1. PMF Model Implementation and Factor Selection
Positive matrix factorization (PMF) was used to resolve the potential sources of the six soil heavy metals. For a concentration matrix X containing n sampling sites and m elements, the observed concentration xij of element j at sampling site i was represented as:
where p is the number of retained factors, gik represents the contribution of factor k to sample i, fkj represents the contribution profile of element j in factor k, and eij is the residual. Both gik and fkj were constrained to be non-negative.
Model fitting was performed by minimizing the uncertainty-weighted objective function:
where uij is the analytical uncertainty associated with element j at sampling site i. The uncertainty was calculated from the measured concentration and the method detection limit (MDL) as:
where EF is the error fraction, which was set to 0.10 in this study.
The weighted PMF model was implemented in Python (version 3.12.10) using an alternating least-squares framework with non-negative least-squares updates. Candidate factor numbers from p = 2 to p = 6 were examined. Because PMF is sensitive to initialization and may converge to different local minima, each candidate solution was evaluated using repeated random initializations. The principal candidate solutions were further examined using 100 random starts with a maximum of 3000 iterations per run. Convergence was defined as a relative change in the objective function of less than 10−8 between successive iterations. For each candidate factor number, model fit was evaluated using the uncertainty-weighted objective function (Qtrue) and an additional capped-residual diagnostic (Qcap,4). The latter was calculated by limiting each squared uncertainty-scaled residual to 16, corresponding to the commonly used residual threshold of ±4 in PMF analysis [38]. This diagnostic was calculated after model fitting. Reconstruction performance and convergence frequency were also examined.
The factor-number selection jointly considered (i) improvement in model fit with increasing factor number, (ii) convergence and reproducibility across random initializations, (iii) stability of factor profiles among near-optimal solutions, and (iv) whether an additional factor represented a reproducible new compositional pattern rather than an unstable subdivision of factors already present in a lower-dimensional solution. Factor profiles from repeated solutions were optimally matched and compared using cosine similarity. A higher-dimensional solution was considered justified only when the additional factor could be repeatedly recovered with a consistent elemental profile; otherwise, the more parsimonious stable solution was preferred.
For interpretation, two complementary quantities were calculated. First, the normalized elemental profile within each factor was used to describe the compositional characteristics of that factor. Second, the reconstructed mass contribution gikfkj was used to calculate the fraction of each element allocated among the retained factors.
2.4.2. GeoDetector-Based Environmental Interpretation
GeoDetector was further used to examine whether the spatial variation in the PMF-derived factor contributions corresponded to different environmental stratifications. The original sample-level PMF contribution of each retained factor (G1, G2, and G3) was separately treated as the dependent variable. GeoDetector was used only as supplementary spatial evidence for interpreting the potential source characteristics of the PMF factors, rather than as evidence of causality or as an independent source-apportionment model.
The explanatory power of an environmental variable was quantified using the GeoDetector q-statistic:
where h = 1,…, L denotes the strata of an environmental variable, Nh and are the number of samples and the variance of the PMF factor contribution within stratum h, respectively, and N and σ2 are the corresponding values for the entire dataset. The value of q ranges from 0 to 1, with larger values indicating a stronger correspondence between the environmental stratification and the spatial variation in the PMF factor contribution.
Because GeoDetector requires categorical explanatory variables, continuous environmental variables were discretized before analysis. Four classification methods were compared: equal interval, quantile, Fisher–Jenks natural breaks, and geometric interval. For each method, 3–6 classes were tested, and schemes containing fewer than 10 samples in any class were excluded. For each combination of PMF factor and environmental variable, the valid classification scheme producing the highest q-value was retained. Parent material and land use/land cover were used directly as categorical variables. To examine the influence of sparsely represented categories, an additional sensitivity analysis was conducted in which categories represented by fewer than five samples were combined into an “Other” class.
Statistical significance was evaluated using 999 permutations. For continuous variables, discretization was re-optimized within each permutation, and the maximum q-value among the valid classification schemes was used to construct the null distribution. This procedure incorporated the uncertainty introduced by selecting the discretization scheme rather than testing significance only after an optimal classification had been selected. The permutation probability was calculated as:
where Nperm = 999. To account for multiple testing, the permutation-derived p-values of the 15 environmental variables were adjusted separately for each PMF factor using the Benjamini–Hochberg false discovery rate (FDR) procedure. Source interpretation was finally based on the combined evidence from elemental composition, element allocation among PMF factors, spatial distribution of factor contributions, GeoDetector results, and known environmental characteristics of the study area.
For cartographic visualization, the PMF factor scores were interpolated using empirical Bayesian kriging (EBK), without using the interpolated values as inputs to the PMF or GeoDetector analyses.
2.5. Source-Oriented Ecological Risk Assessment
The potential ecological risk index proposed by Hakanson was used to evaluate the ecological risk associated with the six heavy metals. To extend the conventional element-based assessment to a source-resolved framework, the PMF-derived contribution of each factor to each element was first converted into a source-attributed concentration.
For element j at sampling site i, the relative contribution of factor k was calculated from the PMF reconstruction as:
where gikfkj represents the reconstructed contribution of factor k to element j at site i, and p is the number of retained factors. The measured concentration of each element was then allocated among the factors according to these PMF-derived proportions:
where Cijk is the concentration of element j attributed to factor k at site i, and Cij is the measured concentration of that element. This proportional allocation preserves the elemental mass balance, such that:
Cijk = PijkCij
The potential ecological risk coefficient of element j attributed to factor k at sampling site i was then calculated as:
where is the toxic-response coefficient of element j, with values of 2, 1, 5, 30, 10, and 40 for Cr, Zn, Pb, Cd, As, and Hg, respectively, and Bij is the geochemical background value of element j corresponding to the dominant parent material at site i. Parent-material-specific background values were adopted to account for the heterogeneous geological conditions of the study area. The 95th-percentile values were obtained from the Shaoguan municipal soil-background standard (DB4402/T 08–2021) [39], which specifies this percentile as the generally adopted environmental background value (Table S2). The parent-material distribution map provided in Appendix A(DB4402/T 08–2021) of the standard was digitized in ArcGIS 10.8, and the 191 sampling sites were spatially overlaid with the resulting polygons to assign the corresponding parent-material-specific background values. To evaluate the sensitivity of ecological risk assessment to background-value selection, RI was recalculated using the corresponding parent-material-specific median values from the same standard, while keeping the measured concentrations, PMF-derived source allocations, toxic-response coefficients, and RI classification thresholds unchanged.
The source-resolved ecological risk contribution of factor k at site i was obtained by summing the element-specific risk coefficients:
and the conventional total ecological risk index was calculated as:
Because the measured elemental concentrations were exhaustively allocated among the retained PMF factors, the source-resolved risks satisfy:
Thus, RIik represents the contribution of factor k to the total ecological risk at a given sampling site rather than an independent ecological-risk category. The conventional total RI was classified as low (RI < 150), moderate (150 ≤ RI < 300), high (300 ≤ RI < 600), and very high (RI ≥ 600). These thresholds were applied only to the total RI and were not used to classify individual source-resolved risk contributions.
To examine whether the elements dominating the mass composition of a source were also those dominating its ecological risk, the relative contribution of each element to the risk of each factor was additionally calculated from Er,ijk. This enabled direct comparison between source composition and source-resolved risk composition.
2.6. Spatial Attribution of Source-Resolved Ecological Risk
2.6.1. Site-Level Source Dominance
To characterize the source structure of ecological risk at individual sampling sites, the relative risk contribution of factor k at site i was calculated as:
where RIik is the source-resolved ecological risk contribution of factor k and RIi is the total ecological risk index at site i. The factor with the largest RIik was defined as the dominant risk source at that site:
Exact ties were retained as a separate “Tie” category rather than being assigned according to factor order. No additional threshold was imposed to distinguish strong from weak dominance.
The site-level dominant source was subsequently cross-tabulated with the conventional total-RI classes defined. This analysis was used to determine whether the source dominating ecological risk differed among low-, moderate-, high-, and very-high-risk sites. The classification was performed only at the sampling-site level.
2.6.2. Global and Local Spatial Autocorrelation
Global and local Moran’s I statistics were used to evaluate the spatial structure of the source-resolved ecological risk contributions and the total ecological risk. Because the RI values were strongly right-skewed and contained several extreme observations, spatial autocorrelation analysis was conducted on log-transformed values:
with the original RI values retained for descriptive statistics and interpretation.
Yi = ln(1 + RIi)
Spatial weights were constructed from the coordinates of the 191 sampling sites using a k-nearest-neighbor (kNN) scheme. An eight-nearest-neighbor configuration (k = 8) was used as the primary spatial-weight specification. The neighbor relations were symmetrized such that two sites were treated as neighbors if either site identified the other among its k nearest neighbors, after which the spatial-weight matrix was row-standardized. To evaluate sensitivity to neighborhood definition, the analysis was repeated using k = 6, 10, and 12.
Global Moran’s I was calculated as:
where n is the number of sampling sites, wij is the spatial weight between sites i and j, and . Statistical significance was evaluated using 999 random permutations. Positive and significant Moran’s I values were interpreted as evidence of global spatial clustering, whereas nonsignificant values were treated as insufficient evidence of an overall spatial pattern. The consistency of global clustering was additionally examined across the four neighborhood sizes (k = 6, 8, 10, 12).
Local Moran’s I was then used to identify site-level spatial association types:
where zi is the standardized log-transformed RI value at site i. Significant local associations were classified as high–high (HH), low–low (LL), high–low (HL), or low–high (LH) according to the sign of the standardized value and its spatial lag. Local significance was assessed using 999 permutations, and the resulting p-values were adjusted separately for each risk indicator using the Benjamini–Hochberg false discovery rate (FDR) procedure. Sites with FDR-adjusted p < 0.05 were regarded as locally significant under the primary k = 8 specification.
To reduce dependence on a single neighborhood definition, a local spatial association was considered stable only when three conditions were simultaneously satisfied: (i) the site was significant after FDR correction under the primary k = 8 specification; (ii) the same HH, LL, HL, or LH category occurred under at least three of the four neighborhood sizes (k = 6, 8, 10, 12); and (iii) no conflicting local association category occurred across the tested neighborhood sizes. Local clusters were formally interpreted only when the corresponding risk indicator also showed significant global spatial autocorrelation. Spatial autocorrelation analyses were performed using the original sampling-site data. Ordinary kriging was used separately to visualize the spatial trends of total and source-specific ecological risk.
2.6.3. Sensitivity to Extreme Observations and Sampling Configuration
To assess the sensitivity of sample-aggregated source-specific ecological risk contributions, the share of each factor was calculated as the sum of its source-specific RI across sampling sites divided by the sum of total RI across the same sites. The influence of extreme observations was examined through leave-one-out analysis and the sequential exclusion of the sites with the highest total RI values. These analyses used the source-resolved RI values from the selected three-factor PMF solution without model refitting. Sampling representativeness was examined by comparing the proportions of sampling sites across land-use and parent-material classes with their corresponding mapped area proportions. In addition, Thiessen polygons were generated from the sampling locations and clipped to the study-area boundary to obtain an area-weighted sensitivity estimate, calculated as the ratio of the area-weighted sum of source-specific RI to the area-weighted sum of total RI. The weighting analysis was repeated using all 191 sampling sites and only the 177 sites within the mapped study-area boundary as polygon generators.
2.6.4. Resampling-Based Uncertainty Assessment
Following PMF factor-number selection, resampling-based uncertainty analysis was conducted to evaluate the variability of source-specific ecological risk contributions and site-level dominant-factor classifications. Three complementary procedures were employed. First, site-level bootstrap resampling was performed with the source-resolved RI values held fixed, using 1000 replicates to assess sensitivity to sample composition. Second, the elemental concentration and uncertainty vectors were resampled together at the sampling-site level, and PMF was refitted using the retained factor number. Each refitting replicate used 20 random initializations, with a maximum of 3000 iterations per initialization. Refitted factor profiles were matched to the reference solution using cosine similarity. Reliable matching required a minimum matched similarity of 0.90 and a difference of at least 0.02 between the optimal and second-best factor assignments. Successfully matched profiles were projected onto the original sampling sites by re-estimating nonnegative factor contributions, from which source-resolved ecological risks were calculated. Third, the refitted profiles were evaluated on their corresponding bootstrap samples to assess the combined effects of sample composition and model refitting. Replicates failing the predefined matching or risk-allocation closure criteria were recorded but excluded from factor-labeled summaries. For each procedure, the distributions of aggregated source-risk contributions were summarized using the 2.5th, 50th, and 97.5th percentiles. Site-level classification stability was evaluated as the frequency with which the original dominant factor remained dominant across successfully matched refits, with retention frequencies below 80% indicating relatively unstable assignments. To further assess sensitivity to spatial dependence, fixed-model spatial-block bootstrap analyses were performed using block sizes of 3, 5, and 7 km, with 1000 replicates for each configuration.
3. Results and Discussion
3.1. Concentration Characteristics and Spatial Distribution of Soil Heavy Metals
The descriptive statistics were calculated from the laboratory-measured concentrations of the six heavy metals in the 191 topsoil samples and are summarized in Table 1. The mean concentrations of Cr, Zn, Pb, Cd, As, and Hg were 90.36, 295.38, 138.85, 2.58, 47.09, and 0.324 mg kg−1, respectively. Except for Cr, the mean concentrations of the other five elements were substantially higher than their corresponding median values, with coefficients of variation (CVs) ranging from 145.02% to 266.81%, indicating strongly right-skewed distributions influenced by a limited number of high-concentration samples. Pb and Cd exhibited the highest CVs (266.81% and 266.16%, respectively), followed by Zn (209.81%), Hg (181.15%), and As (145.02%). In contrast, Cr showed considerably lower variability (CV = 43.65%), with a mean concentration (90.36 mg kg−1) close to its median (84.00 mg kg−1), suggesting a relatively more uniform concentration distribution than the other elements. The pronounced variability and localized high concentrations of these metals may reflect additional inputs or environmental processes superimposed on the regional geochemical background.
Table 1.
Descriptive statistics and enrichment relative to parent-material-specific background values for soil heavy metals.
The spatial distributions of the six heavy metals differed considerably (Figure 2). Elevated Zn, Pb, and Cd concentrations showed substantial spatial overlap in the central and central-western parts of the study area, particularly near urban and industrial land, suggesting potentially shared anthropogenic inputs [40]. Hg exhibited fewer elevated sites, with only partial spatial overlap with Zn, Pb, and Cd. Elevated As concentrations were scattered across the northern, central, and southern areas, whereas Cr showed relatively limited spatial variation without a distinct concentration hotspot, consistent with its lower coefficient of variation.
Figure 2.
Spatial distribution of measured concentrations of (a) Cr, (b) Zn, (c) Pb, (d) Cd, (e) As, and (f) Hg in surface soils of the study area. Concentrations are expressed in mg kg−1. The shaded background represents terrain and impervious surface
Given the substantial differences in geochemical background concentrations among parent materials in Shaoguan (Table S2), concentration-to-background ratios (C/B) were calculated using the background value corresponding to the parent material at each sampling site. This approach was used to distinguish high absolute concentrations from enrichment relative to local geological conditions, recognizing that natural geochemical backgrounds can vary considerably across different geological settings [41]. As shown in Figure S1, Zn had the largest number of samples exceeding their corresponding parent-material-specific background values (80 samples, 41.88%), followed by Cd (35.60%), Pb (23.04%), Cr (21.47%), Hg (20.9%), and As (19.37%). Cd exhibited the highest maximum C/B ratio (39.33), followed by Zn (34.09), Pb (23.39), Hg (14.00), As (9.85), and Cr (3.77). These results indicate that Zn exhibited the most widespread above-background occurrence, whereas Cd showed the strongest localized enrichment despite exceeding its corresponding background value at fewer sites than Zn. Pb was characterized by both high concentration variability and localized enrichment. Notably, although Hg had a relatively low absolute concentration, approximately one-fifth of the samples exceeded their corresponding background values, with a maximum C/B ratio of 14.00, indicating localized enrichment relative to the geological background. In comparison, although Cr exceeded its background value at 21.47% of the sampling sites, its maximum C/B ratio was only 3.77, suggesting substantially weaker relative enrichment than Cd, Zn, and Pb.
3.2. Source Apportionment
3.2.1. PMF-Based Source Apportionment
Weighted positive matrix factorization (PMF) was applied to identify the potential sources of the six soil heavy metals. Candidate solutions with two to six factors were evaluated in terms of reconstruction performance, numerical stability, and factor-profile interpretability. The two-factor solution showed poor reconstruction of As (R2 = 0.235), suggesting that two factors were insufficient to characterize the elemental patterns. Increasing the number of factors to three improved the representation of the elemental composition and produced highly reproducible results. All 100 random starts converged, and the 54 near-optimal solutions exhibited nearly identical factor profiles, with a minimum matched cosine similarity of 0.9999977. The selected three-factor solution yielded Qtrue = 6518.81 and Qcap,4 = 4482.21.
Further increasing the number of factors to four reduced the minimum Qtrue to 3795.85 (a 41.8% reduction), but resulted in three competing factor structures involving alternative separations of Zn–Cd, As, or Pb. Although each structure was internally reproducible, the additional factor lacked consistency across the competing solutions. Preliminary screening of five- and six-factor solutions also did not establish stable, nondegenerate additional factors. Considering the insufficient reconstruction at K = 2, the high reproducibility of the three-factor solution, and the structural ambiguity associated with additional factors, K = 3 was ultimately adopted for subsequent source apportionment and ecological risk analysis. The elemental composition and allocation characteristics of the three retained factors are presented in Figure 3, and their spatial distributions are shown in Figure 4.
Figure 3.
PMF factor profiles and elemental allocation for the three resolved factors. Bars represent the elemental composition within each factor, whereas lollipop markers represent the proportion of each element allocated to that factor.
Figure 4.
Spatial distributions of the PMF-derived factor scores for (a) F1, (b) F2, and (c) F3. The independently scaled color ramps represent the minimum-to-maximum ranges of the interpolated rasters.
F1 was primarily characterized by As (approximately 37%) and Zn (approximately 31%), with additional contributions from Pb and Cr (Figure 3a). In terms of elemental allocation, approximately 85.1% of the total reconstructed As was attributed to F1, indicating that this factor was the principal contributor to As concentrations in the study area. Spatially, elevated F1 contributions occurred mainly in several northern and north-central areas, exhibiting a relatively dispersed distribution (Figure 4a). The geochemical background concentrations of As vary considerably among parent materials in Shaoguan (Table S2), with the 95th-percentile background values ranging from 21.08 mg kg−1 in granitic parent materials to 204.60 mg kg−1 in acidic volcanic extrusive rocks. These substantial differences suggest that geological background conditions may play an important role in the spatial variation of As. Nevertheless, As concentrations exceeded the corresponding parent-material-specific background values at some sampling sites, while Zn and Pb also accounted for appreciable proportions of the F1 composition. These observations suggest that geological background alone may not fully explain the characteristics of F1. Therefore, F1 was tentatively interpreted as an As-dominated mixed source, potentially reflecting geogenic contributions superimposed with localized anthropogenic inputs.
F2 was compositionally dominated by Zn (approximately 61%) and Pb (approximately 36%), which together accounted for nearly the entire factor composition, whereas Cd contributed less than 1% (Figure 3b). However, elemental allocation revealed that approximately 97.8% of Cd, 77.8% of Pb, and 68.0% of Zn were attributed to F2 across the study area. This indicates that although Cd represented only a small proportion of the internal mass composition of F2, nearly all of its reconstructed concentration contribution was associated with this factor. Spearman correlation analysis further showed strong positive correlations between sample-level F2 contributions and the measured concentrations of Cd, Zn, and Pb, with correlation coefficients of 0.97, 0.83, and 0.79, respectively, indicating a close correspondence between the spatial variation of F2 and these three elements. Spatially, elevated F2 contributions were concentrated mainly in the central-western to central parts of the study area (Figure 4b), broadly coinciding with the areas exhibiting elevated Cd, Pb, and Zn concentrations. Previous investigations have documented heavy-metal contamination associated with Pb–Zn smelting activities in Shaoguan, while Cd is commonly associated with Pb–Zn ores and may be released during smelting processes [42]. Similar co-enrichment of Cd, Pb, and Zn has been observed in soils surrounding lead–zinc smelters, with receptor models and Pb isotope fingerprints providing supporting evidence for smelting-related inputs [43]. Collectively, the characteristic Zn–Pb–Cd elemental signature, pronounced spatial co-enrichment, regional industrial history, and supplementary environmental associations provide a consistent basis for interpreting F2 as a predominantly anthropogenic mixed source. Pb–Zn smelting and related industrial activities are considered plausible major contributors to this factor, although their individual contributions cannot be distinguished using the present dataset.
F3 was characterized by a high proportion of Cr (approximately 57%), followed by Zn (approximately 35%), with relatively minor contributions from the remaining elements (Figure 3c). Elemental allocation indicated that approximately 83.0% of the total reconstructed Cr was attributed to F3, suggesting that this factor accounted for the largest share of Cr concentrations in the study area. Cr exhibited the lowest coefficient of variation (43.65%) among the six elements, and its maximum C/B ratio was only 3.77, substantially lower than those of the other heavy metals. These characteristics indicate relatively limited enrichment above the local geological background and comparatively low concentration variability. The local geochemical background data (Table S2) further demonstrate substantial variations in Cr concentrations among parent materials, with 95th-percentile background values ranging from 48.28 mg kg−1 in granitic parent materials to 237.70 mg kg−1 in acidic volcanic extrusive rocks. This lithological dependence is consistent with previous geochemical investigations demonstrating that parent-rock composition can strongly influence the natural distribution of Cr in soils and sediments [44]. Spatially, elevated F3 contributions were relatively dispersed (Figure 4c), without forming a pronounced concentration center comparable to that of F2. The Cr-dominated composition of F3, the relatively low variability and limited enrichment of Cr, and the substantial differences in regional geochemical background across parent materials collectively support the interpretation of F3 as a geological-background-related factor. The geological background appears to be particularly relevant to the Cr component, whereas the contributions of Zn and Hg may reflect a combination of geogenic and anthropogenic processes.
Notably, Hg did not form an independent PMF factor. In the selected three-factor solution, 47.6% and 52.4% of the reconstructed Hg concentrations were allocated to F2 and F3, respectively (Figure 3b,c), while these factors accounted for 48.91% and 51.09% of the total Hg-attributed ecological risk. Although Hg dominated the ecological risk within F3 (89.34% of F3-specific RI), its overall risk contribution was distributed almost equally between F2 and F3. A resampling-based PMF refitting analysis further showed that F3 accounted for the largest share of Hg-attributed risk in only 112 of the 199 successfully matched solutions (56.3%), whereas F2 accounted for the largest share in the remaining 87 solutions. This variability indicates that the allocation of Hg between F2 and F3 is not sufficiently stable to establish a geogenic origin. Previous studies have identified nonferrous metal smelting and atmospheric deposition as potential contributors to soil Hg contamination [45]. However, the present data cannot reliably distinguish these anthropogenic influences from potential geogenic contributions. Therefore, the specific origin of Hg remains unresolved.
3.2.2. Environmental Associations and Source Interpretation Based on GeoDetector
GeoDetector analysis revealed distinct spatial associations between the three PMF factors and the environmental variables (Table 2). Overall, the highest q-value across all factor–variable combinations was only 0.132, indicating that individual environmental variables had limited explanatory power for the spatial variation in PMF-derived factor contributions.
Table 2.
GeoDetector results for environmental associations with PMF factors.
For F1, none of the environmental variables exhibited statistically significant spatial associations after false discovery rate (FDR) correction. The highest q-value was observed for average precipitation (Pre_avg, q = 0.093), but the association did not reach statistical significance after FDR adjustment. Thus, GeoDetector did not provide clear evidence pointing to a single source type. This absence of a distinctive environmental association is consistent with the tentative interpretation of F1 as an As-dominated mixed source potentially influenced by both geological background conditions and localized anthropogenic inputs.
F2 exhibited comparatively clearer associations with environmental variables. Maximum precipitation (Pre_max) and nighttime light intensity (NTL) showed the highest q-values of 0.132 and 0.121, respectively, and both remained statistically significant after FDR correction. Although their explanatory power was relatively limited, higher NTL classes corresponded to greater F2 contributions. As nighttime light intensity is widely used as a spatial proxy for human activity and urban development [46], this pattern suggests a relatively consistent spatial association between F2 and areas characterized by greater human activity and urban–industrial disturbance. Together with its Zn–Pb–Cd elemental signature and the long history of Pb–Zn smelting and related industrial activities in the study area, the GeoDetector results provide further support for interpreting F2 as an anthropogenic mixed source.
F3 exhibited relatively weak spatial associations with the environmental variables. PM10 concentration and parent material (PM) showed comparatively higher q-values of 0.094 and 0.063, respectively, but neither association remained statistically significant after FDR correction. Therefore, as with F1, GeoDetector did not provide sufficient statistical evidence to further distinguish the specific sources represented by F3. Its geological-background-related interpretation remains primarily supported by the Cr-dominated PMF composition, comparatively low spatial variability, and limited enrichment above parent-material-specific background concentrations.
The GeoDetector results should be interpreted as supplementary spatial evidence within the broader source-identification framework. For F2, significant associations with nighttime light intensity and distance to mining areas were consistent with anthropogenic influences, although no significant association was detected with distance to industrial facilities. For F3, the absence of a significant association with parent material did not provide additional spatial confirmation of the geological interpretation, which was instead supported by the Cr-dominated factor profile and regional geochemical characteristics. The generally modest q-values indicate that individual environmental variables explain only a limited proportion of the spatial variation in factor contributions. Moreover, natural and anthropogenic factors may exhibit spatial covariation, which limits the interpretation of individual associations as independent source effects. Accordingly, source identification in this study relies on the convergence of geochemical, spatial, and regional evidence rather than on any single statistical association.
3.3. Ecological Risk Characteristics and Source-Resolved Risk Contributions
3.3.1. Overall Ecological Risk Characteristics
The potential ecological risk assessment revealed a strongly right-skewed distribution of total ecological risk across the 191 sampling sites. Using the parent-material-specific 95th-percentile background values, the mean, median, and maximum RI values were 119.35, 55.02, and 1898.95, respectively. Under this reference scheme, 158 sites were classified as low risk, 17 as moderate risk, 11 as high risk, and 5 as very high risk. When the corresponding median background values were used, the mean RI increased to 547.34, and the numbers of low-, moderate-, high-, and very-high-risk sites changed to 56, 64, 33, and 38, respectively (Table S4). Despite these substantial changes in absolute risk levels, F2 remained the largest contributor to the aggregated ecological risk across the sampled sites, with its contribution increasing from 74.5% to 80.9%. F2 also dominated 66 of the 71 high- and very-high-risk sites under the median-based assessment. These results indicate that absolute RI values and risk classifications are highly sensitive to the reference background values, whereas the predominance of F2 in source-specific ecological risk remains broadly consistent.
Spatially, the interpolated total RI showed relatively elevated values in the central-western part of the study area (Figure 5a). The risk surfaces were generated using ordinary kriging at 50 m resolution, with spherical semivariograms for F1 and F3 and exponential models for F2 and total RI. F1, F2, and total RI were interpolated after ln(1 + RI) transformation and subsequently back-transformed, while F3 was interpolated on its original scale. The surfaces were further smoothed using a Gaussian filter (σ = 150 m). Consequently, the maximum observed RI of 1898.95 was reduced to 420.29 by interpolation and to 350.20 after smoothing at the corresponding raster cell. The displayed raster maximum was 353.04. The interpolated surfaces therefore represent general spatial trends. The color ramps are scaled independently across panels, while the sampling points overlaid on Figure 5a retain the risk classifications derived from the original site-level RI values.
Figure 5.
Spatial distributions of (a) total ecological risk (RI), (b) F1-specific ecological risk, (c) F2-specific ecological risk, and (d) F3-specific ecological risk.
In terms of element-specific risk contributions, total ecological risk was predominantly attributable to Cd and Hg, which accounted for approximately 55.6% and 30.9% of the total RI, respectively. Together, these two elements contributed more than 85% of the overall risk, whereas As, Pb, Zn, and Cr made substantially smaller contributions. Notably, although the mean concentration of Hg was considerably lower than those of Zn, Pb, and As, Hg was the second-largest contributor to ecological risk after Cd. This discrepancy was primarily associated with differences in element-specific geochemical background values and toxic-response coefficients used in the risk calculation. Hg has the highest toxic-response coefficient (40) among the six elements, followed by Cd (30). Moreover, Hg generally has relatively low background concentrations across different parent materials, meaning that localized increases in its concentration can produce disproportionately large contributions to the calculated RI. These findings demonstrate that elemental concentrations and enrichment levels do not necessarily correspond to their relative importance in potential ecological risk assessment (Table 3), as also observed in previous soil heavy-metal risk studies.
Table 3.
Comparison of dominant elements in PMF source composition and element-specific contributions to source-resolved ecological risk.
3.3.2. Source-Specific Ecological Risk Contributions
Building on the PMF source apportionment results, the concentrations of individual elements attributed to each factor were further converted into source-specific ecological risk contributions. The three factors exhibited substantial differences in their risk contributions. The mean RI values of F1, F2, and F3 were 9.33, 88.92, and 21.11, respectively, while their corresponding median values were 4.34, 25.58, and 18.38. F2 exhibited the highest mean and median risk contributions among the three factors. Across the 191 analyzed sampling sites, F1, F2, and F3 accounted for approximately 7.8%, 74.5%, and 17.7% of the summed total RI, respectively, under the selected three-factor PMF solution (Table 4). Thus, although PMF resolved three factors with distinct elemental compositions, their contributions to ecological risk were highly unequal, with F2 accounting for nearly three-quarters of the summed RI across the sampled sites. Similar differences in source-specific ecological risk contributions have been reported in previous PMF-based assessments of industrially influenced soils.
Table 4.
Descriptive statistics and contributions of total and source-specific ecological risk.
The aggregated source contributions were influenced by the strongly right-skewed distribution of ecological risk and the uneven spatial distribution of sampling sites. The site with the highest total RI accounted for 8.33% of the summed RI across all sites, and its exclusion reduced the F2 share from 74.50% to 72.30%. Excluding the 10 and 20 highest-RI sites further reduced the F2 share to 63.99% and 57.67%, respectively, although F2 remained the largest contributing factor in both cases. Spatial representativeness analysis showed that built-up areas accounted for 63.35% of the sampling sites but only 28.10% of the mapped study area, whereas tree-covered areas accounted for 24.61% of the sites and 56.19% of the area. Using Thiessen polygon area weights, the F2 contribution was estimated at 70.16% when all sampling locations were used as polygon generators and 70.08% when only sites within the study-area boundary were used. These results indicate that the precise aggregated contribution of F2 is sensitive to high-RI observations and spatial weighting, while its position as the largest risk-contributing factor is maintained across the examined scenarios. The Thiessen-weighted estimates represent sensitivity assessments based on nearest-sample spatial allocation rather than independently validated area-wide ecological risk contributions. The resampling analyses further quantified the uncertainty in the aggregated source-risk contributions. With the PMF solution held fixed, the F2 contribution ranged from 67.82% to 80.01% between the 2.5th and 97.5th percentiles of 1000 bootstrap replicates. When PMF was refitted and the resulting factors were projected onto the original 191 sites, the median F2 contribution was 74.62%, with corresponding percentiles of 71.81% and 76.78% across 199 successfully matched solutions. Joint resampling and refitting produced a wider percentile range of 67.91–80.55%. Despite these variations, F2 remained the largest risk-contributing factor in all successfully evaluated replicates of the three procedures. The spatial-block bootstrap analyses also retained F2 as the largest contributor in at least 999 of 1000 replicates across the examined block sizes, although the estimated contribution percentages varied more widely. These findings indicate that the precise aggregated contribution is sensitive to sample composition and model refitting, whereas the relative predominance of F2 is more consistently reproduced within the selected three-factor framework.
The three factors also exhibited distinct spatial patterns of source-specific ecological risk (Figure 5b–d). Elevated risk contributions from F1 and F3 were relatively scattered, occurring mainly as localized patches. In contrast, F2 exhibited a more pronounced concentration of elevated risk values in the central-western part of the study area, broadly coinciding with the spatial distribution of high total RI values. Therefore, F2 not only dominated the overall ecological risk contribution at the regional scale but also accounted for a substantial component of the spatial pattern of elevated total ecological risk.
The elemental composition of each factor was not necessarily consistent with its element-specific ecological risk composition (Table 3). For F1, As dominated both source composition and ecological risk, accounting for 68.95% of F1-specific RI. In contrast, although Zn dominated the composition of F2, Cd and Hg contributed 72.85% and 20.31% of its ecological risk, respectively. Similarly, F3 was compositionally dominated by Cr, whereas Hg accounted for 89.34% of its attributed ecological risk (Table 3). However, the dominance of Hg in the calculated ecological risk of F3 reflects the risk-weighting effects of its toxic-response coefficient and background concentration; it does not establish that Hg shares the geological origin tentatively inferred for the Cr component. This discrepancy indicates that the elements dominating the pollutant mass of a PMF-derived source do not necessarily dominate its ecological risk. The difference arises because source-attributed elemental concentrations are weighted by their corresponding background values and toxic-response coefficients when converted into ecological risk. Consequently, elements with higher toxic-response coefficients and lower geochemical background values may contribute disproportionately to the calculated risk. As a result, Cd in F2 and Hg in F3 played substantially greater roles in ecological risk composition than their relative proportions in the source mass composition would suggest.
3.4. Spatial Dominance and Clustering of Source-Resolved Ecological Risk
3.4.1. Site-Level Source Dominance Across Risk Levels
At the sampling-site level, the source-specific ecological risk contributions of F1, F2, and F3 were compared, and the factor contributing the largest share of total ecological risk was identified as the dominant risk source at each site. The distribution of dominant sources varied considerably across total ecological risk classes (Figure 6a and Table 5). Among the 191 sampling sites, F2 was dominant at 106 sites (55.50%), followed by F3 at 75 sites (39.27%) and F1 at only 10 sites (5.24%). Among the 158 low-risk sites, F2 and F3 each dominated 74 sites (46.84%), while F1 dominated the remaining 10 sites (6.33%). As total ecological risk increased, source dominance became increasingly concentrated in F2. Of the 17 moderate-risk sites, 16 (94.12%) were dominated by F2 and only one by F3. All 11 high-risk sites and all five very-high-risk sites were dominated by F2.
Figure 6.
Site-level dominance of source-resolved ecological risk: (a) distribution of dominant sources across total ecological risk classes and (b) spatial distribution of dominant risk sources at the sampling locations.
Table 5.
Distribution of dominant ecological-risk sources across total-risk classes.
These results reveal a clear shift in the structure of dominant risk sources across different ecological risk levels. At low risk levels, source dominance was relatively diverse, with F2 and F3 accounting for equal proportions of the dominant sources. However, as total ecological risk increased, this mixed dominance pattern progressively shifted toward a pronounced predominance of F2.
From a source-specific perspective, although F3 dominated 75 sampling sites, 74 of them were classified as low risk. Similarly, all 10 F1-dominated sites belonged to the low-risk class. In contrast, F2 not only dominated the largest number of sites across the study area but also remained the predominant risk source at moderate to very high risk levels, exclusively dominating all high- and very-high-risk sites. Therefore, F1 and F3 primarily reflected differences in source dominance within low-risk areas, whereas elevated ecological risk was strongly associated with F2 dominance.
Spatially, sampling sites dominated by F1, F2, and F3 were generally interspersed rather than forming spatially separated and continuous source-dominance zones (Figure 6b). This pattern indicates that site-level source dominance reflects the relative importance of source-specific ecological risk contributions at individual locations. Importantly, F2-dominated sites included numerous low-risk locations as well as all high- and very-high-risk sites.
The stability of site-level dominant risk factors was further evaluated using the 199 successfully matched PMF refitting solutions. Among the 191 sampling sites, 183 (95.81%) retained their original dominant factor in at least 80% of the refitted solutions. Only eight sites exhibited retention frequencies below 80%, and none fell below 50%. All eight sites had relatively small differences (less than 0.05) between the contributions of their two leading risk factors in the reference solution. Seven of these sites were classified as low risk and one as moderate risk, while all 16 high- and very-high-risk sites retained their original dominant factor in at least 80% of the successful refits. These results suggest that site-level source dominance was generally reproducible under the selected three-factor model, with greater attribution uncertainty concentrated at sites where competing factor contributions were similar.
3.4.2. Spatial Clustering and Risk Attribution
Following the identification of dominant risk sources at individual sampling sites, spatial autocorrelation analysis was conducted to examine whether source-specific ecological risk contributions exhibited stable spatial clustering. Global Moran’s I statistics calculated using log1p-transformed RI values and eight-nearest-neighbor spatial weights revealed significant positive spatial autocorrelation for F1, F2, and total ecological risk, whereas F3 showed no significant global spatial clustering (Table 6). The Global Moran’s I values for F1, F2, F3, and total RI were 0.1004, 0.2960, 0.0371, and 0.2711, respectively. Among the three source-specific risk components, F2 exhibited the strongest global spatial autocorrelation, with a Moran’s I value close to that of total RI. This indicates that F2-specific risk was characterized not only by a dominant contribution to regional ecological risk but also by a relatively pronounced spatial clustering pattern.
Table 6.
Global spatial autocorrelation and stable local clustering of source-specific and total ecological risks.
Local Moran’s I analysis was subsequently performed to identify local spatial associations. Stable local association types were determined by combining multiple-testing correction with consistency criteria across different neighborhood sizes. Although F1 exhibited weak but significant positive global spatial autocorrelation, no stable local high–high (HH) associations were identified. Because F3 did not show significant global spatial autocorrelation, its local high-value associations were not formally interpreted as spatial hotspots. In contrast, both F2-specific risk and total ecological risk exhibited relatively well-defined and stable local spatial clustering patterns (Figure 7).
Figure 7.
Stable local spatial associations of (a) F2-specific ecological risk and (b) total ecological risk, identified using local Moran’s I with FDR correction and neighborhood-sensitivity criteria. HH and LL denote high–high and low–low spatial associations, respectively.
A total of 20 stable HH sites were identified for F2-specific ecological risk (Table 6), compared with 12 stable HH sites for total ecological risk (Table 6 and Table S3). These two sets of stable HH sites exhibited broadly consistent spatial patterns, with most located in the central-western part of the study area. Further examination of the 12 stable HH sites identified for total ecological risk revealed that 11 were dominated by F2, whereas only one was dominated by F3. In terms of element-specific risk contributions, Cd was the dominant risk-contributing element at 11 of these sites, while Hg dominated at the remaining site.
The stable HH sites of total RI encompassed different ecological risk classes, including three low-risk, four moderate-risk, three high-risk, and two very-high-risk sites (Table S3). The three low-risk HH sites were N0303-028 (RI = 96.40), N0303-100 (RI = 129.11), and N0303-146 (RI = 69.98). This difference reflects the distinct criteria underlying the two analyses. The HH classification identifies statistically significant local clustering of relatively elevated log-transformed RI values, whereas ecological risk classes are determined using fixed thresholds applied to the original RI values. Consequently, spatially clustered relative elevations may occur at sites with low absolute ecological risk. Conversely, only five of the 16 high- and very-high-risk sites were identified as stable HH sites, indicating that elevated ecological risk does not necessarily coincide with significant local spatial clustering.
3.5. Management Implications
Soil ecological risk management in Maba Town should integrate the magnitude of ecological risk, its spatial clustering patterns, and source-specific risk contributions. Across the 191 sampled sites, F2 accounted for approximately 74.5% of the total ecological risk and dominated all 16 high- and very-high-risk sites, identifying F2-associated Cd as a primary concern for targeted investigation and monitoring. High- and very-high-risk sites should be prioritized for site-specific assessment regardless of their spatial clustering status. Among these sites, the five that were also identified as stable high–high (HH) sites provide additional spatial evidence for directing investigations toward surrounding locations and potential shared contamination pathways. The four moderate-risk HH sites represent further priorities for targeted sampling and monitoring, while the three low-risk HH sites indicate localized relative risk elevations that warrant continued observation rather than immediate remediation. Together, these two complementary criteria provide a basis for identifying priority investigation sites and organizing spatially targeted risk management. Given the characteristic Zn–Pb–Cd signature of F2 and the region’s history of Pb–Zn smelting and related industrial activities, targeted investigations should consider historical smelting operations, industrial emissions, material transportation, and other potential pathways of metal inputs. Further sampling around and between the identified HH sites could help determine the spatial extent and continuity of elevated ecological risk, thereby supporting more precise delineation of management areas.
In contrast, F1 and F3 contributed relatively smaller proportions of the total ecological risk, and nearly all sites dominated by these factors were classified as low risk. Therefore, the same management strategies applied to F2-dominated high-risk areas may not be appropriate for areas dominated by F1 or F3. For F1, As was the principal risk-contributing element, while the factor potentially reflected both geological background conditions and localized anthropogenic inputs. Distinguishing naturally elevated background concentrations from anomalous enrichment should therefore be a priority before identifying sites requiring intervention. Within F3, the evidence for geological-background contributions is strongest for Cr, whereas the origin of Hg remains unresolved despite its dominant contribution to the calculated risk of this factor. Therefore, the evaluation of F3-dominated sites should distinguish the potential geological-background influence on Cr from the Hg-related ecological risk, rather than treating the entire factor as geogenic. Targeted Hg monitoring and assessment of localized enrichment are warranted. Where necessary, additional source-tracing investigations, including historical emission records, atmospheric deposition data, or Hg isotope analysis, could help distinguish potential sources before source-specific remediation measures are implemented. Given that Hg contributed approximately 30.9% of the total ecological risk across the sampled sites, it should remain a priority element for monitoring alongside Cd.
The resulting source-resolved risk patterns provide a useful basis for prioritizing monitoring and further investigation. As the assessment is based on total elemental concentrations, it characterizes potential ecological risk rather than directly measured bioavailability; future measurements of metal speciation and bioavailable fractions could further refine the ecological interpretation of these results. Although repeated PMF fitting and resampling supported the overall source-risk patterns and the stability of most site-level assignments, uncertainties in factor separation and interpretation may influence source-specific risk attribution. Future studies incorporating independent geochemical source tracers could provide additional evidence to refine and validate these interpretations.
4. Conclusions
This study linked PMF-based source apportionment with source-resolved ecological risk assessment and spatial analysis to identify the potential sources of soil heavy metals and their contributions to ecological risk in Maba Town. Three potential source factors were resolved: an As-dominated mixed factor (F1), a Cd–Pb–Zn-associated factor tentatively linked to anthropogenic inputs (F2), and a Cr-rich factor with geological-background-related characteristics (F3). The geological-background interpretation of F3 is supported primarily by its Cr signature, whereas the origin of Hg assigned to this factor remains unresolved. These findings highlight the complexity of source identification in areas affected by both geological heterogeneity and anthropogenic activities.
In the selected three-factor solution, F2 contributed approximately 74.5% of the summed ecological risk across the 191 sampling sites and remained the largest risk-contributing factor in the examined sensitivity analyses, although its exact contribution was affected by extreme observations and spatial weighting. Importantly, the elemental composition of a source did not necessarily correspond to its ecological risk composition. While Zn dominated the composition of F2, Cd accounted for 72.85% of its ecological risk. Similarly, F3 was compositionally dominated by Cr, whereas Hg contributed 89.34% of its ecological risk. This discrepancy reflects the combined influence of element-specific toxicity and geochemical background on ecological risk, indicating that the elements contributing most to pollutant mass are not necessarily the principal risk drivers. Spatial analysis further showed that F2 dominated all 16 high- and very-high-risk sites and was strongly associated with the clustering of elevated ecological risk. However, statistical high–high clusters did not always correspond to sites with high absolute risk. Together, these findings indicate that effective identification of priority pollution sources and locations requires consideration of source contributions, risk-driving elements, and spatial risk characteristics rather than total ecological risk alone.
Supplementary Materials
The following supporting information can be downloaded at: https://www.mdpi.com/article/10.3390/geosciences16110481/s1, Table S1: Description and data sources of environmental variables used in GeoDetector analysis; Table S2: Parent-material-specific geochemical background values for soil heavy metals in the study area (mg/kg); Table S3: Source attribution of stable high–high clusters of total ecological risk; Table S4: Sensitivity of ecological risk assessment to the selection of parent-material-specific background values; Table S5: Resampling-based uncertainty and ranking stability of source-specific ecological risk contributions; Figure S1: Spatial enrichment of Cr, Zn, Pb, Cd, As, and Hg relative to parent-material-specific background values. Green, orange, and red symbols represent C/B ≤ 1, 1 < C/B ≤ 2, and C/B > 2, respectively. The background polygons represent different parent-material types.
Author Contributions
Conceptualization, Y.Z.; methodology, Y.Z.; software, Y.C.; validation, X.K.; formal analysis, X.K.; investigation, Y.Z.; resources, Y.Z.; data curation, Y.C.; writing—original draft preparation, Y.Z.; writing—review and editing, X.K.; visualization, Y.C.; supervision, X.K.; project administration, X.K.; funding acquisition, X.K. All authors have read and agreed to the published version of the manuscript.
Funding
This research was funded by the National Key Research and Development Program of China (Grant No. 2022YFC3701303), the Basic Scientific Research Operating Expenses of the Chinese Academy of Geological Sciences (Grant No. SK202409, SK202506), and Natural Science Foundation of Hebei Province of China (NO. D2025504019).
Data Availability Statement
The processed datasets (PMF-derived source contributions, source-attributed concentrations, source-resolved ecological risk indices, site-level source-dominance classifications, and spatial-autocorrelation results) that support the findings of this study are available from the corresponding author upon reasonable request. Raw geochemical concentration data are subject to institutional restrictions and may be obtained from the corresponding author on a case-by-case basis. Data sources for the environmental variables used in this study are provided in Supplementary Table S1.
Conflicts of Interest
The authors declare no conflicts of interest. The funders had no role in the design of the study; in the collection, analyses, or interpretation of data; in the writing of the manuscript; or in the decision to publish the results.
References
- Hou, D.; Jia, X.; Wang, L.; McGrath, S.P.; Zhu, Y.G.; Hu, Q.; Zhao, F.J.; Bank, M.S.; O’Connor, D.; Nriagu, J. Global soil pollution by toxic metals threatens agriculture and human health. Science 2025, 388, 316–321. [Google Scholar] [CrossRef] [Scilit] [PubMed]
- Wang, C.; Chen, Y.; Xie, Y.; Feng, X.; Wu, K.; Li, X.; Wu, P. Multi-source apportionment of soil heavy metals and spatial heterogeneity of associated risks in overlapping zones with high geological background and mining-smelting activities. Environ. Pollut. 2025, 385, 127079. [Google Scholar] [CrossRef] [Scilit] [PubMed]
- Cao, M.; Tang, Q.; Gai, N.; Ma, S.; Liu, J.; Wang, F. Contamination characteristics, source apportionment, and risk assessment of heavy metals and metalloids in the soil-crop-human system within the typical high geological background region of the Yangtze River Delta. J. Environ. Manag. 2025, 391, 126443. [Google Scholar] [CrossRef] [Scilit] [PubMed]
- Anaman, R.; Peng, C.; Jiang, Z.; Liu, X.; Zhou, Z.; Guo, Z.; Xiao, X. Identifying sources and transport routes of heavy metals in soil with different land uses around a smelting site by GIS based PCA and PMF. Sci. Total Environ. 2022, 823, 153759. [Google Scholar] [CrossRef] [Scilit] [PubMed]
- Zhang, J.; Wang, X.; Li, J.; Luo, J.; Wang, X.; Ai, S.; Cheng, H.; Liu, Z. Bioavailability (BA)-based risk assessment of soil heavy metals in provinces of China through the predictive BA-models. J. Hazard. Mater. 2024, 465, 133327. [Google Scholar] [CrossRef] [Scilit] [PubMed]
- Chao, J.; Gu, H.; Liao, Q.; Zuo, W.; Qi, C.; Liu, J.; Tian, C.; Lin, Z. Natural factor-based spatial prediction and source apportionment of typical heavy metals in Chinese surface soil: Application of machine learning models. Environ. Pollut. 2025, 366, 125373. [Google Scholar] [CrossRef] [Scilit] [PubMed]
- Zhao, J.; Cao, C.; Chen, X.; Zhang, W.; Ma, T.; Irfan, M.; Zheng, L. Source-specific ecological risk analysis and critical source identification of heavy metal(loid)s in the soil of typical abandoned coal mining area. Sci. Total Environ. 2024, 947, 174506. [Google Scholar] [CrossRef] [Scilit] [PubMed]
- Zhou, L.; Zhao, X.; Meng, Y.; Fei, Y.; Teng, M.; Song, F.; Wu, F. Identification priority source of soil heavy metals pollution based on source-specific ecological and human health risk analysis in a typical smelting and mining region of South China. Ecotoxicol. Environ. Saf. 2022, 242, 113864. [Google Scholar] [CrossRef] [Scilit] [PubMed]
- Guo, G.; Chen, S.; Zhang, J.; Lei, M. Prioritizing pollution sources and targeted potentially toxic elements in soils using a probabilistic source-specific eco-health risk assessment from micro and macro perspectives. J. Hazard. Mater. 2025, 498, 139909. [Google Scholar] [CrossRef] [Scilit] [PubMed]
- Wu, J.; Wang, H.; Han, Z.; Shu, Y.; Huang, X.; Zhong, Q.; Li, R.; Fan, Z. Application of a PMF+ BMR hybrid model for source apportionment and ecological risk assessment of soil heavy metal(loid)s. J. Hazard. Mater. 2025, 494, 138734. [Google Scholar] [CrossRef] [Scilit] [PubMed]
- Cai, L.-M.; Quan, K.; Wen, H.-H.; Luo, J.; Wang, S.; Chen, L.-G.; Song, H.; Wang, A. A comprehensive approach for quantifying source-specific ecological and health risks of potentially toxic elements in agricultural soil. Environ. Res. 2024, 263, 120163. [Google Scholar] [CrossRef] [Scilit] [PubMed]
- Fei, X.; Lou, Z.; Xiao, R.; Ren, Z.; Lv, X. Contamination assessment and source apportionment of heavy metals in agricultural soil through the synthesis of PMF and GeogDetector models. Sci. Total Environ. 2020, 747, 141293. [Google Scholar] [CrossRef] [Scilit] [PubMed]
- Guo, G.; Li, K.; Zhang, D.; Lei, M. Quantitative source apportionment and associated driving factor identification for soil potential toxicity elements via combining receptor models, SOM, and geo-detector method. Sci. Total Environ. 2022, 830, 154721. [Google Scholar] [CrossRef] [Scilit] [PubMed]
- Zheng, J.; Wang, P.; Shi, H.; Zhuang, C.; Deng, Y.; Yang, X.; Huang, F.; Xiao, R. Quantitative source apportionment and driver identification of soil heavy metals using advanced machine learning techniques. Sci. Total Environ. 2023, 873, 162371. [Google Scholar] [CrossRef] [Scilit] [PubMed]
- Zhang, X.; Wang, L.; Feng, S.; Gao, Y.; Shang, T.; Meng, X.Z. Application evaluation of APCS-MLR and PMF in source apportionment of heavy metals in farmland soil. J. Soils Sediments 2025, 25, 3360–3368. [Google Scholar] [CrossRef] [Scilit]
- Cao, J.; Guo, J.; Shi, H.; Chen, Y.; Shen, Z.; Ma, H.; Hou, D. Sources apportionments of heavy metal(loid)s in soils based on positive matrix factorization (PMF) and lead isotope fingerprinting. J. Environ. Manag. 2025, 395, 127986. [Google Scholar] [CrossRef] [Scilit] [PubMed]
- Liang, J.; Liu, Z.; Tian, Y.; Shi, H.; Fei, Y.; Qi, J.; Mo, L. Research on health risk assessment of heavy metals in soil based on multi-factor source apportionment: A case study in Guangdong Province, China. Sci. Total Environ. 2023, 858, 159991. [Google Scholar] [CrossRef] [Scilit] [PubMed]
- Wei, R.; Meng, Z.; Zerizghi, T.; Luo, J.; Guo, Q. A comprehensive method of source apportionment and ecological risk assessment of soil heavy metals: A case study in Qingyuan city, China. Sci. Total Environ. 2023, 882, 163555. [Google Scholar] [CrossRef] [Scilit] [PubMed]
- Zhou, H.; Yue, X.; Chen, Y.; Liu, Y. Source-specific probabilistic contamination risk and health risk assessment of soil heavy metals in a typical ancient mining area. Sci. Total Environ. 2024, 906, 167772. [Google Scholar] [CrossRef] [Scilit] [PubMed]
- Wang, Y.; Shang, Y.; Chen, X.; Zhang, X.; Gao, F. A Source-Oriented Ecological and Health Risk Assessment of Soil Heavy Metals in a Small Watershed of Henan Province, China: A Coupled PMF-RI/PMF-HRA Approach. Land 2026, 15, 982. [Google Scholar] [CrossRef] [Scilit]
- Liang, X.; Zhao, Y.; Ma, J.; Li, H.; Ma, T.; Ma, J.; Yue, X.; Ma, C. Spatial Distribution, Source Apportionment, and Source-Specific Ecological Risk Assessment of Heavy Metals in Farmland Soils of the Ningxia Yellow River Irrigation Area. Agronomy 2026, 16, 1507. [Google Scholar] [CrossRef] [Scilit]
- Liu, Q.; Zhao, W.; Ma, J.; Zhou, Y.; Wu, Y.; Qu, Y.; Sun, Y. Spatial clustering and source-specific risk of combined pollutants in soils from an industrial area in Shanxi Province, China. Environ. Pollut. 2022, 299, 118925. [Google Scholar] [CrossRef] [Scilit] [PubMed]
- Chen, L.; Xie, M.; Li, G.; Lin, S.; Wang, D.; Li, Z.; Wang, Y.; Wang, Z. A spatial source-oriented and probability-based risk-assessment framework for heavy metal and PAH contamination of urban soils in Guangzhou, China. J. Hazard. Mater. 2025, 482, 136500. [Google Scholar] [CrossRef] [Scilit] [PubMed]
- Pan, Y.; Sha, A.; Han, W.; Liu, C.; Liu, G.; Welsch, E.; Zeng, M.; Xu, S.; Zhao, Y.; Tian, S. Identifying spatial drivers of soil heavy metal pollution risk integrating positive matrix factorization, machine learning, and multi-scale geographically weighted regression. J. Hazard. Mater. 2025, 485, 136841. [Google Scholar] [CrossRef] [Scilit] [PubMed]
- Chen, T.; Zhang, R.; Wang, H.; Dong, X.; Zheng, S.; Chang, Q. Source governance-oriented zoning for heavy metal pollution in farmland soil: A case study of an industrial park in mid-western Shaanxi province, China. Water Air Soil Pollut. 2024, 235, 330. [Google Scholar] [CrossRef] [Scilit]
- Tong, B.; Li, Y.; Zhu, G.; Han, X.; Li, J.; Yan, Y.; Chen, Y.; Chen, H.; Zhai, Y. Integration of Geodetector and PMF model improves source identification of regional soil heavy metals. J. Hazard. Mater. Adv. 2026, 23, 101283. [Google Scholar] [CrossRef] [Scilit]
- Xu, H.; Hu, P.; Wang, H.; Croot, P.; Li, Z.; Li, C.; Xie, S.; Zhou, H.; Zhang, C. Identification of the pollution sources and hidden clustering patterns for potentially toxic elements in typical peri-urban agricultural soils in southern China. Environ. Pollut. 2025, 370, 125904. [Google Scholar] [CrossRef] [Scilit] [PubMed]
- Shao, F.; Li, K.; Ouyang, D.; Zhou, J.; Luo, Y.; Zhang, H. Sources apportionments of heavy metal(loid)s in the farmland soils close to industrial parks: Integrated application of positive matrix factorization (PMF) and cadmium isotopic fractionation. Sci. Total Environ. 2024, 924, 171598. [Google Scholar] [CrossRef] [Scilit] [PubMed]
- Adamec, S.; Tůmová, Š.; Hošek, M.; Lučić, M.; Grygar, T.M. Pitfalls of distinguishing anthropogenic and geogenic reasons for risk elements in soils around coal-fired power plants: From a case study in the Northwestern Czech Republic to general recommendations. J. Soils Sediments 2024, 24, 1274–1288. [Google Scholar] [CrossRef] [Scilit]
- Yan, S.; Ni, M.; Li, K.; Wei, F.; Huang, Q.; Jia, Y.; Liu, X.; Wang, G.; Xu, X.; Pu, Y. An integrated Pb isotope-PMF framework for enhanced source apportionment and risk control of heavy metals in soils of a pyrite mining area. J. Environ. Chem. Eng. 2025, 13, 120505. [Google Scholar] [CrossRef] [Scilit]
- Duan, D.; Wang, P.; Rao, X.; Zhong, J.; Xiao, M.; Huang, F.; Xiao, R. Identifying interactive effects of spatial drivers in soil heavy metal pollutants using interpretable machine learning models. Sci. Total Environ. 2024, 934, 173284. [Google Scholar] [CrossRef] [Scilit] [PubMed]
- Yang, J.; Wang, J.; Zhao, C.; Wang, L.; Wan, X.; Shi, H.; Lei, M.; Chen, T.; Liao, X. Identifying driving factors of soil heavy metal at the mining area scale: Methods and practice. Chemosphere 2024, 350, 140936. [Google Scholar] [CrossRef] [Scilit] [PubMed]
- Pan, Y.; Li, X.; Chen, M.; Wang, X.; Leng, Y. Identification of heavy metal sources in reservoir-adjacent soils and specific source risk assessment based on comprehensive environmental factors: A perspective on prioritizing control sources. J. Contam. Hydrol. 2025, 274, 104673. [Google Scholar] [CrossRef] [Scilit] [PubMed]
- Yan, Y.; Yang, Y. Revealing the synergistic spatial effects in soil heavy metal pollution with explainable machine learning models. J. Hazard. Mater. 2025, 482, 136578. [Google Scholar] [CrossRef] [Scilit] [PubMed]
- Standard’s HJ 1315; Soil and Sediment—Determination of 19 Total Metal Elements—Inductively Coupled Plasma Mass Spectrometry. Ministry of Ecology and Environment of the People’s Republic of China: Beijing, China, 2023.
- Standard’s GB/T 22105.1-2008; Soil Quality—Analysis of Total Mercury, Arsenic and Lead Contents in Soils—Atomic Fluorescence Spectrometry—Part 1: Analysis of Total Mercury Contents in Soils. Standardization Administration of China: Beijing, China, 2008.
- Standard’s GB/T 22105.2-2008; Soil Quality—Analysis of Total Mercury, Arsenic and Lead Contents in Soils—Atomic Fluorescence Spectrometry—Part 2: Analysis of Total Arsenic Contents in Soils. Standardization Administration of China: Beijing, China, 2008.
- Norris, G.; Vedantham, R.; Wade, K.; Zahn, P.; Brown, S.; Paatero, P.; Eberly, S.; Foley, C. Guidance Document for PMF Applications with the Multilinear Engine; EPA 600/R-09/032; U.S. Environmental Protection Agency: Research Triangle Park, NC, USA, 2009. [Google Scholar]
- Standard’s DB4402/T 08-2021; Environmental Background Values of Soil. Shaoguan Municipal Administration for Market Regulation: Shaoguan, China, 2021.
- Yang, L.; Ge, S.; Liu, J.; Iqbal, Y.; Jiang, Y.; Sun, R.; Ruan, X.; Wang, Y. Spatial Distribution and Risk Assessment of Heavy Metal(oid)s Contamination in Topsoil around a Lead and Zinc Smelter in Henan Province, Central China. Toxics 2023, 11, 427. [Google Scholar] [CrossRef] [Scilit] [PubMed]
- Hamon, R.E.; McLaughlin, M.J.; Gilkes, R.J.; Rate, A.W.; Zarcinas, B.; Robertson, A.; Cozens, G.; Radford, N.; Bettenay, L. Geochemical indices allow estimation of heavy metal background concentrations in soils. Glob. Biogeochem. Cycles 2004, 18, GB1014. [Google Scholar] [CrossRef] [Scilit]
- Zang, Z.; Li, Y.; Li, H.; Guo, Z.; Zhang, R. Spatiotemporal variation and pollution assessment of Pb/Zn from smelting activities in China. Int. J. Environ. Res. Public Health 2020, 17, 1968. [Google Scholar] [CrossRef] [Scilit] [PubMed]
- Liang, X.; Wang, C.; Song, Z.; Yang, S.; Bi, X.; Li, Z.; Li, P. Soil metal(loid)s pollution around a lead/zinc smelter and source apportionment using isotope fingerprints and receptor models. Appl. Geochem. 2021, 135, 105118. [Google Scholar] [CrossRef] [Scilit]
- Yan, T.; Wang, X.; Liu, D.; Chi, Q.; Zhou, J.; Xu, S.; Zhang, B.; Nie, L.; Wang, W. Continental-scale spatial distribution of chromium (Cr) in China and its relationship with ultramafic-mafic rocks and ophiolitic chromite deposit. Appl. Geochem. 2021, 126, 104896. [Google Scholar] [CrossRef] [Scilit]
- Song, Z.; Wang, C.; Ding, L.; Chen, M.; Hu, Y.; Li, P.; Zhang, L.; Feng, X. Soil mercury pollution caused by typical anthropogenic sources in China: Evidence from stable mercury isotope measurement and receptor model analysis. J. Clean. Prod. 2021, 288, 125687. [Google Scholar] [CrossRef] [Scilit]
- Ma, T. Quantitative responses of satellite-derived nighttime lighting signals to anthropogenic land-use and land-cover changes across china. Remote Sens. 2018, 10, 1447. [Google Scholar] [CrossRef] [Scilit]
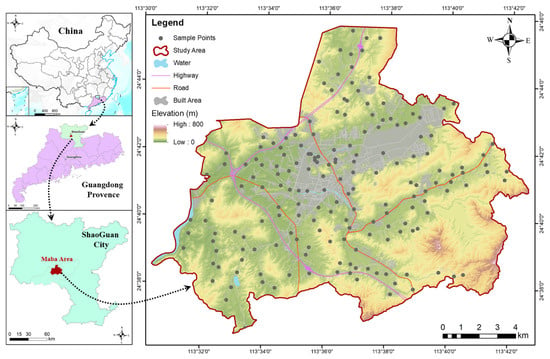
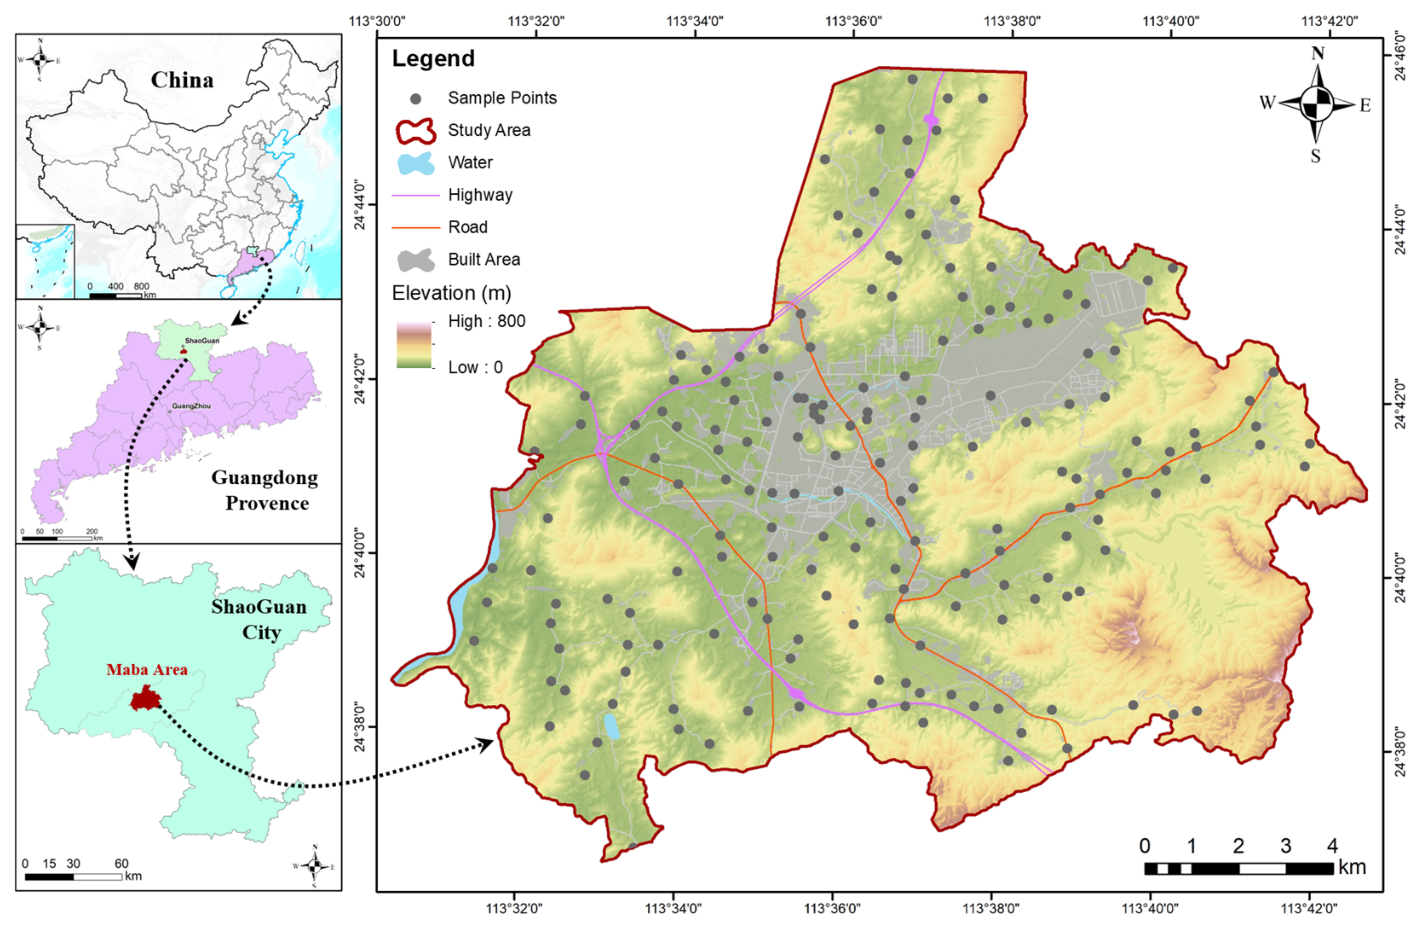
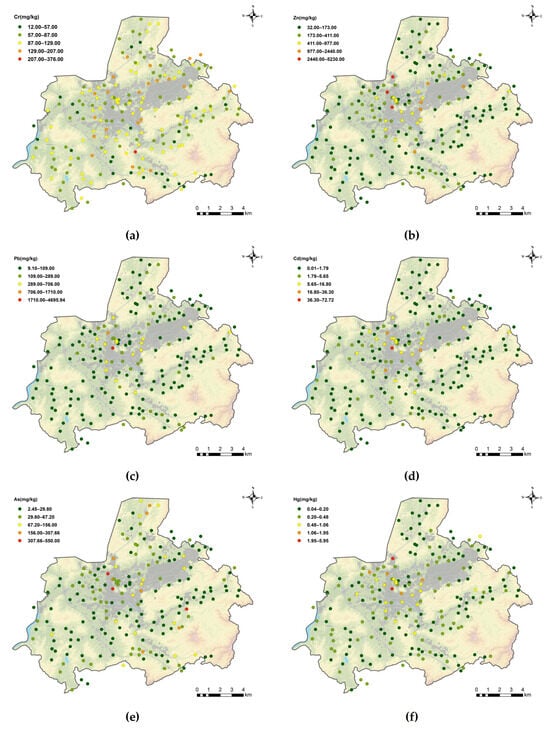
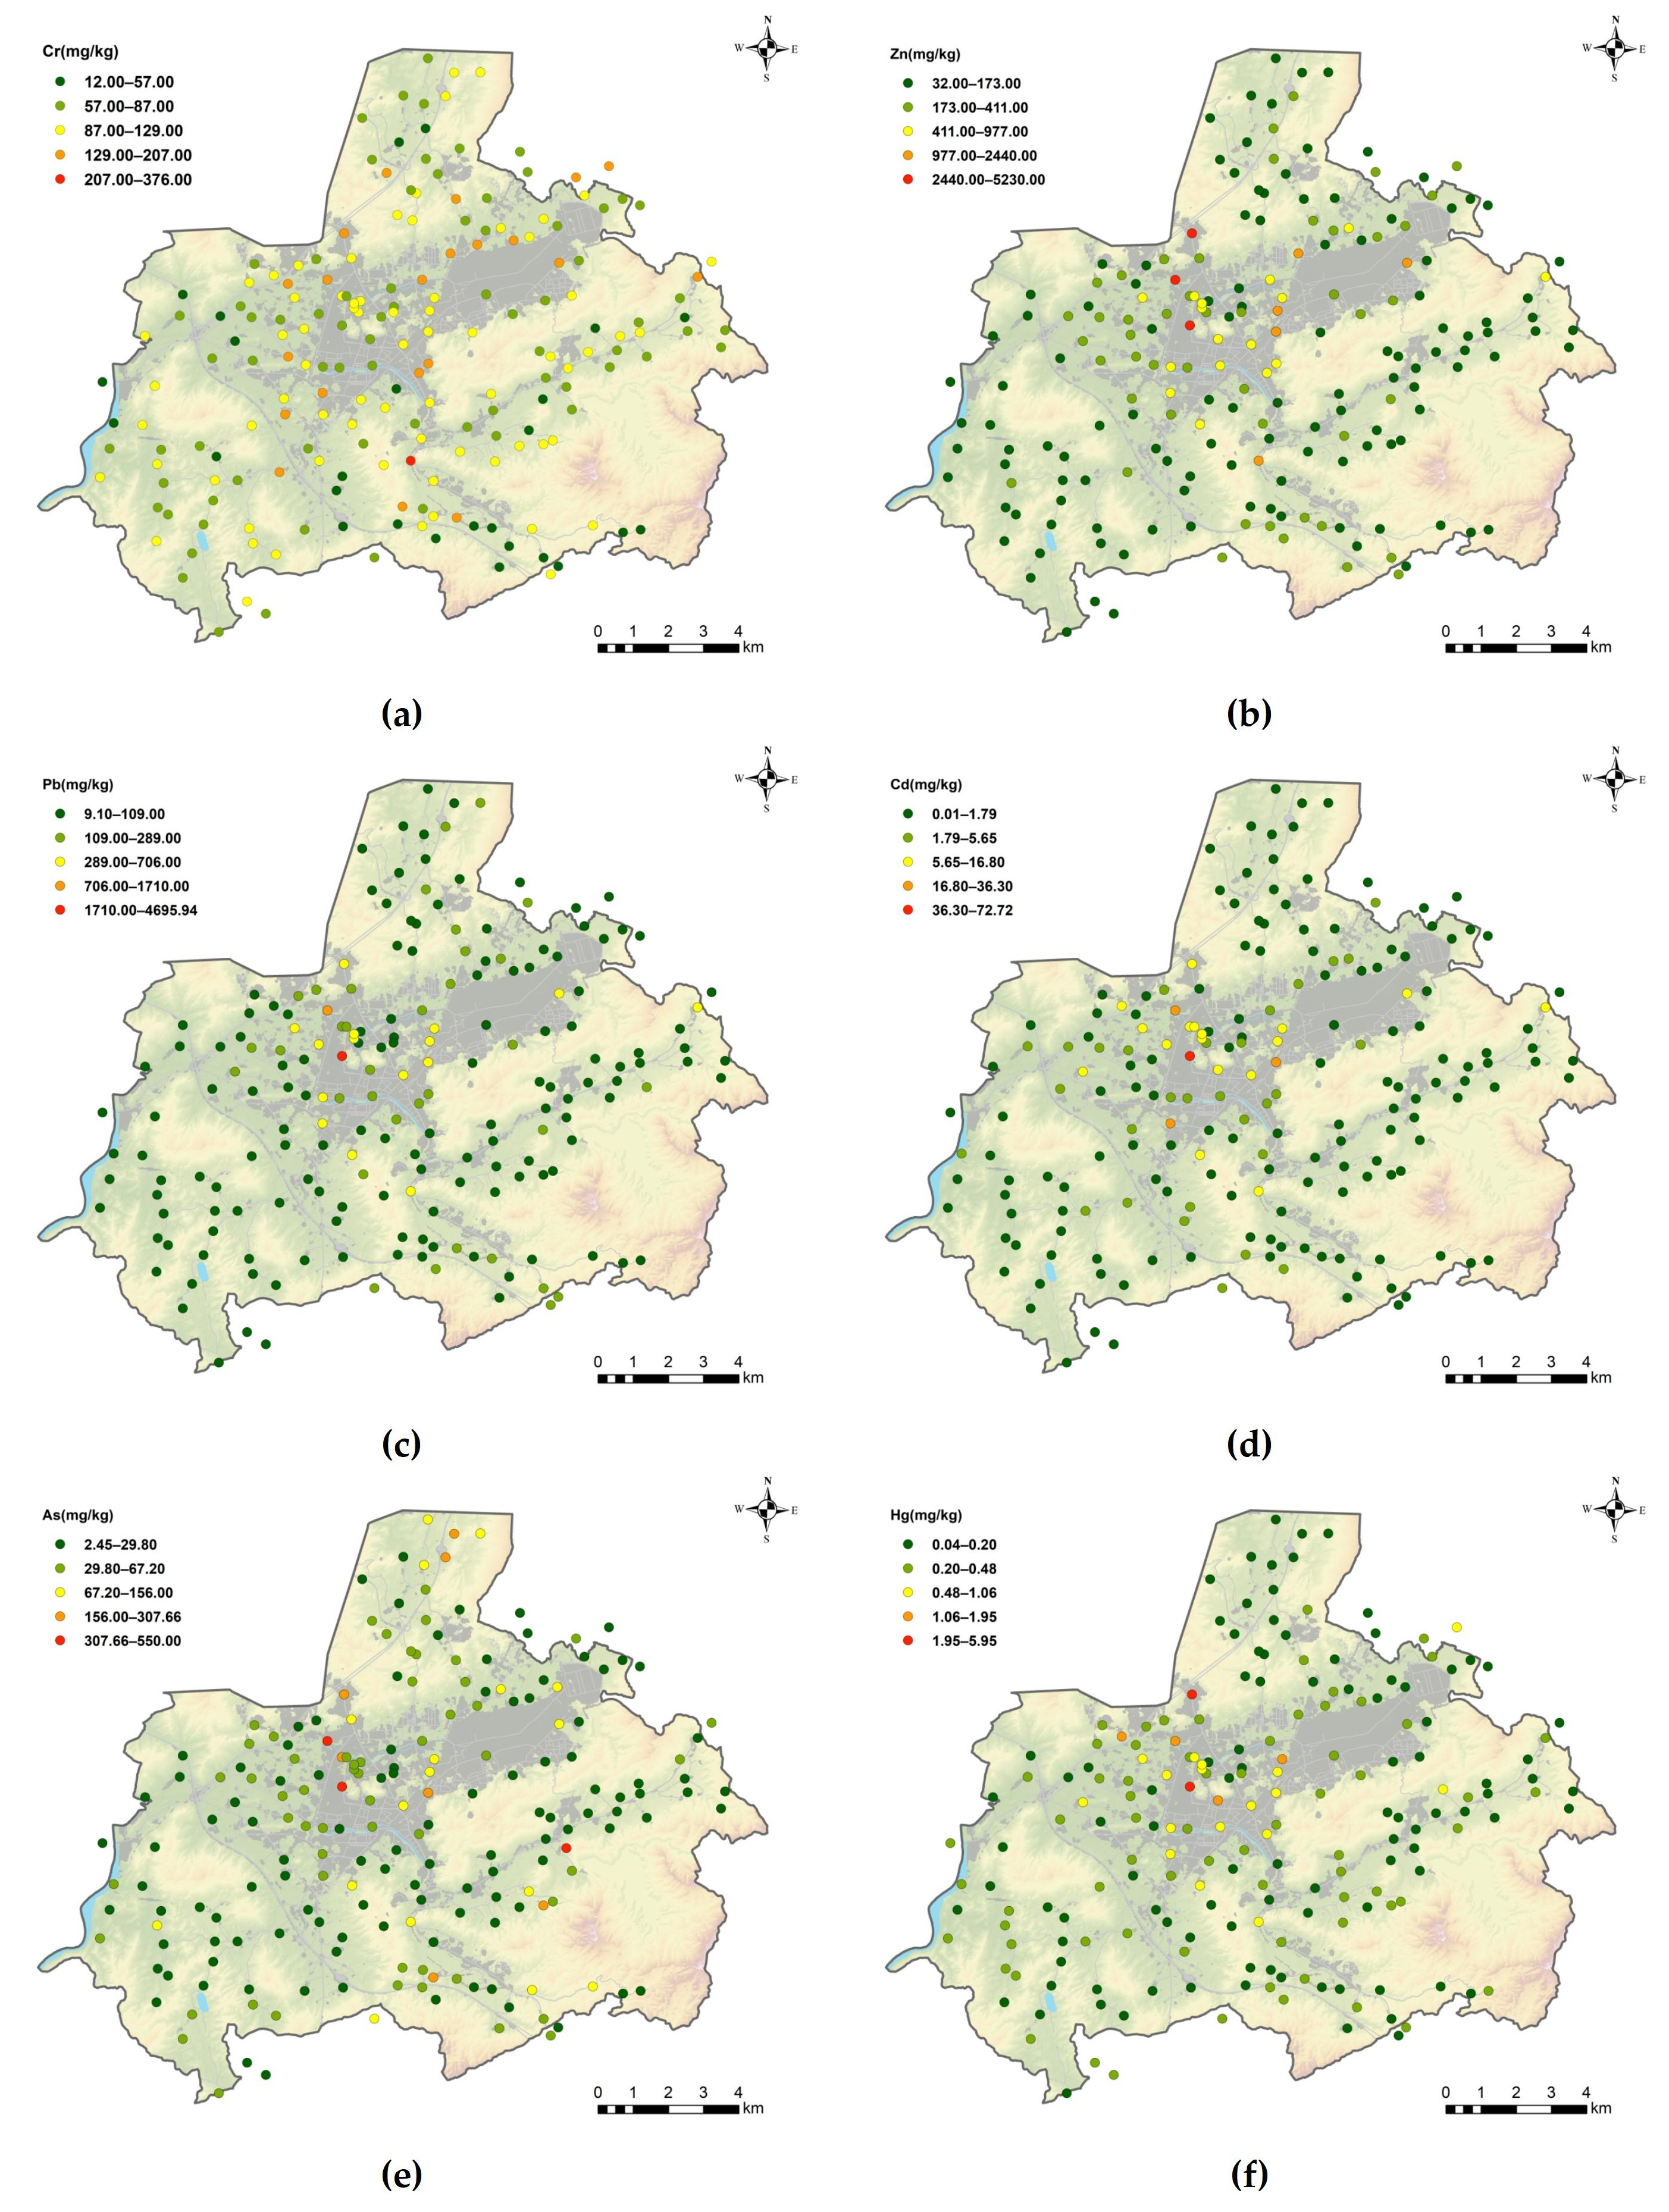
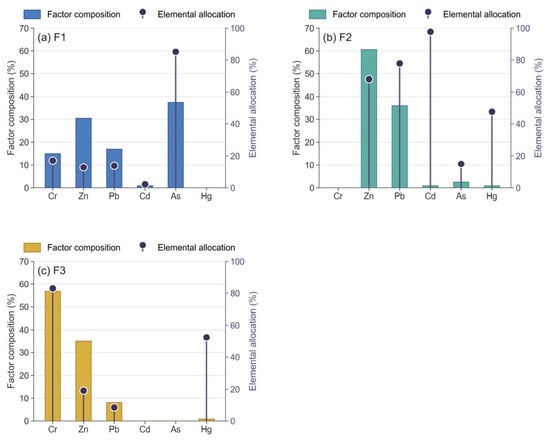
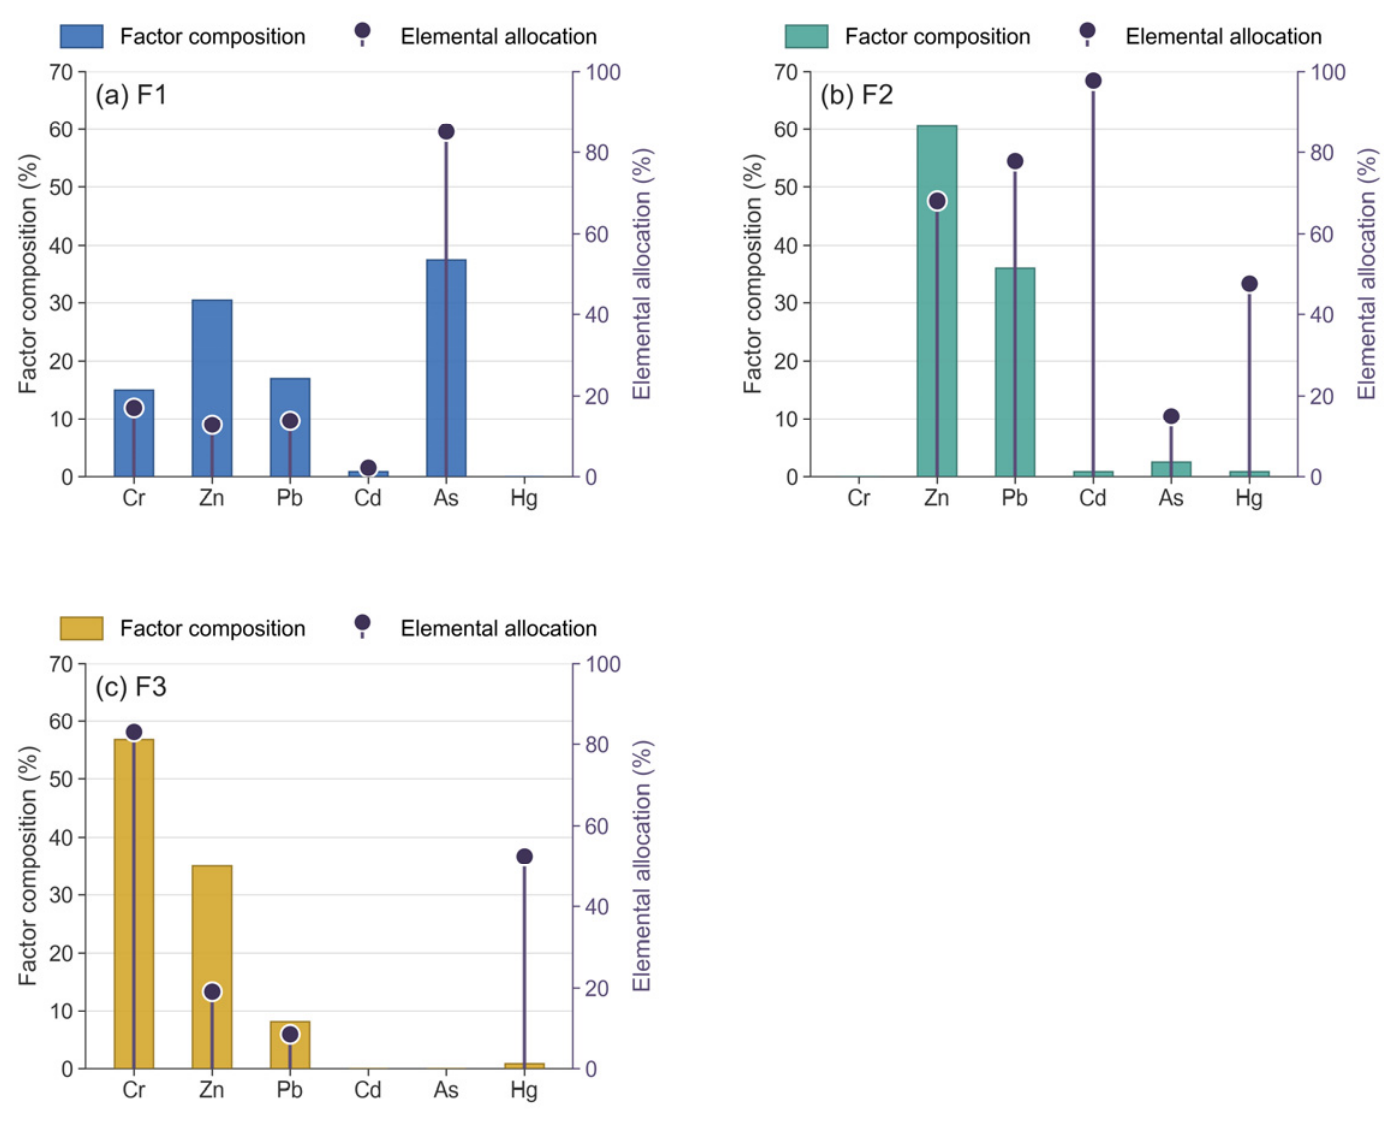
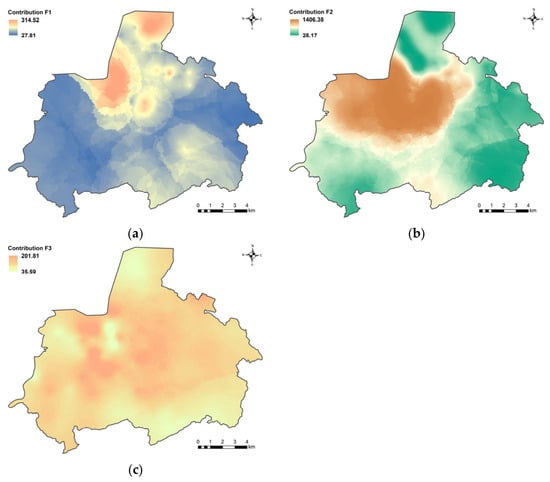
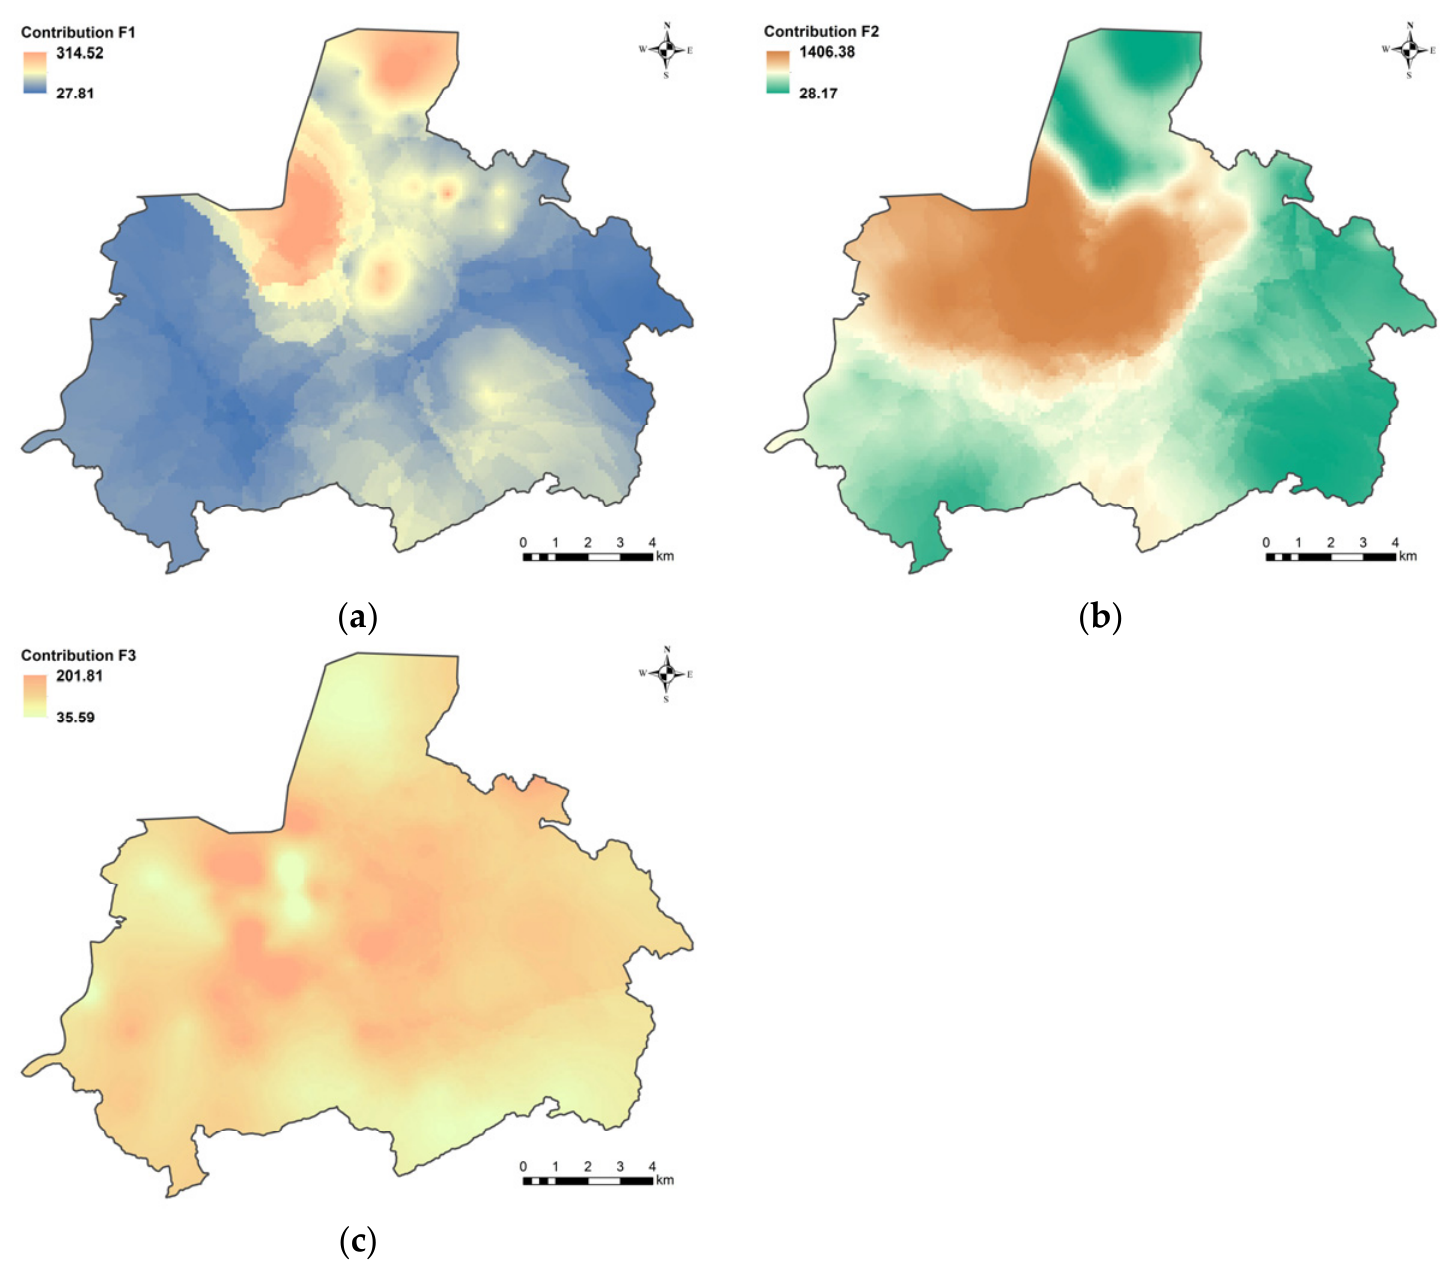
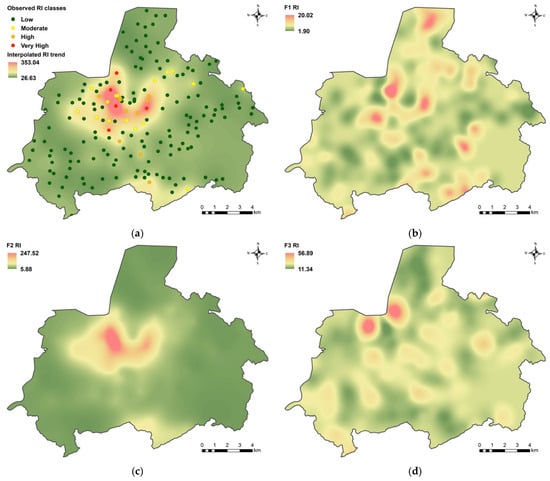
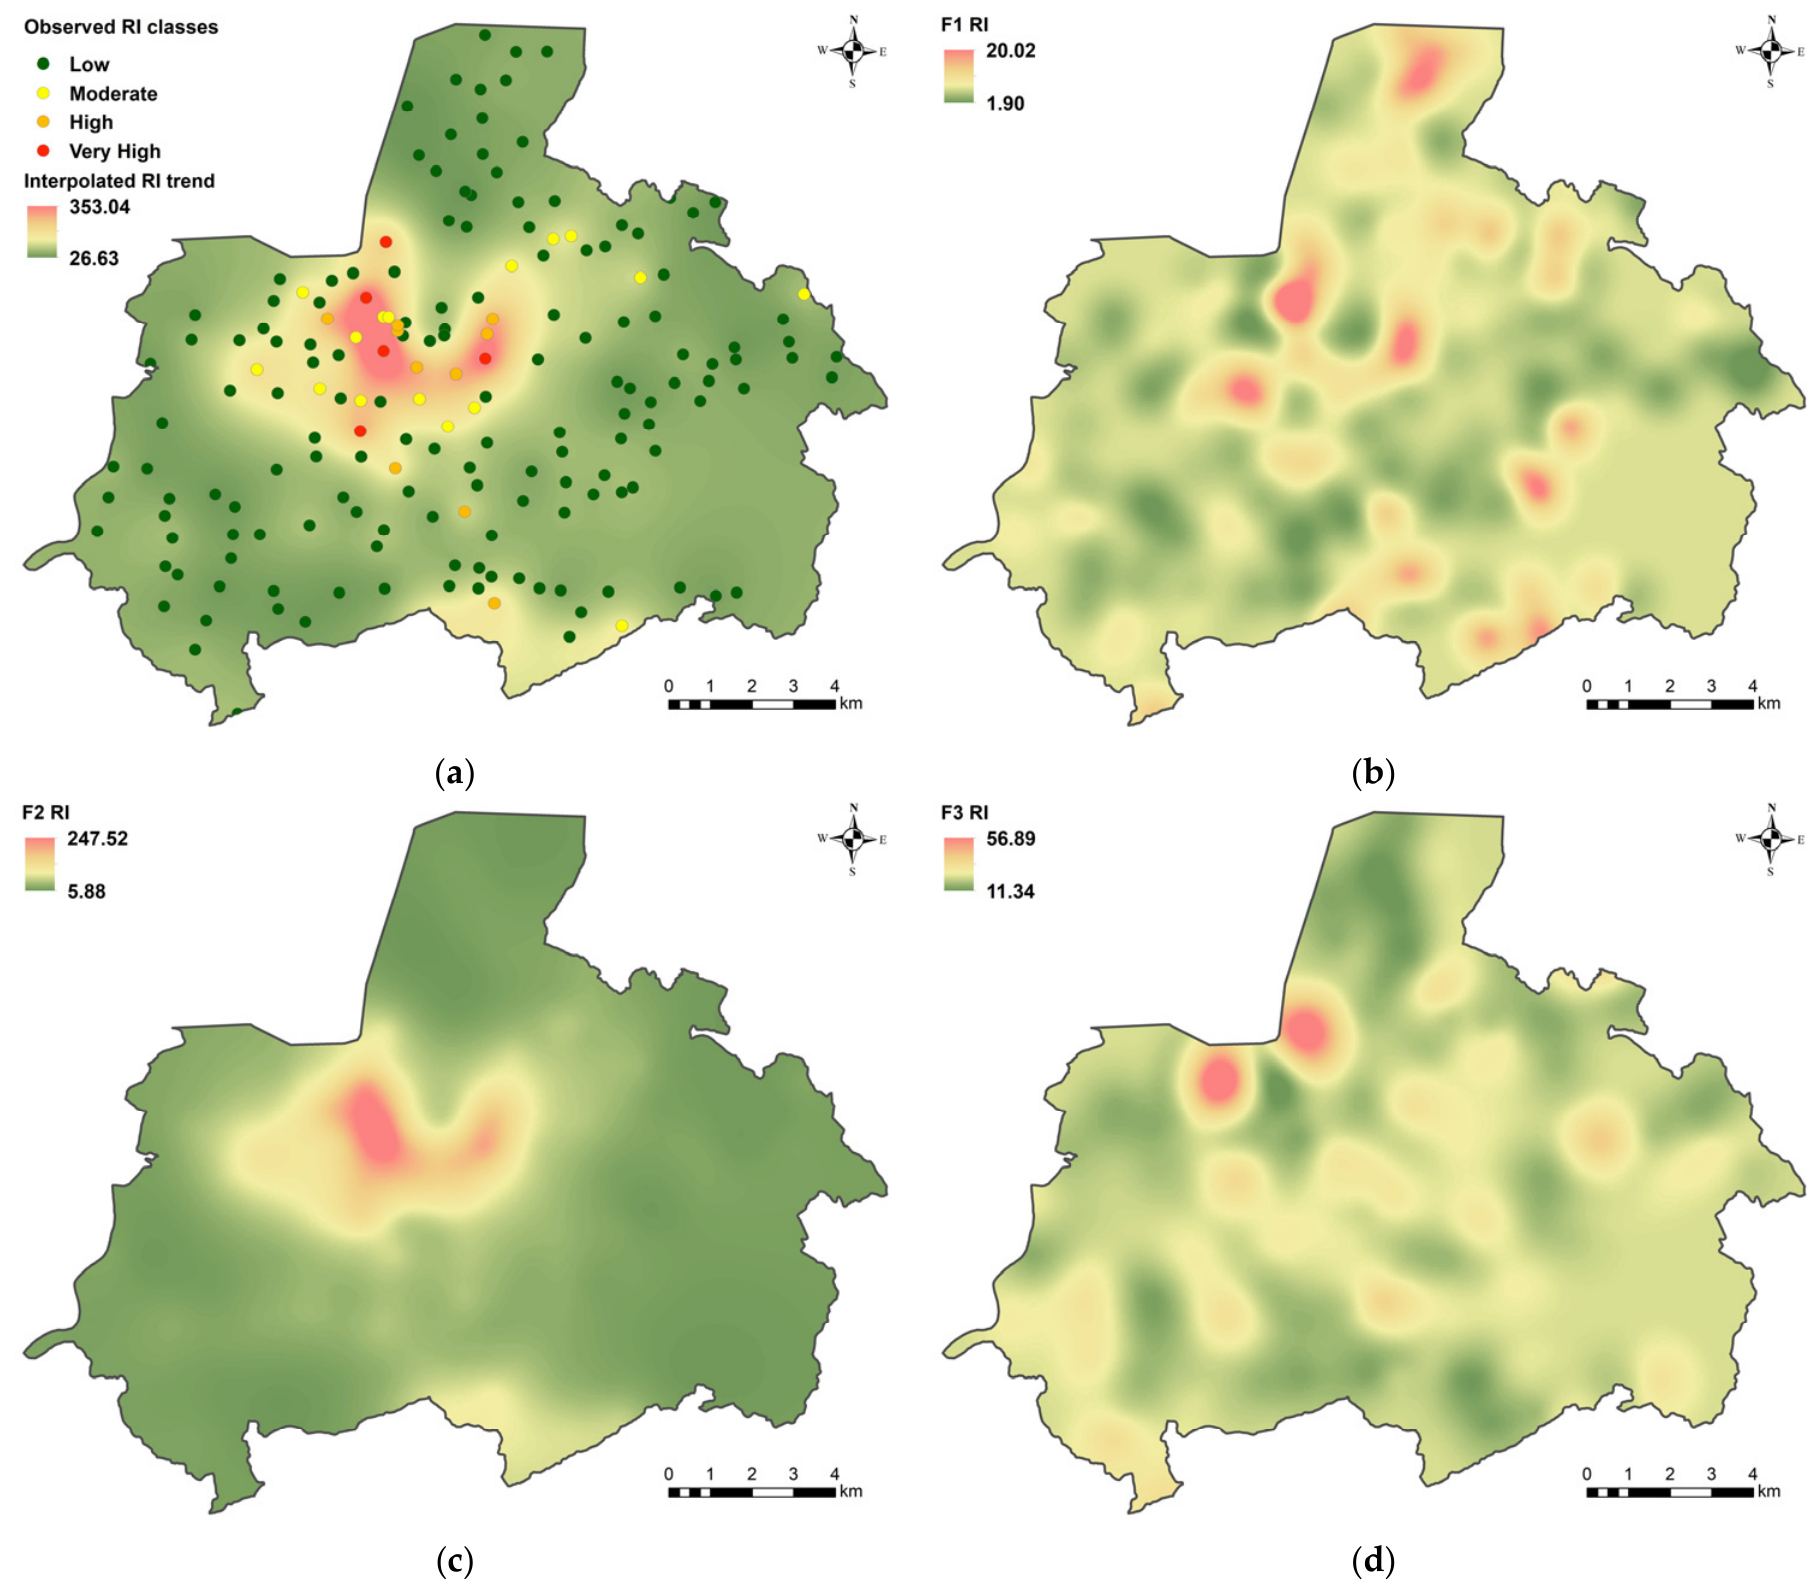
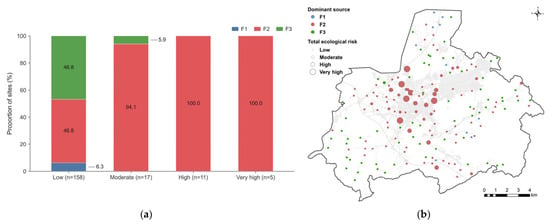
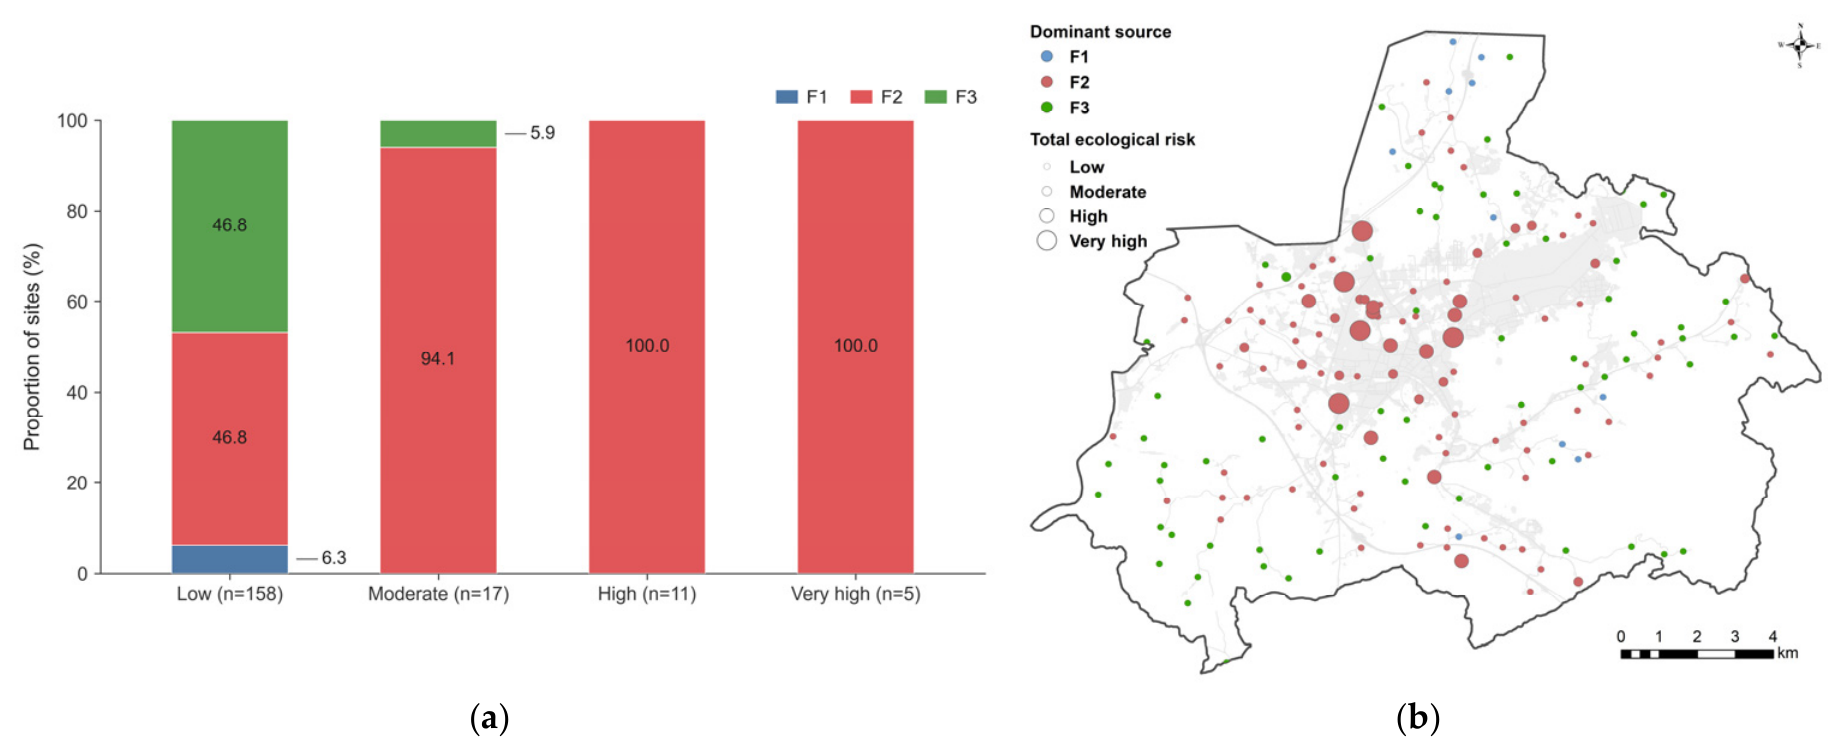
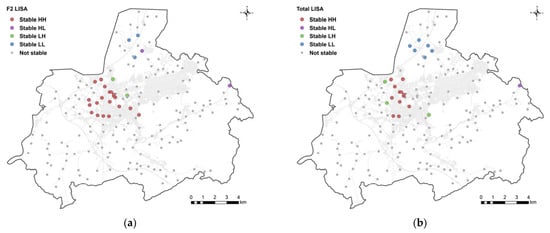
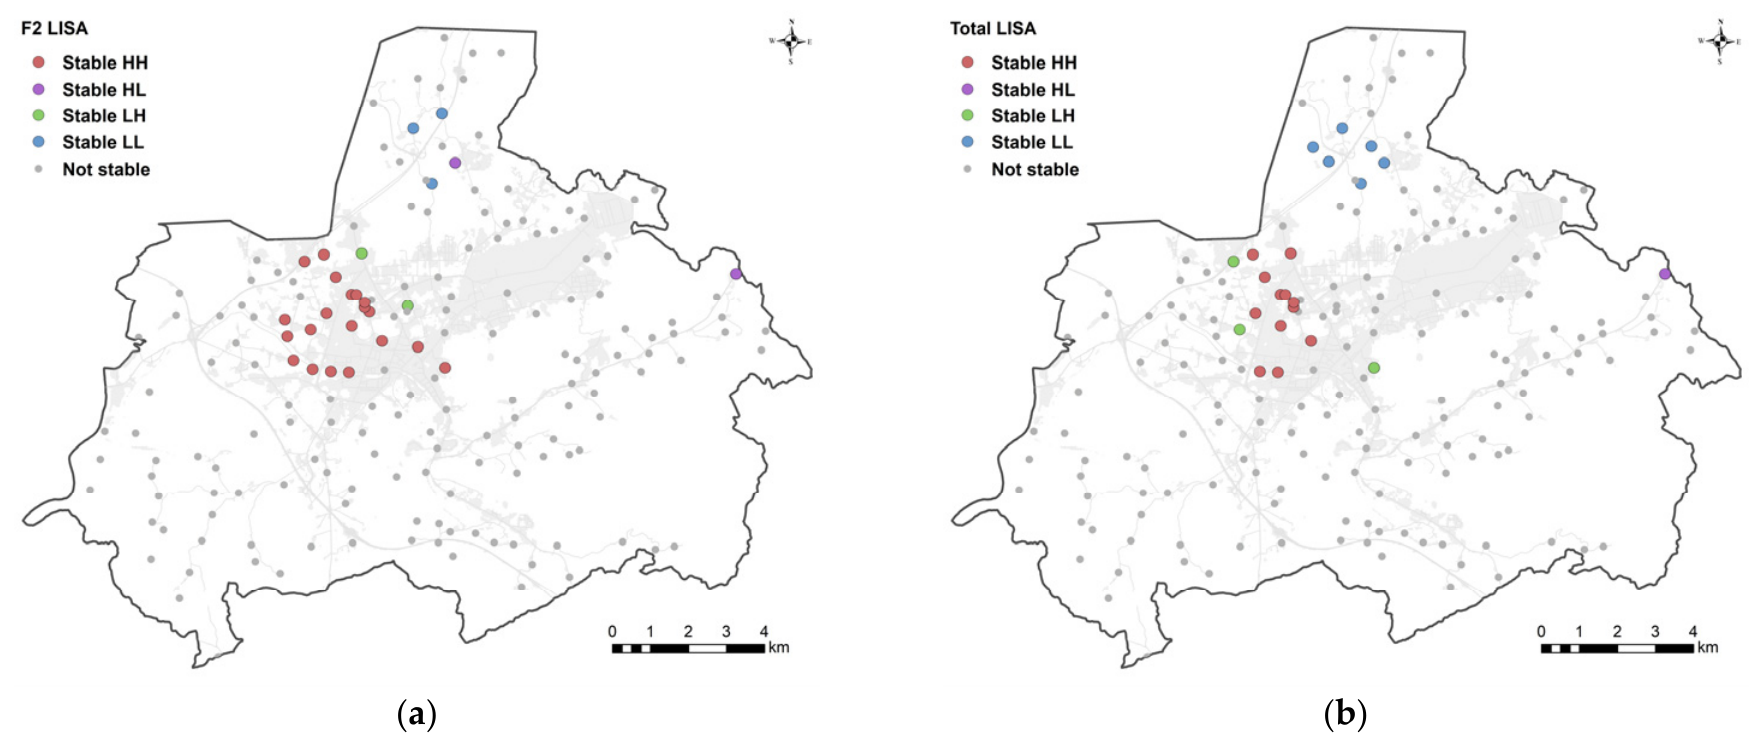

Disclaimer/Publisher’s Note: The statements, opinions and data contained in all publications are solely those of the individual author(s) and contributor(s) and not of MDPI and/or the editor(s). MDPI and/or the editor(s) disclaim responsibility for any injury to people or property resulting from any ideas, methods, instructions or products referred to in the content. |
© 2026 by the authors. Licensee MDPI, Basel, Switzerland. This article is an open access article distributed under the terms and conditions of the Creative Commons Attribution (CC BY) license.