
Article

Beyond the Cafeteria: The Impact of a Classroom-Based Nutrition Program on Attendance, Academic, and Behavioral Outcomes

by
Jenni Putz
College of Arts and Sciences, Eastern Michigan University, Ypsilanti, MI 48197, USA
Soc. Sci. 2026, 15(7), 478; https://doi.org/10.3390/socsci15070478
Submission received: 19 May 2026 / Revised: 3 July 2026 / Accepted: 11 July 2026 / Published: 15 July 2026

Abstract

This paper evaluates the impact of the Fresh Fruit and Vegetable Program (FFVP), a federal classroom-based nutrition program, on elementary schools in Illinois. Using a staggered difference-in-differences framework that accounts for schools moving in and out of funding status, I examine how classroom-based school nutrition programs influence school-level behavioral and academic outcomes. I find that FFVP funding increases school attendance rates, but there are no changes to standardized test scores or disciplinary referrals. These findings suggest that fresh food incentives successfully improve school attendance but are limited in their ability to change trajectories in standardized testing or student conduct.

1. Introduction

Schools are often the primary sites for federal nutrition programs designed to reach low-income children and, for many students, meals provided at school are their most reliable source of healthy food. Because poor nutrition is often linked to lower cognitive performance (Bell et al. 2015), school-based food programs are frequently viewed as a tool to help close achievement gaps while simultaneously supporting student health.
In the United States, school meal programs come in many forms. This paper examines the USDA Fresh Fruit and Vegetable Program (FFVP). Unlike traditional school meal programs, such as the School Breakfast Program (SBP) and the National School Lunch Program (NSLP), that rely on individual means-testing—a process often associated with social stigma and administrative barriers—the FFVP provides universal access to fresh produce for all students within participating schools. By delivering snacks directly in the classroom, the program aims to introduce children to a variety of fresh produce and increase overall consumption. The FFVP is unique in that the program targets low-income students, but funding is determined through the schools’ characteristics, and students are able to receive produce through the FFVP regardless of their family income. This also implies that there should be no stigma attached to in-school FFVP participation, as there could be with other school meal programs that use income to determine eligibility.
While the clinical benefits of improved nutrition are clear, the institutional impact of nutrition programs is less certain. The majority of the literature on federal nutrition programs relates to the means-tested SBP and NSLP. Many studies find positive effects of meal provision on test scores (Figlio and Winicki 2005; Imberman and Kugler 2014; Frisvold 2015), while others find no increases in achievement (Leos-Urbel et al. 2013; Anzman-Frasca et al. 2015; Cuadros-Meñaca et al. 2022). Modest negative effects on test scores have been found in evaluations of Breakfast in the Classroom programs for some groups of students (Cuadros-Meñaca et al. 2022). Previous studies on SBP and NSLP generally find no meaningful effects of these programs on school attendance (Leos-Urbel et al. 2013; Imberman and Kugler 2014; Frisvold 2015). Taken together, the current evidence suggests that traditional, cafeteria-based meal programs have, at most, modest effects on aggregate standardized academic outcomes and generally do not improve school attendance.
There are several mechanisms through which FFVP participation could affect attendance and academic achievement. First, as there is evidence that nutrition is important for cognitive functioning and academic success (Wesnes et al. 2003; Geier et al. 2007), the FFVP may directly impact achievement through improved nutrition. Second, the FFVP may incentivize students to attend school more regularly, which may translate into higher performance on standardized tests. On the other hand, a notable difference between the FFVP and other school nutrition programs is that the FFVP is served in the classroom, outside of the cafeteria. The FFVP is often accompanied by nutrition curriculum during class time, and therefore the FFVP may take up instructional time that could be used for other subjects. Thus, to the extent that the FFVP is disruptive or occupies time that would otherwise be used for instruction towards the test, academic performance may suffer at schools participating in the FFVP, despite more children having access to nutritional snacks at school.
Whether classroom-based nutrition programs produce measurable changes in academic or behavioral outcomes remains a critical empirical question for policymakers. This paper addresses this gap by examining the impact of the FFVP in Illinois public elementary schools. Illinois provides an ideal setting for this analysis, as it encompasses a diverse range of elementary schools that reflect the broader socioeconomic challenges faced by urban and rural districts across the United States. Using school-level data, I leverage the variation in program participation to estimate the effect of FFVP funding on standardized test scores, attendance rates, and disciplinary referrals.
To identify these effects, I exploit the staggered rollout of FFVP grants following the program’s national expansion in 2008. Because schools entered the program at different times based on funding availability and eligibility cycles, I am able to compare the outcomes of participating schools with those of non-participating schools. This strategy allows for an evaluation of the causal impact of the FFVP on academic and behavioral outcomes in high-need schools.
The empirical findings of this paper show that the benefits of this classroom-based nutrition program have meaningful impacts on academic outcomes. Specifically, I find that the receipt of FFVP funding increases school-level attendance rates. Back-of-the-envelope calculations indicate that, for an average-sized school, this program translates to an increase of approximately 225 student-days of instruction annually. However, the program did not have any significant impacts on other dimensions of performance, such as standardized test scores or disciplinary actions.
In Section 1.1, I provide more information about the FFVP in Illinois. I describe my data and empirical methodology in Section 1.2. In Section 2 I report the results of the analysis of the FFVP on academic and behavioral outcomes. In Section 3, I draw conclusions and offer policy recommendations.

1.1. Background

The USDA Fresh Fruit and Vegetable Program (FFVP) aims to increase fresh fruit and vegetable consumption among students in elementary schools with a high percentage of students qualifying for free or reduced-price lunch. While the program does not dictate a planned nutrition curriculum, the goals of the program are “to introduce children to fresh fruits and vegetables, to include new and different varieties, and to increase overall acceptance and consumption of fresh, unprocessed produce among children” (U.S. Department of Agriculture 2017).
The USDA Fresh Fruit and Vegetable Program began as a pilot program in 2002 and was expanded in 2004 and 2006. The program became available nationwide in 2008. The program aims to create a healthier school environment and identify best practices for increasing students’ consumption of fresh foods. The USDA allocates funds to each state; school funding for the FFVP is then determined by the state agency administering the program, based on the amount of state funding and student enrollment. Elementary schools participating in the FFVP receive $50 to $75 per student for the academic year and at least 50% of the grant funds must be spent directly on fresh produce. In Illinois, priority is given to elementary schools with 50% or more of students qualifying for free or reduced-price lunch. However, all enrolled students in eighth grade or below at the FFVP school can receive the fresh fruits and vegetables provided through the FFVP, regardless of their free or reduced-price lunch eligibility (Illinois State Board of Education 2022).
The FFVP must begin within the first week of the school year and continue for the duration of the academic year. Schools are required to serve students a fresh snack at least twice per week—the food may be served at various times during the school day, but it cannot be served during the federally funded SBP or NSLP periods. Snacks are most commonly served inside the classroom in Illinois (Illinois State Board of Education 2022).
While the literature specific to the FFVP is small, there is evidence that the FVP has been successful in accomplishing these goals. Several studies find that participation in the FFVP increases fruit and vegetable intake among children and adolescents (Jamelske et al. 2008; Coyle et al. 2009; Davis et al. 2009). However, other studies note that this increase in consumption is mostly due to the foods directly provided by the program (Olsho et al. 2015). Bartlett et al. (2013) find that while fruit and vegetable consumption increases for students in FFVP schools, there is no increase in total energy intake and no change in consumption of other types of food, suggesting that fruit and vegetable consumption was in addition to, rather than in place of, other foods.
There is also evidence that FFVP participation changes behaviors outside of the classroom and has benefits beyond the immediate effects of the food provided. For example, FFVP participation is associated with asking parents for more fruits and vegetables at home or on shopping trips (Bica and Jamelske 2012; Ohri-Vachaspati et al. 2018). Additionally, FFVP participation has been linked to lower BMI percentiles in children (Qian et al. 2016; Chen et al. 2016).

1.2. Methodology

1.2.1. Data

For the analysis, I used publicly available data provided by the Illinois State Board of Education (ISBE) Report Card Data Library. The Report Card Data Library provides annual public-use datasets containing the information used to produce the official Illinois School Report Cards, including school demographics, enrollment, attendance, disciplinary outcomes, and state assessment results. The datasets are available for download from the ISBE website, along with annual data dictionaries (file layouts) and glossaries that describe each variable.
The data contains yearly records of school-level average standardized test scores, attendance rates, student disciplinary referrals, and school characteristics. Key variables used in this study include school-level average English language arts and mathematics test scores, school-level attendance rate, the numbers of in-school and out-of-school suspensions, enrollment, the percentage of students eligible for free or reduced-price lunch, and student demographic composition (e.g., percentage White, Black, and Hispanic).
The Illinois State Board of Education also reports schools that receive FFVP funds for each academic year.1 The data set covers academic years 2008–2009 through 2018–2019. Annual FFVP participation records were merged with the ISBE files using the school identification code. The full sample is a panel of 2429 public elementary schools. In this sample, there are 542 elementary schools that received FFVP funds at least once over the sample period and there are 1887 schools that never participated in the FFVP.
The primary outcomes for academic performance are school-level average scores on standardized tests, as provided by the Illinois State Board of Education (ISBE). These data represent the aggregate performance across all tested grades within a building (e.g., grades 3 and 4). I measured school-level achievement using the schools’ average English-language Arts (ELA) and mathematics standardized test scores from Illinois’ state standardized test.2 I standardized the scale scores within subject and year to a mean of zero and a standard deviation of one. Thus, the estimated effects are in school-level standard deviations and can be interpreted as an effect size.
Attendance was measured using the student attendance rate provided by the ISBE: the aggregate days of student attendance, divided by the sum of the aggregate days of student attendance and aggregate days of student absence, multiplied by 100. Data on behavioral outcomes were obtained from the Illinois State Board of Education (ISBE) Student Discipline Reports. These reports provide annual school-level counts of in-school and out-of-school suspensions. To account for variations in school enrollment and to ensure comparability across the sample, I calculated the suspension rate as the number of incidents per 100 students enrolled. The ISBE defines an in-school suspension (ISS) as an instance where the student is removed from the regular classroom but stays in the building under supervision, whereas an out-of-school suspension (OSS) is a temporary removal from the school entirely.
Descriptive statistics of school-level variables and outcomes are reported in Table 1. Column (2) represents the sample of schools that participated in the FFVP at least once between 2008 and 2019; column (3) represents the sample of schools that never participated in the FFVP over the same time frame. There are some notable differences between treated schools and never-treated schools. First, schools that received an FFVP grant at least once had lower average test scores in comparison to schools that had never received FFVP funding. Additionally, as priority for FFVP funds is given to elementary schools based on free and reduced eligibility, it is unsurprising that FFVP-participating schools have a higher percentage of students on free/reduced-price lunch. Schools receiving FFVP grants also have a higher share of minority students than non-FFVP schools.
Given that there is variation in the timing of FFVP funding, it would be prudent to examine whether baseline school characteristics are correlated with the timing of a school receiving FFVP grants. To test these correlations, I ran a descriptive OLS regression using schools’ first treatment year as the outcome variable and baseline school demographics (2008)—including the percentage of students receiving free and reduced-price lunch, the percentage of Black students, and the total enrollment—as the independent variables. The timing of FFVP funding is positively correlated with all three of these school demographics, with all coefficients having p-values of less than 0.01. However, this is relatively unsurprising given that schools with greater than 50% of students on free and reduced-price lunch receive priority for FFVP funding. I repeated this analysis using the standardized test scores as independent variables; neither ELA nor math test scores are correlated with the timing of treatment. Note, however, that these regressions are purely descriptive and should not be interpreted as causal relationships.

1.2.2. Empirical Strategy

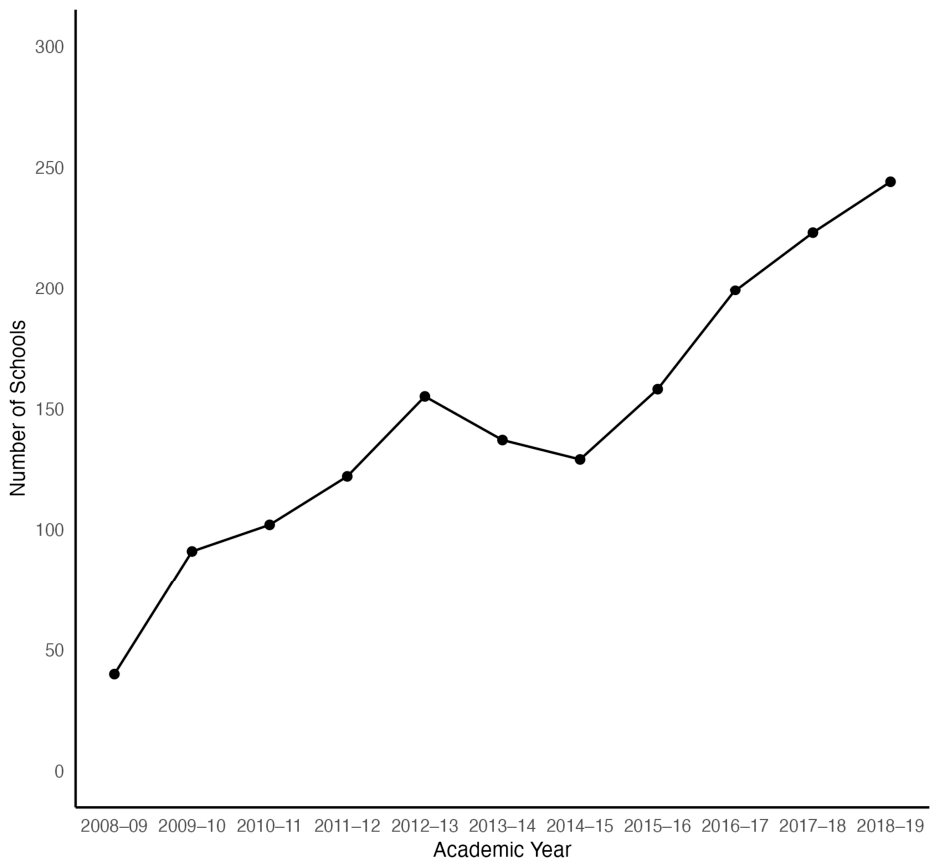
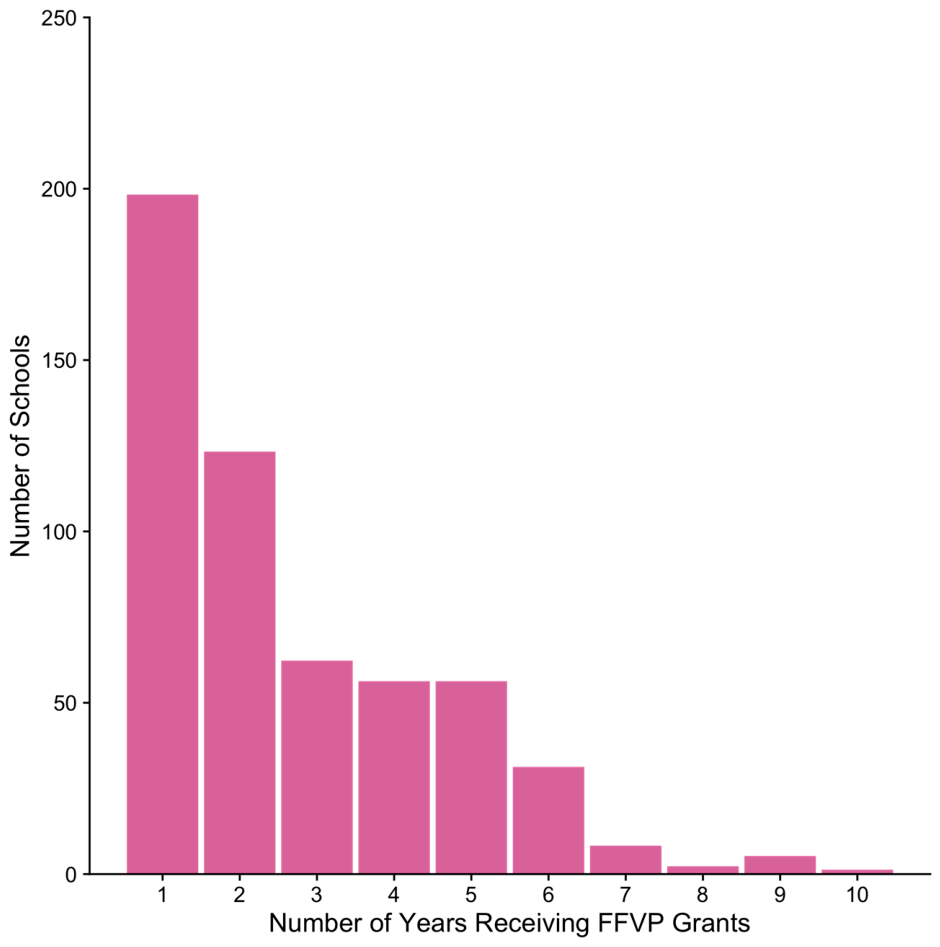
As can be seen in Figure 1, Illinois began the FFVP in 2008 and participation grew over the subsequent decade. At the start of the program in 2008–2009, 42 schools were participating in FFVP and 247 schools received FFVP funding in 2018–2019. Unlike other staggered adoption designs, schools need not stay “treated”. That is, a school may receive FFVP funding for one school year in the sample and not receive it for the other years. There are also schools that move in and out of treatment. For example, a school may have received FFVP funds in 2008–2009 and 2011–2012 but did not receive funds in other school years. As shown in Figure 2, most of the schools in the sample receive FFVP funding for one or two academic years during the sample period.
Recent research has shown that traditional two-way fixed effects models may not provide unbiased estimates in environments with staggered treatment timing (De Chaisemartin and D’Haultfœuille 2020; Callaway and Sant’Anna 2021; Goodman-Bacon 2021; Sun and Abraham 2021; Athey and Imbens 2022). I implemented the estimator developed by De Chaisemartin and D’Haultfœuille (2020) specifically because it remains valid in the presence of ‘switchers’ and ‘re-switchers.’ Unlike other robust estimators that require a staggered setup with absorbing treatment, the De Chaisemartin and D’Haultfœuille (2020) approach allows for treatment effects to be estimated even when units exit and reenter the program, by comparing groups whose treatment status changed to those whose status remained stable.
The identifying assumption is that, in the absence of treatment, the outcomes of FFVP-funded schools and non-FFVP funded schools would have followed parallel trends. While the schools are not identical in levels—as FFVP eligibility is tied to the percentage of low-income students at the school—the model assumes that their trends would have remained consistent. Specifically, I assume that the timing of FFVP funding is exogenous to school performance (such as a sudden decline in attendance or decrease in standardized test scores) and that there are no unobserved, time-varying factors correlated with both FFVP funding and student outcomes. If program administrators prioritized FFVP funding for schools specifically following a ’bad’ year (e.g., a sudden drop in test scores), the estimates would be biased. This concern is particularly relevant because such prioritization would induce correlation between adoption timing and pre-existing performance trends among eligible schools. This type of selection would also imply that test scores predict the timing of treatment adoption. However, because FFVP eligibility is based on a fixed administrative threshold of free and reduced-price lunch eligibility and is dependent on federal and state funding for the program, it is unlikely that academic shocks, such as a down year in test scores, affect the timing of the funding. Consistent with this, the descriptive OLS regression in Section 1.2.1 showed no statistically significant relationship between baseline test scores and timing of FFVP adoption. I test these assumptions by estimating an event-study model to ensure that there are no statistically significant differences in outcomes during the pre-treatment periods.
The pre-treatment placebo estimates from the event-study model should be interpreted carefully. Under the De Chaisemartin and D’Haultfœuille (2020) estimator, placebo coefficients compare schools that will eventually receive treatment with the comparison group that has not yet been treated at a given event time (e.g., two years prior to treatment), rather than directly comparing early- and late-adopting cohorts. Consequently, significant placebo estimates indicate differential pre-treatment dynamics between future treated schools and the comparison schools used for identification, rather than differences between treatment cohorts themselves. Because the panel begins in the first year of FFVP implementation, progressively fewer treated schools contribute to the longer-horizon placebo estimates, so these estimates are based on increasingly small subsets of treated schools.

2. Results

2.1. Attendance

FFVP participation may increase attendance among students for whom healthy food is an incentive to attend. Additionally, if a healthier diet promotes wellness, improvements in nutrition may lead to increased attendance due to reductions in illnesses or other factors.
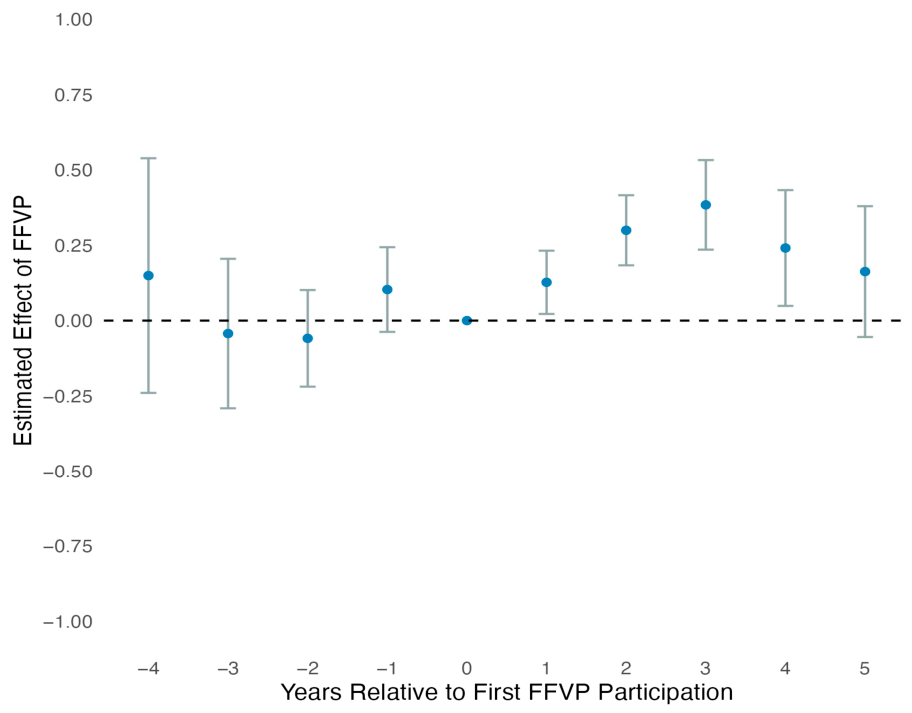
To estimate the effect of FFVP grants on attendance, I conducted the analysis described in Section 1.2.2 using school-level attendance rate as the outcome. Event-study results are reported in Figure 3, which shows the model results including school demographic controls for total enrollment, the percentage of students on free/reduced-price lunch, and the percentage of Black students.
The estimated impacts of the FFVP on the school-level attendance rate are positive and statistically significant. In the first year of receiving FFVP funding, (t = 1) attendance rates increase 0.15 percentage points (p < 0.05), on average. Additionally, the effects increase with subsequent years of FFVP funding. For schools that receive FFVP a second time (t = 2), the effect increases to 0.32 percentage points (p < 0.05). The cumulative effect over time of the FFVP is 0.44 percentage points (p < 0.05); this effect accumulates over approximately three treated periods.
While these effects may appear modest in absolute terms, attendance rates in Illinois elementary schools are already high (94% in schools that received an FFVP grant at least once). To contextualize the magnitude of these findings, a 0.30 percentage point increase in attendance can be translated into cumulative instructional time. The mean enrollment for schools that receive FFVP funding is 415 students. This implies that for a 180-day school year and an average sized school, a 0.30 percentage point increase in the school-level attendance rate translates to approximately 225 student-days of instruction annually. Alternatively, the effect can be understood at the individual student level. A 0.15 percentage point increase in the first year of the program means the average student attends an additional 0.27 days of school in a 180-day school year. By the third year of treatment, the 0.39 percentage point increase implies that the average student gains nearly three-quarters of a full school day (0.70 days) of instructional presence per year. Although prior work demonstrates that a single missed day of schooling can translate to reductions in standardized test scores (e.g., Goodman (2014)), the attendance gains associated with FFVP are considerably smaller than the attendance changes typically examined in the literature. Whether or not the estimated increases in attendance translate to meaningful academic outcomes for students remains an open empirical question.

2.2. Test Scores

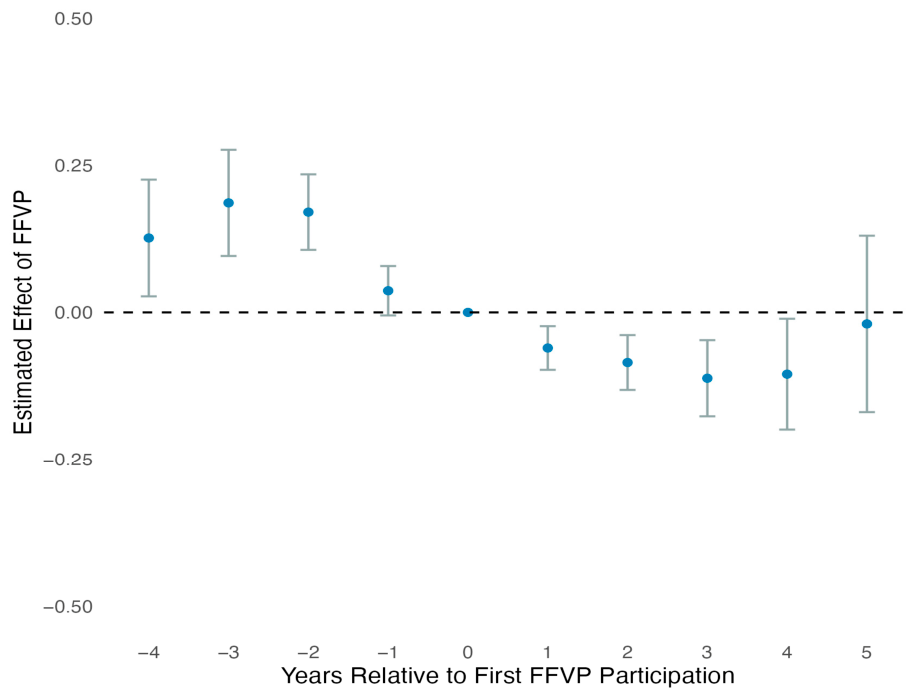
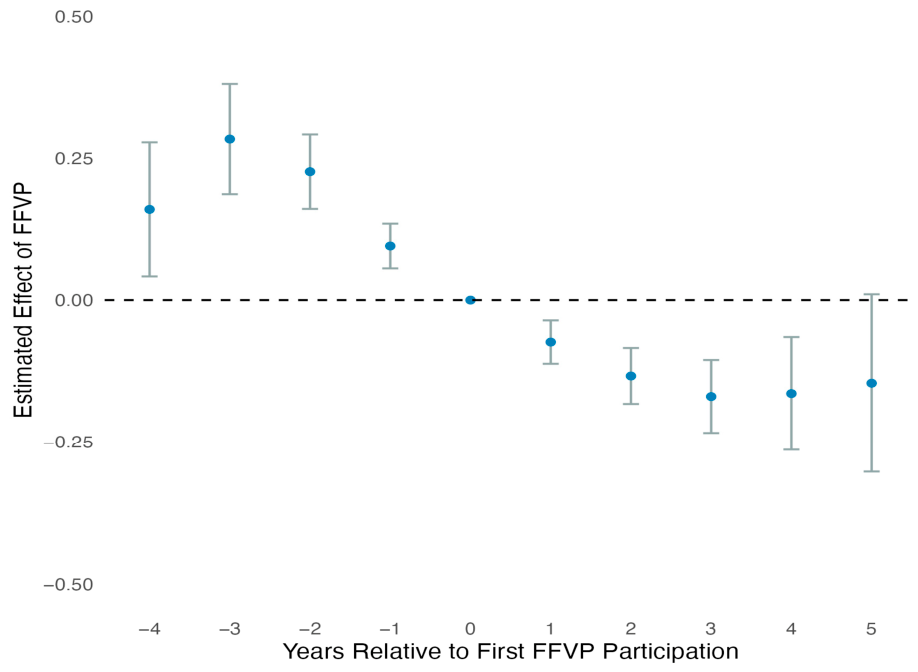
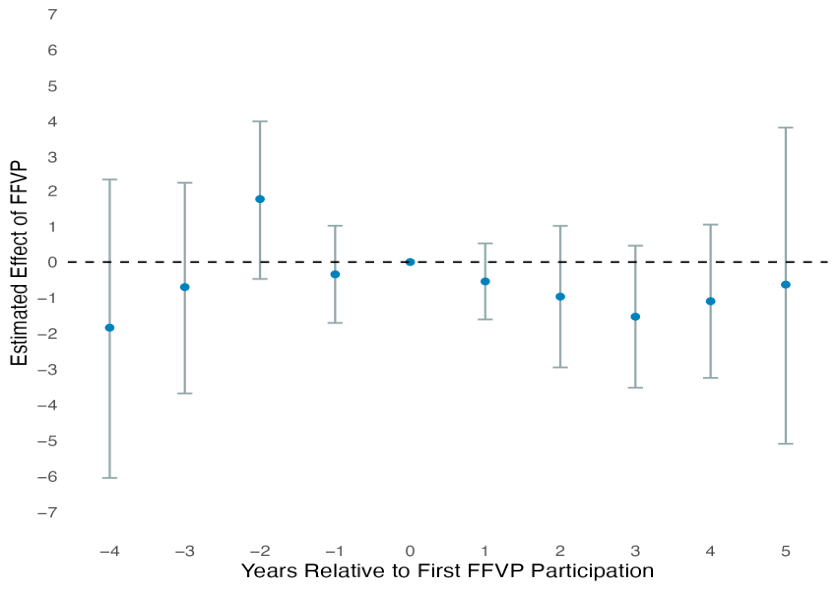
Figure 4 and Figure 5 show the event-study estimates for the English Language Arts (ELA) and Mathematics standardized test scores, respectively. In both cases, several pre-treatment periods display positive and statistically significant coefficients, with a decline at t = −1 and t = 0. In the post-treatment periods, the point estimates are negative. These results yield two primary conclusions. First, the presence of statistically significant coefficients in the pretreatment periods indicates violation of the parallel trends assumption, suggesting that schools receiving FFVP funding were on a different trajectory than non-FFVP schools. Second, despite the existing pre-trends, the introduction of FFVP funding does not result in a structural break in the trend of school-level standardized test scores.
While the point estimates in the post treatment period are negative and statistically significant at the 5% level, a cautious interpretation of these results would be that schools participating in the FFVP do not see changes in school-level standardized test scores that can be attributed to program participation. While the point estimates are consistently negative, I am unable to conclude that FFVP funding causally impacts standardized test scores. We should note that the unit of observation is the school and school-level estimates may be masking heterogeneous effects. The benefits associated with increased nutrition through the FFVP may vary by income, as the FFVP is likely to have greater impacts for the most food-insecure students, who are more likely to be lower-income and lower-performing students (Alaimo et al. 2001; Case et al. 2005). Additionally, the outcome variable is a school-level average of the scaled scores for every grade tested. With the data available, I am unable to estimate the effect of the FFVP on standardized test scores by grade level, masking any heterogeneity by grade that may be present.

2.3. Disciplinary Actions

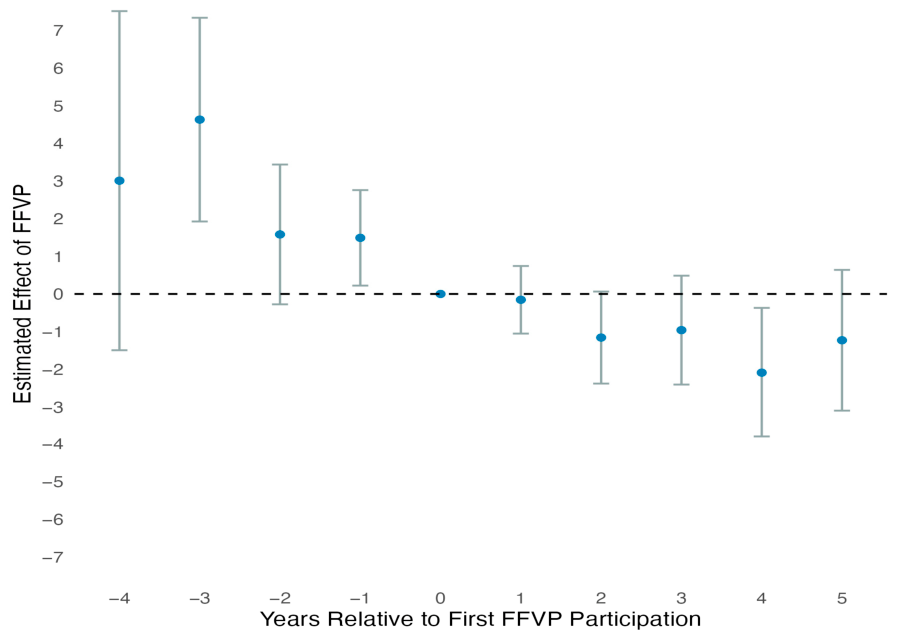
Next, I examined the impact of the FFVP on school-level behavioral outcomes. Specifically, I examined the rate of in-school and out-of-school suspensions, defined as the number of suspensions divided by school enrollment. Overall, as reported in Figure 6 and Figure 7, changes in disciplinary suspensions following FFVP participation are estimated as null effects. For out-of-school suspensions, we again see that there are statistically significant differences in the pre-treatment period, thus we should be cautious in interpreting the results from this model. These null findings yield an important policy insight: while the classroom-based delivery of fresh produce successfully improves student attendance, these gains do not spill over into classroom behavioral management or disciplinary actions.

2.4. Heterogeneity

Because the FFVP is targeted toward schools serving economically disadvantaged students, I examined whether treatment effects differ between schools with different characteristics. First, I compared schools that met the program’s priority edibility threshold (>50% FRPL) and those that did not. Second, as the FFVP may have differential effects for schools serving large shares of traditionally underrepresented groups, I compared schools with above the median percentage of non-White students and schools with below the median percentage of non-White students. The De Chaisemartin and D’Haultfœuille (2020) methodology does not directly allow for heterogenous treatment effects; therefore, I ran a separate model for each group. Consequently, we cannot directly compare the coefficients and determine whether they are statistically different from each other, so this exercise should be interpreted as descriptive rather than causal evidence of heterogeneous effects.
Table 2 shows the estimated average total effect of FFVP funding on the outcome variables, with each column representing a different subgroup. Column 1, for example, contains schools that had greater than 50% of students receiving free or reduced-price lunch in the baseline year of 2008. The results are broadly consistent with the baseline findings. Attendance increases are observed across all subgroups, while estimated effects on standardized test scores and suspension rates are generally small and statistically indistinguishable from zero.

3. Conclusions

This paper examines the effect of a classroom-based nutrition program on academic and behavioral outcomes for elementary-aged children. Specifically, the FFVP increased school-level attendance rates at schools that received funding for the program. The introduction of FFVP funding yields an immediate, statistically significant increase of 0.15 percentage points in school-level daily attendance, with the effect increasing over time to roughly 0.39 percentage points by the third year of treatment.
Notably, however, FFVP funding does not impact other dimensions of school performance. The estimated effects on administrative disciplinary actions—measured as in-school and out-of-school suspensions—are null effects, indicating that the nutritional program alone does not systematically alter classroom behavior management. Additionally, despite the increase in attendance rates, the introduction of the FFVP yields no gains in standardized test scores at the school level. One possible explanation is that the increase in attendance was relatively modest, limiting the potential for detectable changes in aggregate standardized test scores. Additionally, the students whose attendance improved may differ systematically from those who already attended school regularly, such that additional instructional time does not immediately translate into higher average achievement. These findings should be interpreted as applying to aggregate school-level outcomes and do not necessarily imply the absence of effects for individual students or specific student subgroups. Future research using student-level longitudinal data could examine whether attendance gains are concentrated among particular groups of students and whether those students experience improvements in academic performance or other educational outcomes in subsequent years.
For education policymakers, these conclusions offer vital insights. Classroom-based nutrition programs can serve as a mechanism for increased school attendance. However, the lack of improvement in standardized test scores reminds us that standardized academic outcomes are deeply tied to systemic socioeconomic factors that are unaffected by a classroom-based nutrition program alone. There may also be other unobserved effects of these nutrition programs, such as increased caloric intake, increased attention during luring, or improved child nutrition, that improve areas of child development not assessed via standardized academic testing.

Funding

This research received no external funding.

Institutional Review Board Statement

Not applicable.

Informed Consent Statement

Not applicable.

Data Availability Statement

The data presented in the study are openly available on FigShare at https://doi.org/10.6084/m9.figshare.32347581 (accessed on 10 July 2026).

Conflicts of Interest

The author declares no conflict of interest.

Notes

1
For a complete list of schools receiving FFVP funds for a given academic year, see https://www.isbe.net/Pages/Fresh-Fruit-and-Vegetable-Program.aspx (accessed on 10 July 2026).
2
From the 2008–2009 academic year through the 2013–2014 academic year, the Illinois elementary standardized test was the ISAT. Starting with the 2015–2016 academic year, the PARCC became the statewide standardized test in Illinois.

References

  1. Alaimo, Katherine, Christine M. Olson, and Edward A. Frongillo, Jr. 2001. Food insufficiency and American school-aged children’s cognitive, academic, and psychosocial development. Pediatrics 108: 44–53. [Google Scholar] [CrossRef] [Scilit] [PubMed]
  2. Anzman-Frasca, Stephanie, Holly Carmichael Djang, Megan M. Halmo, Peter R. Dolan, and Christina D. Economos. 2015. Estimating Impacts of a Breakfast in the Classroom Program on School Outcomes. JAMA Pediatrics 169: 71–77. [Google Scholar] [CrossRef] [Scilit] [PubMed]
  3. Athey, Susan, and Guido W. Imbens. 2022. Design-based analysis in Difference-In-Differences settings with staggered adoption. Journal of Econometrics 226: 62–79. [Google Scholar] [CrossRef] [Scilit]
  4. Bartlett, Susan, Lauren Olsho, Jacob Klerman, Kelly L. Patlan, Michelle Blocklin, Patty Connor, Karen Webb, Lorrene Ritchie, Patricia Wakimoto, and Patricia Crawford. 2013. Evaluation of the Fresh Fruit and Vegetable Program (FFVP): Final Evaluation Report; Prepared by Abt Associates under Contract No. AG-3198-D-09-0053. Alexandria: U.S. Department of Agriculture, Food and Nutrition Service.
  5. Bell, Lynne, Daniel J. Lamport, Laurie T. Butler, and Claire M. Williams. 2015. A Review of the Cognitive Effects Observed in Humans Following Acute Supplementation with Flavonoids, and Their Associated Mechanisms of Action. Nutrients 7: 10290–306. [Google Scholar] [CrossRef] [Scilit] [PubMed]
  6. Bica, Lori A., and Eric M. Jamelske. 2012. USDA Fresh Fruit and Vegetable Program Creates Positive Change in Children’s Consumption and Other Behaviors Related to Eating Fruit and Vegetables. Journal of Child Nutrition and Management 36. [Google Scholar]
  7. Callaway, Brantly, and Pedro H. C. Sant’Anna. 2021. Difference-in-Differences with multiple time periods Themed Issue: Treatment Effect 1. Journal of Econometrics 225: 200–30. [Google Scholar] [CrossRef] [Scilit]
  8. Case, Anne, Angela Fertig, and Christina Paxson. 2005. The lasting impact of childhood health and circumstance. Journal of Health Economics 24: 365–89. [Google Scholar] [CrossRef] [Scilit] [PubMed]
  9. Chen, Danhong, Michael Thomsen, Rodolfo Nayga, Sangsoo Park, and Judy Bennett. 2016. Evaluating the Impact of Participation in the Fresh Fruit and Vegetable Program on Childhood Obesity Using Synthetic Difference-in-Difference Method. Paper presented at the 2016 Annual Meeting, Boston, MA, USA, July 31–August 2. [Google Scholar]
  10. Coyle, Karin K., Susan Potter, Doris Schneider, Gary May, Leah E. Robin, Jennifer Seymour, and Karen Debrot. 2009. Distributing free fresh fruit and vegetables at school: Results of a pilot outcome evaluation. Public Health Reports 124: 660–69. [Google Scholar] [CrossRef] [Scilit] [PubMed]
  11. Cuadros-Meñaca, Andres, Michael R. Thomsen, and Rodolfo M. Nayga. 2022. The effect of breakfast after the bell on student academic achievement. Economics of Education Review 86: 102223. [Google Scholar] [CrossRef] [Scilit]
  12. Davis, ElaineM., Karen W. Cullen, Kathleen B. Watson, Melanie Konarik, and John Radcliffe. 2009. A fresh fruit and vegetable program improves high school students’ consumption of fresh produce. Journal of the American Dietetic Association 109: 1227–31. [Google Scholar] [CrossRef] [Scilit] [PubMed]
  13. De Chaisemartin, Clément, and Xavier D’Haultfœuille. 2020. Two-Way Fixed Effects Estimators with Heterogeneous Treatment Effects. American Economic Review 110: 2964–96. [Google Scholar] [CrossRef] [Scilit]
  14. Figlio, David N., and Joshua Winicki. 2005. Food for thought: The effects of school accountability plans on school nutrition. Journal of Public Economics 89: 381–94. [Google Scholar] [CrossRef]
  15. Frisvold, David E. 2015. Nutrition and cognitive achievement: An evaluation of the School Breakfast Program. Journal of Public Economics 124: 91–104. [Google Scholar] [CrossRef] [Scilit] [PubMed]
  16. Geier, Andrew B., Gary D. Foster, Leslie G. Womble, Jackie McLaughlin, Kelley E. Borradaile, Joan Nachmani, Sandy Sherman, Shiriki Kumanyika, and Justine Shults. 2007. The relationship between relative weight and school attendance among elementary schoolchildren. Obesity 15: 2157–61. [Google Scholar] [CrossRef] [Scilit] [PubMed]
  17. Goodman, Joshua. 2014. Flaking Out: Student Absences and Snow Days as Disruptions of Instructional Time. NBER Working Paper 20221. Cambridge: National Bureau of Economic Research. [Google Scholar] [CrossRef] [Scilit]
  18. Goodman-Bacon, Andrew. 2021. Difference-in-differences with variation in treatment timing. Journal of Econometrics 225: 254–77. [Google Scholar] [CrossRef] [Scilit]
  19. Illinois State Board of Education. 2022. Fresh Fruit and Vegetable Program. Available online: https://www.isbe.net/Pages/Fresh-Fruit-and-Vegetable-Program.aspx (accessed on 14 March 2026).
  20. Imberman, Scott A., and Adriana D. Kugler. 2014. The Effect of Providing Breakfast in Class on Student Performance. Journal of Policy Analysis and Management 33: 669–99. [Google Scholar] [CrossRef] [Scilit]
  21. Jamelske, Eric, Lori A. Bica, Daniel J. McCarty, and Amy Meinen. 2008. Preliminary findings from an evaluation of the USDA Fresh Fruit and Vegetable Program in Wisconsin schools. Wisconsin Medical Journal 107: 225–30. [Google Scholar] [PubMed]
  22. Leos-Urbel, Jacob, Amy E. Schwartz, Meryle Weinstein, and Sean Corcoran. 2013. Not just for poor kids: The impact of universal free school breakfast on meal participation and student outcomes. Economics of Education Review 36: 88–107. [Google Scholar] [CrossRef] [Scilit] [PubMed]
  23. Ohri-Vachaspati, Punam, Elizabeth Dachenhaus, Jessie Gruner, Kristina Mollner, Eric B. Hekler, and Michael Todd. 2018. Fresh Fruit and Vegetable Program and Requests for Fruits and Vegetables Outside School Settings. Journal of the Academy of Nutrition and Dietetics 118: 1408–16. [Google Scholar] [CrossRef] [Scilit] [PubMed]
  24. Olsho, Lauren E., Jacob A. Klerman, Lorrene Ritchie, Patricia Wakimoto, Karen L. Webb, and Susan Bartlett. 2015. Increasing Child Fruit and Vegetable Intake: Findings from the US Department of Agriculture Fresh Fruit and Vegetable Program. Journal of the Academy of Nutrition and Dietetics 115: 1283–90. [Google Scholar] [CrossRef] [Scilit] [PubMed]
  25. Qian, Yiwei, Rodolfo M. Nayga, Jr., Michael R. Thomsen, and Heather L. Rouse. 2016. The Effect of the Fresh Fruit and Vegetable Program on Childhood Obesity. Applied Economic Perspectives and Policy 38: 260–75. [Google Scholar]
  26. Sun, Liyang, and Sarah Abraham. 2021. Estimating dynamic treatment effects in event studies with heterogeneous treatment effects. Journal of Econometrics 225: 175–99. [Google Scholar] [CrossRef] [Scilit]
  27. U.S. Department of Agriculture. 2017. Fresh Fruit and Vegetable Program (FFVP) Fact Sheet. Available online: https://www.fns.usda.gov/ffvp/ffvp-fact-sheet (accessed on 14 March 2026).
  28. Wesnes, Keith A., Claire Pincock, David Richardson, Gareth Helm, and Simon Hails. 2003. Breakfast reduces declines in attention and memory over the morning in schoolchildren. Appetite 41: 329–31. [Google Scholar] [CrossRef] [Scilit] [PubMed]
Figure 1. Number of Illinois public elementary schools participating in the FFVP per academic year.
Socsci 15 00478 g001
Figure 2. Times schools received FFVP grants over sample period.
Socsci 15 00478 g002
Figure 3. Estimated effect of FFVP on school-level attendance rate. Note: Each bar represents the effect of FFVP participation on school-level attendance rates in the corresponding time period. The x-axis denotes years to a school’s first participation in the FFVP. Negative values indicate years before a school’s first FFVP participation, while positive values indicate years after participation. Points are dynamic treatment effect estimates with 95% confidence intervals. Staggered difference-in-differences effects are estimated using the methodology in De Chaisemartin and D’Haultfœuille (2020). The outcome variable is school-level attendance rate (percentage points). The model includes controls for school-level enrollment, the percentage of students receiving free/reduced-price lunch, and the percentage of Black students. Standard errors are clustered at the school-level. Standard error bars represent the 95% confidence interval.
Socsci 15 00478 g003
Figure 4. Estimated effect of FFVP on school-level ELA scores. Note: Each bar represents the effect of FFVP participation on school-level English Language Arts standardized test scores in the corresponding time period. The x-axis denotes years to a school’s first participation in the FFVP. Negative values indicate years before a school’s first FFVP participation, while positive values indicate years after participation. Points are dynamic treatment effect estimates with 95% confidence intervals. Staggered difference-in-differences effects are estimated using the methodology in De Chaisemartin and D’Haultfœuille (2020). The outcome variable is the school-level ELA standardized test score, normalized according to a standard normal distribution; effects represent standard deviation changes in the school-level test score. The model includes controls for school-level enrollment, the percentage of students receiving free/reduced-price lunch, and the percentage of Black students. Standard errors are clustered at the school-level.
Socsci 15 00478 g004
Figure 5. Estimated effect of FFVP on school-level Mathematics scores. Note: Each bar represents the effect of FFVP participation on school-level Mathematics standardized test scores in the corresponding time period. The x-axis denotes years to a school’s first participation in the FFVP. Negative values indicate years before a school’s first FFVP participation, while positive values indicate years after participation. Points are dynamic treatment effect estimates with 95% confidence intervals. Staggered difference-in-differences effects are estimated using the methodology in De Chaisemartin and D’Haultfœuille (2020). The outcome variable is the school-level mathematics standardized test score, normalized according to a standard normal distribution; effects represent standard deviation changes in the school-level test score. The model includes controls for the percentage of students receiving free/reduced-price lunch and the percentage of Black students. Standard errors are clustered at the school-level. Standard error bars represent the 95% confidence interval.
Socsci 15 00478 g005
Figure 6. Estimated effect of FFVP on in-school suspensions. Note: Each bar represents the effect of FFVP participation on school-level rate of in-school suspension in the corresponding time period. The x-axis denotes years to a school’s first participation in the FFVP. Negative values indicate years before a school’s first FFVP participation, while positive values indicate years after participation. Points are dynamic treatment effect estimates with 95% confidence intervals. Staggered difference-in-differences effects are estimated using the methodology in De Chaisemartin and D’Haultfœuille (2020). The outcome variable is the rate of in-school suspensions, defined as the number of suspensions divided by school enrollment (multiplied by 100). The model includes controls for school-level enrollment, the percentage of students receiving free/reduced-price lunch, and the percentage of Black students. Standard errors are clustered at the school-level. Standard error bars represent the 95% confidence interval.
Socsci 15 00478 g006
Figure 7. Estimated effect of FFVP on out-of-school suspensions. Note: Each bar represents the effect of FFVP participation on school-level rate of out-of-school suspension in the corresponding time period. The x-axis denotes years to a school’s first participation in the FFVP. Negative values indicate years before a school’s first FFVP participation, while positive values indicate years after participation. Points are dynamic treatment effect estimates with 95% confidence intervals. Staggered difference-in-differences effects are estimated using the methodology in De Chaisemartin and D’Haultfœuille (2020). The outcome variable is the rate of out-of-school suspensions, defined as the number of suspensions divided by school enrollment (multiplied by 100). The model includes controls for school-level enrollment, the percentage of students receiving free/reduced-price lunch, and the percentage of Black students. Standard errors are clustered at the school-level. Standard error bars represent the 95% confidence interval.
Socsci 15 00478 g007
Table 1. Means and standard deviations of key variables for FFVP and non-FFVP schools.
Full SampleFFVP SchoolsNon-FFVP Schools
Number of Schools22495421887
Percent Free/Reduced-Price Lunch52.9082.4043.65
(30.29)(16.09)(27.57)
Percent White52.4824.6560.80
(35.16)(32.33)(31.51)
Percent Black20.2243.4112.75
(31.18)(39.86)(23.33)
Percent Hispanic21.8930.6719.16
(27.44)(35.01)(23.97)
(Standardized) ELA Score−0.01−0.760.22
(0.96)(0.73)(0.91)
(Standardized) Math Score−0.01−0.740.20
(0.95)(0.74)(0.91)
Attendance Rate95.1594.3295.40
(1.34)(1.61)(1.12)
Notes: This table reports descriptive statistics for the school-year observations included in the analysis. “FFVP Schools” refers to schools that received FFVP funding during the study period, while “Non-FFVP Schools” refers to schools that never received FFVP funding. Reported values are means, with standard deviations in parentheses. Test scores were standardized to a standard normal distribution with a mean of 0 and a standard deviation of 1.
Table 2. Heterogeneous effects of FFVP by free/reduced-price lunch percentage and non-White student percentage.
Outcome>50% FRPL<50% FRPLAbove Median
Percentage of
Non-White Students
Below Median
Percentage of
Non-White Students
ELA Scores−0.176
(0.109)
−0.064
(0.049)
−0.042
(0.046)
−0.184 **
(0.075)
Math Scores−0.403
(0.132)
−0.085
(0.052)
−0.095
(0.049)
−0.231 **
(0.109)
Attendance0.623 ***
(0.213)
0.276 ***
(0.103)
0.425 ***
(0.104)
0.286 **
(0.134)
In-School Suspensions−1.621
(1.162)
2.056
(1.776)
0.269
(0.928)
−2.517
(1.806)
Out-Of-School Suspensions0.060
(0.942)
−5.848 ***
(1.818)
−0.639
(1.046)
−1.677
(1.248)
Notes: This table reports heterogeneous treatment effects estimated using the De Chaisemartin and D’Haultfœuille (2020) staggered difference-in-differences estimator. Separate models are estimated for schools above and below the 50% free or reduced-price lunch (FRPL) threshold and for schools with above and below the median percentage of non-White students. Reported coefficients represent the estimated average total treatment effect. Standard errors (clustered at the school level) are reported in parentheses. Event-study plots are available upon request. ** p < 0.05, *** p < 0.01.
Disclaimer/Publisher’s Note: The statements, opinions and data contained in all publications are solely those of the individual author(s) and contributor(s) and not of MDPI and/or the editor(s). MDPI and/or the editor(s) disclaim responsibility for any injury to people or property resulting from any ideas, methods, instructions or products referred to in the content.