


Abstract
Unsafe behavior is a primary cause of construction accidents, with safety attitude being a crucial psychological predictor. While numerous safety attitude and climate instruments exist, many originate from other industries or lack rigorous psychometric validation and contextual adaptation for construction, especially when used to assess construction workers’ safety attitudes. This study developed and validated a multidimensional safety attitude scale (CWSAS) for Chinese construction workers using a three-stage mixed-methods design. Initially, grounded theory interviews with 15 workers and literature analysis generated the item pool. Subsequently, two rounds of Delphi consultation with seven experts refined the scale. Finally, item analysis and exploratory factor analysis were performed on Sample 1 (n = 306), followed by confirmatory factor analysis on an independent Sample 2 (n = 260). The CWSAS comprises 26 items across four dimensions: Safety Cognition, Safety Behavioral Tendency, Safety Emotion, and Organization and Management. This four-factor model, grounded in tripartite attitude theory and reflecting China’s unique safety governance, demonstrated excellent fit, high reliability, and acceptable convergent and discriminant validity. The CWSAS offers a robust tool for assessing and improving construction safety.
1. Introduction
The construction industry is a core sector underpinning global economic activity; however, its persistently high rates of accidents and fatalities have long placed it among the most hazardous industries worldwide [1,2]. According to statistics from the International Labour Organization (ILO), the combined sectors of construction, agriculture, forestry, fishing, and manufacturing account for approximately 200,000 occupational fatalities each year, representing 63% of all work-related deaths globally [3]. Among these sectors, the construction industry alone contributes 25% to 40% of all occupational injuries, far exceeding its share of total employment, which is only 6% to 10% [4]. In terms of accident causation, a substantial body of case-based research has demonstrated that workers’ unsafe behaviors constitute a critical driving factor in the occurrence and progression of construction accidents, with 88% to 90% of construction incidents being directly or indirectly attributable to such behaviors [5,6]. Therefore, understanding and effectively intervening in unsafe behaviors is a central issue in the prevention of construction accidents. Among the many antecedents of safety behavior, safety attitude is widely recognized as one of the most predictive individual-level psychological determinants [7,8]. Based on the classical tripartite theory of attitude, safety attitude refers to a relatively stable psychological tendency that individuals hold toward safety goals, regulations, and related work activities, encompassing three interrelated dimensions: cognition (beliefs and judgments about safety risks), affect (emotional evaluations of safety-related work), and behavioral tendency (a state of behavioral readiness in safety-related situations) [9,10,11]. A large body of empirical research has shown that safety attitude exerts a significant direct influence on safety behavior by shaping individuals’ risk perception, safety motivation, and behavioral decision-making [12,13]. Meta-analytic findings from different research teams have further confirmed a robust positive association between safety attitude and safety performance [14].
In the field of safety science, the development and application of psychometric scales to systematically assess employees’ safety attitudes has become a central research approach for understanding and preventing unsafe behavior [15,16]. A scientifically sound safety attitude scale should not only undergo a two-stage validation process involving exploratory factor analysis (EFA) and confirmatory factor analysis (CFA) to establish the stability of its factor structure, but also demonstrate satisfactory internal consistency reliability, convergent validity, and discriminant validity, while remaining highly compatible with the specific industry context in which it is applied [17,18,19]. However, as reviewed below, existing scales exhibit varying degrees of limitation in meeting these requirements, which fundamentally constrains the precision of both construction safety research and intervention practice. Therefore, this section aims to systematically review existing safety attitude scales and critically examine their methodological limitations in construction-related applications, thereby establishing the necessity and academic value of developing a dedicated safety attitude scale for construction workers.
1.1. Applicability of Safety Attitude Scales Developed in Other High-Risk Industries
In academia, mature instruments for measuring safety attitude have been developed in several high-risk industries, including healthcare, aviation, manufacturing, and mining, providing valuable theoretical frameworks and methodological references for the present study [20,21,22]. However, due to fundamental differences across industries in terms of work environment structure, the nature of risk sources, and organizational patterns, these scales cannot be directly transferred to the construction industry.
In the healthcare sector, the Safety Attitudes Questionnaire (SAQ) developed by Sexton et al. is one of the most representative instruments. Its psychometric quality in measuring six dimensions within healthcare settings—teamwork climate, safety climate, job satisfaction, perceptions of management, working conditions, and stress recognition—has been widely recognized [23]. However, the applicability of the SAQ is strictly constrained by the context in which it was developed. Healthcare institutions are highly standardized, process-stable, and controlled indoor environments, whereas their procedural risks (e.g., medication errors and surgical mistakes) differ fundamentally from the physical hazards encountered on construction sites (e.g., falls from height, machinery injuries, and collapses) in terms of risk sources, exposure mechanisms, and prevention logic. In addition, the SAQ emphasizes stable interprofessional teamwork dimensions, such as communication and collaboration between physicians and nurses, which differ fundamentally from the decentralized organizational structure of construction projects, where workforce mobility is high and numerous temporary subcontractors coexist. As a result, the construct validity of the SAQ’s core dimensions in the construction context is highly questionable [24].
In the aviation sector, CRM-based safety attitude research represented by Helmreich et al. and related cockpit attitude instruments emphasizes compliance, crew communication, and collaborative decision-making in highly standardized operational systems [25]. Although aviation is likewise a high-consequence industry, its work tasks are characterized by a high degree of repetition and procedural standardization, with pilots operating within tightly monitored closed systems and following fixed procedures. This differs substantially from the non-routine, project-driven, and open-site working environment faced by construction workers. Therefore, applying instruments that emphasize cockpit team dynamics to assess construction workers’ safety attitudes would involve a clear problem of contextual mismatch [20].
In the manufacturing and mining sectors, existing scales face similar limitations. Safety scales developed for manufacturing are typically constructed around repetitive assembly-line work environments, and their risk dimensions are often unable to capture the frequently changing high-risk tasks found on construction sites, such as scaffold erection, foundation pit excavation, and lifting operations [26,27]. Likewise, safety scales in the mining industry are designed to address the unique geological and confined-space hazards of underground mining, which differ substantially from the risk structure of open-air construction sites above ground [28].
Overall, the applicability limitations of the above industry-specific scales stem from the same fundamental reason: they were all developed on the basis of relatively stable work systems with clear boundaries, whereas the construction site is characterized by environmental dynamism, task non-routine, high workforce mobility, and the superposition of multiple physical hazards, which together create a measurement context that is rarely seen in other industries [22,29,30]. This unique context requires a safety attitude scale with a specially adapted dimensional structure.
1.2. Methodological Review of Existing Construction Safety Research
In recent years, researchers have increasingly begun to focus specifically on construction workers’ safety attitudes; however, the existing studies generally suffer from methodological limitations, which constrain both their scientific value and their practical utility [7].
1.2.1. Cross-Context Transferability of Measurement Instruments
Some studies have directly adopted or only slightly adapted safety scales developed for other industries or general settings, without conducting standardized cultural adaptation and revalidation procedures, thereby making it difficult to ensure the ecological validity and construct validity of the instruments [31]. For example, if a general safety questionnaire originally developed for manufacturing is used to assess construction workers’ safety attitudes in relation to context-specific hazards such as falls from height and machinery collisions, the scale itself may exhibit systematic deficiencies in semantic appropriateness and behavioral specificity. As a result, the measurement outcomes may lack sufficient granularity to effectively inform construction safety management practice [21].
1.2.2. Incomplete Procedures in Scale Development
Although some localized scale development studies have attempted to construct new instruments specifically for the construction context, they still exhibit clear deficiencies in psychometric validation procedures. Three problems are particularly prominent. First, some studies report only EFA results without conducting CFA on an independent sample. However, CFA performed on a separate dataset is a critical step for testing the reproducibility of the factor structure and confirming model stability; without CFA, the cross-sample generalizability of the scale cannot be ensured [19,32]. Second, some studies are based on seriously insufficient sample sizes. It is commonly suggested that CFA requires at least 5 to 10 observations per estimated parameter, and inadequate sample size undermines the statistical power needed for reliable factor analysis [18,33]. Third, key psychometric indicators—such as convergent validity (e.g., average variance extracted, AVE), discriminant validity, and predictive validity—are often incompletely reported, which substantially weakens the overall scientific quality of the scale [34,35].
These methodological deficiencies are not limited to specific regions but are a widespread phenomenon in recent global construction safety research. For instance, recent investigations across various regions, such as North America [36], the Arabic region [37], and Southeast Asia [38], have explored safety perceptions and attitudes within the construction sector. However, a common methodological limitation observed in these studies is the frequent reliance on adapted general scales or the absence of a systematic, multi-stage development process. This often includes a lack of comprehensive item generation, insufficient item analysis, and the omission of both exploratory factor analysis (EFA) and confirmatory factor analysis (CFA) on independent samples. Such incomplete validation procedures can compromise the reliability and validity of the measurements, thereby limiting the generalizability and robustness of their findings. This highlights a critical need for scales developed through a meticulous psychometric process to ensure their suitability and accuracy in assessing construction workers’ safety attitudes.
1.2.3. Structural Gaps in the Dimensional Coverage of Existing Scales
Existing construction safety attitude scales generally fail to distinguish among the three theoretical dimensions of safety attitude—cognition, affect, and behavioral tendency—and instead tend to treat safety attitude as a single undifferentiated construct. This coarse-grained structural approach is inconsistent with the classical tripartite framework of attitude theory [9,10,11], and it also prevents the scale from identifying the differentiated pathways through which distinct attitudinal dimensions influence specific safety behaviors, thereby limiting its value for guiding precise interventions [39,40,41].
Beyond this fundamental issue of internal dimensional differentiation, existing instruments also frequently conflate individual safety attitudes with broader organizational constructs like safety climate. For instance, Mosly and Makki (2021) investigated how sociodemographic factors influence workers’ perceptions of safety climate factors [42]. While valuable, safety climate—defined as workers’ shared perceptions of organizational safety policies, procedures, and practices—is theoretically distinct from individual-level safety attitudes, serving different measurement objectives. The former assesses the organizational context, whereas the latter delves into individual psychological predispositions. This conceptual ambiguity further complicates the precise measurement and targeted intervention of safety attitudes. Furthermore, a systematic database search for Japanese construction safety research revealed a strong academic tradition primarily centered on organizational safety management systems, accident statistical analysis, and engineering control measures. However, this search did not identify any Japanese-sourced literature that met the rigorous scale development standards of this study, particularly regarding the systematic development and psychometric validation of multi-dimensional safety attitude scales for construction workers. This global overview underscores a persistent need for a comprehensive, psychometrically robust scale that integrates the full spectrum of safety attitudes, including cognitive understanding, emotional engagement, behavioral tendencies, and perceptions of organizational support, specifically tailored for the construction industry.
To improve readability and provide a structured overview of the literature reviewed above, Table 1 summarizes representative studies discussed in Section 1.1 and Section 1.2 in terms of research context, methods, validation procedures, main contributions, and remaining gaps.
Table 1.
Summary of representative and recent studies related to safety attitude and construction safety research.
As shown in Table 1, prior studies have provided important theoretical and methodological references for safety-related research; however, existing instruments either originate from non-construction contexts or focus only on partial dimensions such as risk perception or safety cognition. Moreover, a dedicated construction-worker safety attitude scale with complete two-stage factor validation and multidimensional structural coverage remains lacking.
To precisely delineate the contribution of the CWSAS, it is essential to distinguish “safety attitude” from two closely related but theoretically distinct constructs: “safety climate” and “safety perception.” While safety climate refers to the shared perceptions of organizational safety policies and practices at a group or organizational level [16], safety attitude represents a relatively stable individual psychological tendency toward safety goals and regulations, encompassing cognitive, affective, and behavioral dimensions. Furthermore, safety perception (or risk perception) is primarily a cognitive assessment of hazard likelihood and severity [35]. As noted in a recent systematic review, the construction safety literature often conflates these constructs, leading to structural incompleteness in measurement instruments [43]. The CWSAS addresses this gap by focusing specifically on the individual psychological disposition of construction workers through a multi-dimensional framework. Table 2 provides a comparative summary of these three constructs to further clarify their theoretical and methodological boundaries.
Table 2.
Conceptual distinction between safety attitude, safety climate, and safety perception.
Taken together, the above analysis suggests that there is currently no psychometric instrument specifically designed for construction workers’ safety attitudes that has undergone a complete two-stage factor-analytic validation process while also meeting the requirements of reliability and multidimensional validity [44,45,46,47]. This research gap not only constrains theoretical development in the field of construction safety attitudes, but also limits the implementation of precise safety interventions based on measurement data [7,8]. The present study aims to fill this gap by developing a construction industry-specific safety attitude scale through a systematic scale development process and rigorous psychometric validation procedures, thereby providing a reliable measurement foundation for future theoretical research and practical interventions targeting construction workers’ safety attitudes [15,17,32].
1.3. Research Gap and Objectives of This Study
In summary, existing safety attitude scales have two core limitations when applied to construction workers:
- Contextual Mismatch: Scales derived from stable environments such as medical and aviation have an underlying logic that is seriously disconnected from the dynamic, high-risk, and high-turnover characteristics of construction sites, lacking context-specificity.
- Lack of Methodological Rigor: Some studies on the construction industry lack a systematic theoretical construction process (such as grounded theory) in the scale development process, or have deficiencies in psychometric validation (such as lack of CFA, insufficient sample size, and incomplete reliability and validity reports).
Based on this clear research gap, this study is committed to using a rigorous mixed-methods approach to develop and validate a multidimensional safety attitude scale specifically for Chinese construction workers. The theoretical contribution of this move is that it will fill the gap in the existing literature and provide an assessment tool that is both consistent with the context of the construction industry and has a solid psychometric basis. Its practical significance is that it can provide a scientific diagnostic basis for construction companies, help managers identify weak links in safety management, and formulate more targeted intervention measures and training programs, thereby effectively reducing accident rates and improving the overall safety performance of the industry [26].
2. Materials and Methods
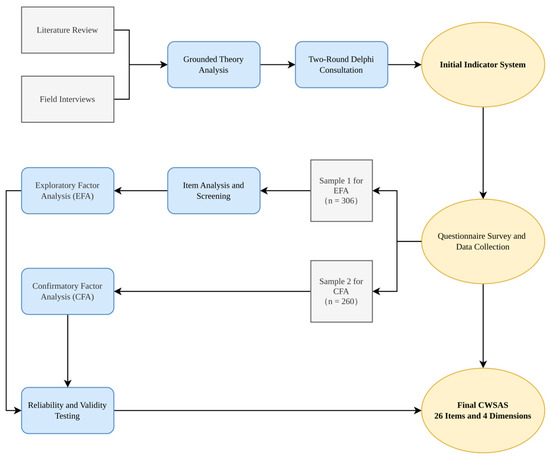
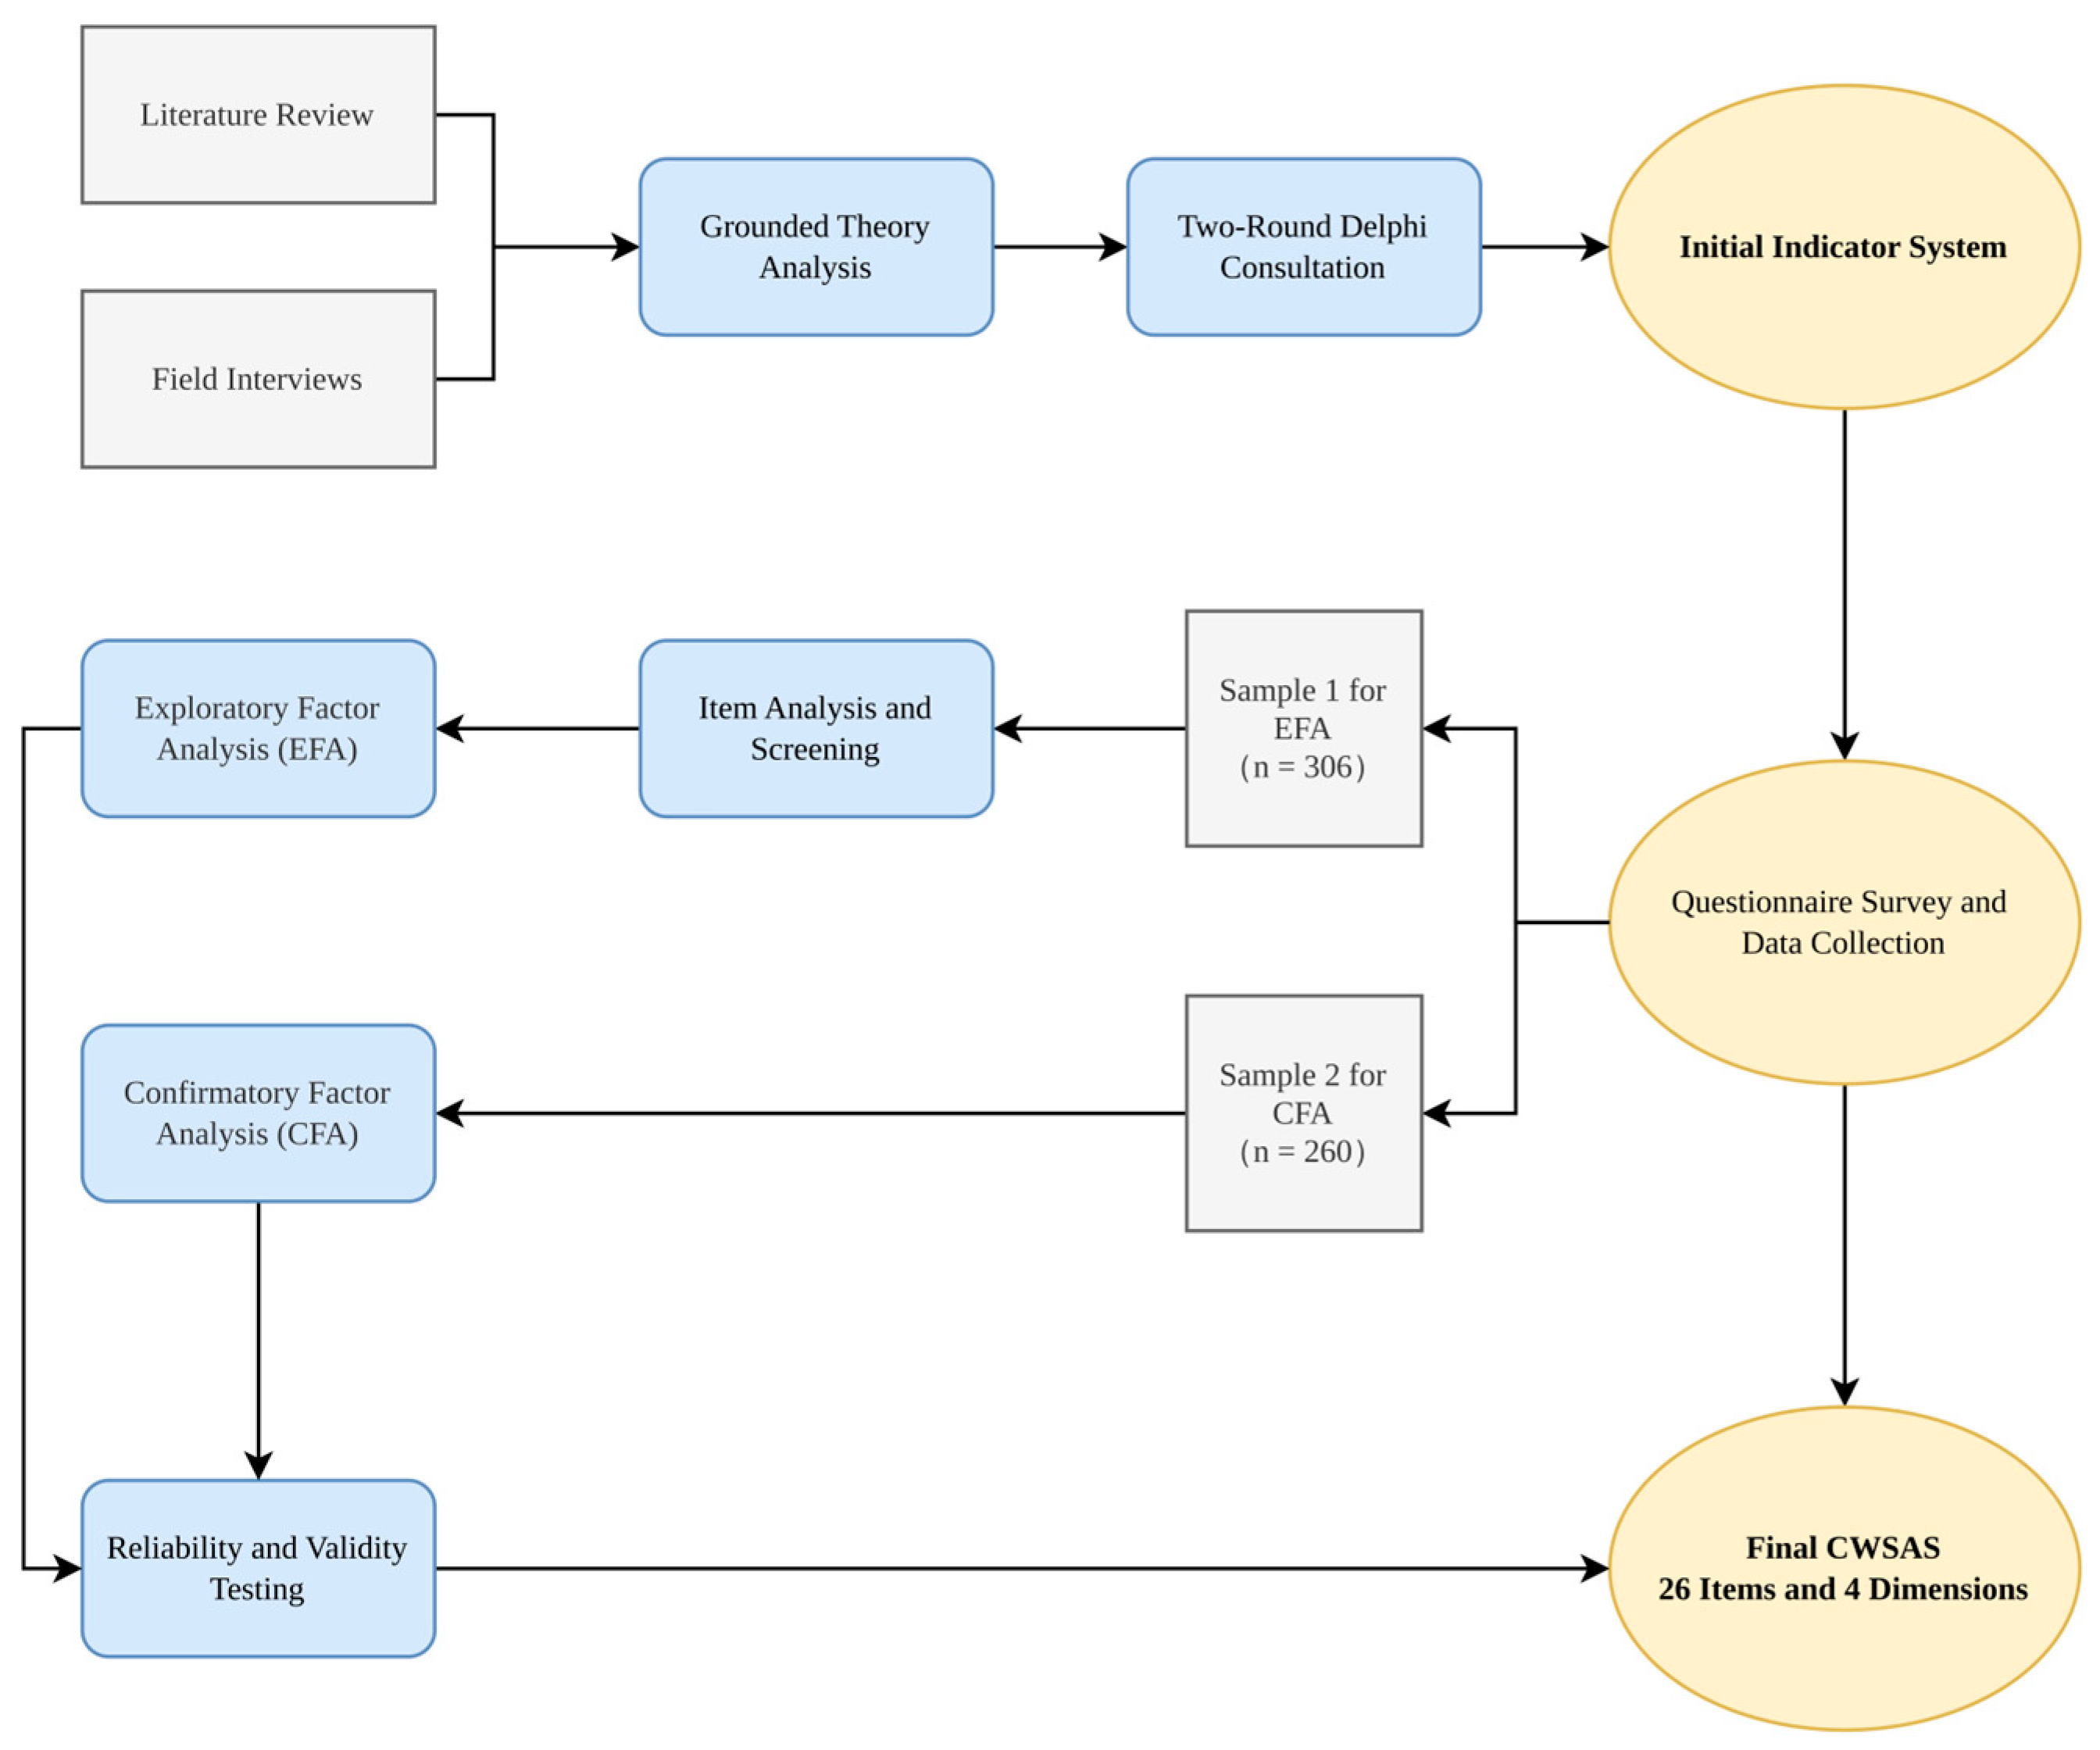
This study employed a three-stage mixed-methods design, strictly following the standard procedures for scale development, as shown in Figure 1.
Figure 1.
Research flowchart. Note: Grey rectangles represent data sources and inputs; blue rectangles denote analytical methods and procedures; yellow ovals indicate key milestones and outcomes.
2.1. Stage One: Initial Dimension and Item Pool Construction
2.1.1. Grounded Theory Interviews
To ensure that the scale content fully reflects the real perceptions and experiences of construction workers, this study first used a grounded theory approach for qualitative exploration. From March to August 2023, the research team conducted semi-structured in-depth interviews with 15 frontline construction workers at construction sites in several cities in China. The interviewees had diverse demographic characteristics, covering different types of work, years of service, and educational backgrounds. The interviews revolved around 5 core open-ended questions, such as “What do you think safety is?” and “What factors affect your safety on the construction site?” All interviews were recorded with consent and transcribed into text.
The interview data were analyzed using the three-stage coding procedure of grounded theory, including open coding, axial coding, and selective coding. First, during the open coding stage, the research team conducted a line-by-line reading and comparative analysis of the interview transcripts, extracted meaning units related to construction workers’ safety attitudes from the original statements, and assigned initial conceptual labels to them. Similar or repetitive concepts were then merged and summarized. Representative examples of the open coding process are provided in Table A1. Second, during the axial coding stage, the researchers further clustered the initial concepts based on their similarities, causal relationships, and contextual associations, forming several higher-level categories and clarifying the logical relationships among them. The axial coding categories and their definitions are summarized in Table A2. Ultimately, four core dimensions were identified: “Safety Behavioral Tendency,” “Safety Emotion,” “Safety Cognition,” and “Organization and Management.” Finally, during the selective coding stage, the major categories were systematically integrated around the core theme of “construction workers’ safety attitudes,” and the core dimensions explaining the structure of construction workers’ safety attitudes were refined, thereby establishing the preliminary theoretical framework of the scale [48].
To enhance coding reliability, two researchers independently coded the interview transcripts. Their coding results were then compared, and discrepancies were resolved through discussion until consensus was reached. When necessary, an additional researcher with qualitative research experience was invited to review disputed cases to ensure the appropriateness and stability of the final categorization.
Theoretical saturation was assessed continuously during the coding process. When no substantially new concepts, categories, or relationships relevant to construction workers’ safety attitudes emerged from subsequent interviews, the data were considered to have reached theoretical saturation. In the present study, no new substantive concepts or categories appeared after the 13th interview, and the remaining two interviews further confirmed the stability of the existing coding framework.
Notably, the emergence of the “Organization and Management” dimension is deeply rooted in the distinctive institutional landscape of the Chinese construction industry. China’s construction sector operates under a highly formalized safety governance system, guided by the Work Safety Law (2021 revision) and the Construction Safety Production Management Regulations. This system enforces a hierarchical on-site responsibility structure where foremen, project managers, and safety officers hold prescribed statutory duties. The interview data revealed that workers’ trust in the competence of safety supervisors and their acceptance of management-issued instructions constitute a psychologically distinct and empirically identifiable dimension. This finding aligns with recent evidence suggesting that organizational and institutional factors are central determinants of safety behavior in Chinese industrial settings [8,12], justifying the inclusion of this dimension alongside the classical tripartite components of attitude.
2.1.2. Literature Review and Item Writing
Based on the framework constructed by grounded theory, the research team extensively reviewed classic scales in related fields such as safety attitude, safety culture, and safety climate, and combined them with the characteristics of safety management in the construction industry to compile an initial questionnaire containing 40 items [49]. The item writing strived to be easy to understand and avoid professional jargon to ensure that frontline workers could accurately understand them.
Item numbering scheme: To facilitate item management and psychometric analysis, we coded each question with a combination of a letter and digits [50]. In this scheme, the letter A denotes the top-level dimension. A single digit (e.g., A1) identifies the first-level indicator; two digits (e.g., A11) identify the second-level indicator under that first-level indicator; and three digits (e.g., A111) designate the specific item within that second-level indicator. For example, “A1” refers to the first first-level indicator, “A11” is the first second-level indicator under that indicator, and “A111” is the first item under the first second-level indicator. This hierarchical coding allows researchers and readers to quickly locate items and understand their dimensional context [51].
2.2. Stage Two: Delphi Method Expert Consultation
To assess the content validity of the initial scale, a two-round Delphi consultation was conducted with a purposively selected panel of seven experts [35]. This panel size was considered appropriate because the Delphi literature does not prescribe a fixed number of experts, and panel size is typically determined according to the focus of the research topic and the appropriateness of the selected experts. In addition, panels of 6–10 experts are commonly considered acceptable in scale development and content validity studies for generating stable and defensible judgments [8,12,40,52].
The inclusion criteria were as follows: (1) relevant professional backgrounds related to the topic of this study, mainly including civil engineering, engineering management, and safety engineering; (2) at least 10 years of practical or research experience in the field of construction safety management [53]; (3) professional judgment capability, as reflected by an intermediate or higher professional title, or a master’s degree or above; (4) willingness to participate in two rounds of Delphi consultation and provide timely feedback.
Based on these criteria, the research team first compiled a list of potential experts and then contacted them through targeted invitations. All seven invited experts agreed to participate and completed both rounds of consultation [52]. The demographic characteristics of the Delphi experts are summarized in Table A5.
During each round, the experts were asked to evaluate each item in terms of importance, clarity, and relevance to its intended dimension using a 5-point Likert scale (1 = very unimportant/unclear/irrelevant, 5 = very important/clear/relevant). After each round, the research team summarized the experts’ ratings and comments, revised problematic items accordingly, and redistributed the revised questionnaire for the next round [52]. The statistical results of expert ratings in Round 1 and Round 2 are presented in Table A7 and Table A8, respectively.
Items were retained or revised based on the mean importance score (M > 4.0), coefficient of variation (CV < 0.25), and the degree of consensus reflected by Kendall’s coefficient of concordance (W). The Kendall’s W values for the two consultation rounds are reported in Table A6. After two rounds of consultation, several items were deleted or revised, including indicators such as “policy interpretation ability.” Ultimately, 4 first-order dimensions, 15 second-order dimensions, and 40 measurement items were retained for the subsequent questionnaire survey and scale validation [52].
2.3. Stage Three: Questionnaire Survey and Scale Validation
2.3.1. Sample and Data Collection
This study used a questionnaire survey to collect data. Considering that exploratory factor analysis (EFA) and confirmatory factor analysis (CFA) require independent samples, the research team collected two separate samples from construction sites in several provinces and cities in China.
Sample 1 (for EFA): A total of 350 questionnaires were distributed, and 306 valid questionnaires were retained, yielding an effective response rate of 87.4%.
Sample 2 (for CFA): A total of 300 questionnaires were distributed, and 260 valid questionnaires were retained, yielding an effective response rate of 86.7%.
The demographic characteristics of Sample 1 and Sample 2, including gender, age, education level, and years of work experience, are presented in Table 3.
Table 3.
Demographic characteristics of Sample 1 and Sample 2.
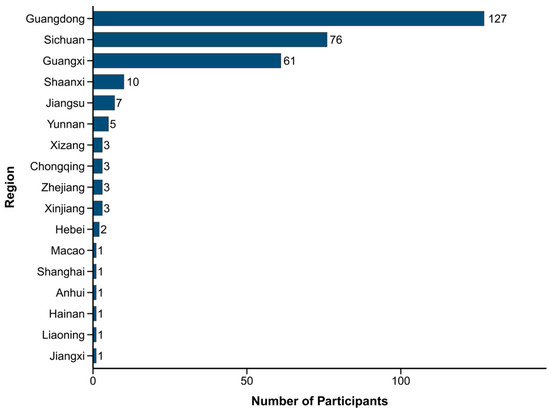
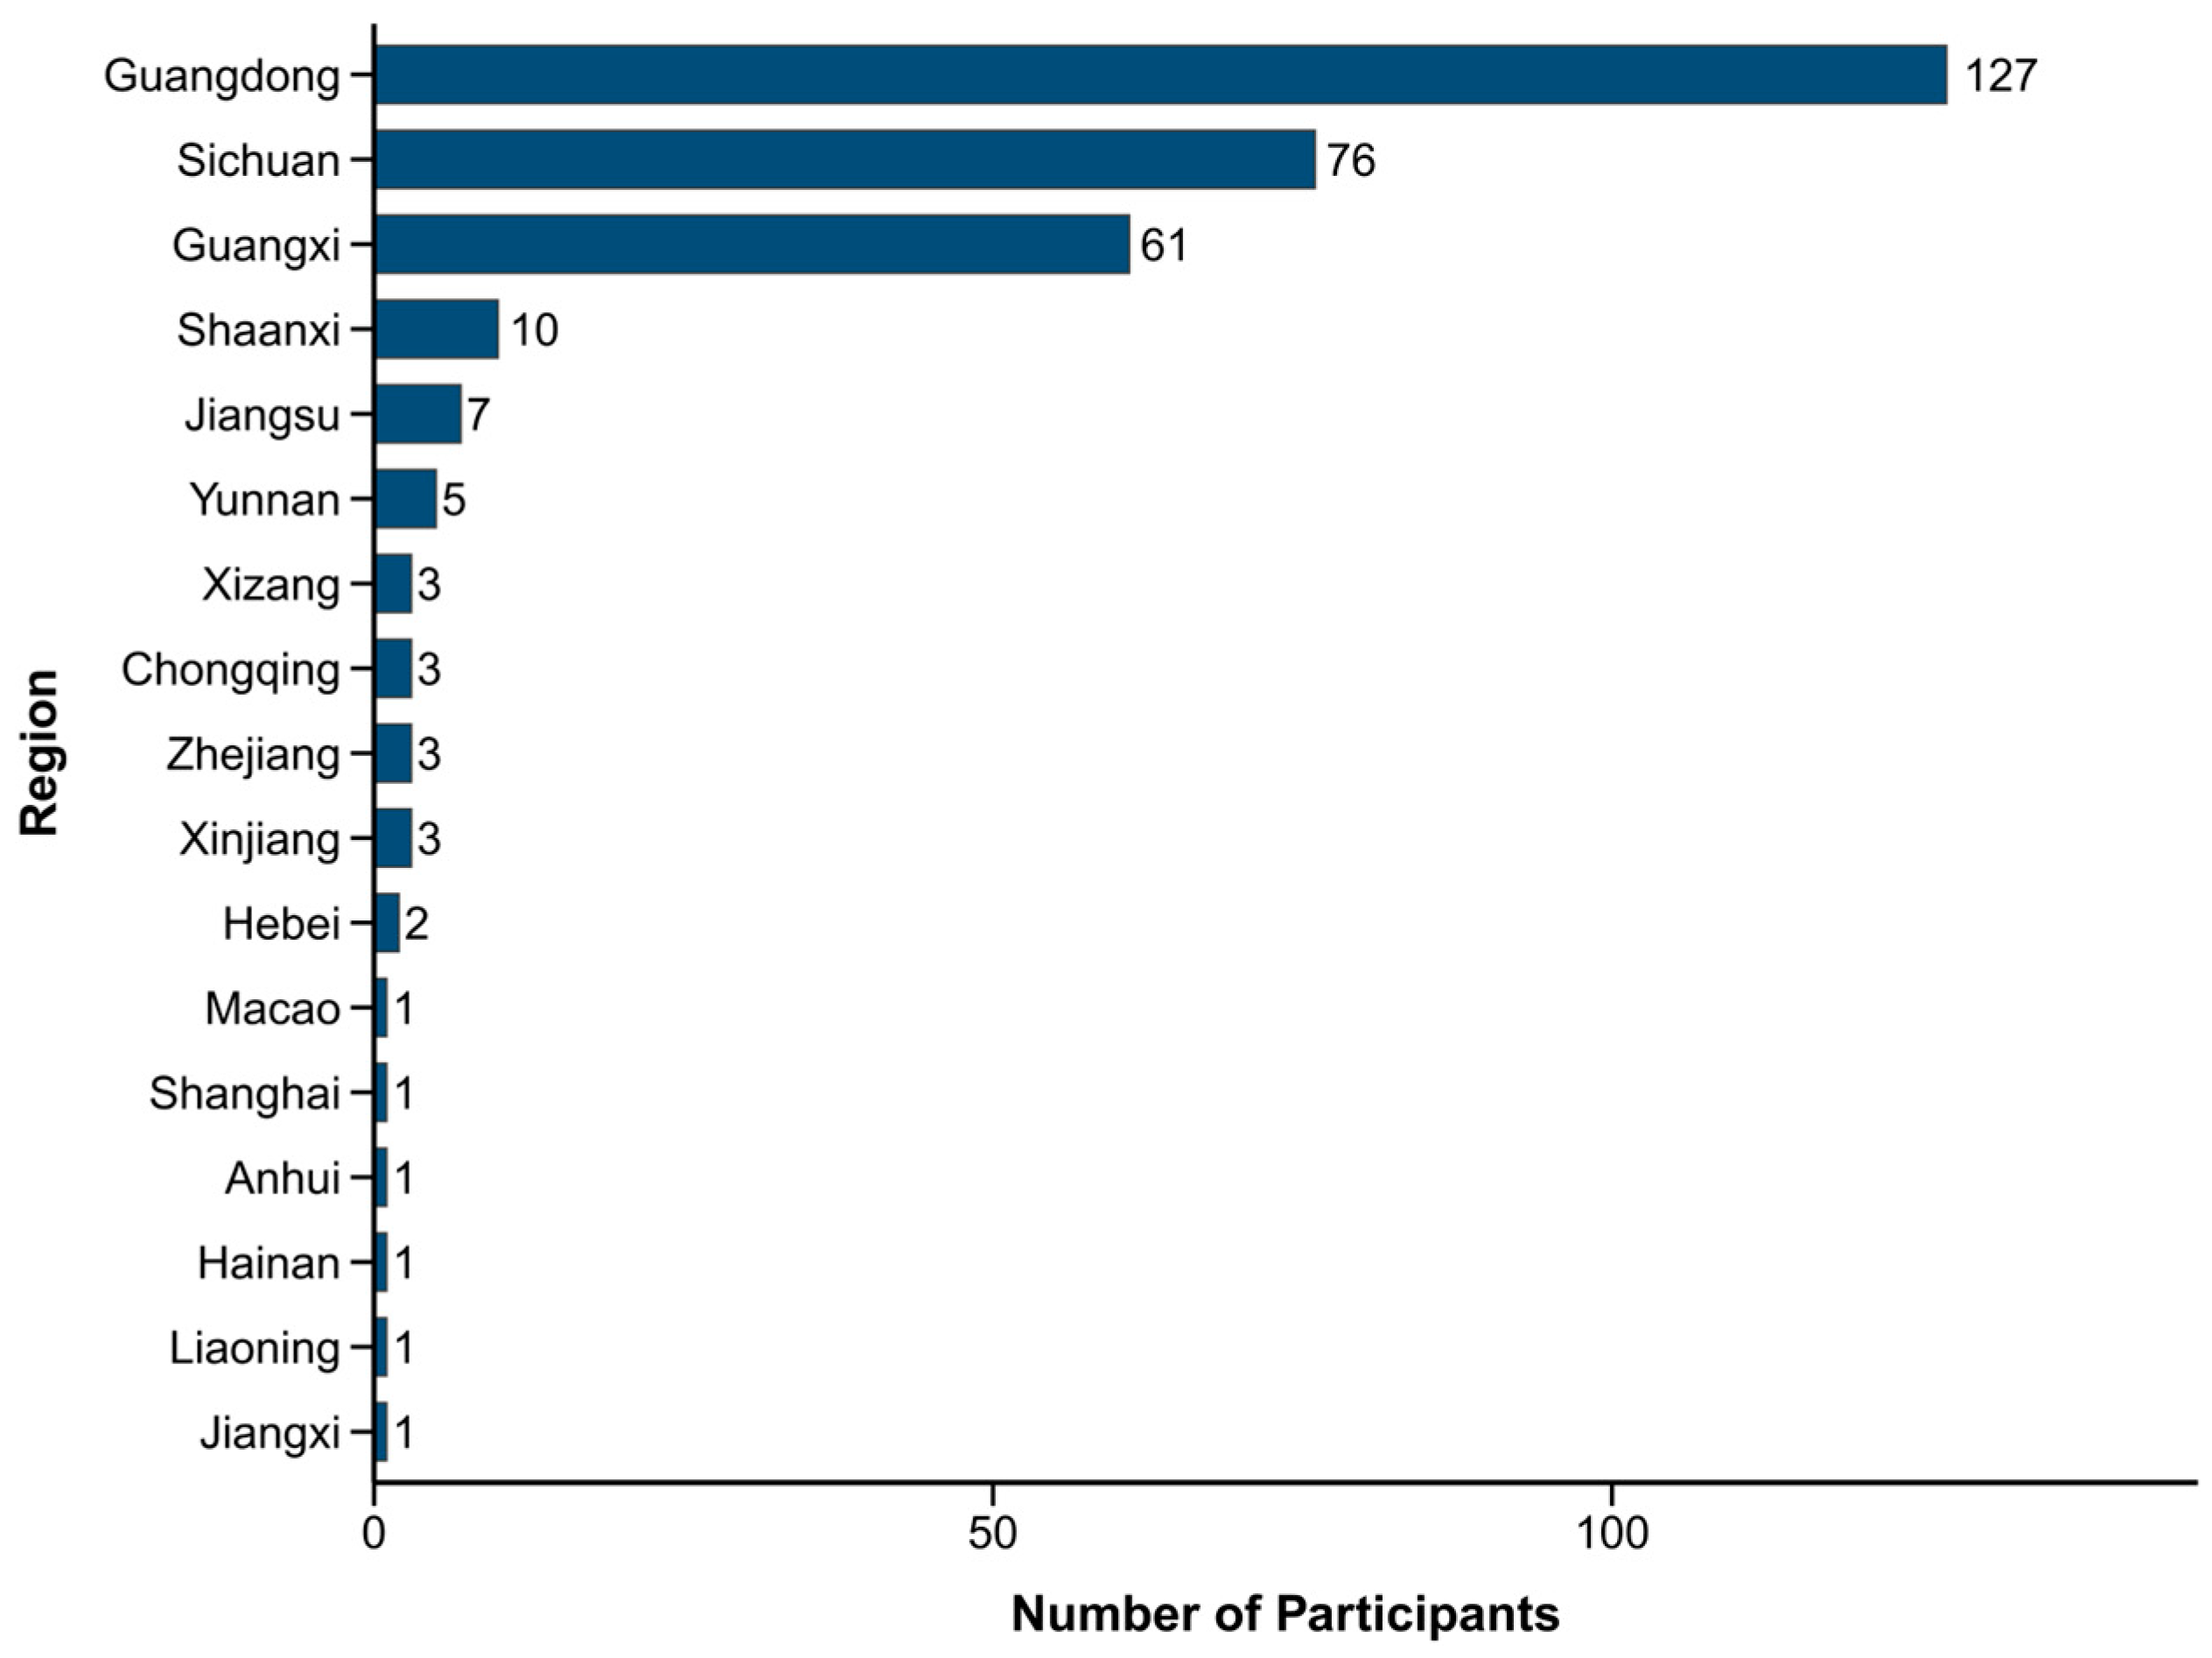
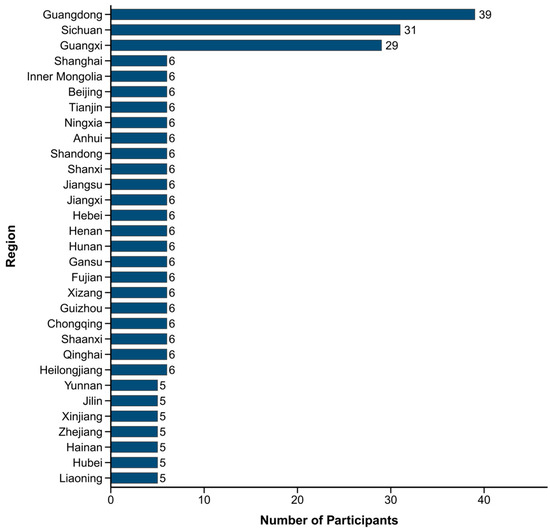
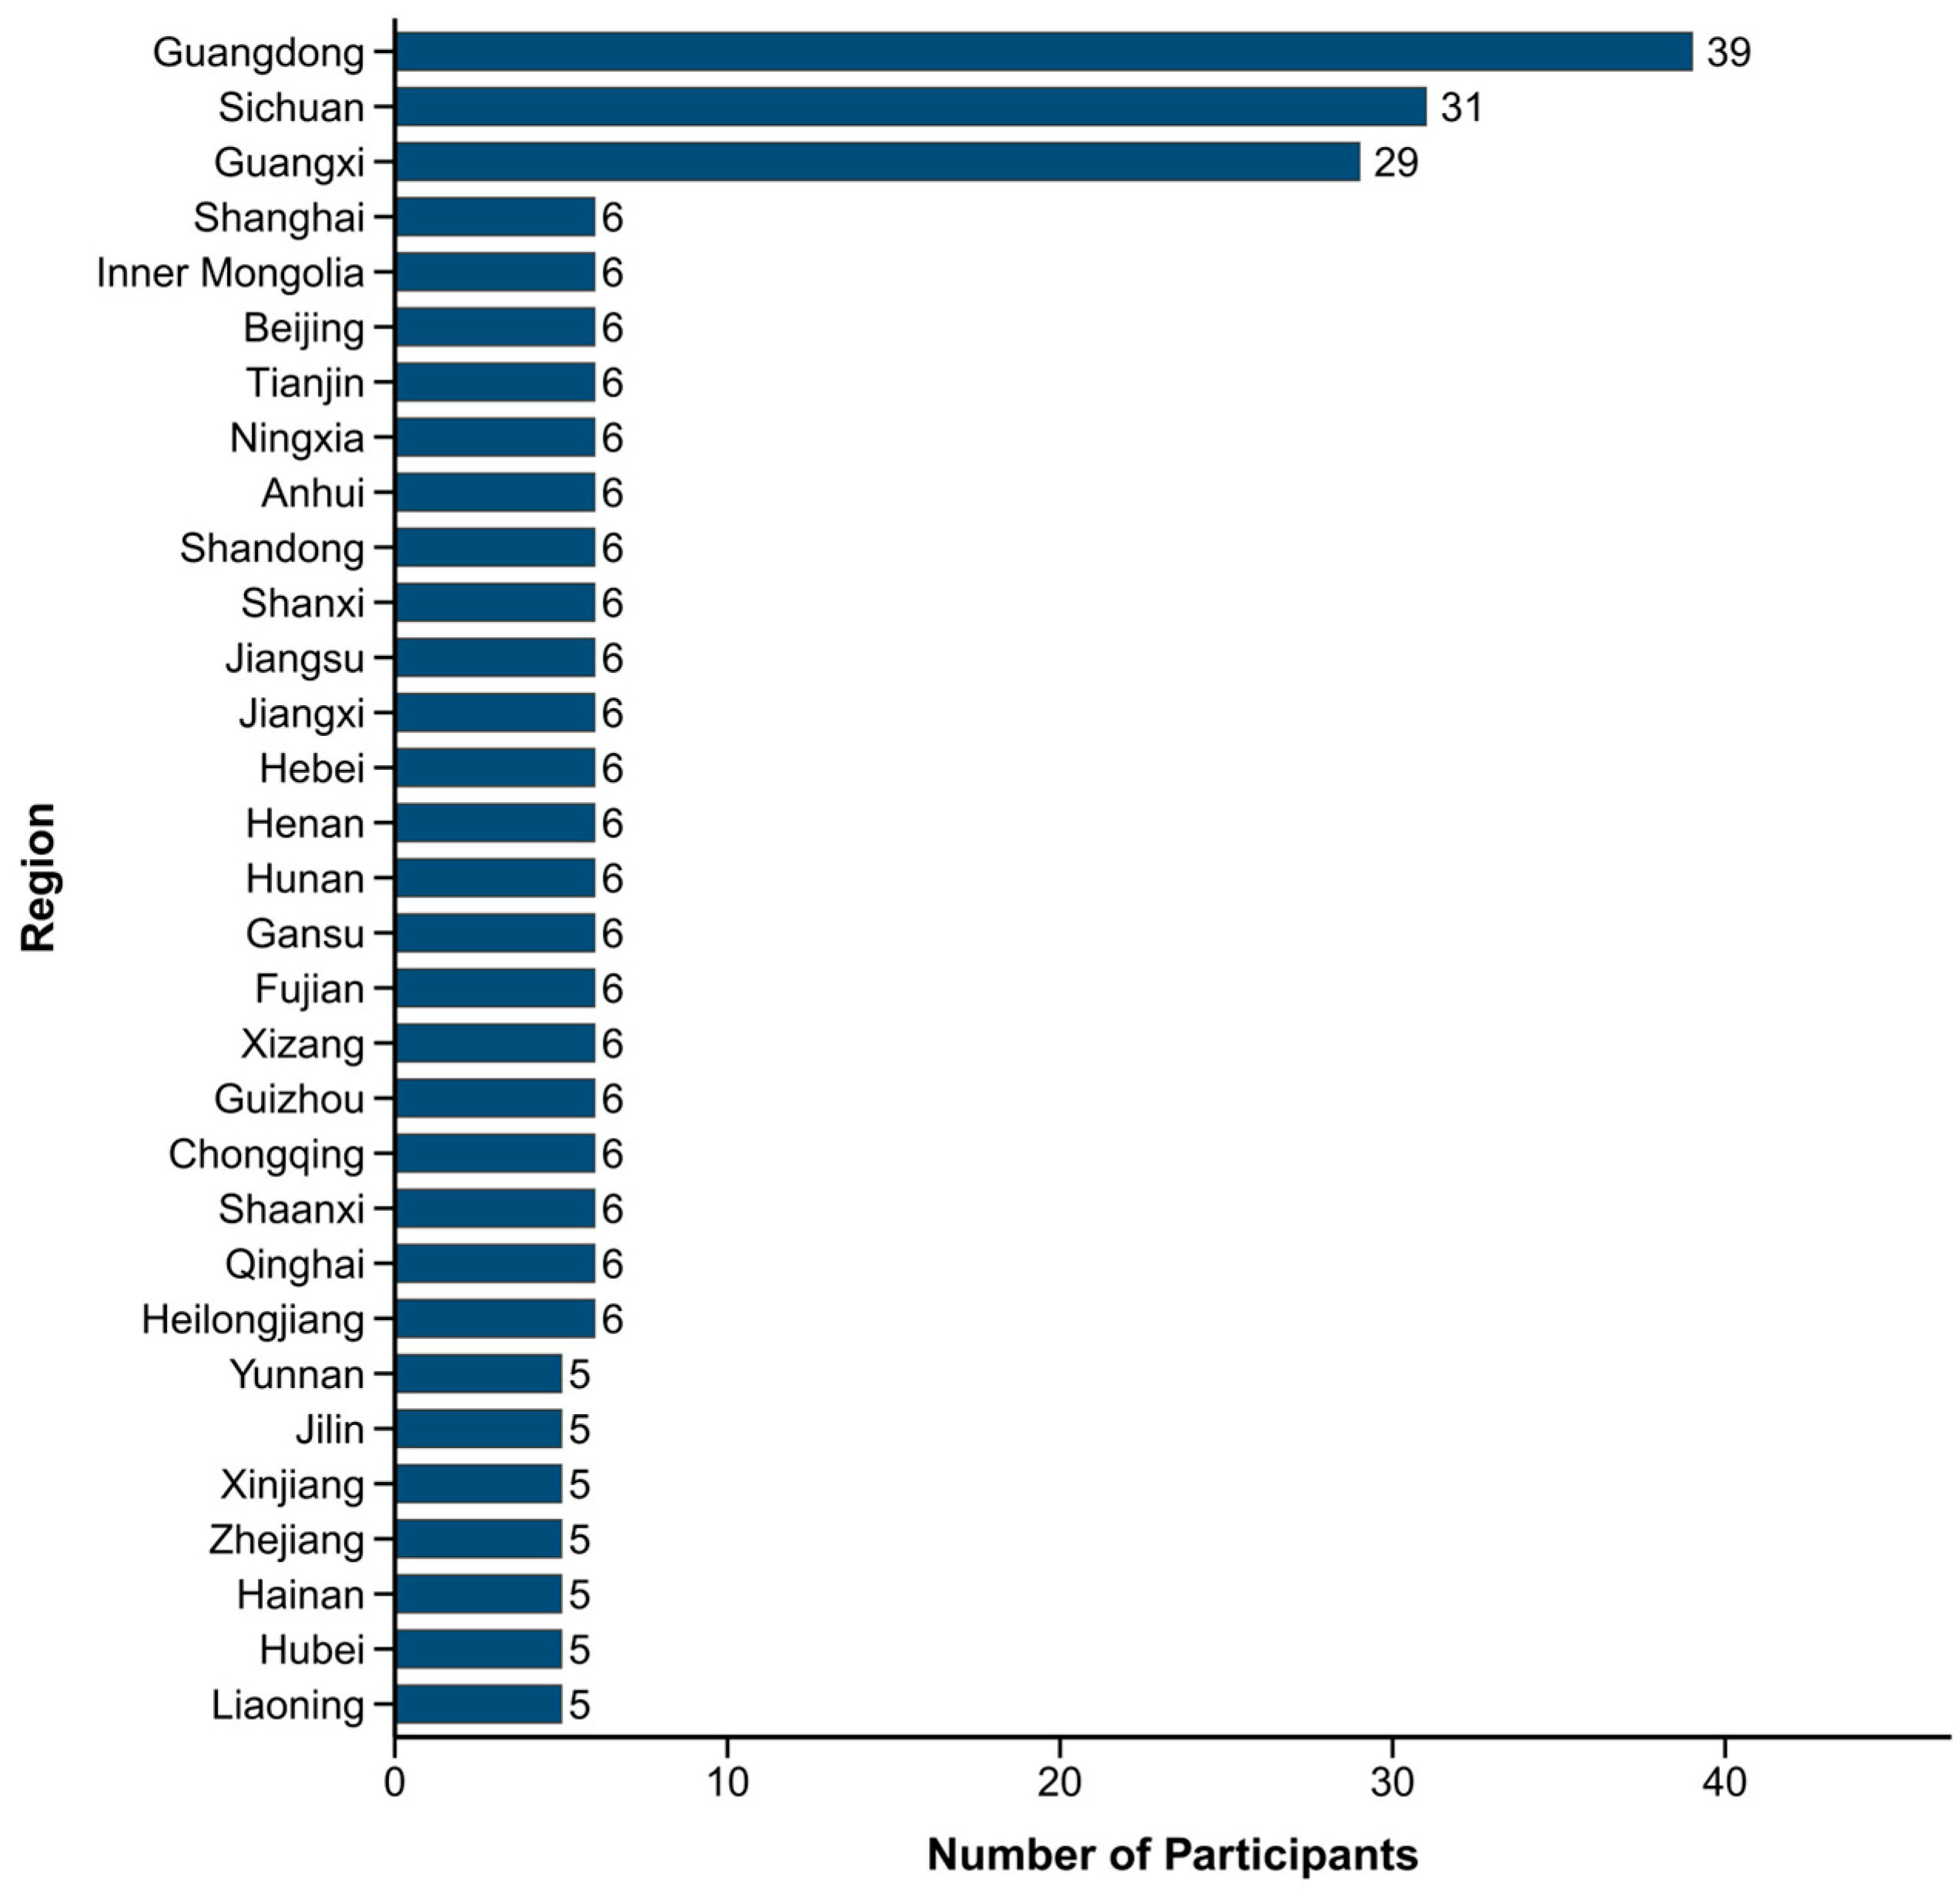
The regional distributions of Sample 1 and Sample 2 are shown in Figure 2 and Figure 3, respectively.
Figure 2.
Regional distribution of Sample 1.
Figure 3.
Regional distribution of Sample 2.
The demographic distributions of the two samples were not identical. Sample 1 was characterized by a younger age structure, lower educational attainment, and shorter work experience, whereas Sample 2 included a relatively larger proportion of older, more educated, and more experienced workers. These differences suggest a certain degree of sample heterogeneity between the two groups. Nevertheless, the use of two independent samples still provided an opportunity to examine the stability of the scale structure across samples with different background characteristics. All participants took part on a voluntary basis and were informed prior to data collection that their responses would be used solely for academic research purposes. The questionnaire was completely anonymous; no names, identification numbers, contact details, or other personally identifiable information were collected at any stage.
2.3.2. Scale Items and Scoring
The 40-item questionnaire used in the survey was rated on a 5-point Likert scale for scoring (1 = strongly disagree, 5 = strongly agree). It included 5 reverse-scored items (e.g., “I think it is acceptable to relax some safety requirements for the sake of efficiency sometimes”), which were reverse-coded before data analysis.
2.3.3. Data Analysis
Data analysis was performed using SPSS 26.0 (IBM Corp., Armonk, NY, USA) and the lavaan package in R (R Core Team, Vienna, Austria). The analysis steps included:
- Item analysis: Based on Sample 1, SPSS 26.0 was used to calculate the critical ratio (CR) and item–total correlation for each item in order to identify and remove items with poor discrimination.
- Exploratory factor analysis (EFA): Based on Sample 1, SPSS 26.0 was used to perform principal component analysis with varimax rotation to explore the underlying factor structure of the scale.
- Confirmatory factor analysis (CFA): Based on Sample 2, the lavaan package in R was used to validate the factor structure obtained from the EFA and to assess the goodness-of-fit of the model.
- Reliability and validity testing: Based on Sample 2, Cronbach’s alpha, composite reliability (CR), and average variance extracted (AVE) were calculated, and discriminant validity was further assessed using the heterotrait–monotrait ratio of correlations (HTMT) [54], in order to comprehensively evaluate the reliability and validity of the scale.
3. Results
3.1. Item Analysis
Based on the data from Sample 1 (n = 306), an item analysis was first performed on the initial 40 items. An independent samples t-test was calculated for the top 27% and bottom 27% of each item score, and the results showed that the critical ratio (CR value) of all items reached a significant level (p < 0.001). Subsequently, the correlation coefficient between the item and the total score was calculated, and 14 items with a correlation coefficient of less than 0.4 were deleted. Finally, 26 items were retained for subsequent factor analysis. The Cronbach’s α coefficient of the total scale of the 26 retained items was 0.953, indicating that the scale has extremely high internal consistency [17].
3.2. Exploratory Factor Analysis (EFA)
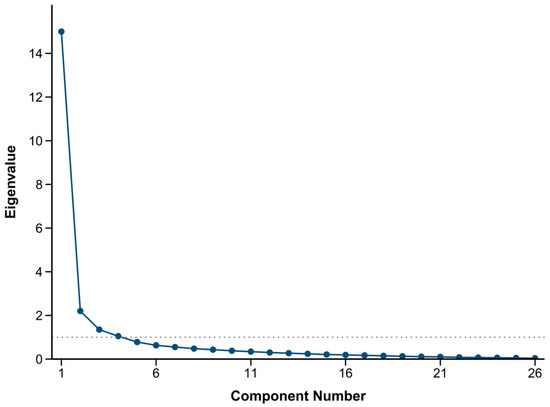
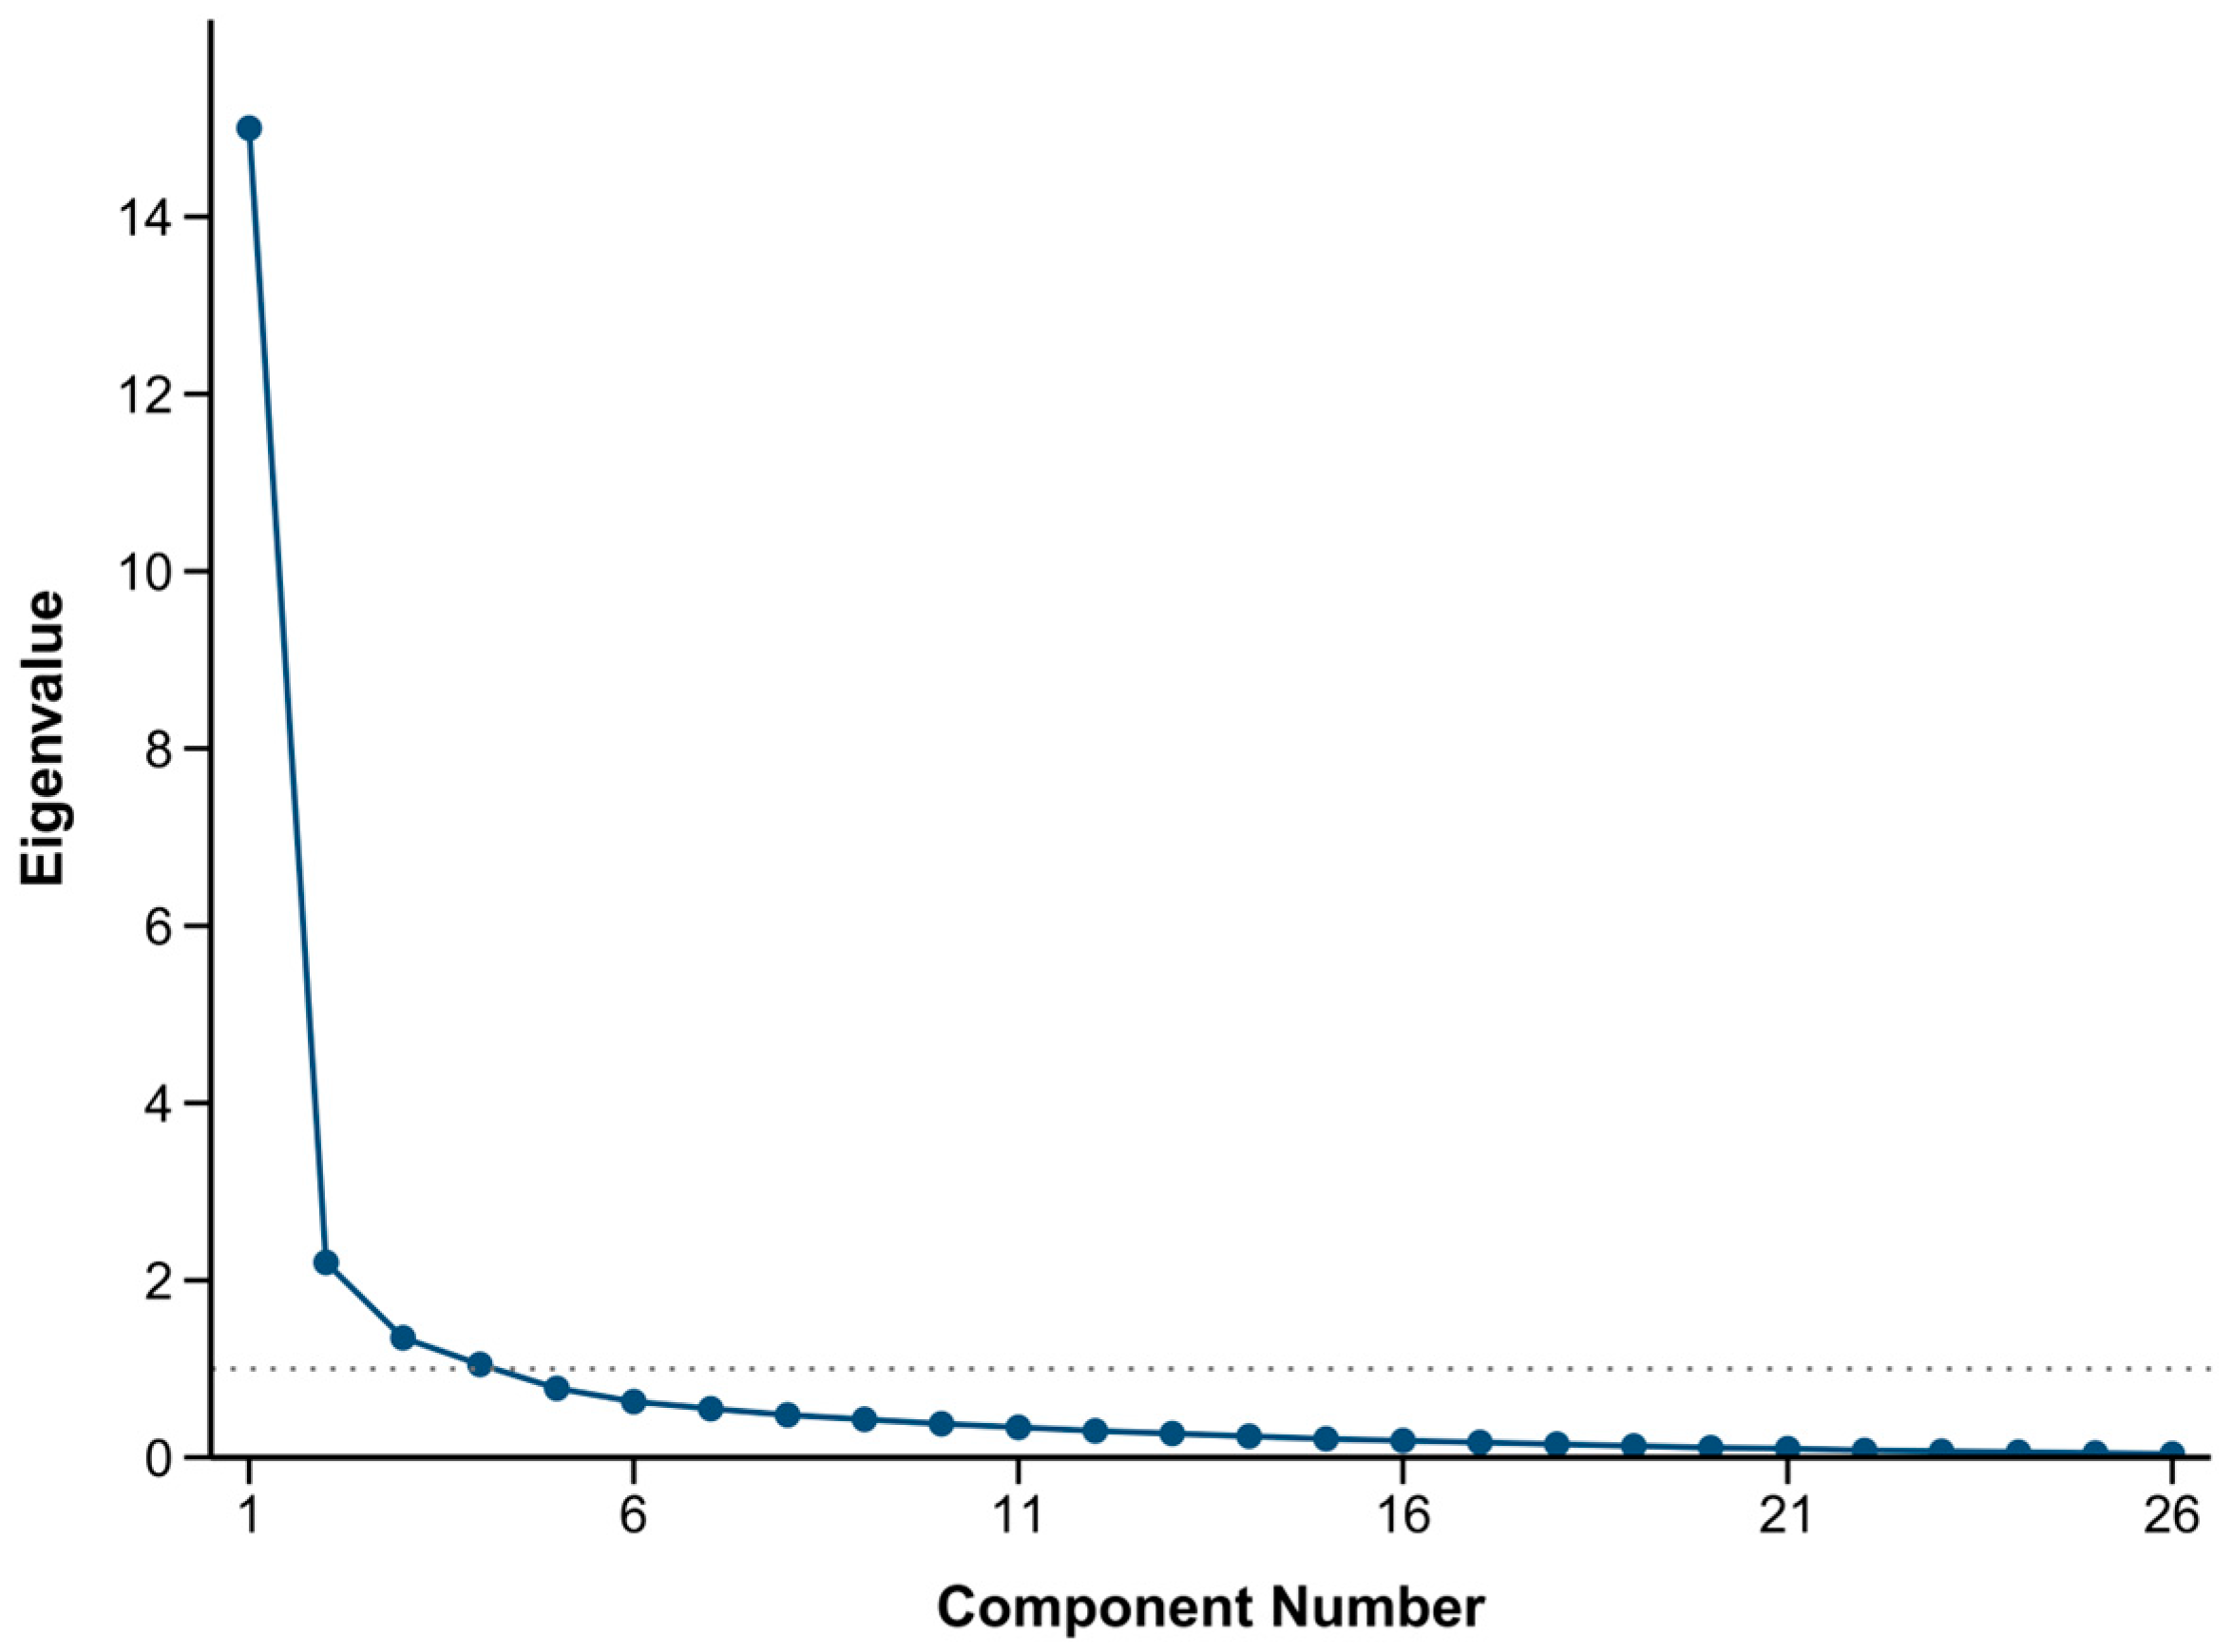
EFA was performed on the 26 retained items using Sample 1 data. The KMO value was 0.956, which is much greater than the recommended value of 0.7; the Bartlett’s test of sphericity was significant (χ2 = 7845.2, p < 0.001), indicating that the data is very suitable for factor analysis [55]. Using principal component analysis, based on the criterion of eigenvalue greater than 1 and the inflection point of the scree plot (Figure 4), it was finally determined to extract 4 common factors. These 4 factors explained a total of 74.759% of the total variance.
Figure 4.
Scree plot for construction workers’ safety attitude. The dotted horizontal line indicates the threshold of eigenvalue = 1 (Kaiser’s criterion).
Following the determination of the optimal number of factors, Varimax rotation was applied to enhance the interpretability of the factor structure. Varimax is an orthogonal rotation method that aims to simplify the factor loadings by maximizing the variance of the squared loadings for each factor. This results in factors that are as uncorrelated as possible, with each item loading highly on only one factor and near zero on others, thereby achieving a ‘simple structure’ [56]. This approach facilitates a clearer understanding of the unique contribution of each factor to the overall construct of safety attitude.
After orthogonal rotation with the varimax method, the loading matrix of each item on the four factors is shown in Table 4. According to the item content, these four factors were named:
Table 4.
Rotated factor loading matrix.
Factor 1: Safety Cognition, containing 9 items, explaining 24.32% of the variance.
Factor 2: Safety Behavioral Tendency, containing 6 items, explaining 18.97% of the variance.
Factor 3: Safety Emotion, containing 6 items, explaining 16.36% of the variance.
Factor 4: Organization and Management, containing 5 items, explaining 15.11% of the variance.
Most items had a loading greater than 0.6 on their respective factors; three items (A332, A333, A413) had loadings between 0.47 and 0.60, which are discussed further in Section 4.1 [57].
3.3. Confirmatory Factor Analysis (CFA)
To test the stability of the four-factor model constructed by EFA, CFA was performed using an independent Sample 2 (n = 260). Before performing CFA, a normal distribution test was performed on the data, and the results showed that the multivariate kurtosis coefficient was 94.183, which was greater than the critical value of 5, indicating that the data had a multivariate non-normal problem. Therefore, the maximum likelihood estimation (ML) method combined with the Bollen-Stine Bootstrap procedure (2000 samples) was used to correct the model for non-normality.
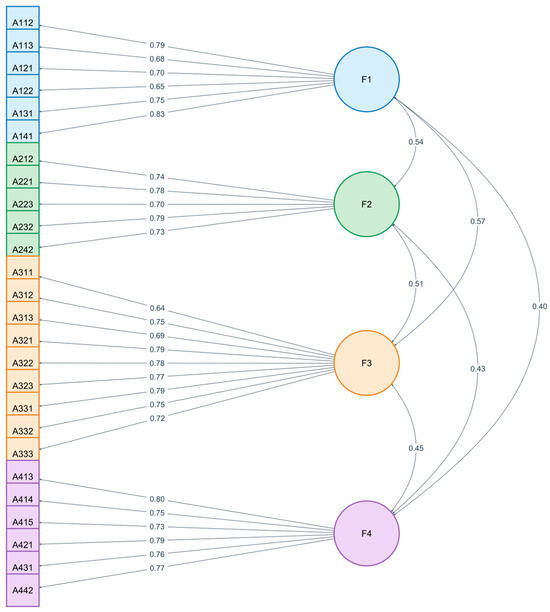
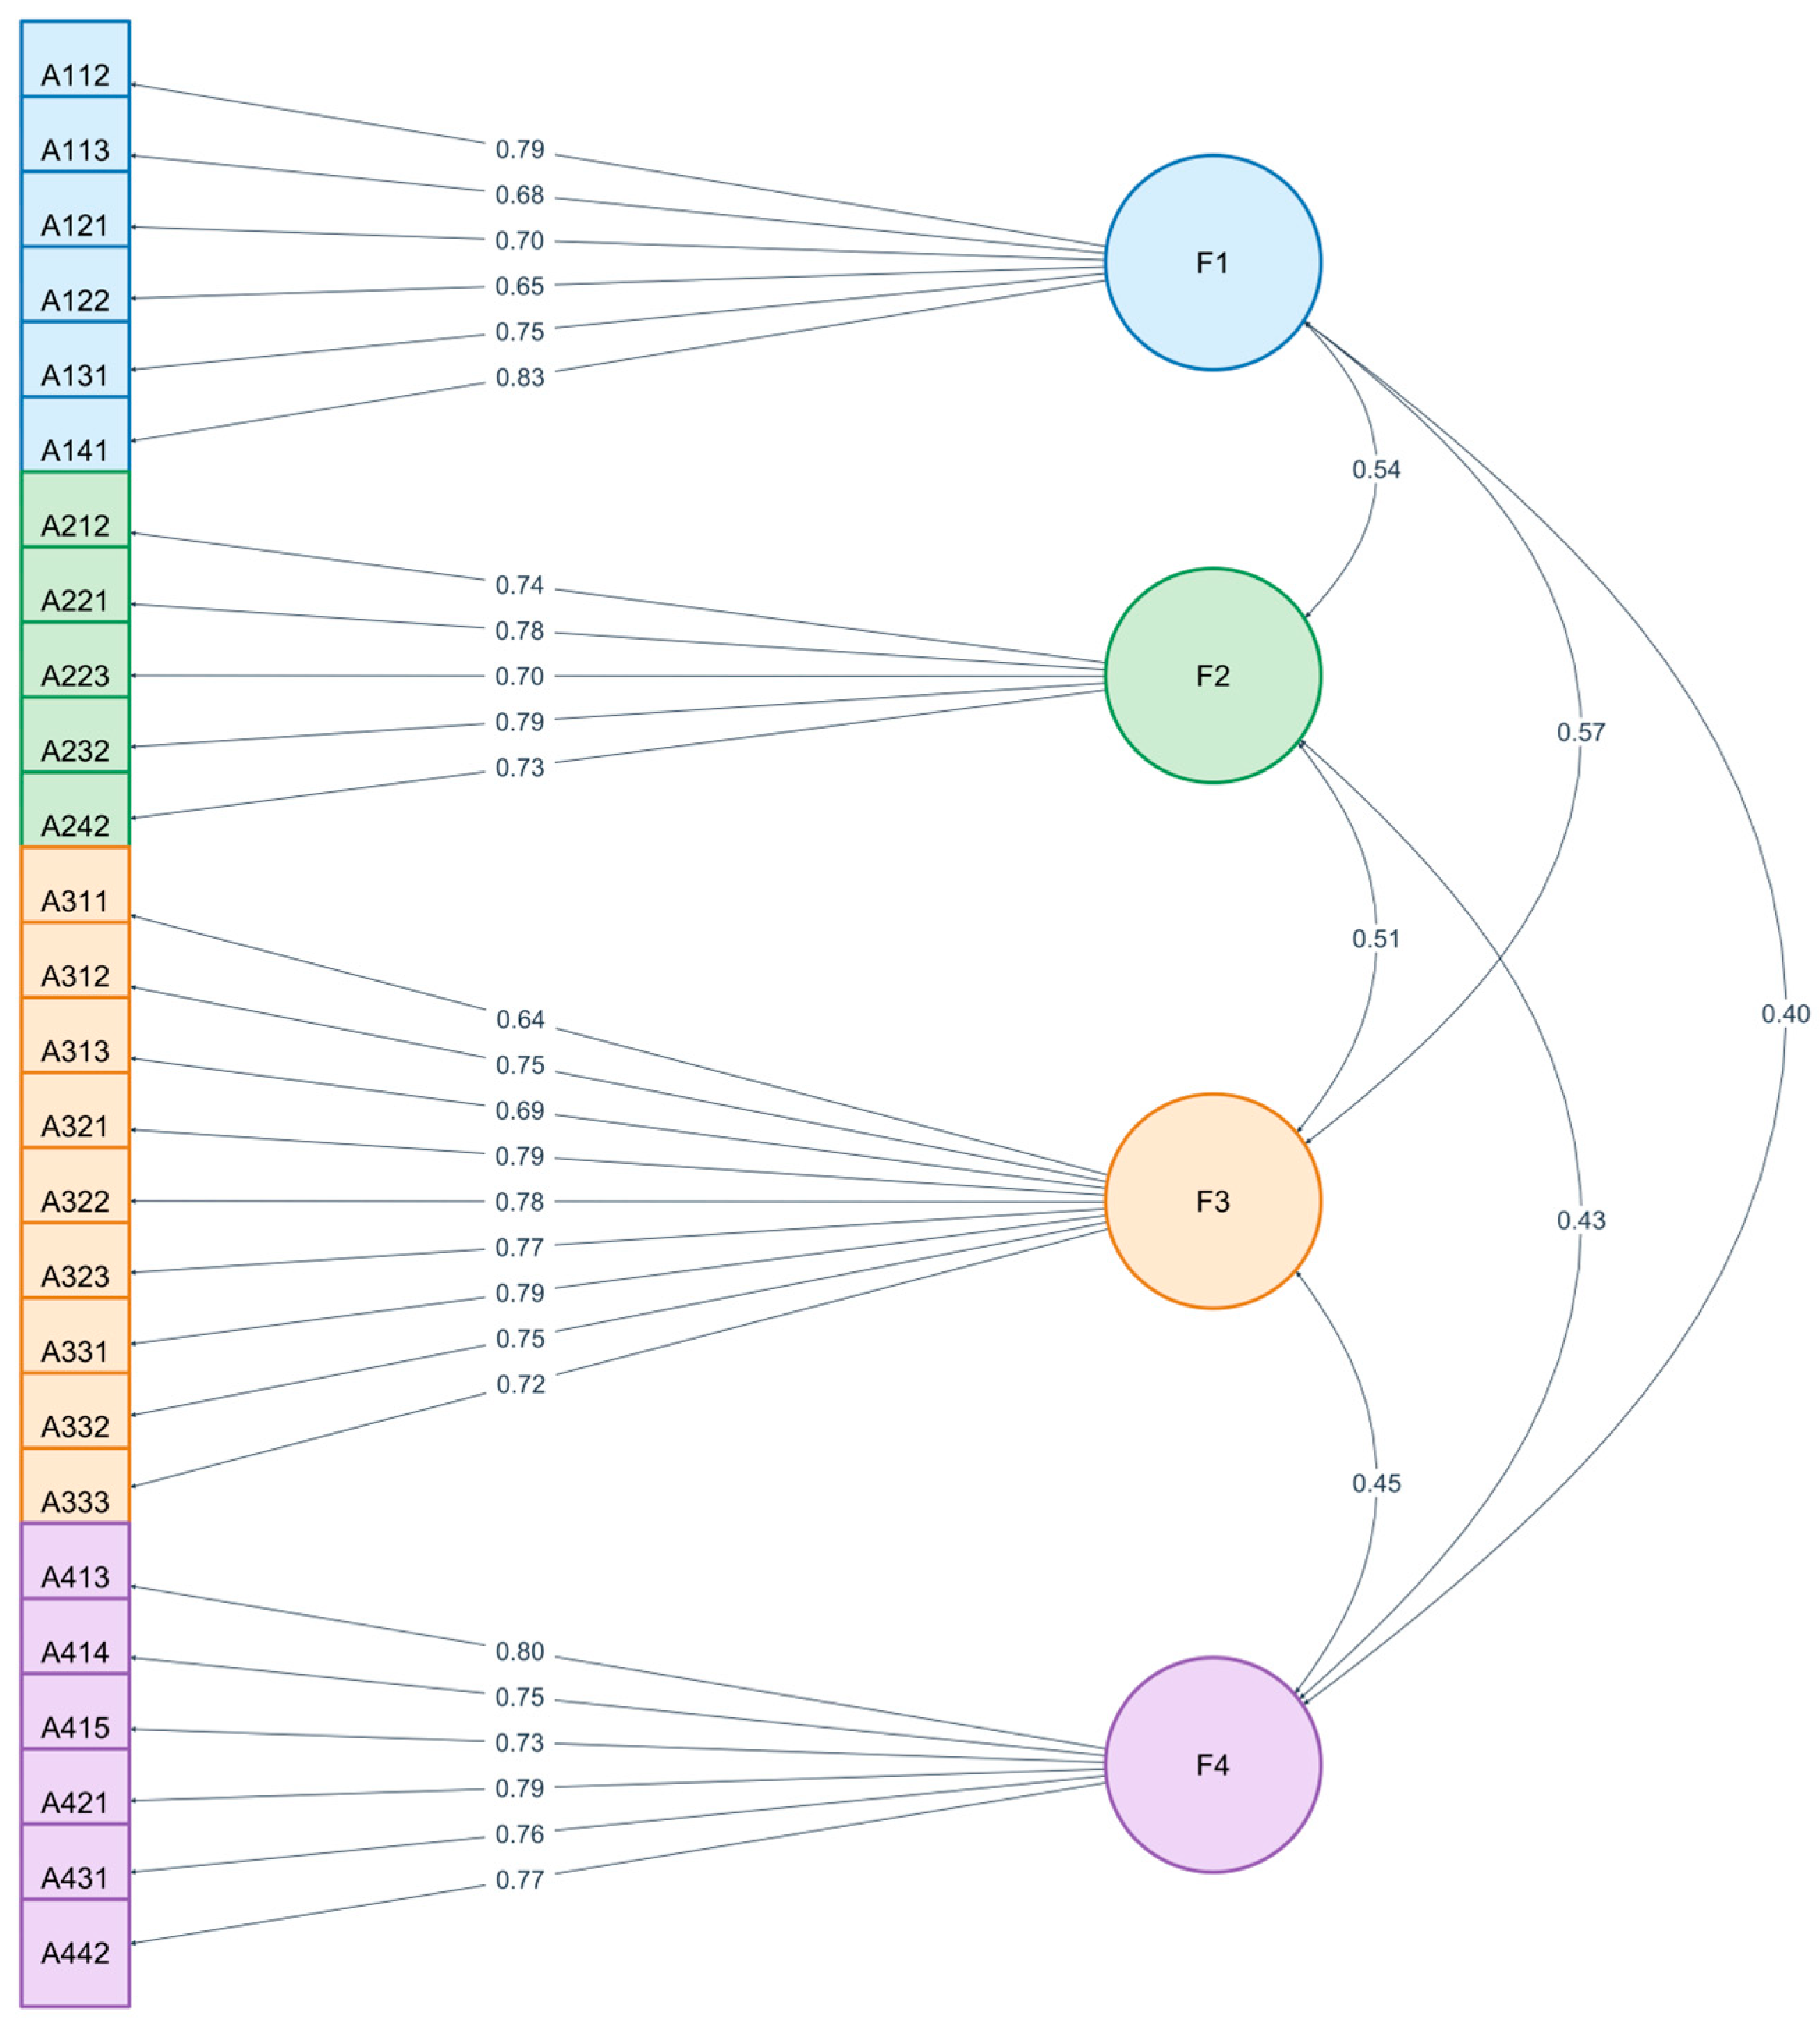
The standardized path diagram of the CFA is shown in Figure 5, and the model fit indices are shown in Table 5.
Figure 5.
CFA standardized path model diagram.
Table 5.
CFA model fit indices.
All fit indices reached the recommended standards, indicating that the four-factor model constructed by EFA fits the observed data well and has a stable structure.
Although the model showed very strong fit, such results should not be interpreted mechanically as either definitive proof of model superiority or automatic evidence of problematic overfitting. Prior methodological studies have cautioned that universal cutoff criteria for fit indices are not appropriate across all contexts, because fit statistics are influenced by model size, estimation method, and data characteristics. Therefore, model fit should be evaluated jointly with theoretical interpretability, item quality, and validation across independent samples rather than relying solely on fixed thresholds [44,45,46,48,49,50,51,52].
3.4. Reliability and Validity Test
3.4.1. Reliability Test
As shown in Table 6, the Cronbach’s α coefficient of the total scale was 0.953, and the α coefficients of the four dimensions were all between 0.899 and 0.952. In addition, the split-half reliability coefficient of the total scale was 0.933. These indicators are all far higher than the recommended standard of 0.7 [17,18,32], indicating that the scale has very high internal consistency reliability [58].
Table 6.
Reliability analysis results of the scale.
3.4.2. Validity Test
Content Validity: The items of this scale are derived from in-depth interviews with construction workers and extensive literature review, and have been reviewed by experts in two rounds, ensuring good content validity.
Construct Validity: The results of EFA and CFA both support the four-factor structure of the scale, indicating good construct validity.
Convergent Validity: As shown in Table 4, the composite reliability (CR) of all dimensions is greater than 0.8, and the average variance extracted (AVE) is greater than 0.5, which exceeds the recommended standards of CR > 0.7 and AVE > 0.5, indicating good convergent validity [34,57].
Discriminant Validity: As shown in Table 7, the square root of the AVE value of all dimensions (the bold values on the diagonal) is greater than its correlation coefficient with other dimensions (the off-diagonal values). In addition, the HTMT values between all dimensions (not shown in the table) are all less than the strict standard of 0.85. This indicates that there is good discriminant validity between the dimensions.
Table 7.
Convergent and discriminant validity analysis using the Fornell–Larcker criterion.
4. Discussion
This study successfully developed and validated a 26-item, four-dimensional safety attitude scale for construction workers (CWSAS), encompassing Safety Cognition, Safety Behavioral Tendency, Safety Emotion, and Organization and Management. Compared to previous studies, this research demonstrates significant improvements in both the depth of theoretical construction and the rigor of its methodology, providing a reliable tool for accurately measuring the safety attitudes of construction workers.
4.1. Theoretical Contributions and Interpretation of Findings
The four-dimensional structure constructed in this study is both related to and an extension of the classic three-component theory of attitude (cognition, affect, behavior). We propose “Organization and Management” as an independent dimension, highlighting that in the unique context of the construction industry, which is highly dependent on organizational coordination and on-site management, workers’ perceptions of organizational-level safety investments (such as safety training and safety goals) are a key component of their overall safety attitude [59]. This finding is consistent with the emphasis on management commitment and the importance of safety systems in safety climate theory [16,20], and provides empirical support for a safety attitude model that integrates individual psychological factors with organizational context factors.
In the EFA analysis, the item “I think training is very important for my work” (A413) cross-loaded from its original “Organization and Management” dimension to the “Safety Emotion” dimension. This interesting finding may indicate that for construction workers, whether they consider training important reflects more of an emotional identification and value judgment than just an objective cognition of organizational behavior. This suggests to managers that safety training is not only about knowledge transfer, but also about stimulating workers’ emotional resonance and intrinsic motivation [60].
In addition, the descriptive statistics show that the mean of the “Safety Emotion” dimension (3.486) is significantly lower than the other dimensions, especially since it contains several reverse-scored items, such as “I think it is irrelevant to me if others violate the rules.” This reveals a common problem: although workers know the importance of safety cognitively, their tolerance for violations is still high emotionally and attitudinally. This may be the key psychological mechanism leading to the phenomenon of “knowing but not doing,” and should be the focus of future safety interventions.
In the measurement model evaluation, three items—A332 (“I can detect the signs of an accident”), A333 (“I understand the hidden dangers of construction operations and can effectively avoid risks”), and A413 (“I think training is very important for my job”)—exhibited factor loadings between 0.47 and 0.60. While these values are slightly below the ideal threshold of 0.70 often recommended in structural equation modeling, they remain acceptable and theoretically meaningful within the context of construction safety research. The retention of these items is justified from both statistical and practical perspectives.
From a statistical standpoint, factor loadings above 0.40 are generally considered acceptable for exploratory or newly developed scales, provided that the overall construct reliability (e.g., Cronbach’s alpha and Composite Reliability) and convergent validity (Average Variance Extracted, AVE) of the corresponding dimensions meet the required thresholds.
In this study, the removal of these items did not significantly improve the AVE or reliability of the “Accident sign recognition” (A33) and “Safety training” (A41) sub-dimensions. Therefore, retaining them preserves the content validity of the measurement instrument without compromising its statistical robustness.
From a practical and psychological perspective, the relatively lower loadings of these specific items can be attributed to the complex cognitive and organizational realities of frontline construction workers.
First, regarding items A332 and A333 within the “Accident sign recognition” dimension, the lower loadings reflect the inherent difficulty and subjectivity of hazard identification in dynamic construction environments. Detecting accident signs (A332) and effectively avoiding risks (A333) require not only theoretical safety knowledge but also extensive on-site experience and situational awareness. For many workers, especially those with less tenure or those operating in highly unpredictable work zones, self-assessing their ability to “detect” and “effectively avoid” dangers may introduce greater variance in responses. Unlike A331, which focuses on predicting dangers from specific “illegal operations” (a more concrete and rule-based scenario), A332 and A333 describe broader, more abstract cognitive abilities. This abstraction likely led to the observed attenuation in their factor loadings, as workers’ self-efficacy in hazard recognition fluctuates based on their specific trades and daily task complexities.
Second, regarding item A413 (“I think training is very important for my job”) within the “Safety training” dimension, the lower loading highlights a potential discrepancy between organizational safety climate and individual perception. While workers generally acknowledge the necessity of training, their subjective valuation of its “importance” (A413) may be diluted by the practical execution of such training programs. In the construction industry, safety training is sometimes perceived as a mandatory administrative procedure rather than a practical skill-building exercise. This sentiment is indirectly supported by item A415 (“I think training is sometimes a burden on my job”). Consequently, a worker might fully understand the spirit of safety meetings (A412) and believe that training ensures production safety (A414) at a macro level, but still rate the personal “importance” of training (A413) lower if the training content lacks direct relevance to their specific daily tasks. This cognitive dissonance between the ideal value of training and its actual utility on the ground explains the moderate factor loading of A413.
In conclusion, the retention of items A332, A333, and A413 is theoretically sound. They capture nuanced, real-world challenges in safety cognition and Organization and Management that higher-loading, more straightforward items might miss. Their inclusion ensures a comprehensive assessment of construction workers’ safety behaviors, acknowledging the gap between theoretical safety protocols and on-site operational realities.
4.2. Practical Implications
The Construction Workers’ Safety Attitude Scale (CWSAS) developed in this study is both comprehensive and concise; its 26 items make it easy to administer on construction sites without overburdening respondents. First, firms can use it as a routine “health check” to regularly gauge employees’ safety attitudes, identify individuals or teams with lower scores, and implement targeted training or managerial interventions. Second, by examining scores across the four dimensions—cognition, behavioural tendency, affect, and organisational management—managers can pinpoint specific weaknesses in their safety management systems. For instance, consistently low scores in organisational management would signal a need for greater investment in safety training, incentives, and goal setting; low Safety Emotion scores would highlight the importance of strengthening safety culture and fostering a sense of shared responsibility. Finally, the CWSAS provides a straightforward means of evaluating the effectiveness of interventions: comparing pre- and post-intervention scores enables firms to assess whether safety training or culture-building initiatives are working and to make evidence-based decisions about future investments.
4.3. Limitations and Future Research Directions
This study still has some limitations. First, the sample was mainly from construction sites in some parts of China, and its representativeness is limited. In the future, the scale needs to be validated in a wider area of China and in other countries and cultural backgrounds to test its cross-cultural generalizability. Second, this study used a self-report questionnaire, which may have social desirability bias. Future research can combine objective indicators such as behavioral observation and accident data to test the criterion validity of the scale. Third, this study is a cross-sectional design, which cannot reveal the causal relationship and dynamic change process between safety attitude and safety behavior.
Another limitation of this study lies in the demographic heterogeneity between Sample 1 and Sample 2. The two samples differed substantially in age, educational level, and years of work experience, with Sample 1 containing a larger proportion of younger, less educated, and less experienced workers, while Sample 2 included relatively more older and experienced workers. Although the use of two independent samples strengthened the psychometric testing procedure, such heterogeneity may have influenced the cross-sample generalizability of the factor structure to some extent. In particular, workers with different age, education, and experience profiles may differ in their understanding and evaluation of safety-related items. Therefore, future studies are encouraged to further validate the scale using more demographically balanced samples and to test its measurement invariance across subgroups with different background characteristics.
Despite the robust psychometric properties demonstrated by the CWSAS, this study is not without limitations. One methodological consideration pertains to the use of Varimax (orthogonal) rotation during the exploratory factor analysis. While Varimax rotation facilitates a clear and interpretable factor structure, it assumes that the underlying factors are uncorrelated. In complex psychological constructs such as safety attitude, it is plausible that the dimensions (e.g., safety cognition and Safety Emotion) are indeed correlated. The use of an orthogonal rotation in such cases might lead to a less accurate representation of the true factor relationships. Future research could explore the use of oblique rotation methods (e.g., Promax or Oblimin) to allow for potential correlations between factors, which might provide a more nuanced understanding of the interrelationships among the safety attitude dimensions.
Future research can adopt a longitudinal tracking design to explore the formation mechanism of safety attitude and its long-term impact on safety performance. Finally, this scale was mainly developed for frontline construction workers, and its applicability to different role groups such as project managers and safety engineers needs to be further tested.
4.4. Comparison with Safety Attitude Scales from Other Countries/Regions
To highlight the innovative nature and practical applicability of the Construction Worker Safety Attitude Scale (CWSAS) developed in this study, this section presents a comparative analysis of CWSAS with representative safety-related scales from Japan and Southeast Asia. By thoroughly examining the characteristics, focal points, and limitations of these existing scales, we aim to underscore CWSAS’s contributions in terms of comprehensiveness, industry specificity, and psychometric integrity.
The Work Safety Scale (WSS), developed by Hayes et al. [26], aims to assess employees’ overall perceptions of workplace safety. This 50-item instrument comprises five sub-dimensions: job safety, coworker safety, supervisor safety, management safety practices, and satisfaction with the safety program. Research findings indicate that management safety and job safety are significant predictors of accident occurrence, while coworker safety and supervisor safety are more effective in predicting safety compliance behaviors [26]. However, the WSS primarily focuses on employees’ macroscopic perceptions of safety policies and practices, without making fine distinctions at the psychological level of cognition, emotion, and behavioral tendencies. Furthermore, it is not specifically adapted to the high-risk characteristics of the construction industry. These limitations restrict its ability to provide a deep understanding of the complex safety attitudes of construction workers.
Siu et al. [24] developed the Hong Kong Safety Attitude Questionnaire (SAQ) based on Donald and Canter’s theory to measure the safety attitudes of construction workers in Hong Kong. This questionnaire features a complex structure, categorizing safety attitudes into role dimensions (e.g., individual, fellow workers, foremen, management), safety objects (passive and active safety referents), and behavioral patterns (cognition, emotion, behavior), resulting in up to twelve subscales [24]. The SAQ emphasizes the evaluation of safety systems and the behavior of others, and its multi-dimensional, multi-level classification reflects a profound understanding of the complexity of safety attitudes. Nevertheless, the large number of items and the highly intricate structure of this instrument may limit its applicability in practical settings, particularly within the fast-paced environment of construction sites.
Shoji and Egawa [61] conducted a self-administered questionnaire survey to investigate the structure of safety climate at Japanese construction sites and its effects on workers’ attitudes and safety. The questionnaire primarily assessed site safety conditions, supervisors’ safety attitudes, and equipment status. The study revealed that the site environment and management attitudes are crucial factors influencing workers’ safety attitudes [61]. Although this scale effectively evaluates safety climate, its main focus is on environmental and managerial perceptions, lacking a clear distinction among individual psychological components such as safety cognition, emotion, and behavioral tendencies. This limitation restricts its capacity to comprehensively portray individual safety attitudes.
Khaday et al. [62] developed the Construction Worker Risk Perception Scale (CoWoRP) for Thai construction workers, refining its items through scenario screening. This scale assesses risk perception across four dimensions: probability, severity, worry, and insecurity [62]. CoWoRP concentrates on risk cognition and emotional responses, aiming to understand workers’ perceived levels of specific risks. However, risk perception constitutes only one important component of safety attitude. This scale does not encompass other critical dimensions such as safety behavioral tendencies or perceptions of organizational safety management, thus failing to provide a comprehensive assessment of construction workers’ safety attitudes.
In summary, existing research in Japan and Southeast Asia predominantly focuses on single or limited dimensions such as safety climate or risk perception. There is a general lack of a comprehensive scale that simultaneously covers safety cognition, emotion, behavioral tendencies, and perceptions of organizational safety management. In comparison to these scales, the CWSAS developed in this study demonstrates significant innovation and advantages. CWSAS not only fully considers the inherent high-risk characteristics of the construction industry but also, within a psychometric framework, comprehensively integrates the cognitive, emotional, and behavioral dimensions of safety attitudes, alongside perceptions of organizational safety management. This multi-dimensional, integrated design allows CWSAS to exhibit unique strengths in international comparisons, enabling a more comprehensive and in-depth reflection of construction workers’ safety attitudes, thereby providing a more solid foundation for developing precise and effective safety intervention measures.
5. Conclusions
Using a systematic mixed-methods approach, this study developed and validated the Construction Workers’ Safety Attitude Scale (CWSAS). Exploratory and confirmatory factor analyses showed that the four-factor model explained 74.759% of total variance and exhibited a good fit on an independent sample (χ2/df = 0.960; CFI = 1.000; TLI = 1.004; RMSEA = 0.000). The overall Cronbach’s alpha was 0.953, with subscale alphas ranging from 0.899 to 0.952, and the average variance extracted (AVE) values were all above 0.50. Discriminant validity was assessed using the Fornell–Larcker criterion—each construct’s square root of AVE exceeded its highest correlation with other constructs, indicating that the scale meets the criterion of sharing more variance with its indicators than with other constructs [34]. This criterion originates from Fornell & Larcker’s seminal work [34].
CWSAS comprises four dimensions—safety cognition, safety behavioural tendency, Safety Emotion, and organisational management. The study found that scores on the Safety Emotion dimension were lower than those on the other dimensions, suggesting a gap between cognitive understanding and affective endorsement of safety (“knowing but not doing”). Moreover, the item “I think training is very important for my work” cross-loaded onto the affect dimension, implying that workers’ appreciation of safety training involves value judgments and emotional identification. Consequently, we recommend that construction firms not only deliver safety training content but also focus on fostering emotional engagement, strengthen managerial commitment, and cultivate a culture in which everyone feels responsible for safety. The CWSAS can be used for regular assessments, targeted interventions, and evaluating the effectiveness of safety programmes [12].
To facilitate implementation and reproducibility, the questionnaire format and participant disclaimer are provided in Table A3, and the correspondence between the initial item design and the indicator system is presented in Table A4. Table 8 below summarises the final 26 items and their dimensions. These materials illustrate the development process and final four-factor structure of the CWSAS, enabling practitioners and researchers to understand the full composition and practical application of the scale.
Table 8.
Final items of the construction worker safety attitude scale (CWSAS).
Author Contributions
Conceptualization, Q.Z. and Y.L.; methodology, Q.Z. and Y.L.; software, Q.Z. and Y.L.; validation, Q.Z. and Y.L.; formal analysis, Q.Z. and Y.L.; investigation, Q.Z. and Y.L.; resources, Q.Z. and H.P.; data curation, Q.Z. and Y.L.; writing—original draft preparation, Q.Z. and Y.L.; writing—review and editing, Q.Z., Y.L. and H.P.; visualization, Q.Z. and Y.L.; supervision, H.P.; project administration, H.P. All authors have read and agreed to the published version of the manuscript.
Funding
This research received no external funding.
Institutional Review Board Statement
This study qualifies for full exemption from ethical review under Article 32 of China’s Measures for Ethical Review of Life Science and Medical Research Involving Humans (2023), as it relies exclusively on anonymized data without causing harm to individual privacy or commercial interests. The research also strictly complied with Article 28 of the Personal Information Protection Law of the People’s Republic of China (2021) by collecting no sensitive or directly identifiable personal information.
Informed Consent Statement
Informed consent was obtained from all subjects involved in the study. Prior to participation, all respondents were clearly informed of the research purpose, the strictly voluntary nature of their participation, and that all data would be collected and processed anonymously.
Data Availability Statement
The data supporting the findings of this study are available from the corresponding author upon reasonable request. The data are not publicly available because of privacy and ethical restrictions.
Conflicts of Interest
The authors declare no conflicts of interest.
Appendix A
Table A1.
Examples of open coding in the grounded theory analysis.
Table A2.
Axial coding results.
Appendix B
This questionnaire is designed solely for academic research. Your responses are completely anonymous, and all data collected will be used only for research purposes. No personally identifiable information will be disclosed. Participation is entirely voluntary, and you are free to withdraw at any time without providing a reason. By completing and submitting this questionnaire, you acknowledge that you have read this information and agree to participate in the study.
Instructions: This questionnaire uses a 5-point Likert scale. Each item offers five response options, numbered 1–5, to capture how much you agree with the statement. Please tick the number that best matches your opinion. The numbers represent:
1 = Strongly Disagree, 2 = Disagree, 3 = Neither Agree nor Disagree (Neutral), 4 = Agree, 5 = Strongly Agree.
There are no right or wrong answers; simply select the number that reflects your honest view.
Table A3.
Questionnaire and disclaimer.
Table A4.
The correspondence between the initial design project and the indicator system.
Appendix C
Table A5.
Demographic characteristics of Delphi experts.
Table A6.
Expert opinion coordination coefficient test table.
Table A7.
Statistical Analysis of Expert Ratings for Each Item in Round 1.
Table A8.
Statistical analysis of expert ratings for each item in round 2.
References
- Lingard, H. Occupational Health and Safety in the Construction Industry. Constr. Manag. Econ. 2013, 31, 505–514. [Google Scholar] [CrossRef] [Scilit]
- Lyu, S.; Hon, C.K.H.; Chan, A.P.C.; Wong, F.K.W.; Javed, A.A. Relationships among Safety Climate, Safety Behavior, and Safety Outcomes for Ethnic Minority Construction Workers. Int. J. Environ. Res. Public Health 2018, 15, 484. [Google Scholar] [CrossRef] [Scilit]
- Takala, J.; Hämäläinen, P.; Sauni, R.; Nygård, C.-H.; Gagliardi, D.; Neupane, S. Global-, Regional- and Country-Level Estimates of the Work-Related Burden of Diseases and Accidents in 2019. Scand. J. Work Environ. Health 2024, 50, 73–82. [Google Scholar] [CrossRef] [Scilit] [PubMed]
- Wadsworth, E.; Walters, D. Safety and Health at the Heart of the Future of Work: Building on 100 Years of Experience; International Labour Office: Geneva, Switzerland, 2019. [Google Scholar]
- Suraji, A.; Duff, A.R.; Peckitt, S.J. Development of Causal Model of Construction Accident Causation. J. Constr. Eng. Manag. 2001, 127, 337–344. [Google Scholar] [CrossRef] [Scilit]
- Javanmardi, A.; Abbasian-Hosseini, S.A.; Liu, M.; Hsiang, S.M. Improving Effectiveness of Constraints Removal in Construction Planning Meetings: Information-Theoretic Approach. J. Constr. Eng. Manag. 2020, 146, 04020015. [Google Scholar] [CrossRef] [Scilit]
- Xia, N.; Xie, Q.; Griffin, M.A.; Ye, G.; Yuan, J. Antecedents of Safety Behavior in Construction: A Literature Review and an Integrated Conceptual Framework. Accid. Anal. Prev. 2020, 148, 105834. [Google Scholar] [CrossRef] [Scilit] [PubMed]
- Xia, N.; Griffin, M.A.; Xie, Q.; Hu, X. Antecedents of Workplace Safety Behavior: Meta-Analysis in the Construction Industry. J. Constr. Eng. Manag. 2023, 149, 04023009. [Google Scholar] [CrossRef] [Scilit]
- Eagly, A.H.; Chaiken, S. The Psychology of Attitudes; Harcourt Brace Jovanovich College Publishers: Fort Worth, TX, USA, 1993. [Google Scholar]
- Fishbein, M.; Ajzen, I. Belief, Attitude, Intention and Behavior: An Introduction to Theory and Research; Addison-Wesley: Reading, MA, USA, 1975. [Google Scholar]
- Ajzen, I. The Theory of Planned Behavior. Organ. Behav. Hum. Decis. Process. 1991, 50, 179–211. [Google Scholar] [CrossRef] [Scilit]
- Liang, Q.; Zhou, Z.; Ye, G.; Shen, L. Unveiling the Mechanism of Construction Workers’ Unsafe Behaviors from an Occupational Stress Perspective: A Qualitative and Quantitative Examination of a Stress–Cognition–Safety Model. Saf. Sci. 2022, 145, 105486. [Google Scholar] [CrossRef] [Scilit]
- Yang, S.; Liu, L.; Wang, T.; Guo, Y.; Qian, Y.; Chen, H. The Impact of Accident Experience on Unsafe Behaviors of Construction Workers Within Social Cognitive Theory. Buildings 2024, 15, 59. [Google Scholar] [CrossRef] [Scilit]
- Christian, M.S.; Bradley, J.C.; Wallace, J.C.; Burke, M.J. Workplace Safety: A Meta-Analysis of the Roles of Person and Situation Factors. J. Appl. Psychol. 2009, 94, 1103–1127. [Google Scholar] [CrossRef] [Scilit] [PubMed]
- Neal, A.; Griffin, M.A. A Study of the Lagged Relationships among Safety Climate, Safety Motivation, Safety Behavior, and Accidents at the Individual and Group Levels. J. Appl. Psychol. 2006, 91, 946–953. [Google Scholar] [CrossRef] [Scilit]
- Zohar, D. Safety Climate in Industrial Organizations: Theoretical and Applied Implications. J. Appl. Psychol. 1980, 65, 96–102. [Google Scholar] [CrossRef]
- DeVellis, R.F. Scale Development: Theory and Applications, 4th ed.; SAGE: Los Angeles, CA, USA, 2017. [Google Scholar]
- Nunnally, J.C.; Bernstein, I.H. Psychometric Theory, 3rd ed.; McGraw-Hill: New York, NY, USA, 1994. [Google Scholar]
- Kline, R.B. Principles and Practice of Structural Equation Modeling, 4th ed.; Guilford Press: New York, NY, USA, 2016. [Google Scholar]
- Flin, R.; Mearns, K.; O’Connor, P.; Bryden, R. Measuring Safety Climate: Identifying the Common Features. Saf. Sci. 2000, 34, 177–192. [Google Scholar] [CrossRef] [Scilit]
- Dedobbeleer, N.; Béland, F. A Safety Climate Measure for Construction Sites. J. Saf. Res. 1991, 22, 97–103. [Google Scholar] [CrossRef] [Scilit]
- Glendon, A.I.; Litherland, D.K. Safety Climate Factors, Group Differences and Safety Behaviour in Road Construction. Saf. Sci. 2001, 39, 157–188. [Google Scholar] [CrossRef] [Scilit]
- Sexton, J.B.; Helmreich, R.L.; Neilands, T.B.; Rowan, K.; Vella, K.; Boyden, J.; Roberts, P.R.; Thomas, E.J. The Safety Attitudes Questionnaire: Psychometric Properties, Benchmarking Data, and Emerging Research. BMC Health Serv. Res. 2006, 6, 44. [Google Scholar] [CrossRef] [Scilit]
- Siu, O.; Phillips, D.R.; Leung, T. Age Differences in Safety Attitudes and Safety Performance in Hong Kong Construction Workers. J. Saf. Res. 2003, 34, 199–205. [Google Scholar] [CrossRef] [Scilit]
- Helmreich, R.L.; Merritt, A.C.; Wilhelm, J.A. The Evolution of Crew Resource Management Training in Commercial Aviation. Int. J. Aviat. Psychol. 1999, 9, 19–32. [Google Scholar] [CrossRef] [Scilit] [PubMed]
- Hayes, B.E.; Perander, J.; Smecko, T.; Trask, J. Measuring Perceptions of Workplace Safety. J. Saf. Res. 1998, 29, 145–161. [Google Scholar] [CrossRef] [Scilit]
- Cooper, M.D.; Phillips, R.A. Exploratory Analysis of the Safety Climate and Safety Behavior Relationship. J. Saf. Res. 2004, 35, 497–512. [Google Scholar] [CrossRef] [Scilit]
- Mearns, K.; Whitaker, S.M.; Flin, R. Safety Climate, Safety Management Practice and Safety Performance in Offshore Environments. Saf. Sci. 2003, 41, 641–680. [Google Scholar] [CrossRef] [Scilit]
- Guo, B.H.W.; Yiu, T.W.; González, V.A. Predicting Safety Behavior in the Construction Industry: Development and Test of an Integrative Model. Saf. Sci. 2016, 84, 1–11. [Google Scholar] [CrossRef] [Scilit]
- Fang, D.; Chen, Y.; Wong, L. Safety Climate in Construction Industry: A Case Study in Hong Kong. J. Constr. Eng. Manag. 2006, 132, 573–584. [Google Scholar] [CrossRef] [Scilit]
- Choudhry, R.M.; Fang, D. Why Operatives Engage in Unsafe Work Behavior: Investigating Factors on Construction Sites. Saf. Sci. 2008, 46, 566–584. [Google Scholar] [CrossRef] [Scilit]
- Brown, T.A. Confirmatory Factor Analysis for Applied Research, 2nd ed.; The Guilford Press: New York, NY, USA, 2015. [Google Scholar]
- Hair, J.F.; Black, W.C.; Babin, B.J.; Anderson, R.E. Multivariate Data Analysis, 8th ed.; Cengage: Andover, UK, 2019. [Google Scholar]
- Fornell, C.; Larcker, D.F. Evaluating Structural Equation Models with Unobservable Variables and Measurement Error. J. Mark. Res. 1981, 18, 39–50. [Google Scholar] [CrossRef] [Scilit]
- Man, S.S.; Chan, A.H.S.; Alabdulkarim, S. Quantification of Risk Perception: Development and Validation of the Construction Worker Risk Perception (CoWoRP) Scale. J. Saf. Res. 2019, 71, 25–39. [Google Scholar] [CrossRef] [Scilit] [PubMed]
- Namian, M.; Tafazzoli, M.; Al-Bayati, A.J.; Kermanshachi, S. Are Construction Managers from Mars and Workers from Venus? Exploring Differences in Construction Safety Perception of Two Key Field Stakeholders. Int. J. Environ. Res. Public Health 2022, 19, 6172. [Google Scholar] [CrossRef] [Scilit]
- Basahel, A.M. Safety Leadership, Safety Attitudes, Safety Knowledge and Motivation toward Safety-Related Behaviors in Electrical Substation Construction Projects. Int. J. Environ. Res. Public Health 2021, 18, 4196. [Google Scholar] [CrossRef] [Scilit] [PubMed]
- Nik Him, N.F.; Amirah, N.A.; Tun Ismail, W.N.A.; Tuan Abdullah, T.N.Z. Assessment of Safety Management Attitude Practices Toward the Safety Culture of the Construction Sector. Plan. Malays. J. 2023, 21, 1220. [Google Scholar] [CrossRef] [Scilit]
- Goh, Y.M.; Binte Sa’adon, N.F. Cognitive Factors Influencing Safety Behavior at Height: A Multimethod Exploratory Study. J. Constr. Eng. Manag. 2015, 141, 04015003. [Google Scholar] [CrossRef] [Scilit]
- Liu, Y.; Ye, G.; Xiang, Q.; Yang, J.; Miang Goh, Y.; Gan, L. Antecedents of Construction Workers’ Safety Cognition: A Systematic Review. Saf. Sci. 2023, 157, 105923. [Google Scholar] [CrossRef] [Scilit]
- Neal, A.; Griffin, M.A.; Hart, P.M. The Impact of Organizational Climate on Safety Climate and Individual Behavior. Saf. Sci. 2000, 34, 99–109. [Google Scholar] [CrossRef] [Scilit]
- Mosly, I.; Makki, A.A. The Effects of Multi-Sociodemographic Characteristics of Construction Sites Personnel on Perceptions of Safety Climate-Influencing Factors: The Construction Industry in Saudi Arabia. Int. J. Environ. Res. Public Health 2021, 18, 1674. [Google Scholar] [CrossRef] [Scilit] [PubMed]
- Chen, H.; Li, H.; Goh, Y.M. A Review of Construction Safety Climate: Definitions, Factors, Relationship with Safety Behavior and Research Agenda. Saf. Sci. 2021, 142, 105391. [Google Scholar] [CrossRef] [Scilit]
- Zohar, D.; Luria, G. A Multilevel Model of Safety Climate: Cross-Level Relationships Between Organization and Group-Level Climates. J. Appl. Psychol. 2005, 90, 616–628. [Google Scholar] [CrossRef] [Scilit]
- Pandit, B.; Albert, A.; Patil, Y.; Al-Bayati, A.J. Impact of Safety Climate on Hazard Recognition and Safety Risk Perception. Saf. Sci. 2019, 113, 44–53. [Google Scholar] [CrossRef] [Scilit]
- Patel, D.A.; Jha, K.N. Neural Network Model for the Prediction of Safe Work Behavior in Construction Projects. J. Constr. Eng. Manag. 2015, 141, 04014066. [Google Scholar] [CrossRef] [Scilit]
- Vinodkumar, M.N.; Bhasi, M. Safety Management Practices and Safety Behaviour: Assessing the Mediating Role of Safety Knowledge and Motivation. Accid. Anal. Prev. 2010, 42, 2082–2093. [Google Scholar] [CrossRef] [Scilit] [PubMed]
- Yuan, B.; Xu, S.; Chen, L.; Niu, M. How Do Psychological Cognition and Institutional Environment Affect the Unsafe Behavior of Construction Workers?—Research on fsQCA Method. Front. Psychol. 2022, 13, 875348. [Google Scholar] [CrossRef] [Scilit] [PubMed]
- Hu, S.H.; Wang, T.; Ramalho, N.C.; Zhou, D.; Hu, X.; Zhao, H. Relationship between Patient Safety Culture and Safety Performance in Nursing: The Role of Safety Behaviour. Int. J. Nurs. Pract. 2021, 27, e12937. [Google Scholar] [CrossRef] [Scilit]
- Kishore, K.; Jaswal, V.; Kulkarni, V.; De, D. Practical Guidelines to Develop and Evaluate a Questionnaire. Indian Dermatol. Online J. 2021, 12, 266–275. [Google Scholar] [CrossRef] [Scilit]
- Sadeghi, E.; Shafaroodi, N.; Fallahpour, M.; Abolghasemi, J.; Hassani Mehraban, A. Cross-Cultural Adaptation and Psychometric Evaluation of the Persian Version of the ADL Taxonomy Questionnaire in Persons with Stroke: A Rasch Analysis. Occup. Ther. Int. 2026, 2026, 6677040. [Google Scholar] [CrossRef] [Scilit] [PubMed]
- Hsu, C.-C.; Sandford, B.A. The Delphi Technique: Making Sense of Consensus. Pract. Assess. Res. Eval. 2007, 12, 10. [Google Scholar] [CrossRef]
- Song, J.; Ma, R.; Zhao, X.-W.; Zhang, X.-X.; Wang, Y.-N.; Ling, M.; Zhou, Y.-Q. Development and Validation of the Help-Seeking Motivation Scale for Patients with Schizophrenia (HSMS). BMC Psychiatry 2025, 25, 439. [Google Scholar] [CrossRef] [Scilit]
- Henseler, J.; Ringle, C.M.; Sarstedt, M. A New Criterion for Assessing Discriminant Validity in Variance-Based Structural Equation Modeling. J. Acad. Mark. Sci. 2015, 43, 115–135. [Google Scholar] [CrossRef] [Scilit]
- Ding, Z.; Ng, F.; Wang, J.; Zou, L. Distinction between Team-Based Self-Esteem and Company-Based Self-Esteem in the Construction Industry. J. Constr. Eng. Manag. 2012, 138, 1212–1219. [Google Scholar] [CrossRef] [Scilit]
- Costello, A.B.; Osborne, J. Best Practices in Exploratory Factor Analysis: Four Recommendations for Getting the Most from Your Analysis. Pract. Assess. Res. Eval. 2005, 10, 7. [Google Scholar] [CrossRef]
- Hair, J.F.; Black, W.C.; Babin, B.J.; Anderson, R.E. Multivariate Data Analysis, 7th ed.; Prentice Hall: Upper Saddle River, NJ, USA, 2010. [Google Scholar]
- Taber, K.S. The Use of Cronbach’s Alpha When Developing and Reporting Research Instruments in Science Education. Res. Sci. Educ. 2018, 48, 1273–1296. [Google Scholar] [CrossRef] [Scilit]
- Truxillo, D.M.; Bauer, T.N.; Erdogan, B. Psychology and Work: An Introduction to Industrial and Organizational Psychology, 2nd ed.; Routledge: New York, NY, USA, 2021. [Google Scholar]
- Jarrar, M.; Al-Bsheish, M.; Samarkandi, L.; Albishi, S.; Alanazi, S.A.; Zubaidi, F. The Mediating Role of Nurses’ Prosocial Voice in the Relationship between Safety Training and Safety Behaviors: Implications for Practice and Education. Int. J. Workplace Health Manag. 2026, 19, 70–88. [Google Scholar] [CrossRef] [Scilit]
- Shoji, T.; Egawa, Y. The Structure of Safety Climates and Its Effects on Workers’ Attitudes and Work Safety at Japanese Construction Work Sites. J. UOEH 2006, 28, 29–43. [Google Scholar] [CrossRef] [Scilit] [PubMed]
- Khaday, S.; Li, K.W.; Man, S.S.; Chan, A.H.S. Risky Scenario Identification in a Risk Perception Scale for Construction Workers in Thailand. J. Saf. Res. 2021, 78, 105–114. [Google Scholar] [CrossRef] [Scilit] [PubMed]

Disclaimer/Publisher’s Note: The statements, opinions and data contained in all publications are solely those of the individual author(s) and contributor(s) and not of MDPI and/or the editor(s). MDPI and/or the editor(s) disclaim responsibility for any injury to people or property resulting from any ideas, methods, instructions or products referred to in the content. |
© 2026 by the authors. Licensee MDPI, Basel, Switzerland. This article is an open access article distributed under the terms and conditions of the Creative Commons Attribution (CC BY) license.