


Abstract
In deep-buried tunnels, the loads acting on supporting structures continuously increase due to the rheological behavior of surrounding rock, while the performance of the secondary lining gradually degrades under environmental effects. These delayed features have significant implications for tunnel safety but are rarely incorporated into the reliability evaluation of tunnels. In this study, the surrounding rock is modeled using the Burgers model, and an analytical solution is developed by incorporating the degradation and damage of the secondary lining. Parametric analysis is conducted to identify the key factors governing tunnel response. Subsequently, limit state functions are established, and a time-dependent system reliability analysis is performed. Results indicate that tunnel response and reliability are highly sensitive to rheological parameters. Among the rheological parameters, the elastic shear modulus of the Maxwell elements Ge has the most pronounced influence on deformation, whereas the elastic shear modulus of the Kelvin elements Gk governs the stress response of the secondary lining. The time-dependent failure probability increases rapidly in the early stage and gradually stabilizes thereafter. Insufficient initial support strength is identified as the dominant failure mode of system failure. Furthermore, Ge and Gk are the key parameters affecting tunnel reliability, and increasing Gk improves the reliability index by more than 1500%. Meanwhile, the variation in system reliability is mainly affected by the failure mode of insufficient initial support strength. These findings provide quantitative guidance for the design, construction, and long-term maintenance of deep-buried tunnels in rheological rock.
1. Introduction
As an important component of the road transportation network, deep-buried tunnels are subjected to the combined influences of environmental conditions, surrounding rock and lining structures throughout their service life, leading to pronounced variations in their mechanical responses [1,2,3,4]. Especially for deep-buried tunnels in rheological rock, the lining structures endure long-term loads generated by the rheological behaviour of the surrounding rock [5,6], which can lead to damage of the lining structures during the operational period. Moreover, as a long-term safeguard for tunnel stability, the secondary lining is exposed to environmental deterioration, groundwater effects, and repeated traffic loading [7]. These adverse actions can lead to material degradation of the secondary lining. In addition, cumulative structural damage may gradually develop. Therefore, these time delayed behaviors should be taken into account when assessing the service safety of deep-buried tunnels.
The causes of secondary lining degradation can be categorised into two primary types. First, concrete degradation [8,9] and voids behind the lining [10] can lead to a reduction in the strength of the secondary lining. This degradation process can be characterized by a decrease in concrete strength. Second, train vibration loads and aerodynamic pressure may cause cumulative damage in the secondary lining [11,12], which further results in strength degradation. The above studies not only clarified the mechanisms of secondary lining degradation but also investigate the long-term safety of tunnels subjected to such degradation.
Furthermore, reliability theory considering the uncertainties of surrounding rock and tunnel linings has been introduced into tunnel safety assessment [13,14,15]. Accordingly, time-dependent reliability approaches that incorporate environmental effects during tunnel operation provide a more comprehensive evaluation of the evolution of tunnel performance over time [16,17]. In this respect, reinforcement corrosion of the secondary lining has been considered in time-dependent tunnel reliability assessments. Finite element methods have been used to construct degradation models and to evaluate the probabilistic distributions of time-dependent tunnel responses [18]. However, reliability evaluation based on finite element methods requires a large number of numerical simulations, which is computationally time consuming. Therefore, when analytical solutions are available, analytical methods can be adopted to significantly reduce the computational cost.
Analytical methods have been widely applied to investigate the mechanical responses of tunnels in rheological rock masses [19,20,21]. These methods provide an efficient and effective means for gaining deeper insight into the interaction between the lining and the surrounding rock [22,23], and they also offer a convenient tool for parametric sensitivity analysis in tunnel engineering problems. Furthermore, analytical methods have been employed to assess the long-term safety of tunnels. Initially, analytical solutions for deep-buried tunnels with sequentially installed linings have been derived, and the time-dependent reliability during the service period has been analyzed accordingly [24]. Based on this, the long-term mechanical response of soft rock tunnels considering the degradation of the initial support has been obtained analytically, and the operational safety of tunnels has been evaluated [19].
To summarize, although researchers have recognized the importance of surrounding rock rheology and secondary lining degradation on the long-term safety of deep-buried tunnels, the coupled effects of these two time-dependent behaviors have not been systematically investigated. Specifically, existing studies have either focused on the rheological behavior of the surrounding rock assuming a constant lining performance [19,20,21], or considered lining degradation under constant surrounding rock loads [8,9]. The interaction mechanism between time-dependent lining strength decay and time-dependent surrounding rock rheology, as well as its influence on the time-dependent reliability of deep-buried tunnels, remains unclear. Recent studies on tunnel–structure interaction have highlighted the importance of considering coupled effects and time-dependent behaviors [25]. A reliable prediction of tunnel long-term safety requires the consideration of both mechanisms, which is crucial for tunnel design and safety assessment.
To address this gap, this paper presents an analytical study on the coupled effects of surrounding rock rheology and secondary lining degradation on the long-term response and time-dependent reliability of deep-buried tunnels. First, the degradation of the secondary lining is characterized by a time-dependent decay of elastic modulus, while the rheological behavior of the surrounding rock is described using a viscoelastic Burgers model. Based on these assumptions (i.e., circular tunnel, isotropic and incompressible Burgers rock, isotropic geostress, and compatible deformation between the surrounding rock and the linings), a coupled analytical model is established. This is followed by validation of the proposed model against existing analytical solutions and numerical simulations. Finally, a time-dependent reliability analysis of the tunnel is conducted, and a parametric study is performed to identify the parameters that have significant influences on tunnel response and time-dependent reliability, providing useful guidance for tunnel design and construction.
2. Analytical Solutions for Deep-Buried Tunnels Considering Degradation of Secondary Lining
2.1. Problem Definition
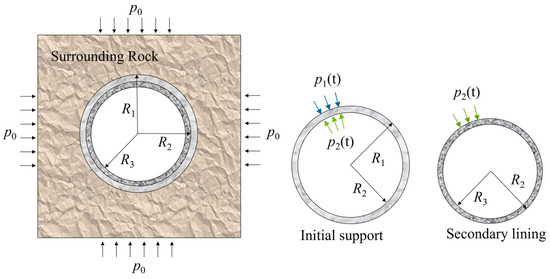
This study focuses on evaluating the time-dependent reliability of deep-buried tunnel in rheological rock, with particular attention to the effects of secondary lining degradation and structural damage. Given the special geological environment and complex interactions between the surrounding rock and lining, several simplifications and assumptions are introduced in the analysis. Firstly, the tunnel is excavated within an isotropic and incompressible viscoelastic Burgers rock. Secondly, the initial geostress p0 is assumed to be isotropic. Thirdly, the tunnel has a circular cross-section (as shown in Figure 1) and is excavated instantaneously at t = t0. The initial support is installed at t = t1, followed by the secondary lining at t = t2. The initial support is firmly bonded to both the surrounding rock and the secondary lining, enabling coordinated deformation among the three components. Finally, the perfect bonding is assumed among the surrounding rock, initial support, and secondary lining, ensuring compatible deformations at their interfaces.
Figure 1.
Tunnel model.
The above assumptions are considered reasonable for deep-buried tunnels excavated in relatively homogeneous and high geostress rock. Under such conditions, the surrounding rock is subjected to high confining pressure, and the deformation is dominated by time-dependent rheological behavior rather than volumetric expansion. In addition, the assumption of isotropy is applicable when the rock does not exhibit strong structural anisotropy, such as well-developed joints or bedding planes.
In addition, the excavation radius of the circular tunnel is R1, the inner radius of the initial support is R2, and the inner radius of the secondary lining is R3. The support pressure between the initial support and the surrounding rock is p1(t), and the support pressure between the secondary lining and the initial support is p2(t), which can be defined respectively:
Based on the above assumptions, the following boundary conditions can be directly derived
2.2. Degradation of the Secondary Lining
Since the secondary lining is directly exposed to the environment, it is subjected to various aggressive actions, including the ingress of sulfate and carbonate ions [26,27], as well as the corrosion of embedded reinforcement [9]. Following previous studies, an exponential decay function is adopted in this research to represent the deterioration of the concrete in the secondary lining [4].
It is worth noting that the degradation of the secondary lining involves both strength and stiffness deterioration. However, these two aspects are strongly correlated, and the reduction in elastic modulus can be used as an effective proxy to describe the overall degradation process [4]. Therefore, in this study, the degradation of the secondary lining is modeled through the evolution of its elastic modulus.
Moreover, the secondary lining often contains initial defects after construction [28]. These defects further propagate and accumulate progressively under vehicular loads, thereby exerting a significant influence on the service life of the tunnel. At present, Miner’s cumulative damage theory is commonly adopted to describe the damage evolution of the secondary lining [29]. Accordingly, the degradation behavior of the secondary lining can be expressed as follows:
where ES0 and ES(t) denote the initial elastic modulus and time-dependent elastic modulus of the secondary lining; χ(t) represents the degradation; De is the damage coefficient of the secondary lining and δ is the degradation coefficient of the concrete.
2.3. Description of Burgers Model
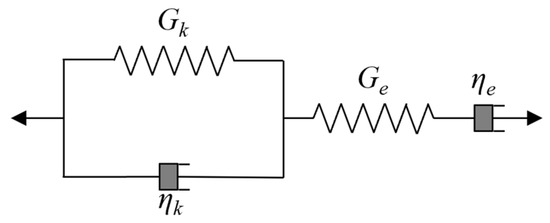
The time-dependent behaviour of rock can be described by viscoelastic models [30,31]. In this study, the rheological behaviour of the surrounding rock is characterised by the Burgers model, which is derived by connecting a Maxwell element and a Kelvin element in series. This model is suitable for describing the long-term creep behaviour of the surrounding rock, as shown in Figure 2. The Burgers model is characterized by four parameters, denoted as Gk, Ge, ηk and ηe, where Gk and Ge represent the elastic shear modulus of the Kelvin and Maxwell elements, respectively, and ηk and ηe denote the corresponding viscosity coefficients. The creep deformation of the surrounding rock is induced by the deviatoric stress component and can be expressed as [32].
Figure 2.
Burgers model.
σm and εm denote the mean stress and mean strain, respectively, and K is the bulk modulus. Moreover, sij and eij denote the deviatoric stress and deviatoric strain corresponding to stress σii and strain εii respectively, and G(t) is the shear modulus. The function G(t) of the Burgers model can be expressed in the Laplace space [32]
Furthermore, the symbol (⁎) in Equation (6) denotes the convolution operation, with the specific operational rules outlined as follows:
In addition, according to the convolution theorem [33], it can be concluded that
2.4. Derivation of the Analytical Solution
Based on the above description of the Burgers model, the analytical solution for deep-buried tunnels can be derived by the characteristics of the Burgers model. This derivation primarily relies on the compatible deformation between the initial support and the surrounding rock, as well as between the initial support and the secondary lining. The subsequent sections provide a detailed derivation of the displacements of the surrounding rock, the initial support, and the secondary lining. Based on these derivations, the support pressure of the initial support p1(t) and that of the secondary lining p2(t) are then determined using the corresponding compatibility equations.
2.4.1. Displacement of Surrounding Rock
Firstly, based on the boundary conditions specified in Equation (3), the analytical expressions for the radial stress σr and hoop stress σθ in the surrounding rock can be obtained as follows [34]:
Furthermore, the radial displacement of the surrounding rock can be obtained
The radial displacement can be expressed in terms of the shear modulus Gr and the bulk modulus Kr of the surrounding rock. For the incompressibility condition, the bulk modulus is assumed to approach infinity (Kr → ∞), which implies that the volumetric strain is negligible. Under this condition, the deformation of the surrounding rock is governed primarily by shear behavior. Subsequently, applying a Laplace transform yields the displacement of the surrounding rock in Laplace space
It should be noted that the bulk modulus and shear modulus are introduced mainly in the derivation process to establish the elastic relationship. However, in the final analytical solution, the time-dependent displacement of the surrounding rock is primarily governed by the rheological parameters of the Burgers model.
According to the convolution operation rule, the radial displacement of the surrounding rock can be rewritten as follows:
Since the surrounding rock is assumed to be incompressible in the preceding analysis, the parameters h1(t) and h2(t) are defined respectively [34]
Therefore, based on Equation (14), the displacements of the surrounding rock at different stages can be derived as follows:
2.4.2. Displacement of Initial Support
The displacement calculation of the initial support can be divided into two stages, that is, before the installation of the secondary lining and after the installation of the secondary lining. Firstly, based on the thick-walled cylinder theory and the boundary conditions, the radial displacement of the initial support before the secondary lining (t1 ≤ t ≤ t2) is installed can be obtained
where EI is the elastic modulus of initial support and v1 is the Poisson’s ratio of initial support.
Secondly, following the installation of the secondary lining (t ≥ t2), the initial support is subjected to external pressure p1(t) and internal pressure p2(t). Based on the thick-walled cylinder theory, the radial displacement of the initial support during this stage can be obtained
2.4.3. Displacement of Secondary Lining
By following the same derivation procedure, the radial stress σS,r and hoop stress σS,θ of the secondary lining after its installation (t ≥ t2) can be readily obtained
Since the secondary lining experiences performance degradation after its installation, the stress increment at each incremental time Δt is given by [35]
In the polar coordinate system, the relationship between the strain increments and the displacement increments is given by
The incremental form of the constitutive equation under plane strain conditions is expressed as follows [35]:
where v2 is the Poisson’s ratio of the secondary lining. By substituting Equations (25) and (23) into Equation (24), the resulting expression for the radial displacement of the secondary lining can be obtained as follows:
2.4.4. Solving Support Pressure Using Deformation Compatibility Equations
As indicated above, the displacement of each component is determined in stages. Consequently, the deformation compatibility equations must also be formulated and computed incrementally. Accordingly, the following section presents the procedure for formulating the deformation compatibility equations and describes the corresponding solution process.
First, during the t1 ≤ t ≤ t2 stage, the initial support and the surrounding rock exhibit identical incremental deformation at r = R1, and this condition is employed to formulate the deformation compatibility equation
Inserting Equations (17), (18) and (20) into Equation (27), the following expression can be obtained
where A1 can be determined from the following expression
Second, during the t ≥ t2 stage, the initial support and the surrounding rock exhibit identical incremental deformation at r = R1, and this condition is employed to formulate the deformation compatibility equation
Inserting Equations (17), (18) and (21) into Equation (30), the following expression can be obtained
where A2 can be determined from the following expression
And in this stage, the initial support and the secondary lining exhibit identical incremental deformation at r = R2, and this condition is employed to formulate the deformation compatibility equation
Substituting Equations (21) and (26) into Equation (33), the following equation is
where A3, A4 and A5 can be determined from the following expressions
By combining Equations (31) and (34), the parameters p12(t) and p22(t) can be obtained. Finally, the surrounding rock displacement can be determined by substituting p1(t) and p2(t) into Equations (17)–(19). The procedure for determining p12(t) and p22(t) is detailed in Appendix B.
3. Verification of the Proposed Analytical Solution
In this section, the proposed approach described in the previous section is validated using the existing analytical solution and finite element simulations. The material parameters of the surrounding rock and the lining adopted in the verification are listed in Table 1 [19]. Moreover, the values of the other parameters are d1 = 0.12 m, d2 = 0.2 m, t1 = 30 d, t2 = 60 d, δ = 0.002 d−1 and De = 0.001 d−1.
Table 1.
Parameter settings for verification.
3.1. Comparison with Existing Analytical Solutions
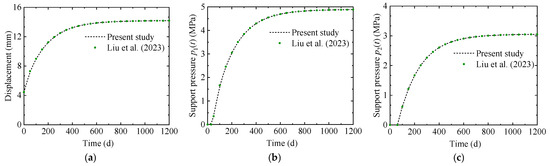
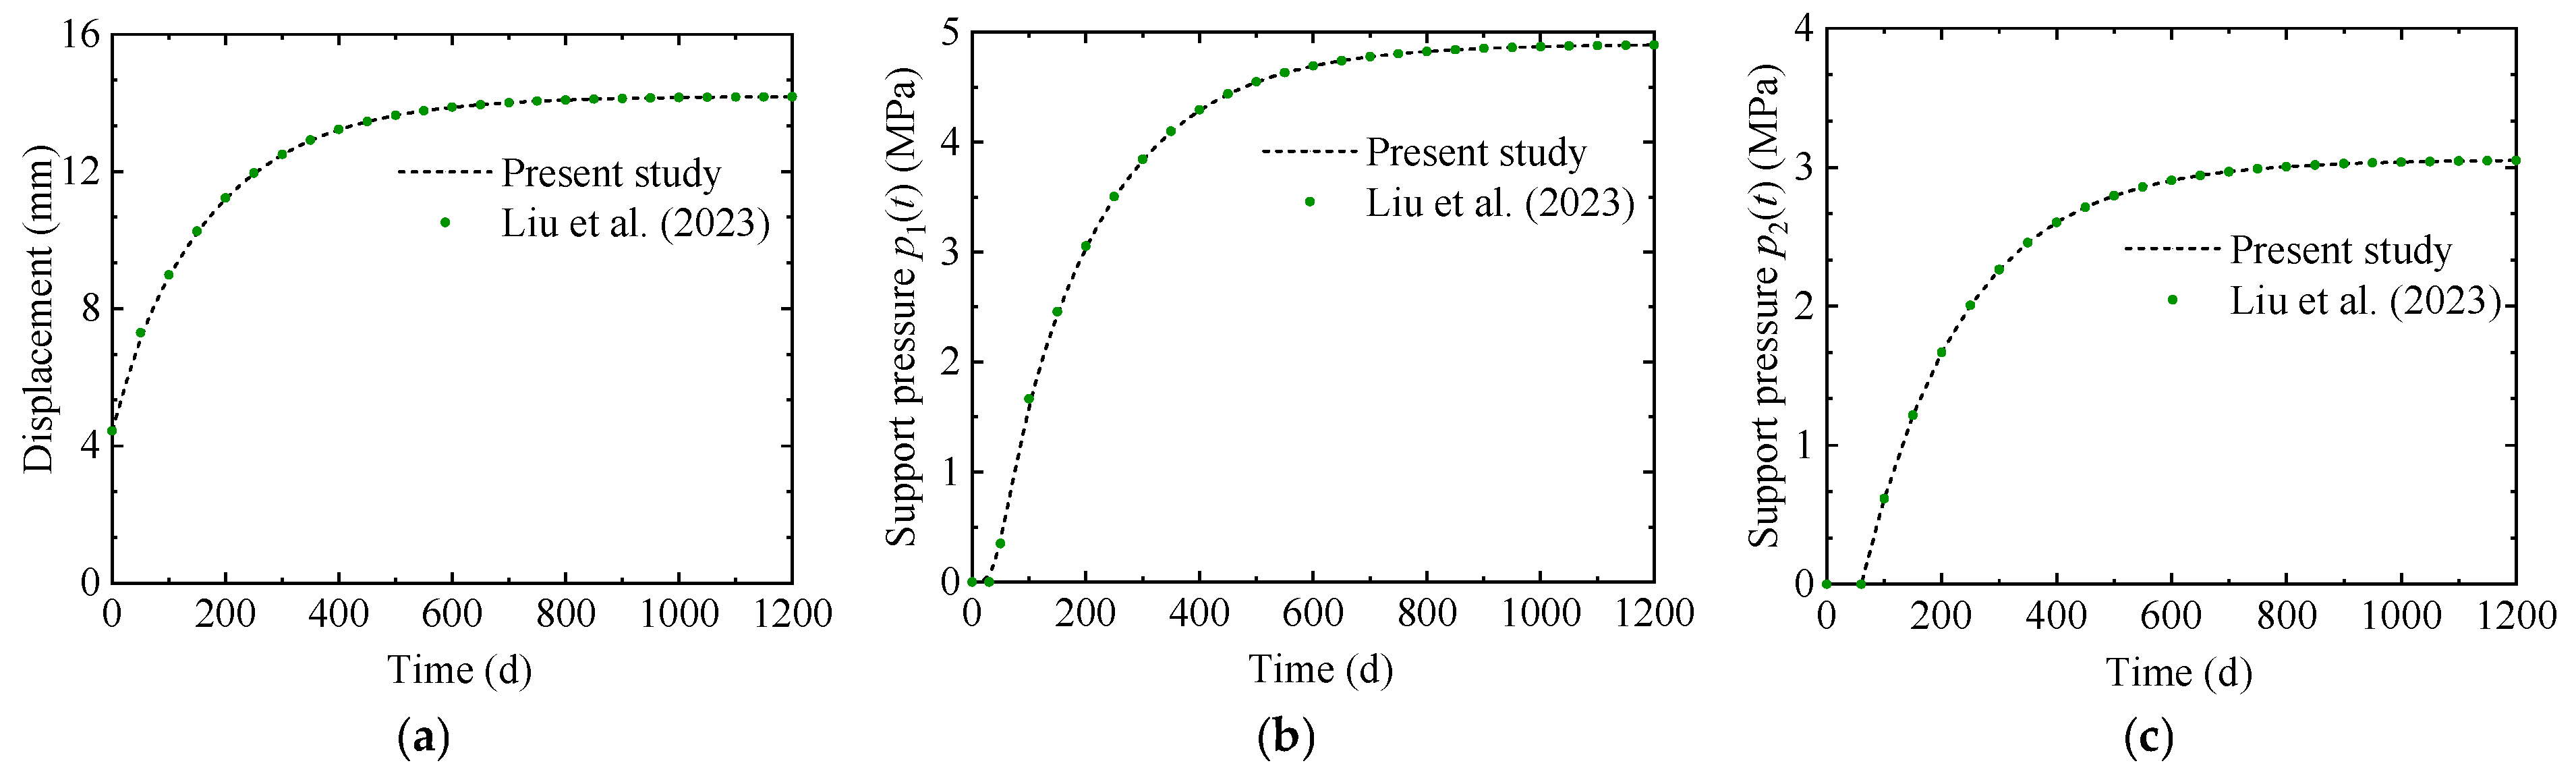
Liu [18] demonstrates the variation in tunnel displacement and support pressure without considering the degradation of the initial support. Under the same condition, namely when this study does not consider damage and degradation, the results are shown in Figure 3. The predicted tunnel displacement as well as the support pressures on the initial support and secondary lining exhibit good agreement with the existing research. To further quantify this agreement, the relative errors between the present results and those reported by Liu are evaluated, and the maximum relative error among all compared quantities is found to be less than 1%. This result demonstrates the accuracy of the proposed method when the degradation and damage of the secondary lining are neglected.
Figure 3.
Comparison between present study and existing research [18]. (a) Surrounding rock displacement. (b) Support pressure of initial support. (c) Support pressure of secondary lining.
3.2. Comparison with the Numerical Solution
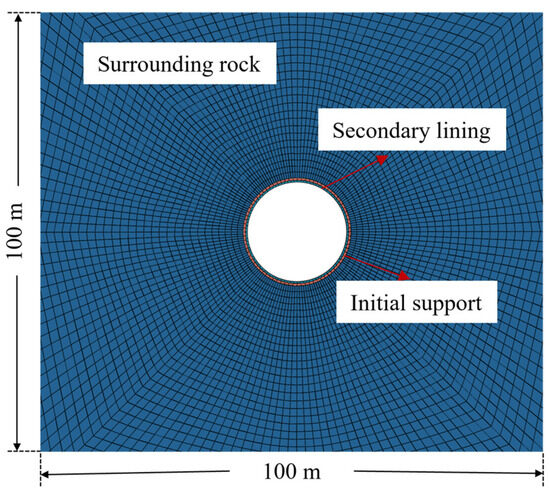
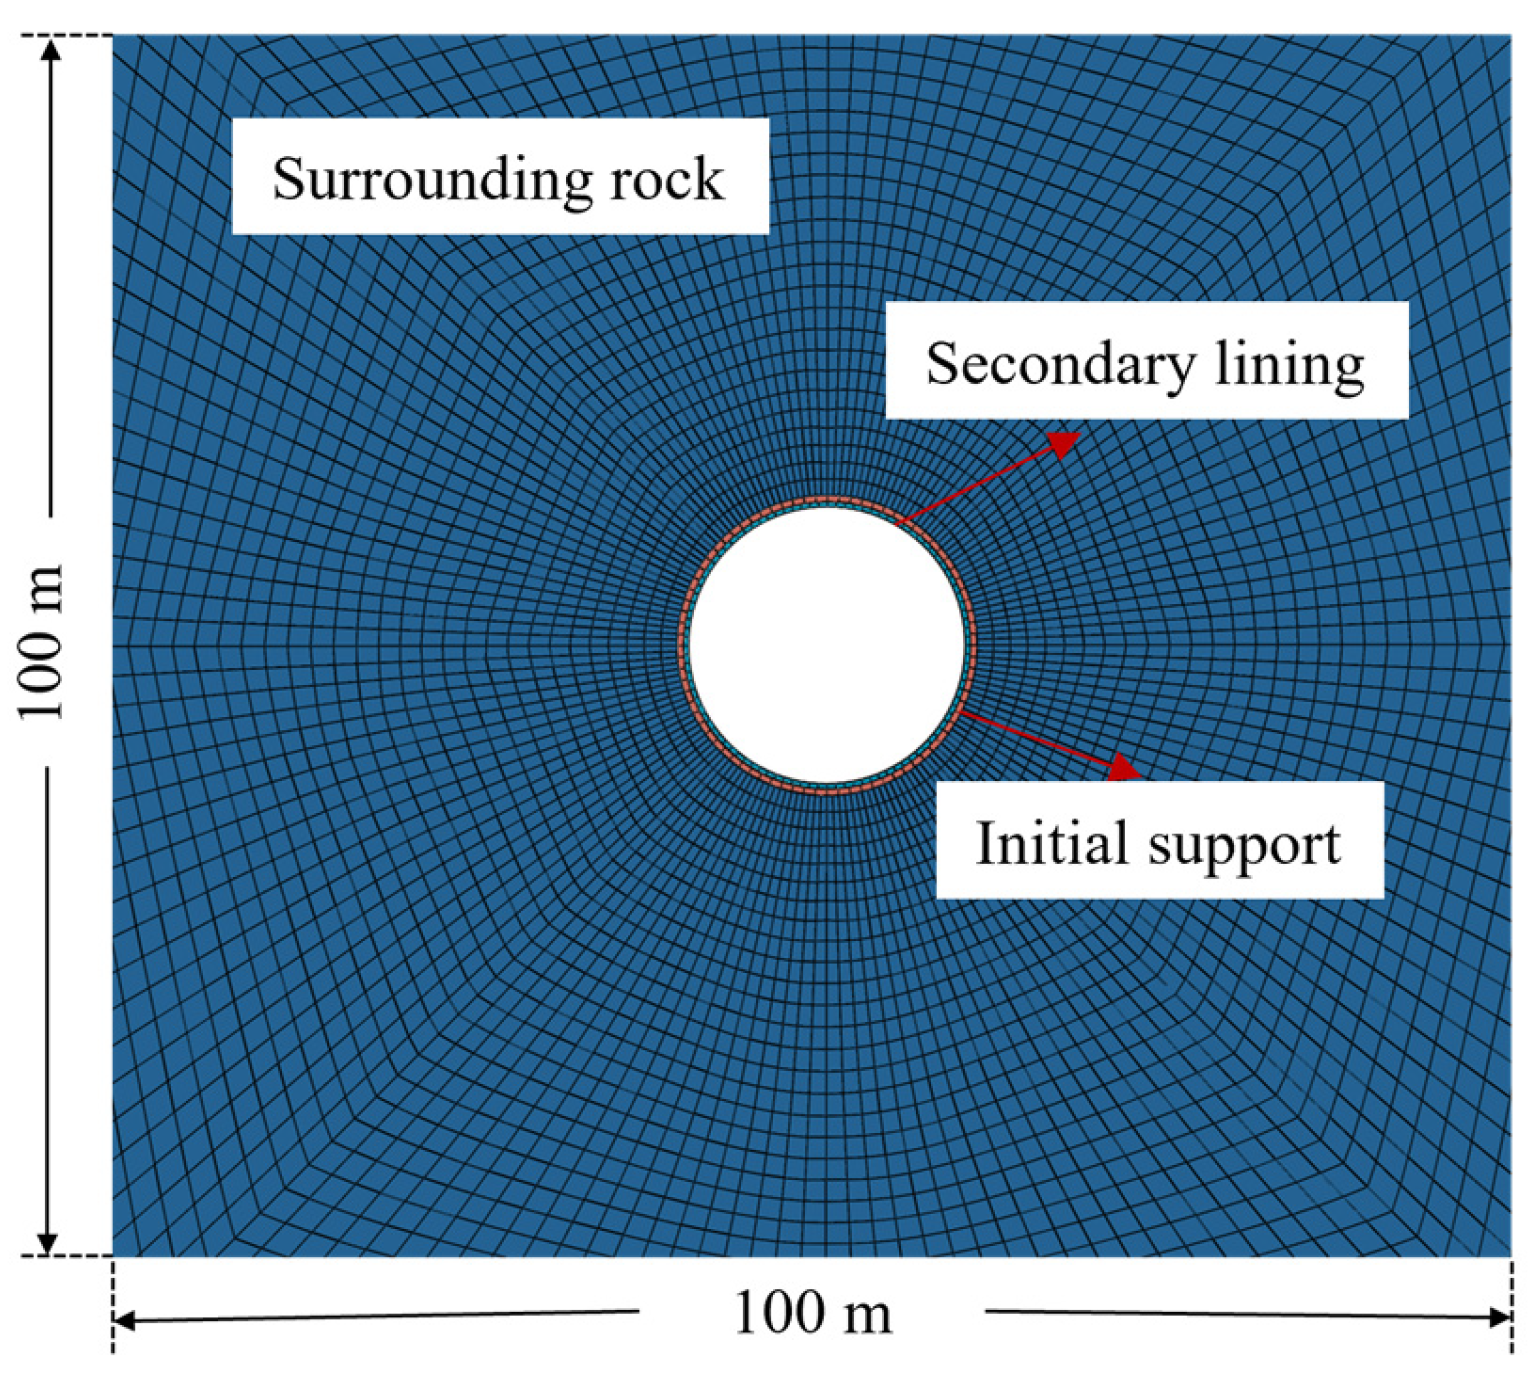
The analytical solution developed in this study is compared with the numerical results obtained using the Burgers model embedded in FLAC 3D (Ver. 6.0). In the numerical model, the degradation and damage of the secondary lining are represented by a reduction in its elastic modulus, while both the initial support and secondary lining are modeled as elastic models. In addition, the surrounding rock is modeled using the Burgers model embedded in FLAC 3D to capture the rheological behavior. As illustrated in Figure 4, a plane strain model with dimensions of 10R1 × 10R1 is established. Hydrostatic pressure p0 is applied along the upper and lateral boundaries, and the base of the model is fixed. Prior to excavation, the initial geostress is brought to equilibrium. The tunnel excavation is simulated as a full-face excavation, followed by the installation of the initial support and secondary lining according to the time defined in the previous section. The degradation of the secondary lining is achieved by programming the FISH built-in FLAC 3D, and the corresponding degradation rate is determined based on the previous section. The creep analysis is conducted using a constant time step of 1 × 10⁻³ d−1.
Figure 4.
Numerical simulation model.
In addition, both the initial support and the secondary lining are assumed to be perfectly bonded to the surrounding rock, without considering interface slip or separation. The material parameters used in the numerical model are listed in Table 1.
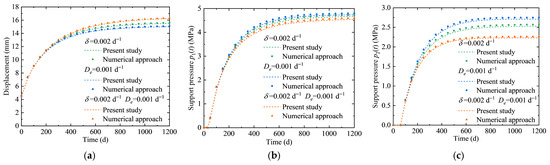
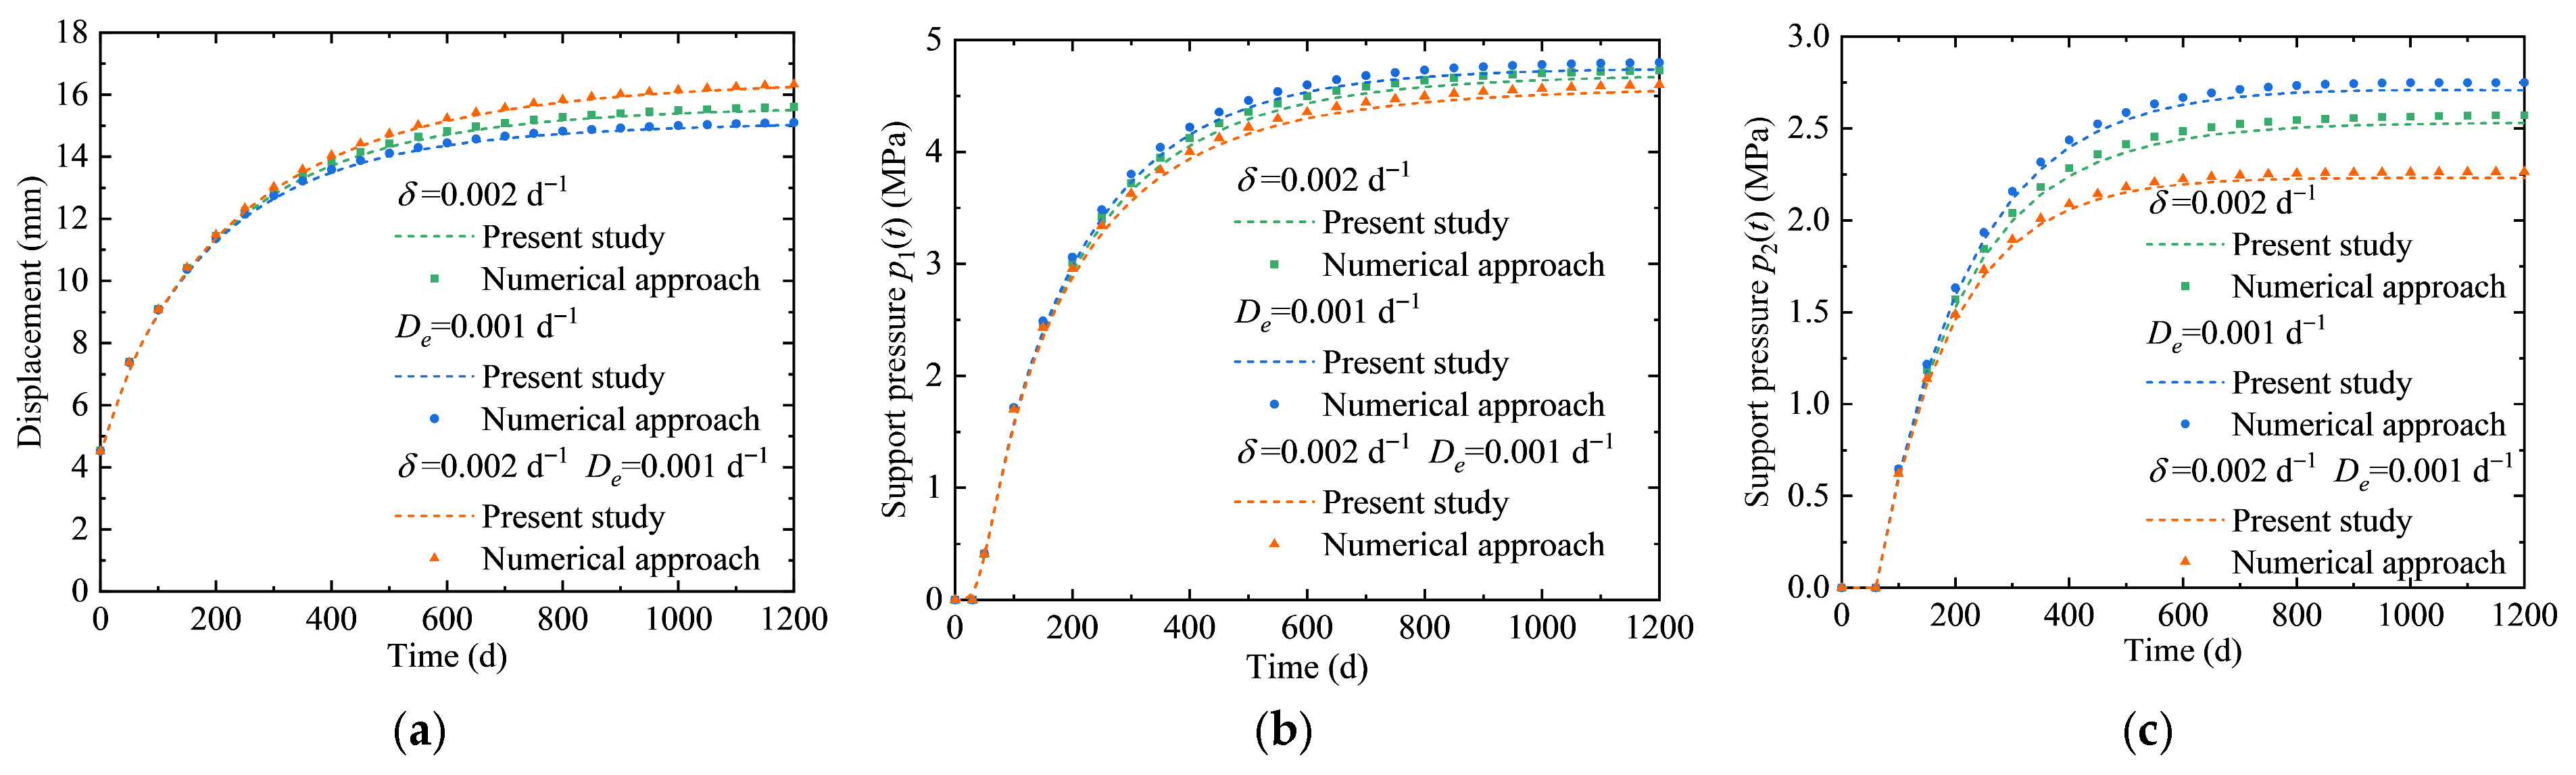
The comparison between the proposed analytical solution and the numerical simulation results is presented in Figure 5. Three working conditions are examined, including degradation of the secondary lining only, damage of the secondary lining only, and the combined occurrence of degradation and damage. All three working conditions demonstrate that the proposed analytical solution exhibits a high level of accuracy. To quantify the accuracy of the results, the maximum relative errors between the proposed analytical solution and numerical results under different working conditions are summarized in Table 2. It can be observed that the maximum relative error is 4.98%, indicating that the proposed analytical solution shows good consistency with the numerical results. Both the degradation coefficient and damage coefficient exert significant influence on both the surrounding rock displacement and the mechanical response of the lining. Consequently, the effects of degradation and damage in the secondary lining exert a considerable impact on the tunnel and should be given due consideration in tunnel safety assessments.
Figure 5.
Comparison between present solution and numerical simulation results. (a) Surrounding rock displacement. (b) Support pressure of initial support. (c) Support pressure of secondary lining.
Table 2.
Maximum relative errors between present solution and numerical simulation results.
4. Parametric Study of the Analytical Solution
To clarify the influence mechanisms of key parameters on the time-dependent mechanical response of soft rock tunnels with high geostress, to elucidate the underlying relationships between these parameters and the mechanical behavior of the tunnel structure, and to identify sensitive parameters for subsequent time-dependent reliability analysis, a parametric sensitivity study of the analytical solution is conducted. The parameters considered in this study include the secondary lining degradation coefficient and damage coefficient, the rheological parameters of the Burgers model, and support design parameters such as support thickness and installation timing, all of which significantly influence the mechanical response of tunnels. The baseline values of all parameters are adopted from those used in the analytical solution validation section presented earlier.
4.1. Effects of the Degradation and Damage Coefficients of the Secondary Lining on Tunnel Response
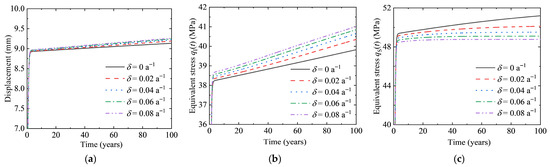
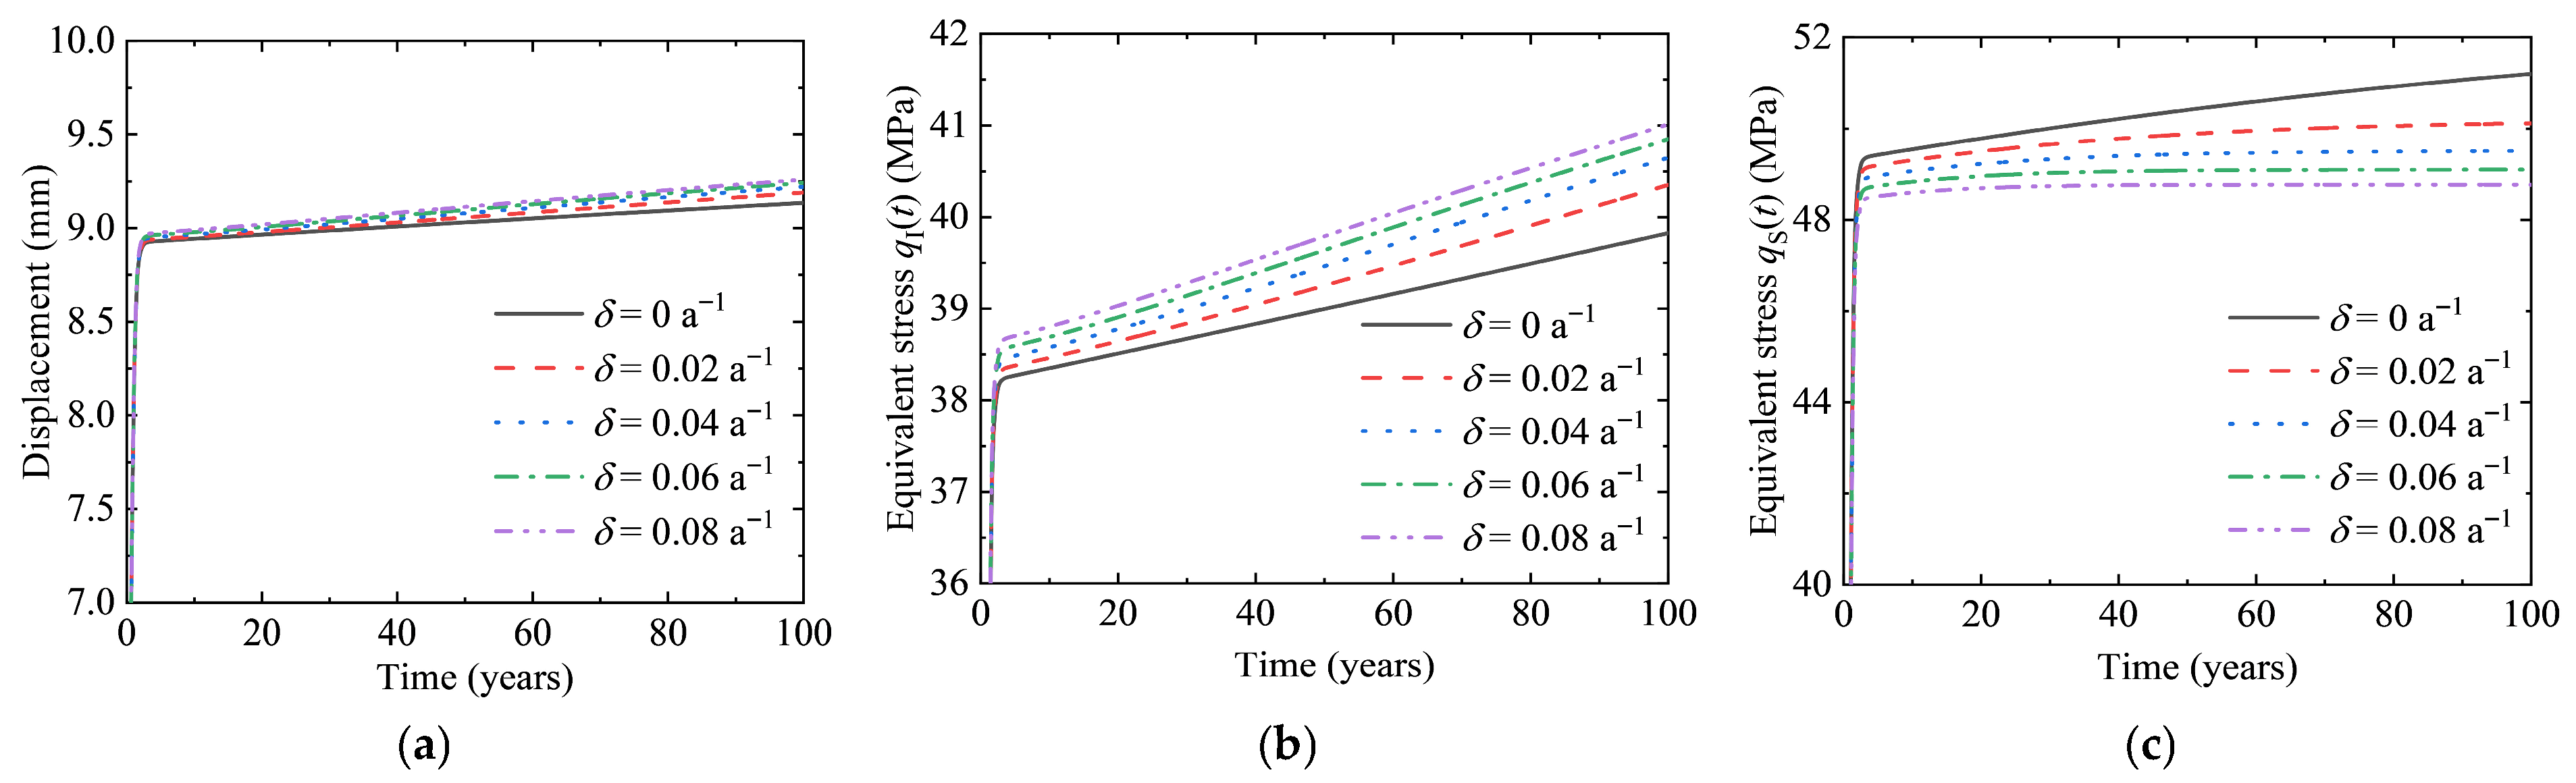
The effects of the secondary lining degradation coefficient on the tunnel response are first investigated. Five representative levels of the degradation coefficient are selected for analysis. Figure 6 illustrates the time-dependent evolution of surrounding rock displacement, as well as the equivalent stresses in the initial support and secondary lining under different degradation coefficients.
Figure 6.
Influence of the degradation coefficient δ on tunnel response. (a) Surrounding rock displacement. (b) Equivalent stress of initial support. (c) Equivalent stress of secondary lining.
The surrounding rock displacement, as well as the equivalent stresses in the initial support and secondary lining, all exhibit a rapid increase stage during the first two years of service, followed by a gradual stabilization phase. For the surrounding rock displacement, a larger degradation coefficient leads to a greater displacement magnitude and a more pronounced cumulative growth effect. At the end of the service period, the displacement under the non-degradation condition stabilizes at 9.14 mm, whereas it increases to 9.26 mm under the maximum degradation coefficient, representing an increase of 1.59%. This behavior is attributed to the degradation of the secondary lining, which results in a reduction in elastic modulus and consequently weakens its restraining effect on the surrounding rock deformation. As a result, the rheological deformation of the surrounding rock continues to develop over time. Moreover, a larger degradation coefficient accelerates stiffness degradation, leading to a more rapid loss of confinement on the surrounding rock.
For the equivalent stress in the initial support, at the end of the service period, the value under the non-degradation condition is 39.83 MPa, whereas it increases to 41.01 MPa under the maximum degradation coefficient, corresponding to a maximum increase of 2.98%. This behavior is attributed to the degradation of the secondary lining, which reduces its load-carrying capacity and causes part of the load originally borne by the secondary lining to be transferred to the initial support. As time progresses, the stiffness of the secondary lining continues to degrade, leading to progressive load transfer and a continuous increase in the stress of the initial support.
For the equivalent stress in the secondary lining, at the end of the service period, the value under the non-degradation condition is 51.20 MPa, whereas it decreases to 48.78 MPa under the maximum degradation coefficient, corresponding to a maximum reduction of 4.74%. This behavior is attributed to the degradation of the secondary lining, which results in a reduction in elastic modulus. Although the deformation of the surrounding rock continues to act, the reduced stiffness limits the ability of the secondary lining to effectively transmit stress, thereby decreasing its load-carrying capacity. Consequently, the equivalent stress decreases with increasing degradation coefficient.
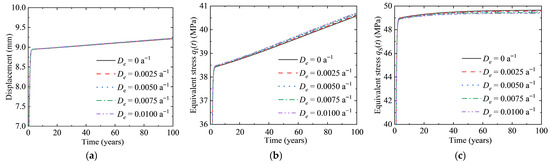
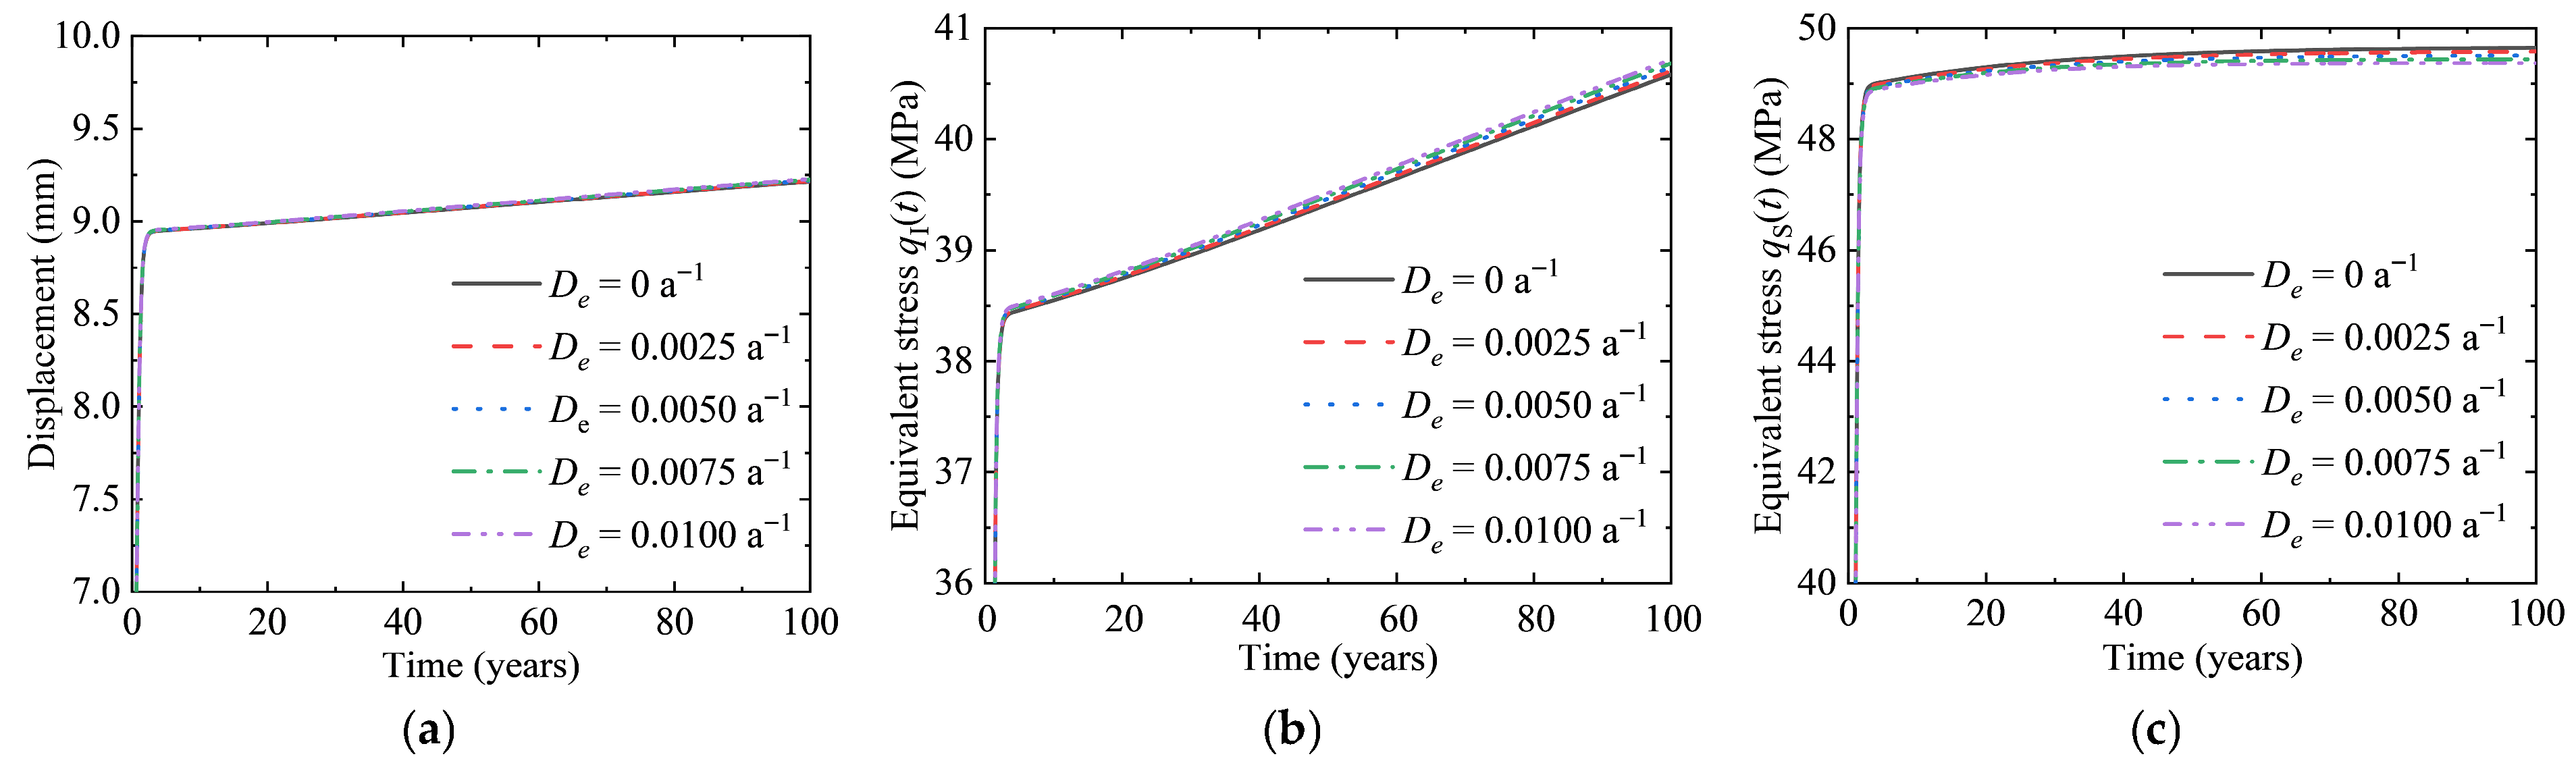
The effects of the secondary lining damage coefficient on the tunnel response are further investigated. Five representative levels of the damage coefficient are selected for analysis. Figure 7 illustrates the time-dependent evolution of surrounding rock displacement, as well as the equivalent stresses in the initial support and secondary lining under different damage coefficients.
Figure 7.
Influence of the damage coefficient De on tunnel response. (a) Surrounding rock displacement. (b) Equivalent stress of initial support. (c) Equivalent stress of secondary lining.
The surrounding rock displacement, as well as the equivalent stresses in the initial support and secondary lining, exhibit overall variation patterns similar to those induced by the degradation coefficient. However, the magnitude of the effect is significantly smaller.
For the surrounding rock displacement, at the end of the service period, the value under the non-damage condition stabilizes at 9.21 mm, whereas it increases to 9.23 mm under the maximum damage coefficient, corresponding to an increase of 0.22%, which is smaller than that caused by degradation. This behavior is attributed to the fact that the damage coefficient reflects the accumulation of fatigue damage in the secondary lining under dynamic loading. Such damage is primarily characterized by the gradual propagation of microcracks, resulting in a relatively slow reduction in stiffness. For the equivalent stress in the initial support, the value at the end of the service period is 40.58 MPa under the non-damage condition and increases to 40.72 MPa under the maximum damage coefficient, representing an increase of 0.33%. For the equivalent stress in the secondary lining, the value decreases from 49.65 MPa under the non-damage condition to 49.37 MPa under the maximum damage coefficient, corresponding to a reduction of 0.56%, which is notably smaller than the 4.74% reduction induced by degradation.
4.2. Effects of Burgers Model Parameters on Tunnel Response
The effects of Burgers model parameters on the tunnel response are subsequently investigated. The Burgers model consists of four parameters. In this analysis, the degradation coefficient and damage coefficient of the secondary lining are fixed at δ = 0.04 a−1 and De = 0.005 a−1, respectively.
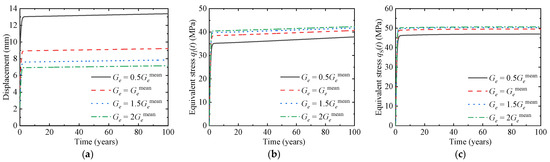
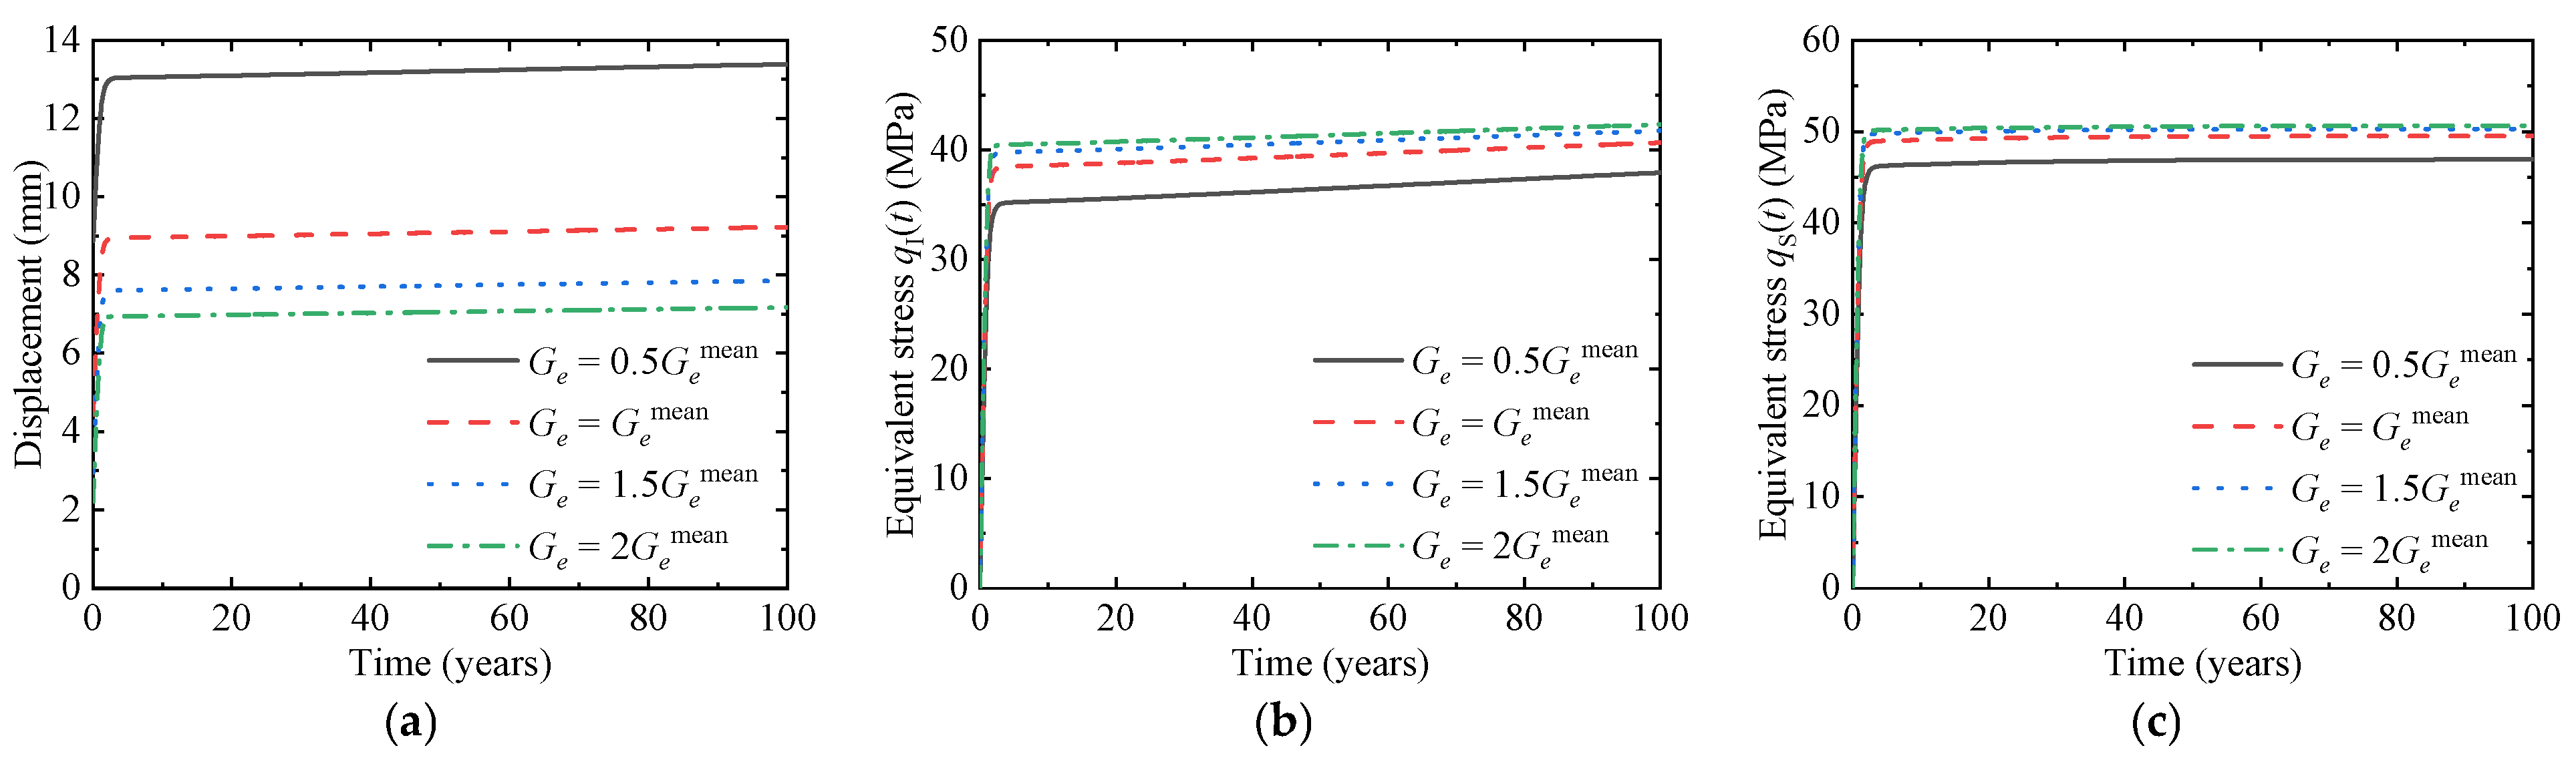
The effects of the parameter Ge in the Burgers model on the tunnel response are first investigated. Four representative values of Ge are selected for analysis. Figure 8 illustrates the time-dependent evolution of surrounding rock displacement, as well as the equivalent stresses in the initial support and secondary lining under different values of Ge.
Figure 8.
Influence of the Ge on tunnel response. (a) Surrounding rock displacement. (b) Equivalent stress of initial support. (c) Equivalent stress of secondary lining.
The surrounding rock displacement, as well as the equivalent stresses in the initial support and secondary lining, exhibit an overall trend characterized by a rapid increase stage followed by gradual stabilization with increasing service time. In the early stage, the rapid growth of the tunnel response is primarily attributed to the quick release of elastic deformation induced by excavation unloading. For the surrounding rock displacement, as time progresses, the elastic deformation is gradually exhausted, and the deformation becomes dominated by rheological behavior, resulting in a progressively reduced growth rate and eventual stabilization. The displacement corresponding to the smallest value of Ge is 86.75% larger than that corresponding to the largest Ge. This behavior is attributed to the fact that Ge directly governs the resistance of the surrounding rock to elastic deformation. A smaller Ge leads to a more complete release of elastic deformation after excavation, thereby resulting in a larger initial magnitude of rheological deformation. Consequently, the cumulative deformation over the long term becomes more pronounced.
For the equivalent stress in the initial support, a decrease in Ge leads to a higher final stress level. At the end of the service period, the stress corresponding to the smallest Ge is 11.55% higher than that corresponding to the largest Ge. This behavior is attributed to the fact that a smaller Ge results in more pronounced deformation of the surrounding rock, thereby inducing stronger compressive loading on the initial support.
For the equivalent stress in the secondary lining, a decrease in Ge leads to an increase in stress, with a more pronounced effect than that observed in the initial support. At the end of the service period, the stress corresponding to the smallest Ge is 7.82% higher than that corresponding to the largest Ge. The reason for this is that a smaller Ge results in greater deformation of the surrounding rock. Under such conditions, the initial support alone becomes insufficient to provide adequate confinement, thereby requiring the secondary lining to carry a greater portion of the load, which leads to an increase in its stress.
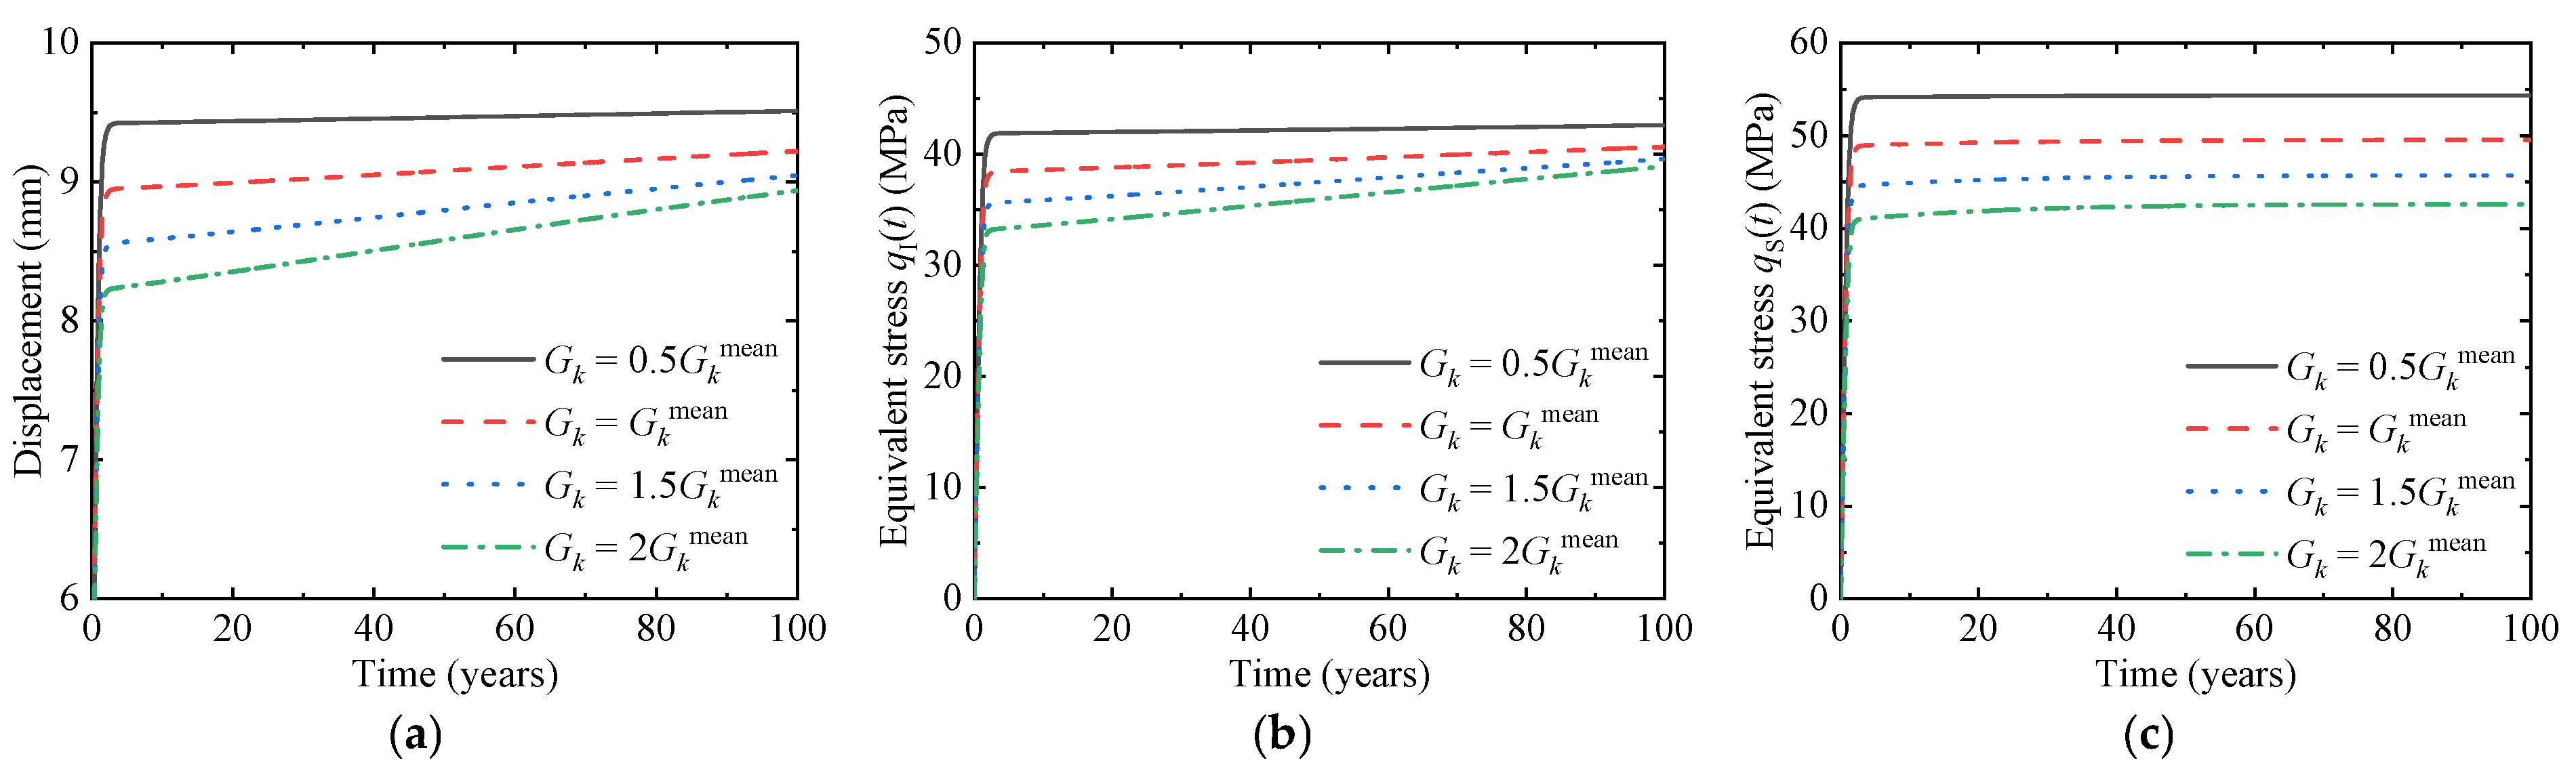
The effects of the parameter Gk in the Burgers model on the tunnel response are subsequently investigated. Four representative values of Gk are selected for analysis. Figure 9 illustrates the time-dependent evolution of surrounding rock displacement, as well as the equivalent stresses in the initial support and secondary lining under different values of Gk.
Figure 9.
Influence of the Gk on tunnel response. (a) Surrounding rock displacement. (b) Equivalent stress of initial support. (c) Equivalent stress of secondary lining.
The effects of Gk on the surrounding rock displacement, as well as the equivalent stresses in the initial support and secondary lining, are consistent with those of Ge, exhibiting an overall trend characterized by a rapid increase followed by gradual stabilization with increasing service time. For the surrounding rock displacement, a decrease in Gk leads to a larger final displacement magnitude. At the end of the service period, the displacement corresponding to the smallest Gk is 6.38% higher than that corresponding to the largest Gk. This behavior is attributed to the fact that Gk characterizes the resistance of the surrounding rock to viscoelastic deformation. A smaller Gk facilitates the development of viscoelastic deformation under long-term loading, ultimately resulting in a greater cumulative displacement.
For the equivalent stress in the initial support, a decrease in Gk leads to a higher final equivalent stress. At the end of the service period, the stress corresponding to the smallest Gk is 9.57% higher than that corresponding to the largest Gk. This is attributed to the fact that a smaller Gk results in more pronounced rheological deformation of the surrounding rock, thereby inducing a stronger long-term compressive effect on the initial support.
For the equivalent stress in the secondary lining, the stress increases as Gk decreases, and this effect is more pronounced than that observed in the initial support. At the end of the service period, the stress corresponding to the smallest Gk is 27.58% higher than that corresponding to the largest Gk. This behavior is attributed to the fact that a smaller Gk results in greater long-term rheological deformation of the surrounding rock. Under such conditions, the initial support alone becomes insufficient to effectively constrain the deformation, thereby requiring the secondary lining to carry a greater portion of the load, which leads to an increase in its internal stress.
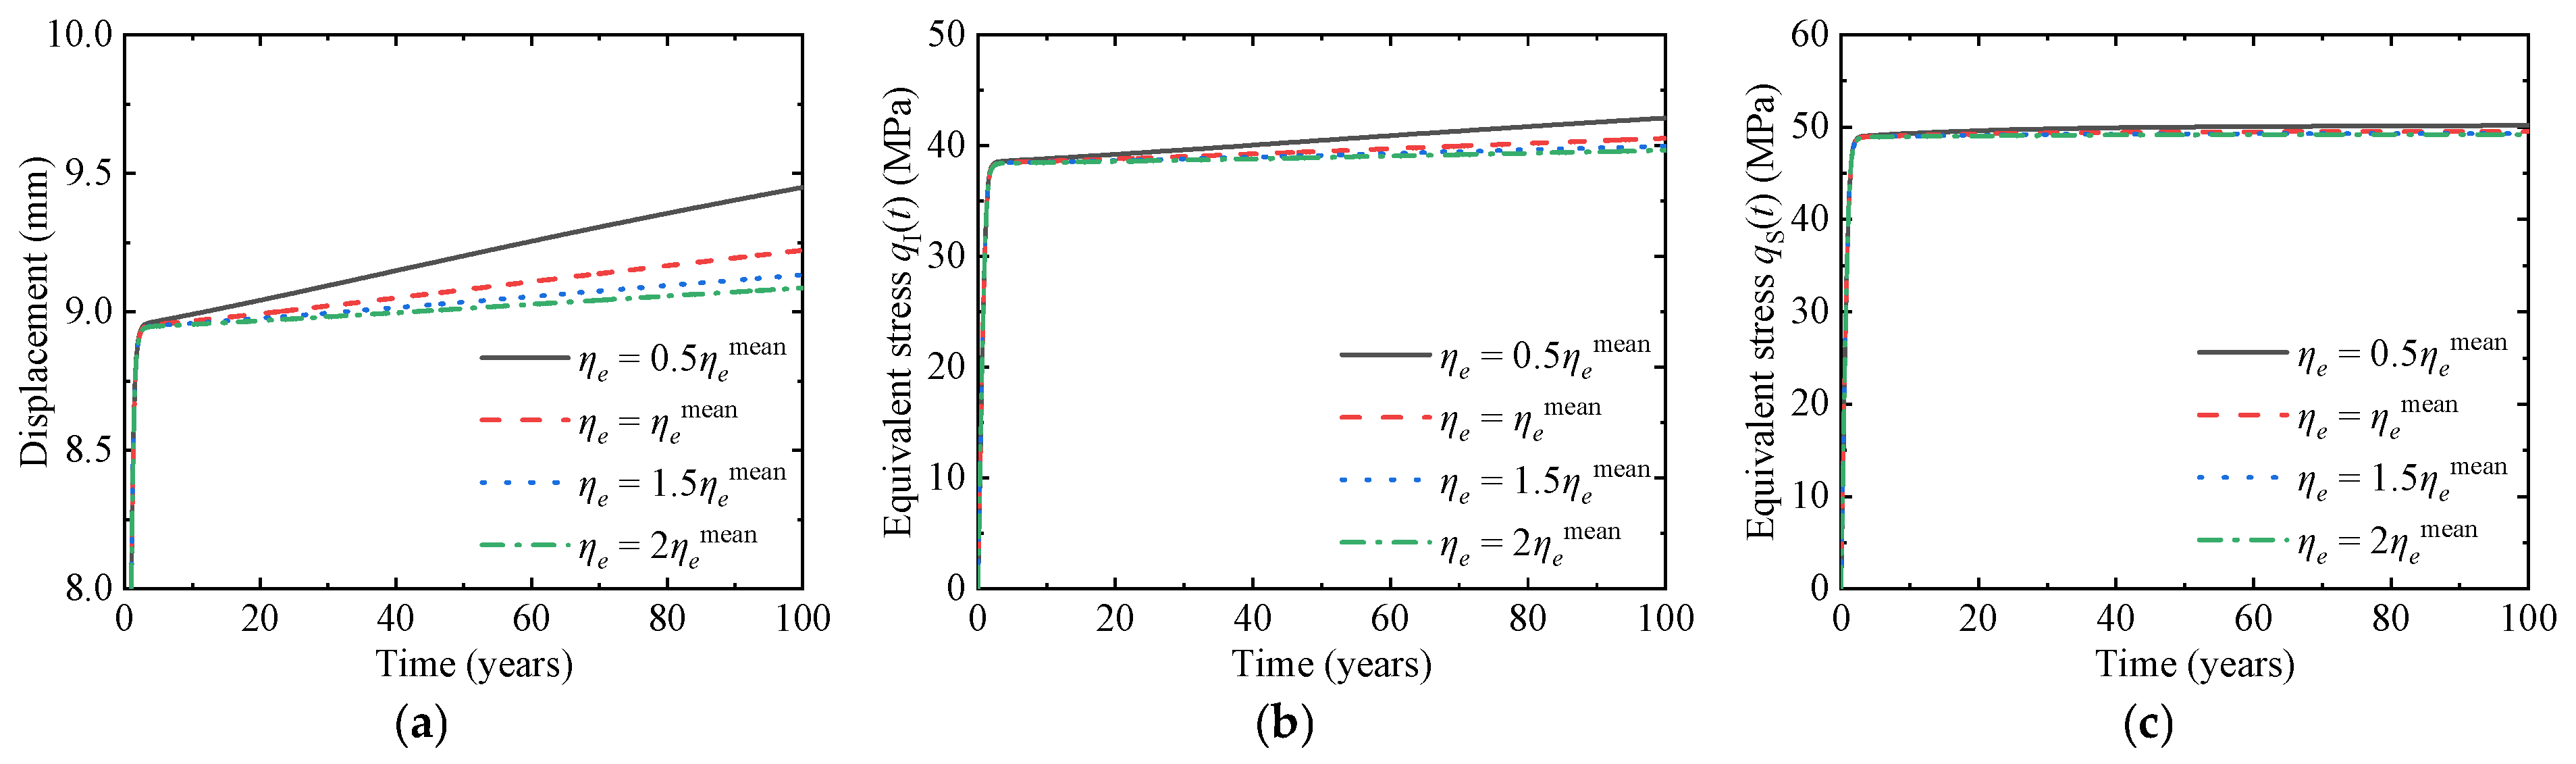
Then, the influence of ηe in the Burgers model on the tunnel response is analyzed and studied. Four different levels of ηe are selected for analysis. Figure 10 gives the variation laws with time of surrounding rock displacement, the equivalent stress of the initial support and the secondary lining under different ηe.
Figure 10.
Influence of the ηe on tunnel response. (a) Surrounding rock displacement. (b) Equivalent stress of initial support. (c) Equivalent stress of secondary lining.
The variation trends of surrounding rock displacement and equivalent stresses are consistent with those observed for the aforementioned parameters. Specifically, a decrease in ηe leads to larger surrounding rock displacement and higher stresses in the supporting structure. At the end of the service period, the displacement corresponding to the smallest ηe is 3.96% higher than that corresponding to the largest ηe. This behavior is attributed to the fact that ηe characterizes the resistance of the surrounding rock to viscous deformation. A smaller ηe facilitates the development of viscous deformation, resulting in greater long-term cumulative deformation.
The equivalent stress in the initial support increases as ηe decreases. At the end of the service period, the stress corresponding to the smallest ηe is 7.43% higher than that corresponding to the largest ηe. Similarly, the equivalent stress in the secondary lining also shows a slight increase with decreasing ηe. At the end of the service period, the increase is only 1.95%. This is because a smaller ηe leads to greater rheological deformation of the surrounding rock, rendering the initial support insufficient to fully constrain the deformation and requiring the secondary lining to carry a greater portion of the load.
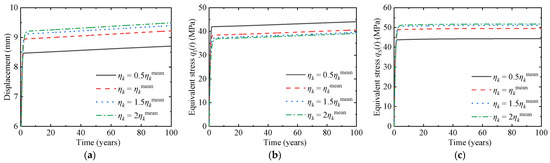
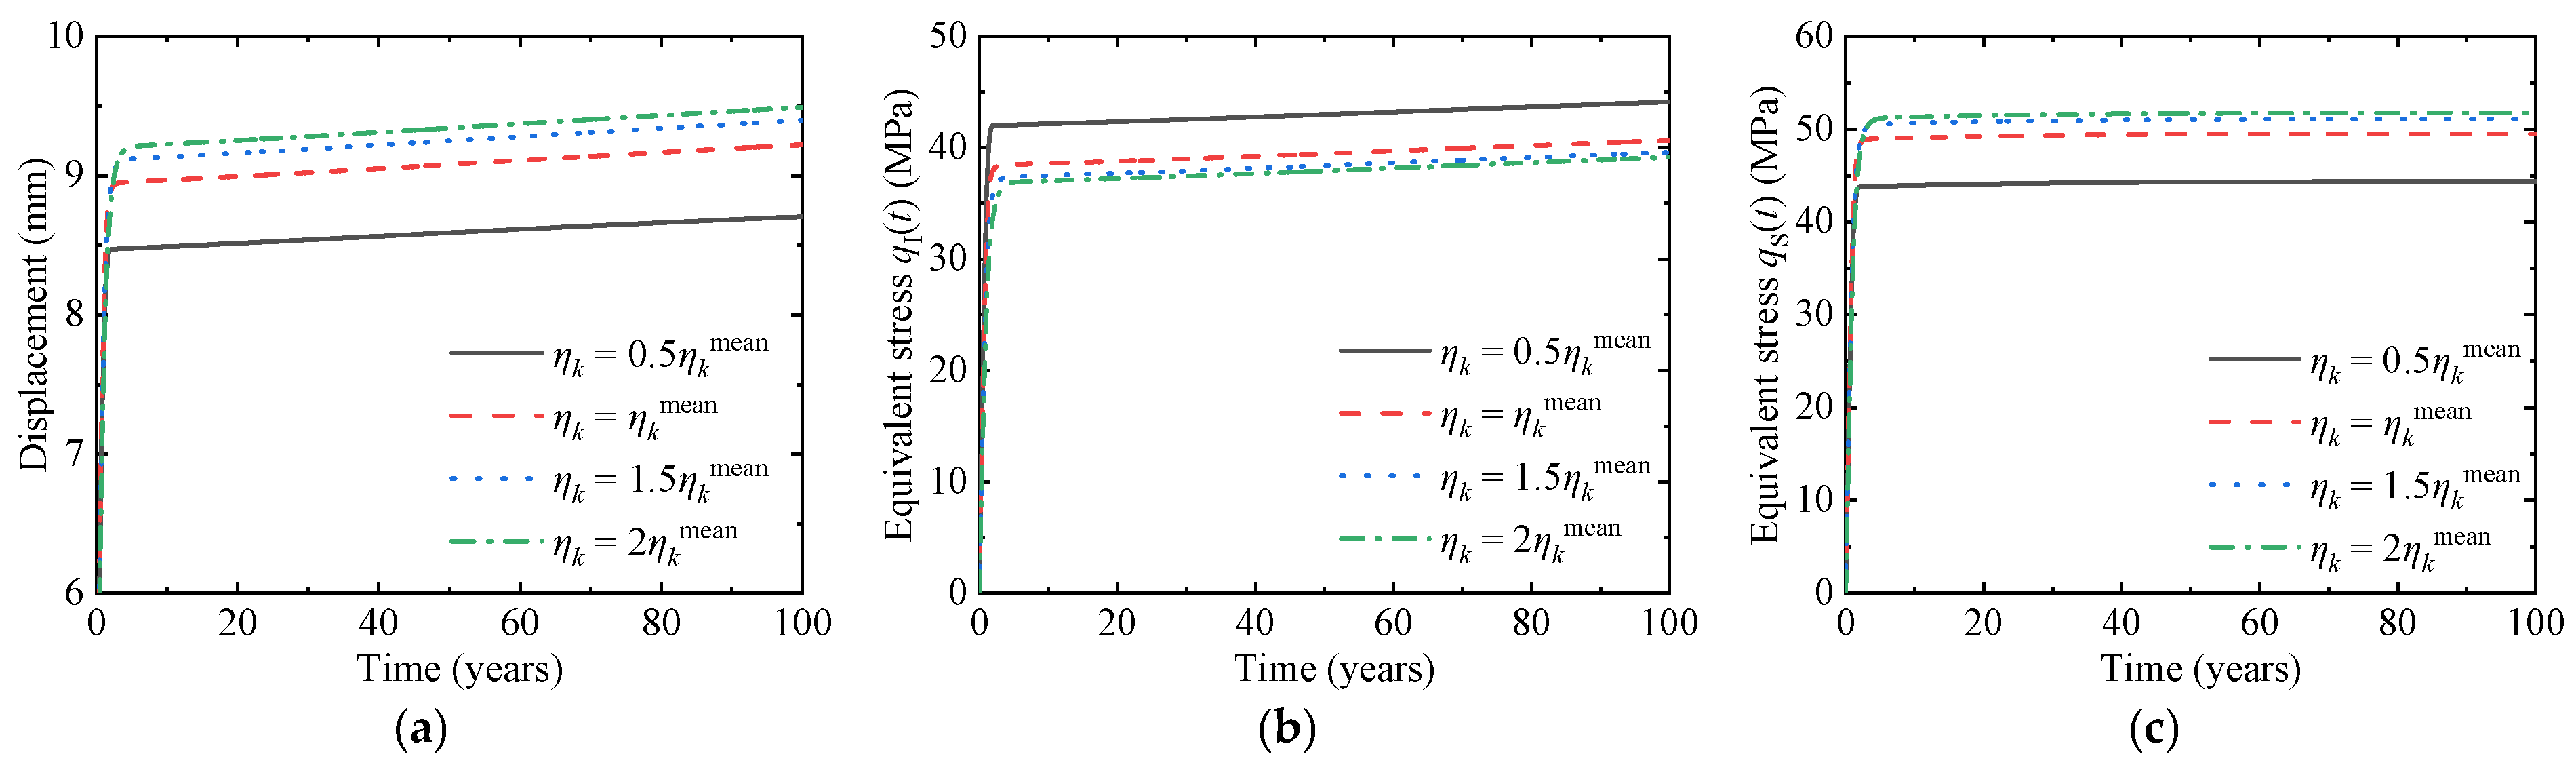
Finally, the effects of the parameter ηk in the Burgers model on the tunnel mechanical response are investigated. Four representative values of ηk are selected for analysis. Figure 11 illustrates the time-dependent evolution of surrounding rock displacement, as well as the equivalent stresses in the initial support and secondary lining under different values of ηk.
Figure 11.
Influence of the ηk on tunnel response. (a) Surrounding rock displacement. (b) Equivalent stress of initial support. (c) Equivalent stress of secondary lining.
The variation trends of surrounding rock displacement and equivalent stresses with respect to ηk differ from those associated with the other Burgers model parameters. As ηk increases, the surrounding rock displacement shows an overall increasing trend, the equivalent stress in the initial support gradually decreases, and the equivalent stress in the secondary lining continuously increases. This behavior is attributed to the fact that ηk primarily governs the transient creep stage. The transient creep deformation of the surrounding rock increases with increasing ηk, whereas the long-term creep rate remains largely unaffected. As transient deformation accumulates, the initial support installed at an early stage provides limited confinement under the increased deformation, resulting in a reduction in its equivalent stress. In contrast, the secondary lining, which is installed later, is subjected to progressively larger loads transferred from the surrounding rock, leading to a continuous increase in its equivalent stress.
Among the four parameters, Ge, Gk, and ηe govern the deformation resistance of the surrounding rock. A decrease in these parameters leads to increased surrounding rock displacement and higher equivalent stresses in the supporting structure, with a more pronounced effect on the initial support. In contrast, an increase in ηk results in more pronounced late-stage rheological deformation of the surrounding rock and consequently larger displacements. It reduces the equivalent stress in the initial support while significantly increasing that in the secondary lining. This behavior alters the load distribution within the supporting system, making ηk a key parameter that warrants particular attention during the late-stage rheological phase of tunnels.
4.3. Effects of Supporting Structure Parameters on Tunnel Response
Finally, the effects of supporting parameters on the time-dependent response of the tunnel are investigated. The installation timing and thickness of the tunnel lining are critical design parameters, which govern the development of surrounding rock rheological deformation and the load distribution between the initial support and secondary lining from the perspectives of structural stiffness and construction sequence, thereby significantly affecting the long-term stability of the tunnel. Subsequently, the influences of supporting parameters on surrounding rock displacement, as well as the equivalent stresses in the initial support and secondary lining, are analyzed to reveal the response characteristics of the tunnel under different supporting conditions.
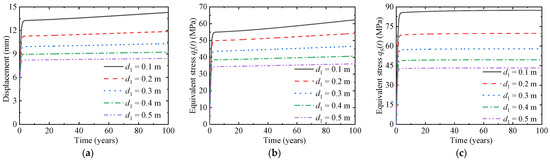
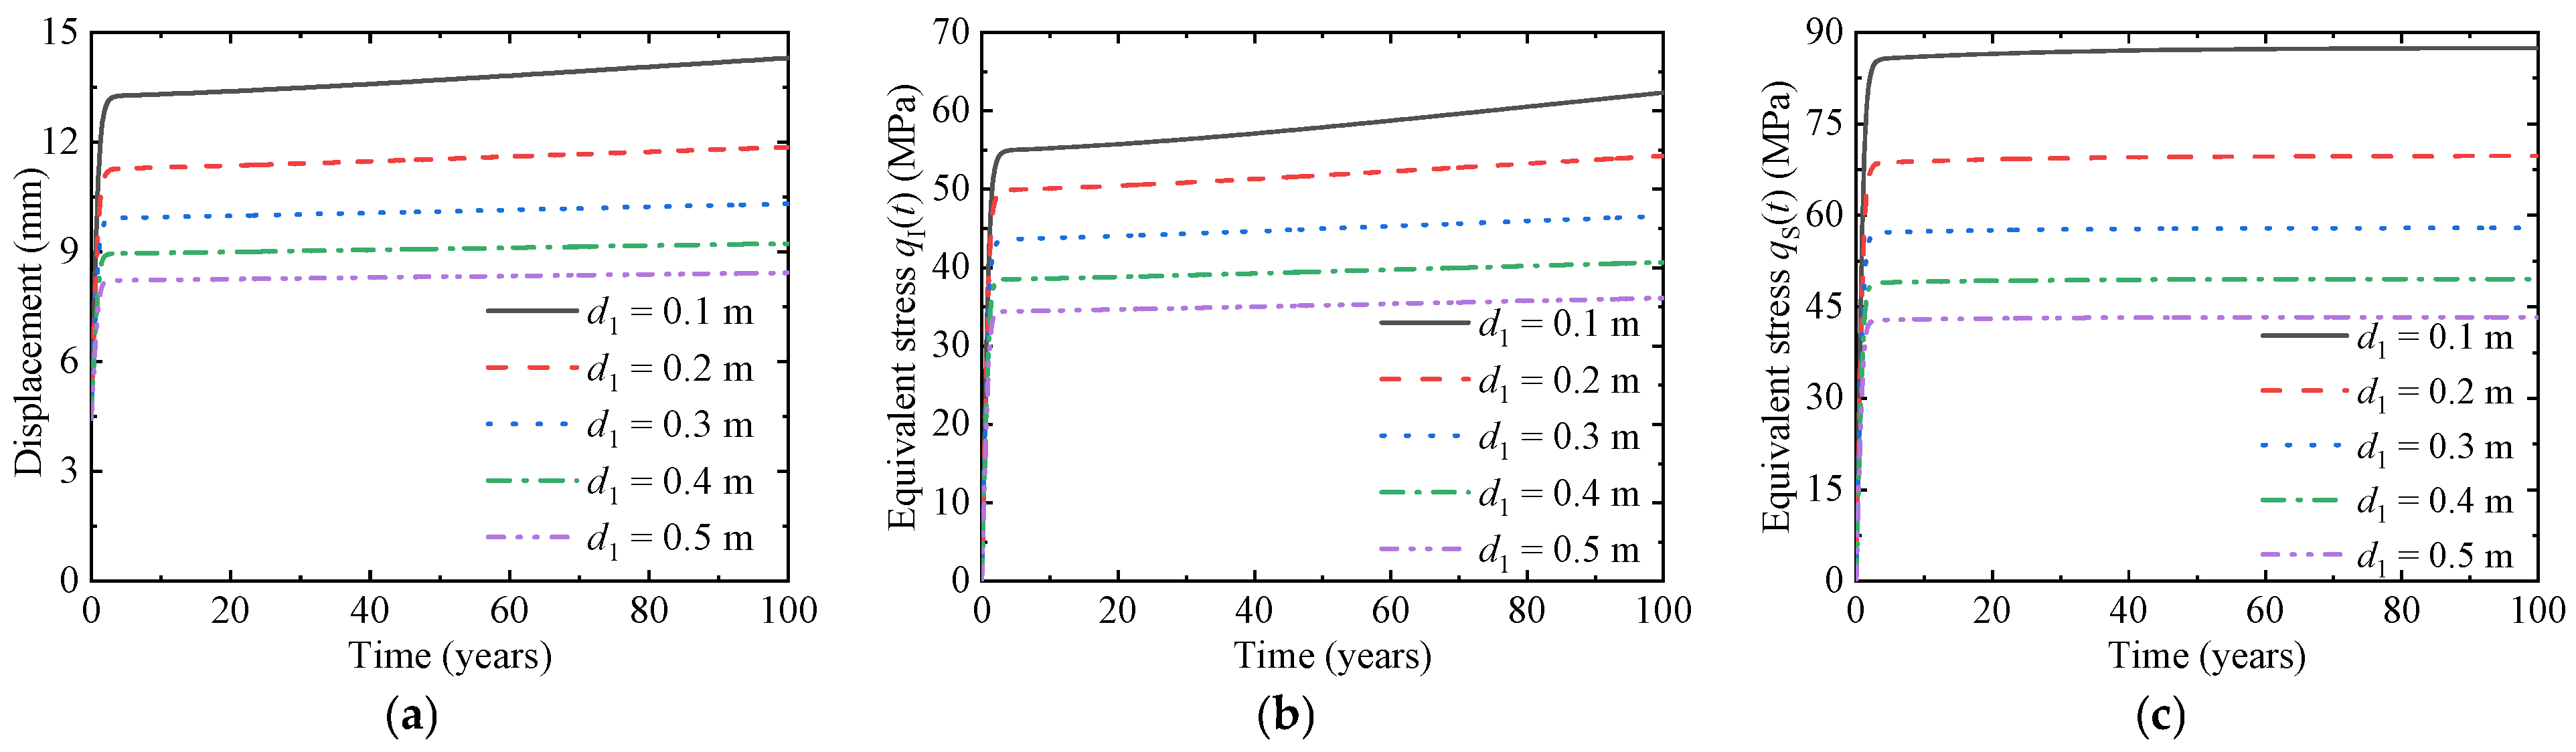
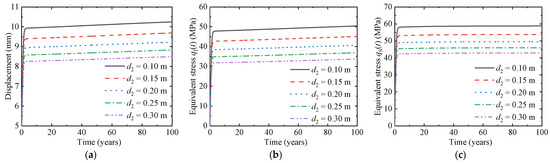
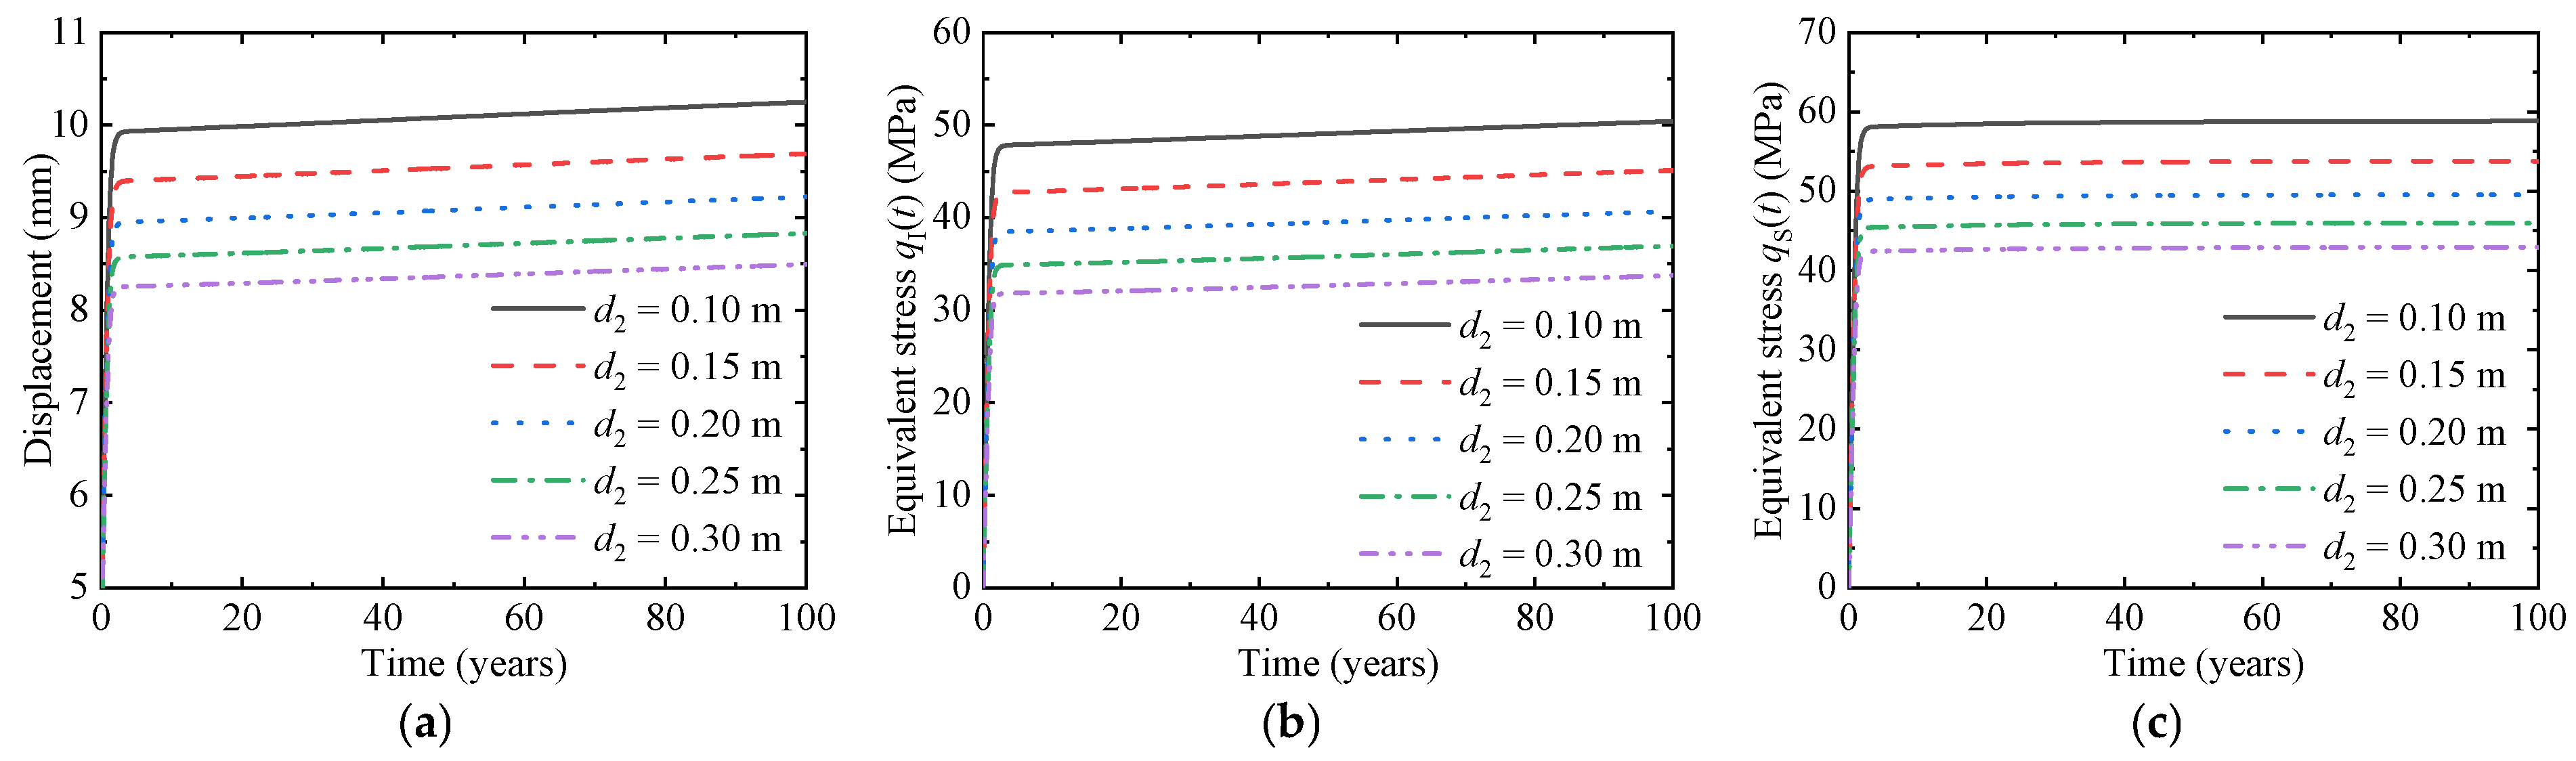
Figure 12 and Figure 13 indicate that the thicknesses of the initial support and secondary lining exhibit similar effects on surrounding rock displacement and the equivalent stresses in the lining. Increasing the thickness of both the initial support and secondary lining effectively reduces the surrounding rock displacement and promotes earlier stabilization of deformation. At the end of the service period, as the thickness of the initial support increases from 0.1 m to 0.5 m, the surrounding rock displacement decreases from 14.30 mm to 8.42 mm, corresponding to a reduction of 41.1%. Similarly, when the thickness of the secondary lining increases from 0.1 m to 0.3 m, the displacement decreases from 10.25 mm to 8.49 mm, representing a reduction of 17.2%. These results indicate that increasing the stiffness of the supporting structure can significantly mitigate the impact of surrounding rock creep on the tunnel.
Figure 12.
Influence of the thickness of initial support d1 on tunnel response. (a) Surrounding rock displacement. (b) Equivalent stress of initial support. (c) Equivalent stress of secondary lining.
Figure 13.
Influence of the thickness of secondary lining d2 on tunnel response. (a) Surrounding rock displacement. (b) Equivalent stress of initial support. (c) Equivalent stress of secondary lining.
At the same time, the increase in lining thickness significantly reduces the equivalent stress of the supporting structure, because the larger thickness enlarges the load-bearing cross-section of the structure and realizes a more uniform distribution of stress. When the thickness of the initial support increases from 0.1 m to 0.5 m, the equivalent stress of the initial support and the secondary lining decreases by 42.1% and 50.4%, respectively. When the thickness of the secondary lining increases from 0.1 m to 0.3 m, the equivalent stress of the initial support and the secondary lining decreases by 33.1% and 27.1%, respectively. This shows that increasing the thickness of the support can reduce the structural stress by improving the support stiffness and enlarging the support cross-section, thereby significantly enhancing the safety of the support.
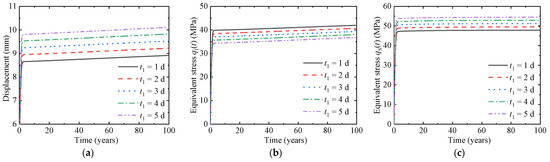
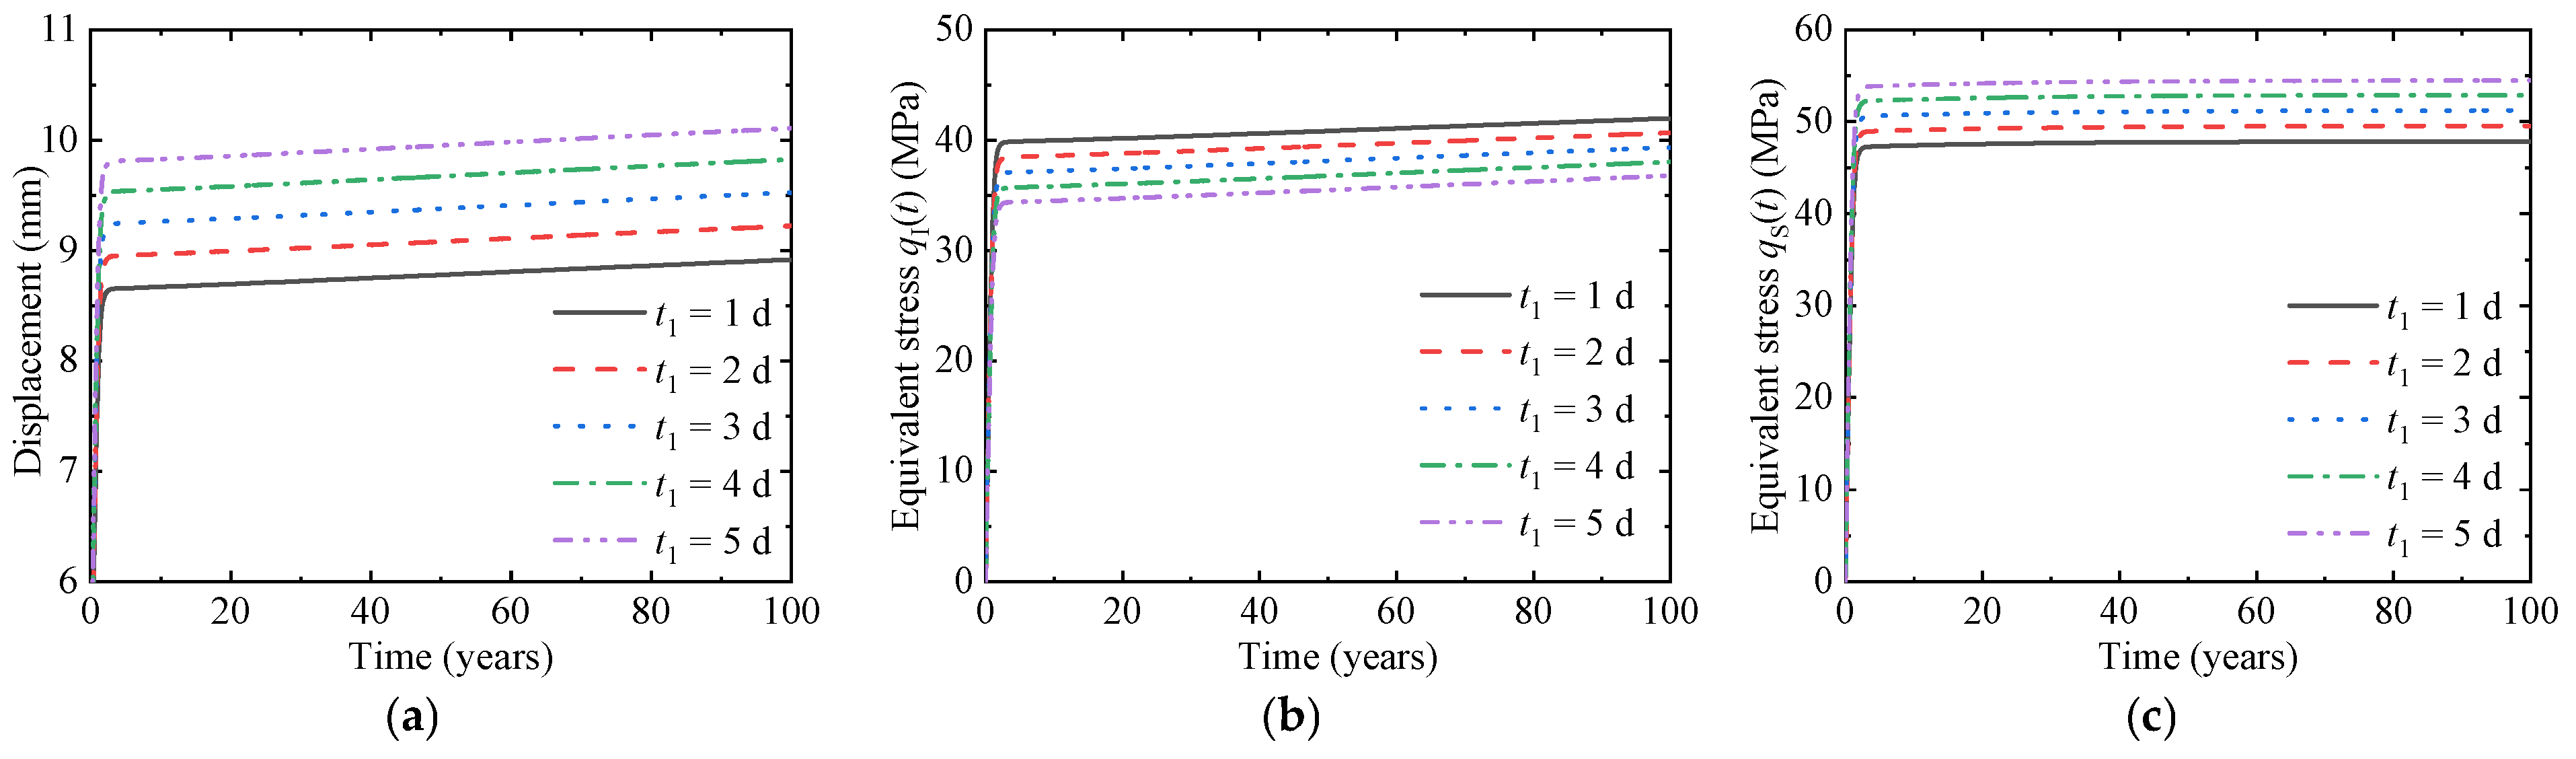
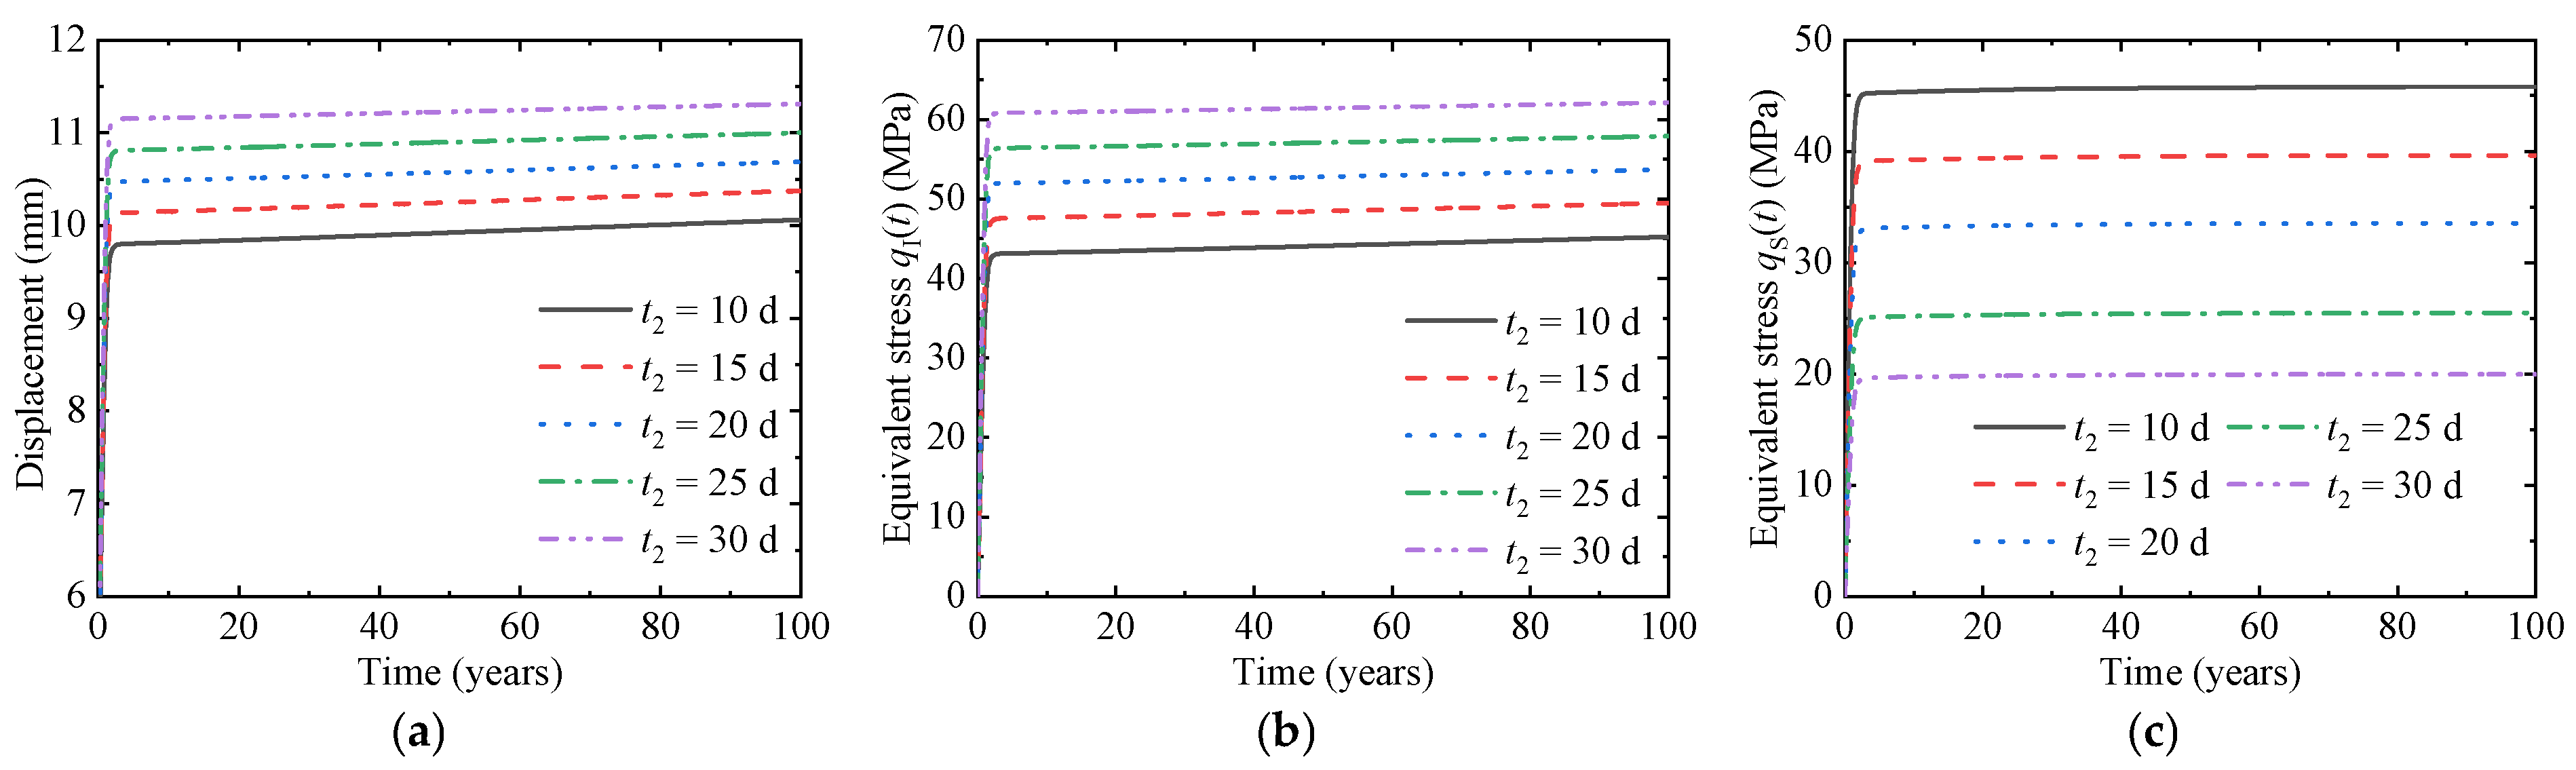
Figure 14 and Figure 15 indicate that the installation timing of the initial support and secondary lining exhibits distinctly different effects on the tunnel response. This difference arises because the installation timing governs both the onset of deformation constraint in the surrounding rock and the load distribution within the supporting system. Delaying the installation of the initial support allows the surrounding rock to undergo early-stage free deformation without confinement. When the installation time is extended from 1 day to 5 days, the surrounding rock displacement increases by 13.3%. Meanwhile, due to the larger initial deformation at the time of installation, the load carried by the initial support decreases, resulting in a reduction of 12.4% in its equivalent stress.
Figure 14.
Influence of the installation time of initial support t1 on tunnel response. (a) Surrounding rock displacement. (b) Equivalent stress of initial support. (c) Equivalent stress of secondary lining.
Figure 15.
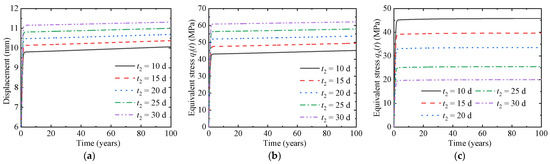
Influence of the installation time of secondary lining t2 on tunnel response. (a) Surrounding rock displacement. (b) Equivalent stress of initial support. (c) Equivalent stress of secondary lining.
When the installation time of the secondary lining is delayed from 10 days to 30 days, the surrounding rock displacement increases by 12.4%. This behavior is attributed to the delayed installation, during which the initial support solely carries the surrounding rock pressure over an extended early-stage period. As a result, the surrounding rock deformation continues to develop due to the absence of secondary confinement, while the initial support experiences a significant increase in stress under sustained loading, with its equivalent stress rising by 37.2%. In contrast, by the time the secondary lining is installed, the surrounding rock deformation has largely stabilized, and the remaining load to be carried is substantially reduced. Consequently, the equivalent stress in the secondary lining decreases by 56.4%.
Based on the above analysis, it can be found that the degradation coefficient and damage coefficient have a relatively small influence on the surrounding rock displacement, the equivalent stress of the initial support and the secondary lining, and thus they are treated as deterministic parameters in the time-dependent reliability analysis. In addition, among the Burgers model parameters, the variation in ηe has a negligible influence on the equivalent stresses in both the initial support and the secondary lining, with a magnitude of only 1.95%, and is also regarded as a deterministic parameter. In contrast, Ge, Gk and ηk have significant effects on the surrounding rock displacement, the equivalent stress of the initial support and the secondary lining, and thus these three parameters are treated as random variables in the time-dependent reliability analysis. Furthermore, among the supporting parameters, d1 and d2 have very significant effects on the tunnel response, and therefore these two parameters are also treated as random variables.
5. Reliability Analysis
In this section, the system limit state function is first established. Subsequently, a time-dependent system reliability analysis considering multiple failure modes is conducted. In addition, a parametric reliability analysis is performed to quantify the effects of key parameters on the time-dependent reliability of the tunnel. The results provide a theoretical basis and practical guidance for tunnel design, construction, and long-term operation and maintenance.
5.1. Determination of Limit State Functions
In tunnel engineering, structural safety is affected by multiple uncertain factors, and the coupling effect of these uncertain factors often leads to different types of failure modes. Therefore, when conducting reliability research on tunnels, especially for time-dependent reliability, it is necessary to comprehensively consider various failure mechanisms that may occur throughout the entire life cycle of the structure, and evaluate the overall reliability of the tunnel from a system level perspective. This subsection will establish limit state functions for the following three failure modes, namely excessive convergence of surrounding rock, insufficient initial support strength, and insufficient secondary lining strength respectively.
5.1.1. Excessive Convergence of Surrounding Rock
After tunnel excavation, the surrounding rock will undergo radial deformation. If this deformation exceeds a certain limit, it will affect the safety of tunnel operation. Assuming this limit is umax, the limit state function of this failure mode can be formulated as follows:
The parameter umax is typically assigned a constant value based on engineering experience. In this study, a value of 0.02R1 is adopted with reference to relevant study [36].
5.1.2. Insufficient Initial Support Strength
For the lining, failure is assumed to occur when the equivalent stress exceeds the allowable stress of the structural constitutive material. Accordingly, for the initial support, the limit state function corresponding to this failure mode is expressed as follows:
where σAlo,I is the allowable stress for the initial support, which is taken as 45 MPa based on a previous study [24].
5.1.3. Insufficient Secondary Lining Strength
Similarly, for the secondary lining, the limit state function corresponding to the strength insufficiency failure mode can be expressed as follows:
where σAlo,S is the allowable stress for the secondary lining, which is taken as 50 MPa based on a previous study [24].
5.1.4. Time-Dependent System Limit State Function
According to the relationships among different structural components, a structural system can generally be classified as a series system, a parallel system, or a series-parallel system [37]. As a critical piece of infrastructure, tunnels may be considered logically equivalent to series systems in practice, since failure in any single mode could potentially lead to structural collapse. With the individual limit state functions defined, the time-dependent system limit state function Gsys(t) for the series system is given as follows:
Inserting Equations (38)–(40) into Equation (41), the system limit state function of the tunnel can be obtained as follows:
5.2. Method of Time-Dependent Reliability Analysis
Usually, the outcrossing rate method is employed to calculate time-dependent reliability index [38]. According to the outcrossing rate theory, the failure of a structure within the time interval [0, t] is interpreted as either occurring at the initial moment or involving at least one outcrossing event during the time interval. Consequently, the cumulative failure probability can be calculated as follow:
where N+(0, t) represents the number of outcrossing within [0, t]. Typically, Pf,sys(0,t) can be approximated using the following formula [39]:
where v+(τ) is the outcrossing rate. Generally speaking, it is extremely difficult to compute the integral of v+(τ) directly. Zhang [40] used the Gauss Legendre method to approximate the integral of v+(τ), which is simple and efficient. Consequently, this paper also adopts this method for computation. Thus, the cumulative failure probability can be approximated as follows:
where τk = t∙ξk/2 + t/2 is the kth estimated instants; ξk and ωk are the kth abscissa and corresponding weight, which are given as ξ = {0, 0.7756, −0.7756} and ω = {0.8889, 0.5556, 0.5556} respectively.
Obtaining v+(τk) is the key to calculating Equation (45). For this critical parameter v+(τk), which is notoriously difficult to compute, the MPHI2 method [39] offers a precise and efficient approach. Within the MPHI2 method, v+(τk) can be calculated as follows:
where Φ2(∙) is the bivariate cumulative normal distribution function; βM(τk) and βM(τk + Δτ) are the time-dependent reliability indices at fixed instants τk and τk + Δτ, which are computed based on Method of Moments (MoM) [41]; and ρGM(τk, τk + Δτ) is the correlation coefficient between Gsys(τk) and Gsys(τk + Δτ) in standard Gaussian space, which is formulated as follows:
where FMTC[∙;∙,∙] is the fourth moment normal transformation function of correlation coefficient [42]; M(τk) = [μG(τk), σG(τk), α3G(τk), α4G(τk)] is the vector of the first four central moments of Gsys(τk); μG(τk), σG(τk), α3G(τk), α4G(τk) denote the mean, standard deviation, skewness and kurtosis of Gsys(τk), respectively; ρG(τk, τk + Δτ)is the linear correlation coefficient between Gsys(τk) and Gsys(τk + Δτ) and is computed as follows:
where E[∙] denotes the expectation operator.
5.3. Time-Dependent Reliability Analysis
This section conducts a time-dependent reliability analysis of the tunnel. In the analysis, the installation times of the linings are taken as t1 = 2 d and t2 = 10 d, while the degradation coefficient and damage coefficient are taken as δ = 0.04 a−1 and De = 0.002 a−1, respectively. Similarly, the values of the other deterministic parameters are adopted as listed in Table 1.
Based on the results presented in previous section, this section focuses on the parameters that have a pronounced influence on the response of the tunnel. These parameters are treated as random variables, and their effects on the reliability associated with different failure modes are investigated. In addition, the geostress p0 also affects tunnel reliability. Therefore, in this study, the geostress is modeled as a stochastic process based on relevant study, and its autocorrelation function is expressed as follows [43]:
where ρ denotes the autocorrelation coefficient; κ is the correlation length, which is taken as 1 month in this study based on relevant research; and Δτ is set to be 0.0059 year based on relevant research [43]. Furthermore, the statistical characteristics of the random variables are shown in Table 3 [24].
Table 3.
Statistical information of random variables.
5.3.1. Time-Dependent Failure Probability of Tunnel
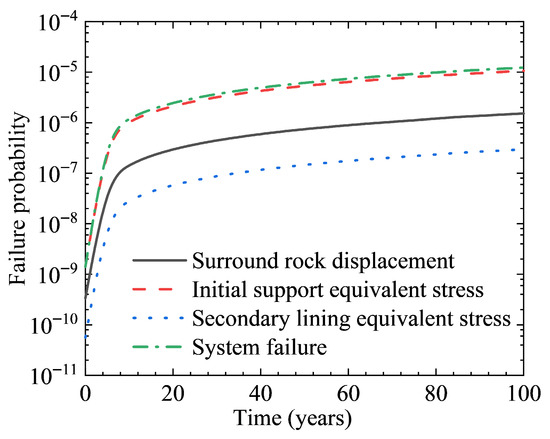
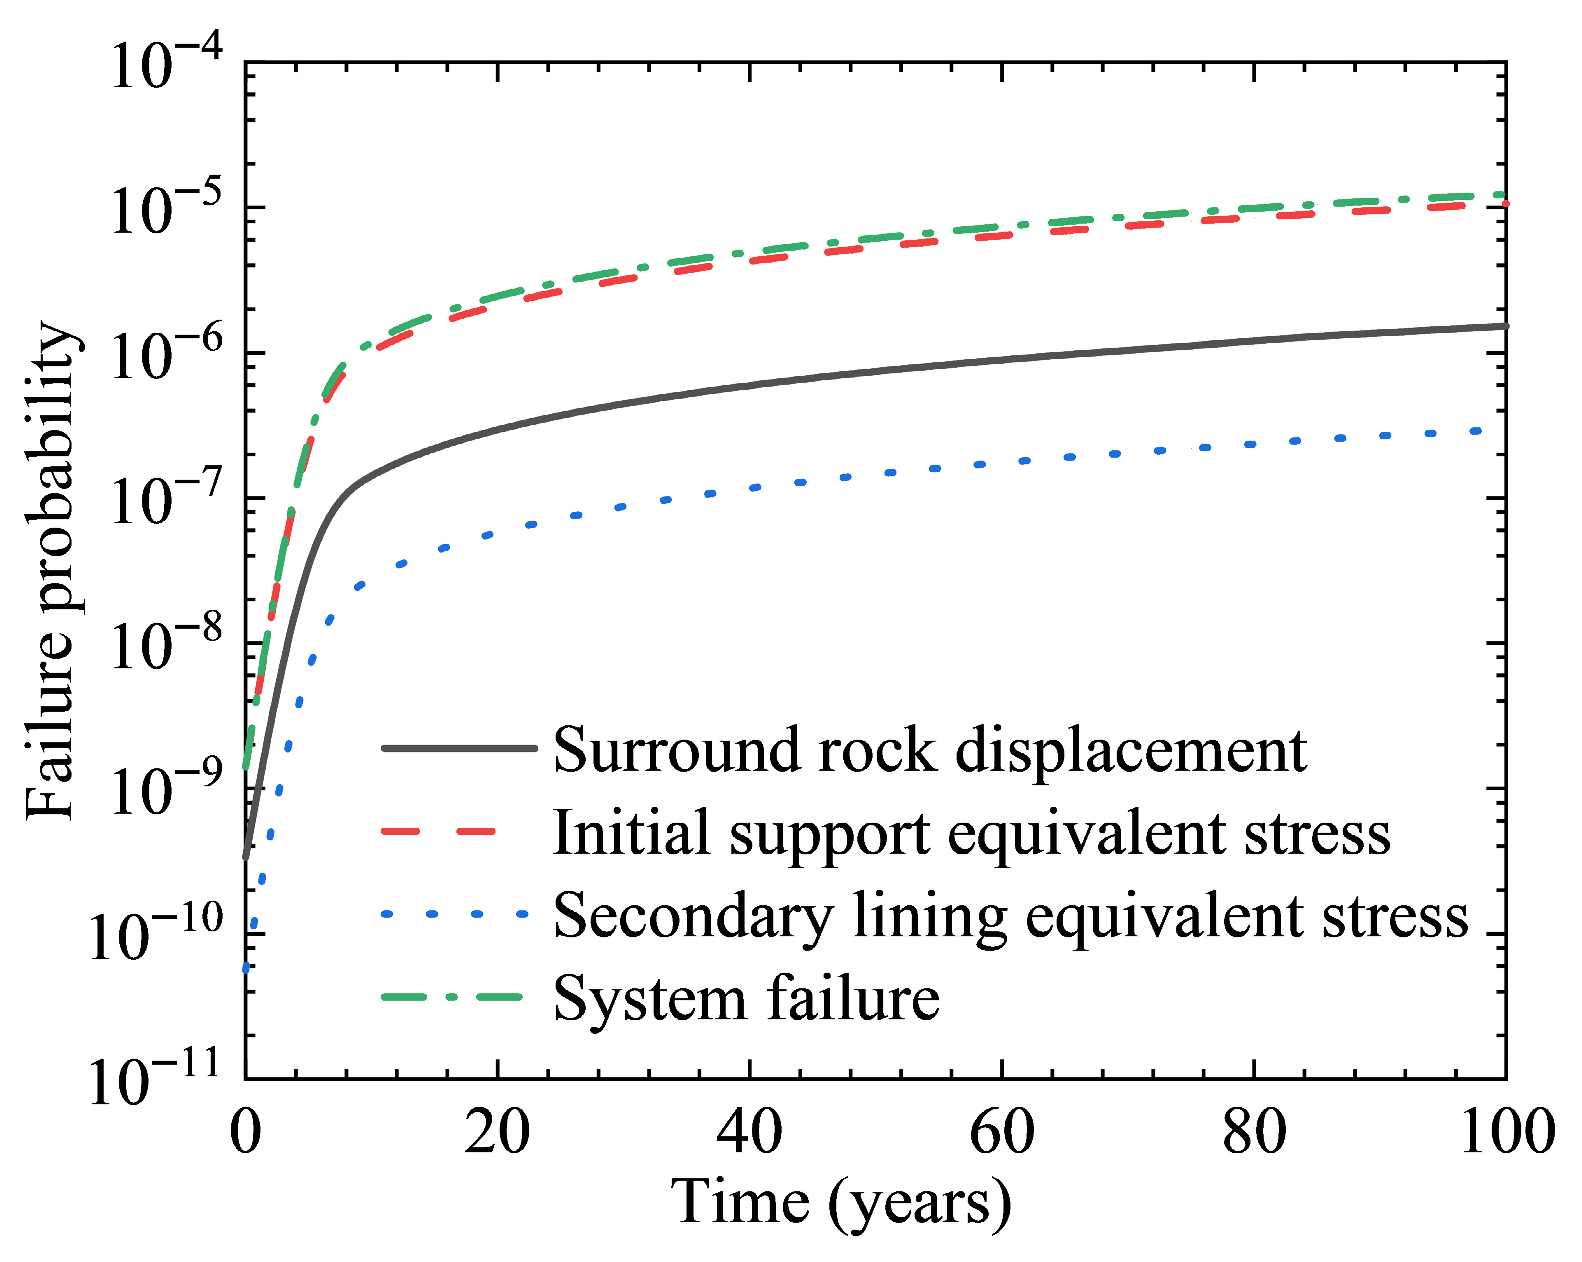
Figure 16 compares the cumulative failure probabilities associated with individual failure modes and the system failure mode over the service life of the tunnel. It is evident that the failure probability of system failure mode exceeds that of individual failures. However, the failure probability of system failure mode is very close to that corresponding to the failure probability of insufficient initial support strength, indicating that this failure mode is dominant during the tunnel service period. Moreover, although the failure probability of insufficient secondary lining strength is relatively low, it increases significantly with service time.
Figure 16.
Time-dependent failure probability.
In addition, all failure modes exhibit relatively low failure probabilities after the tunnel construction. However, the probability of failure increases sharply during the early stage of service period. As the service time continues to increase, the growth rate of the failure probability gradually decreases. Therefore, operational safety must be closely monitored during the initial service period.
5.3.2. Parametric Study of Time-Dependent Reliability
The long-term stability and safety of underground excavations have attracted increasing attention in recent years, as they are significantly influenced by complex mechanical behavior and environmental factors. Recent engineering studies have focused on the stabilization of underground openings in weak or unstable rock masses and the assessment of associated hazards [44,45]. These studies highlight the importance of the performance of supporting structures in ensuring underground stability. In this context, it is necessary to carry out a parametric analysis to evaluate the influence of key factors on tunnel response.
In this section, sensitivity analyses are conducted on the time-dependent reliability of both individual failure modes and the system failure with respect to the mean values and coefficients of variation in different random variables. The evolution characteristics of the tunnel time-dependent reliability are thereby investigated, providing guidance for tunnel design.
During the analysis, the degradation coefficient and damage coefficient of the secondary lining were set to δ = 0.04 a−1 and De = 0.005 a−1, respectively. In addition, the mean values of all random variables are taken as μ = nμ0 (n = 0.5, 1.0, 2.0, where the value of μ0 is given in Table 3). According to Table 3, the ranges of the coefficients of variation for the random variables are as follows: the coefficient of variation in the initial support thickness COVd1 ranges from 0.02 to 0.18, the coefficient of variation in the secondary lining thickness COVd2 ranges from 0.01 to 0.09, and the coefficients of variation in the Burgers model creep parameters COVGe, COVGk and COVηk range from 0.03 to 0.27, 0.026 to 0.234, and 0.02 to 0.18, respectively.
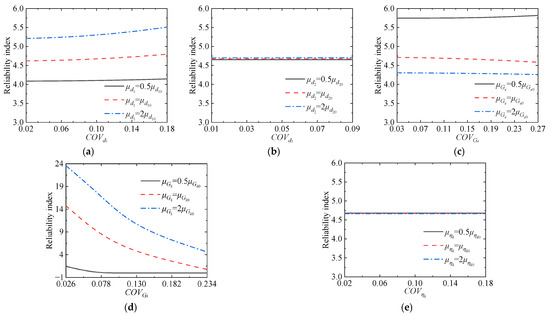
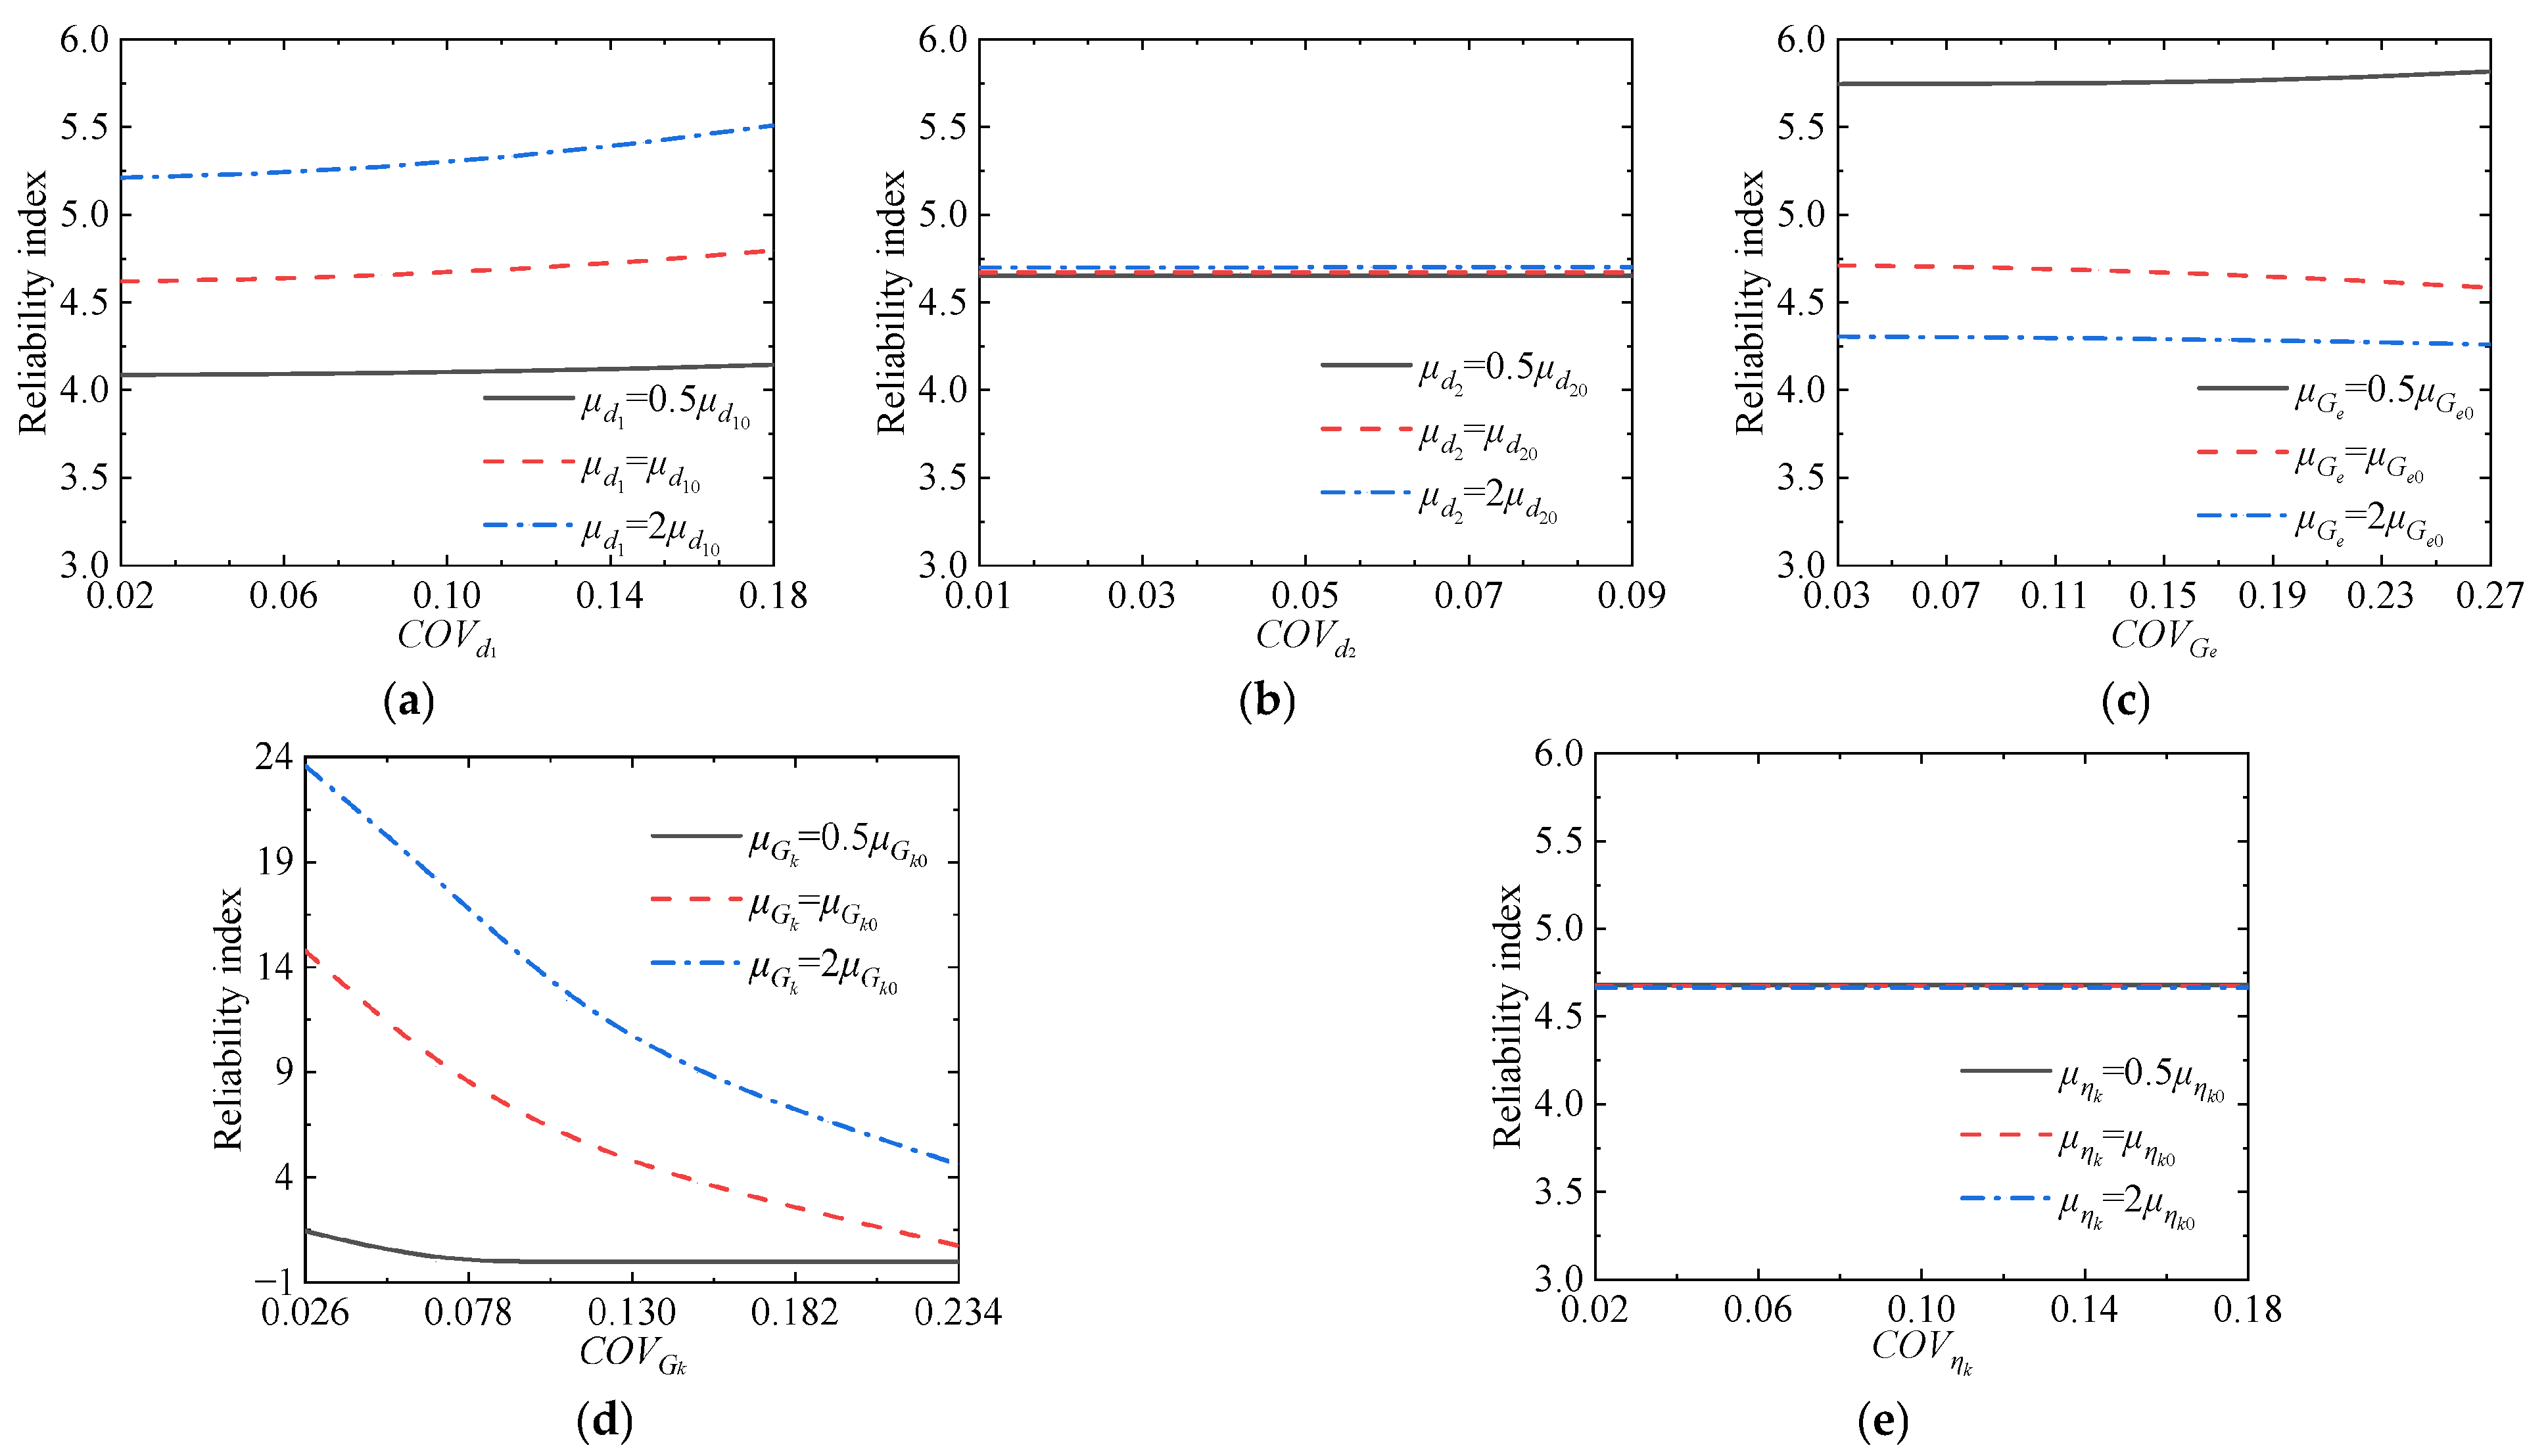
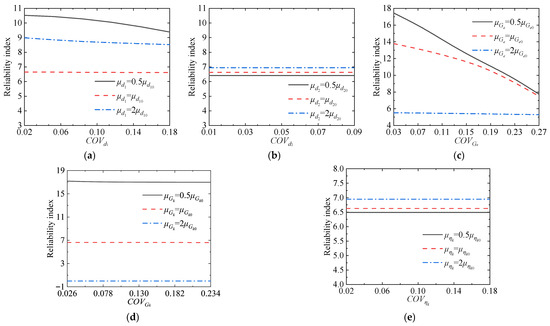
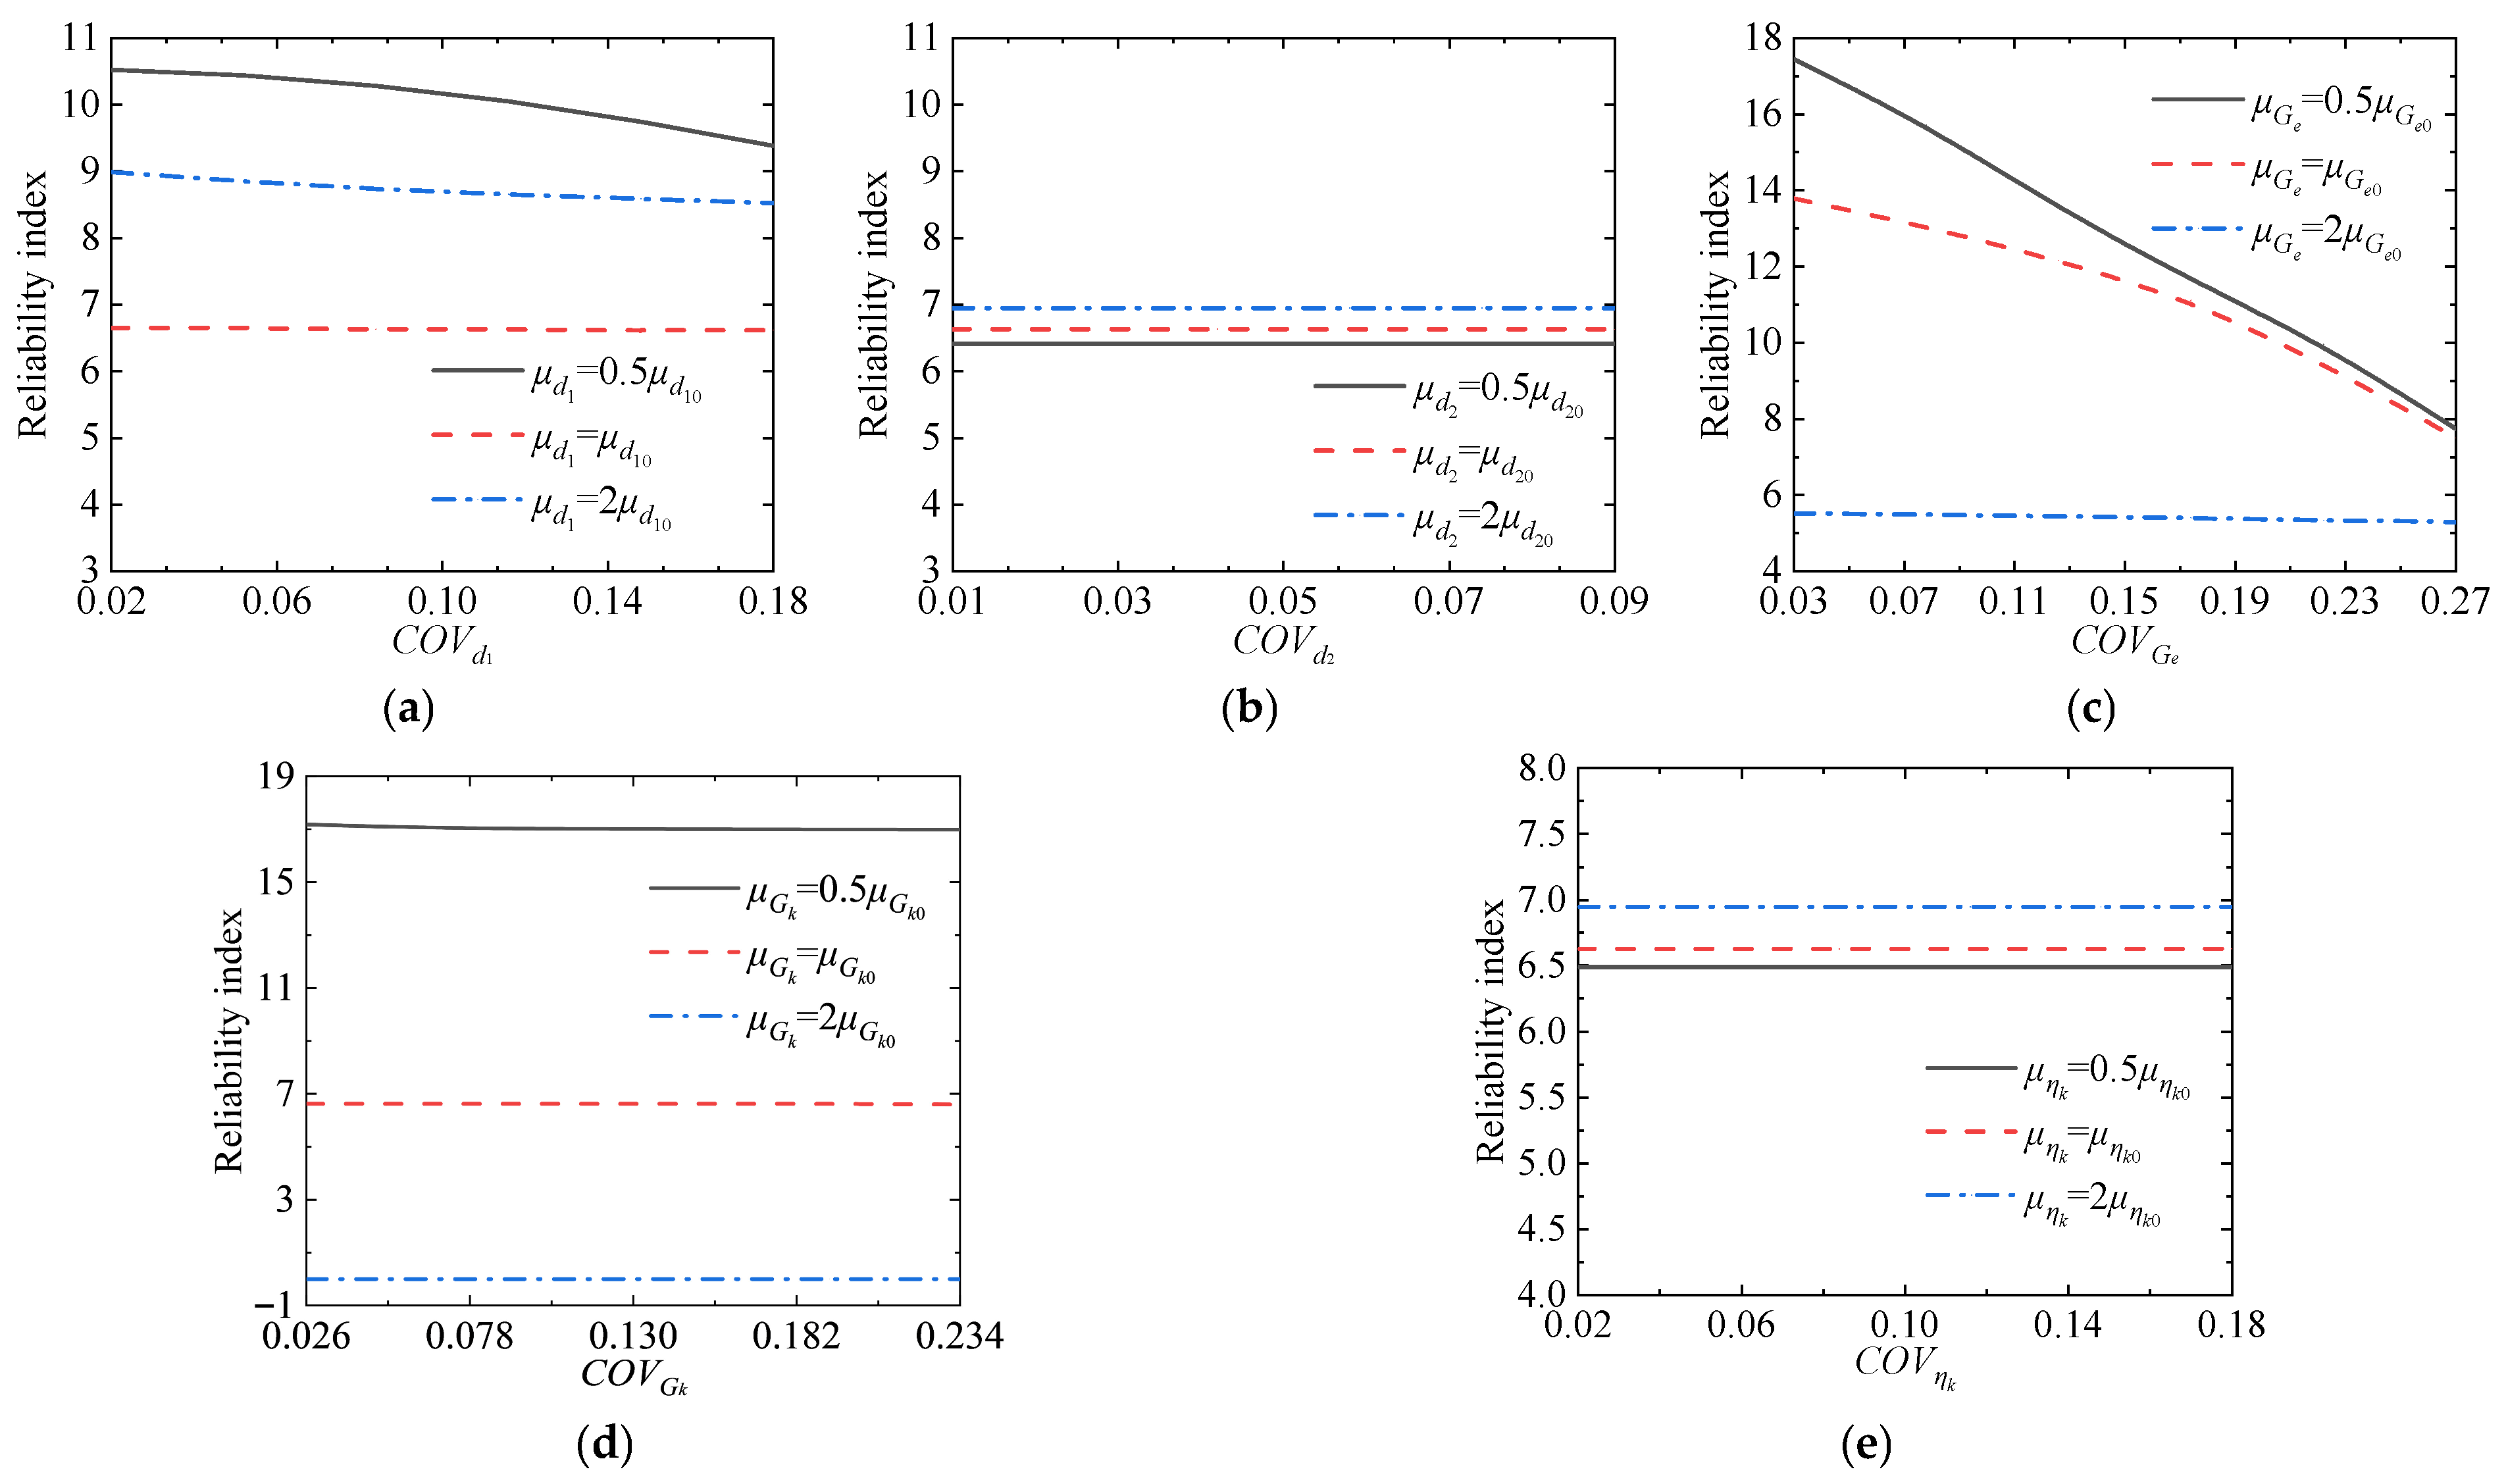
The effects of the mean values and coefficients of variation in the random variables on the reliability index of excessive convergence of surrounding rock are first analyzed, as shown in Figure 17.
Figure 17.
The influence on the reliability of excessive convergence of surrounding rock. (a) Initial support thickness d1. (b) Secondary lining thickness d2; (c) Burgers model parameter Ge. (d) Burgers model parameter Gk. (e) Burgers model parameter ηk.
As the mean values of the five parameters increase, the reliability index corresponding to the secondary lining thickness d2 exhibits the smallest improvement, with a maximum increase of only 1.04%. In contrast, the reliability index associated with Gk shows the most significant increase, exceeding 1500%. This is because Gk, as a parameter characterizing the viscoelastic deformation resistance of the surrounding rock, substantially enhances the rock mass resistance to creep when its mean value increases, thereby markedly reducing the probability of excessive convergence failure.
As the coefficient of variation increases from its minimum to maximum value, the reliability index corresponding to ηk shows no significant change, indicating that the variability of ηk has a negligible effect on the failure probability of surrounding rock convergence. In contrast, the reliability index associated with Gk exhibits the largest variation, decreasing from 23.58 to 4.62. This demonstrates that the variability of Gk plays a dominant role in controlling the reliability of excessive convergence of the surrounding rock.
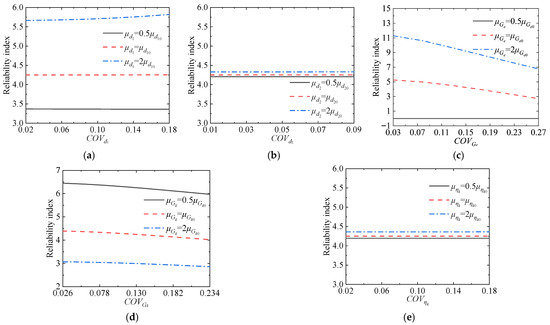
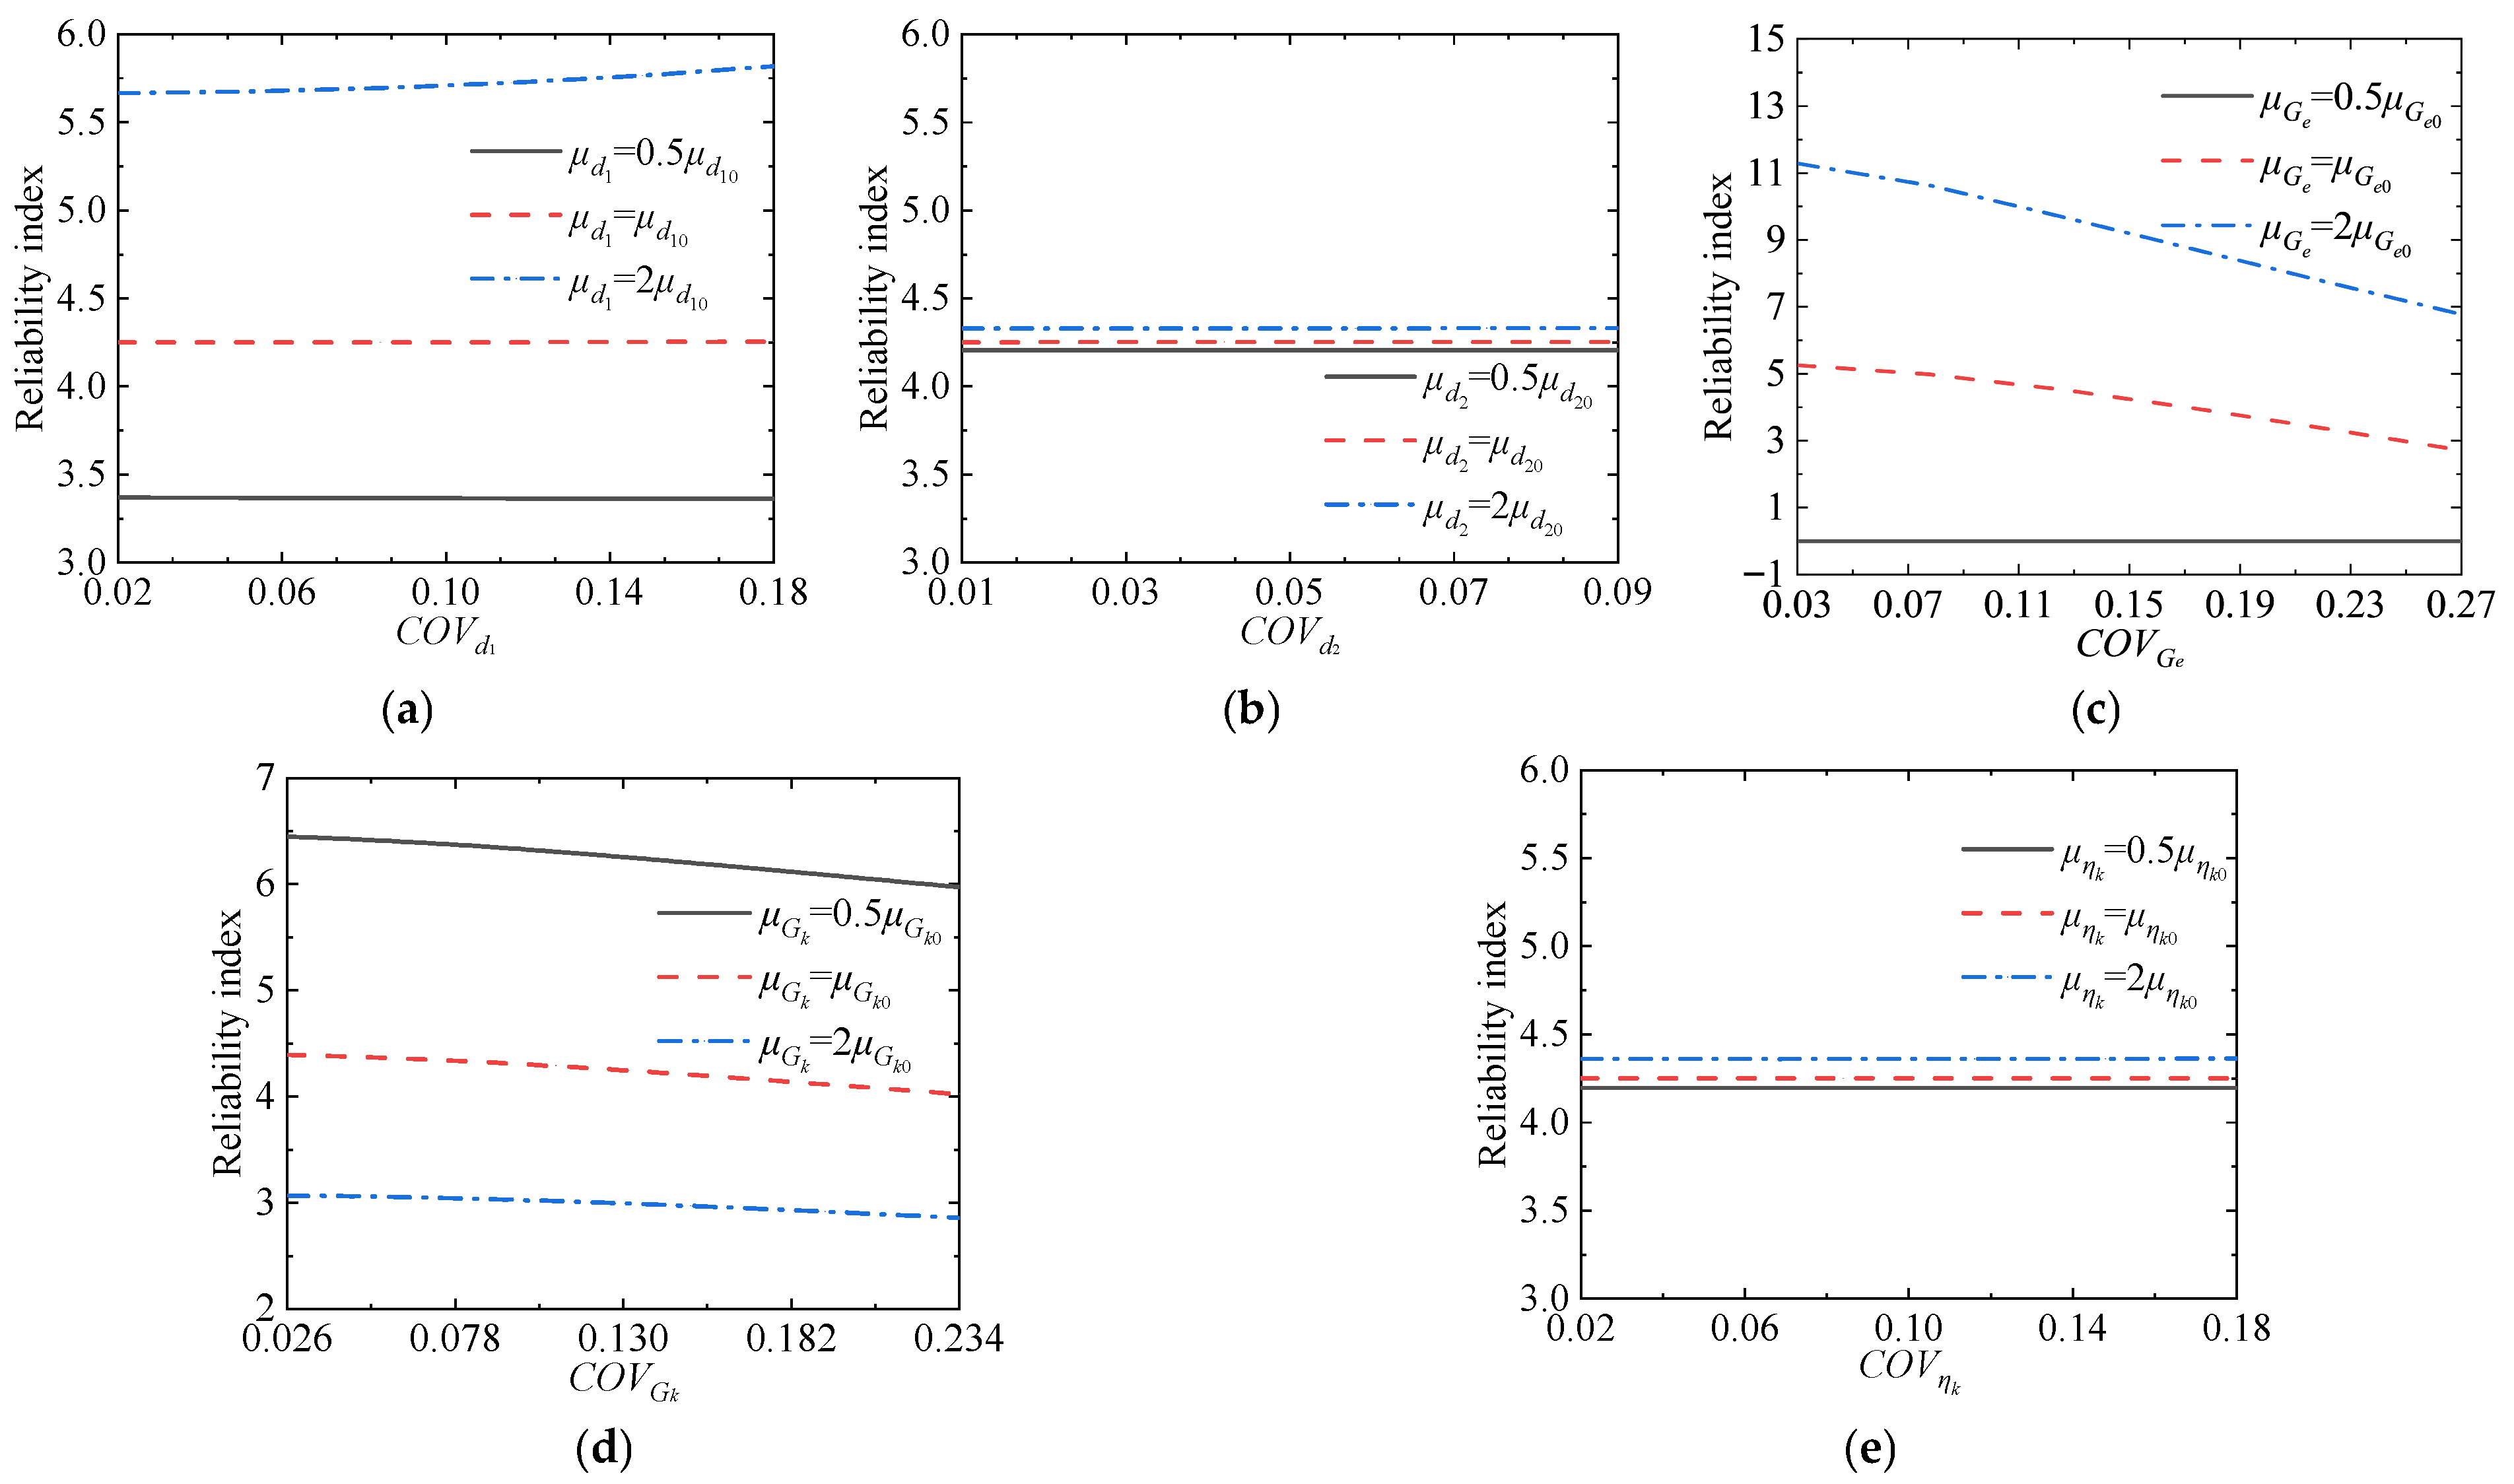
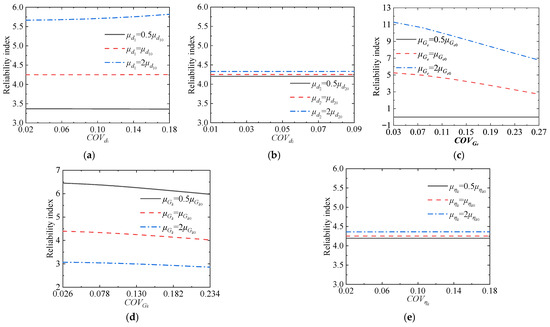
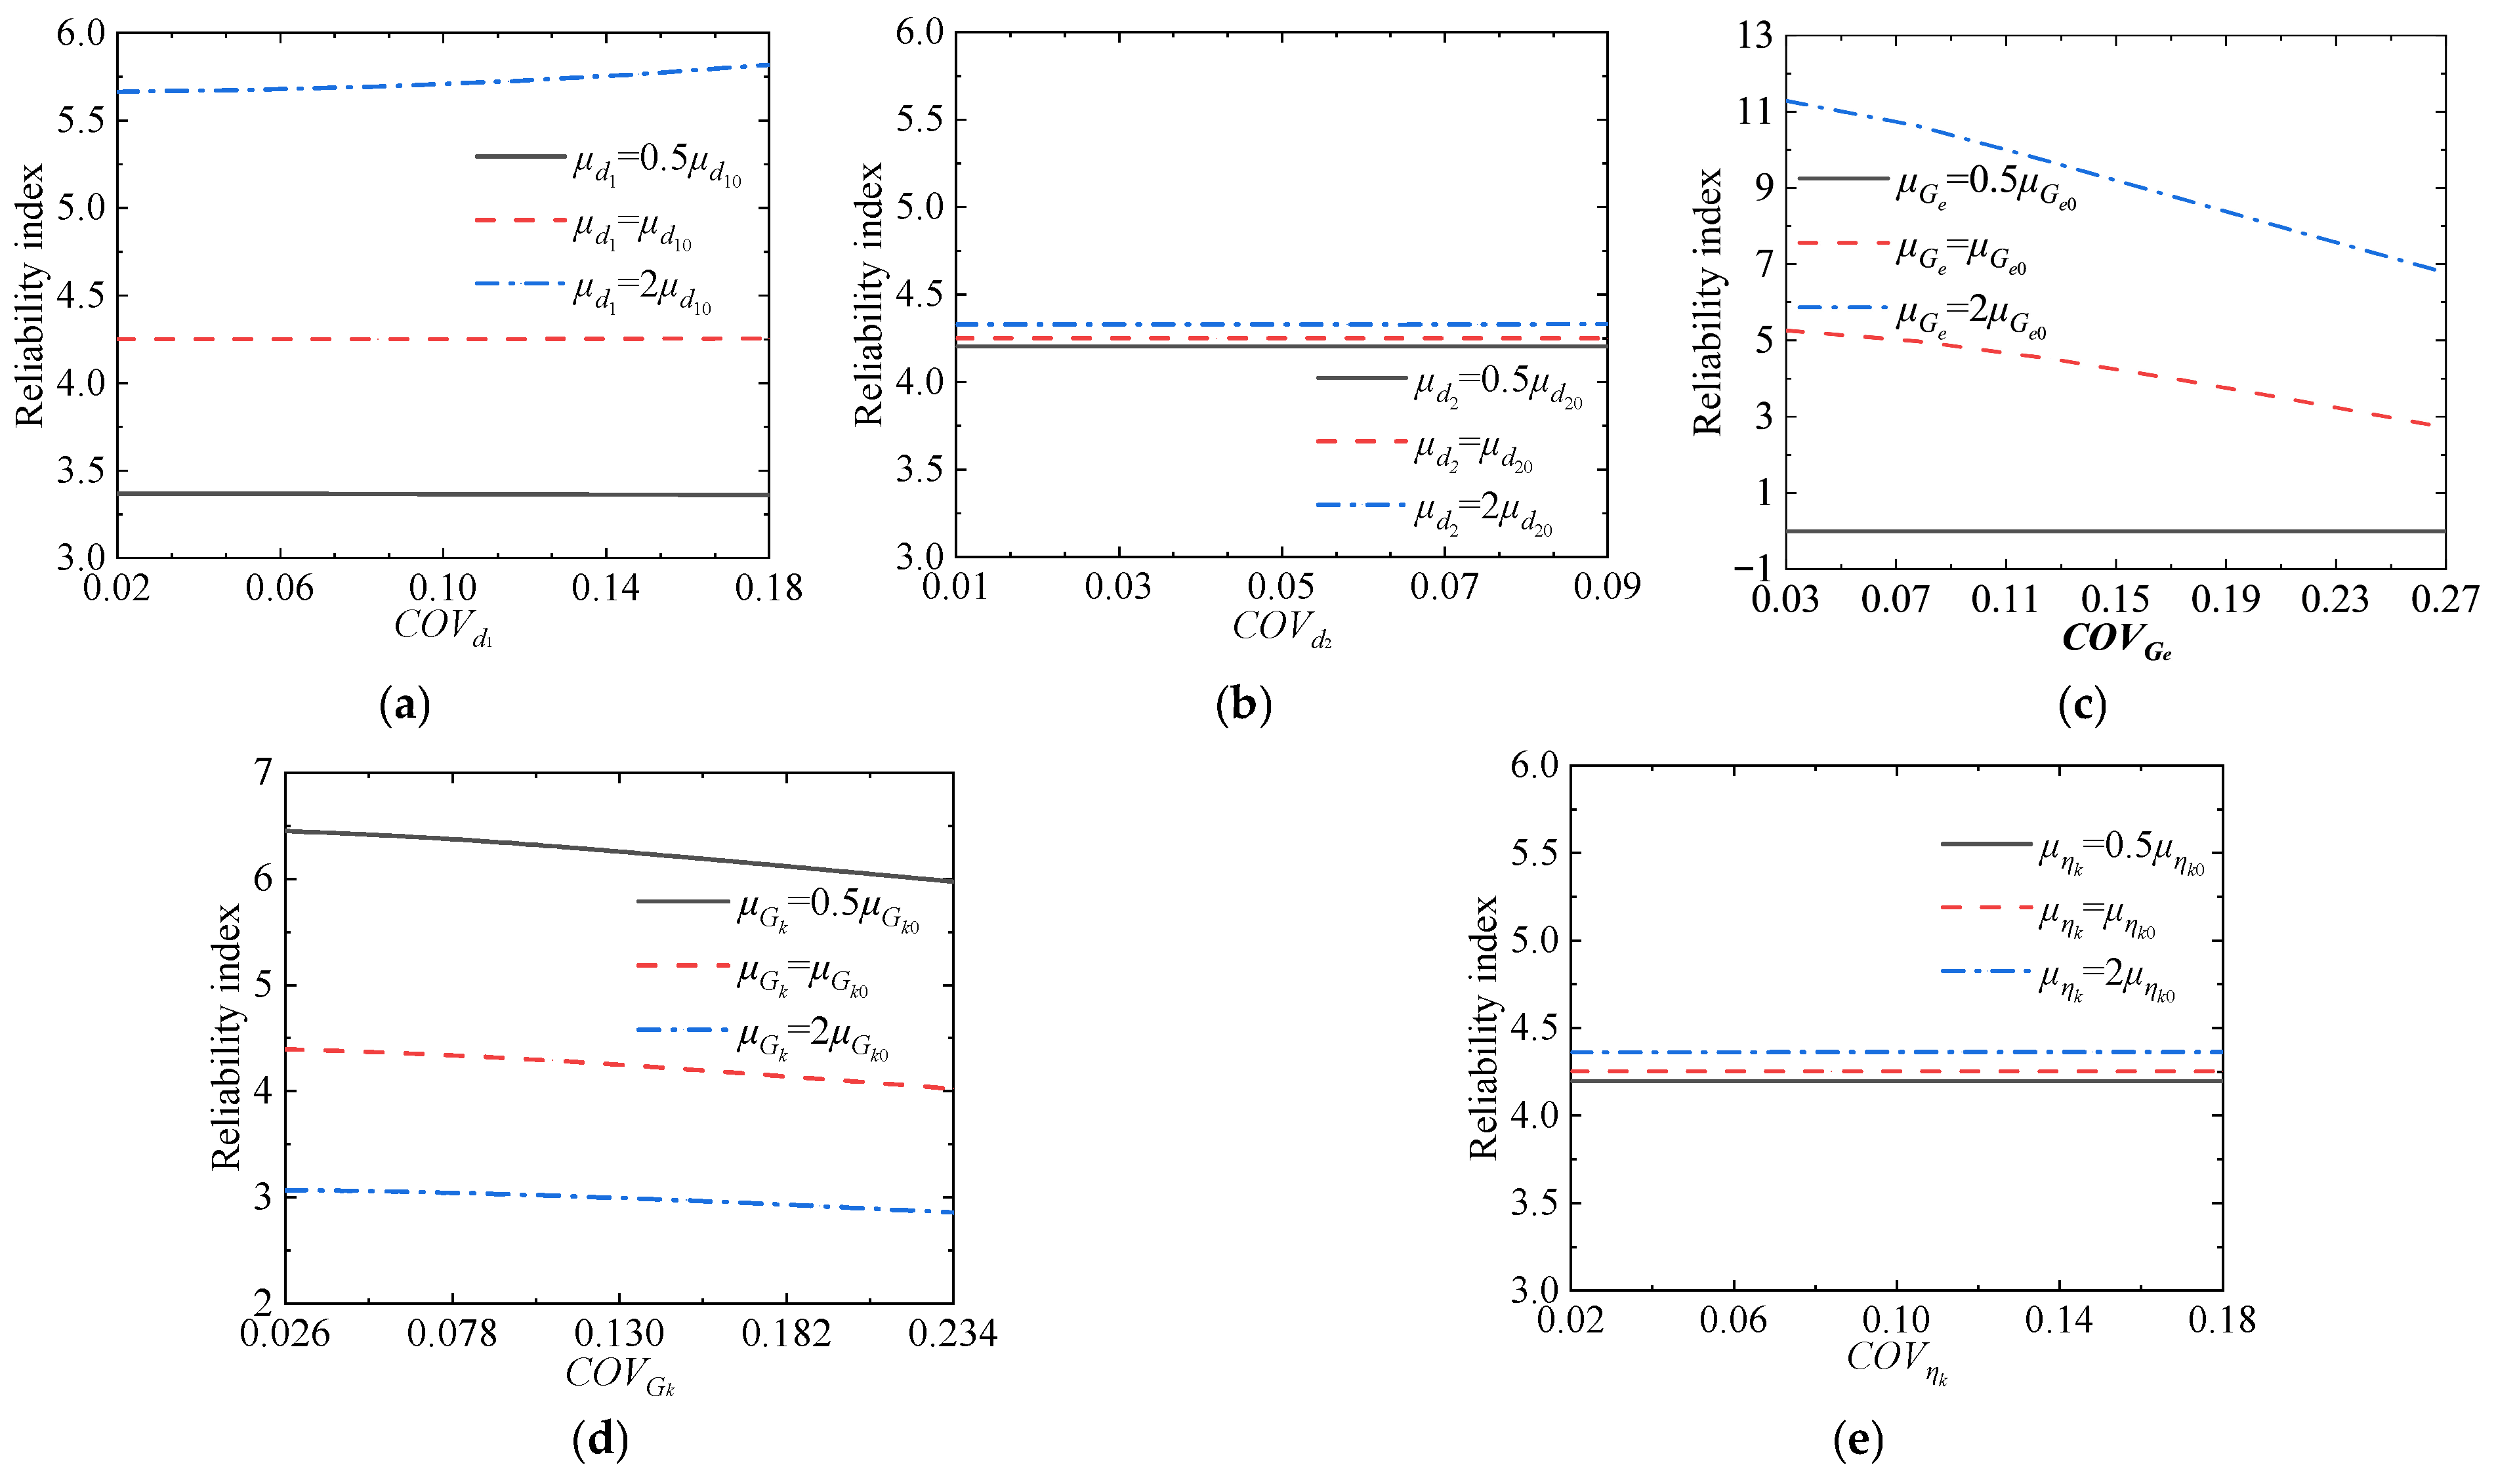
Next, the effects of the mean values and coefficients of variation in the random variables on the reliability index of insufficient initial support strength are analyzed, as shown in Figure 18.
Figure 18.
The influence on the reliability of insufficient initial support strength. (a) Initial support thickness d1. (b) Secondary lining thickness d2. (c) Burgers model parameter Ge. (d) Burgers model parameter Gk. (e) Burgers model parameter ηk.
As the mean values of the five parameters increase, the reliability index corresponding to the secondary lining thickness d2 exhibits the smallest improvement, with a maximum increase of only 3.01%. This is because the secondary lining only bears the supplementary load when the constraint provided by the initial support is insufficient, and thus has a limited effect on mitigating the failure associated with insufficient initial support strength. In contrast, the reliability index associated with Ge shows the most significant increase, rising from 0 to 11.29. This is because an increase in Ge can substantially reduce the overall deformation of the surrounding rock, thereby decreasing the squeezing load acting on the initial support.
As the coefficient of variation increases from its minimum to maximum value, the reliability indices corresponding to all five parameters exhibit varying degrees of change. Among them, the reliability index associated with Ge shows the largest variation, decreasing by 40.0%, indicating that an increase in the variability of Ge significantly raises the risk of initial support failure. In contrast, the reliability index corresponding to ηk shows the smallest variation, with no significant fluctuations observed under different baseline values.
Subsequently, the effects of the mean values and coefficients of variation in the random variables on the reliability index of insufficient secondary lining strength are analyzed, as shown in Figure 19.
Figure 19.
The influence on the reliability of insufficient secondary lining strength. (a) Initial support thickness d1. (b) Secondary lining thickness d2. (c) Burgers model parameter Ge. (d) Burgers model parameter Gk. (e) Burgers model parameter ηk.
As the mean values of the five parameters increase, the reliability index corresponding to ηk exhibits the smallest improvement, with a maximum increase of only 7.04%. In contrast, the reliability index associated with Gk shows the most significant decrease, dropping from 17.18 to 0. This is because an increase in Gk leads to greater additional loads being borne by the secondary lining, thereby significantly reducing the reliability against the failure mode of insufficient secondary lining strength.
As the coefficient of variation increases from its minimum to maximum value, the reliability indices corresponding to all five parameters exhibit varying degrees of change. Among them, the reliability index associated with Ge shows the largest variation, decreasing by 55.6%. In contrast, the reliability indices corresponding to the secondary lining thickness d2 and ηk exhibit the smallest variations.
Finally, the effects of the mean values and coefficients of variation in the random variables on the reliability index of system failure are analyzed, as shown in Figure 20.
Figure 20.
The influence on the reliability of system failure. (a) Initial support thickness d1. (b) Secondary lining thickness d2. (c) Burgers model parameter Ge. (d) Burgers model parameter Gk. (e) Burgers model parameter ηk.
As the coefficient of variation increases from its minimum to maximum value, the reliability indices corresponding to all five parameters decrease to varying degrees. Among them, the reliability index associated with Ge exhibits the largest variation, with a maximum reduction of 40.0%. In contrast, the reliability index corresponding to ηk shows the smallest variation, remaining nearly unchanged across different levels, indicating that the variability of ηk has a negligible effect on the system failure probability.
Overall, for the supporting parameters, the initial support thickness d1 exerts a greater influence on each failure mode than the secondary lining thickness d2. For the creep parameters, Ge has the most significant impact on all failure modes, whereas ηk has the least influence.
With respect to the influence of an individual random variable on different failure modes, all five random variables exert the greatest effect on the failure mode associated with the insufficient secondary lining strength and the least influence on the failure mode associated with the excessive convergence of surrounding rock. This phenomenon can be attributed to the relatively low failure probability of the insufficient secondary lining strength. When the statistical characteristics of random variables vary, events with small failure probabilities are more sensitive.
Finally, it can be observed that regardless of variations in the mean values or coefficients of variation in the random variables, the insufficient initial support strength consistently exerts the greatest influence on system failure. Variations in its reliability directly govern the fluctuations of the system reliability. This conclusion is consistent with the findings of the previous section, further confirming that the insufficient initial support strength is the dominant failure mode throughout the service life of the tunnel.
6. Conclusions
This study considers the combined influence of surrounding rock rheological behavior and the degradation and damage of the secondary lining and establishes an analytical tunnel model based on the Burgers rheological model. Analytical solutions for the mechanical response of deep-buried soft rock tunnels are derived under the assumptions of a circular cross-section, isotropic and incompressible viscoelastic Burgers rock, isotropic geostress, and compatible deformation among the surrounding rock and linings. Furthermore, a system reliability analysis is conducted within the framework of time-dependent reliability theory. The main conclusions are as follows:
- The influences of different parameters on the tunnel response exhibit significant differences. Among the Burgers model parameters, Ge has the greatest impact on the surrounding rock displacement, increasing it by up to 86.75%. In contrast, Gk has the most pronounced effect on the stress of the secondary lining, leading to an increase of 27.58% in the equivalent stress of the secondary lining.
- The time-dependent failure probability of the tunnel exhibits a characteristic of rapid increase in the early stage, followed by a reduced growth rate in the later stage. The system failure probability is consistently higher than that of each individual failure mode, and its value is close to that of the failure mode associated with insufficient initial support strength, which is identified as the dominant failure mode.
- Ge and Gk are the key parameters affecting tunnel reliability. For the failure mode of excessive convergence of surrounding rock, an increase in the mean value of Gk leads to an increase of more than 1500% in the reliability index. For the failure mode of insufficient initial support strength, an increase in the mean value of Ge raises the reliability index from 0 to 11.29, while an increase in its coefficient of variation results in a 40.0% reduction in the reliability index. For the failure mode of insufficient secondary lining strength, an increase in the coefficient of variation in Ge leads to a maximum reduction of 55.6% in the reliability index. The variation in system reliability is mainly affected by the failure mode of insufficient initial support strength.
- Based on the above findings, the following measures can be adopted in practical engineering to specifically improve tunnel reliability. First, adopt sequential excavation and staged support to protect rock mass integrity and reduce delayed creep. Second, apply advance pipe grouting to densify the surrounding rock, close cracks, and significantly increase the instantaneous modulus of the rock. Third, enhance the strength of the initial support to restrain instantaneous relaxation of the surrounding rock.
The analytical solutions derived in this study enable efficient and accurate evaluation of tunnel mechanical responses, avoiding the high computational cost associated with finite element simulations. The identified key sensitive parameters, quantified influence patterns, and corresponding engineering recommendations provide important theoretical foundations and technical support for the design optimization, construction control, and maintenance strategy development of deep-buried soft rock tunnels. Nevertheless, given the simplifying assumptions made in this study, future research should extend the present work to more realistic conditions, including tunnels in anisotropic rock and non-circular cross-sections (e.g., horseshoe-shaped tunnels), to better reflect practical engineering scenarios.
Author Contributions
H.-H.W.: Conceptualization, Methodology, Writing—original draft; G.C.: Resources, Writing—review and editing. All authors have read and agreed to the published version of the manuscript.
Funding
This research received no external funding.
Data Availability Statement
The data presented in this study are available on request from the corresponding author.
Conflicts of Interest
The authors declare no conflicts of interest.
Abbreviations
The following abbreviations are used in this manuscript:
| COV | Coefficient of Variation |
Appendix A
Firstly, Equation (28) can be rewritten in the following form based on the standard integral formulation:
where a1, a2, b1, b2 and k(t) can be calculated by:
The solution of Equation (A1) can be expressed in the following form [33]:
where c1 and c2 are given by
where x1 and x2 are roots of the following equation:
Therefore, x1 and x2 can be determined using the following expressions:
Combining Equations (A4)–(A6), the explicit solution for p11(t) can be obtained as follows [33]:
where m(t) and n(t) are defined as follow:
Appendix B
Taking the derivative of Equations (31) and (34), the following expressions are obtained:
Inserting Equation (A10) in Equation (A9), p12(t) can be expressed as follows:
where ψ(t) is expressed as
Taking the derivative on both sides of Equation (28), the following second-order differential equation of p12(t) can be obtained:
To determine p12(t), Equation (A13) must be solved. However, two initial conditions are required for this solution. The first condition is that p12(t2) = p11(t2), and the second condition is that the first-order derivative of p12(t) at t = t2 can be obtained from Equation (A10). After obtaining p12(t), p22(t) can be determined accordingly. Finally, the equivalent stress of the initial support qI(t) and the equivalent stress of the secondary lining qS(t) can be expressed as follows:
References
- Di, Q.; Li, P.; Zhang, M.; Cui, X. Influence of Relative Density on Deformation and Failure Characteristics Induced by Tunnel Face Instability in Sandy Cobble Strata. Eng. Fail. Anal. 2022, 141, 106641. [Google Scholar] [CrossRef] [Scilit]
- Xu, G.; He, C.; Yang, Q.; Wang, B. Progressive Failure Process of Secondary Lining of a Tunnel under Creep Effect of Surrounding Rock. Tunn. Undergr. Space Technol. 2019, 90, 76–98. [Google Scholar] [CrossRef] [Scilit]
- Zheng, H.; Li, P.; Ma, G. Stability Analysis of the Middle Soil Pillar for Asymmetric Parallel Tunnels by Using Model Testing and Numerical Simulations. Tunn. Undergr. Space Technol. 2021, 108, 103686. [Google Scholar] [CrossRef] [Scilit]
- Showkati, A.; Salari-rad, H.; Hazrati Aghchai, M. Predicting Long-Term Stability of Tunnels Considering Rock Mass Weathering and Deterioration of Primary Support. Tunn. Undergr. Space Technol. 2021, 107, 103670. [Google Scholar] [CrossRef] [Scilit]
- Barla, G.; Debernardi, D.; Sterpi, D. Time-Dependent Modeling of Tunnels in Squeezing Conditions. Int. J. Geomech. 2012, 12, 697–710. [Google Scholar] [CrossRef] [Scilit]
- Zhang, J.; Du, R.; Zhang, X.; Wu, J.; Xiang, X. Experimental and Numerical Investigation of the Rheological Characteristics of Tunnels in Cold Regions during Excavation and Operation. Acta Geotech. 2024, 19, 1943–1964. [Google Scholar] [CrossRef] [Scilit]
- Kovačević, M.S.; Bačić, M.; Vukomanović, M.; Cerić, A. A Framework for Automatic Calculation of Life-Cycle Remediation Costs of Secondary Lining Cracks. Autom. Constr. 2021, 129, 103714. [Google Scholar] [CrossRef] [Scilit]
- Lu, F.; Wang, Y.; Fu, J.; Yang, Y.; Qiu, W.; Jing, Y.; Jiang, M.; Li, H. Safety Evaluation of Plain Concrete Lining Considering Deterioration and Aerodynamic Effects. Sustainability 2023, 15, 7170. [Google Scholar] [CrossRef] [Scilit]
- Xu, G.; Gutierrez, M. Study on the Damage Evolution in Secondary Tunnel Lining under the Combined Actions of Corrosion Degradation of Preliminary Support and Creep Deformation of Surrounding Rock. Transp. Geotech. 2021, 27, 100501. [Google Scholar] [CrossRef] [Scilit]
- Han, W.; Jiang, Y.; Li, N.; Wang, G.; Luan, H.; Liu, C. Failure Behavior and Reinforcing Design of Degraded Tunnel Linings Based on the Three-Dimensional Numerical Evaluation. Eng. Fail. Anal. 2021, 129, 105677. [Google Scholar] [CrossRef] [Scilit]
- Liu, T.; Jiang, Z.; Chen, X.; Zhang, J.; Liang, X. Wave Effects in a Realistic Tunnel Induced by the Passage of High-Speed Trains. Tunn. Undergr. Space Technol. 2019, 86, 224–235. [Google Scholar] [CrossRef] [Scilit]
- Wang, D.; Wang, J.; Rao, C.; Niu, X.; Xu, Q. Tunnel Lining Crack Expansion and Maintenance Strategy Optimization Considering Train Loads: A Case Study. PLoS ONE 2023, 18, e0290533. [Google Scholar] [CrossRef] [Scilit]
- Li, H.-Z.; Low, B.K. Reliability Analysis of Circular Tunnel under Hydrostatic Stress Field. Comput. Geotech. 2010, 37, 50–58. [Google Scholar] [CrossRef] [Scilit]
- Mollon, G.; Dias, D.; Soubra, A.-H. Probabilistic Analysis of Circular Tunnels in Homogeneous Soil Using Response Surface Methodology. J. Geotech. Geoenviron. Eng. 2009, 135, 1314–1325. [Google Scholar] [CrossRef] [Scilit]
- Lü, Q.; Low, B.K. Probabilistic Analysis of Underground Rock Excavations Using Response Surface Method and SORM. Comput. Geotech. 2011, 38, 1008–1021. [Google Scholar] [CrossRef] [Scilit]
- Tan, X.-Y.; Chen, W.; Tian, H.; Wang, L. Analysis for Time-Dependent Behavior of Soft Rock Through a Reinforced Learning Fusion Constitutive Model. Int. J. Appl. Mech. 2024, 16, 2450050. [Google Scholar] [CrossRef] [Scilit]
- Yang, H.Q.; Zeng, Y.Y.; Lan, Y.F.; Zhou, X.P. Analysis of the Excavation Damaged Zone around a Tunnel Accounting for Geostress and Unloading. Int. J. Rock Mech. Min. Sci. 2014, 69, 59–66. [Google Scholar] [CrossRef] [Scilit]
- Liu, C.; Zhang, D.; Zhang, S.; Fang, Q.; Sun, Z. Long-Term Mechanical Analysis of Tunnel Structures in Rheological Rock Considering the Degradation of Primary Lining. Undergr. Space 2023, 10, 217–232. [Google Scholar] [CrossRef] [Scilit]
- Tran, N.-H.; Do, D.-P.; Vu, M.-N. Closed-Form Solution and Reliability Analysis of Deep Lined Tunnel Behavior in Anisotropic Viscoelastic Rock. Int. J. Rock Mech. Min. Sci. 2025, 194, 106242. [Google Scholar] [CrossRef] [Scilit]
- Chu, Z.; Wu, Z.; Liu, Q.; Liu, B. Analytical Solutions for Deep-Buried Lined Tunnels Considering Longitudinal Discontinuous Excavation in Rheological Rock Mass. J. Eng. Mech. 2020, 146, 04020047. [Google Scholar] [CrossRef] [Scilit]
- Lai, H.; Liu, B.; Chu, Z.; Shi, X.; Song, Y.; Deng, T. Analytical Viscoelastic Solution for Double-Lining Tunnel Under a Non-Hydrostatic Stress Field Considering Creep Characteristic of Shotcretet. Rock Mech. Rock Eng. 2025, 58, 2635–2659. [Google Scholar] [CrossRef] [Scilit]
- Fang, Q.; Wang, G.; Du, J.; Liu, Y.; Zhou, M. Prediction of Tunnelling Induced Ground Movement in Clay Using Principle of Minimum Total Potential Energy. Tunn. Undergr. Space Technol. 2023, 131, 104854. [Google Scholar] [CrossRef] [Scilit]
- Xu, G.; Gutierrez, M.; Arora, K.; Wang, X. Visco-Plastic Response of Deep Tunnels Based on a Fractional Damage Creep Constitutive Model. Acta Geotech. 2022, 17, 613–633. [Google Scholar] [CrossRef] [Scilit]
- Do, D.-P.; Tran, N.-T.; Mai, V.-T.; Hoxha, D.; Vu, M.-N. Time-Dependent Reliability Analysis of Deep Tunnel in the Viscoelastic Burger Rock with Sequential Installation of Liners. Rock Mech. Rock Eng. 2020, 53, 1259–1285. [Google Scholar] [CrossRef] [Scilit]
- Xu, J.; Gao, M.; Wang, Y.; Yu, Z.; Zhao, J.; DeJong, M.J. Numerical Investigation of the Effects of Separated Footings on Tunnel-Soil-Structure Interaction. J. Geotech. Geoenviron. Eng. 2025, 151, 04025057. [Google Scholar] [CrossRef] [Scilit]
- Niu, D.; Wang, Y.; Ma, R.; Wang, J.; Xu, S. Experiment Study on the Failure Mechanism of Dry-Mix Shotcrete under the Combined Actions of Sulfate Attack and Drying–Wetting Cycles. Constr. Build. Mater. 2015, 81, 74–80. [Google Scholar] [CrossRef] [Scilit]
- Fuhaid, A.F.A.; Niaz, A. Carbonation and Corrosion Problems in Reinforced Concrete Structures. Buildings 2022, 12, 586. [Google Scholar] [CrossRef] [Scilit]
- Xu, G.; He, C.; Wang, J.; Zhang, J. Study on the Damage Evolution of Secondary Tunnel Lining in Layered Rock Stratum. Bull. Eng. Geol. Environ. 2020, 79, 3533–3557. [Google Scholar] [CrossRef] [Scilit]
- Du, J.M.; Fang, Q.; Chen, L.Q.; Wang, J. Service characteristics of operational tunnel under combined action of time effects of surrounding rock and supporting structure. J. Cent. South Univ. (Sci. Technol.) 2022, 53, 4001–4011. [Google Scholar]
- Paraskevopoulou, C.; Diederichs, M. Analysis of Time-Dependent Deformation in Tunnels Using the Convergence-Confinement Method. Tunn. Undergr. Space Technol. 2018, 71, 62–80. [Google Scholar] [CrossRef] [Scilit]
- Asadollahpour, E.; Rahmannejad, R.; Asghari, A.; Abdollahipour, A. Back Analysis of Closure Parameters of Panet Equation and Burger׳s Model of Babolak Water Tunnel Conveyance. Int. J. Rock Mech. Min. Sci. 2014, 68, 159–166. [Google Scholar] [CrossRef] [Scilit]
- Chu, Z.; Wu, Z.; Liu, B.; Liu, Q. Coupled Analytical Solutions for Deep-Buried Circular Lined Tunnels Considering Tunnel Face Advancement and Soft Rock Rheology Effects. Tunn. Undergr. Space Technol. 2019, 94, 103111. [Google Scholar] [CrossRef] [Scilit]
- Polyanin, P.; Manzhirov, A.V. Handbook of Integral Equations; Chapman and Hall/CRC: Boca Raton, FL, USA, 2008. [Google Scholar]
- Wang, H.N.; Utili, S.; Jiang, M.J. An Analytical Approach for the Sequential Excavation of Axisymmetric Lined Tunnels in Viscoelastic Rock. Int. J. Rock Mech. Min. Sci. 2014, 68, 85–106. [Google Scholar] [CrossRef] [Scilit]
- Ladanyi, B.; Gill, D.E. Design of Tunnel Linings in a Creeping Rock. Int. J. Min. Geol. Eng. 1988, 6, 113–126. [Google Scholar] [CrossRef] [Scilit]
- Thapa, A.; Roy, A.; Chakraborty, S. Reliability Analysis of Underground Tunnel by a Novel Adaptive Kriging Based Metamodeling Approach. Probabilistic Eng. Mech. 2022, 70, 103351. [Google Scholar] [CrossRef] [Scilit]
- Zhao, Y.-G.; Ang, A.H.S. System reliability assessment by method of moments. J. Struct. Eng. 2003, 129, 1341–1349. [Google Scholar] [CrossRef] [Scilit]
- Qiao, H.-P.; Lu, Z.-H.; Zhang, X.-Y.; Li, C.-Q. Moment-Based Outcrossing Rate Method for Time-Dependent Random Field Reliability Analysis Including Finite Element Analysis. Reliab. Eng. Syst. Saf. 2025, 264, 111412. [Google Scholar] [CrossRef] [Scilit]
- Zhang, X.-Y.; Lu, Z.-H.; Wu, S.-Y.; Zhao, Y.-G. An Efficient Method for Time-Variant Reliability Including Finite Element Analysis. Reliab. Eng. Syst. Saf. 2021, 210, 107534. [Google Scholar] [CrossRef] [Scilit]
- Zhang, X.-Y.; Lu, Z.-H.; Zhao, Y.-G.; Li, C.-Q. The GLO Method: An Efficient Algorithm for Time-Dependent Reliability Analysis Based on Outcrossing Rate. Struct. Saf. 2022, 97, 102204. [Google Scholar] [CrossRef] [Scilit]
- Zhao, Y.-G.; Lu, Z.-H. Structural Reliability: Approaches from Perspectives of Statistical Moments; John Wiley & Sons: Hoboken, NJ, USA, 2021. [Google Scholar]
- Lu, Z.-H.; Zhao, Z.; Zhang, X.-Y.; Li, C.-Q.; Ji, X.-W.; Zhao, Y.-G. Simulating Stationary Non-Gaussian Processes Based on Unified Hermite Polynomial Model. J. Eng. Mech. 2020, 146, 04020067. [Google Scholar] [CrossRef] [Scilit]
- Wei, H.-H.; Zhang, X.-Y.; Zhao, Y.-G. Time-Dependent System Reliability Analysis of Tunnels Accounting for Degradation of Surrounding Rock and Support Systems. Geotech. Geol. Eng. 2026, 44, 164. [Google Scholar] [CrossRef] [Scilit]
- Iskakov, Y.; Amanzholov, D.; Kenessov, Z. Innovative approaches to stabilizing underground mine workings in unstable rock masses by creating a preliminary protective shield. Min. Miner. Depos. 2025, 19, 65–74. [Google Scholar] [CrossRef] [Scilit]
- Miletenko, N.A.; Odintsev, V.N.; Fedorov, E.V. Snowmelt Water Breakthrough into Coal Mine. Eng. J. Satbayev Univ. 2025, 147, 48–52. [Google Scholar] [CrossRef] [Scilit]

Disclaimer/Publisher’s Note: The statements, opinions and data contained in all publications are solely those of the individual author(s) and contributor(s) and not of MDPI and/or the editor(s). MDPI and/or the editor(s) disclaim responsibility for any injury to people or property resulting from any ideas, methods, instructions or products referred to in the content. |
© 2026 by the authors. Licensee MDPI, Basel, Switzerland. This article is an open access article distributed under the terms and conditions of the Creative Commons Attribution (CC BY) license.