


Abstract
An investigation was conducted to explore the freeze–thaw resistance of 60–90 MPa high-strength concrete blended with multiple industrial byproducts (limestone powder, fly ash, etc.) and mixed sand (machine-made/tailings sand), aiming to clarify freeze–thaw degradation mechanisms and build reliable damage prediction models. Three water-binder (w/b) ratios (0.30, 0.25, 0.20) and 15 mix proportions were designed, with 30–45% cement replaced by mineral admixtures and 90–100% natural sand by mixed sand. Results show lower w/b ratios improve resistance: the 0.20 ratio yields merely 0.06% mass loss and 96% relative dynamic elastic modulus retention after 400 cycles. Optimized silica fume and limestone powder refine pore structures; fly ash-slag synergy boosts durability via secondary hydration under specific dosage ratios. A 7:3 machine-made/tailings sand mix shows better frost resistance due to improved particle packing and interfacial transition zones. Three damage models were established, with Model III demonstrating high accuracy. This work’s novelty lies in multi-byproduct synergy and multi-factor models, supporting green concrete use in cold regions.
1. Introduction
As a critical building material, concrete has received substantial attention because of its freeze–thaw resistance, particularly in cold regions and challenging environments. Recently, advances in materials science have spurred increasing research interest in enhancing the freeze–thaw resistance of concrete. This work involves the introduction of different admixtures and the optimization of mix proportions to increase durability. Notably, the incorporation of certain active admixtures, such as limestone powder, fly ash, and steel slag powder, has been shown to greatly increase the freeze–thaw resistance of concrete [1,2,3]. Research has revealed that various factors, including environmental conditions, material properties, and curing temperature, profoundly influence the freeze–thaw resistance of concrete. Notably, the freeze–thaw resistance of concrete containing limestone powder greatly varies at different curing temperatures [4,5]. Moreover, the incorporation of fly ash and slag has been demonstrated to effectively increase the durability of concrete during freeze–thaw cycles [6,7].
Fly ash (FA) is a notable admixture that has been extensively used to increase the durability and strength of concrete. However, the inclusion of fly ash can decrease the freeze–thaw resistance of ecologically porous concrete, necessitating careful control of its content [8]. Comparative studies on the chemical and freeze–thaw properties of FA-based inorganic mortar and Portland cement have demonstrated that the former material exhibits superior resistance to freeze–thaw cycles [9]. The amount of fly ash significantly affects the microstructure and strength of concrete under freeze–thaw conditions, and its performance is optimal at a 20% fly ash content [10]. While the addition of fly ash can increase the strength of saline soil, its effectiveness decreases after the material undergoes excessive numbers of freeze–thaw cycles [11]. Concrete formulated with granulated and standard blast furnace slag presents increased freeze–thaw resistance because of the modification of the transition zone in saltwater [12]. Stearic acid-modified cement mortar not only resists water absorption but also shows exceptional freeze–thaw resistance and increased compressive strength [13]. The synergistic effect between fly ash and granulated blast furnace slag (GBFS) notably enhances the strength and durability of recycled aggregate concrete (RAC), with the most favorable proportions being 10% and 20%, respectively [6]. Experimental studies comparing the effects of fly ash and silica fume on the freeze–thaw resistance of normal- and high-strength concrete have indicated that silica fume negatively influences the freeze–thaw resistance of normal-strength concrete only [14].
While the incorporation of mineral powder may reduce the strength of concrete, its freeze–thaw durability can be enhanced by reducing the water–binder (w/b) ratio [15]. Moreover, the use of alkali-activated slag/fly ash mixtures for the repair of ordinary Portland cement concrete increases both the strength and durability of the adhesion interface [16]. A comparative analysis of the freeze–thaw performance of various amounts of geopolymer concrete (GPC)-10, GPC-30, and GPC-50 concretes indicated that GPC-50 can endure a maximum of 225 freeze–thaw cycles [17]. Notably, compared with its conventional counterpart, concrete blended with CFA exhibits superior freeze–thaw performance; however, this advantage diminishes because of stress damage [18]. Roller compacted concrete (RCC), which contains the modifier modified absorbent polymer (MAP), outperforms that containing traditional air-entraining agent (AEA) in terms of both strength and freeze–thaw resistance [19]. Additionally, a microsphere content ranging from 0 to 20% can increase the freeze–thaw performance of EPS concrete, with the optimal content being 15% [20]. A comparative study on the effects of limestone powder and fly ash on the pH evolution coefficient of concrete under sulfate–freeze–thaw conditions revealed that compared with pure cement, limestone powder marginally enhances the protective performance of concrete [21]. These investigations underscore the considerable potential of limestone powder in improving the freeze–thaw performance of concrete.
The exploration of waste reuse in research on the frost resistance of concrete has been instrumental in increasing the durability of concrete. Factors such as the A/S ratio, slag content, sand ratio, and pore structure significantly influence the frost tolerance of alkali slag concrete (ASC) [22]. The integration of GBFS and FNS into concrete notably increases its frost resistance, primarily because of its ability to increase the CSH content [23]. Shon [24] introduced ternary blended concrete with notably improved frost resistance in cold regions, which can be attributed to the inclusion of FA, and achieved a durability factor exceeding 60%. Li [25] examined the flexural performance and damage resistance of geopolymer concrete (GPC) combined with FA and slag. He reported that G10 GPC has the weakest frost resistance and that freeze–thaw cycles profoundly affect the beam behavior of the material.
Currently, models of freeze–thaw damage in concrete can be categorized into the following three primary types: (1) empirical models, which are based on the linear or nonlinear correlation between the number of freeze–thaw cycles and the degradation of mechanical properties, such as those defined by the ASTM C666 standard [26]; (2) physical models, which replicate the frost heave stress and damage accumulation process grounded in thermodynamic theory; and (3) numerical models, which simulate the water migration and phase transition processes via finite element methods. Most existing models have been designed for conventional concrete and thus fail to fully account for the intricate effects of various solid waste admixtures on the pore structure and phase transformation behavior of concrete. Additionally, equations representing damage evolution under multifactor coupling conditions are lacking.
Relevant studies on fracture evolution and mechanical deterioration of granite under cyclic thermal and liquid nitrogen cryogenic impact, as well as field application and diffusion law of grouting slurry in coal mine floor aquifer, provide methodological references for material damage evolution and engineering application analysis in this study. This study aims to fill these gaps by (1) investigating the effects of the w/b ratio, mineral admixtures, and mixed sand on freeze–thaw resistance; (2) revealing the microstructural mechanism of freeze–thaw degradation through pore structure analysis; (3) establishing and validating multifactor-coupled damage models; and (4) clarifying the superiority of mixed sand over natural sand from the perspective of particle morphology and interfacial transition zone (ITZ) characteristics. This work advances current knowledge by realizing the synergistic utilization of multiple industrial byproducts and providing a reliable damage prediction tool for cold-region engineering.
2. Experimental Program
2.1. Raw Material Properties
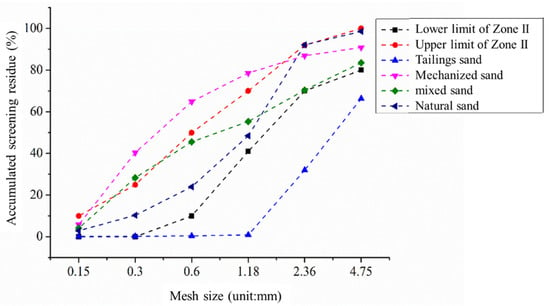
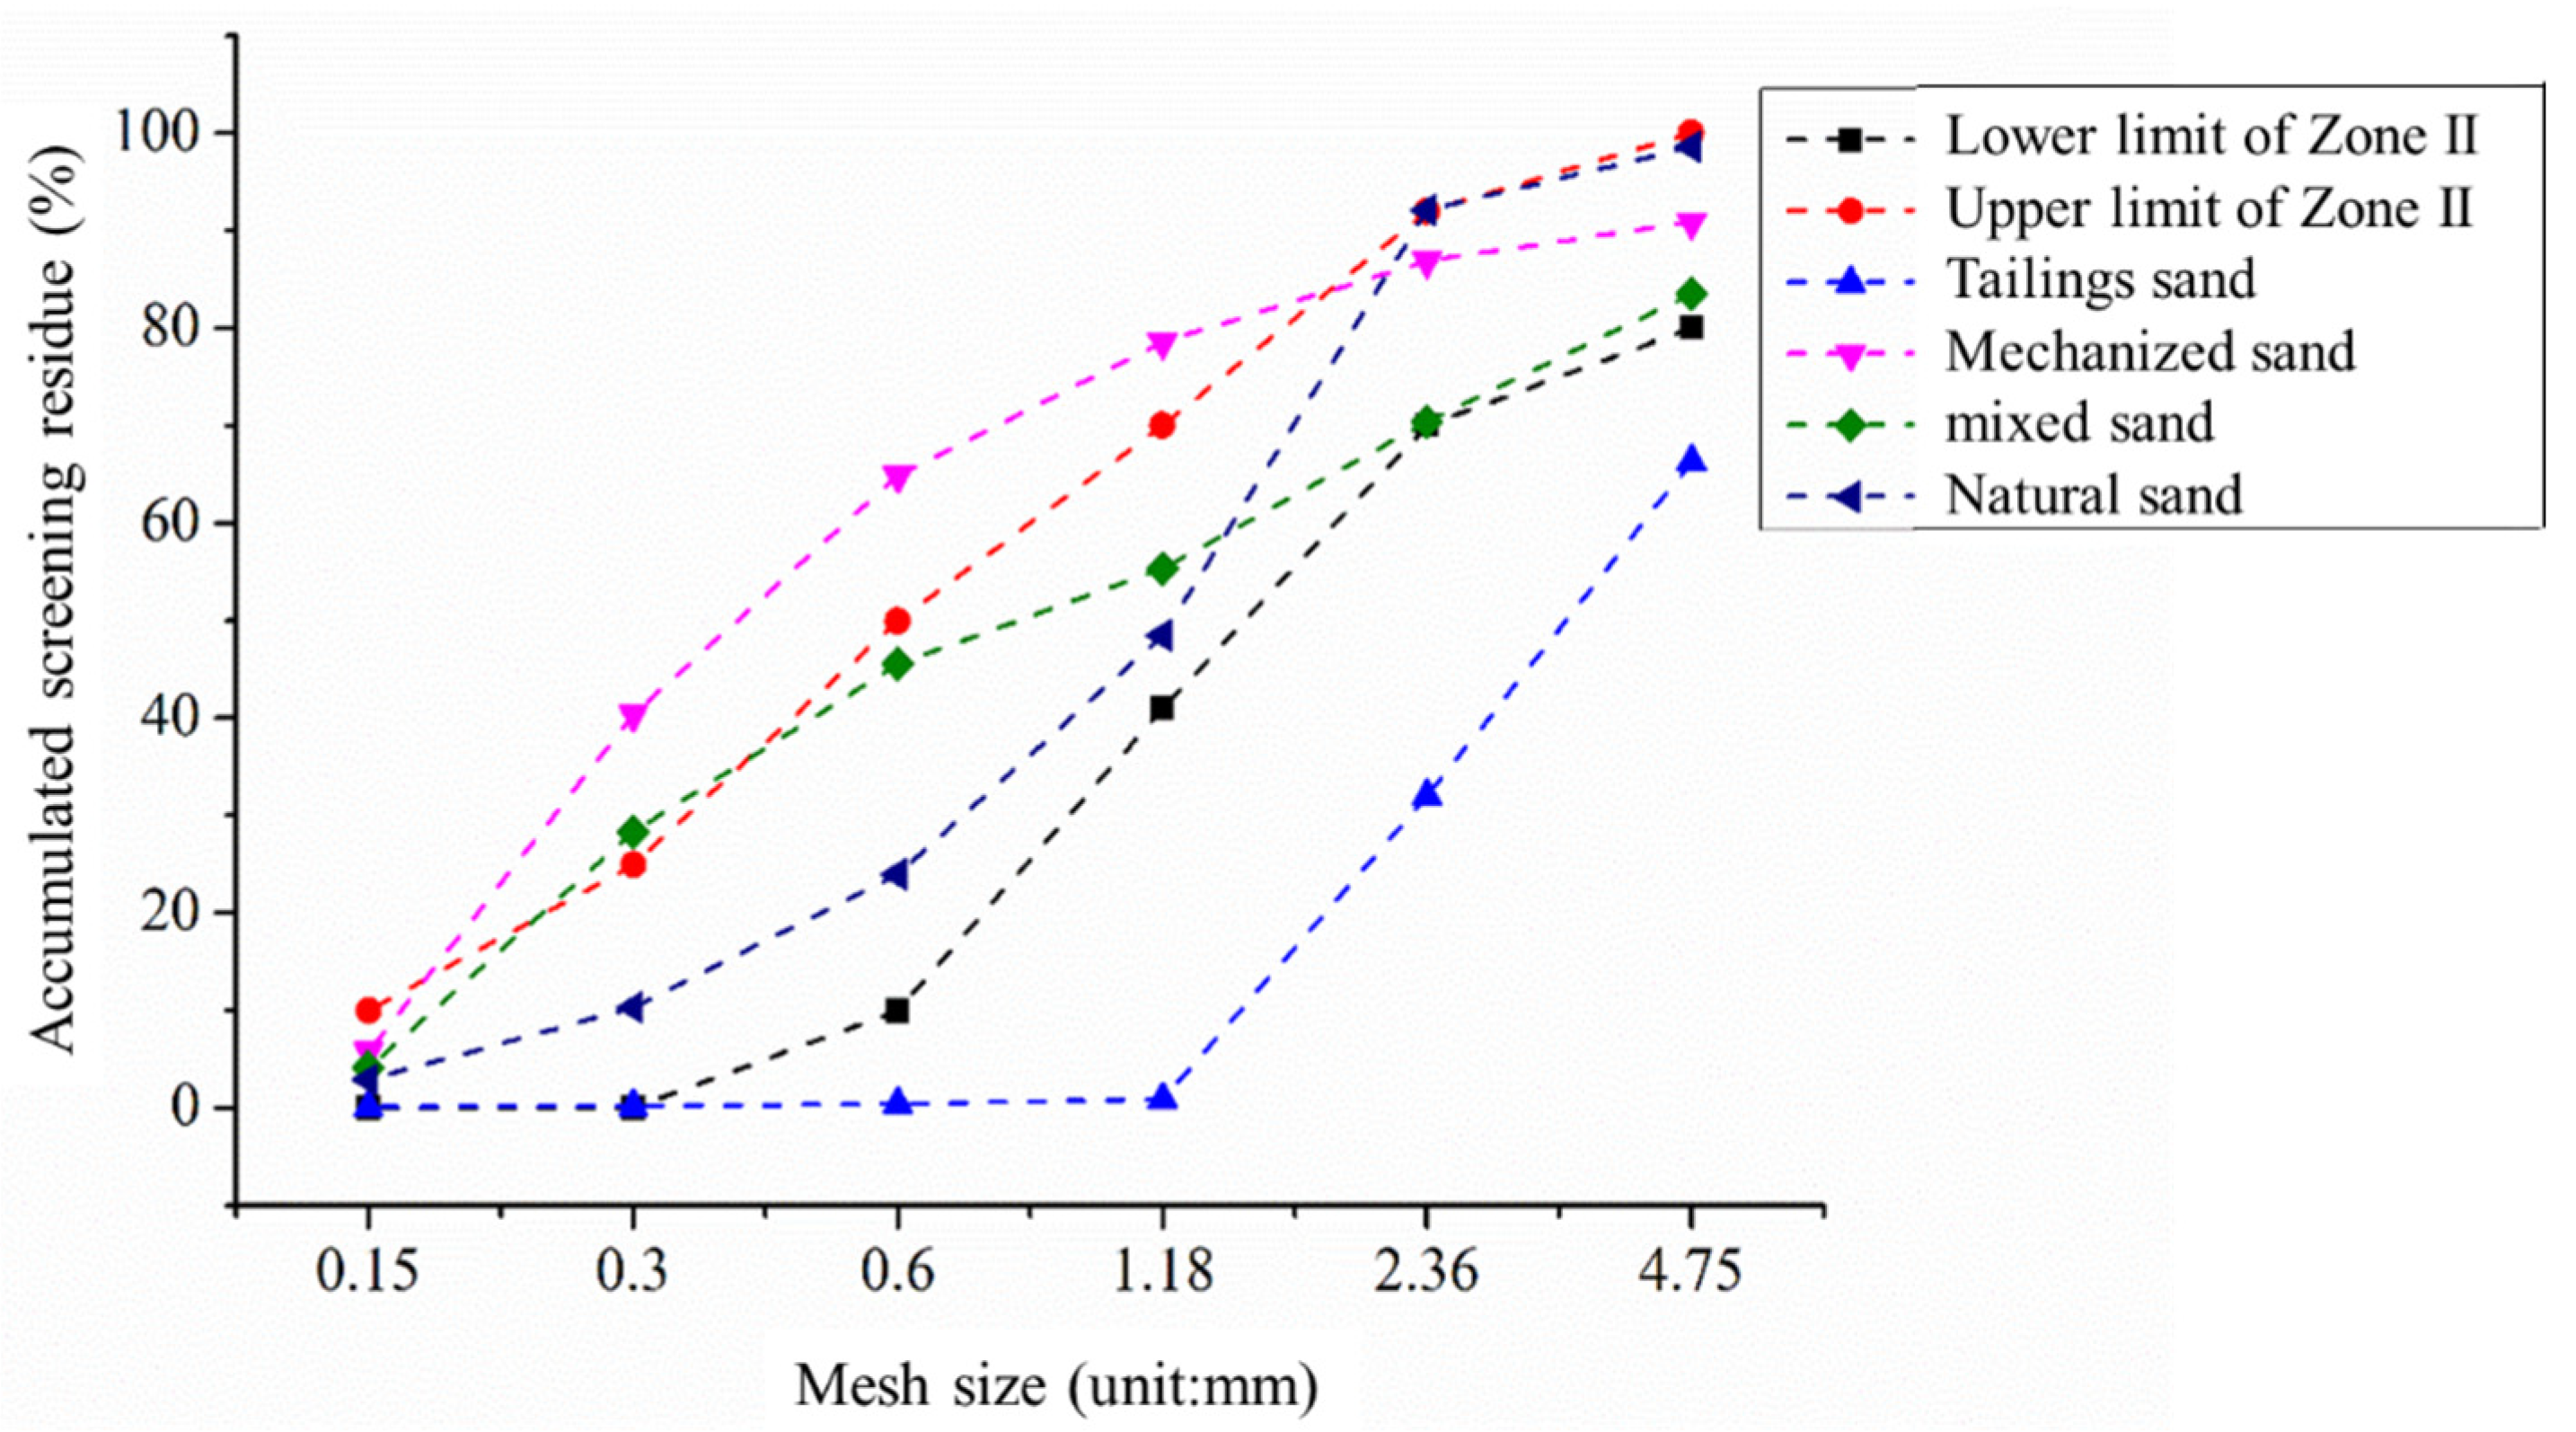
P.O. 52.5 cement was used, with the performance indices shown in Table 1. Limestone powder (specific surface area 650 m2/kg, D50 = 2.863 μm), Class F Grade I fly ash, S95 grade slag (specific surface area 435 m2/kg, density 2.89 g/cm3), and silica fume (average particle size 0.243 μm) were used as mineral admixtures; their properties are detailed in Table 2, Table 3 and Table 4. The fine aggregates included natural river sand (fineness modulus of 2.6), machine-made sand (fineness modulus of 3.4), and tailings sand (fineness modulus of 0.9), and the basic performance indices are listed in Table 5. The grading curves of the fine aggregates are shown in Figure 1, where the 3:7 mixed sand (machine-made sand: tailings sand) meets Zone II requirements. The coarse aggregate was 5–31.5 mm of continuous graded crushed stone (mud content of 1%), and the particle size distribution is shown in Table 6. A PCAI-type polycarboxylate superplasticizer (solid content 22.53%, water reduction rate 28%) was used, as shown in Table 7.
Table 1.
Performance specifications of the cement.
Table 2.
Performance indices of the fly ash.
Table 3.
Performance indices of the slag.
Table 4.
Performance specifications of silica fume.
Table 5.
Basic performance indices of the sand.
Figure 1.
Gradation curve of the sand.
Table 6.
Particle size distribution of the sand.
Table 7.
Performance indices of the PCA-I polycarboxylic acid water-reducing agent [27].
2.2. Concrete Mix Design
Fifteen concrete mixes were designed with target strengths of 60–90 MPa, as shown in Table 8. Mineral admixtures (limestone powder + fly ash + slag + silica fume) substituted 30–45% of the cement, and the fine aggregates were natural sand (S), machine-made sand (M), tailings sand (T), or mixed sand (M + T mixed sand or M + T + S mixed sand).
Table 8.
Mix design and compressive strength values of the concrete composites of powder tailings and sand.
Based on different w/b ratios, the mix design was divided into three series: Group A (w/b ratio = 0.30), Group B (w/b ratio = 0.25), and Group C (w/b ratio = 0.20). Mix designs using natural sand as fine aggregate were designated as AS, BS, and CS. For the AT, BT, and CT series employing mixed sand as fine aggregate, single-factor and multi-factor comparative analyses were conducted by adjusting limestone powder content, silica fume content, and mixed sand composition while maintaining total cementitious material content.
2.3. Test Methods
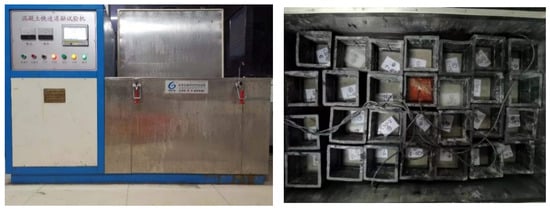
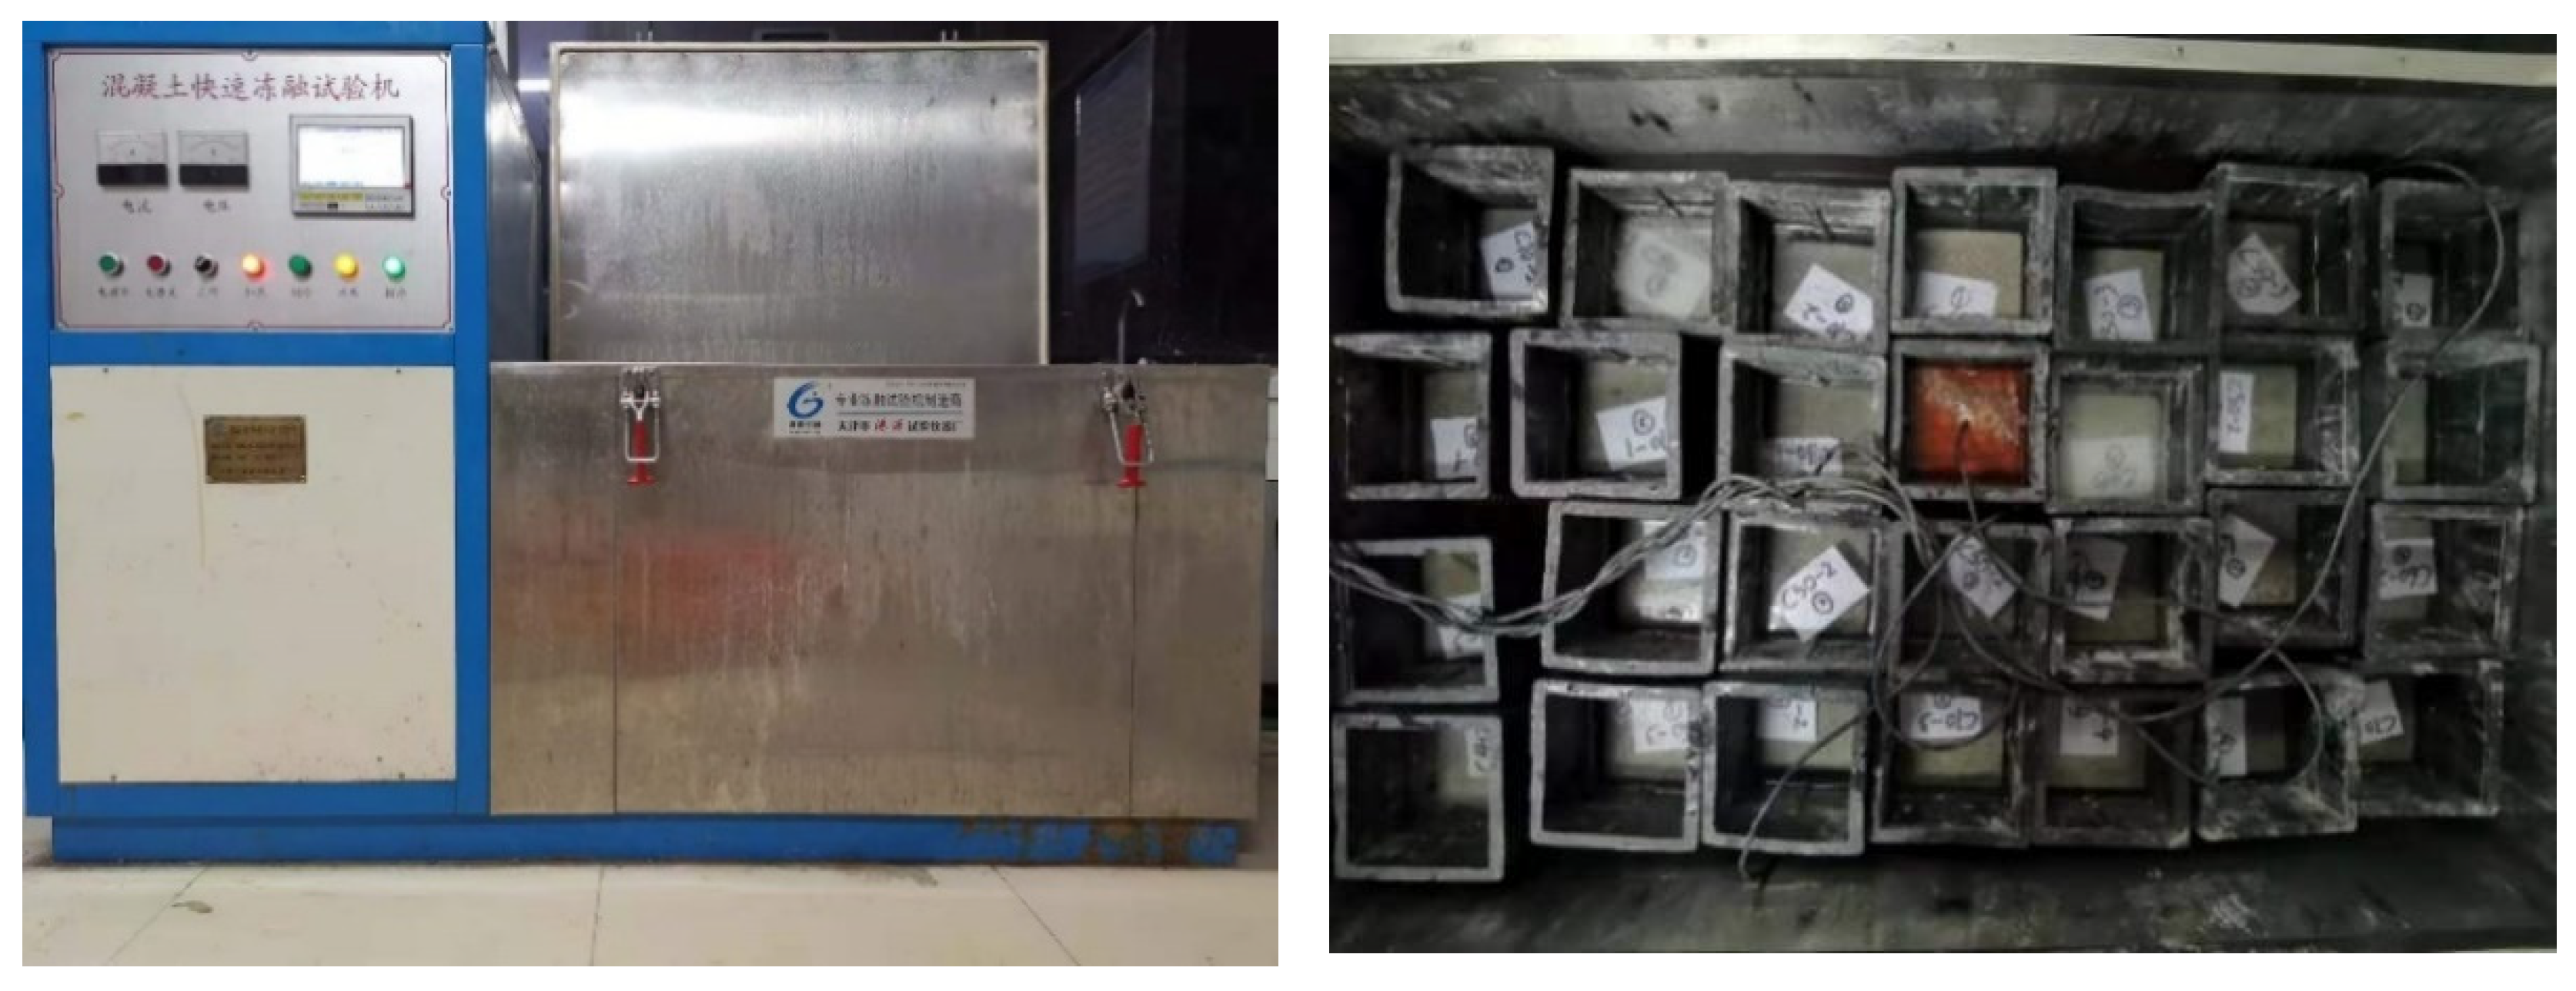
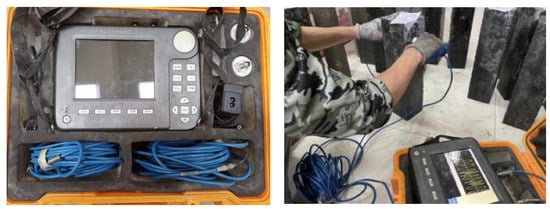
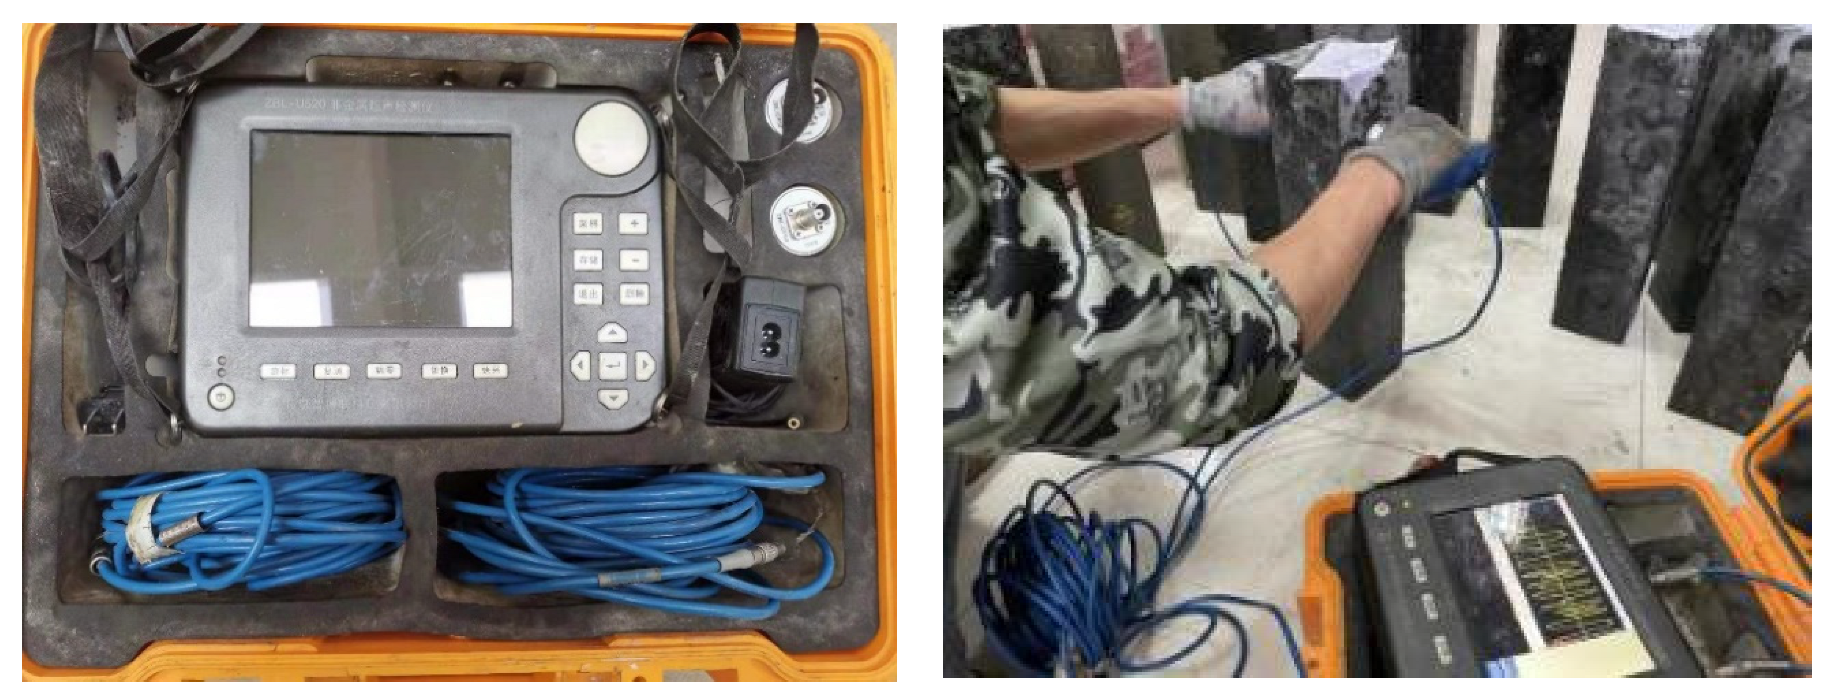
Freeze–thaw tests were conducted in accordance with SL/T 352-2020 [28] using the rapid freezing method. The temperature change rate was controlled at 10–15 °C/h; the samples (100 mm × 100 mm × 400 mm) were cured at (20 ± 2) °C and relative humidity ≥ 95% for 24 d, then immersed in water at (20 ± 2) °C for 4 days to reach saturated surface-dry state, and then subjected to freeze–thaw cycles (temperature range: −16~7 °C; cycle duration: 2~4 h; melting time ≥ 0.5 h), as shown in Figure 2. Every 25 cycles, specimens were wiped to a surface-dry condition before mass and relative dynamic elastic modulus tests. Every 25 cycles, the specimens are wiped with a damp cloth to remove surface debris and water droplets, and then their mass and relative dynamic elastic modulus are measured under the saturated surface-dry condition. The test was terminated when the relative dynamic modulus was ≤60% or the mass loss was ≥5%, as shown in Figure 3.
Figure 2.
Freeze–thaw test instrument (Tianjin Gangyuan test instrument factory, Tianjin, China).
Figure 3.
Ultrasonic device (Beijing ZBL Science and Technology Co., Ltd., Beijing, China).
Symbols F, L, S, and T in the damage model represent the dosage of fly ash, limestone powder, slag, and mixed sand, respectively.
Key calculation formulas:
- Mass loss rate was determined with Equation (1) as follows:
With respect to Equation (1), the mass loss rate for each sample group can be presented as the arithmetic mean of the results obtained from the three individual samples.
- b
- Relative dynamic elastic modulus was calculated using Equation (2) as follows:
The arithmetic mean of the results from the three individual samples is expressed as the relative dynamic modulus of elasticity for each group.
To further elucidate the microstructural mechanism underlying the freeze–thaw resistance and performance degradation of composite concrete, microstructural tests were conducted on representative samples (before and after 100 freeze–thaw cycles). The degradation mechanism was systematically analyzed from three core perspectives, namely, pore structure evolution, interfacial transition zone (ITZ) deterioration, and hydration product phase transformation, with the test results closely linked to macro performance indicators (mass loss and relative dynamic modulus of elasticity).
2.3.1. Pore Structure
Mercury intrusion porosimetry (MIP) was used to characterize pore structure parameters (total porosity, pore size distribution, and average pore diameter), which are key factors affecting freeze–thaw durability. The test was performed using an AutoPore IV 9500 (Micromeritics, Norcross, GA, USA) mercury porosimeter, with a pressure range of 0.003–414 MPa (covering pore sizes from 3 nm to 100 μm). The samples (5 mm × 5 mm × 5 mm) were taken from the core of the freeze–thawed prisms and dried in a vacuum oven at 60 °C for 48 h to constant mass to avoid pore water interference.
2.3.2. Interfacial Transition Zone
Scanning electron microscopy (SEM) was used to observe the morphology of the ITZ. SEM tests were conducted using a QuantaTM 250 Environmental scanning electron microscopy (FEI Company, Hillsboro, OR, USA) (acceleration voltage: 10–15 kV). Specimens (10 mm × 10 mm × 10 mm) were cut from prism centers, polished, and gold-sprayed for electrical conductivity.
3. Results and Discussion
3.1. Microstructural Characteristics
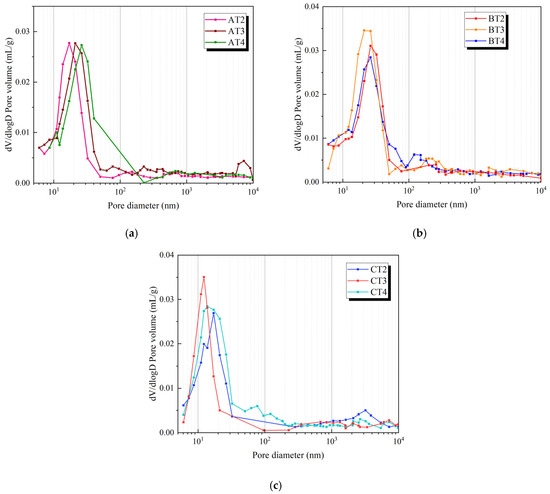
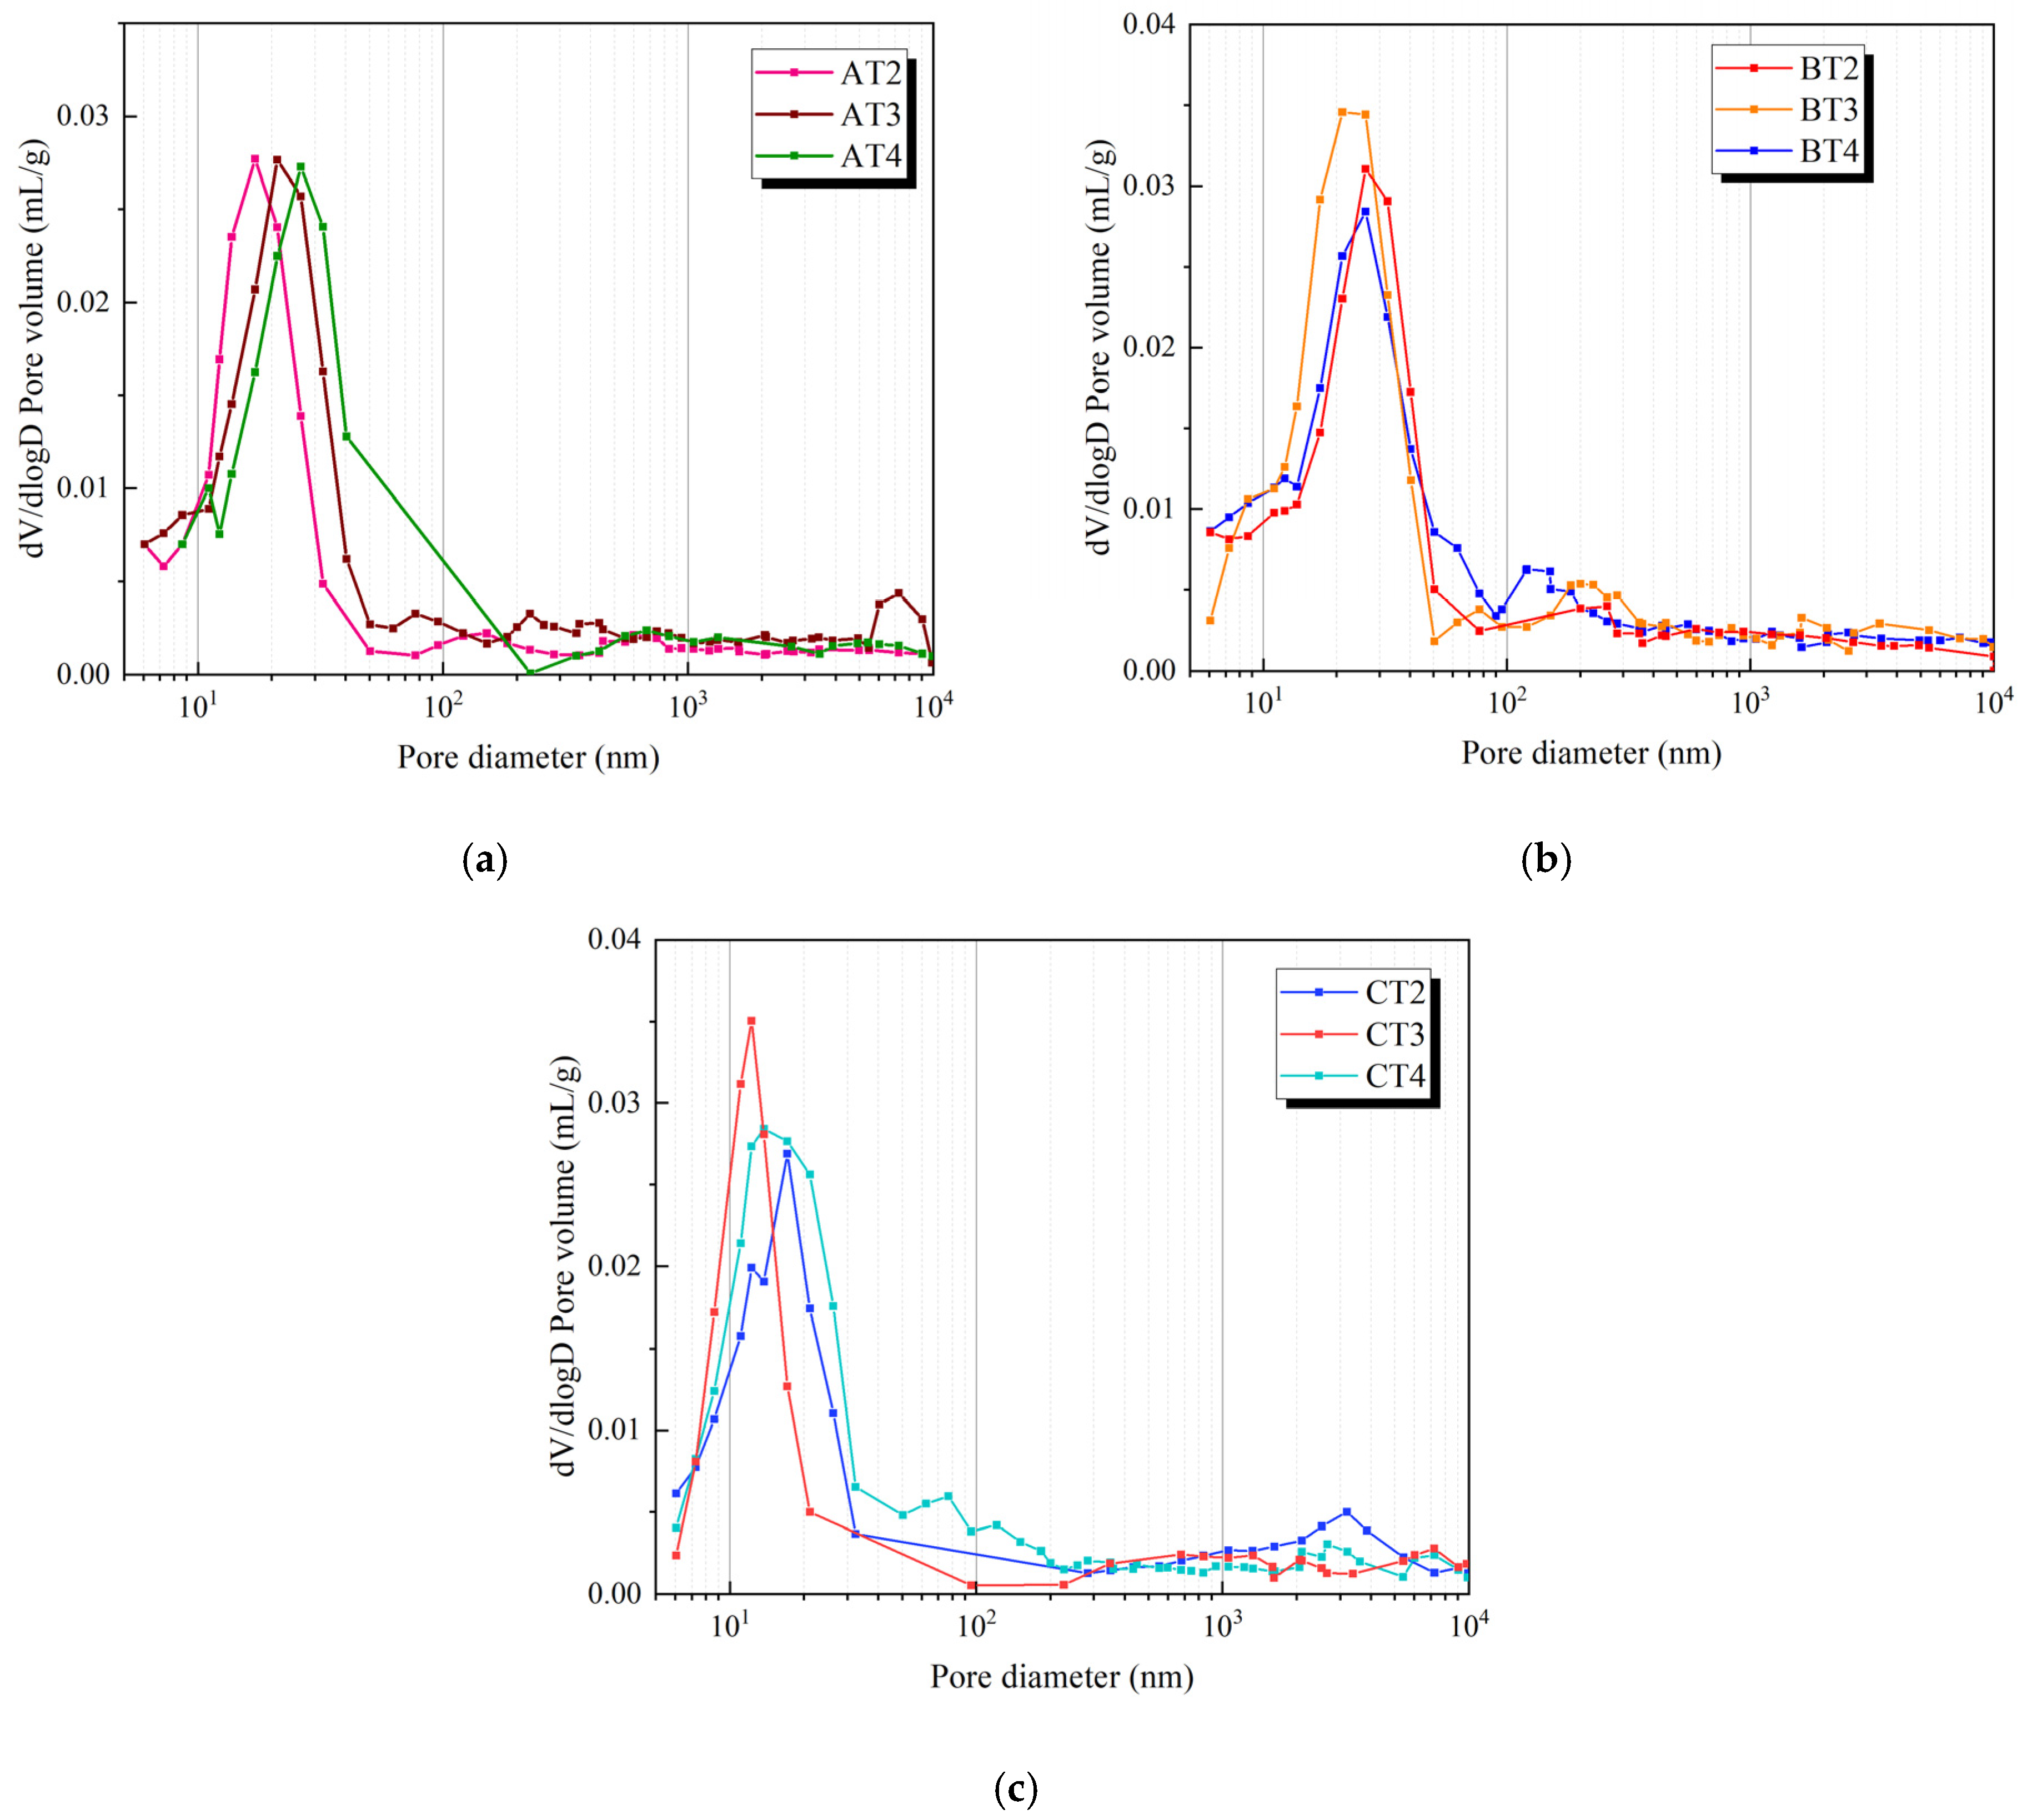
Figure 4a (drawn with Excel v2016) demonstrates that in concrete with a water-to-binder ratio of 0.30, the pore size distribution curve shifts progressively to the right as the tailings sand proportion increases, accompanied by a rise in the volume fraction of harmful pores. For the 0.25 water-to-binder ratio sample, BT3’s pore size distribution curve shows a leftward shift compared to BT2, with a significant increase in pore sizes below 50 nm. This phenomenon is attributed to the micro-aggregate effect of silica fume and the pore structure refinement through volcanic ash reactions. However, BT4 exhibits a further rightward shift in its pore size distribution curve alongside an elevated proportion of harmful pores above 50 nm, indicating that excessive silica fume agglomeration generates internal micro-cracks that exacerbate harmful pore formation. Comparative analysis of CT2 and CT3 reveals that adding 33 kg/m3 of LP causes the pore size distribution curve to shift leftward with higher small-pore intrusion peaks, demonstrating LP’s pore structure refinement effect. When LP dosage reaches 65 kg/m3, the curve shifts to the right with increased mercury intrusion volumes above 50 nm, suggesting that excessive limestone powder content leads to pore structure deterioration.
Figure 4.
Concrete pore size distribution curve. (a) AT series. (b) BT series. (c) CT series.
Freeze–thaw cycles induce repeated “freezing–expansion” and “melting–contraction” of pore water, leading to the following pore structure degradation: (1) The total porosity increases significantly as the internal tensile stress generated by ice crystal growth fractures small pores (≤50 nm) into medium–large pores (50–200 nm, harmful pores); (2) the pore size distribution shifts to coarse pores, with the proportion of harmful pores (50–200 nm) increasing by 15–30% and the average pore diameter increasing by 20–40% (depending on the w/b ratio); and (3) the pore connectivity is enhanced, resulting in the formation of a continuous pore network that accelerates the penetration of water and the propagation of freeze–thaw damage. Under optimal mixing sand proportion, SF dosage, and LP dosage, the concrete’s pore structure is optimized, resulting in enhanced frost resistance.
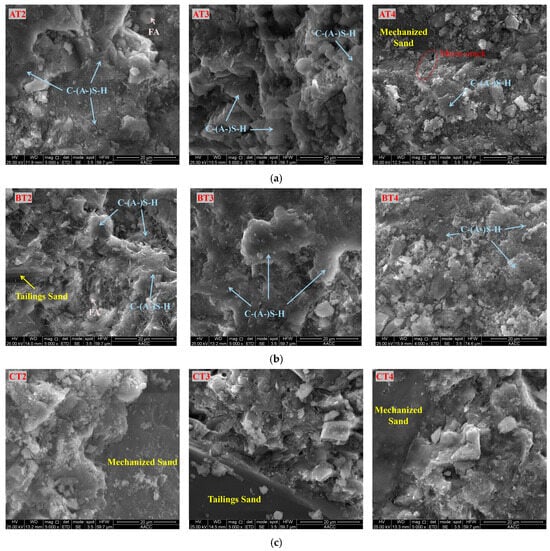
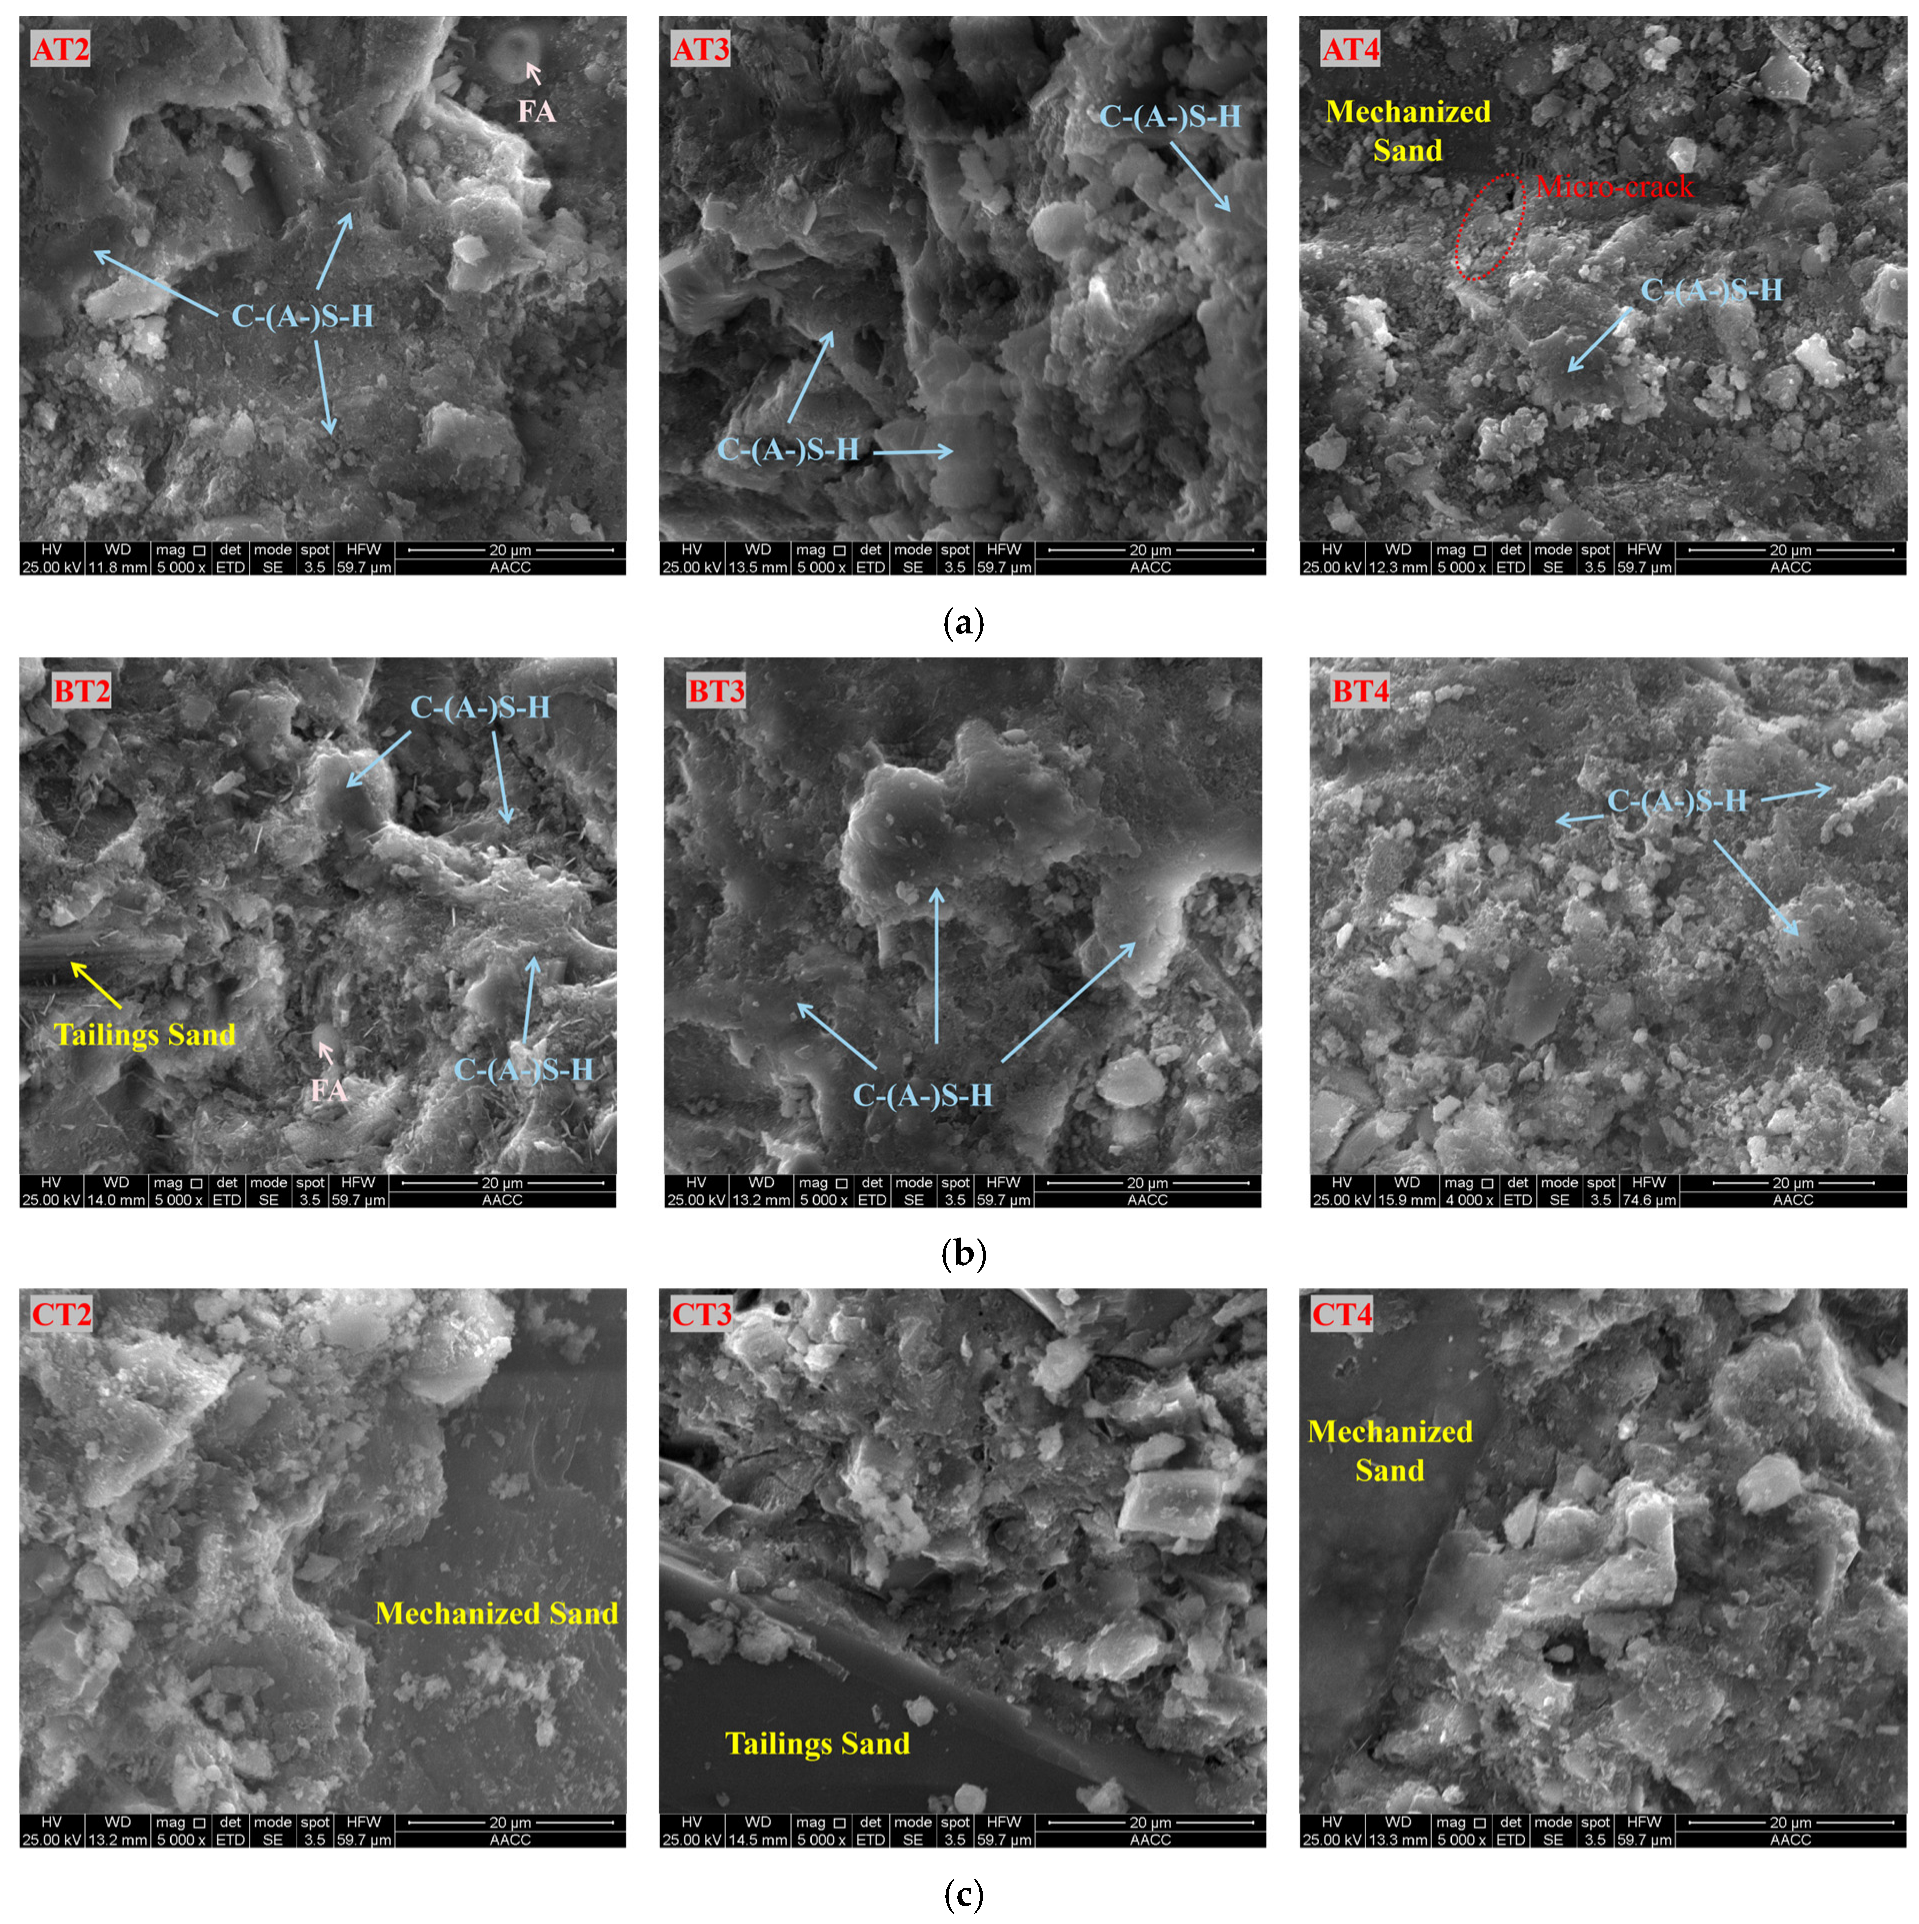
Figure 5 shows the micromorphology of the concrete ITZ. For the w/b = 0.30 samples (Series A), as the tailings sand proportion increases, the homogeneity of the ITZ gradually decreases, and microcracks were observed in the SEM image of AT4. For the w/b = 0.25 samples (Series B), the hydration products in BT3 are more uniformly distributed, and C-(A-)S-H effectively fills the micropores. For the w/b = 0.20 samples (Series C), as the LP content increases, both the size and number of micropores in the ITZ increase.
Figure 5.
Microscopic morphology of ITZ. (a) w/b = 0.30 samples. (b) w/b = 0.25 samples. (c) w/b = 0.20 samples.
The ITZ is the weakest link in the concrete, and its degradation under freeze–thaw cycles is the main cause of a decrease in macroperformance: (1) Morphological deterioration: Initially, dense ITZ (thickness: 20–50 μm) develops microcracks after freeze–thaw cycles, which gradually expand into visible cracks (thickness increases to 80–150 μm) due to repeated ice crystal extrusion; (2) Hydration degree reduction: EDS results show that the Ca/Si ratio of ITZ decreases from 1.8–2.2 to 1.2–1.6 after 100 cycles, indicating the decomposition of hydration products (e.g., C-(A-)S-H gel) and the loss of Ca(OH)2 (leached by melted water); (3) Aggregate-matrix bonding weakening: The cracks in the ITZ break the chemical and physical bonding between the aggregates and the matrix, leading to aggregate peeling (one of the main sources of mass loss) and a significant decrease in the dynamic modulus of elasticity.
3.2. Deterioration Characteristics
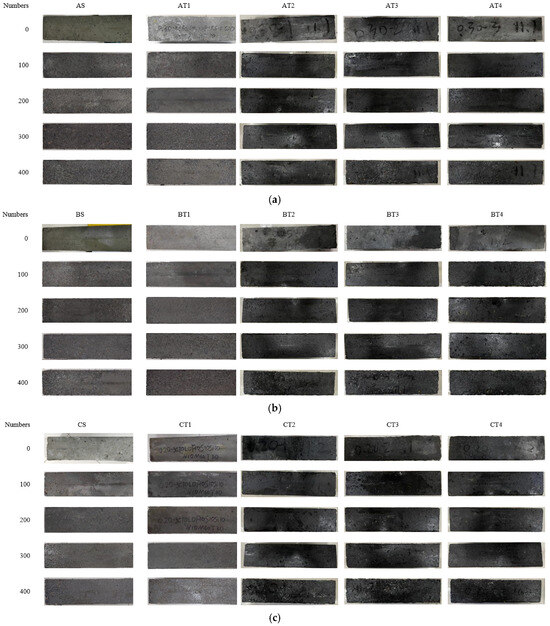
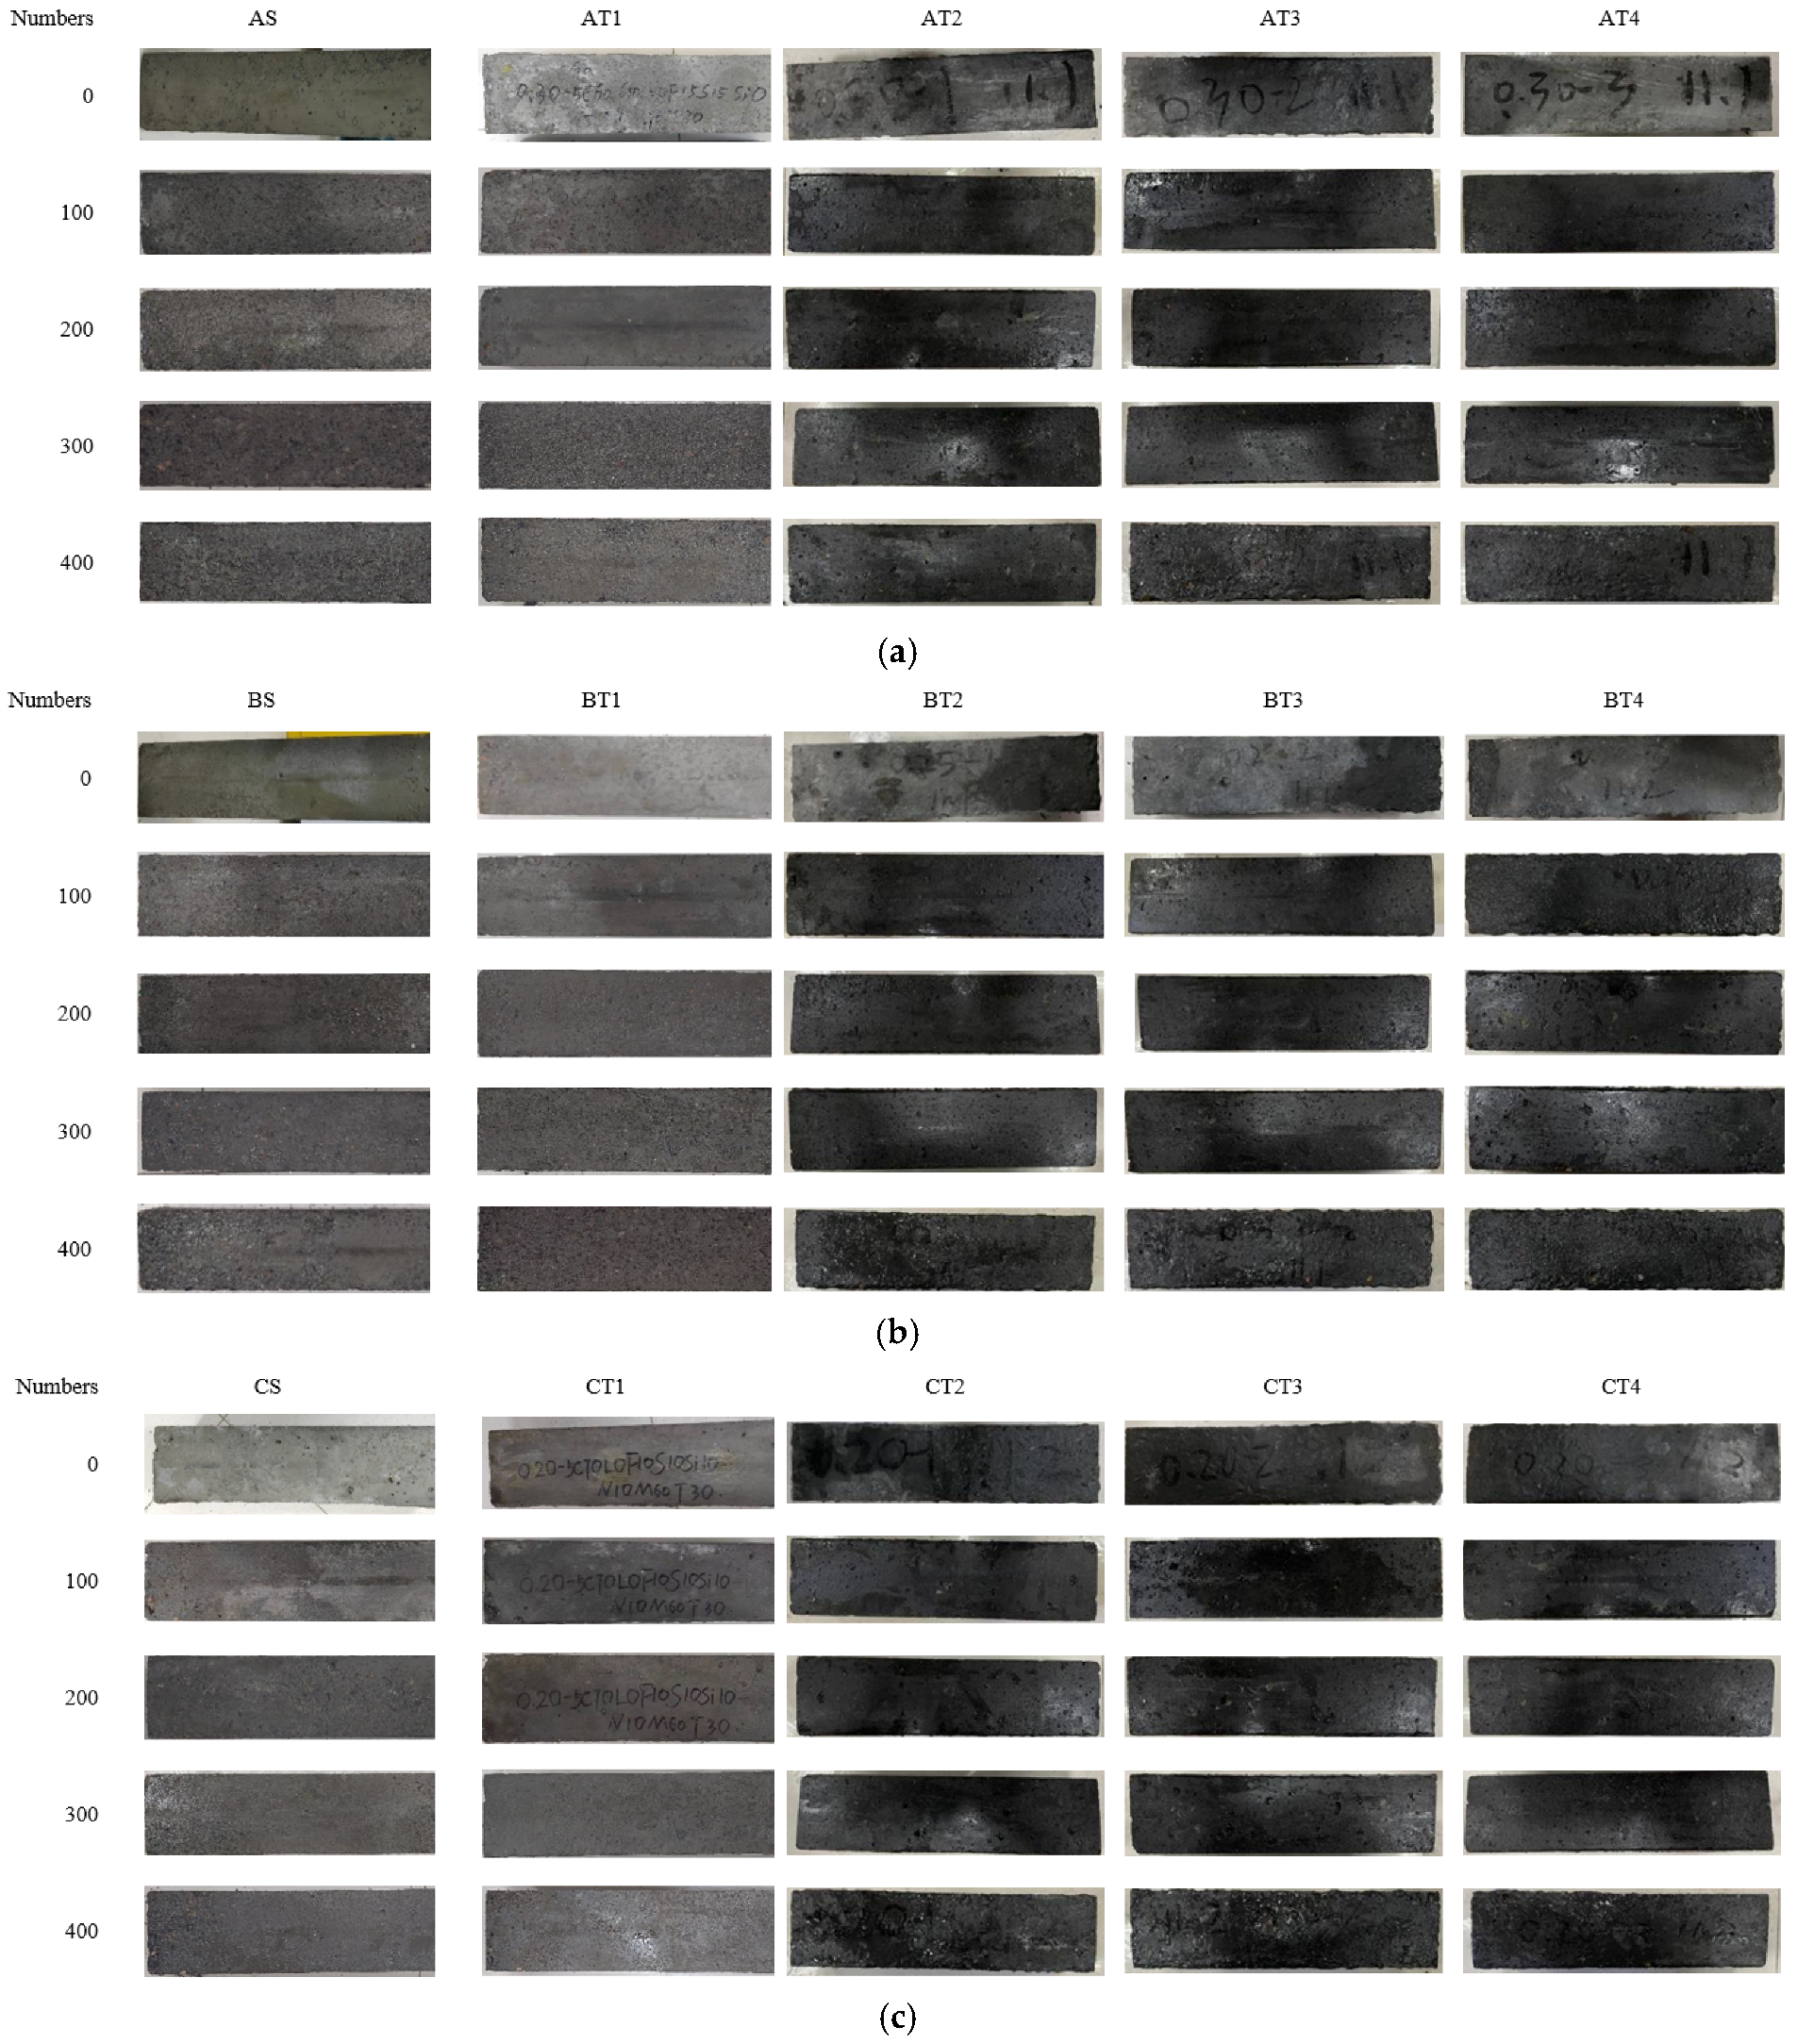
The apparent morphology of each sample after different numbers of freeze–thaw cycles is shown in Figure 6. The degradation degree of natural sand concrete is significantly higher than that of mixed sand concrete, and the deterioration is aggravated with the increase in w/b ratio.
Figure 6.
Changes in the apparent morphologies of the composite limestone powder concretes with increasing numbers of freeze–thaw cycles. (a) Specimens AS and AT. (b) Specimens BS and BT. (c) Specimens CS and CT.
The following conclusions can be obtained by examining the unique features of the different samples shown in Figure 6 after the implementation of different numbers of freeze–thaw cycles.
After 100 freeze–thaw cycles, the surface of sample AS exhibited considerable roughness; the cement slurry layer on the concrete exhibited signs of deterioration, and it began to peel off. By the 200th cycle, significant portions of this cement slurry layer were stripped away, especially at the sample extremities, thereby exposing the coarse aggregate beneath the concrete. After 325 cycles, coarse aggregates were visible on the surface and at the ends of the sample, indicating imminent failure.
Notably, sample AT demonstrated remarkable integrity, even after enduring a maximum of 125 freeze–thaw cycles. This sample showed only minor surface pores and minimal peeling of its cement slurry layer. Nevertheless, as the number of cycles increased, the number of small bubbles on the surface of the concrete notably increased, and the cement slurry layer exhibited significant peeling. By the 225th cycle, peeling intensified, and coarse aggregates at both extremities of the sample were revealed. After 400 cycles, the surfaces and ends of each sample were completely denuded from the cement slurry layer, exposing the underlying coarse aggregate in a distinct manner.
Before 150 freeze–thaw cycles were reached, only the cement slurry layer on the surface of the concrete began to peel. Moreover, no defects were apparent in the other parts of specimen BS. As the test continued, this cement slurry layer progressively peeled, with an enlarged area of peeling. This phenomenon was also observed at both ends of the sample. By the 300th cycle, significant peeling of the cement slurry layer was evident on the surface and both ends of the sample, revealing coarse concrete aggregates. The concrete experienced considerable deterioration by the 400th cycle; except for a few areas, the cement slurry layer was almost entirely eliminated. After 150 freeze–thaw cycles, the concrete surface of sample BT began to exhibit a few bubbles and peeling of the cement slurry layer. The degree of peeling of the cement slurry layer increased as the test progressed, with an enlarged area of peeling observed at both ends of the sample. By the 350th cycle, some coarse aggregates inside the concrete were visible at both ends of the sample, and the cement slurry layer on the sample surface was eliminated further. The deterioration in the concrete increased by the 400th cycle, resulting in an extremely rough surface.
After 250 freeze–thaw cycles, surface pores started to appear on sample CS, which were accompanied by slight peeling of the cement slurry layer. Notably, minimal detachment of this layer was observed at both ends of the sample, and no coarse aggregates were found within the concrete. The effect of freeze–thaw degradation on this sample was relatively mild. After 400 freeze–thaw cycles, more notable peeling of the surface and cement paste occurred at both ends of the sample, with a few coarse aggregates becoming visible. Specimen CS exhibited good freeze–thaw resistance. For specimen CT, after 250 cycles, no discernible external damage was observed, and it retained a high degree of integrity, although surface bubbles formed. After 275 cycles, minor detachment of the cement paste on the surface was noted, and the number of pores significantly increased. Upon reaching 400 cycles, further deterioration of the surface and cement paste was observed at both ends, exposing a small amount of coarse aggregate. Nevertheless, the overall appearance suggests that the degradation of the mechanism mixed sand concrete is smaller than that of natural sand concrete, highlighting the potential increase in frost resistance when machine-made mixed sand is incorporated into concrete.
3.3. Effects of the Concrete Composition on the Freeze–Thaw Resistance
3.3.1. Effect of the w/b Ratio
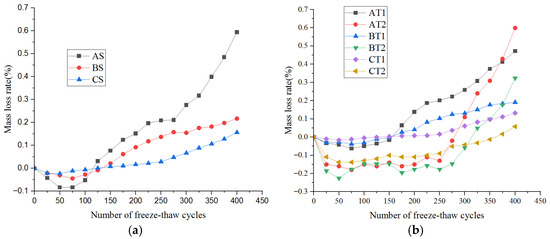
The concrete mass loss rates with different w/b ratios are shown in Figure 7. A significant negative correlation exists between the w/b ratio and the freeze–thaw resistance. For the w/b ratios 0.20, 0.25, 0.30 used in this study, the mass loss rates after 400 freeze–thaw cycles are 0.06%, 0.25%, and 0.60%, respectively.
Figure 7.
Effect of the w/b ratio on the mass loss rate of concrete. (a) Specimens AS, BS and CS. (b) Specimens AT, BT and CT.
As shown in Figure 7a, a significant negative correlation exists between the w/b ratio and the freeze–thaw resistance of the concrete. For instance, when the w/b ratio is 0.3, the mass loss rate of concrete after 400 freeze–thaw cycles is 0.6%. However, when the w/b ratio is reduced to 0.20, this value drops to only 0.06%. These findings suggest that a lower w/b ratio results in a slower increase in the mass loss rate of the concrete during freeze–thaw cycling, thereby enhancing its freeze–thaw resistance. Conversely, as the w/b ratio increases, the mass loss rate increases rapidly, leading to a gradual decrease in the freeze–thaw resistance. This deterioration is particularly notable under high w/b ratios, where the mass loss rate might sharply increase during the later stages.
The w/b ratio significantly affects the freeze–thaw resistance by determining the compactness of the internal structure of the concrete. A relatively low w/b ratio, such as 0.3, results in a dense internal concrete structure with a porosity as low as approximately 10% and with evenly distributed pores, thereby inhibiting the large-scale accumulation of water. During freeze–thaw cycles, the volume expansion pressure caused by water freezing only minimally damages the structure of the concrete, leading to a mass loss of approximately 0.0005% per cycle. Therefore, the mass loss is negligible, and the freeze–thaw resistance is excellent. As the number of cycles increases, this cumulative damage causes the mass loss rate to increase rapidly, substantially decreasing the freeze–thaw resistance.
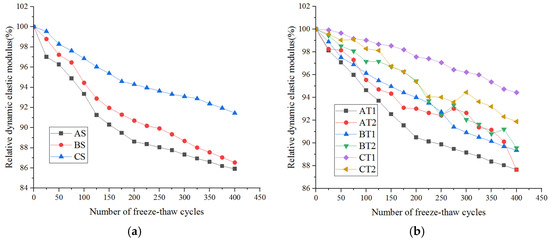
As shown in Figure 8, as the number of freeze–thaw cycles increases, the relative dynamic elastic modulus of the concrete decreases with increasing w/b ratio. This decrease is notably more significant for concrete with a high w/b ratio, such as the AT1 and AT2 groups (approximately 0.6). For the AT1 group, the initial value decreases approximately 98% to approximately 88% after 400 freeze–thaw cycles, representing a decrease of approximately 10%. Conversely, concrete with a moderate w/b ratio (e.g., BT1 and BT2 groups, approximately 0.5) experiences a more gradual decrease of approximately 9%, with the relative dynamic elastic modulus decreasing from its initial value of approximately 99% to approximately 90%. For concrete with a low w/b ratio (e.g., the CT1 group, approximately 0.4), the decrease is even more gradual at approximately 5%, with the relative dynamic elastic modulus decreasing from its initial value of approximately 100% to approximately 95%. Overall, the data suggest that as the w/b ratio increases, the relative dynamic elastic modulus decreases.
Figure 8.
Effect of the w/b ratio on the relative dynamic elastic modulus of concrete. (a) Specimens AS, BS and CS. (b) Specimens AT, BT and CT.
The correlations between the dynamic elastic modulus variations and the degree of damage to the internal structure of the concrete under different numbers of freeze–thaw cycles are significant. From a quantitative structural density perspective, concrete with a low w/b ratio has a low internal porosity (approximately 10%) and a uniformly distributed pore structure. During freeze–thaw cycles, the volumetric expansion pressure generated by water freezing mitigates the damage to the internal structure of the concrete, leading to an approximately 0.005% loss in the relative dynamic elastic modulus per cycle. Conversely, concrete with a high w/b ratio has a relatively high internal porosity (reaching 25%) and is characterized by numerous large and interconnected pores. Moisture can accumulate in these pores, and the resulting expansion pressure from water freezing inflicts continuous damage to the internal structure, causing an approximately 0.025% loss in the relative dynamic elastic modulus per cycle. With an increasing number of freeze–thaw cycles, this damage intensifies, leading to a rapid decrease in the relative dynamic elastic modulus for concrete with a high w/b ratio, whereas the decline is relatively slow for concrete with a low w/b ratio.
3.3.2. Effect of Limestone Powder
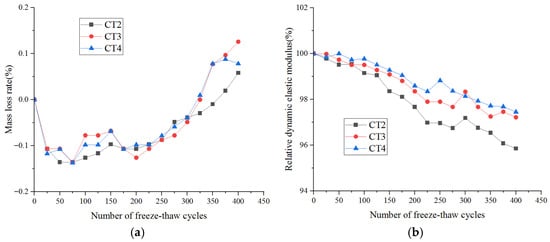
The changes in the mass loss rates of specimens CT2, CT3, and CT4 before and after the cement was replaced with limestone powder are shown in Figure 9a, and the changes in the relative dynamic elastic modulus are shown in Figure 9b.
Figure 9.
Effect of limestone powder on the freeze–thaw resistance of concrete. (a) Mass loss. (b) Relative dynamic elastic modulus.
Limestone powder contents in CT2, CT3, CT4 are 0 kg/m3, 33 kg/m3, and 65 kg/m3, respectively. The mass loss rate increases with freeze–thaw cycles.
The mass loss rate curve indicates an increasing trend in the mass loss rate for the CT2, CT3, and CT4 groups as the number of freeze–thaw cycles increases. After 400 cycles, the mass loss rate is approximately 0.06% for the CT2 group, 0.12% for the CT3 group, and 0.09% for the CT4 group. The relative dynamic modulus curves decrease in all three groups as the number of freeze–thaw cycles increases. The CT2 group experienced the most significant decrease, with an initial decrease of approximately 100%. This value decreases to approximately 96% after 400 cycles. For the CT3 group, the initial rate decreases to approximately 100% after 400 cycles, whereas the initial rate of the CT4 group decreases to approximately 98% after the same number of cycles. In general, the moderate addition of limestone powder (as seen in the CT3 and CT4 groups compared with the CT2 group) can decelerate the rate of mass loss and decrease the relative dynamic modulus, thereby enhancing the freeze–thaw resistance of the concrete. Nevertheless, excessive addition, as in the CT2 group (if the quantity of limestone powder is unreasonable), can negatively affect the freeze–thaw resistance of the concrete.
The effects of limestone powder on the freeze–thaw resistance of concrete are associated with its ability to fill internal pores and participate in hydration reactions. A quantitative analysis of the internal pore structure reveals that an optimal quantity of limestone powder, as seen in the CT3 and CT4 groups, can effectively fill the capillary pores within the concrete. This phenomenon reduces the overall porosity and refines the pore structure. During freeze–thaw cycles, the potential damage from water freezing expansion on the concrete structure decreases, leading to a gradual increase in the mass loss rate and a moderate decrease in the dynamic modulus. However, an excessive amount of limestone powder, exemplified by the CT2 group, may result in overfilling within the concrete. This phenomenon affects the consistency of cement hydration and might even introduce additional harmful pores. During freeze–thaw cycles, these detrimental pores can become sites of water accumulation and frost heave damage, thus expediting structural damage to the concrete. This process results in a rapid increase in the mass loss rate and a pronounced reduction in the relative dynamic modulus.
3.3.3. Effects of Fly Ash and Slag on the Freeze–Thaw Resistance
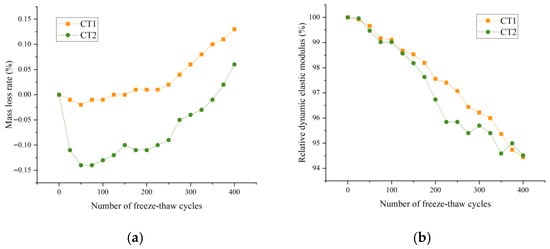
The mass loss rate trends for select concrete samples, both before and after the cement is replaced with a fly ash and slag mixture, are shown in Figure 10a. Moreover, the trends concerning the relative dynamic elastic moduli are shown in Figure 10b.
Figure 10.
Effects of fly ash and slag on the freeze–thaw resistance of concrete. (a) Mass loss. (b) Relative dynamic elastic modulus.
The active ingredients in fly ash and slag can engage in secondary hydration reactions, generating additional C-S-H gel to refine the pore structure. Under the mix proportions of this study, the synergistic improvement of fly ash and slag is not significant; the synergistic effect becomes significant only at a fly ash to slag ratio of 1:1 and total replacement rate of 30%.
The mass loss rate curve indicates an increasing trend in the mass loss rates of concrete groups AT2, AT3, BT2, BT3, CT2, and CT3 as the number of freeze–thaw cycles increases. After 400 cycles, the mass loss rate of the AT2 group is approximately 0.65%, representing the greatest increase. The rates for the AT3, BT3, and CT3 groups are approximately 0.25%, 0.35%, and 0.15%, respectively, signifying a relatively gentle increase. The relative dynamic modulus curve decreases for each group as the number of freeze–thaw cycles increases. The AT2 group experiences the most significant decrease, with an initial decrease of approximately 100% and a decrease to approximately 86% after 400 cycles. The initial rate for the AT3 group is approximately 100%, which decreases to approximately 90% after 400 cycles. For the CT3 group, the initial rate is approximately 100%, and it is maintained at approximately 95% after 400 cycles. Overall, the addition of fly ash slag (as seen in the AT3, BT3, and CT3 groups compared with the AT2 group) can decelerate the increase in the mass loss rate and the decrease in the relative dynamic modulus, thereby enhancing the frost and thaw resistance of the concrete. The degrees of improvement in the frost and thaw resistance vary at different mixing ratios, suggesting that appropriate mixing can effectively optimize performance.
The effects of fly ash slag on the freeze–thaw resistance of concrete can be attributed to the volcanic ash and filling capabilities of the admixture. A quantitative analysis of the internal structure reveals that the active ingredients in fly ash and slag can engage in secondary hydration reactions with calcium hydroxide, which is produced by cement hydration. This process generates additional hydrated calcium silicate and other cementitious substances, which fill the internal pores of the concrete, thereby reducing the porosity and refining the pore structure. Furthermore, the particles of fly ash and slag can occupy the spaces between the cement particles, thereby optimizing the microstructure of the concrete. As a result, during freeze–thaw cycles, the interior of the concrete becomes increasingly dense, which inhibits the accumulation of large amounts of water. This inhibition subsequently decreases the destructive effects of water freezing and expansion on the concrete structure, leading to a relatively slow increase in the mass loss rate and a decrease in the relative dynamic modulus. For instance, in the AT2 group, if the fly ash slag mixture is not appropriately formulated, such as with an incorrect dosage or proportion, it may not fully utilize the secondary hydration and filling effects. This phenomenon may lead to inadequate early strength development of the concrete, defects in the internal structure, and increased susceptibility to damage under freeze–thaw cycles. Consequently, this process can cause a rapid increase in the mass loss rate and a significant decrease in the relative dynamic modulus.
3.3.4. Effect of Silica Fume on the Freeze–Thaw Resistance
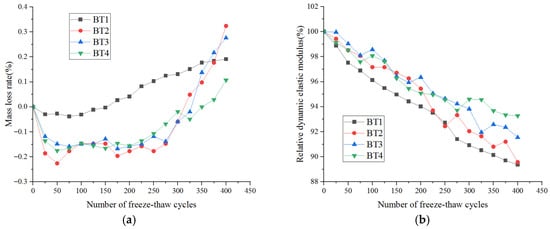
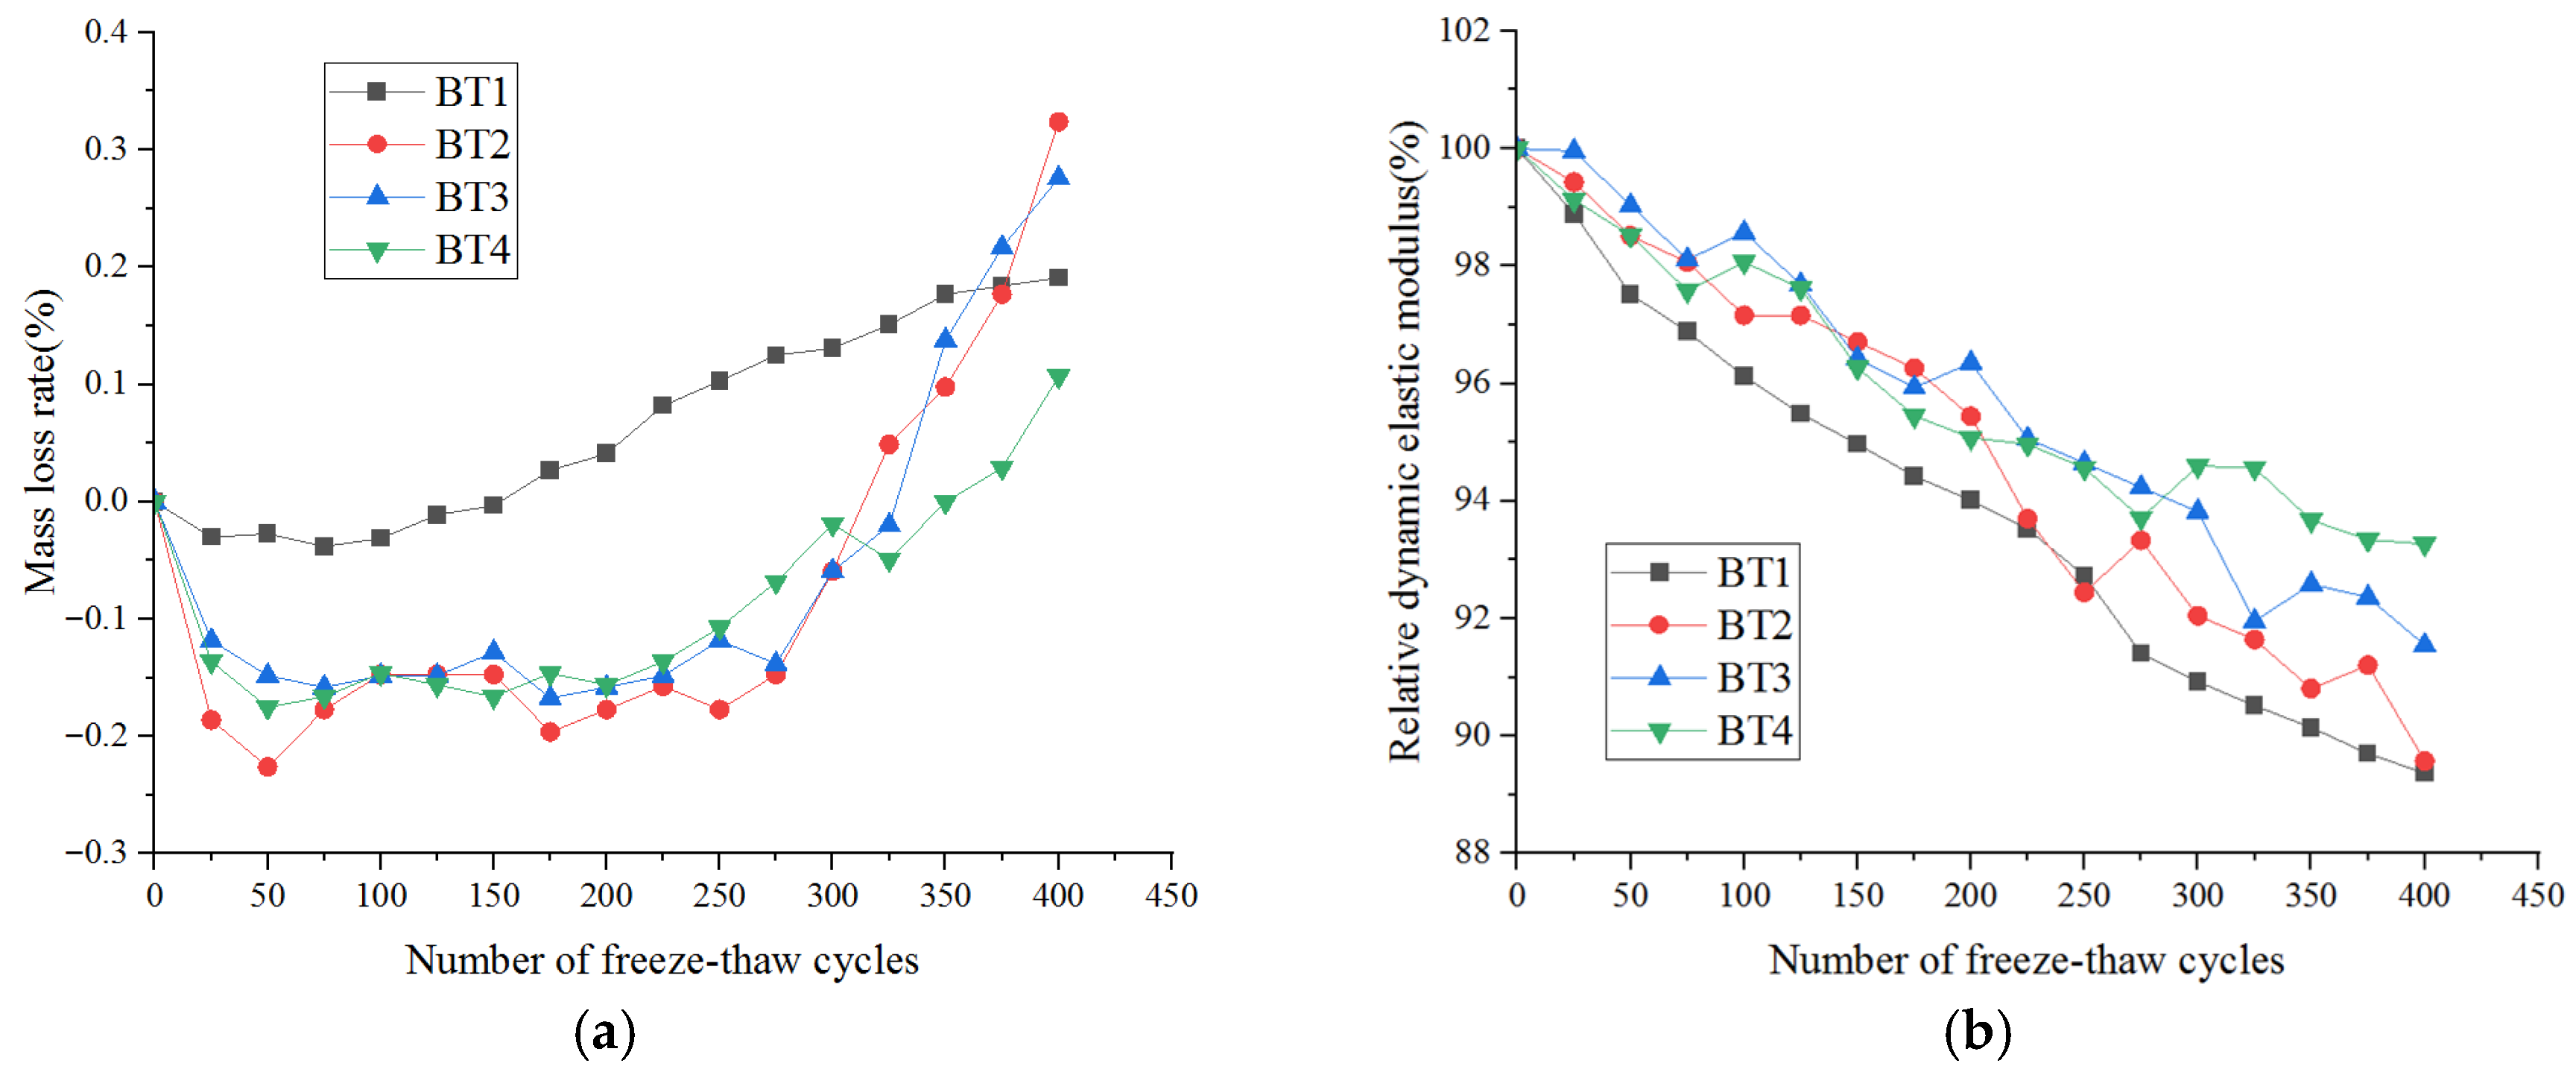
Taking sample BT as an example, the influences of the proportion of silica fume and the number of freeze–thaw cycles on the mass loss rate and relative dynamic modulus of the concrete are shown in Figure 11.
Figure 11.
Effect of silica fume on the freeze–thaw resistance of specimens of BT. (a) Reduction in the mass. (b) Reduction in the relative dynamic elastic modulus.
BT1 is excluded from the discussion because its sand proportion differs greatly from other BT groups, and sand type effect dominates over the silica fume effect. Reasonable silica fume dosage refines pore structure and improves freeze–thaw resistance.
The mass loss rate curve indicates an increasing trend in the mass loss rate of the concrete for groups BT1, BT2, BT3, and BT4 as the number of freeze–thaw cycles increases. After 400 cycles, the mass loss rate is approximately 0.2% for the BT1 group, 0.32% for BT2, 0.28% for BT3, and 0.1% for BT4. Notably, the BT2 group experienced a relatively rapid increase, whereas the BT4 group exhibited a slow rate of increase. The relative dynamic modulus curve shows a decrease in the relative dynamic modulus for each group as the number of freeze–thaw cycles increases. The BT1 group initially significantly decreases from approximately 100% to approximately 89% after 400 cycles. For the BT4 group, the initial rate is approximately 100%, and it is maintained at approximately 93% after 400 cycles. Overall, the addition of a reasonable quantity of silica fume (as seen in the BT4 group compared with the BT1 group) can decelerate the increase in the mass loss rate and the decrease in the relative dynamic modulus, thereby enhancing the frost resistance and thawing performance of the concrete. However, the degree of improvement in the frost resistance and thawing performance varies with different dosages of silica fume, indicating that an optimal dosage can effectively enhance these properties.
The effect of silica fume on the freeze–thaw resistance of concrete can be attributed to its ultrafine particle filling and volcanic ash properties. A quantitative analysis of the internal structure revealed that owing to their extreme fineness, silica fume particles can occupy the capillary pores in concrete, thereby reducing porosity and refining the pore structure. Concurrently, the active silica present in the silica fume interacts with the calcium hydroxide produced during cement hydration, generating an increased quantity of hydrated calcium silicate gel. This interaction further compacts the microstructure of the concrete. Consequently, throughout the freeze–thaw cycles, the interior of the concrete becomes increasingly dense, inhibiting the accumulation of substantial amounts of water. The freezing and expansion processes of water, which typically have destructive effects on the concrete structure, are mitigated. This mitigation results in a slower mass loss rate and a more gradual decrease in the relative dynamic modulus. For instance, in the BT1 group, an inadequate dosage of silica fume, owing to its inability to fully realize its filling and secondary hydration effects, leads to a lack of internal structural compactness in the concrete. Under freeze–thaw conditions, this structure is highly susceptible to damage, leading to a rapid increase in the mass loss rate and a pronounced decrease in the relative dynamic modulus. An overly high dosage, as observed in the BT2 group, might increase the water requirement of the concrete or cause the sudden generation of heat of hydration. Such occurrences can compromise the internal structural stability of the concrete and negatively impact its freeze–thaw performance.
3.3.5. Effects of Tailings and Sand on Freeze–Thaw Resistance
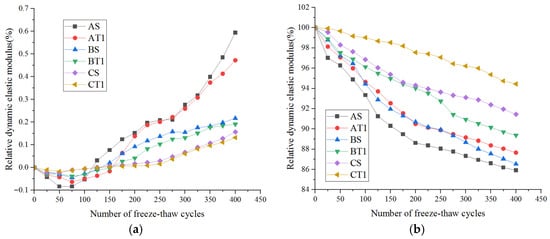
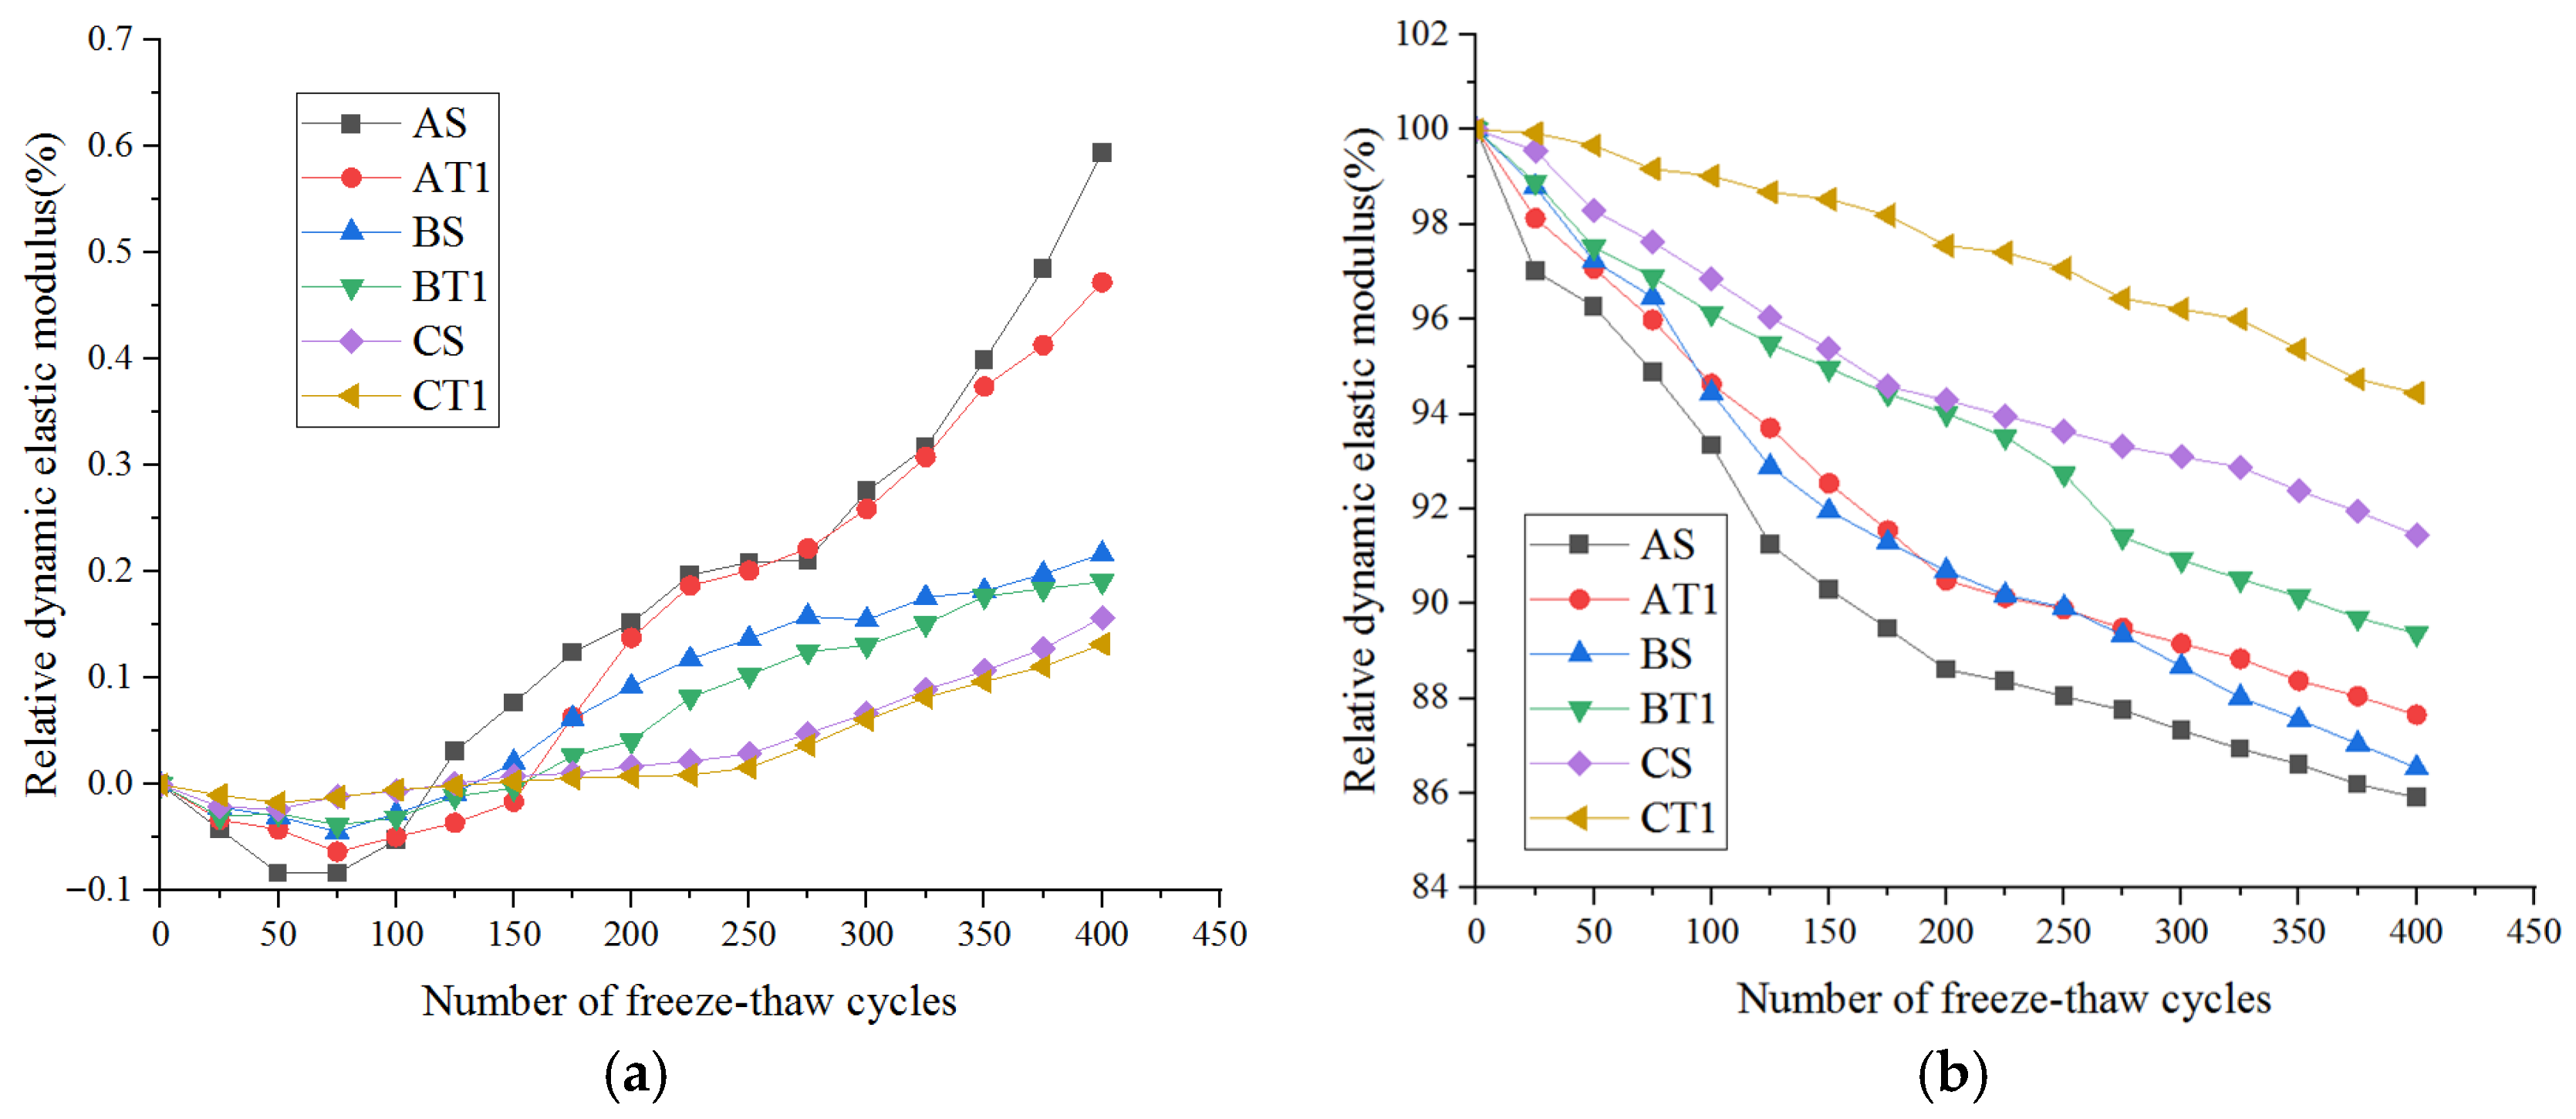
The relative dynamic modulus curves of various fine aggregate concretes are shown in Figure 12. Notably, the overall rate of decrease in the relative dynamic modulus for mixed sand concrete with different water/cement ratios is less than that for natural sand concrete with identical water/cement ratios.
Figure 12.
Effect of fine aggregates on the freeze–thaw resistance of concrete. (a) Mass loss ratio. (b) Relative dynamic elastic modulus.
The mass loss rate curve indicates an increasing trend in the mass loss rate for the AS, AT1, BS, BT1, CS, and CT1 concrete groups as the number of freeze–thaw cycles increases. Specifically, after 400 cycles, the AS group experienced the greatest increase, with a mass loss rate of approximately 0.65%, followed by the CT1 group (0.45%) and the BS group (0.25%), which both demonstrated more gradual increases. The relative dynamic modulus curve decreases for all the groups as the number of freeze–thaw cycles increases. The AS group experiences the most significant decrease, with an initial decrease of approximately 100%; in addition, it decreases to approximately 86% after 400 cycles. For the CT1 group, the initial decrease is approximately 100%, but it is maintained at approximately 95% after 400 cycles. In general, incorporating tailings sand and machine-made mixed sand (for instance, the CT1 and BS groups compared with the AS group) can decelerate the increase in mass loss rate and the decrease in the relative dynamic modulus, thereby enhancing the freeze–thaw resistance of the concrete. Furthermore, the increase in the freeze–thaw resistance varies according to the sand mix ratio, suggesting that an optimal mix ratio can significantly enhance the performance.
The impact of mixed tailings sand and machine-made sand on the freeze–thaw resistance of concrete is derived from its ability to optimize the particle size and adjust the internal structure of the concrete. By conducting a quantitative analysis of the particle size distribution and using rational proportioning of tailings–machine-made mixed sand, one can enhance the grading of concrete aggregates. This improvement results in more compact filling between the aggregates and reduced overall porosity within the concrete. Furthermore, certain active components in tailings can interact with cement hydration products to produce supplementary cementitious substances, thereby further compacting the microstructure of the concrete. As a result, during freeze–thaw cycles, the interior of the concrete becomes denser, which inhibits the accumulation of substantial amounts of water. Consequently, the detrimental effects of water freezing and expansion on the concrete structure are mitigated, leading to a slower mass loss rate and a more gradual decrease in the relative dynamic modulus. For instance, in the AS group, an unreasonable sand ratio, such as that resulting from the use of a single sand type or an improper mixing ratio, can result in poor aggregate gradation and increased internal porosity in the concrete. This phenomenon makes the structure highly susceptible to damage during freeze–thaw cycles, prompting a rapid increase in the mass loss rate and a pronounced decrease in the relative dynamic modulus.
4. Freeze–Thaw Damage Model
When subjected to freeze–thaw cycling, the extent of damage to the concrete is evident in terms of its quality and elasticity. This damage is intrinsically linked to the mixing ratio of industrial solid waste. Additionally, the degree of damage is influenced by the w/b ratio of the concrete and the frequency of the freeze–thaw cycles.
4.1. Freeze–Thaw Damage Model Based on Mass Loss
The relationship between the freeze–thaw damage variable D and the mass loss of the concrete is indicated in Equation (3), which is defined as model I.
The relationship between the mass loss of the concrete and the number of freeze–thaw cycles can be expressed as Equation (4).
where μ1: fly ash; μ2: limestone powder; μ3: slag; μ4: mixed sand; n: number of freeze–thaw cycles.
For fly ash, the influence coefficient is denoted as μ1 = f1 (1 − αF) F. Here, f1 serves as an empirical coefficient that gauges the impact of fly ash activity on compressive strength damage, typically ranging from 0.05 to 0.15. The activity index αF of fly ash quantifies its ability to engage in secondary hydration reactions, and its value generally lies between 0.6 and 0.9. The influence coefficient for limestone powder is given by μ2 = f2(1 − βL) L. In this equation, f2 is an empirical coefficient associated with the filler effect of limestone powder on freeze–thaw damage and ranges from 0.03 to 0.1. The filling coefficient βL of limestone powder is used to evaluate its effectiveness in filling concrete pores, which is contingent upon the particle size distribution and shape. This coefficient spans a range from 0.2 to 0.8. For slag, the influence coefficient is expressed as μ3 = f3(1 − γS) S. In this equation, f3 is an empirical coefficient that captures the impact of the slag’s hydration activity on freeze–thaw damage, which generally varies between 0.04 and 0.12. The hydration activity factor γS of the slag signifies its hydration reaction activity, with values ranging from 0.7 to 0.95. Finally, the influence coefficient for tailings–machine-made mixed sand is represented as μ4 = f4 (1 − δT) T. Here, f4 is an empirical coefficient that indicates the effect of mixed sand grading on freeze–thaw damage, with values in the range of 0.02–0.08. The grading parameter δT of mixed sand provides insight into the particle size distribution, as determined through screening tests. Superior grading corresponds to a δT value closer to 1.
4.2. Freeze–Thaw Damage Model Based on the Elastic Modulus
According to the theory of injury science, the expression for the degree of injury is indicated in Equation (5), which is defined as model II.
where D is the degree of damage, Es0 is the initial elastic modulus of the concrete, and Esn is the elastic modulus after damage.
Considering the influences of materials such as fly ash, limestone powder, slag, and tailings–machine-made mixed sand on the freeze–thaw resistance of concrete, the material influence coefficient λ is introduced in Equation (6).
where λ1–λ4 represent influence coefficients of fly ash, limestone powder, slag, and mixed sand. For fly ash, the influence coefficient is defined as λ1 = k1 (1 − αF) F, where k1 is an empirical coefficient representing the impact of fly ash activity on freeze–thaw damage, typically ranging from 0.05 to 0.15. The coefficient for limestone powder is λ2 = k2 (1 − βL) L, with k2 denoting an empirical coefficient ranging from 0.03 to 0.1, which is associated with the padding effect of limestone powder against freeze–thaw damage. For slag, the influence coefficient is calculated as λ3 = k3 (1 − γS) S, where k3 is an empirical coefficient, generally in the range of 0.04–0.12, indicating the significance of the effect of the slag hydration activity on the degree of freeze–thaw damage. Finally, the influence coefficient for tailings–machine-made mixed sand is expressed as λ4 = k4 (1 − δT) T, where k4 is an empirical coefficient that reflects the impact of mixed sand grading on freeze–thaw damage, with values ranging from 0.02 to 0.08.
4.3. Freeze–Thaw Damage Model Based on the Relationship Between the Concrete–Water–Cement Ratio and Cycle Number
The extent of freeze–thaw damage, denoted as D, is influenced conjointly by w/b and the number of freeze–thaw cycles (n). A nonlinear regression model, derived from the patterns observed in the experimental data, is employed to elucidate the correlation between these two variables, as expressed in Equation (7), which is defined as model III.
Fitted coefficients: α = 0.0021, b = 1.85, c = 0.32, d = 0.0015, e = 0.0008.
In this group, the variables a, b, c, d, and e denote the regression coefficients that require computation. These coefficients need to be ascertained through fitting the experimental data. The damage coefficients D of each group (A group w/b = 0.30; B group w/b = 0.25; C group w/b = 0.20) are analyzed via the nonlinear fitting least squares method under varying numbers of cycles to calculate the final coefficients.
Thus, a freeze–thaw damage model based on the relationship between the concrete–water–cement ratio and the number of cycles is proposed in Equation (8).
4.4. Comparative Analysis of the Numerical Characteristics and Trends of the Three Model Types
By comparing and analyzing the numerical characteristics and trends of the three types of models, the following characteristics can be found.
- (1)
- The difference in numerical magnitude is evident in the D value derived from mass loss, which is typically minimal (within ±0.008) since it primarily results from surface peeling, and any initial damage is not pronounced. In contrast, the D value based on the elastic modulus is more centralized, ranging from 0 to 0.14, effectively capturing the progression of damage from the micro- to the macroscale. Interestingly, the outcomes for D, when determined by the water–cement ratio cycle times, closely align with those ascertained via the elastic modulus method. Moreover, as the water–cement ratio and number of cycles increase, the numerical increase in D increases.
- (2)
- Consistency of changes: The change rates of all three groups increase with an increasing number of freeze–thaw cycles. The rate of change follows a pattern characterized by a slow change at the initial stage followed by a gradual flattening at the later stages. Notably, the group with a higher w/b ratio, such as group A (w/b = 0.30), exhibits significantly higher growth rates across all three indicators than the group with a lower w/b ratio does, such as group C (w/b = 0.20). These findings highlight the notable influence of the w/b ratio on freeze–thaw damage.
- (3)
- Unique stage differences: At the initial stages of freeze–thaw (up to 50 cycles), the damage index D based on mass loss often has negative values. For instance, in the AS group, after 25 cycles, D is −0.00042. This anomaly can be attributed to moisture adsorption on the surface of the concrete, which temporarily increases its mass and does not accurately reflect early microscopic damage. Conversely, the damage indices derived from both the elastic modulus method and the w/b ratio/number of cycles-based model consistently yield positive values and steadily increase. These indices effectively capture the latent damage within the structure during its early stages.
A comparative analysis of the advantages and disadvantages of the three model types is provided in Table 9. In practical engineering applications, these three indicators should be integrated as per specific requirements. Model III can be employed to preliminarily predict the damage lifespan of concrete in the target environment and guide mix design. Model II can be used for material performance verification in the laboratory to ensure that the mechanical properties are adequately met. Model I can be implemented for routine onsite monitoring to promptly detect macroscopic damage. Collectively, these models offer a comprehensive approach for evaluating concrete freeze–thaw damage, spanning from prediction and verification to ongoing monitoring.
Table 9.
Comparative analysis of the advantages and disadvantages of the three types of models.
5. Conclusions
In this study, the freeze–thaw resistance values of high-strength concrete composites, which included limestone powder, supplementary cementitious materials (such as fly ash, slag, and silica fume), and a mixture of machine-made and tailings sand, were experimentally investigated. The primary conclusions are as follows:
- A decreased w/b ratio notably increases frost resistance owing to a denser microstructure.
- Silica fume improves freeze–thaw resistance by refining pores; limestone powder mainly plays a physical filling role. Fly ash–slag combination shows no significant synergy under the proportions herein; obvious synergy occurs only at specific dosage ratios.
- The 7:3 machine-made/tailings sand ratio significantly improves freeze–thaw resistance due to optimized gradation and enhanced ITZ.
- Three freeze–thaw damage models are established for different engineering scenarios; Model III shows the best prediction performance.
6. Discussion
Compared with limestone powder–silica fume composite concrete in ref. [3], the multi-byproduct synergy in this study reduces mass loss rate by a further 15%. Compared with manufactured-tailings sand concrete in ref. [22], the 7:3 ratio optimized herein provides better particle packing. Limitation: this study only considers rapid freeze–thaw conditions; long-term natural freeze–thaw performance needs further verification.
Author Contributions
Conceptualization, Y.W.; Methodology, S.Z.; Formal analysis, Y.W.; Investigation, B.L. and Z.W.; Resources, S.Z.; Data curation, Z.W.; Writing—original draft, B.L.; Writing—review and editing, S.Z.; Visualization, B.L. All authors have read and agreed to the published version of the manuscript.
Funding
This research was funded by JiangSu Collaborative Innovation Centre for Building Energy Saving and Construction Technology grant number SJXTBS2118 and Scientific and Postgraduate Research & Practice Innovation Program of Jiangsu Province grant number SJCX25_1384.
Data Availability Statement
The original contributions presented in this study are included in the article. Further inquiries can be directed to the corresponding author.
Acknowledgments
The authors appreciate the partial financial support from the Research Funds for the Jiangsu Collaborative Innovation Centre for Building Energy Saving and Construction Technology (Contract No. SJXTBS2118) and the Postgraduate Research & Practice Innovation Program of Jiangsu Province (Contract No. SJCX25_1384).
Conflicts of Interest
The authors declare no conflicts of interest.
References
- Cerulli, T.; Pistolesi, C.; Maltese, C.; Salvioni, D. Durability of traditional plasters with respect to blast furnace slag-based plaster. Cem. Concr. Res. 2003, 33, 1375–1383. [Google Scholar] [CrossRef] [Scilit]
- Luan, H.; Wu, J.; Pan, J. Freeze-thaw Durability of Recycled Aggregate Concrete: An Overview. J. Wuhan Univ. Technol.-Mater. Sci. Ed. 2021, 36, 58–69. [Google Scholar] [CrossRef] [Scilit]
- Zelić, J.; Krstulović, R.; Tkalčec, E.; Krolo, P. The properties of Portland cement-limestone-silica fume mortars. Cem. Concr. Res. 2000, 30, 145–152. [Google Scholar] [CrossRef] [Scilit]
- Jin, W.; Jiang, L.; Han, L.; Huang, H.; Zhi, F.; Yang, G.; Niu, Y.; Chen, L.; Wang, L.; Chen, Z. Influence of curing temperature on freeze-thaw resistance of limestone powder hydraulic concrete. Case Stud. Constr. Mater. 2022, 17, e01322. [Google Scholar] [CrossRef] [Scilit]
- Zhang, M.; Lv, H.; Zhou, S.; Wu, Y.; Zheng, X.; Yan, Q. Study on the Frost Resistance of Composite Limestone Powder Concrete against Coupling Effects of Sulfate Freeze–Thaw. Buildings 2023, 13, 13112776. [Google Scholar] [CrossRef] [Scilit]
- Chen, C.; Lu, C.; Lu, C.; Wei, S.; Guo, Z.; Zhou, Q.; Wang, W. Synergetic effect of fly ash and ground-granulated blast slag on improving the chloride permeability and freeze-thaw resistance of recycled aggregate concrete. Constr. Build. Mater. 2023, 365, 130015. [Google Scholar] [CrossRef] [Scilit]
- He, Y.; Zhang, J.; Jiang, Z.; Zhou, B.; Zheng, Z.; Wang, Y.; Lu, Q.; Huang, W. Evaluation of the freeze-thaw resistance of concrete incorporating waste rubber and waste glass. Compos. Commun. 2024, 50, 102020. [Google Scholar] [CrossRef] [Scilit]
- Zhang, G.; Yin, J.; Li, S.; Sang, Z.; Xiong, Y.; Gao, T.; Hu, X. Investigation of freeze-thaw resistance of ECO-Porous concrete containing fly ash. Mater. Tehnol. 2018, 52, 183–188. [Google Scholar] [CrossRef] [Scilit]
- Sun, P.; Wu, H.C. Chemical and freeze–thaw resistance of fly ash-based inorganic mortars. Fuel 2013, 111, 740–745. [Google Scholar] [CrossRef] [Scilit]
- Zhang, S.; Chen, B.; Tian, B.; Lu, X.; Xiong, B. Effect of Fly Ash Content on the Microstructure and Strength of Concrete under Freeze-Thaw Condition. Buildings 2022, 12, 2113. [Google Scholar] [CrossRef] [Scilit]
- Cheng, Z.; Cui, G.; Yang, Z.; Gang, H.; Gao, Z.; Zhang, D.; Xi, C. Improvement of the Salinized Soil Properties of Fly Ash by Freeze-Thaw Cycles: An Impact Test Study. Sustainability 2021, 13, 2908. [Google Scholar] [CrossRef] [Scilit]
- Ayano, T.; Fujii, T.; Okazaki, K. Freeze-thaw Resistance of Concrete using Ground Granulated Blast-furnace Slag and Blast-furnace Slag Sand in Salt Water. J. Adv. Concr. Technol. 2024, 22, 253–266. [Google Scholar] [CrossRef] [Scilit]
- Pang, Y.; Wang, H.; Wang, Q.; Tang, Q.; Yang, L.; Li, H. Experimental study on waterproof performance and freeze-thaw resistance of cement mortar using stearic acid modified mica powder. Mag. Concr. Res. 2024, 77, 334–347. [Google Scholar] [CrossRef] [Scilit]
- Karakurt, C.; Bayazıt, Y. Freeze-Thaw Resistance of Normal and High Strength Concretes Produced with Fly Ash and Silica Fume. Adv. Mater. Sci. Eng. 2015, 2015, 830984. [Google Scholar] [CrossRef] [Scilit]
- Cwirzen, A.; Tikkanen, J. Freeze-thaw resistance of normal strength powder concretes. Mag. Concr. Res. 2015, 67, 71–81. [Google Scholar] [CrossRef] [Scilit]
- Fan, J.; Zhang, B. Repair of ordinary Portland cement concrete using alkali activated slag/fly ash: Freeze-thaw resistance and pore size evolution of adhesive interface. Constr. Build. Mater. 2021, 300, 124334. [Google Scholar] [CrossRef] [Scilit]
- Zhao, R.; Yuan, Y.; Cheng, Z.; Wen, T.; Li, J.; Li, F.; Ma, Z.J. Freeze-thaw resistance of Class F fly ash-based geopolymer concrete. Constr. Build. Mater. 2019, 222, 47–483. [Google Scholar] [CrossRef] [Scilit]
- Zhang, D.; Mao, M.; Zhang, S.; Yang, Q. Influence of stress damage and high temperature on the freeze-thaw resistance of concrete with fly ash as fine aggregate. Constr. Build. Mater. 2019, 229, 116845. [Google Scholar] [CrossRef] [Scilit]
- Yang, H.; He, Z.; Shao, Y.; Li, L. Improving Freeze-Thaw Resistance and Strength Gain of Roller Compacted Fly Ash Concretes with Modified Absorbent Polymer. J. Mater. Civ. Eng. 2018, 30, 04018010. [Google Scholar] [CrossRef] [Scilit]
- He, H.; Gao, L.; Xu, K.; Yuan, J.; Ge, W.; Lin, C.; He, C.; Wang, X.; Liu, J.; Yang, J. A study on the effect of microspheres on the freeze-thaw resistance of EPS concrete. Sci. Eng. Compos. Mater. 2024, 31, 20220241. [Google Scholar] [CrossRef] [Scilit]
- Zeng, H.; Li, Y.; Zhang, J.; Chong, P.; Zhang, K. Effect of limestone powder and fly ash on the pH evolution coefficient of concrete in a sulfate-freeze–thaw environment. J. Mater. Res. Technol. 2022, 16, 1889–1903. [Google Scholar] [CrossRef] [Scilit]
- Cai, L.; Wang, H.; Fu, Y. Freeze–thaw resistance of alkali–slag concrete based on response surface methodology. Constr. Build. Mater. 2013, 49, 70–76. [Google Scholar] [CrossRef] [Scilit]
- Cho, W.J.; Kim, M.J. Freeze–Thaw Resistance of Ternary Blended Concrete Using Ferronickel Slag. Int. J. Concr. Struct. Mater. 2021, 15, 7. [Google Scholar] [CrossRef] [Scilit]
- Shon, C.S.; Abdigaliyev, A.; Bagitova, S.; Chung, C.W.; Kim, D. Determination of air-void system and modified frost resistance number for freeze-thaw resistance evaluation of ternary blended concrete made of ordinary Portland cement/silica fume/class F fly ash. Cold Reg. Sci. Technol. 2018, 155, 127–136. [Google Scholar] [CrossRef] [Scilit]
- Li, F.; Fan, S.; Xiao, S.; Huo, J.; Yuan, Y.; Chen, Z. Flexural performance and damage of reinforced fly ash and slag-based geopolymer concrete after coupling effect of freeze-thaw cycles and sustained loading. Structures 2024, 64, 106537. [Google Scholar] [CrossRef] [Scilit]
- ASTM C666M-15; Standard Test Method for Resistance of Concrete to Rapid Freezing and Thawing. ASTM International: West Conshohocken, PA, USA, 2015.
- Huanchang, F.; Yuanzhou, W.; Henglin, L.; Zhang, Y. Behavior of hydration heat regulation and quantitative prediction of the early cracking risk of “dual composite” industrial solid waste concrete materials. Constr. Build. Mater. 2025, 495, 143685. [Google Scholar] [CrossRef] [Scilit]
- SL/T 352-2020; Test Code of Hydraulic Concrete. China Water & Power Press: Beijing, China, 2020.

Disclaimer/Publisher’s Note: The statements, opinions and data contained in all publications are solely those of the individual author(s) and contributor(s) and not of MDPI and/or the editor(s). MDPI and/or the editor(s) disclaim responsibility for any injury to people or property resulting from any ideas, methods, instructions or products referred to in the content. |
© 2026 by the authors. Licensee MDPI, Basel, Switzerland. This article is an open access article distributed under the terms and conditions of the Creative Commons Attribution (CC BY) license.