


Abstract
Neighborhood-scale decarbonization is essential to achieving urban climate neutrality, yet existing methods often rely on complex, technology-intensive models that are difficult to implement in aging urban areas. This study introduces a simplified smart analysis method and decision-support framework to facilitate net-zero energy and emissions transitions at the neighborhood level through impactful, low-disruption interventions. Applied to a mixed-use neighborhood in Izmir, Türkiye, part of the European Union Mission for Climate-Neutral and Smart Cities, the methodology evaluates four intervention strategies: rooftop Photovoltaic systems, air-source heat pumps, solar-powered LED street lighting, and repurposing idle public spaces. The analysis quantifies energy demand, CO2 emissions, and economic performance based on standardized data and incremental renovation scenarios. Results show that a gradual renovation approach, with a 10% annual replacement rate for heating systems, full rooftop Photovoltaic deployment, and street lighting retrofitting, can achieve a net-zero energy balance in 6–7 years. Redirecting fossil fuel and electricity subsidies to support renewable technologies makes these interventions economically viable within the same period. This framework demonstrates that neighborhood-scale climate neutrality can be attained without extensive structural changes, providing a replicable tool for cities with similar conditions aiming to meet European Union climate targets.
1. Introduction
In 2022, the European Union (EU) broadly described its city mission for 2030 as a new avenue to find ground-level solutions to some of humanity’s biggest challenges [1]. Cities will play a crucial role in achieving climate neutrality by 2050, the goal of the European Green Deal [2]. Although cities cover only 4% of the EU’s land area, 75% of the EU citizens live in them. In addition, cities consume over 65% of the world’s energy and produce more than 70% of global CO2 emissions [3,4]. In the city mission created to alleviate the climate crisis, it has become important to accelerate the zero-emission and smartening of cities. The EU aimed to reduce emissions to 55% by 2030 in 2022, and it added a new target of 66.25% to 72.5% by 2035 in 2025 [5]. The EU’s Mission for climate-neutral and smart cities by 2030 aims to improve the quality of urban life for its citizens [1,3]. For the program, 100 cities from the EU member states and 12 from associated countries were selected from a pool of 337 cities. Seventy-one of the municipalities selected for the Mission are Eurocities members. This case will further increase the cooperation network [6].
The EU stated that to reach this target, a renovation rate of at least 3% per year is required. A 75% reduction in energy demand was needed to achieve climate neutrality in 2050 [7]. Furthermore, the union decided to go to 2035 with an even more ambitious target, since, based on the data, these targets will be achieved by 2030 [5]. “Cities” is one of the mission’s common points, which was targeted for 2030 four years ago and for 2035 in November 2025. This target requires a neighborhood-scale renovation approach that relies on the local framework, conditions, and societal partnership. Thus, stated methodologies need to be simple to be understood and accepted by the local community and decision-makers.
In parallel, the European Union has intensified its climate action agenda through initiatives such as the European Green Deal and the Mission for Climate-Neutral and Smart Cities, which aims to support 100 cities in achieving climate neutrality by 2030 and 2035. This mission underscores the need for neighborhood-scale renovation strategies that are not only effective in reducing emissions but also socially acceptable, economically feasible, and easily implementable within existing urban fabrics. To meet these ambitions, methodologies must be sufficiently simple, transparent, and adaptable so they can be understood and adopted by local stakeholders.
Urban areas play a central role in the global climate crisis. The modern world is fast-paced, polluted, warm, technologically advanced, and densely urbanized. While these cities are home to more than 50% of the world’s population, approximately 75% of Europe’s population lives in cities. Estimates show that by 2050, 66% of society [8,9,10], approximately 7 out of 10 people in the world, will be urban residents. It is also important to remember that community life and the resilience of the built environment depend on the urban environment and climate change [11,12]. Although they cover less than 2% of the Earth’s surface, urban areas are among the most significant sources of pollution and global warming. They consume more than 65% of the world’s energy and produce 75% of greenhouse gas (GHG) emissions. These problems arise globally; thus, their effects are global [3,13,14]. As solutions to existing global problems, the Smart Growth and Sustainable Development paradigms were developed in the 1970s and were well shaped by the end of the 20th century [15,16]. These two concepts are reflected in the definition of Net-zero Energy Neighborhood (NZEN). All net-zero methods share 3 main elements: low energy, low emissions, and a balanced economy [17].
Many net-zero systems studied in the literature involve high-tech, costly structural changes to city infrastructure or the redesign of entire neighborhoods. This approach is unsuitable for old city centers without damaging the neighborhoods’ social structures. For net-zero changes in cities and the built environment, studies in the literature include building materials [18], renewable systems, technological and strategic plans for zero-energy regions [19,20,21], mobility in urban areas, and changes in the design, use, and identity planning of urban spaces [22]. There are also studies on rainwater and urban streams [23,24]. There are also studies on the design and implementation of green assessment tools for cities [25,26,27]. In addition, it is common to work with Geographic Information Systems (GIS) and Building Information Modeling (BIM) models in research on cities [28,29]. BIM is generally carried out in renovation scenario modeling by digitally simulating various intervention options to improve the performance of an existing structure. Although this study is a scenario-based application, it aims to offer the simplest and most practical solution for a neighborhood area without using BIM. As a result, this study was conducted to provide a solution not only for experts but also for diverse audiences [30].
Some studies rely on neighborhood-scale energy modeling, such as Urban Building Energy Modeling (UBEM), Urban-Scale Energy Modeling (USEM), or Community Scale Energy Modeling (CSEM). This model simulates energy demand, supply, and flow for a group of buildings, ranging from a single street block to an entire city area. Unlike BIM, it considers urban-scale variables such as shading from neighbors, local wind speeds, and mutual thermal effects (e.g., the urban heat island effect). GIS can also be used, with geographic data integrated into this model [31,32]. Although the process followed in this paper operates in parallel with UBEM, UBEM is a model that includes more data and data-flow processes. This paper aims to develop a system that suggests neighborhood revisions from a more practical perspective.
The concept of net-zero energy neighborhoods (NZEN) has emerged as a key framework for addressing urban energy and emission challenges. The case studies on NZEN in the literature have focused on renewable energy, heating systems [17], urban morphology, urban heat islands, or green roof solutions for cooling [33,34,35]. While these approaches provide analytical rigor, they often rely on high-resolution datasets, specialized technical expertise, or large-scale physical transformations, thereby limiting their applicability in real-world urban governance contexts. Some studies used the European Model for Power System Investments with Renewable Energy (EMPIRE) method [36], which is complex and requires programming knowledge.
However, much of the existing literature on net-zero neighborhoods and districts emphasizes technology-intensive, large-scale, or high-cost solutions, including advanced building retrofits, comprehensive infrastructure overhauls, or complex optimization-based energy models. While these approaches offer analytical rigor, they often face significant limitations in practice, particularly in aging urban neighborhoods, historic city centers, or socially sensitive areas where extensive physical transformation may disrupt local identity and social structures. Moreover, many advanced modeling frameworks require high-resolution datasets, specialized technical expertise, and programming capabilities, which are not always accessible to local governments or decision-makers.
Moreover, many neighborhood-scale studies focus on individual components—such as PVs, heating systems, or green infrastructure—without offering integrated, decision-oriented methodologies that local authorities can readily apply under financial, institutional, and data constraints. As a result, a gap persists between ambitious climate-neutrality targets and the practical tools available to municipalities to implement neighborhood-scale transitions.
This study addresses this gap by proposing a simplified, smart, analysis-based decision-support methodology for neighborhood-scale net-zero transitions that leverages district-level decarbonization strategies and integrated urban energy systems. Instead of focusing on individual buildings, a system that integrates multiple energy vectors [37] is considered, along with a plan to reduce greenhouse gas emissions across a specific urban area. This increases overall urban resilience. Rather than relying on complex optimization models or comprehensive urban redesign, the proposed approach identifies a limited set of high-impact infrastructural interventions that can be implemented incrementally with minimal disruption to existing urban and social structures. The framework integrates scenario-based energy and emission analysis with an economic feasibility assessment aligned with current policy instruments.
The methodology is applied to a representative mixed-use neighborhood in IIzmir, Türkiye—one of the cities participating in the EU’s Climate-Neutral and Smart Cities Mission. By evaluating rooftop PV (PV) systems, air-source heat pumps (HP), solar-powered LED (SPL) street lighting, and the strategic repurpose of idle public spaces, the study assesses both environmental performance and economic viability under realistic renovation pathways.
The primary contribution of this research lies in reframing smart analysis as an operational, neighborhood-scale transition framework rather than a managerial checklist or a data-intensive optimization tool. The study demonstrates that climate neutrality can be achieved through incremental, high-impact interventions sequenced over time, offering a pragmatic and replicable pathway for cities seeking to meet EU climate targets without extensive structural transformation.
2. Materials and Methods
This study adopts a case-based, scenario-driven analytical research design grounded in a simplified smart analysis framework adapted from the Specific-Measurable-Achievable Relevant Time bound (SMART) concept originally defined by Doran [34,38]. This concept can be confused with smart decision tools, which are sophisticated technological platforms that facilitate data-driven, efficient urban management strategies. By integrating the Internet of Things (IoT) and GIS, these tools enable advanced simulations across critical sectors such as transportation, energy, and waste management. Furthermore, the evolution of Artificial Intelligence (AI) significantly enhances the capabilities of these decision-support systems. A prime example is Izmir’s current implementation of a fully adaptive traffic management and information system [39,40]. However, this study adopted the definition of “smart” based on its conceptual dimension rather than as a “smart tool”. In a sense, the study also applies district-level decarbonization strategies, integrated urban energy systems, and renovation scenario modeling, but these applications are discussed within a more theoretical framework.
2.1. Research Design and Analytical Framework
In this research, smart analysis is operationalized as a decision-support framework for evaluating neighborhood-scale net-zero energy transition pathways under realistic data, institutional, and implementation constraints.
Unlike optimization-based, simulation-intensive, or programming-driven energy models, the proposed framework prioritizes procedural transparency, data accessibility, and scalability. This design choice directly addresses a recurring implementation gap identified in the literature. Although advanced models provide high analytical precision, their data intensity and technical complexity often limit applicability for local governments and urban planners, particularly in neighborhoods with aging building stock and fragmented datasets.
The analytical framework follows a stepwise structure consisting of four stages:
- Identification of high-impact infrastructural intervention factors;
- Scenario-based modeling of incremental renovation pathways;
- Quantification of neighborhood-scale energy demand and CO2 emissions;
- Economic feasibility assessment using return on investment (ROI) and break-even point (BEP) indicators.
This structure enables the isolation of individual intervention effects while also capturing their cumulative impact over time. Although the case study is geographically specific, the analytical logic is not dependent on location. It can be transferred to other neighborhoods with comparable climatic conditions, mixed-use patterns, and building typologies.
The neighborhood scale is deliberately selected as the primary unit of analysis, as it represents the smallest effective scale at which urban energy planning, social dynamics, and local governance intersect. The study is based on the neighborhood scale, considering the smallest scale of urban planning and the smallest unit of urban government [41,42,43]. This scale enables meaningful emission reductions without requiring citywide restructuring or deep building retrofits that may disrupt social and spatial continuity.
2.2. Data Sources and Assumptions
The analysis integrates primary field observations with secondary data sources, ensuring both contextual accuracy and methodological replicability. Energy demand calculations are based on standardized building-stock data aligned with Türkiye’s climate-zone classification, ensuring consistency across building typologies and floor counts.
The primary data sources include:
- National statistical datasets—Turkish Statistical Institute (TSI-TUIK) [44];
- Standardized residential building energy demand coefficients-TS 825 [45];
- Climate and solar radiation data for Izmir;
- Literature-based performance parameters for PV systems and air-source HPs [46,47,48];
- Nationally reported emission factors for electricity and natural gas consumption.
To maintain transparency and reproducibility, average performance coefficients are used rather than building-specific simulations. While this approach may not capture micro-scale behavioral variations, it ensures that the methodology remains applicable in data-limited urban contexts and supports comparative analysis across neighborhoods.
2.3. Identification of High-Impact Intervention Factors
The identification of high-impact intervention factors was conducted through a multidimensional approach that integrated a literature review, field assessment, and site-specific feasibility studies, resulting in the selection of four primary technological and infrastructural measures. These include the deployment of rooftop photovoltaic (PV) systems, the integration of air-source heat pump (HP) systems for space heating, the conversion of public lighting to high-efficiency SPL systems, and the functional repurpose of idle public spaces for community-centered infrastructure. These interventions were prioritized because they address the dominant contributors to neighborhood-scale energy demand—electricity and thermal loads—without necessitating structural alterations to the existing urban morphology. It would not be wrong to categorize the analyses conducted as belonging to district-level decarbonization strategies and integrated urban energy systems.
Furthermore, these measures are consistent with current Turkish regulatory frameworks and established technological standards for 2026 [49], such as the practical availability of 19% PV conversion efficiency and the electrification of heating systems, aligned with the national energy transition.
The selection of rooftop PV integration is supported by the Izmir region’s high solar energy potential, with an average annual global irradiance of 1620–1700 kWh/m2, providing a robust resource for local energy harvesting. Similarly, the shift toward air-source heat pumps leverages the region’s temperate climate, where moderate heating and cooling loads enhance the seasonal performance factor of electrified thermal systems relative to conventional fossil-fuel-based boilers. By focusing on these four factors, the methodology prioritizes interventions with the highest emission-reduction potential per unit of disruption, enabling an incremental implementation strategy that remains economically evaluable within existing subsidy structures. Rather than pursuing high-risk, data-intensive deep retrofits or large-scale district heating networks, this approach identifies scalable pathways that bridge the gap between theoretical climate neutrality and the practical institutional and budgetary constraints of local municipalities.
2.4. Scenario-Based Modeling Approach
To evaluate the individual and combined effects of the identified interventions, a scenario-based modeling approach was employed. This model is It can be described as a more mathematical and theoretical version of the urban renovation scenario. One Base Case and four incremental intervention scenarios were defined. The Base Case represents the neighborhoods’ current condition with no technological or infrastructural modifications.
The intervention scenarios progressively introduce the selected measures while preserving existing land-use patterns and social structures. In addition, a gradual renovation pathway was incorporated to reflect realistic implementation constraints, particularly for heating system replacement.
Alongside making street lighting more energy efficient and installing rooftop PV solutions, a 10% annual replacement rate for conventional heating systems with air-source HPs was assumed, aligned with observed adoption rates in comparable urban contexts. This gradual approach enables assessment of both short-term impacts and medium-term transition dynamics, rather than relying on hypothetical full-scale implementation.
2.5. Energy Demand and Emission Calculations
The methodology for determining the energy performance of buildings in Türkiye is governed by the National Calculation Method [45], which establishes the annual energy consumption per square meter and the resultant CO2 emissions. To achieve this, the primary objective is to calculate the net energy required for heating and cooling, while accounting for system losses, efficiency, and ventilation needs. The calculation framework integrates several critical inputs, including building geometry, thermal properties, internal gains, and solar gains, all of which are processed through a “simple hourly dynamic” calculation method. This semi-dynamic approach utilizes a resistance–capacitance (RC) model to simulate the building’s thermal behavior with high precision, particularly during transition seasons, by utilizing hourly climate data and operational temperature setpoints. The energy balance is maintained by assessing heat transfer between the conditioned space and the exterior, ventilation-related heat exchange, and the thermal storage capacity of the building’s mass.
Central to this methodology is adherence to international standards, primarily ISO 52016-1:2017 [50], which provides the basis for calculating space-heating and cooling energy use. The heat transmission loss coefficient further quantifies the thermal performance, often expressed as U-values for various building components. For a specific zone, the total transmission heat transfer coefficient Htr can be generally represented as the sum of the heat transfer through all building elements:
where U represents the thermal transmittance, A is the area, Ψ is the linear thermal transmittance of thermal bridges, and l is the length of those bridges. Additionally, the methodology accounts for air infiltration and mechanical ventilation, calculating the heat transport effect based on the temperature difference between the indoor air and the supply air.
The methodology for determining building energy performance establishes clear physical and operational boundaries to standardize the calculation of annual energy consumption and CO2 emissions. The primary physical boundary is the building envelope, which includes all opaque and transparent components separating the conditioned interior from the external environment, with particular attention to thermal bridges and adjacent unconditioned zones. Operationally, the system boundary is defined by the energy balance of five core services: heating, cooling, ventilation, domestic hot water, and lighting. While internal gains from occupants and electrical appliances are included as thermal inputs, the energy consumed by these devices is typically excluded from the final performance rating unless they directly serve the building’s mechanical systems. Furthermore, the methodology incorporates a regulatory boundary using a Reference Building, which establishes a baseline performance level (Class D) based on minimum standards, such as TS 825 for insulation [45], and legal minimum efficiency values for mechanical equipment. These boundaries ensure that the resulting energy identity is based on the building’s intrinsic design and systemic efficiency rather than variable user behavior.
The thermal performance and energy demand of the neighborhood-scale model are fundamentally governed by the standardized input parameters prescribed by the BEP-TR 2 methodology, which ensures a consistent baseline for internal heat gains, infiltration rates, and occupancy schedules across all scenarios. Internal heat gains are operationalized by building typology: residential zones are typically assigned a total load of approximately 11.5 W/m2, whereas commercial and administrative zones exhibit significantly higher densities, ranging from 42.0 to 92.0 W/m2, reflecting increased sensible and latent loads from equipment, lighting, and higher occupant density. Infiltration rates, which govern uncontrolled ventilation heat loss, are modeled as fixed hourly air-change rates, with the methodology assuming a baseline of 0.5 h−1 for standard construction. These thermal loads are activated according to deterministic operational schedules: residential occupancy is modelled at 100% capacity during the 07:00–23:00 active period, while commercial schedules concentrate peak loads between 08:00 and 18:00. While these standardized values provide the necessary scientific rigor for the sensitivity analysis and comparative scenario assessment, they establish a deterministic boundary that simplifies the stochastic nature of occupant behavior and the localized meteorological factors influencing real-world infiltration [51].
All buildings in the area were calculated using the national methodology for both the original and renovation scenarios. The combined effect of the entire neighborhood on energy and emissions was obtained by summing individual calculations. Emissions are calculated by emission factors for the national electric grid, natural gas, and other related statistics [52]. All calculations are made using Microsoft Excel macro tools 2025.
The framework also encompasses lighting and domestic hot water energy requirements. Lighting energy consumption is determined by using the Lighting Energy Numerical Indicator, which accounts for the availability of natural daylight, the efficiency of lamps and luminaires, and the presence of automated control systems. For residential buildings, the transition from incandescent lamps to high-efficiency compact fluorescent lamps is emphasized as a primary driver for reducing CO2 emissions. Meanwhile, domestic hot water calculations account for the energy required for heat generation, distribution, and storage, as well as potential contributions from solar thermal systems. Mechanical systems, including heat pumps, boilers, and HVAC units, are evaluated based on their nominal power, partial-load values, and seasonal efficiency metrics such as the Coefficient of Performance (COP) or the Energy Efficiency Ratio.
Annual neighborhood energy demand is calculated by aggregating building-level energy consumption for heating, cooling, lighting, and auxiliary systems. Building energy demand is estimated using standardized per-area consumption values corresponding to local climate conditions and building typologies.
Renewable energy generation potential is calculated based on:
- Average annual solar radiation levels [53];
- Total available rooftop area;
- PV conversion efficiency [54].
Photovoltaic (PV) generation (Epv) is estimated based on peak power (Ppk) and local solar irradiation (Gsol) [48]:
A performance ratio (fperf) of 0.75 is used to account for inverter efficiencies, temperature degradation, and wiring losses.
Emission calculations are conducted using nationally reported emission factors for electricity and natural gas (NG) consumption. The integration of PV systems and HPs is reflected through adjusted energy demand and emission coefficients, allowing direct comparison across scenarios.
The technical and economic parameters are summarized in Table 1, which establishes the fundamental boundary conditions for the neighborhood’s transition toward climate neutrality. The model leverages Izmir’s high solar potential (1608 kWh/m2) and a 19% photovoltaic conversion efficiency to optimize local renewable energy harvesting. On the demand side, the thermal transition is modeled by replacing natural gas with air-source heat pumps with a high Coefficient of Performance (COP of 5), thereby significantly reducing primary energy consumption.
The environmental sensitivity of the framework is driven by the specific emission factors for electricity (0.375 kg/kWh) and natural gas (0.185 kg/kWh), which prioritize the electrification of heating as the primary decarbonization pathway. Furthermore, the economic feasibility of the projected 6–7-year net-zero timeline is anchored in the strategic reallocation of existing government subsidies—currently 80% for natural gas and 50% for electricity—thereby lowering the financial barrier for high-capital expenditure technologies like HP (priced at €11,500 per unit) and ensuring a competitive return on investment. Energy prices are modeled as static in Euro terms to account for the historical decoupling of Turkish energy tariffs from global trends. In the last decade, the depreciation of the Turkish Lira has effectively offset domestic price increases, maintaining stable or declining costs in Euro-denominated terms [55]. Using static prices ensures methodological conservatism; should Euro-denominated prices increase due to future subsidy withdrawals, the actual payback periods would be shorter than those reported in this study, thereby reinforcing the economic argument for the proposed interventions.
Table 1.
Technical, Environmental, and Economic Input Parameters for the Renovation Framework [46,47,52,56,57,58].
2.6. Economic Feasibility Assessment
Economic performance is evaluated using Return on Investment (ROI) and Break-Even Point (BEP) indicators. Two policy conditions are assessed: Without government subsidies and with subsidy levels equivalent to existing fossil fuel and electricity subsidies.
This dual assessment enables evaluation of policy sensitivity and highlights the role of subsidy reallocation in accelerating neighborhood-scale decarbonization. The economic analysis focuses on operational cost savings rather than long-term market speculation, ensuring conservative and policy-relevant results.
2.7. Methodological Limitations
The methodology of this study prioritizes simplicity and transferability to ensure the framework remains accessible to local decision-makers. Consequently, several deliberate assumptions and boundaries were established. First, the analysis focuses exclusively on operational emissions and energy demand; embodied carbon from construction materials and infrastructure is excluded to maintain a clear emphasis on end-use decarbonization. Furthermore, energy demand calculations rely on average performance coefficients rather than building-specific dynamic simulations, and both energy prices and subsidy frameworks are assumed to remain stable over the study period. These economic assumptions reflect the historical decoupling of Turkish energy tariffs from global trends in Euro terms, as discussed in previous sections.
A significant boundary of this research is the exclusion of operational power analysis, such as voltage stability, reactive power compensation, and grid-side load shedding. These assessments are governed by specific legal mandates held by Turkish Electricity Transmission Corporation (TETC-TEİAŞ) (Ankara, Türkiye, at the transmission level) and all distribution system operators in Turkiye (at the distribution level) and require proprietary, non-public infrastructure datasuch as individual transformer load profiles—that are inaccessible for public research. While these issues are critical to power engineering, they fall outside the administrative jurisdiction of local urban planners. Therefore, it is acknowledged that a full-scale implementation of the proposed strategies would require a secondary, high-voltage engineering phase conducted by utility operators to ensure the existing infrastructure can accommodate projected load shifts, particularly regarding large-scale heat pump integration.
Similarly, the study omits high-fidelity dynamic variables, such as building-to-building micro-shading and Urban Heat Island (UHI) effects. While these factors influence individual cooling and heating loads in the dense urban fabric of Izmir, their explicit modeling was bypassed to prioritize the scalability and practical utility of a neighborhood-scale framework. In place of building-specific simulations, the study utilizes standardized building archetypes derived from verified national and regional datasets. In a Mediterranean coastal climate like Izmir—where thermal performance is primarily driven by broad solar-gain trends and ventilation strategies—these archetypes provide a statistically robust baseline for district-level estimates. By focusing on aggregate energy trajectories rather than building-specific stochastic variations, this approach ensures the resulting decarbonization roadmap remains technically sound and strategically relevant for local policy formulation. These limitations are acknowledged as deliberate methodological choices intended to enhance the tool’s replicability across diverse urban contexts. Future research may refine this framework by integrating life-cycle assessments (LCA), dynamic pricing scenarios, and social acceptance factors to capture the evolving socio-technical landscape of energy transitions.
2.8. Sensitivity Analysis
The sensitivity analysis methodology for the neighborhood-scale renovation model utilizes the elementary effect (EEi) to quantify the impact of specific technical and financial interventions on the overall energy and economic profile. Following the global screening approach established by Menberg et al. [59], the sensitivity of the output Y to the input xi is evaluated by computing the change in the model’s output resulting from a standardized perturbation (Δ) of xi. In this context, the elementary effect is defined as
3. Case Study
The selected case study is located in Gazi Neighborhood, Gaziemir District, Izmir, Türkiye—one of the cities participating in the EU Mission for Climate-Neutral and Smart Cities. The city of Izmir is one of the selected cities in the EU 100 Cities Mission and is Türkiye’s 3rd largest city. Figure 1 shows that the neighborhood has an area of approximately 694,000 m2 [60], and the selected case area is 277,000 m2.
Figure 1.
Location of the area [(A):  Gazi Neighborhood, (B):
 Case study area].
Gazi Neighborhood, (B): Case study area].
The neighborhood represents a Mediterranean urban morphology characterized by mixed land use, moderate energy demand, and aging building stock.
Türkiye’s neighborhood concept and size are slightly larger than those of its counterparts in Europe and America. Neighborhoods are connected to the mukhtar, the smallest unit on the political scale. Mukhtars are generally concerned with the neighborhood’s population, demographic structure, and characteristics in their sub-units, which can be compared to city blocks. Nevertheless, mukhtars do not have any power in the structural and spatial planning of the neighborhoods, which is undertaken by the municipalities [61,62]. Due to the relatively large administrative size of Turkish neighborhoods, a representative sub-area comprising approximately 40% of the neighborhood was selected. This area includes residential, public, educational, and commercial buildings, enabling a comprehensive evaluation of neighborhood-scale interventions.
Firstly, the neighborhood’s identity, sociological, cultural, and economic structure in Gazi Neighborhood were documented. Furthermore, the uses of the neighborhood’s buildings were cataloged. This study shows that the buildings in the neighborhood serve more than just as shelter. The area is open to many uses, such as public health, education, and shopping. This information is used to keep socio-economic life unaltered by excessive repurposing in the neighborhood.
The neighborhood includes government buildings such as Gaziemir District Municipality, Gaziemir District Governorship Old Building (the new building has been relocated to another Gaziemir Neighborhood), District Directorate of Food, Agriculture, and Livestock, Post Office, and Izmir Metropolitan Municipality Vocational Factory Gaziemir Course Center. In addition, non-governmental public buildings are also located in the district. These buildings include Gaziemir Entrepreneurial Women’s Cooperative, Rota College Gaziemir Campus, Yahya Kemal Beyatlı Middle and Primary Schools, and many private courses and educational institutions.
District central branches of many private and state banks, as well as various public and private health centers and polyclinics, are also located in this neighborhood. For these reasons, Gazi Neighborhood can be considered mixed-use. The neighborhood is experienced not only by its residents but also by residents from different districts, including low- and high-income groups and various socio-cultural groups. The area around the old District Governor’s Office was selected as the case base for the study. It was demolished at the beginning of 2021. The area where the old District Governor’s Office is located, along with the earthquake meeting area and the park next to it, is now inactive and no longer used by the public.
First, the distribution of house diversity in the area (Figure 2) and the percentage of grey and green areas (Figure 3) were calculated. Buildings, areas, and their functions were identified. The residents’ closest and farthest public transportation points, and their proximity to public transport, specified education and health units, and financial services, were listed.
Figure 2.
Building diversity distributions in the case study area (source: authors’ data archive).
Figure 3.
Green–grey area and road distributions in the case study area (source: authors’ data archive).
The first part of the analysis determined the minimum change required for an urban area to be net-zero in emissions. Based on this decision, changes proposed for the environment were studied for their respective impact, and the neighborhood was modeled three-dimensionally (3D) for further analysis.
For the neighborhood renovation, this paper focused on the open green spaces, which were partially demolished in 2021 and remained idle. The neighborhood, in its old and proposed new forms, was modeled to support a sustainable solution through smart analysis using AutoCAD 2020, Rhino 7, ArchiCAD 24, V-Ray 5, and Lumion 10.5. The changes were made, and a 3D model was created for the neighborhood area (Figure 4):
Figure 4.
General view of the case study area before (A) and after (B) the renovation (source: authors’ model).
- A two-story community center that the municipality can use was constructed for the residents and visitors of the neighborhood, on the remaining land from the old district governor’s office.
- Nine new two-story villas based on the housing variety principle found in the sustainable neighborhood certificates [63,64] with high energy efficiency were designed for the third vacant area on the old governor’s office building land.
- New basketball, tennis, and volleyball courts were designed for the idle areas, defined as green areas in the neighborhood plan taken from the municipality, and supportive planting proposals were made, but no serious landscaping was done. Slow traffic enforcement ramps were suggested to control the traffic around the playground during the daytime.
- A five-story smart car park for 300 vehicles is in the land of the former District Governorship. In addition, it is expected that charging stations will be installed in this parking lot to encourage the use of electric vehicles and foster a habit [65]. The parking lot was designed to generate its energy with solar panels.
- A disaster assembly area in the middle of the neighborhood answers the needs of possible disaster victims. To accommodate different uses in the event of a disaster, two indoor dining and drinking areas and a closed ceiling system in the middle of the area were designed. The area includes a landscaping section that could be used for gatherings, entertainment, and picnics during non-disaster times.
- Rainwater in the region will be stored and used to meet the water needs of landscaping and other necessary areas.
The energy consumption and emissions of the buildings and streetlights in the region were calculated, and it is projected that these buildings and streetlights will gradually become more energy-efficient, with the greatest economic opportunities for the local community and government. At first, a solar energy-benefiting zone was defined by redesigning or rearranging the empty spaces after the demolition. In this context, it was proposed to install rooftop solar panels on residential buildings and then convert existing streetlights to SPL and other high-energy-saving alternatives. Secondly, air-source HP installations were suggested for the new facilities to reduce building heating emissions. The HP proposal was introduced first for base case buildings, then only for new ones. After that, it was proposed to make gradual progress over ten years for all buildings in the region (for example, first year: 10% of buildings, third year: 30% of buildings, fifth year: 50% of buildings, tenth year: all buildings) to increase energy efficiency. In the final stage, the economic analyses of all these cases were evaluated.
All these studies were analyzed in 5 cases, with the Base Case and 5 Cases of the changes made:
- Base Case: The current case is where all equipment and features are used without changing.
- Case 1: SPL street lighting and all buildings with solar power; other features are the same.
- Case 2: SPL street lighting, all existing buildings with solar power, and old buildings with a HP
- Case 3: SPL street lighting, all buildings with solar power, and new ones with HP
- Case 4: SPL street lighting, all buildings with solar power, and new ones with HPs.
Gradually, in ten years, in addition to new buildings, a 10% improvement was targeted at HP for all existing buildings. Intervention measures were selected based on technologically mature and practically available solutions within the Turkish urban context. The selection process prioritized high-impact strategies that offer the greatest economic opportunity for local communities, specifically rooftop solar PV integration and the electrification of heating systems. These measures—transitioning from conventional streetlighting to SPL and replacing fossil-fuel-based boilers with air-source heat pumps (HPs)—reflect established national energy efficiency trends aimed at reducing building-based emissions. By rearranging empty spaces created after urban demolition, the methodology creates “solar-benefiting zones,” ensuring that the proposed interventions are physically and architecturally viable for the region’s specific building typologies. These scenarios represent realistic policy pathways by adopting a gradual, 10-year implementation schedule (e.g., 10% in year one, reaching 100% by year ten) to mirror actual urban transformation constraints and investment cycles. This phased progression allows evaluation of five distinct cases—ranging from a non-intervention “Base Case” to a fully transformed neighborhood—to determine the most cost-effective path to net-zero performance. While a formal mathematical sensitivity analysis was not the primary focus, the comparison between these five cases serves as a functional sensitivity assessment, identifying how the timing and scale of heat pump and solar adoption influence the neighborhood’s overall energy profile. This structured approach ensures that the findings remain grounded in the legal and technical requirements of the Turkish Building Energy Performance (BEP-TR) framework [51].
The representative building stock data were used for energy demand calculations, in which average heating, cooling, and lighting requirements for buildings in climate zone 1 in Türkiye are provided for the residential building stock [44,66]. The presented data contains annual consumption figures for residential buildings, broken down by number of floors and geographic location.
Annual neighborhood energy demand (Qneighborhood) was calculated by aggregating building-level energy consumption values for heating, cooling, lighting, and auxiliary systems. Building energy demand (Qyear) was estimated to use standardized per-area consumption coefficients for local climate zones and building typologies.
Renewable energy generation potential was calculated based on:
- Average annual solar radiation;
- Total available rooftop area;
- PV conversion efficiency.
Emission calculations were conducted using nationally reported emission factors for natural gas and electricity consumption. All calculations follow Equations (1)–(5), ensuring transparent, reproducible results.
Economic feasibility was assessed using Return on Investment (ROI) and Break-Even Point (BEP) metrics under two conditions: without government subsidies and with subsidy levels equivalent to those of existing fossil fuels and electricity.
Qyear (total annual energy requirement for the listed building) was calculated by multiplying the building’s total area by the average primary energy for heating, cooling, and lighting in the same geography and with the same number of floors.
Qneighborhood (annual energy consumption of the neighborhood) calculated as the sum of all buildings as
where m is the number of streetlight poles in the local area, and Qstreet lighting is the annual energy consumption of an individual unit. Individual units require about 17.94 kWh/day of energy [45]. Added suggested scenarios for replacing heating systems with air-source HPs and using rooftop PVs to calculate different shares in the local mix. Thus, Qn,ren (renovated neighborhood energy demand) was calculated as
where H is the daily average solar radiation for Izmir Gaziemir, Apv is the total area of rooftop PV panels, and ηpv is the PV conversion efficiency. The COP (Coefficient of Performance) value for the air-source HP was taken as 5 [67].
CO2 emissions were calculated using natural gas-based emissions: 0.185 kg/kWh for heating [68] and 0.4 kg/kWh for average electricity emissions in Türkiye [69], which remains largely the same for the 2024–2026 period (Table 2).
Table 2.
Summary table for calculation results for baseline conditions.
Return on investment (ROI) and break-even point (BEP) for investments are studied for economic analysis. In these calculations, ROI is calculated as
ROI = Annual Investment Gain/Total Investment Cost
The BEP is calculated as the cumulative difference between annual economic benefits (AEB) achieved and annual investments required (AIR) and is reached when this difference becomes positive. It can be stated as
The proposed smart analysis-based methodology was intentionally selected over complex optimization or programming-intensive models to address practical implementation barriers commonly encountered in neighborhood-scale decarbonization initiatives. While advanced models provide high analytical precision, their complexity and data requirements often limit real-world applicability. In contrast, the methodology developed in this study emphasizes procedural clarity, data accessibility, and scalability, allowing replication in other urban neighborhoods with comparable climatic conditions, mixed-use patterns, and aging building stocks. The stepwise scenario structure and gradual renovation logic further enhance the method’s transferability, making it suitable for cities seeking pragmatic pathways toward EU climate neutrality targets.
This study is subject to several limitations that also define avenues for future research. The energy demand and emission calculations are based on standardized building stock data and average performance coefficients, which enhance replicability but may not fully capture variations in individual building characteristics or occupant behavior. Future studies could integrate building-level simulations or monitored energy data to improve accuracy. In addition, the analysis focuses on operational energy use, excluding embodied carbon associated with construction materials and infrastructure; incorporating life-cycle assessment approaches would provide a more comprehensive environmental evaluation. The economic analysis assumes stable energy prices and subsidy frameworks over the study period, suggesting that future research should explore sensitivity analyses under varying market and policy conditions. Finally, while a simplified, gradual renovation pathway is employed, subsequent research may incorporate social acceptance, governance structures, and institutional capacity to better capture real-world implementation dynamics. Addressing these aspects would strengthen methodological robustness and expand the applicability of the proposed framework.
Sensitivity analysis of Case 1 reveals that the neighborhood’s environmental performance is most sensitive to the utilization of the defined solar-benefiting zones. By shifting from the base case to 100% roof solar area use (Δ = 1.0), the net emissions drop from 11,319.50 tons/year to 2152.14 tons/year, yielding an elementary effect of approximately −9167.36 tons per unit of adoption. This high sensitivity underscores the critical role of local photovoltaic generation in achieving deep decarbonization within the Turkish Building Energy Performance (BEP-TR) framework [51]. Furthermore, the sensitivity of energy demand is highlighted by the conversion of street lighting to SPL, which reduces the total primary energy to 26,871,493 kWh. The economic robustness of the renovation model is similarly assessed through the sensitivity of financial metrics to policy instruments. The calculation demonstrates that the project’s turnaround time is highly sensitive to government intervention: without subsidies, the payback period is 9.24 years, which is reduced by 1.41 years to 7.83 years with subsidies. Correspondingly, the return on investment (ROI) exhibits a sensitive upward shift from 0.11 to 0.13 under subsidized conditions. These results indicate that while technical interventions are effective at reducing primary energy demand, the financial feasibility of the neighborhood transition remains heavily dependent on external economic support and tax relief mechanisms. This dual-layered sensitivity approach ensures that the proposed renovation pathways remain both technically optimized and economically viable for the local community.
4. Results
Green spaces and road ratios are within the proportions determined by the United Nations (UN). Therefore, there are no revisions regarding the proportions of green and grey spaces. In addition, the neighborhood residents can access public transport within 500 m of any point in the area. According to the UN The-Sustainable-Development-Goals-Report [70], these characteristics remain unchanged across all scenarios, ensuring that the observed differences in energy demand and emissions are attributable solely to infrastructural and technological interventions, rather than spatial restructuring.
The baseline analysis indicates that the existing neighborhood already meets several spatial sustainability indicators defined by international frameworks, including access to public transportation within a 500 m radius and adequate green–grey area proportions. The mixed-use character of the neighborhood—hosting residential, educational, administrative, and commercial functions—results in relatively stable daily activity patterns and moderate energy demand. This context provides a suitable baseline for evaluating neighborhood-scale decarbonization strategies without altering social or functional dynamics.
The mixed-use character of the neighborhood—comprising residential, educational, administrative, and commercial functions—generates relatively stable daily activity patterns and moderate energy demand. This context provides a robust baseline for evaluating neighborhood-scale decarbonization strategies without altering social or functional dynamics, and urban renewal of idle areas has both supported the proposed energy systems and provided the necessary power to run them.
Considering the neighborhood’s hybrid structure and mixed use, a new car park was proposed to address the severe parking problem for residents and visitors.
A new community center was proposed based on the neighborhood’s needs. This community center could serve a dual purpose: a training center for the neighborhood and a guest house in the event of disasters such as earthquakes common to the region.
The earthquake meeting area is no longer an empty wasteland; it has been designated for earthquake-focused activities during disasters and for the neighborhood community on normal occasions.
The new residential units in two-story villa structures were suggested as an alternative to common houses for neighborhood residents seeking housing options other than multi-story structures.
Green open spaces, sports fields, and children’s playgrounds have been redesigned for residents. All these redesigns and proposals were brought to the idle area of the old District Governor’s Office building, the out-of-use parks, the earthquake meeting area, and the children’s playground (Figure 5).
Figure 5.
Base state of the idle spaces (A), new smart car park and community center (B), general views of the selected case (C) (source: authors’ archive and model).
In the study, 5 cases were examined together with the Base Case. The other 4 cases were related to the use of the other 4 suggested factors. The current state of the neighborhood is the Base Case, in which all equipment and features remain unchanged. Case 1 has SPL street lighting, and all old buildings have PV applications. In Case 2, there is SPL street lighting. Also, all buildings have PV and HP applications. However, the land-use study and idle-area design were not conducted. Case 3 was considered as the case where the open green space and idle space design proposal, SPL street lighting, PV application to all buildings, that means old buildings (OB) and new buildings (NB), and HP application to NB. The last is Case 4: In addition to the features of Case 3, it is the case based on a 10% HP application increase in old buildings every year (Y).
The scenario-based analysis demonstrates that even limited infrastructural interventions can produce substantial reductions in neighborhood-scale energy demand and CO2 emissions. Table 3 summarizes the energy demand and CO2 emission outcomes for the Base Case and four intervention scenarios. The results demonstrate that incremental infrastructure interventions can substantially reduce neighborhood-scale energy demand and emissions.
Table 3.
Comparative Analysis of Energy Demand and CO2 Emissions across Intervention Scenarios.
Among the evaluated measures, converting conventional street lighting to SPL systems yields the most immediate impact, reducing lighting-related emissions by approximately two-thirds relative to the Base Case. This result highlights the often-underestimated role of public infrastructure in neighborhood energy profiles, particularly in temperate climates where heating and cooling loads are moderate. One of the main reasons for this large share of neighborhood energy-related emissions is Izmir’s temperate climate (Csa) [71]. Compared to other cities in other climatic zones, heating and cooling demand are not very high in Izmir. Nonetheless, this is insufficient to achieve net emissions neutrality, even when new community buildings incorporate measures to minimize energy consumption and harvest energy through PVs. Thus, a gradual conversion of heating and cooling systems to HPs was proposed.
Compared to other cities in other climatic zones, heating and cooling demand are not very high in Izmir. Nonetheless, this is insufficient to achieve net emissions neutrality, even when new community buildings incorporate measures to minimize energy consumption and harvest energy through PVs. Thus, a gradual conversion of heating and cooling systems to HPs was proposed.
Scenarios incorporating air-source HPs demonstrate a marked reduction in both energy demand and emissions. Full and immediate conversion of all buildings yields the lowest emissions; however, such a scenario represents an unrealistic implementation pathway at the neighborhood scale.
The gradual renovation scenario, based on a 10% annual replacement rate of conventional heating systems, provides a more plausible transition pathway. The results show that once approximately 65–70% of existing heating systems are replaced with HPs, the neighborhood reaches a net-zero energy balance. Under this pathway, net-zero conditions are achieved within 6–7 years.
Negative net energy values observed in later years indicate surplus renewable energy generation. These values are conservatively treated as zero-emission outcomes to avoid misinterpretation, although the surplus could potentially support additional neighborhood services or electric mobility in practice.
In fact, after converting about 65% of its current heating and cooling systems, the district is at net-zero energy. Any negative net energy demand in the table indicates excess energy harvested by building-integrated systems that residents can use for other purposes. Even though this will not result in actual CO2 capture by the building, net-positive-energy cases are also shown as zero-emission to avoid confusion. A seven-year renovation scheme is sufficient to achieve net-zero energy demand.
This conversion also decreases energy-related heating, cooling, and lighting costs by 290,257, 565,691, and 151,811 € (Euro), respectively, for a total annual cost reduction of 1,007,759 €. These costs are used to calculate ROI without government subsidies and with subsidies available for PVs and HPs at the same level as fossil subsidies [49,50,51,52,53].
Rooftop PV deployment across all buildings further reduces net energy demand by significantly offsetting electricity consumption. However, PV integration alone is insufficient to achieve a net-zero energy balance. The results indicate that heating and cooling systems remain the dominant contributors to residual emissions, emphasizing the importance of transforming thermal energy systems alongside electricity generation.
ROI for cases 1, 2, and 3 are calculated as 11%, 8%, and 11%, respectively. If current government subsidies for natural gas and electricity, 80% and 50%, respectively [54], are applied to PVs and HPs, the ROI in these cases is nearly tripled, reaching 31%, 23%, and 31%, respectively.
This ensures that the necessary investments become economically feasible. However, such rapid deployment of all buildings in the neighborhood is not feasible for HPs, even if financially viable. Thus, a 10% annual change rate for heating equipment is proposed, along with the installation of rooftop PV panels in the first year (Figure 6).
Figure 6.
BEP for PV installation and stepwise HP system replacement with (▬) and without government subsidies (▬) are available for PVs and HPs with the same level as fossil subsidies.
A BEP can only be reached after 14 years. Still, when the same subsidy levels are applied to PVs and HPs as to fossil resources under government policy, BEP can be reached between the 6th and 7th years. This enables the achievement of the 2035 European net-zero targets in an economically feasible way within the given time frame.
5. Discussion
The results of this study demonstrate that neighborhood-scale climate neutrality can be achieved without comprehensive urban redesign or deep building retrofits by prioritizing high-impact, low-disruption interventions. The baseline analysis indicates that the existing neighborhood already meets critical spatial sustainability indicators, such as green–grey area proportions as defined by the United Nations and public transport access within a 500 m radius of any point. Its mixed-use character—hosting residential, educational, administrative, and commercial functions—generates stable activity patterns and moderate energy demand, providing a robust baseline for evaluating decarbonization strategies without altering social or functional dynamics. New infrastructural proposals, including a smart car park to address local parking issues and a community center designed for disaster training and guest housing, are sited on idle areas such as the former District Governor’s Office and underutilized parks. Additionally, two-story villa units were suggested as an alternative housing option to multi-story structures, ensuring that technological interventions are integrated into a redesigned spatial context that includes new sports fields and playgrounds.
These measures deliver substantial energy and emissions reductions, with street lighting retrofits as a critical early-stage intervention when strategically sequenced. In Izmir’s temperate (Csa) climate, heating and cooling demands are not exceptionally high compared to other zones, yet retrofitting conventional street lighting to SPL systems yields the most immediate impact, reducing lighting-related emissions by approximately two-thirds. Specifically, Case 1 reduces primary total energy to 26,871,493 kWh/and net emissions to 2152 tons/year. While rooftop photovoltaics offset electricity demand, findings confirm that thermal systems remain the dominant source of residual emissions, necessitating the integration of heating transformations into net-zero strategies. A gradual renovation scenario based on a 10% annual replacement rate of conventional systems with air-source heat pumps (HPs) provides a plausible transition pathway. Under this scheme, net-zero conditions are achieved within 6 to 7 years once approximately 65–70% of existing systems are replaced, with any surplus renewable energy in later years conservatively treated as zero-emission outcomes.
This study reframes smart analysis as a process-oriented transition framework, shifting focus from static net-zero end-states toward dynamic pathways. This approach challenges the assumption that structural transformation is a prerequisite for neutrality, demonstrating that incremental, policy-aligned interventions constitute a viable pathway to achieving the European climate targets for 2035.
The robustness of these estimates is evaluated by accounting for uncertainties in the study variables and the inherent limitations of the proposed framework. To maintain a standardized baseline, the study relies on fixed indoor comfort setpoints and behavioral profiles defined by the BEP-TR methodology. These uncertainties are compounded by the variability in renewable energy generation, where Case 1 assumes a conservative 15% conversion efficiency and a 0.75 performance ratio. Sensitivity analysis via the Elementary Effect (EEi) method confirms that environmental outcomes are most sensitive to the heat pump installation ratio and grid emission factors. While the framework offers high precision for core building services, the exclusion of miscellaneous electrical appliances and industrial processes represents a recognized gap between the theoretical model and the actual neighborhood energy footprint.
It should also be noted that the urban renovation of abandoned areas has provided a more effective foundation for the energy-efficient systems proposed in the study, essentially supplying energy to the system. Future research incorporating life-cycle assessments and building-level simulations may further refine these estimates and address the complex thermal interactions typical of high-density urban settings.
6. Conclusions
This study presents a simplified, smart analysis-based decision-support framework intended to facilitate neighborhood-scale net-zero targets through high-impact, low-disruption interventions. The baseline analysis notes that the neighborhood already aligns with several United Nations spatial sustainability indicators, such as 500 m public transport accessibility and specific green–grey area proportions. This existing context allows the proposed strategy to focus primarily on technological and infrastructural shifts rather than broader social or functional restructuring. Research indicates that climate neutrality may be attainable within a 6- to 7-year timeframe, with minimal need for extensive urban redesign or deep building retrofits, in a representative mixed-use neighborhood in Izmir.
The findings suggest that while immediate measures, such as converting street lighting to SPL systems, can reduce lighting-related emissions by approximately two-thirds, achieving a net-zero energy balance likely requires a phased transition of thermal systems. Given Izmir’s annual solar radiation level of 1608 kWh/m2 and the proposed use of air-source heat pumps with a Coefficient of Performance (COP) of 5, the model indicates that rooftop photovoltaic deployment can offset a portion of electricity consumption but may not be sufficient to achieve net neutrality on its own. Instead, the gradual replacement of conventional heating systems with heat pumps at an annual rate of 10% appears to be a primary driver for decarbonization. Results suggest that once this replacement reaches a 65–70% threshold, the neighborhood could achieve a net-zero energy balance, potentially aligning with the European Union’s 2035 climate targets within a 6–7-year implementation window.
The economic feasibility of this transition appears to rely on the strategic reallocation of financial instruments rather than solely on increased public expenditure. While the initial return on investment (ROI) for combined solar and heating interventions is estimated at 0.11, redirecting current government subsidies—80% for natural gas and 50% for electricity—could increase the ROI to 0.31. This shift is estimated to decrease annual energy-related costs for heating, cooling, and lighting by a total of €1,007,759, which could reduce the investment turnaround time from 9.24 years to approximately 7.83 years. These figures suggest that technological investments may become more economically viable when existing fossil fuel subsidies are redirected toward electrification and renewable energy.
The reconciliation of the trade-off between conventional building renovation and the pursuit of net-zero objectives is addressed through a strategically sequenced asset transition. Within a five-year horizon, the framework focuses on immediate infrastructure upgrades and the initiation of a steady technological transition, aligning with the European Commission’s Renovation Wave and REPowerEU strategies to accelerate building electrification and phase out fossil fuel dependencies. Over the ten-year horizon leading to 2035, achieving the 65–70% threshold for heating system replacement supports the objectives of the EU Mission for Climate-Neutral and Smart Cities, of which Izmir is a participant. This demonstrated pathway suggests that incremental technological transitions may provide a more practical and socially acceptable route to climate neutrality than extensive structural remodeling.
The scientific contribution of this research lies in presenting smart analysis as a process-oriented transition framework that emphasizes dynamic pathways over static end-states. By using the Elementary Effect method to quantify sensitivities, the study indicates that environmental outcomes are notably influenced by the heat pump installation ratio and grid emission factors, such as an electricity intensity of 0.375 kg/kWh. Although the framework is bounded by the BEP-TR methodology—utilizing standardized parameters such as residential internal gains of 11.5 W/m2 and an infiltration rate of 0.5 h−1—it offers a potentially replicable and scalable tool for municipalities. Ultimately, the results suggest that strategically sequenced interventions could help bridge the gap between climate targets and implementation capacity, providing a feasible pathway toward sustainable urban energy transitions. To further refine this framework, future research may incorporate life-cycle carbon assessments and multi-dimensional social acceptance analyses to evaluate the holistic sustainability of neighborhood-scale energy transitions.
Author Contributions
Conceptualization, E.A. and D.C.U.; methodology, D.C.U. and A.K.; validation, E.A. and D.C.U.; formal analysis, E.A. and D.C.U.; data curation, D.C.U.; writing—original draft preparation, E.A., D.C.U., A.K. and N.D.B.; writing—review and editing, E.A., D.C.U., A.K. and N.D.B.; visualization A.K. and D.C.U.; supervision, E.A.; project administration E.A.; funding acquisition, E.A. All authors have read and agreed to the published version of the manuscript.
Funding
This research was funded by Yaşar University, grant number BAP97.
Data Availability Statement
The authors tried to use and share all available data in this study. You can reach the authors at their e-mail addresses for data or information that is not understood and requires more details.
Acknowledgments
The authors would like to thank Yaşar University, Department of Architecture, and the Project Support Office for supporting this study through the grant for Scientific Research Project no: BAP97 titled “Smart and Sustainable Neighborhood Scale of Certificate Comparison and Creating E-Newsletter”. Also, the authors would like to thank Emin Selahattin UMDU and Ismail ALAKAVUK for their support in the energy-emission calculation process and smart analysis framework for the study.
Conflicts of Interest
During the project period, Duygu Cinar Umdu worked at Yaşar University, and during the article writing process, she worked for both Yaşar University and Calor-e Oy. The remaining authors declare that the research was conducted in the absence of any commercial or financial relationships that could be construed as a potential conflict of interest.
Abbreviations
The following abbreviations are used in this manuscript:
| 3D | 3 Dimension |
| AB | All buildings |
| AEB | Annual economic benefits |
| AI | Artificial Intelligence |
| AIR | Annual investments required |
| BEP | Breakeven point |
| BIM | Building information modeling |
| COP | Coefficient of performance |
| EEi | Elementary Effect |
| EMPIRE | European Model for Power System Investments with Renewable Energy |
| EU | European Union |
| GHG | Greenhouse Gass |
| GIS | Geographic information system |
| HP | Heat pump |
| IoT | Internet of Things |
| NB | New building |
| NG | Natural Gass |
| NZEN | Net-Zero energy neighbourhood |
| OB | Old building |
| PV | Photovoltaic |
| ROI | Return on investment |
| SMART | Specific-Measurable-Achievable-Relevant-Time bound |
| SPL | Solar-powered LED |
| TETC-TEİAŞ | Turkish Electricity Transmission Corporation |
| TSI-TUIK | Turkish Statistical Institute |
| UN | United Nations |
| Y | Year |
References
- EU. Climate-Neutral and Smart Cities. Research and Innovation. Available online: https://research-and-innovation.ec.europa.eu/funding/funding-opportunities/funding-programmes-and-open-calls/horizon-europe/eu-missions-horizon-europe/climate-neutral-and-smart-cities_en (accessed on 20 January 2026).
- Rivas, S.; Urraca, R.; Bertoldi, P.; Thiel, C. Towards the EU Green Deal: Local key factors to achieve ambitious 2030 climate targets. J. Clean. Prod. 2021, 320, 128878. [Google Scholar] [CrossRef] [Scilit]
- EU. Commission Announces 100 Cities Participating in the EU Mission for Climate-Neutral and Smart Cities by 2030. Available online: https://ec.europa.eu/commission/presscorner/detail/en/IP_22_2591 (accessed on 29 December 2022).
- Zhang, M.; Kafy, A.A.; Xiao, P.; Han, S.; Zou, S.; Saha, M.; Rahaman, Z.A.; Al Rakib, A.; Zhang, M.; Tan, S. Impact of urban expansion on land surface temperature and carbon emissions using machine learning algorithms in Wuhan, China. Urban. Clim. 2023, 47, 101347. [Google Scholar] [CrossRef] [Scilit]
- EU. Paris Agreement: The EU Submits Its Updated NDC with an Indicative Target for 2035 to the UN ahead of COP30. Available online: https://www.consilium.europa.eu/en/press/press-releases/2025/11/05/paris-agreement-the-eu-submits-its-updated-ndc-with-an-indicative-target-for-2035-to-the-un-ahead-of-cop30/ (accessed on 25 December 2025).
- Garcia, R. The 100 Climate-Neutral and Smart Cities by 2030. Eurocities. 2022. Available online: https://eurocities.eu/latest/the-100-climate-neutral-and-smart-cities-by-2030/ (accessed on 29 December 2022).
- Euro Cities. EU’s Renovation Wave Initiative Delivered with Cities and Citizens. Available online: https://ec.europa.eu/futurium/en/system/files/ged/eurocities-policy-paper-renovation-wave_final_10092020.pdf (accessed on 22 October 2022).
- Silva, N.S.e.; Castro, R.; Ferrão, P. Smart Grids in the Context of Smart Cities: A Literature Review and Gap Analysis. Energies 2025, 18, 1186. [Google Scholar] [CrossRef] [Scilit]
- Alakavuk, E.; Cinar Umdu, D. Urban Open Therapy Gardens in EU Cities Mission: Izmir Union Park Proposal. Sustainability 2023, 15, 6715. [Google Scholar] [CrossRef] [Scilit]
- Bernini, C.; Tampieri, A. The mediating role of urbanization on the composition of happiness. Pap. Reg. Sci. 2022, 101, 639–657. [Google Scholar] [CrossRef] [Scilit]
- Wu, D. Towards Resilient Urban Design: Revealing the Impacts of Built Environment on Physical Activity Amidst Climate Change. Buildings 2025, 15, 3470. [Google Scholar] [CrossRef] [Scilit]
- He, H.; Wang, H.; Zheng, L.; Zhao, T.; Zhang, P.; Zheng, K. Factors and Pathways to Enhance Resident Satisfaction in Old Residential Neighbourhood Renovation: A Configuration Analysis of Cases in Central Nanchang, China. Buildings 2025, 15, 1125. [Google Scholar] [CrossRef] [Scilit]
- Pulgar Rubilar, P.; Jordán Vidal, M.M.; Blanco Fernández, D.; Osorio Ramirez, M.; Perillán Torres, L.; Lizana Vial, M.; Lobos Calquin, D.; Pardo Fabregat, F.; Navarro Pedreño, J. Neighbourhood Sustainability Assessment Tools for Sustainable Cities and Communities, a Literature Review—New Trends for New Requirements. Buildings 2023, 13, 2782. [Google Scholar] [CrossRef] [Scilit]
- Boca, M.C.; Bungau, C.C.; Hanga-Farcas, I.F. Climate-Conscious Sustainable Practices in the Romanian Building Sector. Buildings 2025, 15, 2106. [Google Scholar] [CrossRef] [Scilit]
- Mensah, J.; Casadevall, S.R. Sustainable development: Meaning, history, principles, pillars, and implications for human action: Literature review. Cogent Soc. Sci. 2019, 5, 1653531. [Google Scholar] [CrossRef] [Scilit]
- Nolon, J.R. Golden and its emanations: The surprising origins of smart growth. Urb. Law. 2003, 35, 15–73. [Google Scholar] [CrossRef] [Scilit]
- Brozovsky, J.; Gustavsen, A.; Gaitani, N. Zero emission neighbourhoods and positive energy districts–A state-of-the-art review. Sustain. Cities Soc. 2021, 72, 103013. [Google Scholar] [CrossRef] [Scilit]
- Madushika, U.D. Energy and life-cycle cost-saving potential of buildings using green walls: A case study from Sri Lanka. J. Green. Build. 2022, 17, 179–197. [Google Scholar] [CrossRef] [Scilit]
- Kylili, A.; Fokaides, P.A. European smart cities: The role of zero energy buildings. Sustain. Cities Soc. 2015, 15, 86–95. [Google Scholar] [CrossRef] [Scilit]
- Koch, J.; Christ, O. Household participation in an urban photovoltaic project in Switzerland: Exploration of triggers and barriers. Sustain. Cities Soc. 2018, 37, 420–426. [Google Scholar] [CrossRef] [Scilit]
- Silva, B.N.; Khan, M.; Han, K. Towards sustainable smart cities: A review of trends, architectures, components, and open challenges in smart cities. Sustain. Cities Soc. 2018, 38, 697–713. [Google Scholar] [CrossRef] [Scilit]
- Zhang, Q.; Yung, E.H.K.; Chan, E.H.W. Towards sustainable neighborhoods: Challenges and opportunities for neighborhood planning in transitional urban China. Sustainability 2018, 10, 406. [Google Scholar] [CrossRef] [Scilit]
- Olsen, C.; Kowalewski, A.; Gould, M.; Lambrinos, J. Evaluating two rainwater harvesting systems in an urban setting in Oregon’s Willamette Valley. J. Green. Build. 2017, 12, 406. [Google Scholar] [CrossRef] [Scilit]
- Koepke, J. Urban stream restoration and applied practices in Northeast Illinois. J. Green. Build. 2017, 12, 13–27. [Google Scholar] [CrossRef] [Scilit]
- Jensen, L.B.; Bjerre, L.; Mansfeldt, L. Sustainability certification systems as guidelines for early-phase urban design processes. J. Green. Build. 2016, 11, 81–94. [Google Scholar] [CrossRef] [Scilit]
- Yiğitcanlar, T.; Kamruzzaman, M.; Teriman, S. Neighborhood sustainability assessment: Evaluating residential development sustainability in a developing country context. Sustainability 2015, 7, 2570–2602. [Google Scholar] [CrossRef] [Scilit]
- Lewin, S.S. Urban sustainability and urban form metrics. J. Green. Build. 2012, 7, 44–63. [Google Scholar] [CrossRef] [Scilit]
- Çetin, M. Using GIS analysis to assess urban green space in terms of accessibility: Case study in Kutahya. Int. J. Sustain. Dev. World Ecol. 2015, 22, 420–424. [Google Scholar] [CrossRef] [Scilit]
- Ansah, M.K.; Chen, X.; Yang, H.; Lu, L.; Lam, P.T. A review and outlook for integrated BIM application in green building assessment. Sustain. Cities Soc. 2019, 48, 101576. [Google Scholar] [CrossRef] [Scilit]
- Kamari, A.; Laustsen, C.; Petersen, S.; Kirkegaard, P.H. A BIM-based decision support system for the evaluation of holistic renovation scenarios. J. Inf. Technol. Constr. 2018, 23, 354–380. [Google Scholar]
- Mutani, G.; Gadaleta, G.; Giraud, B. District-scale energy modelling: A methodology for the energy assessment of building stocks. Energy Build. 2023, 286, 112861. [Google Scholar] [CrossRef] [Scilit]
- Nardelli, C.; Colombo, R.; Banfi, A.; Ferrando, M.; Shi, X.; Causone, F. A Comparative Analysis of Two Urban Building Energy Modelling Tools via the Case Study of an Italian Neighbourhood. Energies 2025, 18, 2618. [Google Scholar] [CrossRef] [Scilit]
- Chen, G.; He, H.; Chen, Y.; Zhao, L.; Cai, Y.; Ma, Y. Applying a diagnostic equation for maximum urban heat island intensity based on local climate zones for Guangzhou, China. Build. Environ. 2023, 228, 109817. [Google Scholar] [CrossRef] [Scilit]
- Han, S.; Hou, H.; Estoque, R.C.; Zheng, Y.; Shen, C.; Murayama, Y.; Zhang, X.; Hu, T. Seasonal effects of urban morphology on land surface temperature in a three-dimensional perspective: A case study in Hangzhou, China. Build. Environ. 2023, 228, 109913. [Google Scholar] [CrossRef] [Scilit]
- Zuo, J.; Ma, J.; Lin, T.; Dong, J.; Lin, M.; Luo, J. Quantitative valuation of green roofs’ cooling effects under different urban spatial forms in high-density urban areas. Build. Environ. 2022, 222, 109367. [Google Scholar] [CrossRef] [Scilit]
- Backe, S.; Skar, C.; del Granado, P.C.; Turgut, O.; Tomasgard, A. Empire: An open-source model based on multi-horizon programming for energy transition analyses. SoftwareX 2022, 17, 100877. [Google Scholar] [CrossRef] [Scilit]
- Lerbinger, A.; Petkov, I.; Mavromatidis, G.; Knoeri, C. Optimal Decarbonization Strategies for Existing Districts Considering Energy Systems and Retrofits. Appl. Energy 2023, 352, 121863. [Google Scholar] [CrossRef] [Scilit]
- Doran, G.T. There’s a SMART way to write management’s goals and objectives. Manag. Rev. 1981, 70, 35–36. [Google Scholar]
- Öztürk, K.; Can, Z. Predicting Air Quality in Izmir Using Artificial Intelligence and IoT. J. Comput. Des. 2025, 6, 341–364. [Google Scholar] [CrossRef] [Scilit]
- Bodur, M.A. İzmir Büyükşehir Belediyesi Tam Adaptif Akilli Trafik Yönetim Sistemi. Iv. Yapi Elektronik Sistemleri Sempozyumu Bildirileri. Available online: https://www.emo.org.tr/etkinlikler/yapielo/etkinlik_bildirileri_detay.php?etkinlikkod=273&bilkod=6869 (accessed on 31 March 2026).
- Ünal, S.G.; Erol, D. The variation of sustainable neighborhood planning, planning new trends “ecodistrict” approaches and its application in Turkey. Planning 2020, 30, 15–35. [Google Scholar] [CrossRef] [Scilit]
- Coulton, C.J.; Jennings, M.Z.; Chan, T. How big is my neighborhood? Individual and contextual effects on perceptions of neighborhood scale. Am. J. Community Psychol. 2013, 51, 140–150. [Google Scholar] [CrossRef] [Scilit]
- Kumlu, K.; Tüdeş, S.; Keleş, R. Proposal of a multivariate method to measure the results of planning decisions that shape the built environment on the neighborhood unit scale. Planning 2018, 28, 328–347. [Google Scholar] [CrossRef] [Scilit]
- Turkish Statistical Institute (TÜİK). Survey on Building and Dwelling Characteristics 2021 [Micro Data Set]; TÜİK: Ankara, Turkey, 2022; Available online: https://sesricdiag.blob.core.windows.net/oicstatcom/CENSUS_Survey_on_Building_and_Dwelling_Char_EN.pdf (accessed on 31 March 2026).
- TSE (Turk Standardları Enstitusu). TS 825 Thermal Insulation in Buildings. 2024. Available online: https://www.scribd.com/document/898147764/TS-825-1 (accessed on 6 October 2021).
- IEA (International Energy Agency). The Future of Heat Pumps, World Energy Outlook Special Report, Revised Version. 2022. Available online: https://iea.blob.core.windows.net/assets/01324438-d634-4d49-95d8-3d08aaab00d5/TheFutureofHeatPumps.pdf (accessed on 25 January 2023).
- IRENA (International Renewable Energy Agency). Renewable Power Generation Costs in 2021. 2022. Available online: https://www.irena.org/-/media/Files/IRENA/Agency/Publication/2022/Jul/IRENA_Power_Generation_Costs_2021.pdf (accessed on 25 January 2023).
- BS EN 15316-4-3:2017; Energy Performance of Buildings—Methods for Calculation of System Energy Requirements and System Efficiencies—Part 4-3: Heat Generation Systems, Thermal Solar and Photovoltaic Systems. British Standards Institution, BSI: London, UK, 2017. Available online: https://knowledge.bsigroup.com/products/energy-performance-of-buildings-method-for-calculation-of-system-energy-requirements-and-system-efficiencies-heat-generation-systems-thermal-solar-and-photovoltaic-systems-module-m3-8-3-m8-8-3-m11-8-3 (accessed on 26 February 2024).
- Gümüş, B.S. Türkiye Surpasses 2025 Solar Target as Capacity Doubles in 2.5 Years. Ember. Available online: https://ember-energy.org/latest-insights/turkiye-surpasses-2025-solar-target-as-capacity-doubles-in-2-5-years/#:~:text=The%20facilitation%20of%20self%2Dconsumption,and%20T%C3%BCrkiye’s%20evolving%20energy%20landscape (accessed on 31 March 2026).
- ISO 52016-1:2017; Energy Performance of Buildings—Energy Needs for Heating and Cooling, Internal Temperatures and Sensible and Latent Heat Loads—Part 1: Calculation Procedures. International Organization for Standardization: Geneva, Switzerland, 2017. Available online: https://www.iso.org/standard/65696.html (accessed on 31 March 2026).
- Ministry of Environment, Urbanization and Climate Change (CSB). Building Energy Performance (BEP-TR) Calculation Methodology (Binalarda Enerji Performansı Hesaplama Metodolojisi); Directorate General of Professional Services: Ankara, Turkey, 2017; Available online: https://www.lexpera.com.tr/resmi-gazete/metin/binalarda-enerji-performansi-ulusal-hesaplama-yontemine-dair-teblig-30227-1-mhg-2017-26 (accessed on 25 May 2020).
- Climate Action Tracker: Türkiye. 2026. Available online: https://climateactiontracker.org/countries/turkey/ (accessed on 22 April 2026).
- Ministry of Energy and Natural Resources. Turkey Solar Energy Potential Atlas (GEPA); Republic of Türkiye Ministry of Energy and Natural Resources: Ankara, Türkiye, 2024. Available online: https://enerji.gov.tr (accessed on 1 April 2026).
- Ispir, M.; Aksoy, M.H.; Kalyoncu, M. Estimation of solar radiation and photovoltaic power potential of Türkiye using ANFIS. J. King Saud. Univ. Eng. Sci. 2025, 37, 123–135. [Google Scholar] [CrossRef] [Scilit]
- Eurostat. Electricity and Gas Prices for Household Consumers—Bi-Annual Data (nrg_pc_204). 2024. Available online: https://ec.europa.eu/eurostat/databrowser/view/nrg_pc_204/default/table (accessed on 16 April 2026).
- Subramani, C.; Surya, S.; Gowtham, J.; Chari, R.; Srinivasan, S.; Siddharth, J.P.; Shrimali, H. Energy efficiency and pay-back calculation on street lighting systems. In AIP Conference Proceedings; Govindarajan, A., Sambath, P., Sangeetha, S., Eds.; AIP Publishing: Melville, NY, USA, 2019; Volume 2112, p. 020082. Available online: https://aip.scitation.org/doi/abs/10.1063/1.5112267 (accessed on 21 May 2020).
- IEA (International Energy Agency). Levelized Cost of Heating (LCOH) for Consumers, for Selected Space and Water Heating Technologies and Countries. 2022. Available online: https://www.iea.org/data-and-statistics/charts/levelized-cost-of-heating-lcoh-for-consumers-for-selected-space-and-water-heating-technologies-and-countries (accessed on 23 December 2022).
- Temizer, M.; Kılıç, Z.B.; Çağatay, G.; Yüksel, F. Bakan Dönmez: Mart 2023′te Karadeniz Gazını Karada Yakmış Olacağız [Minister Dönmez: By March 2023, We Will Have Burned the Black Sea Gas on Land]; Anadolu Agency: Ankara, Turke, 2022; Available online: https://www.aa.com.tr/tr/gundem/bakan-donmez-mart-2023te-karadeniz-gazini-karada-yakmis-olacagiz/2658654 (accessed on 23 October 2022).
- Menberg, W.; Heo, Y.; Choudhary, R. Sensitivity analysis methods for building energy models: Comparing computational costs and extractable information. Energy Build. 2016, 133, 433–445. [Google Scholar] [CrossRef] [Scilit]
- AtlasBig. İzmir Gaziemir’in Mahalleleri [Neighborhoods of Izmir, Gaziemir]. 2018. Available online: https://www.atlasbig.com/tr/izmir-gaziemirin-mahalleleri (accessed on 19 October 2020).
- Çılgın, K.; Yirmibeşoğlu, F. Neighborhood Governance in the Pursuit of Local Democracy. Planlama 2019, 29, 102–114. [Google Scholar] [CrossRef] [Scilit]
- Reis, Y.K. Improving building permit procedures in municipalities. Planning 2014, 24, 55–63. [Google Scholar]
- SGBC (Swedish Green Building Council). CityLab Action Guide Version 3. 2019. Available online: https://www.sgbc.se/app/uploads/2019/06/Citylab-Guide-H%C3%A5llbar-stadsutveckling-i-planering-och-genomf%C3%B6rande.pdf (accessed on 7 October 2022).
- USGBC (US Green Building Council). LEED v4.1 Cities and Communities: Existing. 2021. Available online: https://www.usgbc.org/resources/addenda-tables-leed-v41-cities-and-communities-existing (accessed on 7 October 2022).
- Charly, A.; Thomas, N.J.; Foley, A.; Caulfield, B. Identifying optimal locations for community electric vehicle charging. Sustain. Cities Soc. 2023, 94, 104573. [Google Scholar] [CrossRef] [Scilit]
- Umdu, E.S. Turkiye Bina Stogu Durum Analizi [Turkey Building Stock Situation Analysis]. In Proceedings of the Workshop on Near Zero Buildings, DKTI Programme for Energy Efficiency in Public Buildings in Turkey, Ankara, Turkey, 28 June 2018. [Google Scholar]
- Priarone, A.; Silenzi, F.; Fossa, M. Modelling heat pumps with variable EER and COP in energy plus: A case study applied to ground source and heat recovery heat pump systems. Energies 2020, 13, 794. [Google Scholar] [CrossRef] [Scilit]
- DEFRA (Department for Environment Food and Rural Affairs). Guidelines to DEFRA’s GHG Conversion Factors for Company Reporting. 2007. Available online: www.carbonindependent.org/files/conversion-factors.pdf (accessed on 25 August 2021).
- Low Carbon Power. Electricity in Turkey in 2024/2025. 2026. Available online: https://lowcarbonpower.org/region/Turkey (accessed on 24 February 2026).
- UN (United Nations). The Sustainable Development Goals Report 2021. 2021. Available online: https://unstats.un.org/sdgs/report/2021/The-Sustainable-Development-Goals-Report-2021.pdf (accessed on 6 October 2021).
- Öztürk, M.Z.; Çetinkaya, G.; Aydın, S. Climate Types of Turkey According to Köppen-Geiger Climate Classification. J. Geogr. 2017, 35, 17–27. [Google Scholar] [CrossRef] [Scilit]
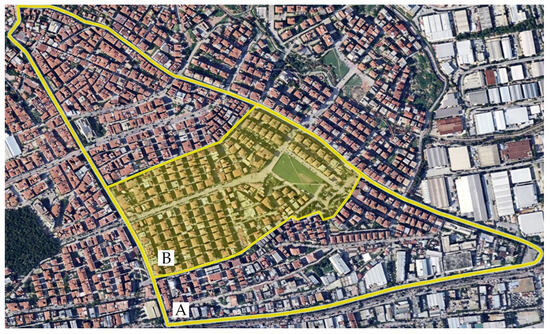
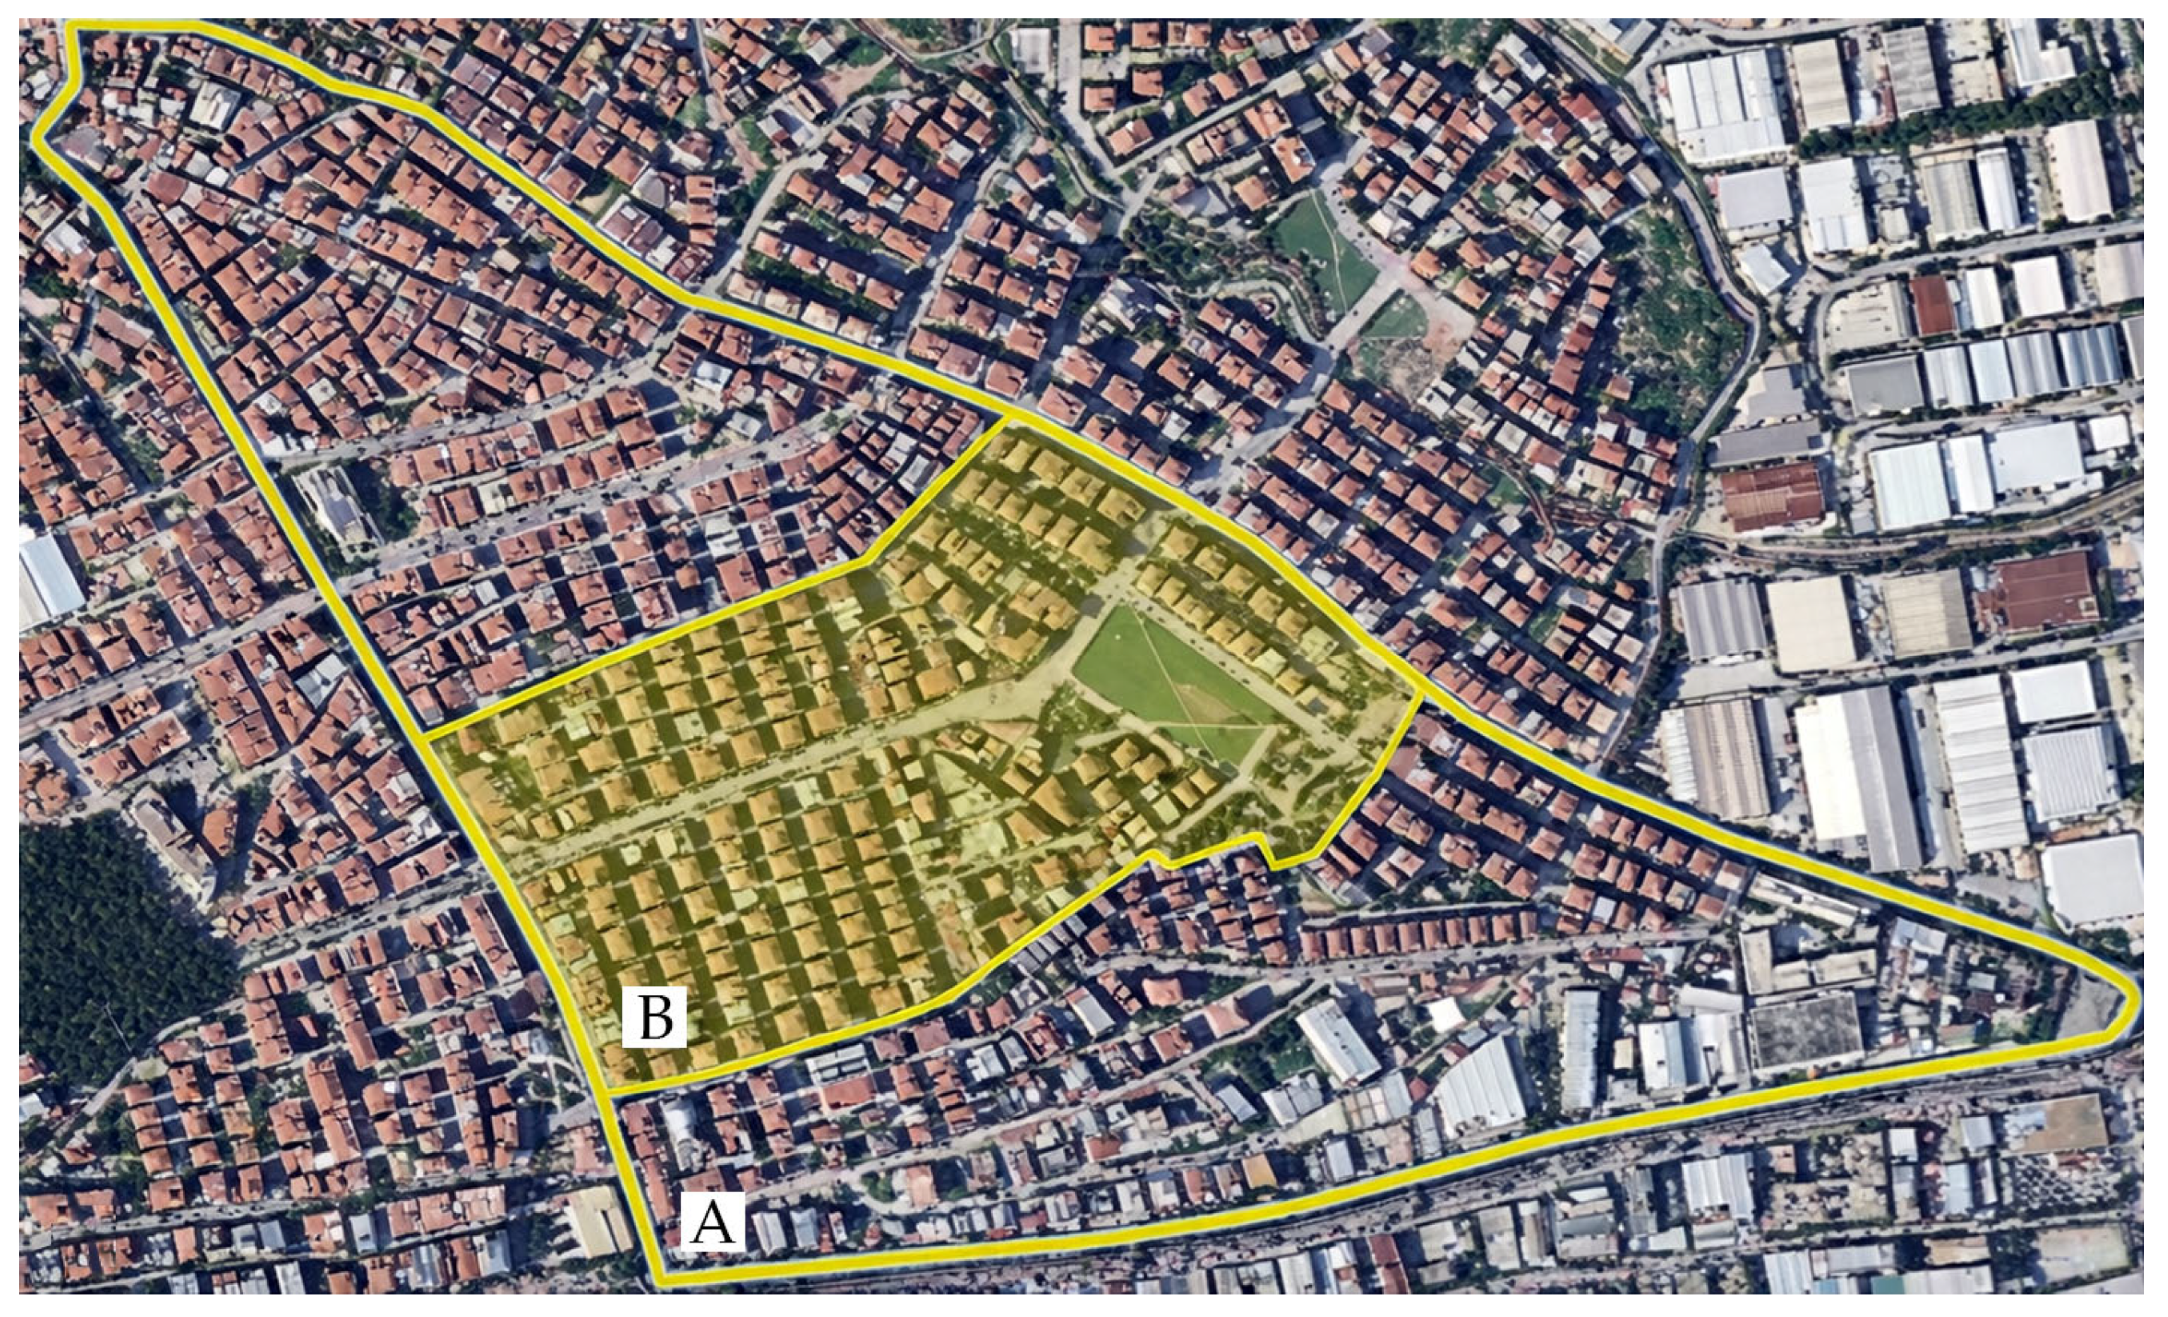
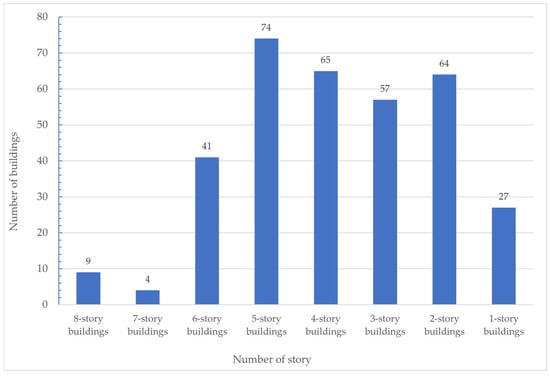
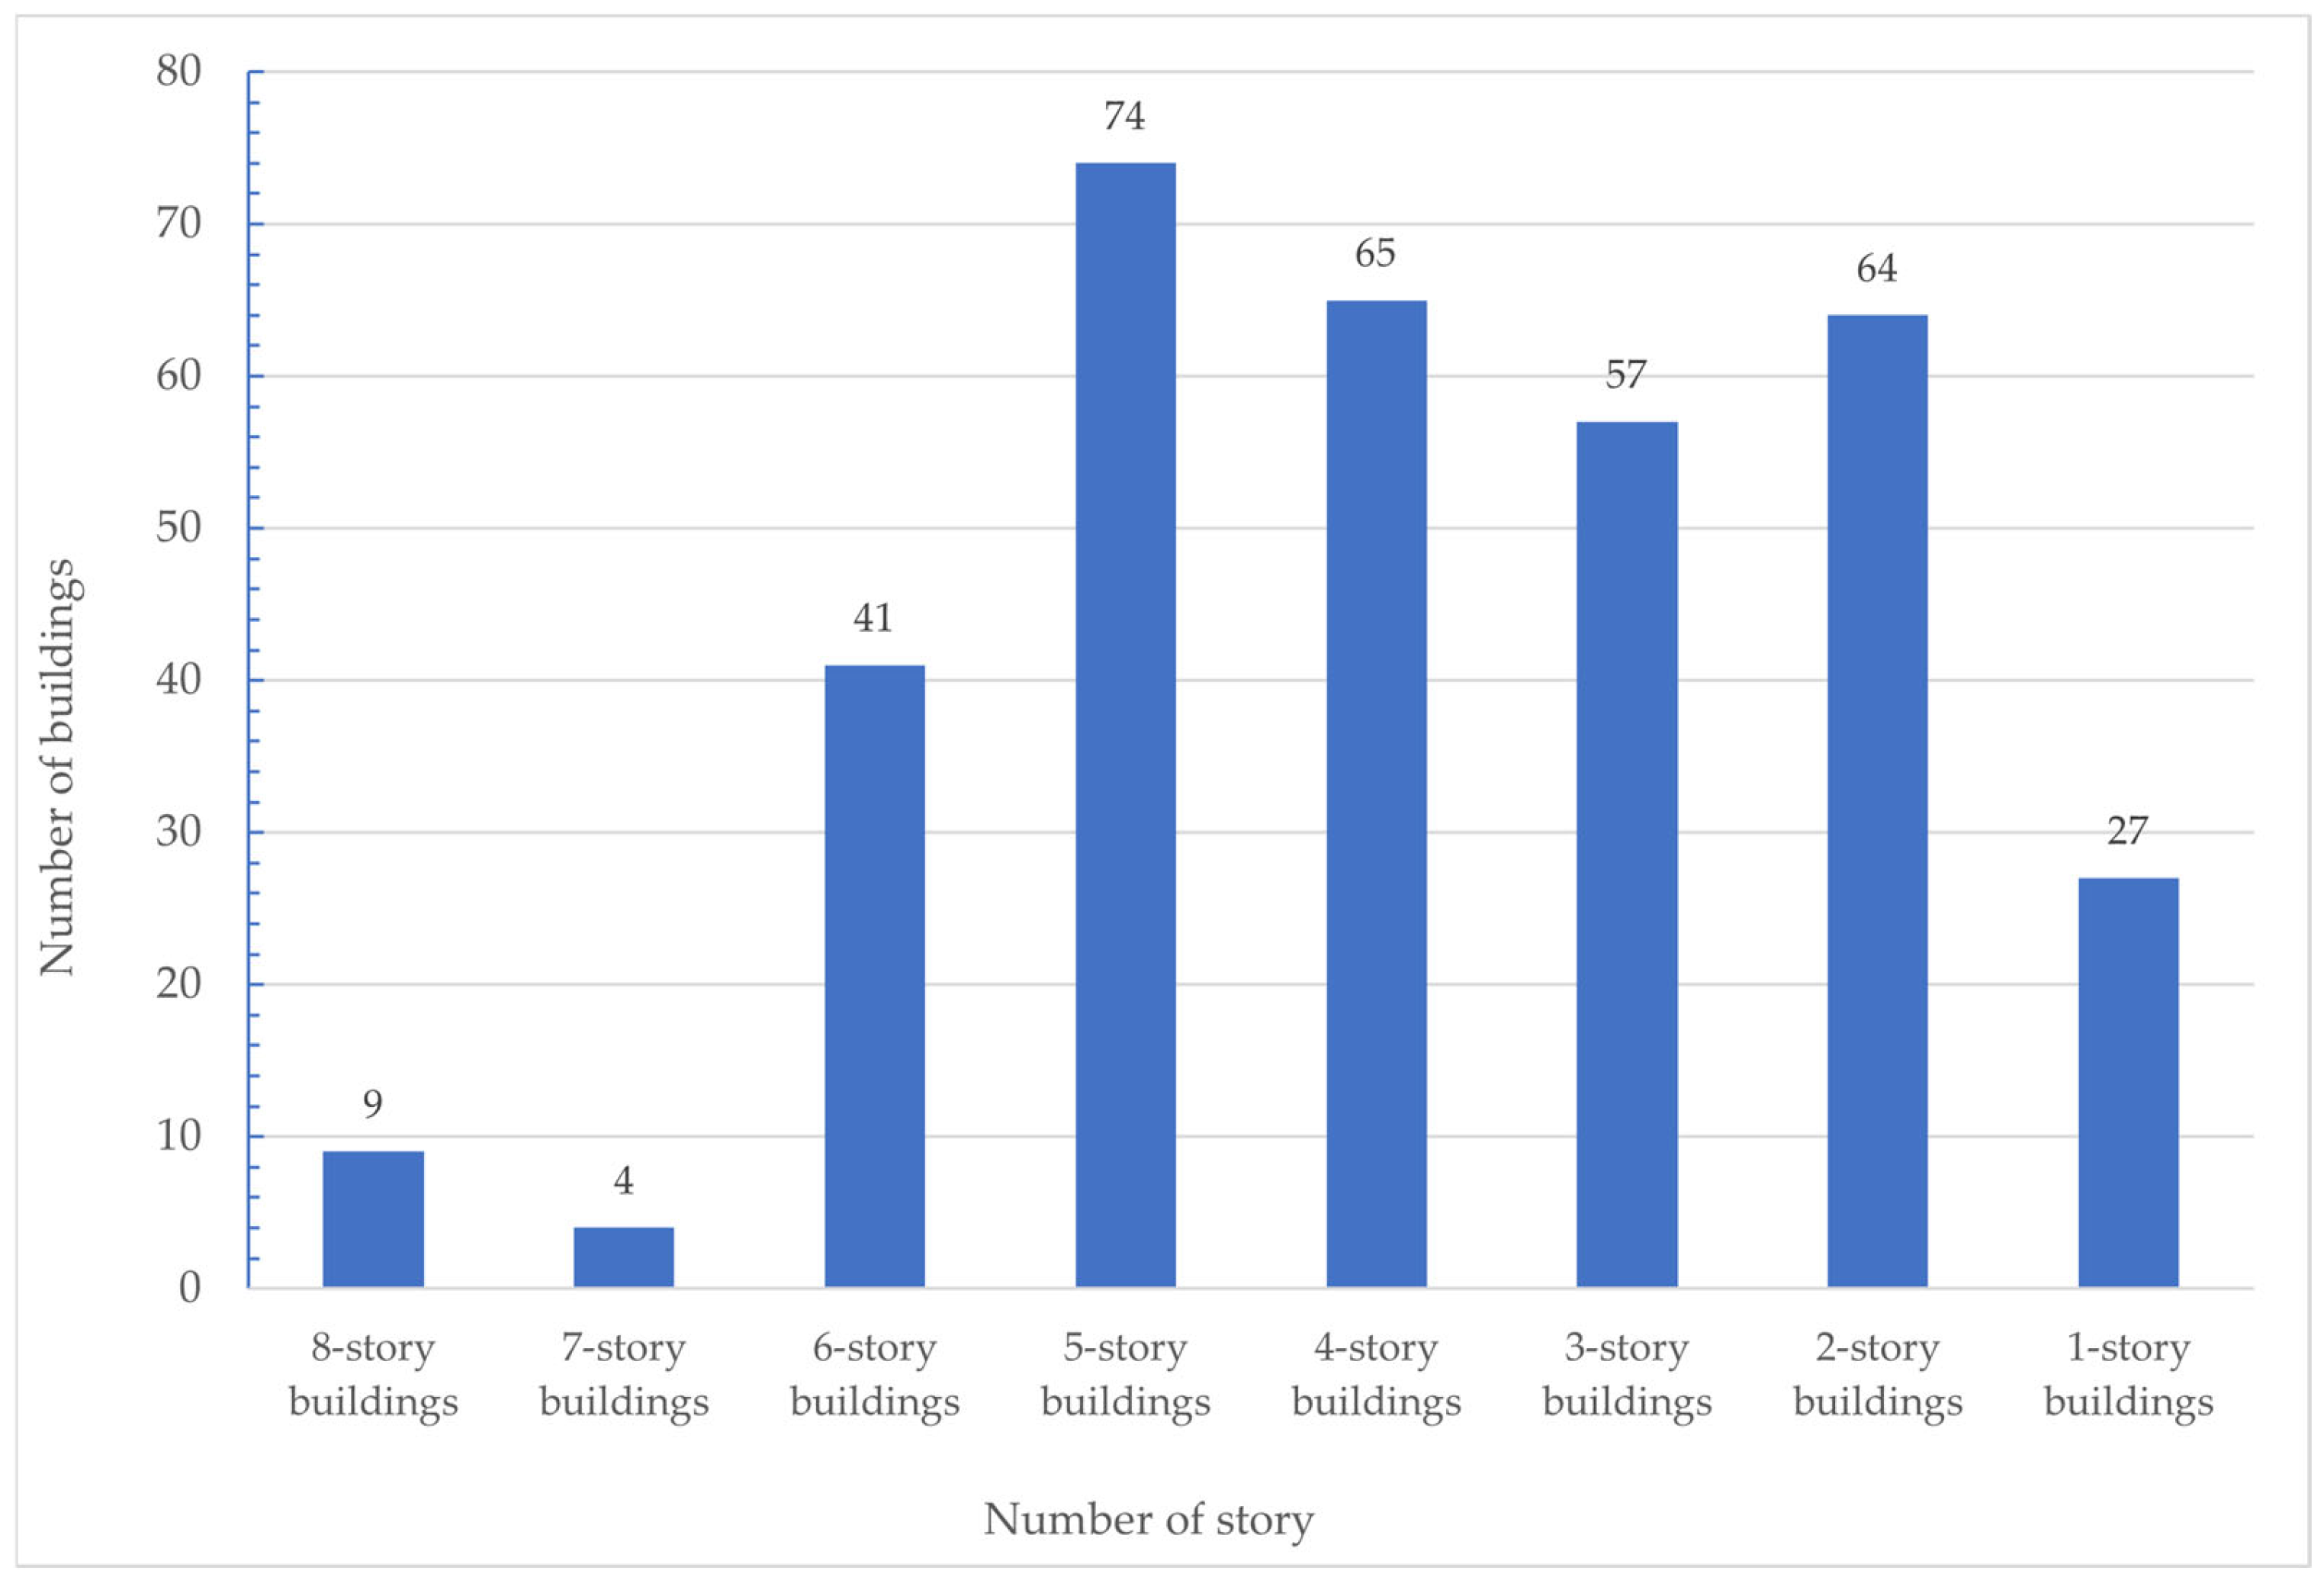
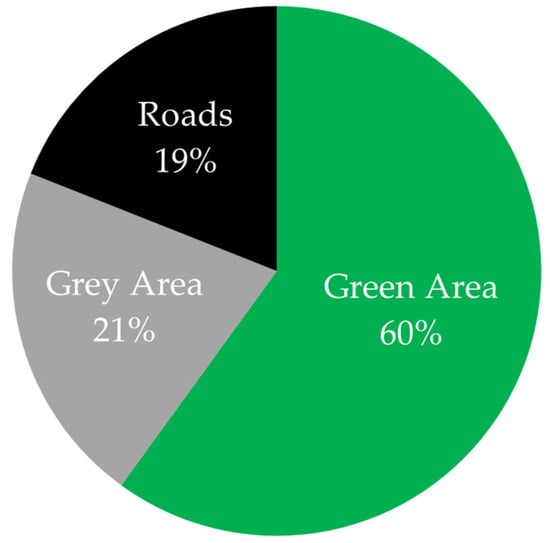
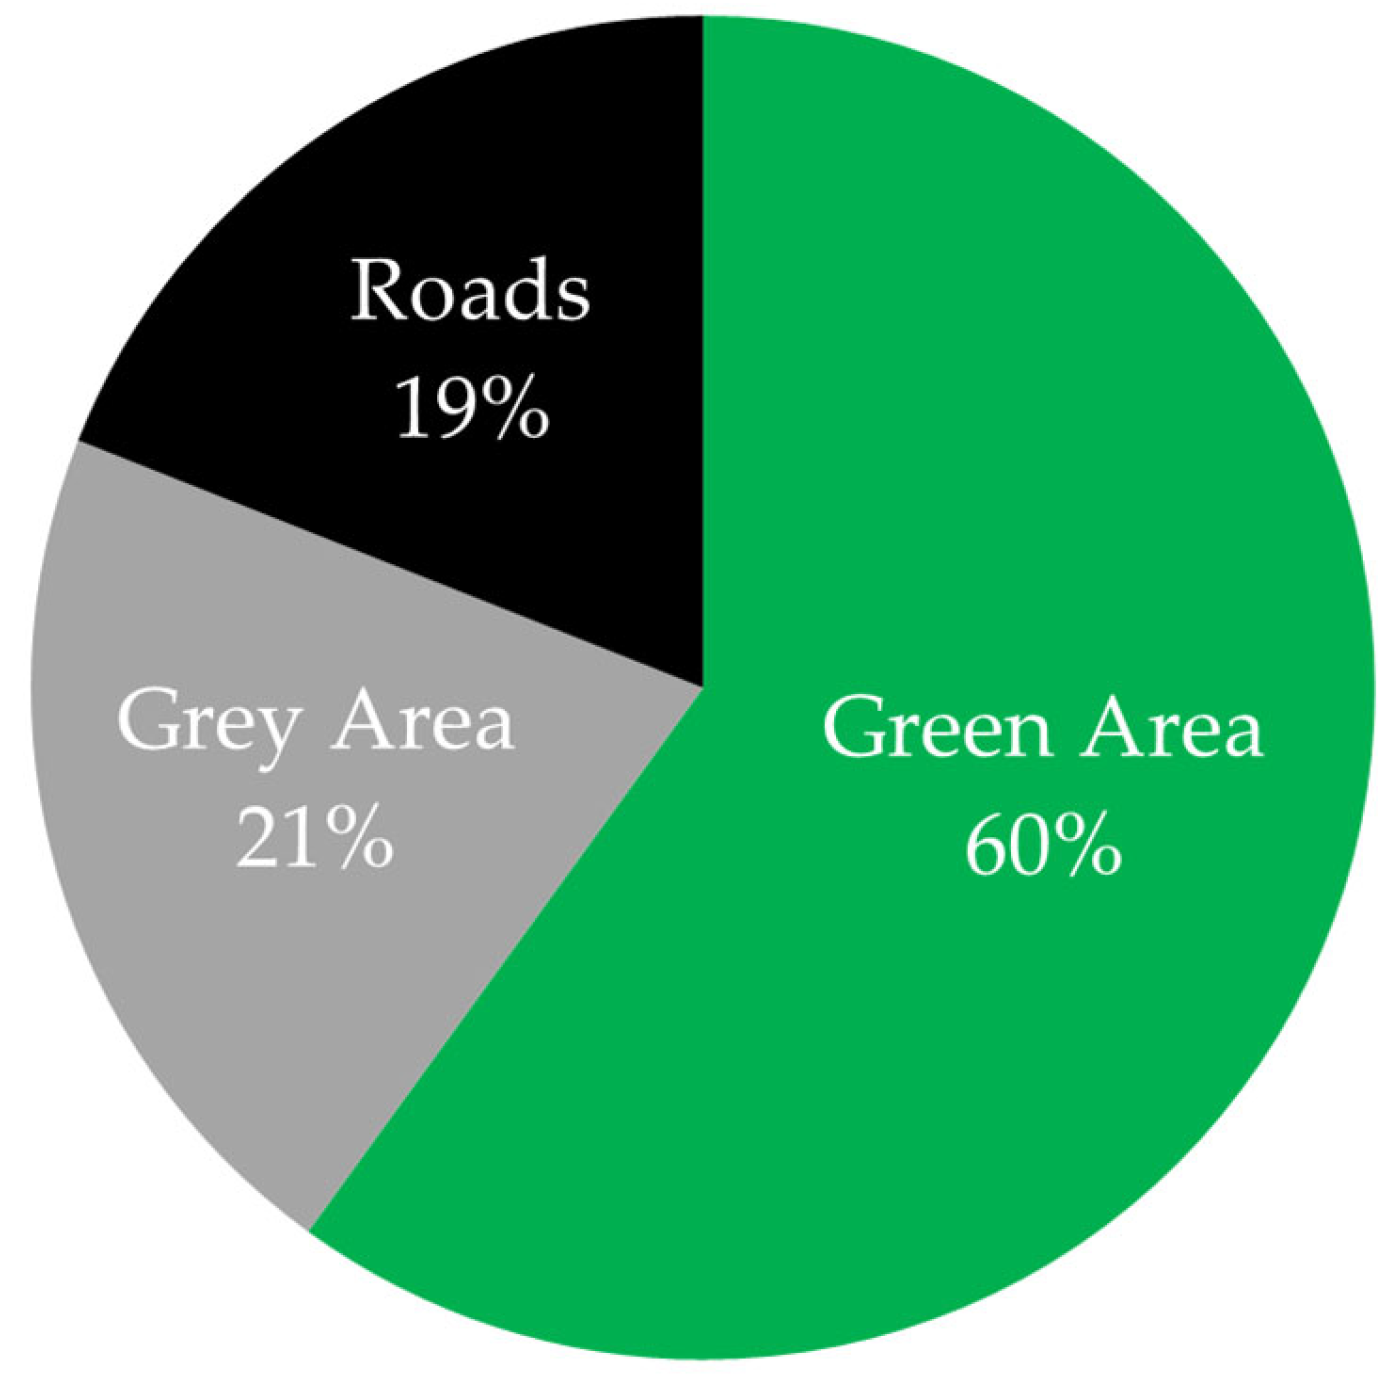
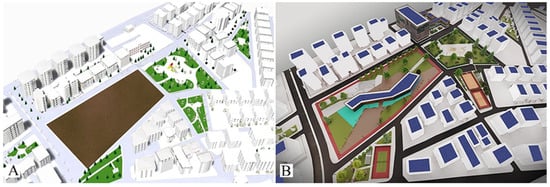
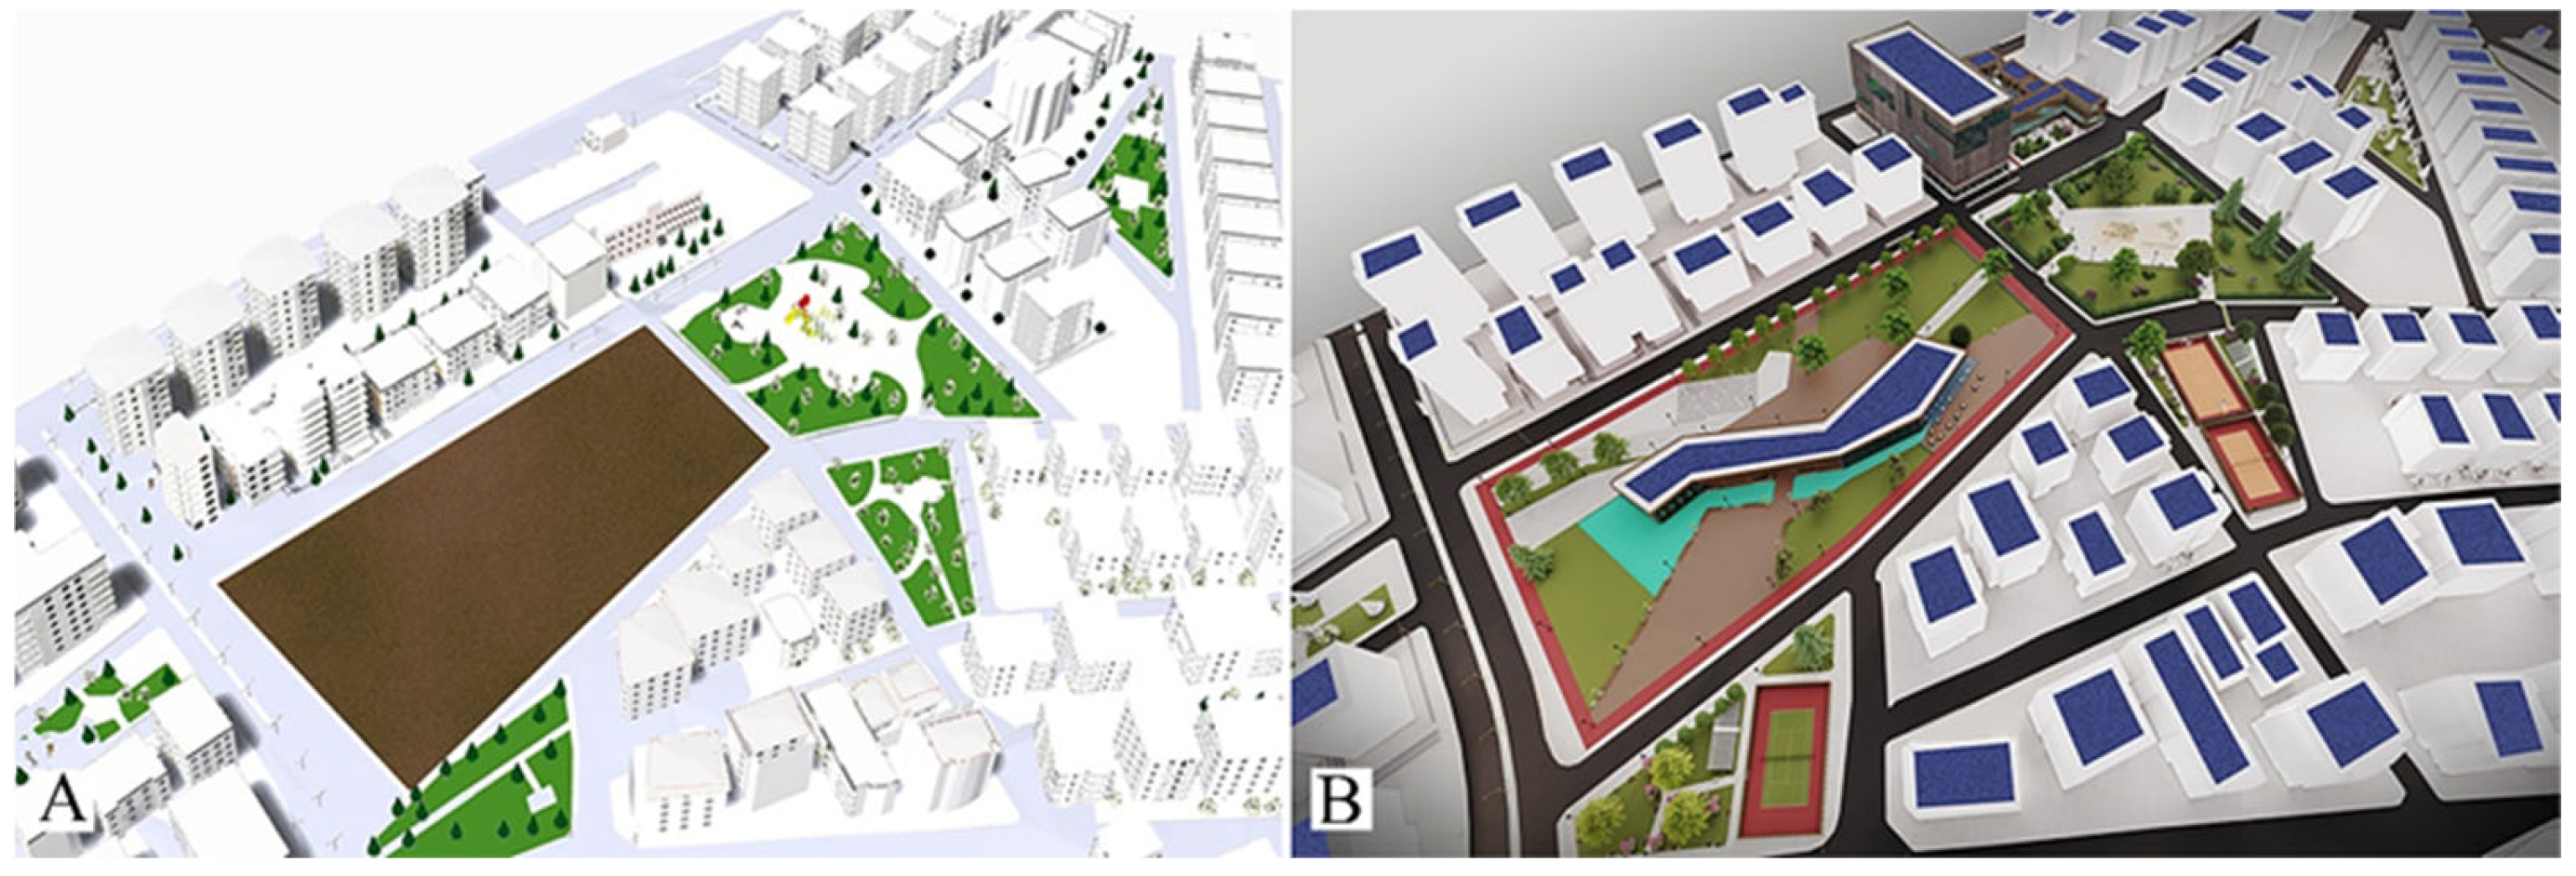
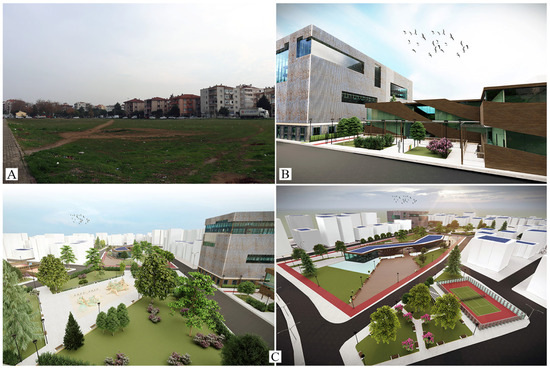
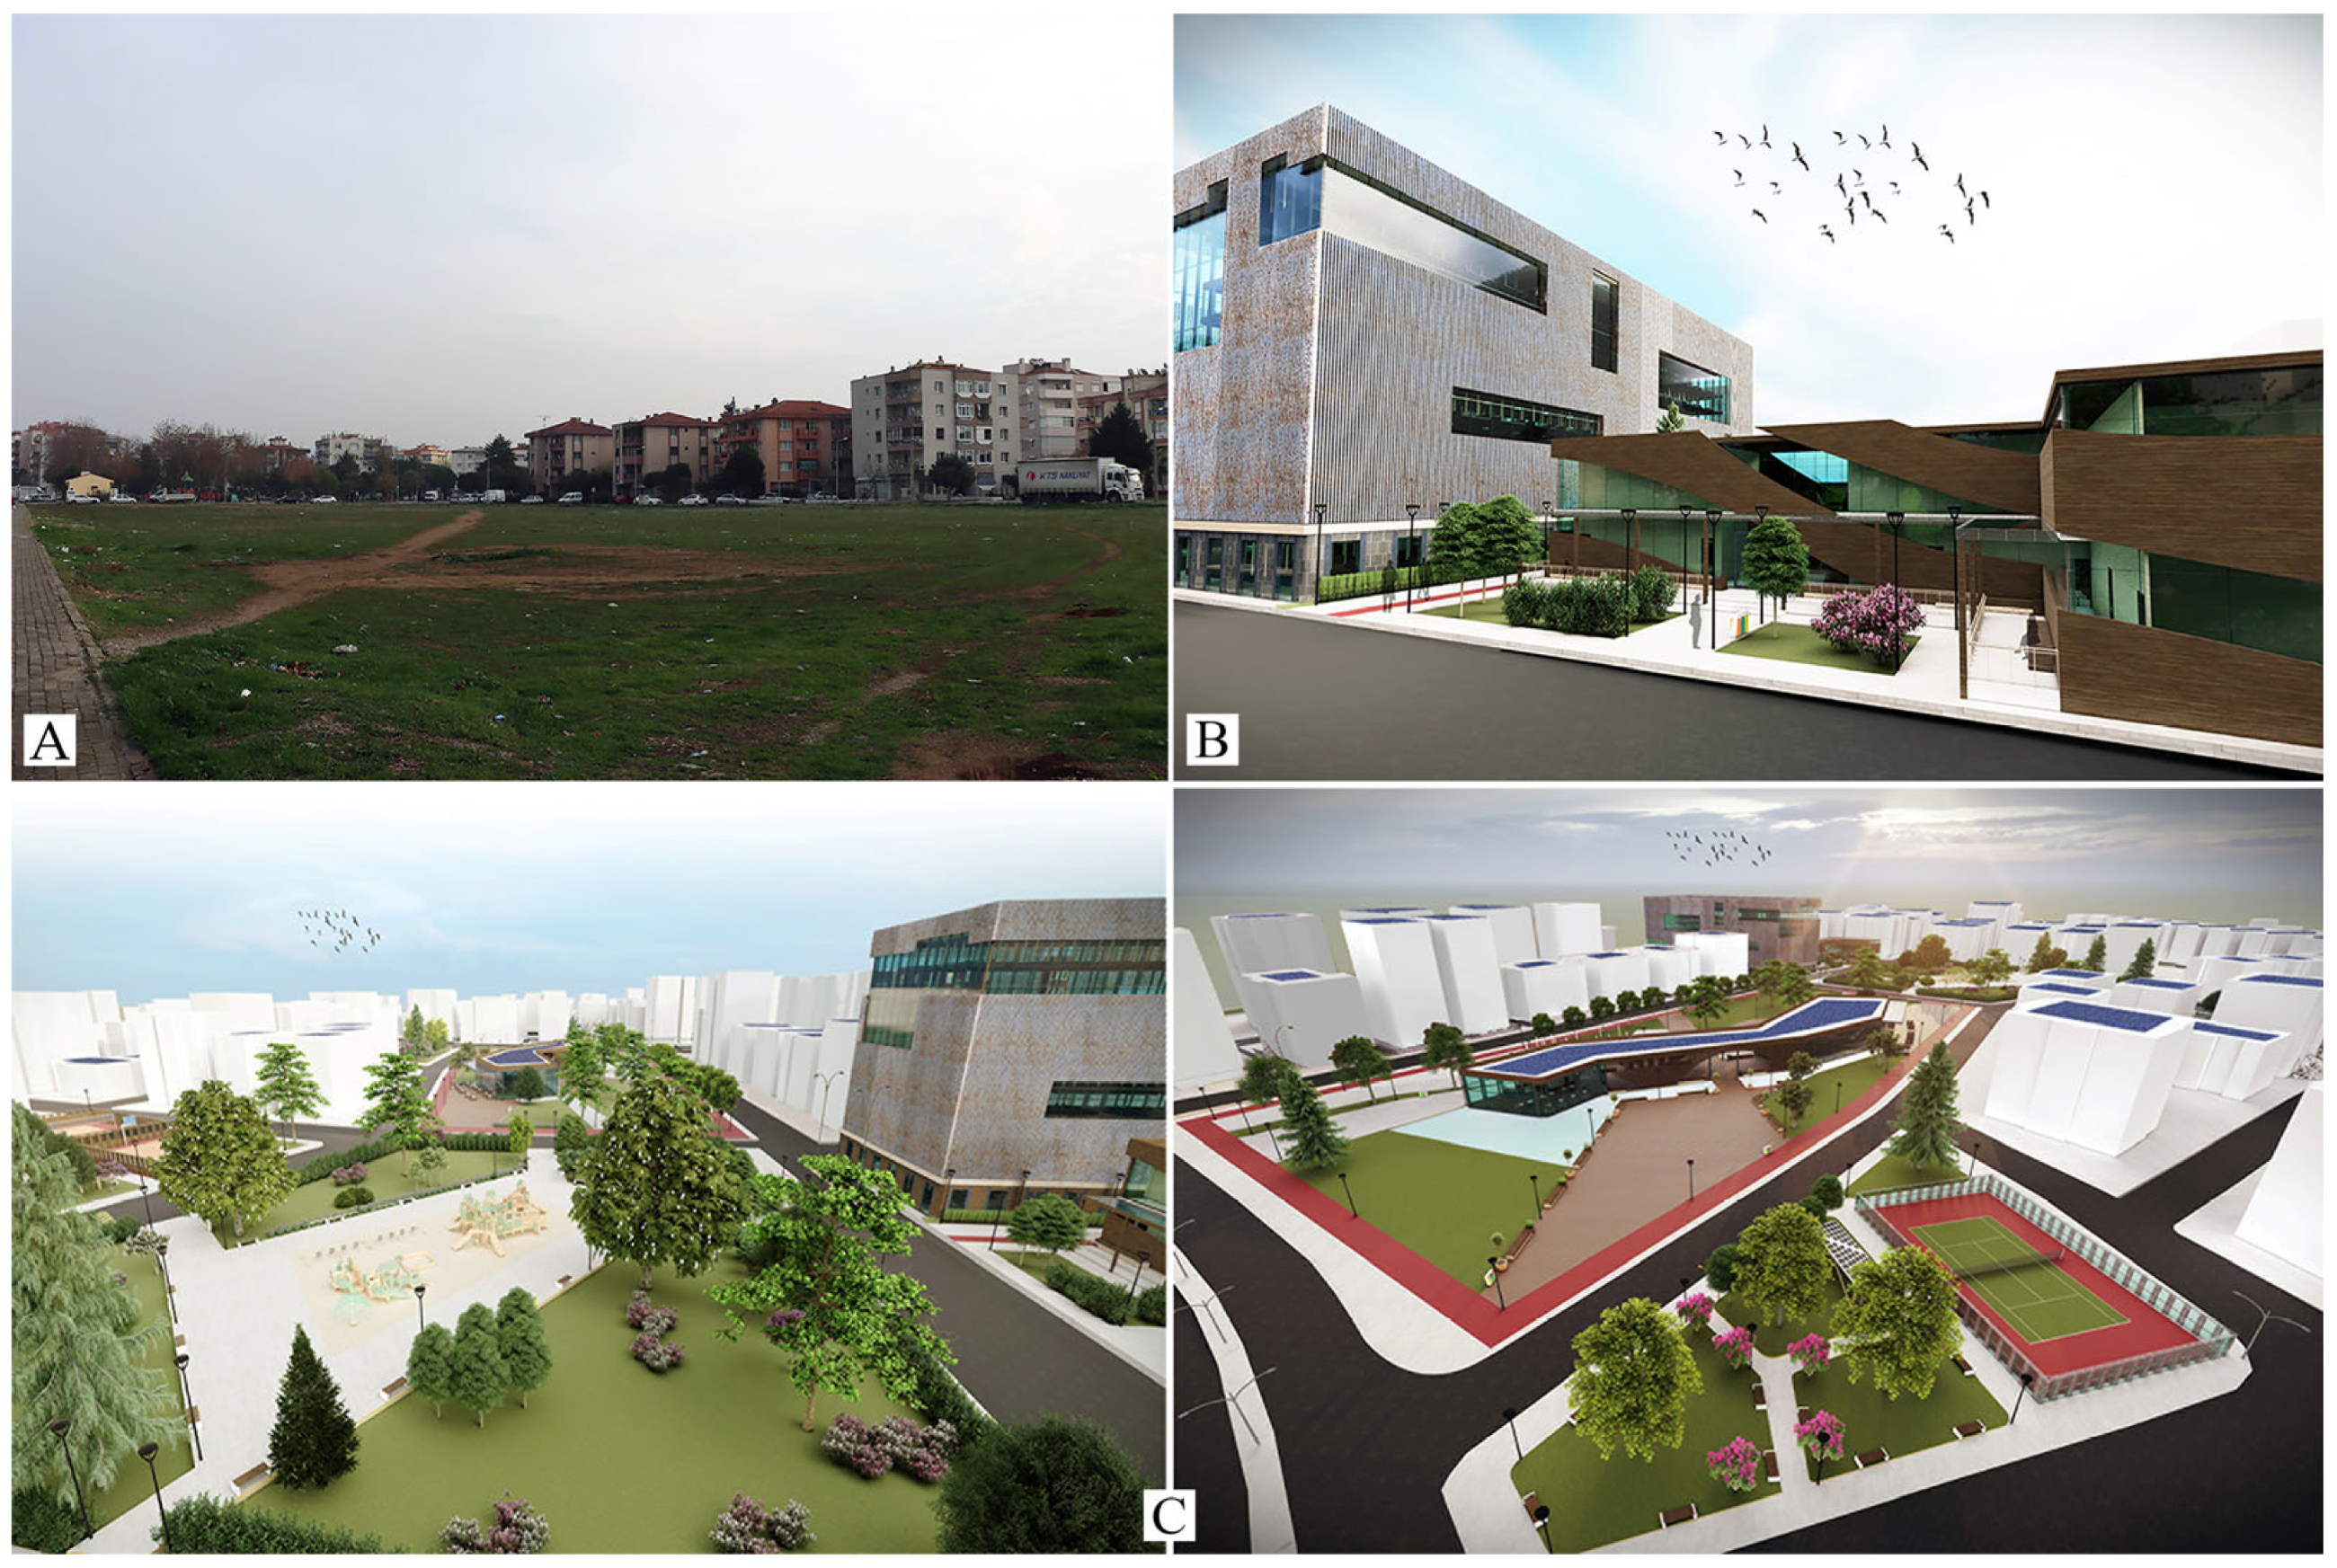
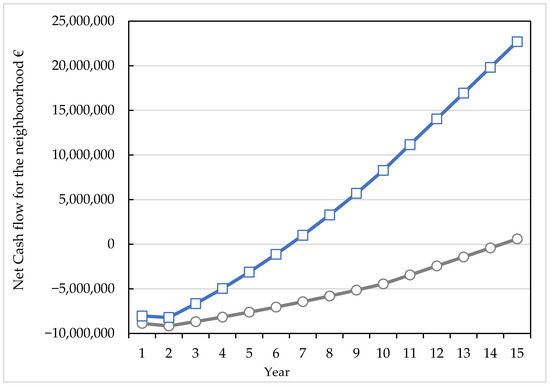
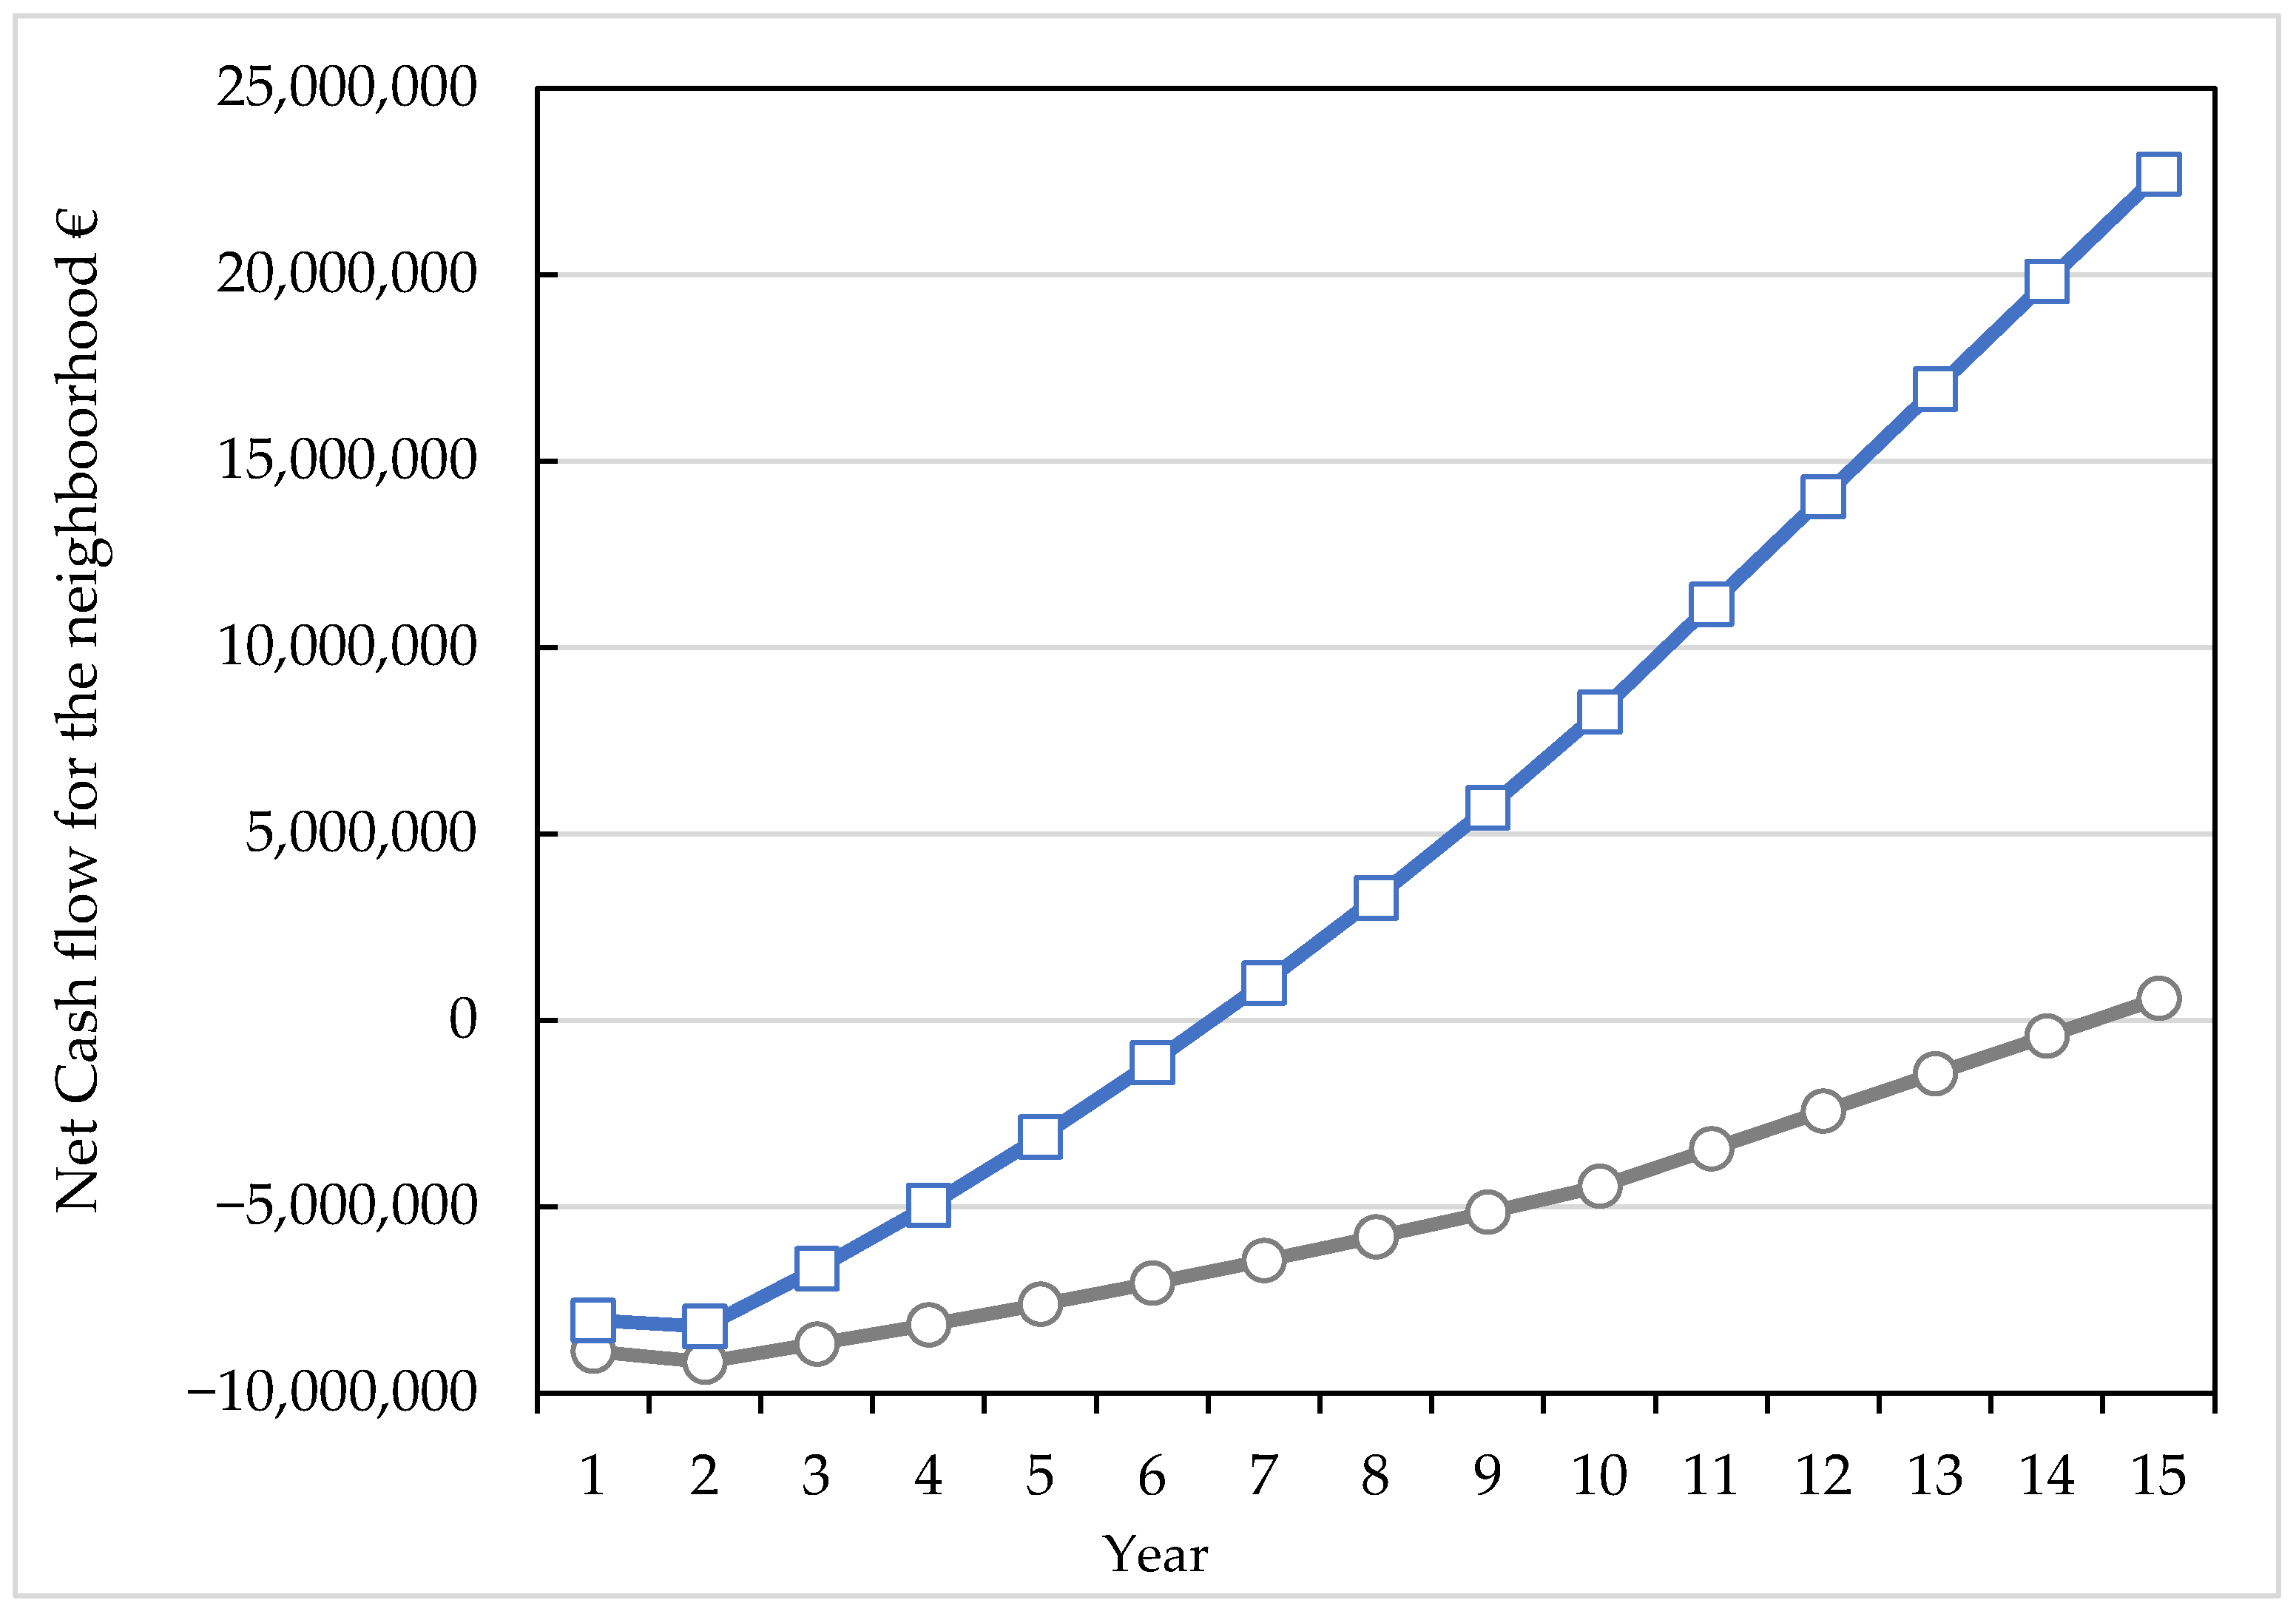

Disclaimer/Publisher’s Note: The statements, opinions and data contained in all publications are solely those of the individual author(s) and contributor(s) and not of MDPI and/or the editor(s). MDPI and/or the editor(s) disclaim responsibility for any injury to people or property resulting from any ideas, methods, instructions or products referred to in the content. |
© 2026 by the authors. Licensee MDPI, Basel, Switzerland. This article is an open access article distributed under the terms and conditions of the Creative Commons Attribution (CC BY) license.