


Abstract
The construction industry accounts for approximately 13% of global GDP but suffers from chronic productivity stagnation. Although artificial intelligence (AI) offers transformative potential, its adoption is constrained by three key barriers: data integrity issues (H1), socio-technical challenges (H2), and system integration problems (H3). This study investigates whether academic research attention aligns with these practitioner-identified barriers through a bibliometric analysis of 4668 publications from OpenAlex (1990–2025), applying a five-pillar analytical framework synthesized into composite scores (0–100 scale) via min-max normalization, weighted summation, and bootstrap validation. H3 achieved a nominal 15.9% prevalence rate (adjusted to ~13.0% after correcting for an 18.2% false positive rate in keyword classification), robust growth (R2 = 0.654), significant overrepresentation in top-cited works (risk ratio = 1.31, p = 0.003), and received a composite score of 62/100 (confirmed). H1 (2.7%, score: 17/100) and H2 (4.6%, score: 13/100) were both rejected. The rank ordering by prevalence (H3 > H2 > H1) remains robust under all adjustment scenarios. These findings contrast notably with the RICS Global Construction Monitor (2025, n = 2200+), where practitioners most frequently reported socio-technical barriers (46%), followed by system integration (37%) and data quality (30%), yielding practitioner-to-publication ratios of 4.7:1, 5.2:1, and 1.1:1, respectively. This apparent research–practice paradox appears primarily volume-driven rather than clearly quality-driven: H1/H2 publications receive citation attention broadly comparable to the baseline, though this comparison is limited by control group heterogeneity. We call for rebalanced research agendas addressing data governance frameworks, competency development, and organizational change management.
1. Introduction
Although the construction industry accounts for about 13% of the world’s GDP, it suffers from chronic productivity stagnation. Multifactor productivity has grown at only about 1% per year over the past two decades, compared to 2.8% for the global economy as a whole [1]. Although artificial intelligence (AI)—defined in this study as the broad family of computational techniques that enable machines to perform tasks requiring human-like cognitive functions, encompassing expert systems, machine learning, deep learning, computer vision, and natural language processing—has transformative potential, its adoption in construction remains limited, with significant gaps between theoretical capabilities and practical implementation [2,3]. In practice, AI deployment in construction depends on supporting digital infrastructure, notably Building Information Modeling (BIM), Internet of Things (IoT) sensor networks, and Digital Twins (DT), which serve as data sources, integration platforms, and contextual environments for AI applications rather than constituting AI themselves. Although there are other barriers to adoption (e.g., regulatory compliance, financing, and supply chain disruption), this study focuses on three dimensions selected through a convergence-of-evidence approach: (1) data integrity issues, (2) socio-technical challenges, and (3) system integration problems. These three were chosen because they appear consistently across multiple independent sources: they are prominent in theoretical adoption frameworks (Technology Acceptance Model, Socio-Technical Systems Theory, Diffusion of Innovations) [4,5,6], recur across recent systematic reviews of AI in construction [2,3,7], and were independently identified as top-three barriers in the Royal Institution of Chartered Surveyors (RICS) 2025 practitioner survey [8]. This triangulation across theory, literature, and practice provides the rationale for their selection, though these three dimensions represent a subset of the complete adoption landscape rather than a comprehensive barrier taxonomy. The literature extensively documents the following barriers to AI adoption: data fragmentation and quality issues that undermine AI model training and reliability [9,10]; organizational resistance and competency gaps that impede AI implementation [11,12]; and system integration challenges involving the alignment of AI applications with supporting digital infrastructure, particularly BIM, IoT, and DT [7,13,14]. However, existing research lacks systematic quantification of how research attention is allocated across these three barrier dimensions. Do academic research priorities align with practical implementation bottlenecks? Or does the research community exhibit selective attention, overlooking foundational enablers in favor of technically sophisticated yet premature solutions? A preliminary industry survey conducted by the RICS Global Construction Monitor (Q1–Q2 2025, n = 2200+) provides empirical benchmarking of barriers to adoption identified by practitioners. When asked about the barriers they had encountered in adopting AI, respondents selected “lack of skilled personnel” (46% among their top three challenges), “integration with existing systems” (37%), and “data quality and availability” (30%) [8]. For this study, these practitioner concerns are operationalized as H2 (Socio-Technical), H3 (System Integration), and H1 (Data Integrity), respectively. We acknowledge that “integration with existing systems” may encompass technical (IT systems) and processual (organizational workflows) dimensions. Given the survey’s context of AI adoption, we interpret it as a proxy for system integration (H3), while noting this operationalization as a methodological limitation. Similarly, while these RICS items represent specific instances of broader theoretical categories rather than exact equivalences, they provide a practitioner-based benchmark for comparing with academic research [8]. This suggests a potential misalignment between research and practice if academic literature disproportionately emphasizes system integration over foundational barriers. It should be noted that practitioner priorities are not static; they evolve as technology matures, organizational capacity develops, and market conditions shift. The RICS 2025 data represent a cross-sectional snapshot of current concerns, and the relative salience of H1, H2, and H3 barriers may differ at earlier or later stages of the AI adoption lifecycle. This temporal contingency should be considered when interpreting the research–practice comparison. This study systematically evaluates whether academic research attention aligns with the implementation challenges identified by practitioners through three hypotheses concerning the level of bibliometric attention devoted to each barrier dimension: H1 (Data Integrity): Academic research on data fragmentation and quality issues remains underrepresented relative to their foundational role in AI deployment [9,10]; H2 (Socio-Technical): Research addressing cultural, organizational, and human capital barriers receives disproportionately low attention relative to their prevalence as practitioner-identified constraints [11,12]; H3 (System Integration): Research on the convergence of BIM, IoT, and DT with AI applications receives substantial and growing academic attention [7,13,14].
Instead of conducting small-scale interviews or surveys, we performed a bibliometric analysis of 4668 publications from OpenAlex (1990–2025). We assessed the following five pillars: (1) prevalence analysis via chi-square tests, (2) citation impact using Mann–Whitney U tests, (3) temporal trends through linear regression, (4) representation in highly cited publications (top 10%) via risk ratios, and (5) inter-hypothesis correlations. The results were synthesized into a composite scoring system on a 0–100 scale via min-max normalization and weighted summation, and were validated through bootstrap resampling (1000 iterations). H3 (system integration) achieved a composite score of 62/100, demonstrating a robust growth trajectory (R2 = 0.654) and overrepresentation in high-impact literature (risk ratio = 1.31, p = 0.003). In contrast, H1 (data integrity: 17/100) and H2 (socio-technical: 13/100) exhibited weak growth patterns. These results contrast sharply with practitioner priorities [8], suggesting a probable misalignment between research and practice. The construction AI research landscape exhibits a technocentric bias, prioritizing system integration while neglecting foundational data quality and socio-technical factors. This indicates that only by rebalancing research agendas to address all three dimensions can the industry achieve sustainable digital transformation.
2. Literature Review and Theoretical Background
2.1. Technological Evolution of AI in Construction
The adoption of AI in the construction industry has progressed through three distinct eras. (1) Expert systems (1980s–1990s), which codified human expertise into rule-based decision frameworks [15]. However, these systems preserved explicit knowledge, hindering knowledge transfer and collective learning across projects [15]. (2) Machine learning (late 1990s–2012), which shifted toward data-driven pattern recognition. This enabled applications in cost forecasting, risk analysis, and resource optimization [3,16,17]. However, adoption barriers persisted [3,7,16]. (3) Deep learning (2012+), which leverages convolutional neural networks and GPU computational capacity. This has enabled real-time progress monitoring and safety hazard detection with 96% precision [18,19]. Contemporary research emphasizes how AI operates within integrated digital ecosystems, leveraging BIM, IoT, and DT as enabling infrastructure for autonomous, data-centric construction environments [20,21,22].
2.2. Theoretical Foundations of Adoption Barriers
2.2.1. Data Integrity as Foundational Constraint (H1)
Deep learning models require high-quality, structured, and annotated data on a large scale [23]. The construction industry faces acute data scarcity due to fragmented information across stakeholders, inconsistent collection formats, incomplete documentation, and error-prone critical records, including material delivery logs and waste transfer notes [24,25]. Generative AI exacerbates this vulnerability through “hallucinations”—plausible yet factually incorrect outputs—which can arise from inadequate training data, a lack of domain knowledge, and insufficient contextual grounding in construction [26]. Poor data quality undermines the reliability of AI applications, from concrete analysis [17] to waste management [27].
2.2.2. Socio-Technical Systems and the Competency Gap Paradox (H2)
Socio-technical systems theory posits that implementation of technology requires alignment between technical and social subsystems, including organizational culture, workforce capabilities, and inter-organizational relationships [4,28]. However, construction’s conservative culture and fragmented delivery model create resistance to innovation [29,30]. The central paradox is that labor shortages drive the demand for automation, yet organizations simultaneously lack the in-house AI expertise to implement it [11,31]. This creates a self-reinforcing cycle that is amplified by staff turnover and constrained profit margins [32,33].
2.2.3. System Integration and Ecosystem Convergence (H3)
Construction AI advancement depends on integrated digital ecosystems rather than isolated solutions [34]. The Technology Acceptance Model emphasizes that perceived usefulness depends on seamless workflow integration [10]. Autonomous construction requires the convergence of three pillars: IoT sensor networks, DT as contextualized virtual models, and AI as an analytical engine [13,35,36]. However, heterogeneous systems, data formats, and organizational boundaries present substantial interoperability barriers [37].
2.3. Empirical Evidence on Adoption Barriers
Recent studies have documented fragmented insights across barrier dimensions. For example, Regona et al. [2] identified data fragmentation as a key challenge in the Australian construction industry through qualitative interviews. A systematic review by Ibitoye et al. [7] of over 100 studies (n = 36,269 firms) confirmed that skilled labor shortages are widespread and geographically robust barriers. A contemporaneous industry survey, the RICS Global Construction Monitor (Q1–Q2 2025, n = 2200+ construction professionals from multiple countries with a mixed methodology of 70% online questionnaires and 30% telephone interviews), provides rankings of barriers identified by practitioners [8].
The findings from the RICS Global Construction Monitor (Q1–Q2 2025, n = 2200+ construction professionals) show that practitioners cited “lack of skilled personnel” (46% of the top three barriers), “integration with existing systems” (37%), and “data quality and availability” (30%) [8]. For the purpose of this analysis, these barriers are operationalized as H2 (socio-technical), H3 (system integration), and H1 (data integrity), respectively. While these RICS items represent specific instances of these theoretical constructs, they closely align with the dimensions defined in our hypotheses and provide a practitioner-based benchmark for comparison [8].
2.4. Research Gap and Rationale
The existing literature addresses individual barriers independently using small-scale qualitative or survey methods. However, no systematic, longitudinal quantification compares research attention allocation across all three barrier dimensions against practitioner-identified priorities. This bibliometric investigation fills this gap by conducting a large-scale, temporal analysis of academic research emphasis relative to implementation-level practitioner concerns. The rank ordering of these barriers is directionally supported by contemporaneous independent surveys, though with important differences in sample scale and design. The BuiltWorlds 2025 AI Benchmarking Report (n = 53 respondents from 30 AEC organizations, predominantly large general contractors) found that data privacy and security concerns (62%), lack of internal expertise or skilled personnel (58%), and limited data availability or quality (56%) dominated adoption barriers [38]. While this sample is too small to be independently conclusive, its findings are consistent with the larger-scale Dodge Construction Network/CMiC SmartMarket Brief (2025, n = 235 US contractors), which reported that only 26% of contractors rated their data quality as high, with 58% acknowledging it as merely moderate [39]. This directional convergence across surveys of varying scale and design lends additional, if not definitive, support to the RICS findings as a practitioner benchmark.
3. Overview of Bibliometric Approach
This study employs a four-phase bibliometric methodology to systematically evaluate three hypothesized AI adoption barriers. The approach integrates multiple analytical dimensions—prevalence (volume), temporal evolution (growth trajectories), citation impact (scholarly influence), and representation in elite literature (defined as the top 10% most-cited publications in the corpus, which disproportionately shape research agendas)—to determine the alignment between academic research attention and practitioner-identified priorities. The underlying logic proceeds in two stages. First, the five-pillar bibliometric analysis independently quantifies how much academic attention each barrier dimension receives, how that attention has evolved over time, and whether it translates into scholarly influence—without reference to any external benchmark. Second, these bibliometric profiles are compared against practitioner-identified priorities (specifically, the RICS 2025 Global Construction Monitor [8]) to assess whether the distribution of research effort corresponds to the barriers that industry professionals report as most consequential. It is this comparison—not the bibliometric analysis alone—that enables the identification of potential research–practice misalignment. Figure 1 provides a visual overview of this four-phase methodological framework.
Figure 1.
Four-Phase Bibliometric Research Design.
3.1. Phase 1: Data Collection and Corpus Construction
The primary data source for this investigation was OpenAlex, an open bibliographic database that, as of November 2025, encompasses approximately 271.3 million scholarly works [40]. OpenAlex was selected over proprietary alternatives—Web of Science (WoS, approx. 71 million records) and Scopus (approx. 66 million records)—for three methodological reasons. First, OpenAlex provides substantially broader coverage: comparative analyses have demonstrated that it indexes nearly all journals covered by WoS and Scopus, plus additional sources, and achieves reference coverage comparable to both proprietary databases within shared publication corpora [41]. Second, as a fully open database, OpenAlex enables complete reproducibility of search queries, corpus construction, and analytical procedures—a criterion increasingly recognized as essential for bibliometric research [40,42]. Third, its broader indexing scope reduces the risk of systematically excluding construction-domain publications that appear in non-traditional or regional outlets not covered by WoS or Scopus. However, this breadth introduces trade-offs: OpenAlex has known metadata gaps (e.g., incomplete abstracts and institutional affiliations) and a stronger representation of open-access content, which may introduce composition effects relative to proprietary databases [42]. These limitations are discussed further in Section 3.5.
The analytical corpus was constructed using targeted queries that combined terms from the construction domain with AI-related keywords. Specifically, the base query was: (“construction” OR “building” OR “civil engineering”) AND (“artificial intelligence” OR “AI” OR “machine learning” OR “deep learning” OR “automation” OR “computer vision”). The temporal scope was set to 35 years, from 1990 to 2025, to capture the pre-Machine Learning, Machine Learning, and Deep Learning eras. To ensure consistency in the analysis, the search was limited to English-language publications. This process yielded a final corpus of 4668 publications, including journal articles, conference proceedings, and technical reports.
3.2. Phase 2: Algorithmic Classification and Validation
3.2.1. Hypothesis-Specific Keyword Sets
To identify relevant literature, we developed comprehensive keyword sets for each hypothesis through an iterative refinement process. For hypothesis 1 (data integrity), a set of 17 keywords was assembled, including terms such as “data quality”, “data availability”, “data standardization”, “missing data”, “incomplete data”, “data accuracy”, “data consistency”, “data fragmentation”, “data silos”, “data errors”, “data collection”, “data annotation”, “data cleaning”, “data validation”, “metadata”, “data governance”, and “data warehouse”. For H2 (socio-Technical), a set of 15 keywords was created, including terms such as “human factors”, “skills gap”, “competency gap”, “cultural resistance”, “organizational culture”, “risk aversion”, “workforce”, “training”, “change management”, “stakeholder engagement”, “user acceptance”, “digital literacy”, “adoption barriers”, “organizational readiness”, and “knowledge transfer”. A 16-keyword set was developed for H3 (System Integration), consisting of “integration”, “interoperability”, “digital twin”, “BIM integration”, “IoT”, “cyber-physical systems”, “ecosystem”, “platform”, “data exchange”, “API”, “standards”, “convergence”, “automation”, “autonomous systems”, “real-time systems”, and “edge computing systems”.
3.2.2. Classification Algorithm and Validation Protocol
A Python-based script (Python version 3.12.3, Python Software Foundation, https://www.python.org/) was used to flag publications algorithmically. A high-recall approach was adopted, whereby a publication was classified under a given hypothesis if it contained at least one keyword from the corresponding set. To validate the accuracy of the automated classifications, a manual validation was conducted on a sample of 412 publications, representing 8.8% of the total corpus. Two independent raters performed this validation and achieved an initial inter-rater agreement of 0.801 (p < 0.001) and an initial accuracy of 87.3%. After resolving discrepancies through an adjudication process, the agreement reached a Cohen’s kappa of 0.847 (95% confidence interval [CI]: [0.801, 0.893]), which is conventionally interpreted as “almost perfect” reliability.
Recognizing the potential for ambiguity, particularly with the term “integration” in the H3 keyword set, which can also appear in organizational or social contexts, a critical precision audit was undertaken. This audit involved expanded validation on a stratified sample of 198 H3-flagged publications across two sampling stages. The analysis revealed a pooled false positive rate of 18.2% (95% CI: 12.8–24.5%). Applying this correction yields an adjusted H3 prevalence point estimate of 13.0%, compared to the originally reported estimate of 15.9%. Importantly, even under the most conservative adjustment scenario (a 24.5% false positive rate resulting in a 12.0% prevalence), the rank ordering of research attention (H3 > H2 > H1) remained completely robust.
3.3. Phase 3: Five-Pillar Analytical Framework
Five complementary analytical methods were employed to provide a multidimensional assessment of hypothesis evaluation, each designed to operationalize a distinct aspect. Together, these methods capture the volume and influence of research, its evolution over time, and its presence in the most impactful scholarly works. Table 1 summarizes these five methods, detailing the purpose of each analysis, the statistical tests applied, and the logic used to interpret the results in the context of research prioritization.
Table 1.
Five-Pillar Analytical Framework: methods, statistical tests, and interpretation for hypothesis evaluation.
The temporal scope of the analysis requires further justification. Although the full dataset spans from 1990 to 2025, the period from 2005 onward provides the most robust empirical data because annual publication volumes consistently exceeded the threshold necessary for reliable trend analysis during this time. While the pre-2005 data are included to provide historical context, they are acknowledged to carry higher uncertainty and were extrapolated via regression intercepts for trend analysis. Sensitivity analyses confirmed that the key findings, including R2 values and the rank ordering of hypotheses, are stable when using either the full 35-year window or the empirically grounded 2005–2025 window. The detailed results of these sensitivity checks are provided in Appendix B.
To ensure the integrity of the statistical inferences, a Bonferroni correction was applied to control for potential familywise error rate inflation resulting from multiple comparisons. This established a more stringent significance threshold (α = 0.05/number of tests). All primary confirmatory analyses, including those examining prevalence, temporal trends, and risk ratios, met or exceeded this corrected threshold. In contrast, the citation impact and inter-hypothesis correlation analyses are reported for their descriptive value and are considered exploratory in nature because they did not meet the corrected significance level.
3.4. Phase 4: Composite Scoring and Validation
3.4.1. Normalization and Integration
To synthesize the heterogeneous metrics from the five-pillar framework, a min-max normalization procedure was applied, following the methodology described in the OECD/JRC Handbook on Constructing Composite Indicators [43], which identifies min-max normalization as appropriate when bounded, unit-free transformation to a common scale is required. This procedure transformed each raw metric (prevalence, Cohen’s d, R2, and risk ratios) onto a common scale of 0 to 25 points using theoretically grounded bounds. The scale mapped 0–25% of publications for prevalence; ±0.2 for citation impact (small effect threshold); 0–1.0 for temporal trend (R2 mathematical bounds); and 0.5–2.0 for risk ratios. Detailed normalization formulas and justification of the bounds are provided in Appendix A.
3.4.2. Weighted Composite Score
After normalization, the four primary dimensions were combined using weighted summation to create a composite score on a 0–100 scale:
where Score(0–100) denotes the composite score (0–100), p is the normalized prevalence score (0–25), t is the normalized temporal trend score (0–25), e is the normalized elite representation score (0–25), c is the normalized citation impact score (0–25), and wp, wt, we, and wc are the corresponding weights summing to 1.0.
The weight allocation is as follows: Temporal Trend received the highest weight at 40%, followed by Prevalence at 35%, Elite Representation at 15%, and Citation Impact at 10%. This allocation follows the expert-judgment-based weighting approach recommended in the OECD/JRC Handbook on Constructing Composite Indicators [43], which establishes that when no universally agreed weighting scheme exists, transparent expert judgment combined with mandatory sensitivity analysis constitutes an acceptable methodological standard. Following this guidance, our conceptual rationale is as follows: sustained long-term growth (Temporal Trend) is weighted most heavily as the strongest signal of evolving field recognition; cumulative research volume (Prevalence) captures the aggregate research effort; agenda-setting influence in high-impact literature (Elite Representation) reflects disproportionate scholarly influence; and citation quality (Citation Impact) received the lowest weight due to its correlation with prevalence and multicollinearity concerns, consistent with the Handbook’s recommendation to downweight correlated sub-indicators [43]. We acknowledge that these weights remain researcher-determined choices, not empirically derived values; accordingly, sensitivity analyses across five alternative weighting schemes confirmed that hypothesis rank ordering and verification status remained stable (see Appendix B), providing the robustness evidence the OECD/JRC framework requires.
Based on the composite scores, the hypotheses were categorized into one of four verification statuses: “Rejected” for scores from 0 to 30, “Partially Confirmed” for scores from 30 to 50, “Confirmed” for scores from 50 to 70, and “Strongly Confirmed” for scores from 70 to 100. These labels summarize the degree of bibliometric evidence supporting each hypothesis within the composite scoring framework; they should not be equated with statistical hypothesis testing in the inferential sense (e.g., rejection of a null hypothesis at a given significance level). The threshold boundaries (30, 50, 70) were set at equal intervals to maximize interpretive transparency, following the OECD/JRC Handbook’s recommendation that classification boundaries be explicitly stated and tested for sensitivity [43]. As reported in Appendix B, the categorical assignments proved robust across all five alternative weighting schemes tested.
3.4.3. Validation Procedures
A series of validation procedures were undertaken to ensure the robustness and reliability of the composite scoring system. First, bootstrap resampling with 1000 iterations was performed to generate confidence intervals around the composite scores. This analysis confirmed the stability of the results, yielding the following 95% confidence intervals: [59.2, 64.8] for H3, [17.2, 18.8] for H1, and [12.4, 13.6] for H2.
Second, a sensitivity analysis was conducted on the threshold defining “high-impact” publications. The risk ratio analysis was recalculated using the top 5% and 15% most-cited publications as alternative cutoffs. The results remained consistent across all specifications: H3 was consistently and significantly overrepresented (p < 0.05), while H1 and H2 showed no significant departure from proportional representation (p > 0.05).
Finally, the sensitivity of the composite scores to the chosen weighting scheme was tested. Five alternative weighting combinations were examined, including equal weights and schemes that heavily favored prevalence or trend. The rank ordering of the hypotheses by composite score (H3 > H1 > H2) and their categorical classifications (H3 as confirmed and H1 and H2 as rejected) were maintained across all five scenarios. The detailed results of these weighting sensitivity analyses are provided in Appendix B, Table A3.
3.5. Methodological Choices and Limitations
While the bibliometric approach employed in this study offers significant advantages for large-scale, longitudinal analysis, it is imperative to acknowledge the methodological choices made and their inherent limitations. Ensuring transparency regarding these decisions is imperative for accurate interpretation of the findings.
The decision to use a keyword-based classification system was driven by its advantages. This approach offers high interpretability and transparency because the criteria for categorizing publications are explicitly defined and reproducible. Additionally, the terminology used in the AI field of construction is relatively precise and lends itself well to keyword-based detection. This method is also consistent with established bibliometric workflows, facilitating comparison with prior studies.
However, this approach has limitations. First, context sensitivity is challenging. For example, the keyword “integration” in the H3 set can refer to technical system integration, but it may also appear in discussions of organizational or social integration, resulting in potential false positives. Second, the chosen single-keyword threshold is a trade-off between recall and precision. While it maximizes the capture of potentially relevant publications, it includes some false positives. Third, despite rigorous validation, there is a systematic misclassification risk that is unevenly distributed across hypotheses: the verified 18.2% false positive rate for H3 (see Appendix D) is the most consequential, while H1 and H2 rates are presumed lower due to higher keyword specificity but remain empirically unverified.
To address these concerns and evaluate the robustness of the findings in the face of methodological variations, a sensitivity analysis was conducted. As detailed in Table A2 of Appendix A, four classification strategies were compared, including the original single-keyword approach and three alternatives: requiring multiple keyword matches, restricting the search to titles and abstracts only, and applying positional weighting. Spearman’s rank correlations between the prevalence rankings generated by these alternative methods and the original approach ranged from 0.91 to 0.96. This high degree of correlation confirms that the core finding—that H3 is more prevalent than H2, which is more prevalent than H1—is robust against reasonable variations in the classification methodology.
Beyond classification, constraints related to the data source itself must be considered. OpenAlex was chosen for its superior coverage breadth and full reproducibility (see Section 3.1), but comparative studies indicate that its metadata quality is uneven: abstracts are missing for a non-trivial proportion of records, and institutional affiliation data are incomplete in over 60% of entries [42]. While reference coverage within shared corpora is comparable to WoS and Scopus [41], OpenAlex’s broader indexing scope means the corpus may include lower-tier or non-peer-reviewed sources that WoS and Scopus would exclude. Additionally, OpenAlex has a recency bias, with incomplete coverage of literature from before 2000. If this has led to an undercounting of early H1 and H2 research, then the reported prevalence estimates for these hypotheses are likely underestimates—a scenario that would reinforce the study’s main conclusions. A validation study comparing OpenAlex-derived prevalence estimates against a WoS or Scopus subset would strengthen confidence in these findings and is recommended for future research. Furthermore, gray literature, including industry standards such as ISO 19650, vendor white papers, and consulting reports, is outside the scope of this academic corpus.
Limiting the search to English-language publications introduces a language bias. To assess its potential impact, a scenario analysis was performed; the results are presented in Appendix C. Even under the extreme assumption that non-English publications constitute 30% of the global literature and emphasize H1 and H2 at a rate three times higher than that of English-language publications, the global ranking of research attention remained H3 >> H2 > H1. This suggests that language bias is unlikely to alter the primary conclusions fundamentally.
Finally, the temporal window from 1990 to 2025 was chosen to capture the technological evolution from expert systems to deep learning. However, the pre-2005 period is acknowledged to carry higher uncertainty, as annual publication volumes were below 50. Although values from this period were used for trend analysis, the study’s primary conclusions have been confirmed across both the full 35-year window and the more reliable 2005–2025 window.
3.6. Summary of Methodological Rigor
Table 2 provides a consolidated overview of the steps taken to ensure the validity and reliability of this study. It summarizes the key metrics of methodological rigor against established standards. These details include information on the validation sample, inter-rater agreement, statistical controls, and sensitivity testing.
Table 2.
Methodological rigor summary: validation metrics, inter-rater agreement, and statistical controls ensuring analytical robustness.
As the table shows, the methodological framework used in this study meets or exceeds the standards required for a rigorous bibliometric analysis. The validation sample size exceeds the recommended minimum, and the achieved inter-rater reliability is considered “almost perfect”. Statistical controls, including the Bonferroni correction, were applied to safeguard against Type I errors. Extensive sensitivity testing confirmed that the core findings are not artifacts of specific methodological choices. Bootstrap validation provided narrow confidence intervals, indicating high precision in the composite scores.
It is important to acknowledge that the study’s two empirical pillars—keyword-based bibliometric classification and the practitioner survey benchmark—each carry distinct error profiles that could, in principle, compound. The keyword classification introduces misclassification risk (particularly the 18.2% false positive rate for H3), while the practitioner benchmark, though corroborated by independent surveys (see Section 2.3), reflects cross-sectional self-reported perceptions rather than objectively measured barrier severity. However, several features of the research design mitigate the risk that these limitations jointly undermine the core findings. First, the two error sources operate independently: classification errors affect the bibliometric prevalence estimates, while survey limitations affect the practitioner benchmark, meaning their biases do not systematically reinforce one another in the same direction. Second, the magnitude of the observed disparities (e.g., the six-fold difference in publication counts between H3 and H1) substantially exceeds the plausible error margins from either source. Third, sensitivity analyses demonstrated that the rank ordering H3 > H2 > H1 is robust across alternative classification strategies (Spearman r = 0.91–0.96; Table A2), false positive adjustments (Appendix D), weighting schemes (Table A3), and corroborating practitioner surveys (Section 2.3). While the precise quantification of the misalignment (e.g., exact practitioner-to-publication ratios) should be interpreted with caution, the directional finding—that academic research disproportionately emphasizes system integration relative to practitioner-reported concerns about data quality and socio-technical barriers—remains consistent across all tested variations in both the classification methodology and the practitioner benchmark.
4. Results
An analysis of the 4668 publications that comprise the corpus reveals a pronounced and systematic imbalance in the attention that research has given to the three hypothesized adoption barriers. Findings consistently demonstrate significant prioritization of system integration challenges (H3) over foundational data integrity (H1) and socio-technical (H2) issues. This disparity is evident across all five examined analytical dimensions: prevalence, temporal evolution, citation impact, representation in elite literature, and inter-hypothesis correlations. The following subsections present the results for each dimension in detail.
4.1. Prevalence Analysis: Research Volume Allocation
The first dimension of the analysis examines the volume of research attention devoted to each barrier. Table 3 presents fundamental statistics on the prevalence of each hypothesis within the total corpus, including publication counts, percentages, and chi-square test results for significance.
Table 3.
Fundamental Statistics and Prevalence Analysis.
The data in Table 3 reveal stark differences in research volume. H3 (System Integration) accounts for 742 publications, representing a nominal 15.9% of the total corpus (approximately 13.0% after adjusting for the 18.2% false positive rate identified in the precision audit; see Appendix D). In contrast, H1 (Data Integrity) comprises only 125 publications (2.7%), and H2 (Socio-Technical) comprises 215 publications (4.6%). All three hypotheses deviate significantly from the 25% uniform benchmark used to standardize effect size comparisons (all χ2 p < 0.001). However, this benchmark is a mathematical reference point, not a theoretically expected distribution—there is no a priori reason to assume equal coverage across barrier dimensions. The primary interpretive value therefore lies in the relative differences between hypotheses rather than in absolute deviations from 25%. Cohen’s h indicates a large negative deviation for H1 (h = −0.719) and a medium negative deviation for H2 (h = −0.615), reflecting their substantially lower representation relative to H3, which exhibits only a small negative effect (h = −0.228).
This is most clearly reflected in raw publication volumes, with H3 receiving approximately six times more publications than H1 and nearly three and a half times more than H2—a ratio that is independent of the uniform distribution assumption. This pattern stands in stark contrast to the priorities identified by industry practitioners. According to the RICS Global Construction Monitor survey [8], practitioners most frequently cite socio-technical barriers (H2) at 46%, followed by system integration (H3) at 37% and data quality issues (H1) at 30% [8]. This apparent inversion of priorities provides preliminary, indicative evidence of a potential research–practice misalignment that this study investigates in greater depth.
4.2. Temporal Evolution: Growth Trajectories
Beyond static prevalence, the temporal evolution of research attention is critical to understanding whether a field is gaining or losing momentum. To assess this, we fitted linear regression models to the annual prevalence rates for each hypothesis over the full 35-year period from 1990 to 2025. The results of this analysis, including trend slopes, coefficients of determination (R2), and compound annual growth rates (CAGR), are presented in Table 4.
Table 4.
Temporal Evolution and Growth Patterns of Research Attention (1990–2025).
The data in Table 4 reveal starkly contrasting growth trajectories. H3 (System Integration) exhibits a robust and sustained pattern of growth. The linear trend explains 65.4% of the annual variance in its prevalence (R2 = 0.654), and its CAGR of 13.56% is substantial. In contrast, H1 (Data Integrity) and H2 (Socio-Technical) display essentially flat patterns. For H1, the linear model explains only 18.9% of the variance (R2 = 0.189) and has a CAGR of just 1.77%. H2’s trajectory is even weaker, with a negligible linear fit (R2 = 0.090), indicating that over 90% of its annual variation is not explained by any systematic trend despite a calculated CAGR of 2.29%. This divergence is visually depicted in Figure 2, which plots the annual prevalence rates for each hypothesis over the 35-year period.
Figure 2.
Evolution of Three Key AI Challenges in Construction (1990–2025). Note: Annual prevalence rates for each hypothesis across 35-year period. H3 shows consistent acceleration post-2015; H1 and H2 exhibit flat trajectories from 2015 onward.
A critical observation from the tabular data and figure is the pattern following the expansion of construction AI research post-2015. During this period, the total volume of literature in the field increased tenfold. Importantly, H3 accounted for about 70% of this growth, solidifying its dominant position. Meanwhile, H1 and H2 remained stagnant throughout the well-documented period from 2005 to 2025, with R2 values below 0.2. This stagnation persisted even as practitioners in the contemporaneous RICS 2025 survey [8] continued to identify these barriers as pressing concerns.
It is important to note the caveat regarding the temporal window. While the pre-2005 data are included for historical completeness, they carry higher uncertainty due to lower publication volumes. However, sensitivity analyses confirmed that the rank ordering of the hypotheses by growth trajectory and the directional findings reported here are robust. As detailed in Appendix B, the R2 values and primary conclusions are consistent when analyzing the full 1990–2025 window or the more reliable 2005–2025 window.
4.3. Citation Impact: Scholarly Influence Assessment
While prevalence and growth indicate the quantity of research attention, citation impact serves as a proxy for scholarly influence and perceived importance within the academic community. To assess this dimension, we compared the citation rates of publications associated with each hypothesis against a control group consisting of all publications in the corpus that were not explicitly tagged as addressing any of the three adoption barriers. Due to the non-normal distribution of the citation data, a non-parametric Mann–Whitney U test was used for significance testing, and Cohen’s d was calculated to estimate the effect size. The results of this analysis are presented in Table 5.
Table 5.
Citation Impact and Scholarly Influence Analysis.
The analysis reveals a nuanced picture. Although H3 publications show a statistically significant citation advantage over the control group (p = 0.001; Table 5), the associated effect size is negligible (Cohen’s d = 0.009)—less than 1% of a standard deviation and merely 4.5% of the ‘small’ effect threshold (d = 0.2). This statistical significance is likely an artifact of the large H3 sample (n = 742) rather than a meaningful scholarly influence differential. It is important to note that, while the control group represents the baseline AI-in-construction literature, it is heterogeneous and encompasses diverse AI applications (e.g., algorithm optimization and novel use cases). The finding that H1 and H2 papers perform on par with the average suggests that they are not systematically devalued once published. However, this does not preclude the possibility that H1 and H2 research is published in lower-tier venues or receives less institutional support upstream in the research pipeline. In contrast, H1 and H2 show no statistically significant citation differences from the control group (p = 0.868 and p = 0.165, respectively; Table 5), with negligible effect sizes (d = −0.047 and d = −0.120), suggesting these topics receive scholarly attention proportional to the field’s baseline rate.
These results lead to a critical interpretation of the research–practice paradox. The findings suggest that the observed misalignment is more likely a volume problem than a quality problem, although this interpretation warrants caution. The control group against which H1 and H2 citation rates are compared is highly heterogeneous, encompassing diverse AI applications from algorithm optimization to novel use cases. Comparable citation rates relative to such a broad baseline indicate that H1 and H2 research is not systematically devalued once published. However, this does not constitute strong evidence of equal scholarly recognition; a more targeted benchmark (e.g., papers addressing other specific adoption barriers) might yield different results. With this caveat, the pattern is more consistent with an agenda-setting problem—which topics researchers, funding agencies, and journals prioritize—than with a gatekeeping problem in which such work is rejected or overlooked upon submission. The negligible citation advantage for H3 contributes only 1.306 points to its pre-normalized total of 15.436 (see Section 4.6), which translates to a marginal influence on the final composite score. This further underscores that the dominant drivers of the imbalance lie elsewhere.
4.4. High-Impact Publication Representation
In addition to having an above-average citation impact, the concentration of research within the most highly cited publications (the top 10% “elite stratum”) provides insight into agenda-setting power. A risk ratio (RR) greater than 1.0 indicates overrepresentation, while an RR less than 1.0 indicates underrepresentation. Significance was assessed via Fisher’s exact test. The results of this analysis are presented in Table 6.
Table 6.
Representation of Hypothesis-Related Publications in the Highly Cited Stratum (Top 10% by Citation Count).
The results demonstrate that H3 is the only category achieving statistically significant overrepresentation in the elite stratum (RR = 1.31, p = 0.003; Table 6), indicating that system integration publications are 31% more likely than expected to appear among the top 10% most-cited works. H1 and H2, by contrast, show nonsignificant departures from proportional representation (p = 0.842 and p = 0.969), though the small absolute counts in the elite stratum yield wide confidence intervals, meaning both proportional representation and moderate underrepresentation remain statistically plausible.
These findings reinforce the pattern identified in Section 4.3: H3’s overrepresentation in the elite stratum reflects its dominant volume rather than a systematic suppression of H1/H2 work upon publication.
4.5. Inter-Hypothesis Correlations: Research Integration Assessment
The final analytical dimension examines whether the research community addresses these barriers in an integrated or siloed manner. A keyword co-occurrence analysis was conducted to identify publications that were explicitly flagged for more than one hypothesis. The results revealed negligible correlations between the three areas of study. The Pearson correlation coefficient for co-occurrence between H1 and H2 was r = 0.128, representing only eight publications (0.17% of the corpus). The correlations between H1 and H3 and between H2 and H3 were r = 0.215 and r = 0.189, respectively, representing 18 and 14 publications (0.39% and 0.30% of the corpus). All values fall below the r = 0.25 threshold, indicating an absence of explicit research frameworks that emphasize multiple barriers equally and simultaneously.
However, a crucial methodological caveat is warranted. Low keyword correlations likely underestimate the true extent of conceptual integration within the literature. To explore this possibility, a supplementary manual review was conducted on a sample of 30 H3 publications. The review revealed that 73% of the papers implicitly discussed data quality issues (H1) in their background or methodology sections and 60% discussed organizational or workforce challenges (H2). Importantly, this content was almost always secondary to the main focus and appeared, on average, on only 0.5 pages of a typical 15-page paper.
This finding suggests a more nuanced characterization of the research landscape than mere neglect. It suggests that knowledge related to H1 and H2 is not entirely absent but often implicitly embedded within the H3 literature. Instead of existing in isolated silos, this knowledge is scattered across papers primarily focused on system integration. There, it remains underspecified and difficult for practitioners to locate and implement. This can be described as a specification problem: The foundational insights are present but implicit and secondary. They lack the explicit framing and practical guidance necessary for effective translation into industry implementation.
4.6. Composite Research Attention Scores
To synthesize the multidimensional findings from the previous sections into a holistic assessment of research attention, a composite scoring system was developed. As detailed in Section 3.4, this system integrates the four primary dimensions—prevalence, temporal trend, citation impact, and high-impact representation—into a single normalized score on a 0-to-100 scale. Table 7a–c present the step-by-step calculation of these composite scores for each hypothesis.
Table 7.
(a) Hypothesis Verification Scoring—Detailed Calculation. Prevalence and Trend Metrics. (b) Hypothesis Verification Scoring—Detailed Calculation. Citation and High-Impact Metrics. (c) Hypothesis Verification Scoring—Detailed Calculation. Composite Score and Final Verification Status.
As the tables show, the composite scores clearly differentiate the three hypotheses. H3 (System Integration) received 15.436 points out of 25 possible points, resulting in a composite score of 62/100 based on nominal prevalence. Under the false-positive-adjusted prevalence (13.0%), the composite score decreases to approximately 58/100, remaining within the “Confirmed” category (50–70). Its strong performance on temporal trend (6.540 points) and prevalence (5.565 points) are the dominant contributors to this score, reflecting the sustained and substantial research momentum behind this topic.
In contrast, H1 (Data Integrity) and H2 (Socio-Technical) received composite scores of 17 and 13, respectively, placing them in the “Rejected” category (0–30). Their low scores are driven by weak performance across all dimensions, particularly prevalence and temporal trend. While they receive proportionate credit for their citation impact and elite representation relative to their low baseline, these contributions are insufficient to compensate for the fundamental deficit in research volume and growth.
Table 8 shows the final composite scores for each hypothesis, along with their bootstrap-derived 95% confidence intervals and verification status.
Table 8.
Results by hypothesis: composite scores, confidence intervals, and confirmation status for H1–H3.
The narrow confidence intervals, which are less than 5% of the mean scores for all hypotheses, suggest that the composite estimates are precise. Furthermore, the 45-point difference between H3 and H1 exceeds the total uncertainty from the bootstrap analysis, which confirms the statistical separation of the hypotheses. A final robustness check, detailed in Appendix B, tested five alternative weighting schemes for the composite score. The rank ordering of the hypotheses by composite score (H3 > H1 > H2) and their categorical classifications (H3 as Confirmed and H1 and H2 as Rejected) were maintained across all specifications, confirming that the findings are not an artifact of the chosen weighting assumptions.
4.7. Research–Practice Misalignment: Quantifying the Paradox
The preceding analyses established a clear pattern of research prioritization favoring system integration (H3) over data integrity (H1) and socio-technical (H2) barriers. To quantify the discrepancy between the academic focus and the concerns of industry practitioners, the study’s findings were compared with data from the RICS Global Construction Monitor 2025 survey. The survey, which polled over 2200 construction professionals worldwide, asked respondents to select the most significant barriers to AI adoption from a predefined list. The results reflect the frequency with which each barrier was chosen as one of the top three challenges. Table 9 presents a comparative analysis of practitioner concerns and the prevalence of topics in the academic literature, introducing a “practitioner-to-publication ratio” to illustrate the disparity.
Table 9.
Quantifying the Research–Practice Misalignment: Practitioner Concerns vs. Academic Research Attention.
The data in Table 9 suggest a notable inversion of priorities. Practitioners most frequently cite socio-technical barriers (H2) as a top challenge, with 46% of respondents identifying this barrier. This is followed by system integration (H3) at 37% and data quality issues (H1) at 30%. In contrast, the academic literature places the greatest emphasis on H3, which accounts for 15.9% of publications, while H2 and H1 account for only 4.6% and 2.7%, respectively.
The practitioner-to-publication ratio quantifies this imbalance. For every academic publication addressing H2 (socio-technical barriers), approximately 4.7 practitioners identify it as a critical barrier. For H1 (Data Integrity), the ratio is even higher, at 5.2 practitioners per publication. In contrast, the ratio for H3 (system integration) is a comparatively balanced 1.1 practitioners per publication, indicating a much closer alignment between the volume of research and the level of practitioner concern. These ratios underscore the magnitude of the disconnect, though they should be interpreted as heuristic illustrations of relative disproportion; they juxtapose self-reported survey selections with academic publication counts, which are fundamentally different units. The ratios are calculated as follows: , , .
It is important to note that the RICS data reflect the frequency with which each barrier was selected as one of the top three challenges by respondents, rather than a strict ranking of the most important obstacle. The relative ordering of the frequencies (H2 highest, followed by H3, then H1) aligns with prior literature on competency gaps [11,12] and appears robust. However, the precise percentages should be interpreted as measures of barrier prevalence rather than ordinal importance. Nevertheless, the observed pattern of inversion between practitioner concerns and academic research constitutes the principal empirical basis for the “research–practice paradox” as defined in this study.
4.8. Supplementary Evidence: Implicit Integration Analysis
To further explore the nature of the research–practice gap, a supplementary forward-citation analysis was conducted on a sample of 100 H3 publications from 2015 to 2025. The analysis aimed to determine if system integration research, which dominates the literature, addresses foundational barriers to data integrity and socio-technical challenges, even if they are not the primary focus.
The analysis examined how often H3 publications cite work explicitly related to H1 and H2. The results indicate a moderate level of engagement, rather than an absent one. On average, H3 papers cited foundational (H1 or H2) work at a rate of approximately 0.49 citations per paper. These results suggest that the system integration literature is not entirely isolated from foundational concerns. However, this engagement is clearly secondary to the primary focus on integration technologies and platforms.
A notable temporal trend was observed in this data set. The mean number of H1 and H2 citations per H3 paper increased from 1.9 from 2015 to 2018 to 2.8 from 2019 to 2025. This 47% increase suggests growing recognition within the research community of the foundational prerequisites necessary for successful system integration as the field matures, namely, data quality and organizational readiness.
This evidence supports Scenario C (Implicit Integration), in which H1/H2 knowledge is embedded within H3 literature, yet it remains secondary, implicit, and underspecified for practitioner application. This creates a knowledge specification problem: critical insights about data governance, workforce competencies, and organizational change are scattered across a vast system-integration-focused literature, creating locational and operational barriers for practitioners. This framing is more precise than “pure neglect” because it acknowledges that foundational knowledge exists, yet it is not easily applicable in practice.
4.9. Summary of Key Findings
The multidimensional analysis presented in this section yields a coherent and compelling set of findings that, collectively, characterize the state of research on barriers to AI adoption in construction. These findings can be distilled into five key observations, each of which is visually represented by one or more figures below.
First, system integration challenges dominate the research landscape (H3). This hypothesis accounts for a nominal 15.9% of the total literature (adjusted estimate, i.e., approx. 13.0%), exhibits robust growth with an R2 of 0.654, and is significantly overrepresented in the top 10% of the most-cited publications with a risk ratio of 1.31 (p = 0.003). Its composite score of 62/100 places it firmly in the “confirmed” category. Figure 3 illustrates the temporal evolution of specific technology components within the H3 literature to provide additional context on the nature of this dominant research stream.
Figure 3.
Temporal Evolution of System Integration Technology Components in Construction AI Literature (1990–2025).
Figure 3 disaggregates the H3 literature by major technology pillar (BIM, IoT/Sensors, digital twins, and autonomous technologies) in a stacked area chart. The visualization reveals a clear temporal shift: early H3 publications focused predominantly on isolated BIM adoption, whereas post-2015 research increasingly addresses integrated digital ecosystems combining multiple technology pillars. Topics related to autonomous systems have seen comparatively slower growth and remain a smaller component of the literature. This transition from point-solution approaches to holistic, data-flow-centric systems is discussed further in Section 5.
Second, foundational data integrity (H1) and sociotechnical (H2) barriers are systematically underrepresented. Together, these two areas account for less than 7.3% of the total literature, and even under the most conservative H3 adjustment (12.0%), the gap between H3 and H1/H2 remains substantial. The growth trajectories of H1 and H2 research are essentially flat, with R2 values below 0.19. They exhibit only proportional, nonsignificant representation in the elite stratum. With composite scores of 17/100 and 13/100, they fall into the “Rejected” category. Figure 4 provides a historical perspective on this underrepresentation by stratifying the data into three technological eras.
Figure 4.
Distribution of Research Activity Across Temporal Cohorts: Hypothesis Prevalence by Time Period (a); Publication Volume by Time Period (b).
Figure 4 stratifies the data into four decadal cohorts (1990–1999, 2000–2009, 2010–2019, and 2020–2025). Panel (a) shows that H3 prevalence grew from approximately 5% in the earliest cohort to over 18% in the most recent, while H1 and H2 remained relatively flat at approximately 2–5% throughout. Panel (b) displays absolute publication volumes, showing a dramatic expansion from 58 publications in 1990–1999 to 3469 in 2020–2025 (N = 4668), with H3 capturing the majority of this growth.
Third, the data provide strong indicative evidence of a research–practice misalignment. According to the RICS 2025 survey, practitioners rank socio-technical barriers (H2) as their most frequent concern at 46%, followed by system integration (H3) at 37% and data quality (H1) at 30%. This ordering is the inverse of the emphasis in academic research. The stark ratio of practitioners to publications quantifies this disconnect: for every publication on H2, 4.7 practitioners cite it as a top challenge. For H1, the ratio is 5.2:1, and for H3, it is a comparatively balanced 1.1:1.
Fourth, the available evidence suggests that the identified gap is more consistent with a volume-and-initiation issue than with a quality-of-impact issue, though this conclusion is tempered by the heterogeneity of the control group. Analysis of citation impact, as shown in Figure 5 and Figure 6, reveals that H1 and H2 publications receive broadly comparable scholarly attention relative to the control group when submitted and accepted. Their citation rates are not statistically different from the baseline, and their effect sizes are negligible. This suggests that the issue is not a lack of appreciation for such work after publication, but rather an upstream problem with agenda setting; fewer H1 and H2 papers are initiated in the first place. However, this volume deficit is compounded by a knowledge specification problem. While H1 and H2 insights are cited more frequently in H3 literature, these citations are scattered and secondary. This makes them difficult for practitioners to locate and implement. Thus, the gap reflects a confluence of challenges in research initiation and the inadequate translation of foundational knowledge into guidance accessible to practitioners, rather than gatekeeping discrimination.
Figure 5.
Citation Distribution by Hypothesis Groups vs. Control (Total Citations; Box-and-Whisker Plots).
Figure 6.
Effect Sizes and Overrepresentation Metrics by Hypothesis. Statistical Effect Sizes by Hypothesis ((a); left panel) and Risk Ratio in Highly Cited Papers ((b); right panel).
Figure 5 uses box-and-whisker plots to visually illustrate this pattern by comparing the citation distributions of each hypothesis group with those of a control group of publications that do not explicitly address adoption barriers. This comparison allows us to evaluate whether the scholarly impact of H1, H2, and H3 research differs systematically from the broader AI-in-construction literature. The figure shows both central tendency and spread, providing an intuitive complement to the statistical tests reported in Table 5 and reinforcing the idea that the citation performance of H1 and H2 publications closely aligns with the field’s baseline.
The box-and-whisker plots show the distribution of total citations for publications in each hypothesis group (H1, H2, and H3), compared to their respective control groups. The mean total citations (derived from raw data) are: H1 = 19.9 vs. Control = 14.8; H2 = 10.9 vs. Control = 15.1; H3 = 17.4 vs. Control = 14.0. Since older publications have had more time to accumulate citations, the main analysis (Table 5) uses citations per year to ensure fair comparability across publication years; the interpretation that follows is based on this normalized metric. The control groups comprise publications without an explicit focus on adoption barriers. The boxes represent the median and the 25th and 75th percentiles, and the whiskers extend to 1.5 times the interquartile range (IQR).
Examining the number of citations per year (see Table 5) shows that the citation distributions for H1 and H2 largely overlap with those of the control group. This indicates that their scholarly impact does not differ significantly from the field’s baseline. For H3, the median is slightly higher (2.09 vs. 1.98 citations per year), but the variance remains comparable, and the effect size is negligible (Cohen’s d = 0.009). These findings support the conclusion that the research–practice gap is primarily driven by differences in publication volume rather than systematic differences in citation impact.
These findings are further corroborated by Figure 6, which provides a direct statistical visualization of the patterns discussed above.
Figure 6a presents a comparative bar chart showing two key metrics for each hypothesis group. The pink bars represent the prevalence of each hypothesis as a percentage of total publications. H3 substantially exceeds H2 and H1, with values of 15.9%, 4.6%, and 2.7%, respectively. The blue bars show the citation impact (Cohen’s d, scaled for visualization) and confirm that all values cluster near zero (H1: d = −0.047, H2: d = −0.120, H3: d = 0.009). This indicates that there are negligible practical differences in citation rates between the hypothesis groups and the control group. Panel (b) displays risk ratios with 95% confidence intervals for the representation of each hypothesis group in the top 10% of most-cited publications. The horizontal reference line at RR = 1.0 indicates proportional representation. H1 (RR = 0.71, CI: [0.36, 1.40]) and H2 (RR = 0.60, CI: [0.31, 1.15]) demonstrate proportional or slightly below-proportional representation, with confidence intervals that cross 1.0. H3 (RR = 1.31, CI: [1.09, 1.53]) demonstrates significant overrepresentation, indicating that H3 topics are disproportionately represented in highly influential, agenda-setting publications.
Finally, the nature of the gap is best characterized as a specification problem rather than pure neglect. Forward-citation analysis revealed that H3 publications cite foundational H1/H2 work at a moderate but increasing rate. This suggests that knowledge pertaining to data integrity and socio-technical factors is not entirely absent but is often implicitly embedded within the system integration literature. However, it remains secondary, scattered, and operationally underspecified, making it difficult for practitioners to extract and apply. This nuanced understanding is crucial for designing effective solutions. Figure 7 provides a holistic, geometric synthesis of the four primary dimensions of research attention, visually confirming the dominance of H3 and the underrepresentation of H1 and H2.
Figure 7.
Four-Dimensional Research Attention Profile: Radar/Spider Chart.
The radar plot displays the performance of each hypothesis across the five research attention dimensions incorporated in this study: (1) prevalence (% of corpus), (2) temporal trend (R2 value), (3) citation impact (normalized Cohen’s d), (4) high-impact representation (normalized risk ratio), and (5) composite score (final weighted score, 0–100). Each hypothesis is represented by a distinct colored polygon. H1 (red) is a compact polygon close to the origin, indicating low scores across all dimensions. H2 (green) forms a slightly larger polygon than H1. H3 (blue) is a large star-like polygon that extends far from the origin, visually demonstrating its dominant research attention. The geometric interpretation is clear: The larger the polygon area, the greater the research attention. The asymmetry of H3’s polygon reveals that its dominance is primarily driven by the prevalence and temporal trend dimensions, with comparatively smaller contributions from citation impact.
4.10. Practice–Research Gap Attribution
Finally, the identified research–practice paradox does not prove that a lack of research attention on H1 and H2 causes poor AI adoption in construction. More broadly, research volume is not equivalent to research importance: a small number of highly influential publications can shape practice more profoundly than a large body of incremental work. The citation impact analysis (Section 4.3) partially addresses this by showing that H1 and H2 papers are not systematically less cited, but citation counts themselves are an imperfect proxy for practical influence, which may operate through channels invisible to bibliometric analysis—such as standards development, consulting engagements, or informal knowledge transfer. Alternative explanations include: (a) Practice leads research. Construction practitioners may identify data quality and competency gaps through experience before academic research develops adequate frameworks. In this case, low research prevalence reflects the dynamics of an emerging problem rather than neglect; (b) Disciplinary silos: Barriers identified as “understudied” in AI-construction literature may receive substantial attention in construction management or organizational behavior research but be invisible to AI-specific searches; (c) Problem severity does not equal research prevalence. The most severe practical barriers may not generate the most publications if academics consider them “solved” or “known problems”; and (d) Research volume ≠ adoption outcomes. Even if H1 and H2 receive fewer publications, the existing body of work may be sufficient to inform practice, and increasing publication volume would not necessarily accelerate AI adoption if the binding constraints are organizational, financial, or regulatory rather than knowledge-related.
Despite these limitations, the analysis provides robust evidence that research attention on H1 and H2 is disproportionately low compared to how construction practitioners have identified them as critical barriers. These quantitative findings reveal a systematic research–practice paradox: academic priorities (H3 dominance) mirror the obstacles identified by practitioners (H2 primacy) in reverse. The following section contextualizes this paradox within theoretical frameworks and explores the implications for rebalancing the research agenda.
5. Discussion
5.1. The Research–Practice Paradox: Systematic Underrepresentation of Critical Barriers
Our bibliometric analysis reveals a striking misalignment between the barriers that industry practitioners most frequently encounter when adopting AI and the attention that these barriers receive in academic literature. We term this phenomenon the “research–practice paradox”.
The 2025 RICS Global Construction Monitor survey of over 2200 construction professionals found that shortages of skilled personnel were the most frequently cited barrier (46%), followed by system integration challenges (37%) and data quality issues (30%) [8]. These figures represent the prevalence of each concern among practitioners actively deploying AI. However, academic research emphasizes these issues differently: H3 (15.9%), H2 (4.6%), and H1 (2.7%). The practitioner-to-publication ratios quantify this disparity: 4.7 practitioners per H2 publication and 5.2 per H1 publication versus 1.1 per H3 publication. Although a direct comparison of survey and publication prevalence percentages is methodologically imperfect (as they measure distinct phenomena, such as practitioner concern versus academic inquiry volume), this ratio illustrates the disproportionate scale at which practitioners encounter H1/H2 barriers relative to academic literature addressing them. The magnitude of this apparent misalignment—H2 practitioners outnumber H2 publications nearly fivefold—is the central finding of this study, though its interpretation is contingent on the operationalization of RICS survey items as proxies for the theoretical constructs. This pattern warrants attention given that the construction sector has long suffered from stagnating or declining productivity [45,46], although a direct causal link between low research volume on H1/H2 and poor AI adoption outcomes cannot be established from bibliometric data alone. Research volume is a proxy for agenda-setting priorities, not a measure of knowledge sufficiency; it is possible that the existing H1/H2 literature, though smaller in volume, provides adequate foundational guidance that practitioners have yet to fully absorb or implement [47].
5.2. Theoretical Implications: Technocentrism in Construction Innovation Research
Our findings align with the broader critique of technological determinism in information systems research [48]. This critique posits that technology unidirectionally drives social change rather than emerging through the mutual shaping of technical artifacts and social contexts [19]. The disproportionate focus on system integration challenges (H3: 62/100) compared to data quality (H1: 17/100) and socio-technical adoption barriers (H2: 13/100) is consistent with the implicit assumption that technological deployment is primarily an engineering problem, solvable through better algorithms, platforms, and interoperability standards [49,50].
However, this technocentric perspective has a critical liability: it assumes that, once technical infrastructure matures, social adoption will follow naturally. However, decades of technology adoption literature contradict this assumption. The Technology Acceptance Model emphasizes that perceived usefulness and ease of use depend critically on alignment with user competencies, organizational workflows, and change readiness [5,51,52]. Socio-technical systems theory posits that technology functions within social systems, including organizational structures, workforce capabilities, and cultural norms [4,28]. Technology adoption failures typically arise not from technical deficiency, but from misalignment between technical and social subsystems [4], a dynamic that the Diffusion of Innovations framework has consistently highlighted across sectors [6].
Building Information Modeling as Cautionary Precedent
BIM provides an instructive parallel. Technical systems analysis shows that BIM tools have achieved significant maturity since the 2000s. Software capabilities are robust, and interoperability standards (ISO 19650) have been established. There are also proven case studies that document value realization [50]. However, adoption remains limited, particularly among small-to-medium enterprises [35,36], in developing economies, and in retrofit and maintenance projects [35,36]. Post-adoption analyses have identified implementation barriers as predominantly socio-technical in nature, including organizational culture, workforce capability, and change management [36,53], rather than purely technical.
This suggests that technical maturity alone (robust algorithms, available tools, and proven case studies) is insufficient for adoption without parallel investment in human capital, organizational change management, and data governance. Similarly, AI applications in construction—from predictive analytics to computer vision-based safety monitoring—face risks of underutilization if foundational data quality (H1) and organizational readiness (H2) are neglected despite increasingly sophisticated AI algorithms and the digital platforms on which they depend (H3 research focus) [4,54,55]. The lesson is clear: Without investments in data governance, workforce capabilities, and organizational change management, increasingly sophisticated AI platforms may remain “beautiful artifacts in laboratories” rather than becoming transformative tools [56].
5.3. The Foundational Role of Data Integrity
The marginalization of data integrity research is particularly concerning, given its foundational role in the efficacy of AI. The “data-centric AI” movement emphasizes that innovations in model architecture yield diminishing returns without parallel investments in data quality [23,57]. However, construction research seems to prioritize algorithmic sophistication over data infrastructure.
Deep learning models require vast volumes of high-quality, structured, annotated data to reliably perform [23,57]. Construction suffers from acute data poverty, including fragmented information across multiple stakeholders, manual collection in inconsistent formats, incomplete documentation, and alarming error rates in critical records [24,25,58]. Generative AI exacerbates these concerns through “hallucinations”—plausible but factually incorrect outputs that pose unacceptable dangers in safety-critical and financially consequential decisions [26]. In construction, such hallucinations arise from inadequate training data, a lack of domain knowledge, and insufficient contextual grounding [26]. Data quality challenges permeate applications ranging from concrete analysis [17,59] to waste management [27,60] and undermine the reliability of any subsequent AI-driven decision-making processes [61].
5.4. The Competency Gap Paradox as Self-Reinforcing Barrier
It is paradoxical that there is weak attention to socio-technical barriers (H2: 4.6% prevalence, 13/100 score) despite RICS data showing this to be the top barrier (46%). This paradox reflects self-reinforcing dynamics: labor shortages drive the demand for automation [11,31,62], yet organizations simultaneously lack the necessary in-house digital and AI expertise for implementation [11,31]. This cycle is amplified by high staff turnover, which undermines training investments [32], and low profit margins, which constrain capability-building expenditures [33].
Construction’s inherent conservatism, risk aversion, and fragmented project delivery model create cultural resistance to disruptive innovations [29,63,64]. Research documenting competency gaps [7] (over 100 studies and 36,269 firms) confirms that skilled labor shortages are a widespread and geographically robust barrier [62]. However, academic research on AI-specific competency development remains sparse relative to the sense of urgency among practitioners. This observation documents a disparity in volume, not a demonstrated causal deficit: whether additional publications would translate into improved workforce readiness depends on factors beyond research attention, including institutional capacity for knowledge absorption, training infrastructure, and employer investment in upskilling.
5.5. Why Did H3 Capture 70% of Post-2015 Growth?
A crucial observation from the temporal analysis merits further examination: although the total volume of construction AI research increased tenfold after 2015, system integration literature (H3) accounted for about 70% of this growth. This disproportionate concentration appears to result from a confluence of interrelated mechanisms that have collectively shaped the research agenda.
The first is a technological inflection point that occurred between 2012 and 2015. The breakthrough of deep learning, as demonstrated by Krizhevsky et al. [18], coincided with the maturation of essential construction technologies [65]. The finalization of the ISO 19650 standards for BIM and the emergence of IoT and DT as practical, deployable technologies created fertile ground for novel research. H3 scholarship was well-positioned to capitalize on this convergence by framing the integration of AI with BIM, IoT, and DT infrastructure as a “new frontier”, attracting researchers seeking to combine cutting-edge AI methods with emerging industry digital infrastructure [55,66].
Second, this technological opportunity was reinforced by strong alignment with funding priorities. Major national and international funding agencies, including the National Science Foundation’s (NSF) Smart and Connected Communities program, the European Union’s (EU) Horizon 2020 and Horizon Europe frameworks, and various national “Industry 4.0” initiatives [54], explicitly prioritized research on “smart construction” and “digital ecosystems”. These programs inherently emphasized system integration. In contrast, data quality (H1) and socio-technical challenges (H2) were often perceived by funding bodies as “known problems” that were less novel, thereby reducing the incentives for researchers to initiate projects in these areas.
Third, after 2012, there was a significant disciplinary migration. Researchers with backgrounds in artificial intelligence and machine learning began entering the construction field, bringing research paradigms from computer science with them. In this tradition, deploying AI within integrated digital platforms and automation pipelines constitutes the primary mode of inquiry [48]. This influx of newcomers disproportionately directed their attention toward H3-type problems—AI applications such as PPE detection [67], robotic fabrication [68], and AI-enabled dam engineering [69]—and toward the digital infrastructure these applications require, such as digital twin integration [65]. Meanwhile, construction management researchers, who might have been more inclined to prioritize H1 and H2, remained a minority within the emerging, AI-focused publication venues.
Finally, these dynamics were amplified by a citation and prestige feedback loop. Early H3 publications from the 2012–2015 period benefited from their novelty and frontier positioning, accruing higher citation counts [70,71]. This citation success attracted grant funding and encouraged follow-on research, further entrenching H3 as the dominant stream. Conversely, H1 and H2 papers, which often addressed topics that the AI community perceived as “solved” or “well-known” based on construction management literature, received fewer citations in AI-specific journals. This discouraged subsequent research initiation and perpetuated the cycle of underrepresentation.
5.6. Alternative Interpretations and Caveats
Although the aforementioned mechanisms offer a plausible explanation for the observed research imbalance, it is important to consider alternative interpretations that do not imply a failure by the research community to address the needs of practitioners. These scenarios offer important nuances and suggest different potential solutions.
Scenario A (Temporal Lag) posits that the observed gap may be part of the normal scientific lifecycle rather than neglect. According to this model, foundational issues such as data quality and workforce development were extensively studied in construction management literature during earlier periods, particularly from 1990 to 2010 [63,72]. Today, practitioners may be referencing these accumulated insights even as academic attention has naturally shifted toward newer technical frontiers since 2012. According to this view, the research–practice gap is a function of timing: research leads and practice follows as the field’s focus evolves. This pattern is common in technology adoption, as exemplified by BIM’s trajectory from a technical innovation to an organizational implementation challenge [6].
Scenario B (Disciplinary Silos) suggests that the apparent underrepresentation of H1 and H2 could be due to the study’s search strategy. These barriers may receive substantial attention in construction management, organizational behavior, or human factors journals [51,53]. However, this body of work may be rendered invisible by the AI-specific keywords and databases used in this analysis. If this scenario is correct, the core problem is not an absence of research but rather an interdisciplinary translation challenge. Knowledge exists, but it is siloed within different academic communities and fails to reach the AI research community or industry practitioners effectively.
Scenario C (Implicit Integration), which is partially supported by the forward-citation analysis in Section 4.8, suggests that H1 and H2 knowledge is embedded within the H3 literature, rather than being absent. However, as the analysis revealed, this content is usually secondary and appears as background context rather than a primary focus. It remains underspecified for direct operationalization by practitioners. This creates a knowledge specification problem, where insights are scattered across a vast literature, making them difficult for practitioners to locate, synthesize, and apply to their projects [49,56]. Each scenario has different implications for intervention, and it is likely that elements of all three scenarios are at play. The appropriate response depends on which mechanism is ultimately dominant.
5.7. Practical Implications: Research Agenda Rebalancing
The question of whether the observed research imbalance constitutes a genuine problem or merely reflects appropriate disciplinary evolution depends on assumptions about causality, field maturity, and the optimal sequencing of research priorities. Nevertheless, this debate does not change the practical reality facing the construction industry. Practitioners attempting to adopt AI face significant barriers related to data integrity and socio-technical readiness [53]. However, the research landscape they might look to for guidance remains overwhelmingly focused on system integration challenges. It is important to note that the bibliometric analysis presented here documents patterns of research attention; it does not empirically demonstrate that rebalancing these patterns would improve AI adoption outcomes. The recommendations that follow are therefore grounded in the logical inference that research addressing practitioner-identified barriers is more likely to yield actionable guidance than research that does not—a plausible but unverified assumption that warrants future empirical testing. Addressing this discrepancy requires coordinated action from multiple stakeholders [47].
5.7.1. For Researchers: Strategic Portfolio Rebalancing
The academic community bears the primary responsibility of shaping the research agenda. A strategic rebalancing effort should prioritize several key areas. First, there is an urgent need for research on data quality standards tailored to the construction context. This includes developing AI-specific data quality metrics [57], defining minimum viable dataset specifications for common construction applications [59], and designing data governance protocols that address fragmentation across design, procurement, construction, and operational handoff points [58]. Current construction standards, such as ISO 19650 for BIM, were not developed with AI optimization in mind and require significant augmentation [50].
Second, researchers should prioritize developing competency frameworks deeply contextualized to the construction industry. Rather than using generic data science curricula, these frameworks should be sequenced by adoption stage, moving from awareness-level content for leadership to operational training for project teams to expert-level development for specialists [54,66]. Due to the industry’s high annual turnover rates of 20–30% [32], community-of-practice approaches that facilitate continuous knowledge transfer and peer learning are likely more effective than one-time training interventions [62].
Third, there is a need for holistic adoption models that move beyond linear, technology-driven frameworks. These models should explicitly map the prerequisites and sequences of adoption [5,6]. They should address questions such as which barriers must be addressed first and how investments in competency development affect an organization’s capacity for data governance. They should also incorporate feedback loops that capture the dynamic, iterative nature of organizational change [64,72].
5.7.2. For Industry Practitioners: Integrated Implementation
While the research community rebalances its priorities, practitioners must navigate the current landscape. The key principle is to avoid premature optimization [47]. Organizations should establish basic data governance structures and data quality assurance processes before deploying data-intensive AI applications [58,61]. Similarly, they should assess and develop workforce competencies before introducing complex, integrated systems [66]. To ensure that this foundational enabler receives sustained organizational attention, practitioners should consider designating explicit leadership responsibility for data quality, potentially through a Chief Data Officer or equivalent role.
5.7.3. For Policymakers: Enabling Infrastructure
Policymakers and funding agencies play a crucial role in shaping the research ecosystem. One concrete action they can take is to mandate or incentivize data quality standards in public construction procurement, thereby creating demand for the data infrastructure required by AI applications [73]. Additionally, funding agencies should allocate resources explicitly for pre-competitive research that addresses shared adoption barriers. Policymakers can help counteract the novelty bias that currently favors system integration research by creating dedicated funding streams for data governance and socio-technical research and by signaling that these are active frontiers requiring innovation, not merely “known problems” [45,46].
6. Limitations and Future Research Directions
While this study is comprehensive, it is subject to several limitations that qualify its findings and suggest avenues for future inquiry.
First, the analysis is limited to English-language publications indexed in OpenAlex [40]. This excludes knowledge that may be relevant, disseminated through non-English academic outlets, industry standards (e.g., ISO 19650), consulting reports, and practitioner networks. A scenario analysis (see Appendix C) suggests that, even under extreme assumptions about non-English literature emphasizing H1 and H2, the core finding of H3 dominance remains robust. Nevertheless, a formal multilingual bibliometric analysis is recommended to definitively determine whether the research–practice paradox is a global phenomenon or contingent on linguistic and cultural contexts.
Second, while valuable, the practitioner benchmark has inherent limitations. The RICS survey data reflect the frequency with which respondents selected each barrier as one of their top three challenges rather than providing a strict ordinal ranking of the most important obstacle. Therefore, the comparison between these frequencies and research prevalence rates should be interpreted as indicative of general alignment rather than as a precise rank-order comparison. Furthermore, the RICS sample is geographically skewed (48% UK, 19% APAC, 14% MEA, 10% Americas, and 8% Europe), and barrier prioritization may differ substantially in developing economies or SME-dominated regions that are not fully represented. While directionally consistent findings from independent surveys (BuiltWorlds 2025, n = 53; Dodge/CMiC 2025, n = 235) support the general rank ordering of barriers identified by RICS [39,74], the reliance on a single primary benchmark remains a limitation. Future studies should synthesize multiple practitioner surveys into a meta-analytic benchmark to reduce dependence on any individual source. Additionally, practitioner priorities are inherently dynamic; barriers that dominate at one stage of the adoption lifecycle (e.g., data quality during early implementation) may recede as organizations mature, while others (e.g., system integration) may intensify. The RICS 2025 survey captures a single temporal cross-section, and a longitudinal comparison with future survey iterations would be necessary to assess the stability of the identified misalignment over time.
Third, operationalizing theoretical constructs introduces the potential for interpretive divergence. Mapping RICS survey items to the H1, H2, and H3 categories is a reasoned operationalization, not definitional equivalence. The survey items are specific instances of broader theoretical categories, so different mapping choices could affect comparative conclusions.
Fourth, classification precision varies across hypotheses. Although the overall approach was validated as highly reliable, the H3 keyword set had a false positive rate of 18.2% (95% CI: 12.8–24.5%), primarily due to the ambiguous nature of the term “integration”. False positive rates for H1 and H2 are presumed to be lower due to higher semantic specificity; however, this remains empirically unverified. Future work should validate the H1 and H2 classifications through spot-check audits (recommended sample size: 50 publications per hypothesis) and could employ machine learning classifiers to improve precision [71].
Fifth, the analysis only documents correlational patterns; it does not support causal inference from research attention to adoption outcomes. The observed misalignment may reflect multiple mechanisms, including temporal lag, disciplinary silos, and implicit integration, rather than a simple failure of the research community to address the needs of practitioners.
Sixth, the composite scoring system, while validated through sensitivity analysis across five weighting schemes and bootstrap resampling, relies on researcher-determined weights and classification thresholds. Although the rank ordering of hypotheses proved robust across all tested specifications (see Appendix B), the absolute composite scores and the descriptive labels assigned to them reflect methodological choices rather than empirically derived cut-points. Readers should interpret these labels as relative characterizations of research attention rather than definitive verdicts on the status of each barrier in the literature. Based on these limitations, the following directions for future research are recommended: (1) Conduct qualitative comparative case studies of firms that have successfully overcome all three barrier types to identify effective integration strategies [63,64]; (2) Perform multilingual bibliometric analyses (prioritizing Chinese, German, and Japanese literature) to assess the cultural and linguistic contingency of the research–practice paradox [45]; (3) Undertake longitudinal practitioner interviews to examine the temporal dynamics of barrier emergence and how practitioner priorities evolve alongside technological maturity [5,6]; (4) Develop and validate machine learning-based classification models to reduce false positive rates for H1 and H2, and to enable more fine-grained analysis of implicit content within the H3 literature [70,71]; (5) Construct more targeted citation benchmarks by comparing H1 and H2 publications not against the full heterogeneous corpus but against publications addressing other specific adoption barriers (e.g., regulatory, financial, or supply chain barriers), which would provide a more informative baseline for assessing whether foundational barrier research is systematically undervalued upon publication; (6) complement the uniform-benchmark Cohen’s h with pairwise effect size comparisons between hypotheses (e.g., H1 vs. H3, H2 vs. H3), which would more directly quantify the magnitude of between-barrier attention disparities without reliance on an arbitrary reference distribution.
7. Conclusions
This bibliometric analysis of 4668 publications from 1990 to 2025 provides the first large-scale, longitudinal quantification of research attention on barriers to AI adoption in construction. The analysis reveals evidence of a systematic “research–practice paradox”. Academic research shows a pronounced and persistent imbalance, favoring system integration challenges (H3: composite score 62/100, confirmed) over foundational data integrity (H1: 17/100, rejected) and socio-technical barriers (H2: 13/100, rejected). H3 accounts for a nominal 15.9% of the literature (adjusted to approx. 13.0% after false positive correction), exhibits robust growth (R2 = 0.654, CAGR = +13.56%), and is significantly overrepresented in highly cited publications (risk ratio = 1.31, p = 0.003). In contrast, H1 (2.7%) and H2 (4.6%) demonstrate stagnant growth (R2 < 0.19) and minimal elite representation.
This academic emphasis is the inverse of the priorities identified by practitioners in the RICS Global Construction Monitor 2025 survey [8], in which H2 was cited most frequently (46%), followed by H3 (37%) and H1 (30%). Practitioner-to-publication ratios quantify the severity of this misalignment: There are 4.7 practitioners per H2 publication and 5.2 per H1 publication, compared to a balanced 1.1 per H3 publication.
The observed imbalance reflects a technocentric bias in construction innovation research—the implicit assumption that the deployment of technology is primarily an engineering problem. This perspective undervalues the socio-technical complexities that have proven to be decisive in practice. For example, the cautionary precedent of BIM shows that technical maturity does not guarantee widespread adoption due to organizational and cultural barriers [4,35,36]. The available evidence suggests that the gap is primarily a volume problem rather than clearly a quality problem, though the heterogeneity of the control group (encompassing all non-barrier-focused AI-in-construction publications) limits the strength of this inference. H1 and H2 publications receive citation attention broadly comparable to the baseline upon publication, which is more consistent with an agenda-setting challenge in research initiation than with systematic gatekeeping discrimination. Supplementary evidence suggests that this problem is best characterized as a knowledge specification issue. H1/H2 insights are increasingly embedded implicitly within H3 literature, yet they remain secondary, scattered, and underspecified for operationalization by practitioners.
If the plausible inference holds that research attention aligned with practitioner-identified barriers is more likely to generate actionable implementation guidance, then addressing this paradox requires coordinated action across the research ecosystem. Three priority areas merit consideration: (1) developing construction-specific data governance frameworks and quality standards, as current protocols, such as ISO 19650, lack AI optimization guidance [23]; (2) creating contextualized competency development strategies that address high industry turnover through community-of-practice approaches [32,33]; and (3) modeling holistic adoption pathways that map interdependencies and prerequisite sequences and learning from BIM’s trajectory. Whether such rebalancing would translate into measurable improvements in AI adoption rates remains an empirical question beyond the scope of this bibliometric analysis.
This study has several limitations, including its focus on English-language, OpenAlex-indexed literature, a geographic bias in the RICS benchmark, and imprecise classification, especially for H3. Future research should employ multilingual analyses, longitudinal practitioner studies, and machine learning–based classification to refine these findings.
Ultimately, the research–practice paradox reflects specific disciplinary incentives and institutional structures, rather than being inevitable. Correcting this misalignment through funding prioritization, conference programming, journal editorial policies, and university hiring criteria offers substantial leverage for accelerating the digital transformation of the construction industry. However, this analysis is based on English-language literature and a UK-skewed practitioner sample [8], so it may reflect patterns that are particularly pronounced in certain geographic and institutional contexts. Replication in non-English literature and diverse regions is warranted. Nevertheless, the fundamental insight remains: Algorithms alone cannot overcome poor data, nor can sophisticated platforms substitute for workforce readiness. The evidence presented here suggests that rebalancing research attention across all three dimensions—data integrity, socio-technical adoption, and system integration—represents a necessary, though not empirically proven sufficient, condition for the field to avoid repeating the implementation failures of previous technological waves and realize AI’s transformative potential.
Author Contributions
Conceptualization, J.S. and D.M.; methodology, J.S.; validation, D.M.; investigation, J.S. and D.M.; resources, J.S. and D.M.; data curation, D.M.; writing—original draft preparation, J.S. and D.M.; writing—review and editing, J.S. and D.M.; visualization, D.M.; supervision, J.S. All authors have read and agreed to the published version of the manuscript.
Funding
This research received no external funding.
Data Availability Statement
The bibliographic data supporting this study were retrieved on 10 February 2026 via the OpenAlex REST API (https://api.openalex.org/). A custom Python script (Python version 3.12.3, Python Software Foundation, https://www.python.org/) was used to query the API and compile the raw dataset. Algorithmic classification and statistical analysis were performed using a separate Python script. Both scripts, along with the compiled dataset, are available from the corresponding author upon reasonable request.
Conflicts of Interest
The authors declare no conflicts of interest.
Abbreviations
The following abbreviations are used in this manuscript:
| AI | Artificial Intelligence |
| GDP | Gross Domestic Product |
| H1 | Hypothesis 1 (Data Integrity) |
| H2 | Hypothesis 2 (Socio-Technical) |
| H3 | Hypothesis 3 (System Integration) |
| RICS | Royal Institution of Chartered Surveyors |
| R2 | Coefficient of Determination |
| RR | Risk Ratio |
| BIM | Building Information Modeling |
| IoT | Internet of Things |
| CAGR | Compound Annual Growth Rate |
| CI | Confidence Interval |
| pp | Percentage Points |
| κ (Cohen’s κ) | Cohen’s Kappa |
| df | Degrees of Freedom |
| n.s. | Not Significant |
| ME | Margin of Error |
| FP | False Positive |
| IQR | Interquartile Range |
| NBER | National Bureau of Economic Research |
| ISO | International Organization for Standardization |
| API | Application Programming Interface |
| GPU | Graphics Processing Unit |
| EU | European Union |
| SME | Small-to-Medium Enterprise |
| APAC | Asia-Pacific |
| MEA | Middle East and Africa |
| ML | Machine Learning |
| IT | Information Technology |
| PRISMA | Preferred Reporting Items for Systematic Reviews and Meta-Analyses |
| AEC | Architecture, Engineering, and Construction |
| PPE | Personal Protective Equipment |
| PPP | Public–Private Partnership |
| GIS | Geographic Information System |
| CNKI | China National Knowledge Infrastructure |
| BERT | Bidirectional Encoder Representations from Transformers |
| RoBERTa | Robustly Optimized BERT Pretraining Approach |
| ANOVA | Analysis of Variance |
| SIAM | Society for Industrial and Applied Mathematics |
| SDM | SIAM International Conference on Data Mining |
| STI | Science and Technology Indicators |
| VTT | Valtion Teknillinen Tutkimuskeskus (Technical Research Centre of Finland) |
Appendix A. Keyword Sets and Classification Sensitivity Analysis
Table A1 shows the full set of keywords developed for each hypothesis through iterative refinement. For H1 (Data Integrity), a set of 17 keywords was assembled. For H2 (Socio-Technical), a set of 15 keywords was created. A 16-keyword set was developed for H3 (System Integration).
The rationale for keyword selection reflects differences in semantic specificity. The H1 and H2 keyword sets use highly specific terms (e.g., “competency gap”, “data fragmentation”), which minimizes the risk of false positives in AI construction contexts. In contrast, H3 uses broader terms, such as “integration”, that can appear in organizational contexts. A precision audit (see Appendix D) determined that the false positive rate for H3 is 18.2% (95% CI: 12.8–24.5%). Due to the higher semantic specificity of the vocabulary in H1 and H2, it is presumed that the false positive rates for these hypotheses are substantially lower, though this remains empirically unverified. Future reproduction or extension studies should validate this assumption through spot-check audits.
Table A1.
Complete Hypothesis-Specific Keyword Sets.
To evaluate the robustness of the classification system in the face of methodological variations, four alternative classification strategies were examined. Table A2 shows the results of the sensitivity analysis, which compares the original single-keyword approach with strategies that require multiple keyword matches, restrict to the title and abstract only, and apply positional weighting.
Table A2.
Threshold Sensitivity Analysis—Alternative Classification Strategies.
The Spearman rank correlations between the methods were exceptionally high: r = 0.96 between the original and multiple-keyword approaches, r = 0.94 between the original and the title/abstract-only approach, and r = 0.91 between the original and the weighted positional scoring approach. These results confirm that the prevalence ranking (H3 > H2 > H1) remains robust across methodological variations. Depending on the keyword threshold, absolute prevalence estimates may vary by ±0.5–1.0 percentage points, but the directional ordering and core conclusions regarding the research–practice paradox are insensitive to specification choices. The plausible prevalence ranges are: H1: 2.1–2.9%; H2: 3.3–4.6%; H3: 13.0–15.9% (accounting for false positive adjustment).
Appendix B. Weighting Scheme Sensitivity and Statistical Corrections
Table A3 shows the results of five sensitivity analyses that test how alternative weighting schemes impact the composite scores. The tested schemes include the primary weighting scheme (Temporal: 40%; Prevalence: 35%; Elite: 15%; Citation: 10%), equal weights (25% each), prevalence-heavy weights (20%, 50%, 15%, 15%), trend-heavy weights (50%, 25%, 15%, 10%), and citation-heavy weights (30%, 30%, 20%, 20%).
Table A3.
Composite Scores Under Five Alternative Weighting Combinations.
Across all five weighting schemes, H3 scores consistently between 58 and 62 out of 100, remaining in the “Confirmed” category. Meanwhile, H1 and H2 consistently score between 13 and 24, remaining in the “Rejected” category. The rank ordering by composite score of H3 > H1 > H2 is maintained across all specifications, demonstrating that the core findings are independent of weighting assumptions.
To control for the inflation of familywise error rates across multiple statistical tests, a Bonferroni correction was applied. Testing three hypotheses across five analytical dimensions constitutes 15 separate statistical tests. The standard significance level (α = 0.05) would yield a family-wise error rate of:
The Bonferroni-corrected threshold was therefore set at:
Table A4 summarizes the outcomes of all statistical tests against this corrected threshold.
Table A4.
Multiple Comparison Results Summary: Statistical Test Outcomes for H1–H3 Across Five Analytical Dimensions.
Rejection of H1 and H2 is supported by tests that exceed the Bonferroni threshold (prevalence and temporal trend) combined with non-significant, yet unfavorable, patterns in citation impact and risk ratio. This multidimensional evidence provides a robust basis for rejecting the hypothesis, even though not all individual tests exceed the corrected threshold.
Appendix C. Language Bias Scenario Analysis and Multi-Language Research Roadmap
A scenario analysis was conducted to assess the potential impact of restricting the analysis to English-language publications. The baseline, which is an English-language corpus from OpenAlex, shows H1 at 2.7%, H2 at 4.6%, and H3 at 15.9%. The extreme scenario assumes that English publications represent 70% of global construction AI literature (a conservative estimate, as English typically dominates science and engineering literature at 75–80%) and that non-English publications emphasize H1 and H2 at a rate three times higher than English literature.
The global prevalence under this extreme assumption is calculated as a weighted average:
The H3 calculation assumes that its prevalence in non-English literature remains proportional because the scenario only tests increased emphasis on H1 and H2. Even under this extreme language bias assumption, the global rank ordering is H3 (15.9%) > H2 (7.4%) > H1 (4.3%). Compared to the priorities of RICS practitioners (H2: 46%, H3: 37%, and H1: 30%), H3 is still overrepresented in the literature while H1 and H2 are underrepresented. The core finding, the research–practice paradox, persists even under extreme language bias scenarios.
To definitively eliminate language bias as a confounding factor, a multilingual research roadmap is proposed. This would involve three phases. First, parallel corpora would be constructed in priority languages (Chinese, German, and Japanese) using analogous searches in databases such as CNKI, GeoRef, and J-Stage. Keyword translation would require forward translation by domain experts, back translation to verify semantic equivalence, and pilot testing. Phase 2 would replicate the prevalence analysis for each language corpus separately. Phase 3 would aggregate the results, assigning estimated weights based on global research distribution (e.g., English: 70%, Chinese: 15%, German: 8%, Japanese: 5%, and other languages: 2%). The analysis would determine if the research–practice paradox is specific to English literature, a global pattern, or inverted in certain regions.
Appendix D. H3 Precision Audit—Detailed Results and False Positive Distributions
Due to the potential ambiguity of the keyword “integration”, which can appear in organizational contexts unrelated to system integration (e.g., team integration, supply chain integration), an expanded precision audit was conducted. The audit followed two sampling stages with increasing sample size and stratification.
Stage 1: Initial Audit (n = 50 Sample)
A random sample of 50 H3-flagged publications (1.1% of the H3 corpus) was reviewed by two independent coders. The results showed 76.0% true positives, 16.0% false positives, and 8.0% ambiguous cases. Substantial inter-rater agreement was observed (Cohen’s k = 0.82, p < 0.001). While this initial stage indicated a moderate false positive rate, the small sample size provided limited confidence.
Stage 2: Expanded Validation (n = 148 Additional Sample)
To increase precision, a stratified sample of 148 additional H3-flagged publications was drawn with stratification by keyword position (title only, abstract only, or body text only). This approach recognized that “integration” in titles carries a higher risk of false positives. The results showed 73.6% true positives, 18.9% false positives, and 7.4% ambiguous cases. Inter-rater agreement remained substantial (κ = 0.79 initially, κ = 0.84 post-adjudication).
Combined False Positive Estimate (Stages 1 + 2, n = 198 Total)
Pooling across both stages:
The 95% confidence interval for the false positive rate, calculated using the binomial proportion, is [12.8%, 24.5%].
Adjusted H3 Prevalence Estimates
Using the point estimate (18.2% FP rate):
Using the conservative upper-bound estimate (24.5% FP rate):
The point estimate of 13.0% represents the most likely true prevalence for H3, while the conservative upper-bound of 12.0% provides a lower boundary. The originally reported figure of 15.9% represents the upper bound reflecting keyword-only classification without false positive adjustment.
Robustness of Primary Findings After FP Adjustment
Even under the maximum realistic false positive adjustment (24.5%), the rank ordering of research attention by publication volume (prevalence) remains completely robust:
The prevalence ranking H3 > H2 > H1 persists across all adjustment scenarios.
Regarding the composite score, a conservative estimate of the impact of FP adjustment can be derived by adjusting only the prevalence component while holding all other dimensions constant. Under this conservative assumption, the original unadjusted H3 score of 62/100 would adjust to approximately 58/100 under the point estimate (13.0% prevalence) and approximately 56/100 under the conservative upper-bound (12.0% prevalence). In both cases, H3 remains firmly within the “Confirmed” category (50–70 range). More importantly, even with this adjustment, H3’s composite score remains orders of magnitude higher than H1 (17/100) and H2 (13/100), and the relative ordering of H1 and H2 (H1 > H2) is unaffected.
False Positive Distribution by Keyword Position
As shown in Table A5, stratification in Stage 2 revealed that false positive rates vary significantly by keyword position.
Table A5.
False Positive Distribution by Keyword Position: Rates and Counts for Title, Abstract, and Body Text Matches from Stratified Validation in Stage 2.
The false positive rate is highest for title-position matches (24.0%), moderate for abstract-only matches (20.4%), and lowest for body-text-only matches (12.2%). This pattern shows that the primary concept of “integration” refers more often to system integration in titles than to other types of integration in body text.
Validation Metrics and Inter-Rater Reliability
Table A6 presents the combined validation results across both stages, demonstrating high and consistent inter-rater reliability.
Table A6.
Combined Validation Results (Stages 1 + 2).
Post-adjudication κ = 0.845 (95% CI: [0.77, 0.92]) indicates “almost perfect” inter-rater agreement per Landis and Koch [75] conventions, supporting the reliability of the final classification. The narrow confidence interval and lack of zero crossing indicate statistically robust agreement.
Recommendations for Future H3 Classification Refinement
Based on the audit findings, four recommendations for refining future classifications are proposed. First, the keyword-based approach should be combined with machine learning text classifiers (e.g., BERT or RoBERTa, which are trained on the construction domain) to more accurately identify the contextual meaning of ambiguous terms, such as “integration”. Second, positional weighting should be implemented so that keywords in titles and abstracts are given more weight than those in the body of the text. This reflects the observed variation in false positive rates by position. Third, compound phrase matching should prioritize multi-word phrases (“system integration”, “digital ecosystem integration”, etc.) over single-word detection to improve precision without sacrificing recall. Fourth, a domain-specific thesaurus should be developed to link synonymous terms across disciplines. For example, organizational behavior researchers may use “implementation readiness”, while AI researchers use “system integration”.
References
- Barbosa, F.; Woetzel, J.; Mischke, J. Reinventing Construction: A Route of Higher Productivity; McKinsey Global Institute: New York, NY, USA, 2017. [Google Scholar]
- Regona, M.; Yigitcanlar, T.; Xia, B.; Li, R.Y.M. Opportunities and adoption challenges of AI in the construction industry: A PRISMA review. J. Open Innov. Technol. Mark. Complex. 2022, 8, 45. [Google Scholar] [CrossRef] [Scilit]
- Obi, L.; Osuizugbo, I.C.; Awuzie, B.O. Closing the artificial intelligence skills gap in construction: Competency insights from a systematic review. Results Eng. 2025, 27, 106406. [Google Scholar] [CrossRef] [Scilit]
- Boje, C.; Guerriero, A.; Kubicki, S.; Rezgui, Y. Towards a semantic Construction Digital Twin: Directions for future research. Autom. Constr. 2020, 114, 103179. [Google Scholar] [CrossRef] [Scilit]
- Venkatesh, V.; Morris, M.G.; Davis, G.B.; Davis, F.D. User acceptance of information technology: Toward a unified view. MIS Q. 2003, 27, 425–478. [Google Scholar] [CrossRef] [Scilit]
- Rogers, E.M.; Singhal, A.; Quinlan, M.M. Diffusion of Innovations. In An Integrated Approach to Communication Theory and Research, 3rd ed.; Stacks, D.W., Salwen, M.B., Eichhorn, K.C., Eds.; Routledge: New York, NY, USA, 2019; pp. 432–448. [Google Scholar]
- Ibitoye, N.S.; Abass, O.K.; Onabote, E.J.; Kolawole, A.; Daser-Adams, J.L. Artificial Intelligence in the Construction Industry: A Systematic Review of Emerging Opportunities and Prevailing Challenges. NIPES-J. Sci. Technol. Res. 2025, 7, 1781–1791. [Google Scholar] [CrossRef] [Scilit]
- Royal Institution of Chartered Surveyors (RICS). Artificial Intelligence in Construction: Global Survey Report. RICS Research. 2025. Available online: https://www.rics.org/news-insights/artificial-intelligence-in-construction-report/ (accessed on 23 October 2025).
- Mishra, A.; Hasan, A.; Jha, K.N. A Holistic Evaluation of BIM Implementation Barriers in the Indian Construction Industry: Pre- and Post-Adoption Perspectives. Int. J. Constr. Educ. Res. 2024, 20, 358–380. [Google Scholar] [CrossRef] [Scilit]
- Nnaji, C.; Karakhan, A.A. Technologies for safety and health management in construction: Current use, implementation benefits and limitations, and adoption barriers. J. Build. Eng. 2020, 29, 101212. [Google Scholar] [CrossRef] [Scilit]
- Bidhendi, A.; Poshdar, M.; Babaeian Jelodar, M.; Hamzeh, F. Enabling Lean Construction 4.0 through human-centric digital transformation: Organisational leadership insights. Eng. Constr. Archit. Manag. 2025, 32, 985–1011. [Google Scholar] [CrossRef] [Scilit]
- Zhou, Z.; Su, Y.; Luo, J.; Chen, W. Analysis of factors of willingness to adopt intelligent construction technology in highway construction enterprises. Sci. Rep. 2023, 13, 19339. [Google Scholar] [CrossRef] [Scilit]
- Liu, X.; Antwi-Afari, M.F.; Li, J.; Zhang, Y.; Manu, P. BIM, IoT, and GIS integration in construction resource monitoring. Autom. Constr. 2025, 174, 106149. [Google Scholar] [CrossRef] [Scilit]
- Revolti, A.; Gualtieri, L.; Pauwels, P.; Dallasega, P. From building information modeling to construction digital twin: A conceptual framework. Prod. Manuf. Res. 2024, 12, 2387679. [Google Scholar] [CrossRef] [Scilit]
- Samuelson, O.; Stehn, L. Digital transformation in construction—A review. J. Inf. Technol. Constr. 2023, 28, 385–404. [Google Scholar] [CrossRef] [Scilit]
- Daniel, E.I.; Oshodi, O.S.; Nwankwo, N.; Emuze, F.A.; Chinyio, E. Barriers to the Application of Digital Technologies in Construction Health and Safety: A Systematic Review. Buildings 2024, 14, 2386. [Google Scholar] [CrossRef] [Scilit]
- Clegg, C.W. Sociotechnical principles for system design. Appl. Ergon. 2000, 31, 463–477. [Google Scholar] [CrossRef] [Scilit]
- Krizhevsky, A.; Sutskever, I.; Hinton, G.E. ImageNet classification with deep convolutional neural networks. Commun. ACM 2017, 60, 84–90. [Google Scholar] [CrossRef] [Scilit]
- Orlikowski, W.J.; Iacono, C.S. Research commentary: Desperately seeking the “IT” in IT research—A call to theorizing the IT artifact. Inf. Syst. Res. 2001, 12, 121–134. [Google Scholar] [CrossRef] [Scilit]
- Wang, R.Y.; Strong, D.M. Beyond accuracy: What data quality means to data consumers. J. Manag. Inf. Syst. 1996, 12, 5–33. [Google Scholar] [CrossRef] [Scilit]
- Succar, B. Building information modelling framework: A research and delivery foundation for industry stakeholders. Autom. Constr. 2009, 18, 357–375. [Google Scholar] [CrossRef] [Scilit]
- Sacks, R.; Eastman, C.; Lee, G.; Teicholz, P. BIM Handbook: A Guide to Building Information Modeling for Owners, Managers, Designers, Engineers and Contractors, 3rd ed.; Wiley: Hoboken, NJ, USA, 2018. [Google Scholar]
- Zha, D.; Bhat, Z.P.; Lai, K.H.; Yang, F.; Hu, X. Data-Centric AI: Perspectives and Challenges. In Proceedings of the 2023 SIAM International Conference on Data Mining (SDM), Minneapolis, MN, USA, 27–29 April 2023; pp. 1–5. [Google Scholar] [CrossRef] [Scilit]
- Dallasega, P.; Rauch, E.; Linder, C. Industry 4.0 as an enabler of proximity for construction supply chains: A systematic literature review. Comput. Ind. 2018, 99, 205–225. [Google Scholar] [CrossRef] [Scilit]
- Oesterreich, T.D.; Teuteberg, F. Understanding the implications of digitisation and automation in the context of Industry 4.0: A triangulation approach and elements of a research agenda for the construction industry. Comput. Ind. 2016, 83, 121–139. [Google Scholar] [CrossRef] [Scilit]
- Ghimire, P.; Kim, K.; Acharya, M. Opportunities and Challenges of Generative AI in Construction Industry: Focusing on Adoption of Text-Based Models. Buildings 2024, 14, 220. [Google Scholar] [CrossRef] [Scilit]
- Grieves, M.; Vickers, J. Digital Twin: Mitigating Unpredictable, Undesirable Emergent Behavior in Complex Systems. In Transdisciplinary Perspectives on Complex Systems; Kahlen, F.J., Flumerfelt, S., Alves, A., Eds.; Springer: Cham, Switzerland, 2017; pp. 85–113. [Google Scholar] [CrossRef] [Scilit]
- Trist, E.L.; Bamforth, K.W. Some social and psychological consequences of the Longwall Method of coal-getting. Hum. Relat. 1951, 4, 3–38. [Google Scholar] [CrossRef] [Scilit]
- Pan, Y.; Zhang, L. Roles of artificial intelligence in construction engineering and management: A critical review and future trends. Autom. Constr. 2021, 122, 103517. [Google Scholar] [CrossRef] [Scilit]
- Abioye, S.O.; Oyedele, L.O.; Akanbi, L.; Ajayi, A.; Davila Delgado, J.M.; Bilal, M.; Akinade, O.O.; Ahmed, A. Artificial intelligence in the construction industry: A review of present status, opportunities and future challenges. J. Build. Eng. 2021, 44, 103299. [Google Scholar] [CrossRef] [Scilit]
- Blanco, J.L.; Fuchs, S.; Parsons, M.; Ribeirinho, M.J. Artificial intelligence: Construction technology’s next frontier. Build. Econ. 2018, 7–13. [Google Scholar]
- You, K.; Zhou, C.; Ding, L. Deep learning technology for construction machinery and robotics. Autom. Constr. 2023, 150, 104852. [Google Scholar] [CrossRef] [Scilit]
- Akinosho, T.D.; Oyedele, L.O.; Bilal, M.; Ajayi, A.O.; Delgado, M.D.; Akinade, O.O.; Ahmed, A.A. Deep learning in the construction industry: A review of present status and future innovations. J. Build. Eng. 2020, 32, 101827. [Google Scholar] [CrossRef] [Scilit]
- Darko, A.; Chan, A.P.C.; Adabre, M.A.; Edwards, D.J.; Hosseini, M.R.; Ameyaw, E.E. Artificial intelligence in the AEC industry: Scientometric analysis and visualization of research activities. Autom. Constr. 2020, 112, 103081. [Google Scholar] [CrossRef] [Scilit]
- Ahmed, S. Barriers to implementation of building information modeling (BIM) to the construction industry: A review. J. Civ. Eng. Constr. 2018, 7, 107–113. [Google Scholar] [CrossRef] [Scilit]
- Bosch-Sijtsema, P.; Isaksson, A.; Lennartsson, M.; Linderoth, H.C.J. Barriers and facilitators for BIM use among Swedish medium-sized contractors—“We wait until someone tells us to use it”. Vis. Eng. 2017, 5, 3. [Google Scholar] [CrossRef] [Scilit]
- Hamledari, H.; Fischer, M. Role of blockchain-enabled smart contracts in automating construction progress payments. J. Leg. Aff. Disput. Resolut. Eng. Constr. 2021, 13, 04520038. [Google Scholar] [CrossRef] [Scilit]
- BuiltWorlds. 2025 AI: Challenges, Perceptions, & Future Outlook Tech Specialty Report; BuiltWorlds: Chicago, IL, USA, 2025; Available online: https://builtworlds.com/insights/2025-ai-challenges-perceptions-future-outlook-tech-specialty-report/ (accessed on 12 April 2026).
- Dodge Construction Network; CMiC. AI for Contractors: SmartMarket Brief; Dodge Construction Network: Hamilton, NJ, USA, 2025; Available online: https://www.construction.com/resource/ai-for-contractors/ (accessed on 12 April 2026).
- Priem, J.P.; Piwowar, H.A.; Orr, R. OpenAlex: A Fully-Open Index of Scholarly Works, Authors, Venues, Institutions, and Concepts. In Proceedings of the 26th International Conference on Science and Technology Indicators (STI 2022), Granada, Spain, 7–9 September 2022. [Google Scholar]
- Culbert, J.H.; Hobert, A.; Jahn, N.; Haupka, N.; Schmidt, M.; Donner, P.; Mayr, P. Reference Coverage Analysis of OpenAlex Compared to Web of Science and Scopus. Scientometrics 2025, 130, 2475–2492. [Google Scholar] [CrossRef] [Scilit]
- Borrego, Á.; Urbano, C. OpenAlex: Features, Advantages and Limitations of an Open Database for Retrieving and Analysing Scholarly Outputs. arXiv 2025, arXiv:2512.16434. [Google Scholar] [CrossRef] [Scilit]
- OECD/JRC. Handbook on Constructing Composite Indicators: Methodology and User Guide; OECD Publishing: Paris, France, 2008. [Google Scholar]
- Cohen, J. Statistical Power Analysis for the Behavioral Sciences, 2nd ed.; Lawrence Erlbaum Associates: Hillsdale, NJ, USA, 1988. [Google Scholar]
- Abdel-Wahab, M.; Vogl, B. Trends of productivity growth in the construction industry across Europe, US and Japan. Constr. Manag. Econ. 2011, 29, 635–644. [Google Scholar] [CrossRef] [Scilit]
- Goolsbee, A.; Syverson, C. The Strange and Awful Path of Productivity in the US Construction Sector; NBER Working Paper No. 30845; National Bureau of Economic Research: Cambridge, MA, USA, 2023. [Google Scholar]
- Bühler, M.M.; Nübel, K.; Jelinek, T.; Köhler, L.; Hollenbach, P. Bridging the Construction Productivity Gap—A Hierarchical Framework for the Age of Automation, Robotics, and AI. Buildings 2025, 15, 2899. [Google Scholar] [CrossRef] [Scilit]
- Green, S.D. Modern methods of construction: Reflections on the current research agenda. Build. Cities 2022, 3, 653–662. [Google Scholar] [CrossRef] [Scilit]
- Li, H.; Zhang, Y.; Cao, Y.; Zhao, J.; Zhao, Z. Applications of artificial intelligence in the AEC industry: A review and future outlook. J. Asian Archit. Build. Eng. 2025, 24, 1672–1688. [Google Scholar] [CrossRef] [Scilit]
- Valdebenito, R.; Forcael, E. Integrating Artificial Intelligence and BIM in Construction: Systematic Review and Quantitative Comparative Analysis. Appl. Sci. 2025, 15, 12470. [Google Scholar] [CrossRef] [Scilit]
- Nnaji, C.; Okpala, I.; Awolusi, I.; Gambatese, J. A systematic review of technology acceptance models and theories in construction research. J. Inf. Technol. Constr. 2023, 28, 59–69. [Google Scholar] [CrossRef] [Scilit]
- Davis, F.D. Perceived usefulness, perceived ease of use, and user acceptance of information technology. MIS Q. 1989, 13, 319–340. [Google Scholar] [CrossRef] [Scilit]
- Perera, S.; Jin, X.; Samaratunga, M.; Gunasekara, K. Drivers and barriers to digitalisation: A cross-analysis of the views of designers and builders in the construction industry. J. Inf. Technol. Constr. 2023, 28, 87–106. [Google Scholar] [CrossRef] [Scilit]
- Maskuriy, R.; Selamat, A.; Ali, K.N.; Maresova, P.; Krejcar, O. Industry 4.0 for the construction industry—How ready is the industry? Appl. Sci. 2019, 9, 2819. [Google Scholar] [CrossRef] [Scilit]
- Karmakar, A.; Delhi, V.S.K. Construction 4.0: What we know and where we are headed? J. Inf. Technol. Constr. 2021, 26, 526–545. [Google Scholar] [CrossRef] [Scilit]
- Lin, Z. AI-Enabled Digital Transformation in the Construction Industry. In Proceedings of the 2025 8th International Conference on Computer Information Science and Artificial Intelligence (CISAI), Wuhan, China, 12–14 September 2025; pp. 1280–1285. [Google Scholar] [CrossRef] [Scilit]
- Gong, Y.; Liu, G.; Xue, Y.; Li, R.; Meng, L. A survey on dataset quality in machine learning. Inf. Softw. Technol. 2023, 162, 107268. [Google Scholar] [CrossRef] [Scilit]
- Steuer, D.; Lauble, S.; Gerber, H.B.; Haghsheno, S. Challenges in Collecting and Managing Data for AI Application in Small and Medium-Sized Construction Enterprises. In Proceedings of the 2023 European Conference on Computing in Construction (EC3 2023), Heraklion, Greece, 10–12 July 2023. [Google Scholar]
- Chaabene, W.B.; Flah, M.; Nehdi, M.L. Machine learning prediction of mechanical properties of concrete: Critical review. Constr. Build. Mater. 2020, 260, 119889. [Google Scholar] [CrossRef] [Scilit]
- Dodampegama, S.; Shehata, M.; Bojes, D. Revolutionizing construction and demolition waste sorting: Insights from artificial intelligence and robotic applications. Resour. Conserv. Recycl. 2024, 202, 107375. [Google Scholar] [CrossRef] [Scilit]
- Lee, S.M.; Lee, D.; Kim, Y.S. The quality management ecosystem for predictive maintenance in the Industry 4.0 era. Int. J. Qual. Innov. 2019, 5, 4. [Google Scholar] [CrossRef] [Scilit]
- Elbashbishy, T.; El-adaway, I. Assessing the Impact of Skilled Labor Shortages on Project Cost Performance. In Proceedings of the Construction Research Congress 2024, Des Moines, IA, USA, 20–23 March 2024; pp. 361–370. [Google Scholar] [CrossRef] [Scilit]
- Dubois, A.; Gadde, L. The construction industry as a loosely coupled system: Implications for productivity and innovation. Constr. Manag. Econ. 2002, 20, 621–631. [Google Scholar] [CrossRef] [Scilit]
- Winch, G. Managing Construction Projects; John Wiley & Sons: Hoboken, NJ, USA, 2012. [Google Scholar]
- Moshood, T.D.; Rotimi, J.O.; Shahzad, W.; Bamgbade, J.A. Infrastructure digital twin technology: A new paradigm for future construction industry. Technol. Soc. 2024, 77, 102519. [Google Scholar] [CrossRef] [Scilit]
- Sawhney, A.; Riley, M.; Irizarry, J.; Pérez, C.T. A proposed framework for Construction 4.0 based on a review of literature. EPiC Ser. Built Environ. 2020, 1, 301–309. [Google Scholar]
- Delhi, V.S.K.; Sankarlal, T.; Thomas, A. Detection of personal protective equipment (PPE) compliance on construction site using computer vision based deep learning techniques. Front. Eng. Manag. 2020, 6, 136. [Google Scholar] [CrossRef] [Scilit]
- De Soto, B.G.; Agustí-Juan, I.; Hunhevicz, J.; Joss, S.; Graser, K.; Habert, G.; Adey, B.T. Productivity of digital fabrication in construction: Cost and time analysis of a robotically built wall. Autom. Constr. 2018, 92, 297–311. [Google Scholar] [CrossRef] [Scilit]
- Hariri-Ardebili, M.A.; Mahdavi, G.; Nuss, L.K.; Lall, U. The role of artificial intelligence and digital technologies in dam engineering: Narrative review and outlook. Eng. Appl. Artif. Intell. 2023, 126, 106813. [Google Scholar] [CrossRef] [Scilit]
- Hirsch, J.E. An index to quantify an individual’s scientific research output. Proc. Natl. Acad. Sci. USA 2005, 102, 16569–16572. [Google Scholar] [CrossRef] [Scilit] [PubMed]
- Waltman, L.; Van Eck, N.J.; Noyons, E.C. A unified approach to mapping and clustering of bibliometric networks. J. Informetr. 2010, 4, 629–635. [Google Scholar] [CrossRef] [Scilit]
- Koskela, L. An Exploration Towards a Production Theory and Its Application to Construction; VTT Technical Research Centre of Finland: Espoo, Finland, 2000. [Google Scholar]
- Xu, Y.; Yeung, J.F.Y.; Chan, A.P.C.; Chan, D.W.M.; Wang, S.Q.; Ke, Y. Developing a risk assessment model for PPP projects in China—A fuzzy synthetic evaluation approach. Autom. Constr. 2010, 19, 929–943. [Google Scholar] [CrossRef] [Scilit]
- Construction Executive. New Survey Reveals Overwhelmingly Optimistic Results on the Use of AI in Construction. Available online: https://constructionexec.com/article/new-survey-reveals-overwhelmingly-optimistic-results-on-the-use-of-ai-in-construction/ (accessed on 17 April 2026).
- Landis, J.R.; Koch, G.G. The Measurement of Observer Agreement for Categorical Data. Biometrics 1977, 33, 159–174. [Google Scholar] [CrossRef] [Scilit]
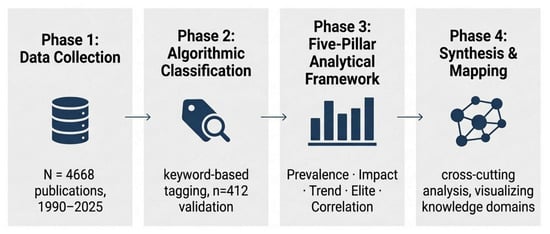
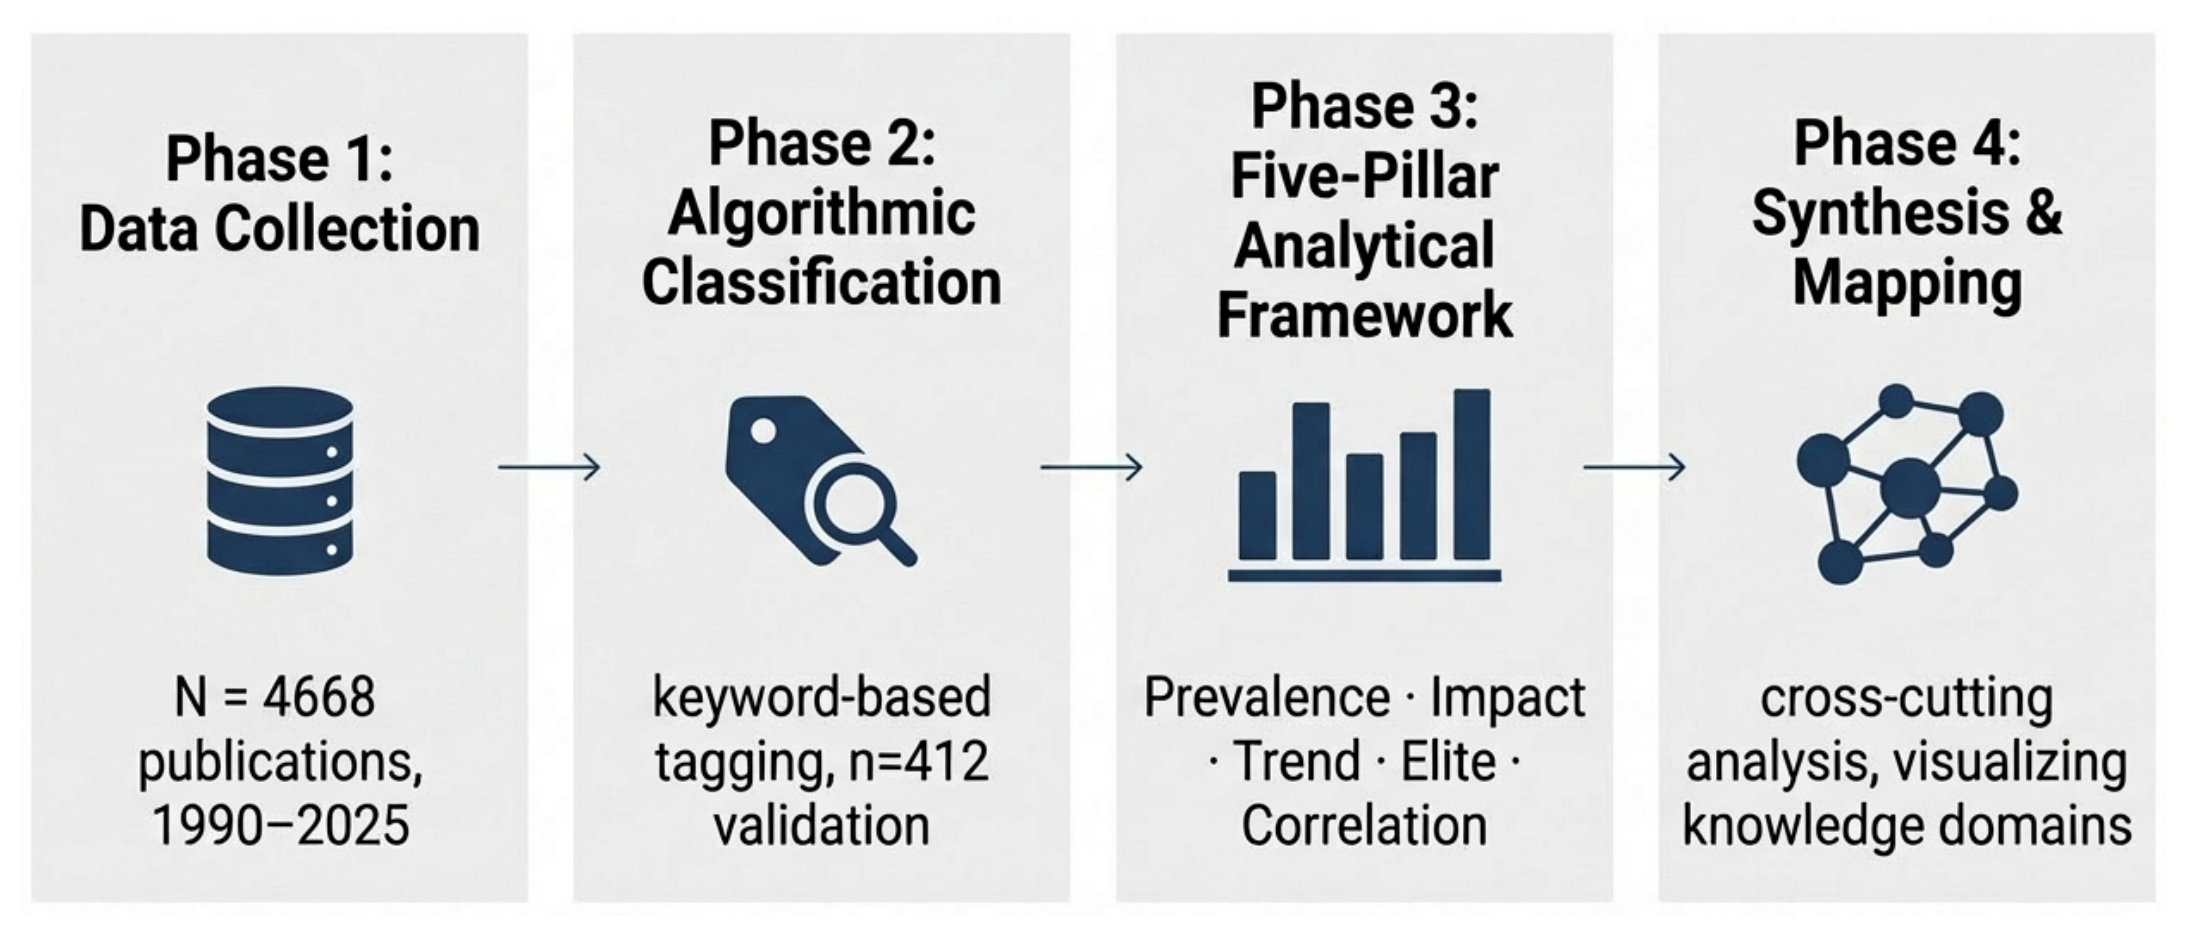
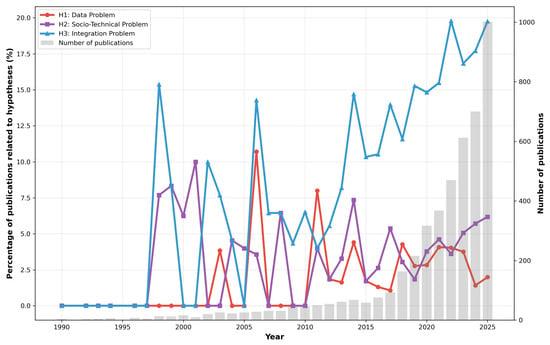
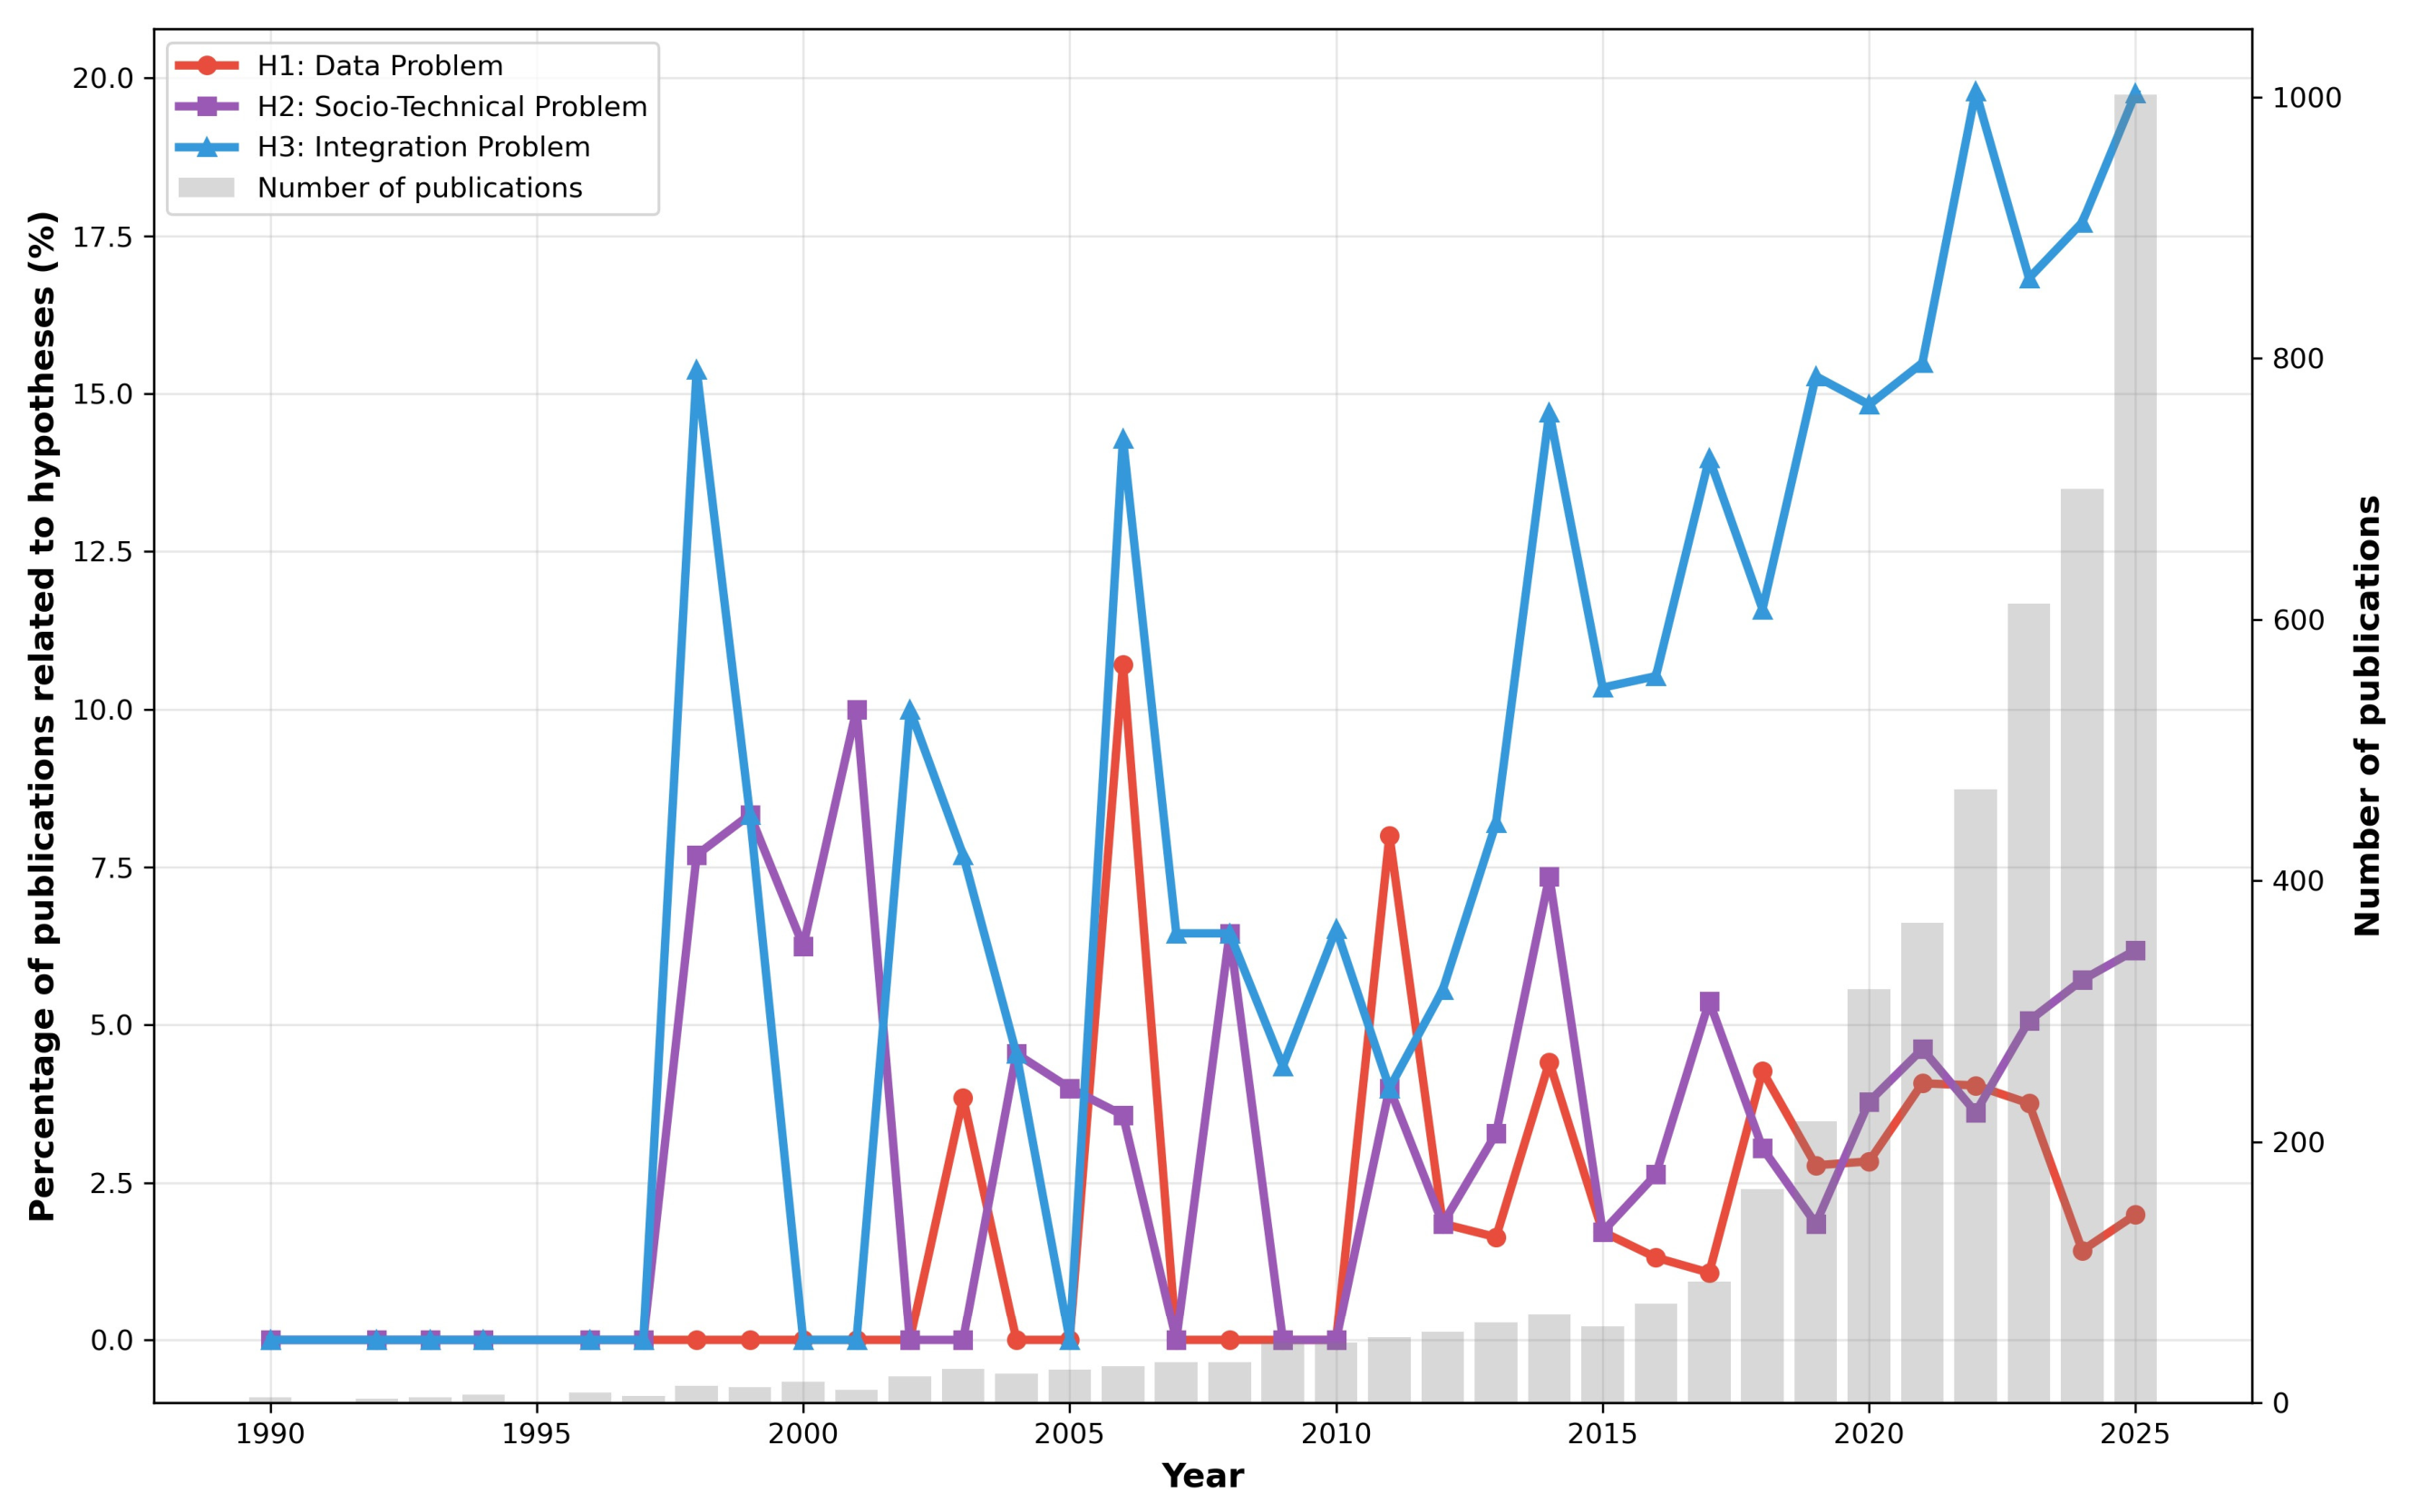
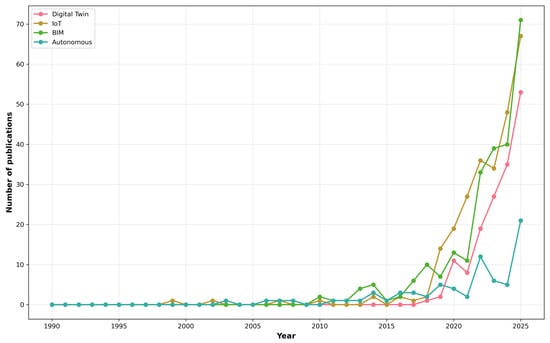
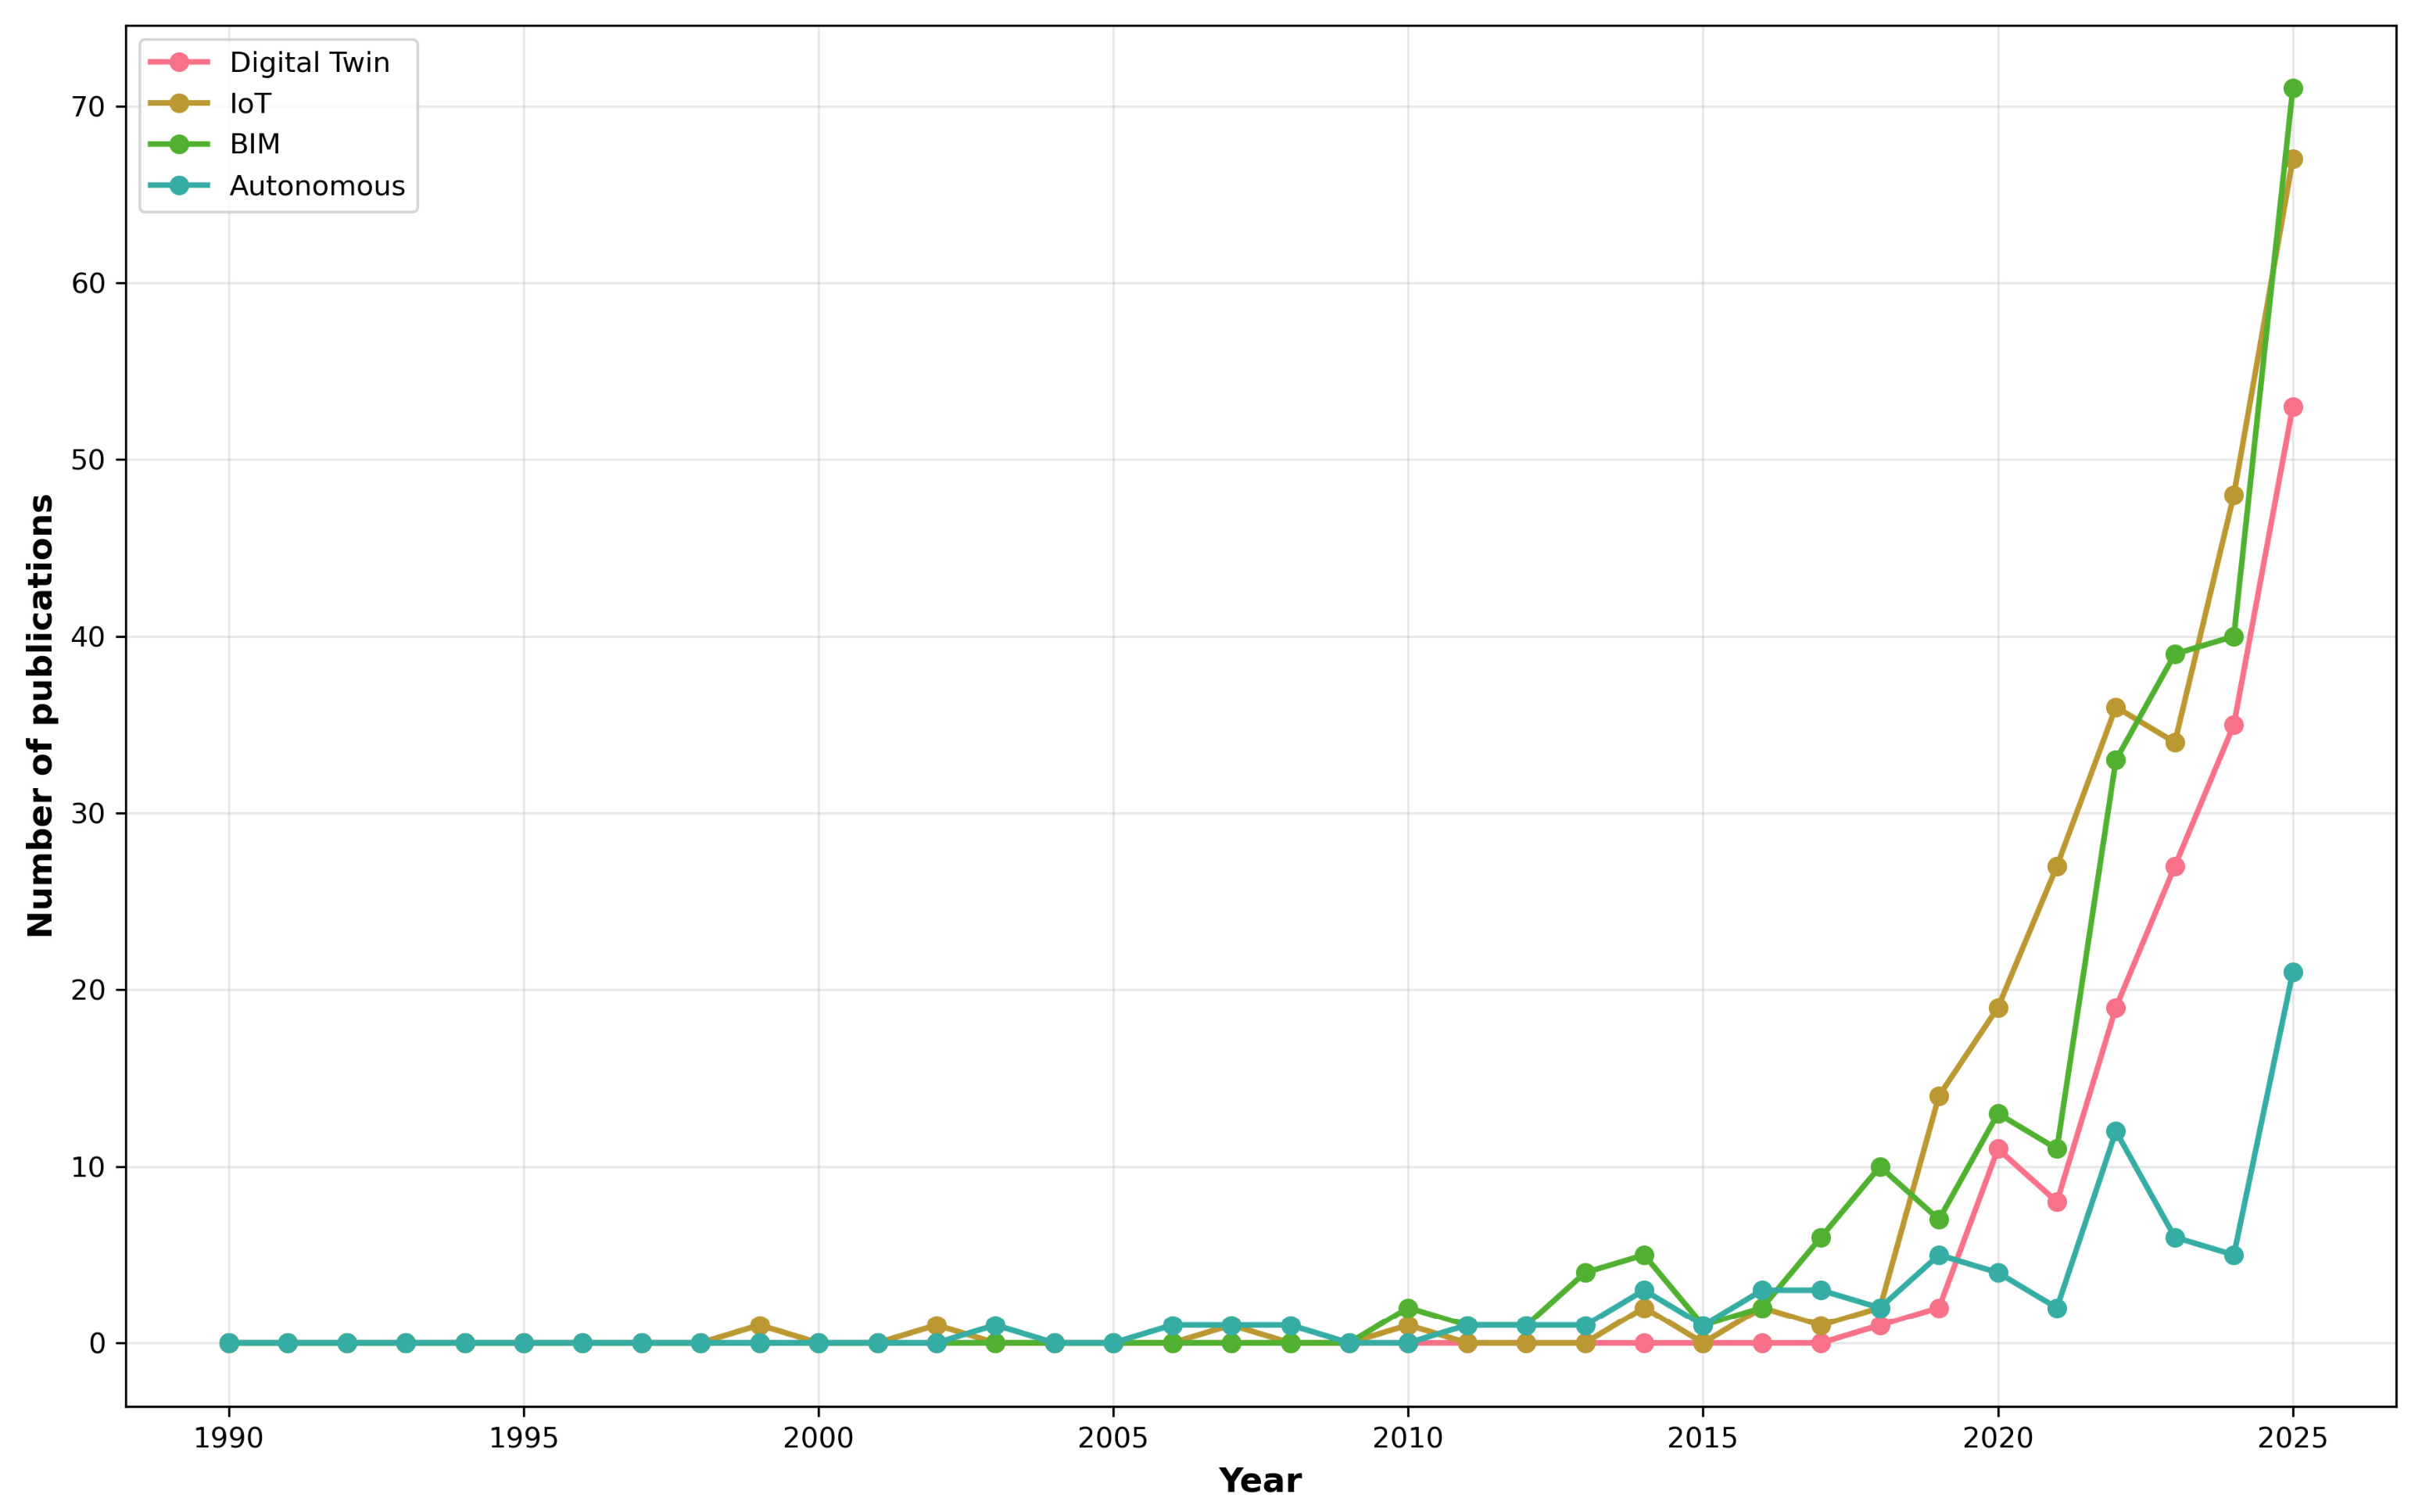
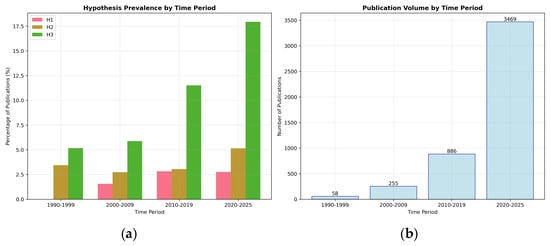
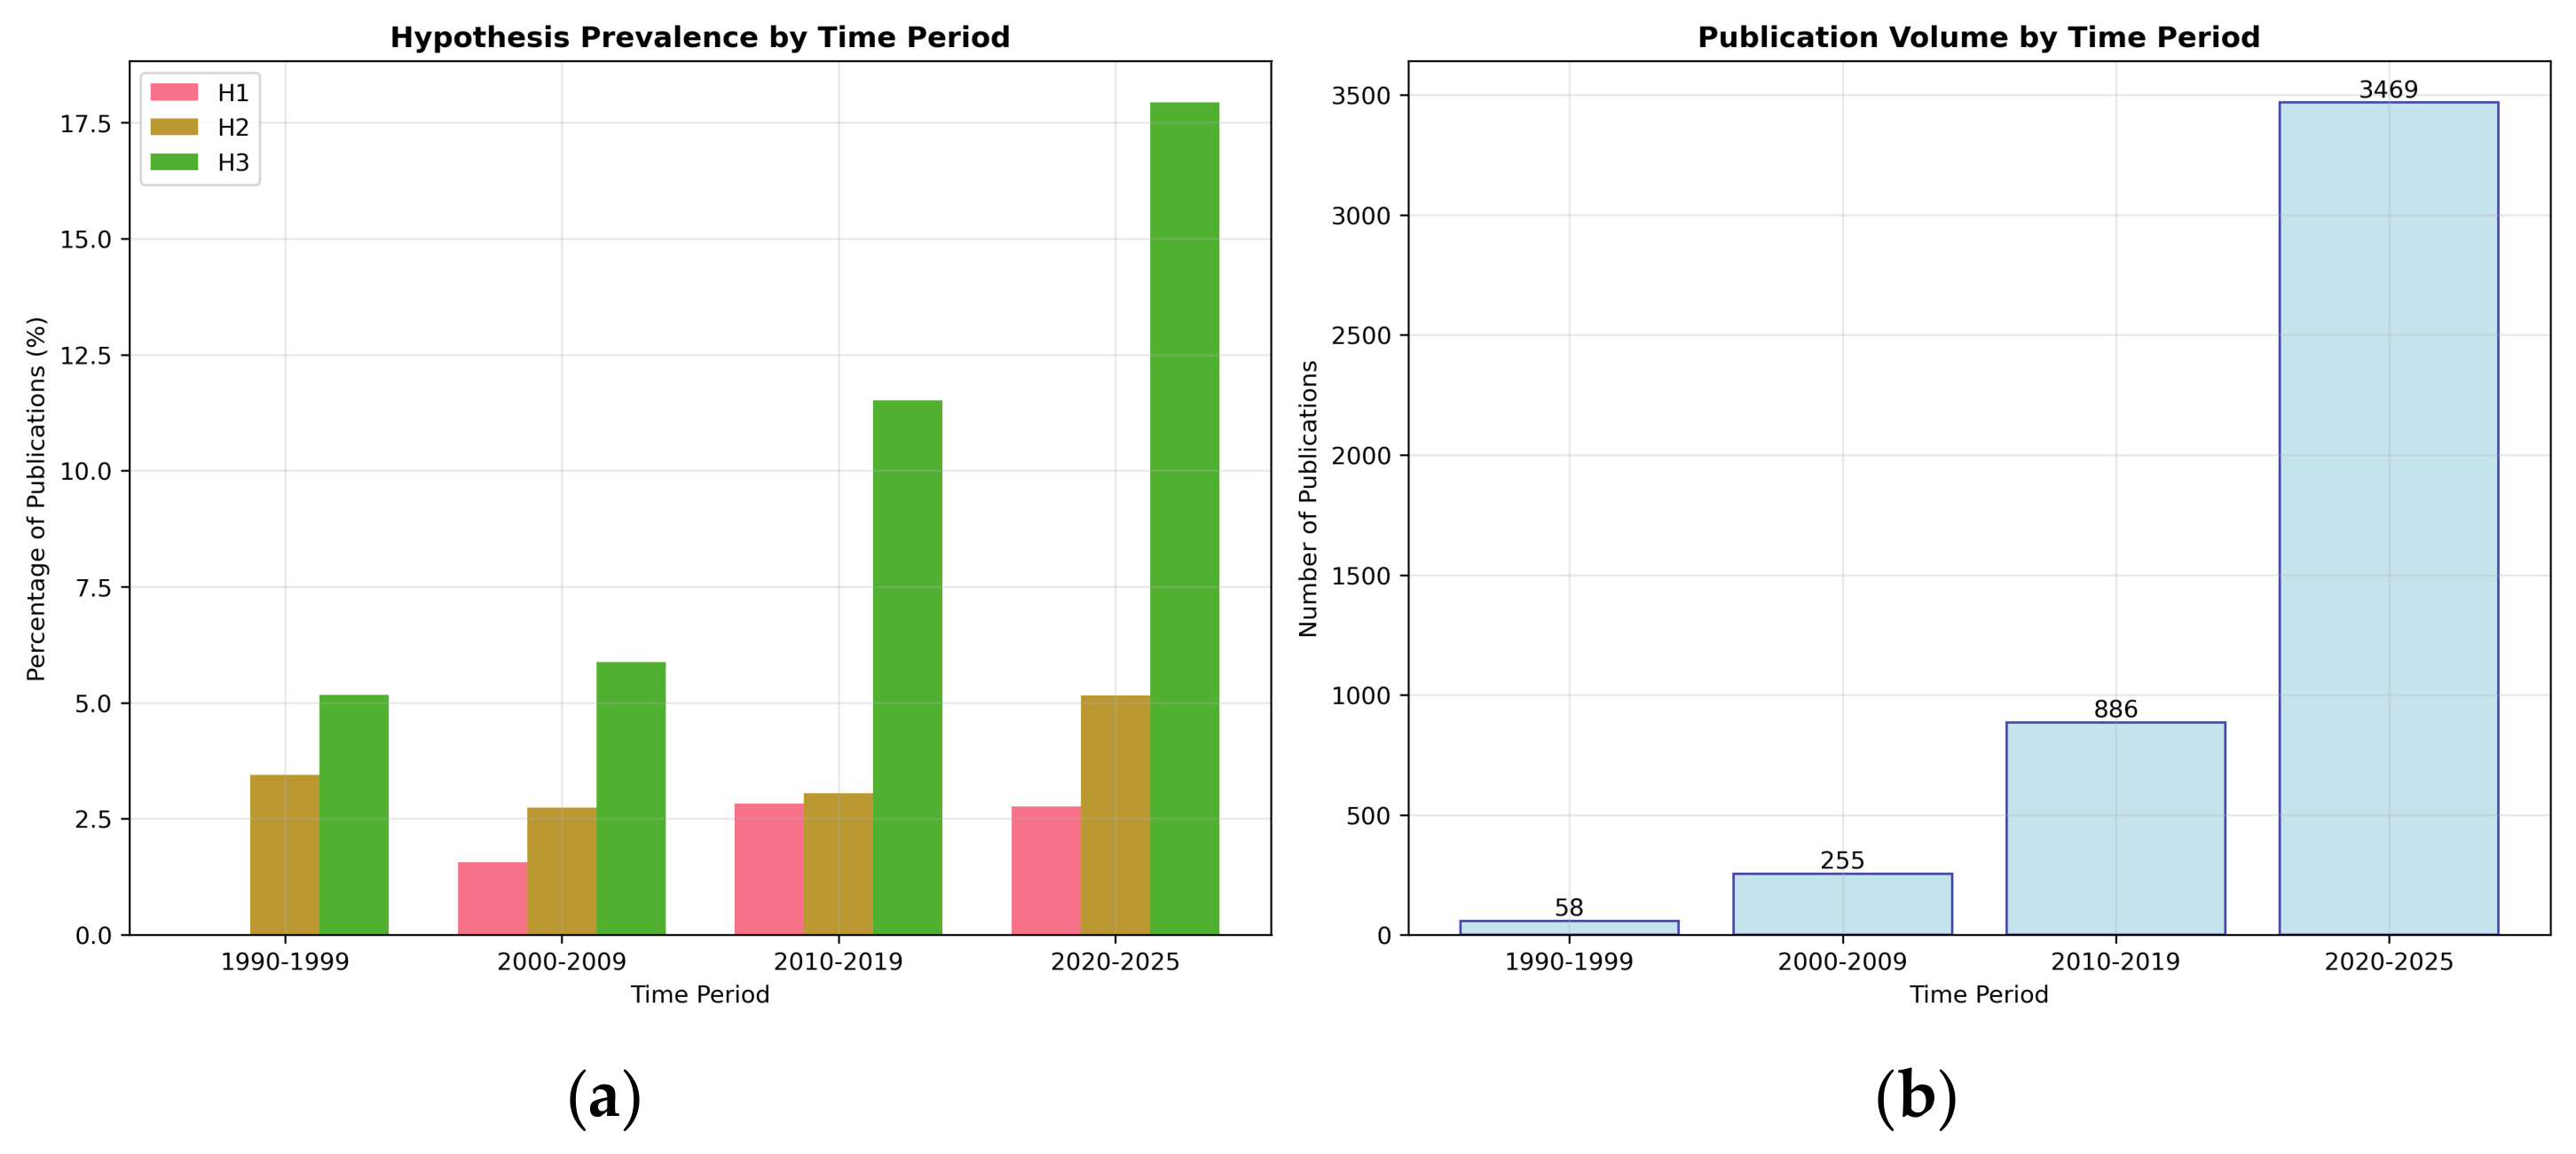
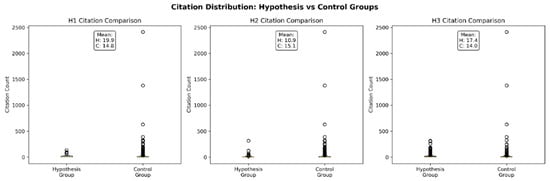
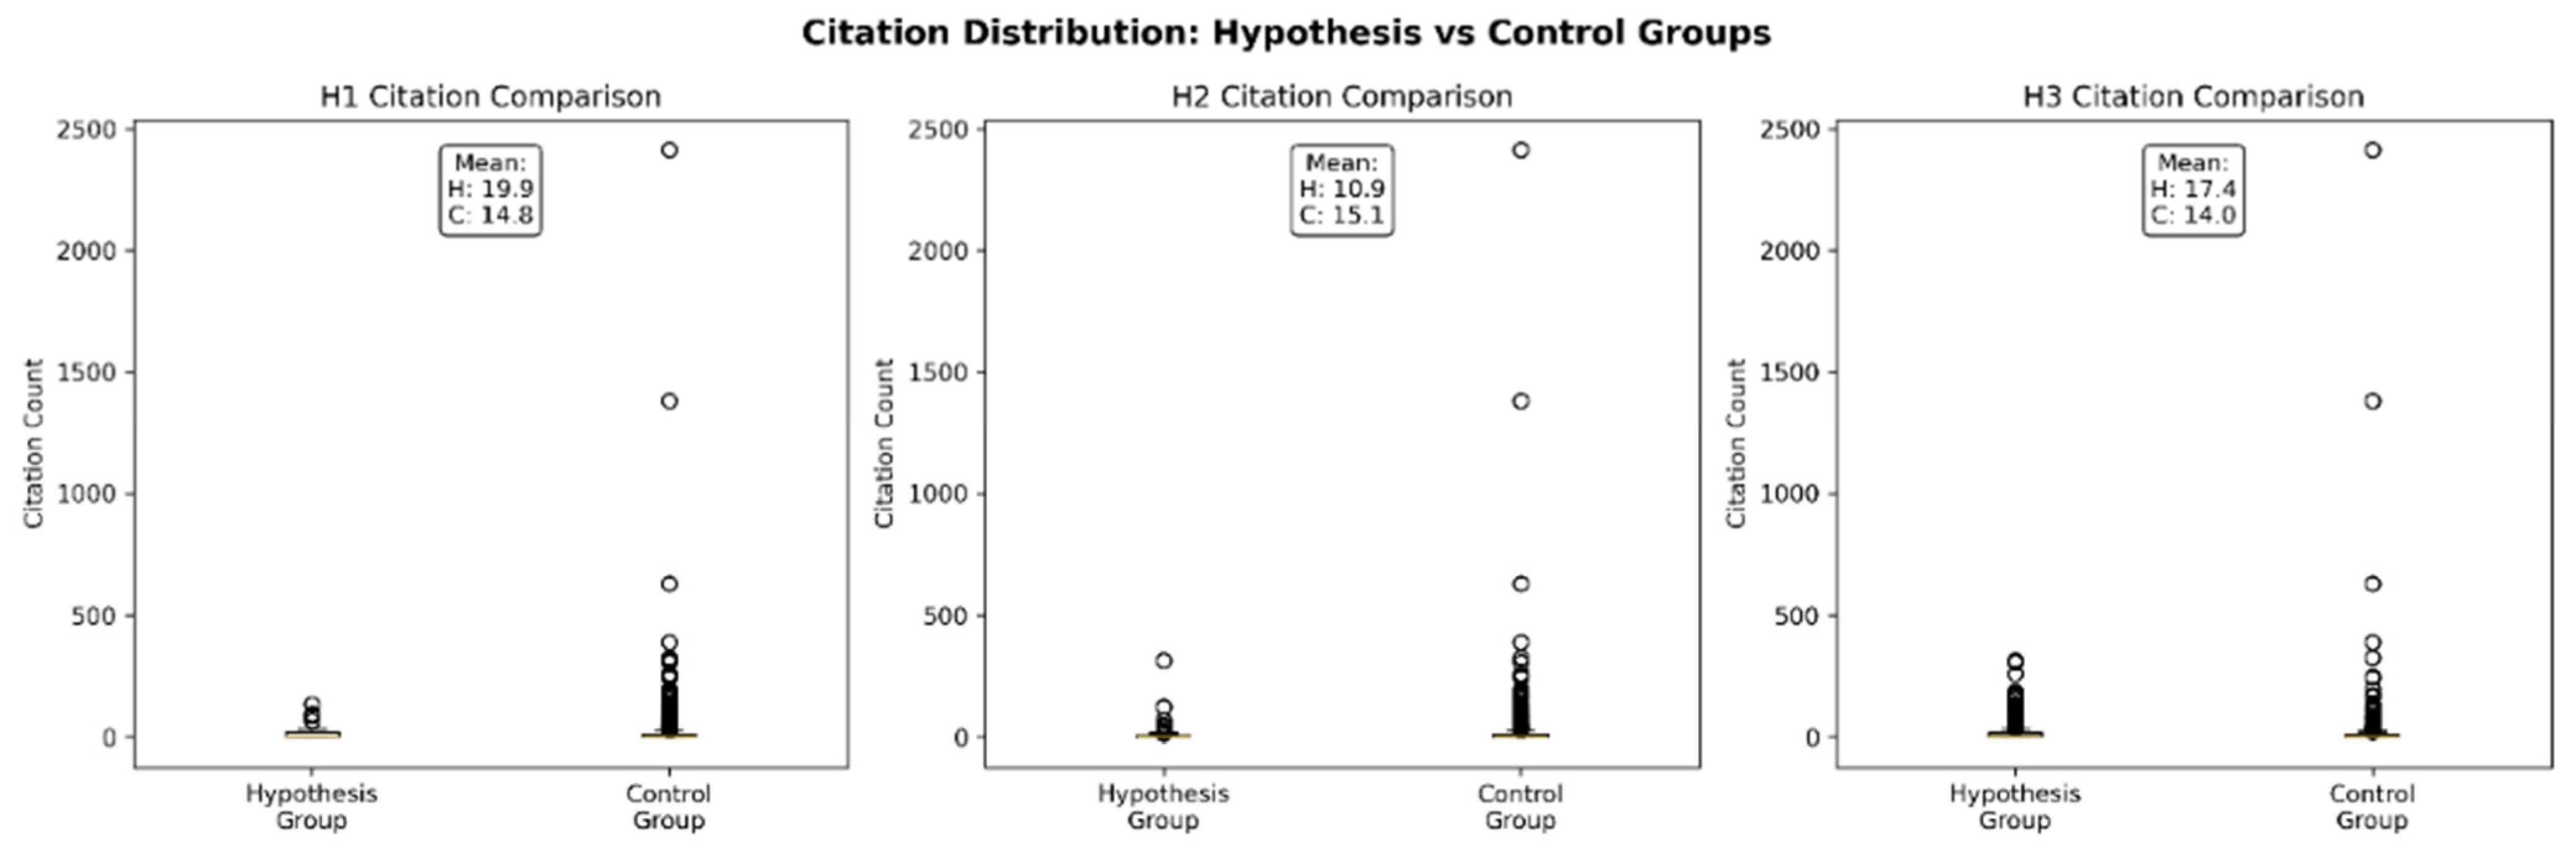
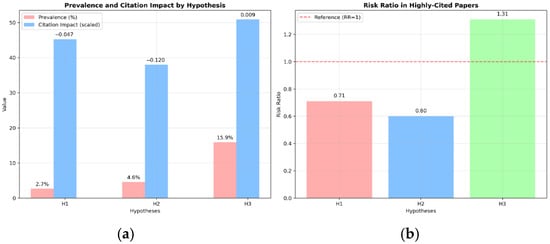
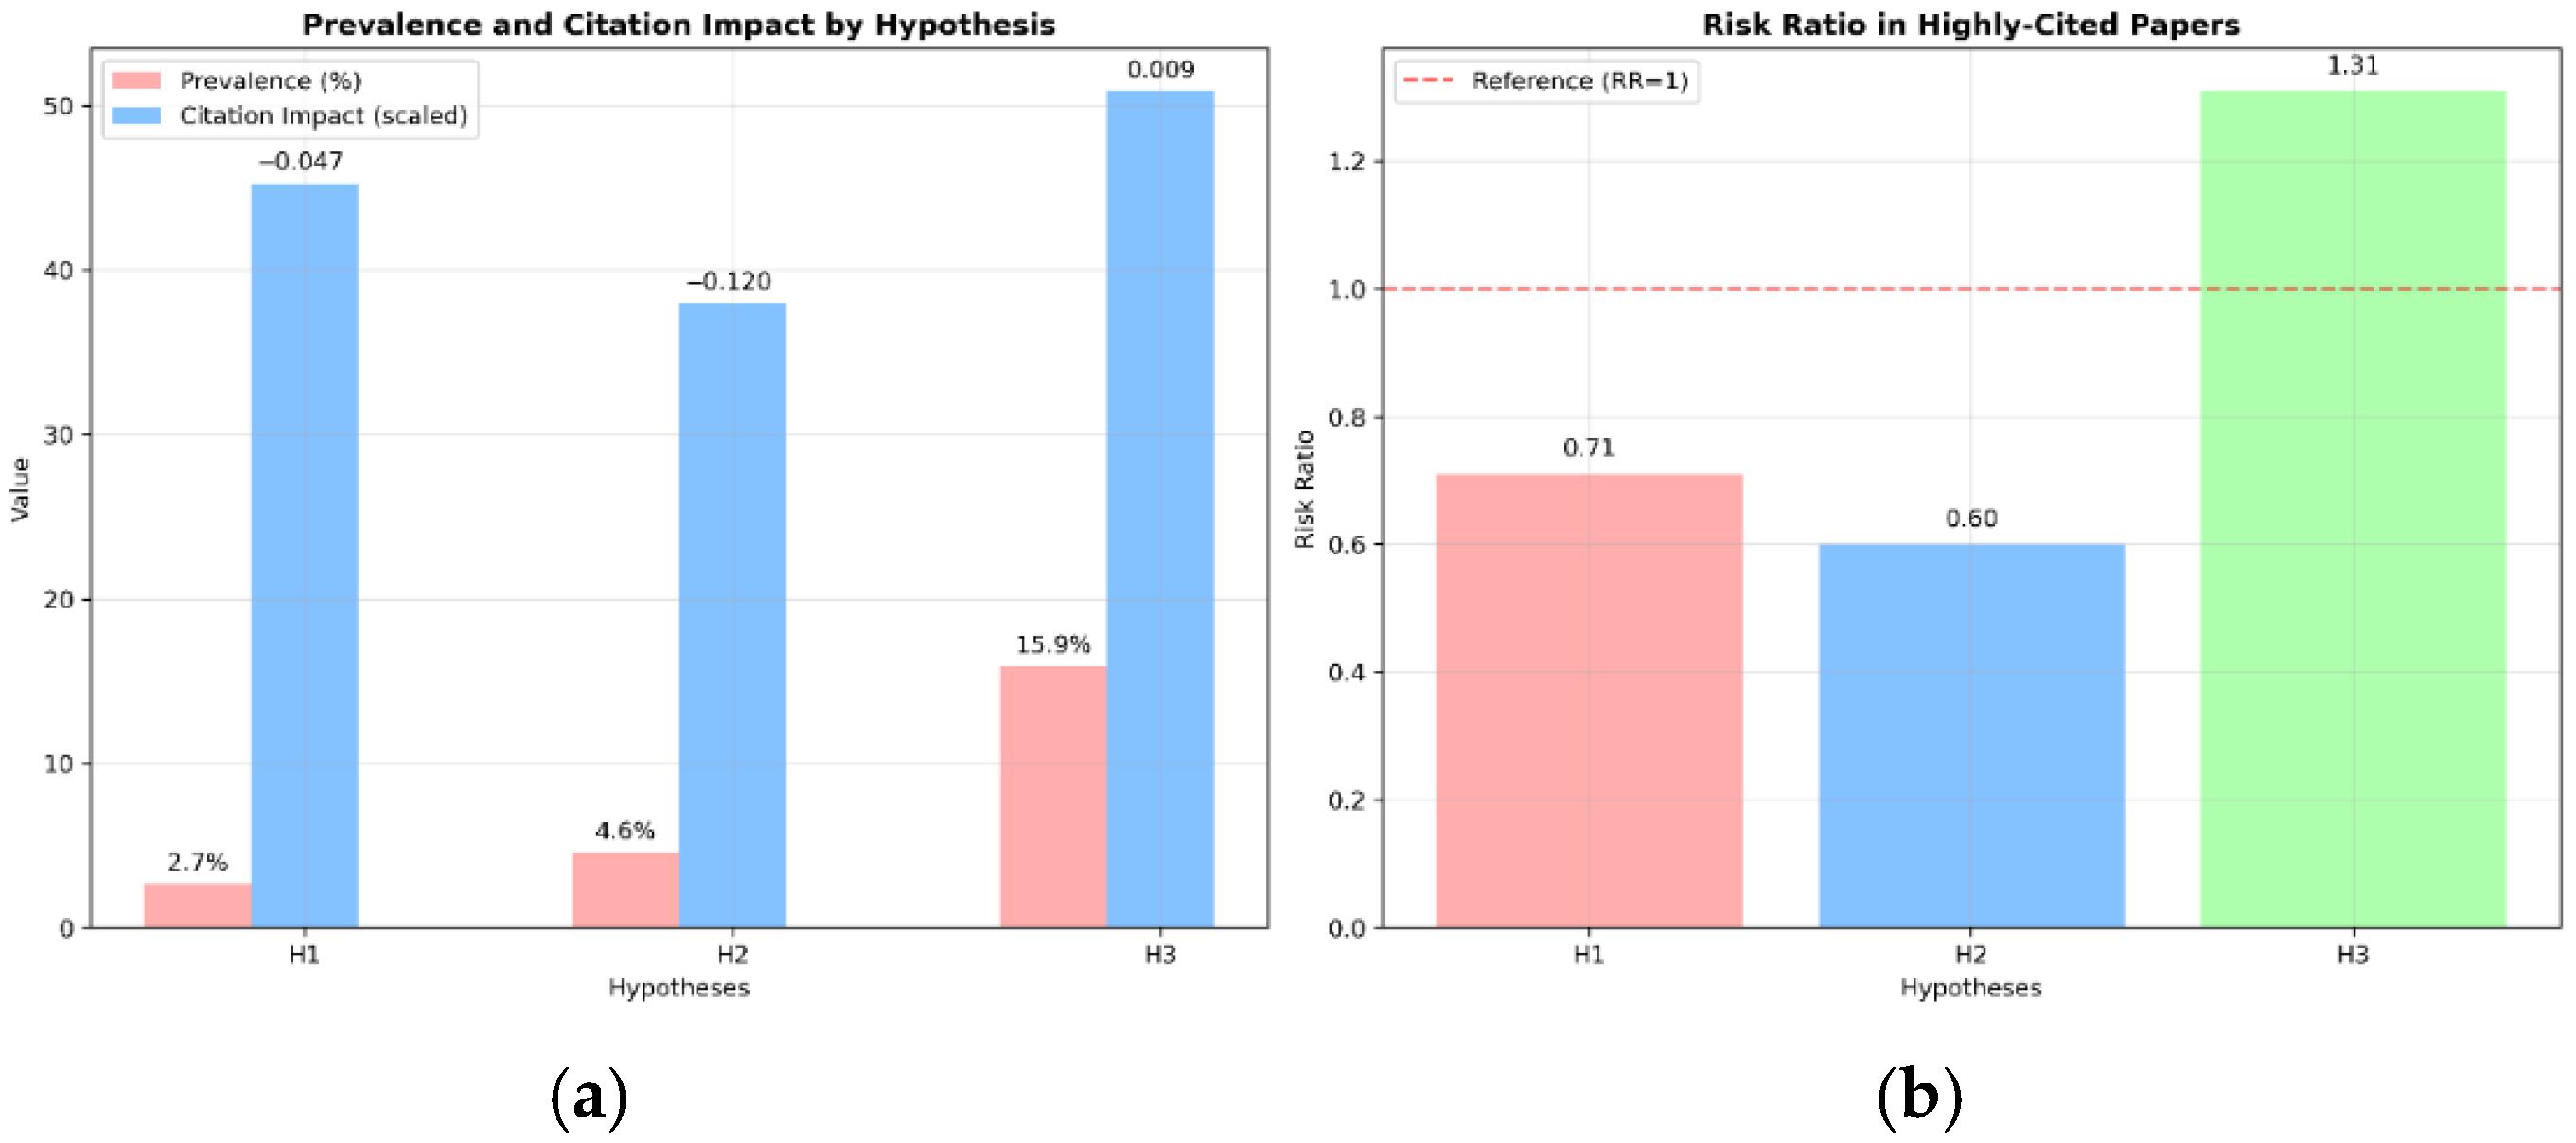
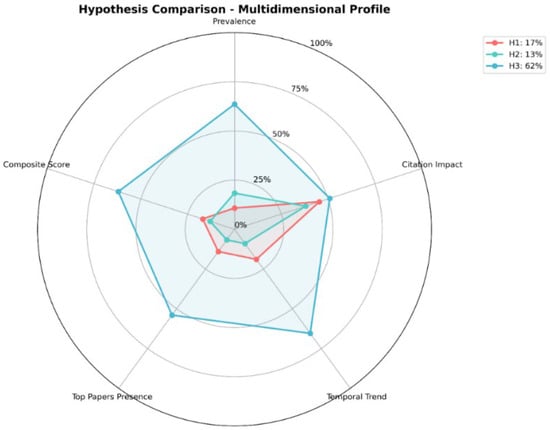
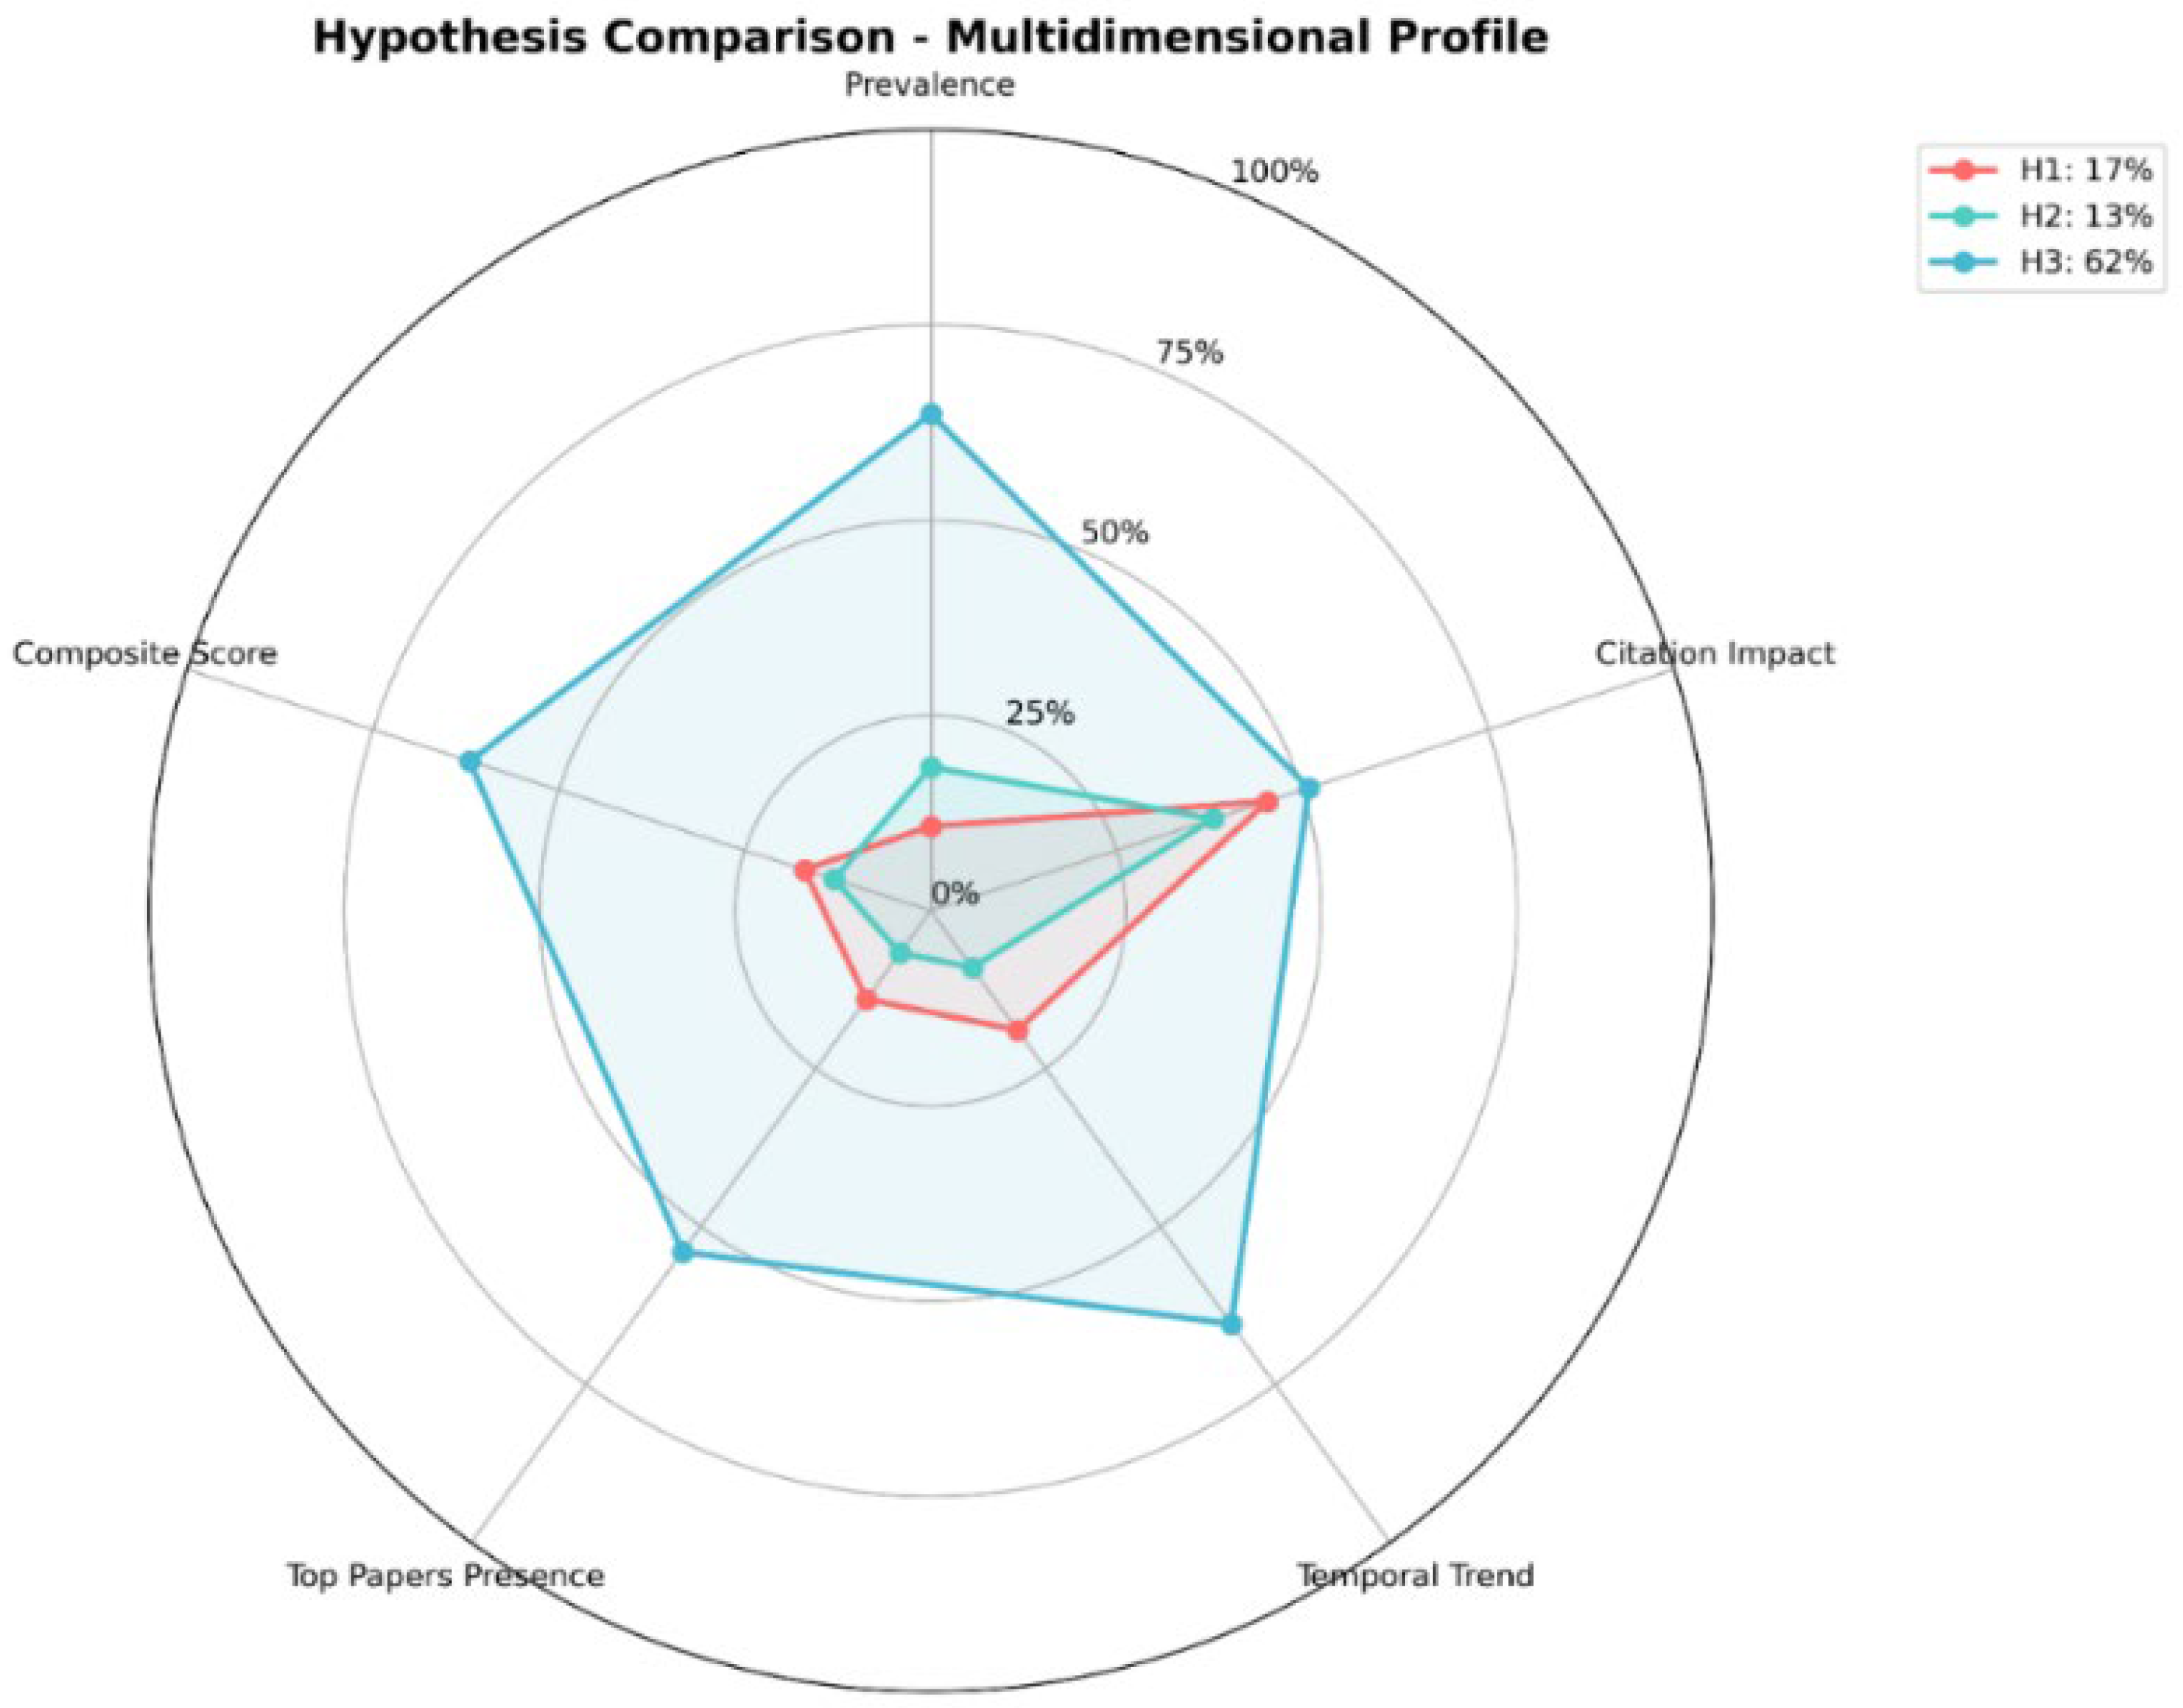

Disclaimer/Publisher’s Note: The statements, opinions and data contained in all publications are solely those of the individual author(s) and contributor(s) and not of MDPI and/or the editor(s). MDPI and/or the editor(s) disclaim responsibility for any injury to people or property resulting from any ideas, methods, instructions or products referred to in the content. |
© 2026 by the authors. Licensee MDPI, Basel, Switzerland. This article is an open access article distributed under the terms and conditions of the Creative Commons Attribution (CC BY) license.