Article

Spatial Flow Estimation Method Combining Space Syntax and Pedestrian Origin–Destination for Architectural Design Stage

1
College of Architecture, South China University of Technology, Guangzhou 510640, China
2
College of Architecture and Urban Planning, Shenzhen University, Shenzhen 518060, China
3
Benyuan Design Research Center, Shenzhen University, Shenzhen 518060, China
4
College of Civil and Transportation Engineering, Shenzhen University, Shenzhen 518060, China
*
Author to whom correspondence should be addressed.
Buildings 2026, 16(9), 1719; https://doi.org/10.3390/buildings16091719
Submission received: 18 February 2026 / Revised: 22 March 2026 / Accepted: 23 April 2026 / Published: 27 April 2026
(This article belongs to the Section Architectural Design, Urban Science, and Real Estate)

Abstract

With the continuous expansion of building scale and increasingly complex functions, pedestrian congestion within buildings has become increasingly prominent. To identify high-utilization spaces during the architectural design stage, so as to optimize the design at the source and effectively alleviate the risk of oversaturated spatial flow in super high-rise buildings, transportation hubs and other complex buildings, this paper investigates spatial flow estimation methods in the architectural design phase. First, based on detailed data from microscopic pedestrian simulation in buildings, this study conducts an in-depth analysis of the factors influencing spatial flow from the perspectives of spatial structure and pedestrian demand. Then, by incorporating the visual integration degree from space syntax and the proposed Origin-Destination (OD) influence range definition method that accounts for obstacle detours, a spatial utilization intensity index integrating both factors is developed. Furthermore, regression analysis is employed to achieve spatial flow estimation based on the constructed spatial utilization intensity index. Finally, taking the basement 1 floor of the Shenzhen Bay Super Headquarters Base C Tower connected with the metro as an example, the effectiveness of the proposed method is verified. The results show that the MAPE is 26%. This study provides an effective estimation method for the prediction of spatial flow in the architectural design stage.

1. Introduction

In the field of architecture, “spatial flow” is a core concept, which mainly refers to the total number of pedestrians passing through a specific area inside or around a building within a given time period. It is not only a key indicator for measuring the activity level of building usage, but also a core factor influencing architectural functional design, spatial layout, safety evacuation, and commercial value. At present, Chinese architecture presents the complex characteristics of large volume and comprehensive function, strong passenger flow adsorption capacity, and obvious pedestrian flow aggregation phenomena [1]. As of 2024, there are more than 900 super high-rise buildings over 200 m in China, of which 212 are in Shenzhen, ranking first in the world [2,3]. In super high-rise complex buildings, the phenomenon of human flow agglomeration caused by the morning and evening peaks is more obvious, especially in space areas such as important connecting passages and elevator waiting areas. For example, Shenzhen Ping An Financial Center covers an area of about 30,000 m2, with a total construction area of more than 600,000 square meters. Its weekday pedestrian flow is as high as 62,000 people, the waiting time in the elevator area often exceeds 15 min, the per capita space is less than 0.6 square meters, far lower than the 1.5–3.0 square meters recommended by the “Store Building Design Code,” and the space is seriously saturated.
At the same time, some buildings, such as transportation hubs and convention and exhibition centers, will also cause the agglomeration of people due to their functional characteristics, easily creating a bottleneck effect. In terms of Shenzhen as a whole, in 2024, the city’s urban rail transit passenger traffic reached 11.88 million passengers in a single day, and the total number of passengers in the whole year reached 3.1 billion, both hitting a record high [4]. As an important transportation hub in South China, Shenzhen North High-speed Railway Station registered more than 150 million passenger trips in 2024. In peak periods of passenger flow such as Spring Festival travel and holidays, up to 350,000 passengers can be recorded daily [5]. High-density pedestrian flow leads to long-term saturation of channel space, and traffic efficiency is significantly affected. At the same time, Chegongmiao Subway Station, as a transfer station of Line 4 of Shenzhen Metro, has an average daily passenger flow of 230,000 people on working days, about 40% of which is accounted for by the passenger flow in and out of the station in the morning peak. Traffic in the station is slow, which affects the passengers’ travel experience and also entails safety risks.
If an emergency occurs, evacuation will be very difficult. The building space is oversaturated, which causes a series of negative effects such as delays and safety risks. In the face of this phenomenon, national policy is systematically encouraging stakeholders to identify high building utilization areas, in order to locate and eliminate space bottleneck risks, and construct a safe and efficient building space utilization system. The Security Commission Office of The State Council clearly pointed out in the “Notice on Further Strengthening the Safety Management of Personnel Gathering in Public Places” that public places have the characteristics of high crowd gathering, strong mobility, high burst, and many accidental factors, so it is necessary to strengthen the monitoring of human flow and carry out safety risk assessments [6,7]. Considering that human flow is an important indicator of building space utilization, and architectural design is one of the main influencing factors thereof, the calculation of spatial human flow in advance through scientific methods in the architectural design stage, with the aim of identifying the high utilization space of the building, and optimizing and adjusting the design scheme accordingly to alleviate the hidden danger of space supersaturation from the source, has become an urgent problem to be solved in current architectural design research.
At present, existing studies on building spatial flow prediction mainly focus on completed buildings. Data are usually obtained through surveys and simulation models, and prediction is conducted using machine learning methods, while relatively few studies are conducted at the architectural design stage. Starting from building spatial structure and pedestrian demand, this study separately analyzes the influences of building spatial structure and pedestrian demand on spatial flow by adopting corresponding parameters of space syntax and the proposed method for defining OD influence ranges considering obstacle detours. On this basis, a spatial utilization intensity index that comprehensively integrates the above two factors is constructed, and regression analysis is employed to realize the estimation of spatial flow at the architectural design stage.

2. Literature Review

In recent years, with the increasing shortage of urban space resources and the diversification of building functions, the quantification and evaluation of space utilization has become a research hotspot. For the quantitative assessment of space use, existing studies mainly focus on the field of method research. In the early stages of research, scholars generally believed that the physical form of space itself was the fundamental factor determining the use of space. Therefore, research focused on the structural properties of architectural space and mainly used tools such as graph theory and space syntax to analyze the potential relationship between spatial structure and space utilization from a static perspective. The space syntax theory proposed by Hillier et al. [8] laid the foundation for this field, emphasizing the idea that space organization can guide human flow through invisible mechanisms. Based on this theory, Ye [9] pointed out that the topological structure property of a space system directly determines its potential utilization. Borba et al. [10] proved that space syntax has more cost advantages than traditional models in identifying potential high-flow paths. In order to make up for the lack of micro-geometric representation of macro-topology, subsequent research began to introduce more elaborate modeling methods: Turner et al. [11] proposed a visual profile analysis (VGA) method for complex indoor environments, which quantifies visual depth and visual connectivity by discretizing the free plane into a line-of-sight grid, thus effectively predicting the visual perception preferences of pedestrians in scenes such as art museums. Song et al. [12] proposed a raster-based modeling method to express micro-scale geometric and semantic relationships in detail. Duan et al. [13] also applied the syntactic model to the analysis of high-density urban form in China and verified the control effect of structural centrality on functional distribution. Zhou et al. [14] constructed a directed graph model guided by the connection strength based on the functional key nodes in the urban transportation system, and used the network clustering method to identify the functional areas in the city. Fan et al. [15] combined the topological analysis of space syntax with the quantitative analysis of GIS, taking the urban area of Shanghai as an example, to explain the influence of urban road network structure on the layout and hierarchy of urban commercial centers. Pont et al. [16] constructed an urban spatial typology model by quantifying the centrality of urban street networks and building density, which effectively reveals the differences in spatial organization of different macro-structures but, with this kind of method, it is difficult to capture specific high-intensity usage characteristics at the micro-scale. However, Ratti [17] criticized this method of abstractive space as a topological network, saying that it often leads to deviation due to researchers ignoring specific geometric and metric information when analyzing scenes with complex terrain or height differences.
Shopping mall and commercial complex design represents the most extensive application area of space syntax, with relevant research focusing on spatial layout optimization, pedestrian flow guidance, and the enhancement of commercial vitality. Andi et al. [18] systematically reviewed the application of space syntax in shopping mall design, providing a practical guide for the optimization of such developments. Deb et al. [19] integrated space syntax with the bid rent model to investigate the relationships between commercial spatial configuration, tenant layout, and rental levels. Taking retail spaces on commercial streets as their research object, Lian et al. [20] conducted visibility graph analysis using space syntax and, combined with consumer behavior surveys, proposed optimization schemes for window-front spatial coefficients and depth coefficients in retail environments. Alo Baydi et al. [21] combined space syntax with GIS technology and found that streets with high integration and high connectivity are more conducive to the formation of commercial clusters, offering empirical support for the regeneration and layout optimization of historic commercial districts. Using the segment analysis method of space syntax, Al-Saffar et al. [22] quantified indicators such as street integration and connectivity for commercial spaces in the historic urban core of Baghdad. Taking Gaochun Old Street in Nanjing as a case study, Wang et al. [23] employed space syntax modeling and correlation analysis with commercial format density to identify highly integrated and permeable zones within the commercial street network. Adebayo et al. [24] used retail spaces in York and Leeds as case studies to analyze the relationship between consumer movement patterns and retail space performance via space syntax, and examined how spatial configuration influences rental levels in retail areas.
In summary, space syntax provides a powerful tool for the analysis of building spatial flow from a static perspective. However, since it only analyzes spatial structure and abstracts space into a network of topological and geometric relationships, dynamic factors influencing spatial flow—such as pedestrian demand—are neglected in the analysis.
In view of the shortcomings of the above static quantification methods, scholars have tried to introduce measured data to correct them. Eom et al. [25] verified that the density of spatial structure was positively correlated with the distribution of pedestrian flow by introducing the actual observation data of central Tokyo; that is, the high-density spatial network often coincides with the high-intensity pedestrian flow agglomeration area in space. In their study of a commercial complex, Xu et al. [26] innovated through the introduction of “functional space coefficient” and “spatial depth coefficient” structural indices in combination with the actual distribution characteristics of pedestrian flow, which effectively improved the accuracy of high-intensity spatial identification. In their study of transportation hubs, Danilina et al. [27] successfully identified three spatial utilization areas with different characteristics through clustering analysis of two types of heterogeneous data, “pedestrian flow” and “spatial axis length”, which provided a composite model for functional zoning. Bao et al. [28] systematically partitioned and optimized campus walking space based on the characteristics of pedestrian flow agglomeration from the structural dimensions of accessibility and coordination degree. Sevtsuk et al. [29] proposed a “network accessibility” model in the study of urban retail commercial locations and proved that after considering the destination attraction weight, the prediction accuracy of the model for commercial pedestrian flow was significantly better than that of traditional syntax. Fesenko et al. [30] revealed the coupling effects of structural elements such as visual depth and spatial continuity on pedestrian route choice behavior from the perspective of microphysical characteristics. The above studies show that spatial structure, as a physical carrier, defines the basis of space utilization through topological relations. Pedestrian flow, as a behavioral representation, reflects the actual representation of space utilization through dynamic density and trajectory.
With the rapid development of computer technology, simulation is increasingly used as a data acquisition and verification method in research on space utilization evaluation. Among relevant studies, dynamic simulation technology based on agent-based models has gradually become the research frontier. One such example is the social force model, which was proposed by Helbing et al. [31] in 1995. Based on the principle of Newtonian mechanics, pedestrians are regarded as self-actuated particles affected by “driving force,” “repulsive force,” and “attractive force.” Although the model was proposed nearly 30 years ago, scholars still add visual and psychological factors to improve its applicability. Some scholars, such as Li et al. [32], have begun to modify the model by introducing perceptual factors such as visual field limitation. Choi et al. [33] used an agent-based model (ABM) to simulate crowd dynamics and combined it with sensitivity analysis to optimize parameters, in an effort to solve the lag of static analysis. Kirova et al. [34] used a data-driven ABM simulation to generate heat maps and predicted future space utilization trends by identifying high- and low-density areas. Lian et al. [35] constructed a multi-layer grid model to simulate crowd evacuation behavior under different exit layouts, and combined regional density and exit topology to realize the positioning of dynamic high-density areas, which verified the effectiveness of multi-grid modeling in dynamic emergency scenarios. In their study of museum scenes, Liu et al. [36] used microscopic simulation to confirm that only by comprehensively considering spatial connectivity and the microscopic behavior logic of pedestrians can accurate evaluation of residence time and circulation efficiency be achieved. However, although the above simulation techniques are relatively mature in terms of spatial representation at the physical level, there are still significant limitations in considering the complexity of pedestrian behavior when constructing simulation-based space efficiency evaluation systems. Most existing studies simplify pedestrians as “particles” that follow the rules of collision avoidance and focus on “hard indicators” such as evacuation time and traffic efficiency, while ignoring the differences between pedestrian behavior characteristics and travel purposes. For example, Moussaid et al. [37] compared video observation data of real crowds with simulation output results, and found that with a traditional model based on physical forces, it is difficult to reproduce the social interaction characteristics of groups such as “pedestrian side-by-side” that are ubiquitous in reality, resulting in significant deviations in prediction in complex scenes. Turner et al. [38] endowed agents with “gaze analysis” in their early research and found that the motion trajectory of agents based on visual guidance highly coincides with the core integration degree of space syntax, which provides a dynamic verification for “spatial structure-guided behavior.” Sime [39] performed a comparative analysis of actual evacuation cases and user psychology, and pointed out that the pure pursuit of engineering indicators such as “flow speed” is often out of line with the real sense of security of users, and cannot effectively characterize the stagnation and hesitation or subjective discomfort of pedestrians caused by environmental pressure. Considering that microscopic pedestrian simulation software for buildings has become increasingly mature, and the results of building pedestrian microscopic simulation models are relatively consistent with those of space syntax analysis, the detailed pedestrian data output by building pedestrian simulation models can be used as the foundation of this study.
In complex built environments, pedestrians differ significantly in their travel motivations and behavioral patterns, which influence their route choices and the actual utilization of space. In his research on architectural wayfinding, Passini [40] pointed out that pedestrian spatial behavior is a dynamic process of environmental perception and decision-making. Ignoring pedestrian behavioral characteristics may weaken the influence of spatial structure on behavior and lead to certain biases in spatial utilization analysis. Therefore, classifying pedestrian types is of great importance. In large-scale complexes such as super high-rise commercial centers and transportation hubs, pedestrians vary in their travel purposes. Based on Haq’s [41] division of spatial cognitive stages, pedestrian travel behavior can generally be divided into two categories. One category consists of pedestrians with clear travel goals, such as office workers moving from building entrances to offices, passengers traveling from metro stations to high-speed railway ticket checkpoints, and consumers or delivery riders heading directly to target brand stores. Their movement in space mainly pursues continuity, efficiency, and accessibility, and is thus goal-oriented. The other category includes pedestrians with no clear activity objectives, such as consumers wandering and browsing stores, passengers exploring hub service facilities while waiting, and visitors familiarizing themselves with spatial layouts [42]. These two types of behavior contribute differently to indoor spatial flow and follow distinct distribution logics, and they also exert different influences on spatial utilization. Failing to distinguish between them is likely to affect the analysis of spatial utilization.
To sum up, the following research status conclusions are drawn:
Spatial structure and pedestrian flow are the key influencing factors of space utilization.
Existing studies have shown that the utilization level of building space is largely affected by both spatial structure characteristics and pedestrian flow distribution. Research on space syntax shows that spaces with high integration easily become hotspots of pedestrian flow due to their good accessibility, and the attraction generated by the functional layout of buildings further strengthens the intensity of space utilization through pedestrian OD trajectories. Correspondingly, the areas at the edge of the spatial location have a lower utilization level. The spatial structure and pedestrian flow factors are coupled with each other, and the two factors work together to form a differentiated pattern of space utilization inside the building.
The construction of a space efficiency evaluation system based on simulation has limitations in considering pedestrian behavior.
Although different scholars select different evaluation indicators in the construction of their evaluation systems, the pedestrian flow obtained based on the prediction method is essentially used as the source of simulation data which, in turn, is used as the input of the evaluation system, from which the effectiveness evaluation results are obtained. For the prediction of pedestrian flow in specific scenarios, researchers may ignore the limitations of pedestrian behavior characteristics; that is, they focus on oriented crowds with a clear OD and do not take into consideration the behavior patterns of exploratory crowds. The trajectory of an exploratory crowd in space is highly uncertain and its movement direction is affected by visual field information or other factors, which leads to deviation in spatial efficiency evaluation.
Therefore, in order to accurately describe the differences in spatial utilization levels within buildings, in this study, we relied on space syntax, considered pedestrian travel characteristics and travel purposes, and fused spatial structure and pedestrian flow information to propose a spatial utilization level classification method for building space, which provides a quantitative basis for spatial optimization and management decisions.

3. Research Methods and Data

This section is divided into six subsections. Section 3.1 introduces the two main influencing factors of building space flow: architectural spatial structure and OD demand. Section 3.2 and Section 3.3 propose the quantitative impact indicators for building spatial structure and OD demand, respectively. Section 3.4 presents a comprehensive impact indicator for spatial flow based on the above two factors. Section 3.5 proposes a regression-analysis-based estimation method for building space flow, which takes the comprehensive impact indicator of spatial flow as the independent variable. Section 3.6 describes the data used in this study.

3.1. Analysis of Factors Influencing Spatial Flow

In this study, the degree of building space utilization was defined as the pedestrian traffic intensity in the internal area of the building, and a quantitative relationship between pedestrian flow per unit time and space area was constructed to analyze the spatial carrying efficiency and utilization degree of different regions.

3.1.1. The Demands of Origin–Destination

Pedestrian OD has a direct impact on space utilization by affecting the magnitude and main distribution of traffic. Pedestrian travel is highly goal-oriented. As the core element of pedestrian spatial activities, the distribution of pedestrian flow is mainly determined by the location distribution of OD pairs. At the same time, the OD volume also directly affects the volume of pedestrian flow. Therefore, the spatial distribution characteristics of OD not only directly determine the density and direction of passenger flow inside the building, but also have a direct and significant impact on the channel capacity and the traffic efficiency of transfer nodes through the superposition effect of flow in peak hours.

3.1.2. Spatial Structure

Spatial structure has an indirect effect on space utilization by affecting the path choices of pedestrians. While OD distribution specifies the general distribution of flow, in complex buildings such as large building complexes or transportation hubs, there is no single path for pedestrians from the starting point to the end point. Differences in route choices directly lead to differences in flow in different regions, and spatial structure is an important factor affecting this phenomenon. In other words, pedestrian route choice is affected by spatial structure. Bill Hillier, the founder of space syntax, believes that spatial structural elements inside buildings, such as moving line design, passage scale, and turning point, form an “implicit guidance” mechanism that can guide the direction of pedestrian flow without explicit identification through the transmission of visual information and the accumulation of behavioral inertia [1], thus affecting pedestrian spatial perception and action decision-making.
In summary, pedestrian OD and spatial structure constitute two key factors affecting architectural space utilization. Pedestrian OD determines the basic direction and scale of pedestrian flow, while spatial structure has a regulating effect on the specific path choice of pedestrian flow through the “implicit guidance” mechanism. In this section, we select scientific evaluation indicators based on pedestrian OD data and building spatial structure elements, respectively, to perform a quantitative analysis of building space utilization intensity and provide a theoretical basis for the identification and optimization of high-utilization space.

3.2. Influence Index of Spatial Flow Structure

Space syntax abstracts space into the connections between nodes and lines, and analyzes spatial properties from a topological perspective. It mainly includes three models: the convex space model, the axial model, and the visibility graph model (VGA), which analyze spatial structure from different perspectives [43,44]. Compared with the convex space model and the axial model, the visibility graph model operates at a finer scale, focuses more on human subjective spatial perception, and can reveal the intrinsic relationship between spatial form and human behavior at the micro level. It is therefore suitable for studying the interaction between dynamic pedestrian flows and complex built environments. Among its indicators, visual integration is a key parameter of the visibility graph model [45,46].
By integrating “visual accessibility” and “spatial efficiency,” the visual integration degree is more suitable for the quantitative needs of pedestrian behavior decision-making in this study in terms of analysis angle and applicability. In this study, pedestrian behavior decisions are influenced by the visual area. In other words, visual integration measures the potential of a space to attract arriving traffic. Therefore, in this section, we take visual integration as an index to quantify the influence of spatial structure on pedestrian flow for further analysis, referring to the research of space syntax and the work of VGA researcher Alasdair Turner on visual integration [4]. The formula for calculating the visual integration degree of grid i is as follows:
I i = j = 1 n 1   l o g 2 j + 2 3 ( n 1 ) ( M D i 1 )
M D i = j = 1 n D i , j n 1
where MD i denotes the mean depth of grid i; D i , j represents the visual depth between grid i and grid j, defined as the number of turns required for mutual visibility between grid i and grid j; and n stands for the total number of grids.

3.3. Spatial Traffic OD Impact Index

Obstacles interfere with the trajectory of pedestrians. The actual distribution of OD influence space is changed by pedestrians’ autonomous detour behavior to the obstacles in their path. This effect is particularly significant in scenes with complex functions and dense pedestrian flow. In this paper, we propose a method to determine the pedestrian OD influence space considering obstacles to quantify the impact of pedestrian flow on space utilization. Pedestrians’ obstacle avoidance behavior can be divided into two stages: “obstacle perception” and “obstacle detour.”

3.3.1. Shape Analysis of Obstacle Perception

In the stage of obstacle perception, pedestrians cannot directly and accurately judge the specific shape of the obstacle through the surface of the obstacle in the field of vision. They can detour through the visual perception of the obstacle boundary, but the specific shape of the obstacle has little effect on the pedestrians’ detour path. At the same time, in buildings such as shopping malls and traffic hubs, obstacles (walls, pillars, etc.) usually present a regular shape, and rectangular completion is more realistic. Therefore, we believe that pedestrians usually complete obstacles into rectangles according to what they see and then bypass them.

3.3.2. Considering the Definition of the Spatial Influence of Obstacle Detour

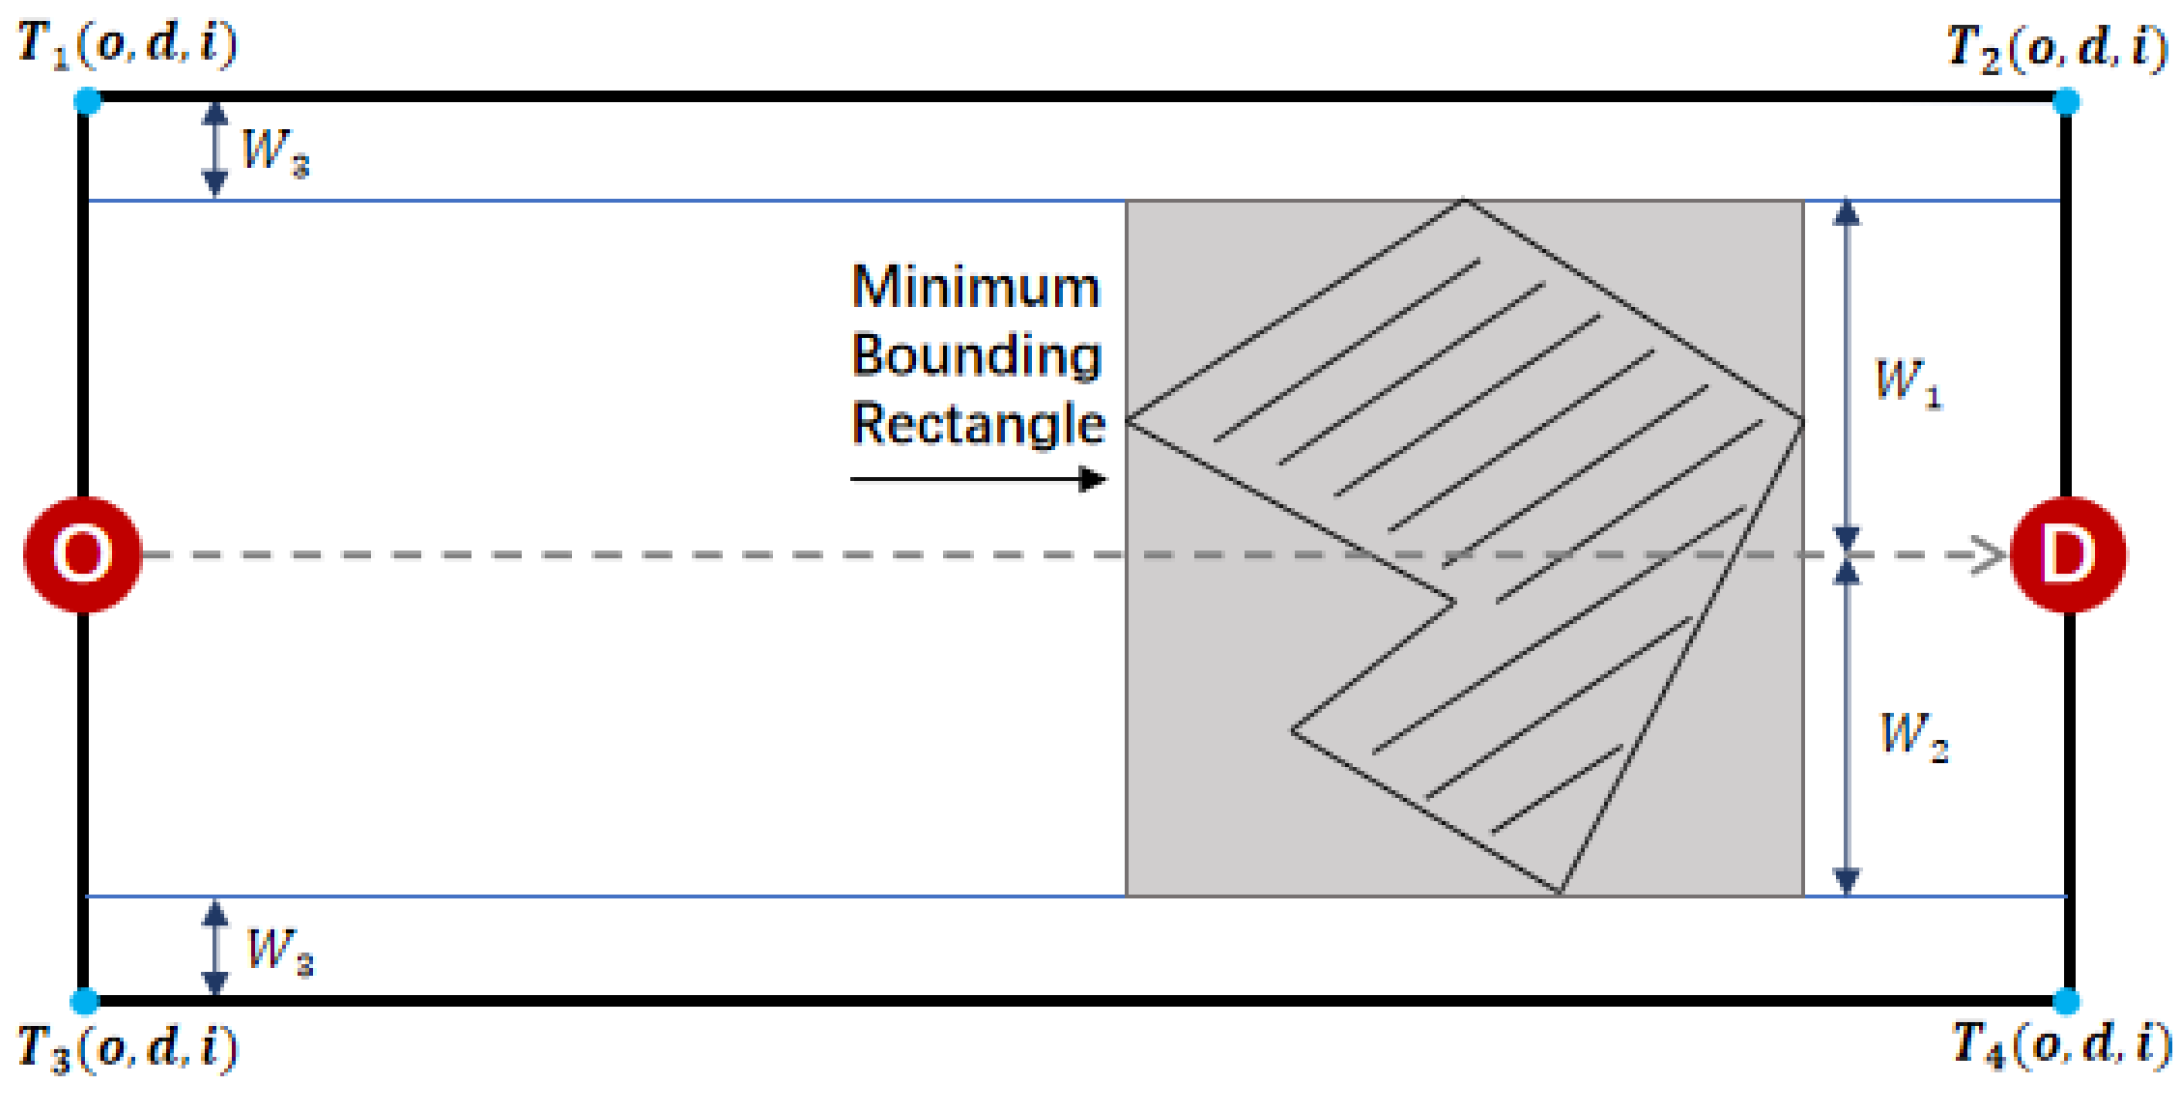
When there are no obstacles between pedestrian origin–destination (OD) pairs, the spatial influence of pedestrian OD mainly occurs in the straight-line region between the origin and destination. However, when obstacles exist between pedestrian OD pairs, the spatial influence of pedestrian OD appears in the obstacle detour region. The pedestrian detour space is mainly affected by factors such as obstacles and the pedestrian’s field of view. Limited by research capacity, this study simplifies the obstacle space to its minimum bounding rectangle. On this basis, considering the required space width for pedestrian walking, a pedestrian obstacle detour influence space is designed. Therefore, for a given pedestrian demand OD, the central coordinates of the four vertices of the pedestrian obstacle detour influence space of any obstacle i in the plane are as follows:
T 1 ( o , d , i ) : [ X o + ( W 1 ( o , d , i ) + D ) sin θ , Y o + ( W 1 ( o , d , i ) + D ) cos θ ]
T 2 ( o , d , i ) : [ X d + ( W 1 ( o , d , i ) + D ) sin θ , Y d + ( W 1 ( o , d , i ) + D ) cos θ ]
T 3 ( o , d , i ) : [ X o ( W 2 ( o , d , i ) + D ) sin θ , Y o ( W 2 ( o , d , i ) + D ) cos θ ]
T 4 ( o , d , i ) : [ X d ( W 2 ( o , d , i ) + D ) sin θ , Y d ( W 2 ( o , d , i ) + D ) cos θ ]
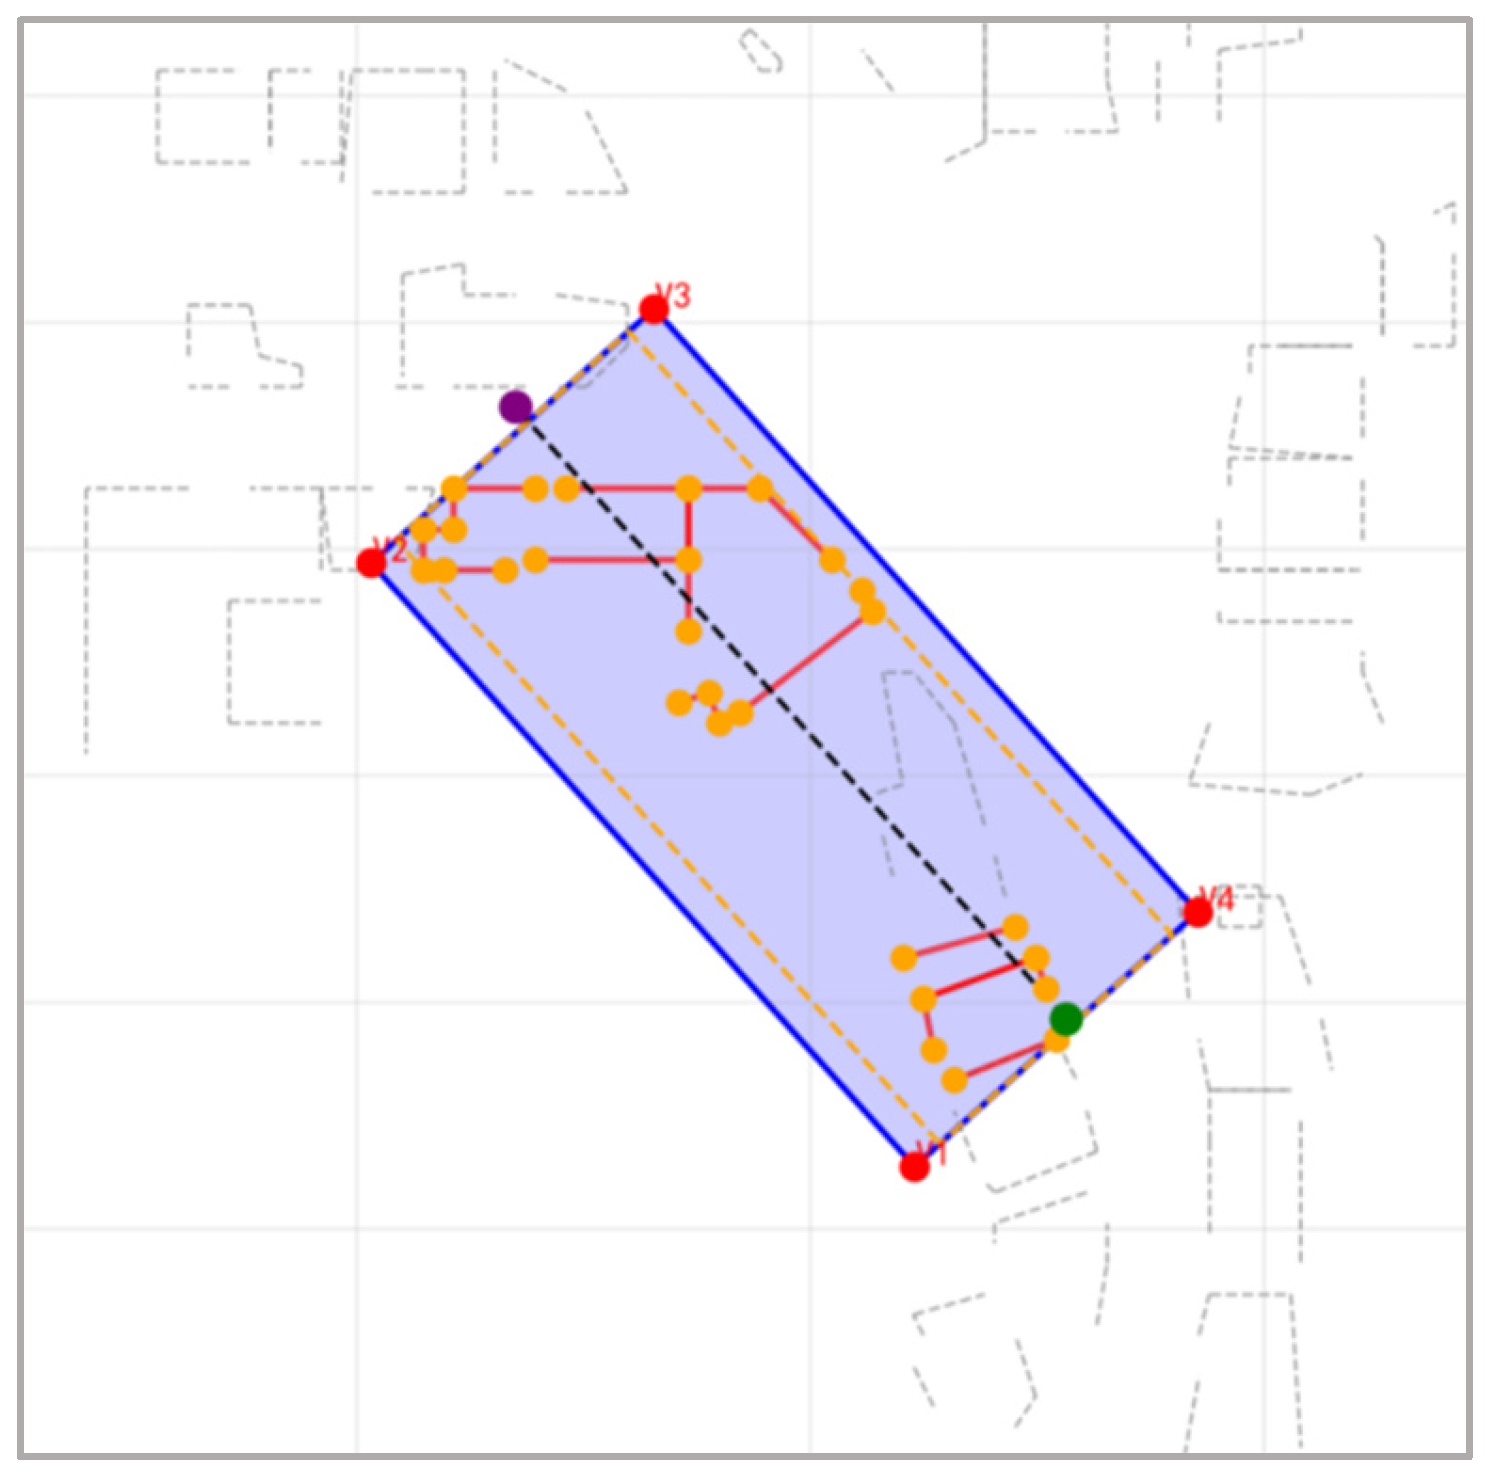
where X o , Y o and X d , Y d denote the central coordinates of the origin grid o and destination grid d of the demand, respectively; W 1 ( o , d , i ) and W 2 ( o , d , i ) represent the widths of the upper and lower parts of the minimum bounding rectangle of obstacle i with respect to the connecting line of OD demand, respectively; W 3 denotes the minimum space width required for pedestrian movement. According to the Code for Design of Store Buildings (JGJ 48-2014) [47], the minimum clear width for comfortable pedestrian passage should be 2.4–3 m. Therefore, combined with indoor ergonomics and design standards for public building comfort, this study sets the fixed pedestrian walking width W 3 to 3 m; θ ( o , d ) represents the horizontal angle between the OD connecting line and the X-axis. The details are shown in the Figure 1 below.
In actual obstacle detouring, pedestrians tend to choose the side with a shorter detour distance. Considering pedestrian detour preferences, this study takes the OD connecting line as the dividing line of the OD influence space, compares the widths W 1 and W 2 on both sides, and selects the smaller side as the actual detour influence space. This is more consistent with the real path choice characteristics of pedestrians, thereby improving the accuracy of measurement results.

3.4. Comprehensive Influence Index of Spatial Flow

The OD influence space can well quantify the influence range of pedestrian OD on space utilization. However, for the internal OD influence space, the distribution of grid utilization is not uniform, and pedestrians are still affected by spatial structure. To accurately depict the actual use of the characteristics of interior space, when we only depend on space form or pedestrian OD, the impact of a single index is often difficult to fully reflect space usage. Pedestrian OD reflects the actual travel demand and flow direction, while spatial form determines the visible accessibility of space and affects the distribution of pedestrian routes.
Therefore, based on the aforementioned method for determining the pedestrian OD influence space considering obstacles, this study designs a grid utilization intensity index by accounting for the combined effects of spatial structure and pedestrian OD on indoor space utilization. The calculation formula is as follows:
K ( i ) = j = 1 n k = 1 n Q j k × α i j k
where Q j k denotes the OD flow generated by demand j k , reflecting the actual influence intensity of pedestrian flow in the space; α i j k represents the coverage ratio of grid s i covered by the pedestrian influence zone of demand j k , with a value range of [0, 1]. Grid utilization intensity couples the characteristics of spatial structure and pedestrian flow distribution, thereby achieving a quantitative description of indoor space utilization intensity. It reveals the mechanism underlying the relationship between flow distribution and spatial form, and provides data support for the identification and optimal design of high-utilization spaces in the next chapter.

3.5. Building Space Flow Estimation Based on Regression Analysis

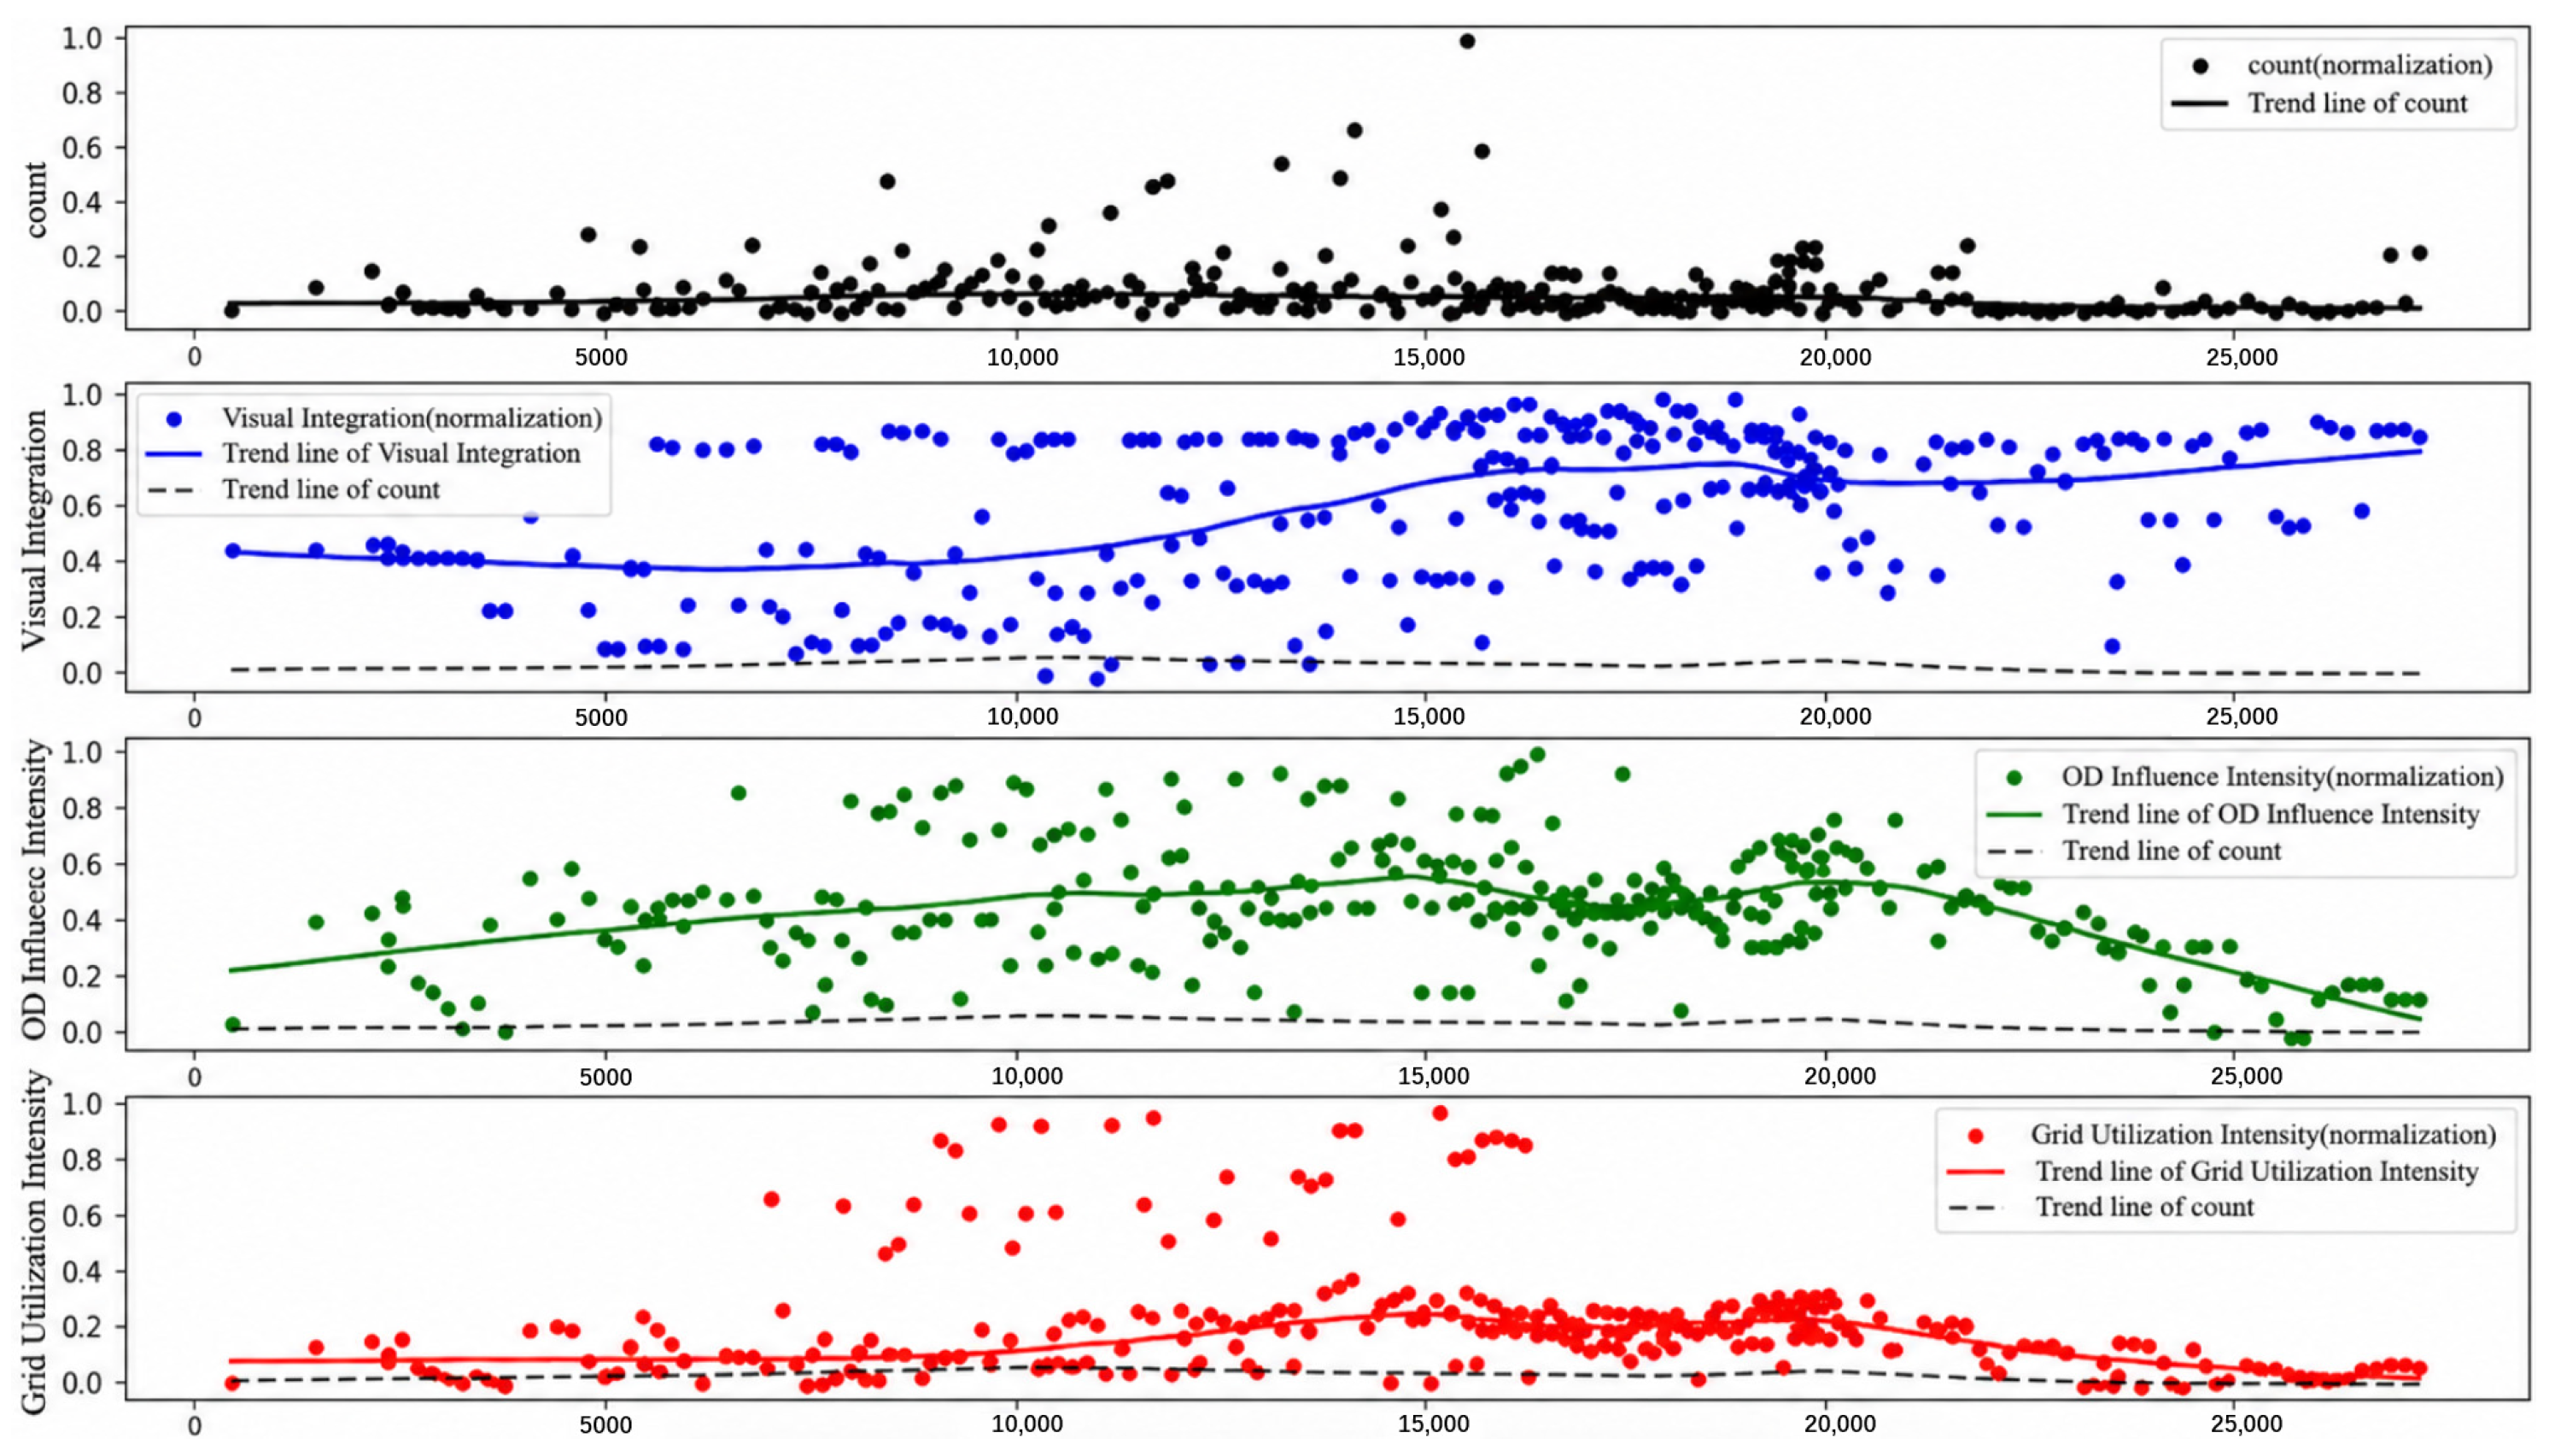
In order to analyze the correlation degree of each index with the actual flow, in this subsection, we compare and analyze the actual flow, visual integration, OD influence intensity, and grid utilization intensity normalized value with the grid number as the sequence. By drawing the scatter plot of the distribution in Figure 2, and comparing and analyzing the scatter distribution and trend line, it can be seen that compared with the two indicators of visual integration degree and OD influence intensity, the scatter distribution of raster utilization intensity is relatively concentrated, showing a similar change trend with the actual traffic. Specifically, the trend curve of raster utilization intensity is highly consistent with the actual traffic trend line in terms of fluctuation amplitude and direction, indicating that it has a stronger ability to explain the actual traffic. The Pearson correlation coefficients were further calculated. The Pearson correlation coefficients between actual pedestrian flow and visual integration, OD influence intensity, and grid utilization intensity were −0.0011, 0.0917, and 0.4301, respectively. The results indicate that visual integration and OD influence intensity have weak correlations with actual pedestrian flow, while grid utilization intensity has a moderate positive correlation with actual pedestrian flow. Although they only show a moderate correlation, a strong regularity in the scatter distribution can be observed from Figure 2. Therefore, this paper adopts the grid utilization intensity index to conduct regression fitting with actual pedestrian flow.

3.6. Research Scope

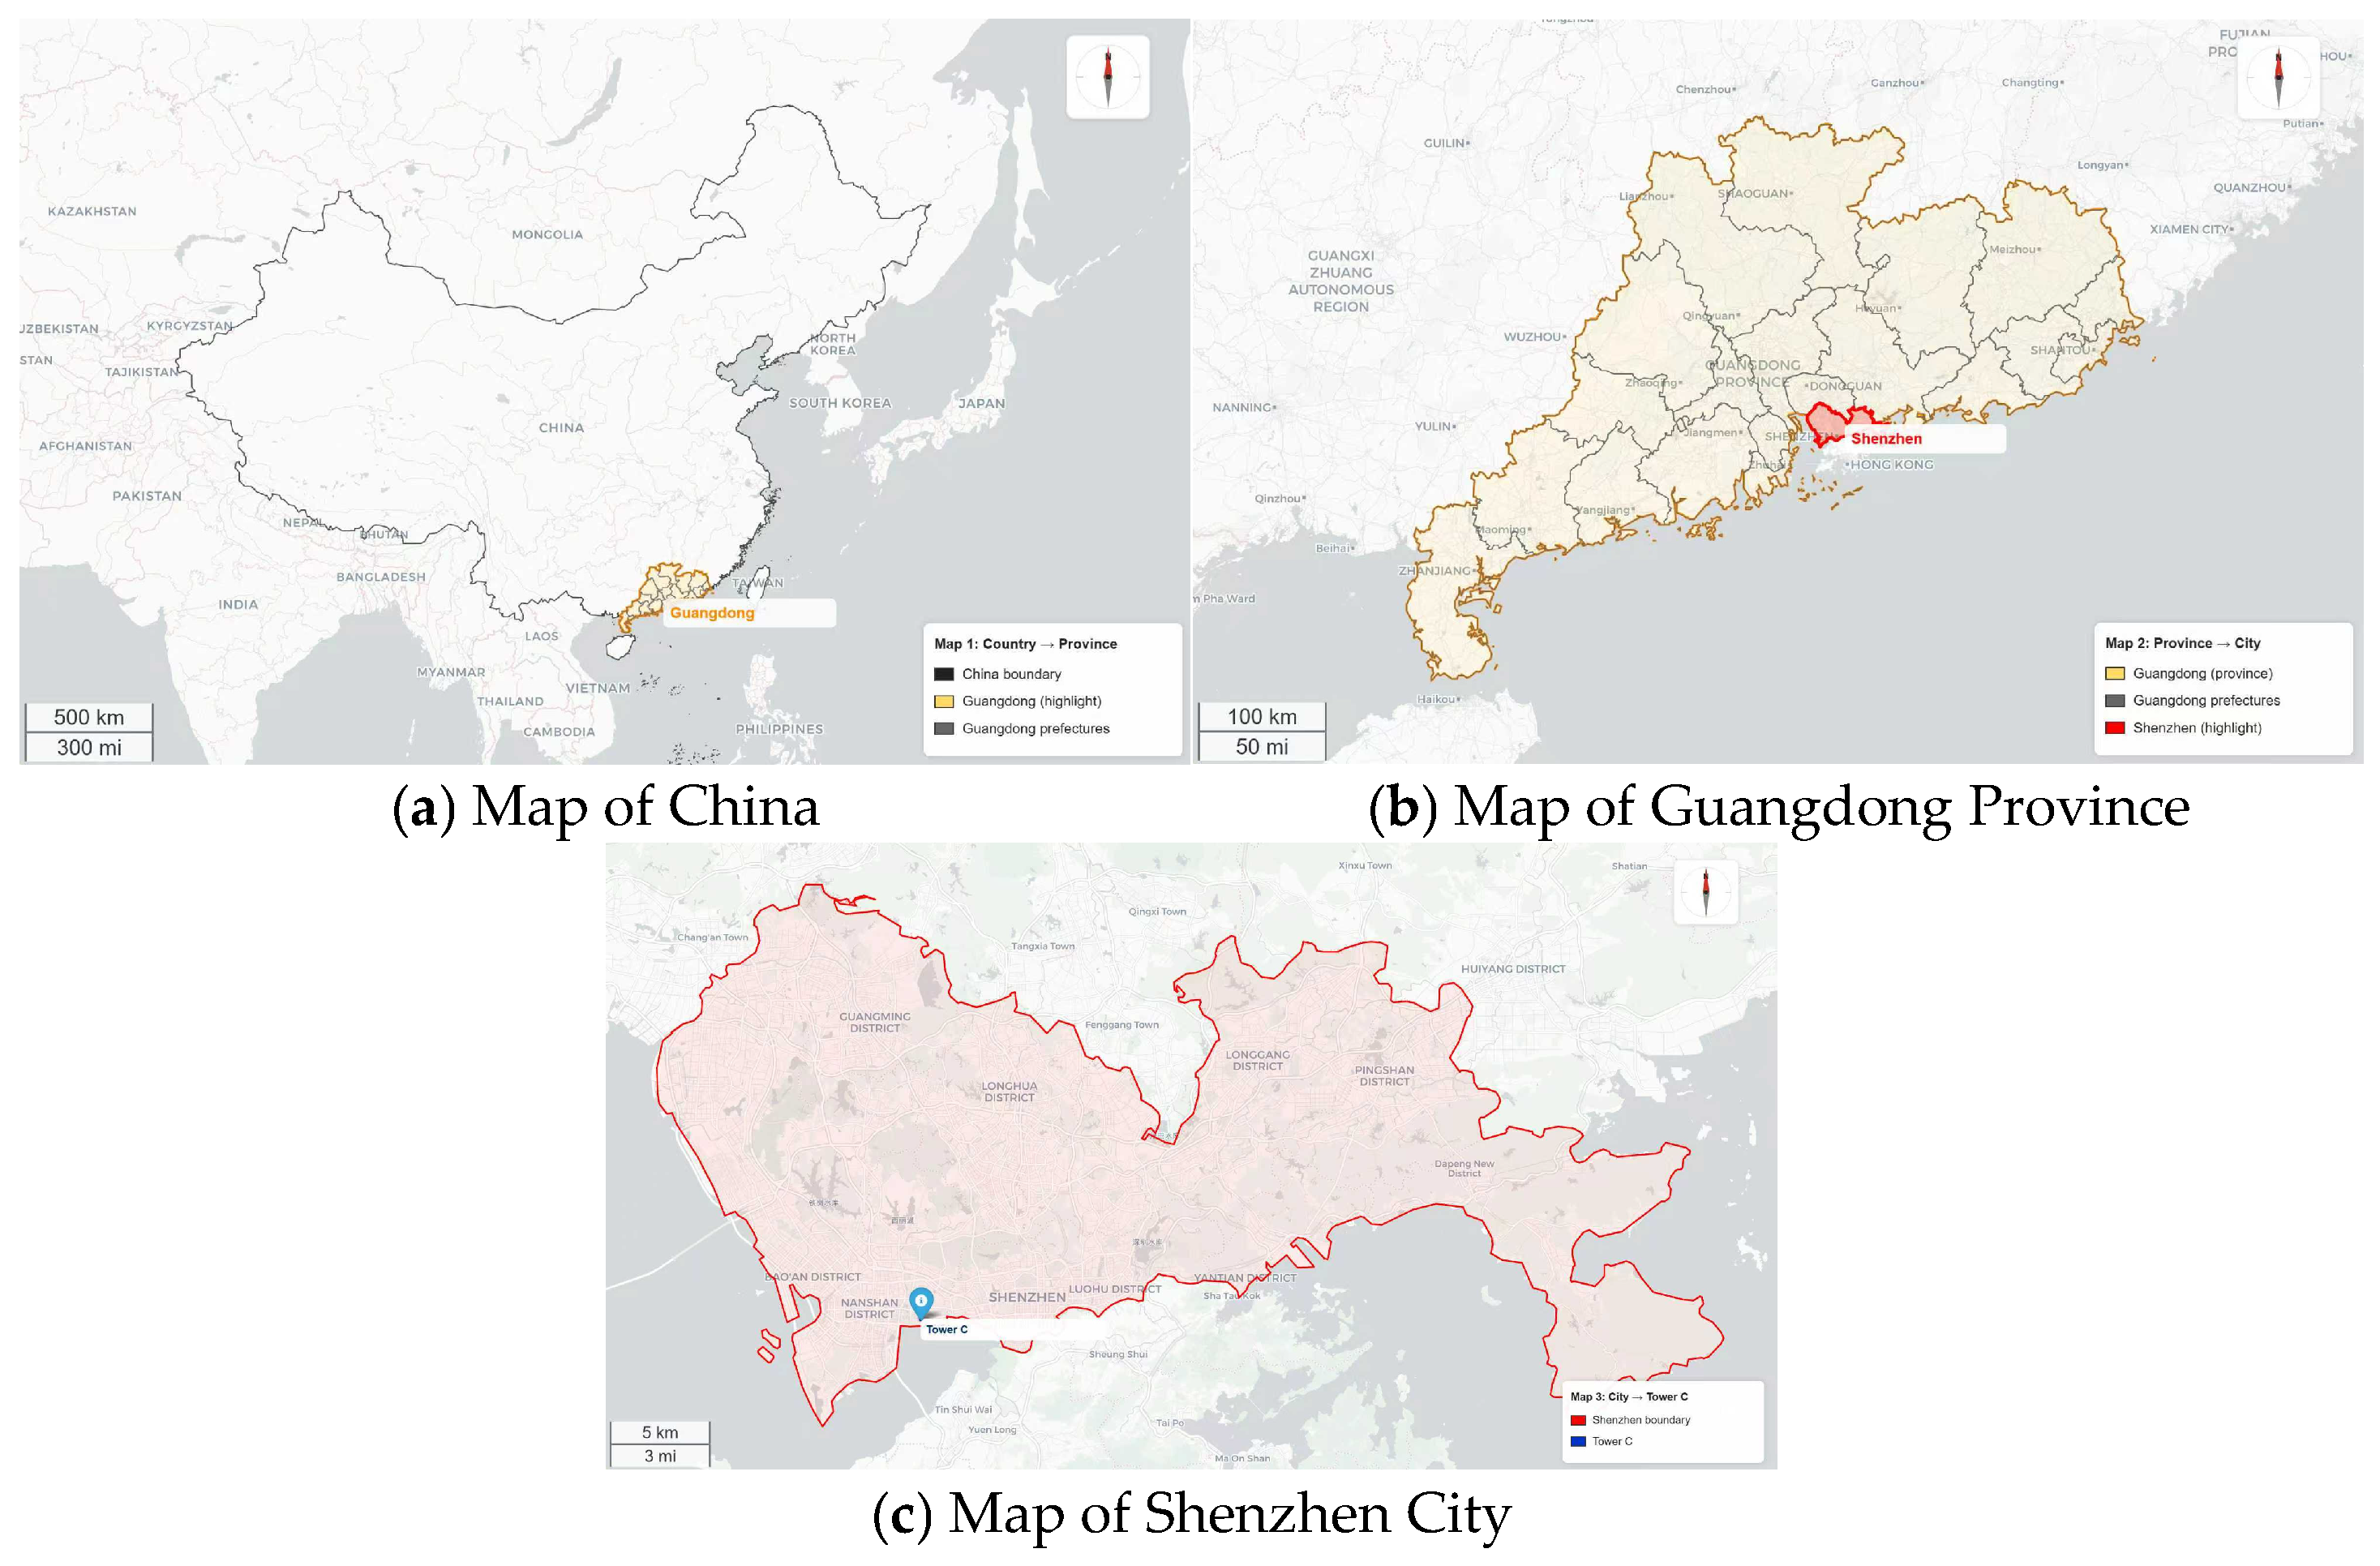
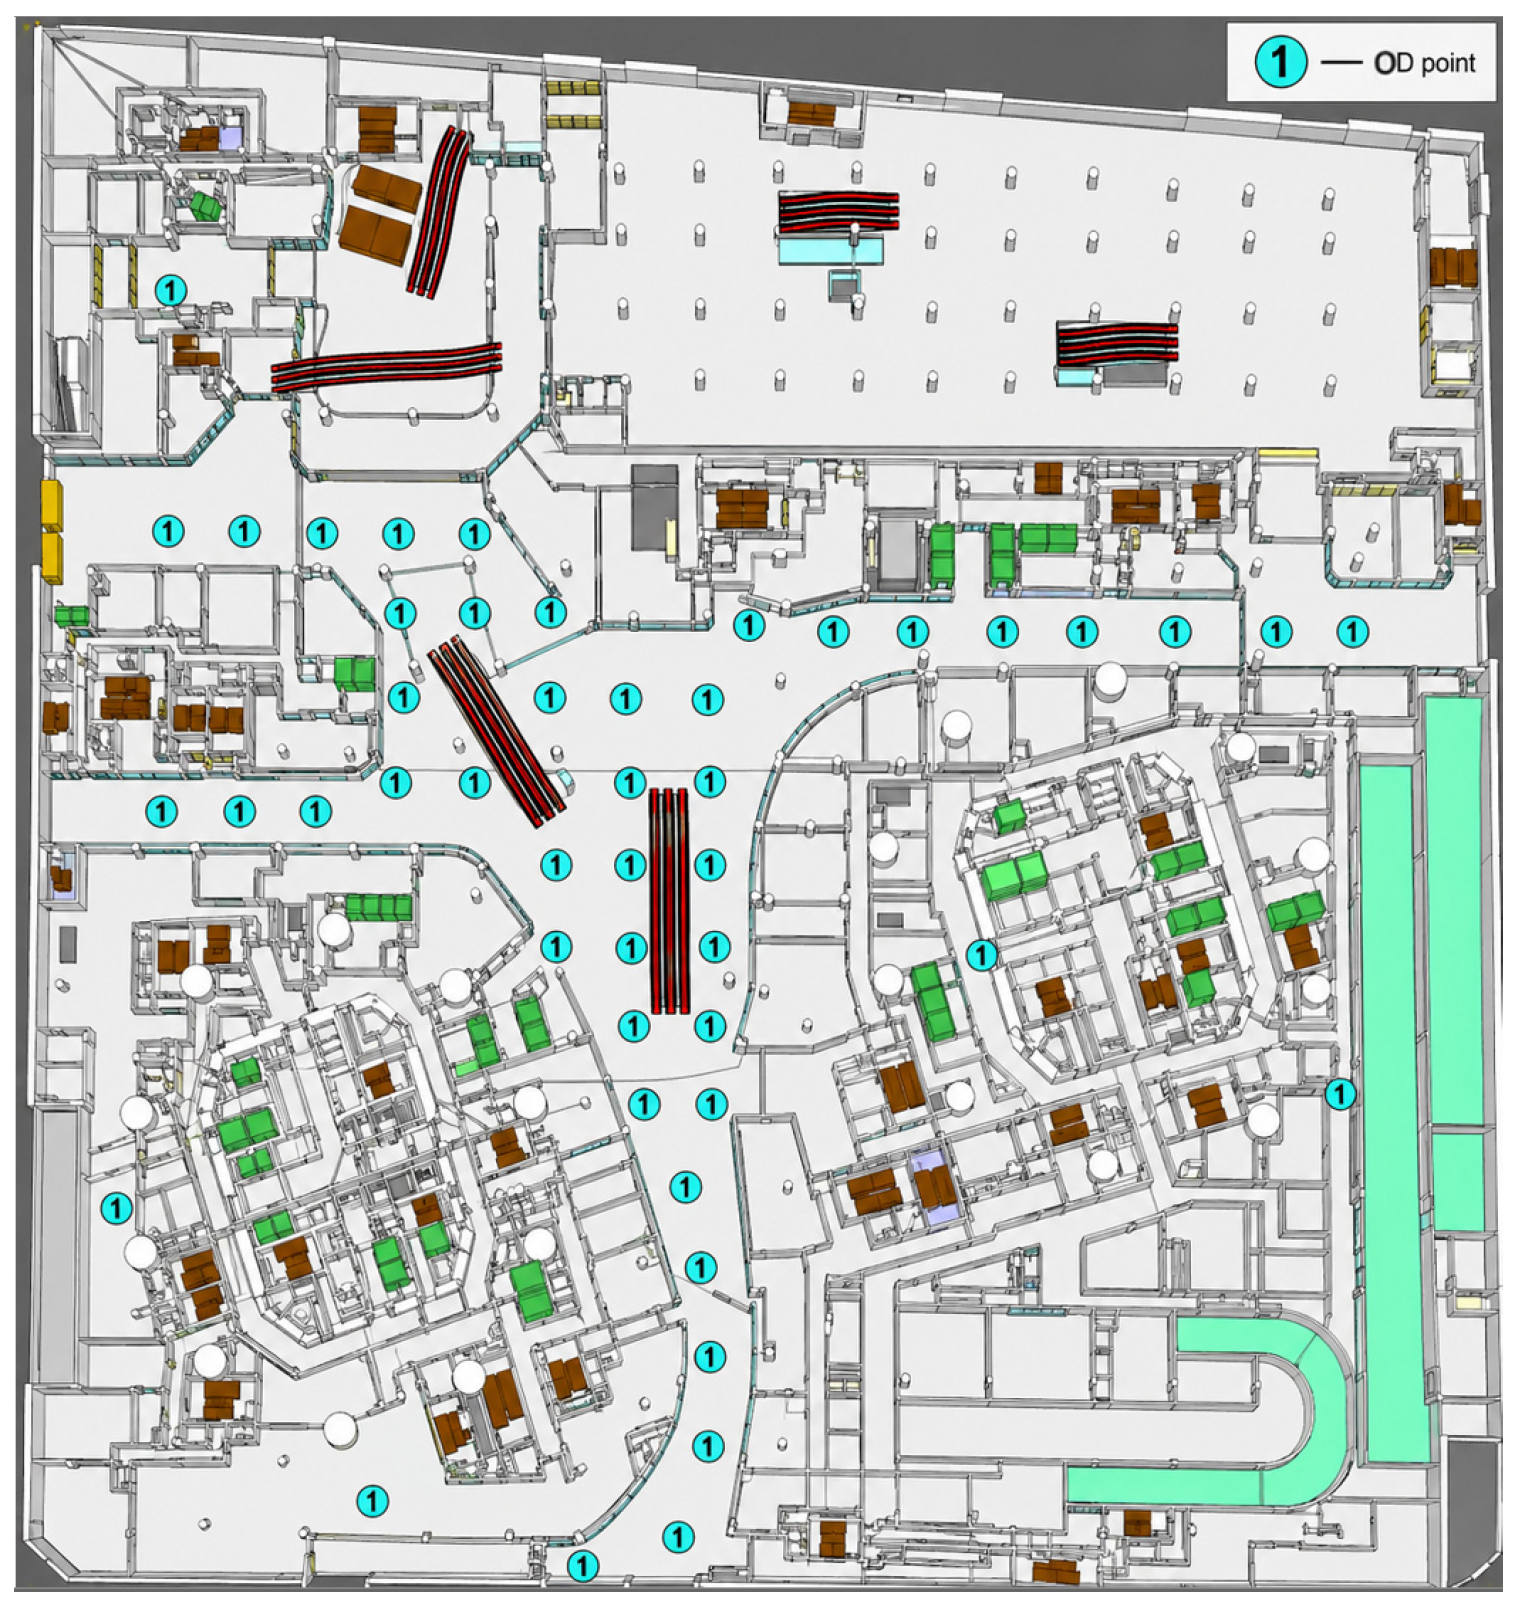
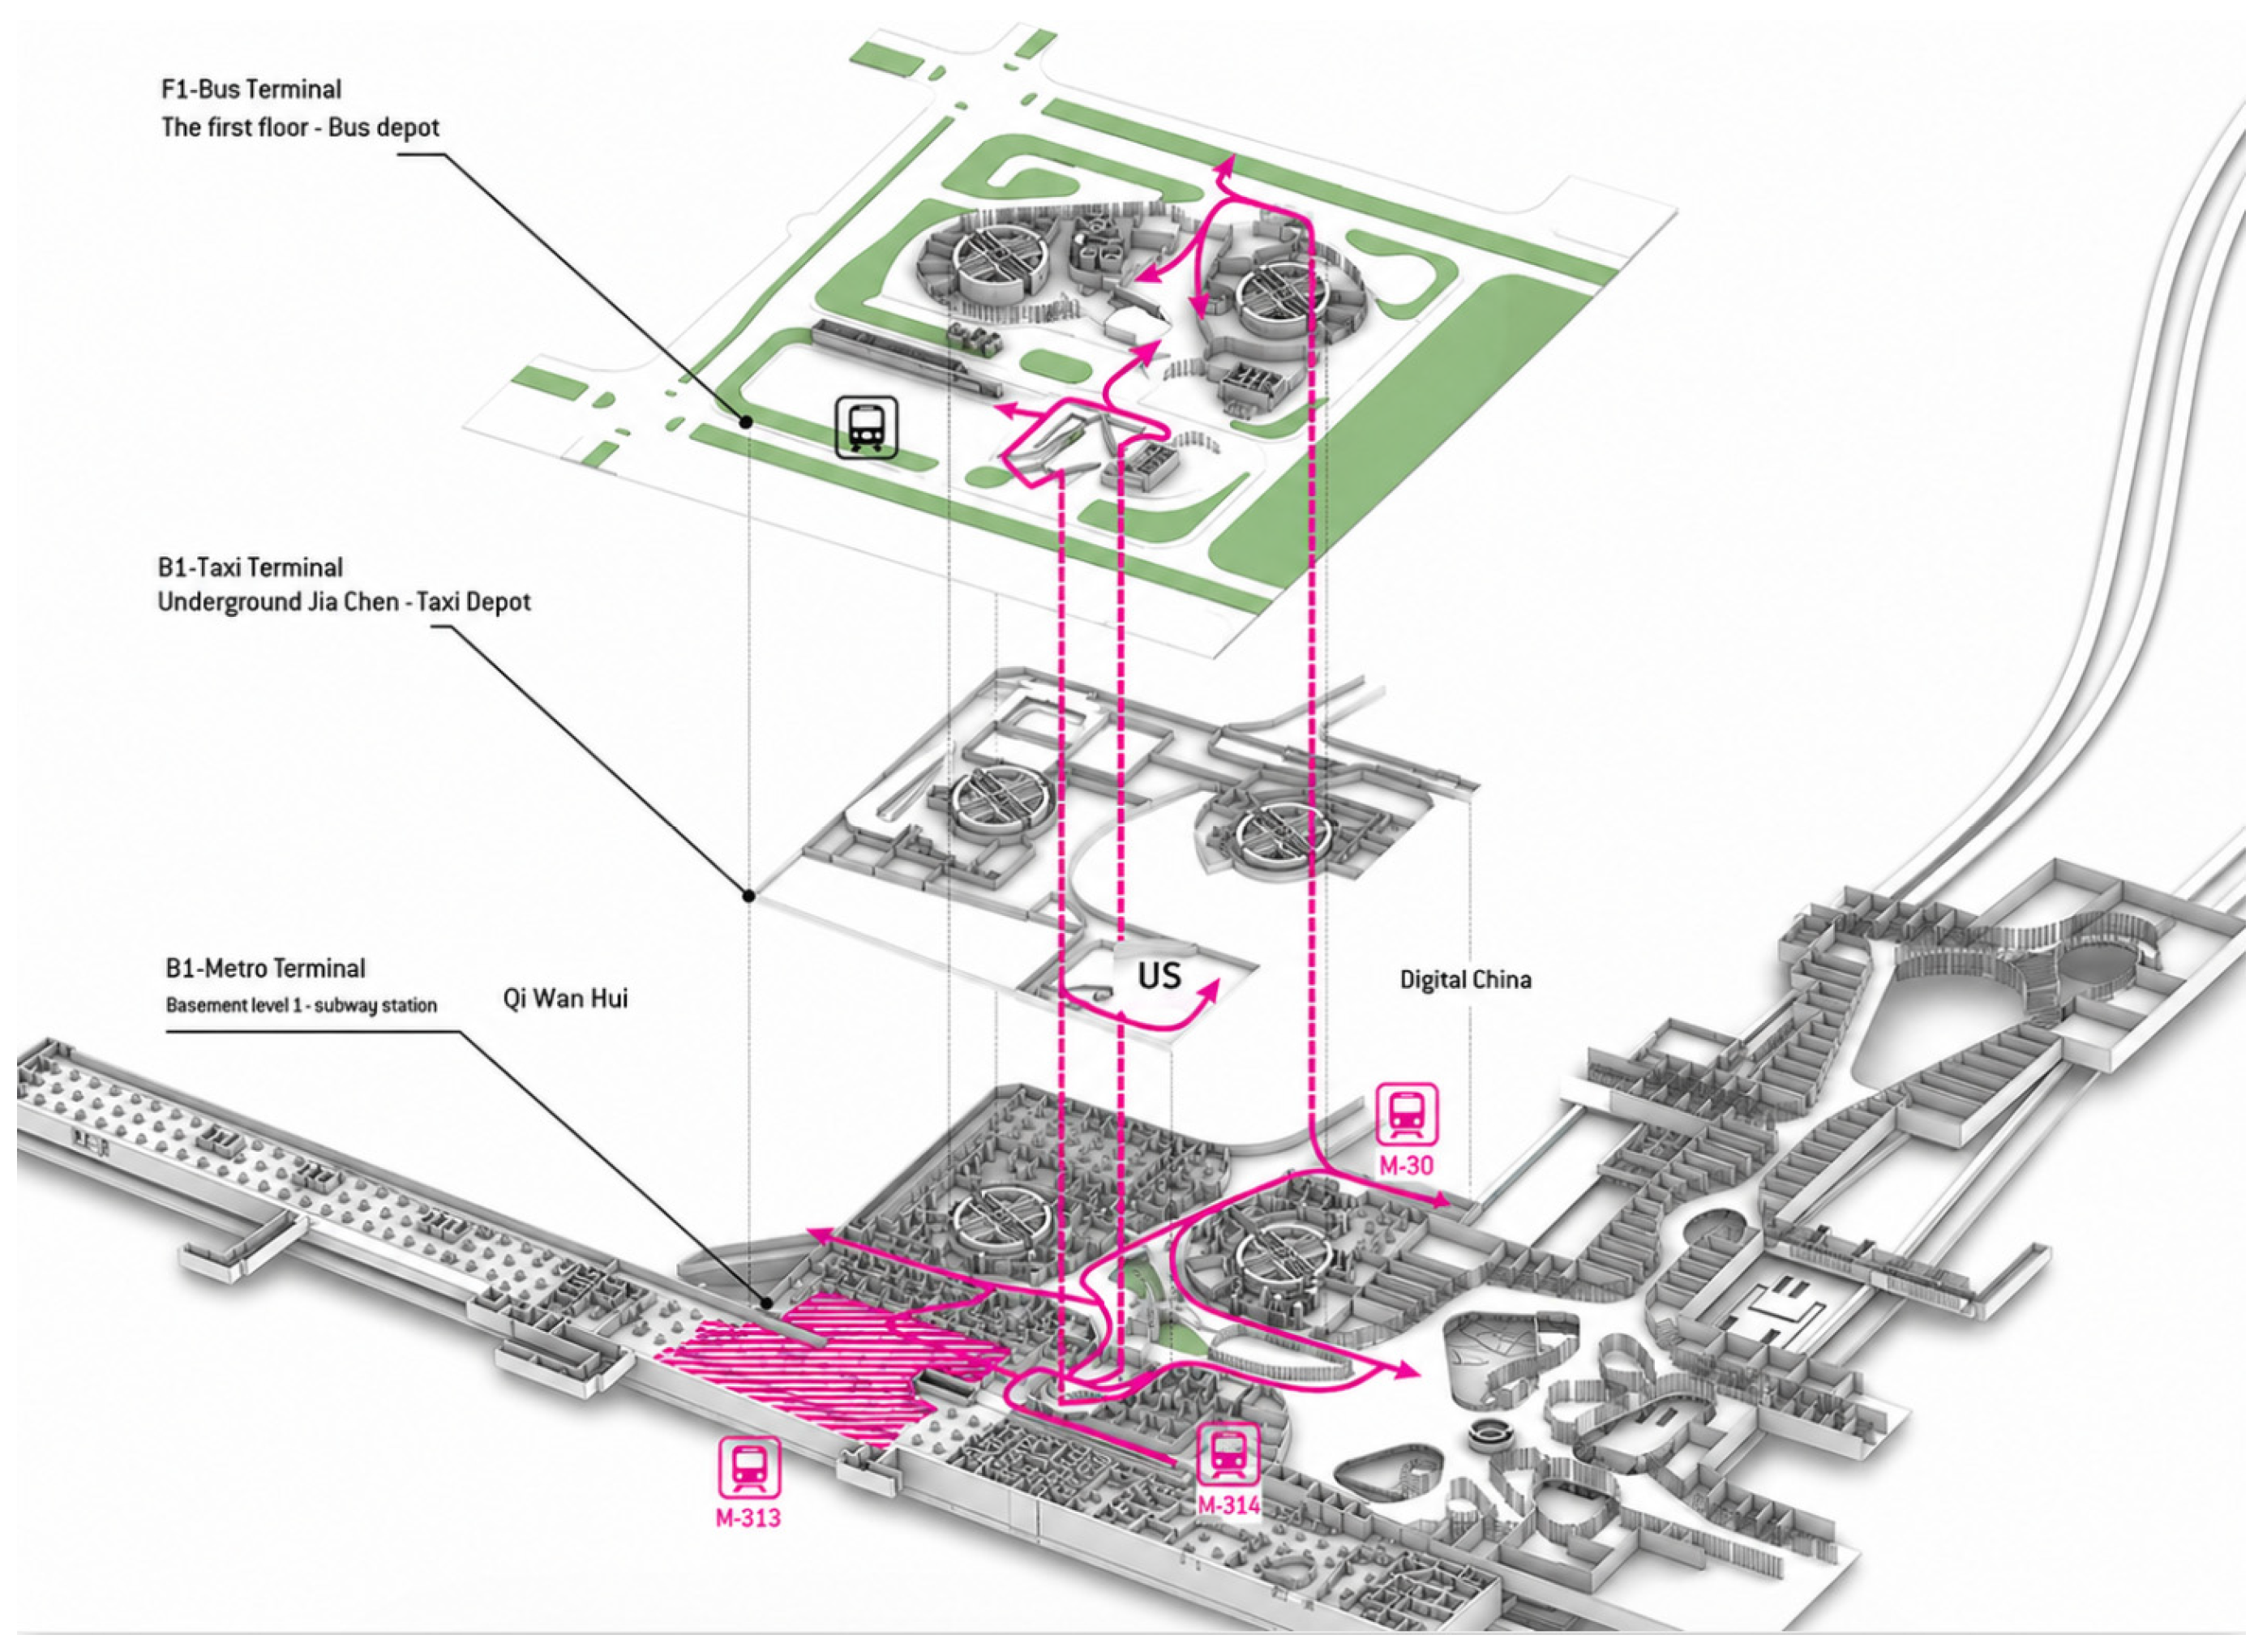
Shenzhen Bay Super Headquarters Base is one of the key development areas of Shenzhen. It is positioned as “a typical representative of the ultimate status of the city in the global economic and industrial chain, and a functional center for Shenzhen to develop into a world-class city.” Figure 3 shows the location map of the research objects (GS(2024)0650) [48]. Its goal is to become a landmark node, as part of a new generation of headquarters economic zones, which will allow Shenzhen to join the ranks of international cities. Its total land area is 117 hectares, the total development area is about 5.2 million square meters, and the employment population is about 300 thousand. The area will build a future urban model integrating a global headquarters gathering area, an urban cultural highland, an international exchange center, and a world-class coastal city area. Located in the core location of Shenzhen Bay Super Headquarters Base, Tower C is one of the super high-rise landmarks of the “Shenzhen Bay urban core” in the area. Tower C, shown in Figure 3, is the absolute center of Shenzhen Super Headquarters, representing the spirit of Shenzhen, and is a new window for the world to know the city. The total land area of the project is 36,268.61 square meters, and the floor area of the specified floor area ratio is 440,000 square meters. The use types include office (291,310 square meters), commercial (54,500 square meters), hotel (30,000 square meters), culture (44,000 square meters), municipal transportation (18,000 square meters, including municipal transportation facilities and a transfer distribution space area index of 10,500 square meters), postal branch (1500 square meters), and a property service room (690 square meters). Underground, there is an intersection of several urban and intercity rail lines, mainly including Shenzhen metro lines 9, 11, and deep inter-city (Shenzhen), whereas the ground buildings and traffic facilities together form a super-tall TOD synthesis of landmark towers. The first floor is connected to a shuttle bus depot, mezzanine B1 is connected to a taxi terminal, and floor B1 is connected to the subway station. This paper focuses on the negative floor connected to the subway, as shown in Figure 4 below.
MassMotion features high simulation efficiency and supports dynamic 3D visualization. It also allows secondary development according to user requirements, making it suitable for pedestrian simulation involving complex behaviors. In addition, MassMotion provides an efficient mechanism for converting 3D architectural models into formats compatible with simulation analysis [49,50]. Therefore, MassMotion 9.0 is adopted as the indoor scene simulation software in this study.

4. Results and Discussion

4.1. Influence Index of Building Space Flow Structure

As a spatial structure index, the degree of visual integration is used to measure the relative relationship between a certain grid and other grids. Under the assumption that pedestrians lack a clear global goal, the higher the visual integration degree, the stronger the guidance to pedestrians and the more likely it is for the grid to be passed; the flow is also greater, so space has a higher utilization degree. In order to verify the influence of spatial structure on pedestrian flow distribution, in this subsection, we consider horizon integration as an important representation of the spatial structure index from the aspects of both qualitative and quantitative influence on spatial structure.

4.1.1. Principles and Methods of the Experiment

Theoretically, when the distribution of points is sufficiently uniform and the travel volume between each OD pair is equal—that is, when each grid cell has the same probability of being the origin or destination—it can be considered that pedestrian flow distribution is only affected by spatial structure, which is consistent with the connotation of visual integration. In order to verify the effect of visual integration on pedestrian flow, in this study, we arranged OD points uniformly in the corridor space to simulate a balanced travel demand in the whole region. The denser the OD distribution, the stronger the ability of visual integration to describe the space utilization. By observing the distribution of areas with high values of visual integration and high values of flow, it can be considered that when the actual flow of areas with high visual integration is greater, spatial structure has a certain impact on the level of space utilization.
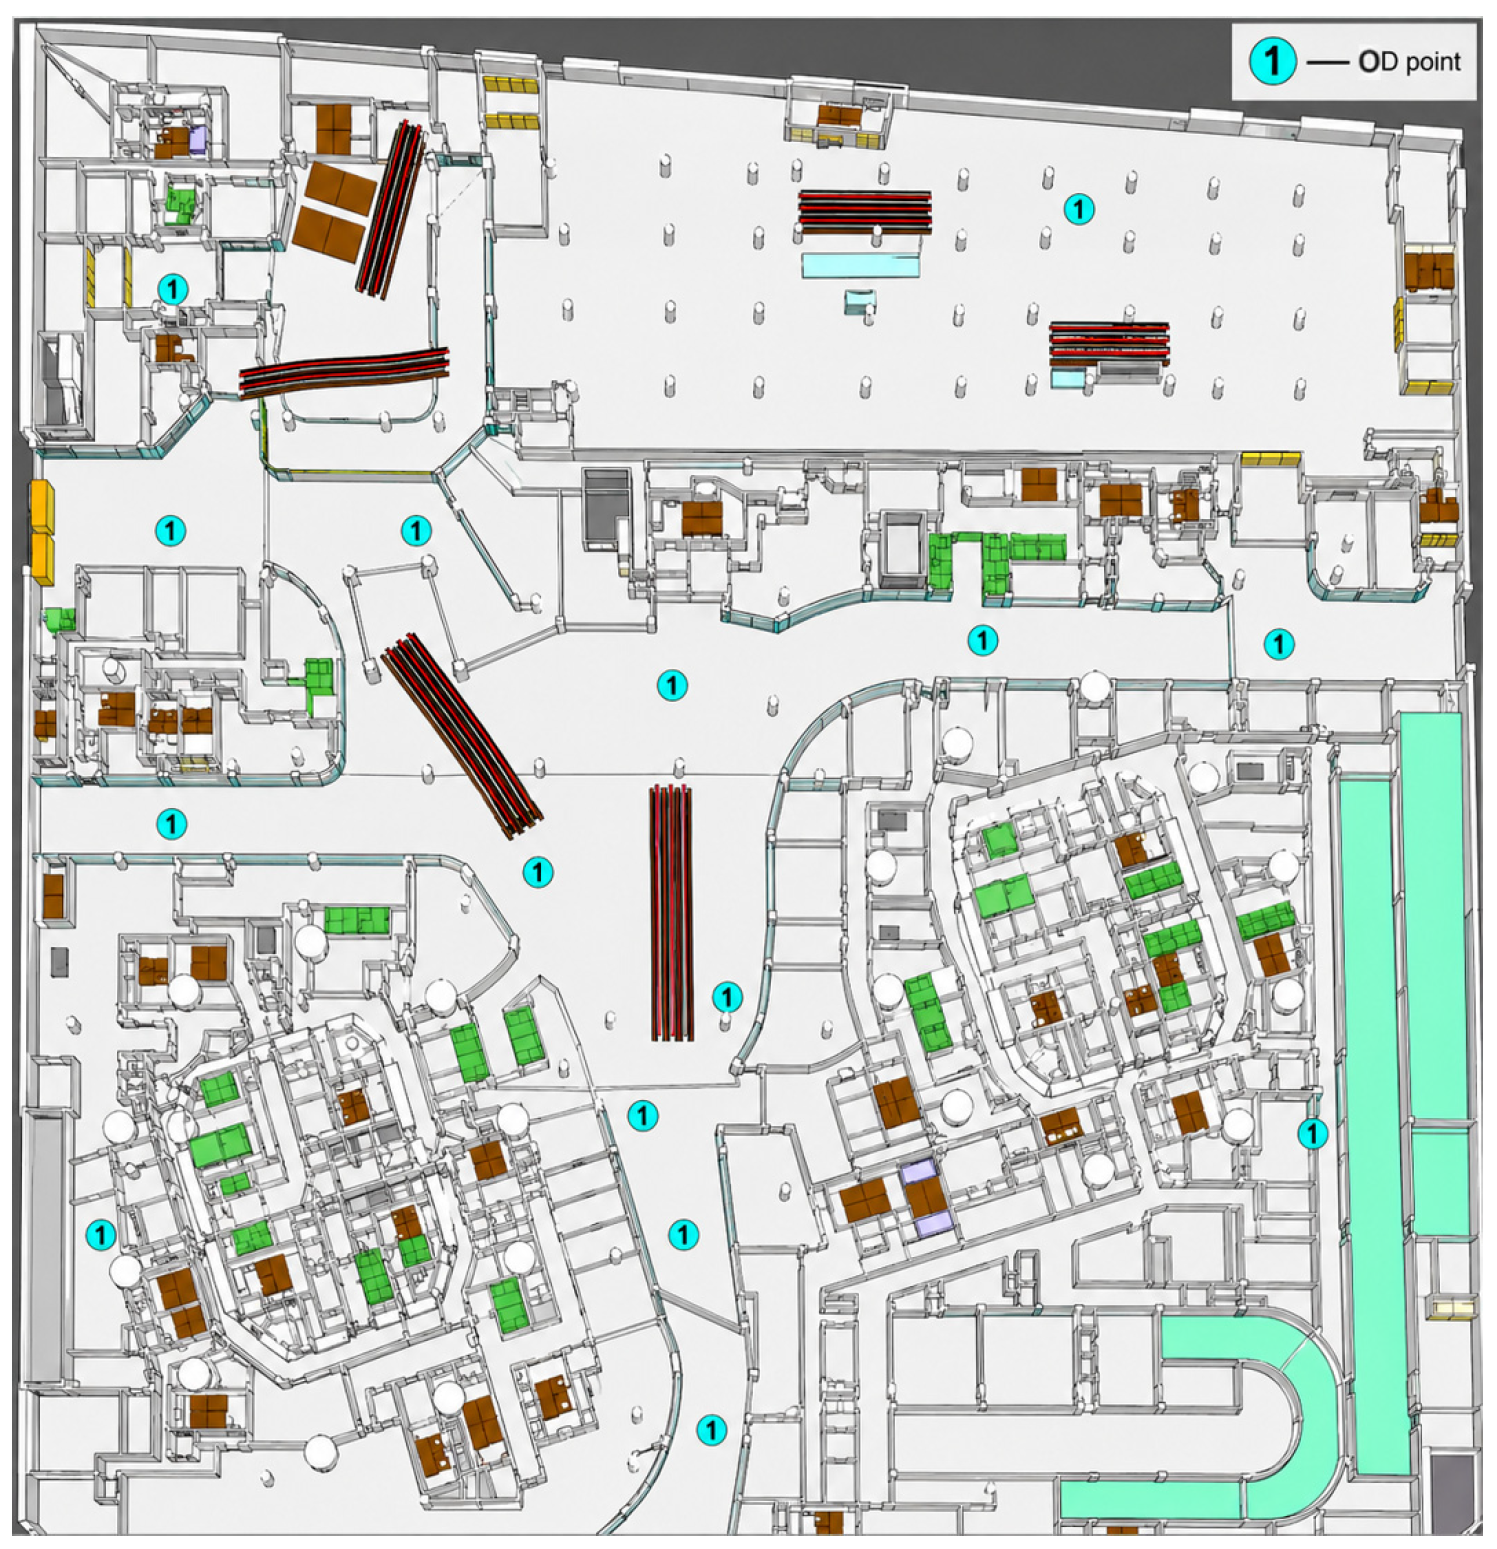
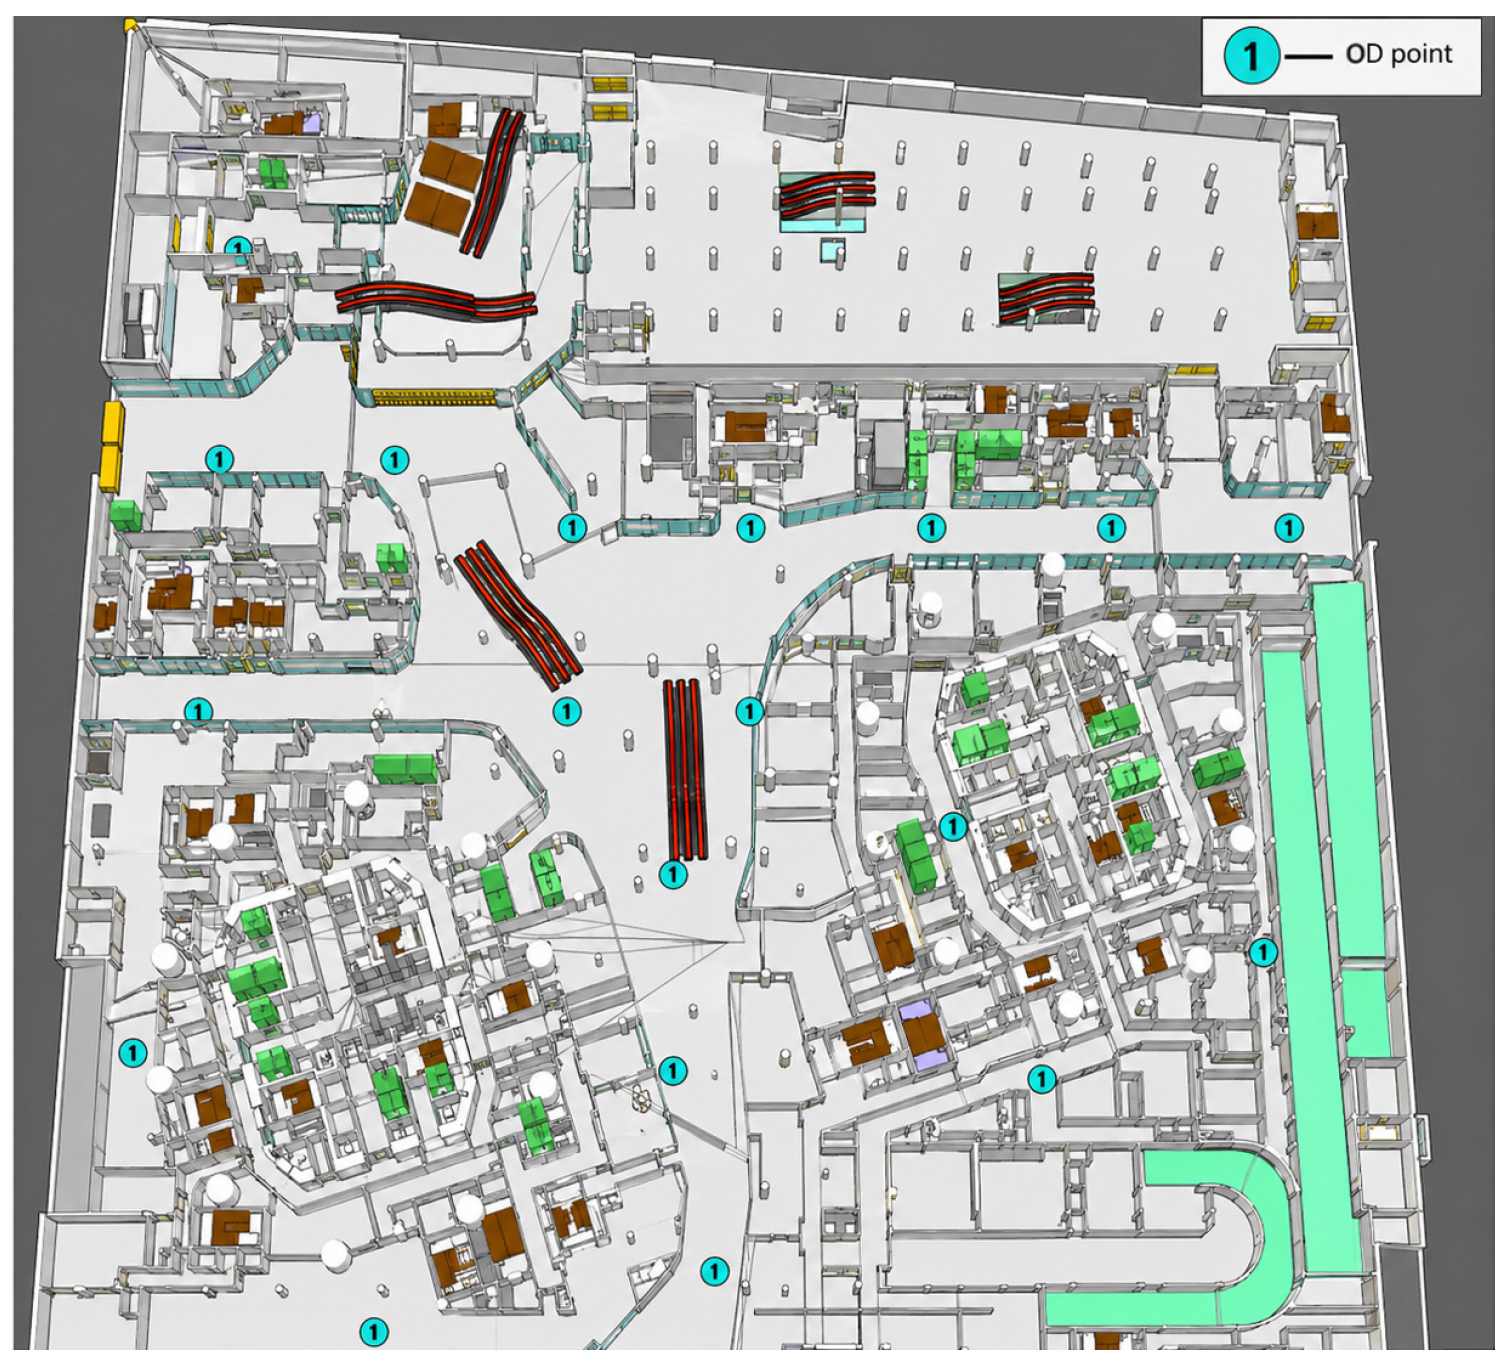
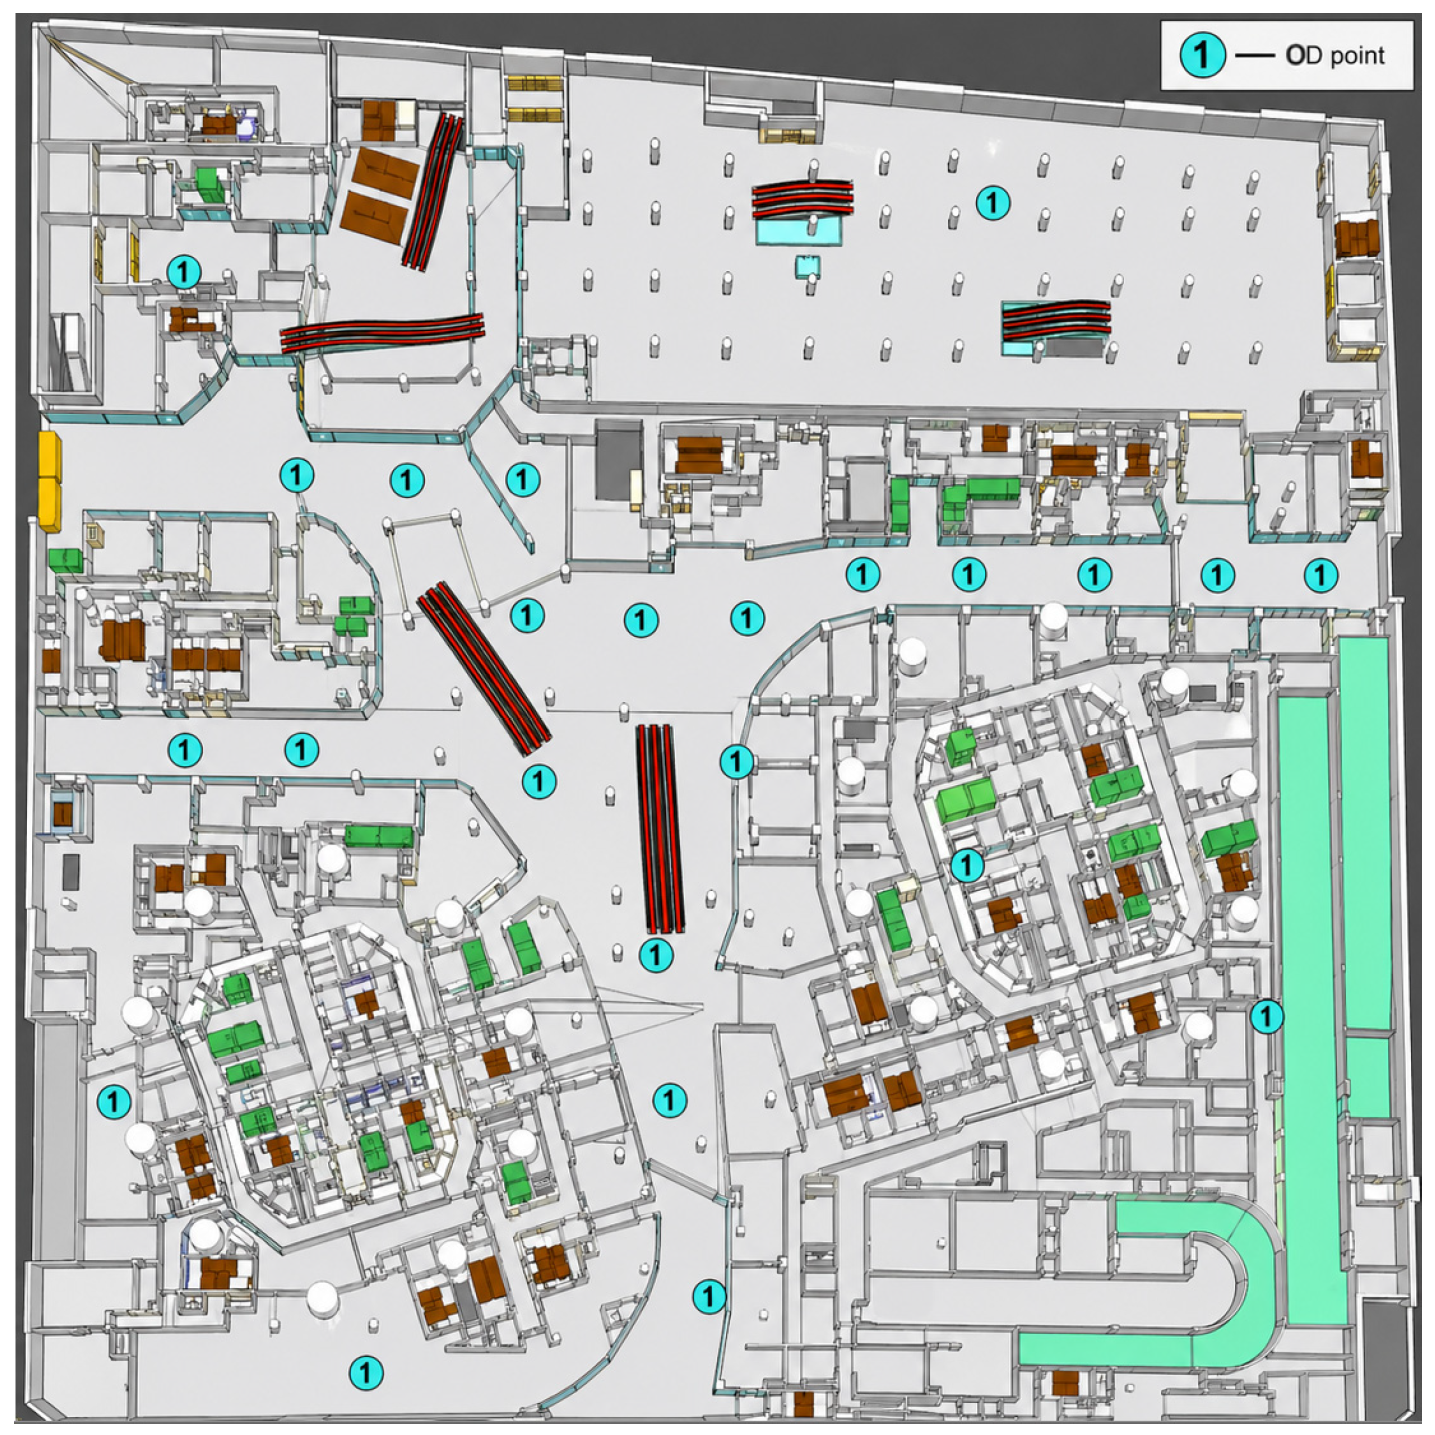
To further analyze the influence of OD distribution, this study sets four groups of simulation experiments. On the one hand, the study area is 180 m × 200 m; on the other hand, considering the comfortable walking width of 3 m for pedestrians, the OD layout should not be too dense. Therefore, OD points are uniformly arranged in the corridor area at intervals of 35 m, 25 m, 15 m, and 10 m, as shown in Figure 5, Figure 6, Figure 7 and Figure 8. On the one hand, to ensure comparability among different experiments; on the other hand, to minimize the mutual interference between pedestrians caused by high flow rates, the OD volume between all OD pairs is set to 2 persons per 15 min in the experiments, so as to simulate the performance of high-utilization areas under different layout densities. The statistical grid is the line frequency as the actual pedestrian flow; the higher the frequency, the greater the flow, and the higher the levels of space utilization. Finally, the raster flow is normalized by 0–1, which allows the visualization results to better show changes in high-value areas.
In particular, considering that space edges, narrow channels, or poor accessibility usually generate and attract less traffic in actual situations, in this study, we appropriately reduce the number of OD points in such areas, so that the simulation is more in line with the real law of space use.

4.1.2. Qualitative Analysis of the Influence of Spatial Structure

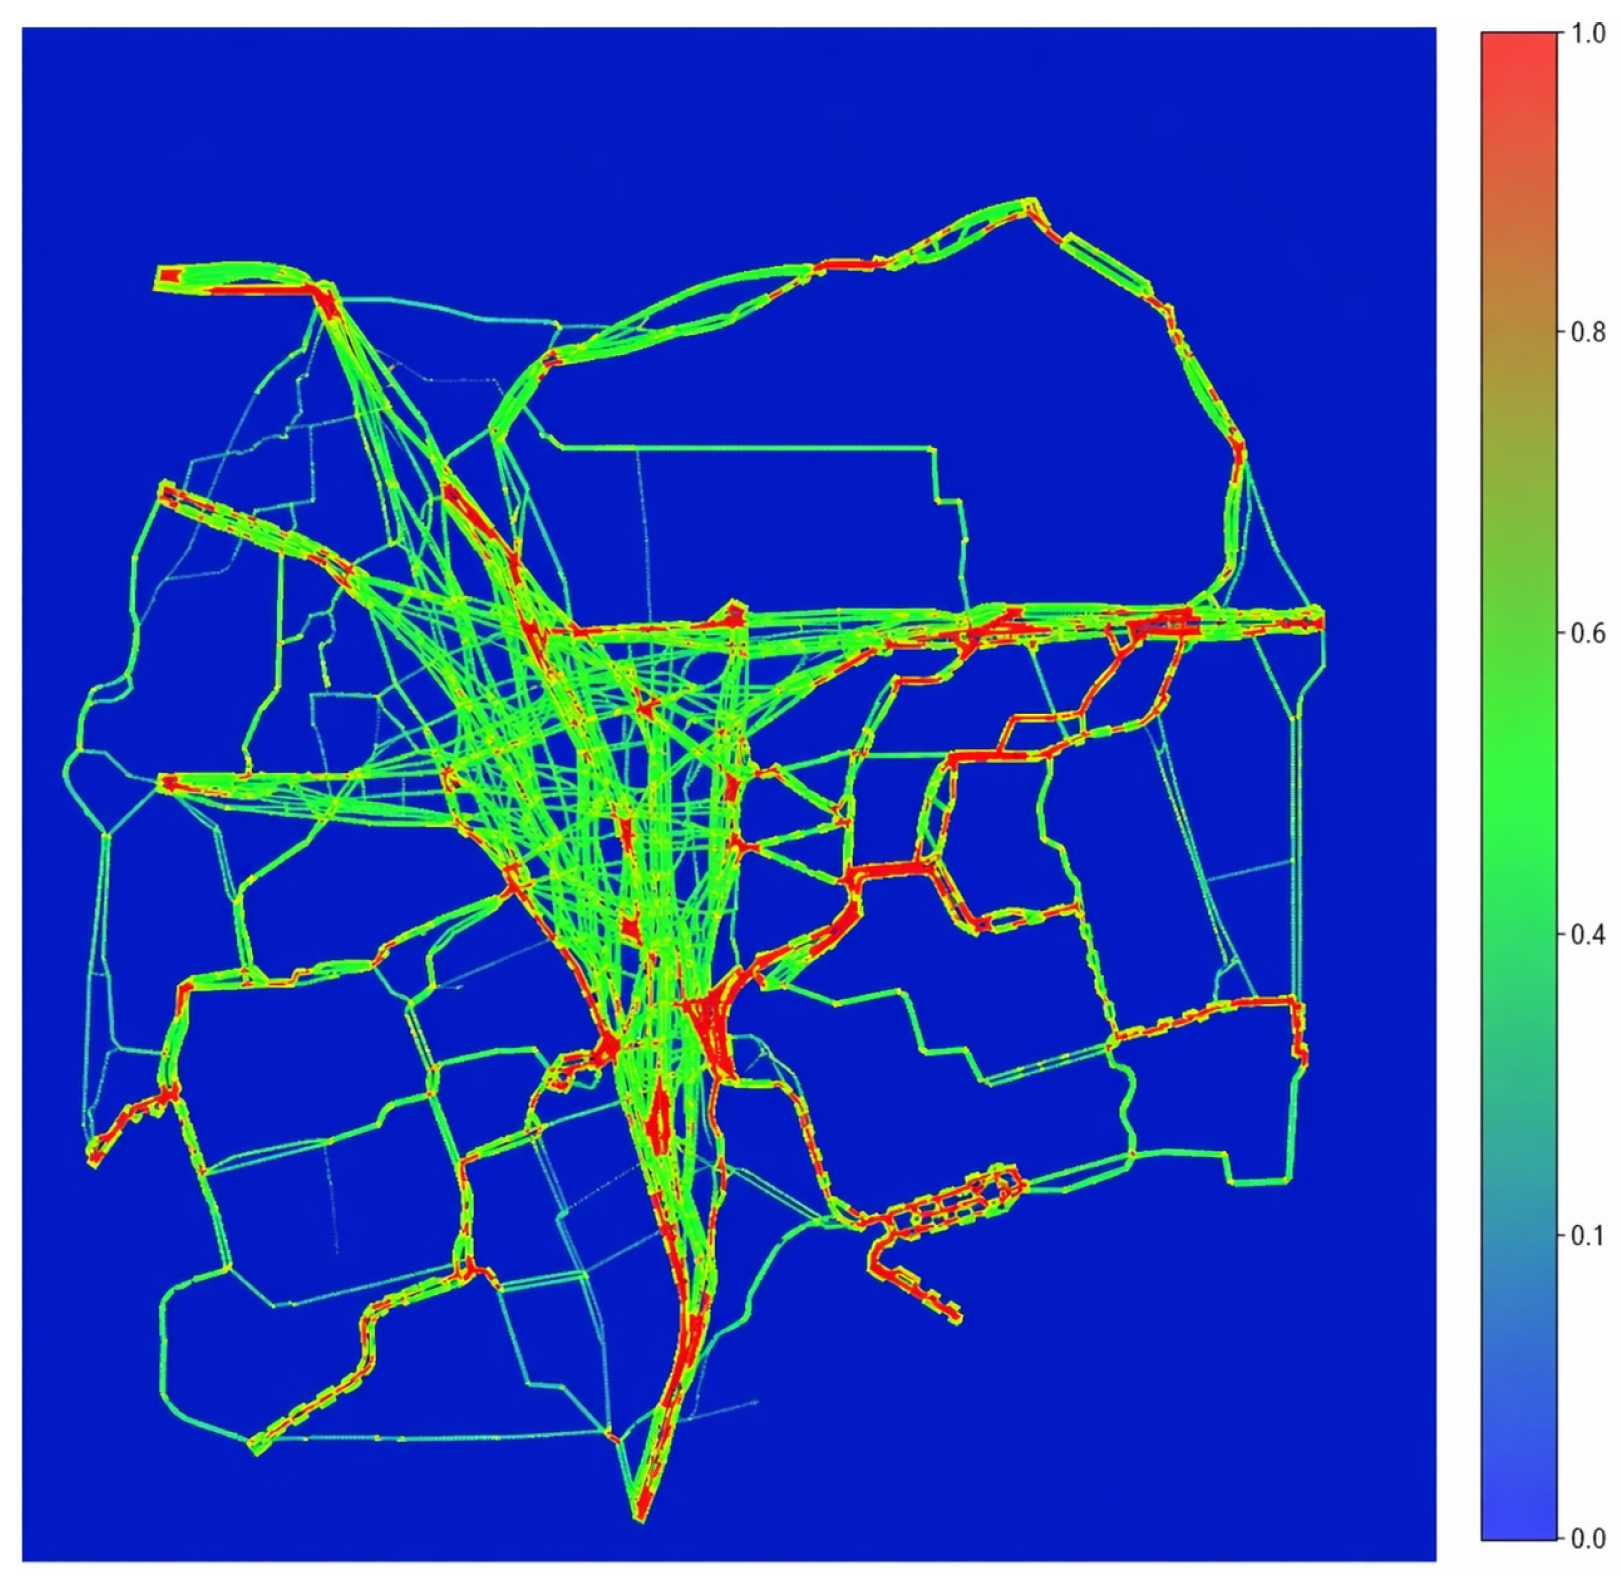
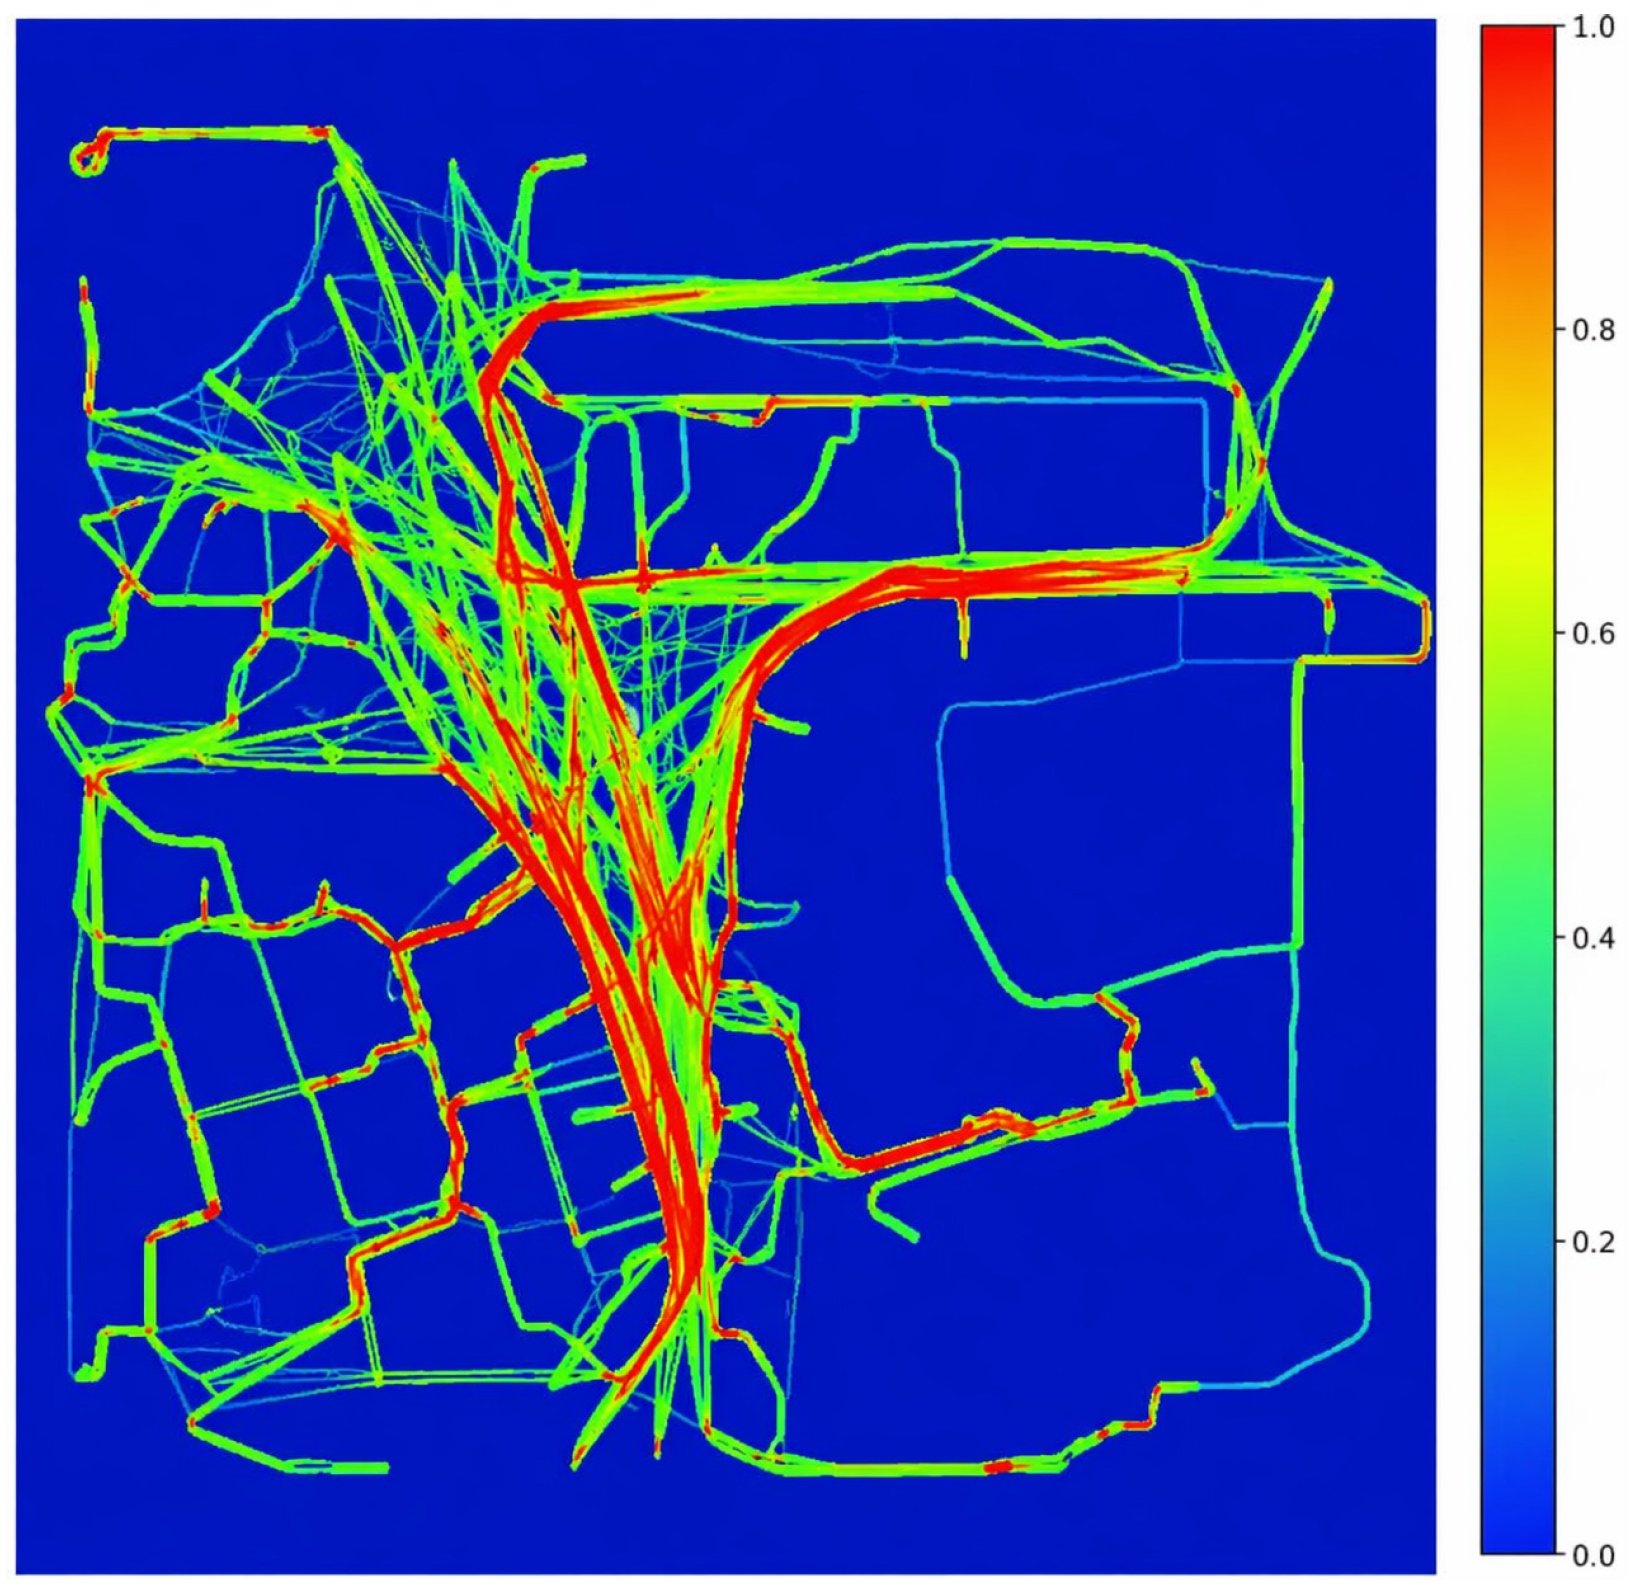
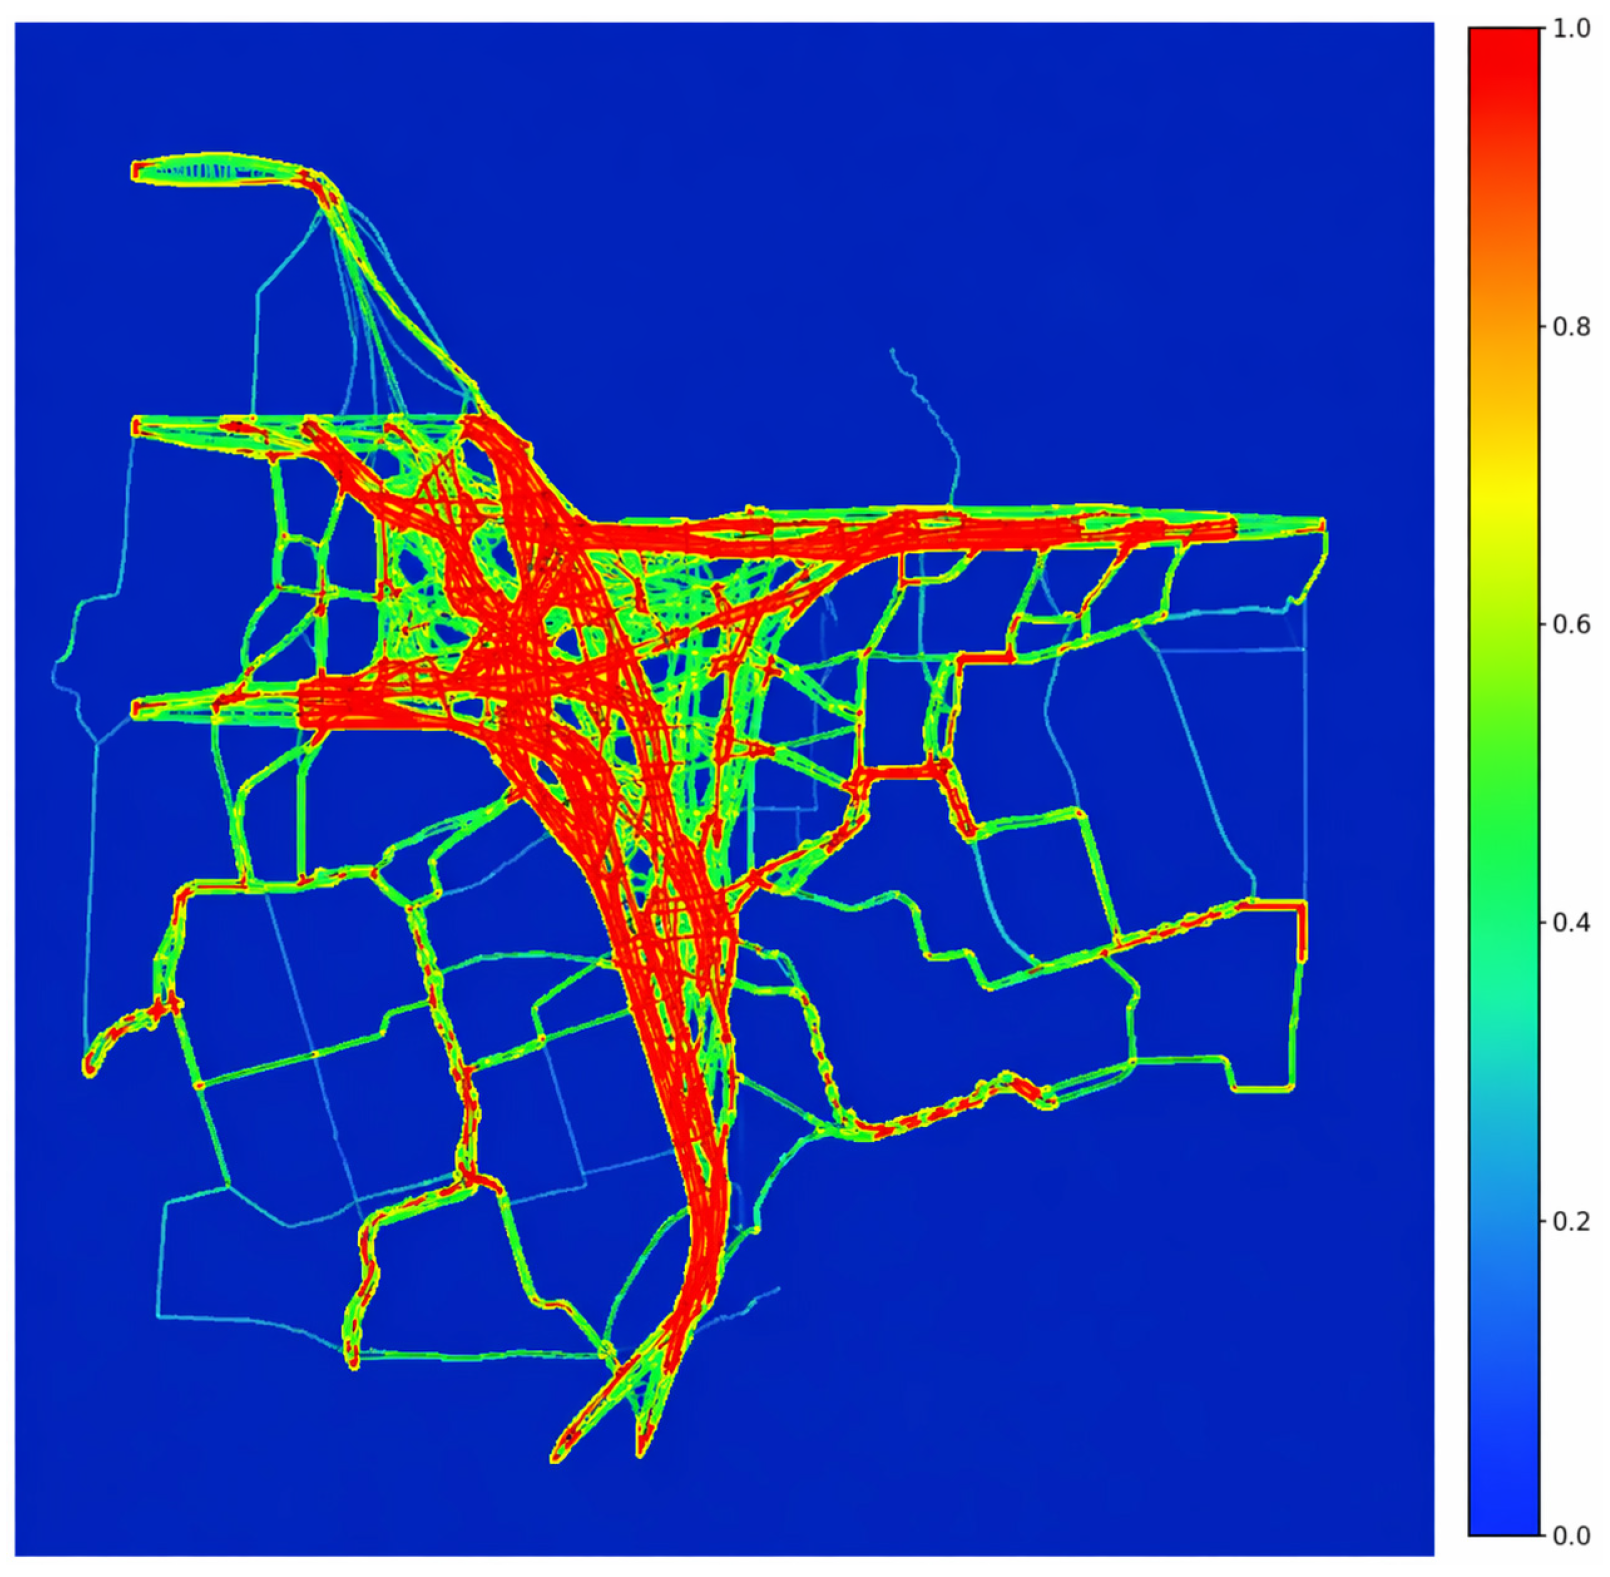
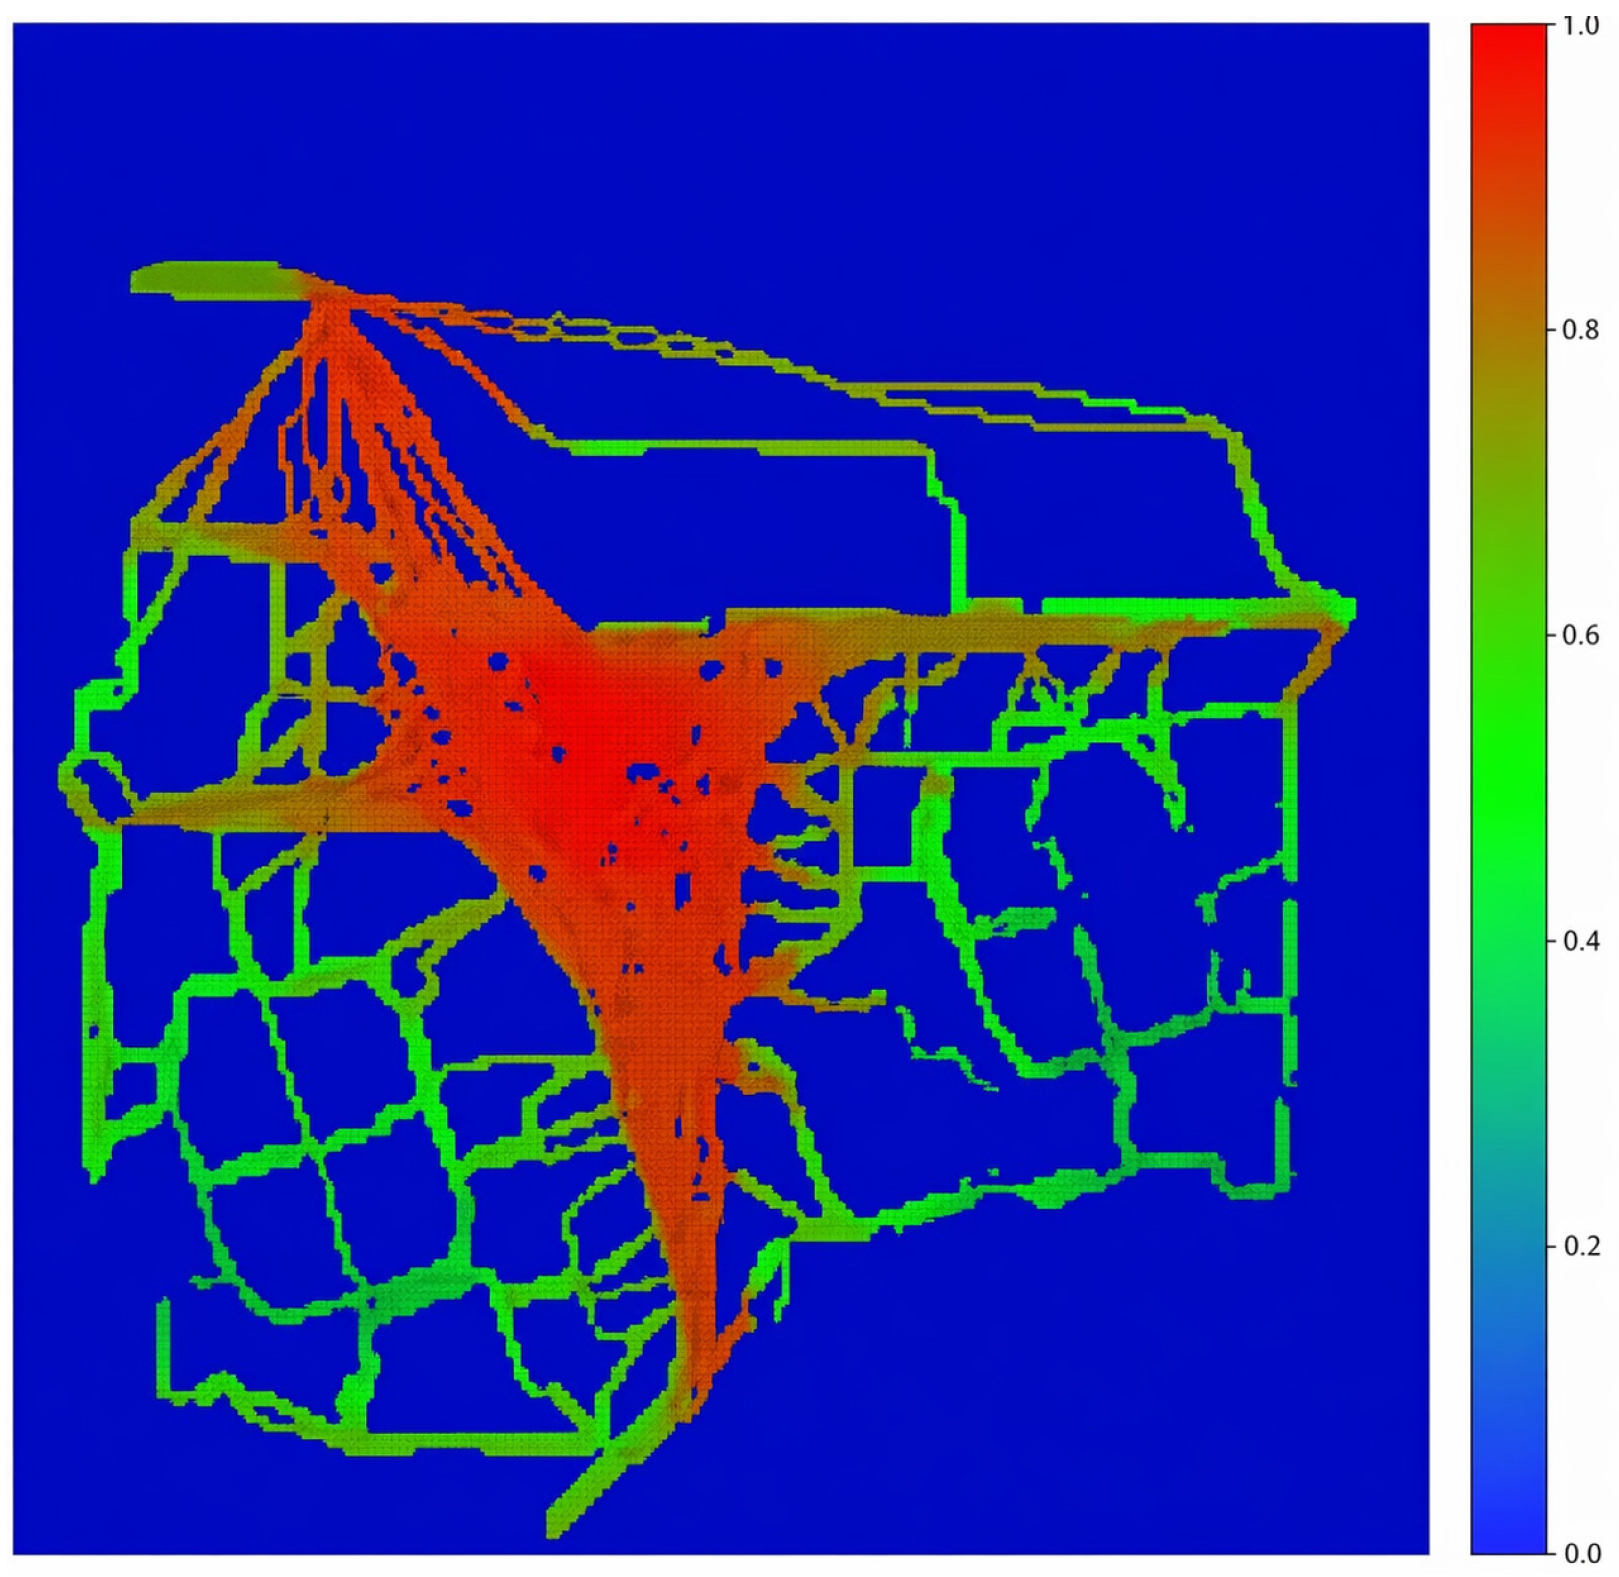
By processing and analyzing the simulation output, a comparison group diagram of traffic distribution and visual integration under different OD point deployment densities is obtained, as shown in the following figure. By observing the changes in high-traffic grid distribution, it can be seen that with the increase in OD pair deployment density, the high-value grid area in the space gradually moves from global dispersion to central contraction, and the consistency between traffic distribution results and visual integration analysis results is stronger, as shown in Figure 9, Figure 10, Figure 11, Figure 12 and Figure 13. Areas with higher visual integration showed higher flow levels, indicating that these locations had stronger visibility and reachability in the spatial structure, so it was easier to attract pedestrians to pass by, indicating that the spatial structure itself had a guiding effect on the flow. Thus, the important spatial structure factors influencing space utilization were verified from a qualitative perspective.
Quantitative analysis of the influence of spatial structure.
In order to quantitatively reveal the influence of spatial structure on pedestrian flow, in this subsection, we perform a correlation analysis on the experimental groups with different OD point spacings. The Pearson correlation coefficient can accurately measure the correlation degree between two variables when they are approximately continuous and the sample size is large, and the results have clear statistical interpretation and comparability. Therefore, we further carried out a Pearson correlation analysis between the degree of visual integration and the actual flow, and the data results are shown in Table 1. As can be seen from the table, with the increase in OD point distribution density, the Pearson correlation coefficient between variables showed a significant upward trend, from a weak positive correlation (0.2486) to a strong positive correlation (0.7056). The corresponding t-value increased from 2.867 to 9.807, and the standard error gradually decreased, and the overall significance, two-tailed significance, and one-tailed significance levels under all schemes were all equal (<0.0001), showing that there is a certain degree of positive correlation between variables, which is statistically significant. In other words, areas with higher visual integration tend to have higher flow levels and higher spatial utilization; that is, to some extent, spatial structure has an impact on spatial utilization.

4.2. OD Impact Index of Building Space Flow

4.2.1. Experimental Principles and Methods

Pedestrian OD is the direct source of flow in the spatial flow generation mechanism. In theory, when there is a quantitative increase in travel between two points, the local distribution of pedestrian OD will be obviously increased, thus affecting the use of space. Therefore, observing the impact of local OD on the overall flow pattern can be used to verify the direct driving effect of pedestrian OD on space utilization.
In this subsection, we look at pedestrian OD before and after the change in flow rate distribution mainly from two aspects in order to validate how pedestrian OD affects the use of space:
(1) Multiple OD pairs were set to test the rationality of the improved method of defining the space affected by pedestrian OD.
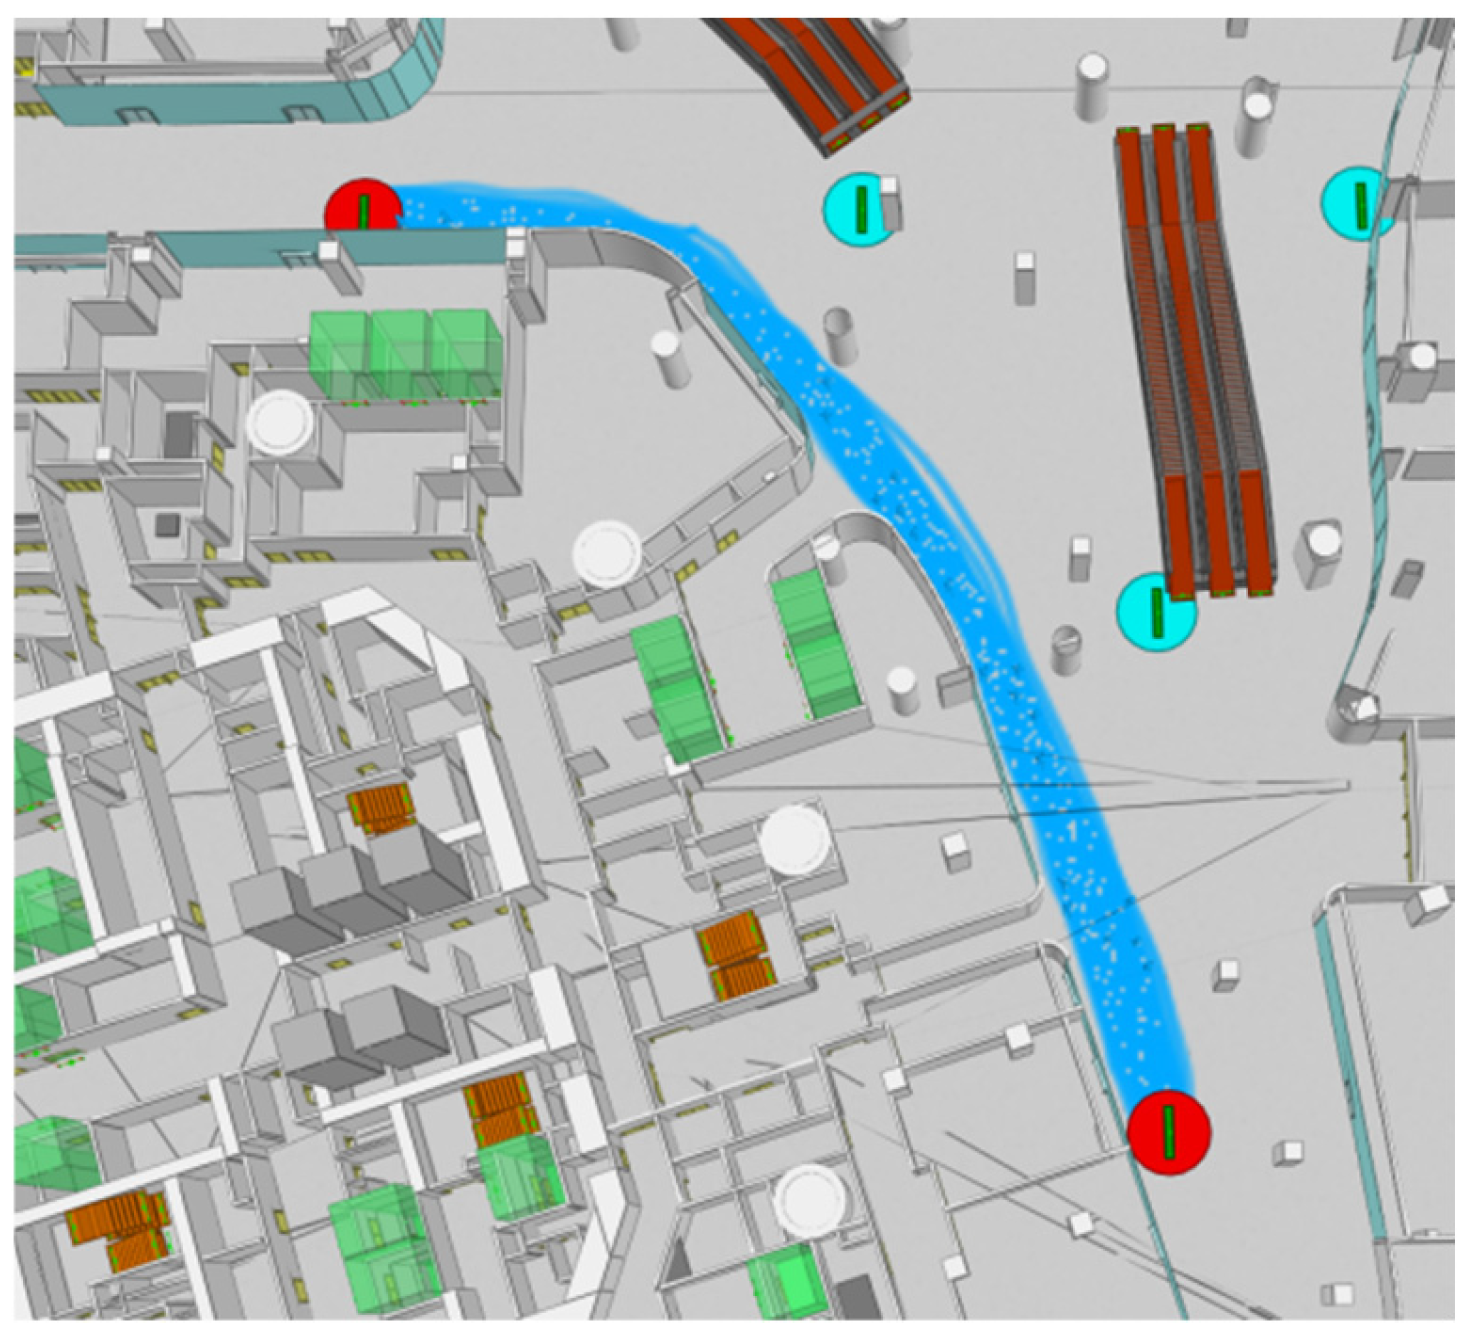
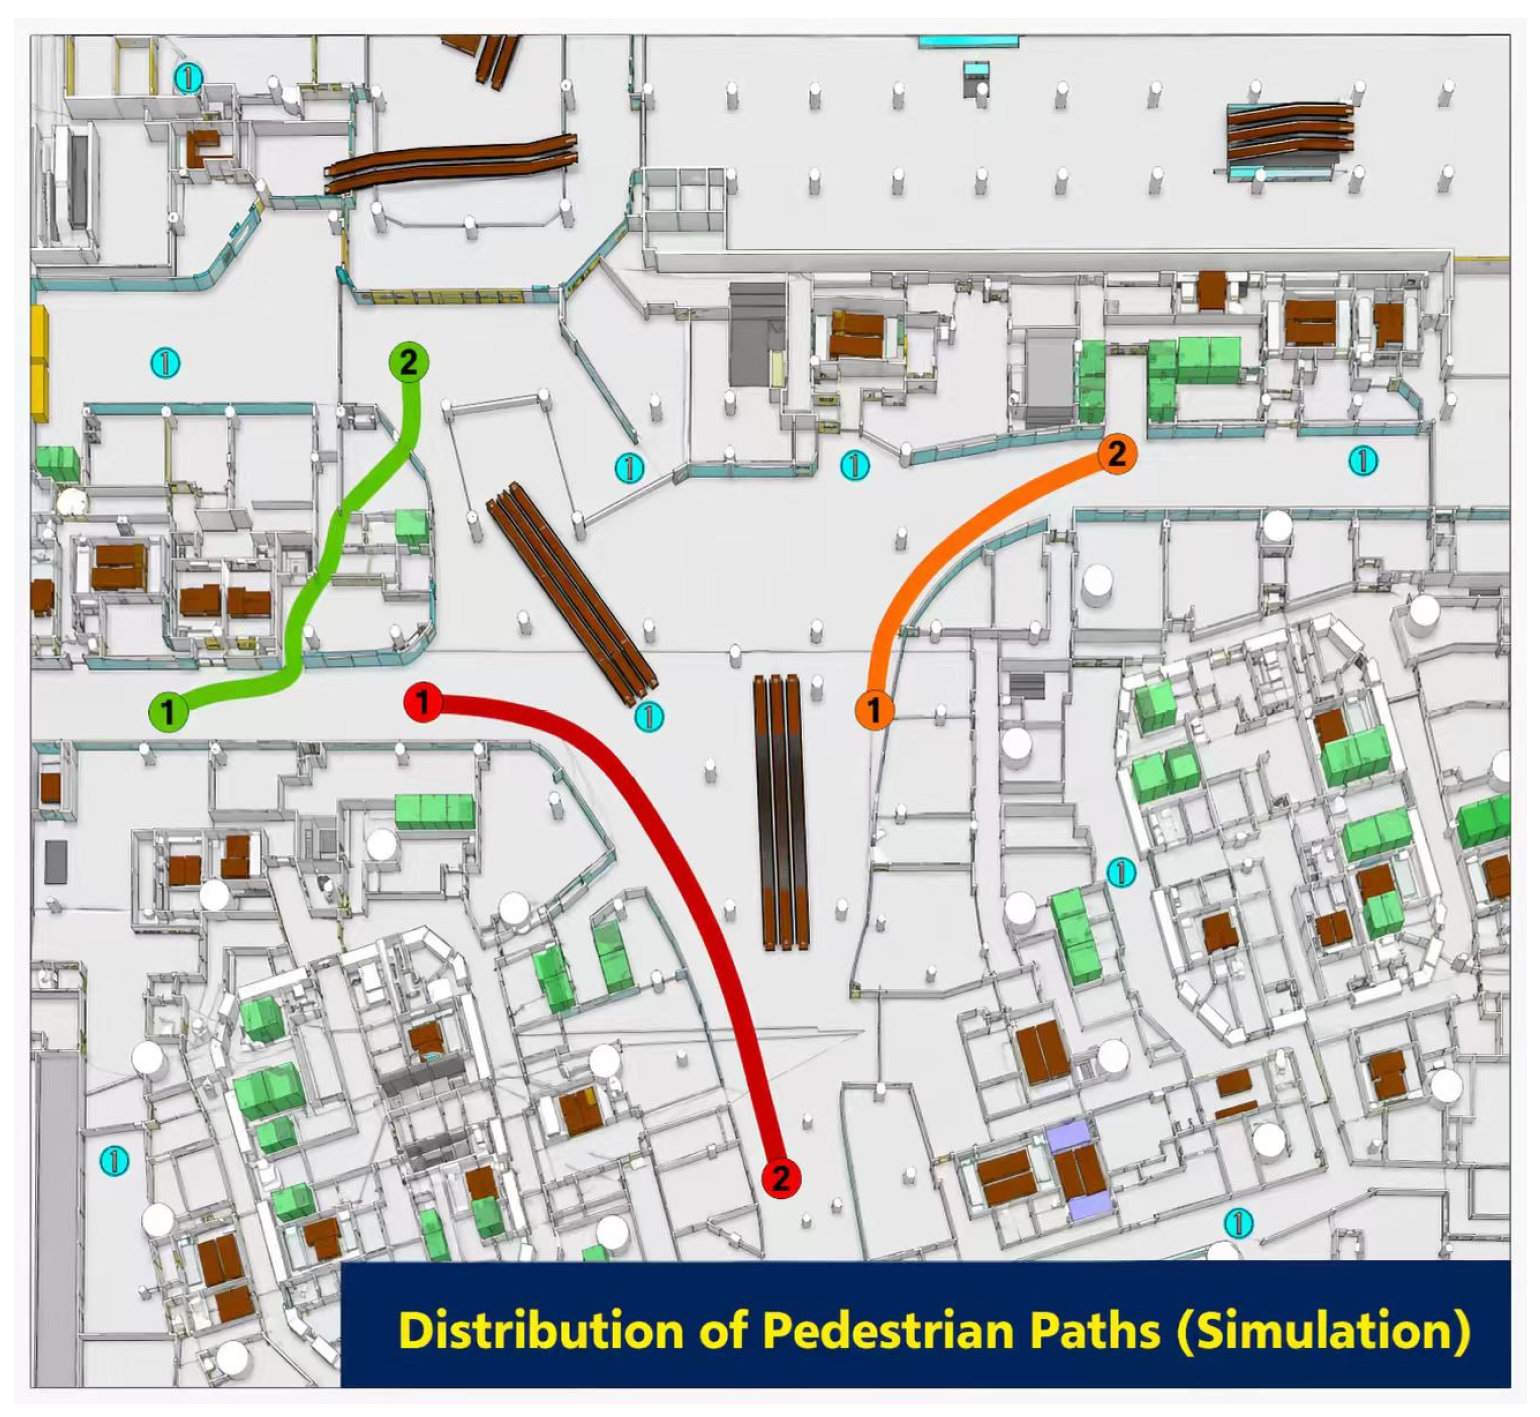
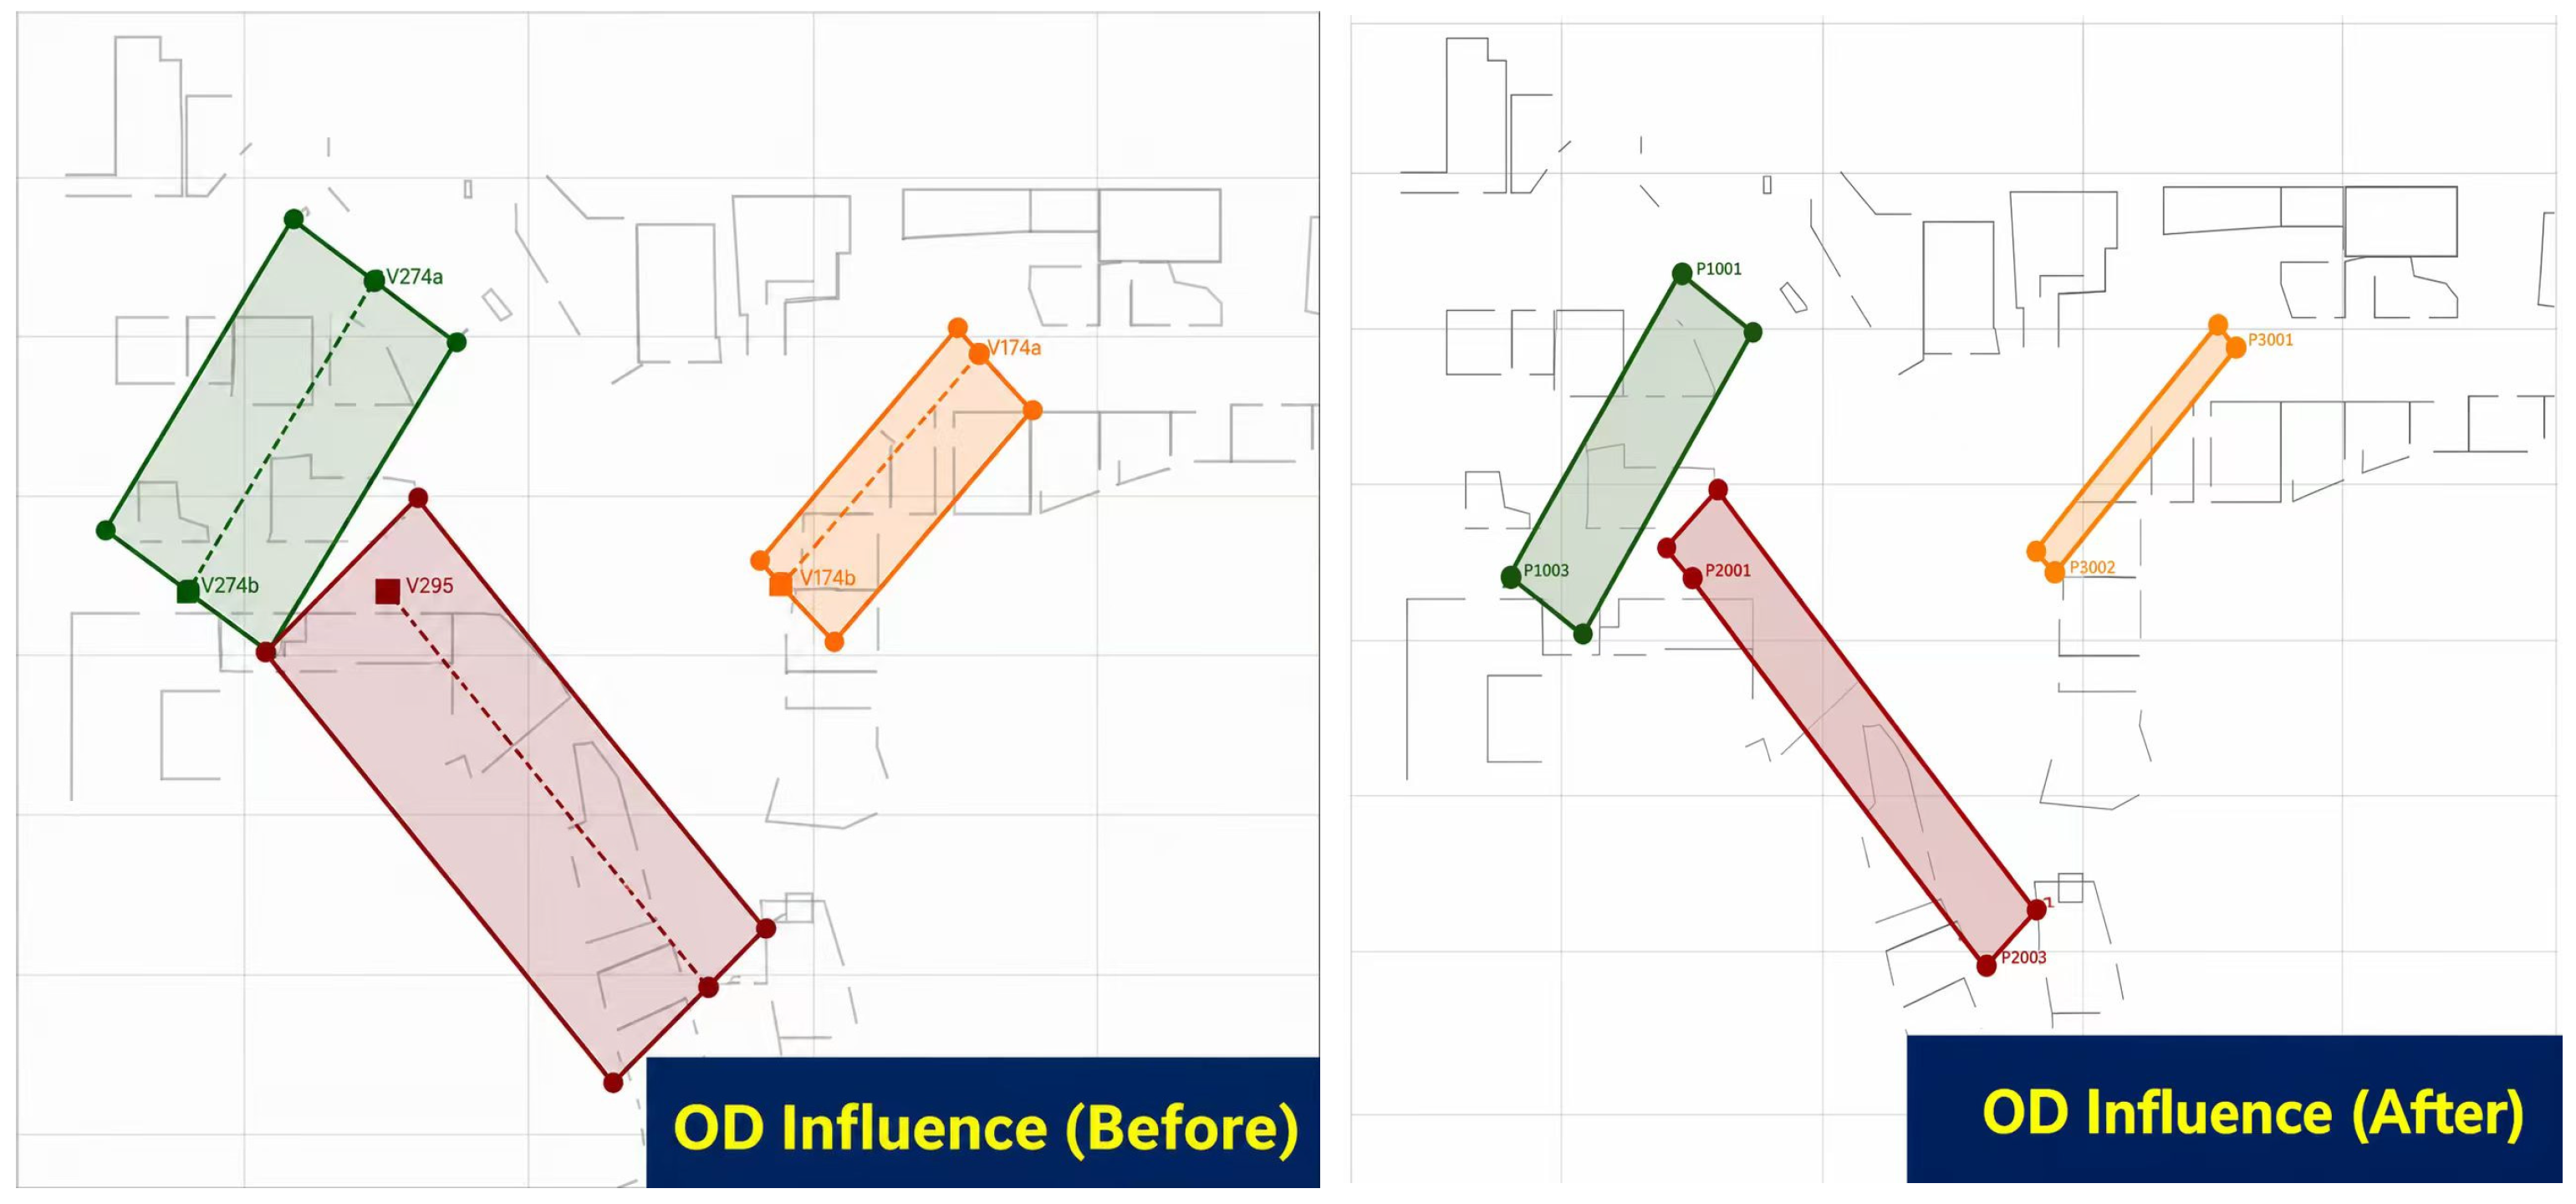
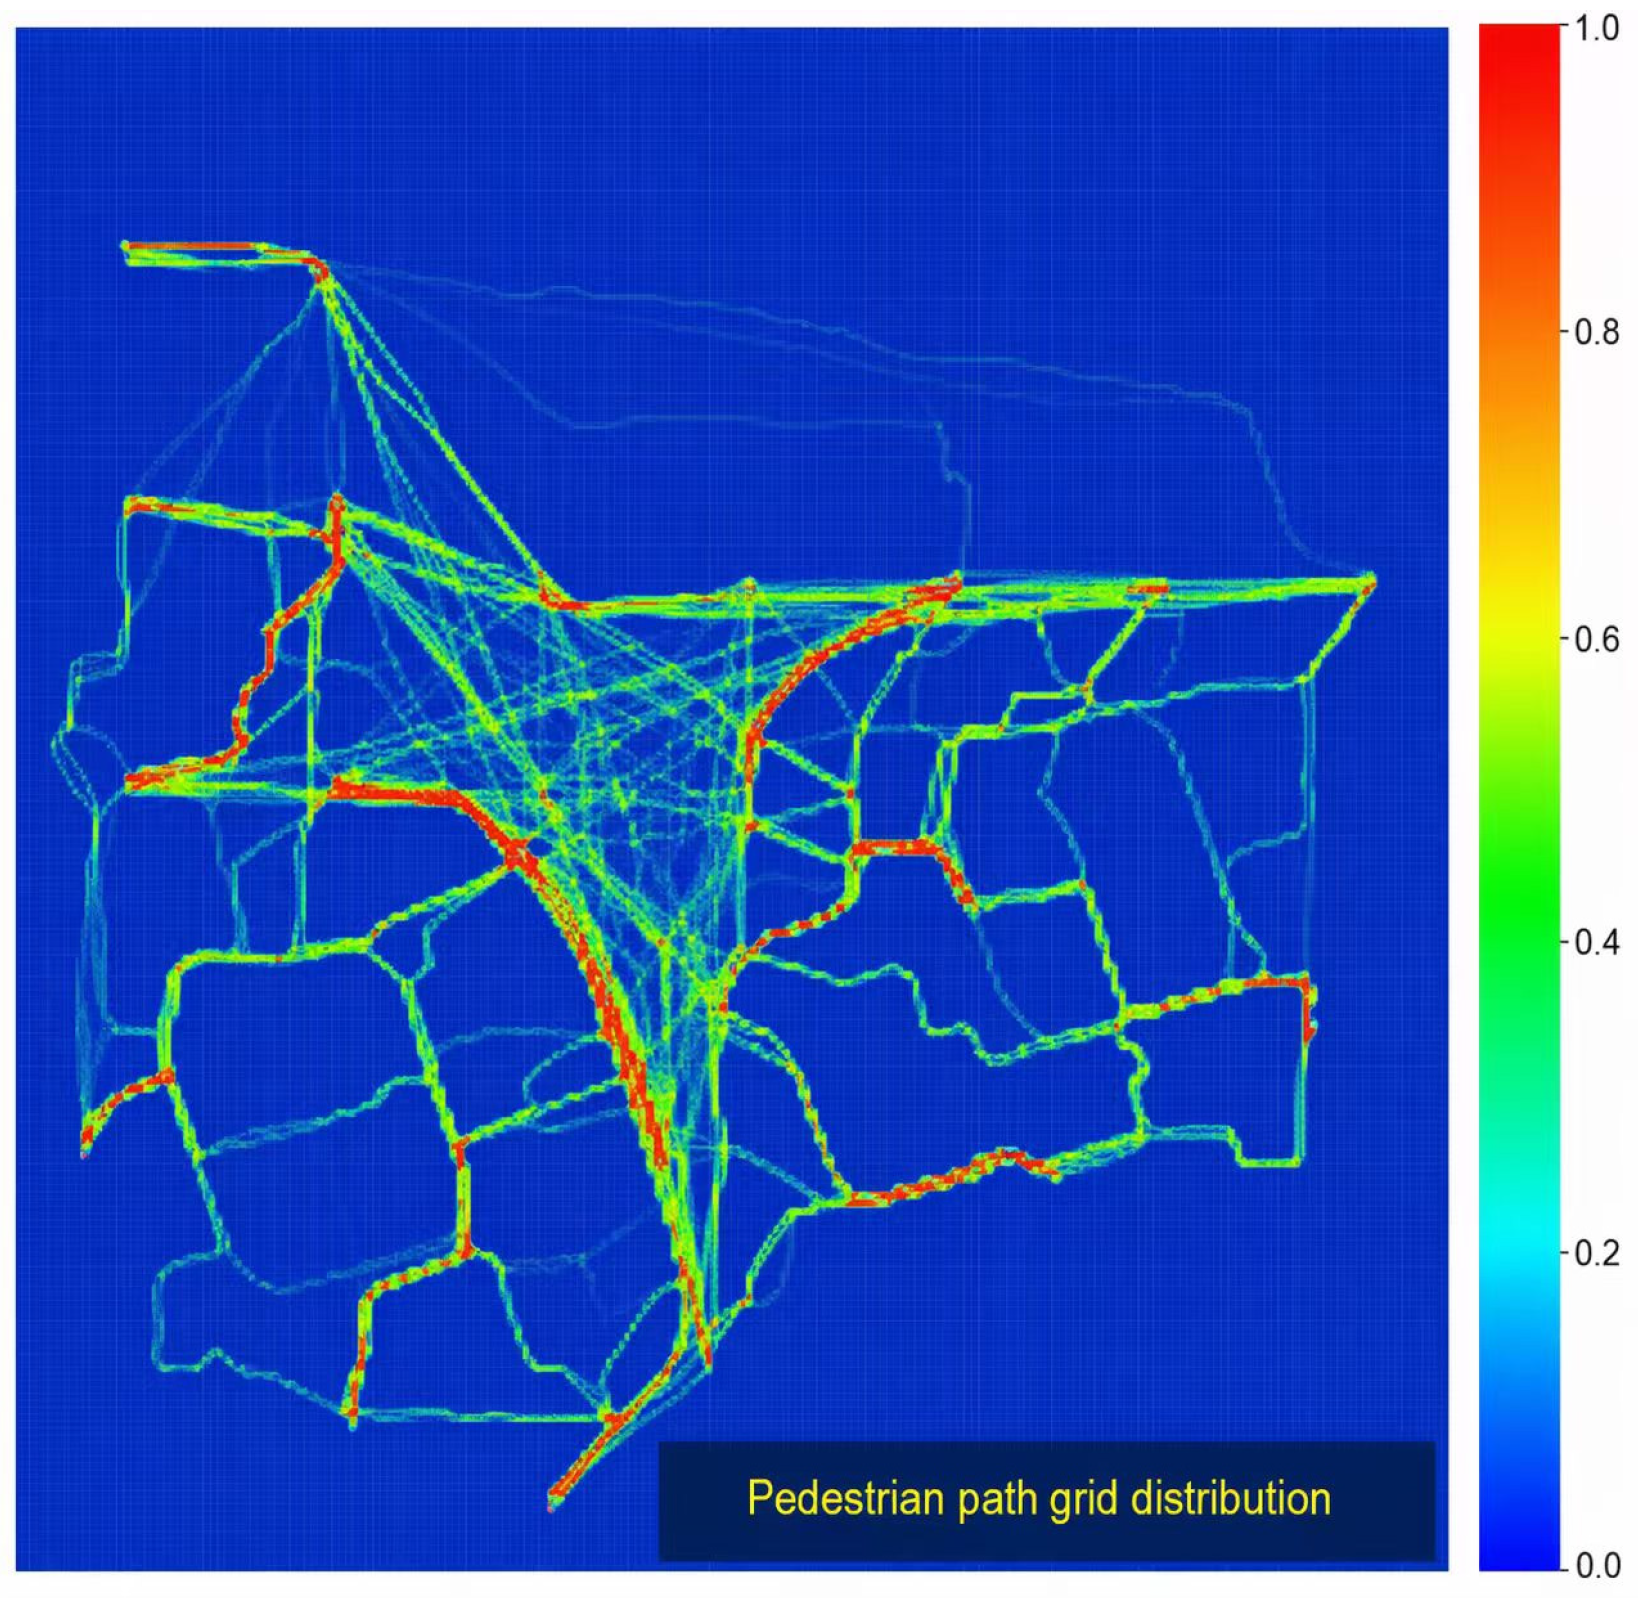
Keeping the space structure, grid division, and other simulation as invariable parameters, we randomly selected three OD pairs as the experimental object and examined the influence on space and visualization separately for each pair of OD points before and after the improvement in OD. The results are shown in Figure 14 and Figure 15. In the simulation, the grids covered the statistical paths and the OD influence space.
In order to verify the rationality of the improved OD influence space, in this part, we quantified the improvement effect by designing two indicators: “accuracy” and “path raster proportion.”
Accuracy refers to the probability that the pedestrian path grid falls in the OD influence space and represents the ability of the OD influence space to contain the pedestrian path. The calculation method is as follows:
Accuracy = Number of path grids falling within the influence space Total number of path grids
Path proportion refers to the proportion of path grids in the grids contained in OD influence space and represents the redundancy rate of OD influence space. The calculation method is as follows:
Path ratio = Number of path grids falling within the influence space Total number of grids contained in the OD influence space
(2) Different OD values are set for the same OD group to observe the changes in high traffic grid distribution.
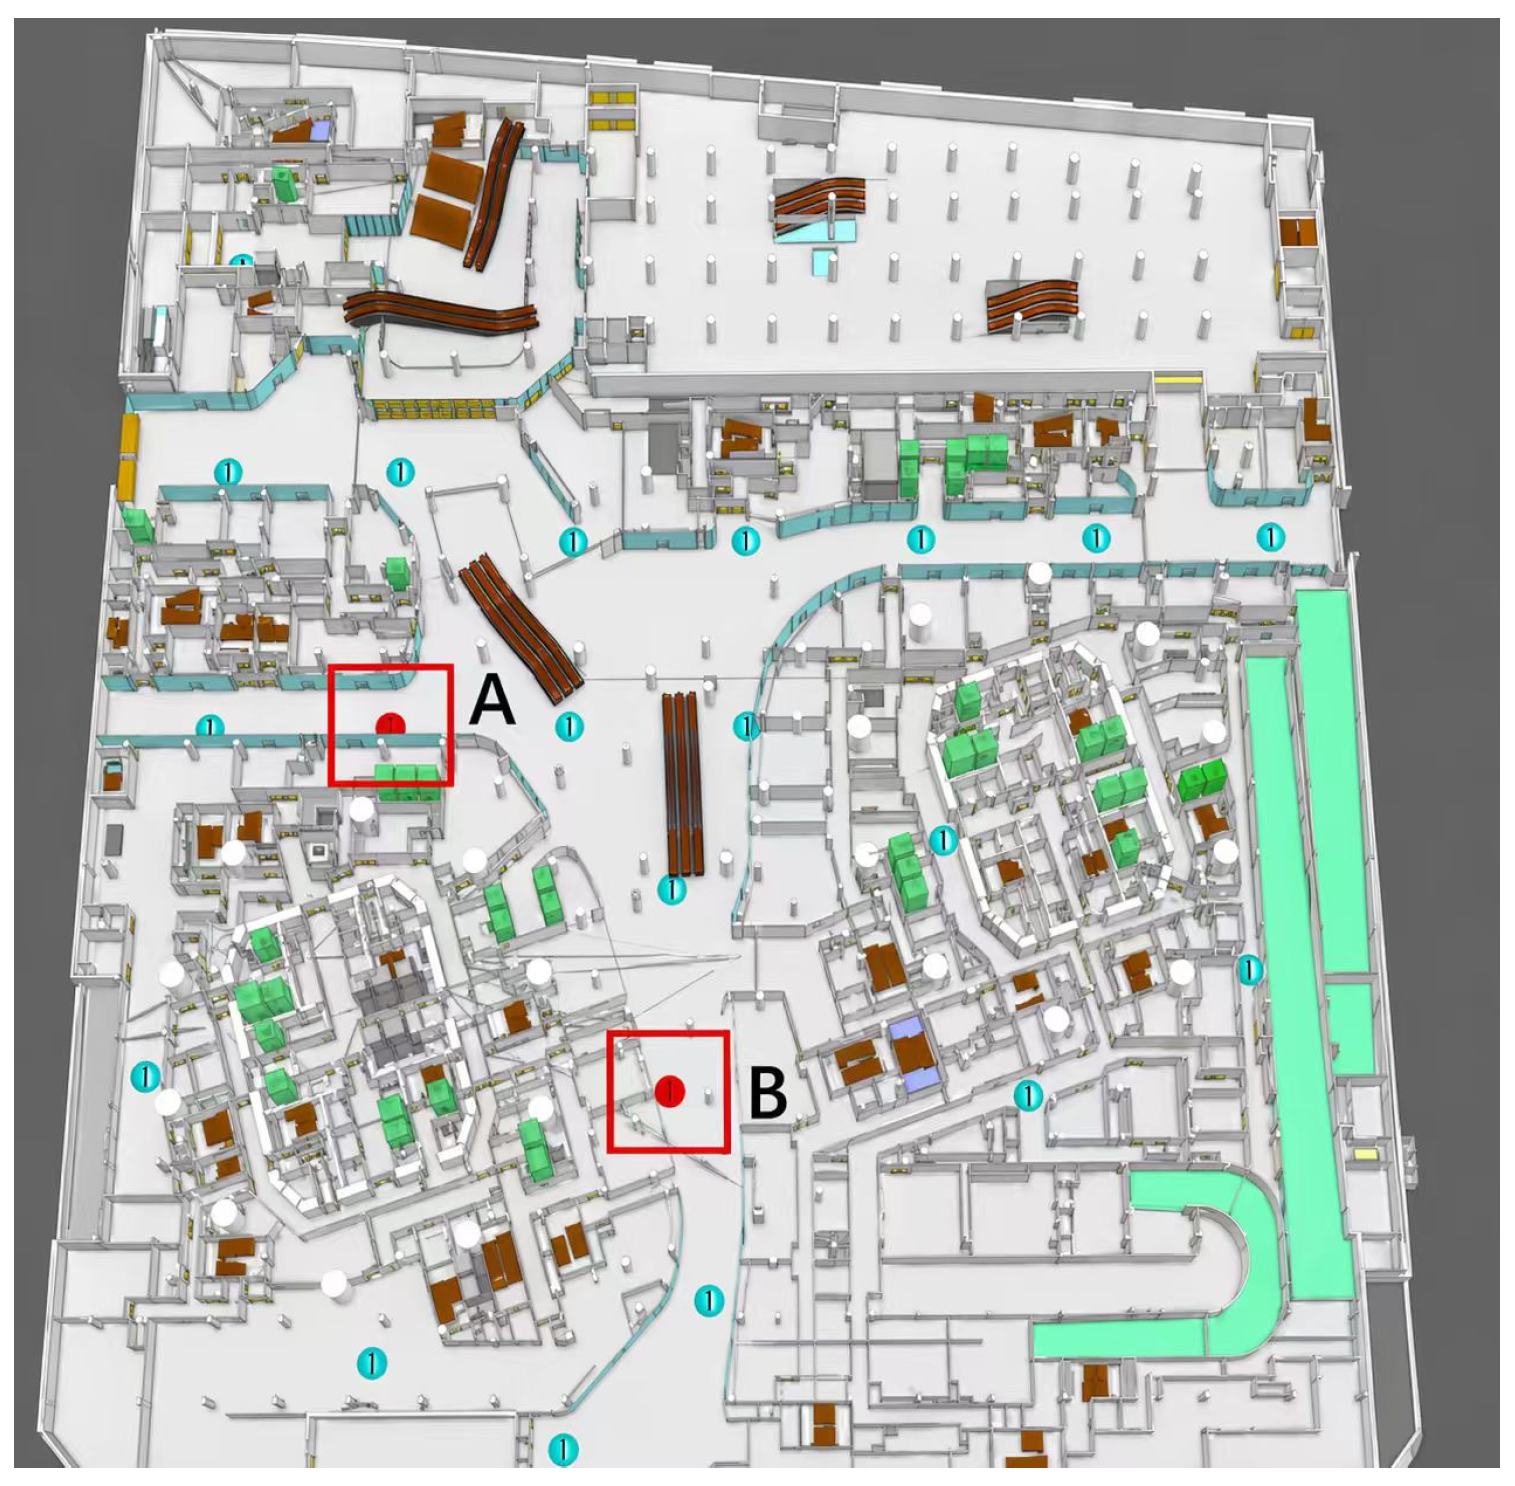
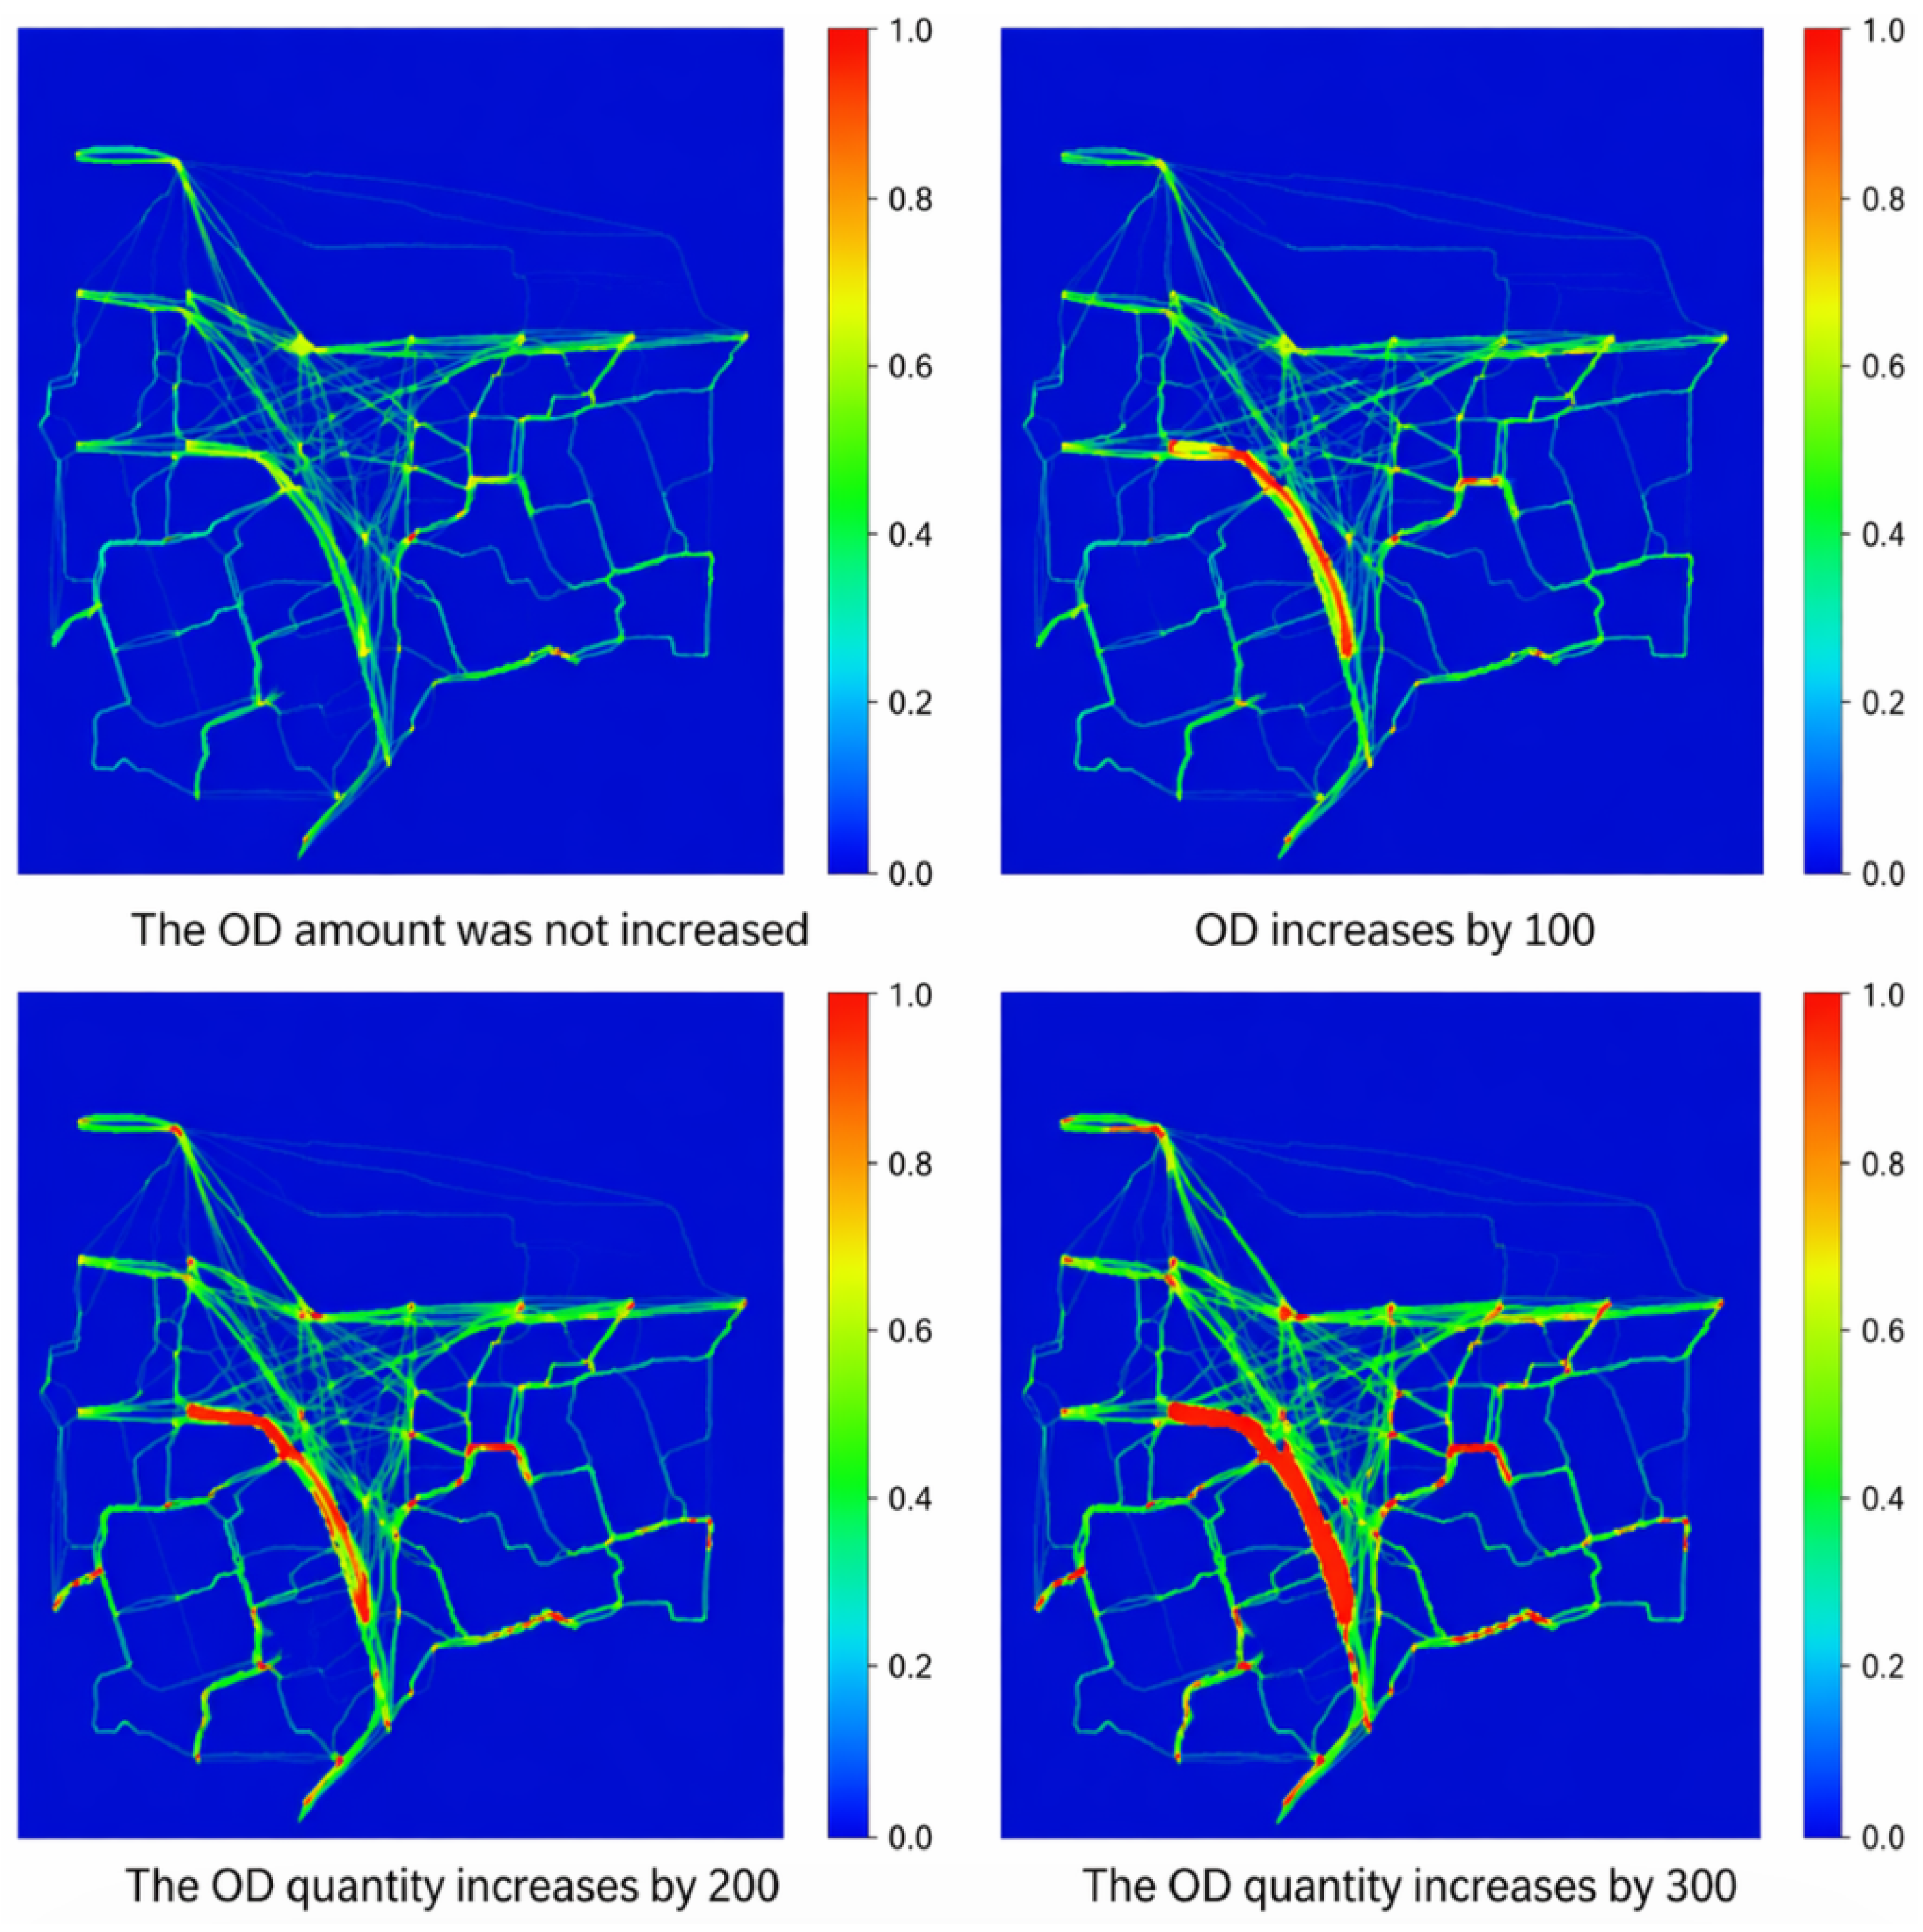
In this section, while keeping the positions and volumes of other OD pairs in the simulation scenario unchanged, Points A and B are selected as the experimental objects (as shown in Figure 16). With reference to the passenger flow at Gangxia North Station during the morning peak hours of Shenzhen Metro, the OD volume between these two points is gradually increased by 100 persons per 15 min, 200 persons per 15 min, and 300 persons per 15 min, respectively, to simulate the scenario where the demand intensity between the two points rises gradually. The distribution of high-flow grids and whether large-scale adjustment occurs in the overall spatial utilization are observed, so as to verify the impact of OD volume on spatial utilization.

4.2.2. Improving the Rationality Analysis of Pedestrian OD Influence Space

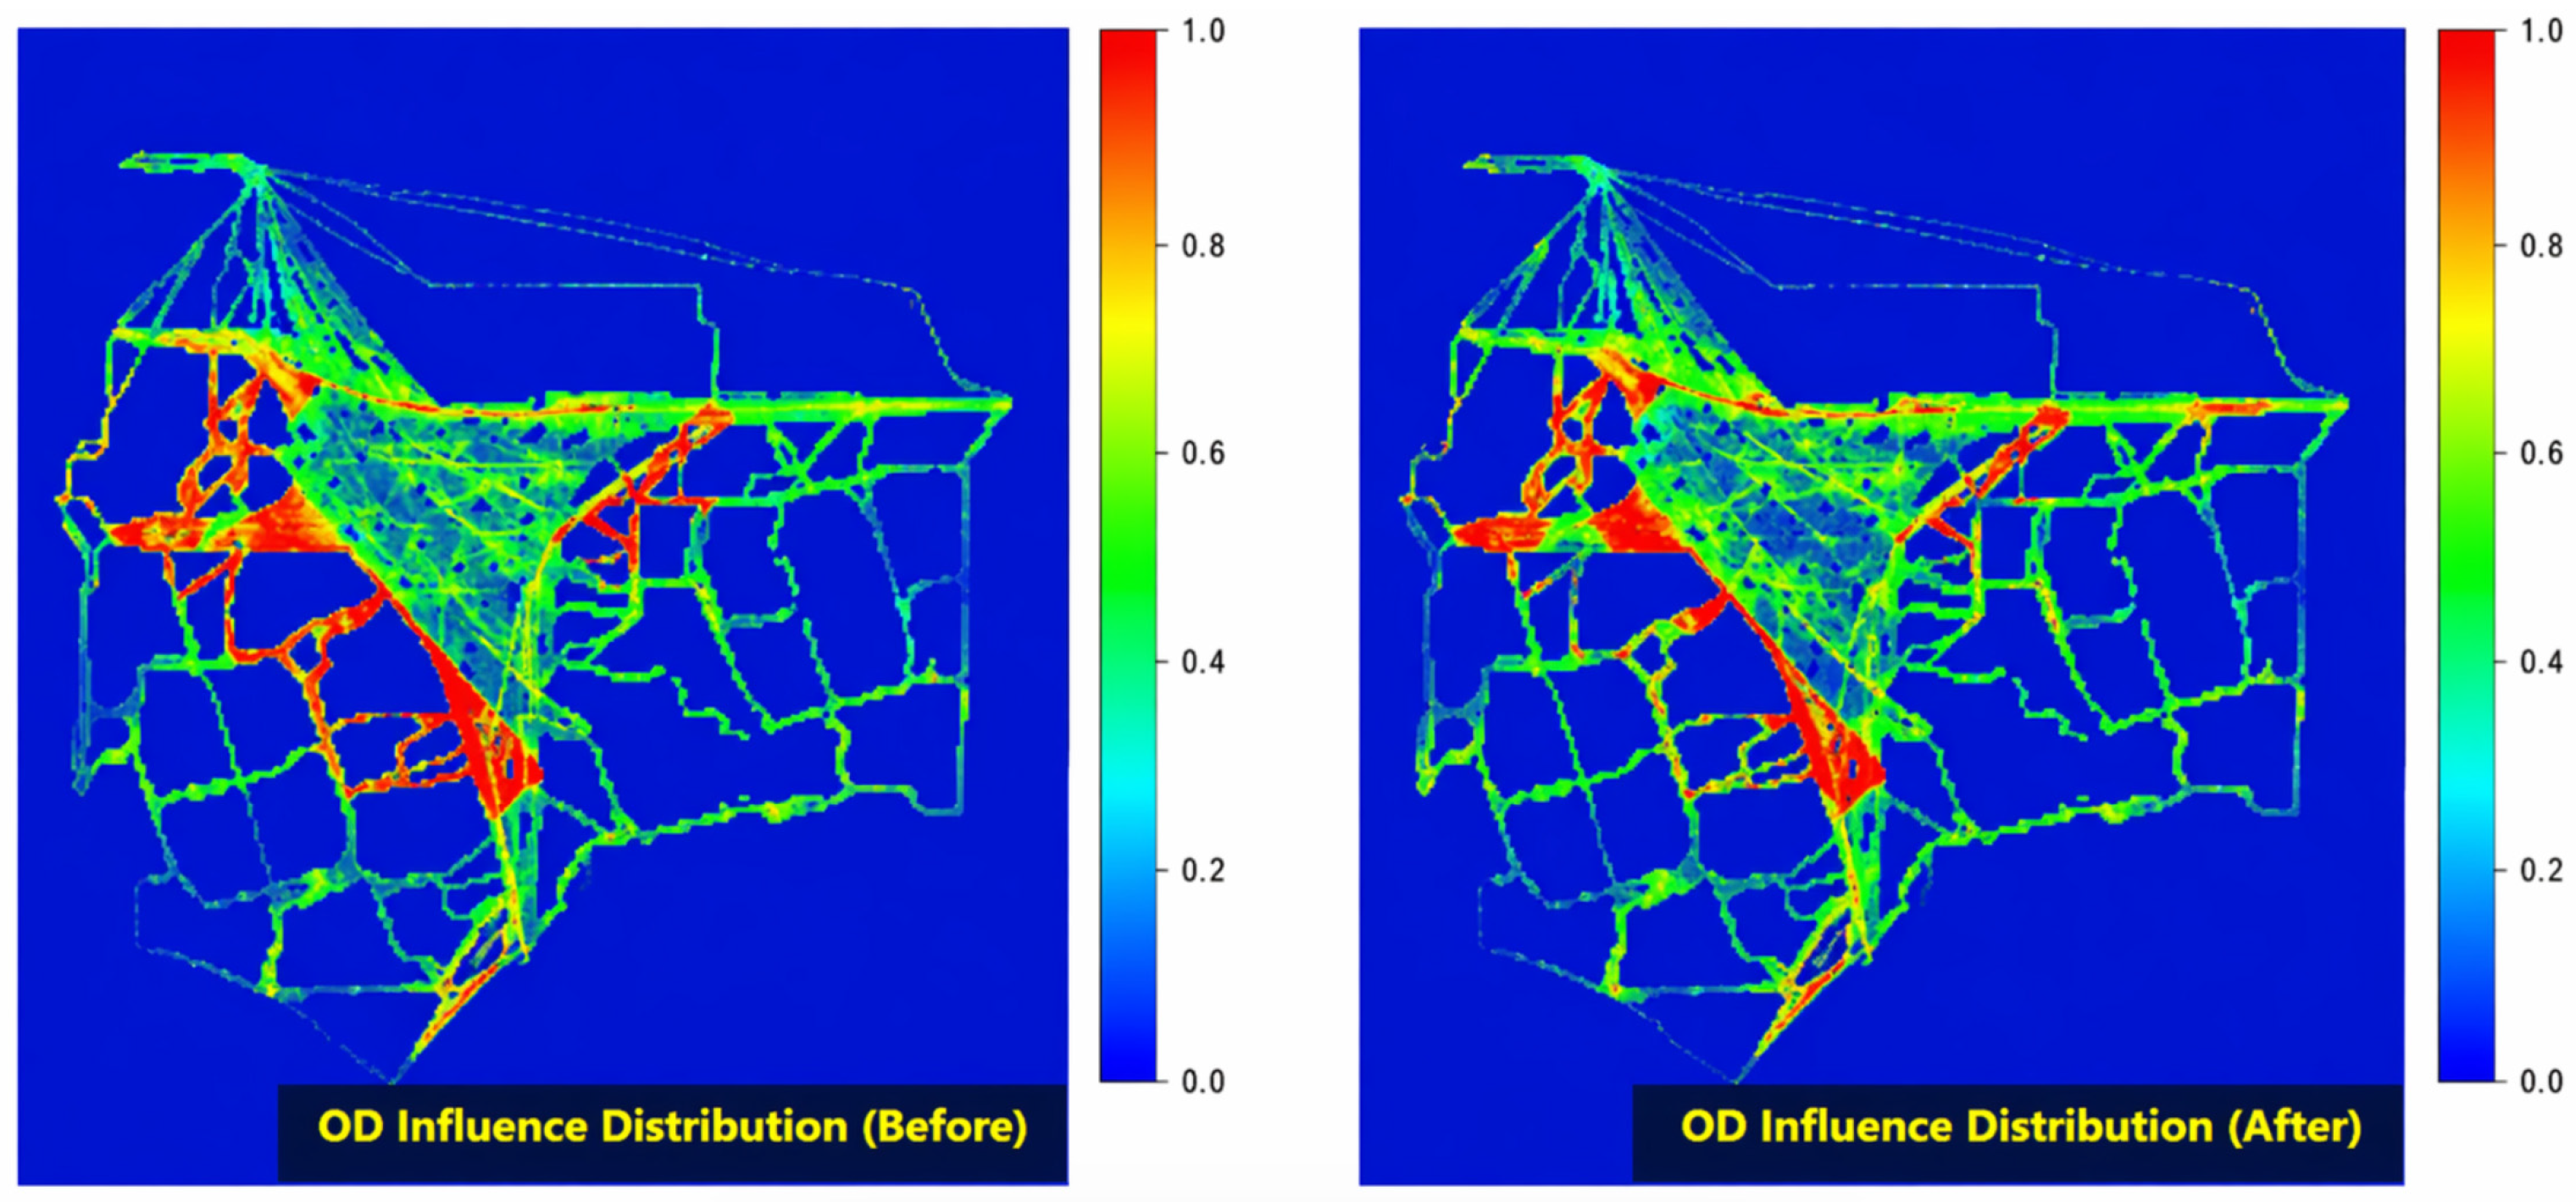
The analysis results show that the improved OD influence space can more accurately capture the actual utilization of the local area by pedestrian travel and more fully describe the pedestrian path. Firstly, in terms of the proportion of path grids, the growth rate of the improved OD influence space is higher than 100% compared with that before improvement, which indicates that the improvement of the original definition method of OD influence space can effectively reduce the error of OD influence quantification. In addition, the analysis of the accuracy index shows that there is little difference in OD influence space accuracy before and after the improvement. Although the accuracy decreases slightly after the improvement, it is still at the level of more than 85%, indicating that most of the pedestrian path grids fall into the constructed OD influence space. Therefore, the improved definition method of OD influence space is reasonable to a certain extent. The specific data and effect diagram are shown in Table 2 and Figure 17 and Figure 18.

4.2.3. Pedestrian OD Impact Analysis

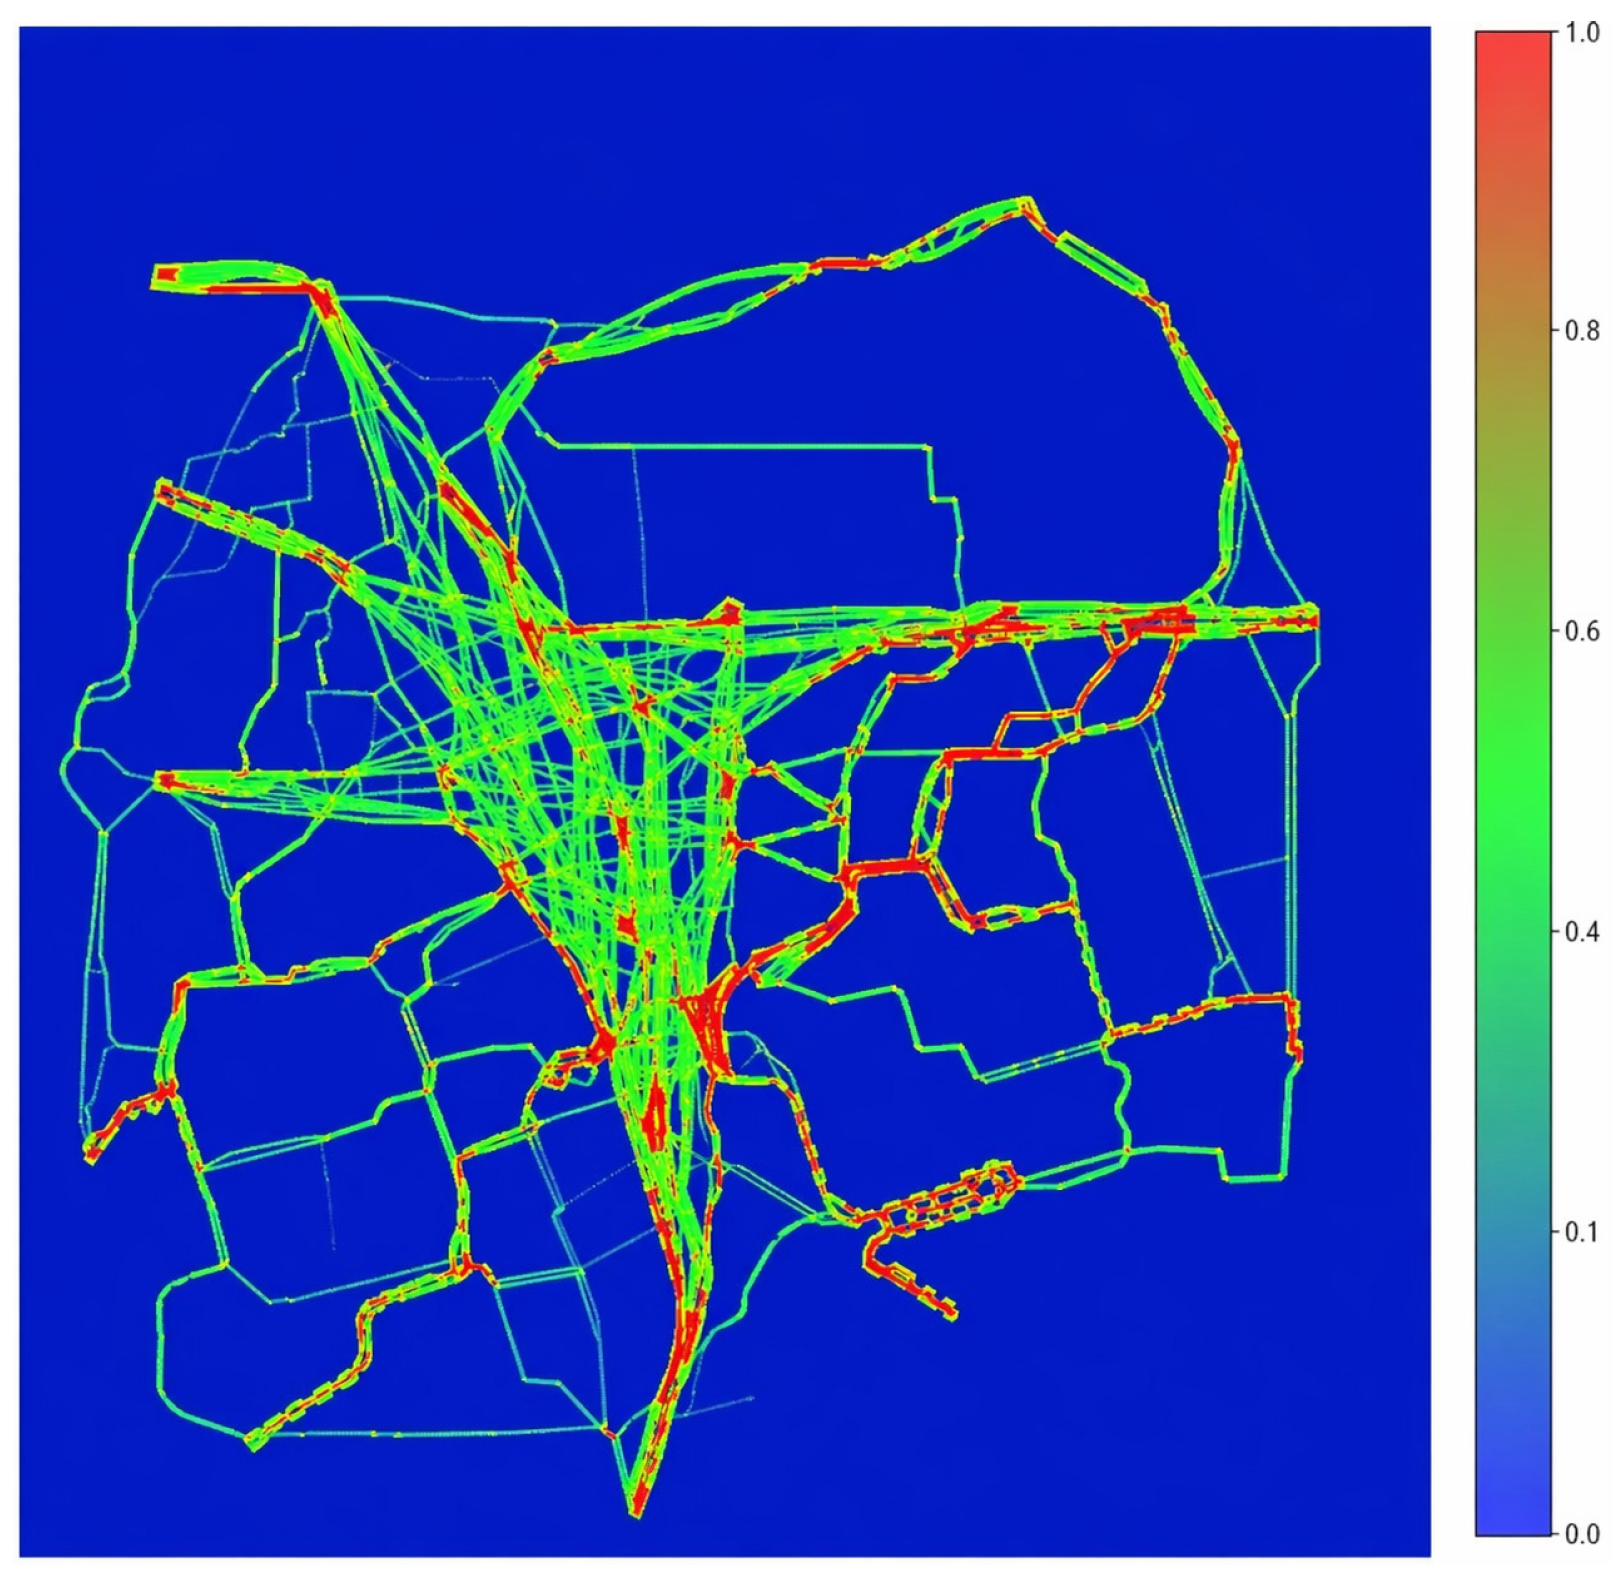
By observing the changes in traffic distribution, it can be seen that with the increase in OD between two points A and B, the flow in the local area connecting the two points increases significantly, and so does the space utilization degree, forming a clear high value band. However, the flow in other areas essentially remains stable; that is, there is no large-scale change in the flow distribution, and its change is mainly affected by the change in pedestrian OD at A and B, which verifies that pedestrian OD has a significant positive role in space utilization. The simulation output results were processed and analyzed, and a normalized actual flow visualization map was obtained as shown in Figure 19.

4.3. Comprehensive Impact Index of Building Space Flow

According to the OD influence space quantification method in Section 3.3.1, for two points A and B in the channel area in 3.3.2, the corresponding influence space rectangle was constructed, as shown in Figure 20 and Figure 21, and the coordinates of four vertices were output at the same time. Then, the simulation results were processed, the distribution of pedestrian paths was analyzed, and the grids covered by pedestrian paths were counted. The results show that the OD influence AB interval contains grid 214, which falls in the direct path of OD influence space grid 209, accounting for 97.66%. In other words, most of the pedestrian path grids fall into the constructed OD influence space, indicating that the space division can accurately capture the actual utilization of local areas by pedestrian travel.
Firstly, we compared and selected the appropriate regression model to establish the mapping relationship between the grid utilization intensity and the actual pedestrian flow, and converted the grid utilization intensity value into the corresponding pedestrian flow value to reflect the association between the potential utilization degree of space and the actual pedestrian flow distribution. Then, referring to the relevant traffic classification standards, the flow results obtained by regression were divided into intervals, and the seed grids were obtained according to the different level thresholds, so as to describe the utilization degree and distribution differences of different grids.

4.4. Regression Analysis of Architectural Space Flow Calculation

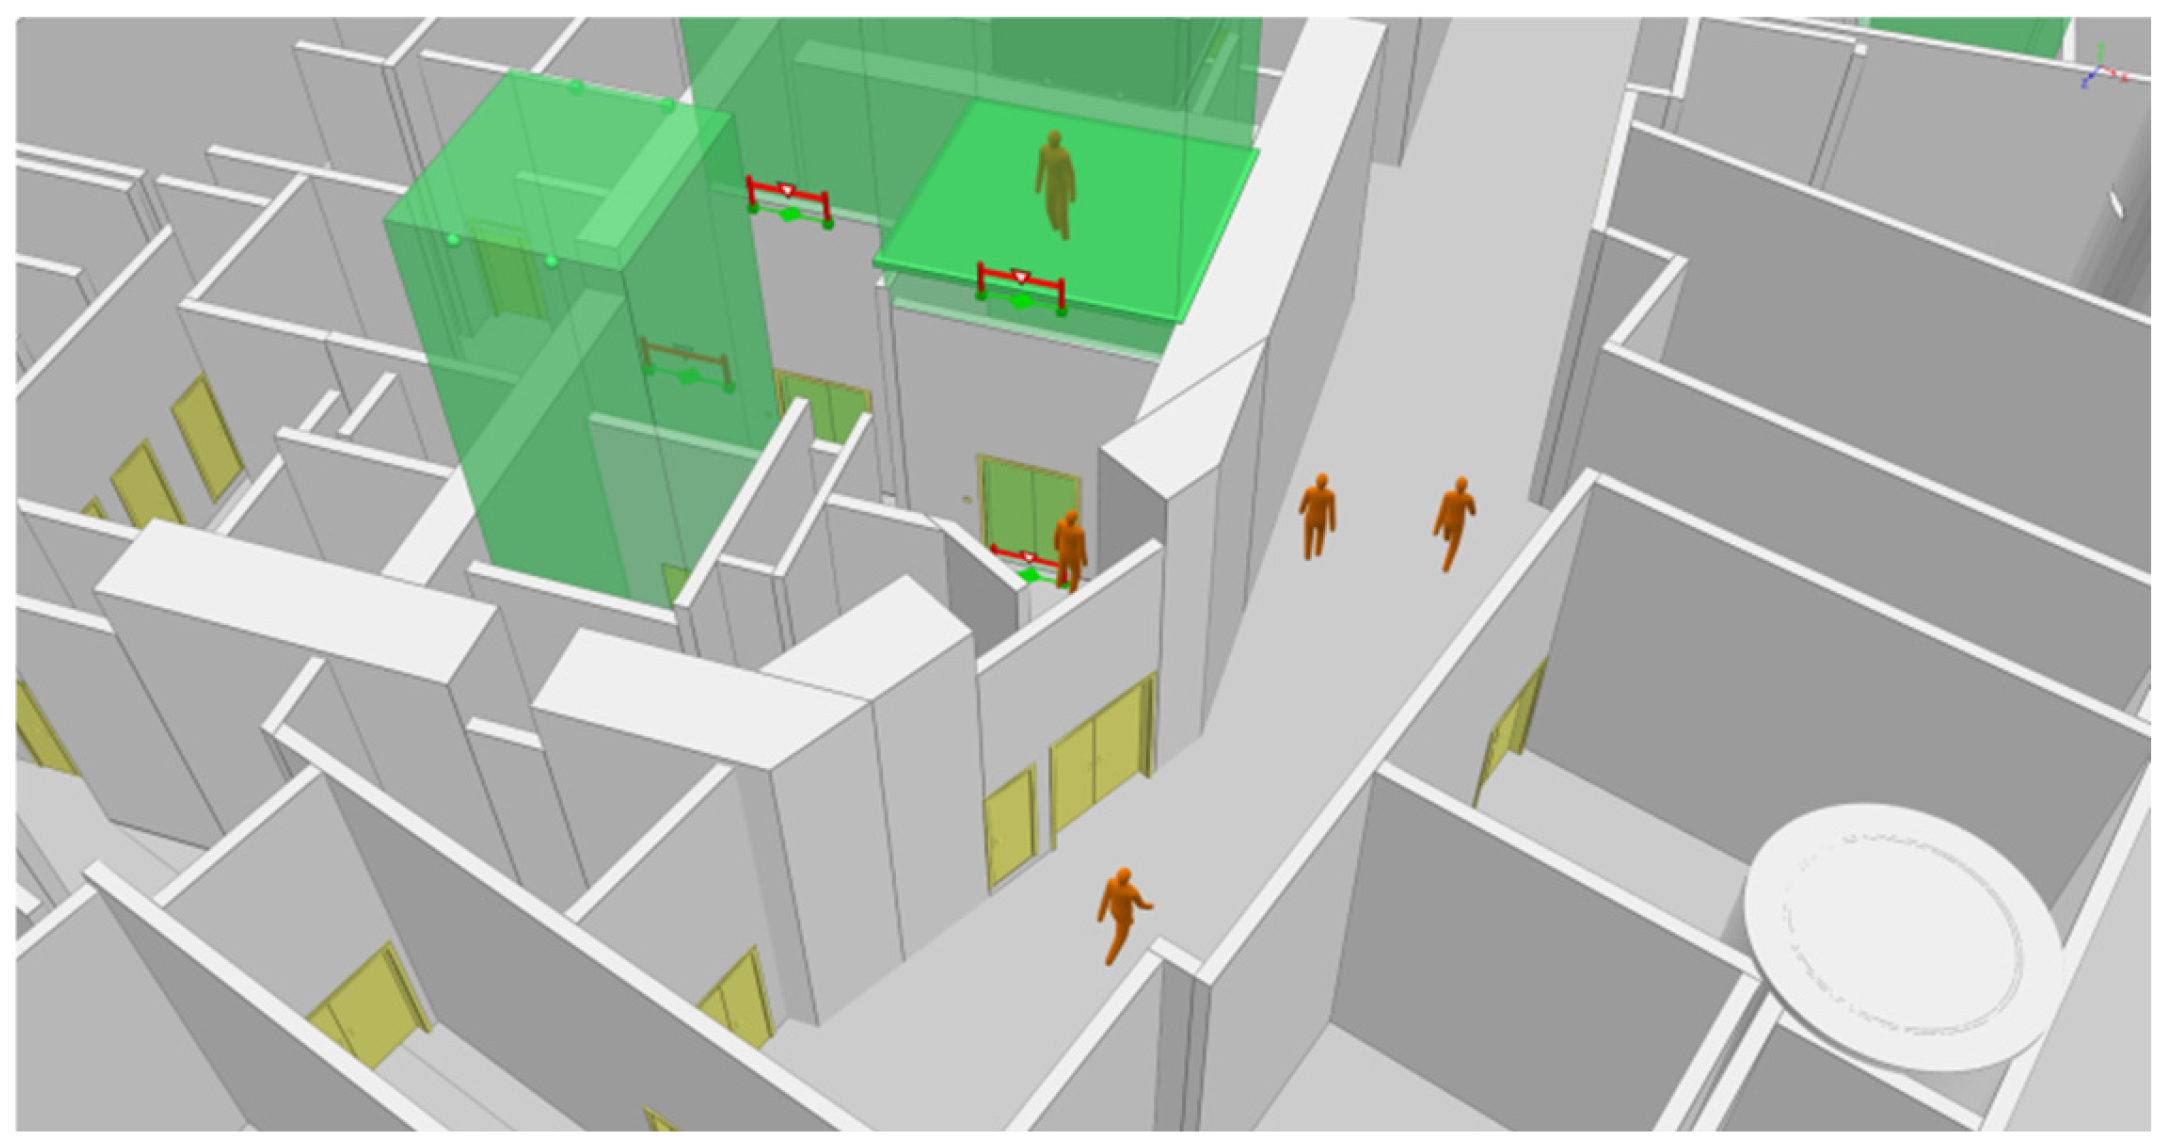
In order to test the corresponding relationship between grid utilization intensity and actual human flow, and evaluate its ability to explain flow changes, we carried out a comparative study of regression models on the basis of the above correlation analysis, and compared and analyzed the explanatory ability of different models between flow and grid utilization intensity, so as to select the optimal regression fitting model. The data used in the regression analysis were from the simulation results of Tower C in Shenzhen Bay, and the OD matrix of simulation pedestrians was set by random generation. At the same time, the number of times each grid was passed by pedestrians was recorded as the actual flow. Figure 22 shows the pedestrian simulation diagram generated by MassMotion.
After cleaning the simulation data, 43,003 valid rasters were selected, including 9826 non-zero actual flow data and 9445 raster utilization intensity data. The results of the descriptive statistics show that the mean and standard deviation of actual traffic were 275.95 and 246.49, respectively. The mean of grid utilization intensity was 406.04, and the standard deviation was 210.25, reflecting that there were significant differences in human flow and utilization levels in different regions. In addition, the values of each control variable were in a reasonable range, and there were no obvious extreme outliers. The data quality thus met the needs of the subsequent model analysis.
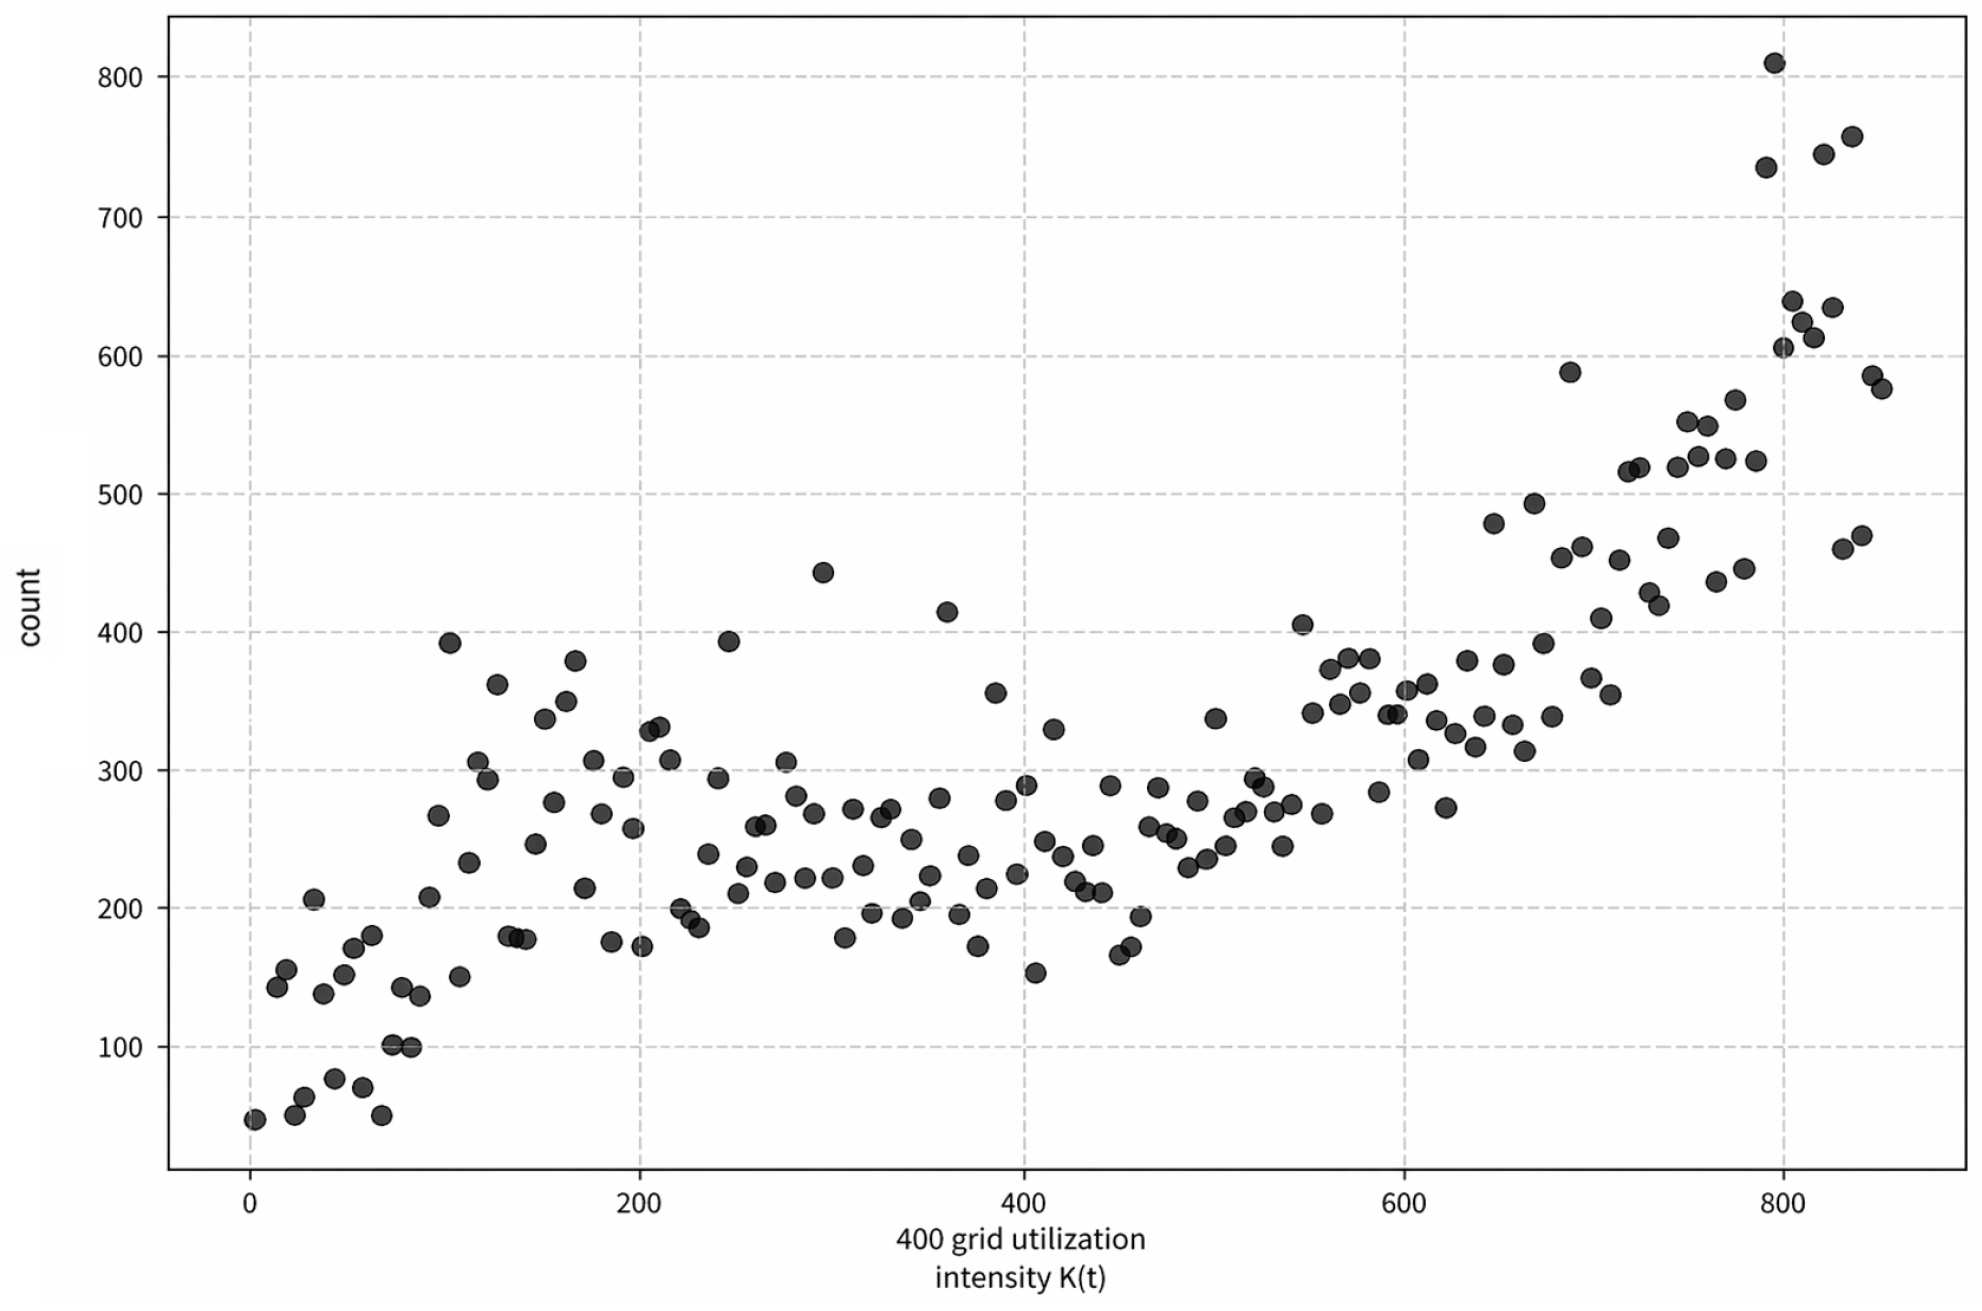
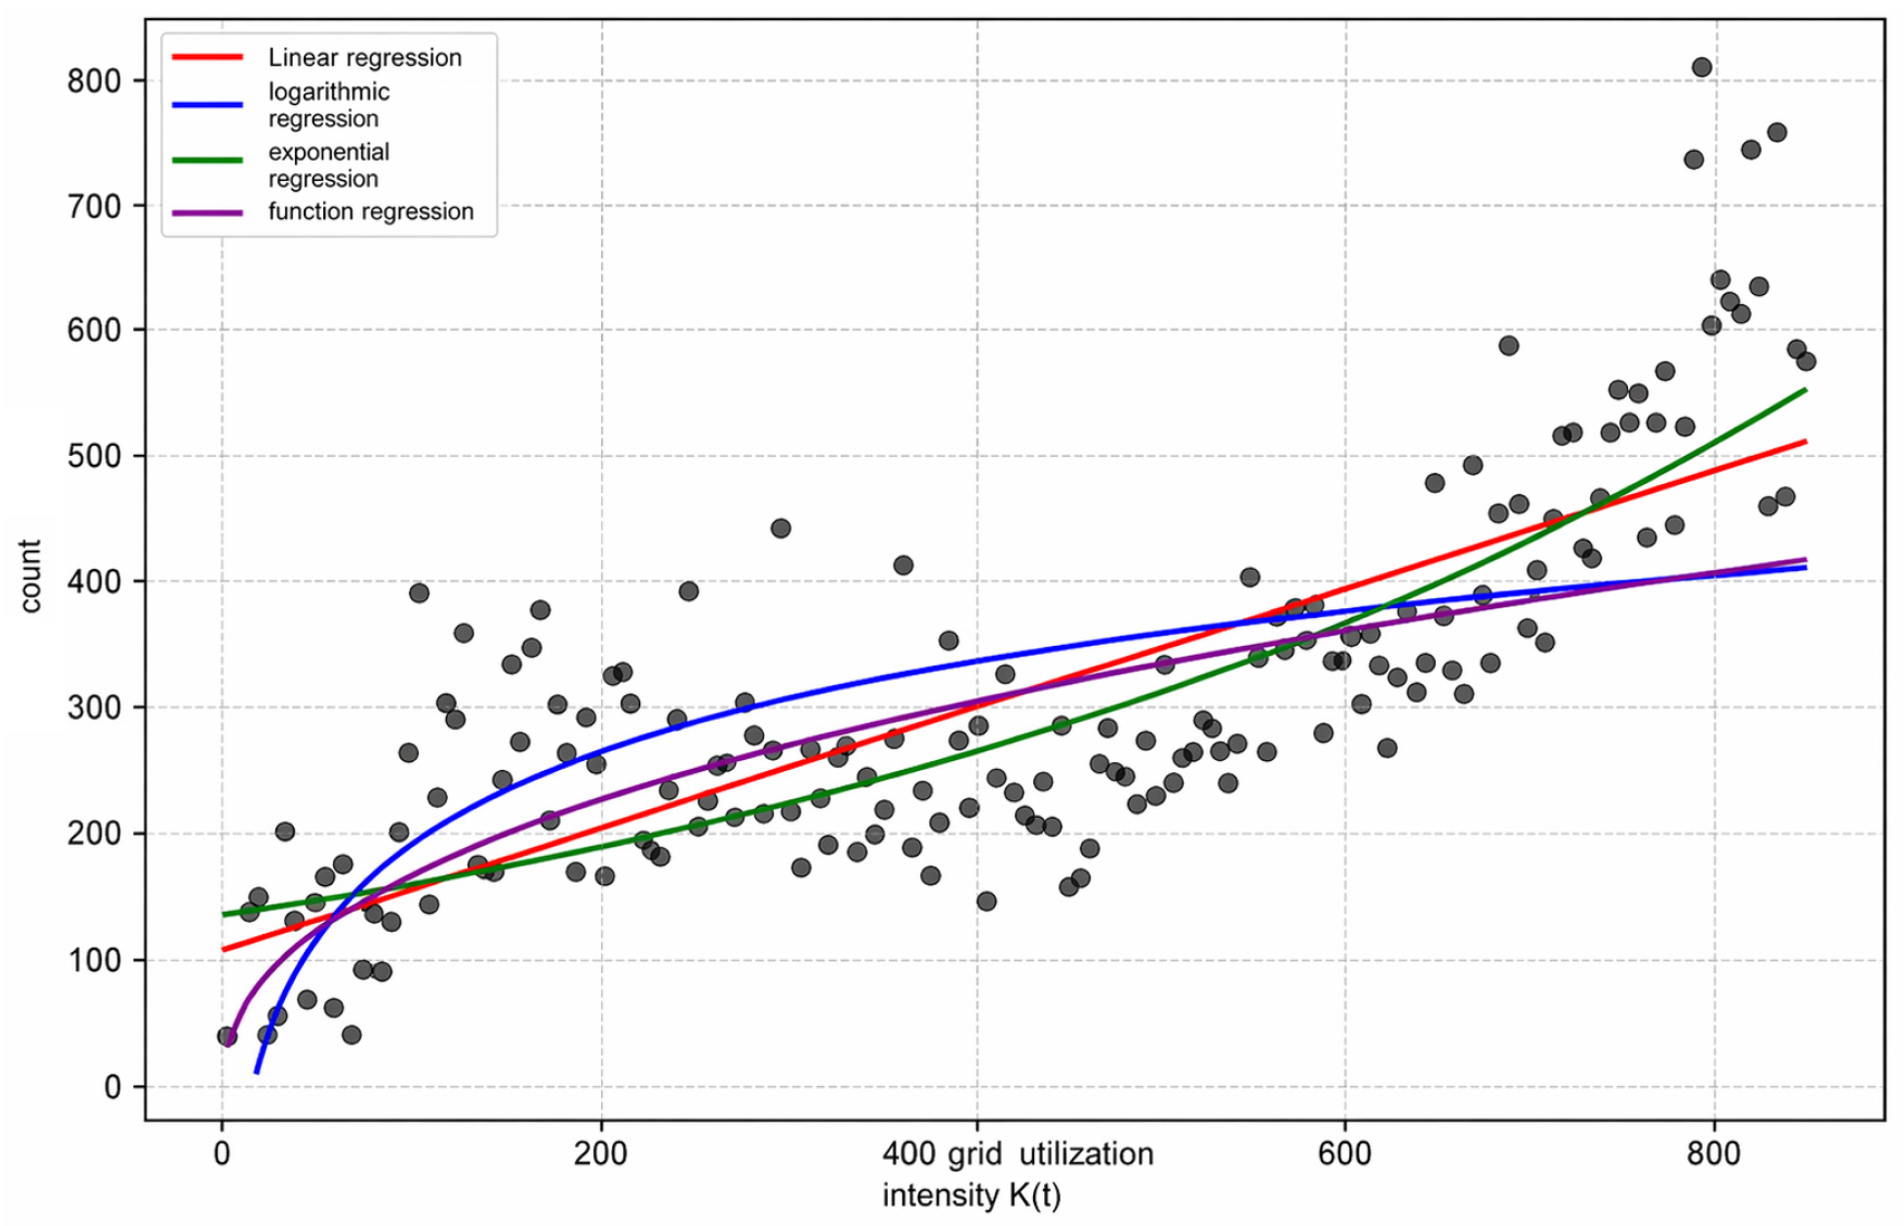
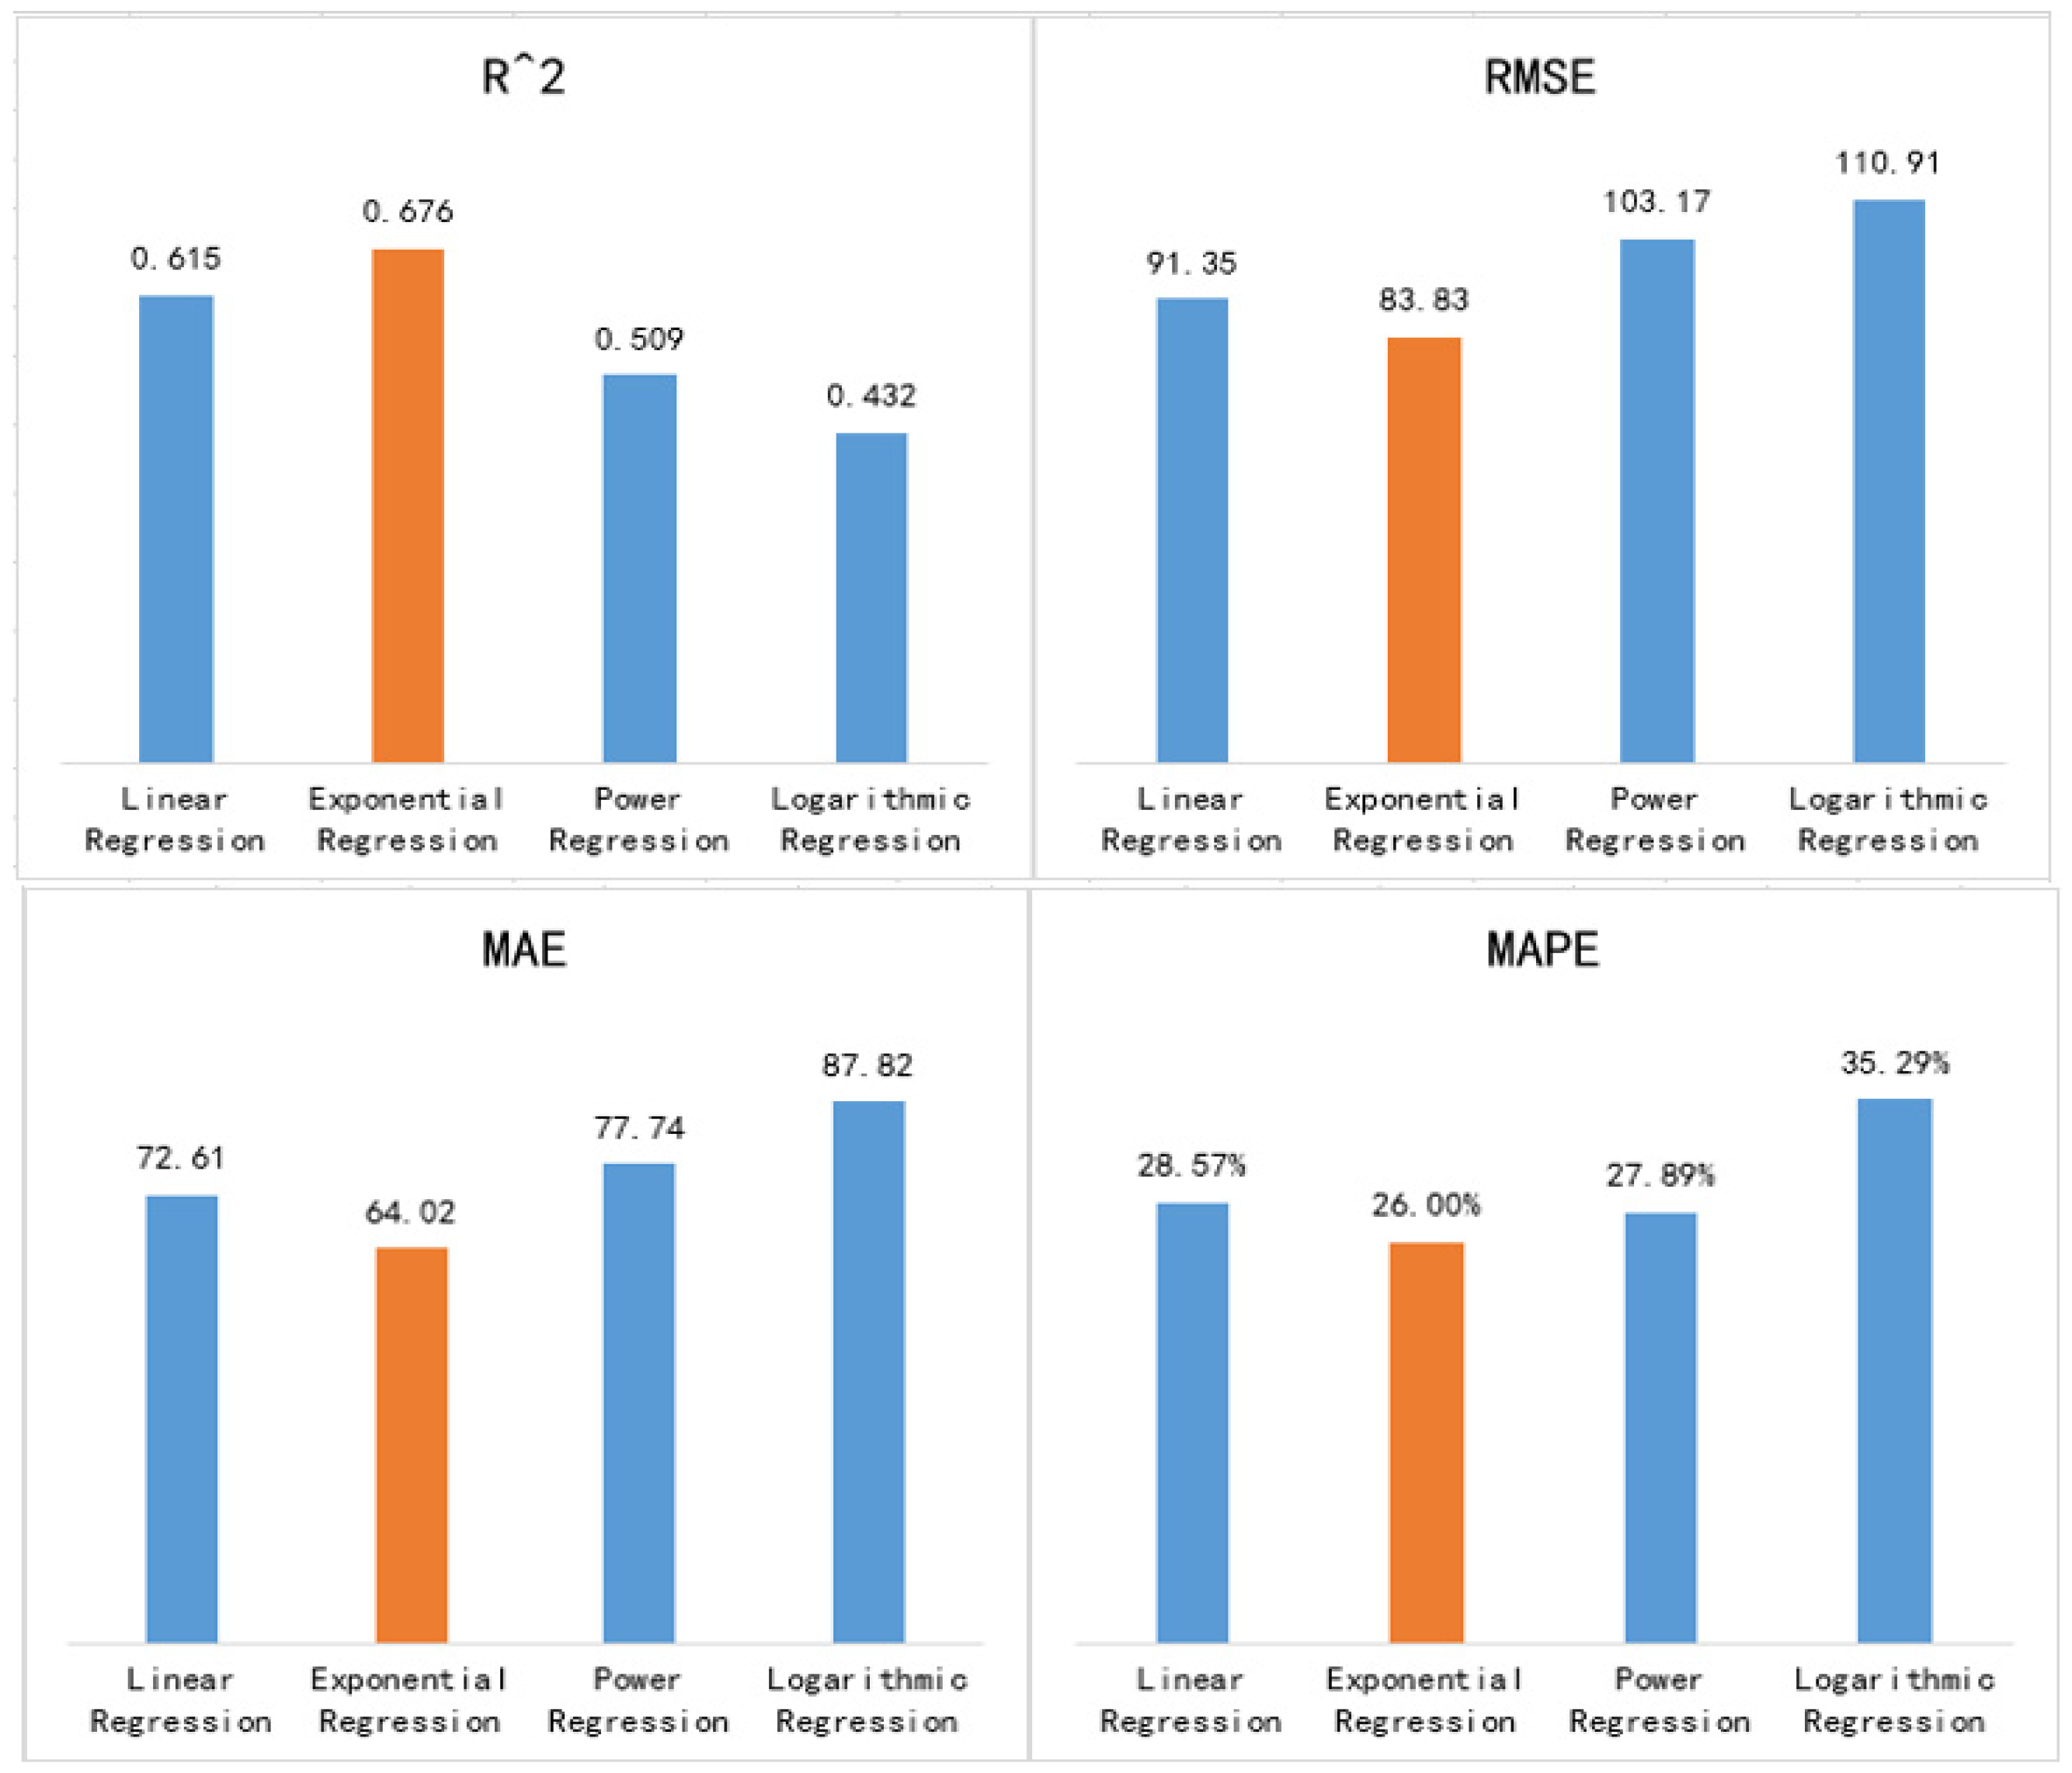
The grid utilization intensity was taken as the independent variable, and the actual flow was taken as the dependent variable. The scatter distribution diagram is shown in Figure 23. By observing the distribution of scatter points, it can be seen that with the increase in grid utilization intensity, the actual flow value generally showed a monotonically increasing change trend. Therefore, in order to further characterize the functional relationship between the two, we decided to use a linear regression model, an exponential regression model, a power regression model, and a logarithmic regression model to fit and analyze the actual traffic, as shown in Figure 24. The correlation evaluation index (R2), root mean square error (RMSE), mean absolute error (MAE), and mean absolute percentage error (MAPE) values of the fitting results are shown in Table 3.
The correlation coefficient between the linear regression model ( R 2 = 0.615 ) and the exponential regression model ( R 2 = 0.676 ) was large, indicating that grid utilization intensity could explain most of the actual traffic variation. The statistical correlation between the two models was significant, and the traffic showed an upward trend with the increase in grid utilization intensity. In addition, the exponential regression model performed better in RMSE, MAE, and MAPE, but the metric values were smaller on average, whereas the exponential regression model showed fitting error fluctuation and lightness, but fitting accuracy was higher, as shown in Figure 25. Although the prediction accuracy of the exponential regression model is not high overall, with a MAPE of 26%, this result was obtained using only architectural space and OD demand during the architectural design stage. On the other hand, it can be observed from Figure 24 that the exponential regression model provides more accurate predictions under high-flow conditions. Therefore, the research results of this study can provide data support for identifying potential pedestrian congestion areas as early as the architectural design stage, thereby eliminating related hidden dangers at the source. Furthermore, although this study only takes Tower C of Shenzhen Bay Super Headquarters Base as a case for analysis and validation, the proposed estimation method does not rely on building-type-specific factors. Accordingly, the findings of this paper are generalizable and can be applied to relevant analyses of other buildings.
Based on the research results of this study, the sidewalk level of service evaluation system proposed by Fruin [51] can be used to assess the spatial flow level in future work. Corresponding design optimization and adjustments can be implemented for areas with high spatial flow, such as increasing corridor width or setting up diverging nodes.

5. Conclusions

To effectively alleviate the hidden danger of oversaturated spatial flow in super high-rise buildings, transportation hubs and other facilities by optimizing the design scheme at the source, this paper conducts an in-depth study on the problem of spatial flow estimation in the architectural design stage. Firstly, based on the detailed data from pedestrian micro-simulation in buildings, the influencing factors of spatial flow are thoroughly analyzed from two aspects: spatial structure and pedestrian demand. Furthermore, by introducing the visibility integration degree of space syntax and the method for defining the OD influence range considering obstacle detouring proposed in this paper, a spatial utilization intensity index is designed, which comprehensively incorporates the above two factors. On this basis, regression analysis is employed to realize spatial flow estimation based on the spatial utilization intensity index. Finally, taking the basement 1 floor of the Shenzhen Bay Super Headquarters Base C Tower connected with the metro as a case study, the effectiveness of the proposed method is verified, with MAPE of 26%.
Due to the limitation of research data volume, the building spatial flow estimation using regression analysis in this paper does not accurately reflect the relationship between relevant influencing factors and spatial flow to a certain extent. In the future, with the continuous improvement of relevant research data and the enhancement of computing power, research on deep learning-based building spatial flow estimation methods can be considered. Meanwhile, this study only focuses on the flow of unit grids. In later stages, based on this research, larger-scale regional flow estimation and grade classification can be carried out to provide a better basis for architectural design. It is also possible to consider verifying the research results of this paper by introducing multiple scenarios, and calibrating the proposed method using real pedestrian flow data from completed buildings, so as to further improve the prediction accuracy.

Author Contributions

Conceptualization, L.Z., J.Q. and W.Y.; methodology, L.Z. and W.Y.; software, W.Y.; validation, J.Q.; formal analysis, L.Z.; investigation, L.Z. and W.Y.; resources, L.Z. and J.Q.; data curation, L.Z. and W.Y.; writing—original draft preparation, L.Z. and W.Y.; writing—review and editing, J.Q.; visualization, L.Z. and W.Y.; supervision, L.Z.; funding acquisition, J.Q. and L.Z. All authors have read and agreed to the published version of the manuscript.

Funding

This work was supported by the National Natural Science Foundation of China, No. 2023YFC3807400 (Sub-project No. 2023YFC3807403), Shenzhen Bay Area Urban Construction Development Co., Ltd. (SWFZ-2025HT-013-GC-CTA-PD), the Shenzhen Science and Technology Plan Project (No. KJZD20230923115223047), and the Shenzhen Higher Education Stable Support Plan Project (No. 20231123103157001).

Data Availability Statement

The data presented in this study are available on request from the corresponding author. The data are not publicly available due to privacy.

Conflicts of Interest

The authors declare no conflicts of interest.

References

  1. National Bureau of Statistics. Statistical Communiqué of the People’s Republic of China on the 2024 National Economic and Social Development. 2025. Available online: https://www.stats.gov.cn/sj/zxfb/202502/t20250228_1958817.html (accessed on 2 January 2026).
  2. Council on Tall Buildings and Urban Habitat (CTBUH). CTBUH 2024 Year in Review: Tall Trends; CTBUH: Chicago, IL, USA, 2025; Available online: https://newatlas.com/tag/ctbuh/ (accessed on 2 January 2026).
  3. Council on Tall Buildings and Urban Habitat (CTBUH). The Skyscraper Center: Global City Rankings. 2026. Available online: https://www.skyscrapercenter.com/ (accessed on 2 January 2026).
  4. Shenzhen Municipal Bureau of Transportation. 2024 Annual Report on Transportation Operation of Shenzhen; Shenzhen Municipal Bureau of Transportation: Shenzhen, China, 2025. Available online: https://jtys.sz.gov.cn/zwgk/ztzl/wgk/jggk/content/post_12053371.html (accessed on 2 January 2026).
  5. Shenzhen Metro. Analysis Report on Passenger Flow Intensity of Shenzhen Metro Network. Officially Released by Shenzhen Metro. 2024. Available online: https://www.szmc.net/ (accessed on 2 January 2026).
  6. CBRE. China Office Market Tenant Survey, Q3 2024. CBRE Research. 2024. Available online: https://baijiahao.baidu.com/s?id=1810076770147850527&wfr=spider&for=pc (accessed on 2 January 2026).
  7. Central Committee of the Communist Party of China, State Council. National Territorial Spatial Planning Outline (2021–2035). 14 October 2022. Available online: https://www.gov.cn/zhengce/zhengceku/2017-02/04/content_5165309.htm (accessed on 2 January 2026).
  8. Hillier, B.; Hanson, J. The Social Logic of Space; Cambridge University Press: Cambridge, UK, 1984. [Google Scholar]
  9. Ye, J. Research and Evaluation of the Spatial Configuration-Based on Integration and Intelligibility. Master’s Thesis, Chongqing University, Chongqing, China, 2007. Available online: https://kns.cnki.net/kcms2/article/abstract?v=vxt3_kKBHYNFGMLtAzbcTEPcSQFgKQsOcgsZkXsD81YZ4xnHtd-8Skp0EcZ7C1kVpIGCSLGO-cpuvtGg7kGduI1hC0dRQL2JmszdSH2EIOIqYpN8vvbUfojfiNy3CajkkjaDo-aVI4jnadGXQeJbUSYLhWsuLNV0gKLPUFsGFgHN-sb3EsfquA==&uniplatform=NZKPT&language=CHST (accessed on 2 January 2026).
  10. Borba, P.; da Silva, P.C.M.; de Holanda, F.R.B. Exploratory Study of Space Syntax as a Traffic Assignment Tool. In Proceedings of the 6th International Space Syntax Symposium, Istanbul, Turkey, 12–15 June 2007. [Google Scholar]
  11. Turner, A.; Doxa, M.; O’Sullivan, D.; Penn, A. From isovists to visibility graphs: A methodology for the analysis of architectural space. Environ. Plan. B Plan. Des. 2001, 28, 103–121. [Google Scholar] [CrossRef] [Scilit]
  12. Song, Y.; Niu, L.; He, L.; Wang, R. A grid-based graph data model for pedestrian route analysis in a micro-spatial environment. Int. J. Autom. Comput. 2016, 13, 296–304. [Google Scholar] [CrossRef] [Scilit]
  13. Duan, J.; Bill, H. Space Syntax and Urban Planning; Southeast University Press: Nanjing, China, 2007; Available online: https://baike.baidu.com/item/%E7%A9%BA%E9%97%B4%E7%A0%94%E7%A9%B63-%E7%A9%BA%E9%97%B4%E5%8F%A5%E6%B3%95%E4%B8%8E%E5%9F%8E%E5%B8%82%E8%A7%84%E5%88%92/12222297?fr=aladdin (accessed on 2 January 2026).
  14. Zhou, Y.; Thill, J.C. Urban Nodal Regions Through Communities of Functionally Critical Locations in the Transportation Network. In Smart Cities, Green Technologies, and Intelligent Transport Systems; Springer: Berlin/Heidelberg, Germany, 2020; pp. 293–311. [Google Scholar]
  15. Fan, W.; Shi, Y.; Che, J.; Chen, H. Influence of Urban Street Configuration on the Location of Urban Commercial Center Based on GIS and Space Syntax. J. Sun Yat-Sen Univ. (Nat. Sci. Ed.) 2011, 50, 112–117. [Google Scholar]
  16. Pont, M.B.; Stavroulaki, I.; Gil, J.; Marcus, L.; Serra, M.; Hausleitner, B.; Abshirini, E.; Dhanani, A.; Olsson, J. Quantitative comparison of cities: Distribution of street and building types based on density and centrality measures. In Proceedings of the 11th Space Syntax Symposium, Lisbon, Portugal, 3–7 July 2017; pp. 44.1–44.18. Available online: https://www.semanticscholar.org/paper/Quantitative-comparison-of-cities-%3A-Distribution-of-Pont-Stavroulaki/a64abf8e15522ea4dabbc8d0a763cca0769771d6 (accessed on 2 January 2026).
  17. Ratti, C. Space syntax: Some inconsistencies. Environ. Plan. B Plan. Des. 2004, 31, 487–499. [Google Scholar] [CrossRef] [Scilit]
  18. Andi, A.; Abednego, I.A.; Gultom, B.J.M.L. A Space Syntax Guide to Optimize Shopping Mall: A Systematic Review. Int. J. Environ. Archit. Soc. 2021, 1, 19–30. [Google Scholar] [CrossRef] [Scilit]
  19. Deb, S. Spatial Logic of Shopping Malls: Application of Space Syntax in Understanding Economics of Architecture. J. Archit. Plan. Res. 2013, 30, 321–338. [Google Scholar]
  20. Lian, H.; Li, G. Correlation Analysis of Retail Space and Shopping Behavior in a Commercial Street Based on Space Syntax: A Case of Shijiazhuang, China. Buildings 2023, 13, 2674. [Google Scholar] [CrossRef] [Scilit]
  21. Alo Baydi, A.F.; Alobaydi, D.G.; Abdullah, S.F. Exploring the Impact of Streets’ Syntactic Properties on the Urban Functions and Land Use: Insights from Spatial Network Analysis. J. Eng. 2025, 31, 122–135. [Google Scholar] [CrossRef] [Scilit]
  22. Al-Saffar, A.; Alo Baydi, A.F. Assessing the Influence of Urban Street Network on Land Use Distribution in Historic Urban Cores. Iraqi J. Archit. Plan. 2025, 24, 128–140. [Google Scholar]
  23. Wang, J.; Su, S. Design of Commercial Format Layout in Digital Urban Block Based on Space Syntax and Correlation Analysis. In Proceedings of the International Conference on Digital Landscape Architecture, Dessau, Germany, 4–6 June 2025; pp. 537–544. [Google Scholar]
  24. Adebayo, A.; Greenhalgh, P.; Muldoon-Smith, K. Investigating Retail Space Performance through Spatial Configuration of Consumer Movement: A Comparison of York and Leeds. In Proceedings of the 12th International Space Syntax Symposium, Beijing, China, 8–13 July 2019; pp. 456–465. [Google Scholar]
  25. Eom, Y.; Suzuki, K. Spatial distribution of pedestrian space in central Tokyo. Int. Rev. Spat. Plan. Sustain. Dev. 2019, 7, 108–124. [Google Scholar] [CrossRef] [Scilit]
  26. Xu, L.; Xia, Z. Pedestrian Distribution in High-Rise Commercial Complexes: An Analysis of Integrating Spatial and Functional Factors. Int. J. High-Rise Build. 2016, 5, 95–103. [Google Scholar] [CrossRef] [Scilit]
  27. Danilina, N.; Privezentseva, S. Smart space solutions of pedestrian ways in public transport transit hubs. IOP Conf. Ser. Mater. Sci. Eng. 2020, 775, 012008. [Google Scholar] [CrossRef] [Scilit]
  28. Bao, X.; Lian, H. Research on campus walking traffic space optimization strategy based on space syntax: Taking Lanzhou Jiaotong University as an example. Chongqing Archit. 2020, 24, 10–15. [Google Scholar]
  29. Sevtsuk, A.; Kalvo, R. Patronage of urban commercial clusters: A network-based extension of the Huff model for balancing location and size. Environ. Plan. B Urban Anal. City Sci. 2018, 45, 508–528. [Google Scholar] [CrossRef] [Scilit]
  30. Fesenko, O.; Szabo, B. Physical characteristics influencing space usage and pedestrian behaviour in public space. Period. Polytech. Archit. 2023, 54, 29–36. [Google Scholar] [CrossRef] [Scilit]
  31. Helbing, D.; Molnar, P. Social force model for pedestrian dynamics. Phys. Rev. E 1995, 51, 4282–4286. [Google Scholar] [CrossRef] [Scilit]
  32. Li, M.; Zhai, Y.; Zhou, J. Extended social force model with a sensor-based limitation of the field of view. Phys. A 2020, 556, 124827. [Google Scholar]
  33. Choi, M.; Crooks, A.T.; Wan, N. Addressing equifinality in agent-based modeling: A sequential parameter space search method based on sensitivity analysis. Int. J. Geogr. Inf. Sci. 2024, 38, 1007–1034. [Google Scholar] [CrossRef] [Scilit]
  34. Kirova, N.; Markopoulou, A. Pedestrian Flow: Monitoring and Prediction. In Proceedings of the 40th Annual Conference of the Association for Computer Aided Design in Architecture (ACADIA), Online, 24–30 October 2020. [Google Scholar]
  35. Lian, L.; Ye, R.; Wu, J.; Qin, T.; Hu, J.; Yan, C. Multi-Grid Simulation of Pedestrian Evacuation in a Room. In Proceedings of the 2019 9th International Conference on Fire Science and Fire Protection Engineering (ICFSFPE), Chengdu, China, 18–20 October 2019; pp. 1–5. [Google Scholar] [CrossRef] [Scilit]
  36. Liu, Y.; Chen, L.; Xu, Y.; Yang, J. Exhibition space circulation in museums from the perspective of pedestrian simulation. Buildings 2024, 14, 847. [Google Scholar] [CrossRef] [Scilit]
  37. Moussaid, M.; Perozo, N.; Garnier, S.; Helbing, D.; Theraulaz, G. The walking behaviour of pedestrian social groups and its impact on crowd dynamics. PLoS ONE 2010, 5, e10047. [Google Scholar] [CrossRef] [Scilit]
  38. Turner, A.; Penn, A. Encoding natural movement as an agent-based system: An investigation into human pedestrian behaviour in the built environment. Environ. Plan. B Plan. Des. 2002, 29, 473–490. [Google Scholar] [CrossRef] [Scilit]
  39. Sime, J.D. Crowd psychology and engineering. Saf. Sci. 1995, 21, 1–14. [Google Scholar] [CrossRef] [Scilit]
  40. Passini, R. Wayfinding in Architecture; Van Nostrand Reinhold: New York, NY, USA, 1984; Available online: https://xueshu.baidu.com/ndscholar/browse/detail?paperid=f4e10c487c9af804282b1788c79456e9&site=xueshu_se (accessed on 15 March 2026).
  41. Haq, S.; Zimring, C. Just down the road a piece: The development of topological knowledge of building layouts. Environ. Behav. 2003, 35, 132–160. [Google Scholar] [CrossRef] [Scilit]
  42. Bloch, P.H.; Ridgway, N.M.; Sherrell, D.L. Extending the concept of shopping: An investigation of browsing activity. J. Acad. Mark. Sci. 1989, 17, 13–21. [Google Scholar] [CrossRef]
  43. Wang, Y.; Wu, Y.F. Research on Spatial Security Mechanism of Huizhou Ancient Villages Based on Syntactic Variable Analysis. Planners 2016, 32, 101–107. [Google Scholar] [CrossRef]
  44. Wen, N. Differences between Axial Model and Segment Model of Space Syntax in Urban Design Applications. Urban. Archit. 2019, 16, 9–12. [Google Scholar] [CrossRef]
  45. Li, Z.J.; Li, C.H.; Li, C. Research on Quantitative Visibility Analysis Algorithm in Space Syntax. J. Xi’an Univ. Archit. Technol. (Nat. Sci. Ed.) 2011, 43, 716–719. [Google Scholar] [CrossRef]
  46. Guo, X.M.; Wang, J.C. Research on Public Space Renewal Strategies of Shenzhen Dongmen Old Street Based on Space Syntax. Planners 2014, 30, 89–95. [Google Scholar] [CrossRef]
  47. JGJ 48-2014; Code for Design of Store Buildings. China Architecture & Building Press: Beijing, China, 2014. Available online: https://ebook.chinabuilding.com.cn/zbooklib/bookpdf/probation?SiteID=1&bookID=58501 (accessed on 2 January 2026).
  48. GS(2024)0650; 2024 Administrative Division Data of China at Provincial, Municipal and County Levels. National Geomatics Center of China: Beijing, China, 2024. Available online: https://www.tianditu.gov.cn/index.html (accessed on 2 January 2026).
  49. Zhou, H. A Study on Unidirectional and Bidirectional Pedestrian Evacuation of Stairs Based on MassMotion. Master’s Thesis, Shanghai Institute of Technology, Shanghai, China, 2022. Available online: https://d.wanfangdata.com.cn/thesis/Ch1UaGVzaXNOZXdTb2xyOVMyMDI2MDExNzA4NTkxNhIJRDAyODUxMjMxGgh3NnB1ZG5saw%3D%3D (accessed on 15 March 2026).
  50. Gao, J.; Wang, X.P. Simulation Research on Unidirectional and Bidirectional Flow Evacuation of Stairs Based on MassMotion. J. Chengdu Technol. Univ. 2024, 27, 29–34. [Google Scholar] [CrossRef]
  51. Fruin, J. Pedestrian Planning and Design. Engineering, Environmental Science. 1971. Available online: https://www.semanticscholar.org/paper/Pedestrian-planning-and-design-Fruin/a9edc6d06a781a737f5a402d8a9a8ec89b7b728c (accessed on 15 March 2026).
Figure 1. Schematic diagram of pedestrian OD influence space.
Buildings 16 01719 g001
Figure 2. Comparison of scatter distribution and trend line.
Buildings 16 01719 g002
Figure 3. Location map of research objects.
Buildings 16 01719 g003
Figure 4. Schematic diagram of the first floor and B1 floor of Tower C.
Buildings 16 01719 g004
Figure 5. OD point layout diagram (35 m interval).
Buildings 16 01719 g005
Figure 6. OD point layout diagram (25 m interval).
Buildings 16 01719 g006
Figure 7. OD point layout diagram (interval 15 m).
Buildings 16 01719 g007
Figure 8. OD point layout diagram (interval 10 m).
Buildings 16 01719 g008
Figure 9. Flow distribution of OD layout with interval of 35 m.
Buildings 16 01719 g009
Figure 10. Flow distribution of OD layout with spacing of 25 m.
Buildings 16 01719 g010
Figure 11. Flow distribution of OD deployment with interval of 15 m.
Buildings 16 01719 g011
Figure 12. Flow distribution of OD deployment with interval of 10 m.
Buildings 16 01719 g012
Figure 13. Integration analysis diagram.
Buildings 16 01719 g013
Figure 14. Grid distribution diagram of simulated pedestrian paths.
Buildings 16 01719 g014
Figure 15. Comparison of pedestrian OD influence space before and after improvement.
Buildings 16 01719 g015
Figure 16. Location map of points A and B in the simulation scene.
Buildings 16 01719 g016
Figure 17. Actual pedestrian path distribution diagram.
Buildings 16 01719 g017
Figure 18. Comparison of quantization effect before and after improvement of OD influence space.
Buildings 16 01719 g018
Figure 19. Flux distribution variation.
Buildings 16 01719 g019
Figure 20. Schematic diagram of the OD influence space between the two points A and B.
Buildings 16 01719 g020
Figure 21. Actual pedestrian trajectories at the two points A and B.
Buildings 16 01719 g021
Figure 22. Mass motion pedestrian simulation diagram.
Buildings 16 01719 g022
Figure 23. Scatter distribution diagram of grid utilization intensity vs. actual traffic.
Buildings 16 01719 g023
Figure 24. Grid utilization intensity vs. actual flow model fitting diagram.
Buildings 16 01719 g024
Figure 25. Model correlation coefficient and error comparison chart.
Buildings 16 01719 g025
Table 1. Results of Pearson correlation analysis.
Experimental ProtocolPearson
Correlation Coefficient
T-ValueOverall
Saliency
Two-Tailed
Saliency
Single-Tail
Saliency
Standard Error
OD Point Layout
Spacing 35 m
0.24862.867<0.0001<0.0001<0.00010.372
OD Point Layout
Spacing 25 m
0.45616.841<0.0001<0.0001<0.00010.139
OD Point Layout
Spacing 15 m
0.53758.326<0.0001<0.0001<0.00010.094
OD Point Layout
Spacing 10 m
0.70569.807<0.0001<0.0001<0.00010.072
Table 2. Quantitative results of OD influence space before and after improvement.
OD PairOD Influence SpacePath
Raster Count
Number of Path Grids That Fall Inside the Influence SpaceInfluence Space
Total Number of Grids
AccuracyPercentage of Path Grids
OD1 (green)Before141131104792.91%12.51%
After12952091.49%24.81%
OD2 (red)Before 247223197590.28%11.29%
After 21684987.45%25.43%
OD3 (orange)Before 12411080588.71%13.67%
After 10736986.29%28.98%
Table 3. Regression model fitting effect table.
ModelRelationshipR2RMSEMAEMAPE
Linear regression model y = 0.473 x + 110.533 0.61591.3572.6128.57%
Exponential regression model y = 137.578 × e 0.0016 x 0.67683.8364.0226.00%
Power regression model y = 24.162 × x 0.423 0.509103.1777.7427.89%
Logarithmic regression model y = 102.192 × ln ( x ) 276.808 0.432110.9187.8235.29%
Disclaimer/Publisher’s Note: The statements, opinions and data contained in all publications are solely those of the individual author(s) and contributor(s) and not of MDPI and/or the editor(s). MDPI and/or the editor(s) disclaim responsibility for any injury to people or property resulting from any ideas, methods, instructions or products referred to in the content.