


Abstract
A novel procedure is proposed in this paper to investigate the capacity of parking structures to resist additional live loads that could come from many cars, potentially from heavier or driverless cars. In recent decades, the typical operating weight of passenger vehicles has risen significantly. The anticipated widespread adoption of electric vehicles (EVs), which contain heavy battery systems, may further increase live load demands. As a result, a new robust procedure is needed to assess the live load effects on parking structures. Hence, using the proposed innovative approach based on 3D influence surfaces, tributary areas (AT) and three-dimensional influence surfaces (AI) were calculated (for the first time) to examine the equivalent uniformly distributed load corresponding to selected column axial loads and beam midspan moments that are expected to be experienced during the lifetime of parking structures. As case studies, the responses of two existing multistory parking garages on the Ohio State University campus were investigated under different arrangements of two car types—standard cars and sports utility vehicles (SUVs)—and the calculated maximum live loads were compared with the current code requirements. The results show that the maximum live load for the midspan moment is conservative; however, the maximum axial column loading in the extreme scenarios presented in this paper can be larger than the specified (original) design limit of the selected parking garages. The novel methodology proposed in this paper is based on 3D influence line analysis and can be applied for any vehicle configuration and weight, and different parking arrangements or loading scenarios to investigate the performance of parking garages.
1. Introduction
Our understanding of live loads and probabilistic live load modeling improved significantly in recent years. Even though there are methods for accurately predicting how a structure reacts to a given load, the live load effects still need to be determined or approximated using field measurements, analyses, or expert opinion. Two essential characteristics include comprehensive understanding of the probabilistic and statistical methods required for quantitative analysis of load phenomena and a heightened awareness of the profession’s knowledge gaps regarding floor loads and structural behavior under specific loads. As discussed below, researchers and engineers have not used influence lines to determine live load effects on the structural members of parking structures since mid-1970s. McGuire and Cornell [1] and Ellingwood and Culver [2] performed simple hand calculations and did not have access to today’s powerful software that can quickly generate three-dimensional influence surfaces, as proposed and implemented in this study [1,2].
McGuire and Cornell [1] investigated the effects of live loads using influence surfaces. They examined the shape of the influence area, the volume of the region under consideration, and the division of the considered area into individual tenants or workplaces. For various supported regions, the researchers calculated the corresponding equivalent uniformly distributed load (EUDL) for shear, tension, and axial loads. They concluded that the EUDL had the same load effect as the live load but with a constant load value. They also compared the design loads in the United States and Canada to the fractals of the maximum total EUDL, i.e., the peak effective force a structure can be subjected to during its life. Ellingwood and Culver [2] used the EUDL and load reduction factor and compared the results with load survey of office buildings in the United States. To define live load correlations between EUDL and load survey, the researchers provided a probabilistic live load model as a function of building use. Subsequent live load studies were designed with a focus on these correlations (e.g., building geographic location, height, age, and government or private sector) because of their significance to structural reliability. Due to inherent parameter variations, it is challenging to calculate a realistic estimate of live load. The evaluation is made more difficult by the absence of historical data on the production, construction, design, and operation of structures. Codes for new construction consider both historical evidence and theoretical considerations. Loads can vary and may not always apply to all situations [2].
Over recent decades, there has been a considerable increase in the common operating weight of passenger cars. The largest contributors are more powerful engines, more stringent safety measures, and more comfortable interiors. The existence of prospective electric vehicles with heavy batteries will likely lead to a live load increase. Consequently, the live load models for parking garages need to be updated [3].
This novel study investigates the effects of additional live loads that could be due to a larger number of driverless cars or heavier vehicles in parking structures. A new method is proposed in this research to quantify the 3D effects of multiple-wheel (point) loads on axial, shear and moment demand on the beams and columns of a frame building. The proposed method is based on 3D influence surfaces, which can be calculated using different software. Existing parking structures are used as case studies to determine if they can carry the unexpected future live loads. With the aid of CSiBridge software [4], tributary areas (AT) and 3D influence surfaces (AI) are calculated to determine EUDL using calculated column axial loads and beam midspan moments that parking structures are expected to experience during their lifetimes.
Two multistory parking garages, the SC and NW garages on the main OSU campus, were used as case studies by considering different arrangements of two car types, standard cars and sports utility vehicles (SUV). The main objective is to investigate the maximum live load effects in cast-in-place and precast concrete parking structures and the live load requirements in the current standards and codes, such as ASCE 7-22 [5] and ICC [6].
2. Influence Surface
In Minimum Design Loads Associated Criteria for Buildings and Other Structures (ASCE) standard version 1982 included the concept and methods for computing member live load reductions as a function of a loaded member’s influence area, AI. This was the first revision since the concept of live load reduction was introduced more than 40 years ago [5]. ASCE 7-22 provides live load elements factors, KLL for different structural elements and configurations to relate tributary and influence areas. For example, in this study, an edge column with cantilever slabs and an edge beam with cantilever slabs are investigated. For both members (edge column and edge beam), it is assumed that the live load reduction is 0 within the cantilever; hence, KLL is equal to 4 and 2 for the edge column and edge beam, respectively [5]. ASCE 7-22 [5] and ICC [6] specify a uniformly distributed live load of 1.92 kN/m2 (40 psf) for parking structures or 13,345 N (3000 lb) acting on a 114 mm by 114 mm (4.5 in. by 4.5 in.) area for concentrated loads [5].
3. Vehicle Properties
The data for the distribution of car weight loads come from a study [7] that was carried out in nine different parking garages in the states of Massachusetts and Illinois. There was a significant disparity in the weights of the vehicles, which ranged from 7531 to 38,255 N with the average being 15,173 N. Wen and Yeo [7] recommend a range of 4448 to 38,922 N with a mean of 8.089 based on a lognormal distribution. The U.S. Environmental Protection Agency (U.S. EPA, 2021) keeps data on the average weight of automobiles each year [8]. The EPA discovered that the average curb (empty) weight of a personal vehicle increased by only 5% since the authors of [7] conducted their study. The average reported empty car weight is 16,089 N, which is consistent with the vehicle weight averages and distributions in [7,9].
In this analytical investigation, a standard vehicle footprint provided by Naito et al. [9] was utilized for convenience. The track width and wheelbase of the standard-sized car were 1676 mm and 2667 mm, respectively. For simplicity, it was assumed that the weight distribution across all tire locations was equal. Also, there was no attempt to add dynamic force effects to any of the vehicle loads [9].
Another type of vehicle footprint (i.e., that of a sport utility vehicle or an SUV) was also considered in the live load design, which is that of a Chevy Tahoe [10]. The track width and wheelbase of the SUV were 1740 mm and 3071 mm, respectively. Assuming the weight distribution across each axle could be equally divided by two, each tire on the front and rear axles has a load of 8229 and 9564 N, respectively. The purpose of this analysis is to identify the maximum live load the structure can carry due to a variety of car weights.
4. Methodology
4.1. Calculation of Influence Surfaces
The objective of this study is to develop 3D influence surfaces, which represent the structural response due to a unit load moving across the slab. Since CSiBridge software [4] requires a vehicle definition to perform moving load analysis, a generic tow truck was adopted as a practical tool to facilitate the systematic movement of load across the slab surface. The specific properties of the tow truck (e.g., geometry, axle configuration, or total weight) do not influence the final calculated influence surface, as the analysis is conducted within a linear elastic framework, and the results are effectively normalized to represent unit load effects. Therefore, the tow truck should be understood as a procedural generic vehicle rather than a physical input affecting the results. The resulting influence surfaces are fundamentally mechanics-based, reflecting the structural response characteristics of the slab system, and are independent of the particular vehicle selected within the software environment. There are two main factors considered in the selection of the appropriate truck. The first is the overall height. Because the parking garages involved in this analysis, i.e., the SC and the NW garages, have a clear height of 2.13 m, the truck height must be less than this limit. The second factor is the overall truck weight. The truck must have a high gross vehicle weight to generate as large an envelope response as possible when it moves on the defined lane in CSiBridge software. Therefore, a tow truck is considered to be moving at the center of the defined lane in CSiBridge software to generate the 3D influence surface and investigate influence surface coordinates in this research. The selected tow truck has a track width and wheelbase of 823 mm and 3691 mm, respectively.
A 3D influence surface in CSiBridge software [4] represents the variation in a selected structural response such as bending moment, shear force, or deflection at a specific location—as a unit load is applied over all points on the slab surface. In parking structures, this concept is particularly useful for evaluating non-uniform live load scenarios, such as different vehicle positions and load concentrations near edges or corners. The surface is generated by developing a finite element model of the slab (typically using plate or shell elements with appropriate geometry, supports, and boundary conditions), discretizing the slab into a grid of load points, and sequentially applying a unit load at each grid point. For each load position, the response at the point of interest is recorded, resulting in a function that defines the unitless coordinates of the influence surface. This surface can then be used to evaluate the structural response under any actual load distribution , enabling accurate analysis of non-uniform loading conditions. This approach provides a more refined assessment compared to traditional methods, such as tributary area approaches, particularly when localized or edge-concentrated live loads govern the design.
In this study, the slab surface was discretized into approximately 1000 load points to ensure adequate spatial resolution of the influence surface. A uniform grid distribution was adopted across the slab plan, providing a balance between computational efficiency and accuracy in capturing localized effects. At each discretized point, a unit load was applied as a pure point load for simplicity to represent load transfer in slab systems.
The influence surface was then constructed by sequentially applying the unit load at each of these points and recording the corresponding structural response at the location of interest. This procedure ensures that variations in response due to load position are captured with sufficient accuracy.
After the 3D influence surfaces were created, a total of 28 scenarios were discussed, including the SC and NW parking garages, column axial loading and beam midspan moment, and the tributary area AT and influence area AI for both standard cars and SUVs. These findings, presented in Table 1, provide a detailed summary of all scenarios considered in this paper.
Table 1.
Detailed summary of the number of scenarios discussed for design live load using 3D analysis.
4.2. Column Axial Load Calculations Using 3D Influence Surfaces
The five-story SC parking structure located on the main OSU campus in Columbus, Ohio, USA, is a cast-in-place concrete structure. Its roof includes a two-way ribbed slab with cantilever edges. This parking garage has two halves. Each one is 19.29 m (63 ft) in width and 87.10 m (285.75 ft) in length. The main beams are 762 mm (30 in.) wide and 508 mm (20 in.) deep along axes 1 and 4, and 610 mm (24 in.) wide and 508 mm (20 in.) deep along axes 2 and 3 at the roof level. All of the columns in this structure are 457 or 508 mm (18 or 20 in.) diameter circular columns. The columns and beams have a specified compressive strength of 34.5 MPa (5000 psi) and 27.5 MPa (4000 psi), respectively. The other properties of the SC garage are described in [11].
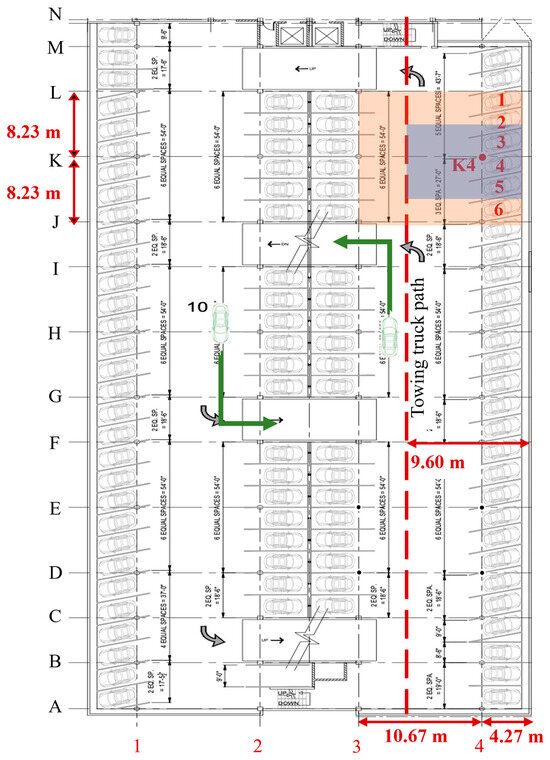
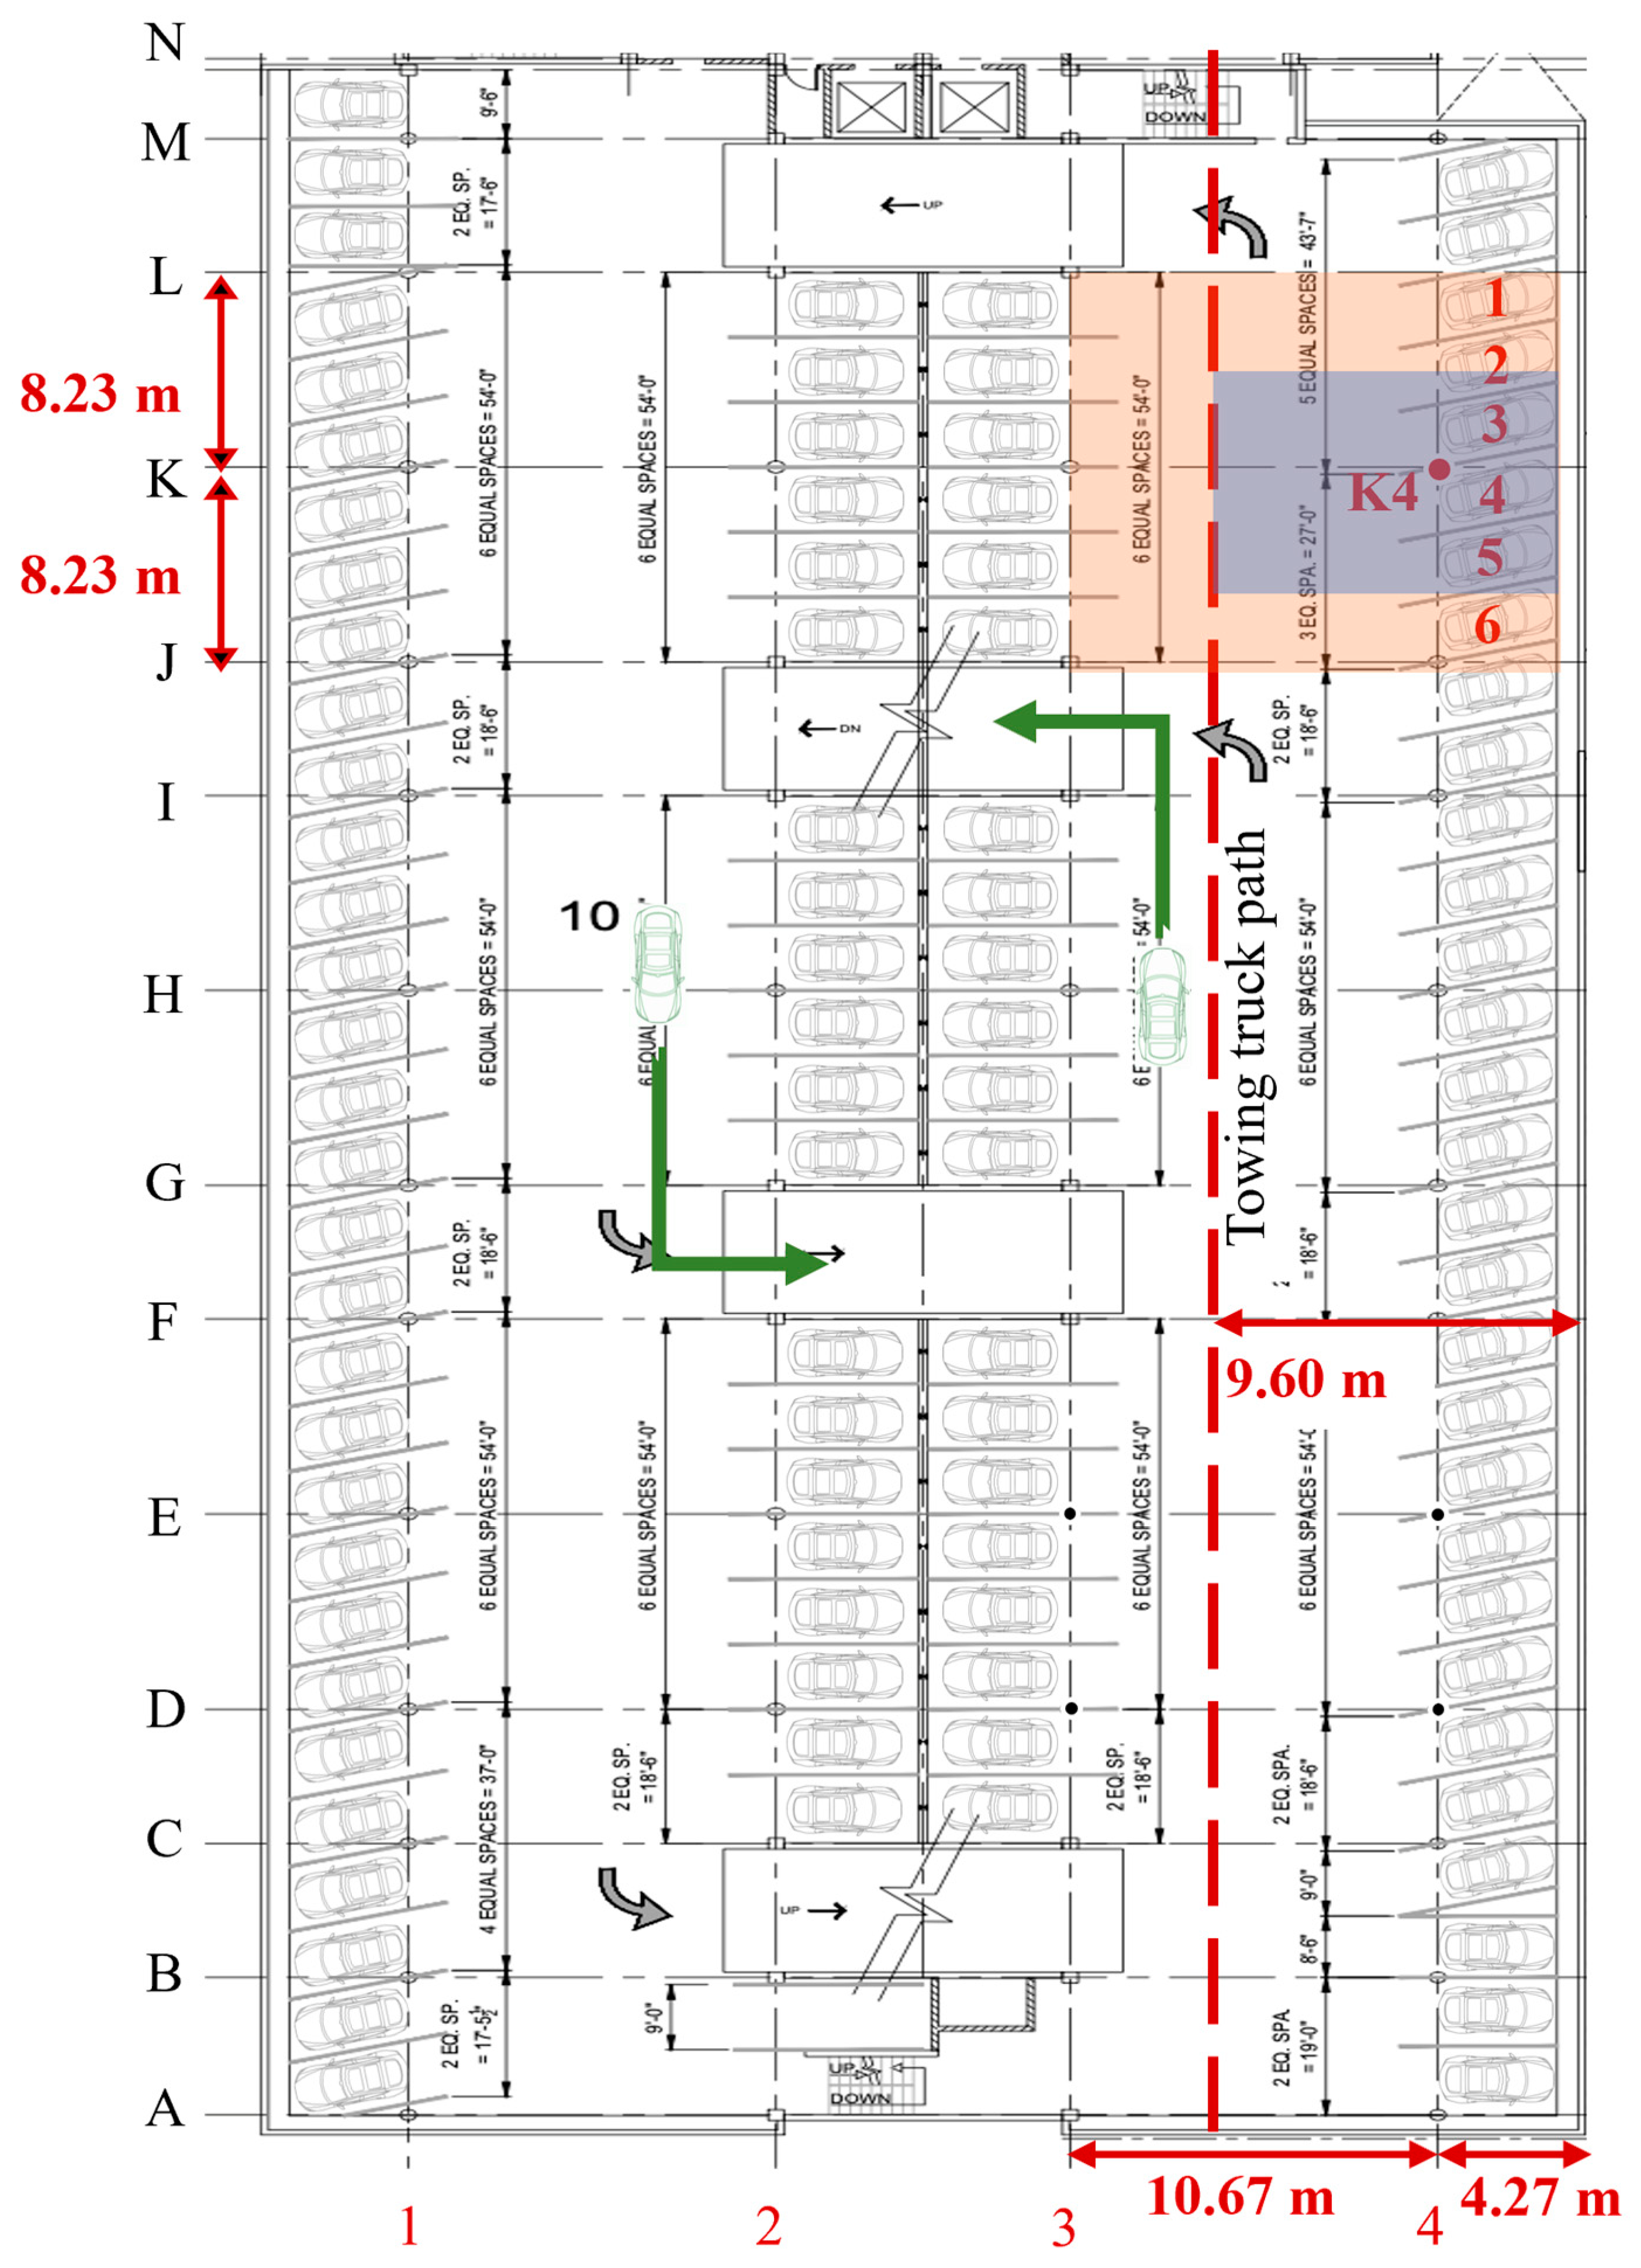
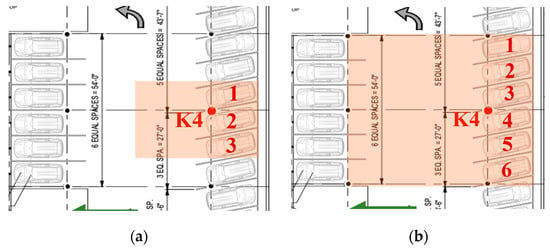
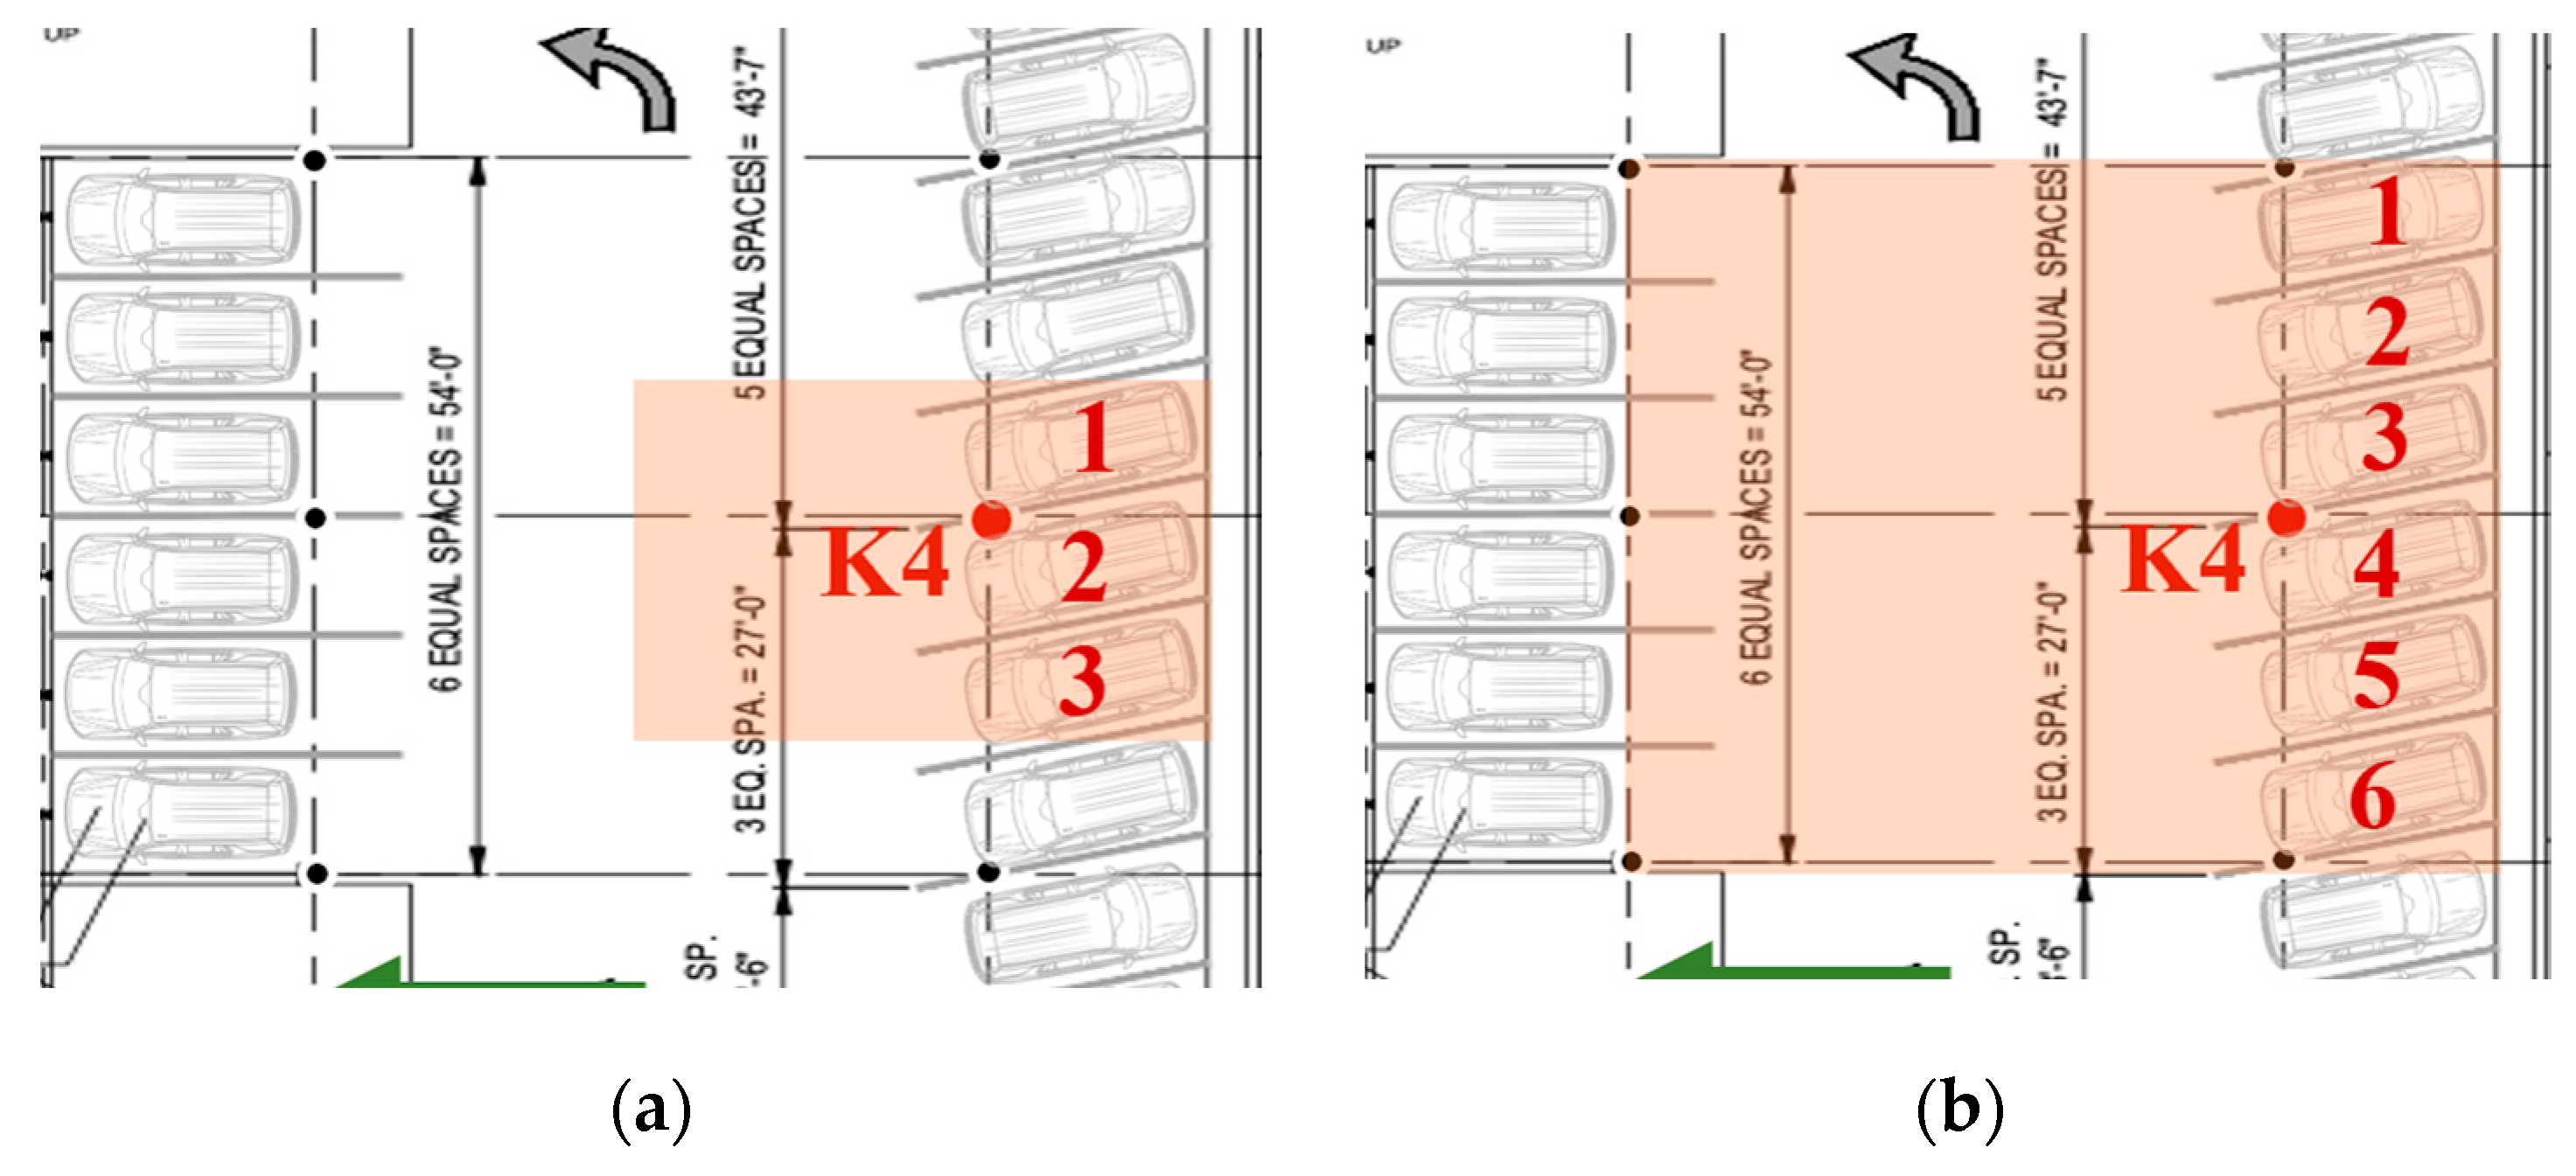
Figure 1 shows a schematic diagram of the typical configuration of parking stalls in the SC parking garage bay. Using this layout, the influence surface coordinates of the columns can be easily determined. The influence areas are used to determine the maximum axial load applied on each column. Different load positions within a column will result in different load capacities. The closer a load is to a column, the greater its impact on the column is, and vice versa.
Figure 1.
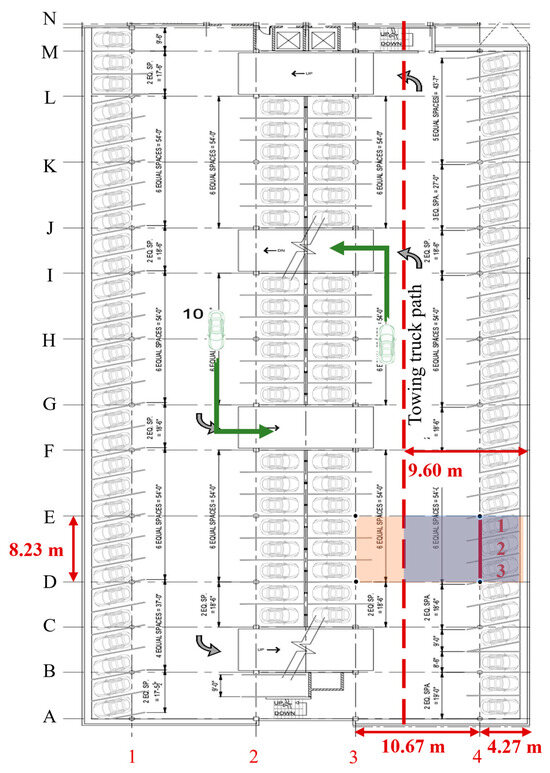
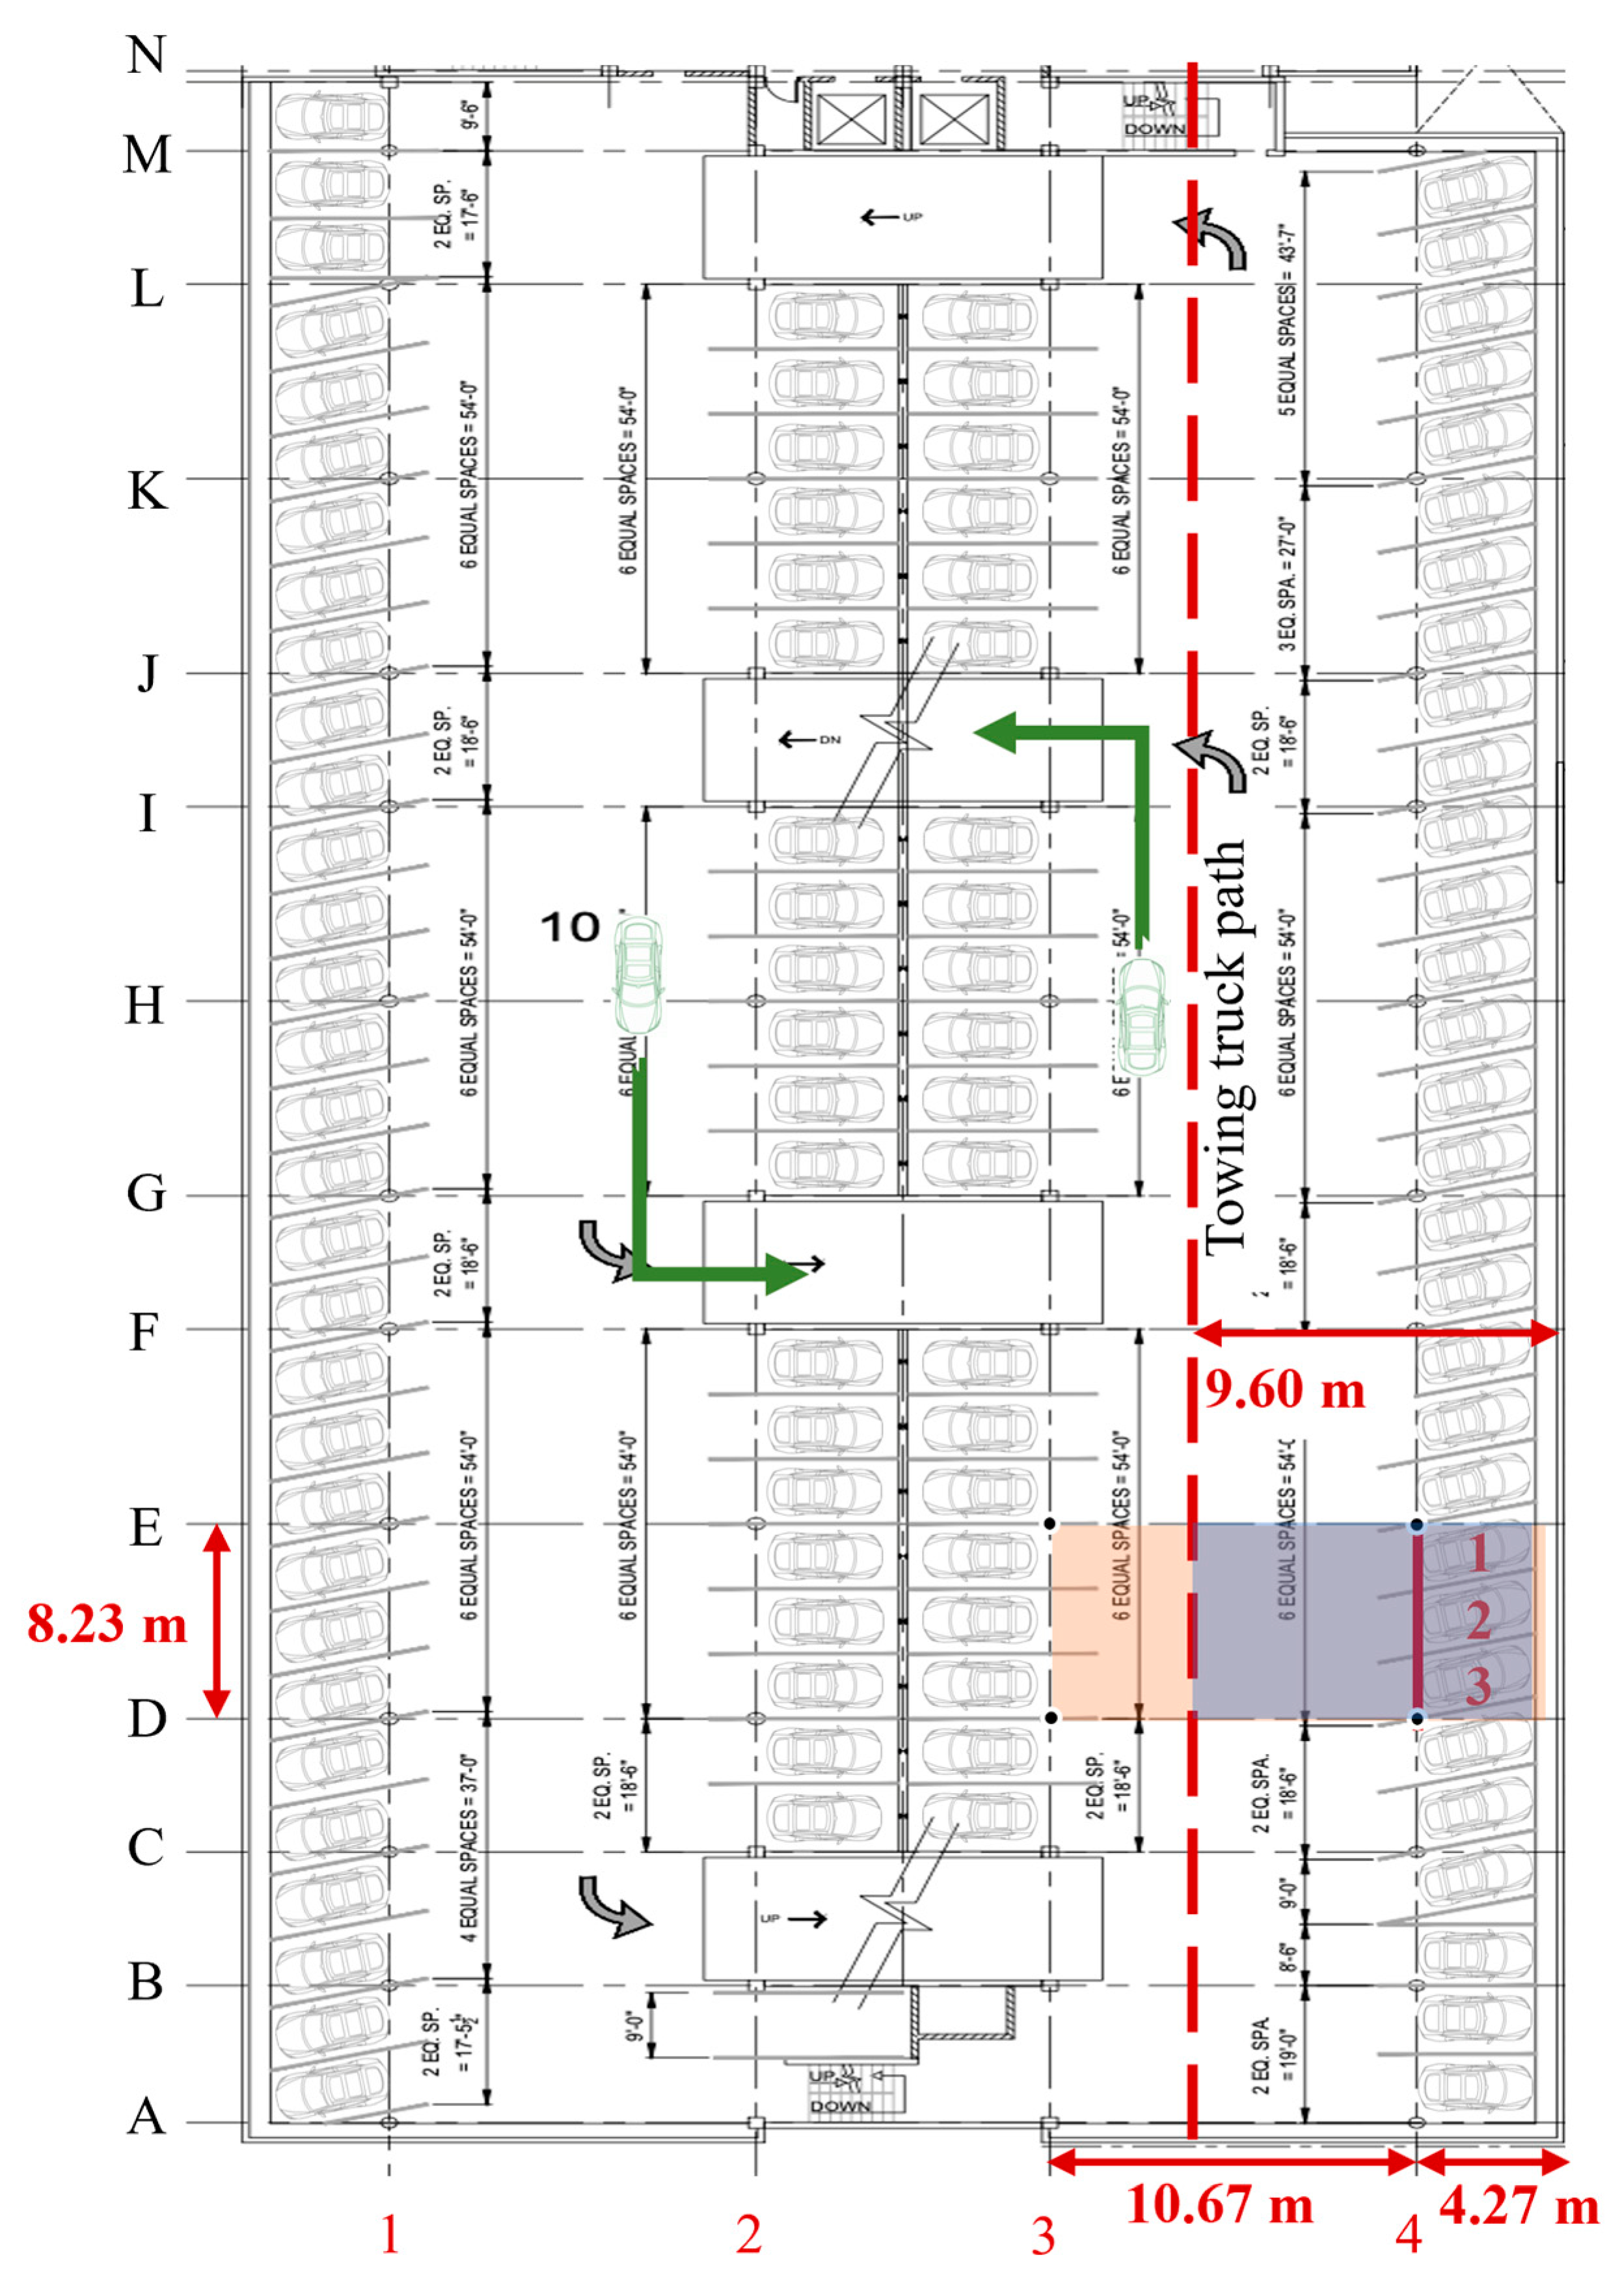
Standard car arrangements used to examine the axial load on column K4 of scenario 1 with its corresponding tributary area (the highlighted blue) and with its corresponding influence area (the highlighted red).
From Figure 1, column K4 was selected because it gives the maximum reaction response based on influence surfaces calculated using the CSiBridge software [4] model. Following the ASCE 7-22 standard, the length tributary area is 8.23/2 + 8.23/2 = 8.23 m (27 ft) and the width is 10.67/2 + 4.27 m = 9.60 m (31.5 ft), and 4.27 m (14 ft) should not be divided by two because it is a cantilever edge with no column for column K4.
4.2.1. Analysis of Column K4 in SC Garage Structure
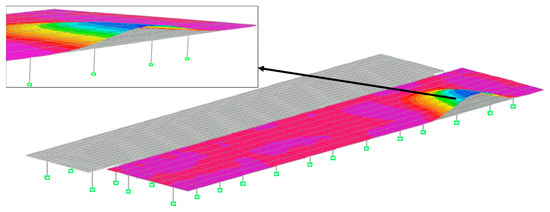
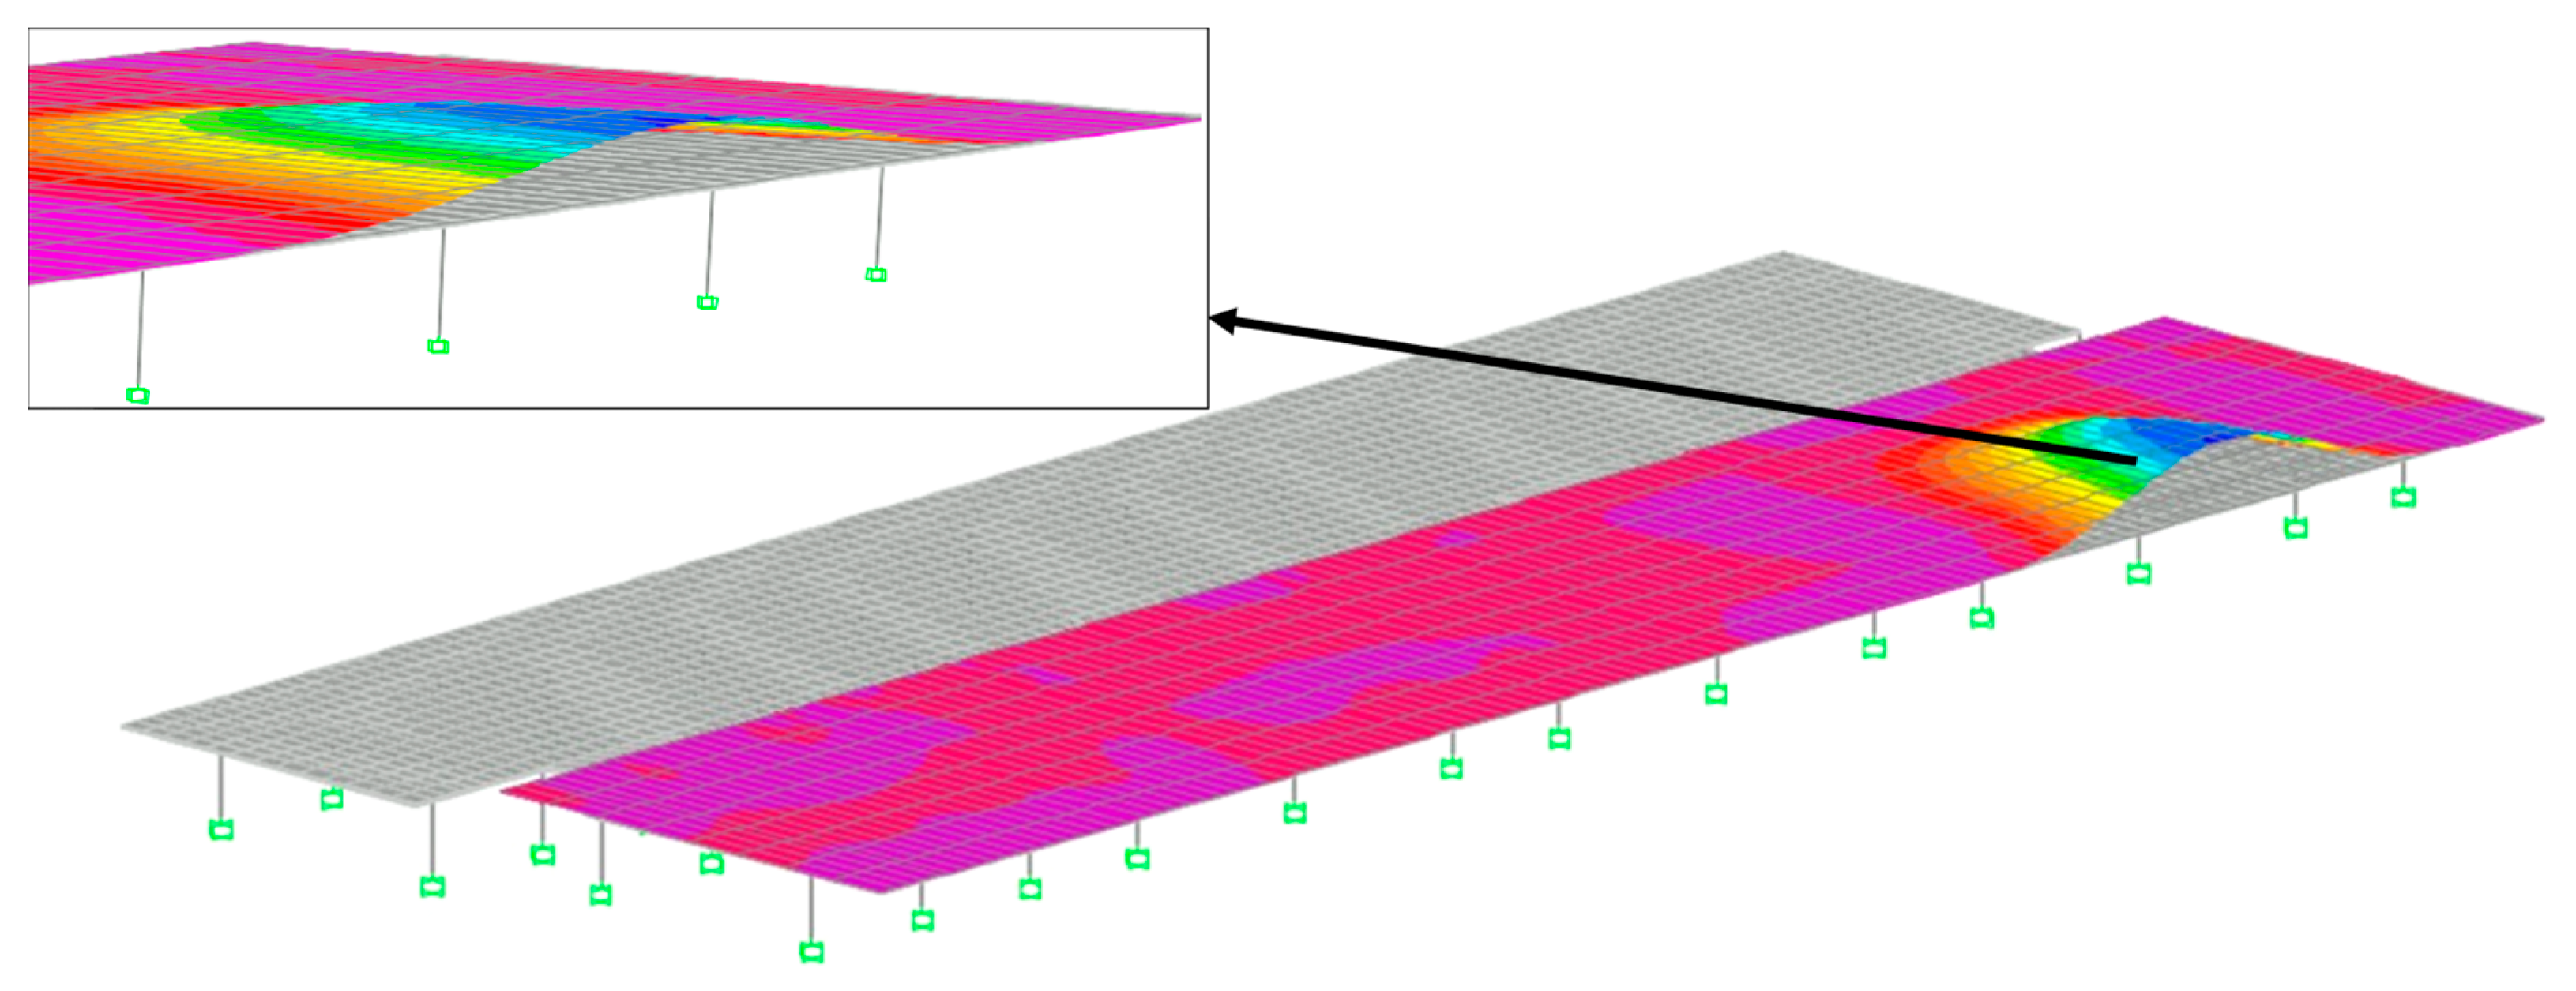
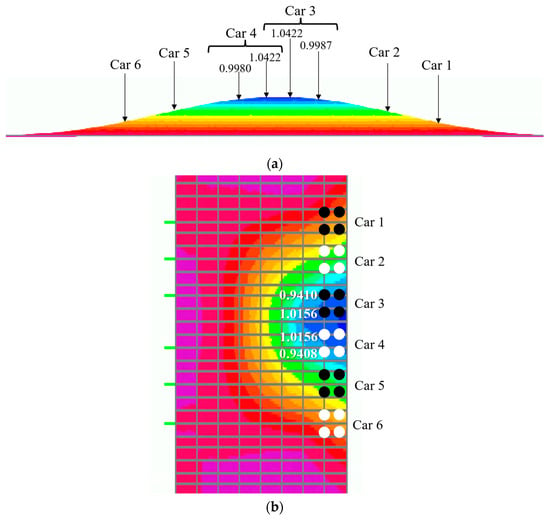
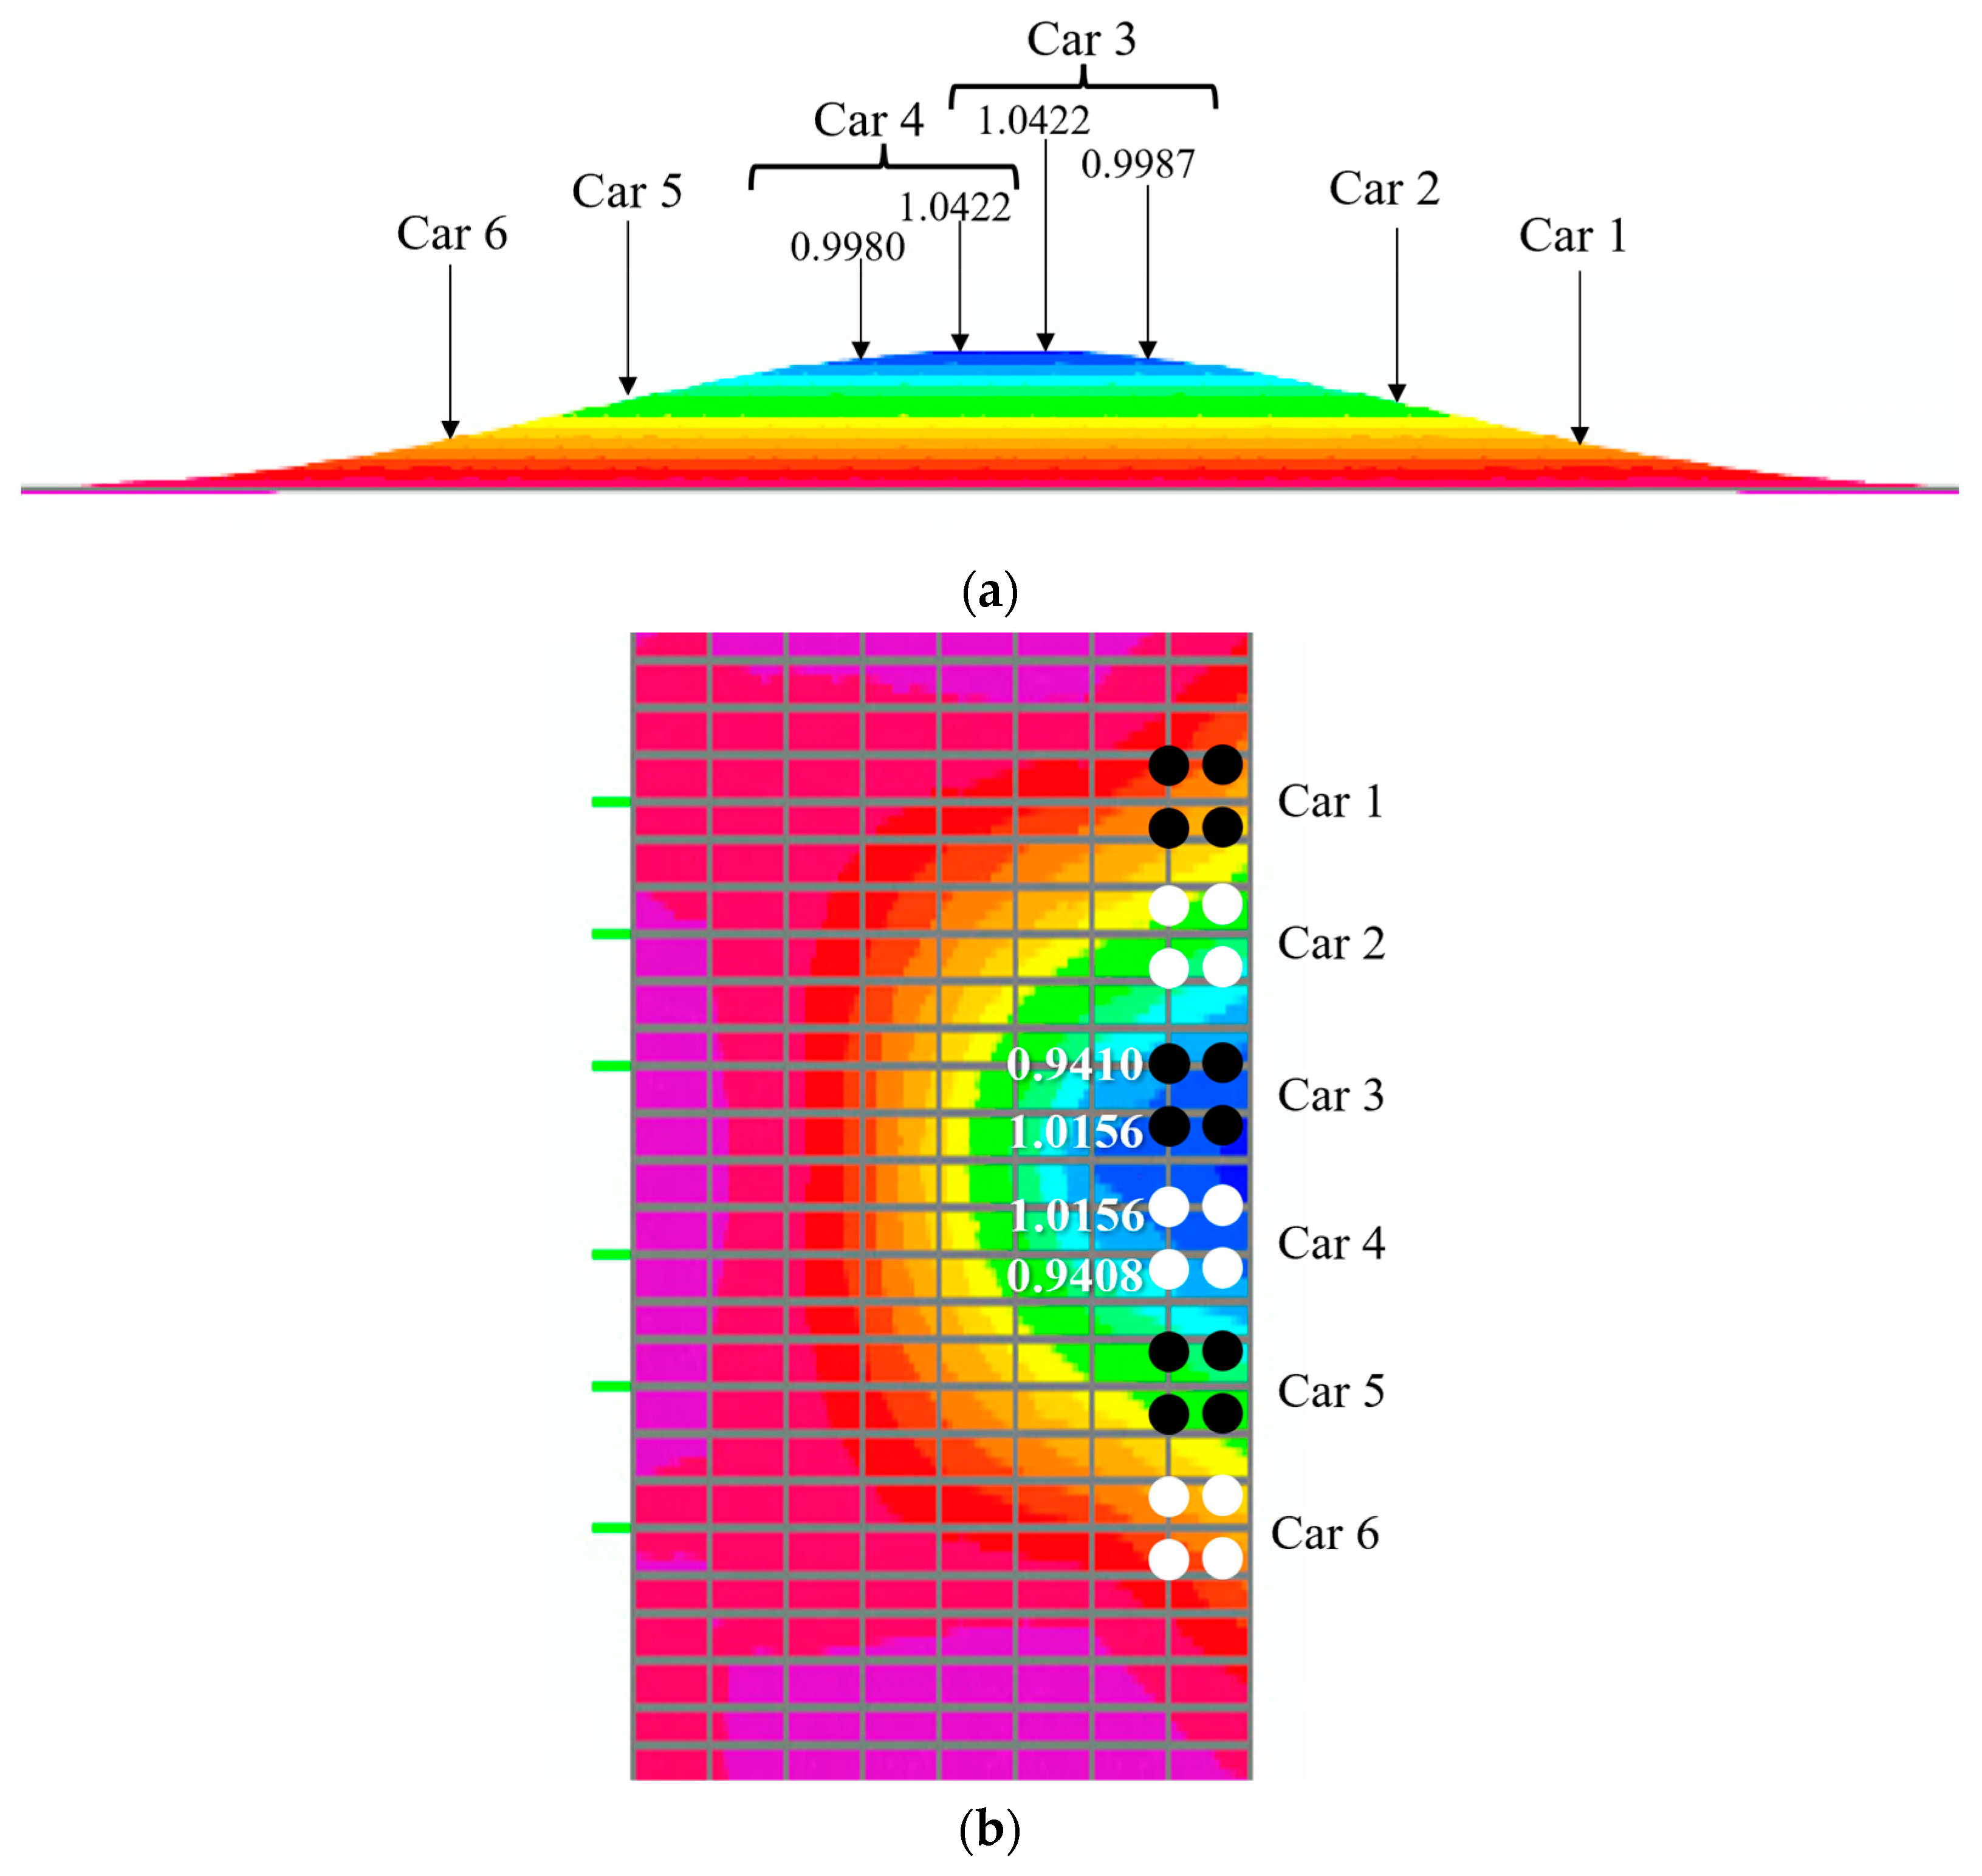
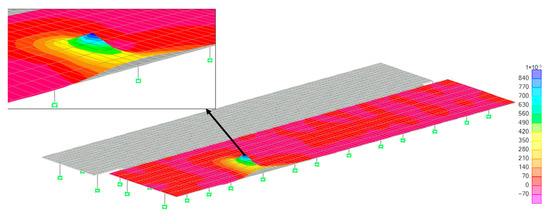
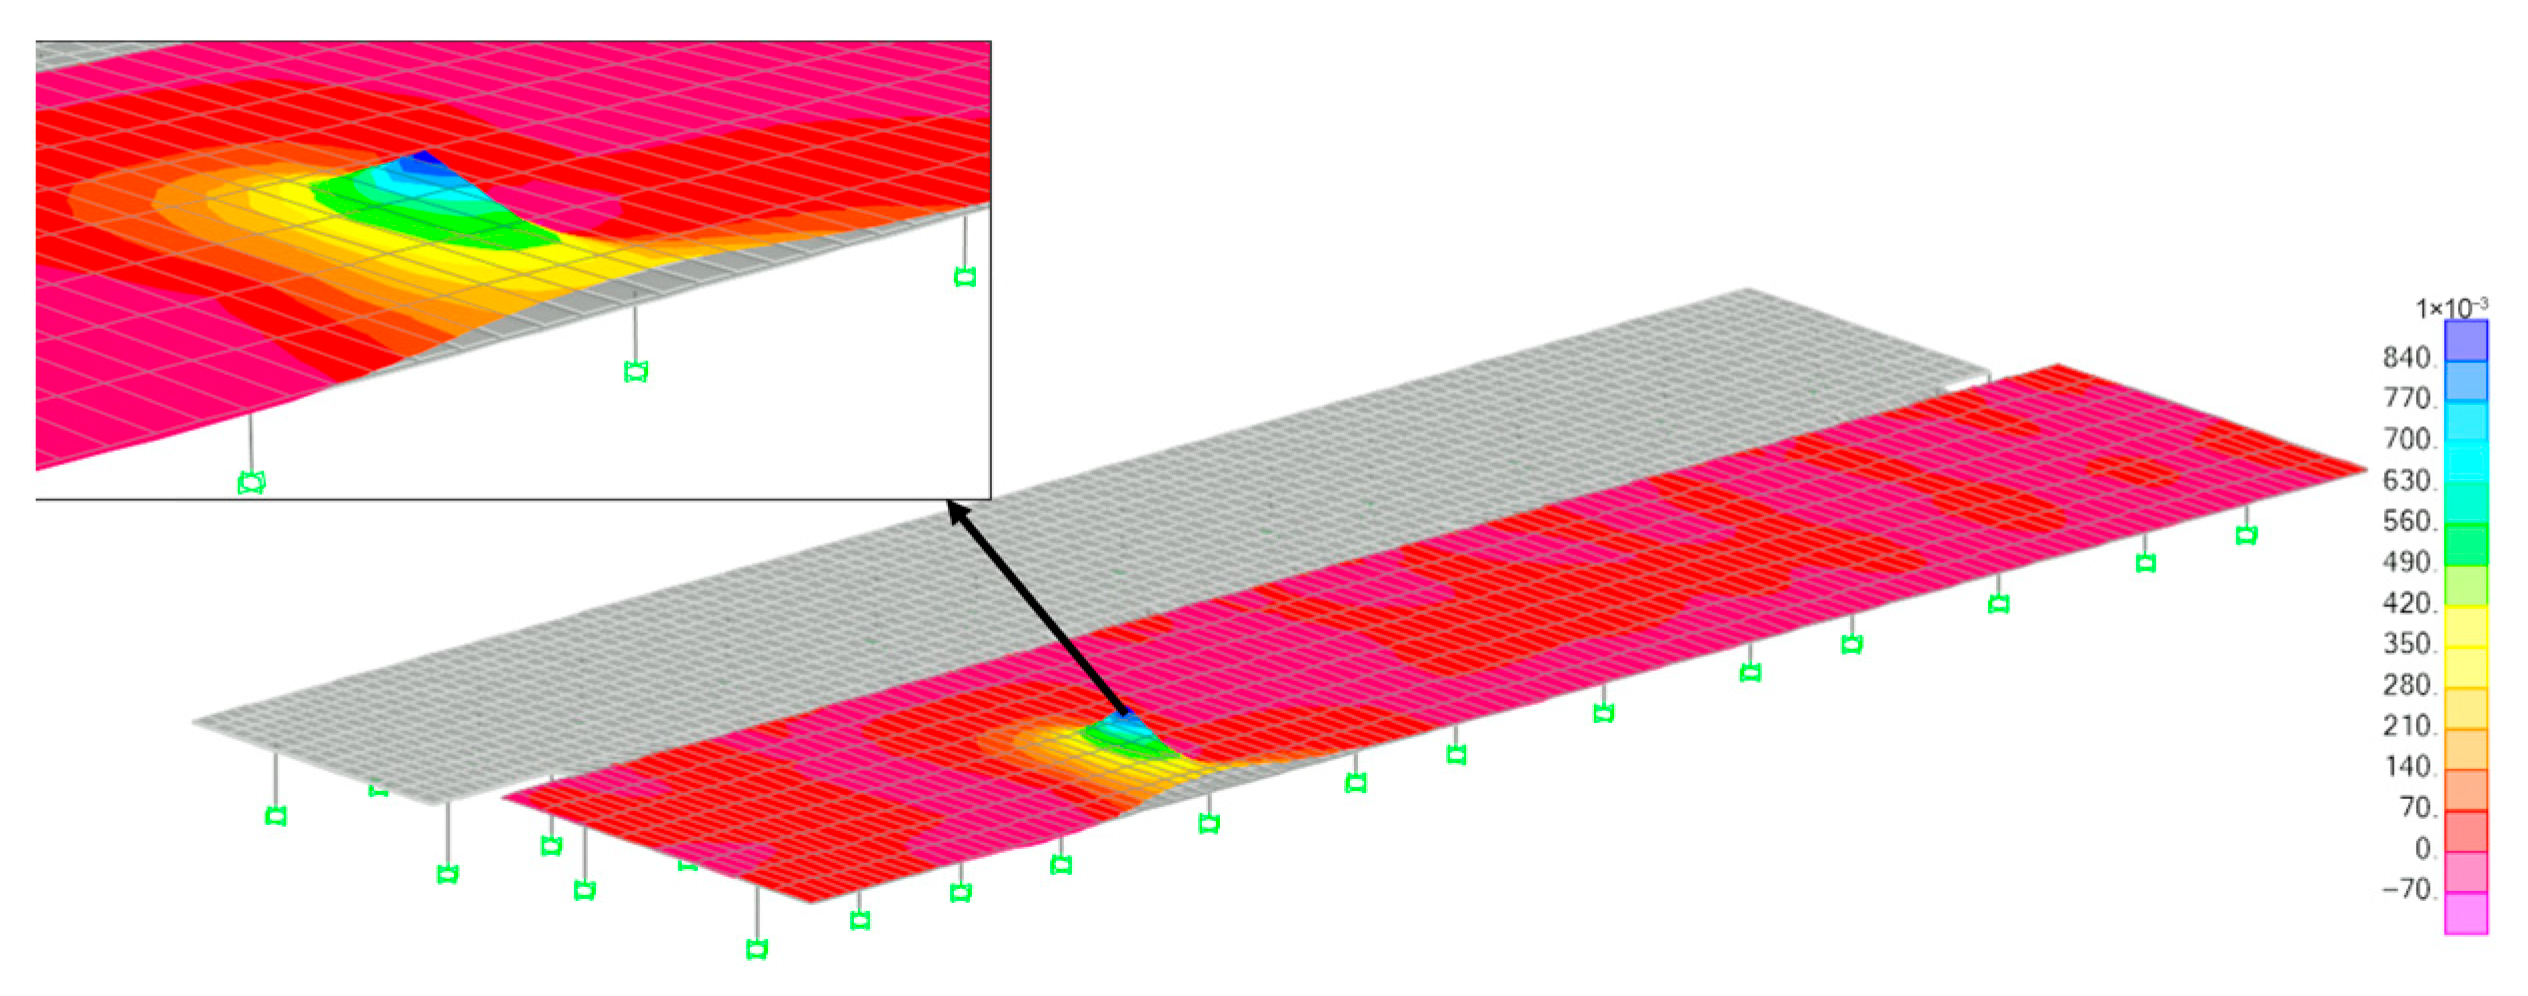
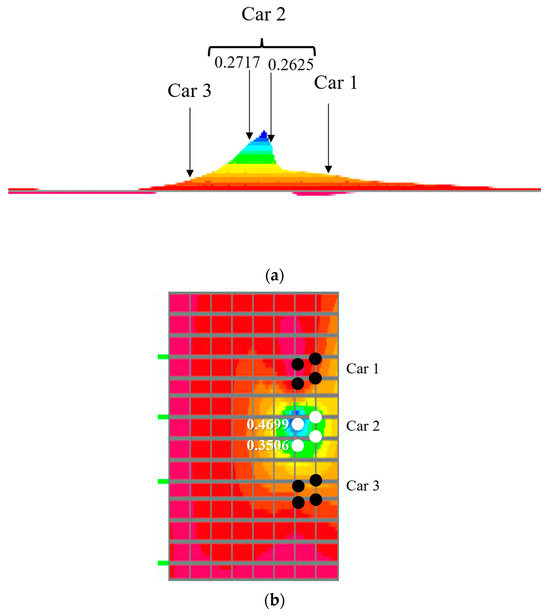
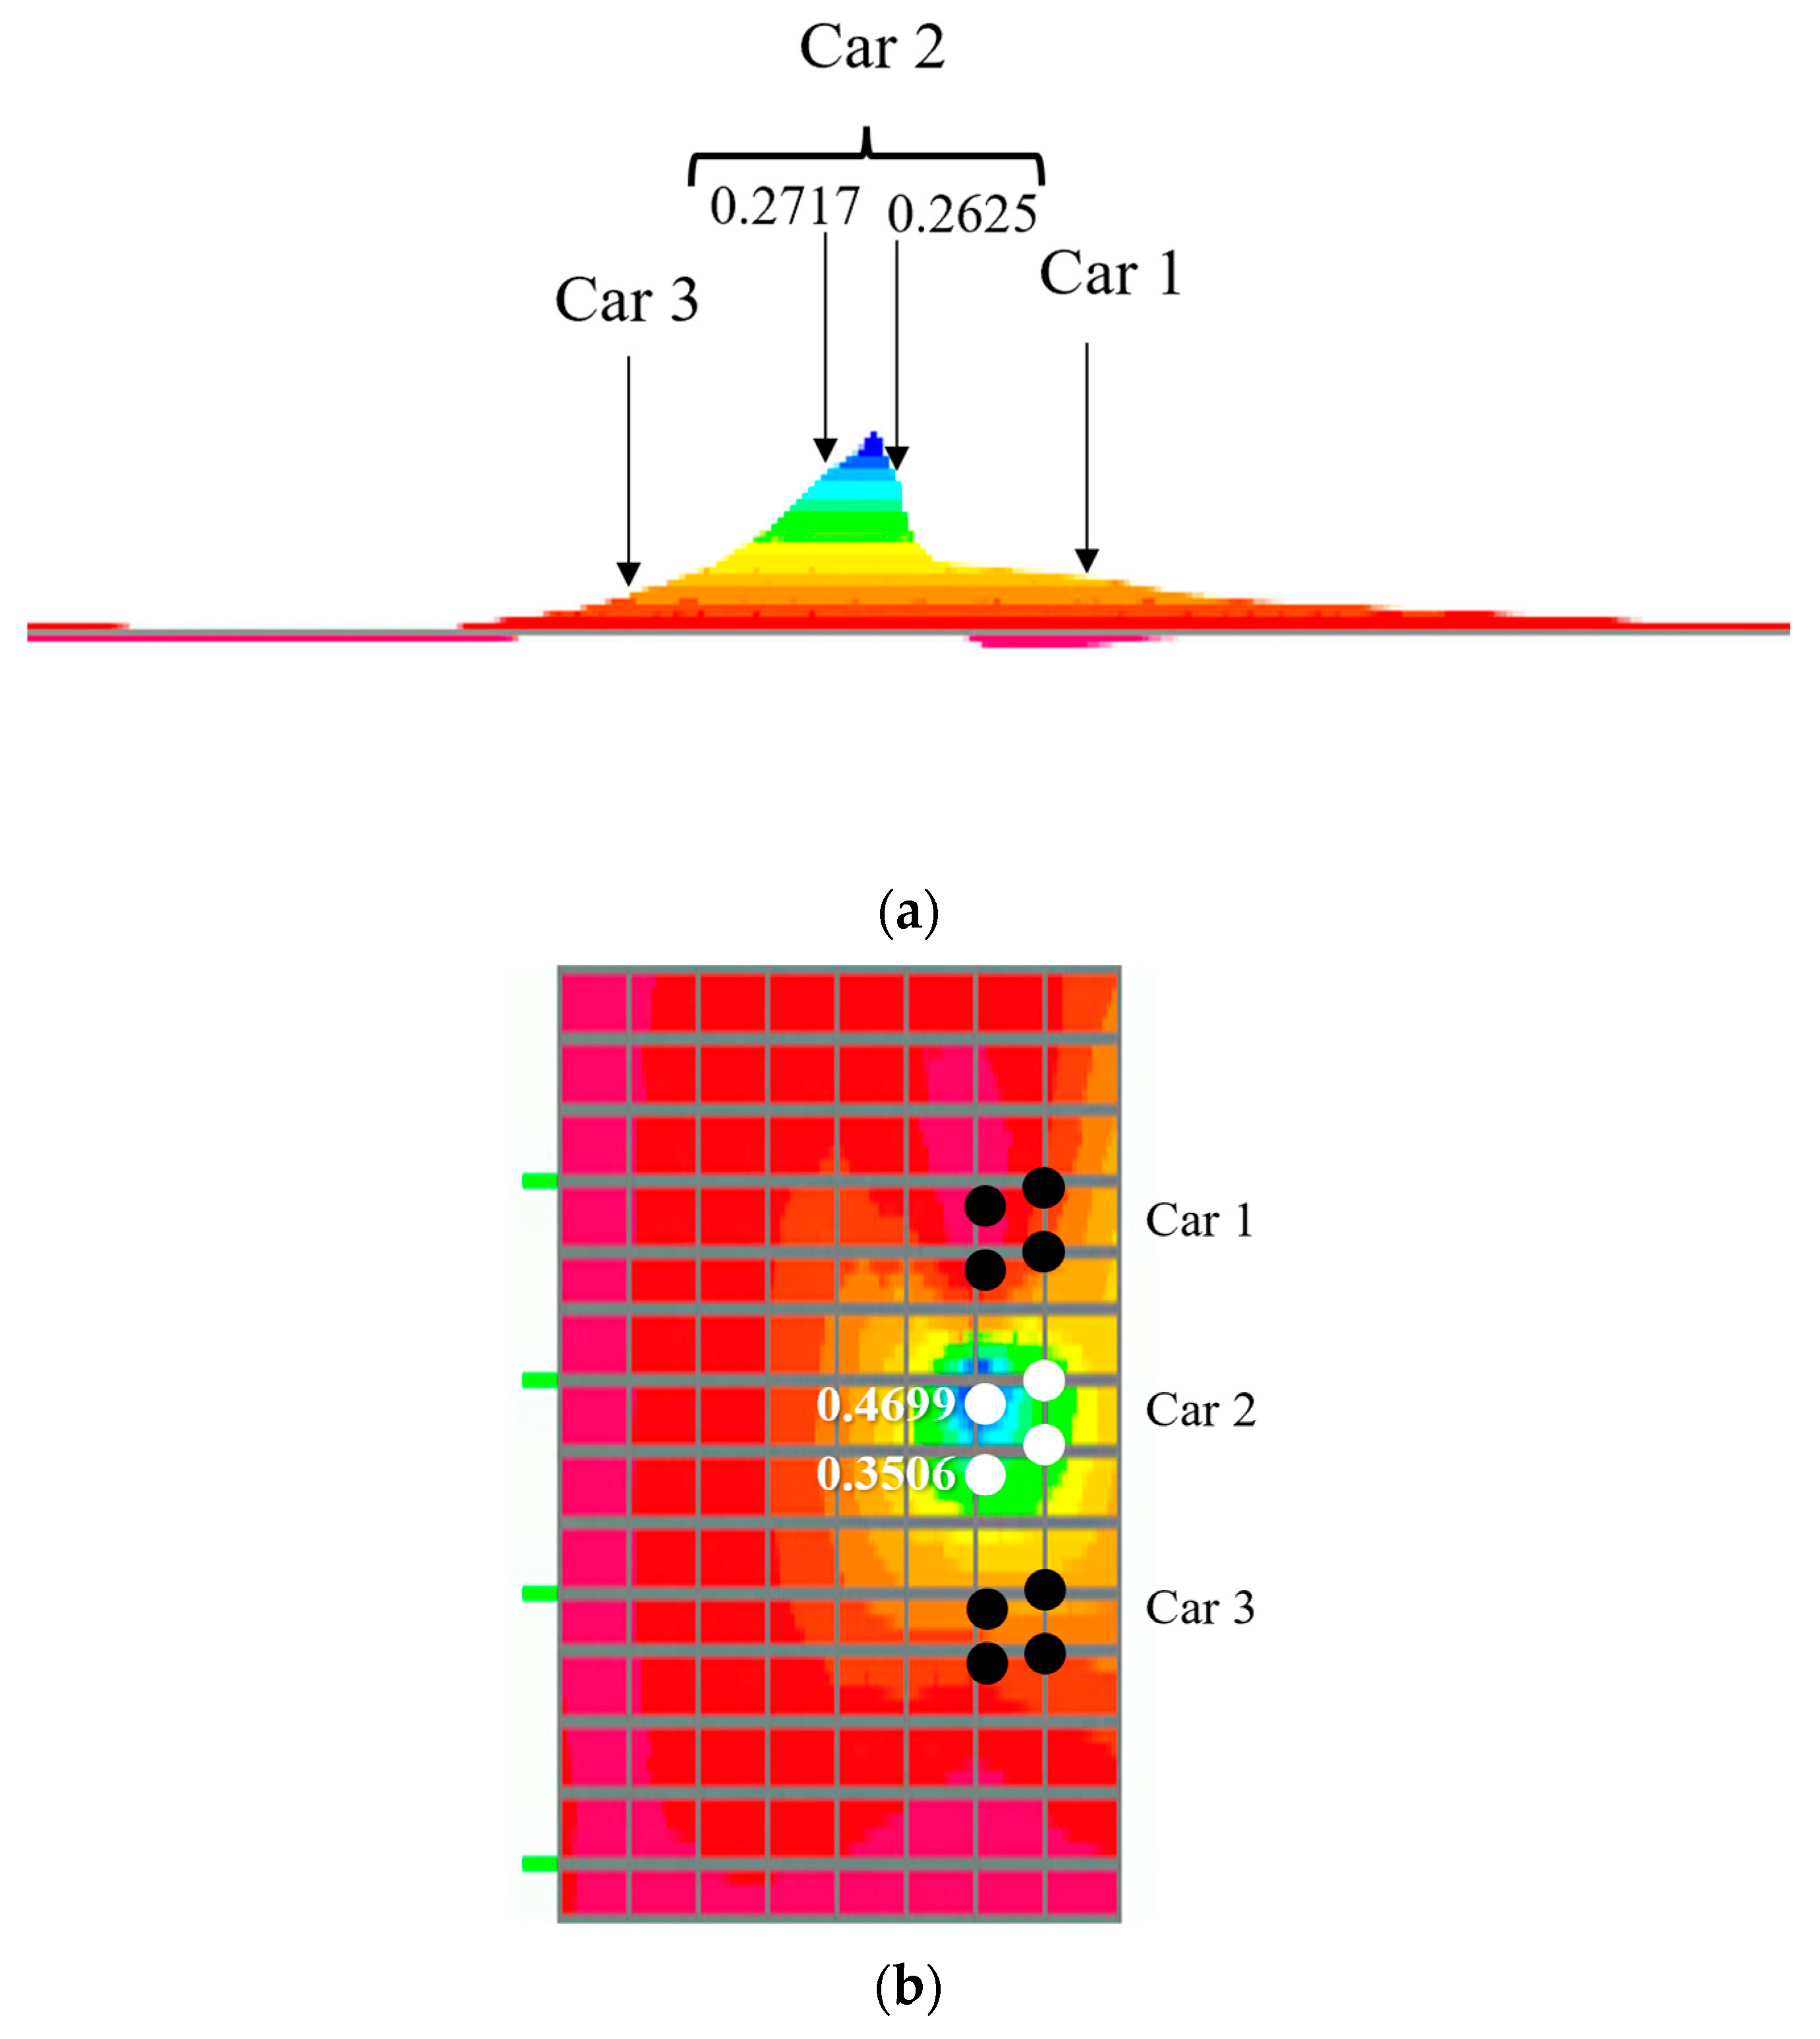
The influence areas of column K4 of the SC parking garage located on the first floor are presented in Figure 2. They were identified based on the requirements of the ASCE 7-22 standard. Note that the influence area for axial loading on a column is four times larger than the tributary area commonly considered in design. This is an important consideration. The influence surface and area depicted (Figure 1) can be represented in a 3D graph using the CSiBridge software [4], as shown in Figure 2. The authors began by assuming a single car was parked in every stall. The maximum column axial load can be obtained (using the vertical coordinates on the influence surface) when the towing truck is placed at exactly 9.60 m (31.5 ft) from the cantilever tip of the parking plan as shown in Figure 1. The maximum loads were calculated using CSiBridge software [4]. The influence surface coordinates of column K4 of the parking stalls within the tributary area for the three cars only using CSiBridge software [4] are shown in Figure 3 and Table 2.
Figure 2.
3D influence surface for axial load in column K4 in the SC parking garage.
Figure 3.
Coordinates of 3D influence surface for axial load in column K4 under cars number 3 and 4, (a) front wheels and (b) rear wheels.
Table 2.
Influence surface coordinates calculated for column K4 within the tributary area shown in Figure 1.
Each parking stall is assumed to have a car weight of 16,089 N (3617 lb) [9]. Hence, each tire acts as a single load of 4022 N (904.25 lb). The total axial load supported by column K4 is given by [7] and is defined in Equation (1).
where F is the axial loading on one column due to 1/4 of the influence area, Wi is the tire weight, and Ci is the influence surface coordinates under each tire generated from CSiBridge software [4]. Because the weights of four tires are the same 4022 N each, it is easier to sum all the influence surface coordinates together in Table 2 and multiply by a single tire load. Therefore, the summation for all coordinates represented in Table 2 is 10.88 for three cars. The design live load on the tributary area is 1.92 kN/m2, i.e., live load for a parking garage in the ASCE 7-22, multiplied by 9.60 m × 8.23 m = 151,389 N. The total load on column K4 is 4022 N × 10.88 = 43,770 N. Therefore, the design live load for scenario 1 within the tributary area using the reverse of the process is P/AT = 43,770 N/9.60 m × 8.23 m = 0.55 kN/m2. It can be concluded that the design live load for a parking garage in the ASCE 7-22 (1.92 kN/m2) is about three times larger than the calculated EUDL (0.55 kN/m2) for the standard car (scenario 1) for column K4 within the tributary area. Therefore, the design live load of the ASCE 7-22 is considered to be conservative in this specific scenario, assuming that the influence area of column K4 (Figure 1) is considered instead of the tributary area. To determine the locations of the standard cars’ wheels (concentrated forces) in terms of the coordinates, the influence surface coordinates of the parking stall within the influence area of column K4 for the six cars (Figure 1) using CSiBridge (2022) software are provided in Table 3.
F = CiWi
Table 3.
Influence surface coordinates calculated for column K4 within the influence area shown in Figure 1.
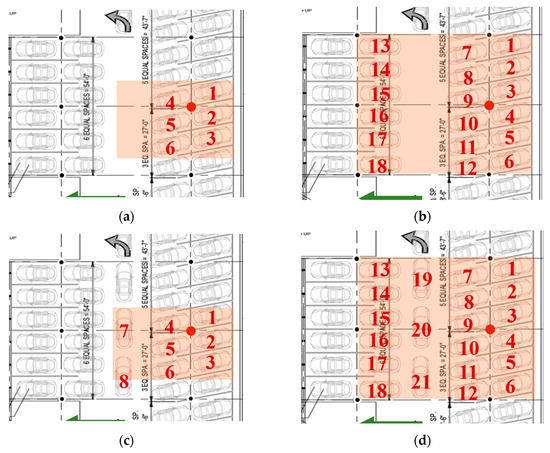
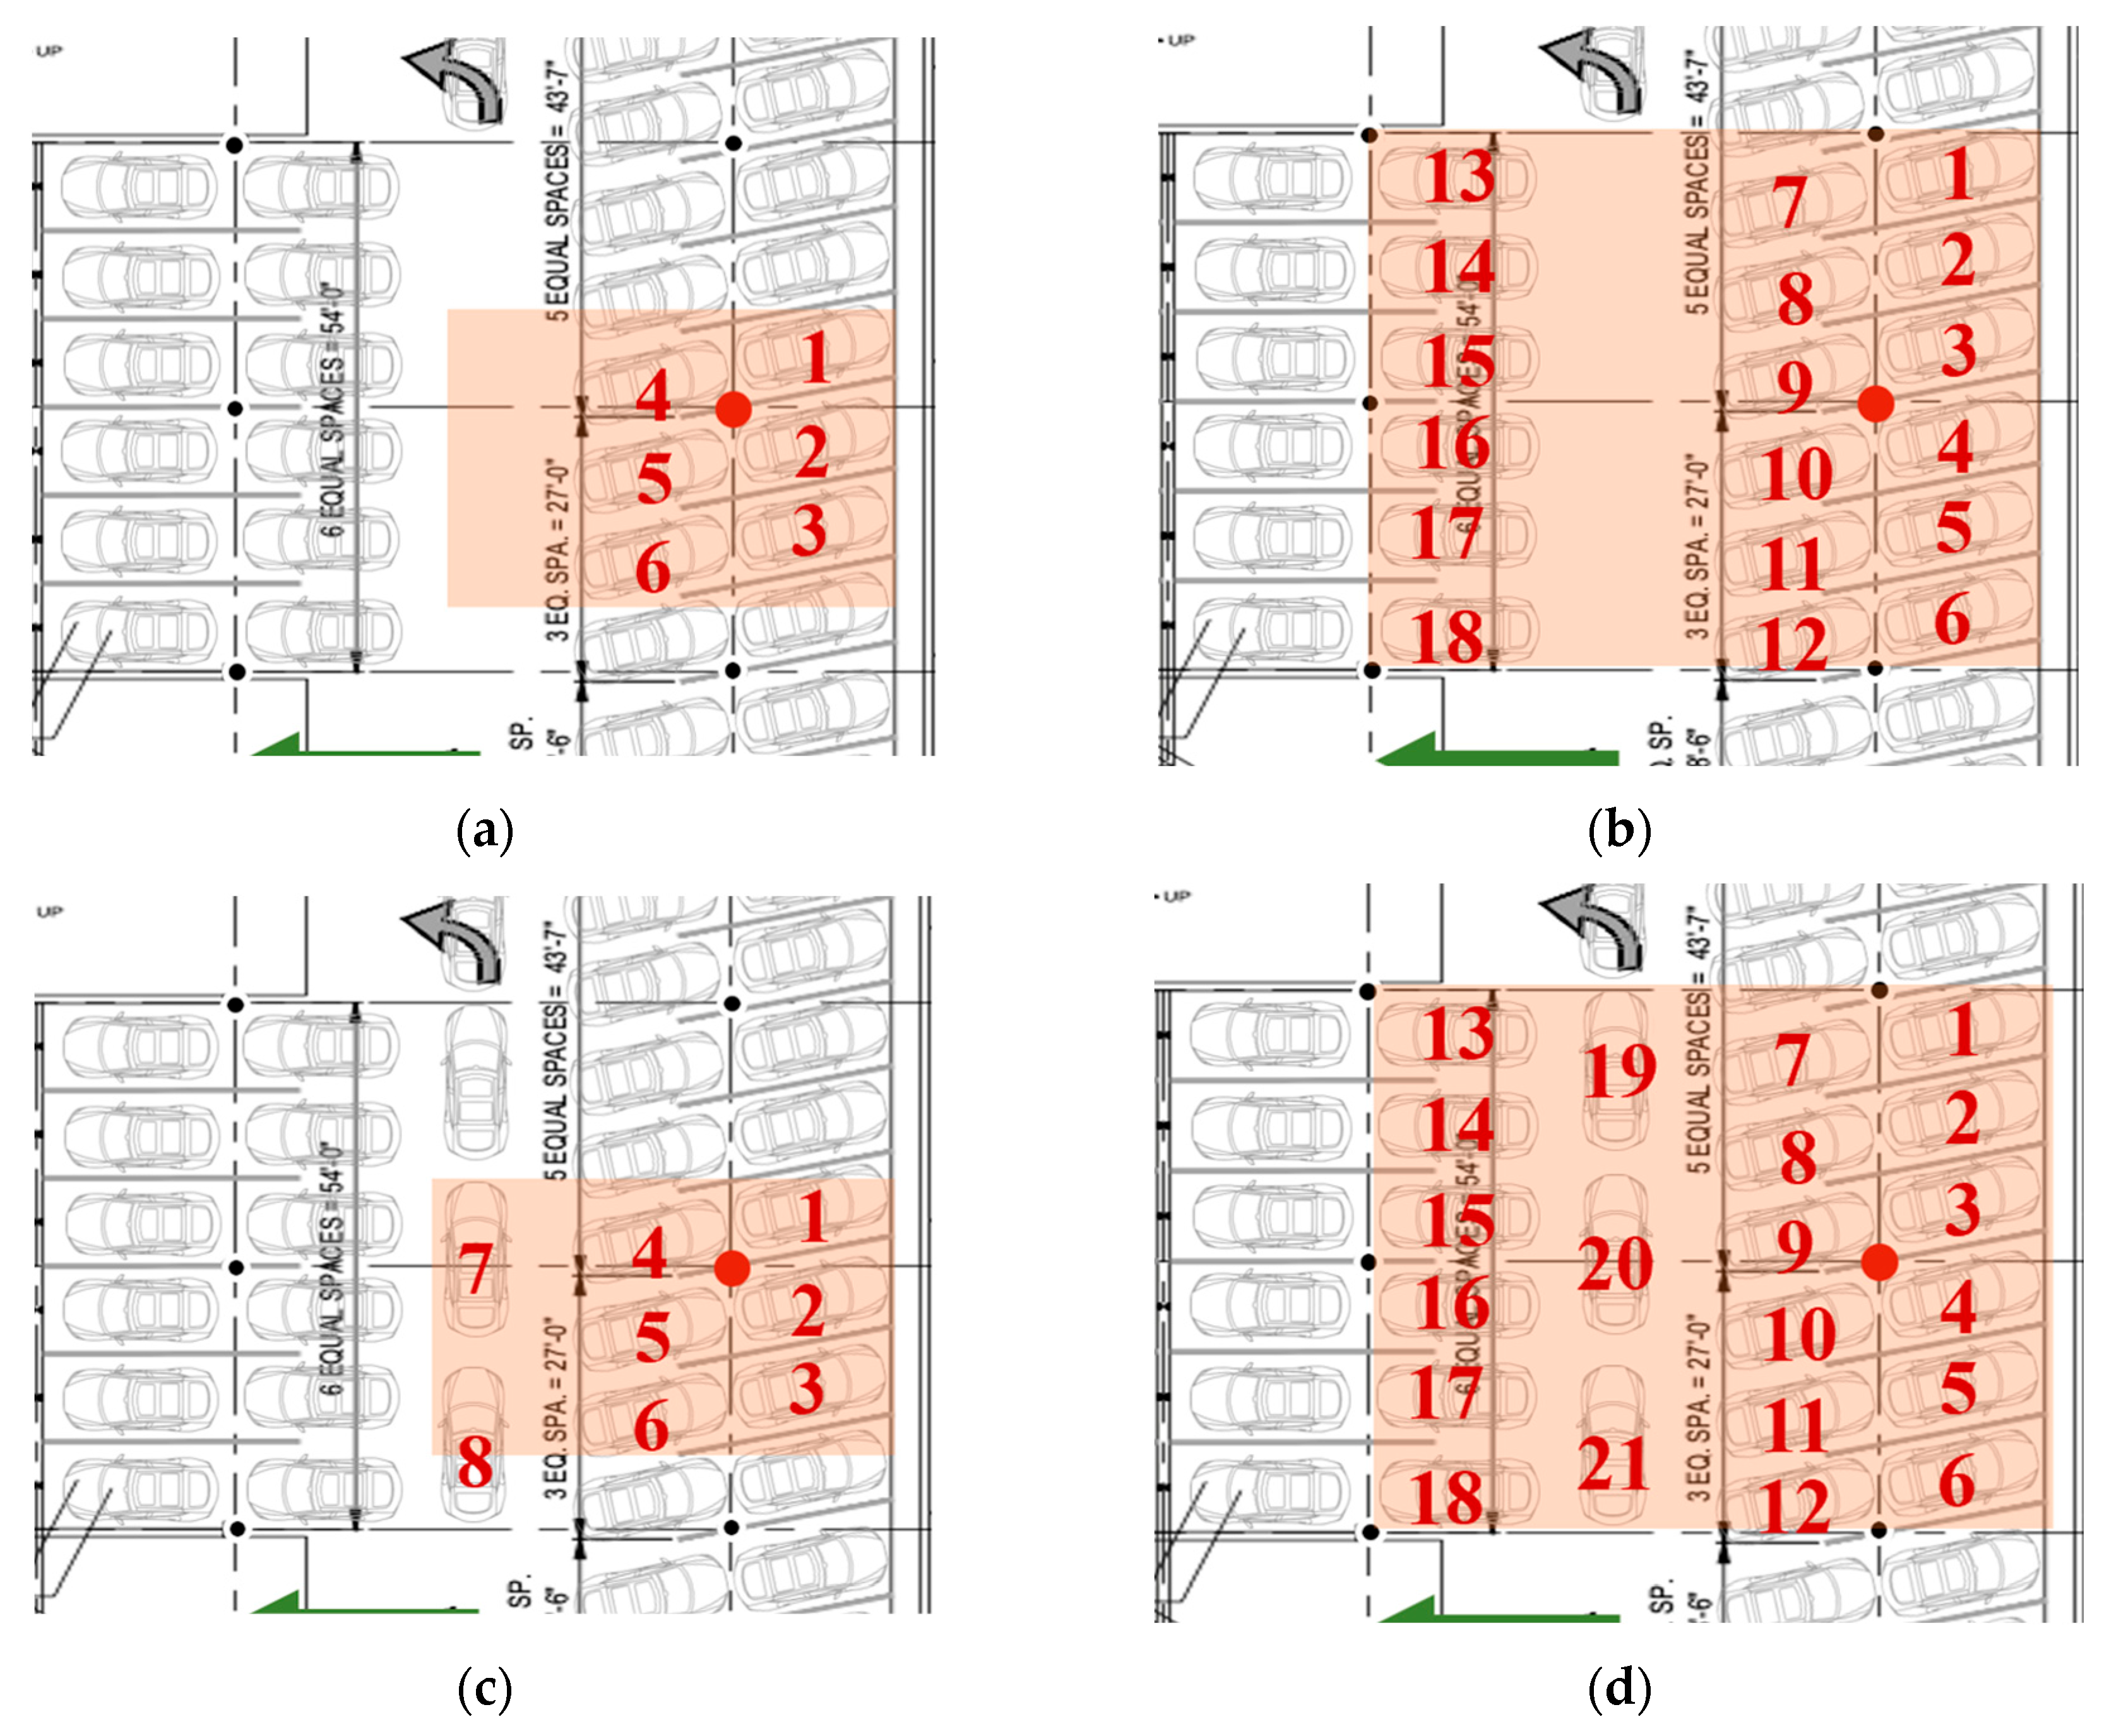
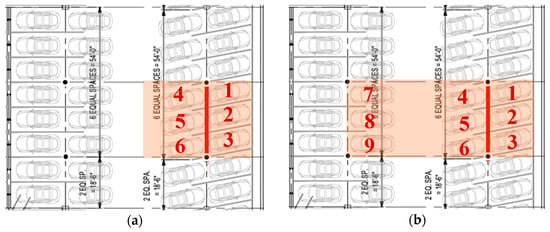
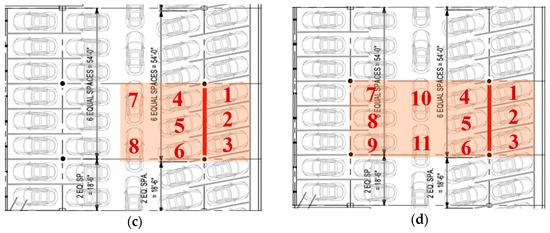
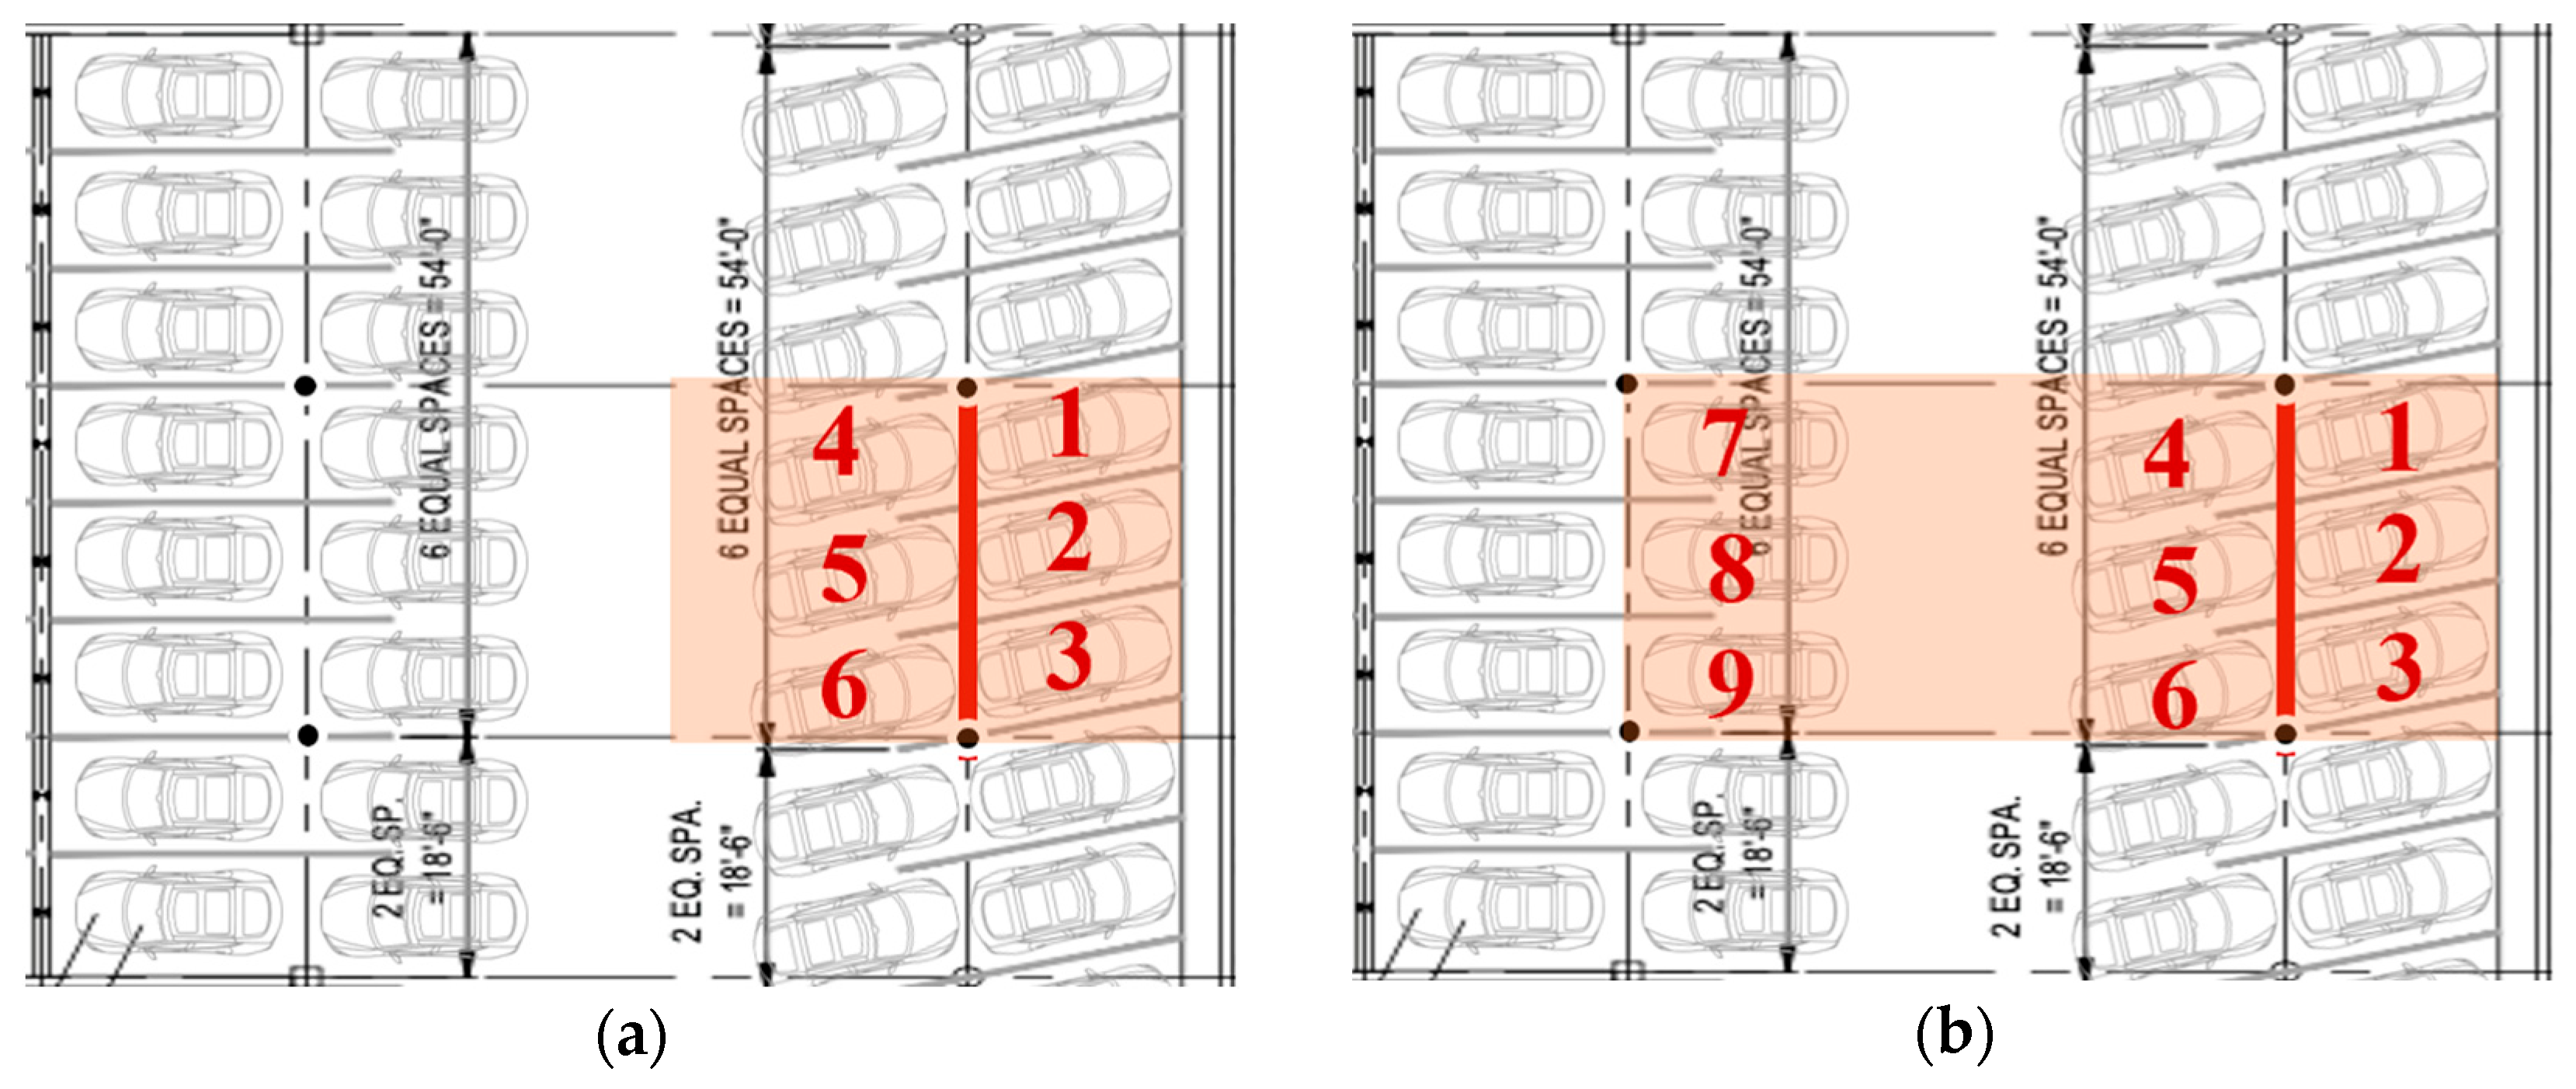
The summation for all coordinates represented in Table 3 is 15.79. Assuming there is a uniform design live load of 1.92 kN/m2, based on the ASCE 7-22 and ICC [6], the expected axial load is 117,700 N. The total load on column K4 is 4022 N × 15.793 = 63,525 N. Therefore, the design live load for scenario 1 within the influence area using the reverse process is P/AI = 4 × 63,525 N/16.46 m × 14.94 m = 1.03 kN/m2. It can be concluded that the axial load (1.92 kN/m2 × 16.46 × 14.94 m/4 = 117,700 N) on column K4 due to the ASCE 7-22 live load (1.92 kN/m2) is about twice the value of the calculated maximum axial load (63,525 N) which column K4 experienced due to the calculated EUDL (1.03 kN/m2) for the standard car (scenario 1) within the influence area. Therefore, the design live load in the ASCE 7-22 can be considered conservative in this scenario. Alternative arrangement scenarios of the standard cars (scenarios 2 and 3) were considered to examine the axial load on column K4 in the SC parking garage, and are detailed in Figure 4. Table 4 summarizes the calculated EUDL due to axial load on column K4 of standard cars’ scenarios, the design live load requirements from the ASCE 7-22 standard for parking garages, and the specified (original) design live load for the SC parking garage.
Figure 4.
Standard car arrangements used to examine the axial load on column K4: (a) scenario 2 with its corresponding tributary area, (b) scenario 2 with its corresponding influence area, (c) scenario 3 with its corresponding tributary area, and (d) scenario 3 with its corresponding influence area.
Table 4.
Summary of the live loads for column K4 axial loading (standard cars) in the SC parking garage.
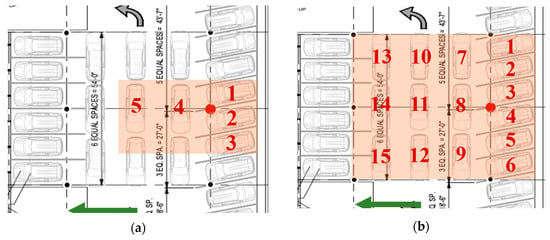
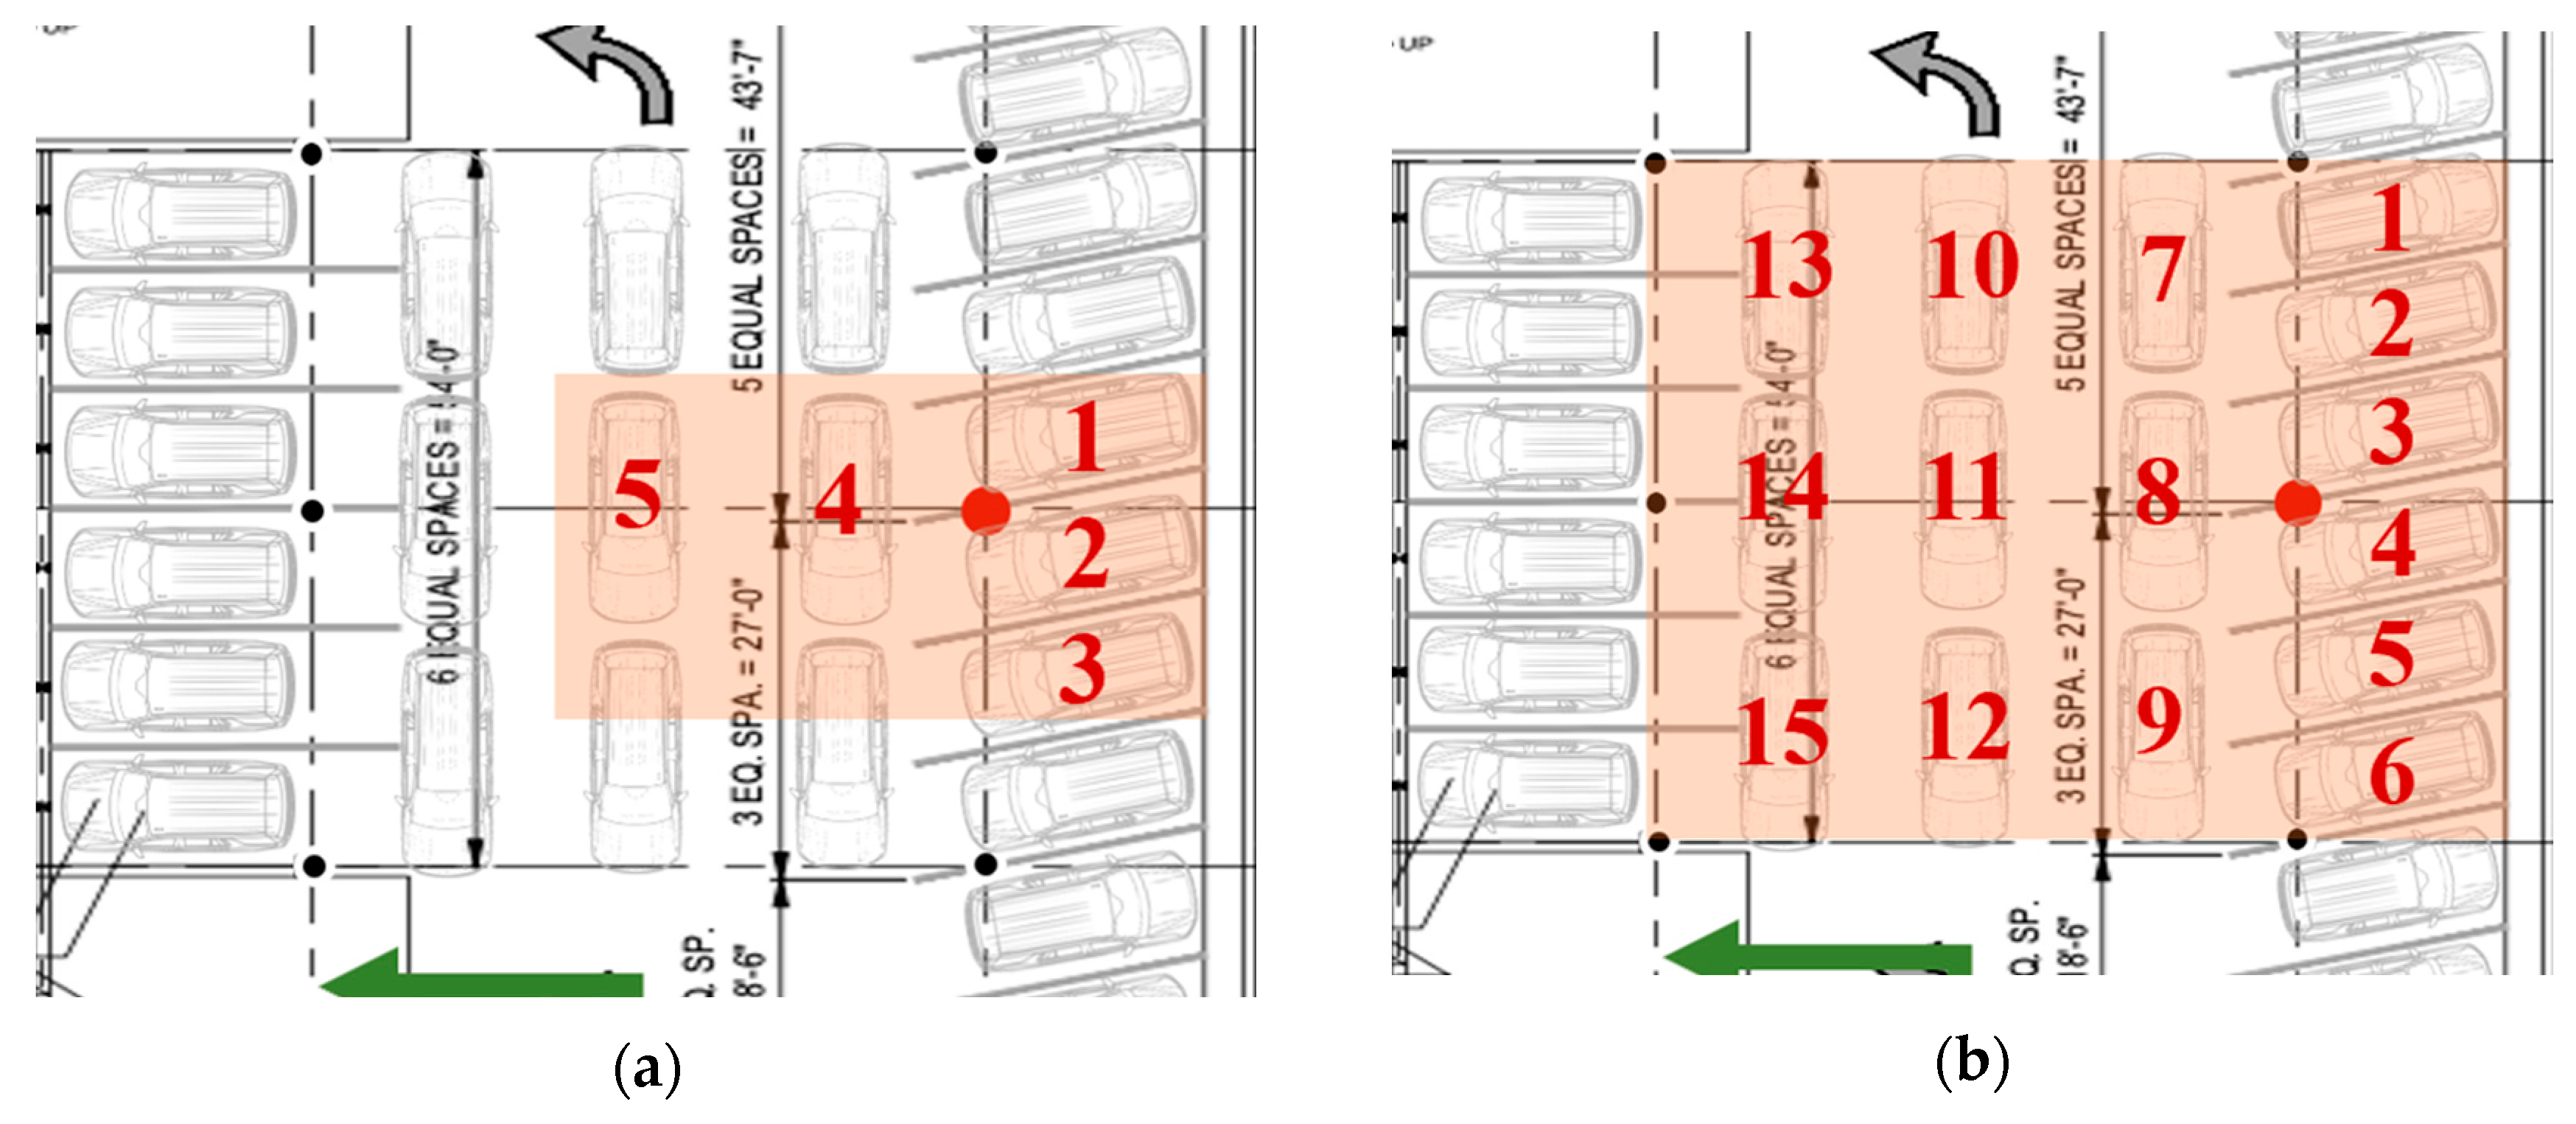
Now, consider another car model as detailed in [11]. In Figure 5, the tributary and influence areas are specified based on the ASCE 7-22. The first scenario involves assuming that one car is parked in each stall. By approximating the SUV wheels as concentrated loads, the influence surface coordinates of parking stall coordinates within the tributary and influence areas of column K4 calculated using CSiBridge software [4] are shown in Table 2 and Table 3, respectively.
Figure 5.
Scenario 1 of SUV arrangement to examine axial loads in column K4 and its corresponding (a) tributary area and (b) influence area.
From Figure 5, it can be seen that the SUVs (in the highlighted area) are parked in reverse, except for car number 1 (Figure 5b). This car arrangement is considered because the rear axle has a gross weight greater than the front axle. This is why the authors consider the SUVs’ front and rear axles separately, as they do not have the same weights as those of standard cars. It is important to locate the SUV tires on the influence surface coordinates that produce the maximum live load. Hence, for simplicity, the first two rows presented in Table 5 and Table 6 are the influence surface coordinates corresponding to an SUV’s rear axle.
Table 5.
Influence surface coordinates calculated for column K4 within the tributary area shown in Figure 5a.
Table 6.
Influence surface coordinates calculated for column K4 within the influence area shown in Figure 5b.
Because the weights of the rear tires are the same (9564 N each) and the front tires are the same (8229 N each), it is easier to sum each axle’s influence surface coordinates together and multiply each axle summation by the corresponding tire load. Therefore, the summations for all coordinates shown in Table 5 under the rear and front axles are 5.729 and 5.153, respectively. Then, the total axial load on column K4 is 9564 N × 5.729 + 8229 N × 5.153 = 97,198 N. Therefore, the design live load for SUV scenario 1 within the tributary area (Figure 5a) is P/AT = 97,198 N/9.60 m × 8.23 m = 1.23 kN/m2. The design live load for a parking garage in the ASCE 7-22 (1.92 kN/m2) is about 1.5 times larger than the calculated EUDL (1.23 kN/m2) for the SUVs (scenario 1) for column K4 within the tributary area (Figure 5a). Therefore, the design live load of the ASCE 7-22 is considered to be conservative in this scenario.
Assuming that the influence area of column K4, i.e., a highlighted area in Figure 5b, is considered instead of the tributary area, to determine the locations of the standard cars’ wheels (concentrated forces) in terms of the coordinates, the influence surface coordinates (Table 6) of parking stall coordinates within the influence area of column K4 for the scenario shown in Figure 5b are 9564 N × 8.533 + 8229 N × 7.261 = 141,456 N. Therefore, the design live load for SUV scenario 1 within the influence area using the reverse of the process mentioned above is P/AI = 4 × 141,456 N/16.46 m × 14.94 m = 2.30 kN/m2. It can be concluded that the axial load (1.92 kN/m2 × 16.46 m × 14.94 m/4 = 117,700 N) on column K4 due to the ASCE 7-22 (1.92 kN/m2) is smaller than the value of the calculated maximum axial load (141,456 N) which column K4 experienced due to the calculated EUDL (2.30 kN/m2) for the SUVs (scenario 1) within the influence area (Figure 5b). However, due to the specified (original) design live load (2.39 kN/m2) of the SC parking garage, the axial load on column K4 is 2.39 kN/m2 × 16.46 m × 14.94 m/4 = 147,125 N, which is about 1.04 times the value of the calculated maximum axial load (141,456 N) which column K4 is expected to experience over the garage’s lifetime on the first scenario (Figure 5b). Another scenario (scenario 2) of the SUVs’ arrangement is considered to examine axial load on column K4 in the SC parking garage, as detailed in Figure 6. Table 7 summarizes the calculated EUDL due to axial load on column K4 of SUV scenarios, the design live load requirements from the ASCE 7-22 standard for parking garages, and the specified (original) design live load for the SC parking garage.
Figure 6.
Scenario 2 of SUV arrangement to examine column K4 and its corresponding (a) tributary area and (b) influence area.
Table 7.
Summary of the live loads for column K4 axial loading (SUV) in the SC parking garage.
From Table 7, it can be concluded that the axial load on column K4 due to ASCE 7-22 (1.92 kN/m2) is smaller than the value of the calculated maximum axial load due to the calculated EUDL of 2.30 kN/m2 and 2.01 kN/m2 for the SUVs in scenarios 1 and 2, respectively.
However, due to the SC parking garage’s specified (original) design live load (2.39 kN/m2), the axial load on column K4 is about 1.04 times the value of the calculated maximum axial load that column K4 is expected to experience during its service life. In addition, the calculated EUDL (4.74 kN/m2) of column K4 in the second SUV scenario is about twice the specified (original) design live load of the SC parking garage structure (2.39 kN/m2). It should be noted that this scenario compromised the SC parking garage with extreme loading.
4.2.2. Analysis of Column C6 in the NW Garage Structure
The five-story NW parking garage located in Columbus, Ohio, is a precast concrete structure. It contains prestressed concrete double-tee beams. This parking garage has two halves totaling 58.37 m (191.5 ft) in width and 73.58 m (241.42 ft) in length. The main prestressed concrete double-tee beam is the 8DT32 section. All columns have 610 mm (24 in) square sections. The columns and double-tee beams have a specified compressive strength of 41.4 MPa (6000 psi) and 34.5 MPa (5000 psi), respectively. The other properties of the NW garage are described in [11].
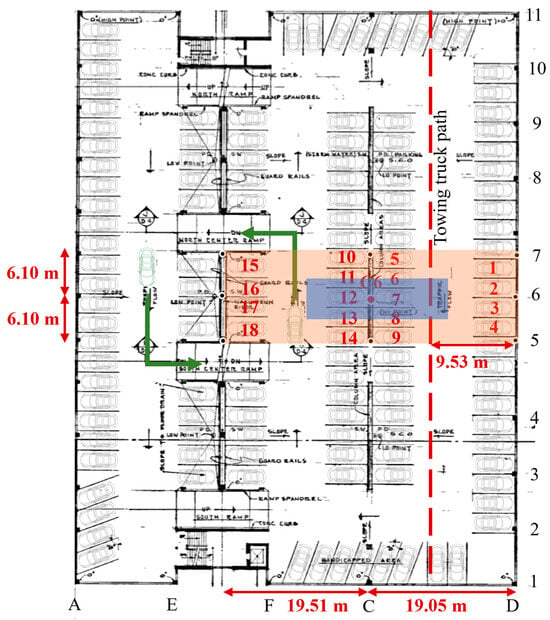
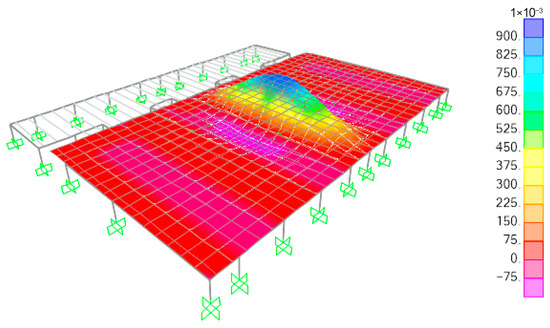
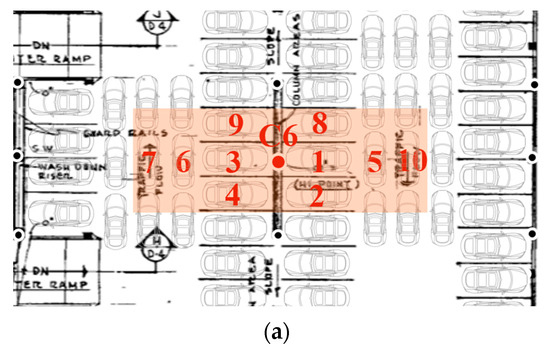
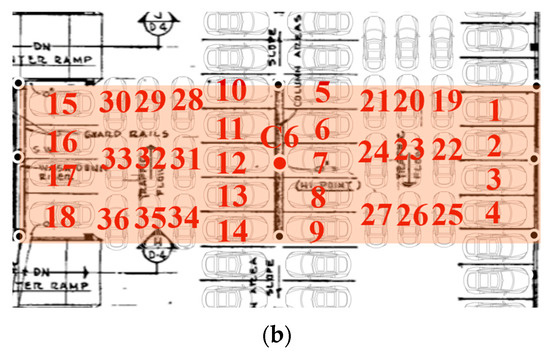
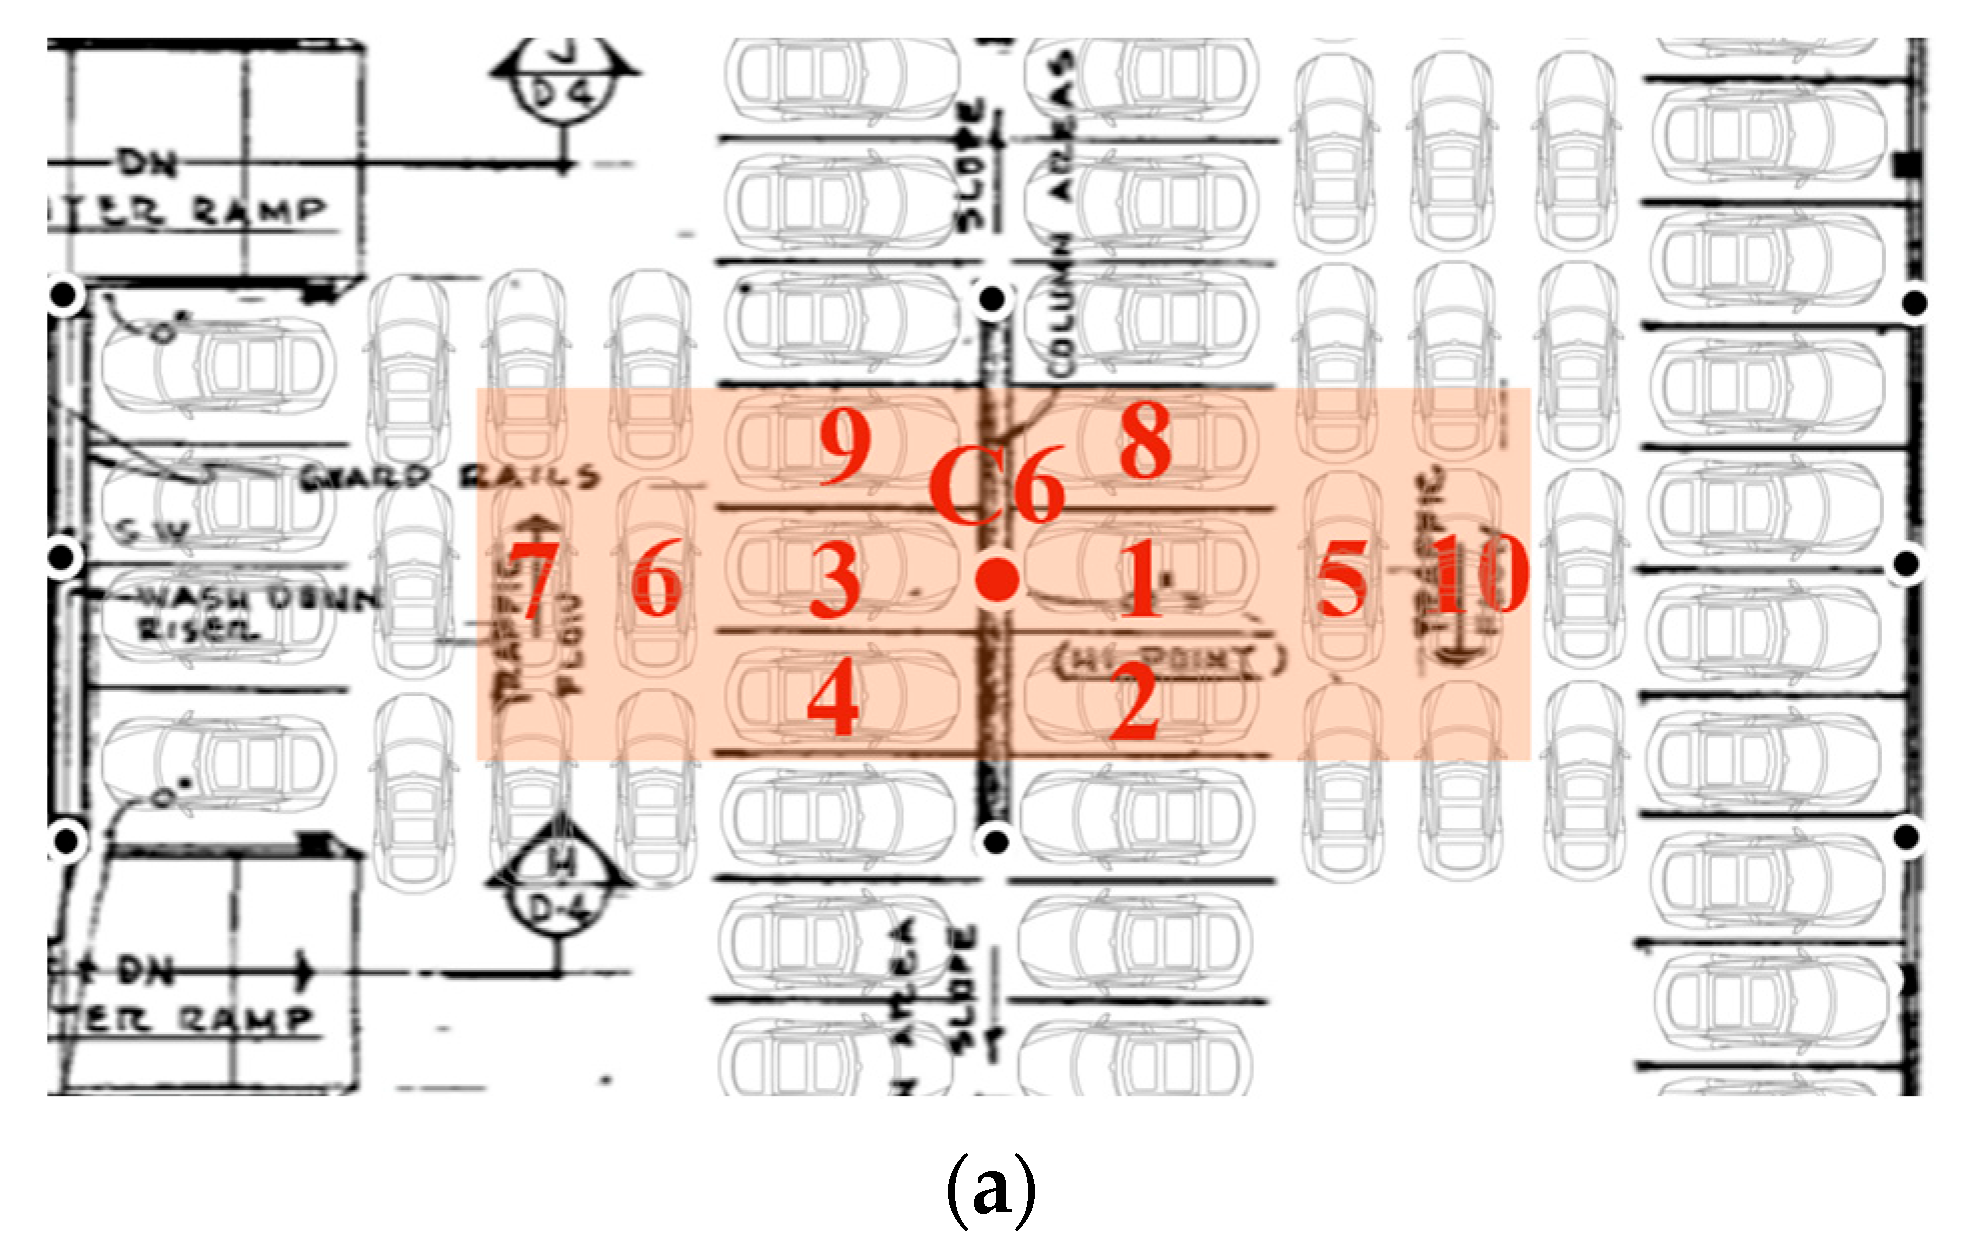
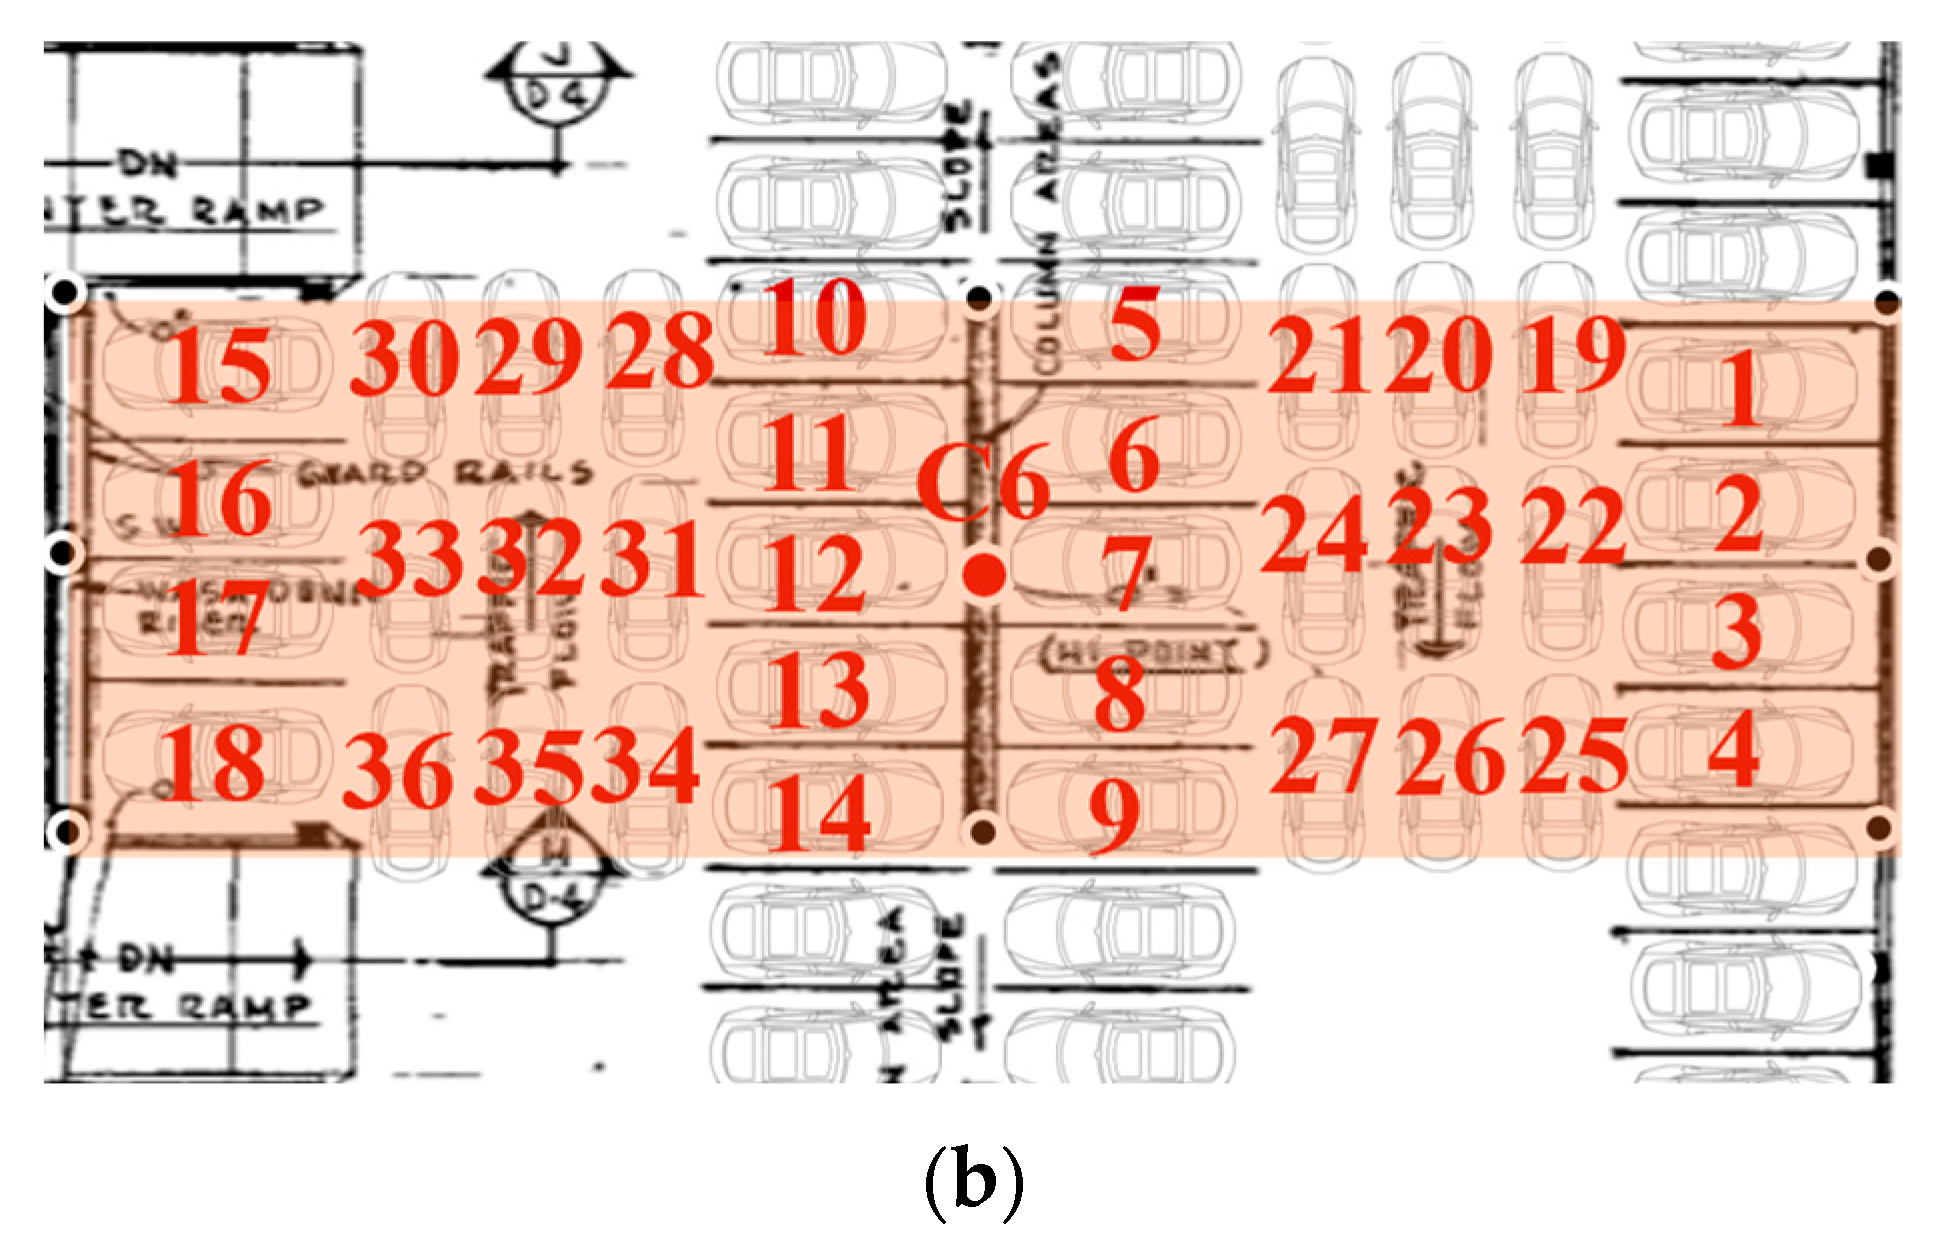
Column C6 was selected because it had the maximum reaction response in the CSiBridge (2022) software model. Following the ASCE 7-22 standard for determining the tributary area’s width and length, the length is 19.05/2 + 19.51/2 = 19.28 m (63.25 ft) and the width is 6.10/2 + 6.10/2 = 6.10 m (20 ft), as shown in Figure 7. The influence area of column C6 can be represented in 3D using the CSiBridge (2022) software, as shown in Figure 8.
Figure 7.
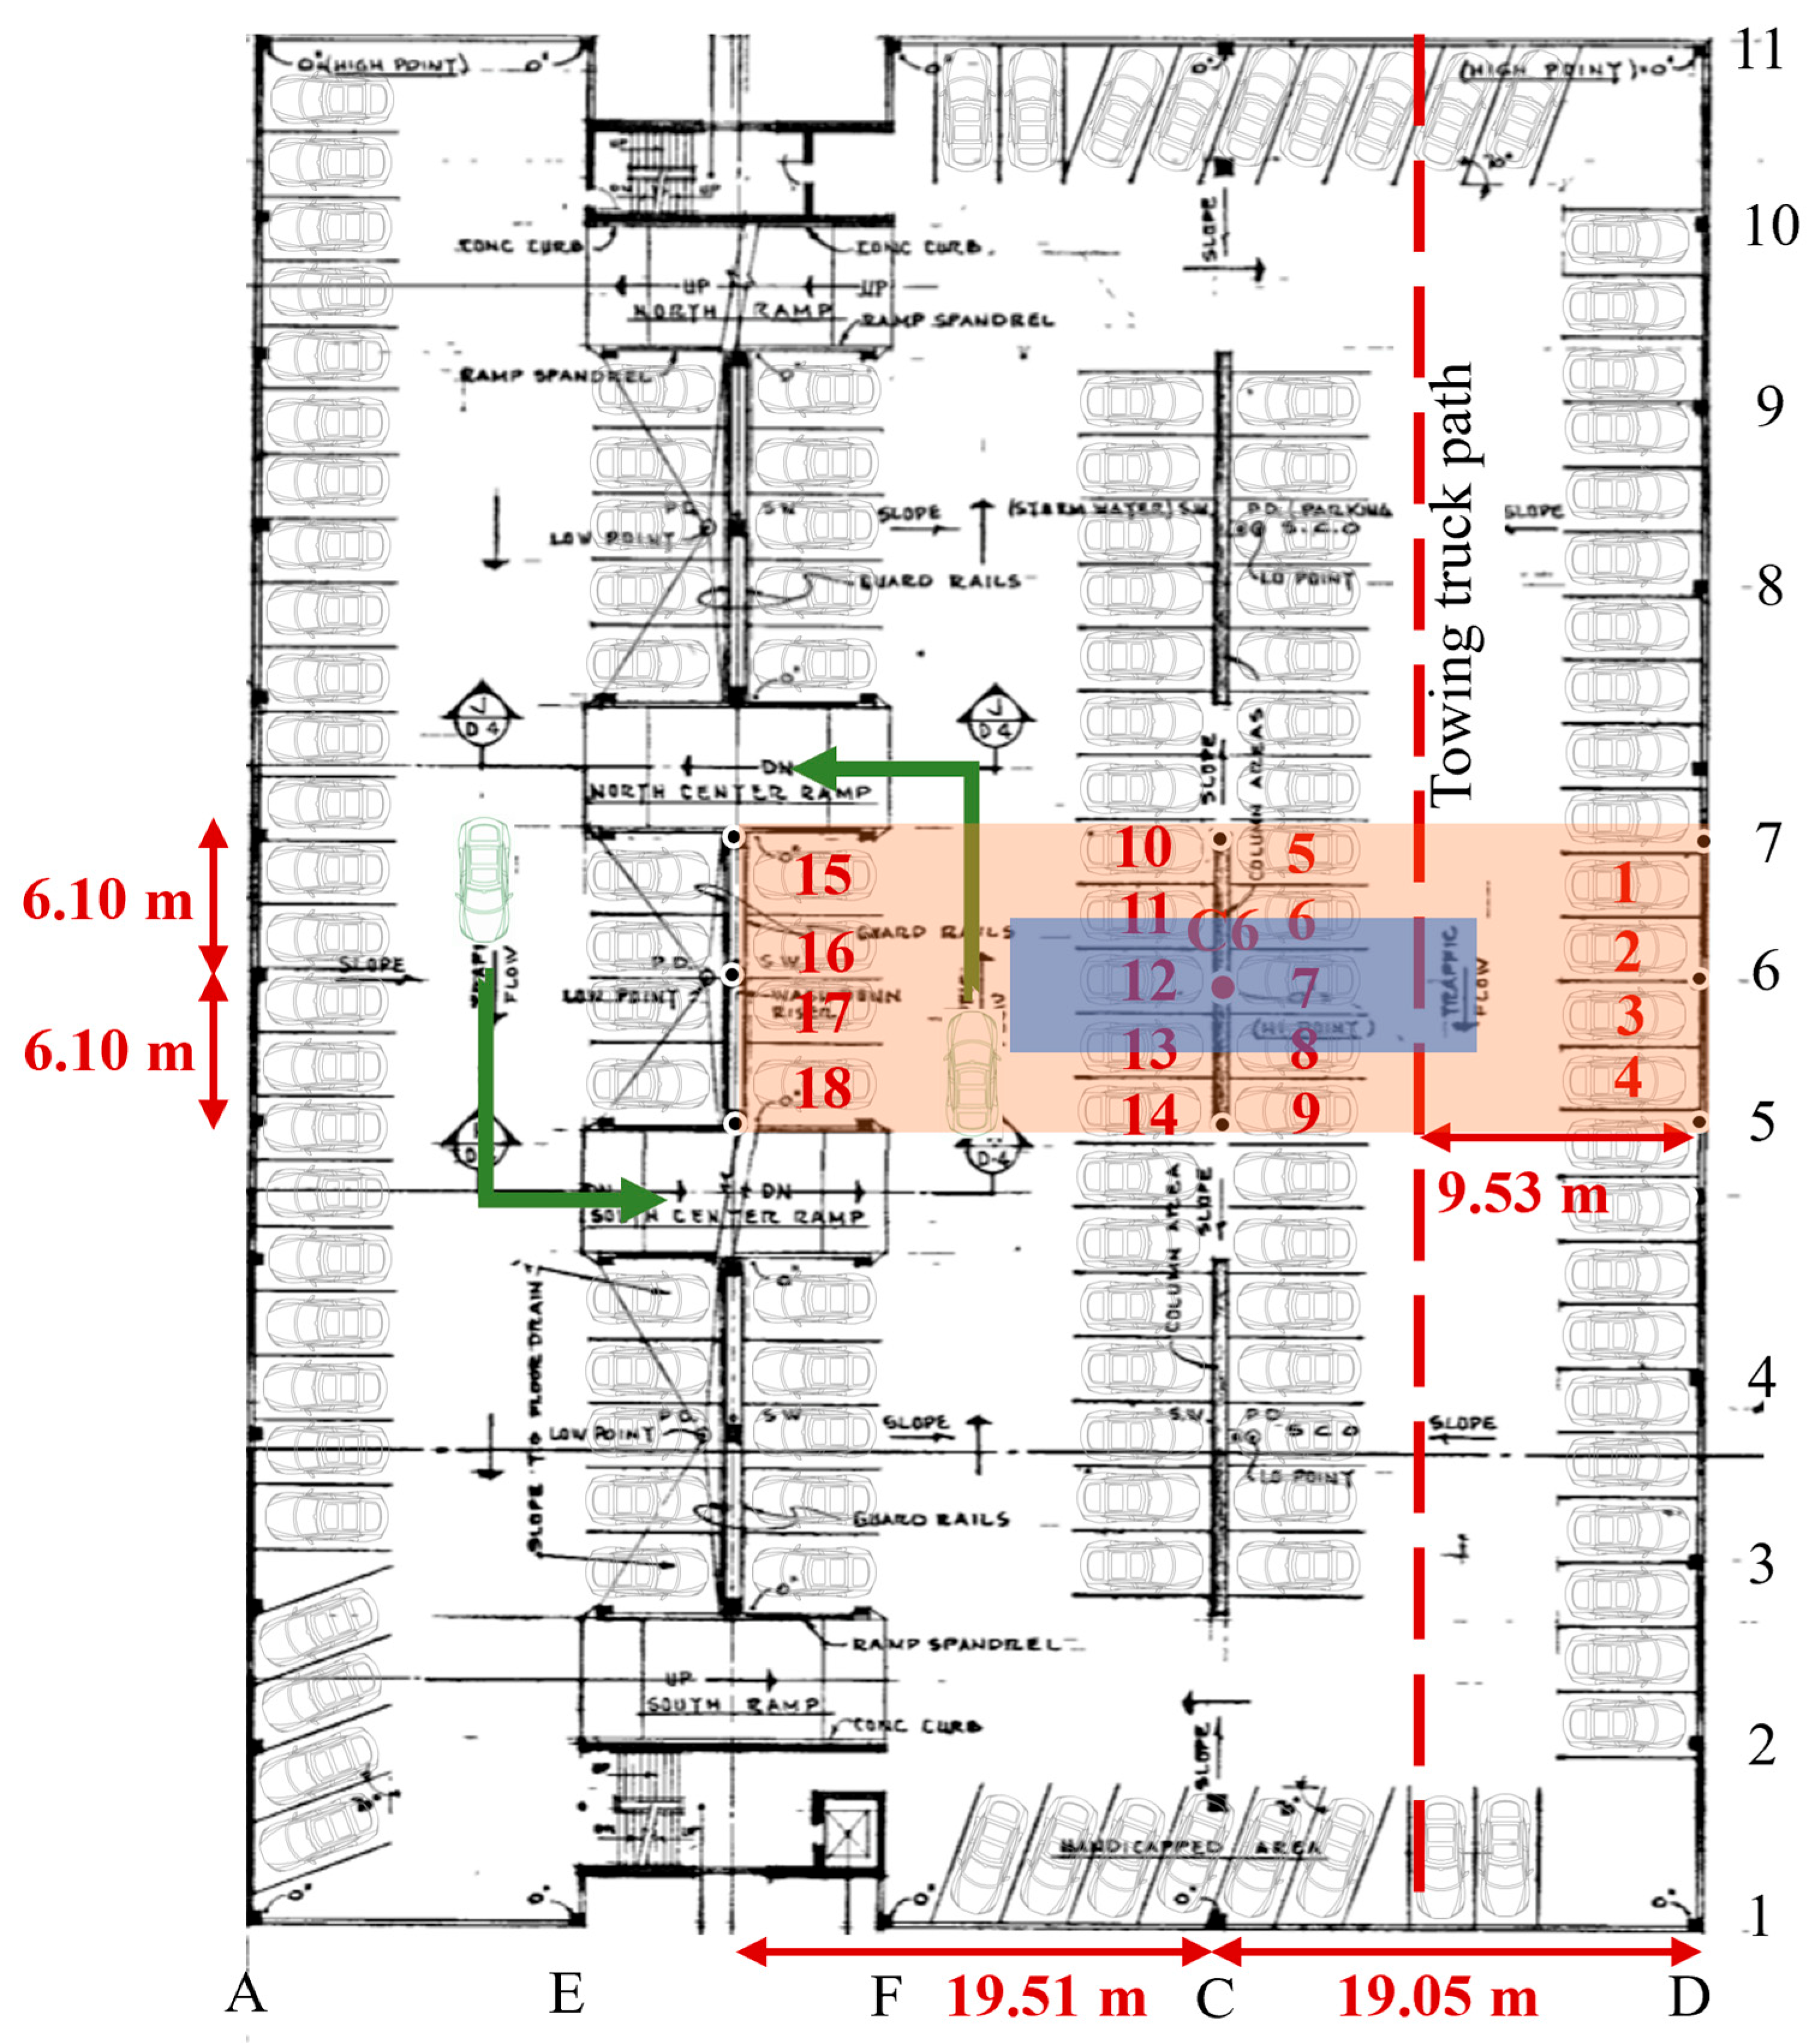
Standard car arrangements used to examine the axial load on column C6 of scenario 1 with its corresponding tributary area (highlighted blue) and with its corresponding influence area (highlighted red).
Figure 8.
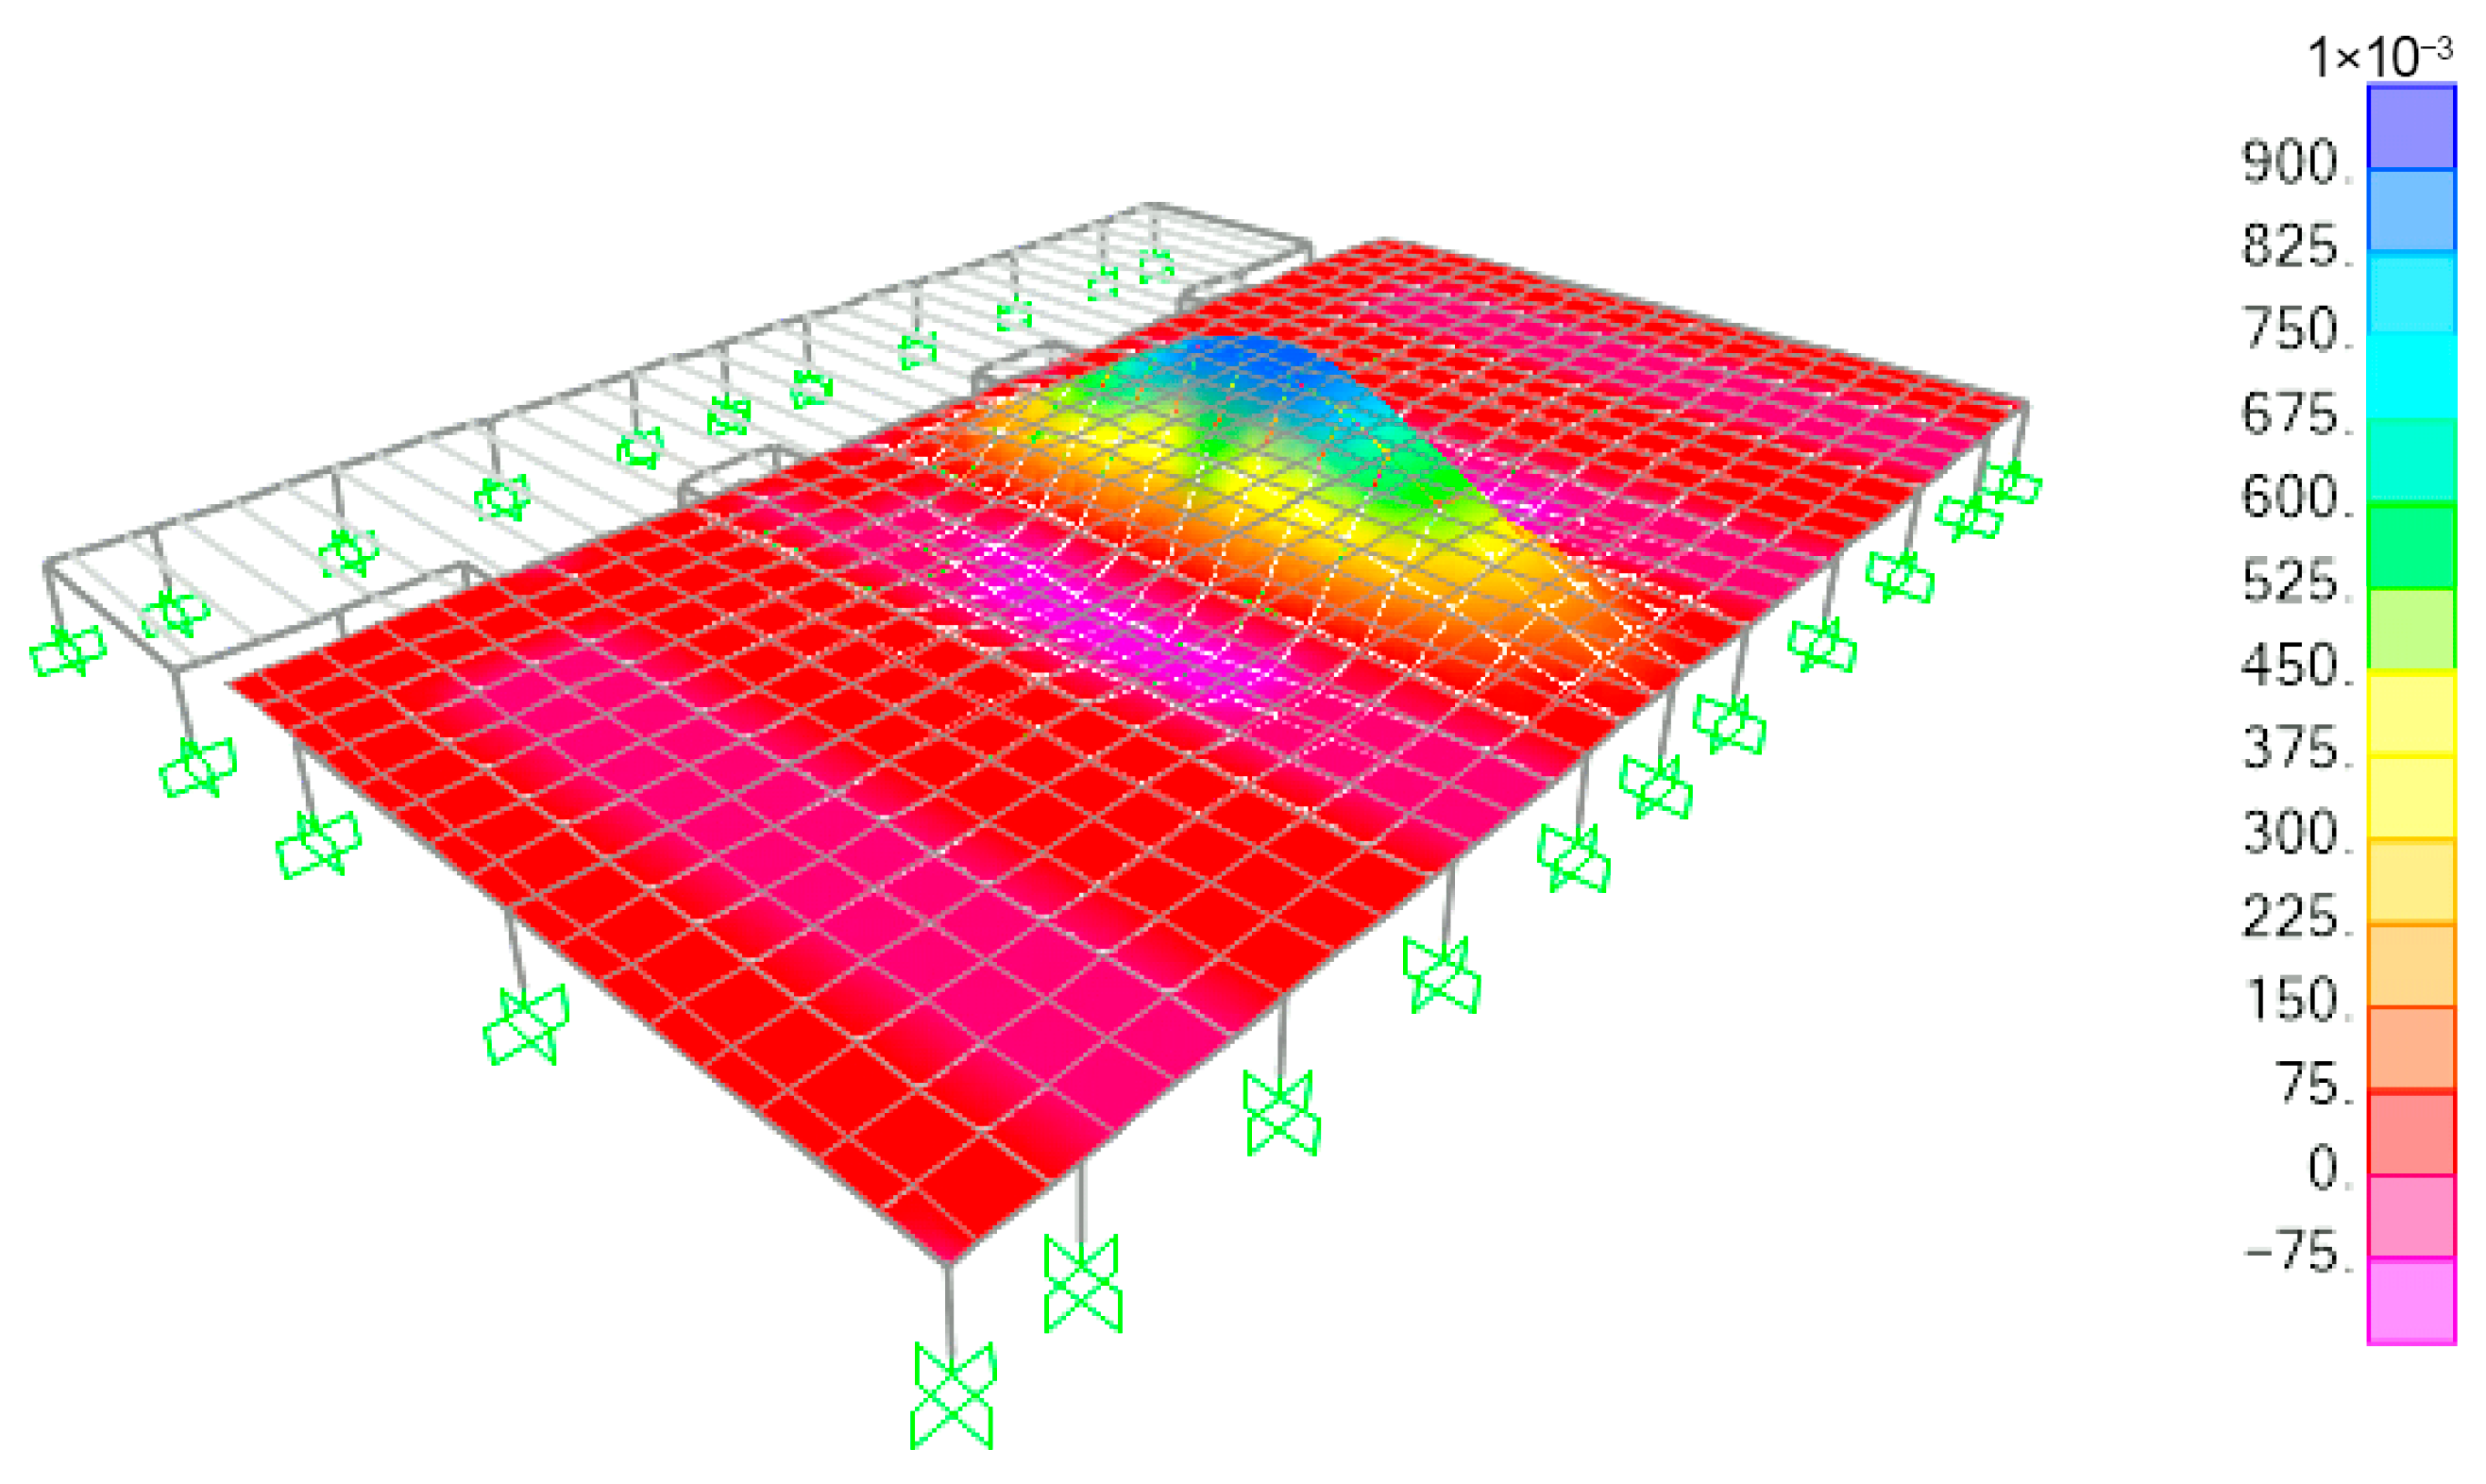
3D influence surface for axial load in column C6 in the NW parking garage.
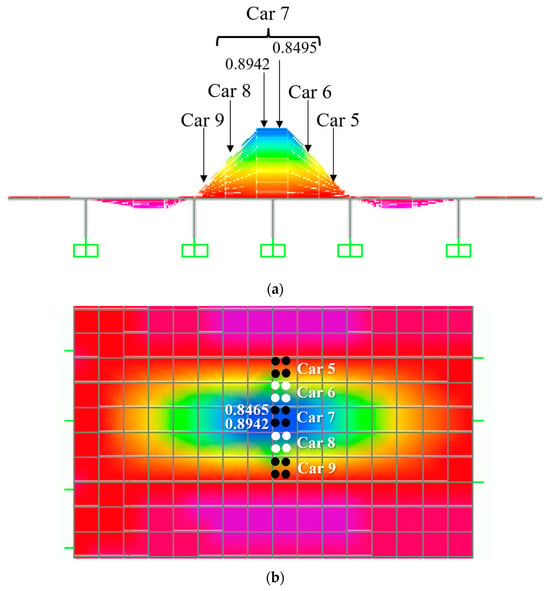
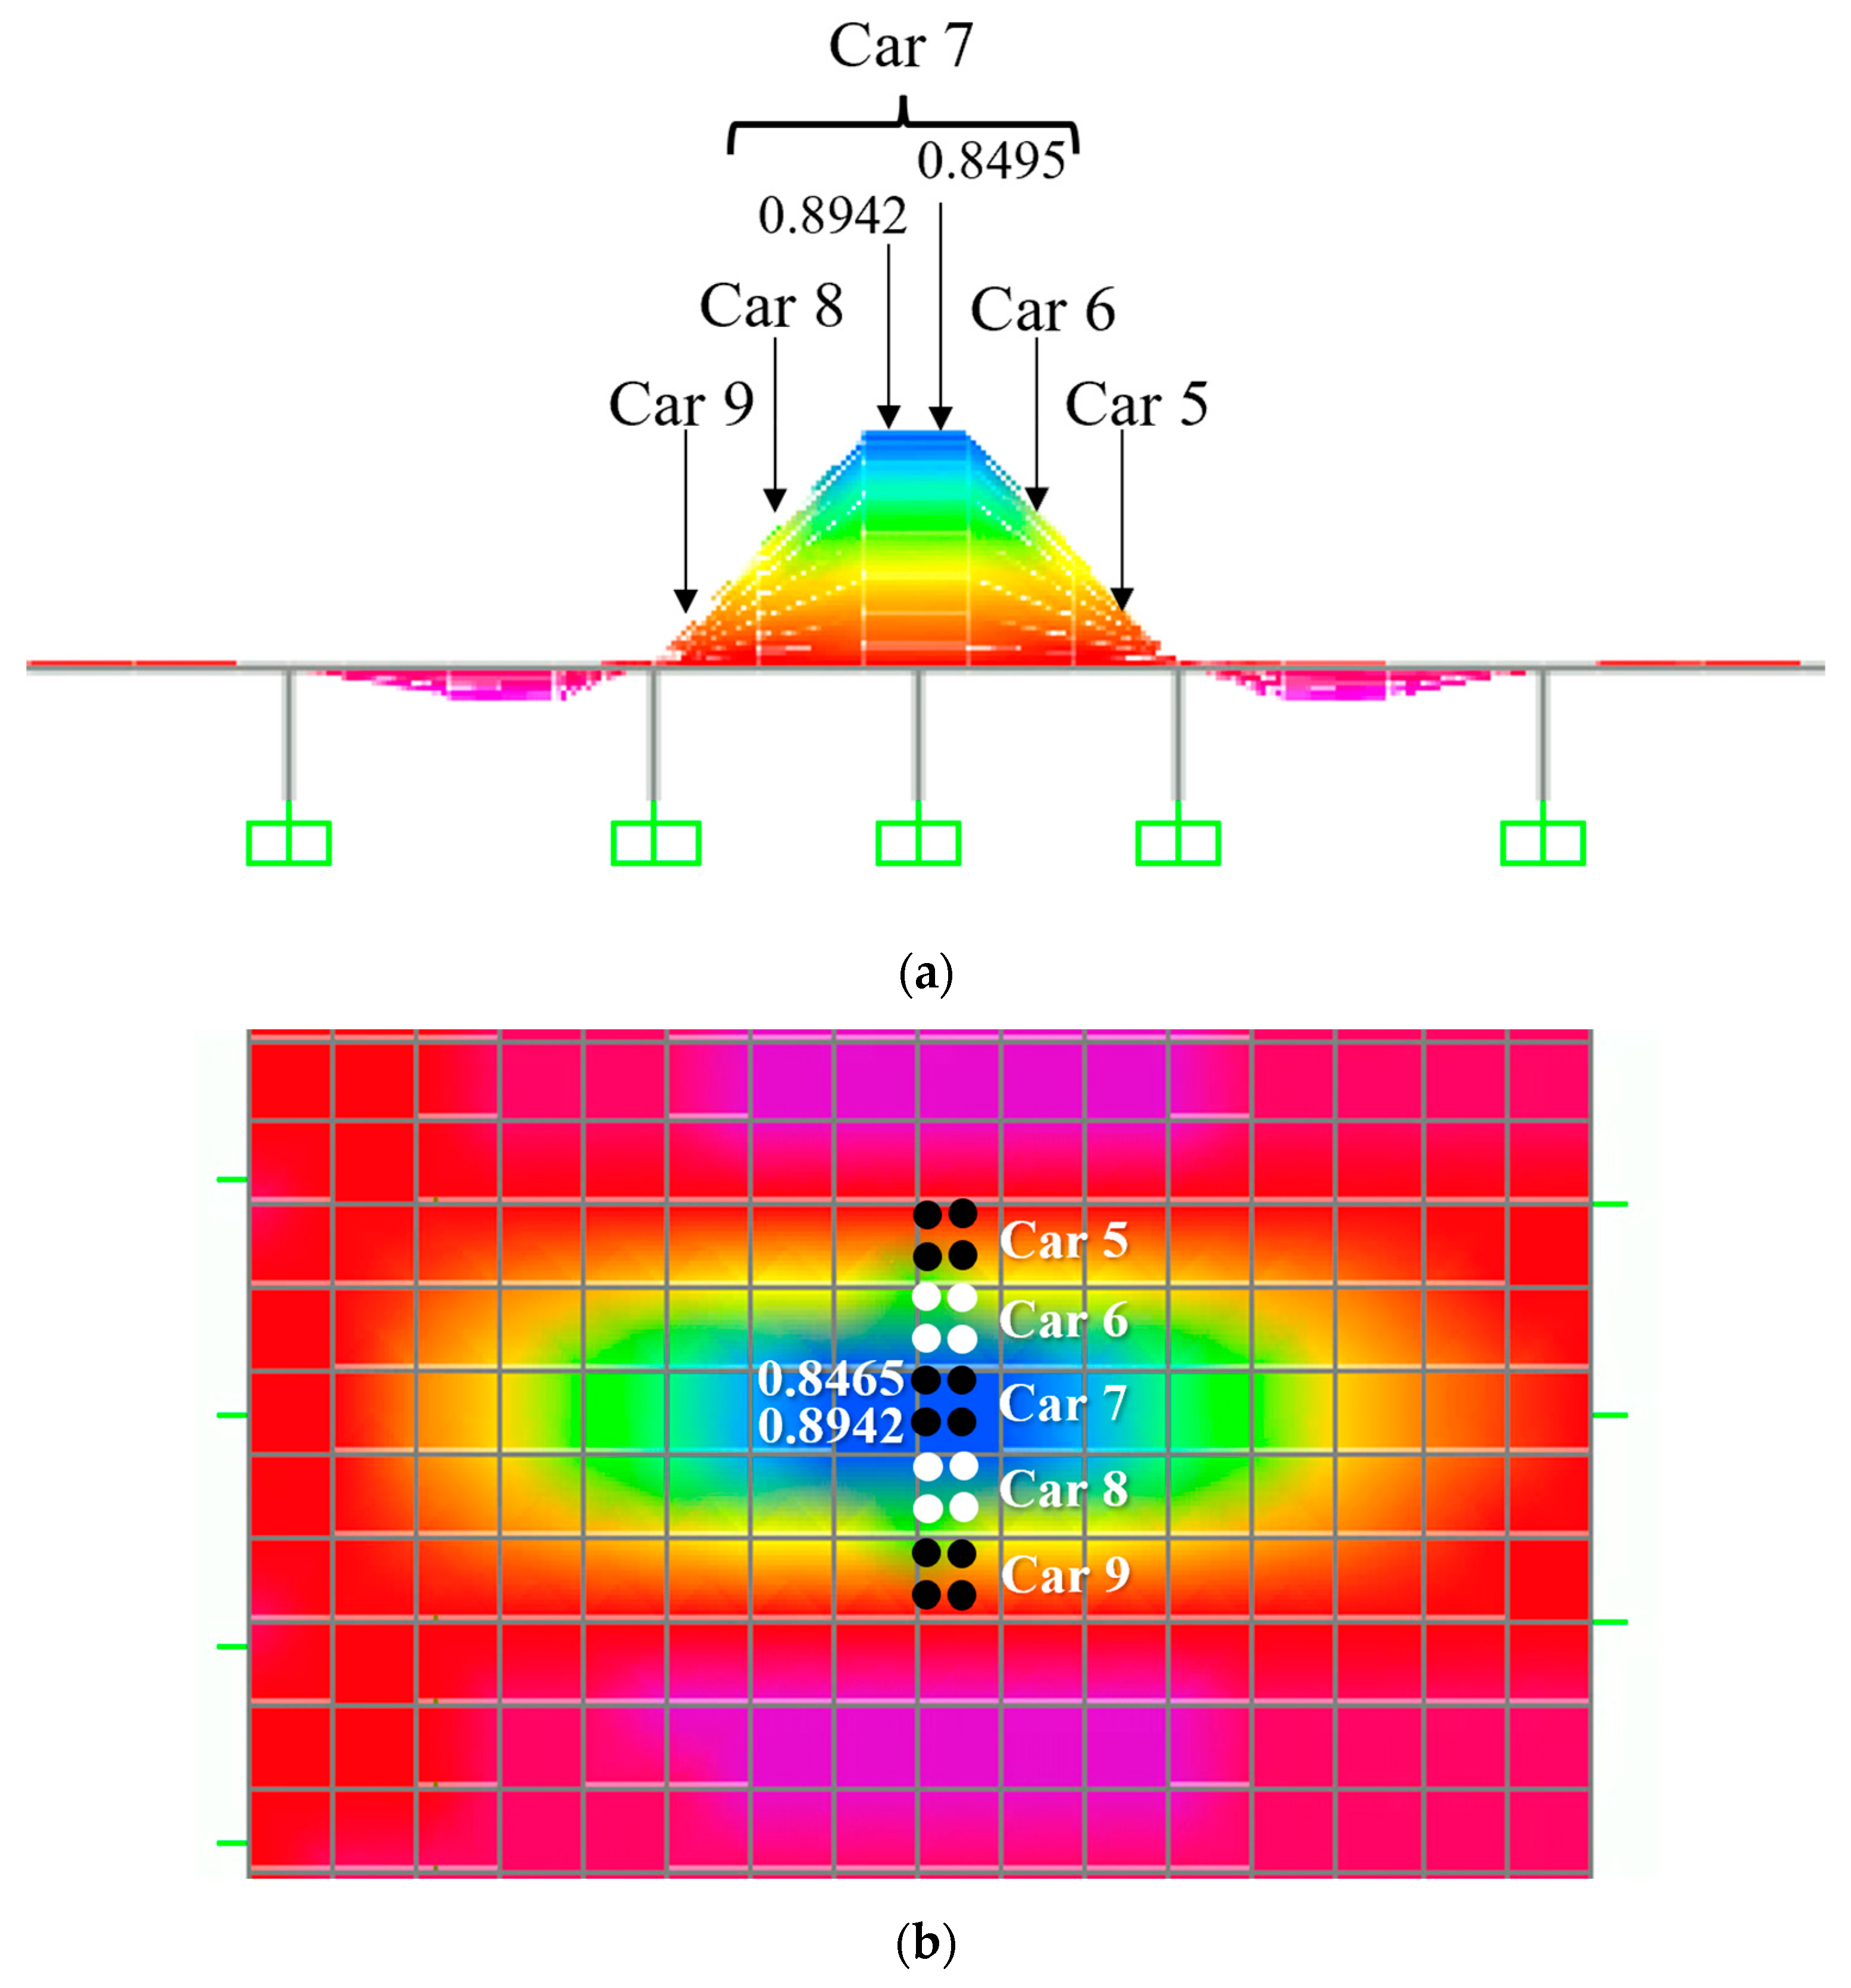
A similar approach was used in the NW parking garage. The authors began with assuming every stall has a single car parked in it. The influence surface coordinates can be obtained using the vertical coordinates on the influence surface when a towing truck presented in [11] is placed at the middle of the 19.05 m span (i.e., 9.53 m or 31.25 ft from the right side of the parking plan shown in Figure 7) and at the middle of the 19.51 m span (i.e., 28.80 m from the right side of the parking plan shown in Figure 7). They were calculated using CSiBridge (2022) software as presented in Figure 9.
Figure 9.
Coordinates of 3D influence surface for axial load in column C6 under car number 7, (a) rear wheels and (b) front wheels.
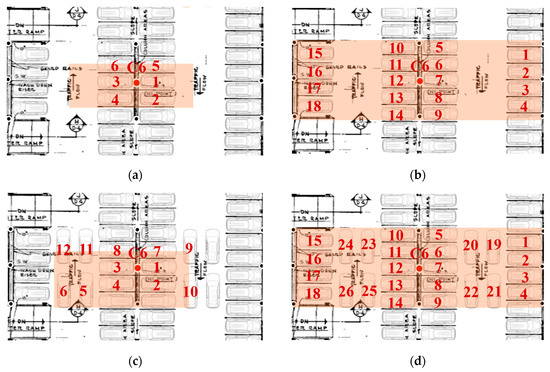
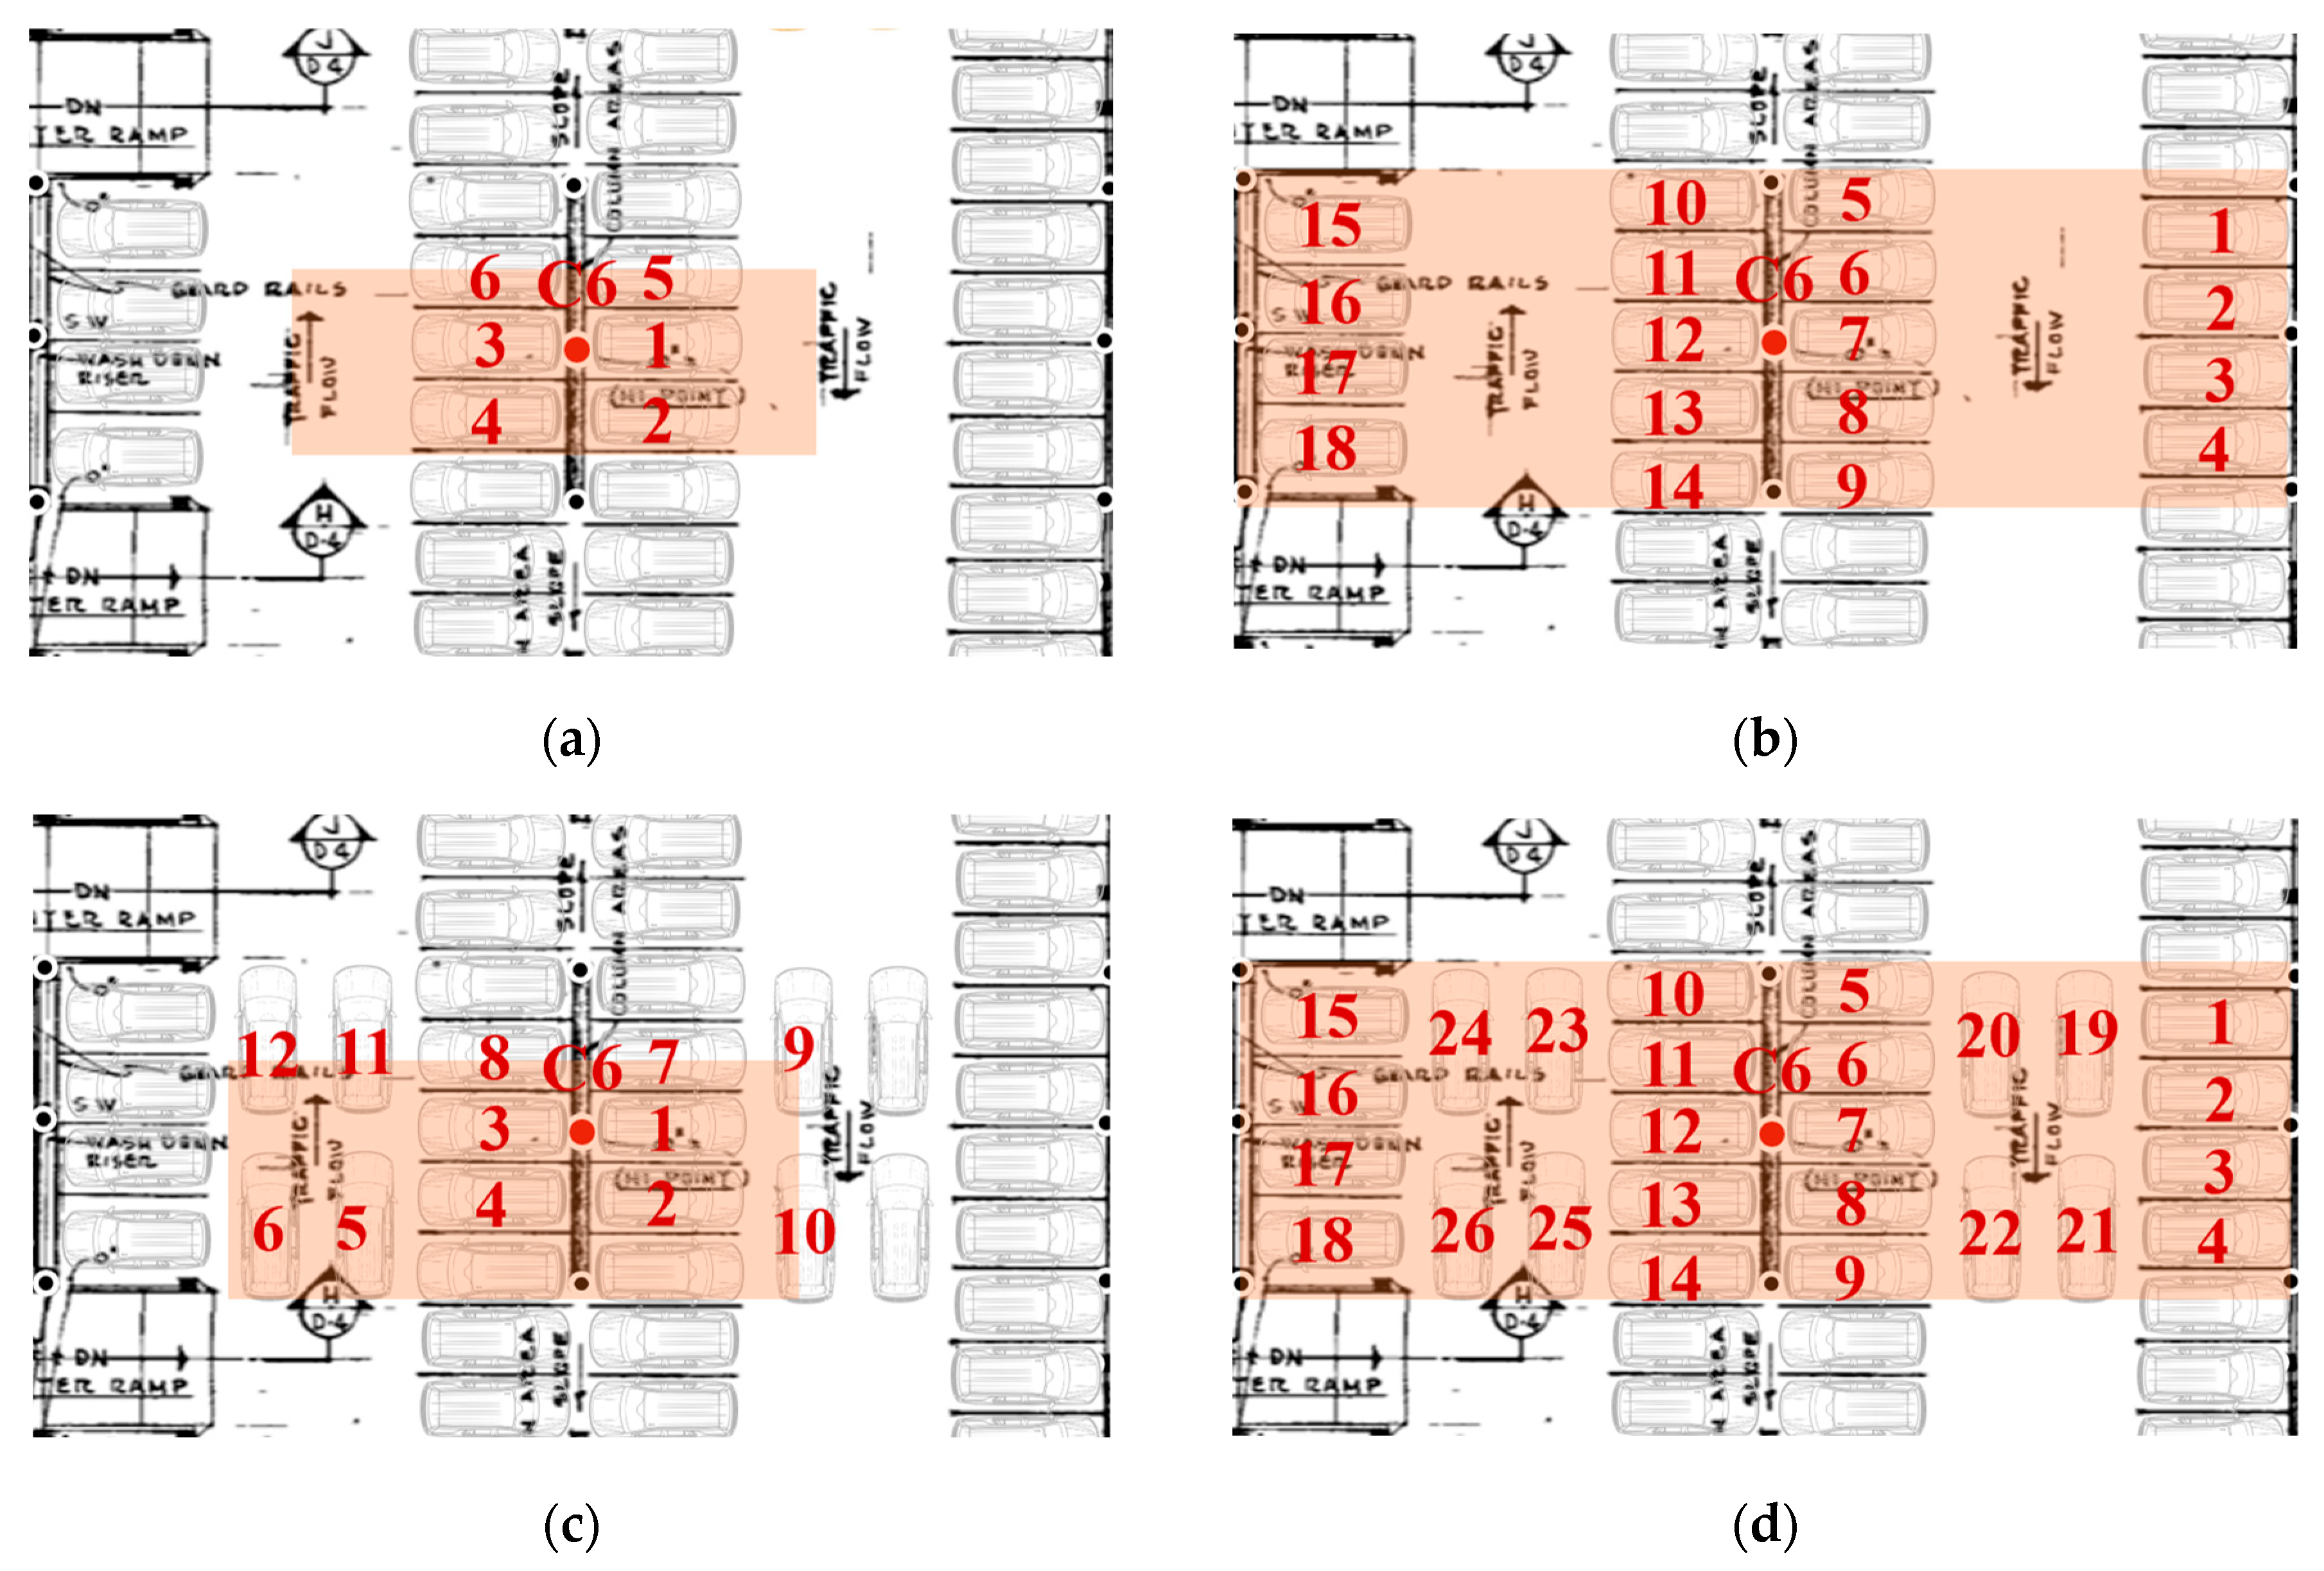
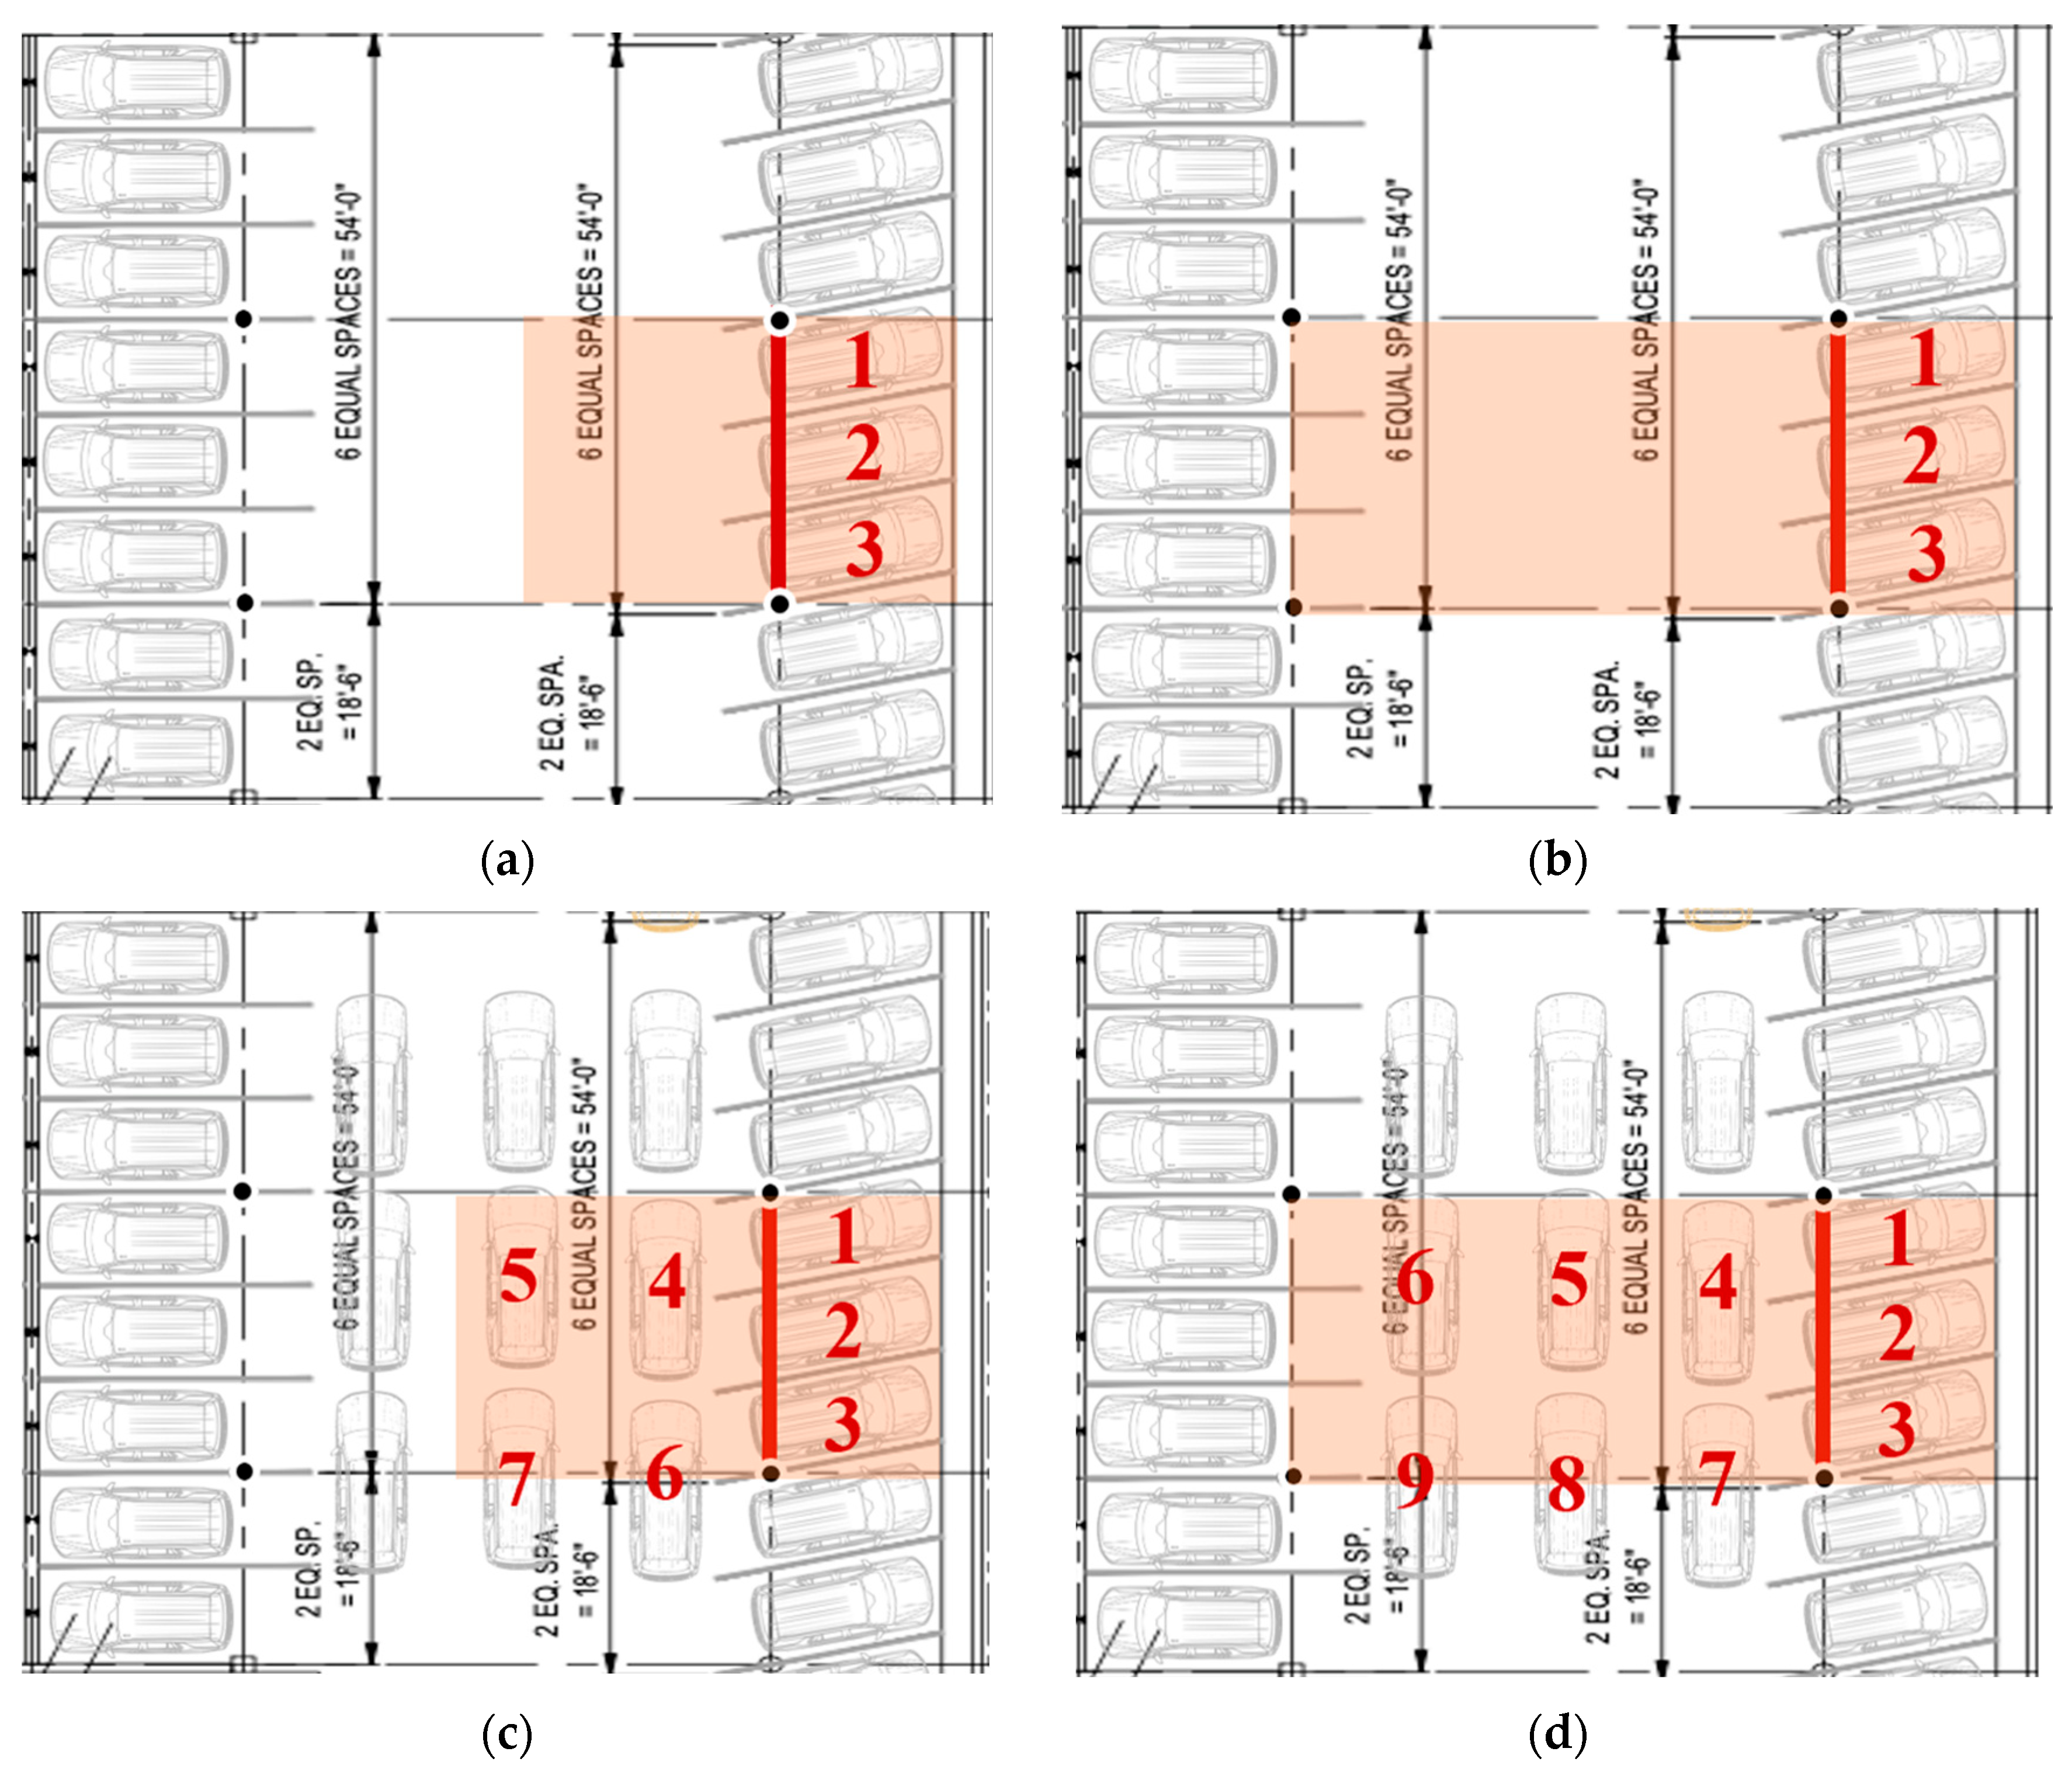
Now, considering other scenarios of the standard cars and SUVs on column C6 axial loading in the NW parking garage detailed in Figure 10 and Figure 11, the EUDL was calculated using the same procedure as for the SC garage. Table 8 summarizes the calculated EUDL for column C6 axial loading for standard and SUV cars in the NW parking garage. From Table 8, it is clear that the design live load for column C6 axial loading (scenario 2 of SUVs cars) in the NW parking garage exceeds the ASCE 7-22 (1.92 kN/m2) requirement, and the specified (original) design live load (2.39 kN/m2).
Figure 10.
Scenario 2 of standard car arrangement to examine column C6 and its corresponding (a) tributary area and (b) influence area.
Figure 11.
SUV arrangements used to examine the axial load on column C6: (a) scenario 1 with its corresponding tributary area, (b) scenario 1 with its corresponding influence area, (c) scenario 2 with its corresponding tributary area, and (d) scenario 2 with its corresponding influence area.
Table 8.
Summary of the live loads for column C6 axial loading (standard and SUVs cars) in the NW parking garage.
4.3. Beam Midspan Moment Calculations Using 3D Influence Surfaces
The impact area on the beam induced by the midspan moment is twice as large as the average tributary area considered in the design as presented in Table 9. For the beam D4–E4 midspan moment for the parking layout shown in Figure 12, the 3D influence surface of the load is shown in Figure 13. Note that the influence area for the midspan moment on a beam is twice the conventional tributary area used in design analysis [5,6].
Table 9.
Influence surface coordinates calculated for beams D4–E4 within the tributary and influence areas shown in Figure 12.
Figure 12.
Standard car arrangements used to examine the moment on the beam D4−E4 midspan of scenario 1 with its corresponding tributary area (highlighted blue) and with its corresponding influence area (highlighted red).
Figure 13.
3D influence surface of beams D4–E4 midspan moment in the SC parking garage.
Analysis of a Beam in SC Garage Structure
In the first scenario, one car is parked in each stall. The influence surface coordinates obtained by moving a tow truck exactly at the middle of the plan (i.e., 9.60 m or 31.5 ft from the left side of the parking plan, as shown in Figure 12) were calculated using CSiBridge (2022) software. The influence surface coordinates of parking stall coordinates calculated using CSiBridge software within the tributary and influence areas for the three cars of beams D4–E4 are presented in Table 9 and Figure 14.
Figure 14.
Coordinates of 3D influence surface of beams D4–E4 midspan moment under car number 2, (a) front wheels and (b) rear wheels.
It is assumed that each parking stall has a car weight of 16,089 N [9]. Hence, each tire acts as a single load of 4022 N. To calculate the maximum moment on the beam D4–E4 midspan, it was assumed that the beam has fixed supports at both ends with a concentrated load at the beam’s center. Therefore, the beam’s midspan moment was calculated and defined in Equation (2).
Mmax is the maximum moment at the midspan of the beam, P is the concentrated load (i.e., the tire load × the influence surface coordinates calculated from CSiBridge (2022) software), and l is the beam length.
Because the weights of the four tires are the same (4022 N each), it is easier to sum all the influence surface coordinates together and multiply by a single tire load. Therefore, the summation for all coordinates represented in Table 9 (as calculated in CSiBridge (2022) software) is 2.609. The midspan moment within the tributary area using Equation (2) is (P = 1.92 kN/m2 × 9.60 m × 8.23 m) × (l = 8.23 m)/8 = 156 kN-m. The total midspan moment on beams D4–E4 is 4022 N × 2.609 × 8.23 m/8 = 11 kN-m. Therefore, the design live load for scenario 1 for beam D4–E4 within the tributary area from Equation (2) is P/AT = 4022 N × 2.609/9.60 m × 8.23 m = 0.13 kN/m2. It can be concluded that the design live load for a parking garage in the ASCE 7-22 (1.92 kN/m2) is about 14 times larger than the calculated EUDL (0.13 kN/m2) for the standard cars (scenario 1) for beams D4–E4 within the tributary area. In this scenario, although the influence area covered more area than the tributary area, no cars were added to the influence area. Therefore, the summation for all the influence surface coordinates of parking stall coordinates within the influence area of beams D4–E4 is the same as the tributary summation, which is 2.609. The midspan moment within the influence area considering that the beam is 1/2 of the influence surface using Equation (2) is (P = 1.92 kN/m2 × 14.94 m × 8.23 m) × (l = 8.23 m)/(8 × 2) = 121 kN-m. Therefore, the design live load for scenario 1 for beam D4–E4 within the influence area (Figure 12) is P/AI = (2 × 2.609 × 4022 N)/(14.94 m × 8.23 m) = 0.17 kN/m2. It can be concluded that the midspan moment (1.92 kN/m2 × 9.60 m × 8.23 m × 8.23 m/8 = 156 kN-m) on beams D4–E4 due to the ASCE 7-22 (1.92 kN/m2) is about 11 times larger than the value of the calculated maximum midspan moment (11 kN-m) that beams D4–E4 experienced due to the calculated EUDL (0.17 kN/m2) for the standard cars (scenario 1) within the influence surface (Figure 12). Therefore, the design live load according to the ASCE 7-22 standard is considered to be conservative in this scenario.
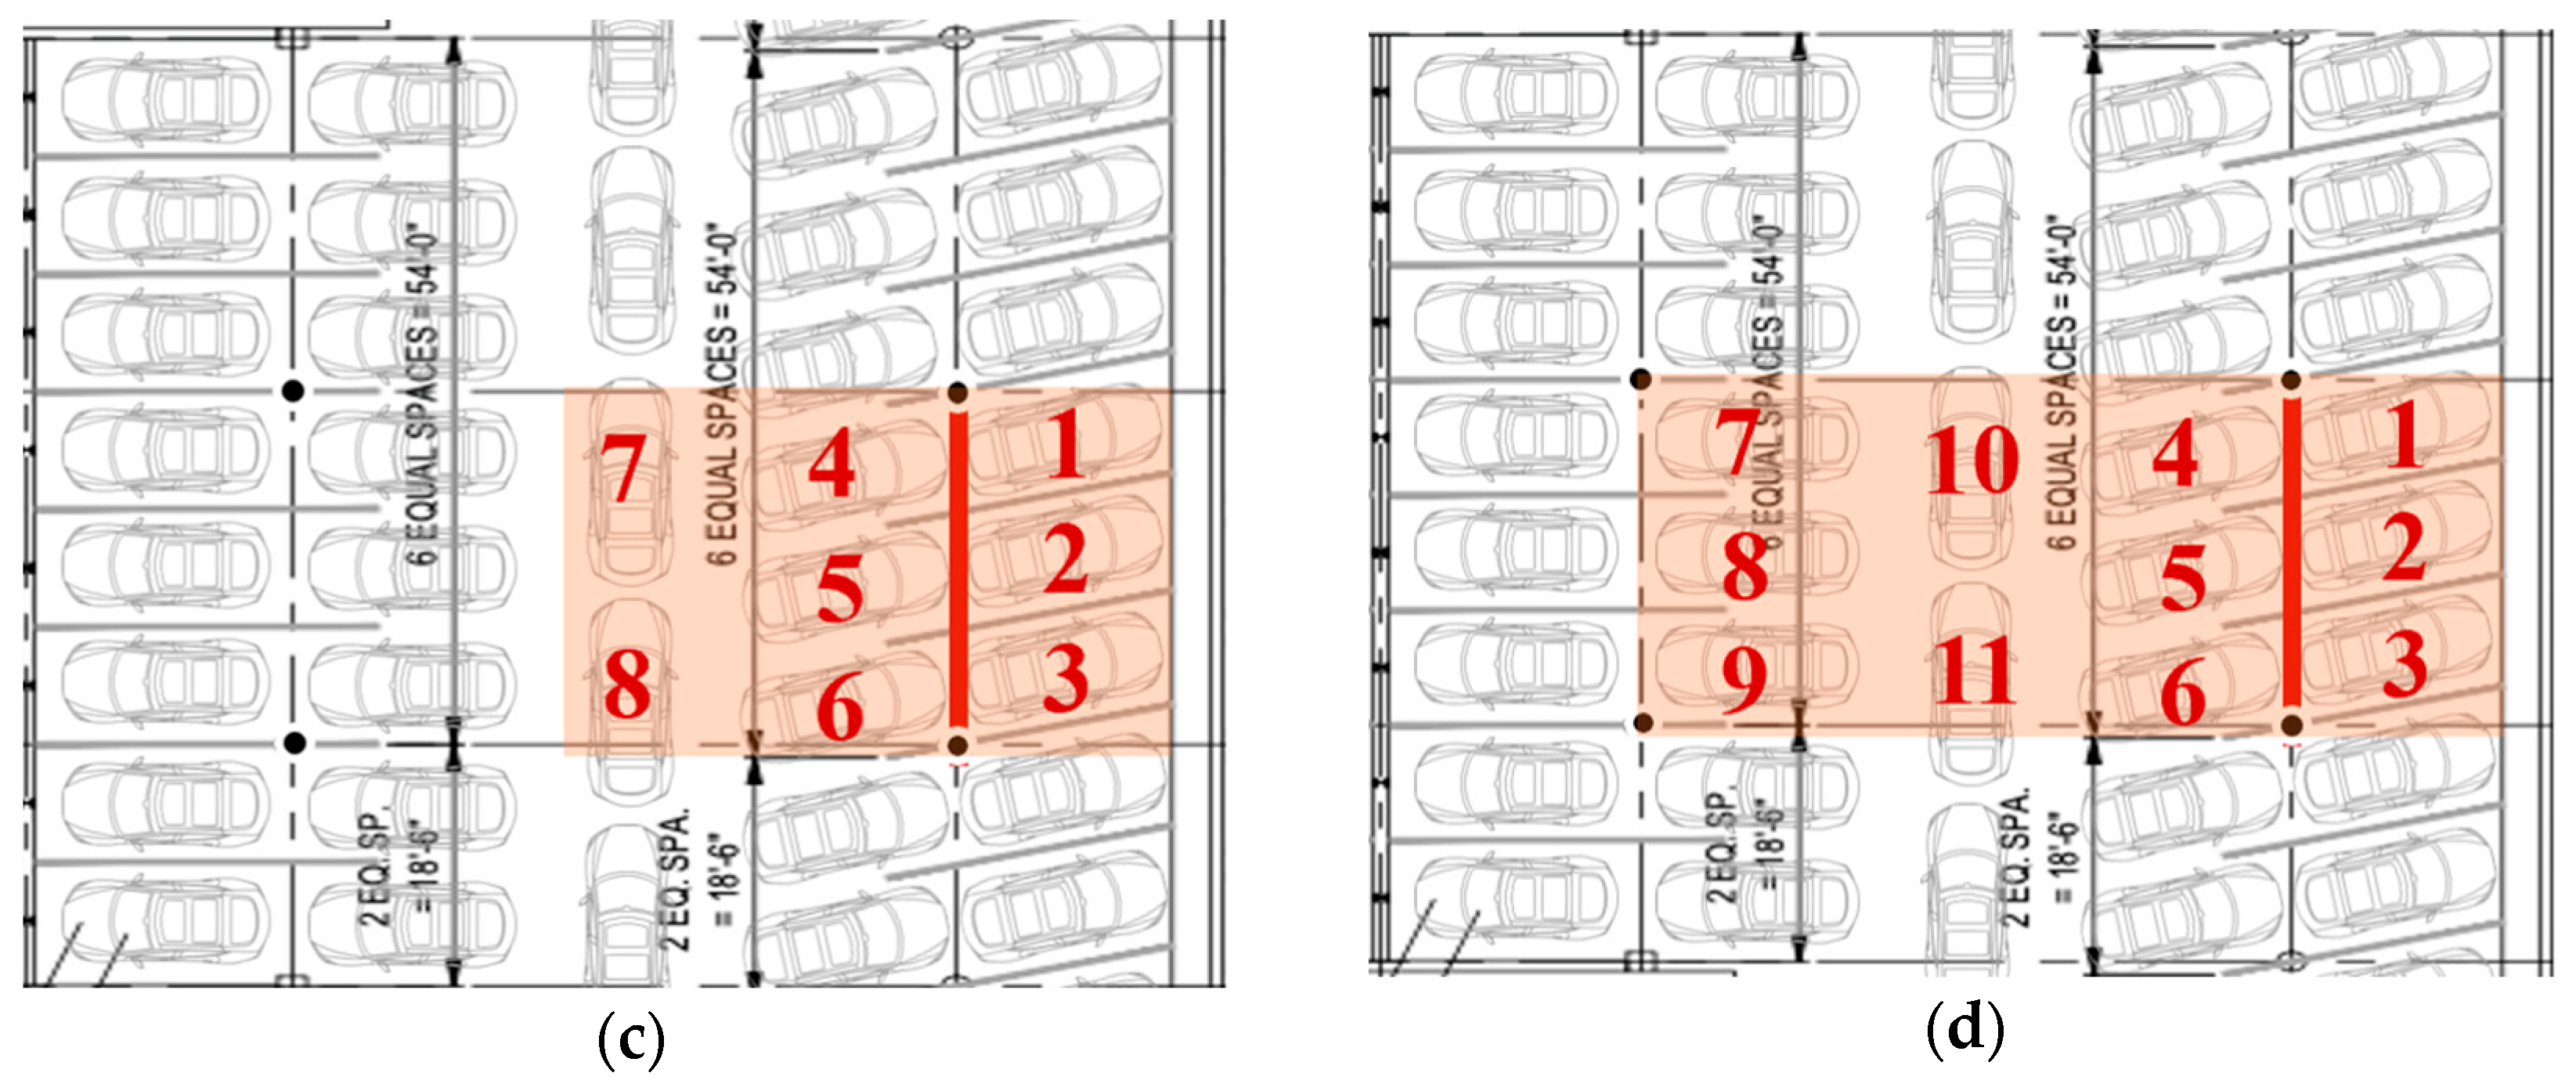
Figure 15 and Figure 16 present other scenarios of the standard cars and SUVs on beams D4–E4, respectively. Table 10 summarizes the calculated EUDL due to the midspan moment on beams D4–E4 of standard and SUV cars scenarios, the design live load requirements from the ASCE 7-22 standard for parking garages, and the specified (original) design live load for the SC parking garage. From Table 10, it can be concluded that all live load scenarios (standard and SUV cars) for beam D4–E4 midspan moment in the SC parking garage are conservative and less than the ASCE 7-22 requirement (1.92 kN/m2) and specified (original) design live load (2.39 kN/m2).
Figure 15.
Standard car arrangements used to examine moment on the beam D4−E4 midspan: (a) scenario 2 with its corresponding tributary area, (b) scenario 2 with its corresponding influence area, (c) scenario 3 with its corresponding tributary area, and (d) scenario 3 with its corresponding influence area.
Figure 16.
SUV arrangements used to examine moment on the beam D4−E4 midspan: (a) scenario 1 with its corresponding tributary area, (b) scenario 1 with its corresponding influence area, (c) scenario 2 with its corresponding tributary area, and (d) scenario 2 with its corresponding influence area.
Table 10.
Summary of the live loads for beam D4–E4 midspan moments (standard and SUVs cars) in the SC parking garage.
5. Discussion
This study compares only the live load component. In design, the factored load combination (e.g., 1.2D + 1.6L) governs, and the structure’s capacity includes overstrength factors. The comparison of live load alone does not directly determine structural adequacy or imply failure. The intent of comparing the live load effect in this study is not to assess ultimate capacity or code compliance, but rather to highlight the relative amplification and redistribution of live loads under non-uniform loading scenarios. The presented values (e.g., 2.30 kN/m2 versus 1.92 kN/m2) are used to demonstrate how certain loading arrangements can exceed nominal design live load levels locally, thereby potentially influencing serviceability performance and demand distribution within the structure. A comprehensive assessment of structural safety would require consideration of full-factored load combinations, material resistance, and system overstrength.
The exceedances of reported scenarios over building code or the specified (original) design live load for certain configurations are obtained under highly organized and intentionally unfavorable parking arrangements. The purpose of including these scenarios is to establish upper-bound demand conditions and to evaluate the sensitivity of structural response to concentrated and aligned vehicle loading. In real-world operation, typical parking patterns are often random and less dense; however, there are situations where more systematic and compact arrangements may occur, such as during peak demand periods or under valet parking operations, where vehicles are intentionally positioned to maximize space efficiency. In such cases, vehicles may be parked in more organized patterns, which can increase the likelihood of localized load concentration similar to the scenarios investigated in this study.
When compared to other types of buildings and structures, parking garages are subjected to unique loading conditions due to the mobility and variability of vehicular loads. However, similar loading characteristics can be observed in structures subjected to moving or concentrated loads, such as bridge decks, industrial floors, warehouses, and logistics facilities. In bridge engineering, for instance, influence surfaces are routinely used to determine critical load positions for vehicular loading, and the concept of load equivalency is well established. The present study extends this concept to building-type structures, where such advanced analytical approaches are less commonly applied.
6. Conclusions
This paper presents an innovative general methodology to investigate the performance of parking structures when additional new live loads are applied. The new live loads may come from many driverless cars or other types of live loads that the original structure may not be designed for. As a case study, this research uses two existing cast-in-place and precast concrete parking structures to investigate the effects of 28 different loading scenarios. Results are presented in Table 11.
Table 11.
Summary of live loads for all scenarios in the 3D influence surface analysis.
Tributary areas and 3D influence surfaces were calculated to examine the corresponding EUDL column axial loads and the expected beam midspan moments during service life. For demonstration purposes, two car types (standard cars and SUVs) were considered in these case studies. The conclusions of the 3D live load analysis for the SC and NW parking garage structure scenarios can be summarized as follows:
- The axial load considered in the design of column K4 in the SC garage is lower than the maximum axial load that column K4 experienced in the third scenario (2.07 kN/m2) with standard cars.
- Furthermore, the axial load from the second extreme loading scenario of 4.74 kN/m2 with SUVs is about twice the specified (original) design live load of 2.39 kN/m2 in the SC parking garage structure.
- The axial load used in the design of column C6 in the NW garage is lower than the maximum axial load that column C6 experienced in the second extreme loading scenario of 2.45 kN/m2 with SUVs.
In conclusion, a new novel procedure is proposed and implemented in this paper to apply and demonstrate the effects of different extreme loading scenarios. As shown in Table 11, in some of the extreme loading cases, which push the limits, the calculated demands can exceed the original design loads for the two older existing parking structures selected in this study. Although the maximum live load for the midspan moment is conservative (Table 11), the maximum axial column loading in some of the extreme scenarios considered in this paper can be twice larger than the specified (original) design limits for the SC and NW parking garages. The proposed innovative methodology can be used to determine and evaluate the demands on a given parking structure for any potentially heavier and more densely parked vehicles.
Author Contributions
Conceptualization, A.A.I. and H.S.; methodology, A.A.I. and H.S.; software, A.A.I.; validation, H.S.; formal analysis, A.A.I. and H.S.; investigation, A.A.I.; resources, H.S.; data curation, A.A.I. and H.S.; writing—original draft preparation, A.A.I.; writing—review and editing, H.S.; visualization, A.A.I. and H.S.; supervision, H.S.; project administration, H.S. All authors have read and agreed to the published version of the manuscript.
Funding
This research received no external funding.
Data Availability Statement
The data presented in this study are available on request from the corresponding author.
Acknowledgments
The partial support provided by the Precast/Prestressed Concrete Institute (PCI) Jenny Fellowship, CampusParc, the Department of Transportation and Traffic Management Office at The Ohio State University, and the Sponsorship of the Saudi Arabian Cultural Mission is gratefully acknowledged.
Conflicts of Interest
The authors declare no conflicts of interest.
References
- McGuire, R.K.; Cornell, C.A. Live Load Effects in Office Buildings. J. Struct. Div. 1974, 100, 1351–1366. [Google Scholar] [CrossRef] [Scilit]
- Ellingwood, B.; Culver, C. Analysis of Live Loads in Office Buildings. J. Struct. Div. 1977, 103, 1551–1559. [Google Scholar] [CrossRef] [Scilit]
- Kemper, F.H.; Funke, A.; Feldmann, M. Revaluation of Live Load Models for Parking Garages Based on Measurements, Simulations, and Extreme Value Determination. Struct. Saf. 2022, 96, 102177. [Google Scholar] [CrossRef] [Scilit]
- CSiBridge. Bridge Analysis, Design, and Rating Software, version 22.20; Computers and Structures, Inc.: Walnut Creek, CA, USA, 2022; Available online: https://www.csiamerica.com/products/csibridge (accessed on 15 February 2026).
- American Society of Civil Engineers (ASCE). Minimum Design Loads and Associated Criteria for Buildings and Other Structures; American Society of Civil Engineers: Reston, VA, USA, 2022. [Google Scholar]
- International Code Council (ICC). International Building Code; International Code Council: Falls Church, VA, USA, 2021. [Google Scholar]
- Wen, Y.K.; Yeo, G.L. Design Live Loads for Passenger Cars Parking Garages. J. Struct. Eng. 2001, 127, 280–289. [Google Scholar] [CrossRef] [Scilit]
- U.S. Environmental Protection Agency (US EPA). The 2021 EPA Automotive Trends Report: Greenhouse Gas Emissions, Fuel Economy, and Technology Since 1975. 2021. Available online: https://nepis.epa.gov/Exe/ZyPDF.cgi?Dockey=P1013L5Z.pdf (accessed on 15 February 2026).
- Naito, C.; Hendricks, R.; Osborn, A. Flange-to-Flange Double-Tee Connections Subjected to Vehicular Loading, Part 2: Fatigue Life Assessment. PCI J. 2019, 64, 23–38. [Google Scholar] [CrossRef] [Scilit]
- Chevrolet. Chevrolet Pressroom. 2021. Available online: https://chevrolet.com/ (accessed on 15 February 2026).
- Al Ismaeel, A. Life Cycle Assessment of Concrete Parking Structures to Enhance Durability and Structural Performance. Ph.D. Thesis, The Ohio State University, Columbus, OH, USA, 2023. Available online: http://rave.ohiolink.edu/etdc/view?acc_num=osu1681952801259889 (accessed on 15 February 2026).

Disclaimer/Publisher’s Note: The statements, opinions and data contained in all publications are solely those of the individual author(s) and contributor(s) and not of MDPI and/or the editor(s). MDPI and/or the editor(s) disclaim responsibility for any injury to people or property resulting from any ideas, methods, instructions or products referred to in the content. |
© 2026 by the authors. Licensee MDPI, Basel, Switzerland. This article is an open access article distributed under the terms and conditions of the Creative Commons Attribution (CC BY) license.