


Abstract
In this paper, a hidden ring beam (HRB) joint suitable for steel-tube-reinforced concrete (ST-RC) composite columns is proposed. The seismic performance was evaluated experimentally by hysteresis loading tests on reinforcement anchorage construction and reinforced concrete (RC) slabs, which was evaluated by several indices to assess the strength, ductility, stiffness degradation and energy dissipation capacity. The results showed that the HRB joints have reliable seismic safety performance. The ultimate failure of all the specimens occurred in the plastic hinge regions of the RC beams. The specimens with different reinforcement anchorage construction methods exhibited excellent anchorage performance, maintaining effective anchorage between beam longitudinal bars and ring bars under cyclic loading. The RC slab increased the joint strength and the initial stiffness, with only a reduction in the ductility coefficient, and the average equivalent viscous damping coefficient reached 0.155. In addition, a joint numerical model was established, and the accuracy was validated against the test results, with the predicted strength differing from the test results by no more than 6%. A parametric analysis using numerical simulations revealed that the ring–longitudinal ratio, bearing stirrup diameter, RC slab constraints and axial load ratio were critical factors influencing the seismic performance of the joints. On the basis of the results of the parametric analysis, a moment capacity calculation method is proposed for HRB joints, providing a practical reference for seismic design in engineering applications.
1. Introduction
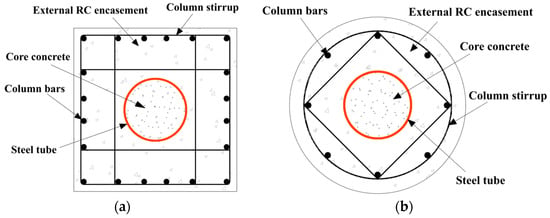
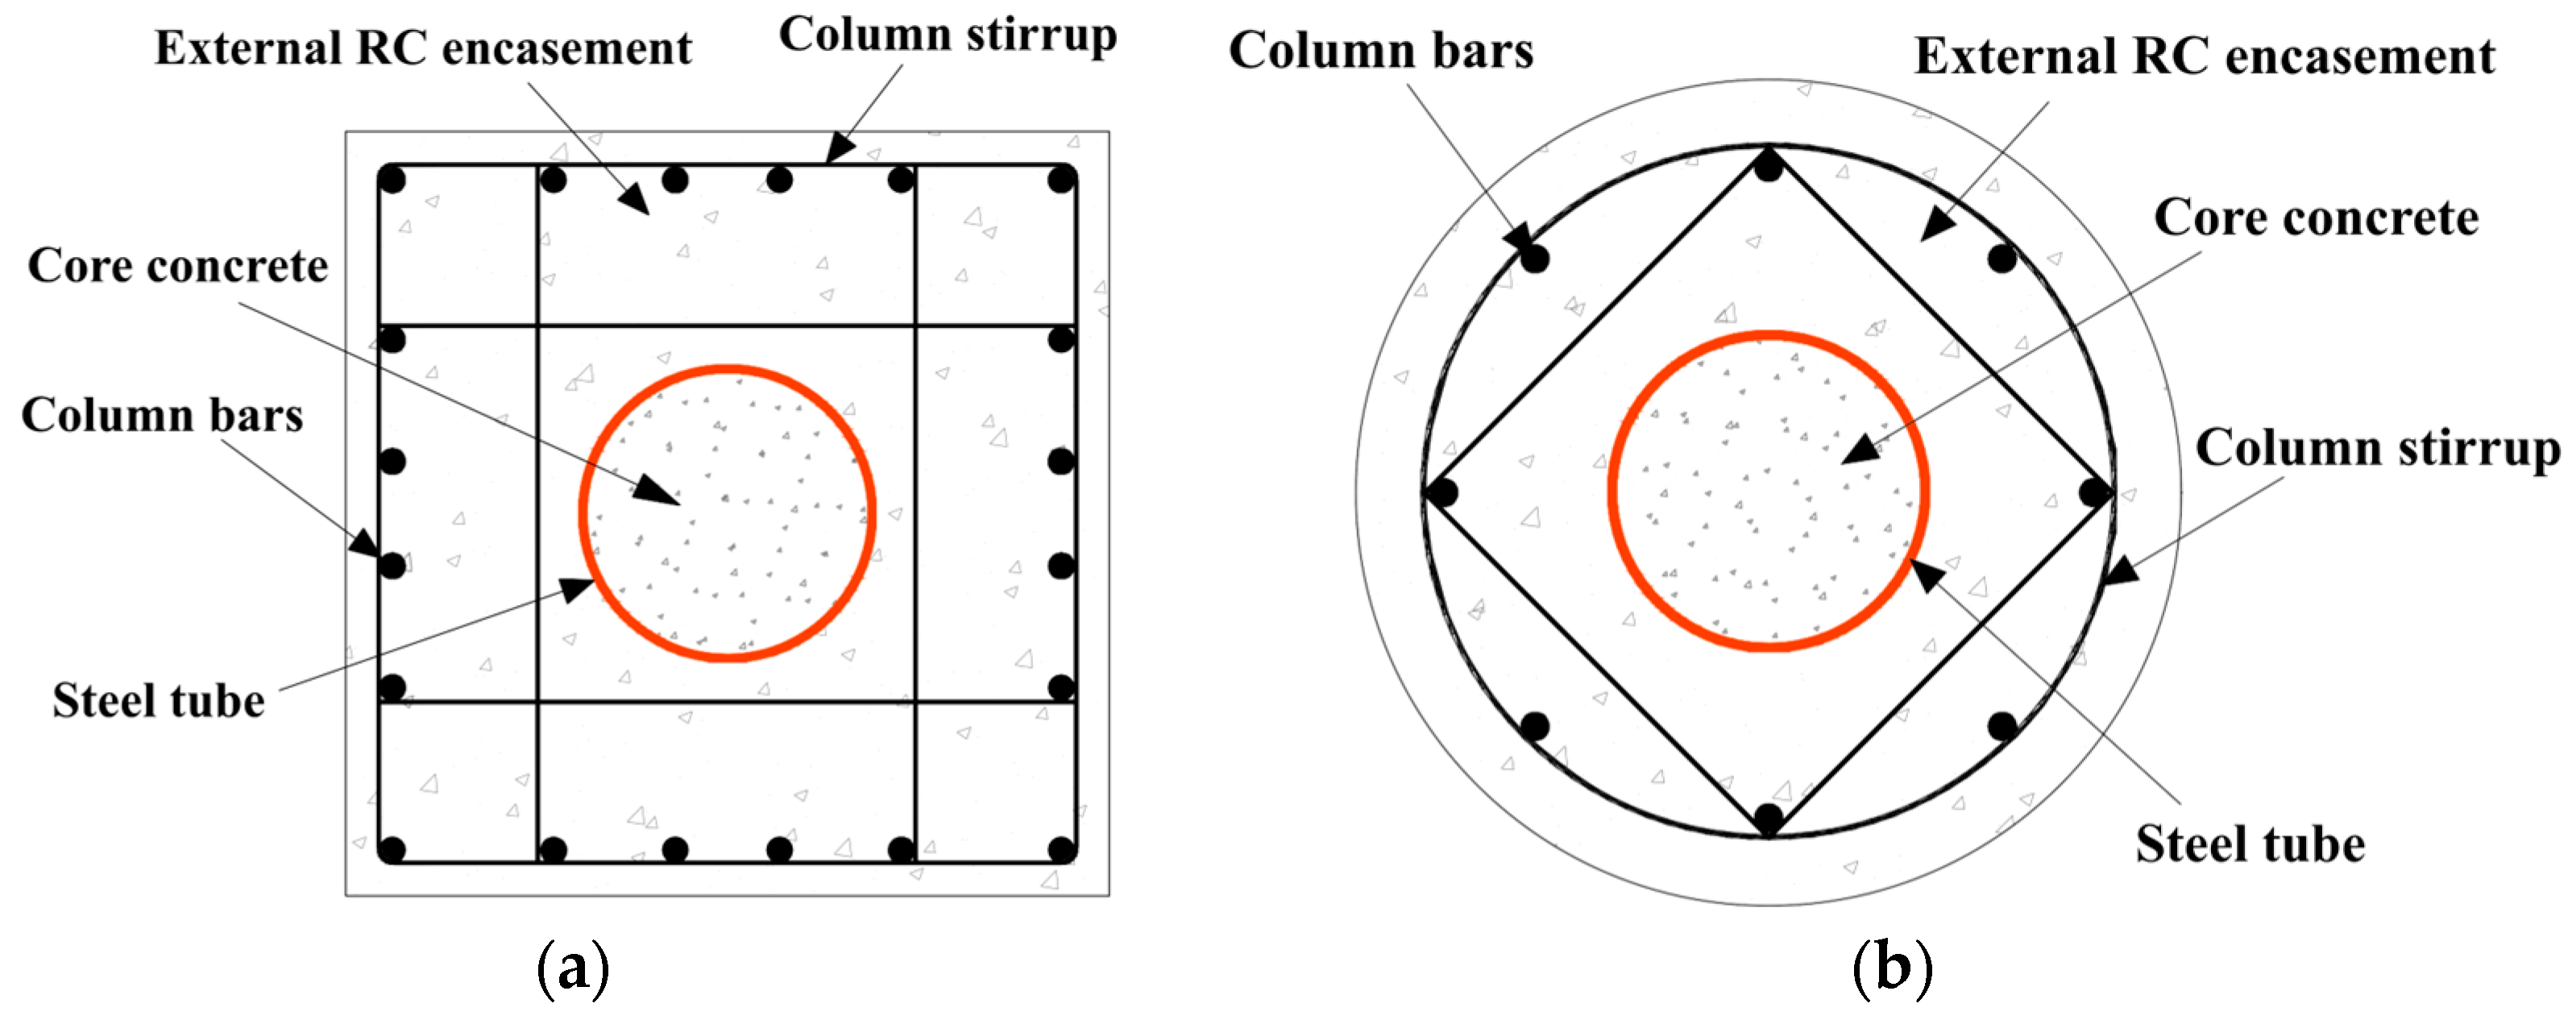
Steel-tube-reinforced concrete (ST-RC) composite columns are an advanced structural system comprising a concrete-filled steel tube (CFST) column enclosed by an external reinforced concrete (RC) encasement, with typical cross-sections, as illustrated in Figure 1. CFSTs enhance strength and ductility because of the confinement effect of steel tubes [1,2,3], whereas external RC encasement improves fire and corrosion resistance [4,5,6]. This composite column has been utilized in large-scale engineering projects such as the Shenzhen Huanggang Center and Guangzhou Baiyun Railway Station [7]. However, a critical challenge arises in beam–column joint design: the embedded steel tube obstructs the continuous passage of beam longitudinal bars through the joint core region, rendering conventional RC joint detailing methods inapplicable. This necessitates the urgent development of innovative connections with improved force transfer mechanisms.
Figure 1.
Typical cross-sections of ST-RC composite columns. (a) Rectangular cross-section; (b) circular cross-section.
ST-RC composite columns for beam joints have received limited research attention, but columns similar to beam composite joints have been extensively studied. Researchers have conducted experimental investigations on different types of steel-reinforced concrete (SRC) joints. Through quasi-static tests, Chen et al. [8] clarified the shear deformation behavior of the joint core; Vasdravellis et al. [9] validated the stability of the hysteretic behavior in steel beam-SRC column joints; and Park et al. [10] demonstrated that the connection formed by a U-shaped steel beam and an RC column provides excellent energy dissipation capacity under severe earthquake loading. Abbas et al. [11] further confirmed that steel fiber concrete can improve the ultimate deformation capacity of joints by approximately 30%, and other studies have indicated that the confinement effect of steel tubes on core concrete can significantly enhance joint seismic performance [12,13,14,15]. In CFST-RC beam joints where steel tubes penetrate the joint core, effective connections between the steel tubes and the beam longitudinal reinforcements are also needed. Fang et al. [16] developed a CFST column–RC ring beam connection joint that can reliably transfer beam-end moments and shear forces. Chen et al. [17] conducted experiments on through-beam joints connecting CFST columns and RC beams, and the results demonstrated excellent seismic performance. The joint-beam reinforcement ratio and joint-column cross-section ratio were found to significantly affect the joint seismic behavior.
Connections between ST-RC composite columns and either RC beams or steel beams have been widely studied [18,19,20,21,22,23,24,25,26,27]. China’s Technical Specification [28] suggests two connection methods for ST-RC composite columns and RC beams: (1) Passing RC beam longitudinal bars through the embedded CFST core, although excessive perforations may weaken the steel tube and compromise the compactness of the poured concrete. (2) Welding steel components to the steel tube wall to anchor longitudinal bars, although this risks heat-affected zone degradation and increases construction complexity due to extensive welding. Ma et al. [29] developed simple and novel wet connection details for precast concrete beam-to-CECFST column joints, and the test results demonstrated satisfactory seismic performance and constructability. Qiao et al. [30] investigated exterior precast concrete beam-to-CECFST column joints and showed that the cast-in-place concrete material and axial load level could influence joint behavior. Zhou et al. [31] developed an innovative connection for ST-RC composite columns and RC ring beams, demonstrating its safety in experiments, but the bulky concrete ring beam limits architectural spatial flexibility. Ling et al. [32] proposed a restoring force model for HRB joints by combining a trilinear skeleton curve with stiffness degradation laws and hysteresis rules, and showed that it could reproduce the cyclic response of HRB joints with good agreement to both test and finite-element results. In previous experimental studies on composite joints, the contribution of the RC slab was rarely considered. However, in practical applications, the presence of an RC slab can significantly affect the joint behavior. Ning et al. [33] found that the presence of RC slabs enhanced the bearing capacity of the RC frame by a reduction in deformation capacity. Therefore, the RC slab constraints should be regarded as critical parameters in the study of ST-RC columns and RC beam joints. Although the above connection details can effectively transfer internal forces and improve the seismic performance of ST-RC columns to RC beam joints, they generally suffer from several practical drawbacks, such as complicated construction procedures, a large welding workload, increased construction cost, and in some cases, a significant occupation of usable architectural space around the joint region.
In this study, a novel hidden ring beam (HRB) joint which relies on conventional RC detailing and avoids perforating the steel tube and extensive onsite welding, thus simplifying construction and reducing cost, is proposed. To investigate its seismic and anchorage performance under earthquake-type loading, an experimental program involving three groups of specimens was designed. The proposed joint incorporates the HRB reinforcement skeleton pre-installed in the joint core, through which the longitudinal reinforcement of the RC beam is anchored by direct force transfer to the ring bars, thereby forming a reliable internal anchorage mechanism. This paper’s highlights are as follows: (1) hysteresis loading tests were conducted to evaluate the effects of reinforcement anchorage constructions and RC slab constraints on seismic behavior; (2) a comprehensive assessment of seismic performance metrics, such as strength, ductility, stiffness degradation, energy dissipation efficiency, and failure mechanisms, was performed; (3) a refined finite element analysis (FEA) model was developed and rigorously validated against experimental data to ensure computational accuracy; and (4) a parametric analysis leveraging the FEA model was conducted to establish a theoretical framework for calculating the joint’s moment capacity, as supported by the results of the parametric analysis.
2. Configurations and Characteristics of the HRB Joint
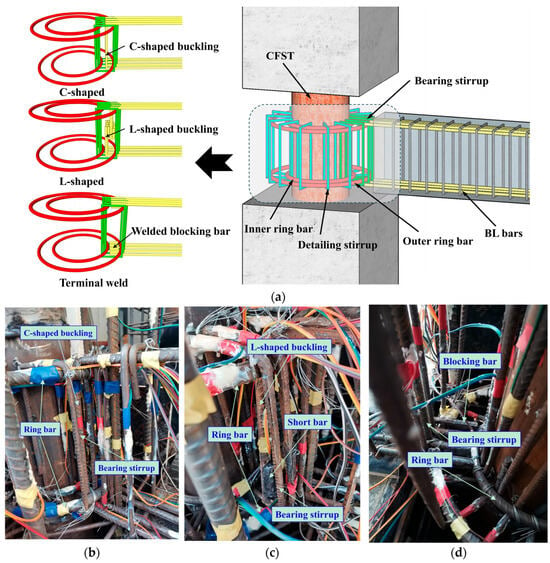
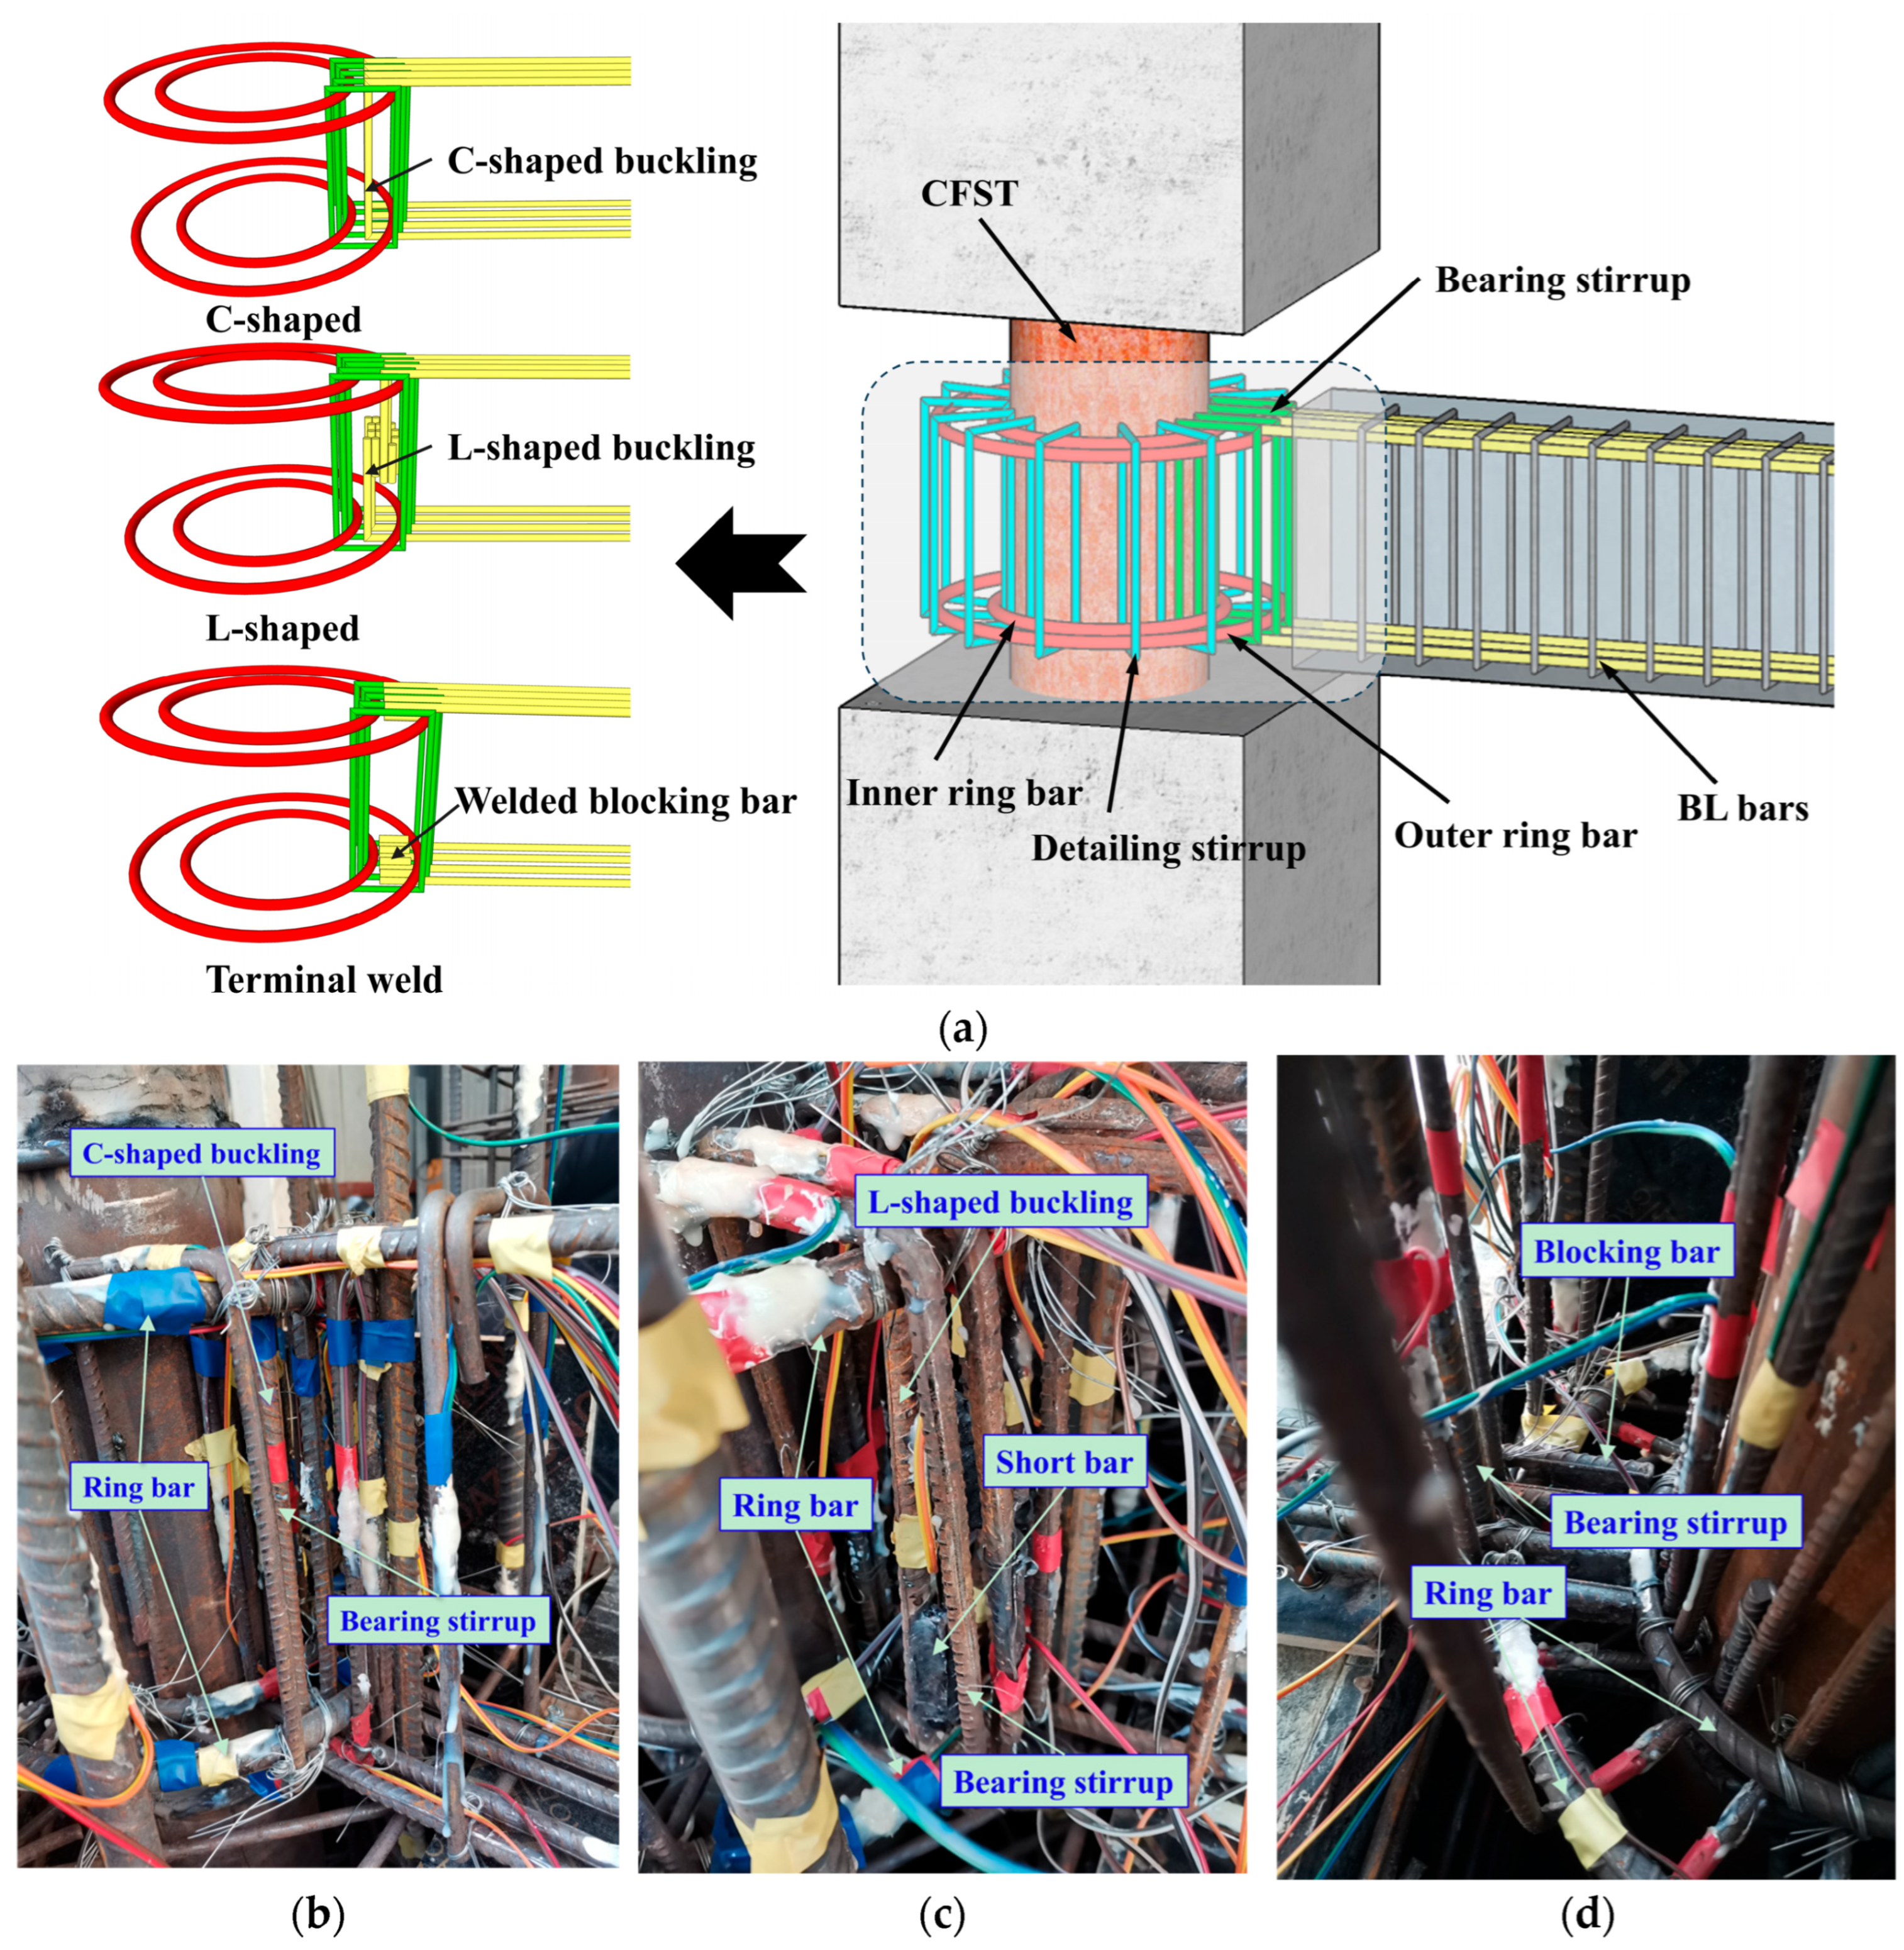
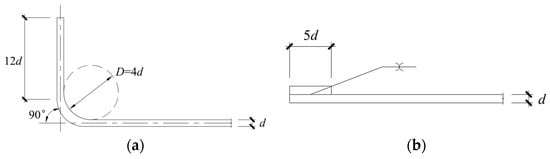
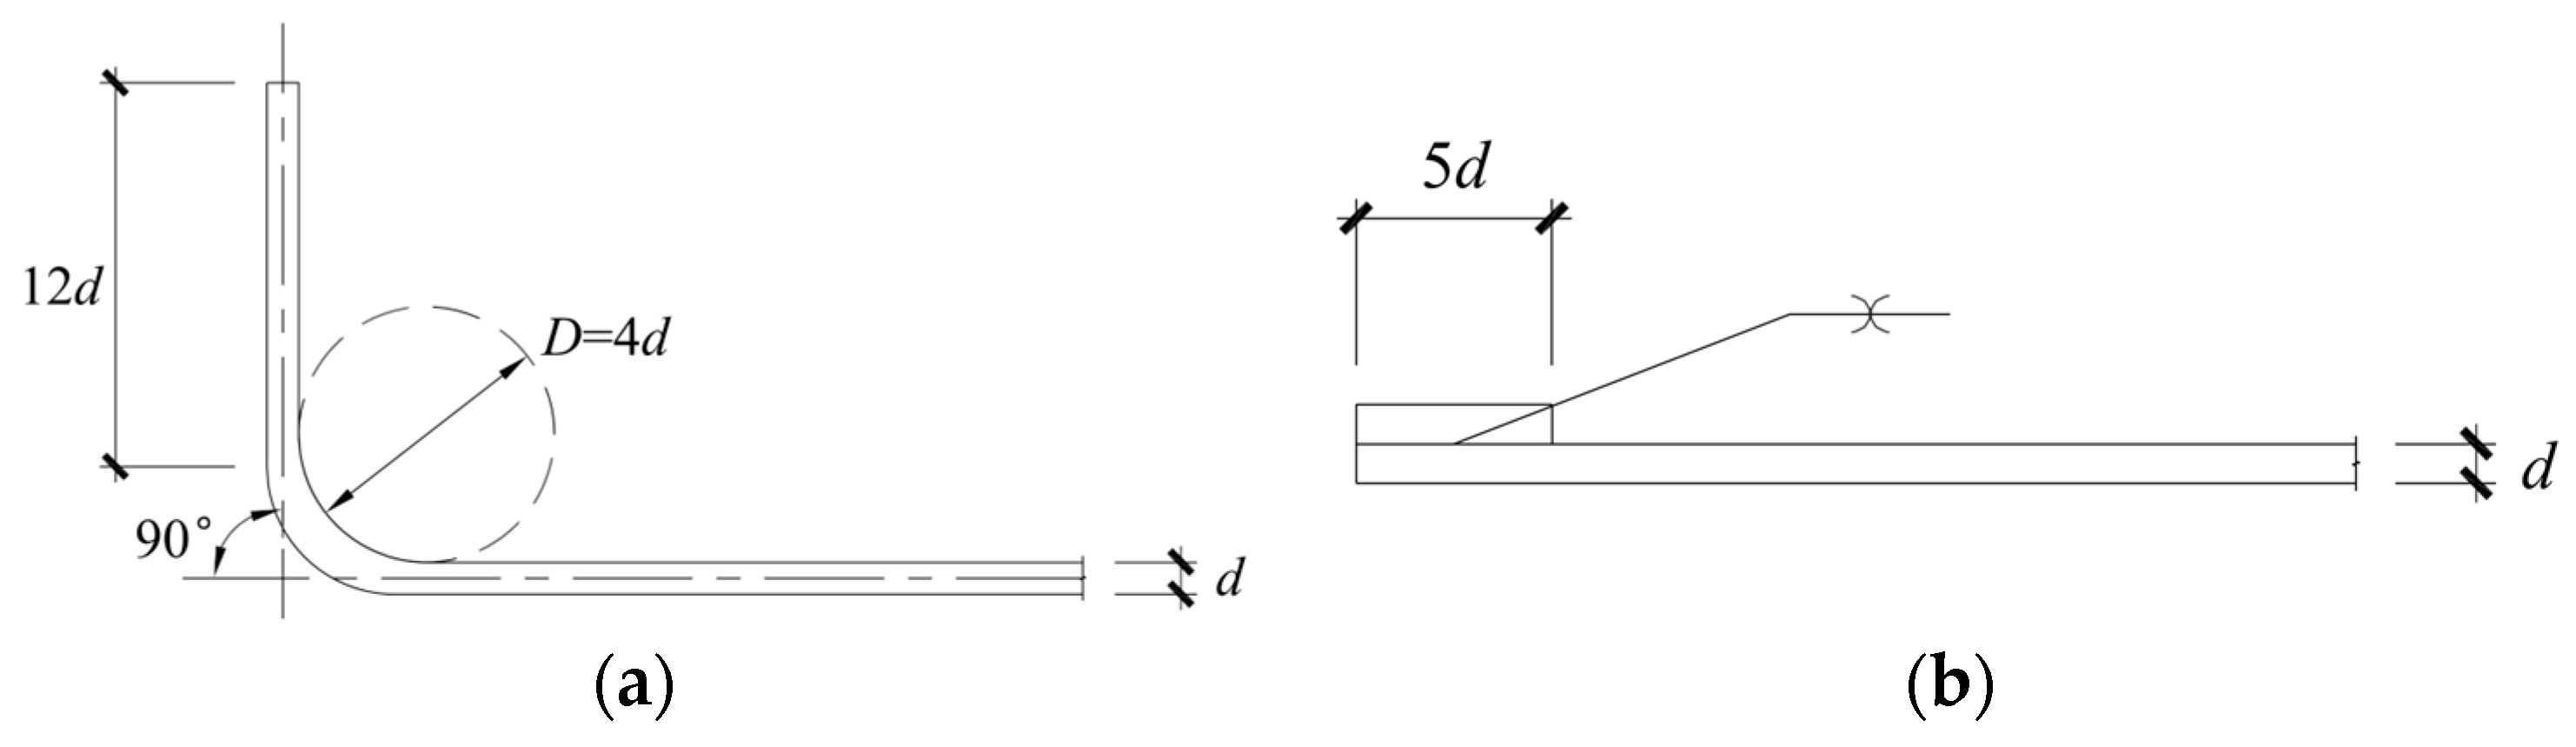
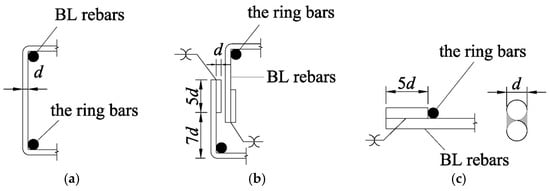
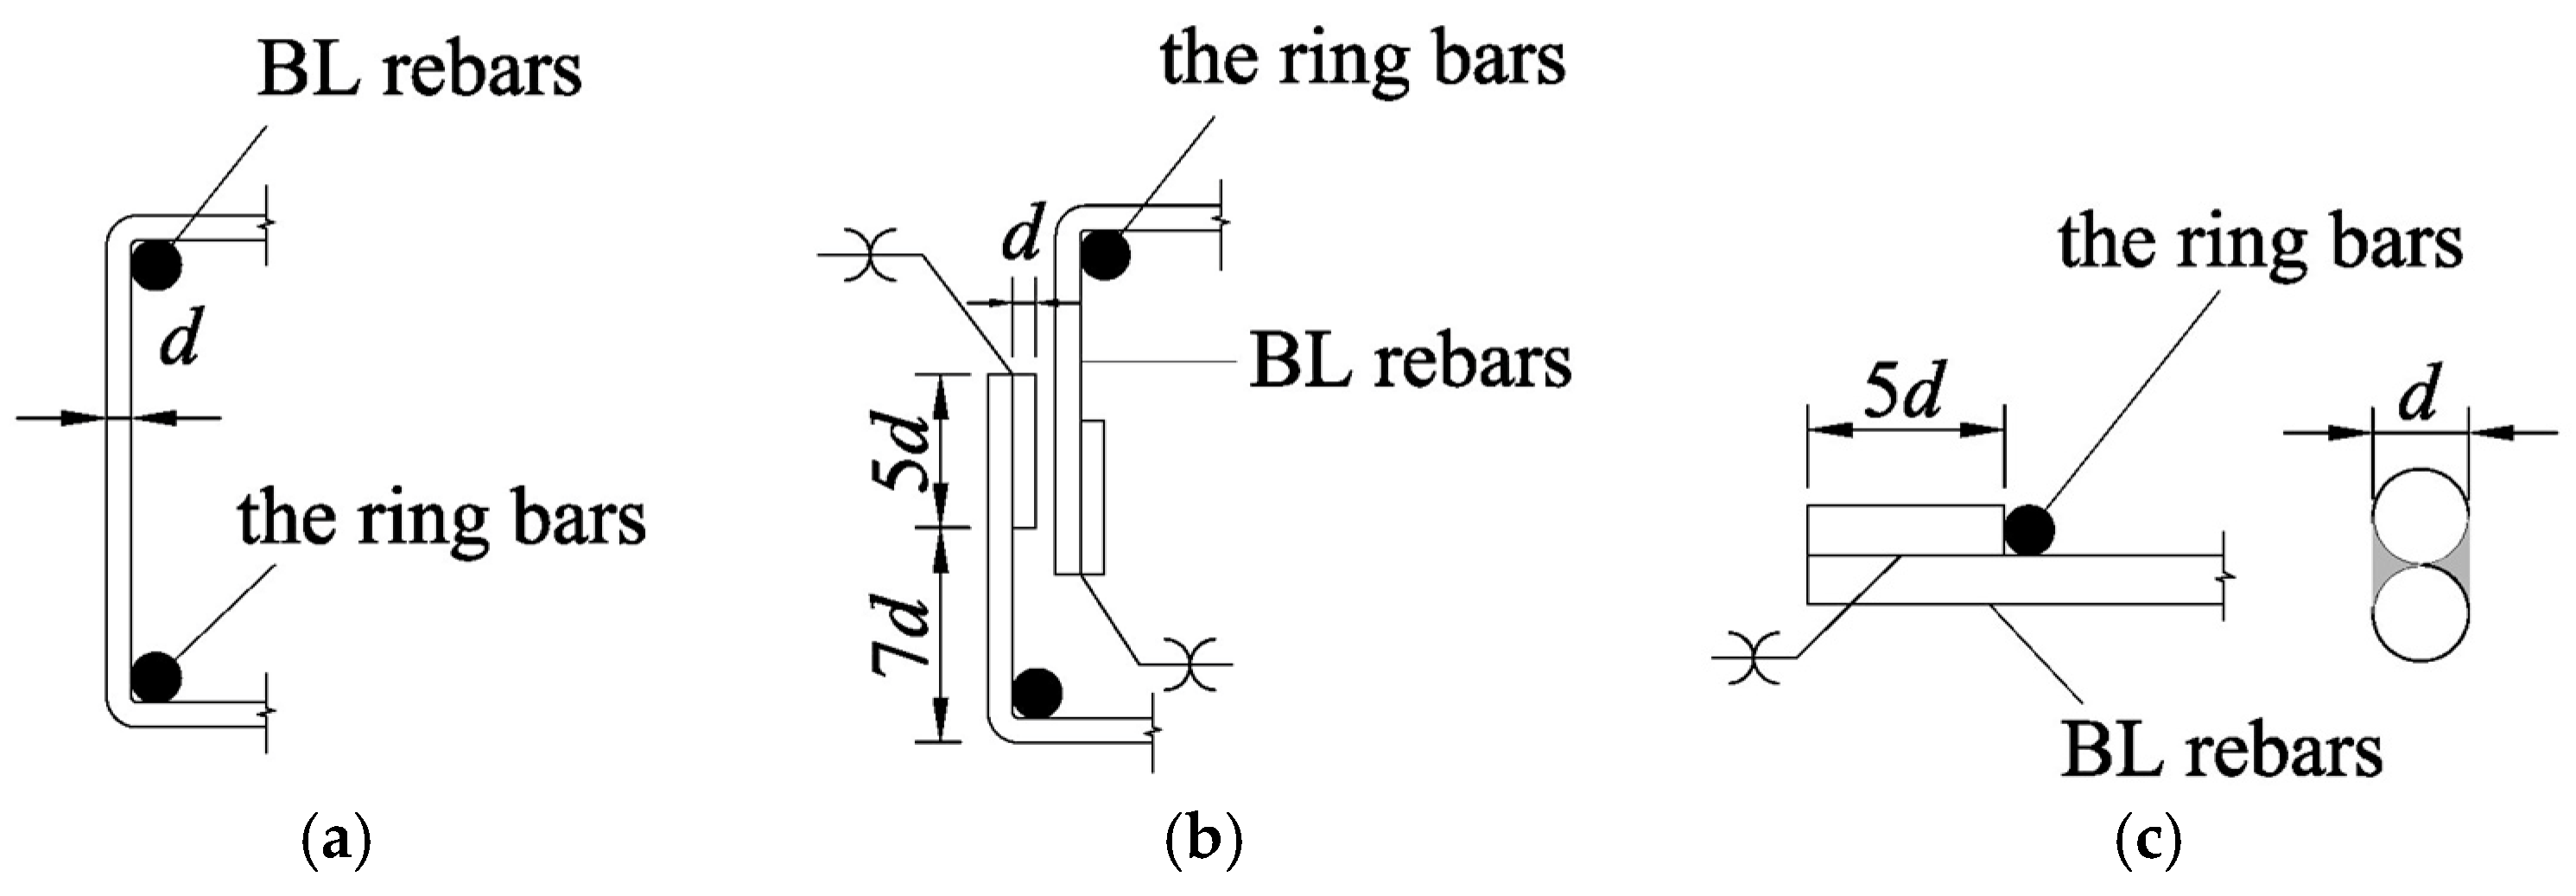
As shown in Figure 2, the HRB reinforcement skeleton consists of ring bars, bearing stirrups, and detailing stirrups. The outer ring bars are directly anchored to the beam longitudinal bars (the BL bars), whereas the inner ring bars, positioned at the same horizontal level, feature the same or a reduced diameter. The bearing stirrups, positioned adjacent to the BL bars, contribute to load transfer. The detailing stirrups, which are radially arranged around the steel tube center, mechanically link the inner and outer ring bars. The ring bars, embedded within the ST-RC composite column, anchor the BL bars via three different reinforcement anchorage constructions. As shown in Figure 2, three anchorage constructions were adopted in this study, namely the C-shaped bar joint construction (CBJC), L-shaped bar joint construction (LBJC), and terminal welded joint construction (TWJC). These constructions were developed with reference to the basic anchorage forms recommended in China’s Code GB50010-2010 [34], as illustrated in Figure 3. Notably, the top and bottom BL bars are formed from a single continuous reinforcement that undergoes two vertical bends in the CBJC, whereas in LBJC and TWJC, an additional blocking bar is welded to the end of the BL bars.
Figure 2.
Configurations of HRB joint. (a) The configuration scheme of HRB. (b) The onsite photo of CBJC. (c) The onsite photo of LBJC. (d) The onsite photo of TWJC.
Figure 3.
The technical requirements for buckling and mechanical anchors in GB 50010-2010. (a) 90-degree buckling. (b) Terminal welded joint construction.
Compared to existing ST-RC column-RC beam connections, the proposed HRB joint offers several practical and mechanical characteristics. First, because the HRB reinforcement skeleton is embedded in the external reinforced concrete encasement, the BL bars can be anchored without relying on tube perforation, thereby avoiding the integrity loss and concreting difficulty associated with through-tube configurations. Second, the elimination of extensive welded external stiffeners simplifies field assembly and reduces construction cost. Finally, the HRB reinforcement skeleton provides a local force-transfer path and contributes to maintaining the integrity of the joint core.
3. Experimental Programs
3.1. Specimen Design and Material Properties
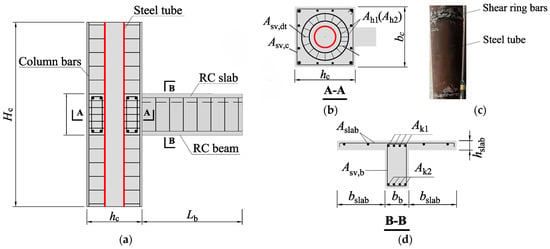
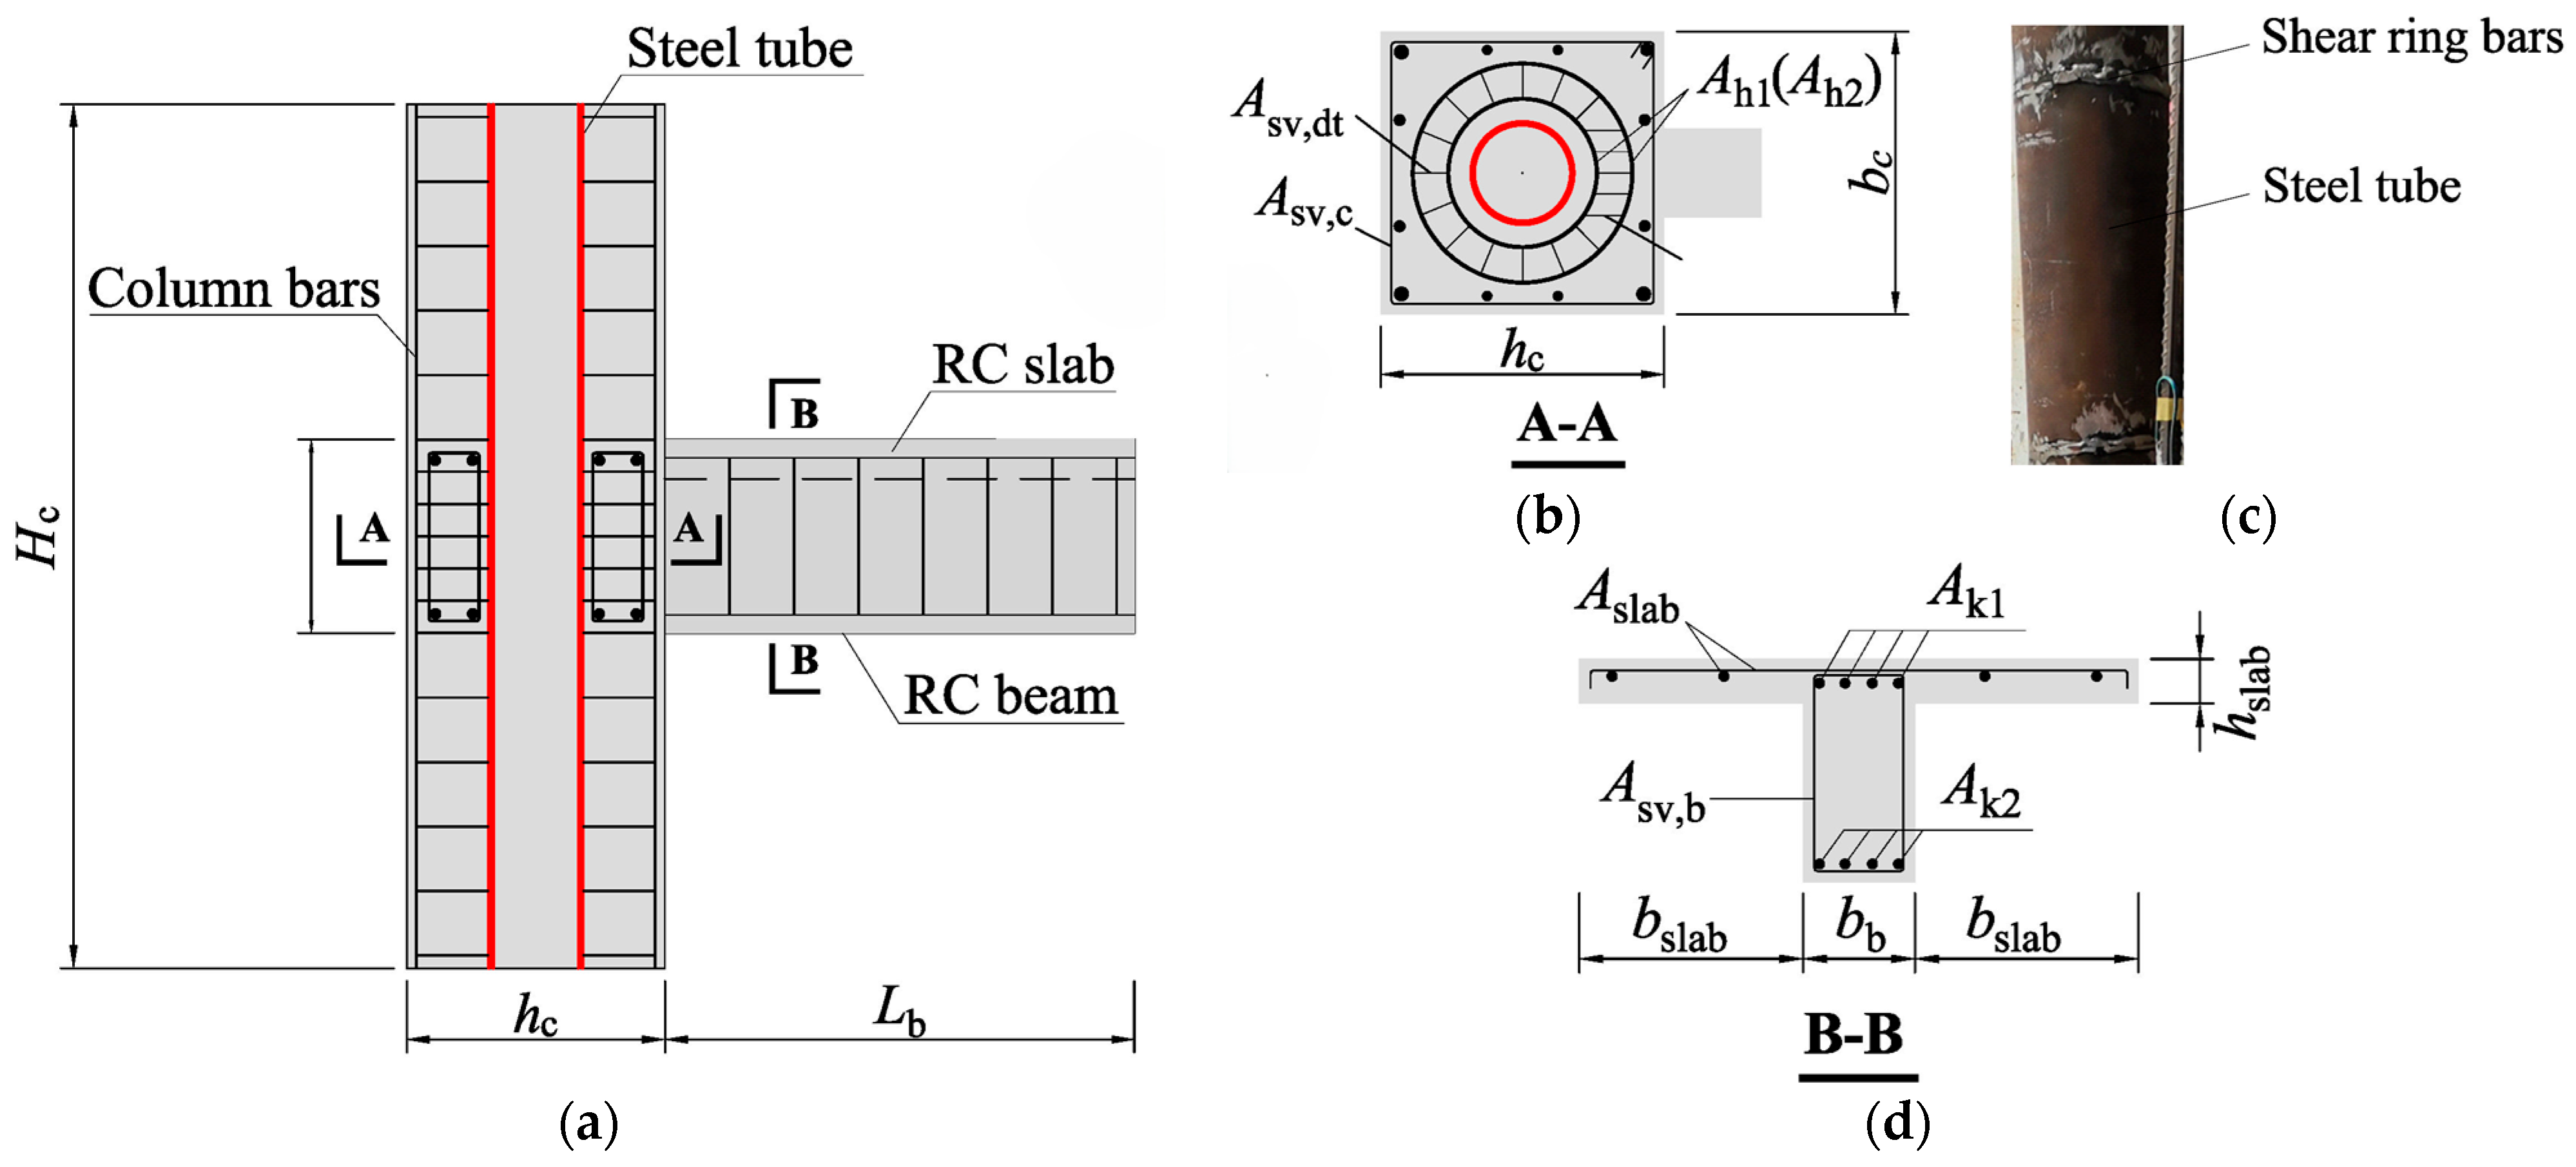
A representative exterior joint of frame structures was selected as the research sample, with the column heights and the RC beam lengths determined on the basis of inflection points in the frame structure. Due to the loading-capacity limitation of the test equipment, the hysteresis test specimen was designed to be about one-half of the prototype size. It should be noted that half-scale specimens may still involve size-related effects, particularly for local anchorage mechanisms in the congested HRB zone, such as bond–slip, aggregate interlock, and local concrete breakout [35]. Nevertheless, the present half-scale specimens were still able to effectively reveal the overall seismic behavior, failure mode, anchorage feasibility, and relative influence of key detailing parameters of the proposed HRB joint. According to the China’s Code GB50011-2010 [36], the specimens adhered to the principle of a “strong column and weak beam”, with a beam-to-column strength ratio of 1.5. A design drawing of the hysteresis test specimens is shown in Figure 4, and the details of the specimens are shown in Table 1. The reinforcement anchorage constructions in the joint core region are detailed in Figure 5. The column length is 2000 mm, whereas the effective height H is 1800 mm. The distance L, measured from the beam end loading point to the column edge is 1500 mm. The steel tube has sectional dimensions of “D × t” = 146 × 8 mm, with a steel tube area ratio of 2.2%. The effects of the anchorage constructions were examined by comparing specimens J-1, J-2, and J-3. The influences of the RC slab were assessed by contrasting the loading directions within each specimen. All specimens were employed with HRB400 reinforcement and a Q355B seamless steel tube. Table 2 shows the properties of the steel tube and reinforcements according to China’s standard [37]. In addition, different concrete strength grades were assigned to different regions of the specimen, with C60 used in the core concrete and C40 adopted elsewhere. The compression strength of the concrete was obtained according to China’s Specification JGJ 101-2015 [38], and the properties of the concrete are listed in Table 3.
Figure 4.
Detail drawings of joints. (a) Elevation. (b) Section A-A. (c) Steel tube. (d) Section B-B.
Table 1.
Details of the specimens.
Figure 5.
Rebar anchorage constructions in the joint core region. (a) C-shaped; (b) L-shaped; (c) terminal welded joint construction.
Table 2.
Mechanical properties of the reinforcements and steel tube.
Table 3.
Mechanical properties of the concrete.
3.2. Test Setup and Loading Procedure
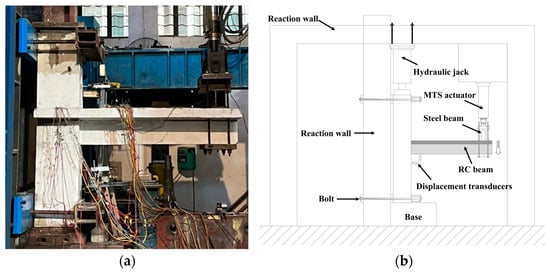
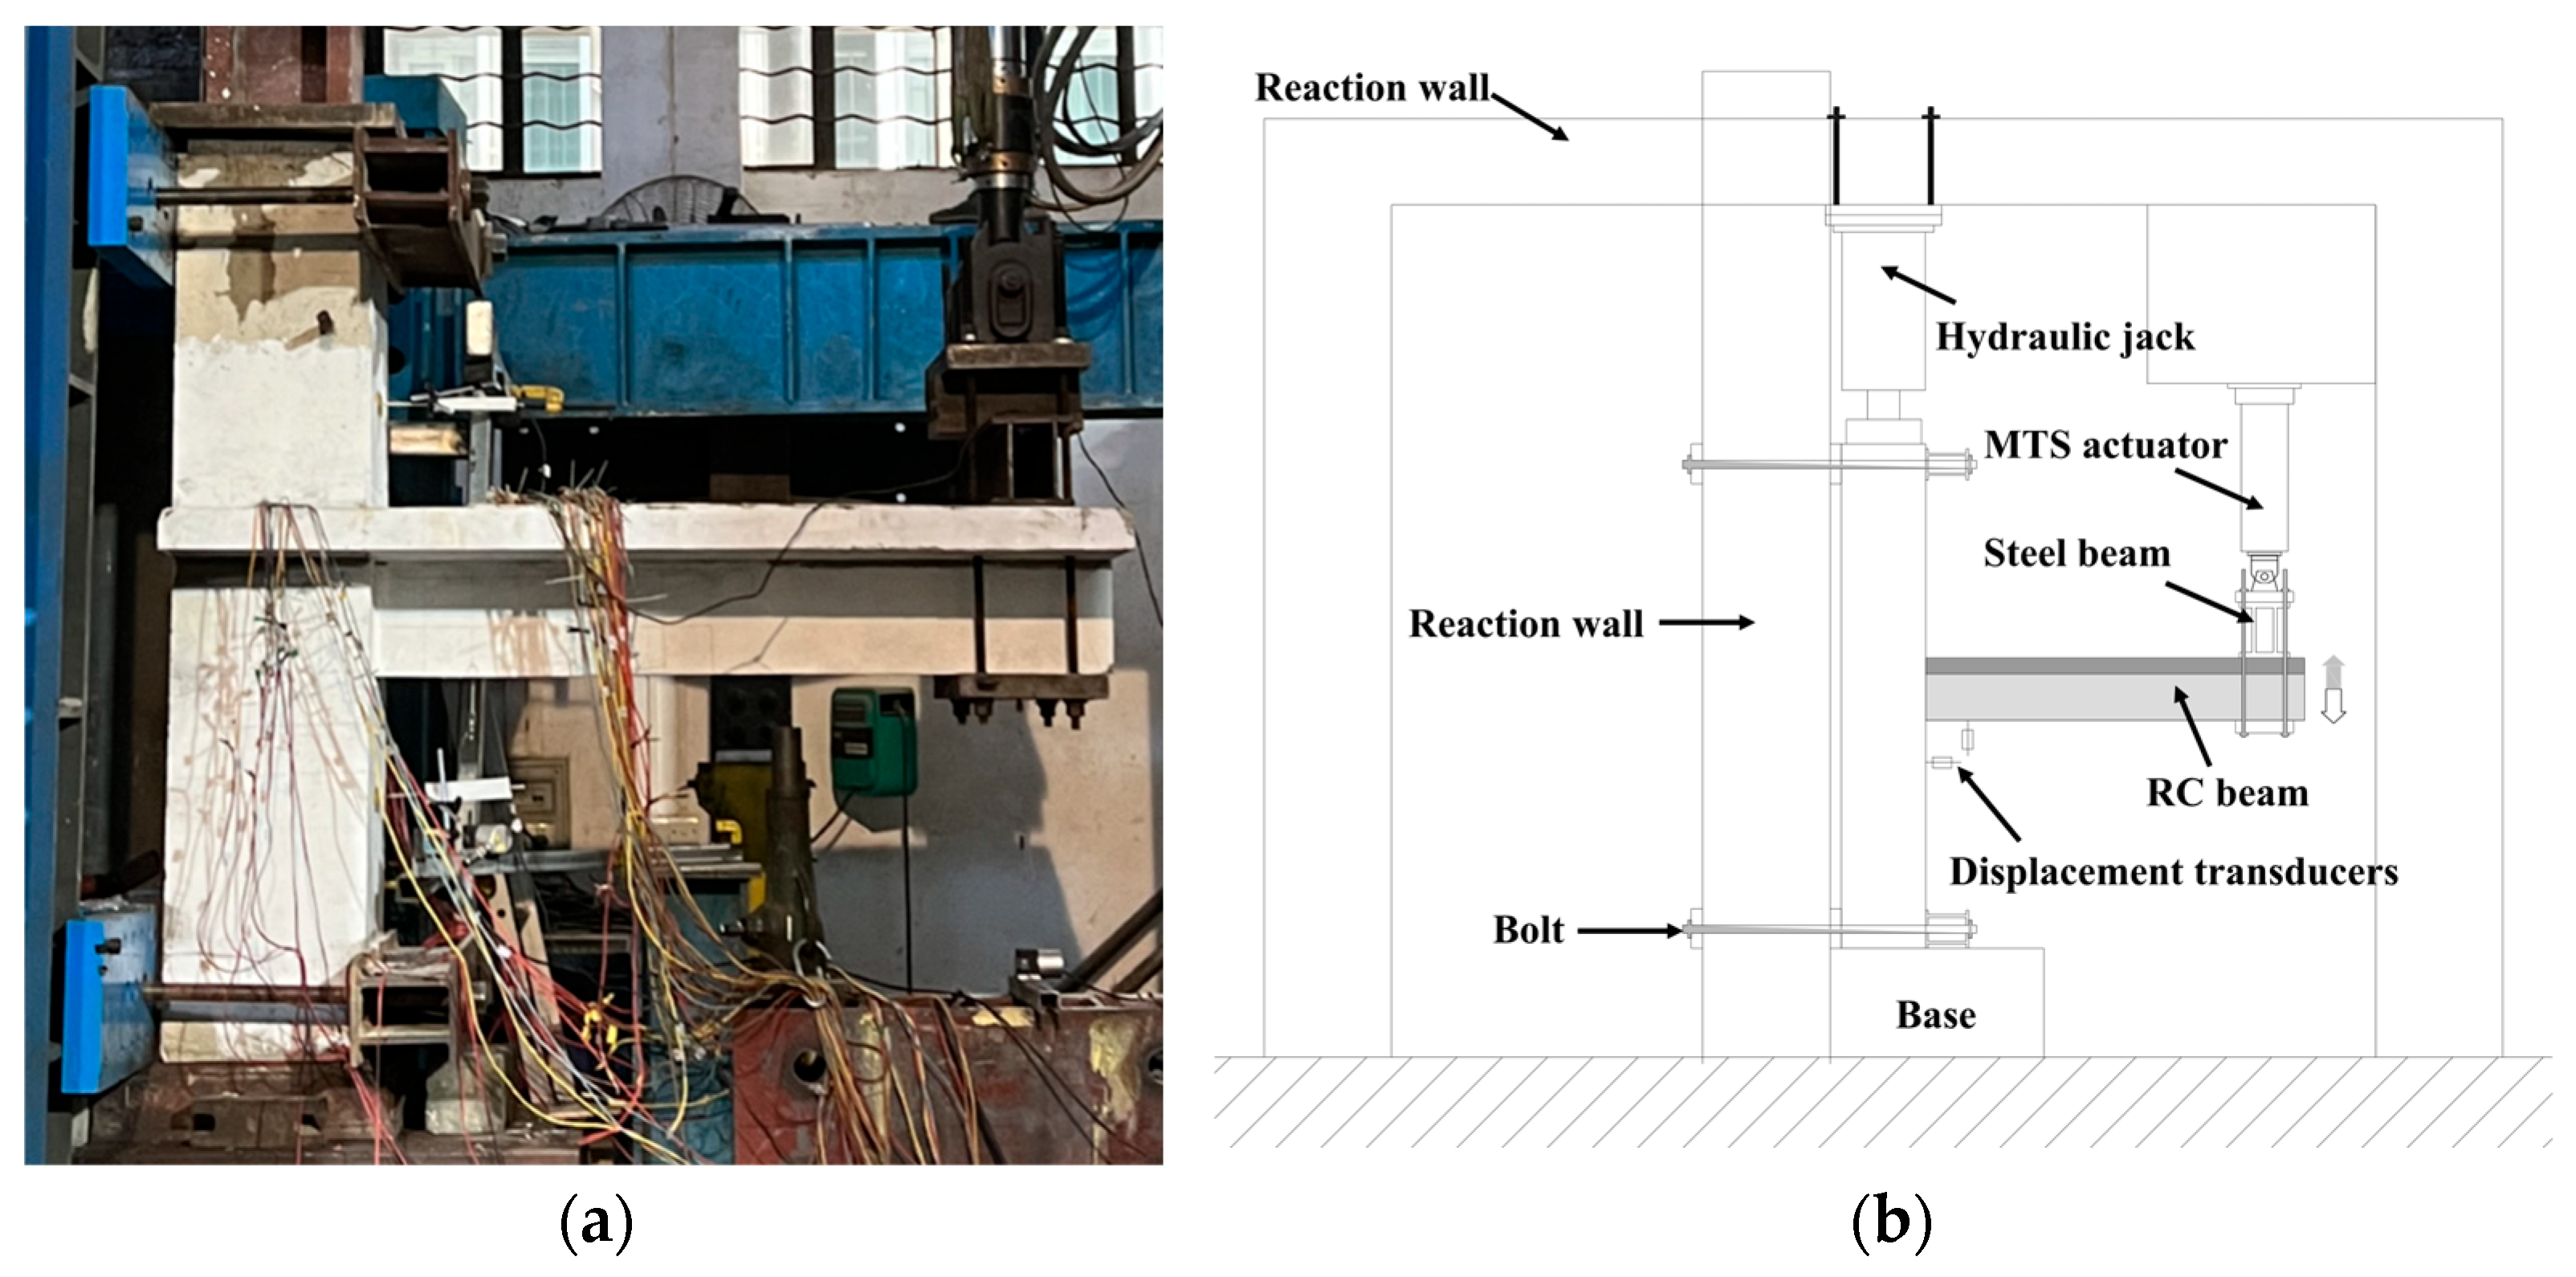
The test setup is shown in Figure 6. The top and bottom of the ST-RC composite column were restrained against both vertical and horizontal displacements by the bolts and rigid frame, while a constant axial load of 1860 kN, corresponding to approximately 30% of the axial compressive capacity, was applied to the column through a hydraulic jack. The axial compressive load was calculated via Equations (1)–(3).
where is the axial compressive capacity ratio, which is taken as 0.3; and are the design values of the axial compressive load of the ST-RC composite column and the axial compressive load capacity of the CFST short column; is the steel load ratio of the CFST; , and are the areas of the core concrete of the CFST, external concrete and steel tube, respectively; and , and are the compressive strengths of the core concrete of the CFST, external concrete and steel tube, respectively.
Figure 6.
Test setup. (a) The onsite photo of setup; (b) the schematic of setup.
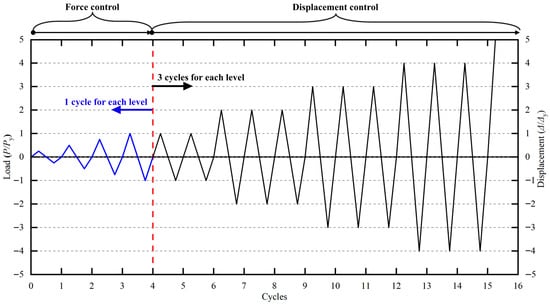
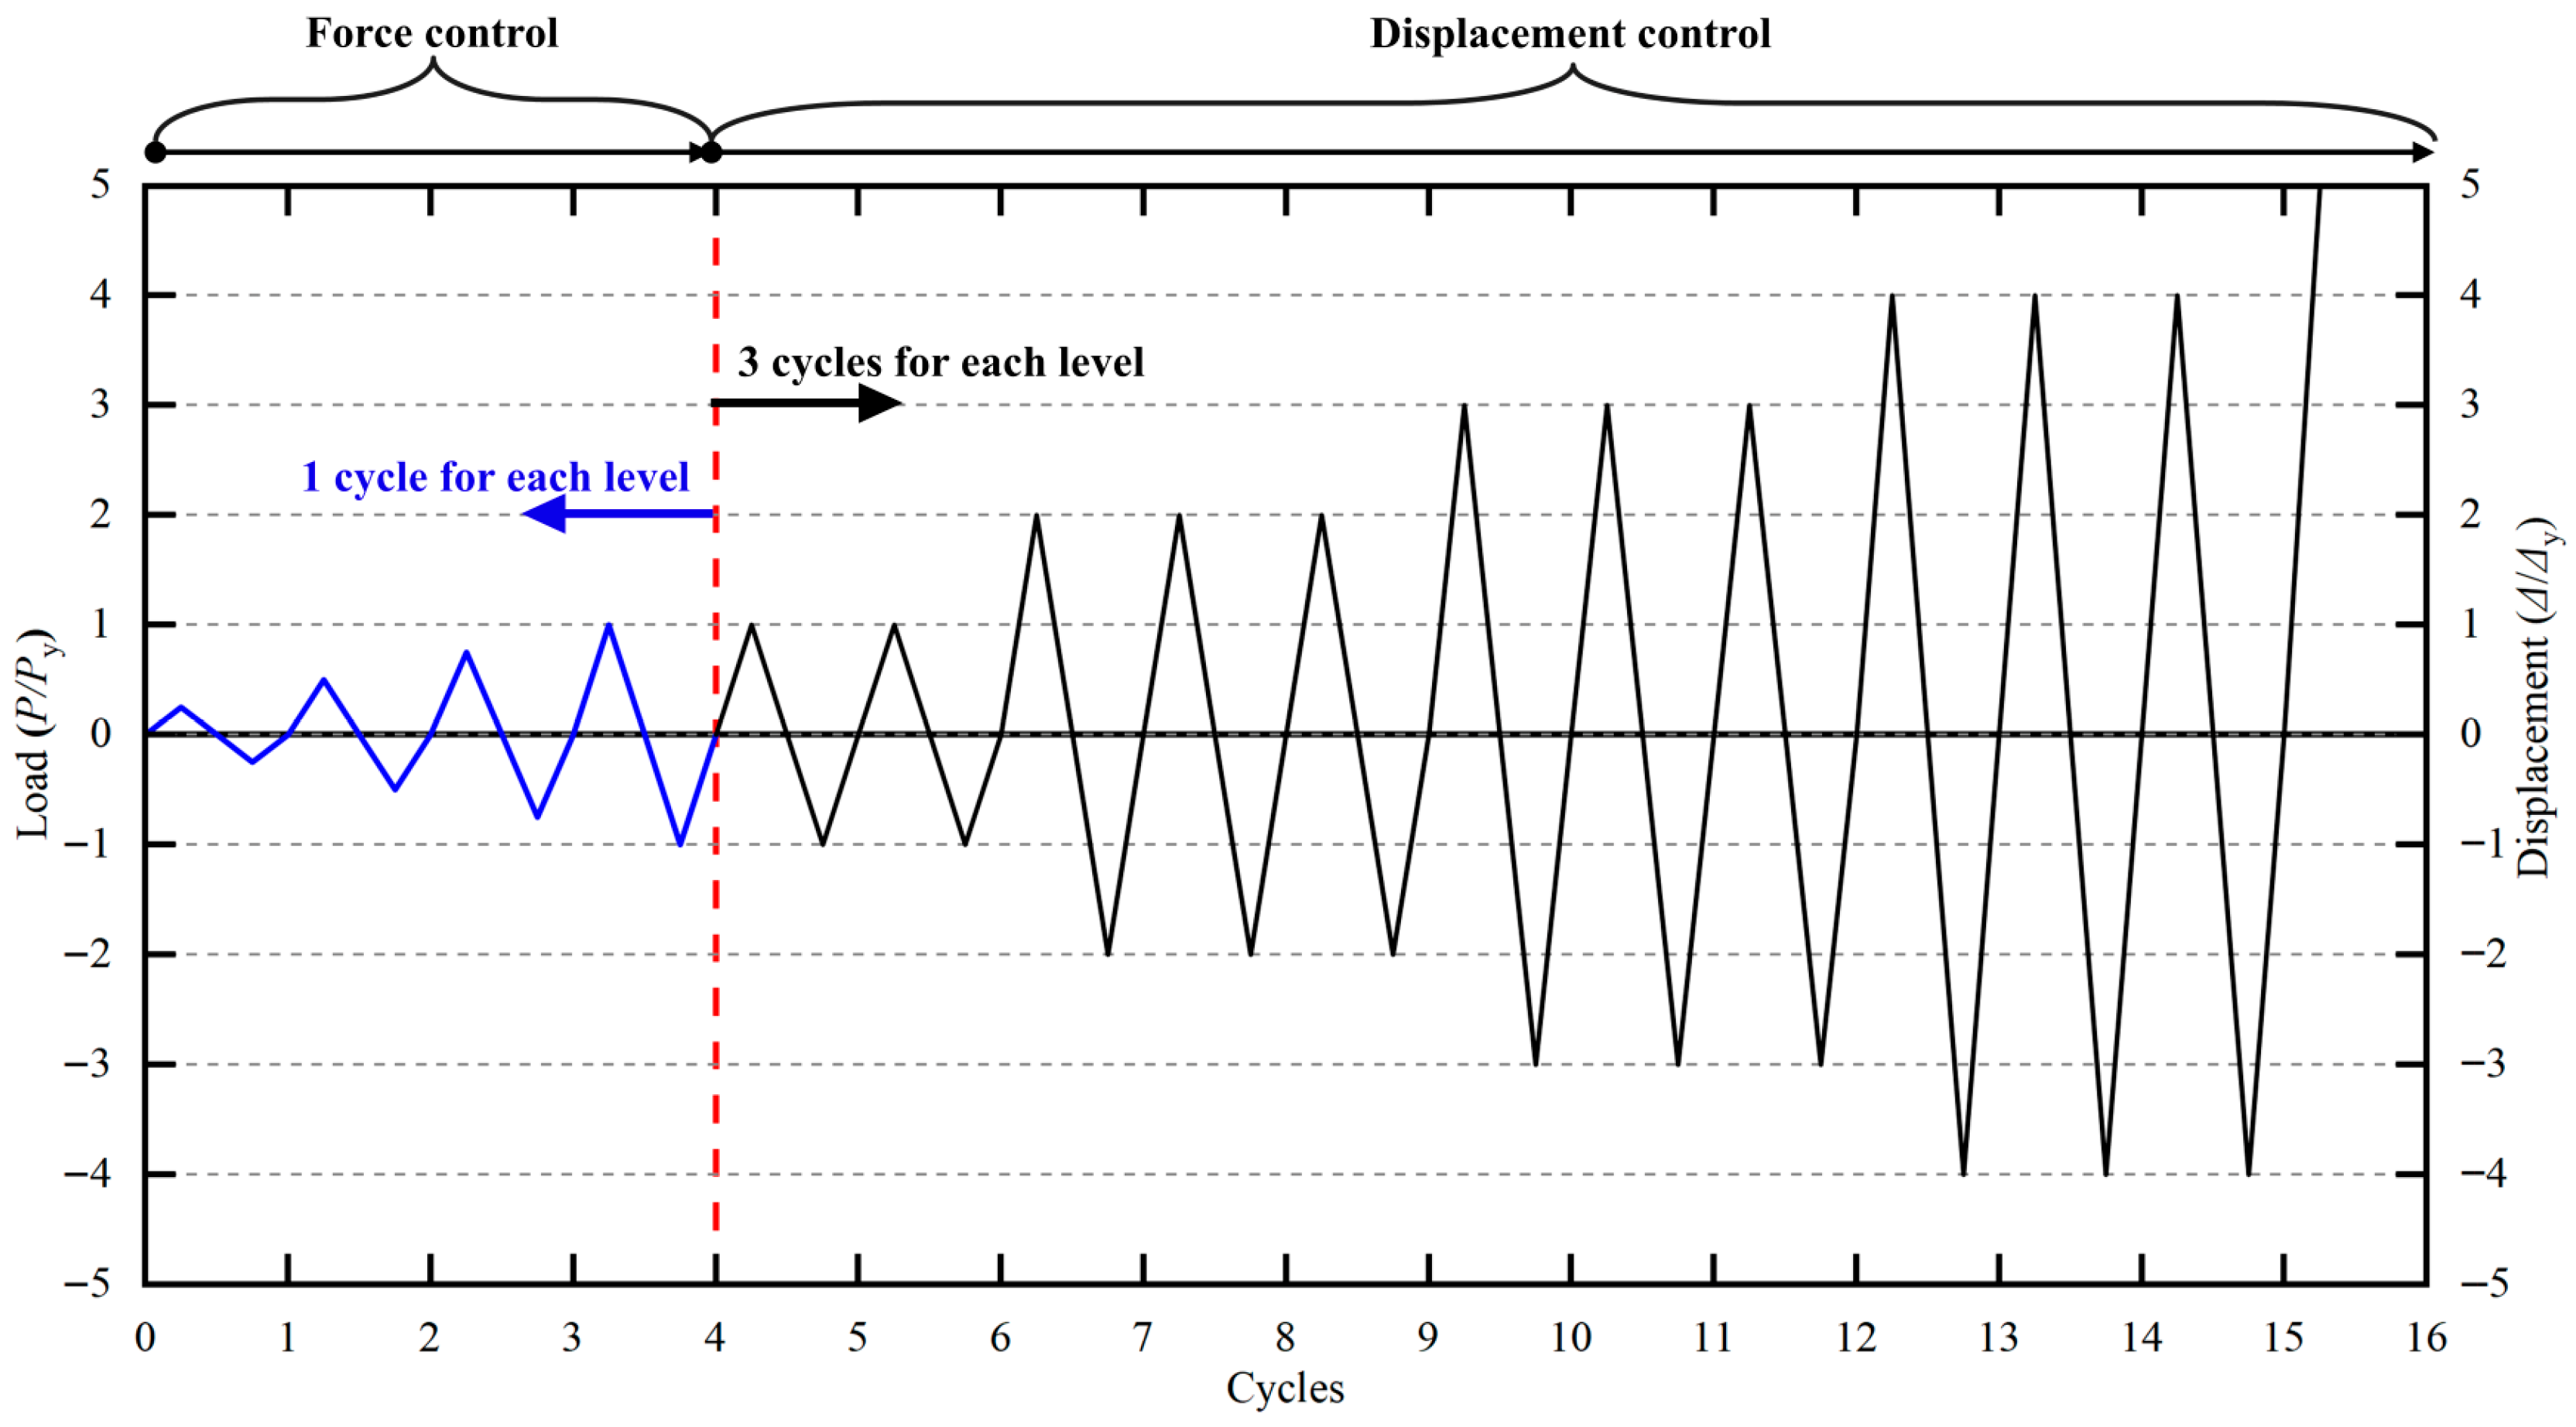
Bolts were used to connect the rigid beam on the top surface of the beam and the end plates at the bottom of the beam to fix them together between the end of the RC beam and the MTS actuator, as in the research study by Zhang et al. [39]. The test was conducted via the two-stage load ()-displacement () loading scheme, as shown in Figure 7. Before yielding, the specimens were employed by the loading-control mode with increments of 0.25 applied once at each level, where is the estimated yield load. The displacement-control mode was adopted after each specimen yielded. Each displacement increment was repeated three times, with taken as the measured yield displacement. The test was terminated when each specimen failed so severely that further loading was impossible or the applied load had decreased to approximately 85% of the maximum load.
Figure 7.
Loading scheme for specimens.
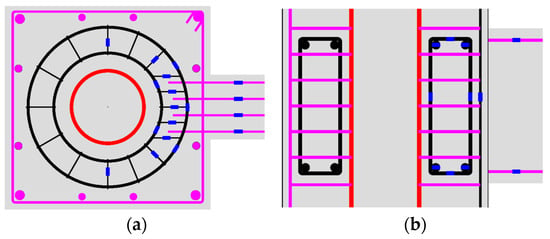
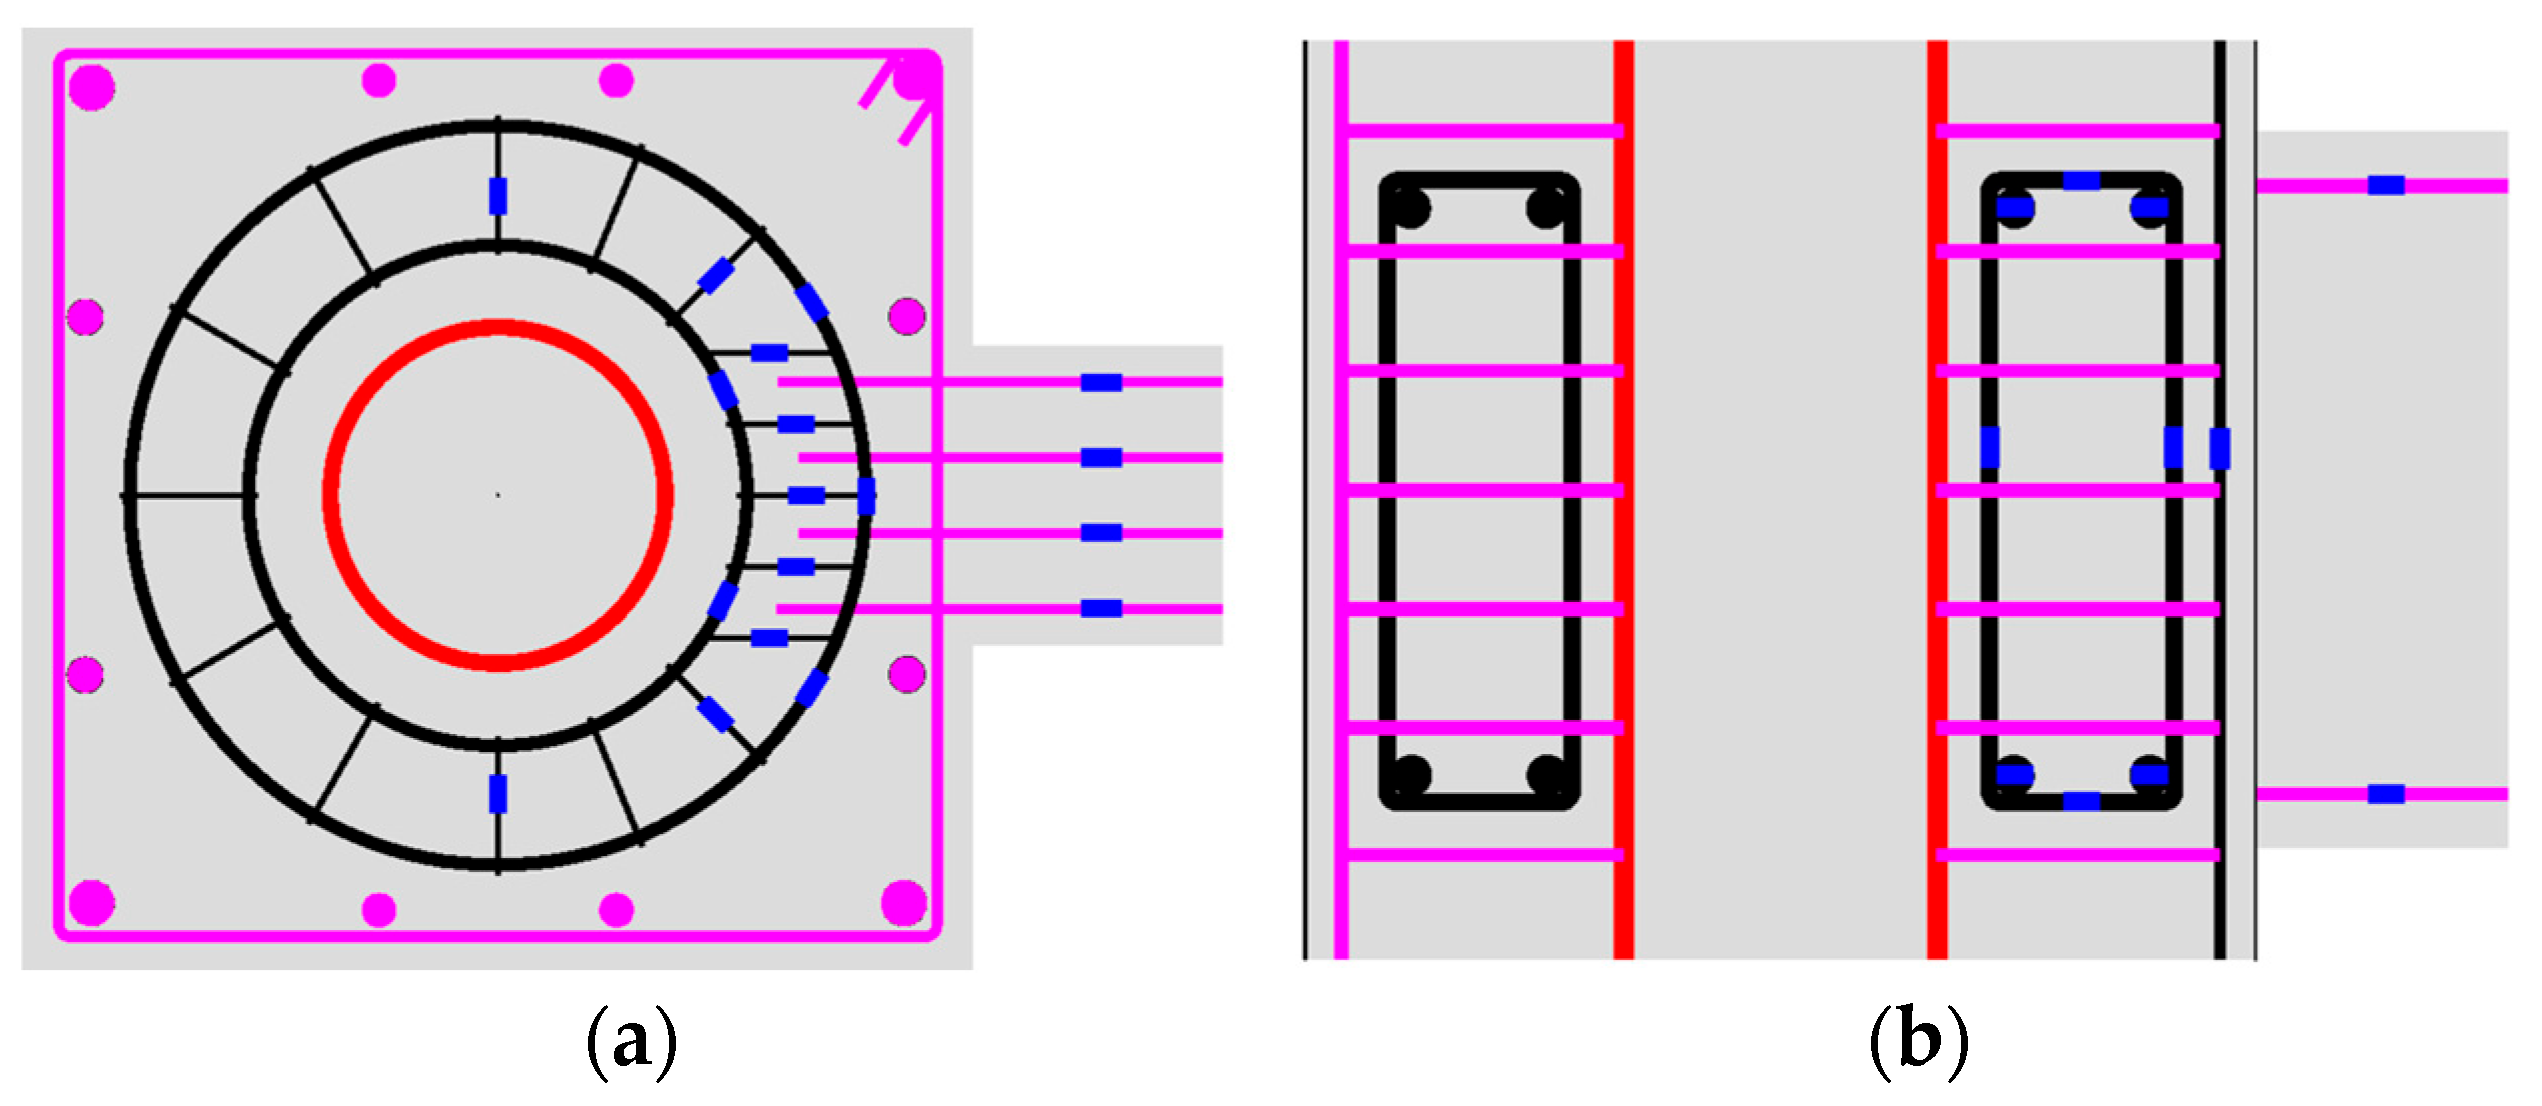
During testing, the MTS actuator continuously recorded the beam-end load and displacement . The cracking initiation and propagation on the RC beam, RC slab and ST-RC composite column were monitored throughout the loading history. The strain gauges were used to measure the strain of the reinforcements, as shown in Figure 8.
Figure 8.
Arrangement of the strain gauges on the bars. (a) Top view; (b) elevation.
4. Experimental Results and Discussion
4.1. Test Process and Failure Mechanism
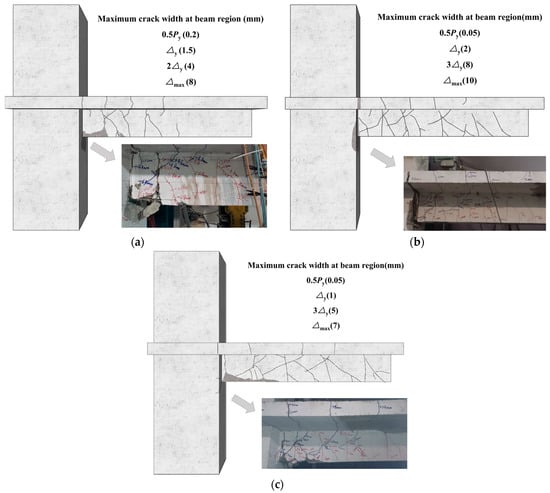
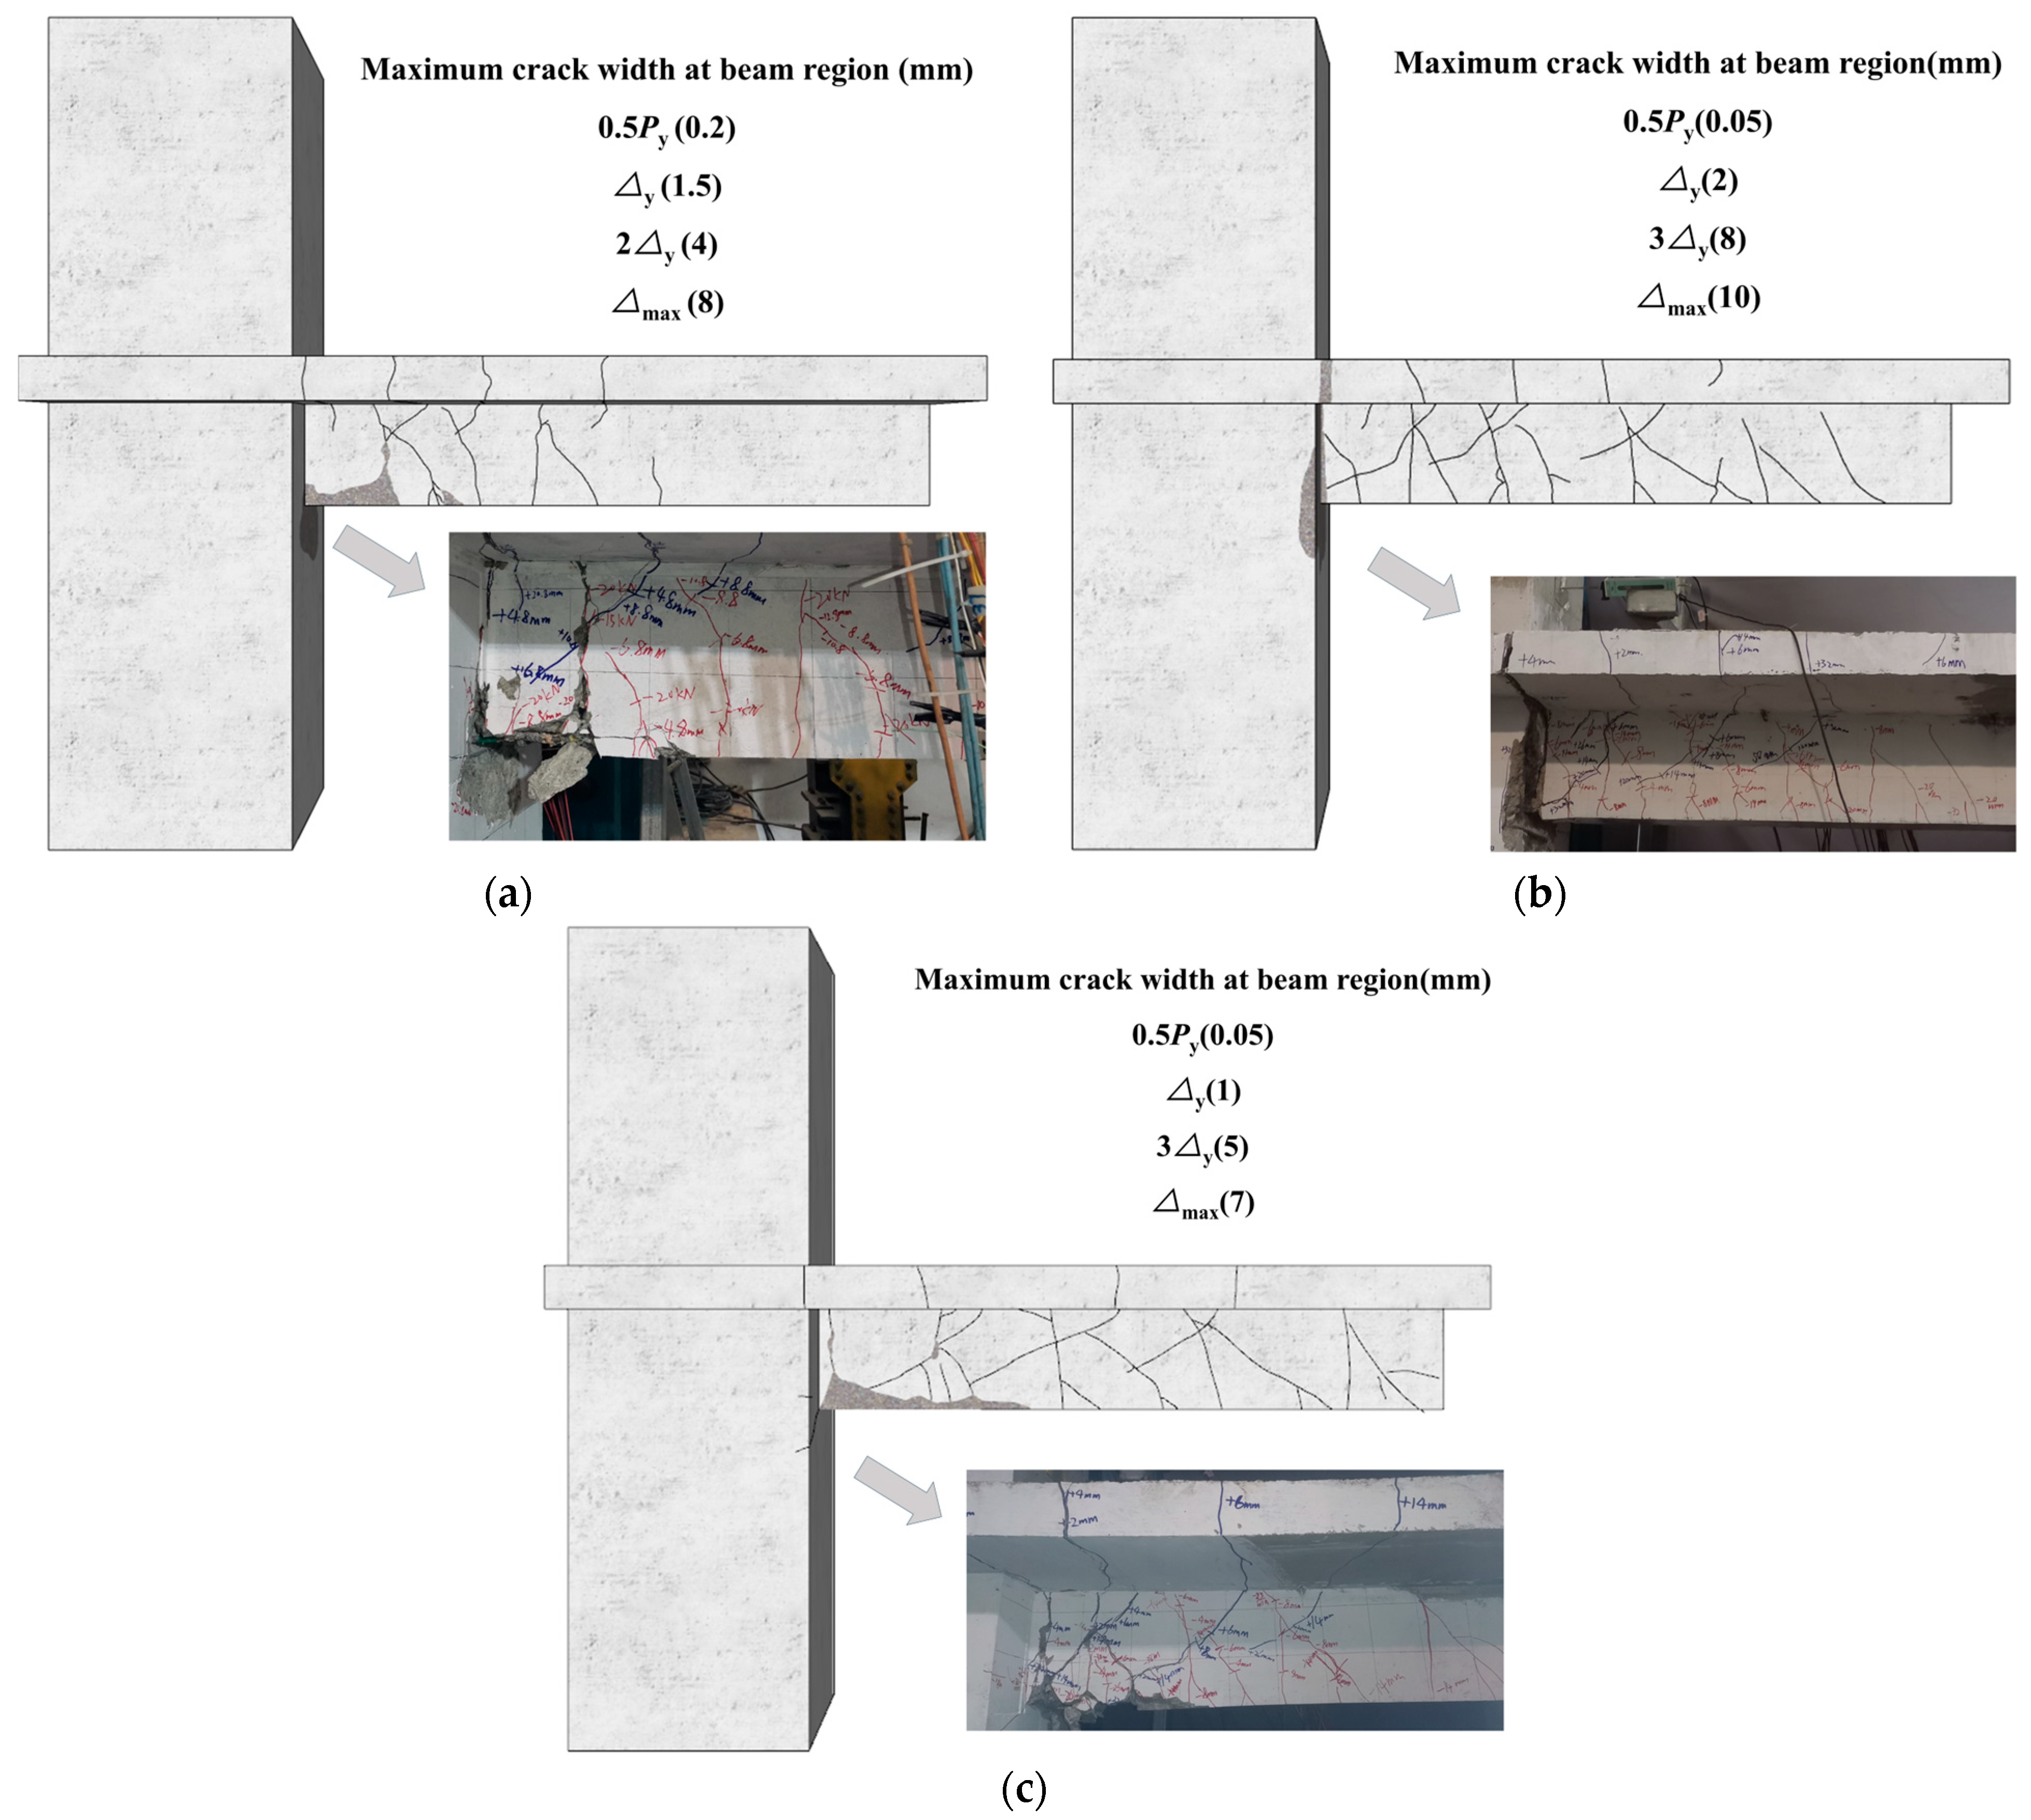
The ultimate failure modes of the specimens are illustrated in Figure 9. All the specimens exhibited a failure mode dominated by flexural-shear failure on the RC beam. The cracking development of each specimen was observed and recorded during the test.
Figure 9.
Ultimate failure modes for specimens. (a) J-1 (CBJC); (b) J-2 (LBJC); (c) J-3 (TWJC).
Specimen J-2 was taken as an example to describe the cyclic failure process. The RC beam under tension is defined as positive (+) and that under compression is defined as negative (−). When the load increased to −16 kN, a horizontal crack, with a width of 0.05 mm and a length of approximately 175 mm, was observed at the bottom surface of the beam, 140 mm from the beam–column interface. When the load increased to 23 kN, a tensile crack with a width of 0.05 mm appeared at the top surface of the beam, 200 mm from the interface. Concurrently, the strain of the BL bars reached 1000 με. When the load increased to 33 kN, several diagonal cracks appeared at both the top and bottom surfaces of the beam. These cracks initiated at the beam web and propagated toward the compressed zone. When the load increased to 54 kN, the primary tensile crack on the beam’s top surface increased to 2 mm, with diagonal cracks propagating to the bottom surface of the slab. The maximum strains in the positive and negative tensile of the BL bars were 2274 με and 2540 με, respectively. The maximum strain of the beam stirrups was 884 με. At this stage, the — hysteresis loop had turned, indicating yielding and the transition from loading-control to displacement-control. Existing cracks propagated under increasing displacement, with minimal new crack formation. The concrete spalling was initiated on the beam’s compression side. At the ultimate displacement , the concrete of the RC beam at the beam–column junction was significantly crushed, exposing the internal reinforcements. When the displacement increased to 54 mm, the load decreased to 55.1 kN, at which point the test was terminated. The failure modes of J-1 and J-3 were similar to that of J-2. Compared with the results of the authors’ previous studies, the damage to the RC beam under cyclic loading was more severe. This is attributed to the cumulative inelastic damage under repeated reversed loading and the quasi-brittle nature of concrete, which causes the beam to exhibit a more pronounced quasi-brittle failure pattern.
Although the reinforcement anchorage construction and the degree of restraint provided by the RC slab differed among the specimens, all specimens ultimately exhibited a similar failure mode, while the sequence of damage progression and the extent of local deterioration varied. Horizontal flexural cracks first developed on the RC beam adjacent to the column surface, followed by diagonal cracks before the BL bars yielded. These cracks interact, resulting in the formation of multiple flexural-shear cracks. After yielding of the BL bars, damage accumulated rapidly in the plastic hinge region, where crushing of the compression side concrete gradually exposed the BL bars, and yielding deformation of the beam stirrups was subsequently observed. This failure mode was mainly governed by the progressive deterioration of the plastic hinge region after yielding of the BL bars, which led to a decline in strength.
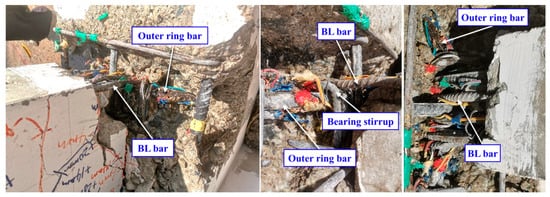
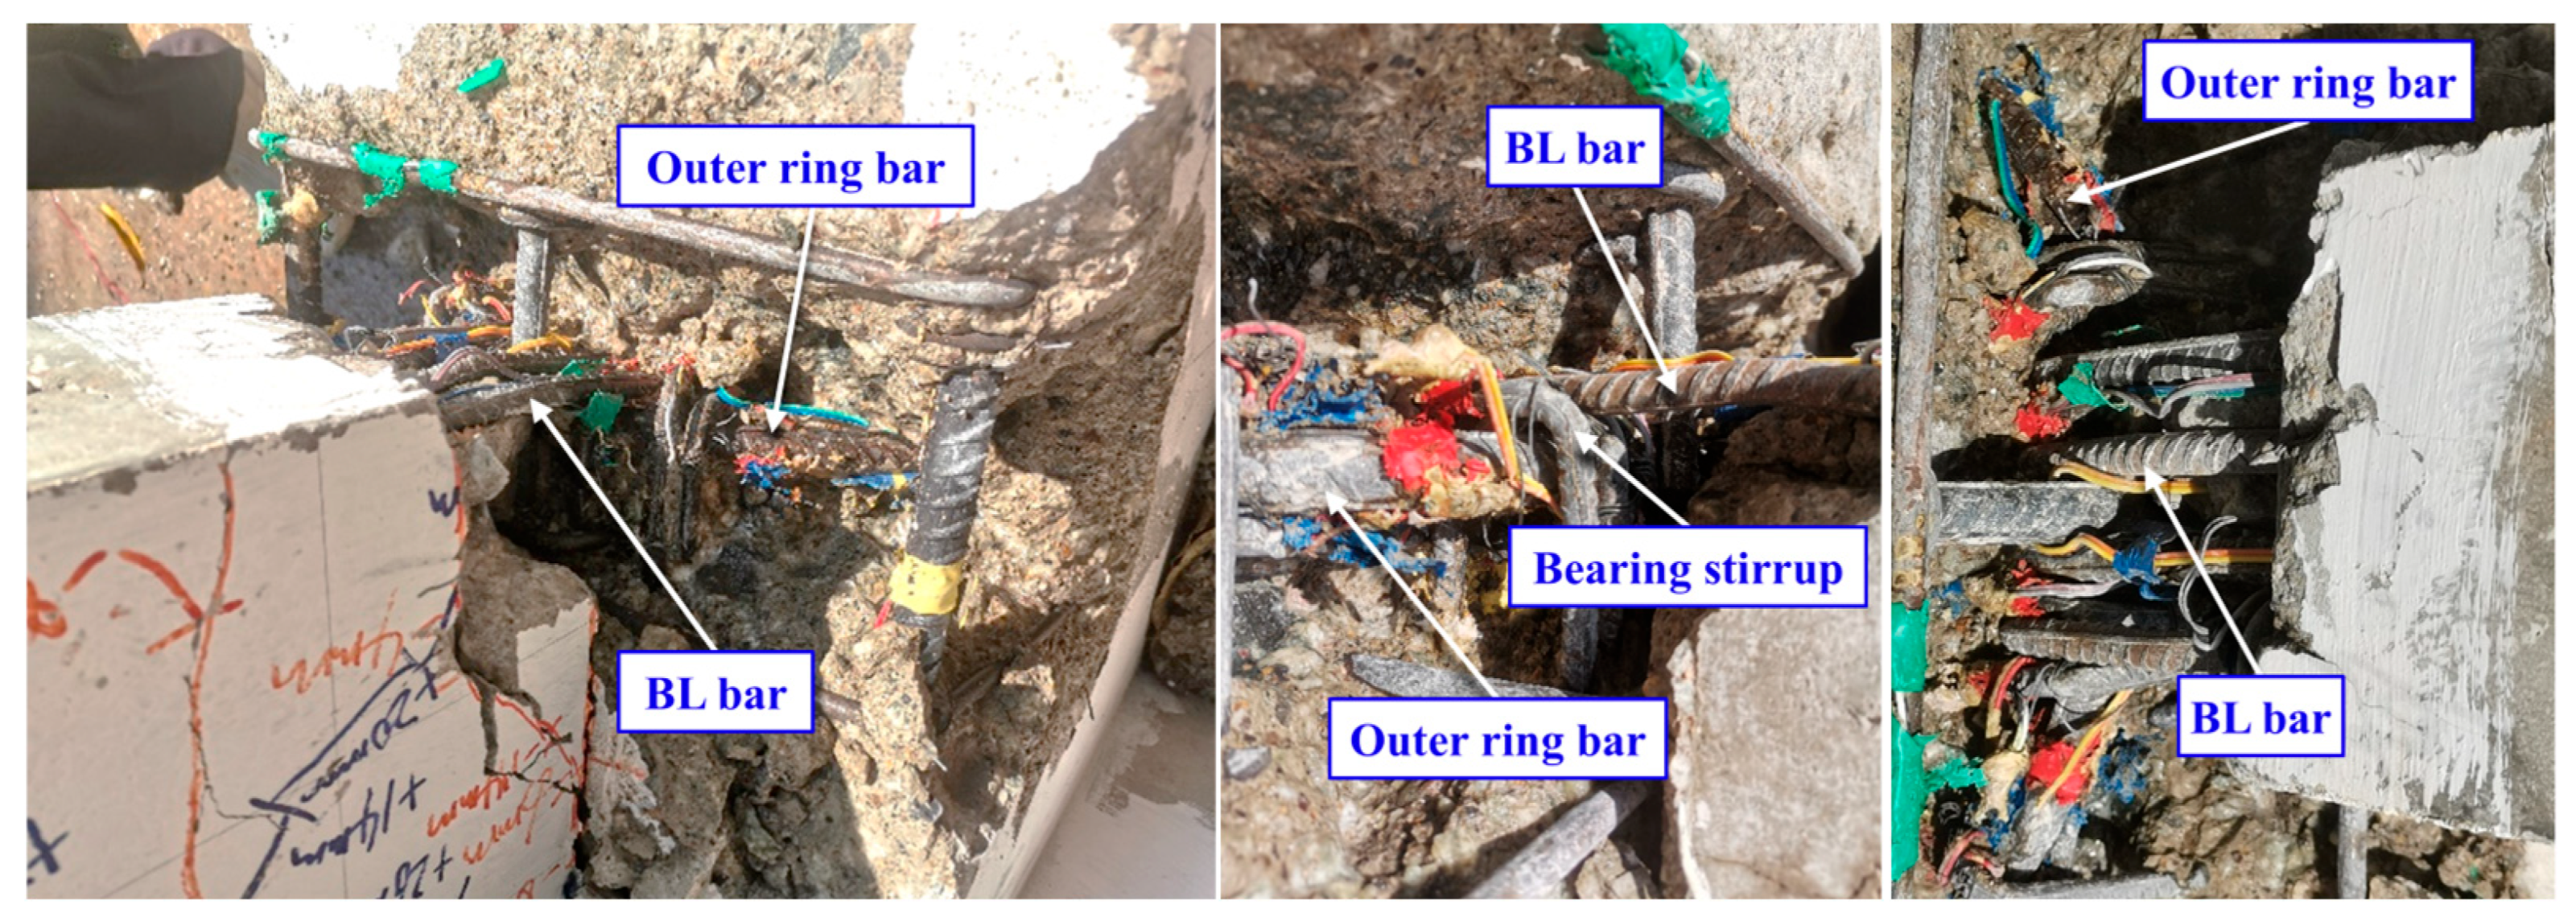
The external concrete in the joint area of specimen J-2 was chipped, and deformation of the bars in the joint area was observed. As shown in Figure 10, the BL bars and the outer ring bars remained interlocked together, and the BL bars in the plastic hinge region bulged outward because of tensile forces. There was no obvious deformation of the outer ring bars, which can maintain the characteristics of the circular rigid ring.
Figure 10.
Exposed view of the connection in J-2.
4.2. Hysteretic Behavior
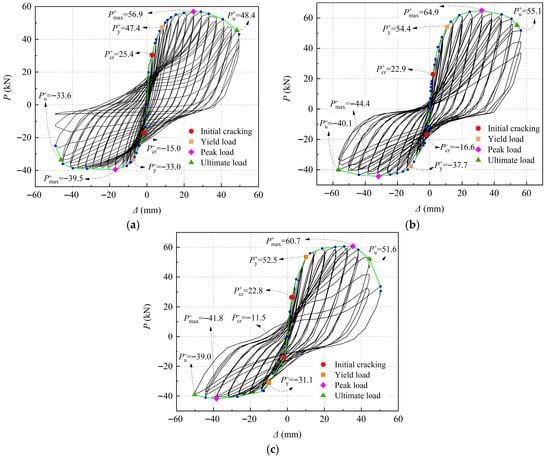
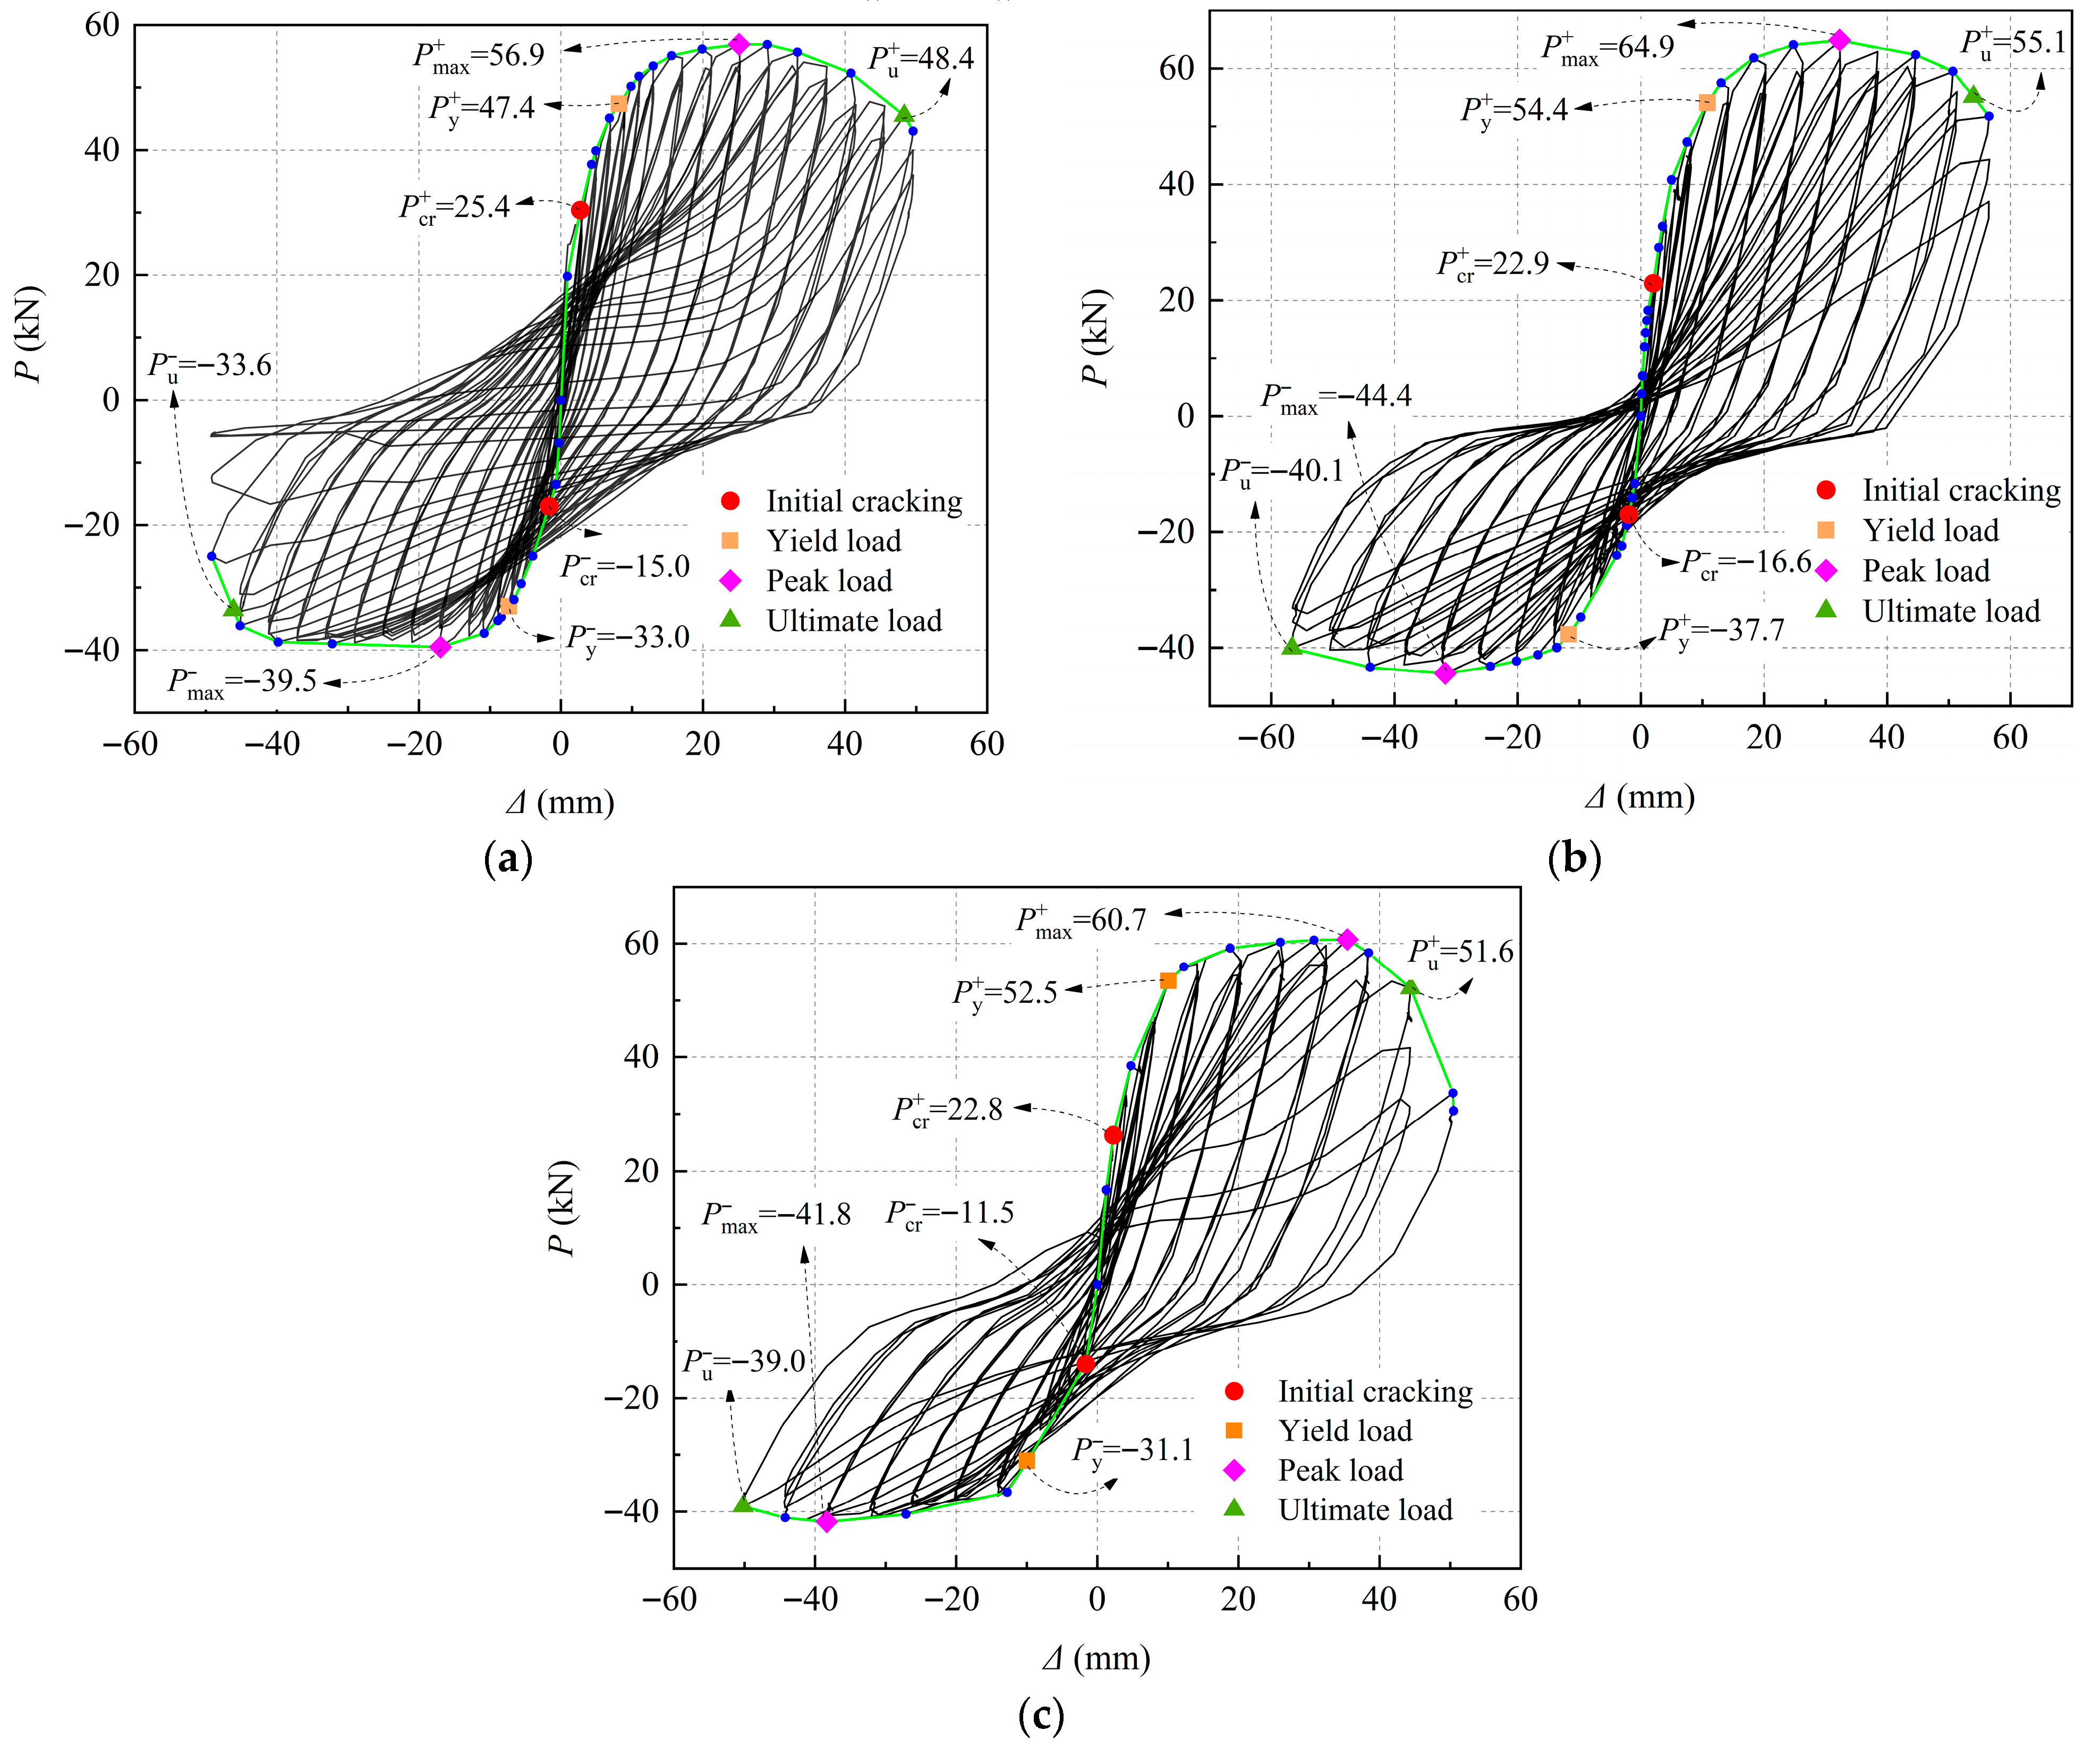
The hysteretic curves in Figure 11 reveal that all specimens responded almost linearly at initial stage of loading, with small hysteretic loop areas and limited energy dissipation. With the initiation and propagation of the concrete cracking, the specimen stiffness gradually deteriorated, resulting in increasingly curved hysteretic loops and the progressive accumulation of residual deformation after unloading. In the post-peak loading stage, further degradation of both strength and stiffness was observed, accompanied by varying degrees of pinching in the hysteresis response, which was primarily caused by bond slip between the reinforcement and the concrete [40]. The hysteresis loop of specimen J-1 was fuller, with a bow-shaped profile. Compared with specimens J-1, J-2 and J-3 exhibited pinched S-shaped hysteresis loops, indicating a reduced energy dissipation capacity. This contrasts with the superior performance of the CBJC.
Figure 11.
Hysteresis curves of specimens. (a) J-1 (CBJC); (b) J-2 (LBJC); (c) J-3 (TWJC).
4.3. Skeleton Curves
The yield load and the yield displacement for each skeleton curve were determined via an equivalent elastoplastic energy method [41]. The ultimate load and ultimate displacement were defined as the load and displacement at specimen failure or test termination, respectively. When the first crack appeared in the RC beam, the cracking load and cracking displacement were recorded. The peak load and corresponding displacement represented the maximum values observed during testing. The characteristic loads and displacements of all the specimens are shown in Table 4.
Table 4.
Characteristic loads and displacements of the specimens.
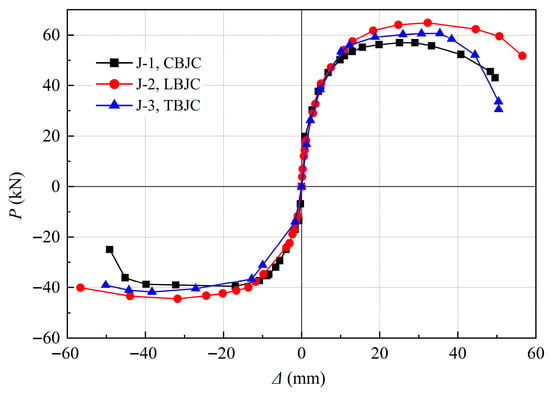
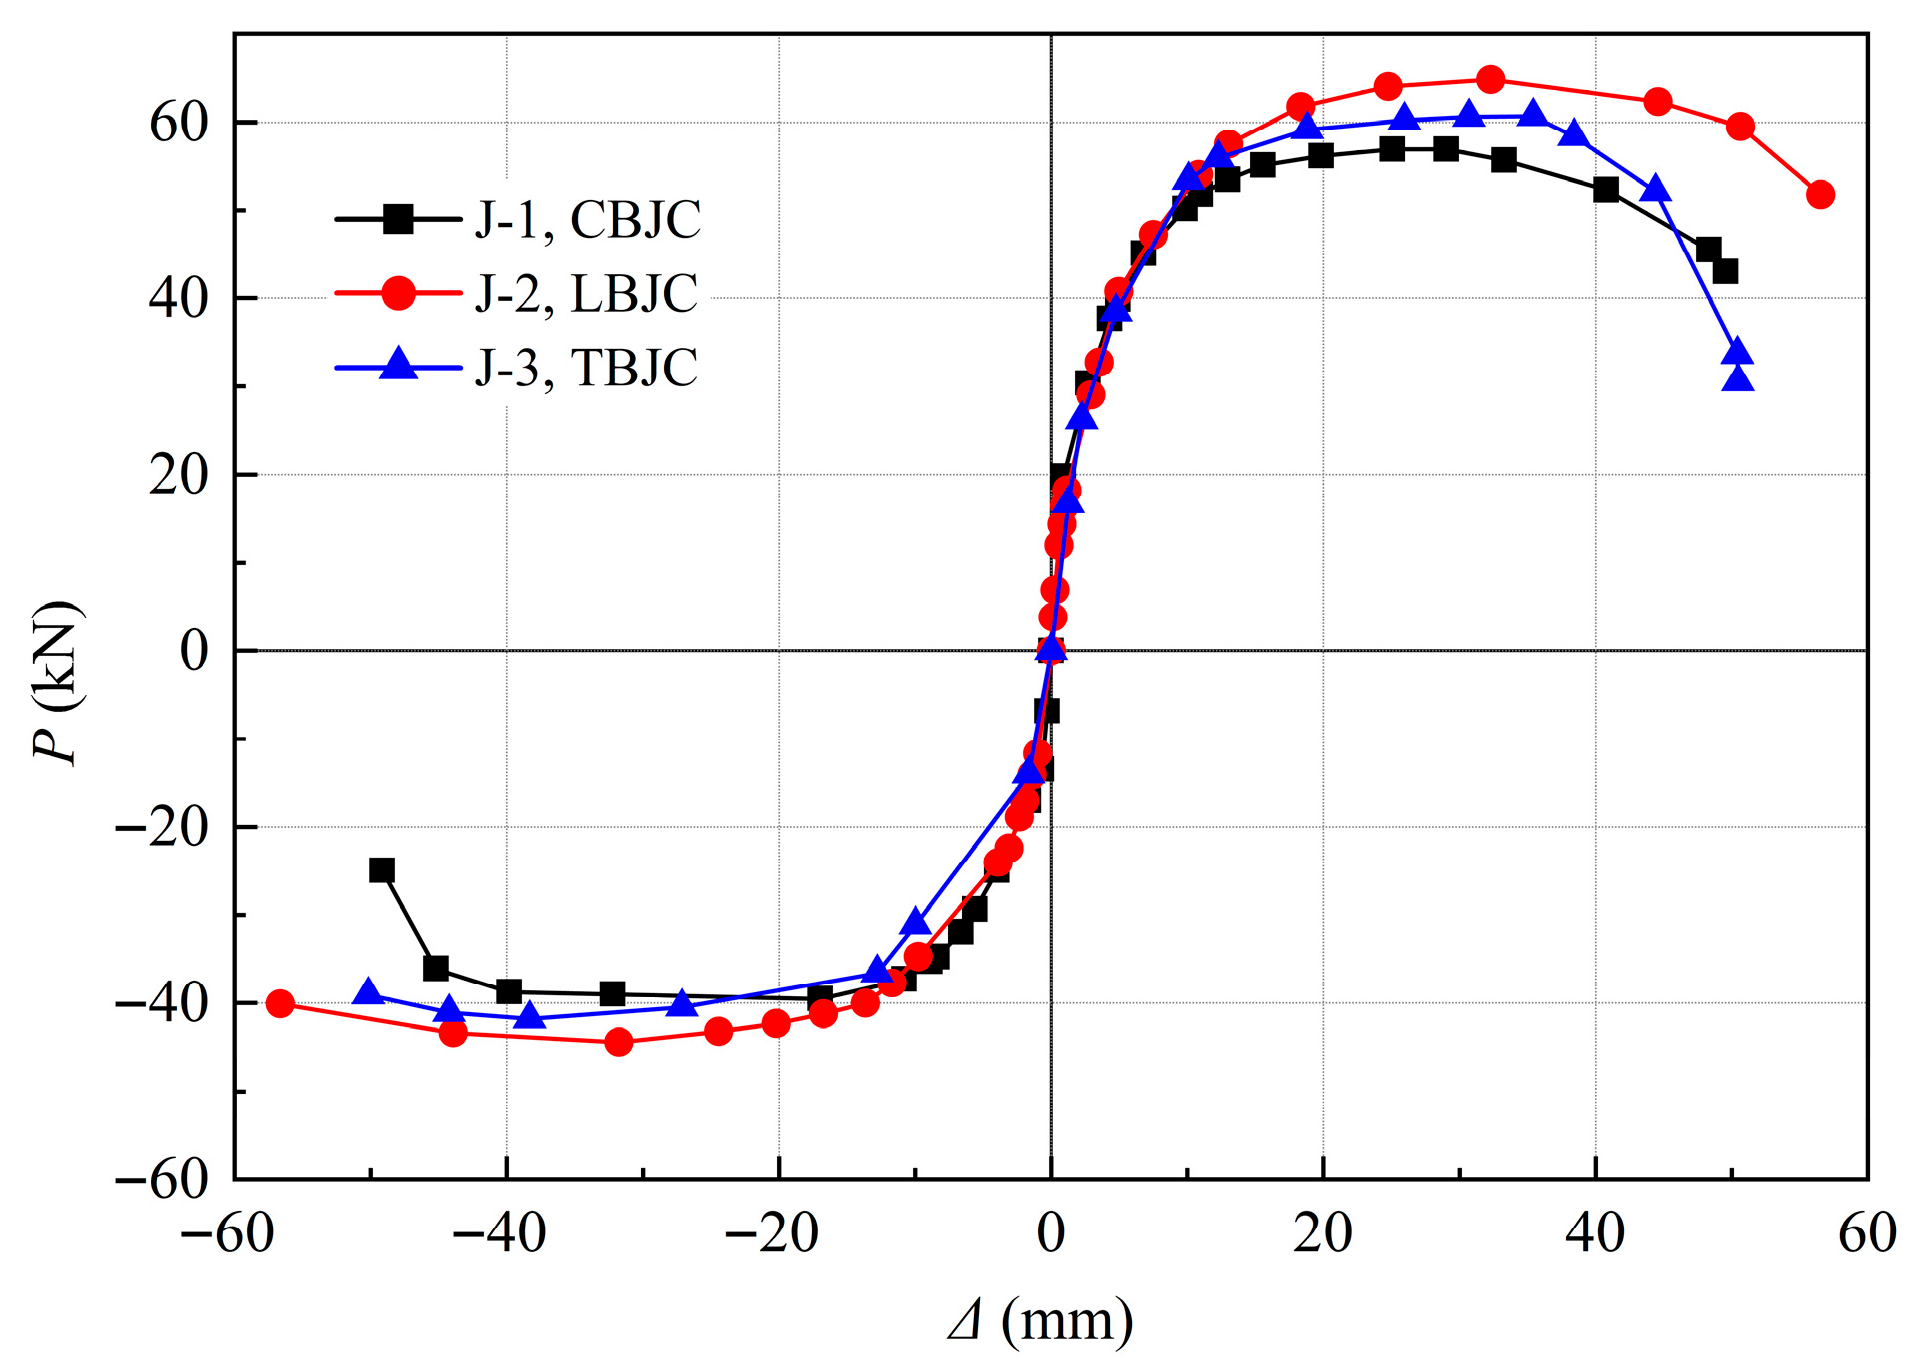
Figure 12 shows the skeleton curves of all three specimens, which are typical four-stage characteristics, namely, the elastic stage, yield stage, hardening stage, and failure stage, which are consistent with the ductile failure pattern of properly reinforced concrete beams. During initial loading, all specimens demonstrated comparable stiffnesses. As loading progressed into the hardening stage, crack propagation in the beam led to stiffness degradation, which was accompanied by plastic deformation accumulation and strength enhancement. After the peak load, all specimens exhibited significant strength reduction and stiffness degradation. Comparative analysis indicated that the strength on the RC slab side exceeds that on the non-RC slab side, demonstrating that RC slabs acting as flanges can effectively increase the strength. A comparison of the results of specimens J-1 to J-3 revealed that the different reinforcement anchorage constructions did not significantly affect the skeleton curve, ultimate strength or initial stiffness.
Figure 12.
Skeleton curve of specimens.
The anchorage performance of the BL bars is the primary factor governing the reliability and safety of the proposed reinforcement anchorage construction, particularly in the TWJC specimens. When the BL bars detach from the ring bars under loading, the BL bars are no longer effectively anchored and cannot provide support under loading. This detachment manifests as a sudden load drop in the skeleton curve before the BL bars yield. The skeleton curves of all specimens did not exhibit a sudden load drop during loading. Thus, the three reinforcement anchorage constructions were capable of achieving secure anchoring.
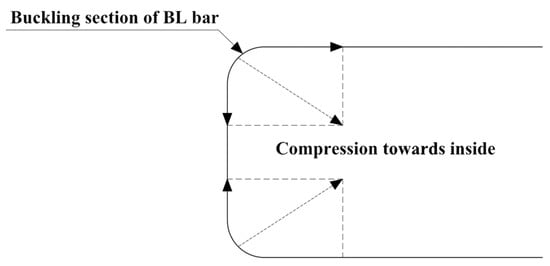
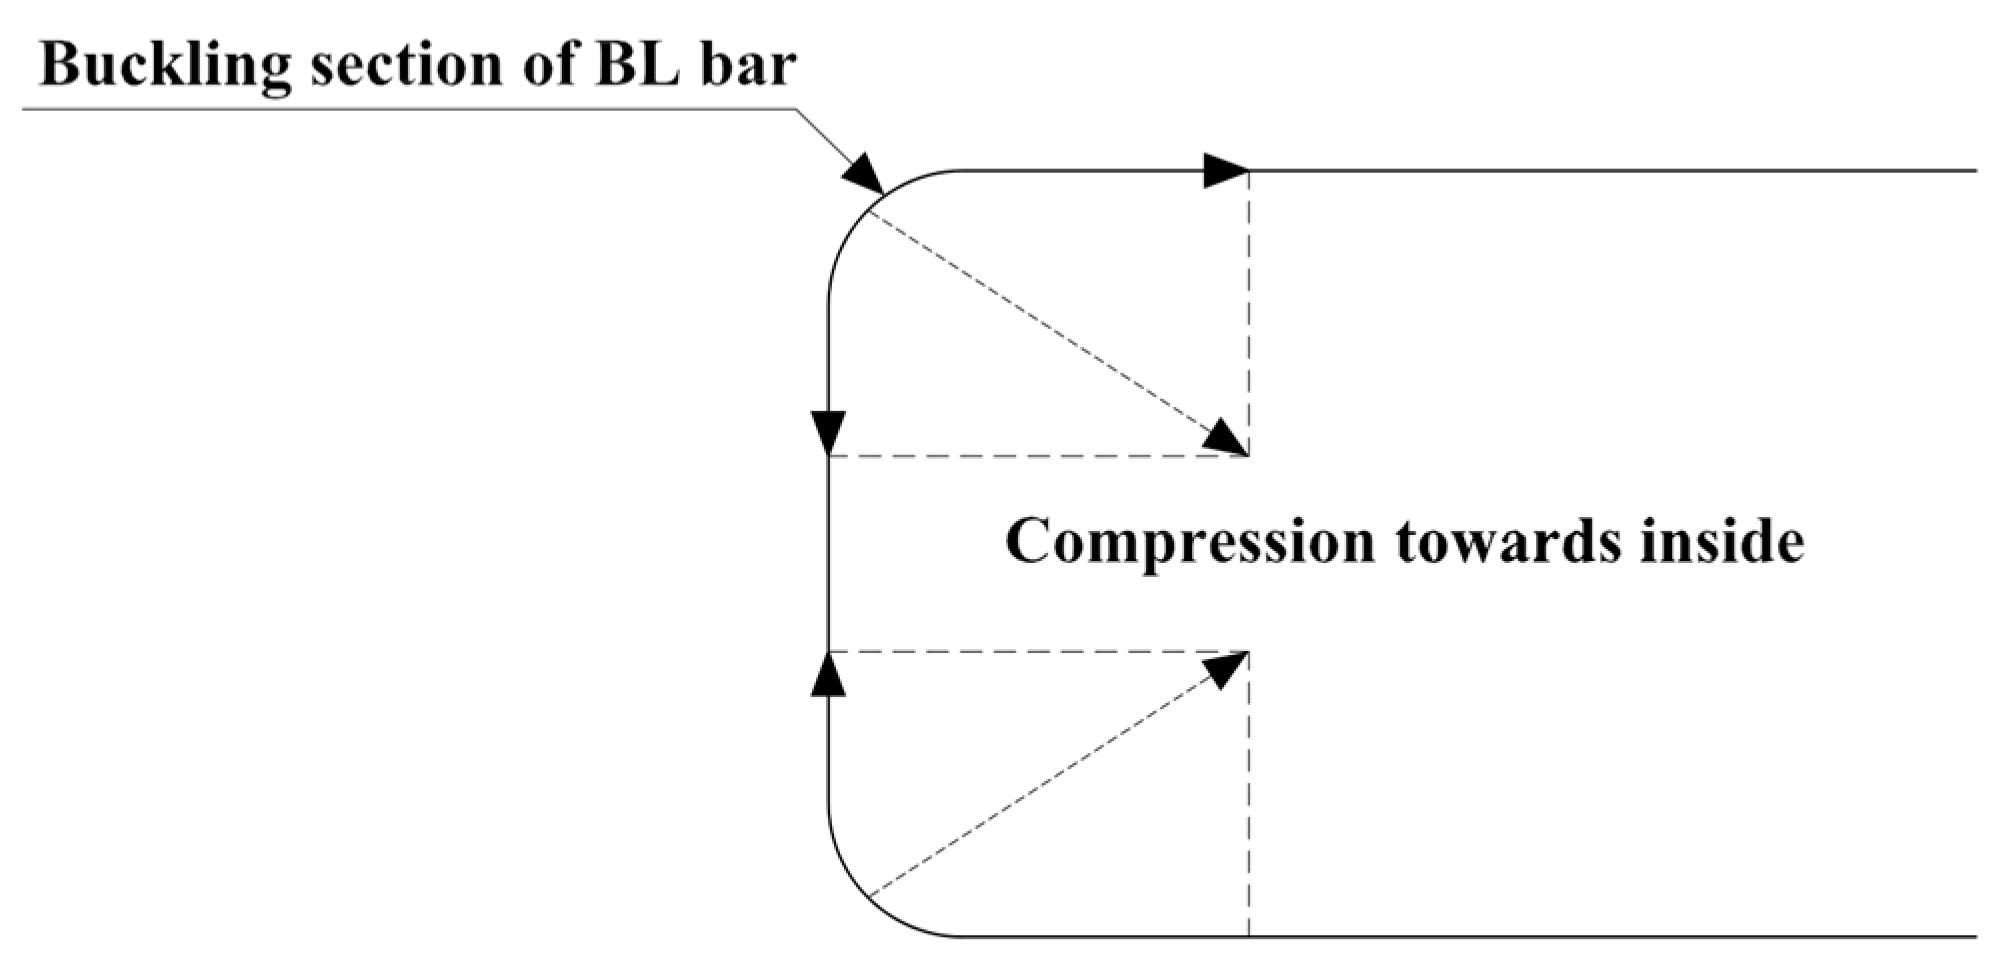
The buckling construction of each CBJC and LBJC specimen can lead to compression of the arc sections of the BL bar in two perpendicular directions, as shown in Figure 13. This compression, which is directed toward the inside of the RC beam, reduces the effective length of the force arm, resulting in a decrease in the strength of the specimen [42]. Consequently, the specimen may fail at the beam–column junction before reaching the peak load. This failure mechanism does not occur in the TWJC specimens. A comparison of the results of specimens J-1 to J-3 revealed that the skeleton curves tended to coincide. The load change patterns of the CBJC and LBJC specimens were approximately similar to those of the TWJC specimens during the whole stage, indicating that the failure mode of the CBJC and LBJC specimens did not occur through the aforementioned failure mechanism.
Figure 13.
Possible deformation of the arc sections of the BL rebars in CBJC and LBJC specimens.
4.4. Rotation and Ductility
The displacement ductility coefficient of a specimen is defined as the ratio of to . The values of the ductility coefficient listed in Table 5 range from 4.56 to 6.31, and the average values range from 4.74 to 5.93, indicating that all specimens satisfied the ductility requirements for seismic structures stipulated in China’s Code [36]. For specimens J-1 to J-3, the values for the positive and negative segments were 4.99 and 5.4 with and without the RC slab, respectively, indicating that the ductility of the RC slab can be affected. Specifically, the RC slab as the beam flange increases the concrete area of the compression zone during negative loading, and the neutral axis of the cross-section is closer to the compression zone, resulting in better ductility at the negative segment.
Table 5.
Ductility coefficient and rotation angle.
Given the minimal column rotation, the rotation angle can be taken as . Similarly, the rotation angles of the characteristic points for each specimen are listed in Table 5. China’s Code [36] stipulates the rotation requirement for concrete building structures, with limits of an allowable elastic drift angle [] = 1/550 and an elastic–plastic drift angle [] = 1/50. The measured yield rotation angles of the HRB joints in the present tests were within the range of 1/208–1/76, and the measured ultimate rotation angles ranged from 1/34 to 1/25. The results suggested that the HRB joint possessed exceptional deformation capacity and ductility. Additionally, the joint can meet the requirements of the code, which is suitable for buildings in earthquake-prone regions.
4.5. Stiffness Degradation
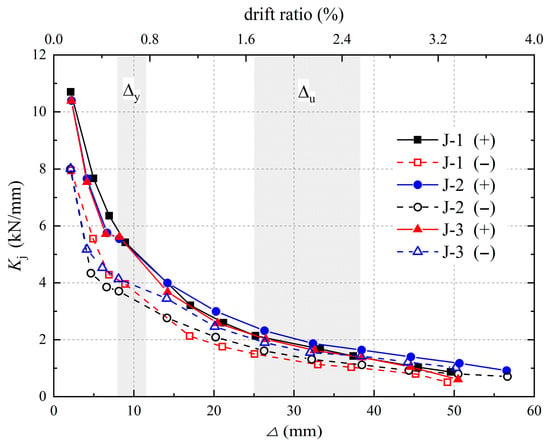
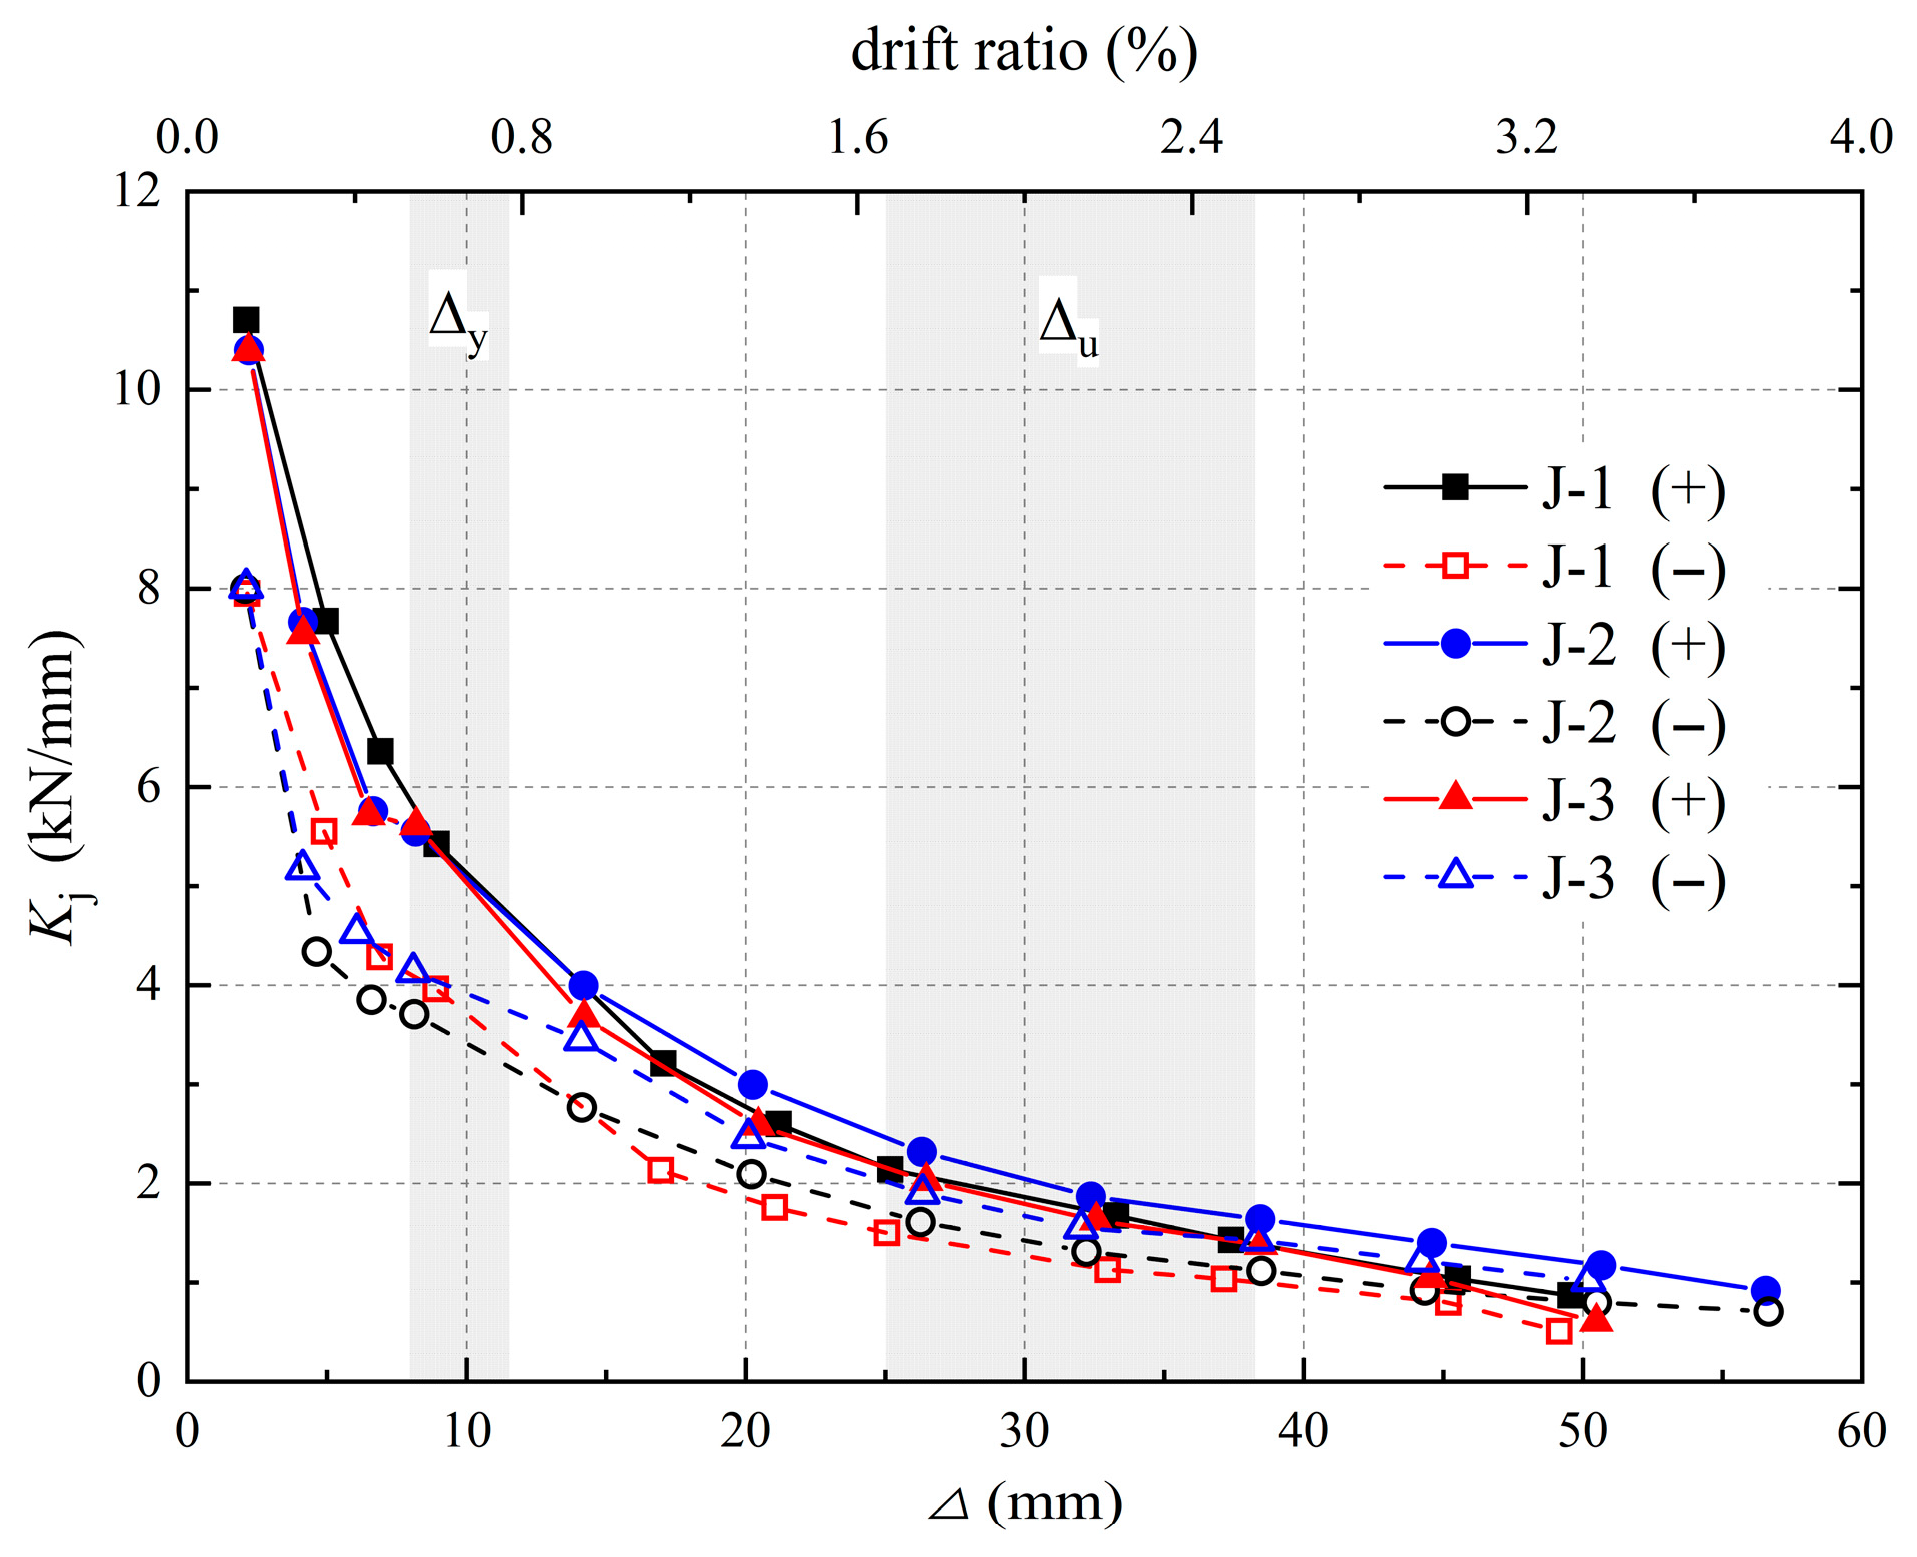
During the hysteresis test, the joint specimens exhibited a gradual reduction in stiffness with increasing displacement. Secant stiffness was adopted to compare the degree of stiffness degradation. The relationship between and is shown in Figure 14. During the initial loading stage, the initial stiffness of the side with the RC slab was approximately 11 kN/mm, whereas the side without the RC slab exhibited a stiffness of 8 kN/mm, indicating an increase in initial stiffness due to the RC slab. The stiffness degradation trends of the specimens were nearly identical. Before the specimens yielded, the stiffness of each specimen decreased as the displacement of the beam end increased because of cracking and crushing of the concrete. After the specimens yielded, the rate of stiffness degradation slowed. The stiffness values in the positive and negative loading directions were nearly identical at ultimate failure, confirming that the RC slab and beams were almost completely damaged, with the RC slab no longer contributing additional stiffness. Comparative analysis revealed that specimens with the RC slab exhibited more pronounced stiffness degradation, but the influence of joint detailing on the degradation patterns was insignificant. Notably, despite the sequential occurrence of concrete cracking, crushing, and reinforcement yielding under cyclic loading, all specimens demonstrated stable stiffness degradation behavior.
Figure 14.
Stiffness degradation of specimens.
4.6. Energy Dissipation
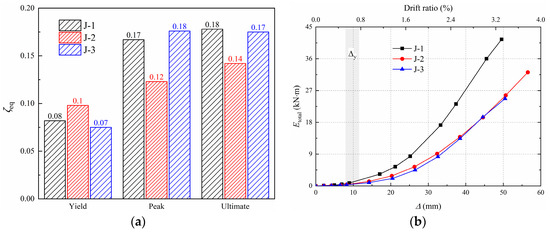
The equivalent viscous damping coefficient is suggested to determine the energy dissipation capacity. Figure 15a shows the values of where the yield load, peak load and ultimate load were reached. The values of for all the sample joints range from 0.123 to 0.176 at the peak load, with an average value of 0.155. These results indicate that the proposed HRB joints exhibited good energy dissipation capacity.
Figure 15.
Energy dissipation of specimens. (a) Equivalent viscous damping coefficient at each stage; (b) cumulative energy dissipation.
The cumulative energy dissipation is calculated by summing the energy dissipation in the previous cycle. The relationships between and for the specimens are shown in Figure 15b. increased with increasing displacement, and the values were the same at the initial stage of loading. After the specimens yielded, the significantly differed. Specimen J-1 exhibited the best energy dissipation capacity because of the high integrity of the BL bars, and was greatest at the same displacement level.
4.7. Strain Analysis
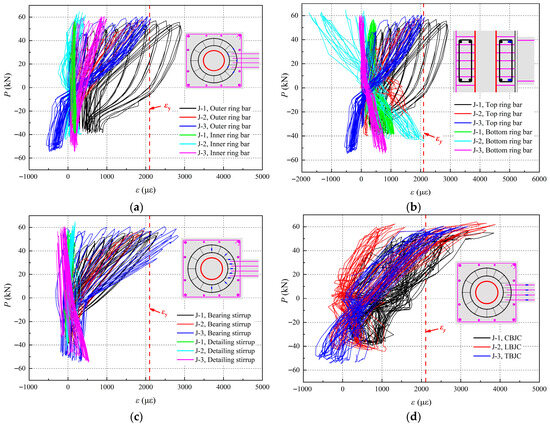
Figure 16 presents the measured strain variations in which a positive value represents tensile strain and a negative value represents compressive strain.
Figure 16.
Strain variations in rebars. (a) Strain variations in the outer and inner ring bars; (b) strain variations in the top and bottom ring bars; (c) strain variations in the HRB stirrups; (d) strain variations in the BL rebars.
Figure 16a shows that the strain of the outer ring bars is always higher than that of the inner ring bars during loading. When the loading was , the strain of the top ring bars exceeded that of the bottom ring bars. This is because of the higher load on the segment with the RC slab. As shown in Figure 16a–c, the load () versus strain () hysteresis loops of the ring bars and the bearing stirrups were full. The magnitude of the strain under compression was much lower. The findings suggest that the BL bars can transmit force to the ring bars relatively well under tension but can detach from the ring bars under compression and cannot transmit force. Conversely, the - hysteresis loops of the detailing stirrups were narrow under tension or compression and hardly participated in load transfer. An analysis of the strain variation revealed that the strain variation in the ring bars and the bearing stirrups always lagged behind that of the BL bars. The load transfer mechanism of the HRB joint was predicted as follows: the BL bars transferred the tensile force at the beam end to the reinforcement skeleton of the HRB, which then transfers the load to the ST-RC composite column.
5. Finite Element Modeling
5.1. Establishment and Validation of Finite Element Analysis
The finite element analysis in this study is developed using ABAQUS. The elastic–plastic model and concrete damage plastic model are applied to the steel and concrete materials in the FEA model, respectively. In terms of element type and mesh discretization, the concrete, steel tube and reinforcement are simulated by eight-node brick elements, four-node shell elements, and two-node truss elements, respectively, with typical mesh sizes of 50 mm for the concrete, 50 mm for the steel tube and 30 mm for the reinforcement.
The uniaxial behavior of the steel tube and reinforcement was defined by an ideal elastic–plastic constitutive model, while the concrete stress–strain relationship followed the model of An et al. [43], and the CDP parameters used to capture tensile and compressive damage are listed in Table 6 [44]. The “Spring2” interaction was adopted for the concrete and reinforcement, with normal and tangential springs simulating concrete the compression and grip of the concrete, whereas longitudinal springs were used to represent the bond–slip behavior based on the bond stress–slip constitutive relationship in Appendix C of the China’s Code GB50010-2010 (GB 50010) [34]. Interactions among the components were modeled by “surface to surface”. In the normal direction, hard contact was adopted, whereas tangential behavior was described using a penalty friction formulation with a Coulomb friction coefficient of 0.6 for the steel and concrete interface.
Table 6.
Parameter values of the CDP model in ABAQUS.
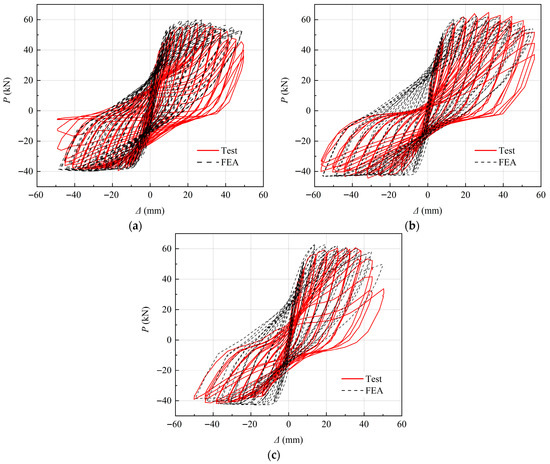
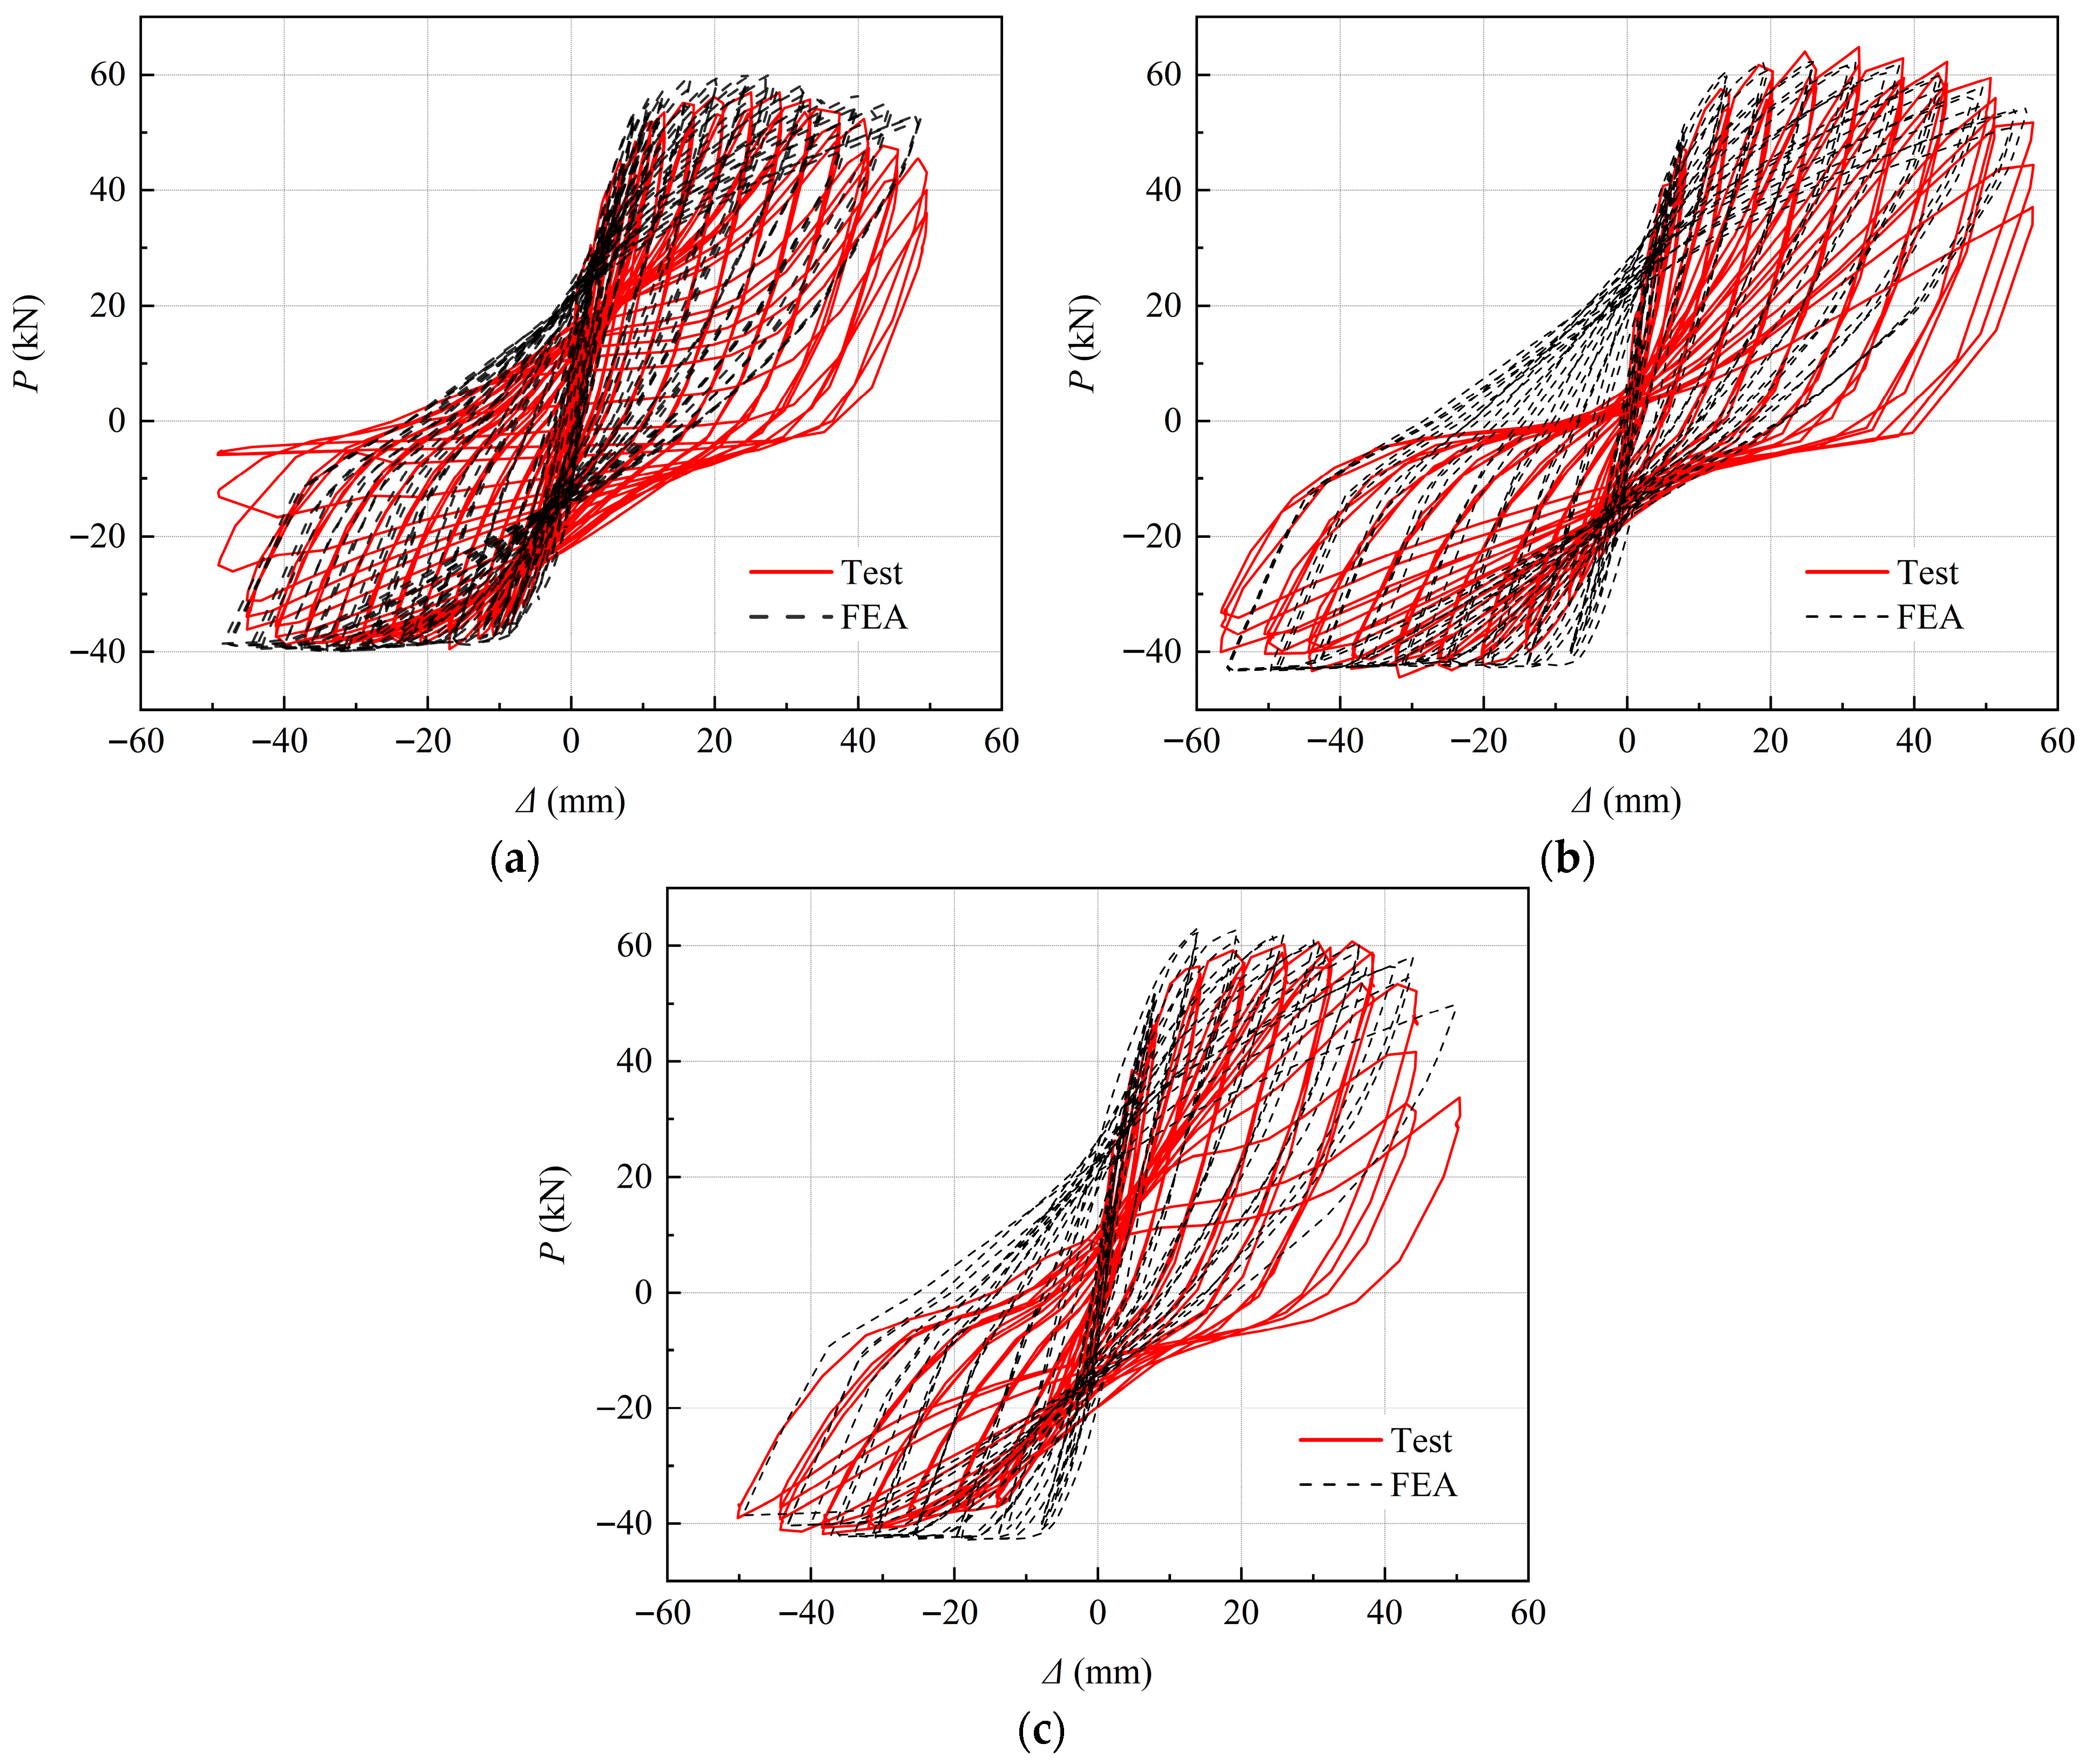
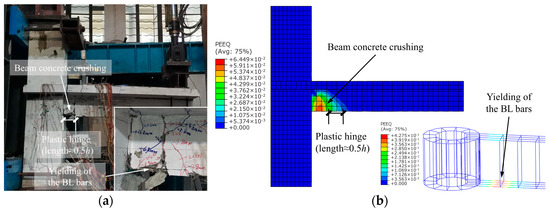
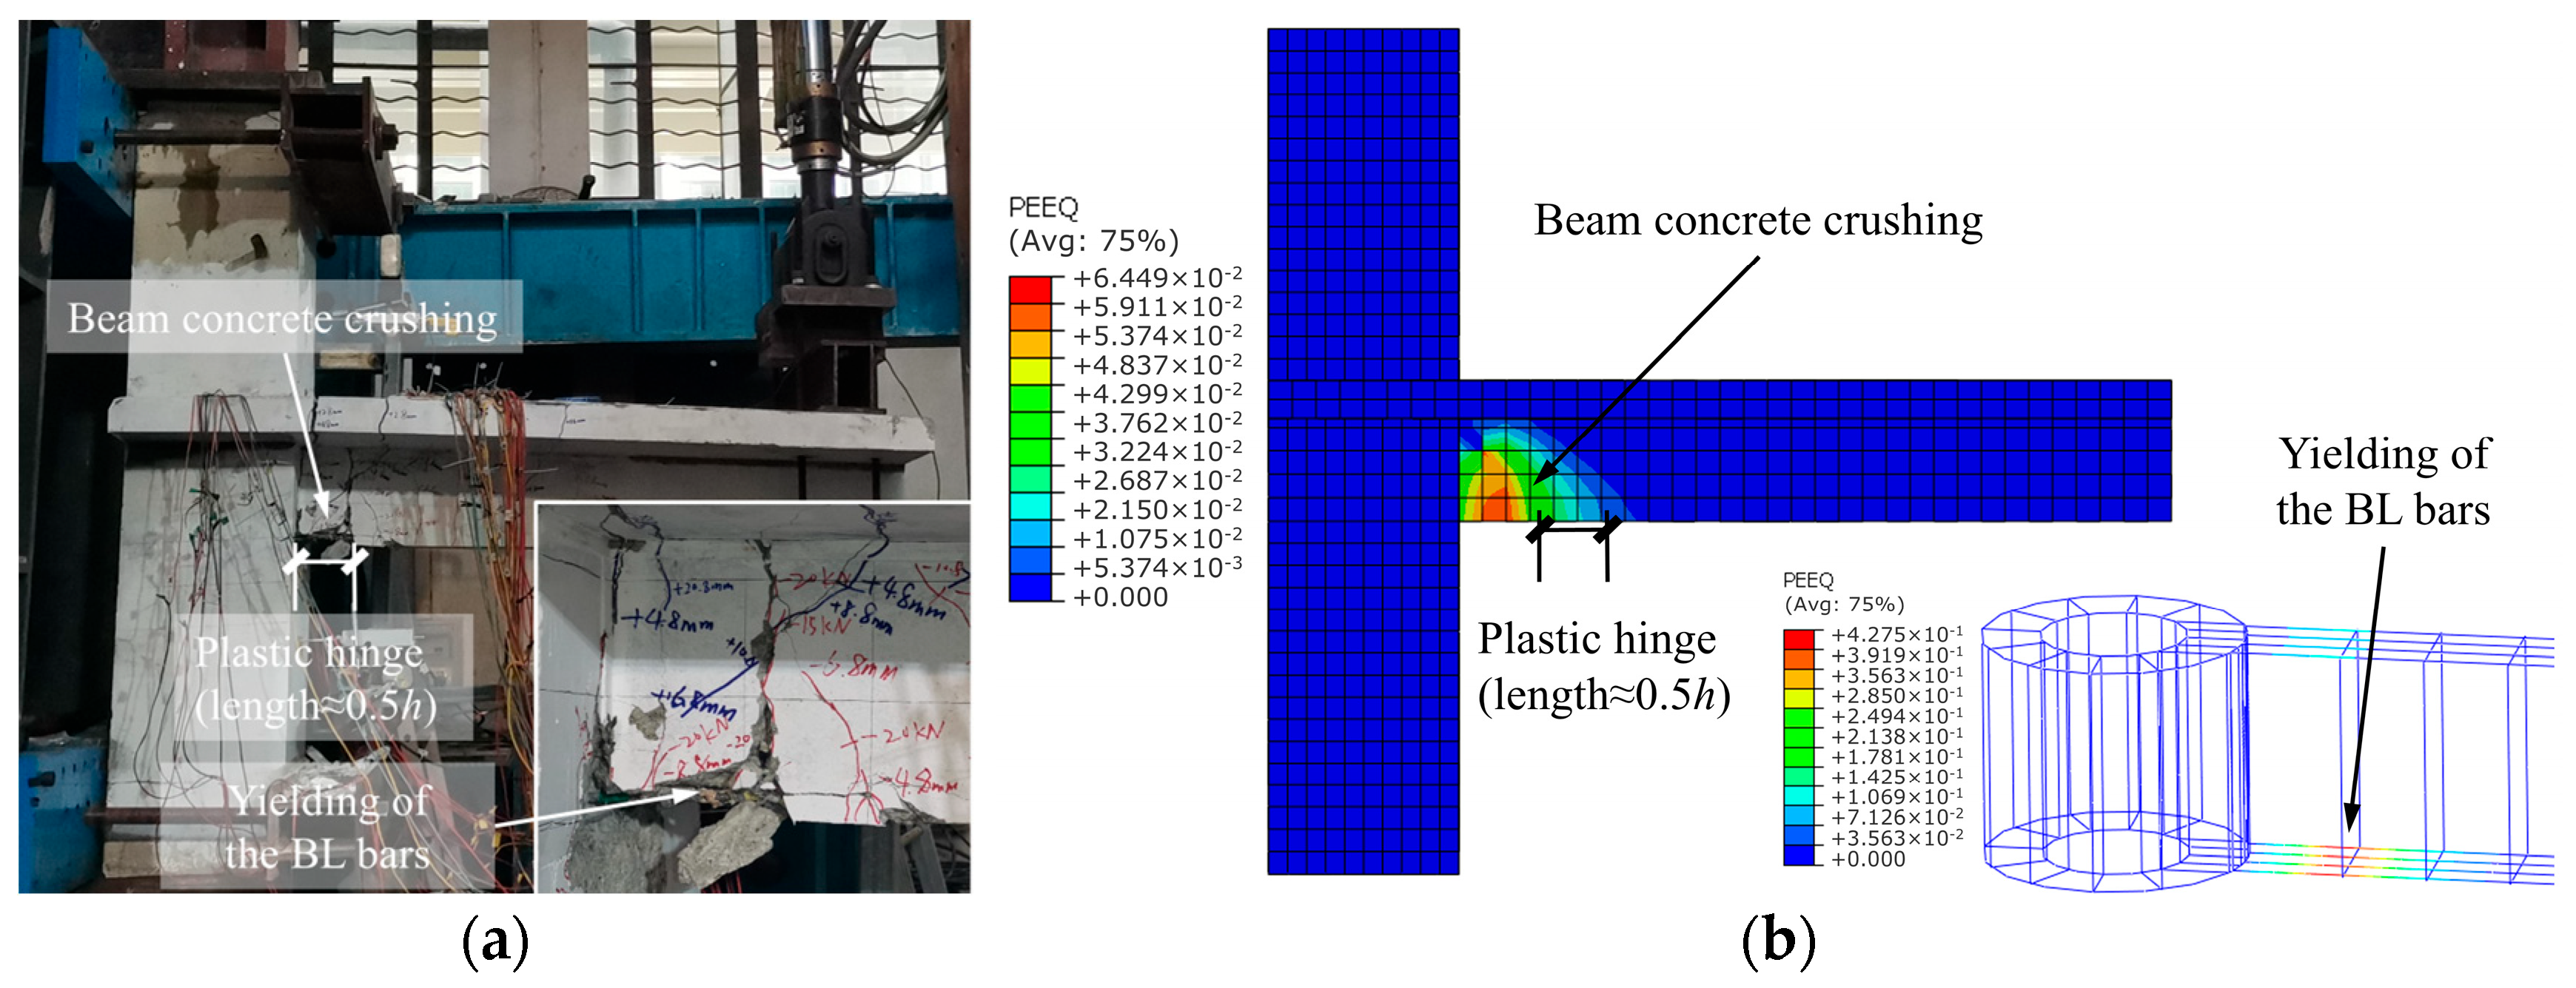
The results of the FEA are compared with the experimental results to verify its reliability. Figure 17 shows a comparison of the hysteretic curves for the joint specimens, and the measured and predicted maximum strengths are listed in Table 7, indicating that the FEA curves coincide well with the test hysteretic curves, with prediction errors of the joint strength not exceeding 6.0%. The failure mode predicted is consistent with that observed in the test, as shown in Figure 18. Therefore, the finite element model can be used to analyze the mechanical behavior of the ST-RC composite column-HRB joint.
Figure 17.
Comparison of hysteretic curves. (a) J-1 (CBJC); (b) J-2 (LBJC); (c) J-3 (TWJC).
Table 7.
Comparison of the maximum strength.
Figure 18.
Validation of the failure modes. (a) The observed failure mode; (b) the predicted failure mode.
5.2. Parametric Analysis
Standard models of ST-RC composite column-HRB joints are selected for parametric analysis. The details of the standard models are listed in Table 8, with the member dimensions consistent with those of the actual experimental tests. Four key parameters—the ring–longitudinal ratio (the ratio of the ring bars to the BL bars), the diameter of the bearing stirrups, the RC slab and the axial load ratio—are examined for their effects on the joint strength and failure modes. The variations in the parameters are presented in Table 9.
Table 8.
Details of the standard model.
Table 9.
Variations in parameters.
5.2.1. The Ring–Longitudinal Ratio
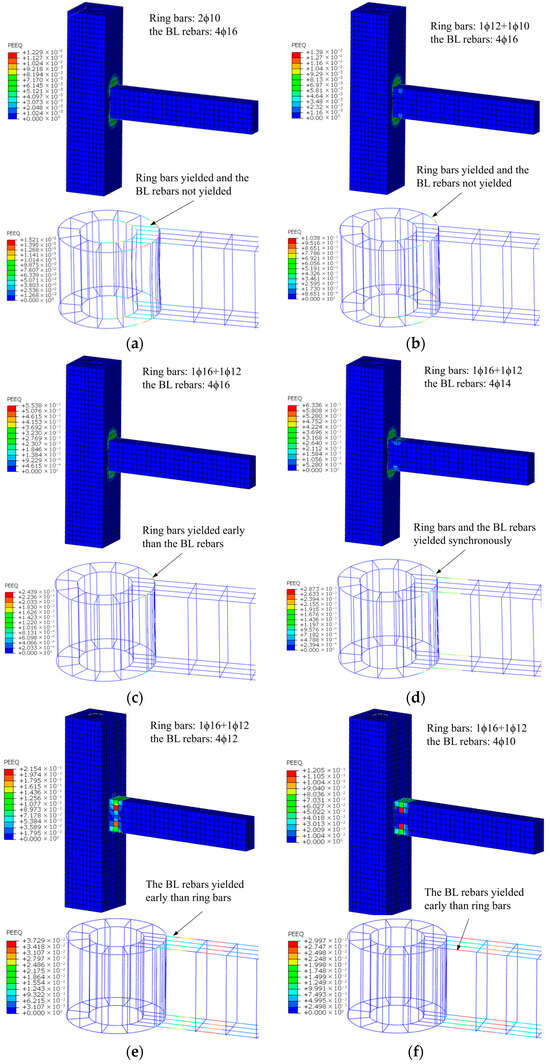
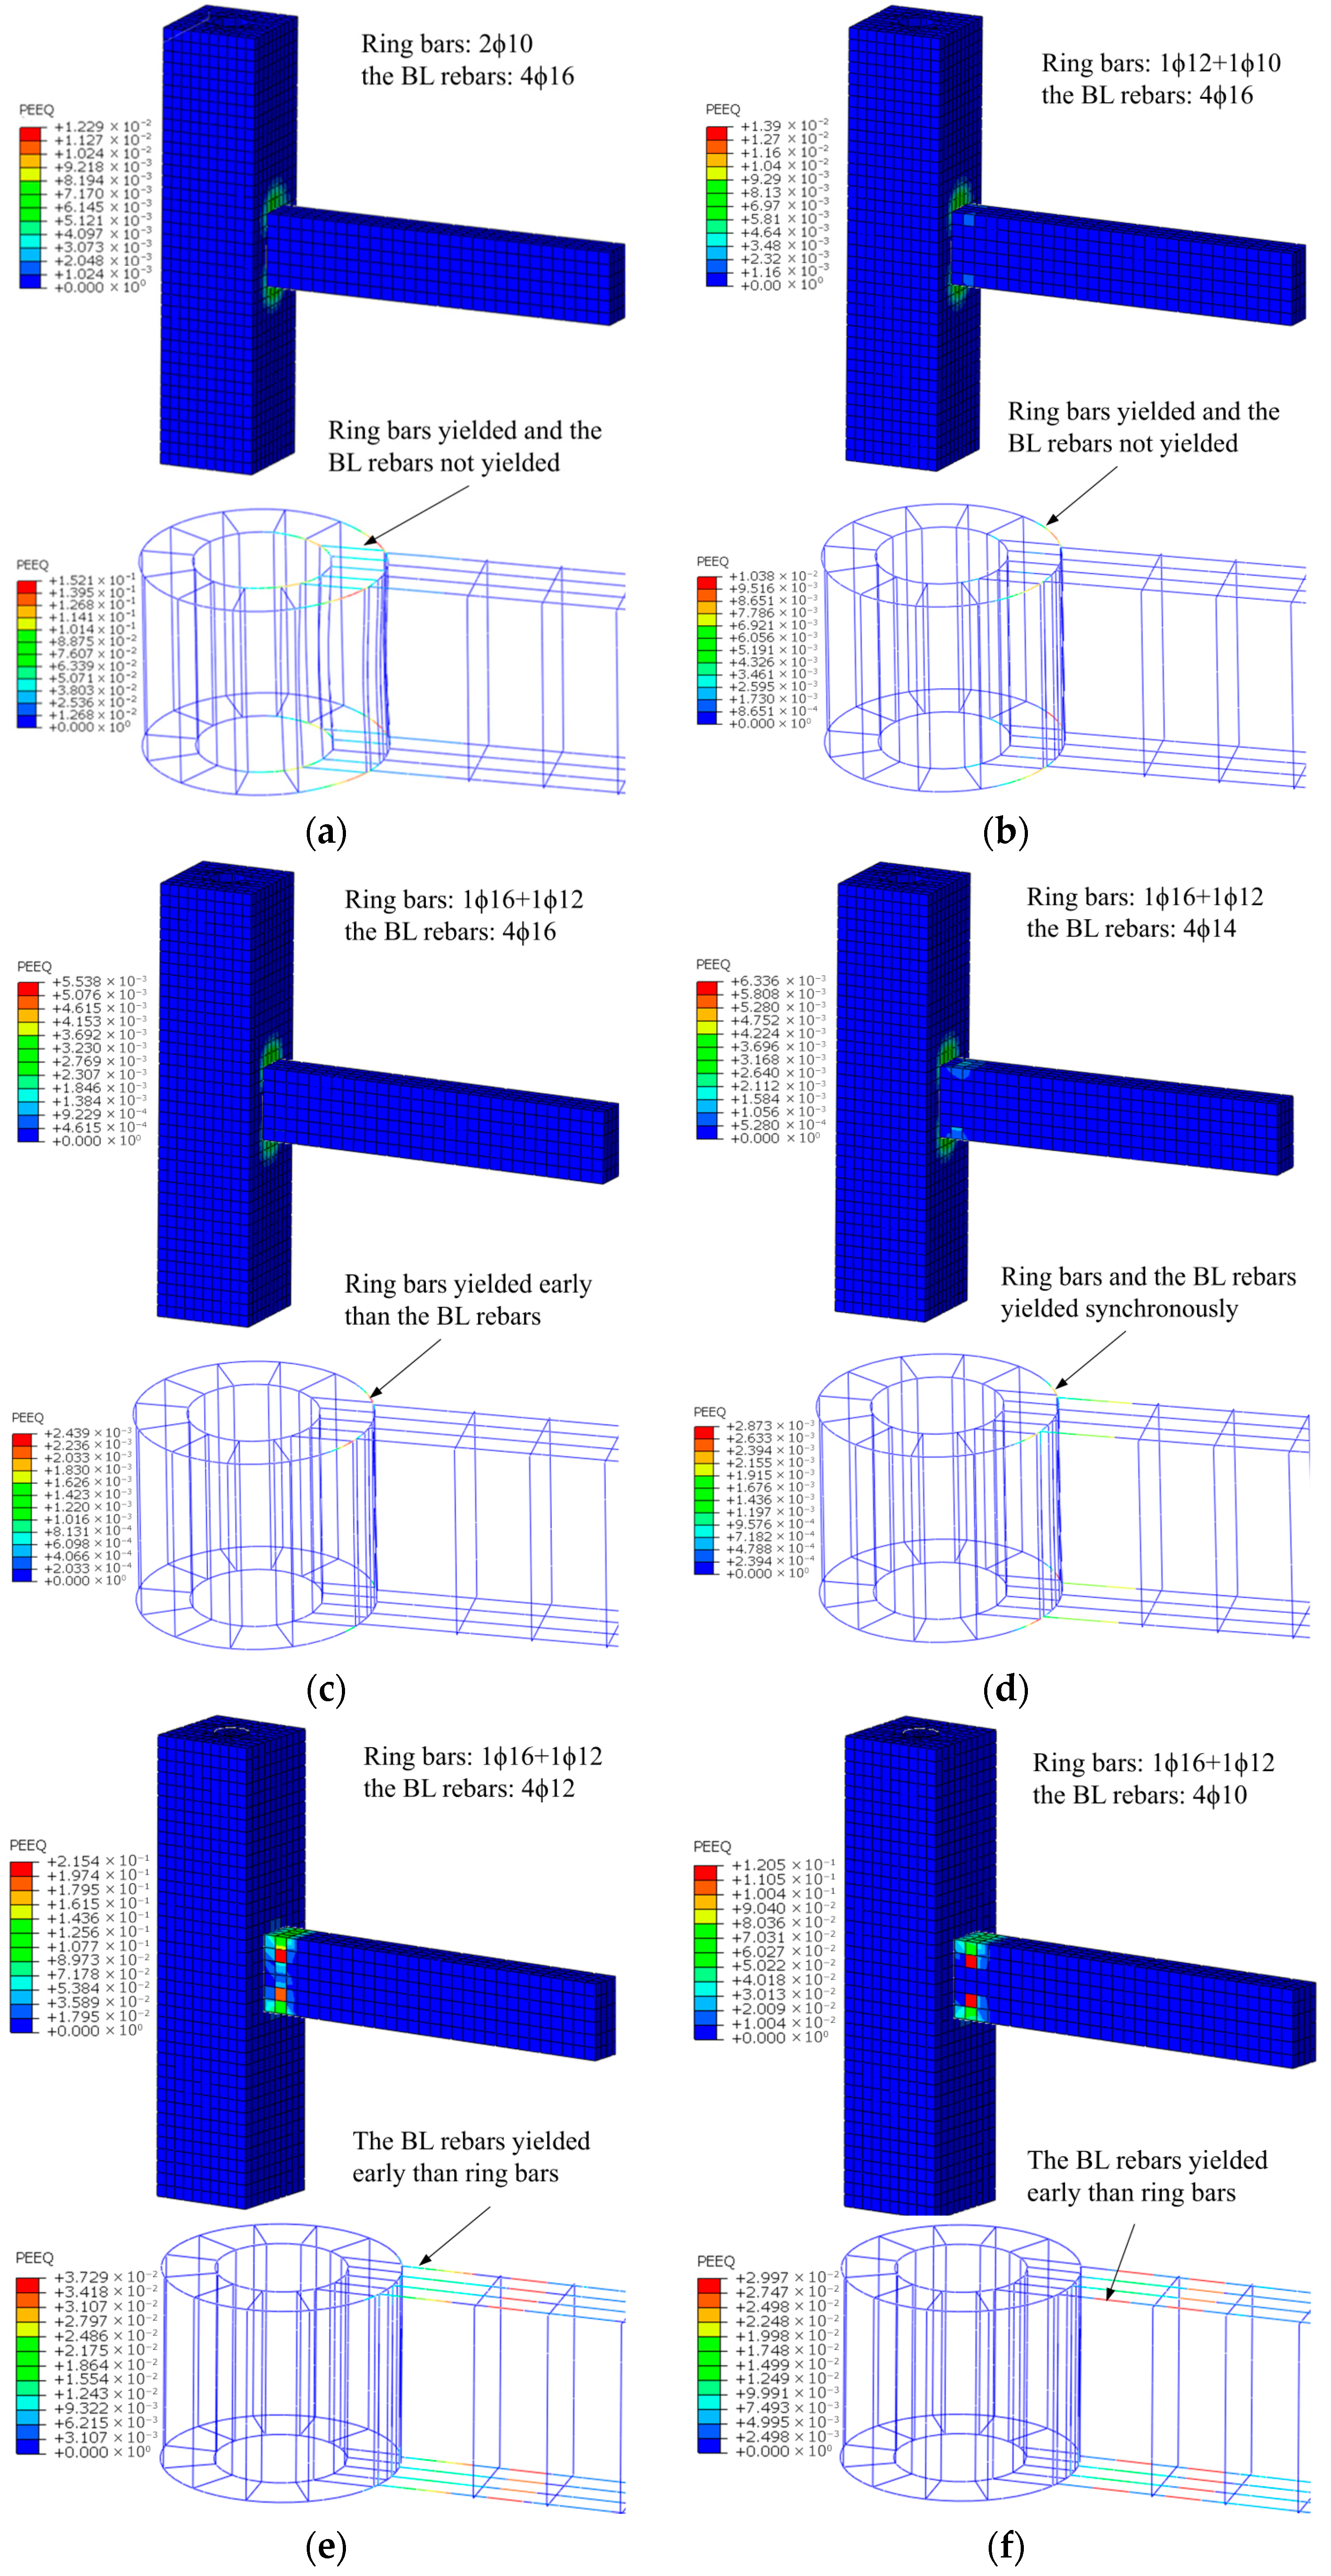
The variation in the ring–longitudinal ratio () was achieved by adjusting the diameters of the ring bar and the BL bar. Figure 19 shows the numerical results with different values. The analysis revealed the following patterns: when > 0.51, the beam bending failure mode dominated the joint behavior, characterized by plastic hinge formation at the beam end. In this case, the BL bars yielded prior to the ring bars. Conversely, when < 0.51, the ultimate failure mode transitioned to HRB joint failure, with the ring bars yielding prior to the BL bars. The critical value of = 0.51 corresponds to a transitional state between these two failure modes, indicating that the ring–longitudinal ratio plays a decisive role in determining the joint’s ultimate failure mode.
Figure 19.
The failure mode with different . (a) = 0.19 (HRB failure); (b) = 0.24 (HRB failure); (c) = 0.39 (HRB failure); (d) = 0.51 (HRB and RC beam failure); (e) = 0.70 (RC beam failure); (f) = 1.00 (RC beam failure).
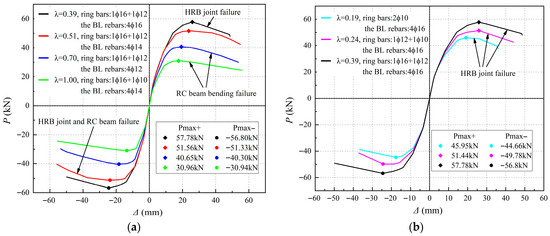
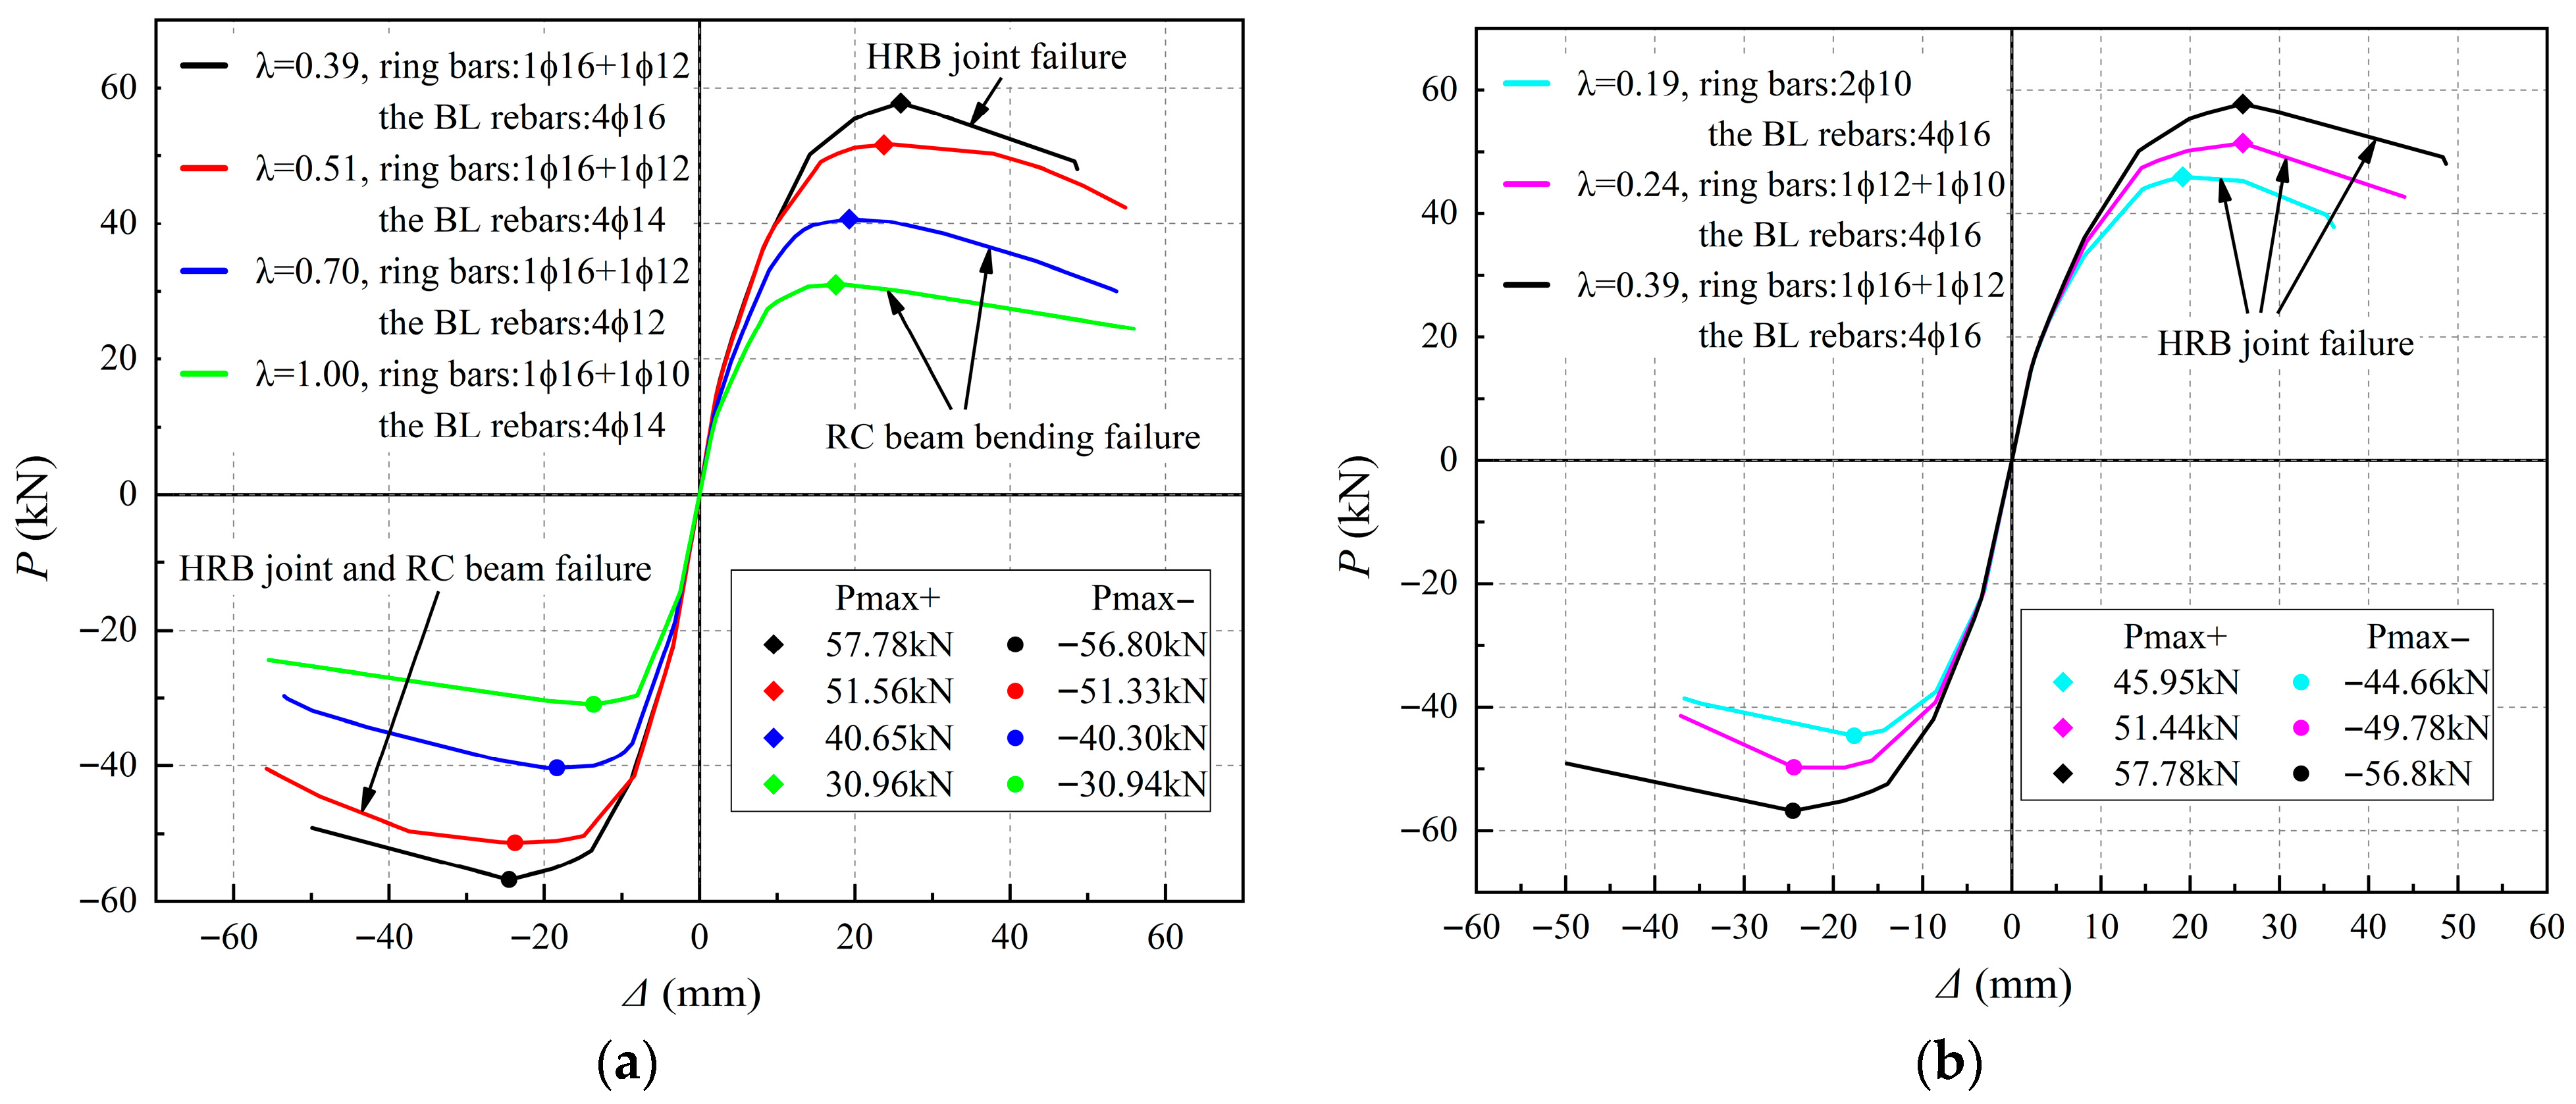
Figure 20 shows the FEA results for the joints with different values of . These results reveal that significantly affects the joint strength. When ≥ 0.51, the joint strength increases proportionally with increasing area of the BL bar. In contrast, when < 0.51, the ductility is significantly reduced. In this case, the joint strength is governed by the moment capacity of the HRB. As shown in Figure 20b, the joint strength nonlinearly decreases as the ring bar area decreases. This confirms that the ring bar area significantly influences the joint strength during HRB failure.
Figure 20.
The skeleton curve with different . (a) = 0.39–1.00; (b) = 0.19–0.39.
5.2.2. Diameter of the Bearing Stirrup
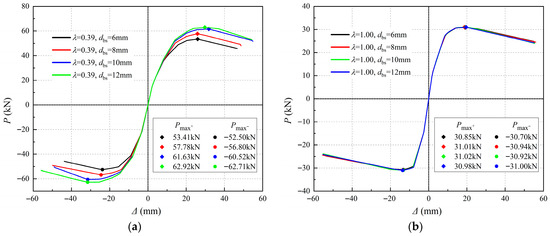
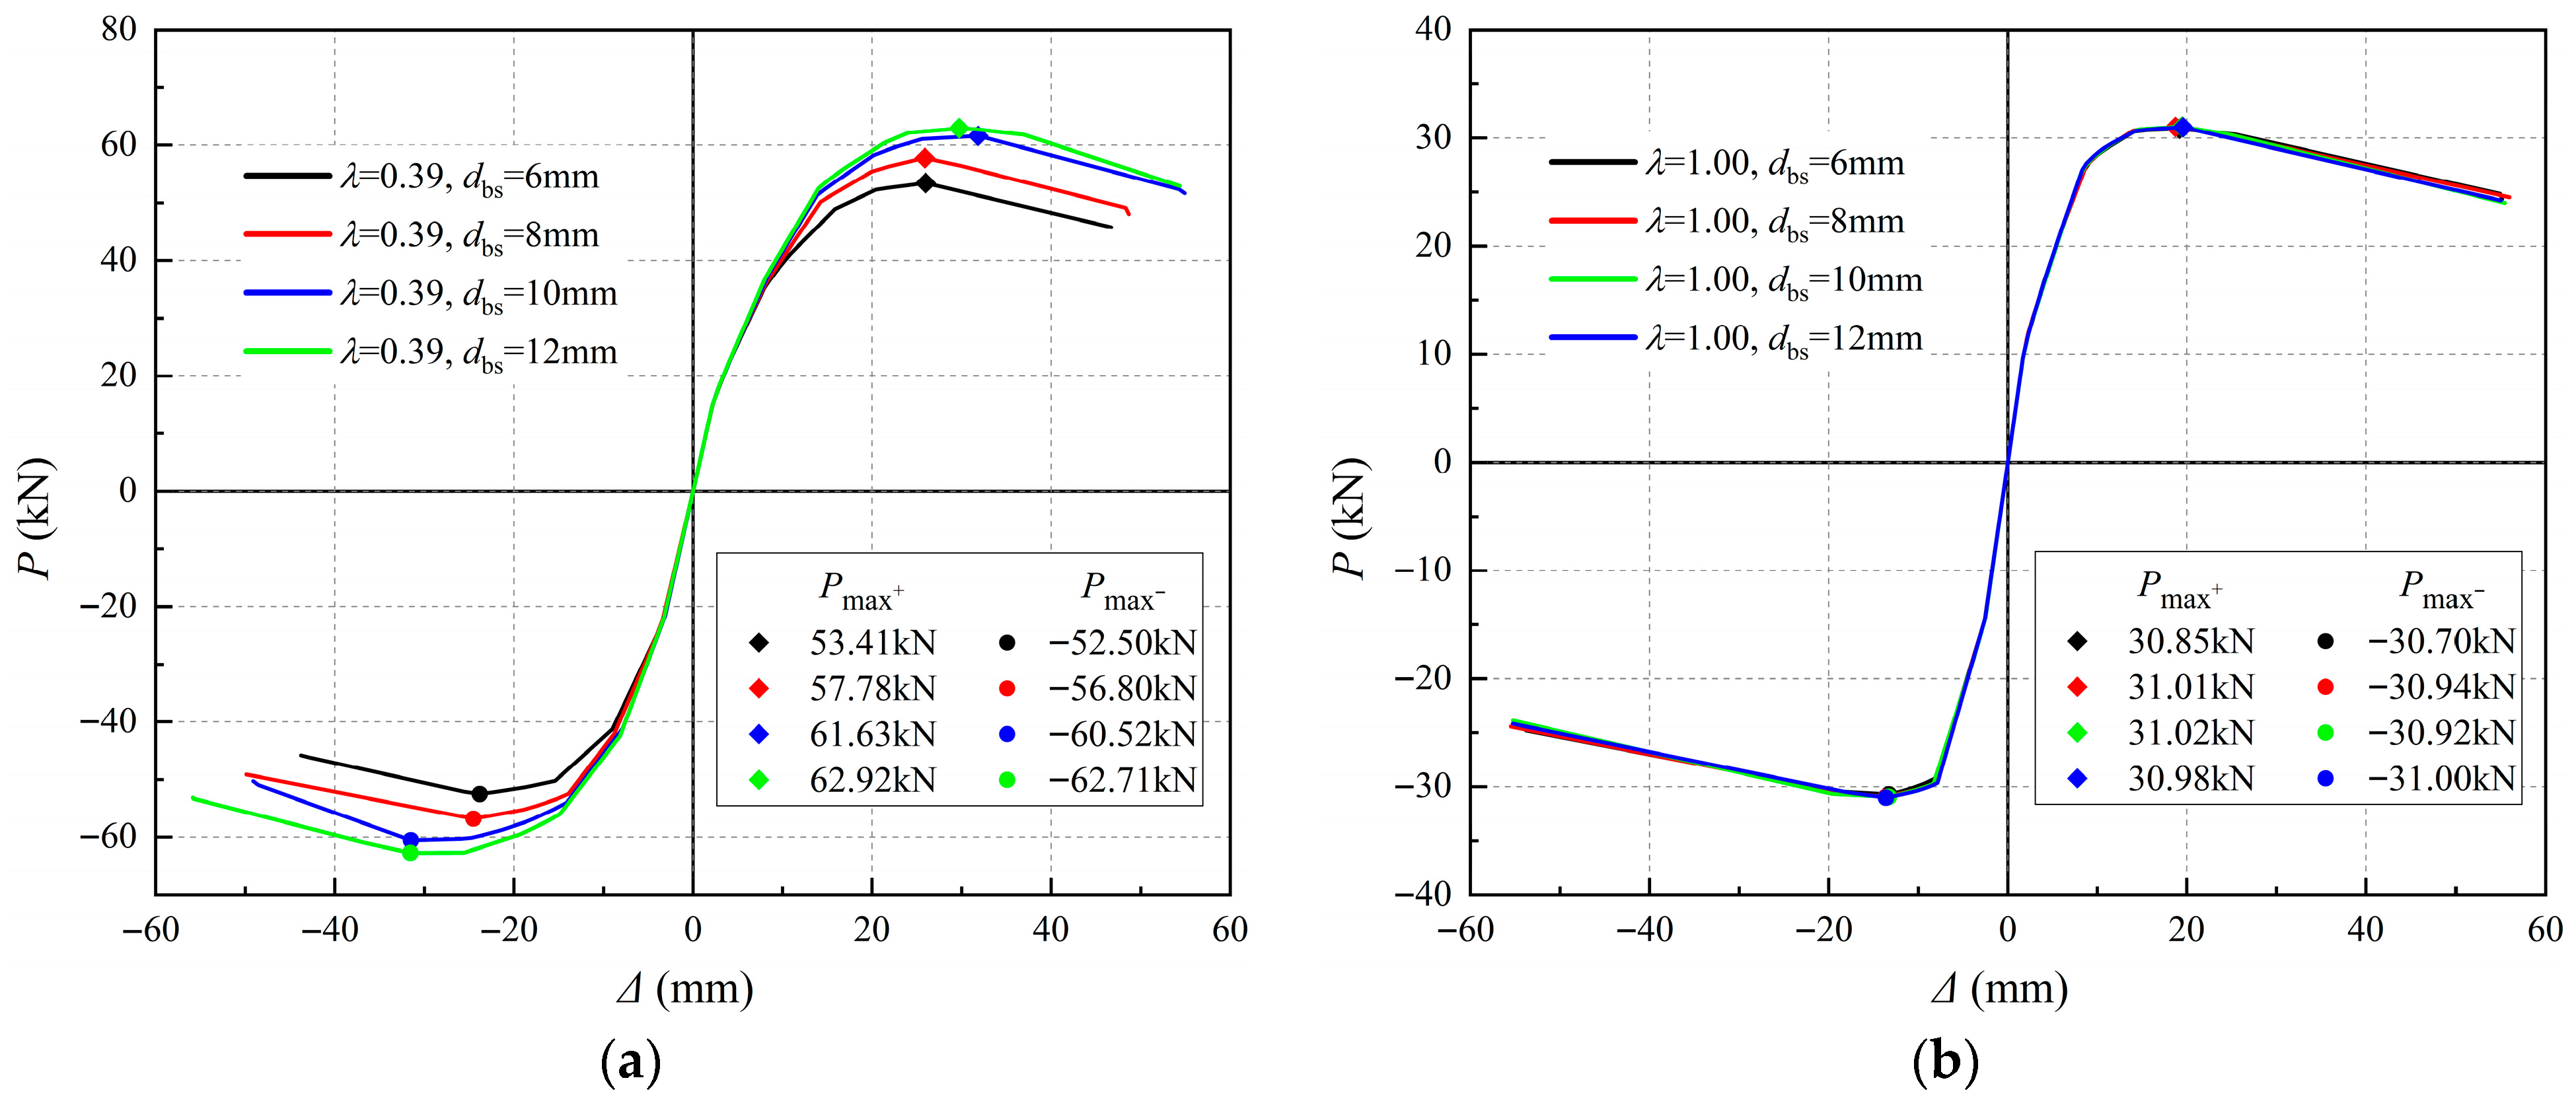
Figure 21 shows the influence of the diameter of the bearing stirrup on the two joint failure modes (beam bending failure and HRB failure). The results indicate that moderately affects the ultimate strength of the joint and has a minor influence on the initial stiffness in the RC beam bending failure mode. In contrast, increasing can effectively increase the joint strength in the HRB failure mode: when increases from 6 mm to 10 mm, the strength increases by approximately 15.3%, but when further increases to 12 mm, only a 2.9% improvement is observed.
Figure 21.
The skeleton curve with different . (a) For the HRB failure mode. (b) For the RC beam bending failure mode.
5.2.3. Constraints of the RC Slab
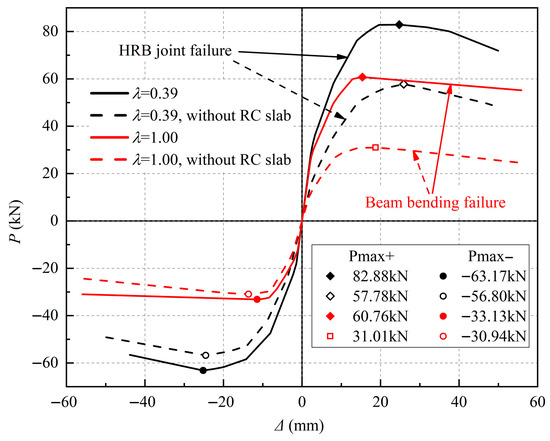
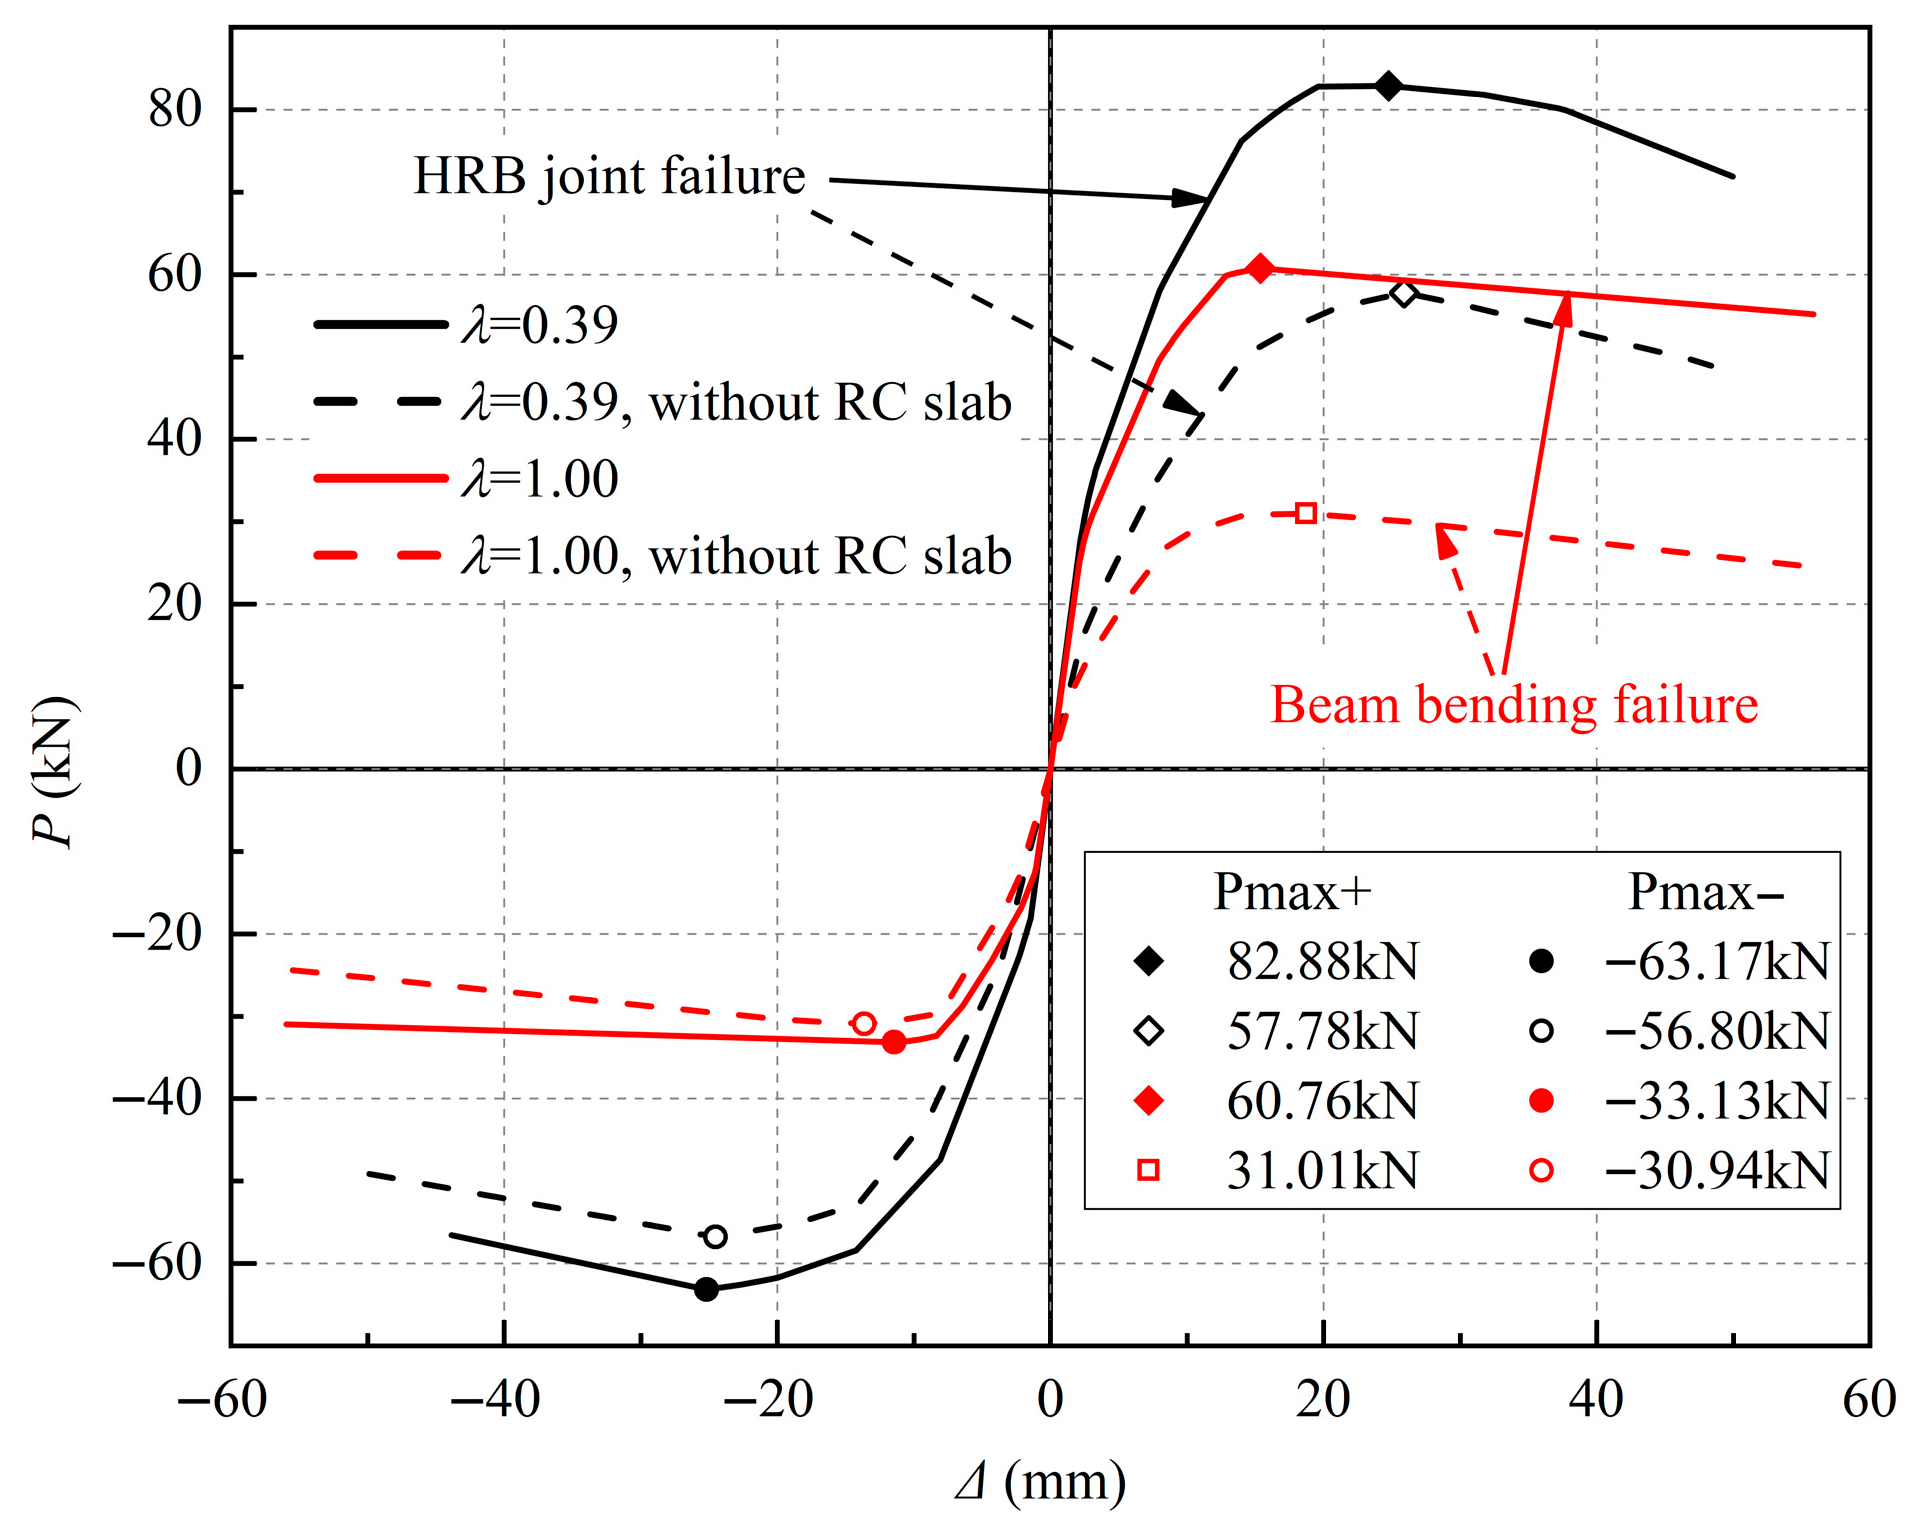
The influence of the RC slab on the joint strength is shown in Figure 22. In the RC beam bending failure mode, the RC slab acts as a compression flange of the beam, increasing both the effective sectional height and the compression zone area of the beam. The synergistic loading action between the slab bars and the BL bars significantly enhances the joint strength. In the HRB failure mode, the constraint effect provided by the RC slab improves the joint strength.
Figure 22.
The skeleton curve with or without RC slab.
5.2.4. Axial Load Ratio
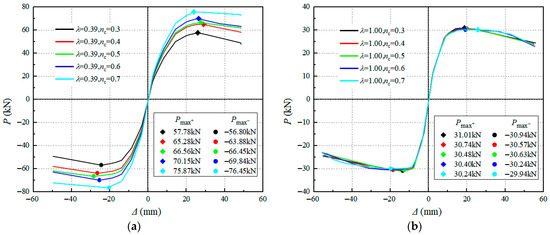
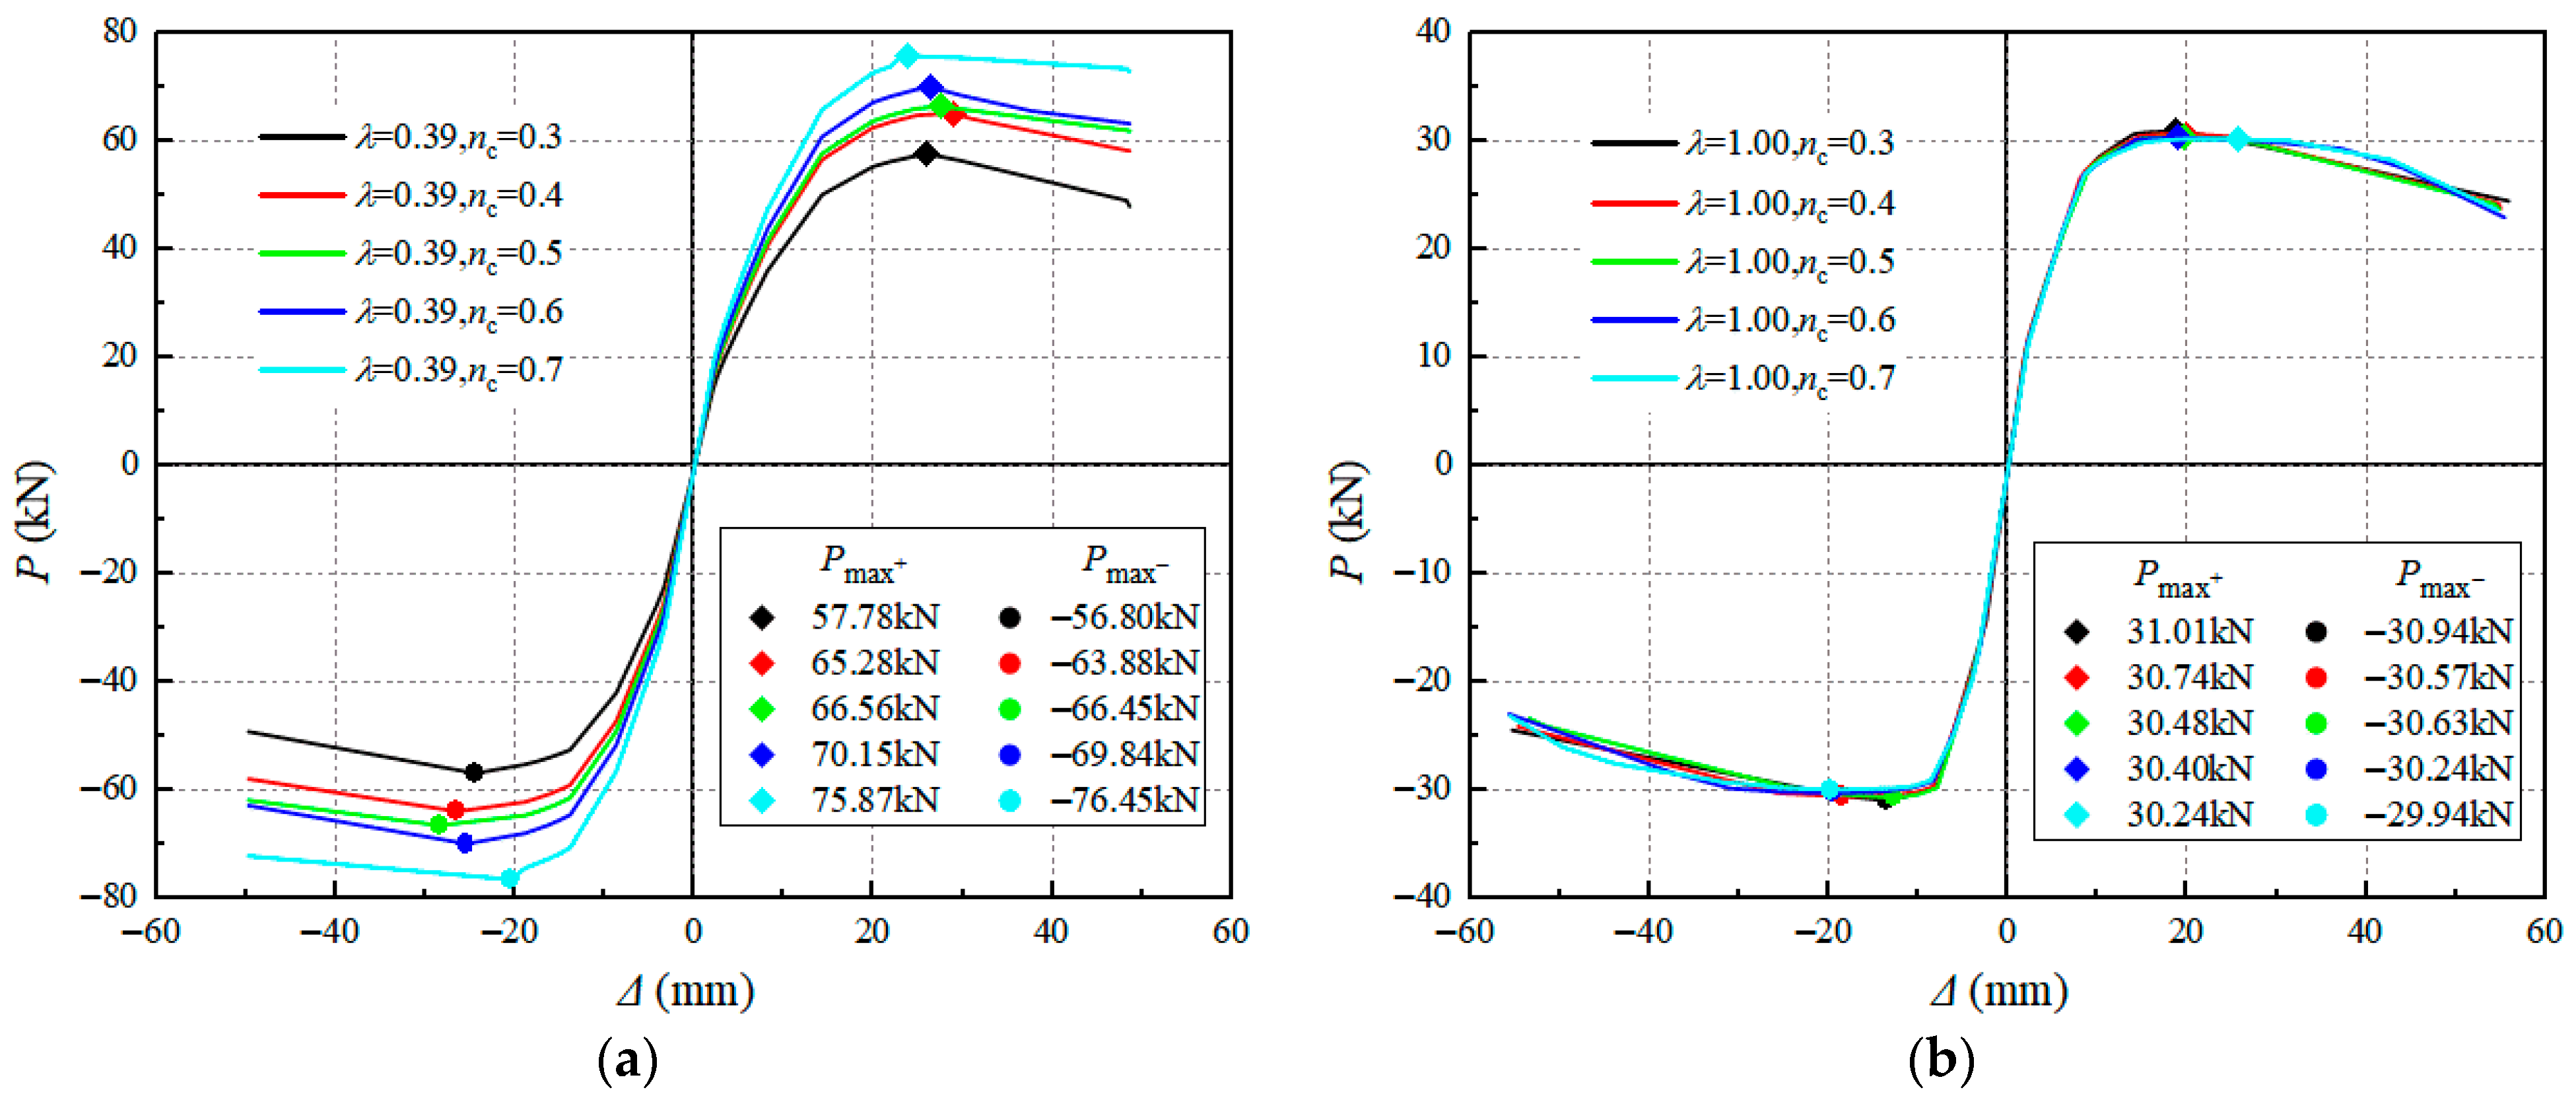
To investigate the effect of axial load ratio on the HRB joint, a parametric analysis was carried out with of 0.3 to 0.7. Since the joints exhibited two different failure modes, namely HRB failure and beam bending failure, the influence of the was analyzed separately. The influence of the on the joint strength is shown in Figure 23.
Figure 23.
The skeleton curve with different . (a) For the HRB failure mode. (b) For the RC beam bending failure mode.
For the HRB failure mode, the joint strength increased with the increased . For the beam bending failure, the skeleton curves under different axial load ratios were generally close to each other, and the joint strength changed only slightly. This indicates that the effect of axial load ratio on the HRB joint depends on the failure mode.
5.3. Moment Capacity Calculation Method for the HRB
The results of the parametric analysis reveal significant differences in the joint strength among the different failure modes. The HRB joint should be designed to yield after the RC beam. As presented in Section 5.2, both the ring–longitudinal ratio, the diameter of the bearing stirrup and the axial load ratio have a pronounced influence on the joint strength. Although the HRB joint shares similar construction details with the ST-RC column-ring beam joint, its mechanical behavior differs significantly. For the HRB joint, the reinforcement skeleton is fully embedded with the column, enabling the column to resist out-of-plane torsion, rather than the ring beam itself as in the ST-RC column-ring beam joint. On the basis of the limit equilibrium method of the free-body and the load transfer mechanism proposed in [31], a moment capacity calculation method is developed for the HRB joint.
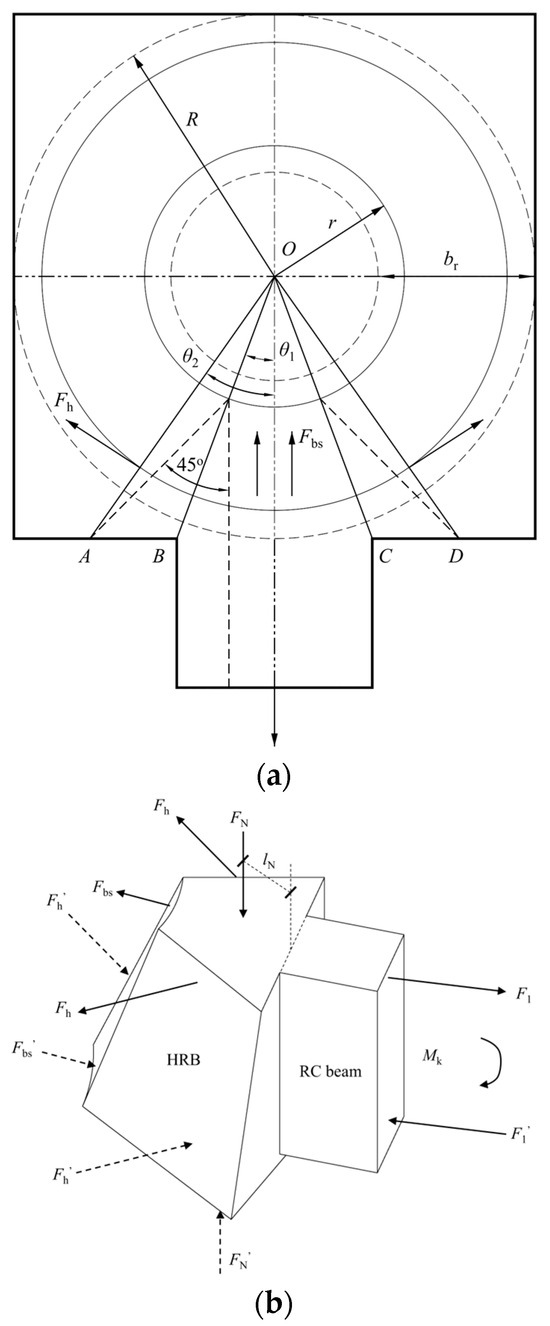
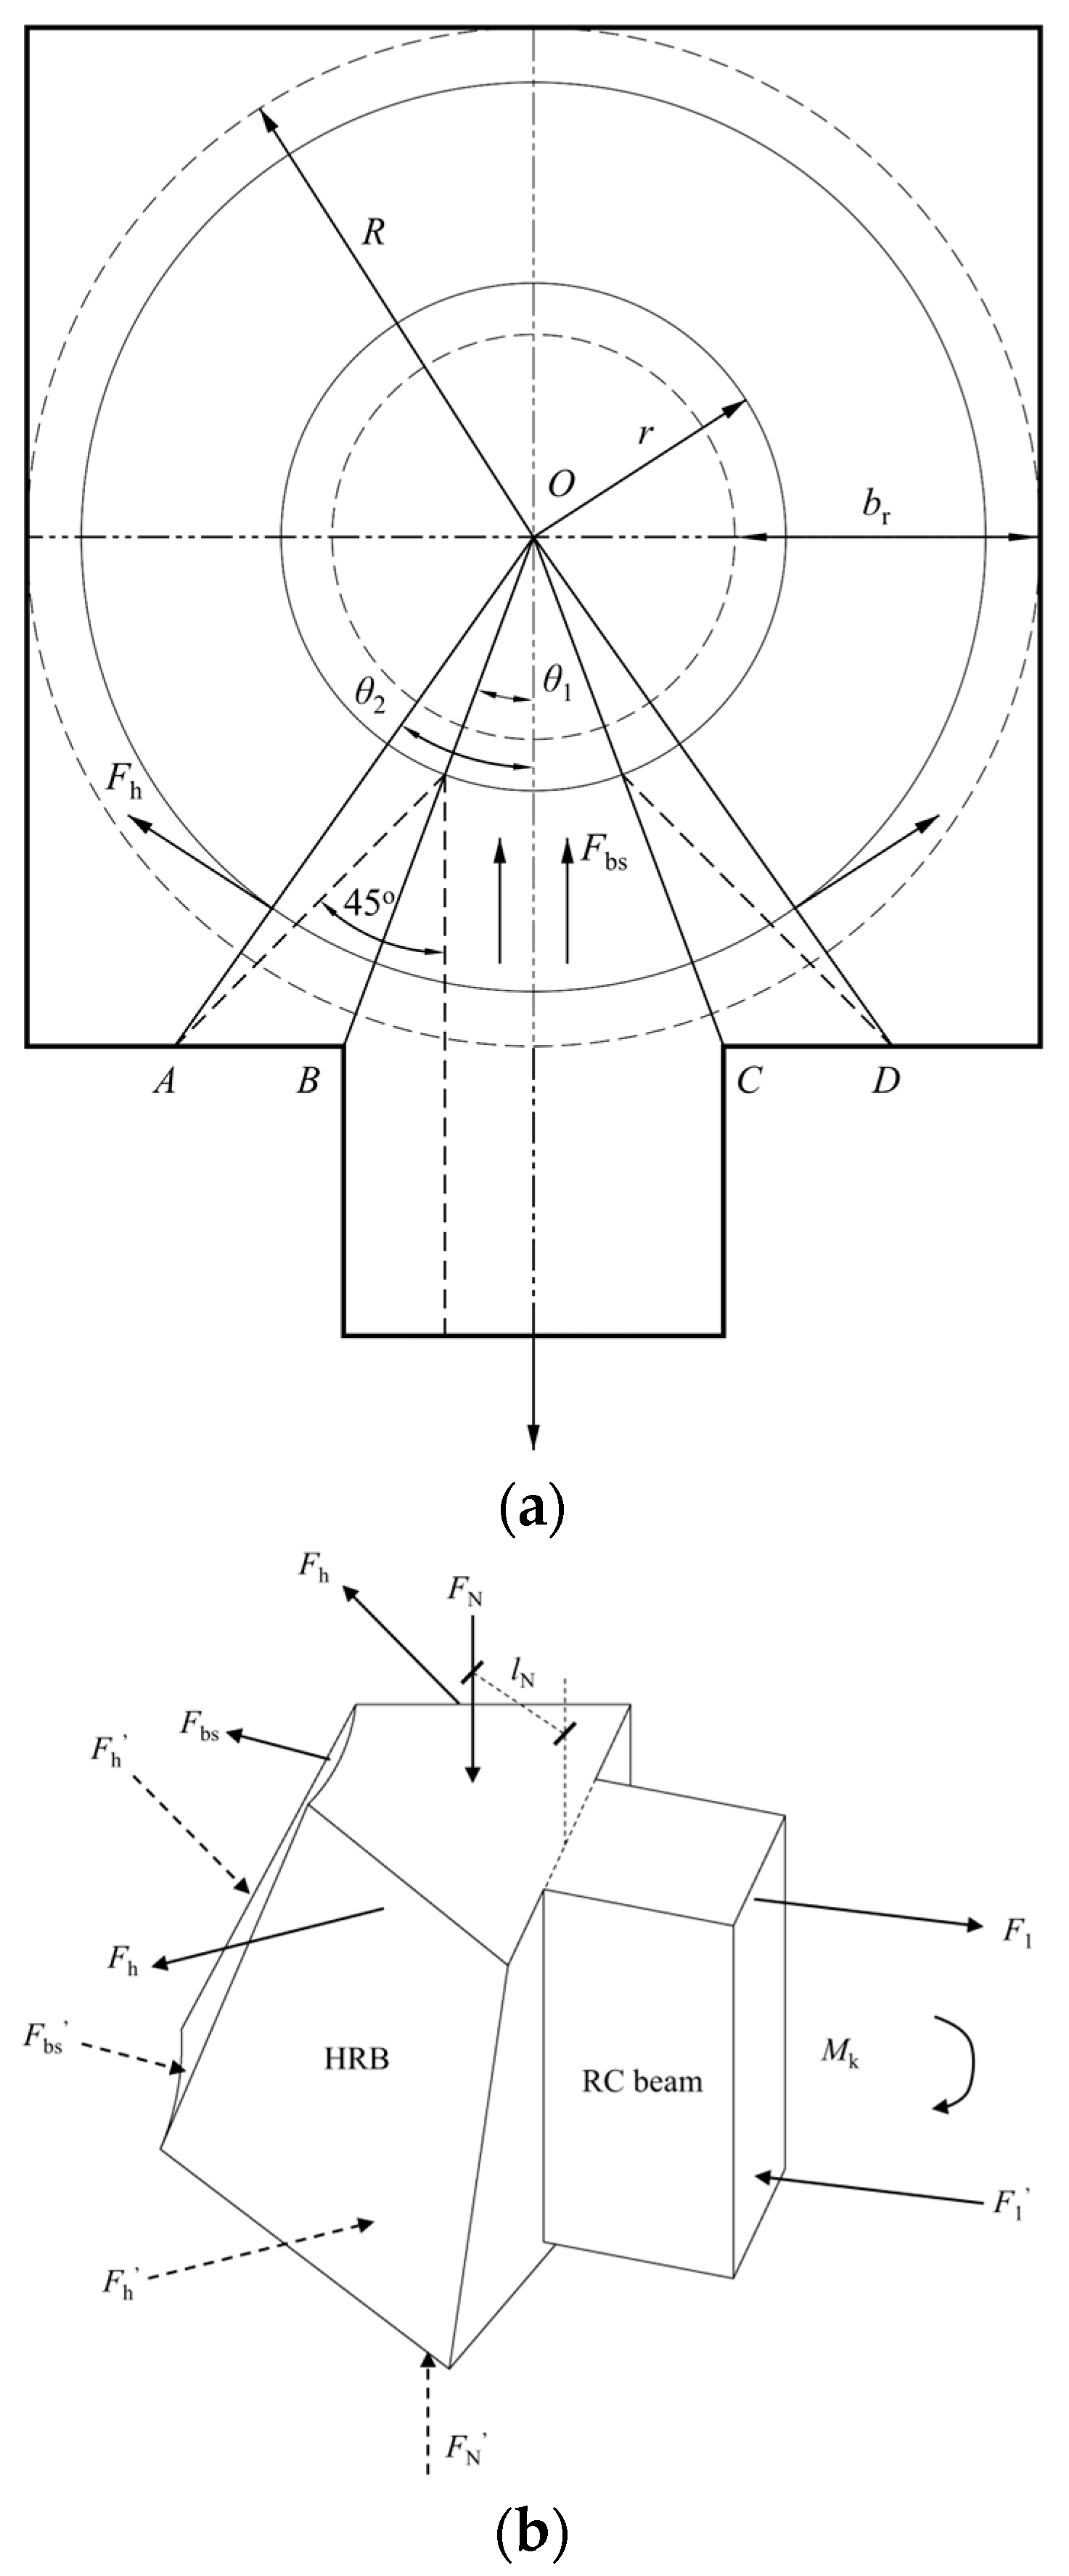
Figure 24 illustrates the schematic of the free-body of the HRB joint. According to the FEA, the principal stress direction of the ring bars forms an angle of 45° with respect to the beam axis (Figure 24a, OA, OD), where and .
Figure 24.
Sketch of the free-body under forces. (a) Geometrical relationship for analysis. (b) Three-dimensional force diagram.
Figure 24b shows the three-dimensional force diagram of the free-body. The bending moment at the RC beam end is resisted by three components: the force couple generated by nominal tension and compression forces in the ring bars, the force couple from the bearing stirrups, and the axial compression force couple developed by the external RC encasement. Accordingly, the moment capacity of the HRB joint can be expressed as Equation (4):
The moment generated from the ring bars is calculated by Equations (5) and (6):
where is the internal lever arm of the ring bars, taken as the RC beam height; is the spatial location coefficient, defined as , is the distance of each ring bar to the inner surface of the HRB; is the width of the HRB; and and are the yield strength and area of each ring bar, respectively.
The contribution of the bearing stirrups is calculated using a similar approach, as given by Equation (7):
where , is the reinforcement ratio of the bearing stirrup, the value of should not exceed 1.0; is the area of the single bearing stirrup; and is the yield strength of the bearing stirrup.
The axial pressure combined force of the upper external concrete encasement is assumed to apply to the center of the width of the HRB, and its size is the same as the reverse of the opposite force applied on the edge of the ST-RC composite column, with the arm of force . The moment can be calculated via Equations (8)–(10):
where is the stress unevenness coefficient, which is taken as 0.65, and is the axial pressure by the external concrete encasement, which can be determined according to the Chinese specification:
Substituting the results into Equation (4), the moment capacity of the HRB joint can be calculated by Equation (12):
Introducing a capacity correction factor , Equation (13) is obtained:
Table 10 shows the comparison between the numerical results and the calculated results of Equation (12), and the ratio of the numerical results to the calculated results has a mean value of 1.08 and a standard deviation of 0.048. To ensure that the calculation method has a guarantee of more than 90%, the correction coefficient = 1.08 − 1.282 × 0.048 = 1.02.
Table 10.
Validation of the moment capacity calculation method.
6. Conclusions
In this paper, a new ST-RC composite column with HRB joints was proposed. Cyclic tests were conducted on three specimens to gain insights into the seismic and anchorage performance of the proposed joints. The following conclusions can be drawn from this research:
- (1)
- The use of the ST-RC composite column with HRB joints was safe and feasible when the reinforcement of the HRB was sufficient, demonstrating excellent seismic performance. The ultimate failure of the specimens was characterized by typical beam bending failure, with no significant damage observed in the joint core. Combined with the observed failure characteristics and reinforcement strain analysis, these results suggest that the proposed joint generally meets the design principle of a “strong joint and weak member”.
- (2)
- For the specimens designed following the principle of “strong column and weak beam”, the bearing capacities of the three reinforcement anchorage constructions were similar, and the anchorage performances of the different reinforcement anchorage constructions were excellent. The ductility of the specimens was greater than 3.0. The yield and ultimate rotation angles ranged from 1/205 to 1/128 and 1/34 to 1/26, respectively. The ductility and rotation angle both met the standards of the Chinese code. The presence of the RC slab significantly enhanced the strength and initial stiffness of the RC beams but decreased the ductility of the specimens.
- (3)
- The hysteresis curves revealed a pinching effect. The hysteresis curve of the CBJC was the fullest. The of specimens were still higher than 0.1, indicating that the HRB joints have a great energy dissipation capacity.
- (4)
- With concrete nonlinear behavior and the internal contact mechanisms in the joint core explicitly considered, the numerical simulation provided a reliable prediction of the seismic performance and the failure mode of the HRB joints, and the discrepancy between calculated and measured strengths did not exceed 6.0%.
- (5)
- The parametric analysis showed that the ring–longitudinal ratio is the key parameter governing the failure mode of the HRB joint. A critical value of 0.51 was identified for the transition from HRB failure to RC beam failure. Increasing the bearing stirrup diameter improved the joint strength, although the strengthening effect gradually diminished. RC slab participation was also beneficial to the joint strength.
- (6)
- On the basis of the parametric analysis, a moment capacity calculation method is proposed that considers the limit equilibrium method of the free-body. This method calculated results agreed well with the numerical results, with a mean ratio of 1.08 and a standard deviation of 0.048, indicating that the proposed method can provide a useful basis for design.
Author Contributions
Conceptualization, Y.L. and J.Z.; methodology, J.X. and J.Z.; software, J.X.; validation, Y.L., J.Z. and J.X.; formal analysis, J.X.; investigation, J.X.; resources, Y.L. and J.Z.; data curation, J.X.; writing—original draft preparation, J.X.; writing—review and editing, Y.L., J.Z. and J.X.; visualization, J.X.; supervision, Y.L. and J.Z.; project administration, J.X.; funding acquisition, Y.L. and J.Z. All authors have read and agreed to the published version of the manuscript.
Funding
This research was funded by the National Nature Science Foundation of China (Grant No. 12172135 and No. 52378512) and the Project of State Key Laboratory of Subtropical Building and Urban Science (Grant No. 2021Z12).
Data Availability Statement
The original contributions presented in this study are included in the article. Further inquiries can be directed to the corresponding author.
Acknowledgments
The authors greatly appreciate the financial support received from the funding bodies.
Conflicts of Interest
The authors declare that they have no known competing financial interests or personal relationships that could have appeared to influence the work reported in this paper.
References
- Han, L.; Liao, F.; Tao, Z.; Hong, Z. Performance of concrete filled steel tube reinforced concrete columns subjected to cyclic bending. J. Constr. Steel Res. 2009, 65, 1607–1616. [Google Scholar] [CrossRef] [Scilit]
- Han, L.; An, Y. Performance of concrete-encased CFST stub columns under axial compression. J. Constr. Steel Res. 2014, 93, 62–76. [Google Scholar] [CrossRef] [Scilit]
- Kim, S.; Yom, K.; Choi, S. Stress-transfer in concrete encased and filled tube square columns employed in top-down construction. Steel Compos. Struct. 2016, 22, 63–77. [Google Scholar] [CrossRef] [Scilit]
- Zhou, K.; Han, L. Experimental performance of concrete-encased CFST columns subjected to full-range fire including heating and cooling. Eng. Struct. 2018, 165, 331–348. [Google Scholar] [CrossRef] [Scilit]
- Ma, D.; Han, L.; Li, W.; Hou, C.; Mu, T. Behaviour of concrete-encased CFST stub columns subjected to long-term sustained loading. J. Constr. Steel Res. 2018, 151, 58–69. [Google Scholar] [CrossRef] [Scilit]
- Ma, D.; Han, L.; Ji, X.; Yang, W. Behaviour of hexagonal concrete-encased CFST columns subjected to cyclic bending. J. Constr. Steel Res. 2018, 144, 283–294. [Google Scholar] [CrossRef] [Scilit]
- Qian, W.; Li, W.; Han, L.; Zhao, X. Analytical behavior of concrete-encased CFST columns under cyclic lateral loading. J. Constr. Steel Res. 2016, 120, 206–220. [Google Scholar] [CrossRef] [Scilit]
- Chen, C.; Lin, K. Behavior and strength of steel reinforced concrete beam–column joints with two-side force inputs. J. Constr. Steel Res. 2009, 65, 641–649. [Google Scholar] [CrossRef] [Scilit]
- Vasdravellis, G.; Valente, M.; Castiglioni, C. Behavior of exterior partial-strength composite beam-to-column connections: Experimental study and numerical simulations. J. Constr. Steel Res. 2009, 65, 23–35. [Google Scholar] [CrossRef] [Scilit]
- Park, H.; Hwang, H.; Lee, C.; Park, C.; Lee, C. Cyclic loading test for concrete-filled U-shaped steel beam–RC column connections. Eng. Struct. 2012, 36, 325–336. [Google Scholar] [CrossRef] [Scilit]
- Abbas, A.; Syed Mohsin, S.; Cotsovos, D. Seismic response of steel fibre reinforced concrete beam–column joints. Eng. Struct. 2014, 59, 261–283. [Google Scholar] [CrossRef] [Scilit]
- Gan, D.; Zhou, Z.; Zhou, X.; Kang, H. Seismic Behavior Tests of Square Reinforced Concrete–Filled Steel Tube Columns Connected to RC Beam Joints. J. Struct. Eng. 2019, 145, 04018267. [Google Scholar] [CrossRef] [Scilit]
- Zhang, Y.; Zhao, J.; Cai, C. Seismic behavior of ring beam joints between concrete-filled twin steel tubes columns and reinforced concrete beams. Eng. Struct. 2012, 39, 1–10. [Google Scholar] [CrossRef] [Scilit]
- Tang, X.; Cai, J.; Chen, Q.; Liu, X.; He, A. Seismic behaviour of through-beam connection between square CFST columns and RC beams. J. Constr. Steel Res. 2016, 122, 151–166. [Google Scholar] [CrossRef] [Scilit]
- Pucinotti, R.; Bursi, O.; Demonceau, J. Post-earthquake fire and seismic performance of welded steel–concrete composite beam-to-column joints. J. Constr. Steel Res. 2011, 67, 1358–1375. [Google Scholar] [CrossRef] [Scilit]
- Fang, X.; Huang, S.; Li, S.; Qian, J.; Zhou, D. Design method of RC beam-STCC column joint connected with ring beam. J. Build. Struct. 2008, 29, 20–33. (In Chinese) [Google Scholar] [CrossRef]
- Chen, Q.; Cai, J.; Bradford, M.A.; Liu, X.; Zuo, Z. Seismic behaviour of a through-beam connection between concrete-filled steel tubular columns and reinforced concrete beams. Eng. Struct. 2014, 80, 24–39. [Google Scholar] [CrossRef] [Scilit]
- Liao, F.Y.; Han, L.H.; Tao, Z. Behaviour of composite joints with concrete encased CFST columns under cyclic loading: Experiments. Eng. Struct. 2014, 59, 745–764. [Google Scholar] [CrossRef] [Scilit]
- Li, W.; Xu, L.; Qian, W. Seismic performance of concrete-encased CFST column to steel beam joints with different connection details. Eng. Struct. 2020, 204, 109875. [Google Scholar] [CrossRef] [Scilit]
- Ma, D.; Han, L.; Zhao, X. Seismic performance of the concrete-encased CFST column to RC beam joint: Experiment. J. Constr. Steel Res. 2019, 154, 134–148. [Google Scholar] [CrossRef] [Scilit]
- Xiang, P.; Deng, Z.; Su, Y.; Wang, H.; Wan, Y. Experimental investigation on joints between steel-reinforced concrete T-shaped column and reinforced concrete beam under bidirectional low-cyclic reversed loading. Adv. Struct. Eng. 2016, 20, 446–460. [Google Scholar] [CrossRef] [Scilit]
- Dong, B.; Pan, J.; Cai, J.; Xu, L. Mechanical behaviour of a new ECC-encased CFST column to RC beam connection under cyclic loading. Eng. Struct. 2021, 234, 111915. [Google Scholar] [CrossRef] [Scilit]
- Nie, J.; Wang, Y.; Tao, M. Research and optimization on laminated steel tube column-concrete beam joints with outer stiffening ring. J. Build. Struct. 2013, 56, 1282–1293. (In Chinese) [Google Scholar] [CrossRef] [Scilit]
- Su, Y.N.; Yang, W.G.; Zou, J.Q.; Ma, R.C.; Zhang, Q.L.; Gao, Y.H. Seismic performance of the ST-RC columns to RC beams exterior joint with assembled connection details. Structures 2024, 68, 107139. [Google Scholar] [CrossRef] [Scilit]
- Lee, H.J.; Park, H.G. Seismic behavior of precast concrete beam-column joints with encased steel tube. J. Build. Eng. 2022, 61, 105296. [Google Scholar] [CrossRef] [Scilit]
- Qiao, M.X.; Ma, Y.X.; Fung, T.C.; Tan, K.H. Seismic performance of PC beam-to-CECFST column joints with novel wet connections. Eng. Struct. 2025, 322, 119024. [Google Scholar] [CrossRef] [Scilit]
- Guo, L.; Wang, J.F.; Wang, W.Q.; Hu, Z.H. Experimental and numerical investigations of bolted assembled joints to concrete encased CFST columns with different connection details. J. Constr. Steel Res. 2023, 201, 107739. [Google Scholar] [CrossRef] [Scilit]
- T/CECS 188-2019; Technical Specification for Steel Tube-Reinforced Concrete Column Structures. China Architecture & Building Press: Beijing, China, 2019.
- Ma, Y.X. Experimental evaluation of simple connection details for precast concrete beam-to-CECFST column joints. J. Constr. Steel Res. 2024, 221, 108927. [Google Scholar] [CrossRef] [Scilit]
- Qiao, M.X.; Ma, Y.X.; Fung, T.C.; Tan, K.H. Experimental study on exterior precast concrete beam-to-CECFST column joints with wet connections under cyclic loading. J. Build. Eng. 2024, 88, 109109. [Google Scholar] [CrossRef] [Scilit]
- Zhou, Y.; Yu, H.; Qian, J.; Hu, K.; Qu, G. Moment capacity calculation method on ring beams of joints of concrete filled steel tubular laminated columns. J. Build. Struct. 2015, 36, 79–86. (In Chinese) [Google Scholar] [CrossRef]
- Ling, Y.; Xu, J.; Zhou, J. Seismic performance of a ST-RC column with RC hidden ring beam joint. J. Constr. Steel Res. 2025, 235, 109896. [Google Scholar] [CrossRef] [Scilit]
- Ning, N.; Qu, W.; Zhu, P. Role of cast-in situ slabs in RC frames under low frequency cyclic load. Eng. Struct. 2014, 59, 28–38. [Google Scholar] [CrossRef] [Scilit]
- GB 50010-2010; Code for Design of Concrete Stuctures. China Architecture & Building Press: Beijing, China, 2015.
- Jin, L.; Yu, W.; Su, X.; Zhang, S.; Du, X.; Han, J.; Li, D. Effect of cross-section size on the flexural failure behavior of RC cantilever beams under low cyclic and monotonic lateral loadings. Eng. Struct. 2018, 156, 567–586. [Google Scholar] [CrossRef] [Scilit]
- GB 50011-2010; Code for Seismic Design of Buildings. China Architecture & Building Press: Beijing, China, 2016.
- GB/T 228.1-2021; Metallic Materials-Tensile Testing-Part 1: Method of Test at Room Temperature. China Architecture & Building Press: Beijing, China, 2021.
- JGJ 101-2015; Specification for Seismic Test of Buildings. China Architecture & Building Press: Beijing, China, 2015.
- Zhang, J.; Hu, X.; Gong, S.; Wu, J.; Zhu, W.; Ren, C. Experimental investigation of steel-concrete composite beam to reinforced-concrete column joints with single plate shear connection. Eng. Struct. 2021, 245, 112906. [Google Scholar] [CrossRef] [Scilit]
- Heitz, T. Understanding and phenomenological modeling of the pinching effect of the load–deflection curve of reinforced concrete beams subjected to bending. Mech. Res. Commun. 2024, 140, 104318. [Google Scholar] [CrossRef] [Scilit]
- Park, R. Evaluation of ductility of structures and structural assemblages from laboratory testing. Bull. New Zealand Soc. Earthq. Eng. 1989, 22, 155–166. [Google Scholar] [CrossRef] [Scilit]
- Zhou, J.; Fang, X.; Jiang, Y.; Yang, J. Cyclic Experiments on Concrete-encased CFST wall-RC Coupling Beam Joints with Non-through-core Anchorages. J. Earthqu Eng. 2022, 26, 1518–1542. [Google Scholar] [CrossRef] [Scilit]
- An, Y.; Han, L. Behaviour of concrete-encased CFST columns under combined compression and bending. J. Constr. Steel Res. 2014, 101, 314–330. [Google Scholar] [CrossRef] [Scilit]
- Ma, D.; Han, L.; Zhao, X.; Yang, W. Seismic performance of the concrete-encased CFST column to RC beam joints: Analytical study. Steel Compos. Struct. 2020, 36, 533–551. [Google Scholar] [CrossRef]

Disclaimer/Publisher’s Note: The statements, opinions and data contained in all publications are solely those of the individual author(s) and contributor(s) and not of MDPI and/or the editor(s). MDPI and/or the editor(s) disclaim responsibility for any injury to people or property resulting from any ideas, methods, instructions or products referred to in the content. |
© 2026 by the authors. Licensee MDPI, Basel, Switzerland. This article is an open access article distributed under the terms and conditions of the Creative Commons Attribution (CC BY) license.