


Abstract
This study investigates the mechanical properties and internal pore structure characteristics of raw phosphogypsum–basalt fiber (RPG-BF) cementitious materials with varying raw phosphogypsum (PG) replacement ratios. Specifically, six different PG addition levels (0%, 3%, 6%, 9%, 12%, and 15% by mass of cementitious materials) with a constant basalt fiber dosage of 0.1% (by volume of concrete) were adopted. The mechanical properties of RPG-BF cementitious materials were evaluated by testing the 7-day and 28-day compressive strengths, 28-day split tensile strength, and 28-day flexural strength. Meanwhile, the pore distribution characteristics of the RPG-BF cementitious materials were systematically analyzed using liquid nitrogen adsorption (LNA) tests and scanning electron microscopy (SEM) observations. The experimental results indicate the following: (a) With an increase in PG content, the mechanical properties of RPG-BF cementitious materials exhibit a significant downward trend: the 28-day compressive strength, split tensile strength, and flexural strength decrease by 49%, 44%, and 43%, respectively. (b) The internal pores of the RPG-BF cementitious materials possess excellent fractal characteristics, with fractal dimensions ranging from 2.52 to 2.62. As the PG content increases, the pore structure becomes more intricate and less homogeneous, which is a microstructural factor associated with the degradation of mechanical properties. (c) There exists a strong Pearson’s linear correlation (R > 0.82, with R2 ranging from 0.67 to 0.94) between the pore fractal dimension of RPG-BF cementitious materials and their 7-day/28-day compressive strength, split tensile strength, and flexural strength. (d) SEM observations show that the quantity of micropores and microcracks in the RPG-BF cementitious materials increases with increasing PG content, further confirming deterioration of the material microstructure.
1. Introduction
Phosphogypsum (PG) is a significant by-product produced during the phosphate fertilizer manufacturing process, with a global accumulation history spanning several decades. At present, the global annual production of PG is around 200 million tonnes, with the total stockpile exceeding six billion tonnes.
Morocco, the United States, Tunisia, South Africa, and Russia collectively account for more than 70% of the global PG output; however, the overall utilization of PG in these countries stays relatively low. In contrast, due to the scarcity of natural gypsum resources in Japan, nearly 100% of its by-product PG is converted into high-value-added products. Specifically, approximately 60% of PG is utilized in the production of gypsum boards and plaster powder, while around 30% is employed as a cement retarder. Germany pioneered the application of PG as a cement retarder as early as the 1950s, and its current PG utilization rate has reached approximately 95%. In France, PG is processed into β-hemihydrate gypsum, but market constraints have restricted its effective utilization rate to merely 4–5%. In the United States and Canada, stringent environmental regulations have led to the predominant disposal of PG through stockpiling, resulting in a utilization rate of less than 5%. For coastal countries such as Morocco and Tunisia, direct marine discharge is the primary disposal method, leading to a near-zero utilization rate of PG. Despite the achievement of high-value and large-scale PG utilization in countries like Japan and Germany, the global average utilization rate of PG remains below 25%.
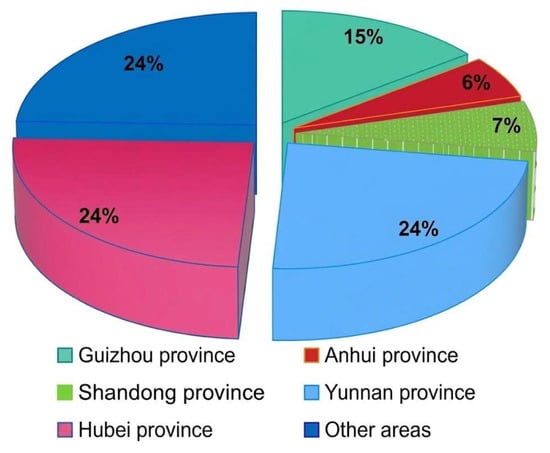
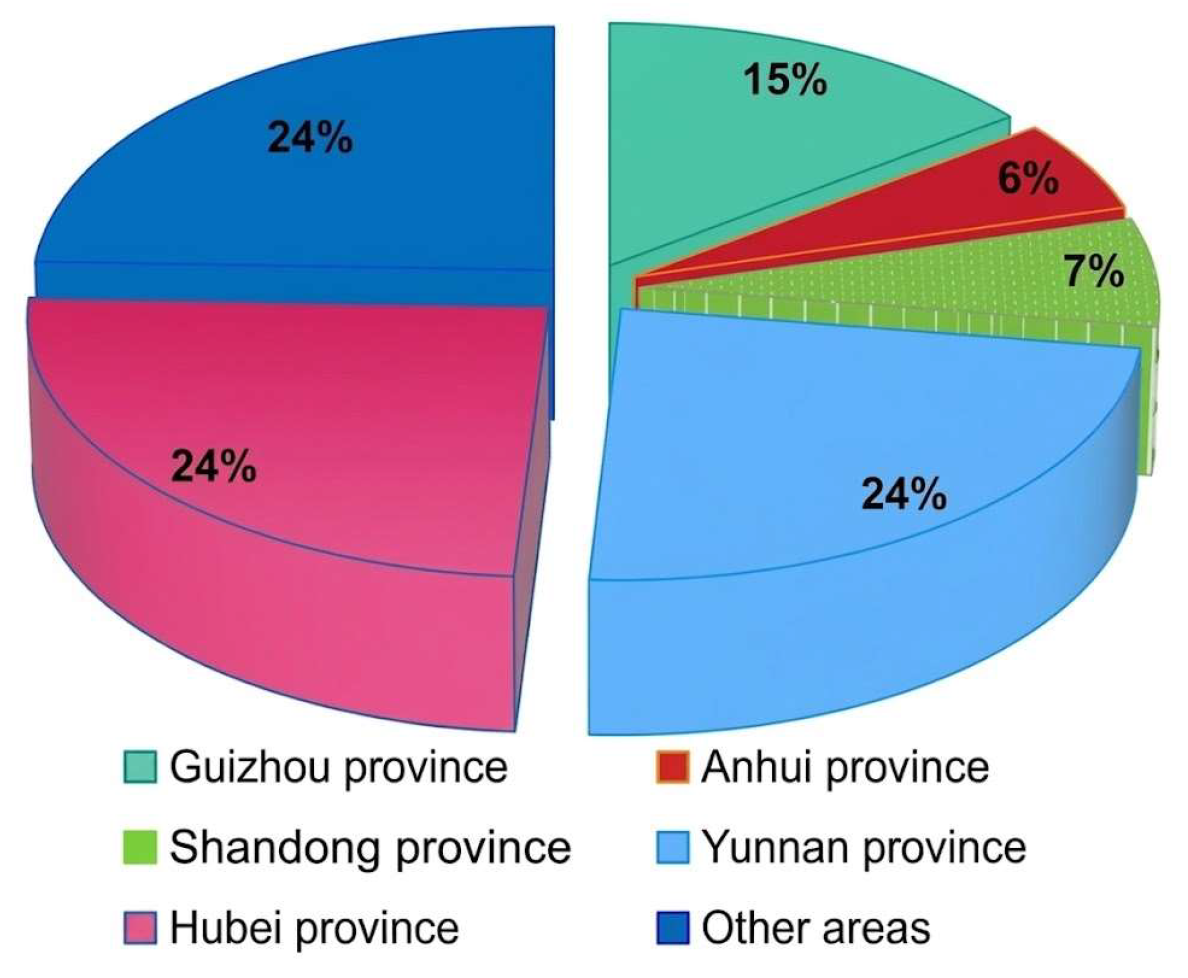
PG has a complex composition. In addition to calcium sulfate, there is residual phosphoric acid, which has not yet thoroughly decomposed phosphate, acid-insoluble matter, fluoride, organic matter, etc. Piles of PG may take up a large amount of land and pose a significant environmental and resource waste risk. China’s annual PG emissions are as high as 7–8 million tons, ranking first globally. They are mainly distributed in the Yunnan–Guizhou region, the middle and lower reaches of the Yangtze River, and the Shandong region (as shown in Figure 1). However, the current comprehensive utilization rate in China is less than 50% according to the Chinese government’s report in 2024.
Figure 1.
The distribution of PG emission areas in China: mainly distributed in Yunnan, Guizhou, the middle and lower reaches of the Yangtze River (including the Hubei and Anhui provinces), and Shandong Province.
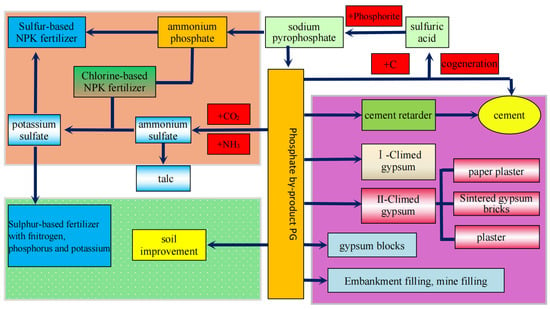
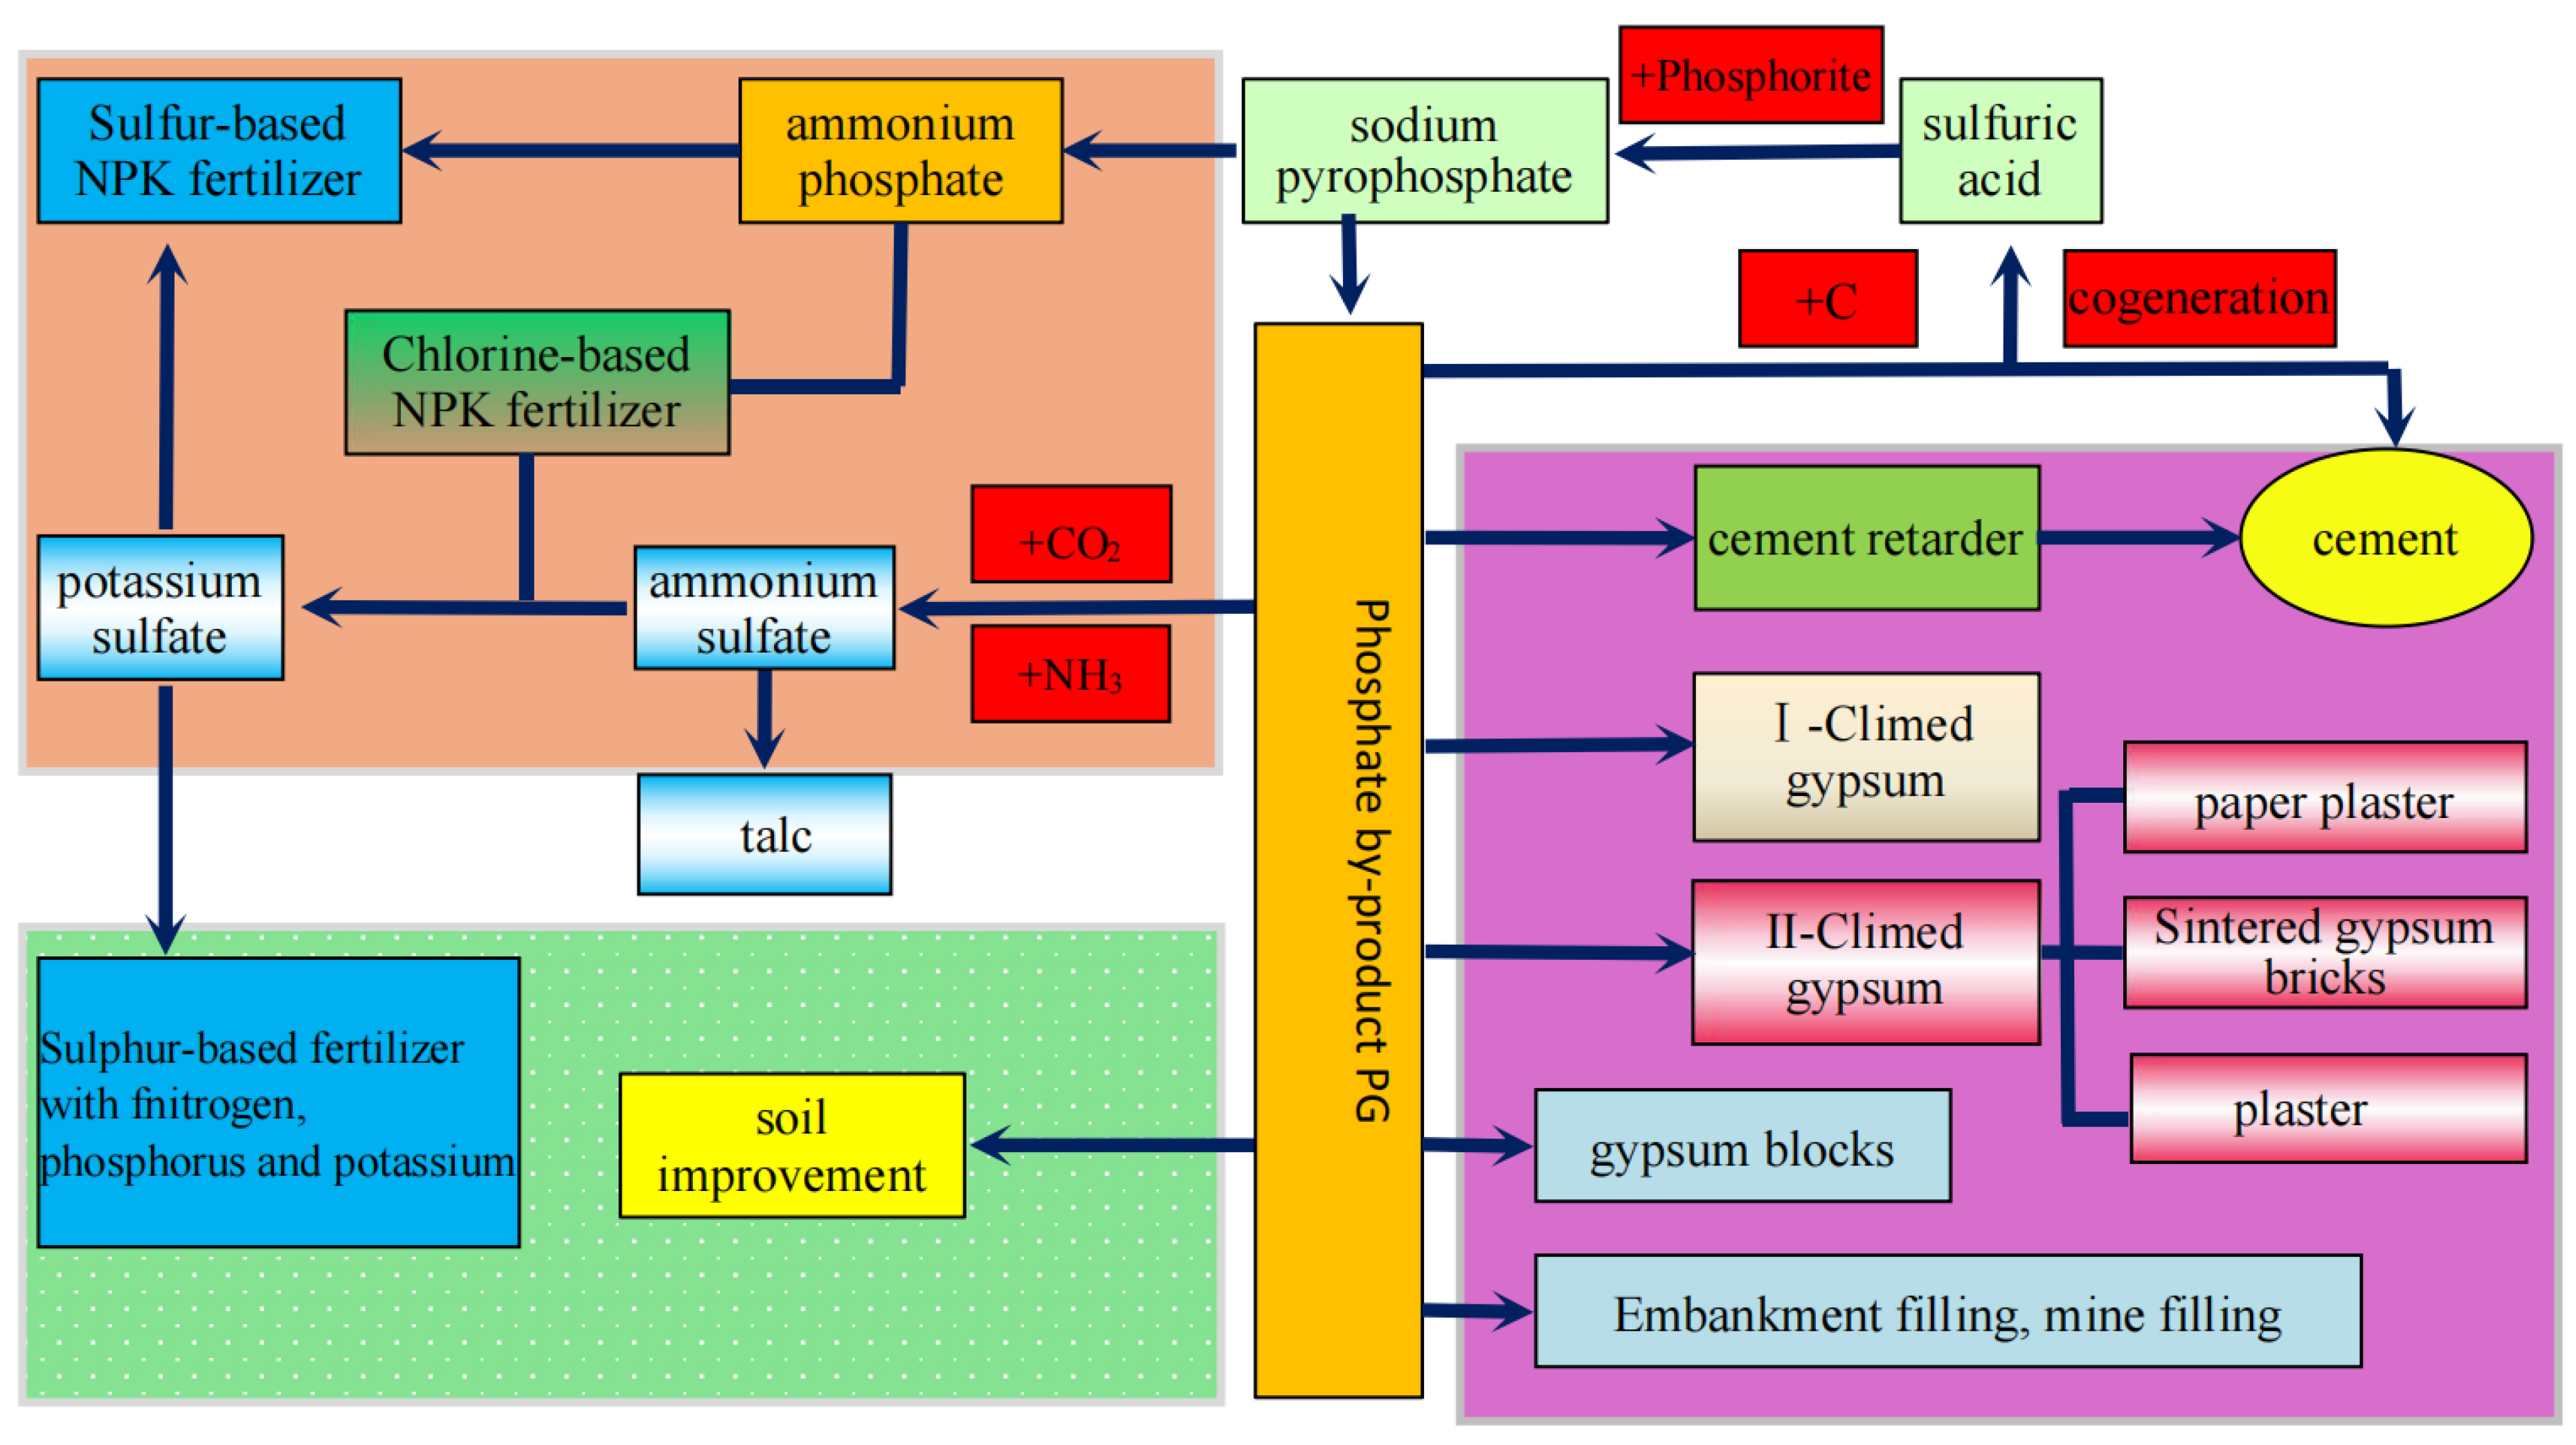
In recent years, the comprehensive utilization of PG in China has mainly been in the three fields of chemical industry, agriculture, and building materials, as shown in Figure 2. The chemical industry consumes about 5% of the total, agriculture only about 2%, and the rest is basically used in the building materials industry.
Figure 2.
The application of PG.
In the construction sector, there are many ways to utilize PG to mitigate the issue of PG, which can be utilized in the production of a variety of cements. These include applications in bricklaying, cementitious materials, embankment filling, and mine backfilling. Upon hydration, PG-based cementitious materials can solidify into a stone-like mass, effectively binding other materials and alleviating the burden of PG accumulation.
The different composition, mineral admixture, and particle size of PG cementitious materials cause the cementitious materials to possess different original porosity and permeability. Specifically, the mineral admixtures related to the study of PG cementitious materials are mainly focused on quicklime [1], fly ash, cement, blast furnace slag [2], steel slag, red mud [3], and oily sludge [4], hemihydrate PG (β-HPG) [5,6], lithium slag [7], dredged soil [8], preparation of concrete, cement mortar [9], and geo-coagulants, and the cutting-edge research mainly involves mechanical properties, pore structure, permeability, and road filling [10].
Ding [11] proposed that the increase in strength of the cementitious material is primarily due to the cementing action of hydration products and their pore-filling effect within the matrix. Additionally, the MIP data showed that adding more cementitious material and extending the curing time improved the pore structure, resulting in a lower total pore volume, smaller average entrance pore diameter, and reduced D-p50.
PG accounts for 30% of the cementitious materials in concrete, which can improve the mechanical properties of the material, reduce porosity, and enhance the microstructure of the material [12]. Increasing the cement content can significantly enhance the water resistance and adhesion of PGCM. However, the increase in cement production reduces the economy.
PG, red mud, fly ash, and other solid wastes were mixed [13], and the addition of PG significantly increases the compressive strength and permeability of MgO-activated slag and bentonite mud in the early (7 days) stage [14]. The combined addition of RM and PG had a synergistic effect in promoting the hydration process and optimizing the pore structure, thereby establishing a low-permeability, high-mechanical-strength matrix.
Li [15] developed a cementitious material using PG, granulated ground blast furnace slag (GGBS), and sulphoaluminate cement. The material set rapidly, released relatively little heat during hydration, and produced high-strength mortar. It also helped immobilize harmful components in PG, including phosphate, fluoride, Cr, and Ba.
Peng [16] examines how PG pH levels and particle fineness influence the mechanical properties of soil stabilized with cement and PG. A classification standard for road-use PG was established based on analyses of the mechanical properties of cement-PG-stabilized soil.
For PG- and blast furnace slag-based cementitious materials, the hydration of PG-GBFS can be enhanced by adding nano-calcite, thereby effectively improving the early strength [17]. The hydration products, such as ettringite (AFt) and C-S-H cementitious material generated by NaOH-activated slag and fly ash, can effectively fill the pores of HPG paste, thereby improving its mechanical properties [18].
For iron tailings and PG, the prepared cementitious material, which produces more Ca6[Al(OH)6]2(SO4)3·26H2O (calcium vanadium), can effectively reduce the porosity of the cementitious material and improve the compressive strength of the cementitious material [19].
PG as a sulfate exciter [20] can significantly improve the compressive strength of “slag-PG-steel slag” cementitious materials at 3 and 7 days, and the fineness of slag has a significant effect on the cementitious materials [21].
In Wei Xing’s study [22], a compound cementitious material was prepared from PG, anhydrite gypsum, steel slag, and silicate cement (P.II 52.5) by adding a small amount of synergist, which has a 28-day compressive strength of up to 51.5 MPa, and to a certain extent reduces the use of P.C32.5 cement.
Nie [23] modified PG-based cementitious materials by incorporating polyacrylic acid polymers and found that the 28-day compressive strength of the samples reached 47.5 MPa at a 40% PG mass fraction, which was 25% higher than that of the unmodified samples.
Liu Dongmei et al. [24] used PG, phosphorus slag, and cement clinker as raw materials in the mass ratio of 20:72:8, and mixed them with water glass in a mass fraction of 1.5%, and produced a composite cementitious material with a compressive strength of 43 MPa at 28 d. Adding hollow glass microspheres to the PG-based composite cementitious material in varying amounts will reduce its strength [25].
Despite extensive research on PG-based cementitious materials, two critical knowledge gaps remain: (1) Most published studies focus on treated or neutralized PG (e.g., calcined, water-washed, or chemically modified). The use of raw (untreated) PG is more economically attractive and requires less pre-processing energy, but its effects on cementitious material performance and pore structure are not well understood. (2) While basalt fiber is known to improve the tensile and flexural performance of cementitious composites, its combined use with raw PG—where it may partially compensate for PG-induced strength reduction—has not been systematically studied. Basalt fiber was chosen because of its chemical resistance in high-sulfate environments typical of PG-rich matrices, in contrast to steel fibers, which may corrode. Furthermore, the quantitative relationship between microscopic pore structure and mechanical properties in raw PG/basalt fiber composite systems has not been established. Six PG levels (0%, 3%, 6%, 9%, 12%, and 15%) were chosen to systematically cover the range from trace addition to significant replacement, enabling a continuous analysis of the dose–response relationship and identification of practical threshold values.
“Raw PG–basalt fiber cementitious materials” is a composite produced by binding raw PG, basalt fibers, sand, aggregate, and other constituents together with cement and water. In this work, RPG-BF cementitious materials with different PG replacement ratios were prepared, and the resulting changes in their mechanical properties were investigated. This research integrates mechanical testing and microanalysis to assess the influence of PG content on the mechanical performance of RPG-BF concrete and to elucidate the underlying mechanisms.
2. Materials and Samples
2.1. Raw Materials
The cement used in this study was P.O. 42.5 ordinary Portland cement, supplied by Luzhou Said Cement Co., Ltd. (Luzhou, China) The manufacturer’s technical datasheet states that the cement’s initial setting time is 125 min, with a final setting time of 223 min. Its 7-day flexural strength is 6.1 MPa, while the 7-day compressive strength reaches 33.8 MPa. The estimated 28-day compressive strength is 50.7 MPa. These values are reported as reference product information and were not independently verified in this study.
In contrast, the chemical composition, specific surface area, and specific gravity of the cement were independently determined by the research team in accordance with GB/T 176-2017 [26] and GB/T 8074-2008 [27]. The results showed that the fineness of the cement was 365 m2/kg, and the specific gravity was 3.14. Table 1 shows the cement’s chemical composition. The basalt fiber was purchased from Shandong Hengtai New Material Technology Co. (Zibo, China).
Table 1.
Cement chemical composition and content.
Table 2 lists the manufacturer’s data in this study. In particular, the reported alkali resistance of 94% refers to the tensile strength retention ratio after alkali exposure testing, according to the manufacturer’s test specification.
Table 2.
The parameters of the physical properties of basalt fibers from the manufacturer.
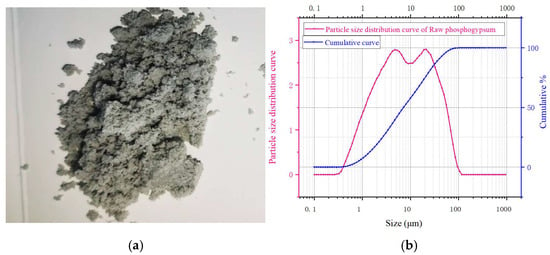
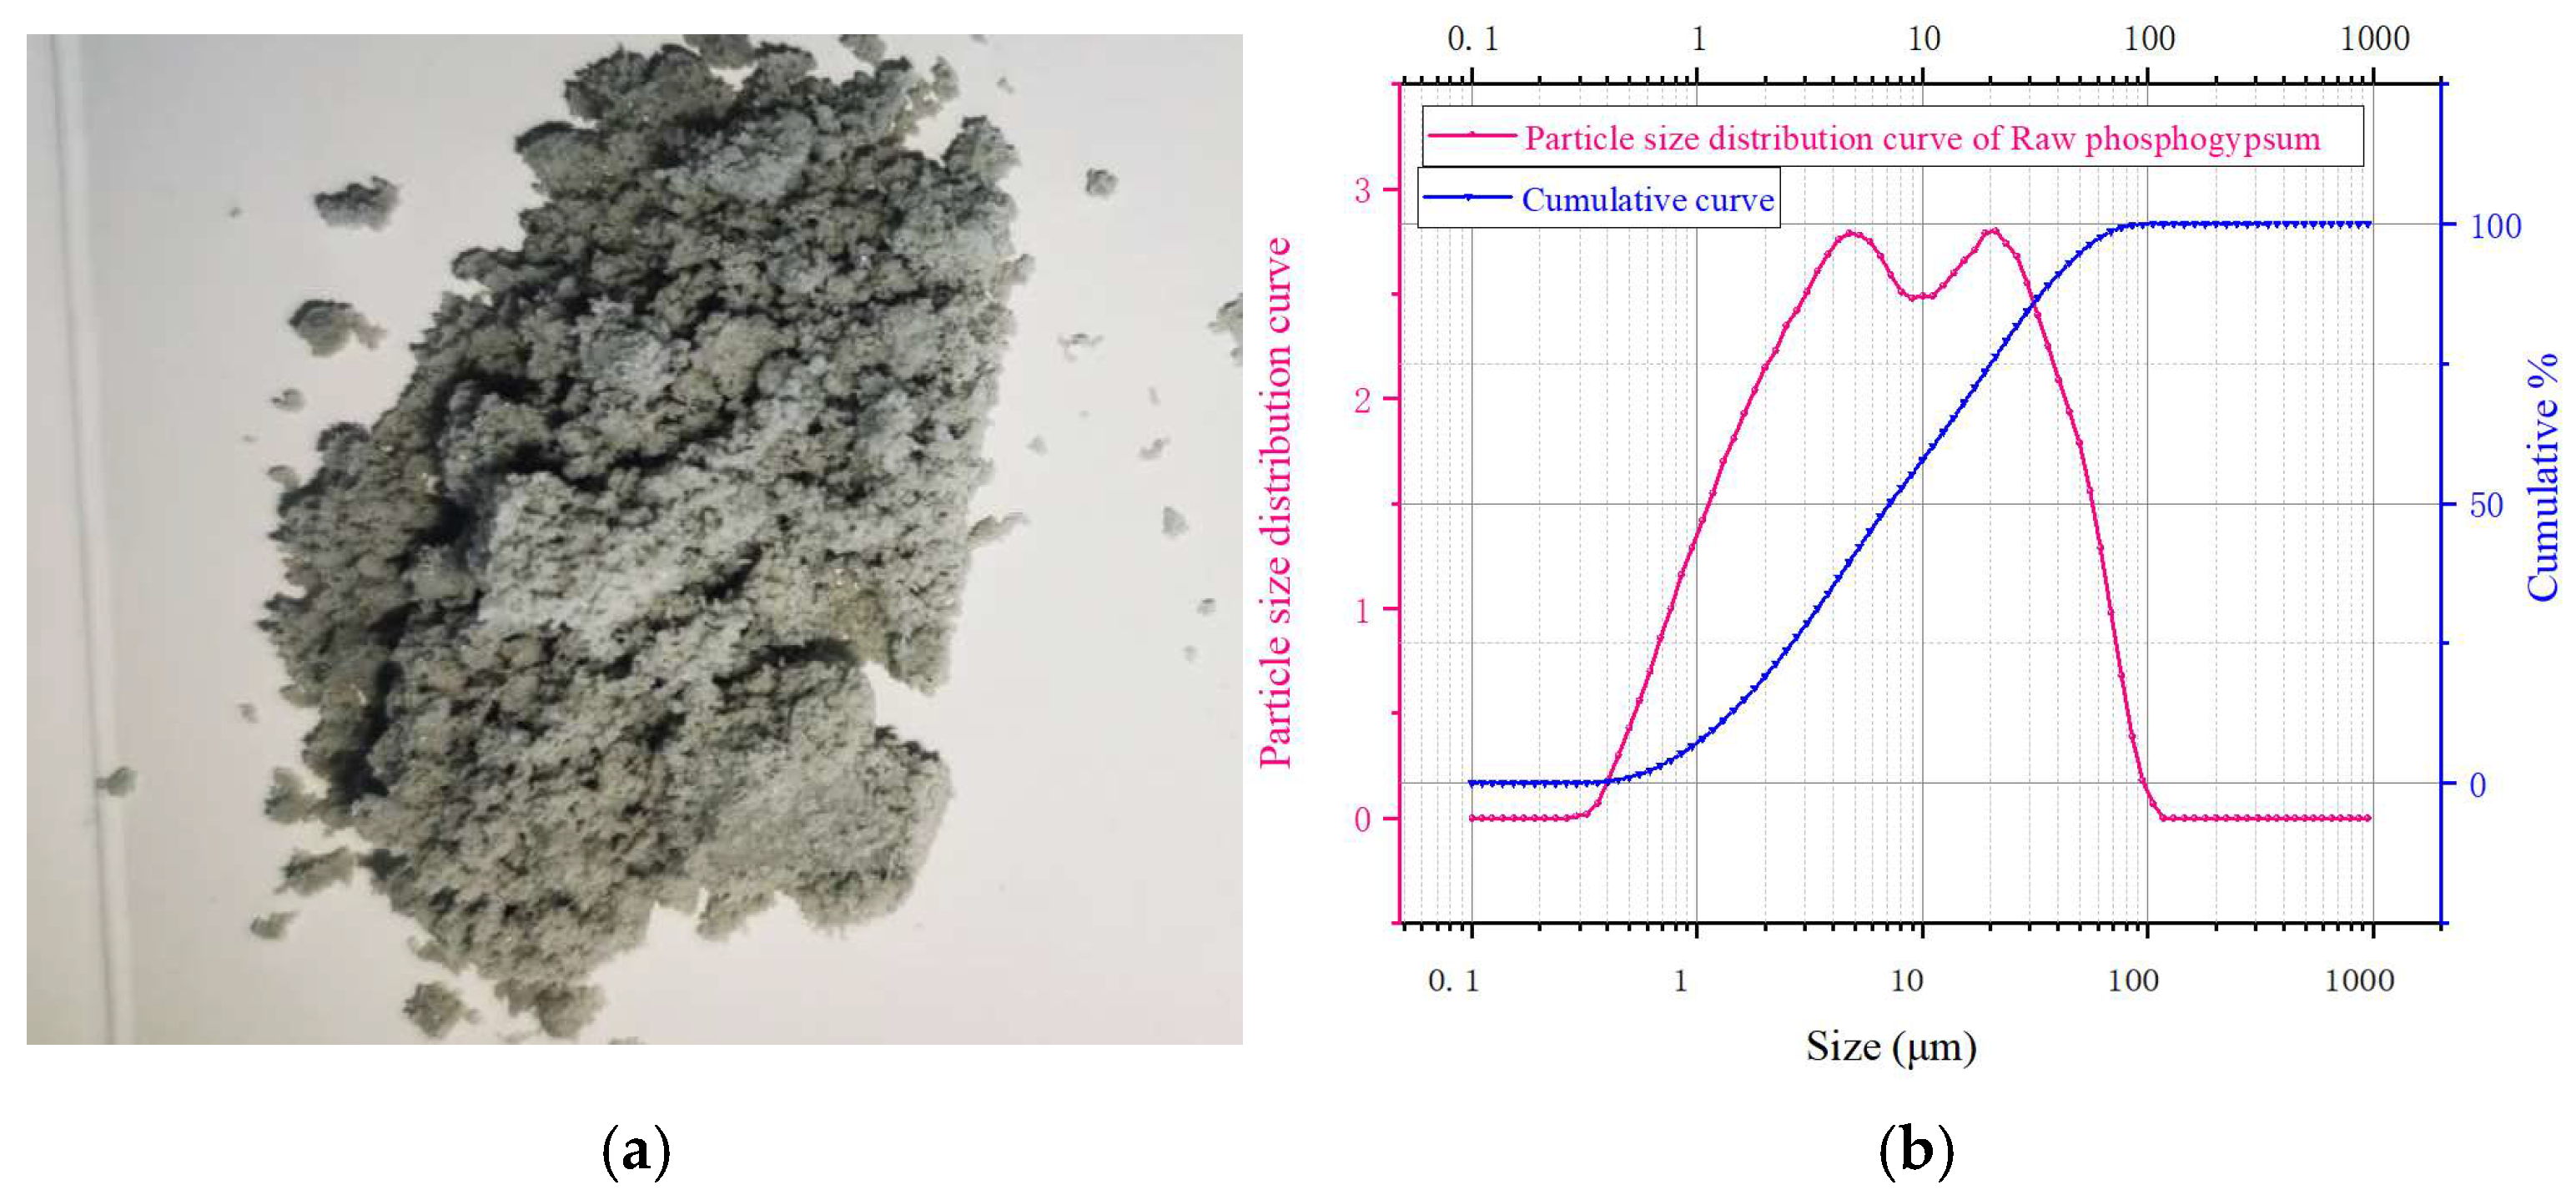
The main constituents of “raw PG–basalt fiber cementitious materials” include sand, fly ash, cement, and raw PG. The PG used in the test was provided by the Guizhou Phosphate Green Environmental Protection Industry Company (Guizhou, China), as shown in Figure 3. The main components of the PG are P2O5, SO3, CaO, SiO2, Al2O3, and Fe2O3, and the proportions are shown in Table 3. The particle size distribution of PG measured by the laser particle size meter (the instrument is marked: Bettersize 3000Plus, Dandong Bettersize Instruments, Dandong, China) is shown in Figure 3b. The particle size distribution was characterized by D10 = 3.2 μm, D50 = 18.6 μm, and D90 = 68.4 μm, indicating a moderately broad gradation that is typical of unprocessed phosphogypsum.
Figure 3.
(a) PG in its original form. (b) The PG particle size distribution and cumulative distribution curve.
Table 3.
Composition and content of raw PG minerals.
The mechanism of sand and fly ash used in the test is prepared by the Guizhou Province “Granite” building materials company, according to the “common concrete sand, stone quality, and test method standards (JGJ 52-2006)” [28] as revealed by the Guizhou Province Building Materials Products Quality Inspection and Testing Institute’s test results, as shown in Table 4 and Table 5.
Table 4.
The test results of sand.
Table 5.
The “Fly ash” test results.
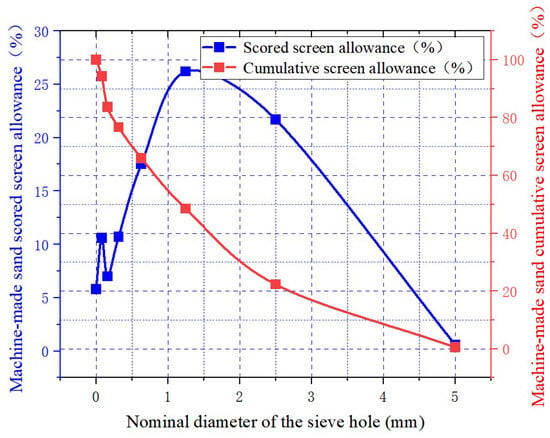
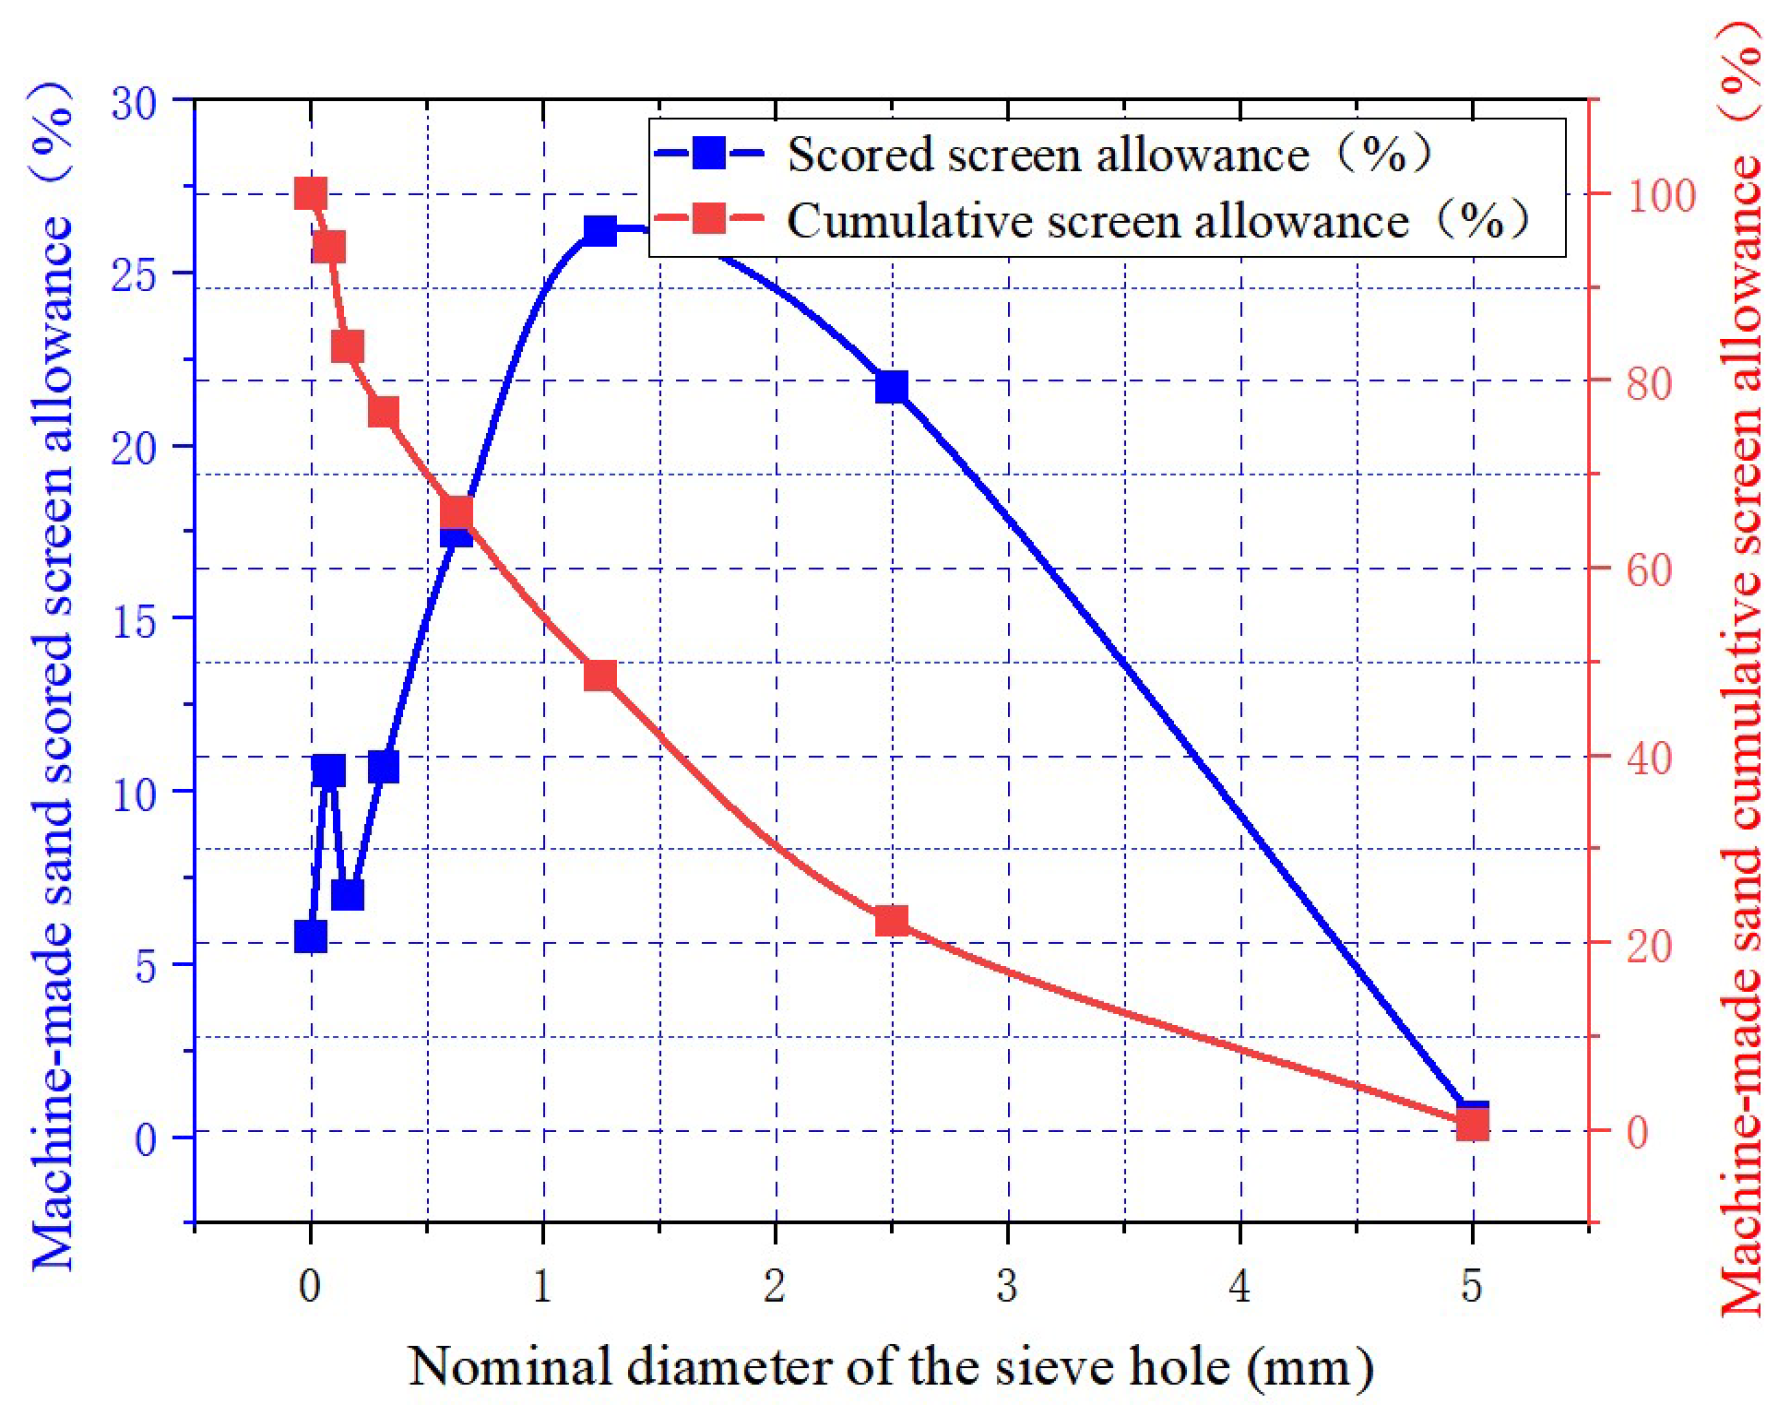
The cumulative distribution and particle-size distribution ranges of manufactured sand can depict its grading characteristics and particle composition, serving as key parameters for evaluating its engineering suitability. In this project, the particle-size distribution of the manufactured sand was measured, as shown in Figure 4. According to Figure 4, the manufactured sand exhibits a continuous distribution with no significant gaps, and the fractions of the fine and coarse particles are well-balanced.
Figure 4.
The grading curve and cumulative passing distribution of the manufactured sand.
2.2. Sample Preparation
The test specimens of RPG-BF cementitious materials have the following coordination: a water–binder ratio of 0.39, a cementitious material of 380 kg/m3, and a sand rate of 56%, as listed in Table 6. A total of 6 groups were designed with different PG contents (0%, 3%, 6%, 9%, 12%, and 15% of cementitious material). According to the mix proportions listed in Table 6, we weighed each material to an accuracy of 0.01 kg. We transferred the weighed binder materials into the mixing bowl in sequence, added water, and mixed for 90 s. Then, we added the standard sand and continued mixing until the program was complete. Immediately after mixing, we cast the paste into standard three-gang mortar molds, compacted it on the vibrating table, and struck off the excess material with a straightedge. Due to the low early strength of PG-based binders, demolding was difficult; therefore, we left the specimens in the standard curing chamber for 48 h before demolding, then cured them to the specified ages for mechanical testing. The specimens were cured at 20 ± 2 °C with a relative humidity of ≥95%.
Table 6.
The mixing ratios for the RPG-BF cementitious structures.
In the mix proportions shown in Table 6, basalt fiber has a chemical composition similar to that of the cement matrix and a matching coefficient of thermal expansion. Its high tensile strength and elastic modulus allow it to form a three-dimensional “micro-reinforcement” network within the binder, markedly improving flexural, tensile, impact, and fatigue performance. The basalt fiber dosage was fixed at 2 kg/m3 (approximately 0.1% by volume) for all mixtures. This dosage was selected to provide a representative fiber-reinforced condition while maintaining an adequate workability and minimizing the risk of fiber agglomeration. In the present study, the fiber dosage was intentionally kept constant so that the effect of the PG replacement ratio on the mechanical properties and the pore structure could be evaluated under the same fiber-reinforced background. The aggregate, mainly crushed stone, carries 70–80% of the compressive load in the binder and limits shrinkage deformation. Sand is primarily used to fill the voids between coarse aggregate particles, creating a continuous gradation and reducing the amount of cement paste required. PG mainly fills the pores at the sand interface, lowers porosity and reduces cement consumption. Replacing part of the sand and cement with PG enables waste utilization and cuts carbon emissions.
3. Test Program
3.1. Mechanical Performance Test Method
According to the “Standard for Test Methods of Physical and Mechanical Properties of Concrete” (GB/T 50081-2019) [29] each mix proportion is cast as follows: six 100 × 100 × 100 mm3 cubes for determining the 7-day and 28-day compressive strengths; three 150 × 150 × 150 mm3 cubes for the splitting-tensile test; three 100 × 100 × 400 mm3 prisms for the flexural strength test of the cementitious matrix; six cylinders measuring 10 mm in diameter and 300 mm in height are utilized to characterize the internal pore structure of the cementitious materials through low-temperature liquid nitrogen adsorption.
3.2. Low-Temperature Liquid Nitrogen Adsorption Test
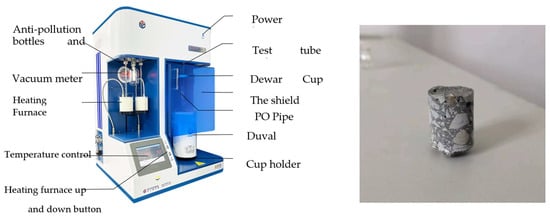
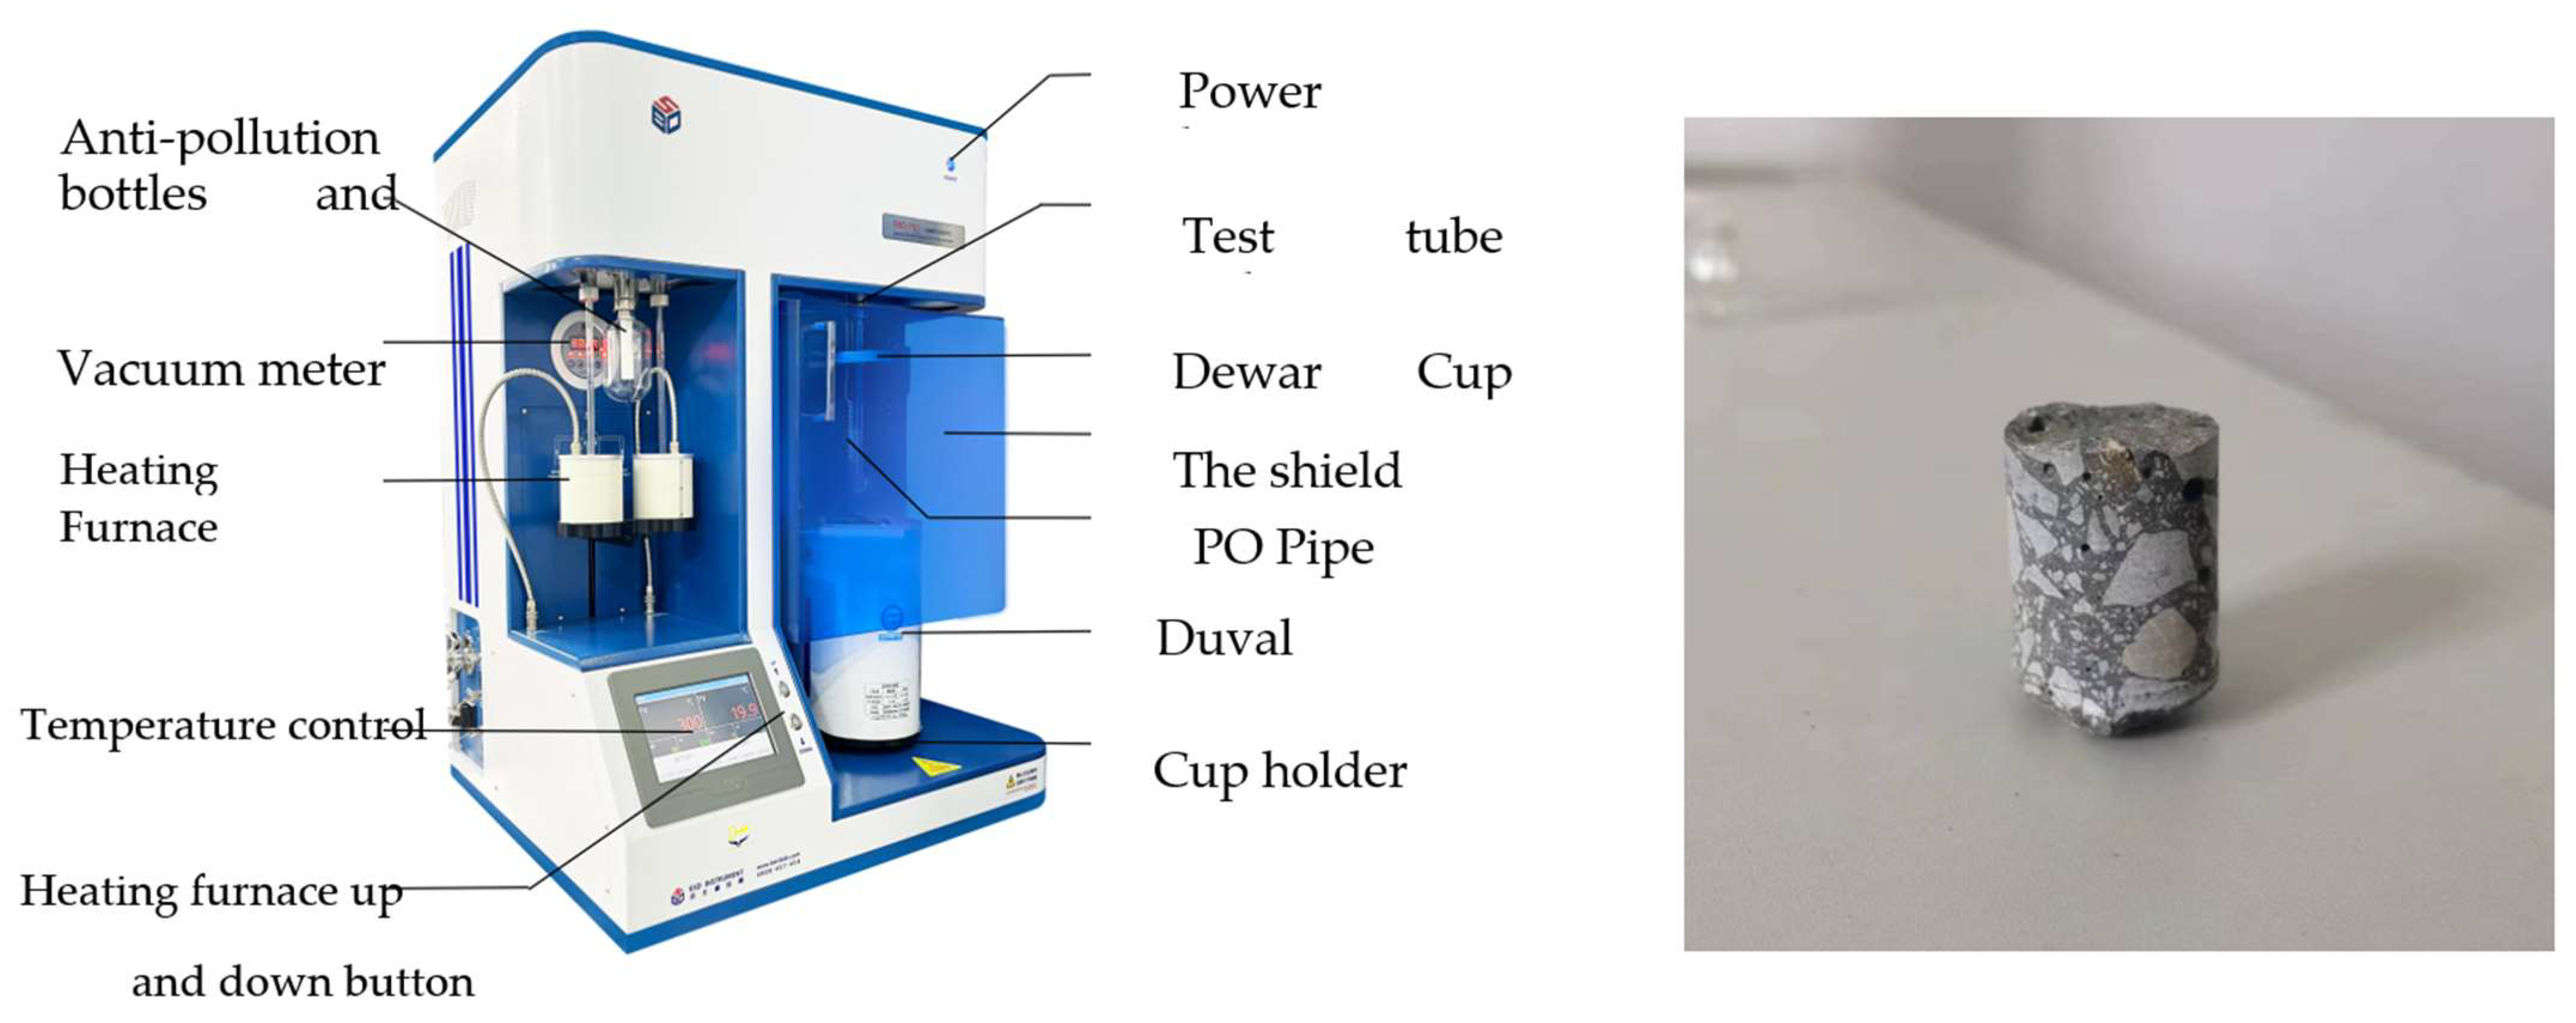
Based on the principle of gas adsorption (nitrogen adsorption), the BSD-PS1/2 series, which comprises fully automated analyzers for specific surface area and pore size (shown in Figure 5), was used to experimentally determine the parameters of the specific surface area, pore volume, pore diameter, pore distribution, etc., and to perform the analysis of isothermal adsorption and desorption. N2 was used as a test adsorbate. Cubic samples of approximately 1 cm3 were cut from the interior sections of the cured cylindrical specimens and used for LNA characterization. Prior to conducting the measurements, the samples were subjected to degassing at 80 °C for a duration of five hours under a vacuum of approximately 10 Pa. This degassing temperature was selected following the established protocols for cementitious materials in nitrogen adsorption analysis [30], which recommend 80 °C as a balance between the effective removal of physically adsorbed water and avoidance of significant thermal damage to hydration products. While marginally elevated temperatures may affect thermally sensitive phases such as ettringite, this pretreatment was applied consistently and identically to all six sample groups, ensuring that relative comparisons between groups remain valid. The mass difference prior to and following vacuum degassing was documented. Subsequently, the samples were transferred to the adsorption station for gas adsorption testing. The minimum threshold for determining the specific surface area was 0.0005 m2/g, with no specified upper limit. The pore size range examined extended from 0.35 nm to 500 nm. The adsorption temperature was maintained at 77.3 K, supplied by a Dewar’s cup filled with liquid nitrogen.
Figure 5.
The specific surface area pore size analyzer (BET analyzer: BSD-PS1/2) and experimental sample shape.
3.3. Scanning Electron Microscope (SEM) Test
To further elucidate the characteristics of the internal pore structure within the cementitious matrix of RPG-BF, specimens with a 28-day strength were selected for sectioning and polishing. The micro-morphology was observed using a field emission scanning electron microscope, with a resolution of 0.8 nm, an accelerating voltage ranging from 0.2 to 30 kV, a magnification power between 35 and 900,000 times, and detectors including ETD, TLD, and CBS. The microscope featured a continuous rotation with R = 360 degrees to facilitate the comprehensive observation of the microstructure.
3.4. X-Ray Diffraction (XRD) Analysis
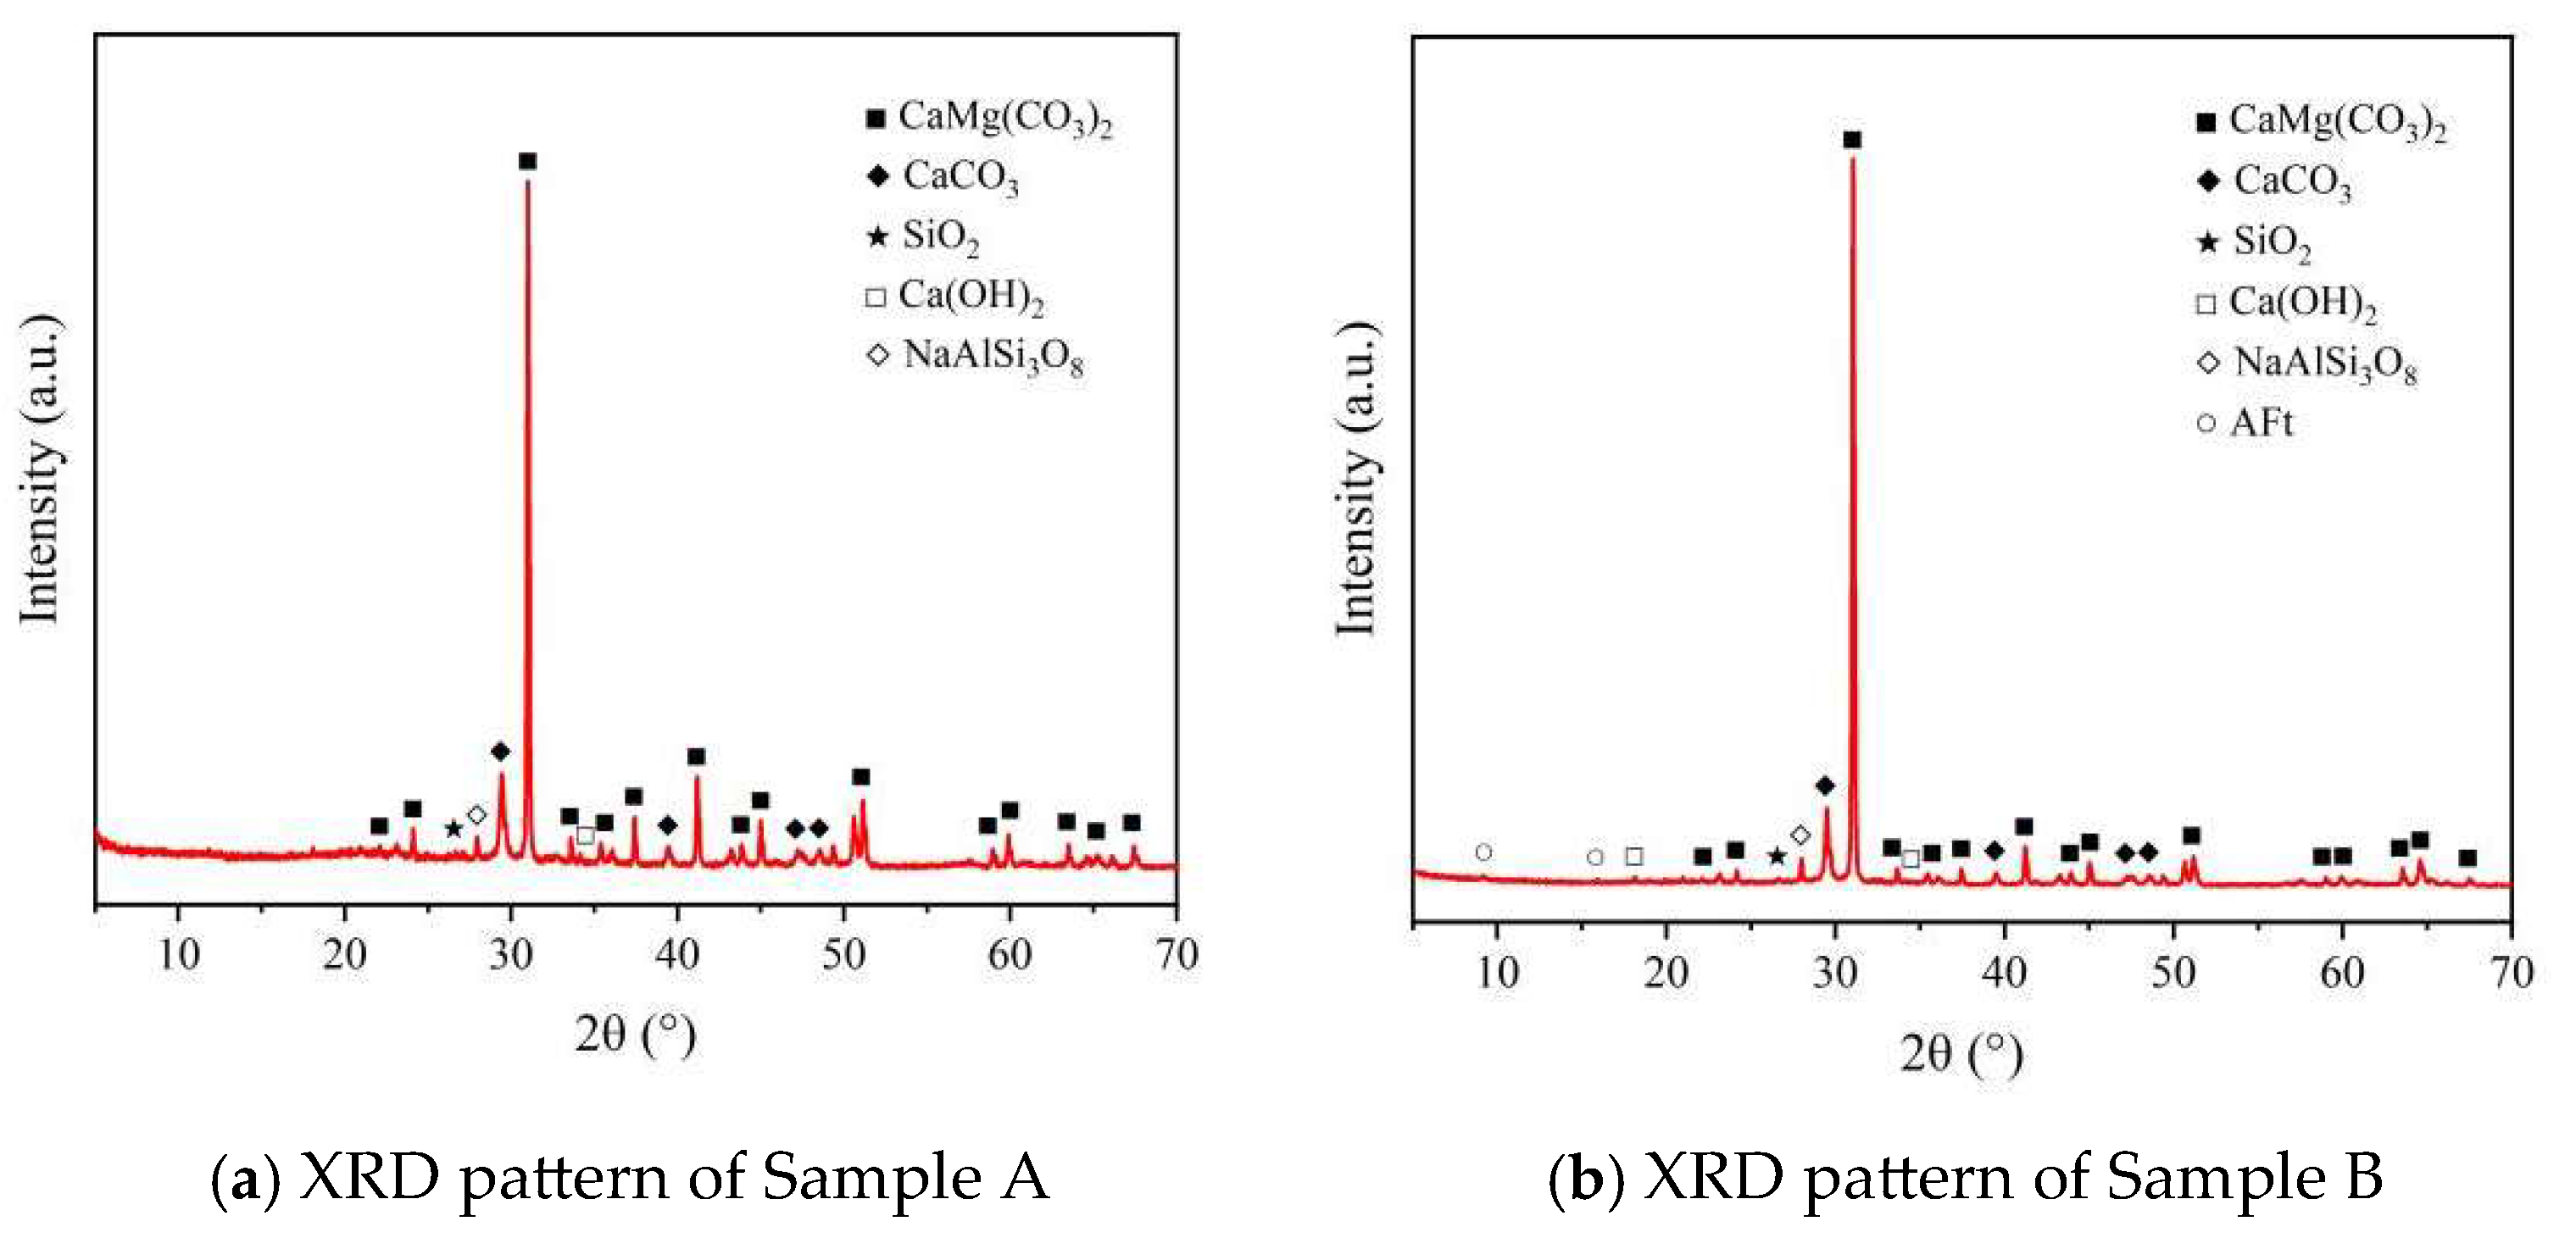
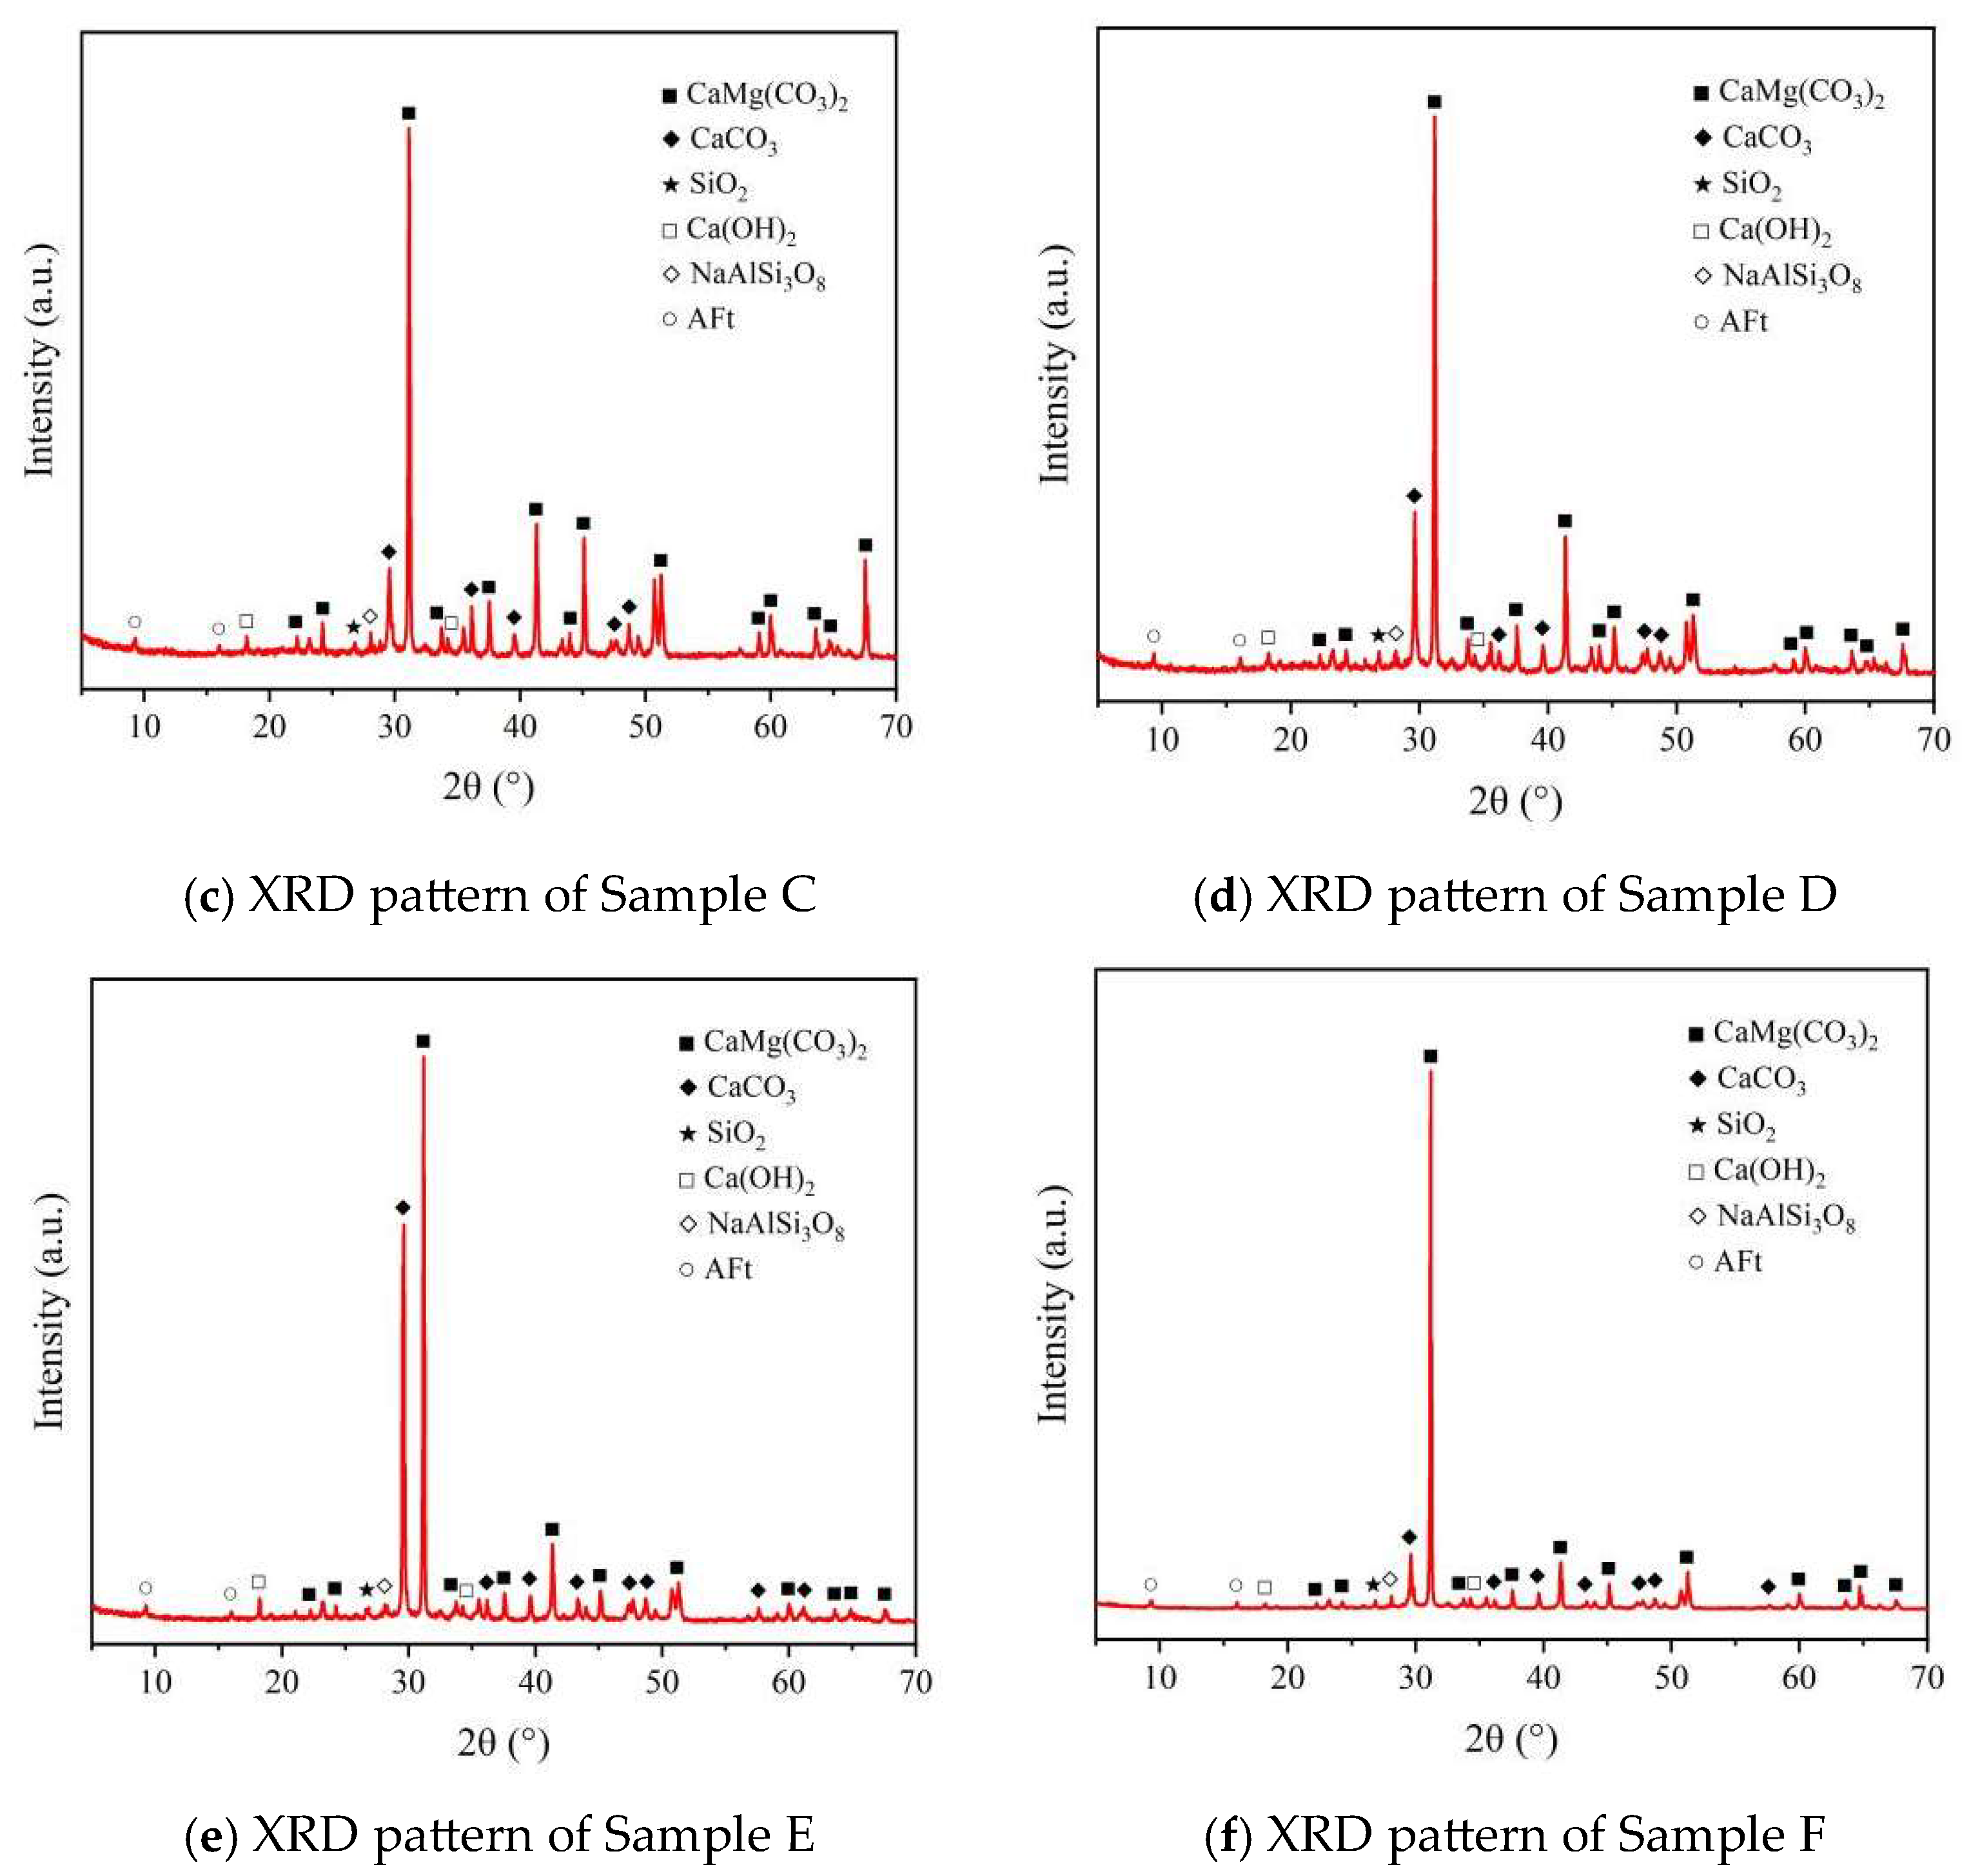
X-ray diffraction (XRD) analysis was conducted to characterize the phase composition of the RPG-BF cementitious materials with different PG replacement ratios. Powder samples were taken from the interior of the 28-day-cured specimens. Before testing, the coarse aggregate was removed as much as possible, and only the binder-rich portion was retained for phase analysis. The selected material was dried, ground, and sieved to obtain a fine powder with a particle size smaller than 40 μm (approximately 320 mesh) so as to reduce preferred orientation and improve diffraction accuracy.
The XRD measurements were performed using Cu Kα radiation (λ = 0.15406 nm). The X-ray tube voltage and current were set to 40 kV and 40 mA, respectively. The diffraction data were collected over a 2θ range of 5–80°, which is suitable for identifying the major crystalline phases commonly present in cementitious systems, such as quartz, calcite, ettringite, and portlandite. The scan was carried out with a step size of 0.02° and a scanning rate of 2°/min.
4. Analysis of Test Results
4.1. Mechanical Performance Test Results
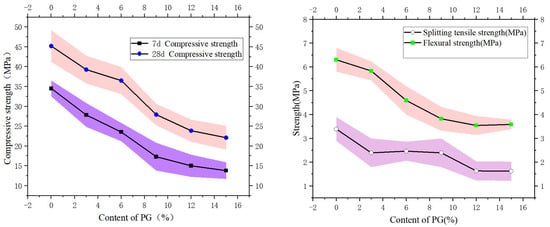
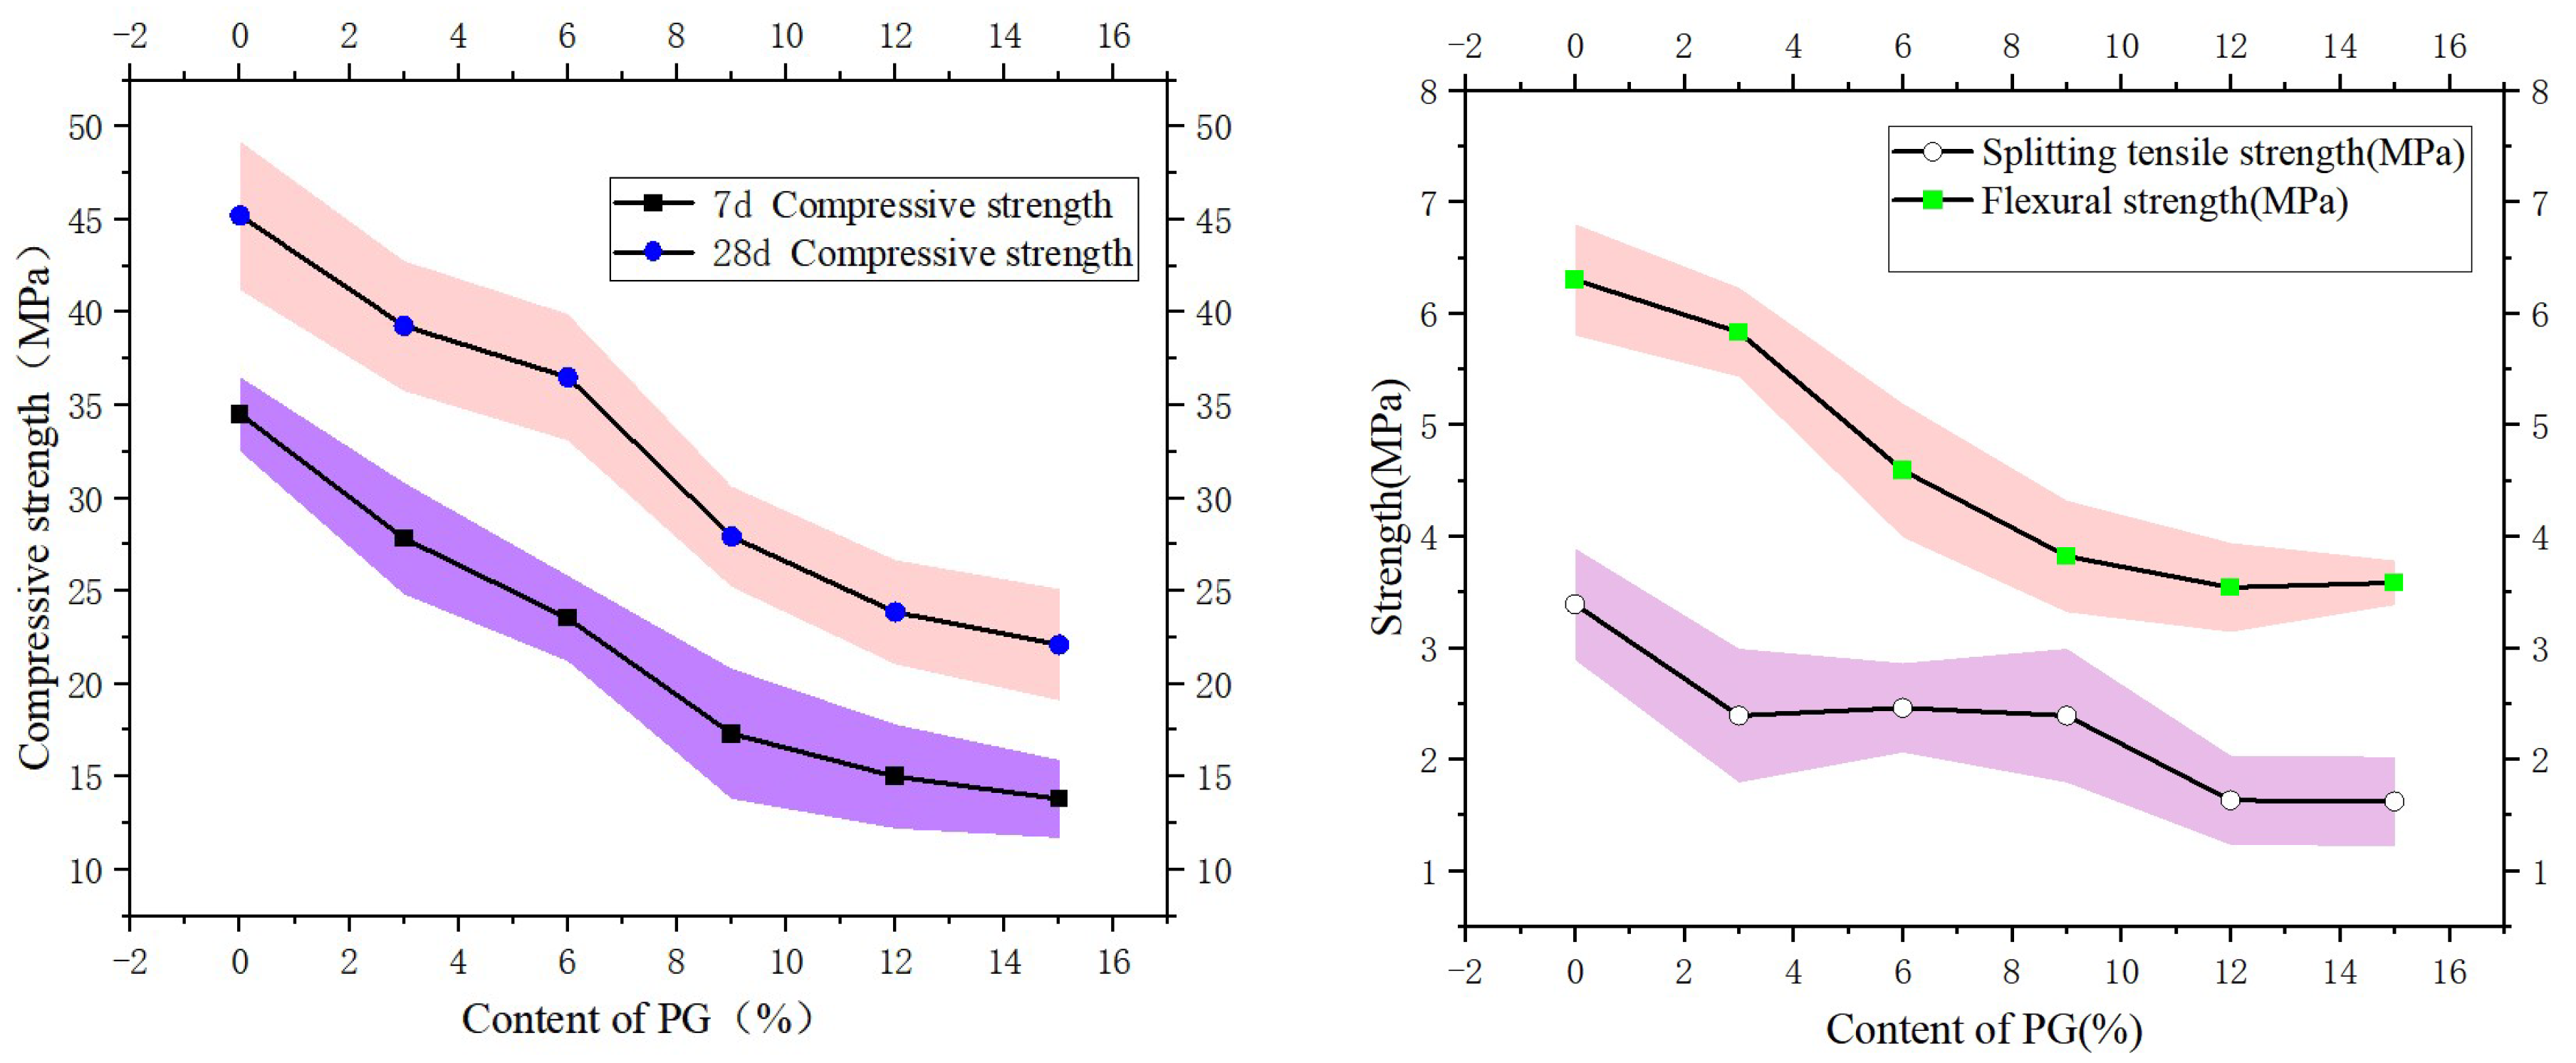
The mechanical properties of RPG-BF concrete with different PG dosages were evaluated in accordance with GB/T 50081-2019 [29]. Six groups of specimens (RPG-BF A–F) were tested for 7-day and 28-day compressive, splitting tensile, and flexural strengths, with the corresponding results shown in Figure 6. The experiments were performed in the Building Materials Laboratory of the Guizhou Institute of Technology using a 500 kN computer-controlled electro-hydraulic servo testing machine at a loading rate of 0.15 mm/min. The measurement and recording systems were connected to the computer by the displacement gauge and pressure sensor of the universal servo-hydraulic machine to display the stress size in real time.
Figure 6.
The effect of PG content on the mechanical properties of RPG-BF; the compressive strength data are shown with standard deviation-based colored error bands.
Figure 6 shows the error band diagram for compressive strength. The method is as follows: During compressive strength testing, each test group contains three specimens. The arithmetic mean of these three specimens serves as the representative value. When the maximum or minimum measured value deviates from the median by more than 15%, that value is regarded as an outlier and excluded, followed by testing a new specimen. The final compressive strength is documented as the arithmetic mean of three valid test results. Based on the actual measured compressive strength values, the standard deviation of the samples is calculated. Figure 6 shows the compressive strength results together with standard deviation-based error bands. The black curve represents the mean value, while the colored bands represent the upper and lower bounds of the error range.
As presented in Figure 6, increasing the PG replacement ratio from 0% to 15% led to a gradual deterioration in the mechanical properties of the RPG-BF cementitious materials. Relative to the control group, the largest reduction in compressive strength reached 52.22% in 7 days and 49.00% in 28 days. Despite the decline caused by PG incorporation, the 28-day compressive strength remained higher than the corresponding 7-day value. When PG content was below 8%, the rate of strength reduction was more pronounced, but after exceeding 10%, both 7-day and 28-day strength loss rates decreased. Two factors explain this behavior: (1) Particle packing effects—at higher PG replacement ratios, the finer PG particles partially fill interstitial voids between cement and fly ash grains, providing limited physical reinforcement that partially offsets the loss of cementitious bonding capacity. (2) Dilution saturation—beyond approximately 10% PG, further incremental dilution of the cement fraction produces a proportionally smaller marginal strength loss, consistent with the diminishing returns behavior observed in other solid waste substitution studies [11,12].
The 7d/28d compressive strength ratio decreases from 0.768 (0% PG) to approximately 0.63 at higher PG contents, implying that the inhibitory effect of PG is more pronounced during early hydration than during later hydration. This is consistent with the retardation of early hydration caused by excess sulfate and impurities in the phosphogypsum.
The splitting tensile strength decreased progressively as the PG content increased. From 0% to 15% PG, the splitting tensile strength decreased from approximately 3.21 MPa to 1.79 MPa, corresponding to an overall decrease of about 44%. A plateau was observed around 3–9% PG content, but the overall downward trend was consistent. The decline rate was relatively gradual compared to the compressive strength, but the overall reduction was substantial.
In practical engineering applications, PG content should be controlled at or below 9% to ensure that the 28-day compressive strength remains above approximately 30 MPa, meeting the minimum performance criterion for C30 grade concrete per GB/T 50081-2019. At 12% PG, the 28-day compressive strength falls to approximately 27.8 MPa, below this threshold. This recommendation is based on the experimental findings obtained under the conditions employed in this study (w/b = 0.39, 0.1% basalt fiber, specific local raw materials) and should be independently verified for other mix designs or application requirements. Additionally, according to the literature [31], PG content controlled between 1 and 3% can improve cement adaptability, extend concrete setting time, and enhance the physical properties of cement, which represents a fundamentally different application scenario compared to the high PG replacement levels investigated in this study.
4.2. Analysis of Characterization of Pore Shape Based on Nitrogen Adsorption–Desorption Isotherms
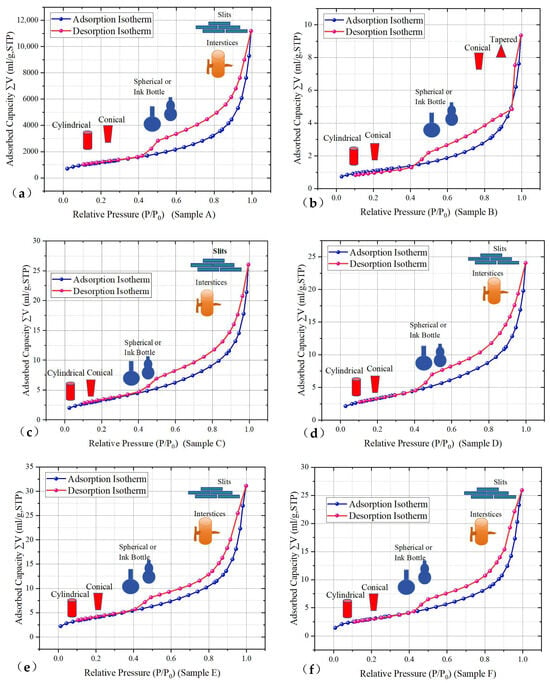
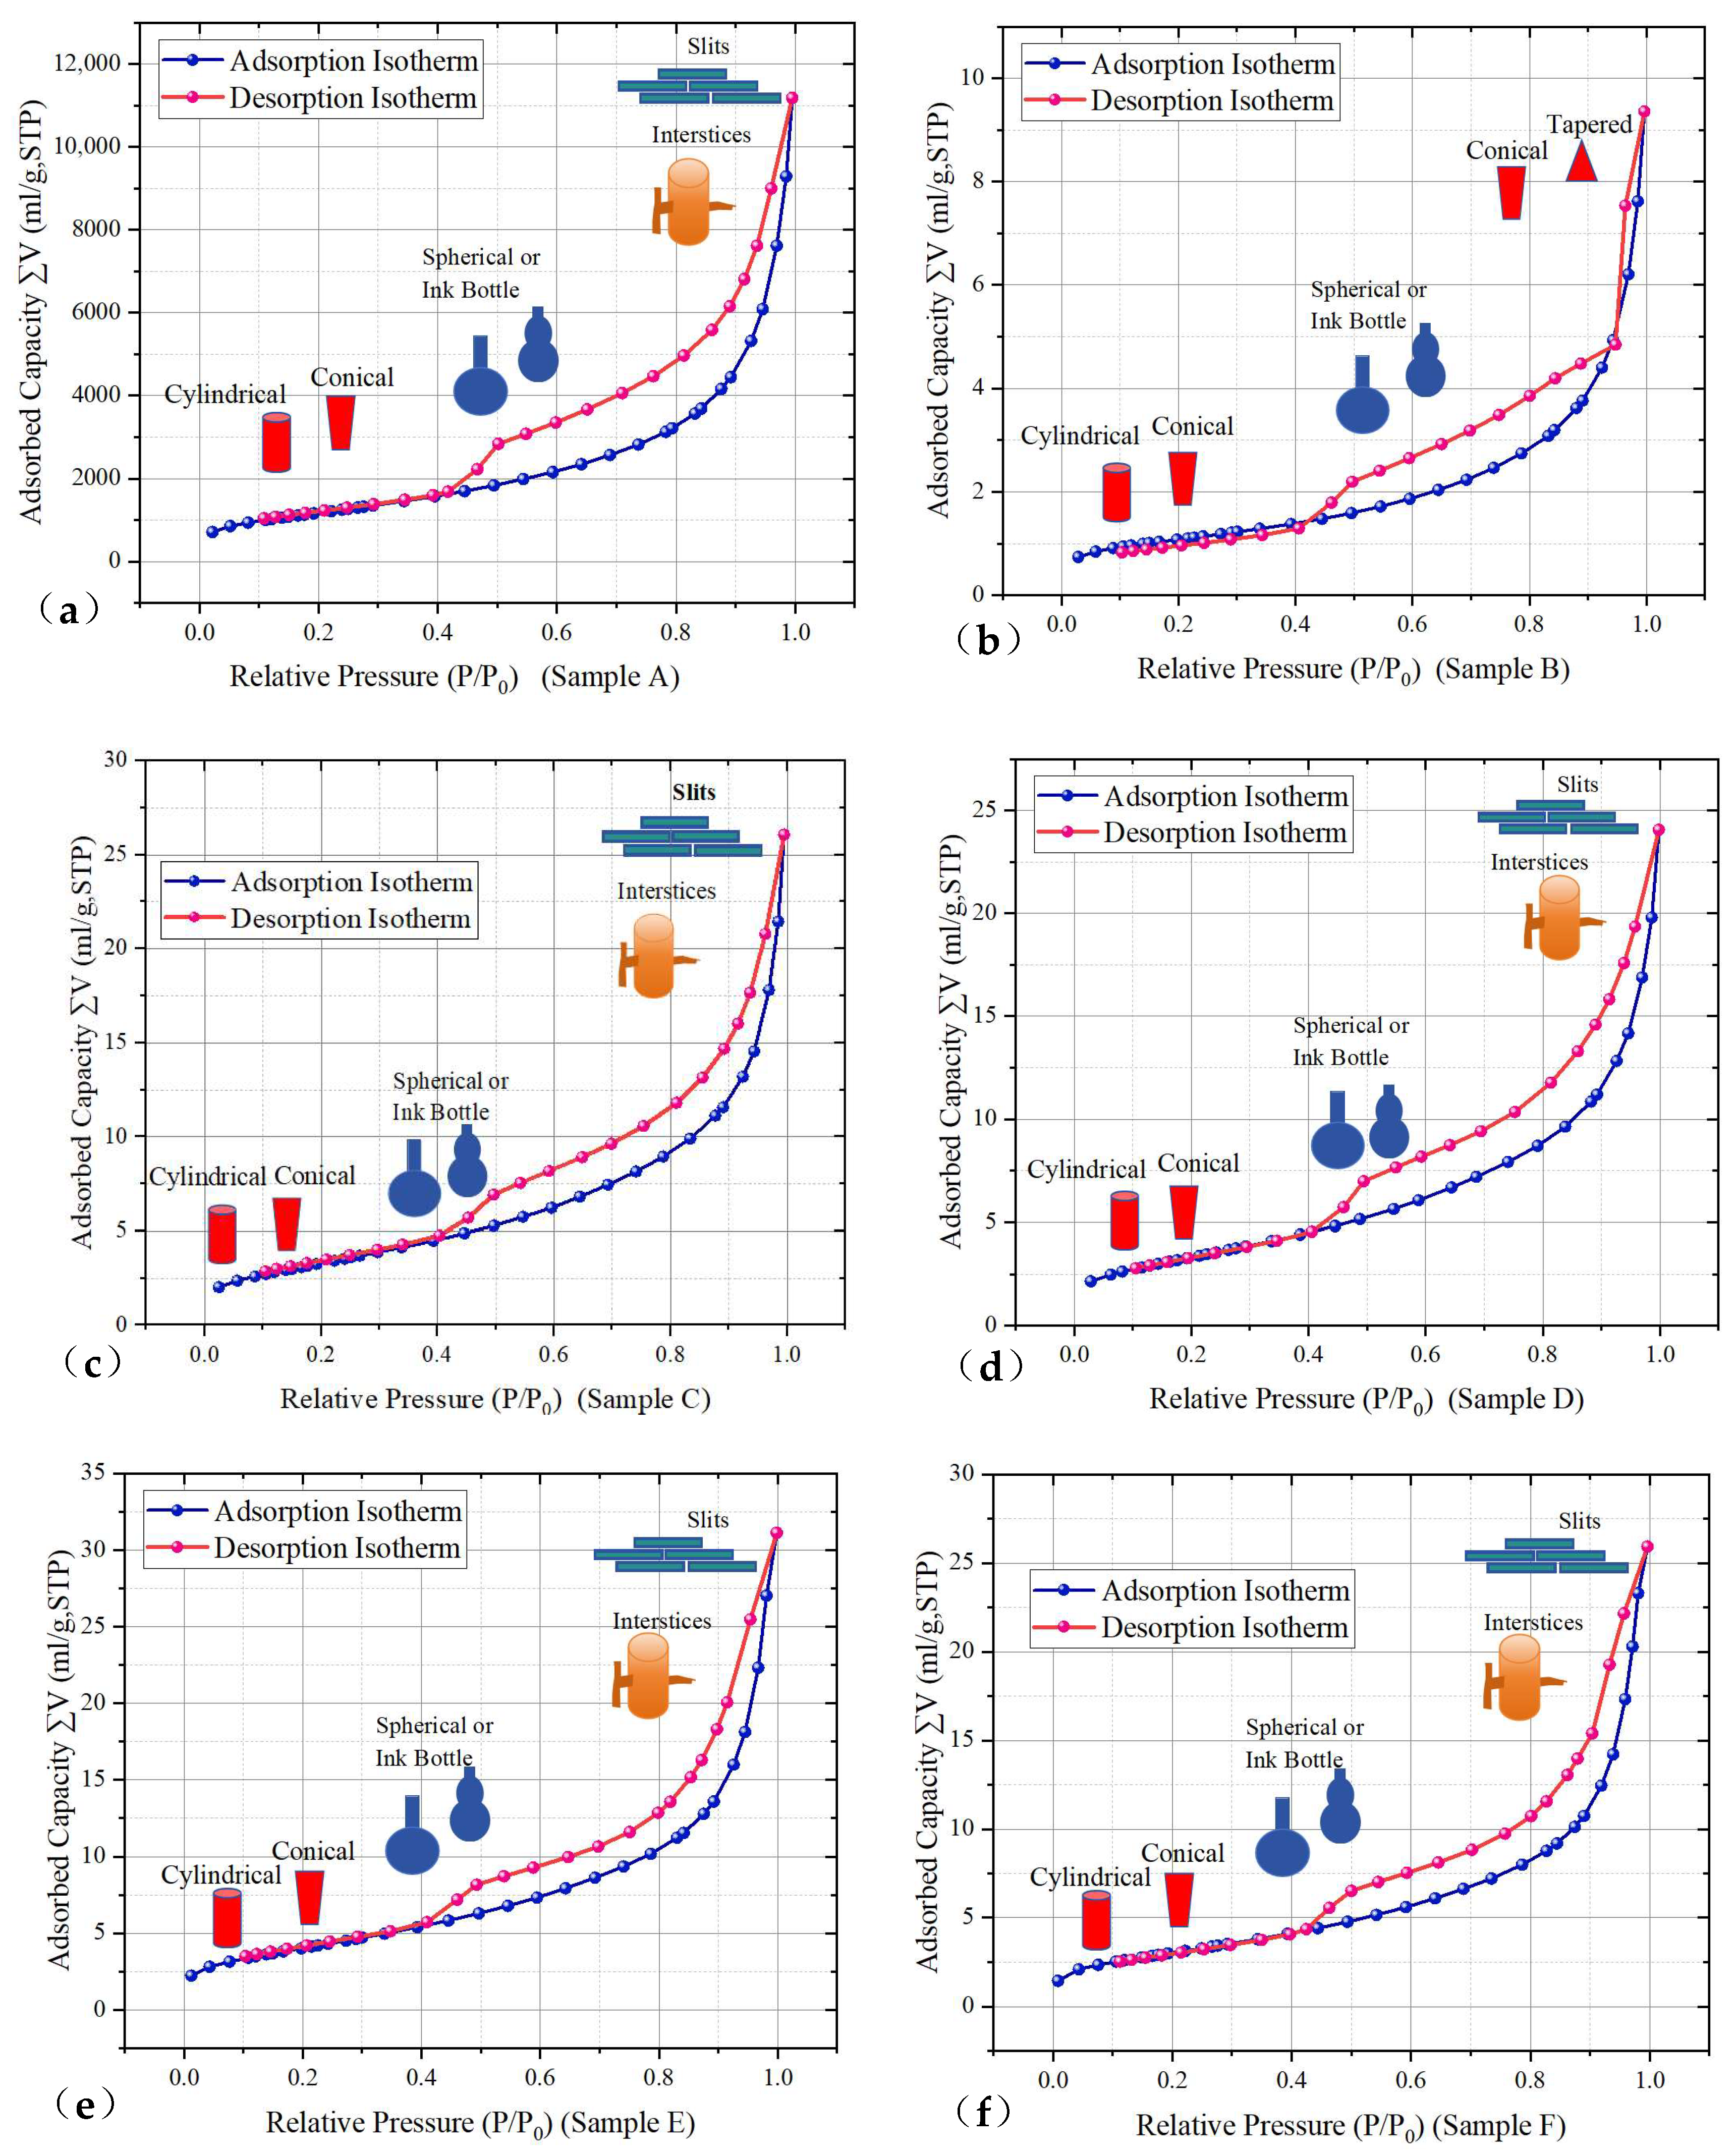
All six samples showed Type IV isotherms (Figure 7) according to the IUPAC classification, indicating the presence of a mesoporous pore system in the RPG-BF cementitious materials. At low relative pressure (P/P0 < 0.4), the adsorbed volume increases only slightly, and little separation is observed between the adsorption and desorption branches, suggesting that the process in this region is dominated by surface adsorption within the pore structure. In the intermediate relative pressure range, a clear hysteresis loop appears, reflecting capillary condensation in mesopores and suggesting a relatively complex pore structure. As the relative pressure approaches 1.0, the adsorption amount rises more rapidly, indicating the increasing influence of larger pores and interparticle voids. Overall, the isotherm results suggest that the pore structure of the RPG-BF cementitious materials is mainly characterized by mesopores, together with some larger pores and pore spaces associated with microcracks.
Figure 7.
The nitrogen adsorption–desorption isotherms of RPG-BF cementitious materials with different PG contents: (a) 0%, (b) 3%, (c) 6%, (d) 9%, (e) 12%, and (f) 15%. All curves exhibit Type IV isotherm characteristics with hysteresis loops, indicating the presence of mesopores and complex pore structures.
As shown in Figure 7a–f, in the low relative pressure region (P/P0 < 0.4), the adsorption capacity increases slowly, and the adsorption and desorption branches remain nearly overlapped. This suggests that the pore structure of the cementitious material is mainly composed of cylindrical and wedge-shaped pores. When the relative pressure reaches 0.4 (P/P0 ≥ 0.4), the adsorption and desorption branches gradually separate, forming a pronounced hysteresis loop. This indicates that, within this pressure range, the adsorbate primarily fills the ink bottle-shaped and non-permeable pores. Near the end of the curve, the adsorption and desorption branches tend to merge again, suggesting the presence of fissure pores or plate-like interlayer structures in the cementitious material. In the low relative pressure region (P/P0 < 0.4), the composite initially forms a monolayer adsorption, with the curve rising slowly. As the relative pressure increases, multilayer adsorption and capillary condensation phenomena occur.
When the relative pressure is within 0.4 ≤ P/P0 ≤ 0.95, the adsorption and desorption branches gradually diverge, resulting in a pronounced hysteresis loop. This indicates that ink bottle-shaped, non-permeable pores are the dominant pore type in this interval. With a further increase in pressure, the adsorption and desorption branches gradually approach each other again, suggesting that the pores in the sample are mainly wedge-shaped and conical, with one closed end. As P/P0 approaches one, the upward trend of the curve becomes more evident. As the relative pressure P/P0 approaches one, the upward trend of the curve becomes evident, and the adsorption and desorption curves tend to overlap. Nitrogen adsorption mainly occurs in macropores, indicating that the RPG-BF cementitious material contains a significant number of interconnected slit-shaped and cylindrical pores. While 0.8 ≤ P/P0 ≤ 0.99, the curve rises quickly, suggesting that the pore types are predominantly ink bottle-shaped and non-permeable.
According to the IUPAC classification standards for isotherms, the isotherm shapes of all six samples conform to Type IV isotherms. This suggests that the internal composition of the cementitious material includes a relatively continuous and complete pore system, as well as numerous primary crack pores. This is because, during the casting process of the RPG-BF specimens, air trapped inside was not fully expelled, resulting in micropores. During the curing process, water evaporation and temperature changes caused shrinkage and cracking in the specimens, forming primary cracks. The presence of these primary pores leads to internal structural damage, which can reduce the material’s overall mechanical performance.
At the highest relative pressure (P/P0 ≈ 1.0), the maximum adsorption capacities of Samples A–F are 11.18, 9.36, 26.07, 24.06, 31.12, and 25.93 × 10⁻³ mL/g, respectively. Among them, Sample E exhibits the highest adsorption capacity, followed by Samples C, F, and D, while Samples A and B show relatively lower values.
This variation is closely associated with differences in pore structure characteristics, as reflected by the adsorption–desorption isotherms. All samples exhibit evident hysteresis loops, indicating the coexistence of multiple pore types, including cylindrical, conical, ink bottle-shaped, and slit-like pores. Samples with higher adsorption capacities, particularly Sample E, display more pronounced hysteresis loops in the high relative pressure region, suggesting a greater proportion of mesopores and slit-like pores as well as more developed interparticle voids, which enhance gas adsorption.
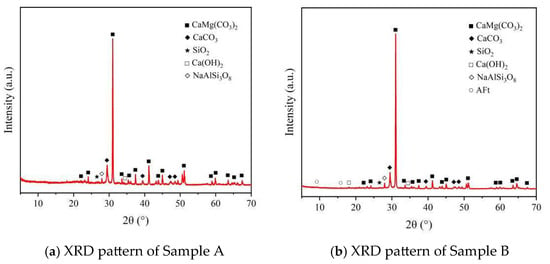
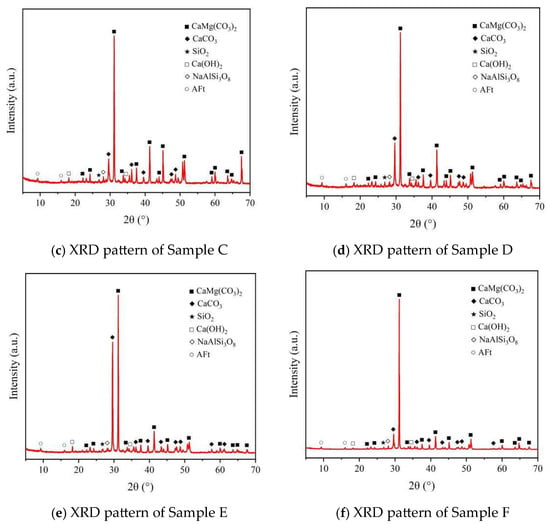
XRD patterns (Figure 8) also showed differences in phase composition among the samples. Notably, Sample E shows relatively stronger diffraction peaks corresponding to CaCO3, indicating a higher content or crystallinity of calcium carbonate. This may be attributed to enhanced carbonation reactions facilitated by a more favorable pore structure, which allows greater CO2 ingress and promotes the conversion of Ca(OH)2 into CaCO3. The presence of CaCO3 may also contribute to pore structure modification by acting as a filler phase, influencing pore size distribution and surface characteristics.
Figure 8.
The XRD patterns of basalt fiber-reinforced concrete with varying PG contents.
Phosphogypsum also affected the hydration process and phase assemblage, as evidenced by the formation of ettringite (AFt) in PG-containing samples. The combined effects of phase evolution, pore structure modification, and possible retardation of hydration due to impurities (e.g., phosphorus and fluorine) result in significant differences in pore connectivity and adsorption performance.
Adsorption capacity depends on both the pore structure and hydration phases of pore structure characteristics and hydration-induced phase evolution, rather than a single controlling factor.
4.3. Pore Fractal Analysis by Low-Temperature Nitrogen Adsorption
The liquid nitrogen adsorption data are processed using the fractal dimension calculation method based on the Frenkel–Halsey–Hill (FHH) model proposed by Pfeifer P [32]. The FHH model represents the gas adsorbed on a fractal surface using the following formula:
In the formula:
- p represents the equilibrium pressure;
- V is the adsorption volume corresponding to the equilibrium pressure;
- K is a constant, referring to the linear relationship coefficient, which is related to the adsorption mechanism;
- C is a constant;
- D is the fractal dimension. K = D − 3.
In terms of pore structure, a fractal dimension approaching two generally corresponds to a smoother pore surface, a less complex pore network, and lower heterogeneity. By contrast, when the fractal dimension approaches three, the pore surface tends to be rougher, the pore structure becomes more intricate, and the degree of heterogeneity increases. In this study, the FHH-based fractal dimension is used as a quantitative descriptor of pore-surface irregularity and structural heterogeneity derived from low-temperature nitrogen adsorption data.
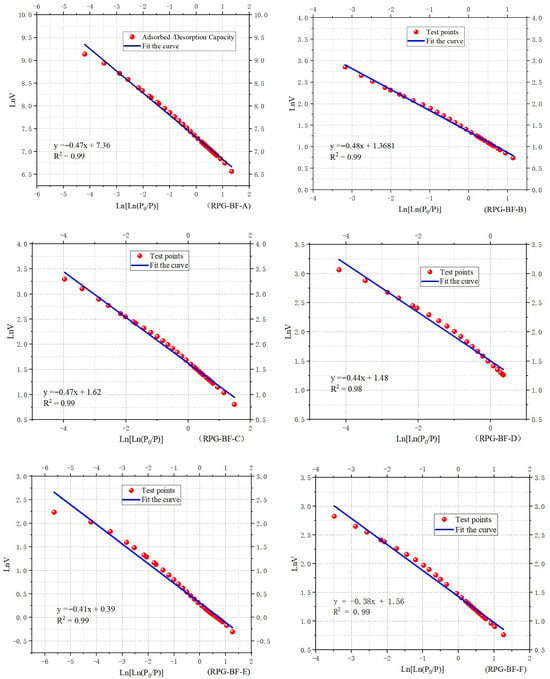
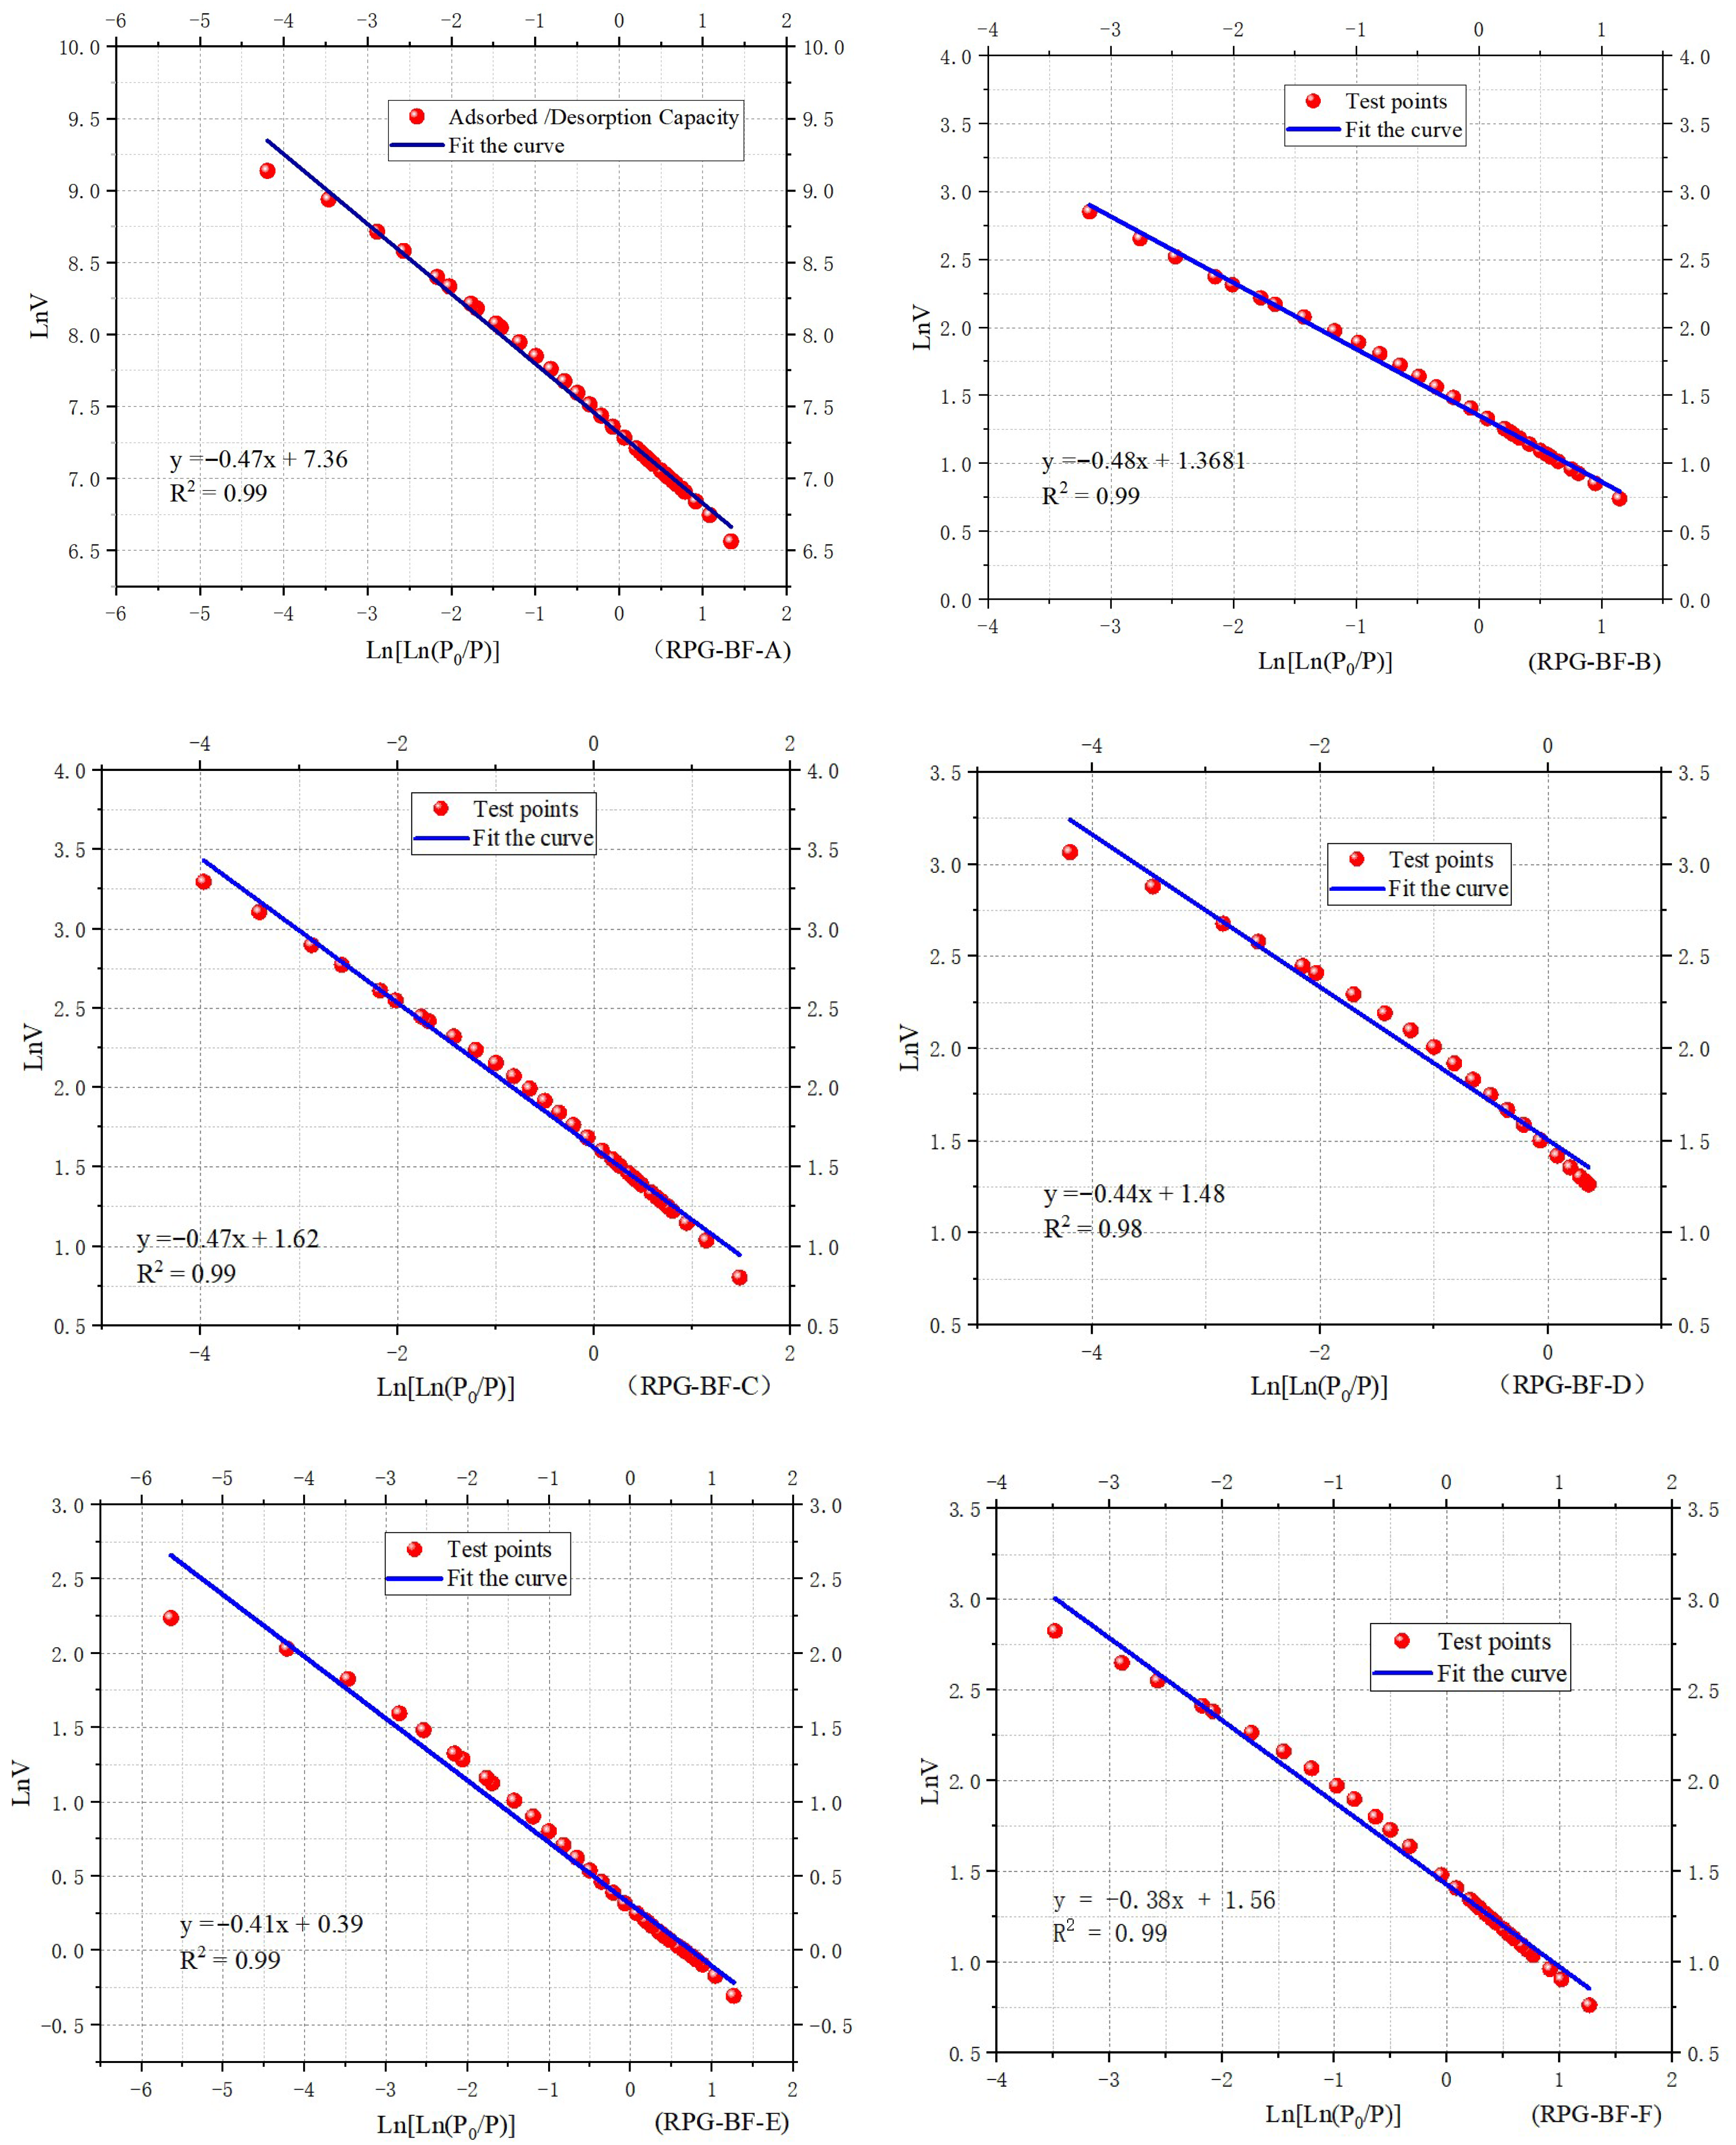
Using as the X-axis and as the Y-axis, the fitting is performed using the least squares method. The comparison between the fitted curve and the original curve is shown in Figure 9. The parameter R2 is the coefficient of determination, used to evaluate the quality of the fitting equation.
Figure 9.
The low-temperature liquid-nitrogen adsorption volume fractal dimension fitting diagram.
From Figure 9, the fractal dimension D is obtained from the slope K of the fitting equation, as shown in Table 7. The fractal dimension ranges from 2.52 to 2.62, with the coefficient of determination R2 close to one.
Table 7.
A summary of the low-temperature liquid nitrogen adsorption test results and fractal dimension.
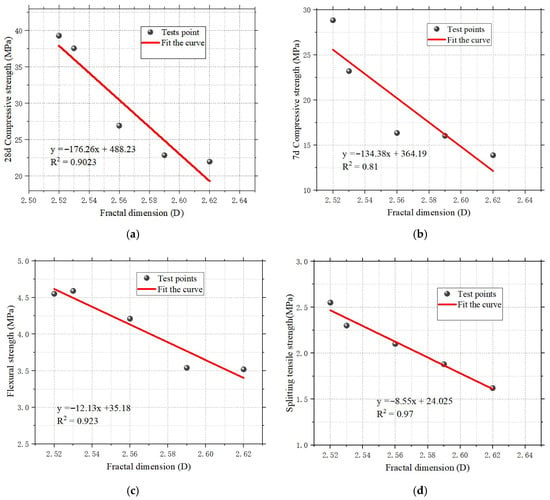
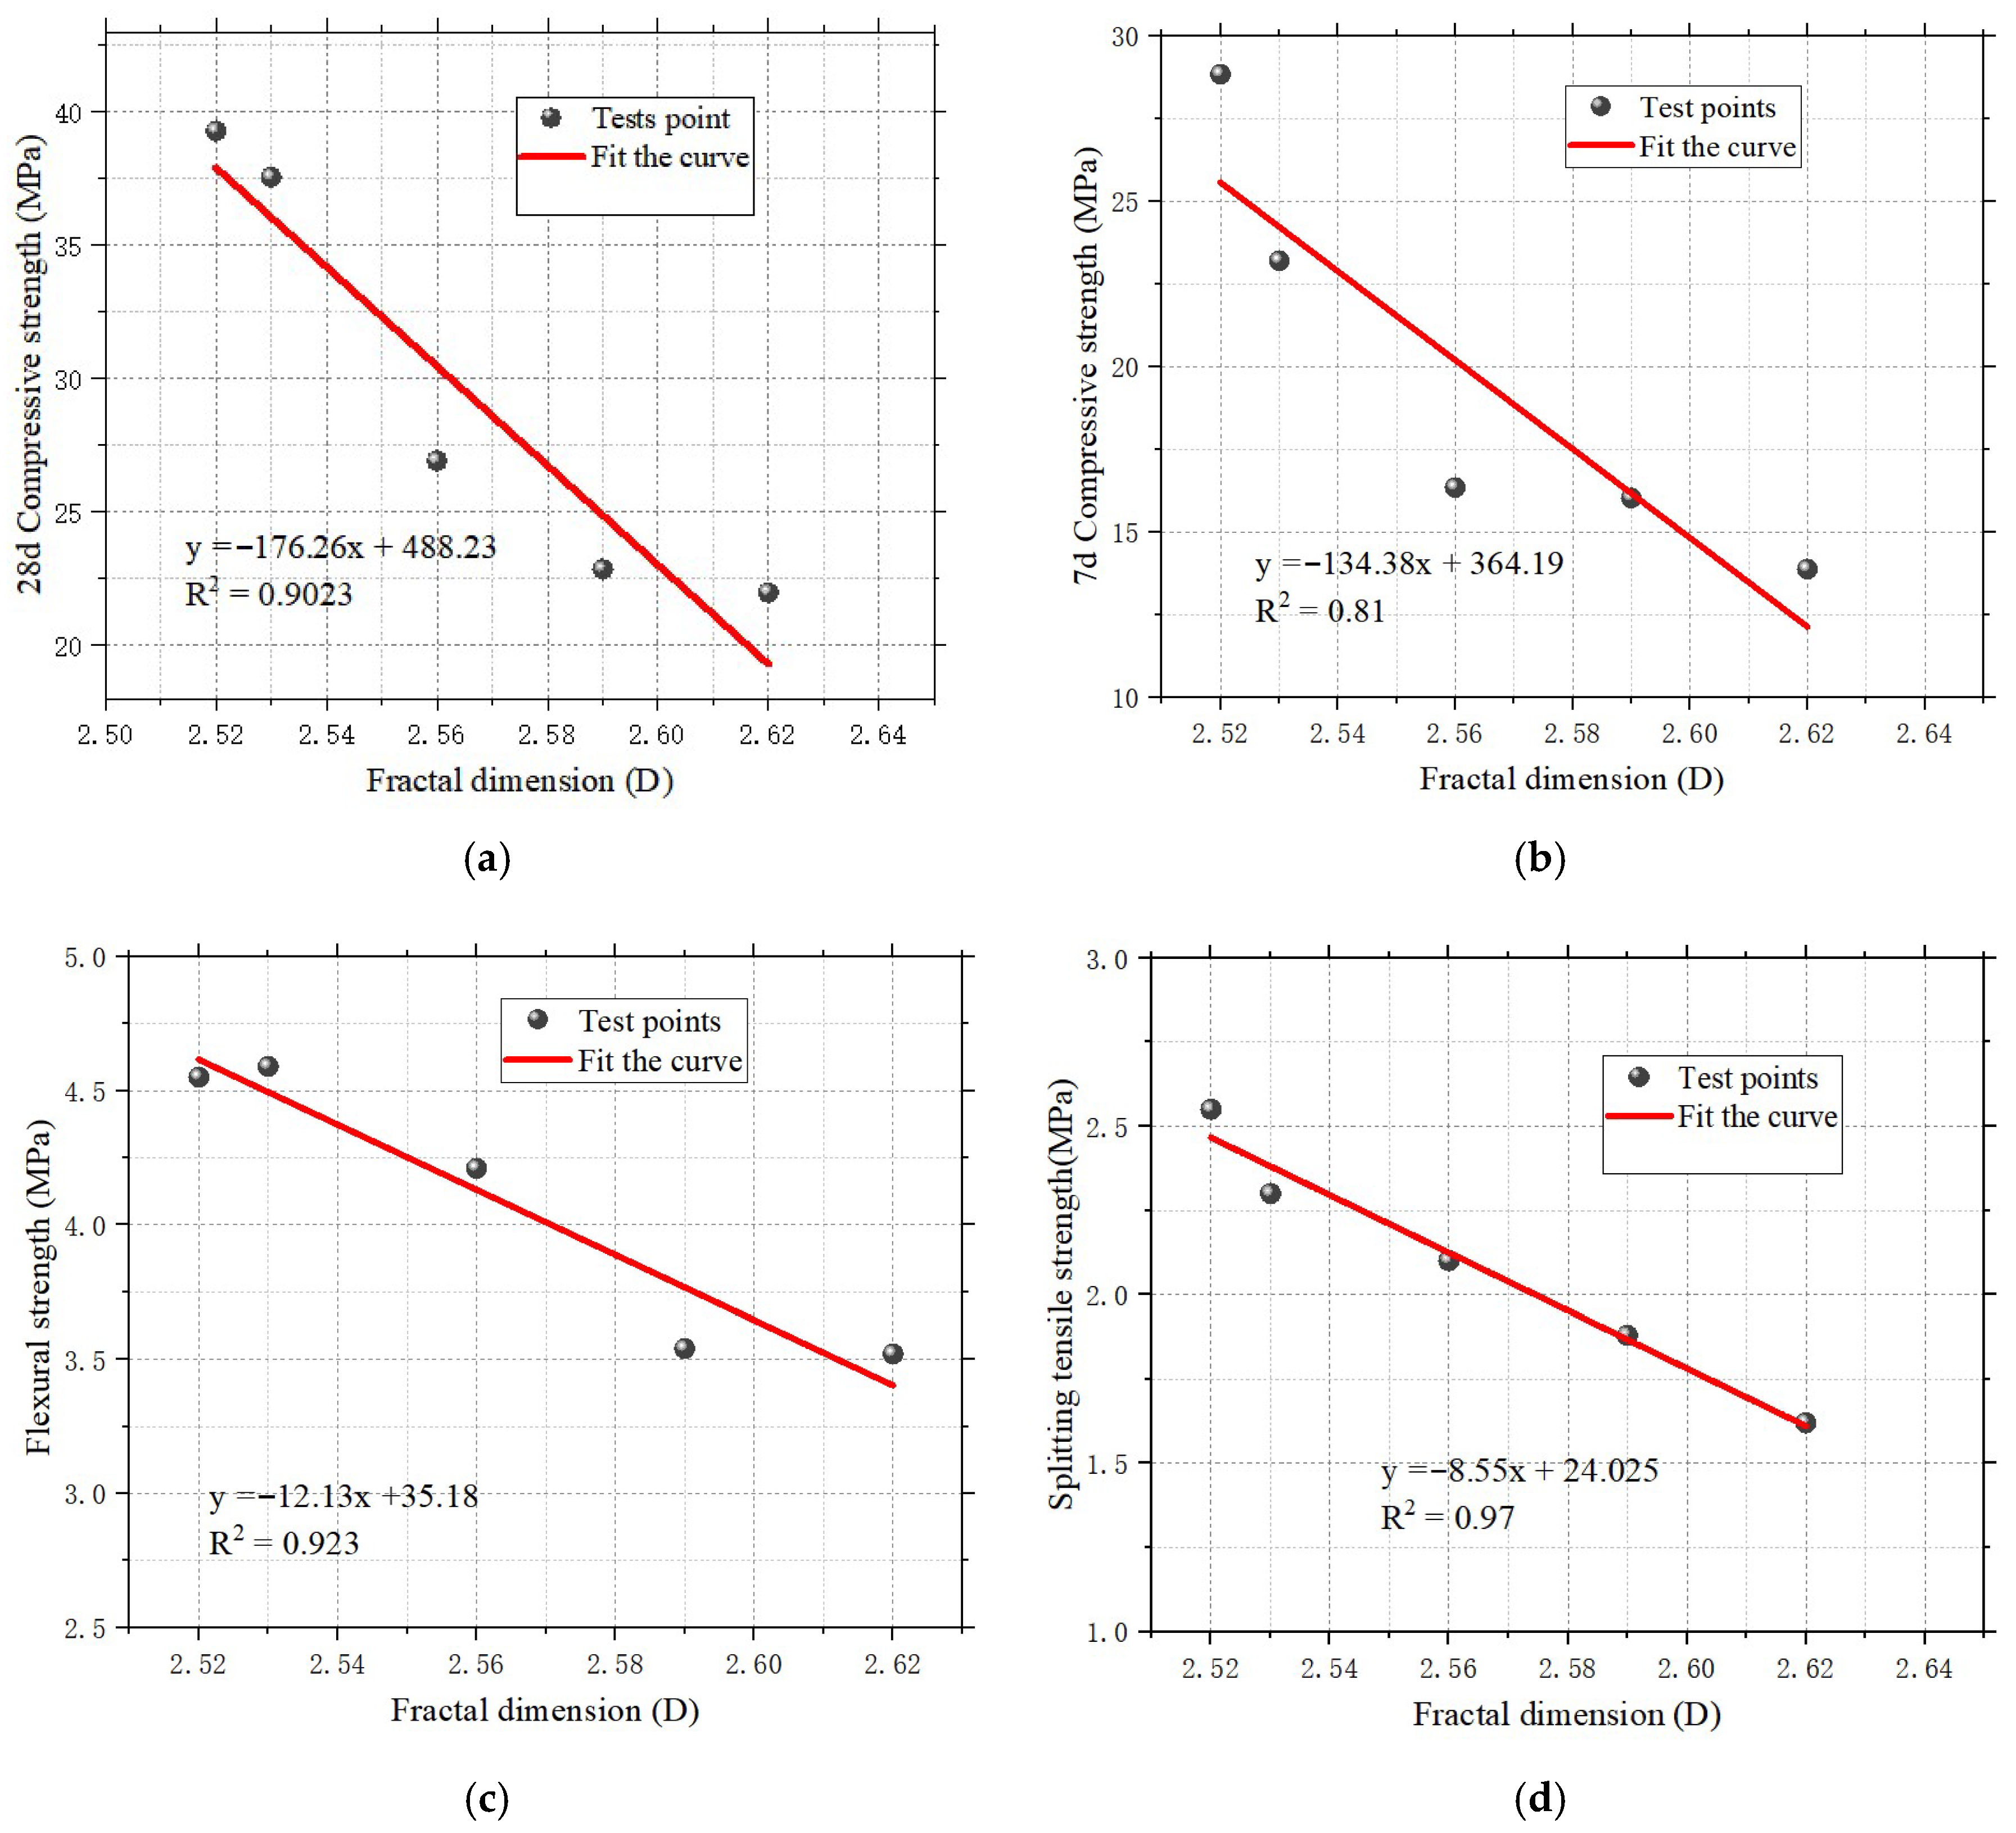
The correlation between the fractal dimension and the mechanical properties of the cementitious material is shown in Figure 10.
Figure 10.
The relationship between the fractal dimension and the mechanical properties of the RPG-BF cementitious materials. (a) The relationship between the 28-day compressive strength and the fractal dimension. (b) The relationship between the 7-day compressive strength and the fractal dimension. (c) The relationship between the flexural strength and the fractal dimension. (d) The relationship between the splitting tensile strength and the fractal dimension.
From Figure 10, it can be seen that the fractal dimension of the pore structure inside the RPG-BF cementitious material exhibits a general trend of linear function relationship with the 7-day compressive strength, 28-day compressive strength, tensile splitting strength, and flexural strength, with correlation coefficients all above 0.81. In later engineering practice, by reducing the fractal dimension—such as optimizing the particle size distribution or minimizing the interfacial defects—the compressive strength of cementitious materials can be enhanced.
4.4. BJH Pore Size Distribution and SEM Observation of Pore Morphology
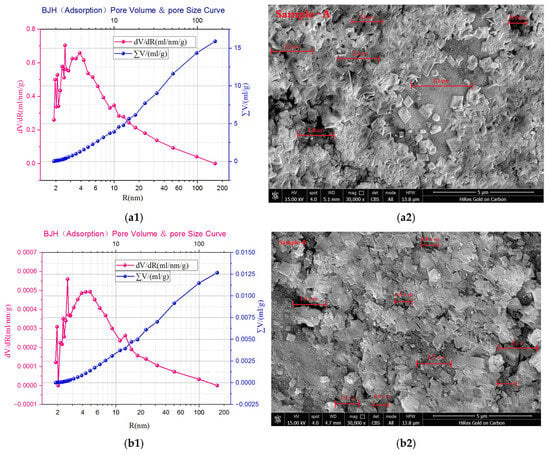
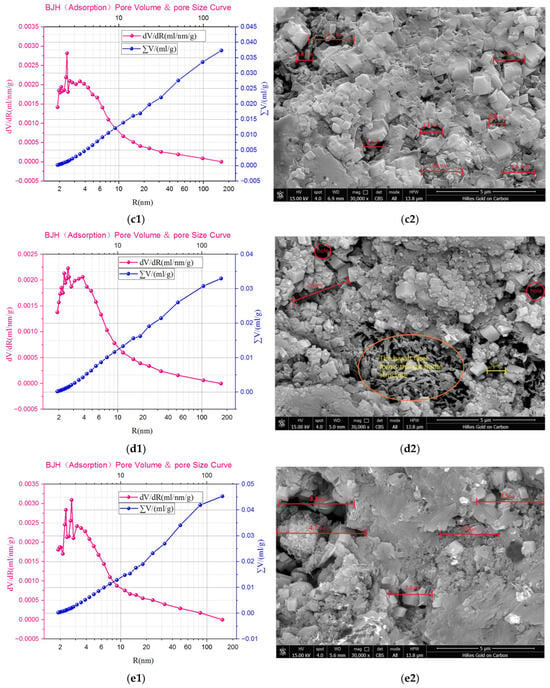
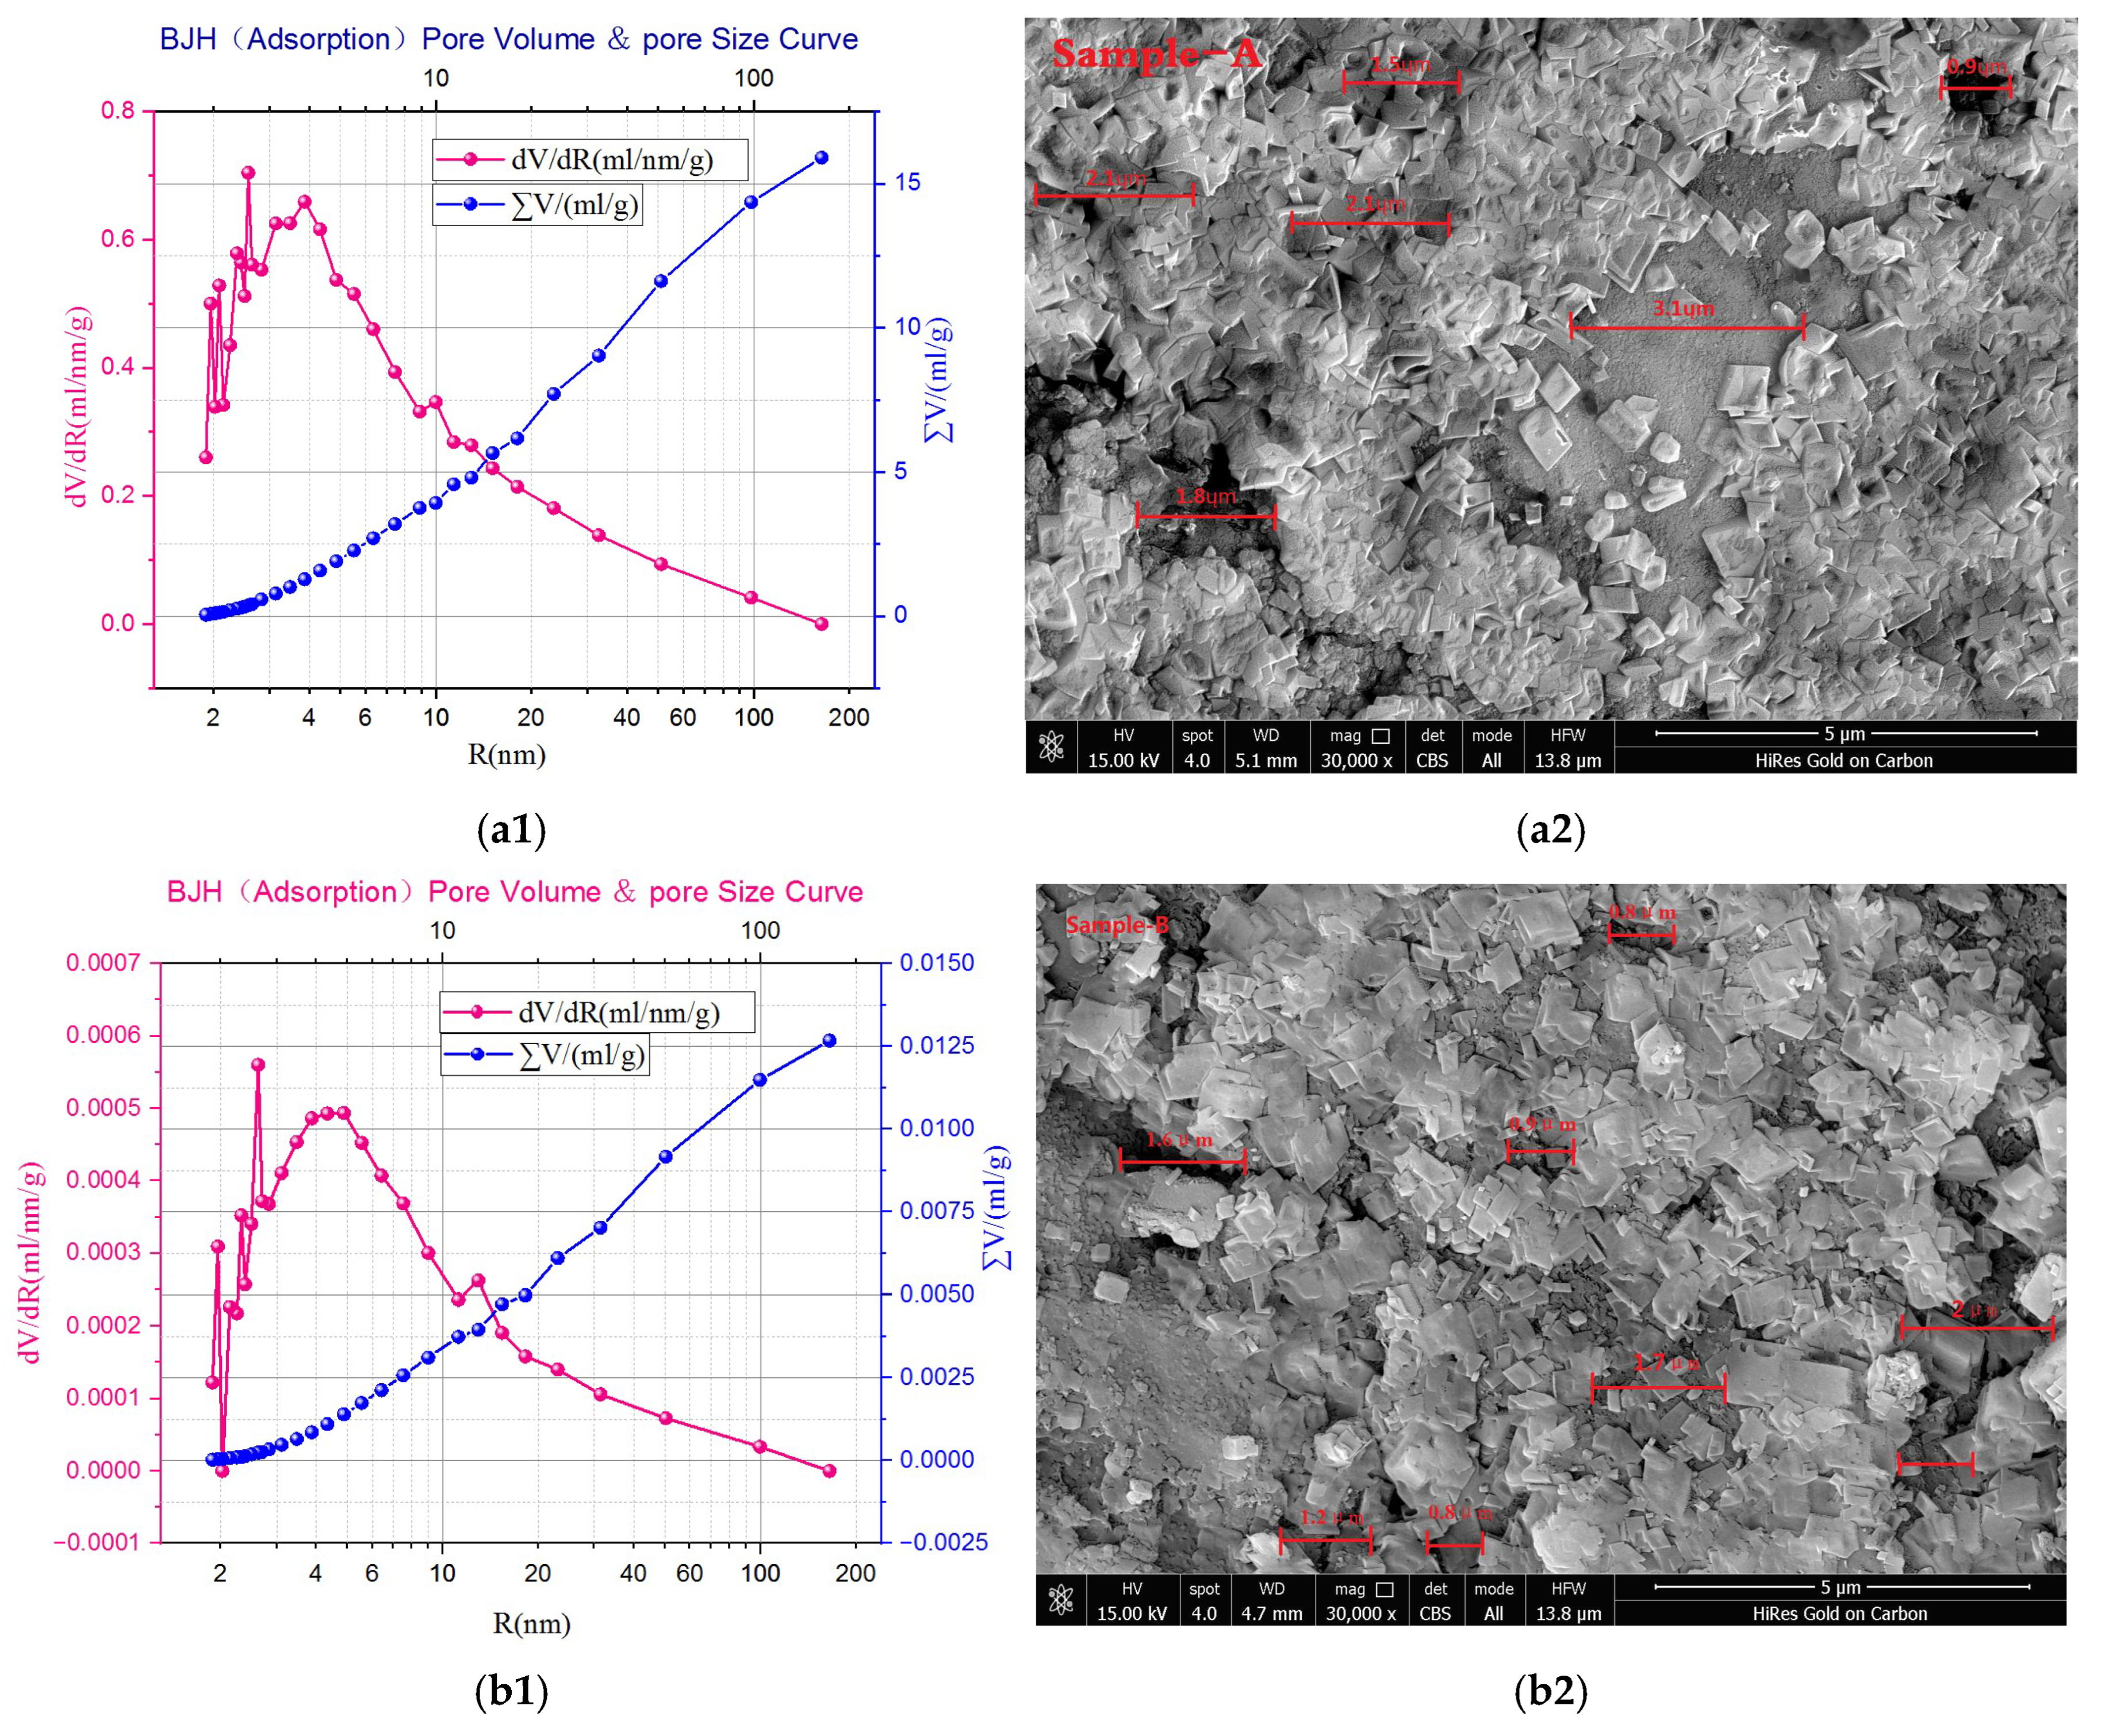
Based on the nitrogen adsorption–desorption isotherm data, the Barrett–Joyner–Halenda (BJH) model, which scans several images of six different samples at various magnifications, was performed to observe the distribution of pores and cracks on the sample surfaces, as shown in Figure 11.
Figure 11.
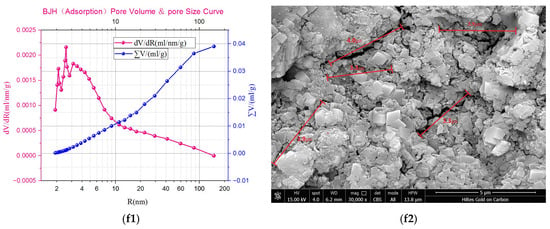
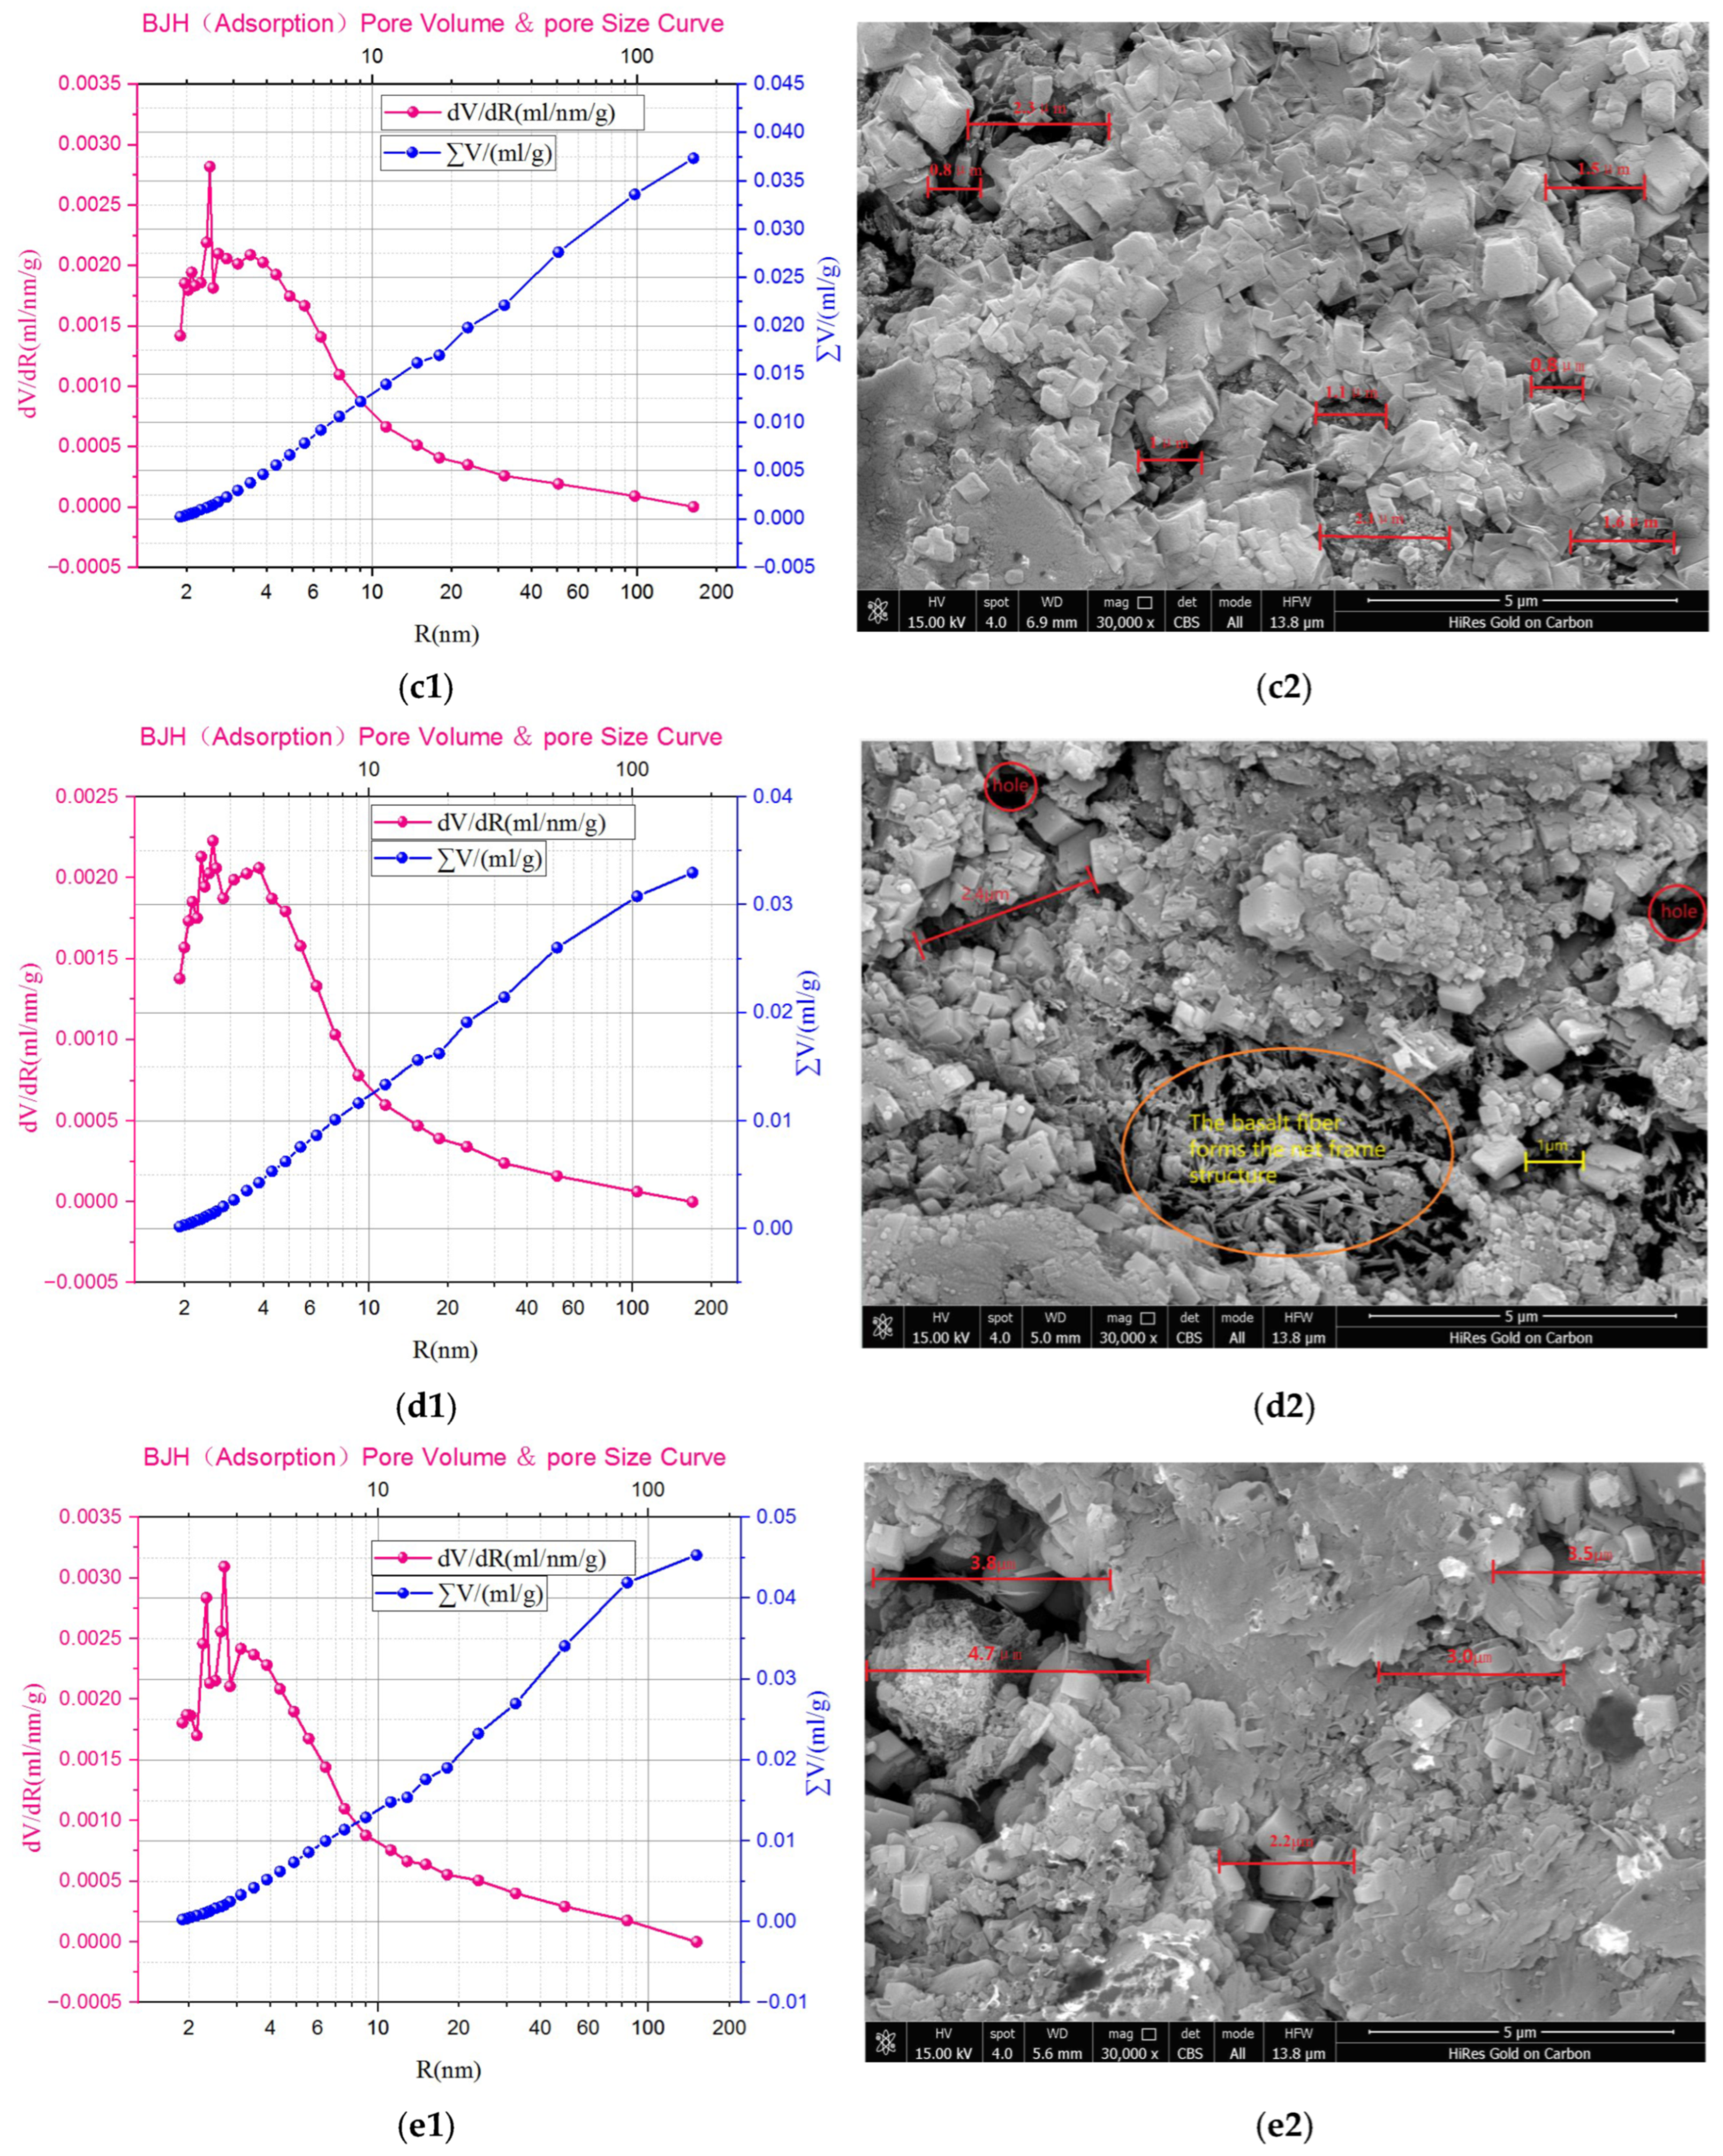
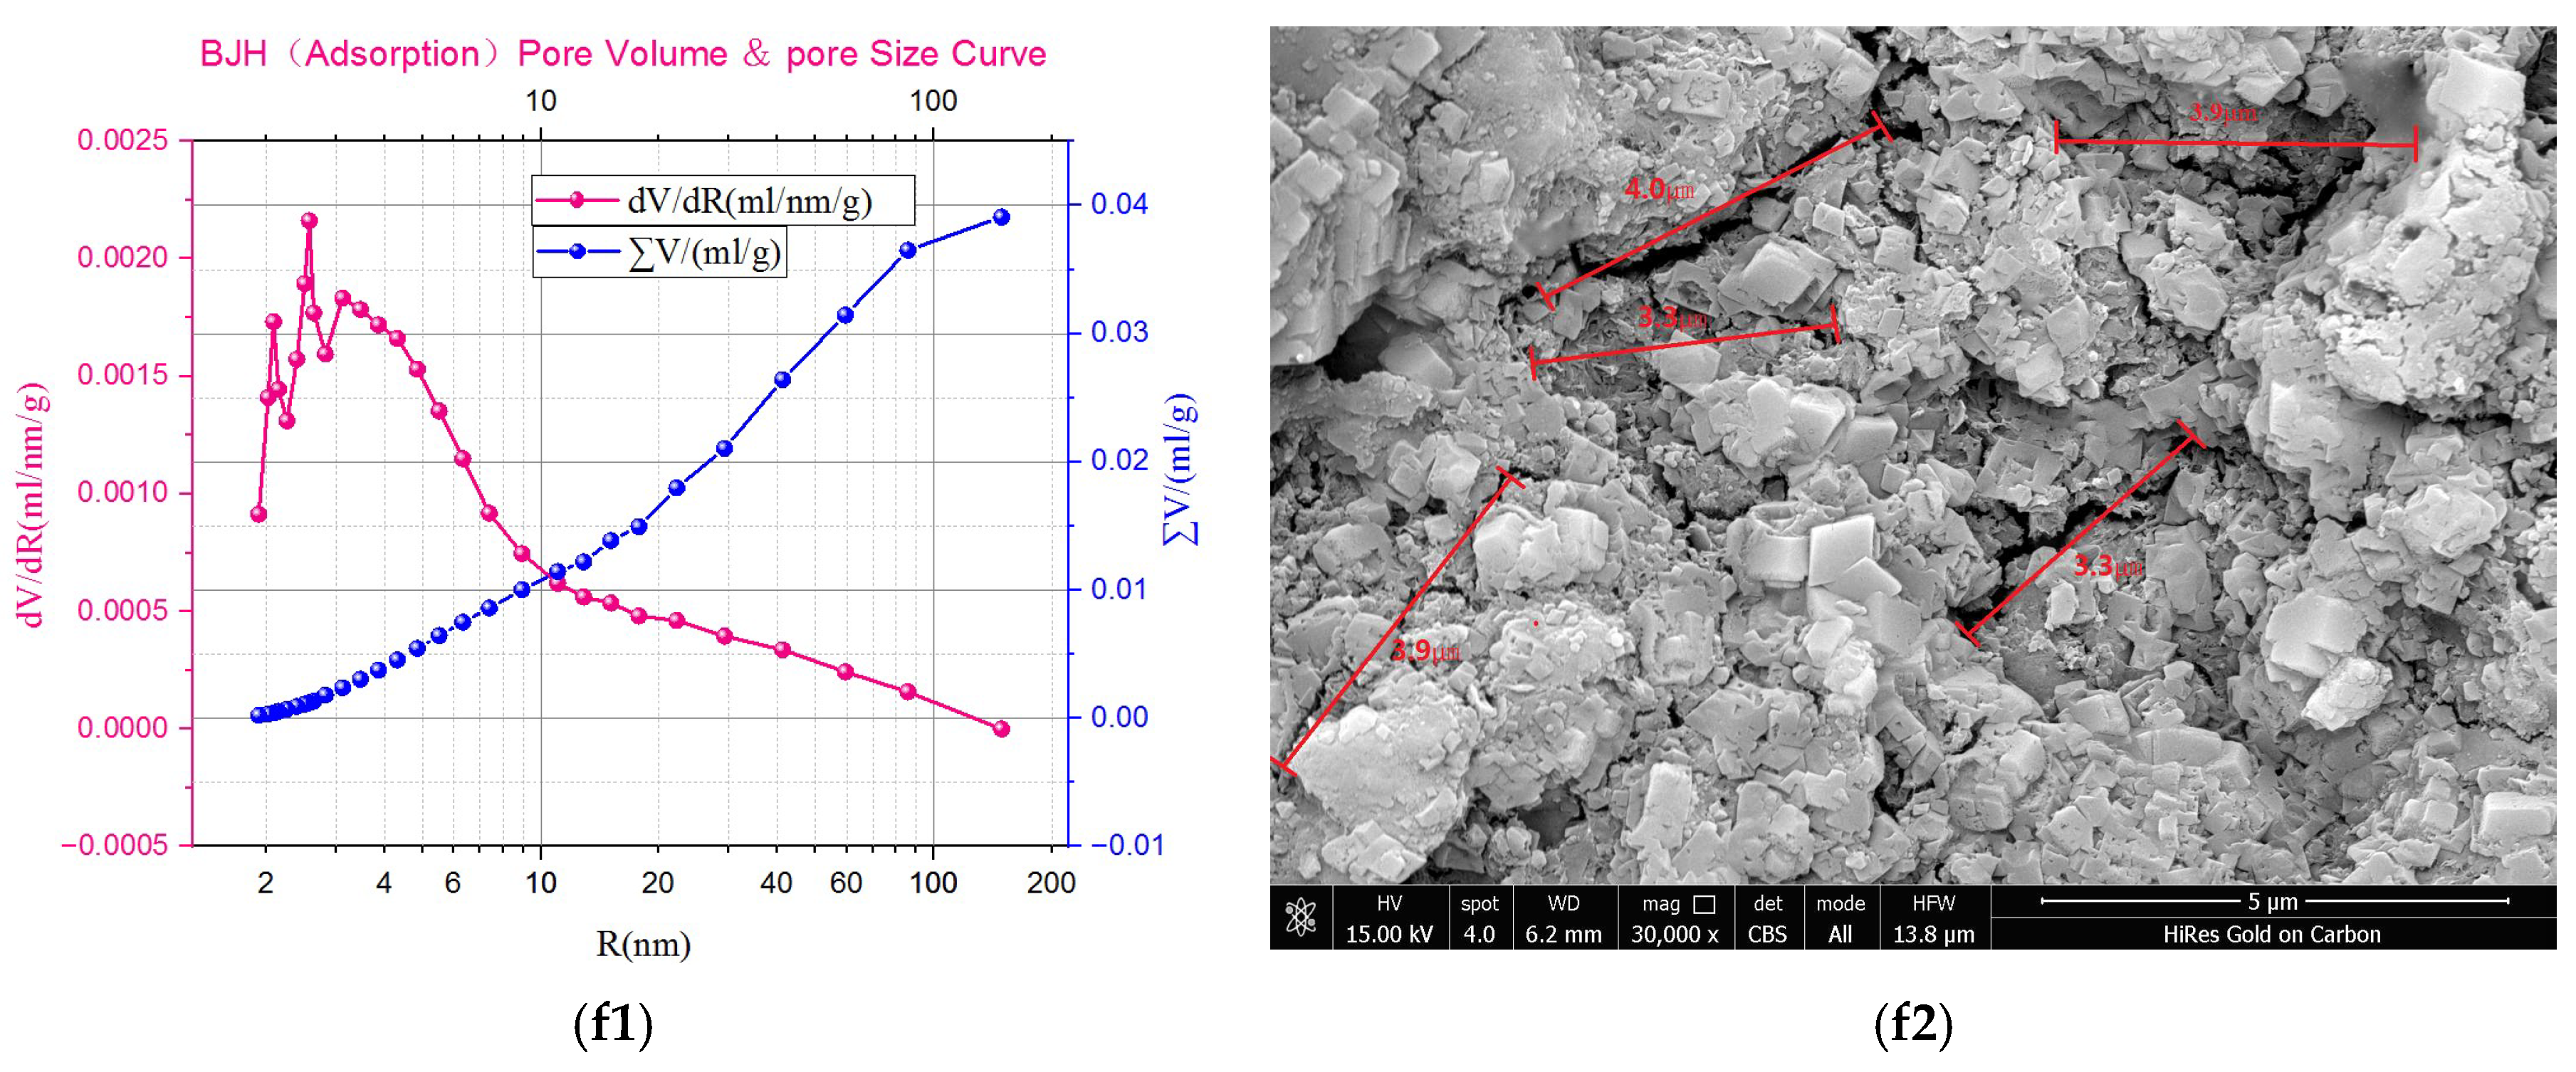
The pore diameter distribution curve of the RPG-BF cementitious materials. (a1) The pore diameter distribution curve of Sample A; (a2) the SEM of Sample A; (b1) the pore diameter distribution curve of Sample B; (b2) the SEM of Sample B; (c1) the pore diameter distribution curve of Sample C; (c2) the SEM of Sample C; (d1) the pore diameter distribution curve of Sample D; (d2) the SEM of Sample D; (e1) the pore Diameter Distribution Curve of Sample E; (e2) the SEM of Sample E; (f1) the pore diameter distribution curve of Sample F; and (f2) the SEM of Sample F.
The right side of Figure 11 is a scanning electron microscope (SEM) image. In the left-side plot, the horizontal axis represents the pore-size distribution. The blue curve on the vertical axis shows the cumulative pore-size distribution, while the red curve indicates the rate of change in pore volume. Peaks in the red curve signify that pores are the most concentrated within the corresponding pore-size range. Figure 11 illustrates that the RPG-BF cementitious material contains a multitude of micron and nanometer-sized intragranular pores, cavities, and through-cracks. These pores are often irregular or circular and are associated with cracks, primarily formed by the inclusion of air during mixing, which aggregates into larger bubbles, creating a diverse pore structure upon hardening.
The cumulative pore volumes and average diameters varied among the samples, with SEM observations at 30,000× magnification revealing complex and irregular pore morphologies and arrangements. Large pores in the range of 1 to 3 µm were commonly observed, with evidence of pore aggregation and connectivity on the surface. Sample RPG-BF-A shows the lowest cumulative pore volume among the six samples (0.0159 mL/g), while its BJH average pore diameter is relatively large (11.90 nm), indicating that cumulative pore volume and average pore diameter do not vary synchronously. The SEM images at 30,000× magnification reveal a complex and irregular pore morphology and arrangement, with large pores in the range of 1 µm to 3 µm being common and a tendency for pore region aggregation or connectivity. The differential pore volume indicates a significant concentration of pores around 2.5 nm in diameter. In contrast, other samples show lower cumulative pore volumes and average pore diameters, with differential pore volumes peaking at different sizes, suggesting a more varied pore size distribution.
The basalt fibers in RPG-BF-D were randomly distributed, forming a network and bonding with the cementitious material, with numerous cavities and cracks from 1 to 3 µm.
Sample A has a larger pore volume compared to other samples; hence, it has the greatest adsorption capacity, which is consistent with the analysis results in Section 3.2. The distinct characteristics of Sample RPG-BF-A may imply a more interconnected pore network; however, its strength is the greatest, which indicates that the incorporation of PG affects the uniformity and integrity of the internal structure, leading to changes in the pore structure and thus reducing the adsorption capacity. This is consistent with the research results in Gong, Y.S. [12] and Wang Yiyang [33].
5. Conclusions
This study analyzed the mechanical properties and microstructural characteristics of raw PG–basalt fiber (RPG-BF) cementitious materials with varying proportions of raw PG replacement.
Influence of PG on Mechanical Properties: The incorporation of raw PG into RPG-BF cementitious materials resulted in a significant decrease in mechanical properties. Specifically, as the PG content increased from 0% to 15%, there was a notable reduction in 7-day compressive strength (up to 52%), 28-day compressive strength (up to 49%), tensile splitting strength (up to 44%), and flexural strength (up to 43%). This trend indicates that the presence of PG adversely affects the mechanical integrity of the cementitious materials.
Pore Structure and Fractal Dimension: The internal pore structure of RPG-BF cementitious materials exhibited distinct fractal properties, with fractal dimensions ranging from 2.52 to 2.62. An increase in PG content led to a more complex and heterogeneous pore structure, which corresponds to a decrease in mechanical performance. The fractal dimension served as a quantitative descriptor of the pore structure’s complexity and heterogeneity.
The Linear Relationship Between Fractal Dimension and Mechanical Properties: A relatively strong Pearson’s linear correlation coefficient (R > 0.82) was observed between the pore fractal dimension of RPG-BF cementitious materials and their mechanical properties, including 7-day and 28-day compressive strength, tensile splitting strength, and flexural strength. This relationship underscores the significance of pore structure in determining the mechanical behavior of the materials.
SEM Analysis of Pore Morphology: The scanning electron microscope (SEM) analysis revealed an uneven internal surface of the RPG-BF cementitious materials, characterized by a multitude of primary crack pores. The presence of micropores (1–5 micrometers) and cracks (3–5 micrometers) was prominent, with the basalt fibers forming a spatial network structure within the cementitious material, contributing to its overall performance.
In summary, the study establishes a clear link between the microstructural characteristics, particularly the pore structure, and the mechanical properties of RPG-BF cementitious materials. The findings emphasize the importance of controlling the internal structure to enhance the mechanical performance of such materials, which has implications for the sustainable utilization of PG in the construction industry. For practical applications, PG content should be strictly controlled at or below 9% (to maintain 28-day compressive strength ≥ 30 MPa for C30 grade applications per GB/T 50081-2019). This recommendation is based on the specific experimental conditions of this study (w/b = 0.39, 0.1% basalt fiber); it should be verified for other mix designs or performance requirements. Pretreatments such as water washing, lime neutralization, ball milling, or high-temperature calcination are recommended where higher PG replacement ratios are required without compromising mechanical performance.
These conclusions are based on the experimental data and analyses presented in this study, providing valuable insights into the behavior of RPG-BF cementitious materials with varying amounts of PG. Further research may focus on optimizing the mix proportions and processing techniques to mitigate the negative impact of PG and enhance the overall performance of these materials.
Author Contributions
Methodology, G.X., L.H., Y.Z., W.X., Z.C. and W.Z.; software, Y.Z.; validation, L.H.; formal analysis, W.X., Z.C., Q.F. and Y.L.; investigation, G.X. and W.X.; resources, G.X., L.H., Y.Z. and W.X.; writing—original draft, G.X., L.H., Y.Z., Q.F., Y.L. and W.Z.; writing—review and editing, L.H., Z.C. and W.Z.; supervision, W.X. and Z.C.; funding acquisition, G.X., Q.F. and Y.L. All authors have read and agreed to the published version of the manuscript.
Funding
This research was funded by the Guiyang City Science and Technology Plan Project, grant number ZHUKE HETONG [2024]-1-8; the Natural Science Foundation of Guizhou Province (QIAN KE HEJICHU ZK [2022] ZHONGDIAN 027, QianKeHe Ren Cai-CXTD [2025]042, QIAN KE HEJICHU-ZK [2022] YIBAN 174); the National Natural Science Foundation of China, grant number 52268065, 52560015; the Technology Department Foundation of Guizhou Province, grant number QIAN KE HE Platform Talents-GCC [2023]053; and the Guizhou Province Science and Technology Plan Project (Qiankehe Platform KXJZ [2024]020, Qiankehe Platform KXJZ (2025) 004).
Data Availability Statement
The data presented in this study are available on request from the corresponding author.
Conflicts of Interest
Authors Yan Zhang and Weihong Xu were employed by Guizhou Phosphorus Green Environmental Protection Industry Co., Ltd. Author Qianbao Fang was employed by the Guiyang Survey and Design Institute Co., Ltd. The remaining authors declare that the research was conducted in the absence of any commercial or financial relationships that could be construed as a potential conflict of interest.
References
- Li, M.; Chen, Z. Strength Properties of PG Based Composite Filling Materials. In Proceedings of the Chinese Materials Conference (CMC), Yinchuan, China, 6–12 July 2017; pp. 555–567. [Google Scholar]
- Chen, P.; Ma, B.; Tan, H. Effect of amorphous aluminum hydroxide on the PG-based cementitious materials in prefabricated building field. J. Build. Eng. 2023, 77, 107437. [Google Scholar] [CrossRef] [Scilit]
- Dong, S.; Zhuo, Q.; Chen, L.; Wu, F.; Xie, L. Reuse of Pretreated Red Mud and PG as Supplementary Cementitious Material. Sustainability 2023, 15, 2856. [Google Scholar]
- Xiao, W.; Yao, X.; Zhang, F. Recycling of Oily Sludge as a Roadbed Material Utilizing PG-Based Cementitious Materials. Adv. Civ. Eng. 2019, 2019, 6280715. [Google Scholar] [CrossRef] [Scilit]
- Fu, R.; Lu, Y.; Wang, L.; An, H.; Chen, S.; Kong, D. The effects of admixtures on the durability properties of PG-based cementitious materials. Constr. Build. Mater. 2024, 411, 134379. [Google Scholar] [CrossRef] [Scilit]
- Jin, Z.; Cui, C.; Su, Y.; He, X.; Wang, Y.; Qi, H.; Li, Y.; Duan, X. Duan Improvement of the mechanical properties of beta-hemihydrate PG by incorporating wet-ground low-calcium fly ash slurries. Constr. Build. Mater. 2024, 428, 136371. [Google Scholar] [CrossRef] [Scilit]
- He, Y.; Chen, Q.; Qi, C.; Zhang, Q.; Xiao, C. Lithium slag and fly ash-based binder for cemented fine tailings backfill. J. Environ. Manag. 2019, 248, 109282. [Google Scholar] [CrossRef] [Scilit]
- Zhang, S.; Liu, J.; Ding, J.; Gao, M.; Xue, C. Effect of recycled PG and calcium aluminate cement on the strength behavior optimization of cement-treated dredged soil: A co-utilization of solid wastes. J. Environ. Manag. 2024, 353, 120020. [Google Scholar] [CrossRef] [Scilit]
- Ban, J.; Lu, J.X.; Peng, L.; Du, H.; Yao, J.; Poon, C.S. Efficient utilization of waste CRT glass in low carbon super-sulfated cement mortar. Cem. Concr. Compos. 2023, 139, 105037. [Google Scholar] [CrossRef] [Scilit]
- Huang, Z.W. Preparation and Property Study of Red Mud-PG Composite Subbase Material. Master’s Thesis, Guizhou University, Guiyang, China, 2022. [Google Scholar]
- Ding, J.; Feng, X.; Xu, G.; Qian, S.; Ji, F. Strength Properties and Microstructural Characteristics of Stabilized Dredged Materials at High Water Contents. J. Test. Eval. 2019, 47, 2225–2239. [Google Scholar] [CrossRef] [Scilit]
- Gong, Y.; Dong, S.; Liu, L.; Wu, F. A Sustainable Composite Cementitious Material Manufactured by PG Waste. Appl. Sci. 2022, 12, 12718. [Google Scholar] [CrossRef] [Scilit]
- Zhang, J.; Huang, Z.; Su, X.; Chen, Y.; Li, H.; Li, W. Study on the Impact of PG Addition on the Performance of Red Mud-Based Composite Materials. China Nonferrous Metall. 2023, 52, 121–130. [Google Scholar]
- Huang, X.; Li, J.S.; Jiang, W.; Chen, Z.; Wan, Y.; Xue, Q.; Liu, L.; Poon, C.S. Recycling of PG and red mud in low carbon and green cementitious materials for vertical barrier. Sci. Total Environ. 2022, 838, 155925. [Google Scholar] [CrossRef] [Scilit]
- Li, P.; Zhang, X.; Zhong, M.; Fan, Z.; Xiong, J.; Zhang, Z. PG-Based Ultra-Low Basicity Cementing Material. Materials 2022, 15, 6601. [Google Scholar]
- Peng, B.; Yang, Z.; Yang, Z.; Peng, J. Effects of pH and Fineness of PG on Mechanical Performance of Cement-PG-Stabilized Soil and Classification for Road-Used PG. Coatings 2020, 10, 1021. [Google Scholar] [CrossRef] [Scilit]
- Wang, J.; Deng, X.; Tan, H.; Guo, H.; Zhang, J.; Li, M.; Chen, P.; He, X.; Yang, J.; Jian, S.; et al. The mechanical properties and sustainability of PG-slag binder activated by nano-ettringite. Sci. Total Environ. 2023, 903, 166015. [Google Scholar] [CrossRef] [Scilit] [PubMed]
- Zhang, W.; Jin, Y.; Na, S.; Zhao, L.; Su, F.; Zhu, J. Improving mechanical properties of hemihydrate PG via alkali-activated mineral admixtures. J. Clean. Prod. 2024, 454, 142234. [Google Scholar] [CrossRef] [Scilit]
- Xu, J.; Chen, P.; Zhang, C.; Yang, Y. Influence of PG on mechanical properties and microstructure of iron tailings cementitious material. Arch. Civ. Mech. Eng. 2023, 24, 18. [Google Scholar] [CrossRef] [Scilit]
- Yang, G.; Li, C.; Xie, W.; Yue, Y.; Kong, C.; Li, X. Effect of carbide slag and steel slag as alkali activators on the key properties of carbide slag-steel slag-slag-PG composite cementitious materials. Front. Mater. 2024, 11, 1353004. [Google Scholar] [CrossRef] [Scilit]
- Zhu, C.; Tan, H.; Du, C.; Wang, J.; Deng, X.; Zheng, Z.; He, X. Enhancement of ultra-fine slag on compressive strength of solid waste-based cementitious materials: Towards low carbon emissions. J. Build. Eng. 2023, 63, 105475. [Google Scholar] [CrossRef] [Scilit]
- Wei, X. Preparation of PG Composite Cementitious Materials and Product Development. Master’s Thesis, Kunming University of Science and Technology, Kunming, China, 2021. [Google Scholar]
- Nie, C. Study on Dehydration Behavior, Surface Structure Design of Phosphogypsum and Its Application in PP. Doctoral Dissertation, Guizhou University, Guiyang, China, 2023. [Google Scholar] [CrossRef]
- Liu, D.; Wang, W.; Peng, Y.; Shi, H.; Li, D.; Wang, B. Study on the Strength and Hydration Characteristics of PG-Slag-Based Composite Cementitious Materials. Met. Mines 2022, 9, 230–237. [Google Scholar]
- Zheng, S.; Chen, M.; Liu, T.; Yang, G.; Jiang, G.; Gu, H. Research on compressive strength and thermal conductivity of lightweight PG-based composite cementitious materials. Constr. Build. Mater. 2024, 436, 136955. [Google Scholar] [CrossRef] [Scilit]
- GB/T 176-2017; Methods for Chemical Analysis of Cement. Standards Press of China: Beijing, China, 2017.
- GB/T 8074-2008; Testing Method for Specific Surface of Cement—Blaine Method. Standards Press of China: Beijing, China, 2008.
- JGJ 52-2006; Standard for Technical Requirements and Test Method of Sand and Crushed Stone (or Gravel) for Ordinary Concrete. China Architecture & Building Press: Beijing, China, 2006.
- GB/T 50081-2019; Standard for Test Methods of Concrete Physical and Mechanical Properties. Standards Press of China: Beijing, China, 2019.
- Aligizaki, K.K. Pore Structure of Cement-Based Materials: Testing, Interpretation and Requirements; CRC Press: Boca Raton, FL, USA, 2005. [Google Scholar]
- Zhang, D.; Yao, X.; Yu, F.; Zhu, Q.; Zeng, X.H.; Xiong, H.N. Analysis on the Influence of Gypsum on Concrete Properties. Guangdong Civ. Eng. Archit. 2021, 28, 84–86. [Google Scholar] [CrossRef]
- Pfeifer, P.; Jagiełło, J. Adsorption on Fractal Surfaces. J. Colloid Interface Sci. 1982, 97, 51–62. [Google Scholar]
- Wang, Y.Y. Research on the Preparation of Cementitious Materials and Concrete from PG. Master’s Thesis, Beijing University of Chemical Technology, Beijing, China, 2014. [Google Scholar]

Disclaimer/Publisher’s Note: The statements, opinions and data contained in all publications are solely those of the individual author(s) and contributor(s) and not of MDPI and/or the editor(s). MDPI and/or the editor(s) disclaim responsibility for any injury to people or property resulting from any ideas, methods, instructions or products referred to in the content. |
© 2026 by the authors. Licensee MDPI, Basel, Switzerland. This article is an open access article distributed under the terms and conditions of the Creative Commons Attribution (CC BY) license.