


Abstract
This study investigates tension-induced stress in Cross-tensioned Concrete Pavement (CTCP) during sequential tensioning. An integrated approach combining full-scale field testing and finite element analysis was employed. A field test was conducted to capture the stress distribution throughout the complete tensioning process, and a finite element model was subsequently developed and validated against measured strains. The results indicate that the maximum tensile stress (approximately 1.35 MPa) consistently occurs at the corner of the nearest anchorage zone, which can be completely offset by the compressive stress generated from subsequent tensioning operations. The concept of “prestress effect zone” is proposed to characterize the influence region of each tensioning sequence. In CTCP, the extent of this zone is expected to be influenced by the characteristics of the applied prestress force, including tendon angle, spacing, and magnitude. Based on the distinct tension-induced stress distribution characteristics along the slab, three zones are identified: tensile increase region, tensile stability region, and tensile decrease region, enabling clearer investigation of tension-induced stress. The observed superposition of tensile stresses during sequential tensioning operations highlights the importance of analyzing the development of tension-induced stress throughout the tensioning process, providing essential guidance for anchorage zone design and construction procedures.
1. Introduction
Cement concrete pavements serve as critical infrastructure for airports, and their structural integrity is therefore essential to flight safety. However, conventional concrete pavements are susceptible to various joint-related distresses under high-speed aircraft taxiing and heavy wheel loads, including faulting, spalling, and pumping, which pose significant threats to flight safety [1]. Cross-tensioned Concrete Pavement (CTCP), which incorporates diagonally arranged prestressed tendons, introduces prestress forces in both the longitudinal and transverse directions simultaneously [2,3,4,5]. This configuration substantially enhances the load-carrying capacity of cement concrete pavements while reducing the number of joints by approximately 95%, thereby effectively mitigating joint-related deterioration. Consequently, CTCP has emerged as a promising solution for constructing jointless, high-strength pavement systems.
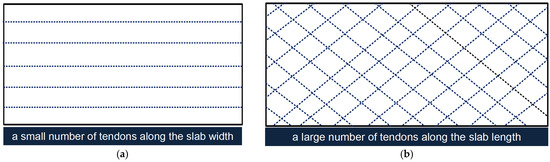
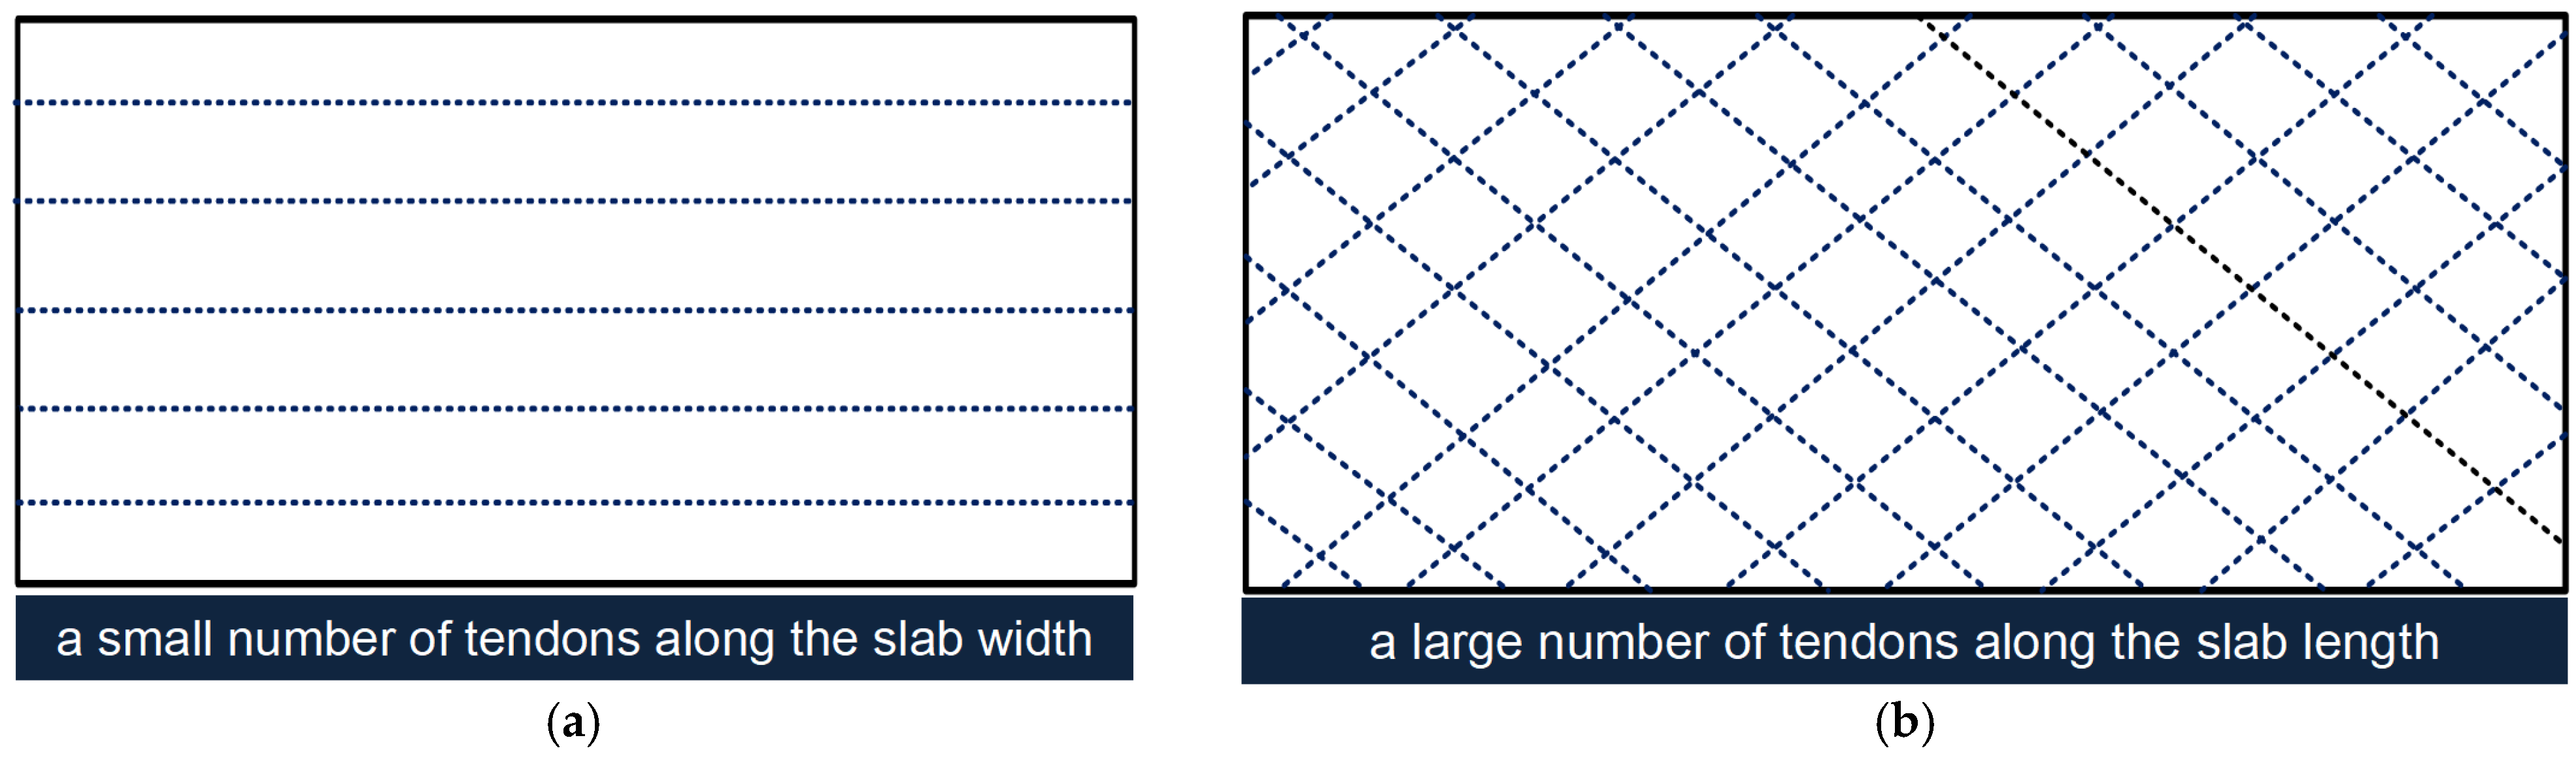
Compared with conventional concrete slabs (typically 5 m × 5 m), research indicates that CTCP slab dimensions can be extended to exceed 80 m × 7 m [6,7,8,9,10,11,12]. However, this substantial increase in scale introduces new challenges. In contrast to longitudinal prestressed concrete pavement (as shown in Figure 1), the number of prestressed tendons in CTCP increases proportionally with slab length, resulting in a large number of tendons widely distributed throughout the slab. Furthermore, because these tendons are anchored at an angle relative to the pavement edges, the resulting tension-induced stress distribution becomes increasingly complex and non-uniform, particularly near the edge regions [13]. Consequently, each sequential tendon tensioning influences the stress state established by previously tensioned tendons, creating a cumulative effect that evolves throughout the tensioning process. The stress response of CTCP during the tensioning process is therefore considerably more complex than that of conventional LPCP due to the greater number of tensioning operations. Understanding the prestress effect of individual tendons during sequential tensioning is therefore essential for guiding pavement design and construction procedures.
Figure 1.
Distribution characteristics of prestressed tendons in the prestressed pavement slab. (a) Longitudinal Prestressed Concrete Pavement. (b) Cross-tensioned Concrete Pavement.
Numerous researchers have investigated tension-induced stress distribution in CTCP through finite element (FE) methods and field testing. Hossain et al. [2] established fundamental design concepts for CTCP development and examined stress effects near pavement edges, demonstrating that CTCP effectively utilizes the high tensile strength of prestressed tendons and the compressive strength of concrete. Akpinar et al. [3] employed FE analysis to study post-tensioning stress distribution in pavement, revealing that maximum tensile stresses at tendon crossing points near edges remained substantially below the recommended allowable limits. Li et al. [14] analyzed the influence of tendon location, spacing, and angle using FE methods, subsequently recommending optimal configurations for the anchorage zone. Guo et al. [15] investigated CTCP responses under heavy loading through field testing to examine fatigue behavior. Meng et al. [16] and Han et al. [17] studied the effect of the sliding layer on tension-induced stress distribution in the pavement.
In summary, previous research efforts have predominantly focused on investigating the influence of various factors—such as tensioning position, angle, and tendon diameter—on CTCP performance using FE analysis and field testing. Moreover, the role of concrete material composition, including the use of industrial by-products and secondary raw materials, has been recognized as crucial for enhancing the durability and sustainability of pavement systems [18,19,20]. However, the majority of existing studies have concentrated on the post-tensioning stress states within the slab following completion of the tensioning process, with limited attention devoted to analyzing the tension-dependent effects of individual prestressed tendons on CTCP throughout the sequential tensioning procedure. Moreover, the substantially larger number of prestressed tendons in CTCP, compared to conventional prestressed concrete structures, renders the evolution of tension-induced stress considerably more complex.
This study aims to address three key issues: (1) the development of internal tension-induced stress distribution in CTCP throughout multi-sequence tensioning; (2) the distinction between the “tension-independent effect” of individual prestressed tendons and the “tension-dependent effect” characterizing the complete tensioning process; and (3) the characteristics of the influence zone associated with a single diagonal tendon tensioning and the superposition behavior of multiple tension-induced stress effects.
To this end, this study investigates tension-induced stress in CTCP during the tensioning process through integrated field testing and FE analysis. In Section 2, a full-scale CTCP model was constructed for field testing to capture tension-induced stress distribution throughout the complete tensioning process. Subsequently, in Section 3, a validated FE model was developed to investigate both the tension-independent and tension-dependent effects on tension-induced stress in CTCP.
2. Field Testing
This section describes the construction of a full-scale test field, which was instrumented to elucidate the tension-induced response distribution in CTCP throughout the entire tensioning process. Furthermore, the field measurements enabled the subsequent validation of the FE model.
2.1. Field Test Set-Up
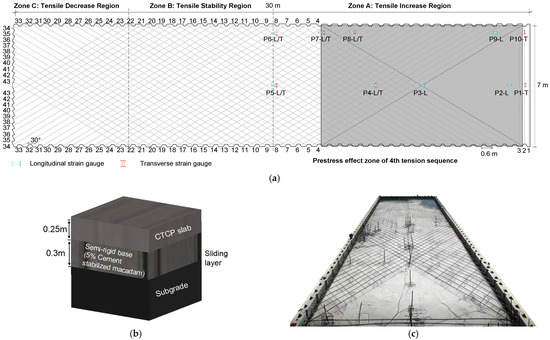
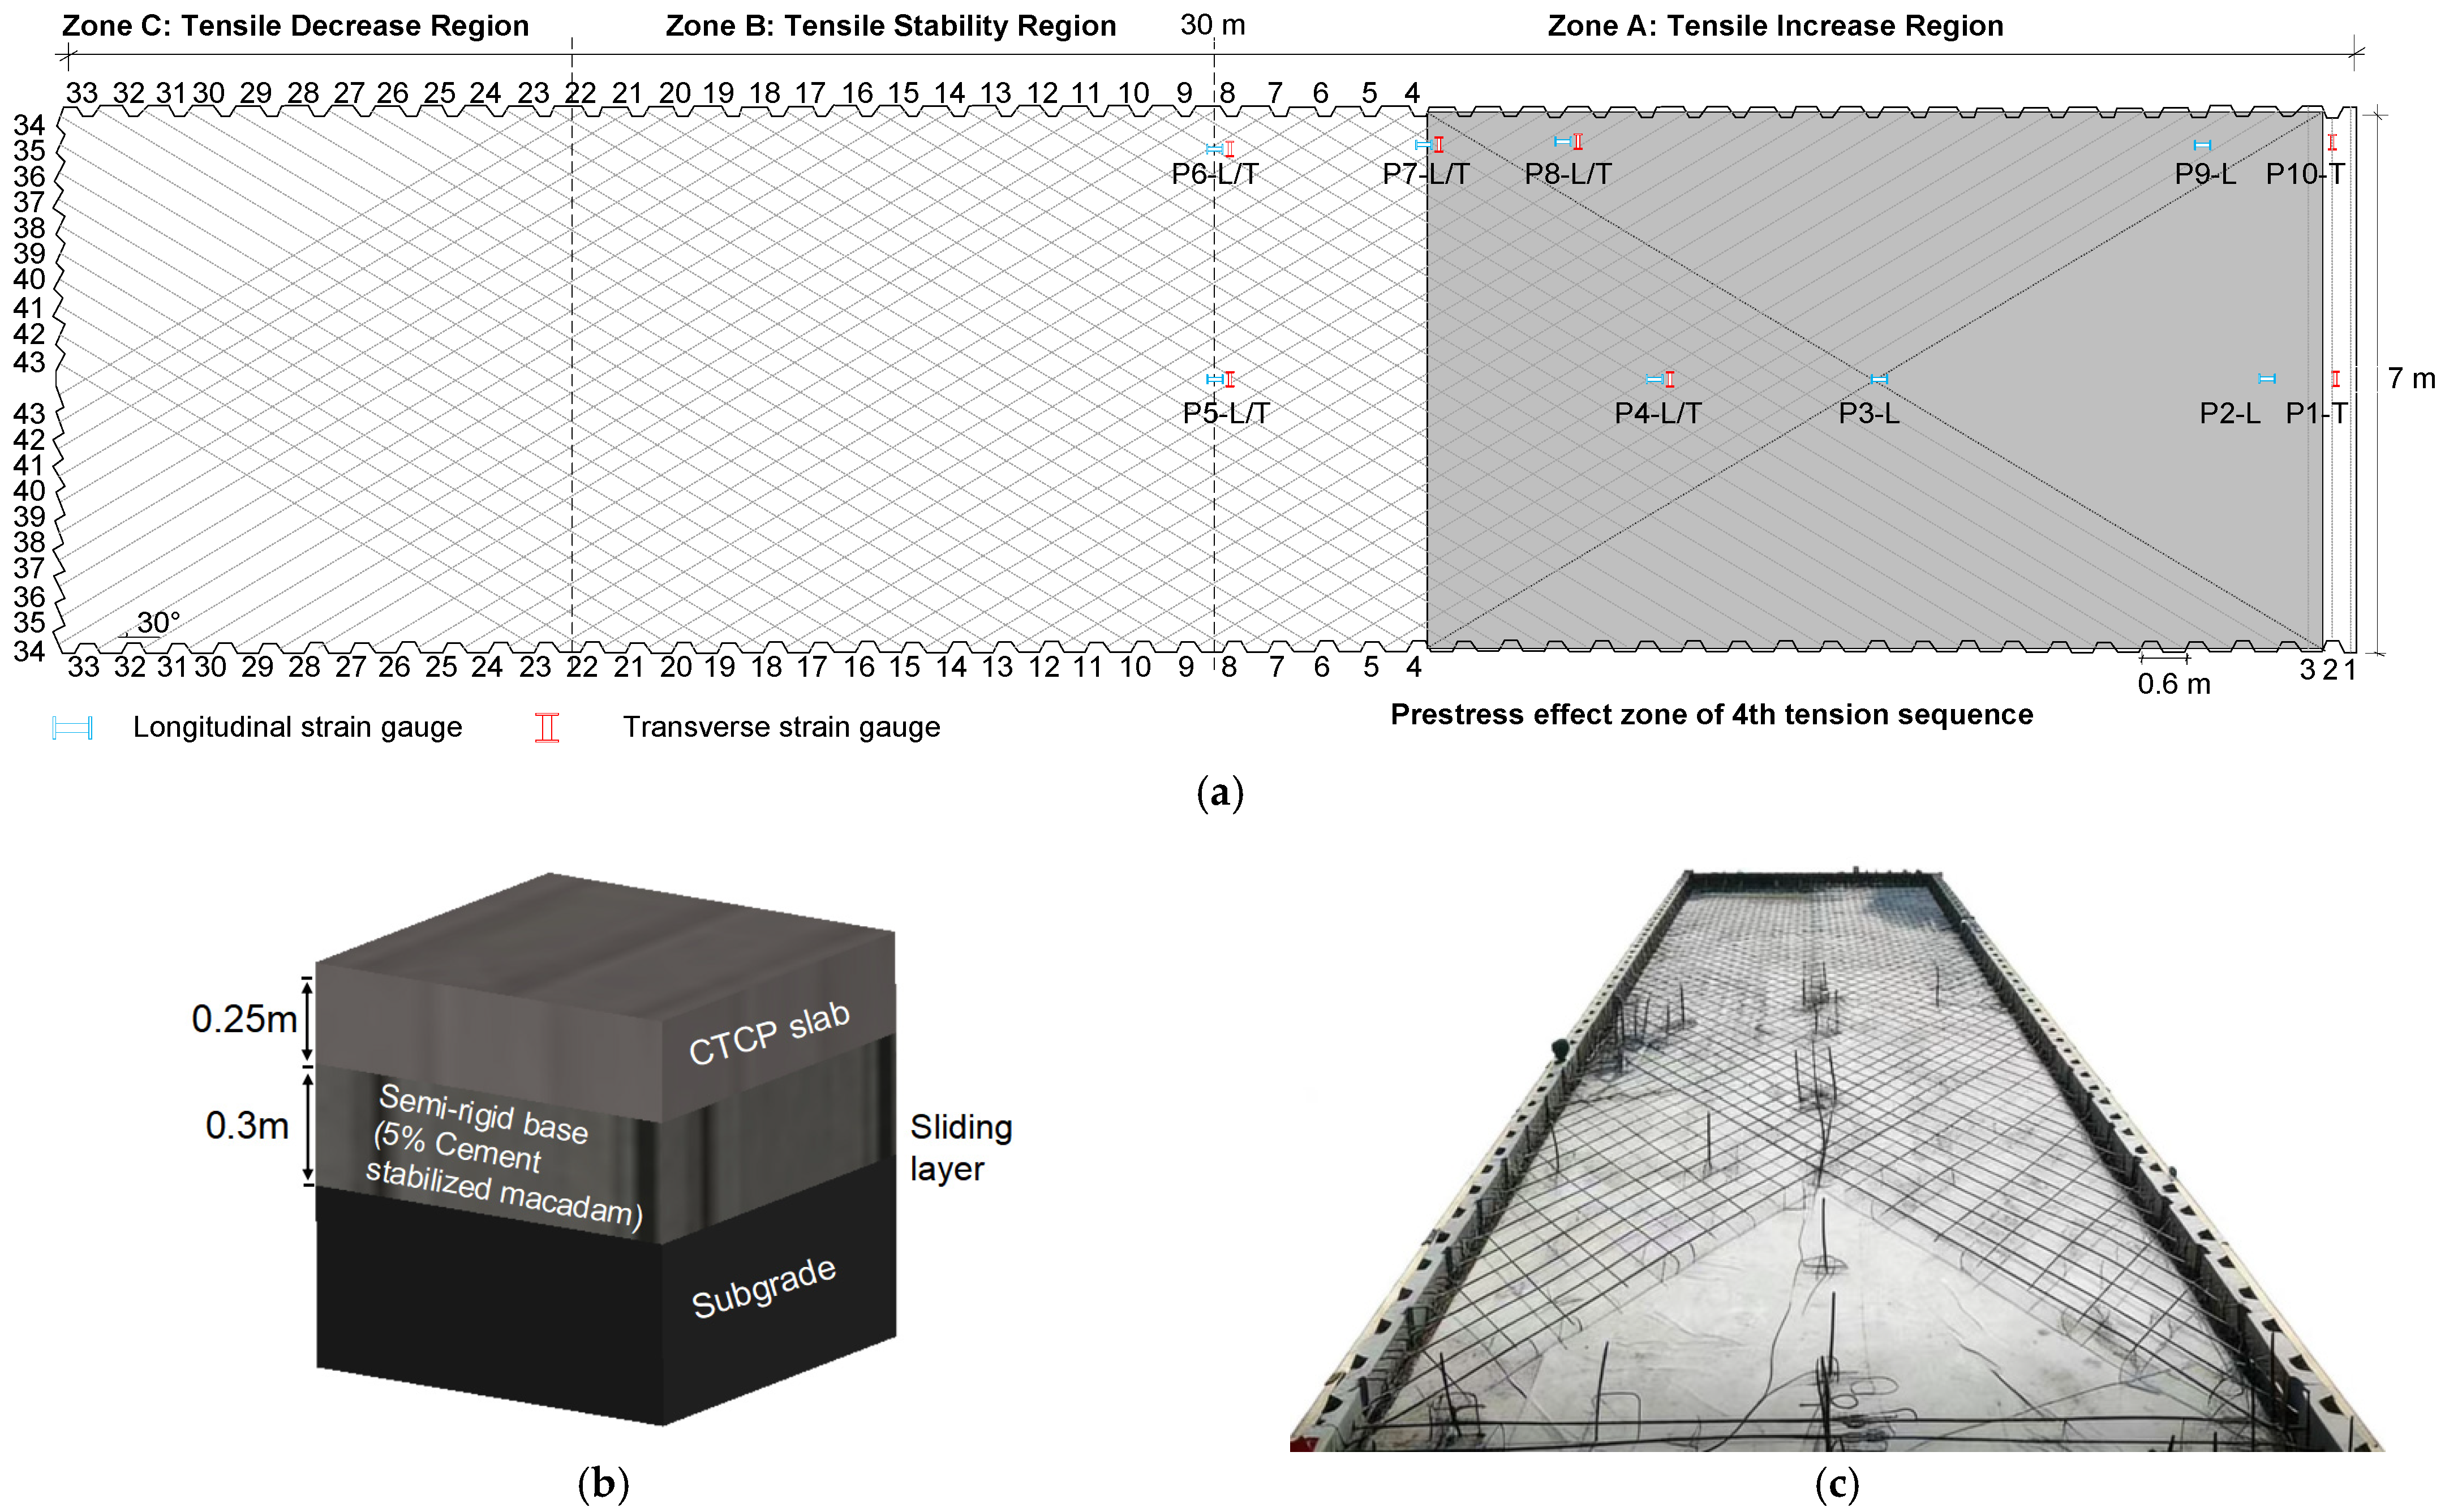
To experimentally investigate the mechanical response of CTCP during the sequential tensioning process and to provide validation data for the FE model, a full-scale test field was constructed as illustrated in Figure 2, the CTCP slab measured 30 m in length, 7 m in width, and 0.25 m in thickness, with a total area of 210 m2. The test section incorporated a total of 89 prestressed tendons: 86 diagonally oriented tendons arranged at a 30° angle relative to the longitudinal direction with a spacing of 0.6 m, and 3 transverse tendons. This tendon configuration was specifically designed to capture the complex tension-induced stress distribution characteristics associated with multi-directional prestressing in large-scale slabs.
Figure 2.
Layout of the field test. (a) Plan view. (b) Structural cross-section. (c) The tendon configuration.
The test slab was instrumented with an array of embedded strain gauges to monitor the evolution of stress during the complete tensioning process. Ten monitoring points, designated P1–P10, were established in two cross-sections: Section I located at the slab center (3.5 m from the longitudinal edge) and Section II located near the edge (0.5 m from the longitudinal edge). Each section contained five monitoring points equipped with strain gauges, with an additional fifteen strain gauges embedded at the pavement bottom. Longitudinal and transverse strain gauges were designated as “L” and “T”, represented by blue and red colors respectively in Figure 2a, enabling simultaneous measurement of longitudinal and transverse strain responses throughout the whole tensioning process.
The pavement structure comprised three layers, as depicted in Figure 2b: the CTCP slab, a semi-rigid base, and the subgrade. A 25 cm thick semi-rigid base constructed from stabilized macadam containing 5% cement was laid over the lime-stabilized subgrade. The 25 cm thick CTCP slab was designed with concrete grade C45, corresponding to a compressive strength of 45 MPa for 150 mm × 150 mm × 150 mm cubes after 28 days of curing, conforming to the Technical Specifications for CTCP (DB61/T 979-2015) [21]. The prestressed tendons had a nominal diameter of 15.2 mm. To minimize frictional resistance and accommodate end movements during tensioning, two polyethylene plastic films were installed between the concrete slab and the base layer, serving as a sliding layer to ensure effective prestress transfer and reduce boundary constraints.
2.2. Tensioning Setup
In this field test, the tensioning process proceeded symmetrically from the right side to the left side of the slab. Each pair of symmetrically arranged prestressed tendons was tensioned simultaneously to ensure uniform and symmetrical tension-induced stress distribution within the pavement. As illustrated in Figure 2a, the numbers marked on the tendons indicate their tensioning sequence. For instance, two tendons labeled with the number “4” belong to the 4th tensioning group, meaning they were tensioned after completion of the 3rd tendon group. A total of 43 pairs of symmetrically arranged prestressed tendons were tensioned sequentially from the 1st pair to the 43rd pair. Each tensioning operation lasted 3–5 min, and the entire sequence was completed within approximately 3–4 h. To minimize the influence of ambient temperature variations, all tensioning operations were conducted during daytime hours.
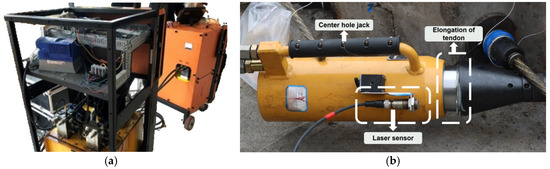
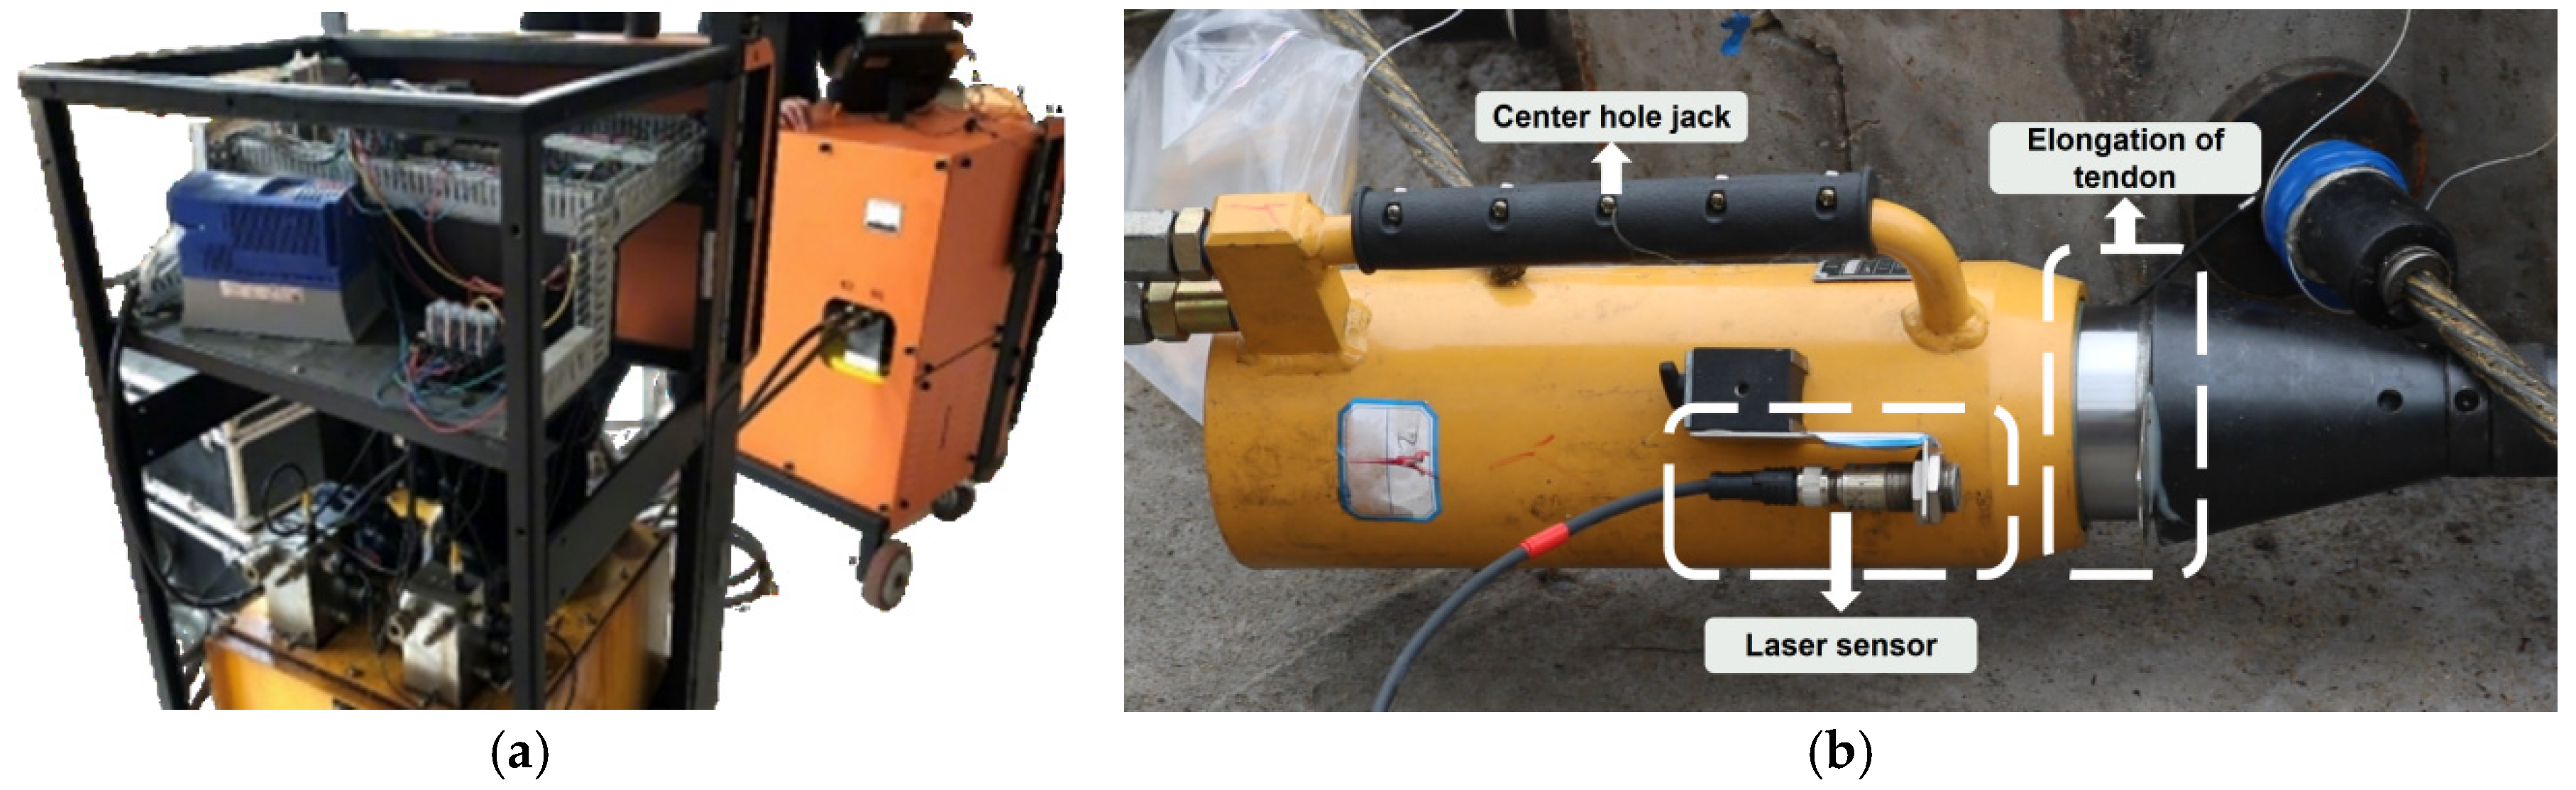
The tensioning force was controlled by an oil pump and applied using a center-hole jack equipped with an intelligent tensioning machine (TH-PTD, Toehold Engineering Technology, China), as shown in Figure 3a. The elongation of each prestressed tendon was measured by a laser sensor instrumented on the center hole jack to verify the applied tensioning force, as shown in Figure 3b. For post-tensioned prestressed structures, particularly when dealing with large concrete volumes, an initial tensioning is typically performed within 24 h after casting to reducing the risk of early-age tensile stress concentrations [22]. Accordingly, in this test, the first tensioning process applied 30% of the control stress. Subsequently, after the concrete compressive strength reached 75% of the design strength, a second tensioning process was conducted at 105% of the control stress to compensate for stress losses due to creep.
Figure 3.
Tensioning system. (a) Intelligent tensioning machine. (b) Apply tensioning force.
2.3. Results of Field Testing
To investigate the effect of prestress on tension-induced response during the tensioning process, this section first presents the response variations observed during a given tensioning operation. Subsequently, the measured responses from both sections throughout the complete tensioning process are examined and discussed.
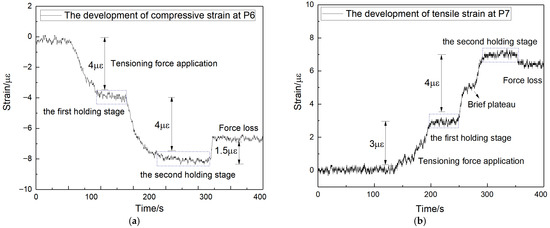
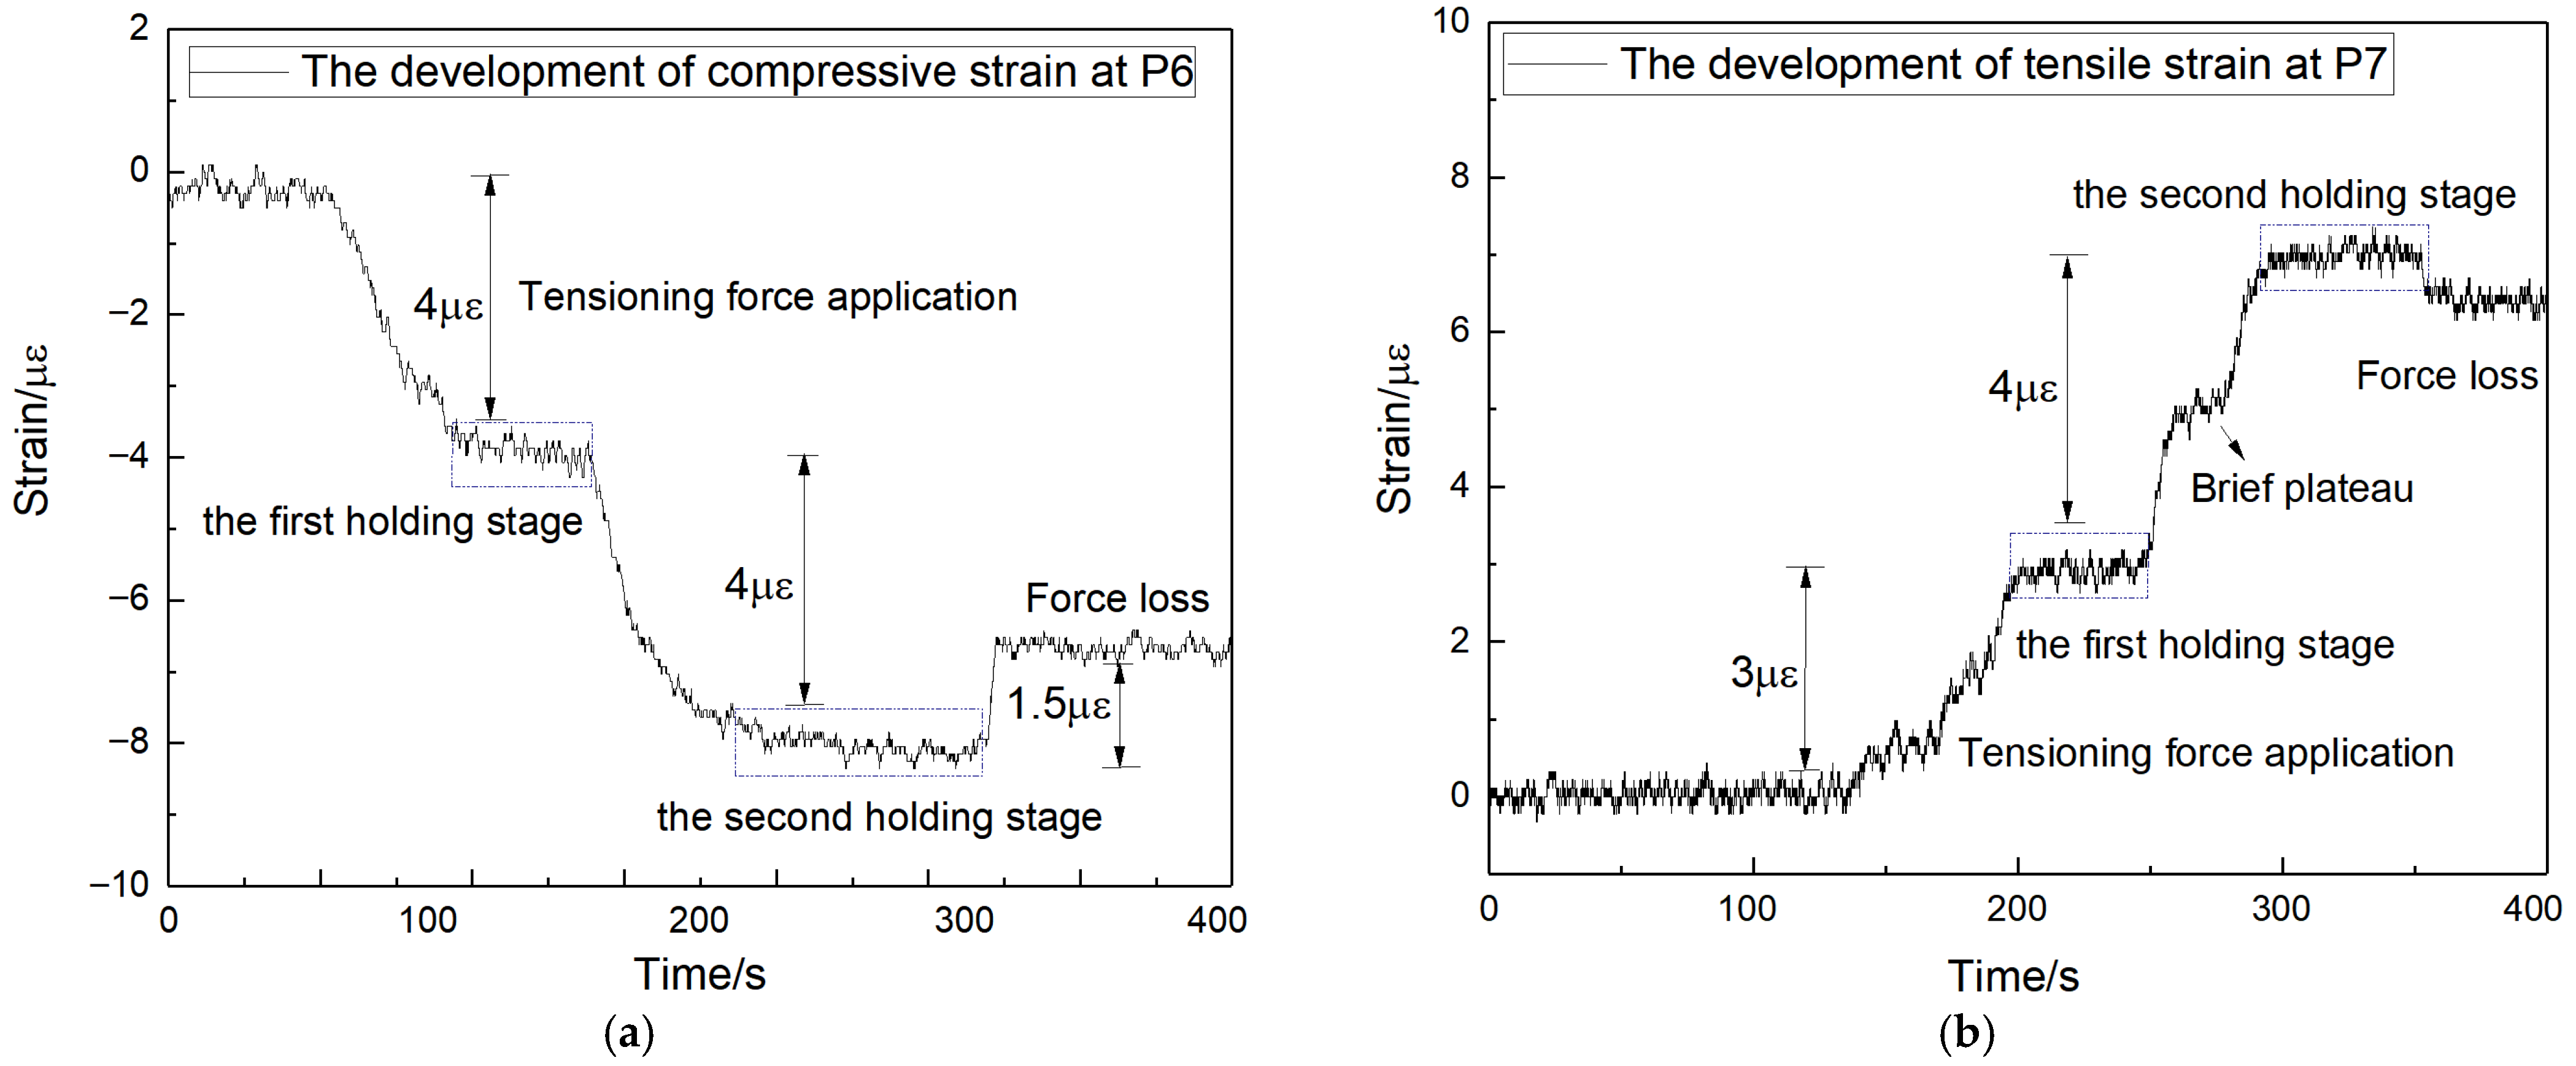
Figure 4 presents the development of two typical tension-induced strain responses at two different positions obtained from one certain tension operation. It is noted that two holding periods were set at every time of tensioning operation to avoid tensioning too fast. Figure 4a shows that the compressive strain increases from 0 to 4 με with the increase in tensioning force from (0 to 29.2 kN), and then it maintains stability when the tensioning machine is holding. After that, the compressive strain increases from 4 με to 8 με when the tensioning force is applied twice. But after the second holding stage, the compressive strain decreases suddenly. The reason for this sudden decrease is that the jack stops tensioning and the prestressed tendon begins to shrink, resulting in a significant loss in prestress force.
Figure 4.
The development of strain obtained from one certain tension operation. (a) The development of strain at P6. (b) The development of strain at P7.
Figure 4b shows the development of tensile strain at monitoring point P7, exhibiting a generally similar pattern to that shown in Figure 4a. It is worth mentioning, however, that a brief plateau was observed between the first and second holding stages in Figure 4b. This plateau resulted from uneven oil supply during jack operation, which caused a temporary pause in tensioning before the second loading phase resumed.
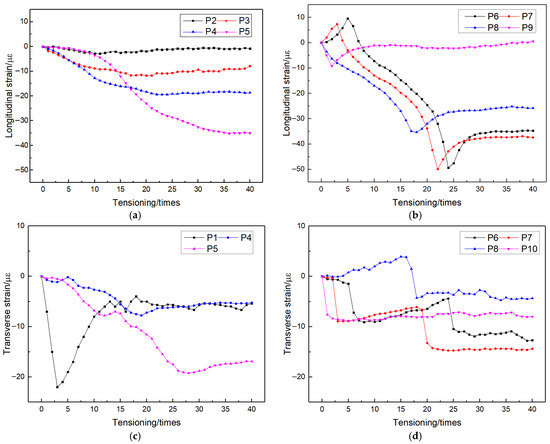
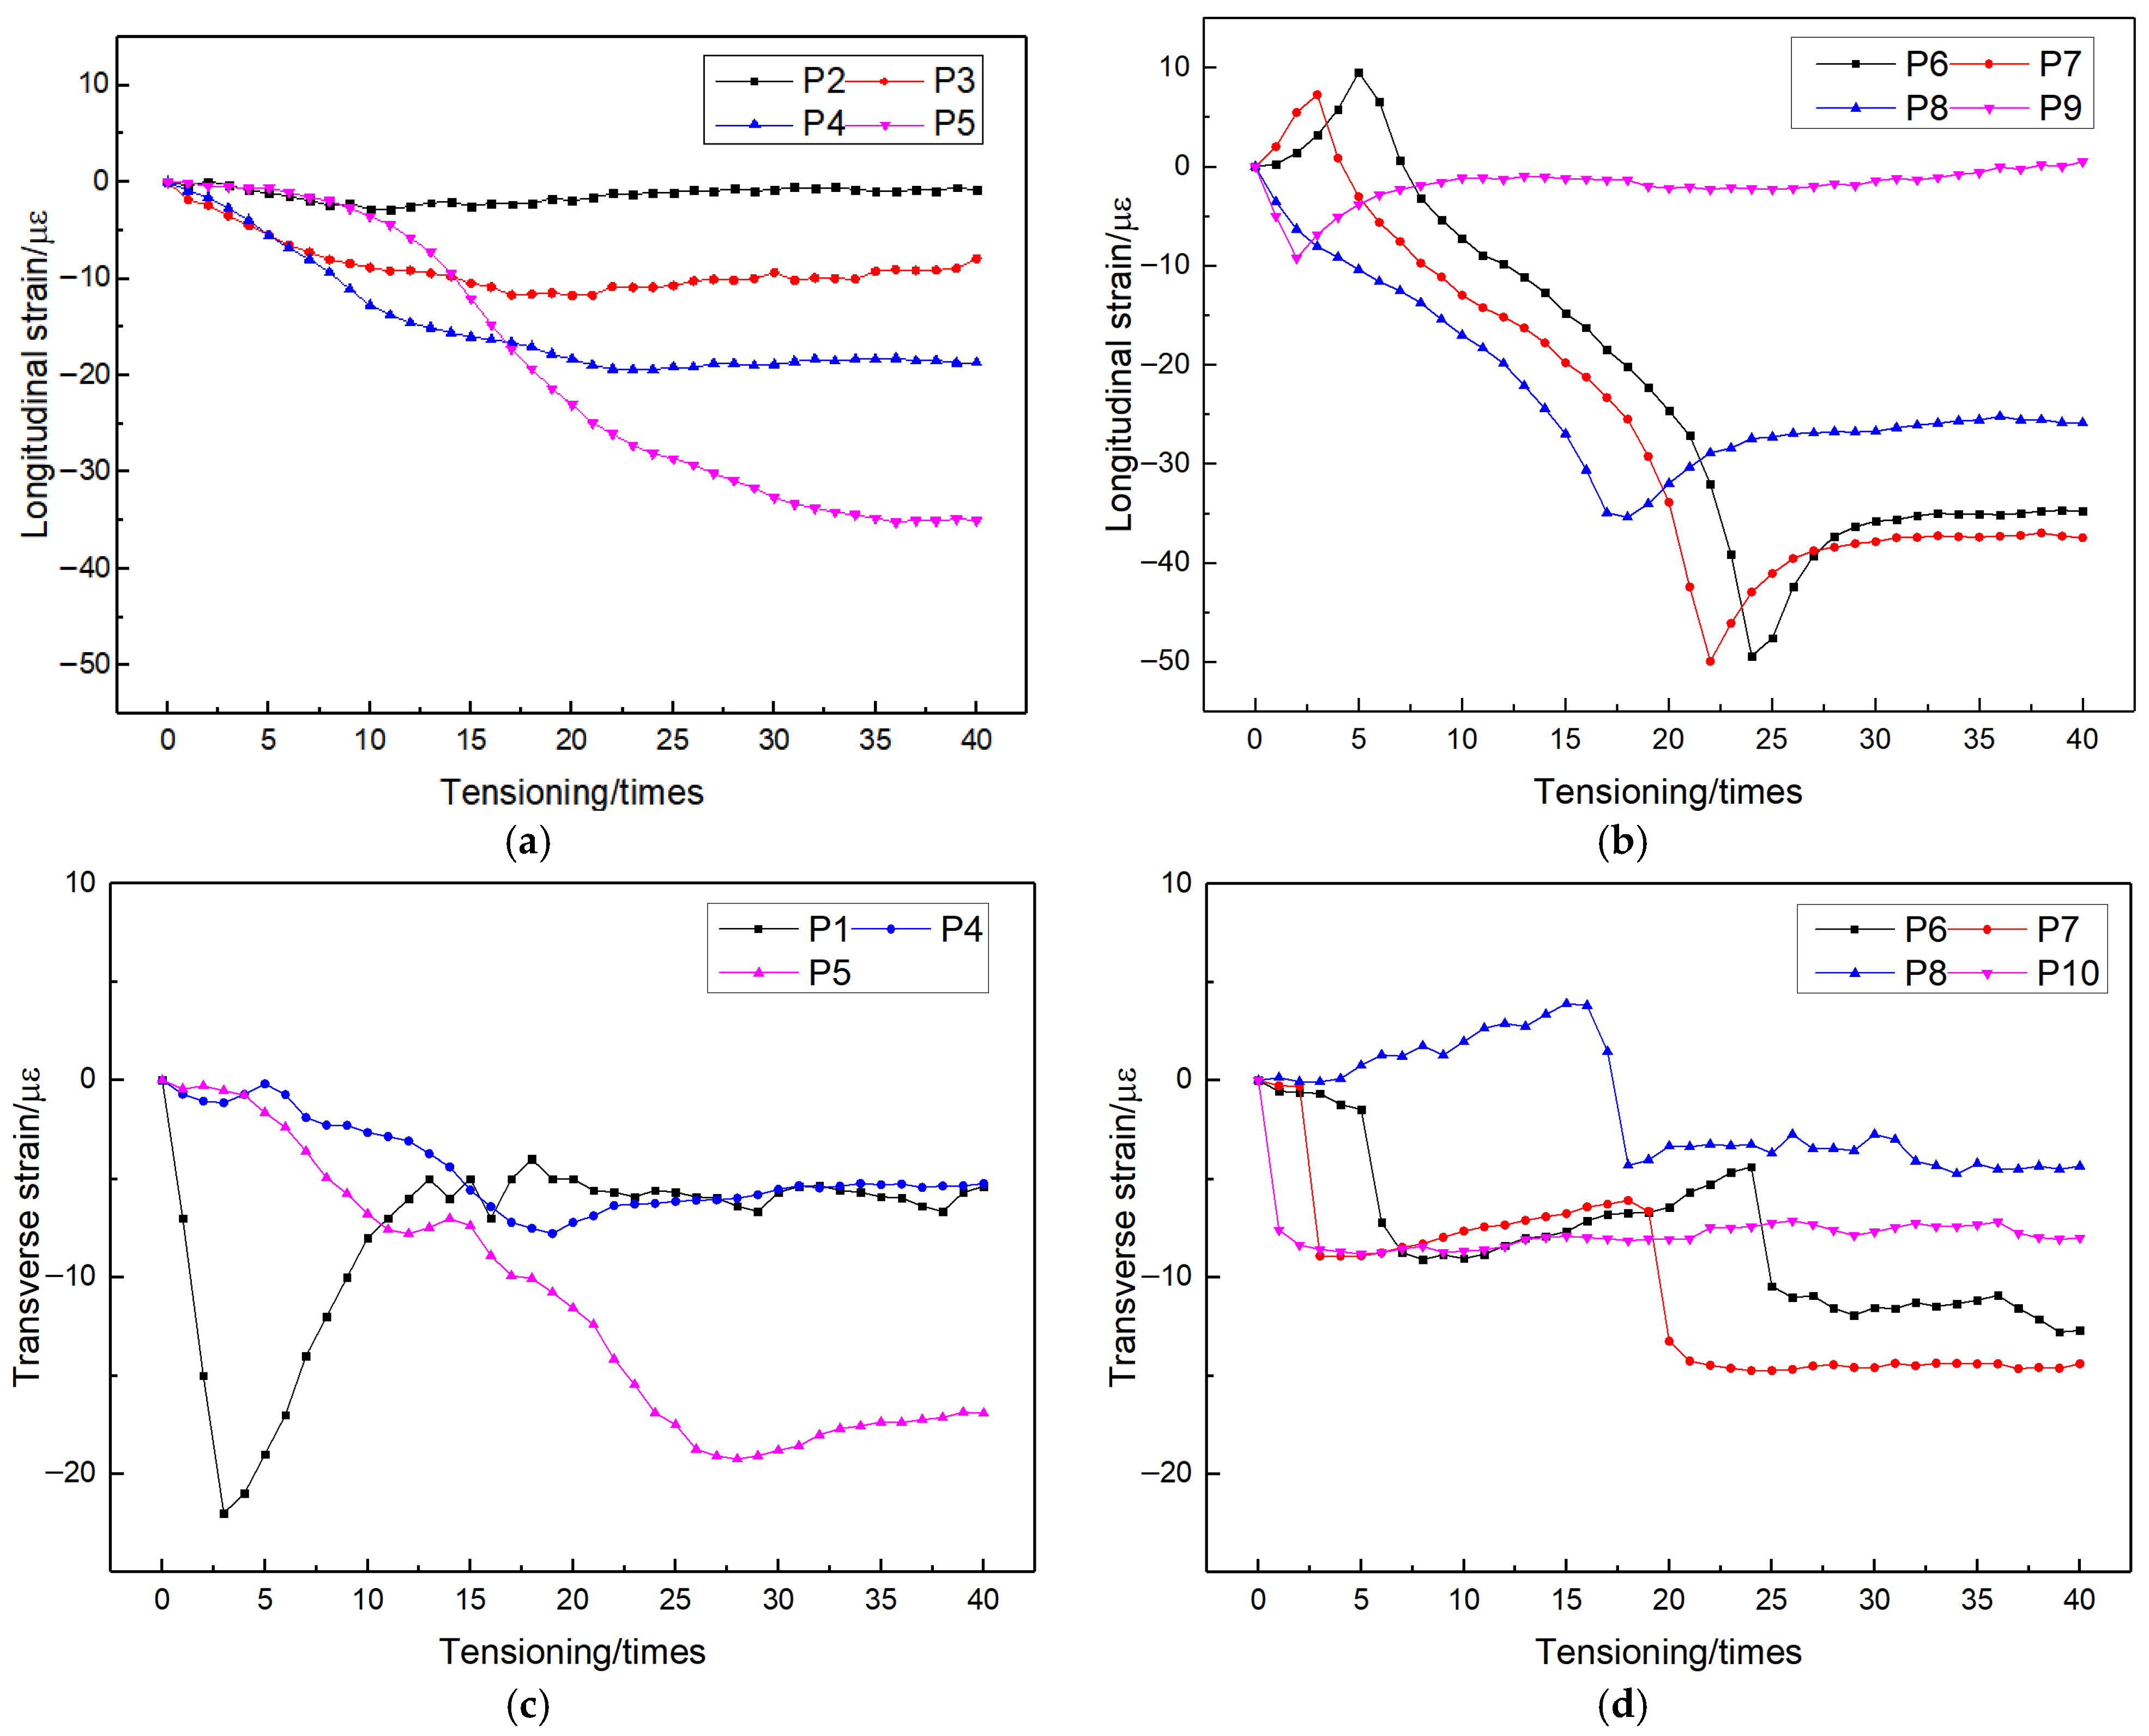
Figure 5a presents the development of longitudinal strain (E1) in Section I during the tensioning process. Three findings can be observed. First, at P2, E1 fluctuates around zero throughout the entire tensioning process, indicating that tensioning has negligible influence on the unreinforced area. Second, at P3 (the transition between unreinforced and reinforced areas) and P4, compressive strain accumulates gradually, reaching 9 με and 18 με by the 13th and 18th tensioning, respectively; thereafter, the strain stabilizes, demonstrating that the tensioning process significantly affects these regions. Third, at P5 (slab center), E1 initially remains near zero during early tensioning, then progressively increases to a compressive strain of 35 με by the 30th tensioning.
Figure 5.
Field measurement results. (a) E1 in Section I. (b) E1 in Section II. (c) E2 in Section I. (d) E2 in Section II.
Figure 5b shows the measured E1 in Section II, where two distinct patterns emerge. At P6 and P7, tensile strain appears at the beginning of tensioning and increases with successive tensioning operations; subsequently, a sharp decrease occurs as the strain transitions to maximum compressive strain, followed by gradual stabilization. At P8 and P9, no tensile strain is observed throughout the entire process; only compressive strain variations occur, similar to the later-stage behavior of P6 and P7.
The observed tensile strain is attributed to the prestress force, which tends to tighten the concrete between adjacent tensioned points. To explain this phenomenon, the concept of the “prestress effect zone” is introduced, as illustrated in Figure 2a, referring to the concrete region encompassed by tensioned tendons. Specifically, P8 and P9 lie within the prestress effect zone of the 1st tensioning, thus exhibiting compressive strain, which diminishes as they move out of this zone during subsequent tensioning. In contrast, P6 and P7 are initially outside the 1st tensioning effect zone, resulting in tensile strain that intensifies with additional tensioning until these points enter a nearby effect zone, whereupon the strain rapidly shifts from tension to compression.
Figure 5c,d presents the transverse strain (E2) in Sections I and II, respectively. In Section I, the compressive strain at P1 increases sharply to 23 με after tensioning of the three transverse tendons. However, once diagonal tensioning begins, E2 gradually decreases, highlighting the importance of transverse tendons at the slab edge in reducing diagonal-tensioning-induced tensile strain. At P4 and P5, E2 exhibits similar trends, reaching a plateau after the 19th and 28th tensioning, respectively. In Section II, two distinct plateaus are observed at P6, P7, and P8, indicating that only a limited number of tensioning operations significantly affect E2. Transverse compressive strain increases rapidly when a diagonal tendon passes through the monitoring point, but diminishes when the prestress effect zone moves away. This suggests that E2 is primarily influenced by the nearest prestress effect zone, with distant zones having minimal impact. Notably, shorter plateaus correspond to higher strain values, implying that more tensioning operations contribute to the cumulative strain. At P10, E2 remains compressive throughout the entire process without reduction, contrasting with P1 and indicating that diagonal tendons have limited influence on the pavement edge response.
Overall, the transverse strain analysis reveals that E2 remains predominantly compressive at both the edge and center of the slab, significantly affected only by the nearest few prestressed tendons, while distant tendons exert minimal influence.
3. Finite Element Analysis
For CTCP, stress distribution is extremely complex due to the increasing number of cross-tensioned prestressed strands in longer slabs, making accurate analytical solutions difficult to obtain. Numerical simulation using the finite element (FE) method has proven to be an effective approach for investigating tension-induced stress responses. Therefore, to fully understand the behavior of CTCP throughout the entire tensioning process, FE models were developed to investigate the development of tension-induced stress distribution through the whole tensioning process in this section. This numerical investigation aims to provide a comprehensive understanding of tension-induced stress and to lay the groundwork for its design.
3.1. Finite Element Model Development
3.1.1. Finite Element Model of CTCP
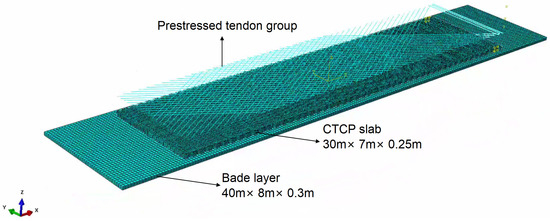
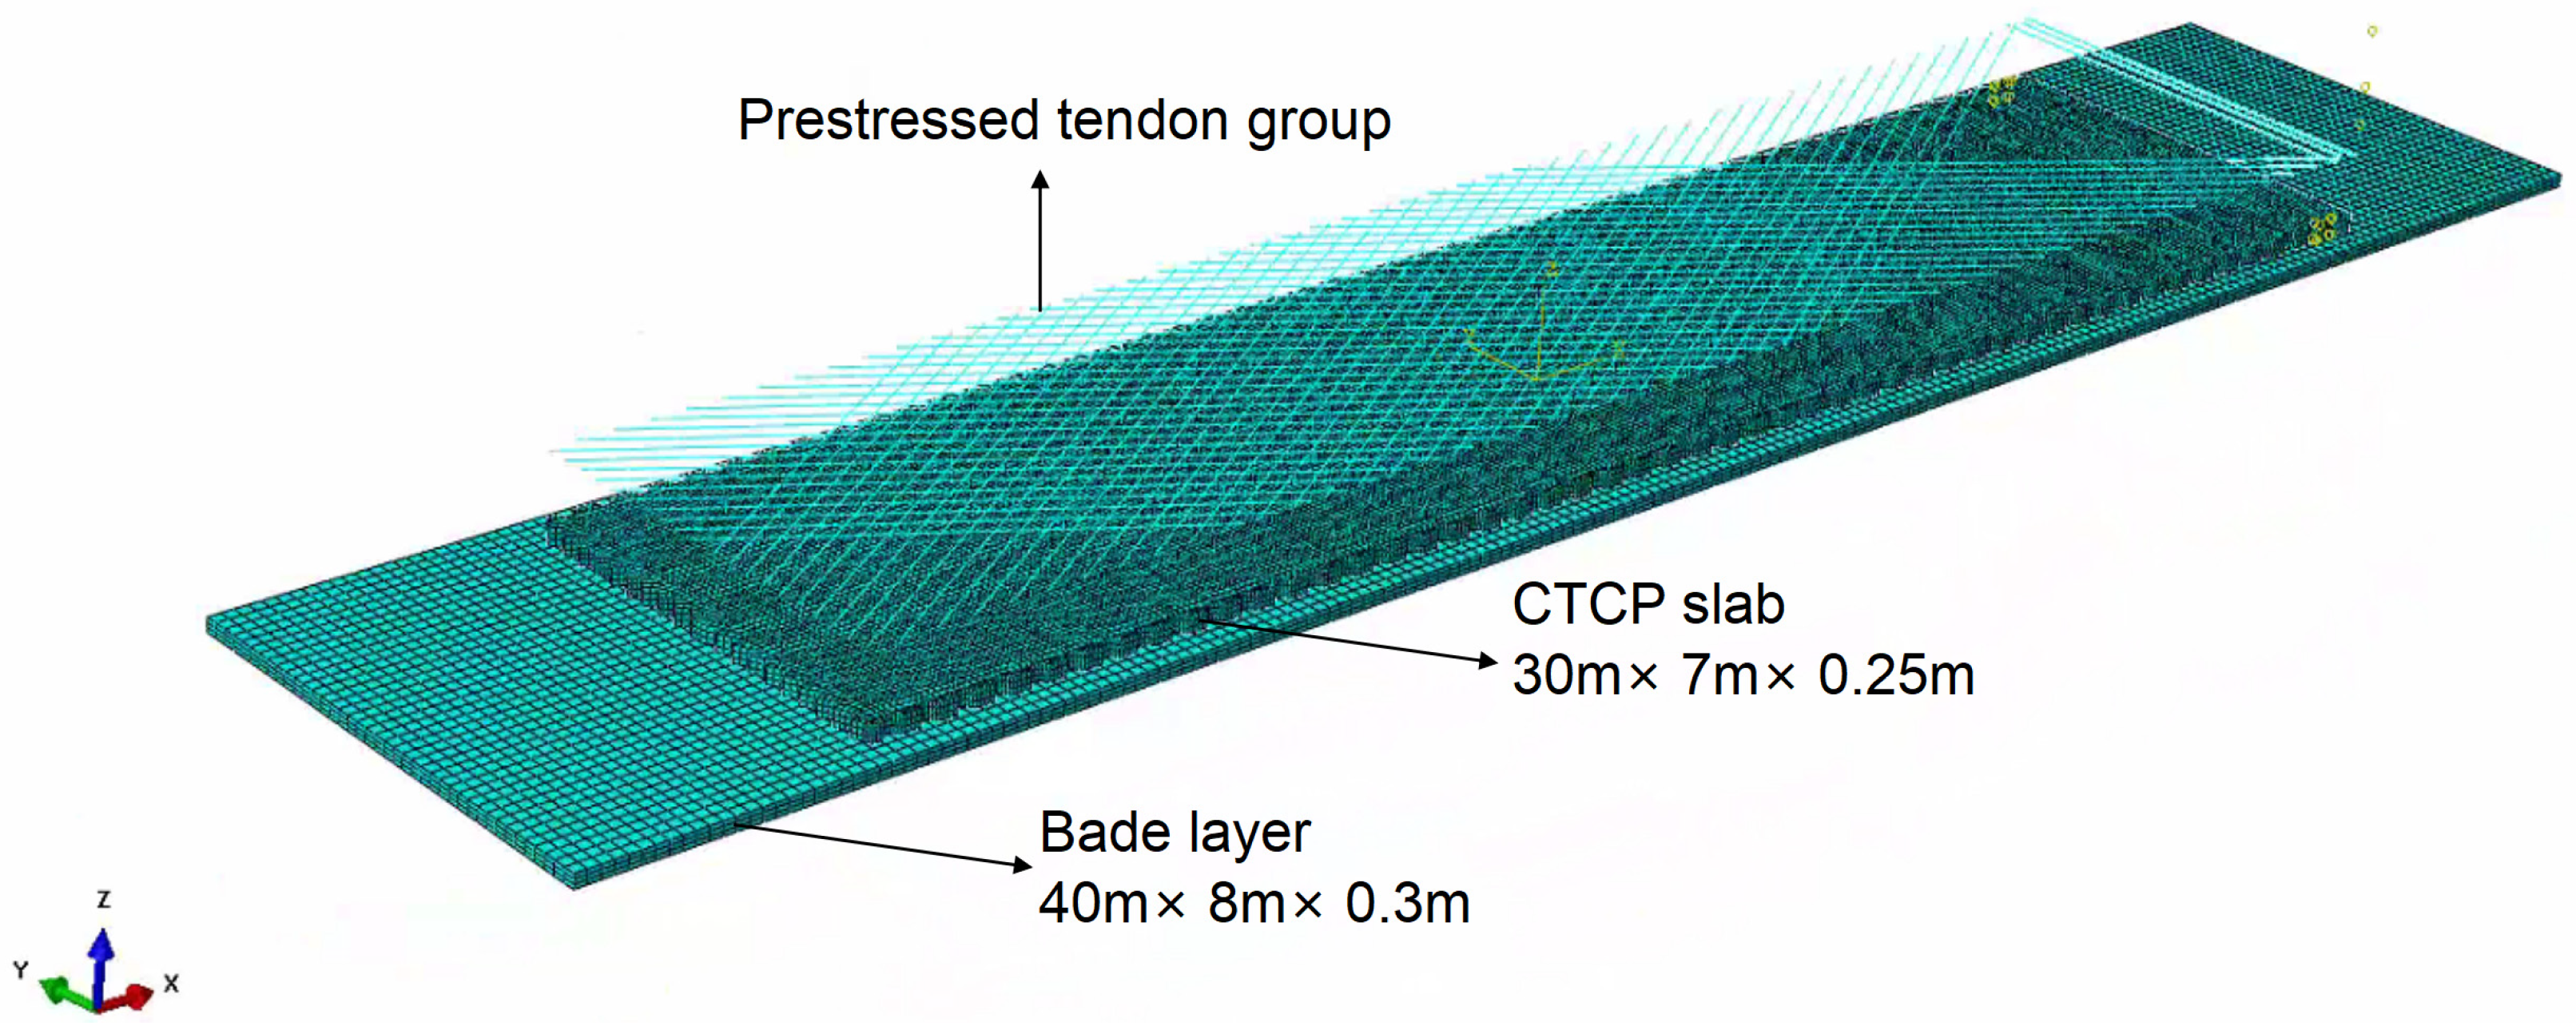
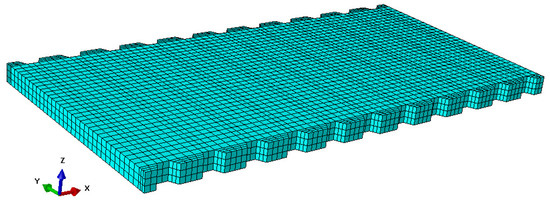
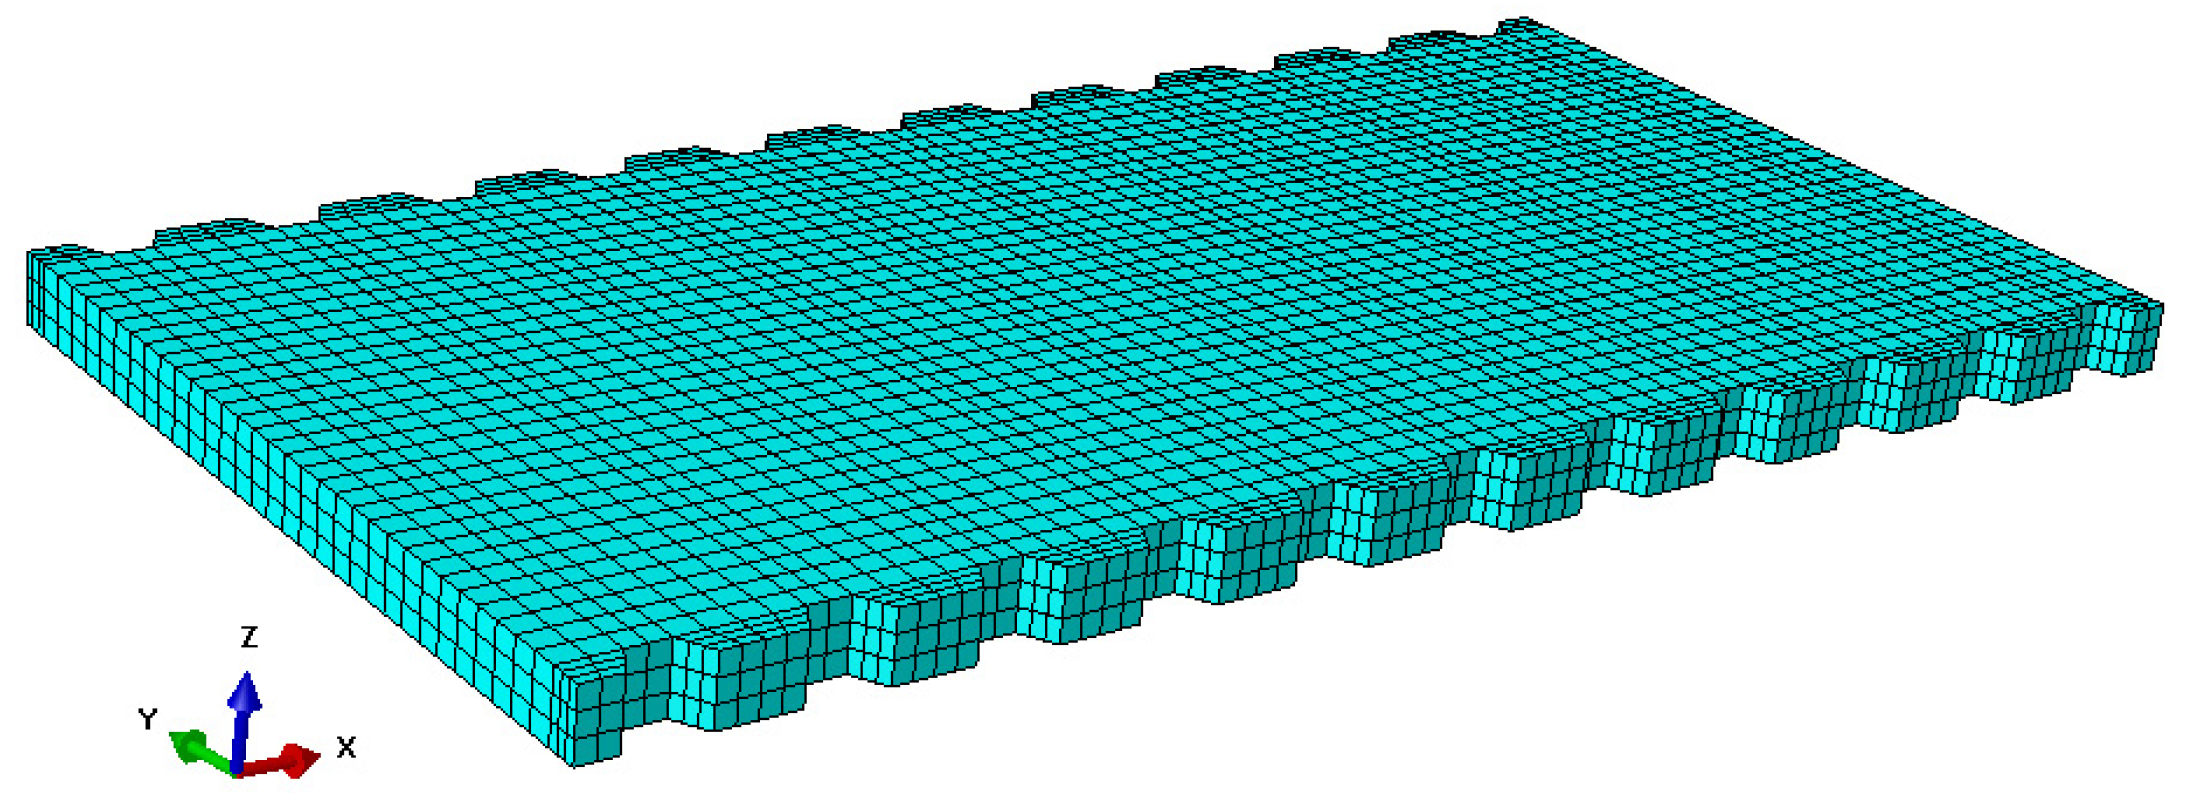
A three-dimensional finite element (FE) model was developed using ABAQUS, as shown in Figure 6. The subgrade support was modeled as a Winkler foundation, following the approach described by Chen et al. [10]. The FE model was simplified to a two-layer structure comprising the CTCP slab and the base layer: the CTCP slab measured 30 m in length, 7 m in width, and 0.25 m in thickness, while the underlying base layer measured 40 m in length, 8 m in width, and 0.3 m in thickness. Boundary conditions were applied such that the slab width direction (X-axis) was restrained against displacement in both the X and Y directions (i.e., no horizontal movement), whereas the longitudinal direction (Y-axis) was free, allowing for unrestricted movement in the slab length direction. Vertically (Z-axis), the bottom surface of the slab was supported by the base layer. The model employed eight-node linear brick elements with reduced integration (C3D8R) for both the slab and base layers, with element sizes ranging from 0.1 m to 0.5 m. The prestressed tendons were modeled using two-node linear beam elements (B31) with an element size of 1 m. A hard contact interaction was defined between the slab and the base layer, allowing normal separation without penetration. Tangential behavior was modeled using a penalty friction formulation with a friction coefficient of 0.66, consistent with the sliding layer properties determined from laboratory tests [10]. All materials were assumed to be linear elastic, with material properties adopted from Liao et al. [23], as summarized in Table 1.
Figure 6.
Finite element analysis model of CTCP.
Table 1.
Parameters of CTCP model.
3.1.2. Simulation of Prestress Force
Accurate simulation of unbonded prestress force is critical in FE analysis of CTCP. Unbonded prestressing technology, commonly used in CTCP systems, differs from bonded post-tensioning in that it allows permanent longitudinal movement of the prestressed tendons relative to the concrete [24,25]. This is typically achieved by encasing each tendon in a plastic sheath filled with corrosion-inhibiting grease. The tensioning force is transferred to the concrete through anchorages at the tendon ends, generating the effective prestress force. Due to the presence of grease between the tendon and sheath, the displacement of the sheath is negligible and can be disregarded. Consequently, the prestress force is often simulated by applying a uniform load on the anchorage zone [26], which can be calculated using Equation (1):
where FT is the tensioned control stress (N); σT is the uniform load (MPa); Sa is the cross-sectional area of the anchor plate (mm2).
Another widely used approach for simulating prestress force is the initial temperature load method [27,28]. In this approach, the prestressed tendons were modeled as individual components, and the connections between the tendon ends and the anchorage zones were established using Multi-Point Constraint (MPC) Beam constraints. The equivalent temperature change required to produce the desired prestress force is given by Equation (2):
where ∆T denotes applied temperature; C denotes the coefficient of linear expansion; Fp denotes prestress force; Ep denotes elastic modulus of prestressed tendon; Ap denotes the cross-sectional area of prestressed tendon.
To compare and evaluate the two simulation methods—the uniform load (UL) method and initial temperature (IT) method—a numerical model with plan dimensions of 4.0 m × 2.2 m was established, as shown in Figure 7. In the unbonded prestress simulation, the tendon diameter was 15.2 mm, with a tension control stress (σcon) of 1395 MPa (approximately 75% of the ultimate tensile strength), corresponding to a tension control force of 195.3 kN per tendon. For the UL method, the equivalent uniform load (σT) was calculated as approximately 25 MPa based on Equation (1), using an anchor plate area of approximately 78.5 cm2. For the IT method, the linear expansion coefficient C was taken as 2.0 × 10⁻⁵, the cross-sectional area Ap as 140 mm2, and the elastic modulus as 200 GPa. The required negative temperature change ΔT was calculated from Equation (2) to be −311 °C.
Figure 7.
Finite element model (4.0 m × 2.2 m) used for method comparison.
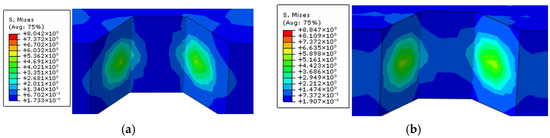
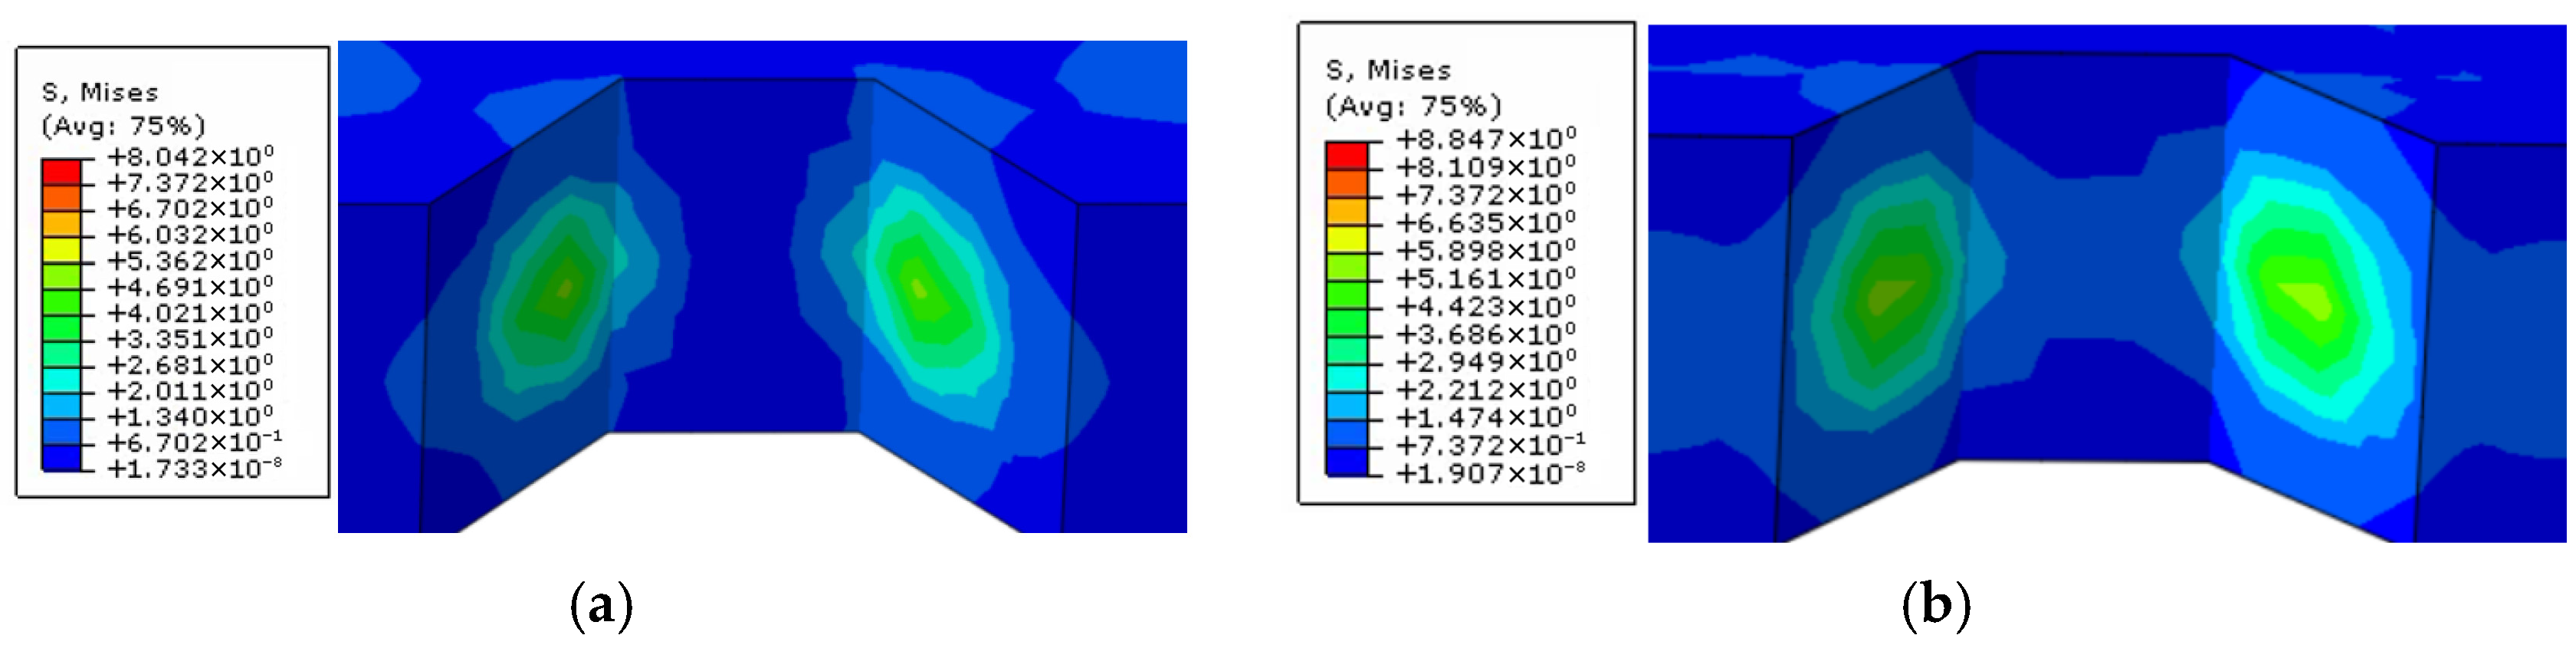
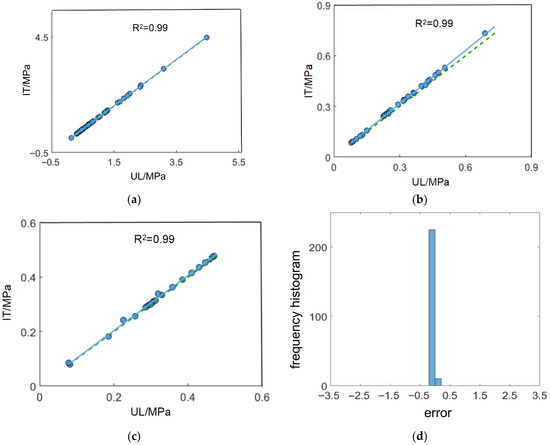
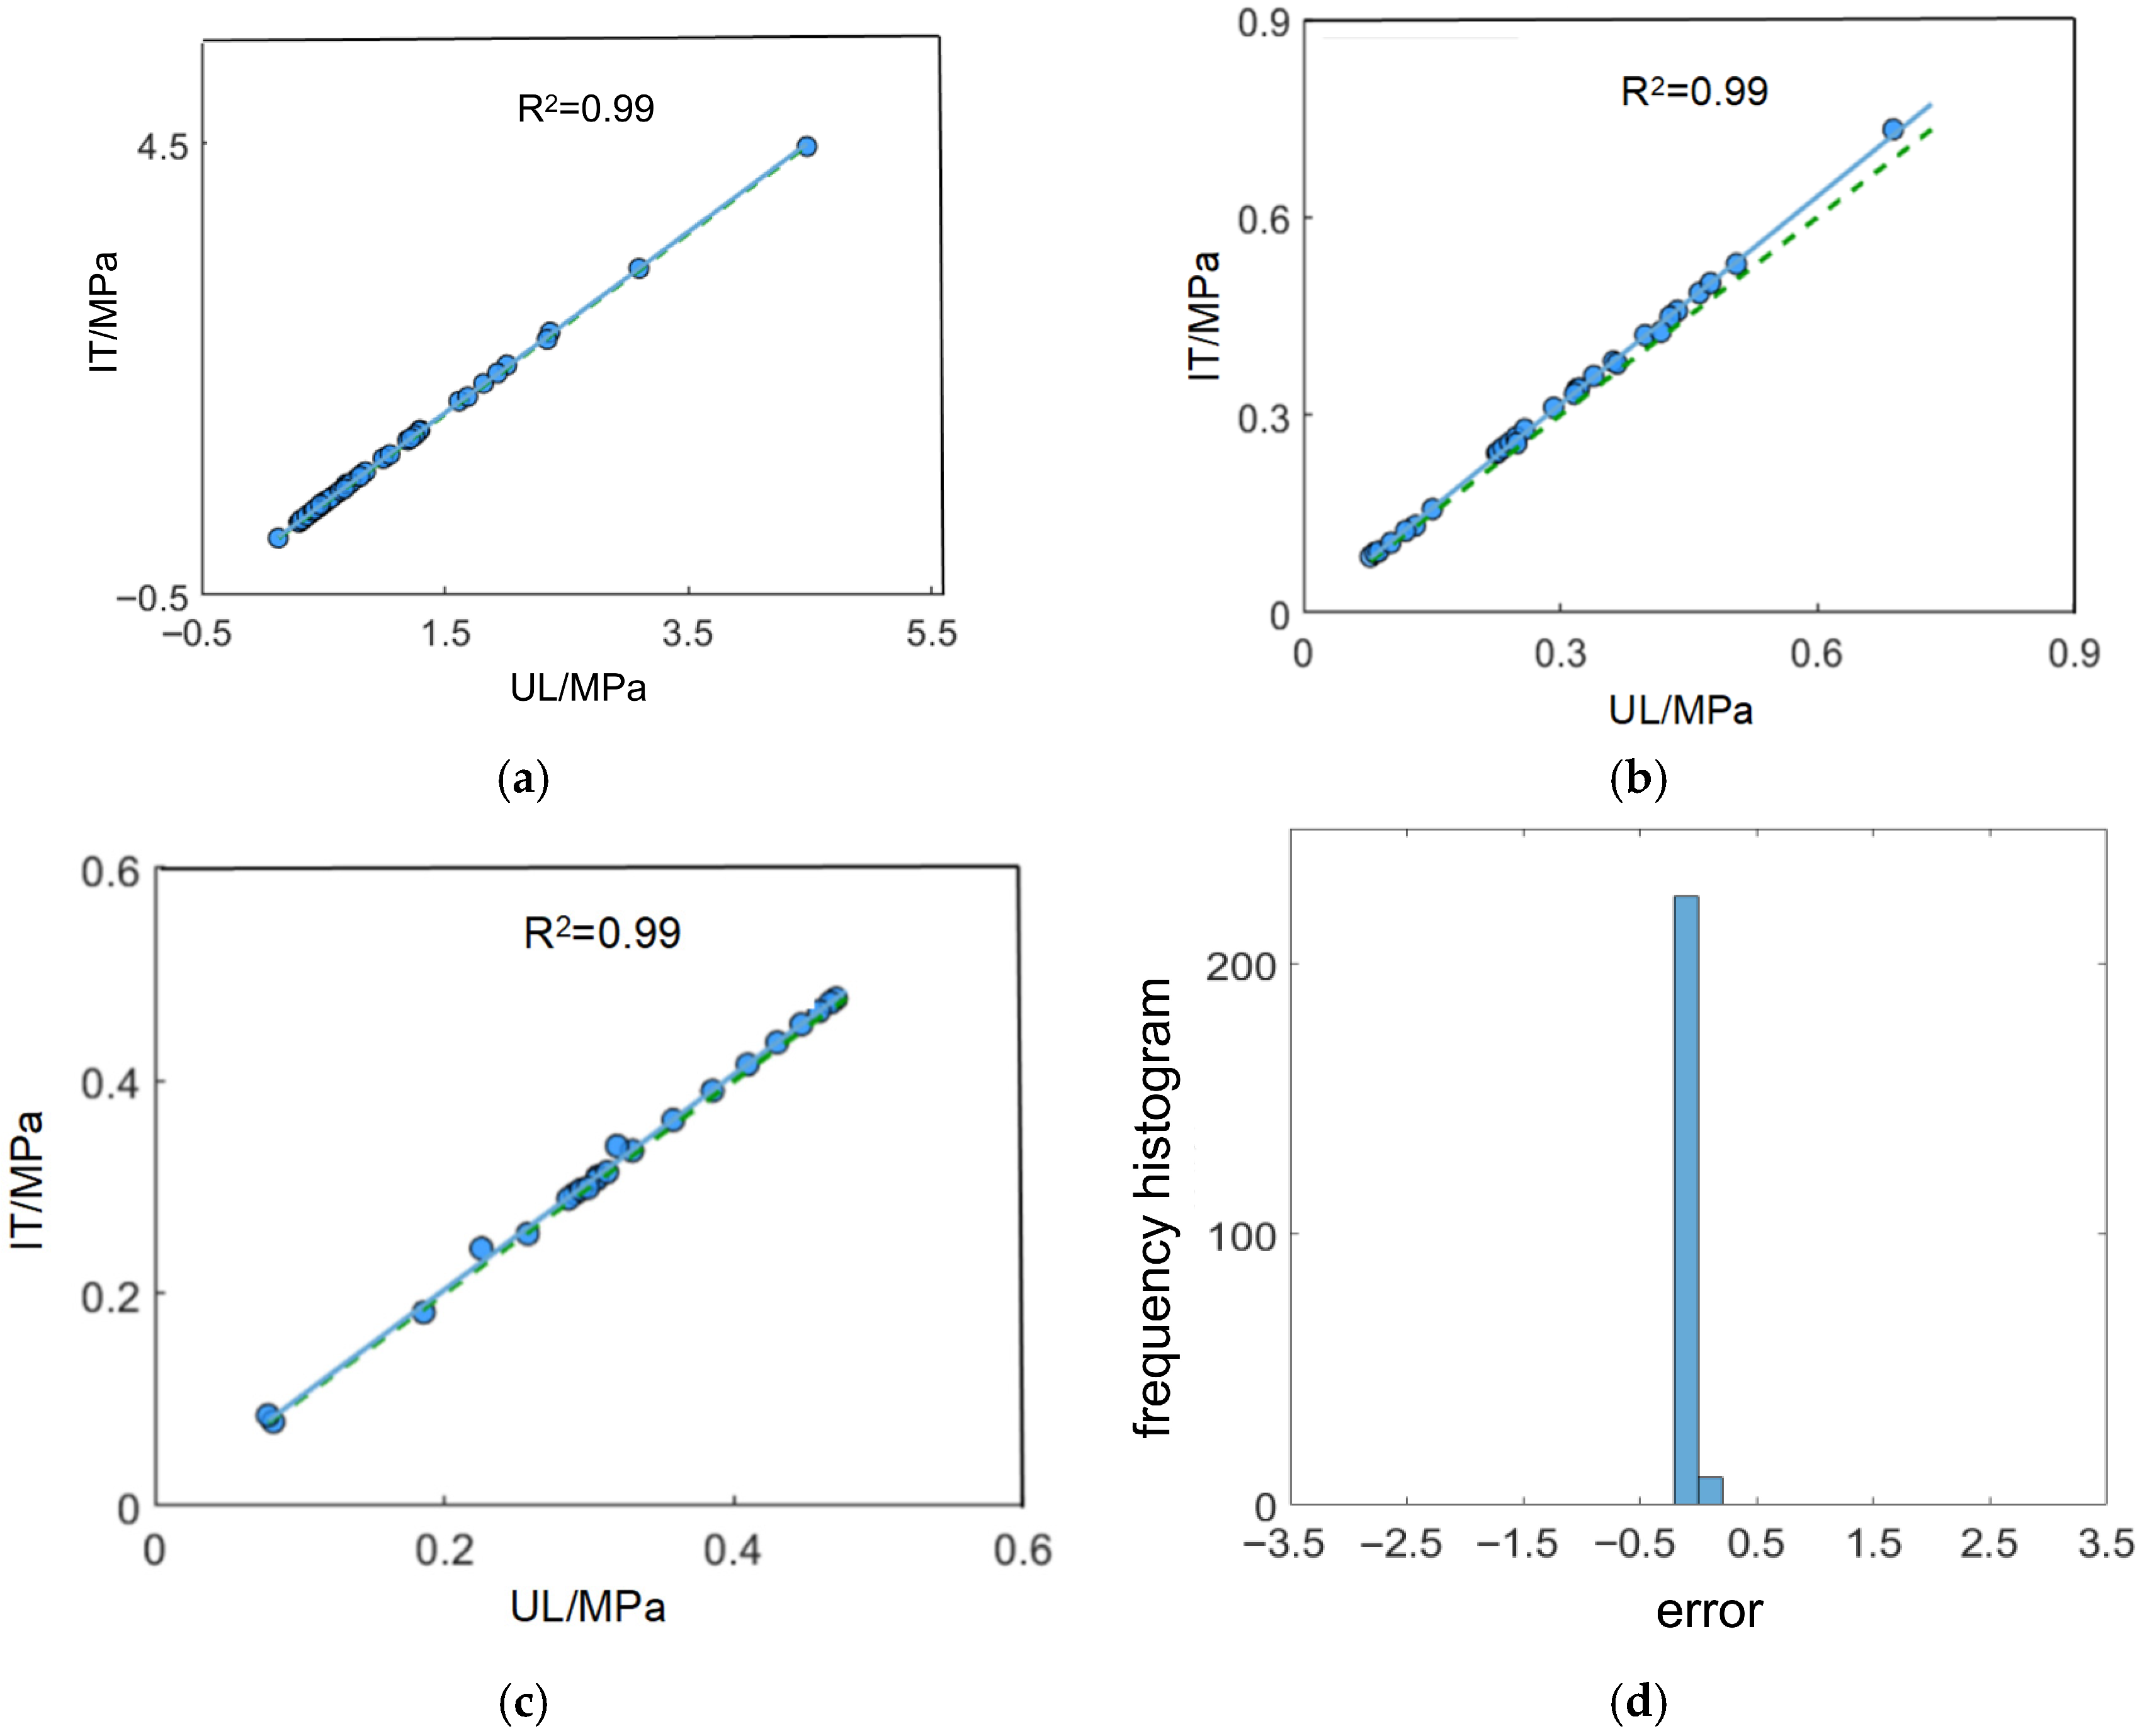
After applying the prestress, the resulting stress distributions in the anchorage zone obtained from both methods were nearly identical, as shown in Figure 8. Further quantitative comparison of Mises stress values at various pavement locations (e.g., transverse joint edge, longitudinal joint edge, and slab center) is presented in Figure 9. The results reveal excellent agreement between the two methods, with a coefficient of determination (R2) of 0.99. Figure 9d shows the error distribution, where the vast majority of errors are concentrated near zero, indicating high consistency and reliability of both methods in simulating the tension-induced stress in CTCP. In summary, both the uniform load method and the initial temperature method can effectively and accurately simulate the heterotrophic prestress in CTCP for tension-induced stress analysis. For investigating the overall structural performance of CTCP, the equivalent uniform load method offers simplicity and efficiency. However, when the focus is on local tension-induced responses or the specific influence of tendon configuration on structural behavior, the initial temperature method is more appropriate due to its ability to capture localized effects.
Figure 8.
Stress distribution in anchorage zone obtained from two methods. (a) IT method. (b) UL method.
Figure 9.
Comparison of stresses at various slab locations predicted by uniform load method and initial temperature method. (a) Longitudinal edge. (b) Transverse edge. (c) Slab center. (d) Corresponding error distribution.
3.2. Finite Element Model Validation
The developed FE model was employed to investigate both the tension-independent effect (influence of individual tensioning operations) and the tension-dependent effect (cumulative influence of the sequential tensioning process) in CTCP.
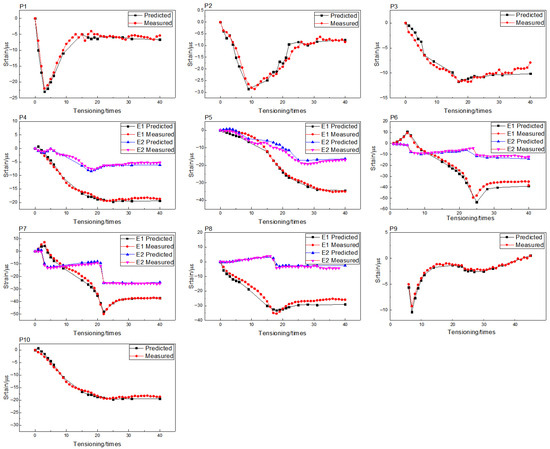
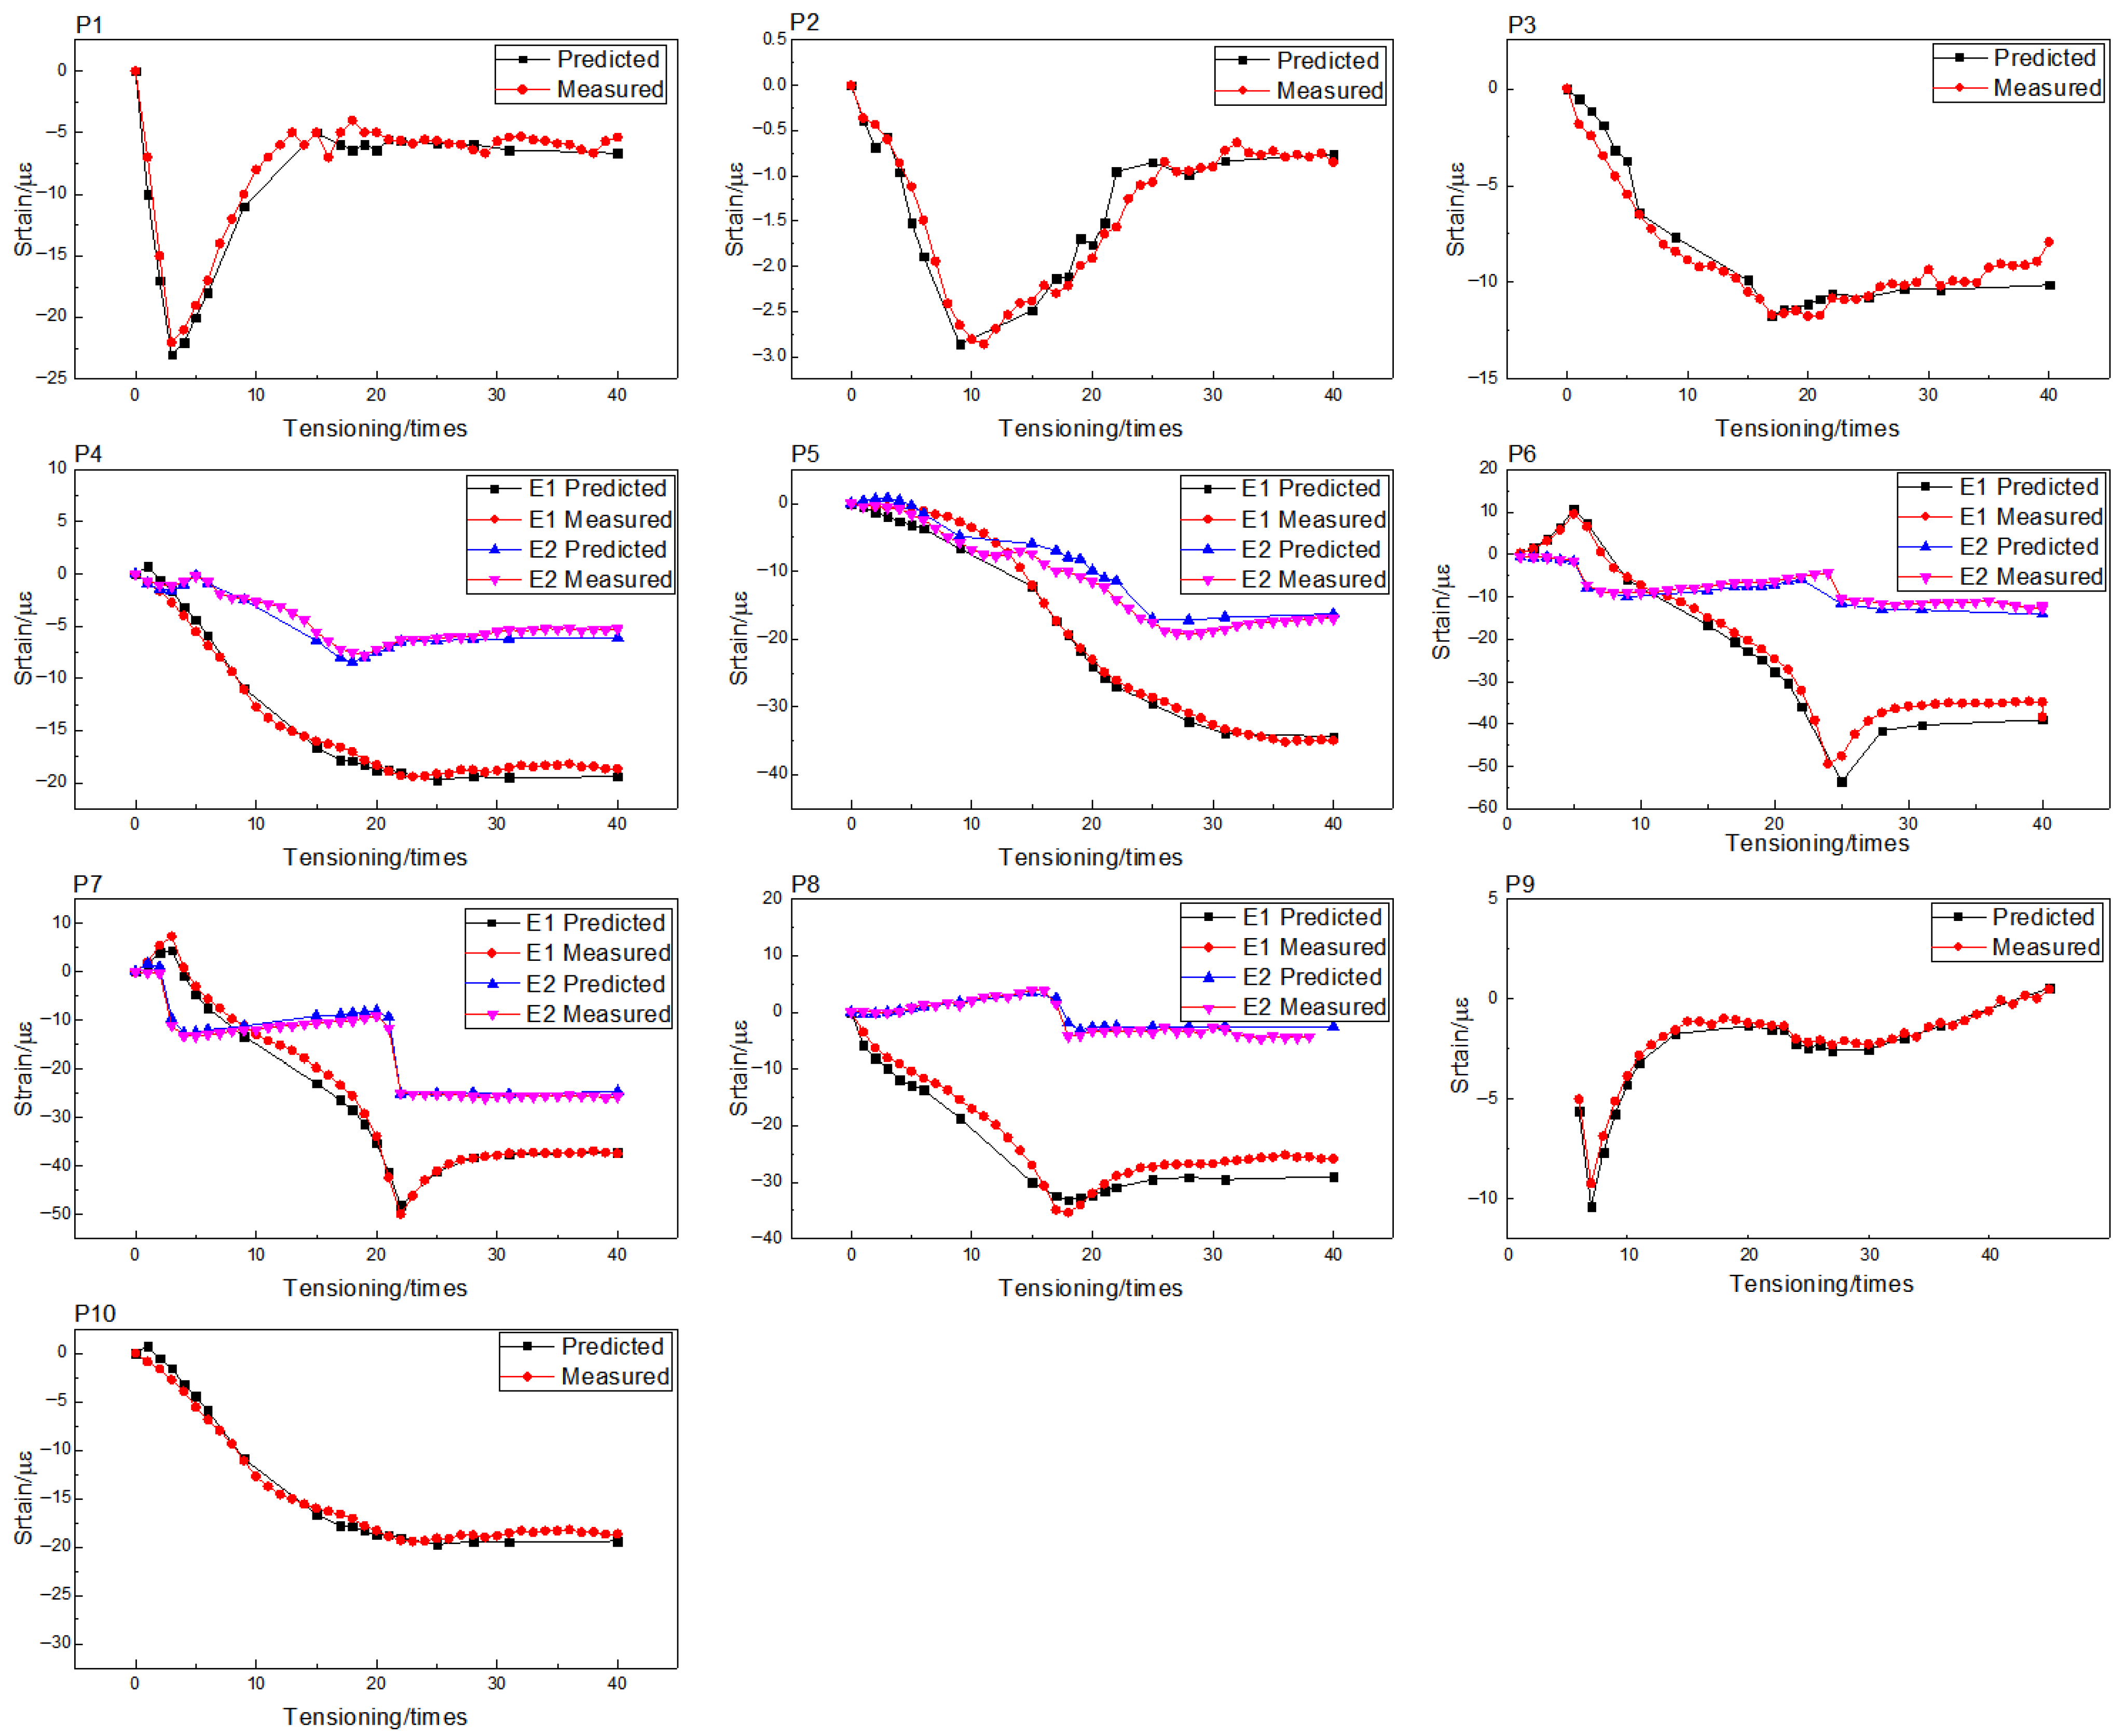
Accordingly, model calibration focused on validating the predicted tension-induced strain responses against field measurements. Figure 10 compares the strain responses obtained from all strain gauges with the corresponding FE predictions, and Table 2 summarizes the average errors for E1 and E2. The average errors for E1 range from 7.9% to 12.3%, with the maximum (12.3%) at P7; for E2, errors range from 2.3% to 15.5%, with the maximum (15.5%) at P4. The larger errors at P4 and P7 are attributed to their locations at the transition zone (P4) and edge effect zone (P7), where stress responses are most complex. Other points exhibit smaller errors due to simpler stress states. Overall, the average errors for E1 and E2 are approximately 12.4% and 8.2%, respectively. The FE model was successfully validated against the field test results and deemed reliable for subsequent analysis.
Figure 10.
Validation of finite element model.
Table 2.
Summary of the average errors for E1 and E2.
3.3. Analysis of Finite Element Method
3.3.1. Tension-Independent Effect
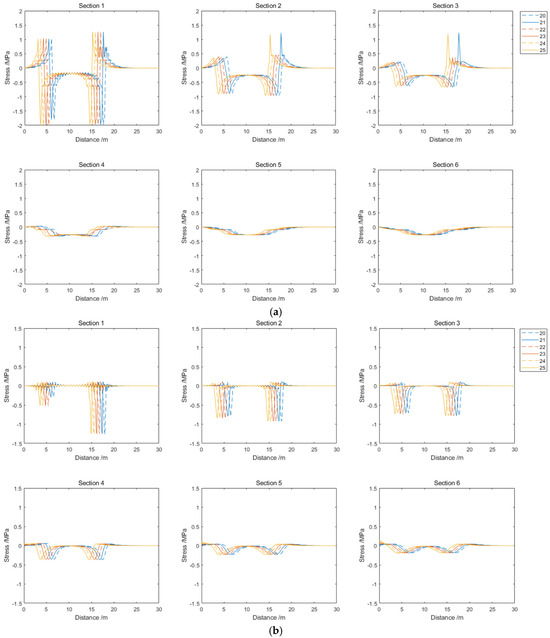
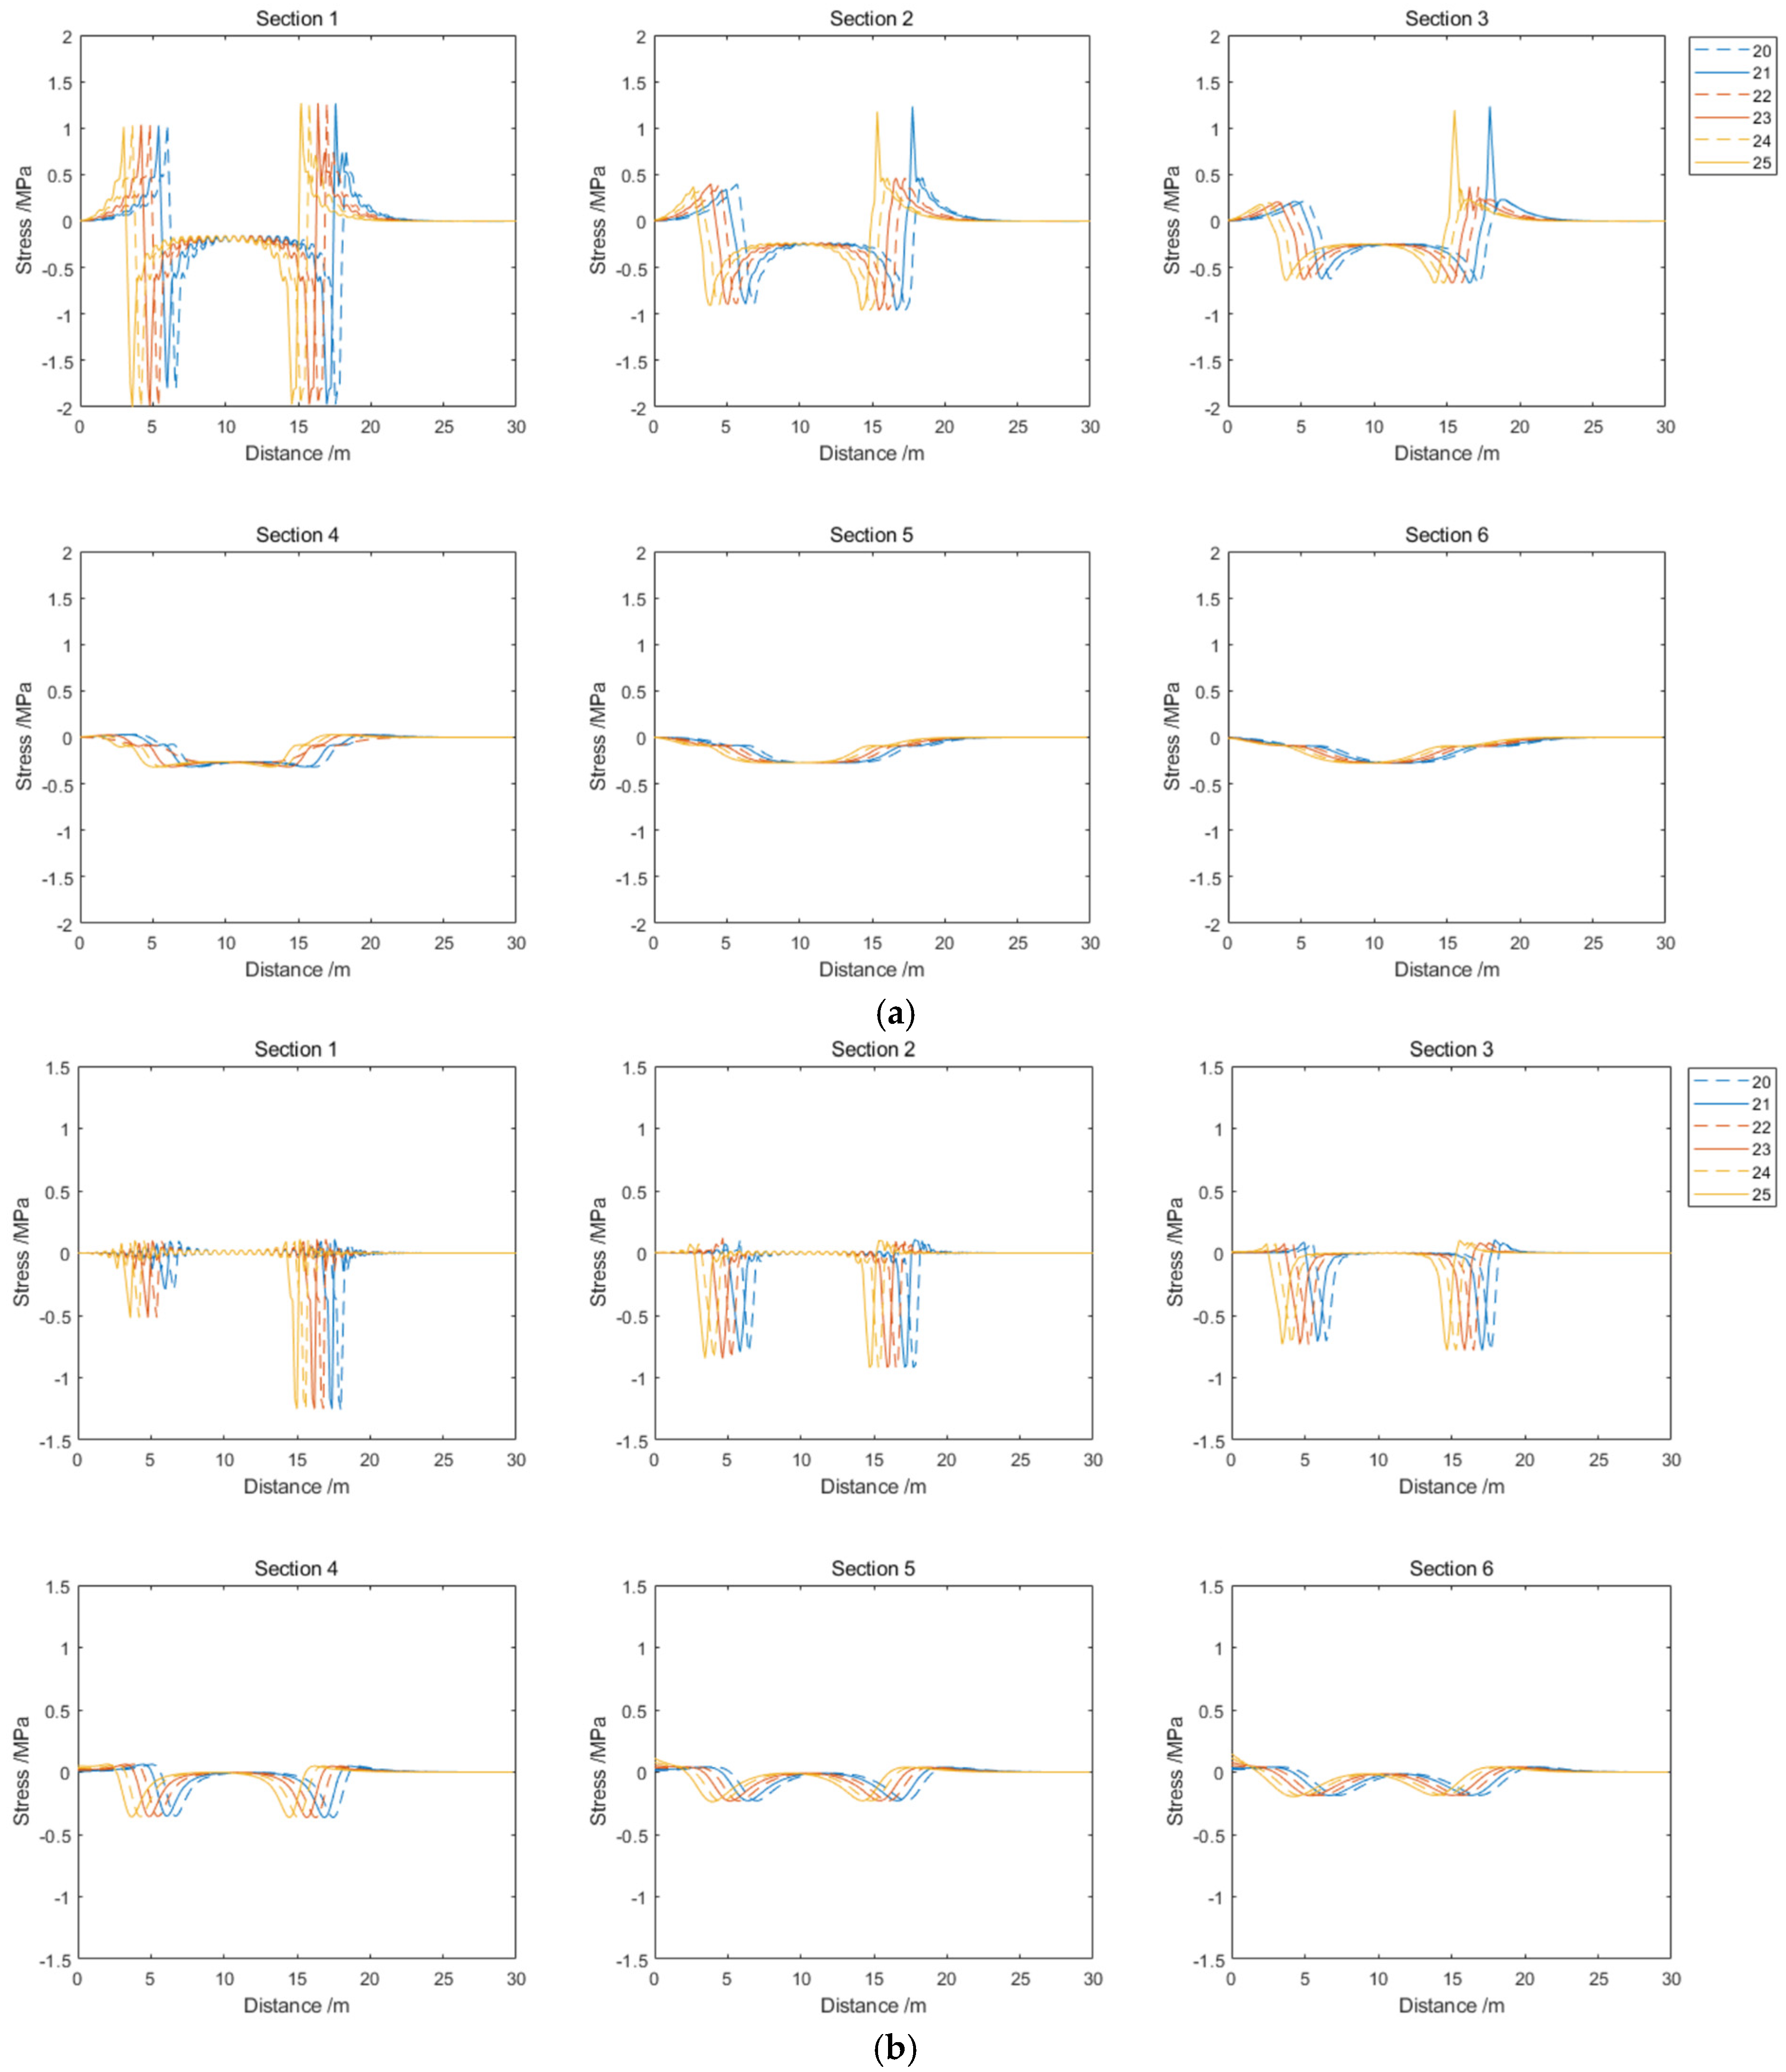
Figure 11 presents the development of tension-induced stress when the 20th–25th pairs of prestressed tendons were tensioned independently, with the legend indicating the tensioning sequence. Figure 11a,b shows the longitudinal stress (S1) and transverse stress (S2) distributions across six sections at distances of 0 m, 0.2 m, 0.4 m, 1 m, 2 m, and 3.5 m from the longitudinal joint, respectively. Due to the symmetrical tensioning of each tendon pair, the resulting tension-induced stress distribution in the slab is symmetric. As shown in Figure 11a, the development of S1 remains nearly identical for different tensioning pairs, with the stress curves exhibiting a translational shift. However, notable differences exist across sections. Sections closer to the anchorage zone (e.g., Sections 1 and 2) experience greater stress fluctuations, whereas sections farther away (e.g., Sections 3–6) exhibit more stable stress responses. For Sections 1–4, S1 initially exhibits tensile stress, with the maximum value occurring at the corner of the nearest anchorage zone. Subsequently, S1 transitions to compressive stress, reaches its peak, and finally rebounds to approximately 0~88% of the maximum compressive stress. For Sections 5 and 6, no tensile stress is observed near the anchorage zone. This is attributed to stress concentration during tensioning, where the anchorage zone experiences high tensile stress that gradually dissipates as stress transfers toward the slab center, eventually diminishing to zero. Additionally, Sections 6 and 7 exhibit no compressive rebound but rather a plateau, indicating that S1 in the central region of CTCP is predominantly compressive. Figure 11b reveals that S2 in the anchorage zone fluctuates more severely than S1. For Sections 3–6, the development trend of S2 resembles that of S1, but with a more significant rebound—nearly returning to zero. This indicates that S2 is more sensitive to the distance from the anchorage zone.
Figure 11.
Stress response to independent tensioning. (a) S1. (b) S2.
3.3.2. Tension-Dependent Effect
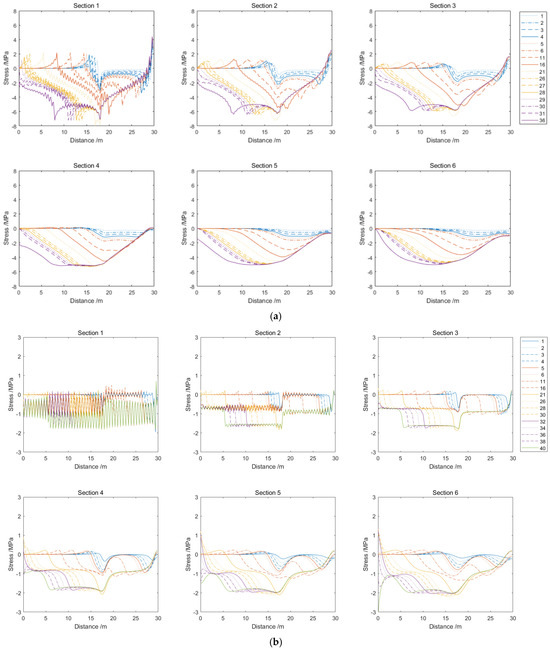
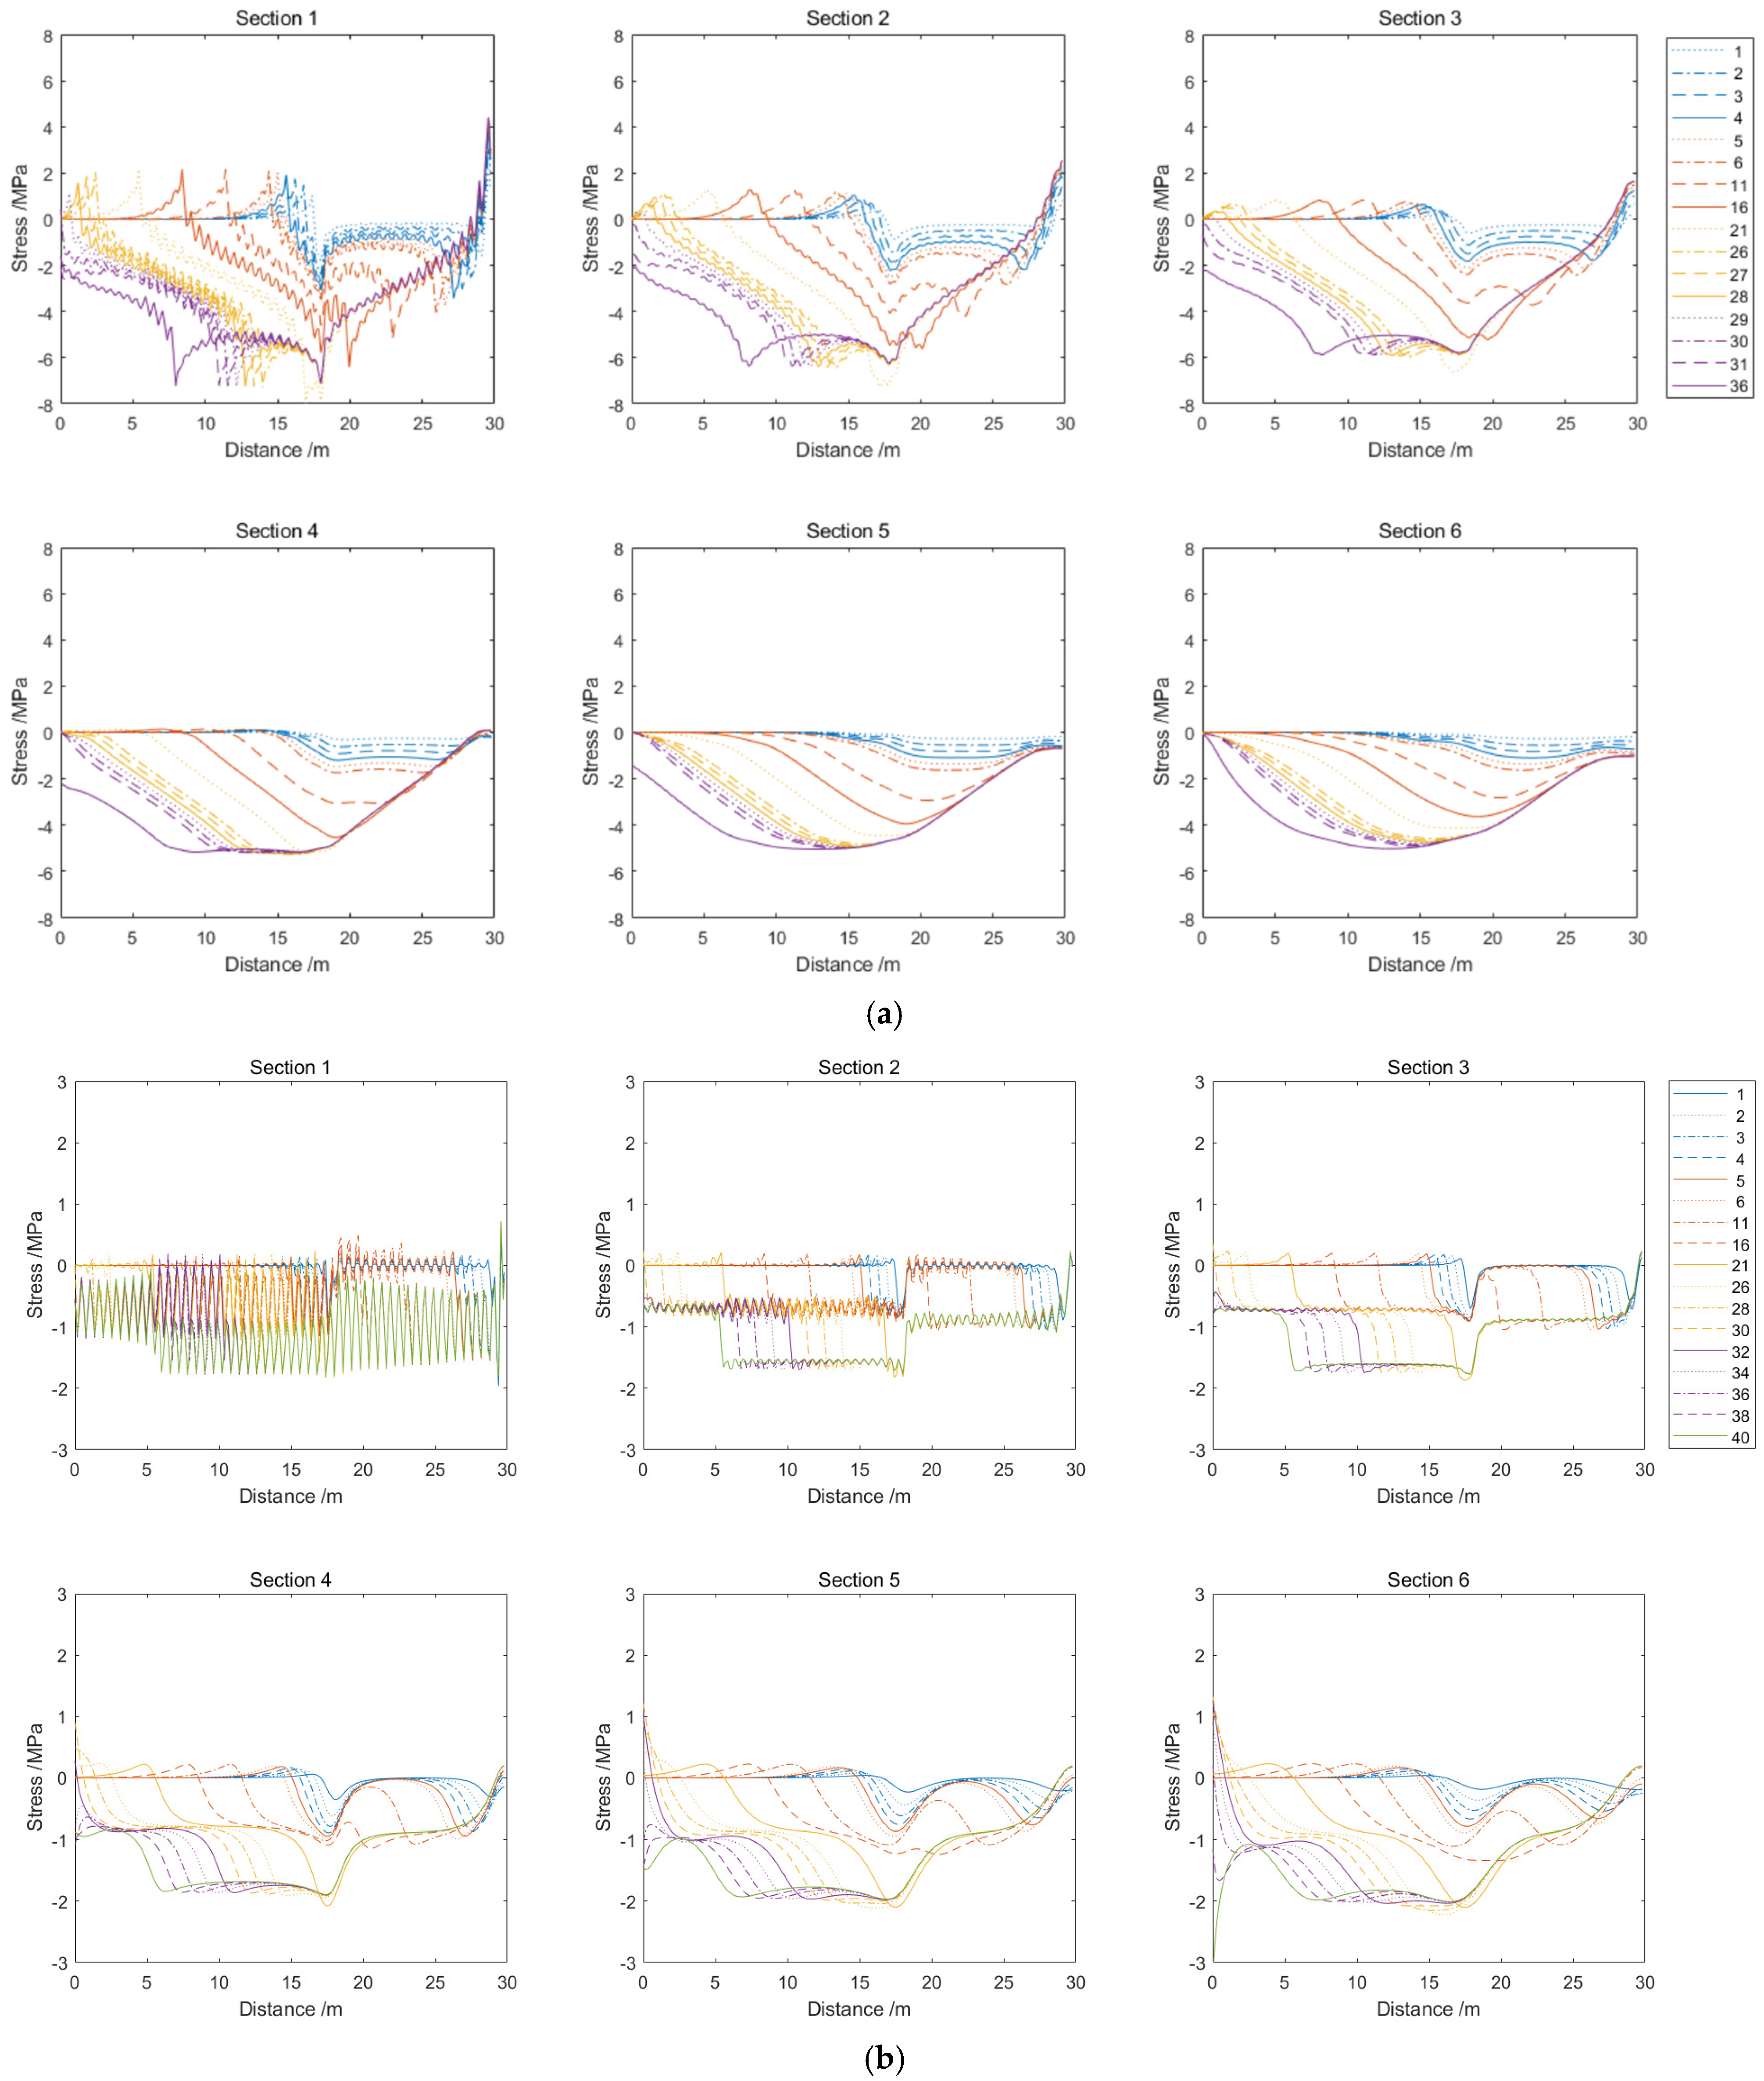
Figure 12 presents the tension-induced stress responses throughout the entire tensioning process, which consisted of 40 tensioning operations (excluding the three transverse tensioning conducted in the field test). The legend denotes the tensioning sequence. As shown in Figure 12a, the maximum tensile longitudinal stress generated at the corner during a given tensioning can be completely offset by the compressive stress induced by the subsequent tensioning. The peak tensile stress gradually increases during the first five tensioning operations, after which it stabilizes with minimal variation. From the 26th tensioning onward, the maximum tensile stress begins to decrease, and after the 30th tensioning, no tensile stress is observed in the CTCP slab. This indicates that the stress state is influenced primarily by the five adjacent prestressed tendons.
Figure 12.
Stress response to dependent tensioning. (a) S1. (b) S2.
Based on the distinct stress distribution characteristics along the slab, three zones can be identified: Tensile Increase Region (hereinafter referred to as Zone A in Figure 2a), Tensile Stability Region (Zone B), and Tensile Decrease Region (Zone C). In Zone A, tensile stress tends to increase with successive tensioning operations, suggesting that reinforcement should be provided in areas without short prestressed tendons. In Zone B, the tensile stress reaches a relatively stable plateau, indicating that the cumulative effect of sequential tensioning becomes balanced in this region. In Zone C, the tensile stress gradually diminishes and eventually disappears as tensioning progresses, reflecting the decrease in prestress influence toward the slab interior. These regional characteristics provide valuable insights for optimizing tendon layout and reinforcement design to manage tension-induced stress in CTCP.
In summary, for Zone A, it is recommended to provide supplementary reinforcement using high-strength steel bars. The reinforcement should be placed with particular attention to areas where no short prestressed tendons are present. To effectively control the accumulated tensile stress, a closer spacing may be adopted, and the reinforcement should be extended adequately into the adjacent Zone B to ensure proper anchorage and load transfer. For Zone B, where tensile stress remains stable, conventional reinforcement detailing is generally sufficient without special measures. For Zone C, where tensile stress naturally diminishes, minimal or no additional reinforcement is required beyond standard requirements. In both zones, reinforcement design should follow routine practice, as the cumulative tensioning effects do not impose significant additional demand. Summary of zone characteristics and reinforcement recommendations for CTCP is as shown in Table 3.
Table 3.
Summary of zone characteristics and reinforcement recommendations for CTCP.
4. Conclusions
This study investigates the tension-induced stress on Cross-tensioned Concrete Pavement (CTCP) through integrated full-scale field testing and finite element analysis. Field testing was conducted to capture the stress distribution in CTCP throughout the complete tensioning process. Subsequently, an FE model was developed and validated against field measurements, enabling systematic investigation of both tension-independent and tension-dependent effects on tension-induced stress. Based on the experimental and numerical results, the following conclusions can be drawn:
(1) The developed FE model demonstrates good agreement with field measurements of tension-induced strain, with average errors of 12.4% and 8.2% for longitudinal and transverse strains, respectively. The validated model provides a reliable tool for analyzing tension-induced stress responses throughout the entire tensioning process.
(2) The concept of a “prestress effect zone” is proposed to characterize the influence region of individual tendon tensioning in CTCP. The extent of this zone is expected to be influenced by the characteristics of the applied prestress force, including tendon angle, spacing, and magnitude.
(3) During the tensioning process, the maximum tension-induced tensile stress consistently occurs at the corner of the nearest anchorage zone. Notably, this tensile stress can be completely offset by the compressive stress generated from subsequent tensioning operations, demonstrating a self-mitigating mechanism inherent to the sequential tensioning procedure.
(4) Based on the distinct stress distribution characteristics along the slab, three zones can be identified: Zone A (tensile increase region), where tensile stress accumulates with successive tensioning; Zone B (tensile stability region), where stress reaches a balanced plateau; and Zone C (tensile decrease region), where tensile stress gradually diminishes. Reinforcement is recommended in Zone A to control the accumulated tensile stress.
(5) From a practical engineering perspective, the proposed zone concepts offer direct guidance to mitigate potential tensile overstress. Tendons passing through Zone A should be tensioned earlier in the sequence to reduce stress accumulation, while standard schedules suffice for Zones B and C. The anchorage zone corner, where peak tensile stress occurs, should be reinforced to accommodate temporary tensile peaks, recognizing that subsequent tensioning will offset these stresses. Additionally, engineers are advised to closely monitor Zone A during construction and consider supplementary reinforcement or adjusted tensioning order to ensure tensile stresses remain below the concrete’s early-age tensile strength.
Future parametric studies will systematically investigate the effects of tendon angle, spacing, and prestress magnitude on the size and shape of the prestress effect zone. Additionally, critical stress analysis will be conducted to determine the maximum tension-induced tensile stresses under various tensioning sequences, providing further guidance for anchorage zone design and construction optimization.
Author Contributions
Conceptualization, H.C. and M.Z.; Methodology, H.C., M.Z. and Y.C.; Software, M.Z., Y.C., Y.Z. and C.J.; Validation, H.C., Y.C. and C.J.; Formal Analysis, H.C., Y.Z. and Y.C.; Investigation, H.C., M.Z. and Y.Z.; Resources, Y.C., C.J. and J.C.; Writing—Original Draft Preparation, H.C. and Y.C.; Writing—Review and Editing, H.C., M.Z., Y.C., Y.Z., C.J. and J.C.; Supervision, M.Z. and Y.C.; Funding Acquisition, H.C. and J.C. All authors have read and agreed to the published version of the manuscript.
Funding
This study was funded by the Shanghai Pujiang Program under grant 25PJA049, the Key Laboratory of Infrastructure Durability and Operation Safety in Airfield of CAAC under grant MK202502, and the Shanghai Sailing Program under grant 23YF1437700.
Data Availability Statement
The data presented in this study are available on request from the corresponding author.
Conflicts of Interest
Authors Yang Cai and Chen Jin were employed by the company Shanghai Urban Construction Design and Research Institute (Group) Co., Ltd. Author Juewei Cai was employed by the company Shanghai Research Institute of Building Science Co., Ltd. The remaining authors declare that the research was conducted in the absence of any commercial or financial relationships that could be construed as potential conflicts of interest.
References
- Meng, Q.; Zhong, K.; Sun, M. Dynamic Response Analysis of Airport Pavement under Impact Loading. Appl. Sci. 2023, 13, 5723. [Google Scholar] [CrossRef] [Scilit]
- Hossain, M.; Hancock, J.; Wu, Z.J. Cross Tensioned Concrete Pavement. J. Transp. Eng. 2003, 129, 427–433. [Google Scholar] [CrossRef] [Scilit]
- Akpinar, M.V.; Hancock, J.; Hossain, M. Cross Tensioned Concrete Pavement; Kansas Department of Transportation: Topeka, KS, USA, 2003.
- Akpinar, M.; Hancock, J.; Hossain, M.; Gisi, A.J. The Use of Concrete in Developing Long-Lasting Pavement Solutions for the 21st Century. In Proceedings of the Seventh International Conference on Concrete Pavements, Lake Buena Vista, FL, USA, 9–13 September 2001. [Google Scholar]
- Hancock, J.; Hossain, M. Cross Tensioned Concrete Pavement: An Alternative Modern PCCP Design. In Proceedings of the Mid-Continent Transportation Symposium, Ames, Iowa, 15–16 May 2000. [Google Scholar]
- Chen, H.; Ling, J.M.; Wu, D.F.; Zeng, M.Y.; Zhao, H.D. Monitoring the Prestress Force in Cross-Tensioned Concrete Pavement by Using Vibration Analysis. In Proceedings of the Transportation Research Board 99th Annual Meeting, Washington, DC, USA, 12–16 January 2020. [Google Scholar]
- Zeng, M.Y.; Chen, H.; Ling, J.M.; Zhao, H.D.; Wu, D.F. Monitoring of Prestressing Forces in Cross-Tensioned Concrete Pavements during Construction and Maintenance Based on Distributed Optical Fiber Sensing. Autom. Constr. 2022, 142, 104526. [Google Scholar] [CrossRef] [Scilit]
- Cheng, K.; Zeng, M.Y.; Chen, H.; Ling, J.M. Prestress Force Monitoring in Cross-Tensioned Concrete Pavement Using Distributed Optical Sensing Technology. In Proceedings of the Transportation Research Board 100th Annual Meeting, Washington, DC, USA, 29 January 2021. [Google Scholar]
- Chen, H.; Ling, J.M.; Zeng, M.Y.; Zhao, H.D.; Cheng, K. Mechanical Response of Cross-Tensioned Concrete Pavement under Tensioning Process. In Proceedings of the Transportation Research Board 101st Annual Meeting, Washington, DC, USA, 9–13 January 2022. [Google Scholar]
- Chen, H.; Ling, J.M.; Zhao, H.D.; Zeng, M.Y.; Wu, D.F. Vibration Characteristics of Cross-tensioned Concrete Pavement. China J. Highway Transp. 2020, 33, 32–41. [Google Scholar]
- Zhao, H.; Zeng, M.; Chen, H.; Ling, J.; Wu, D. Investigating the Effect of Prestress Force on Cross-Tensioned Concrete Pavement Vibration. Transp. Res. Rec. 2020, 2674, 875–886. [Google Scholar] [CrossRef] [Scilit]
- Chen, H.; Yang, J.; Zeng, M.; Jiang, Y.; Xu, J. Prefabricated Integrated Anchorage Device and Continuous Tensioning Construction for Heterotrophic Prestressed Concrete Pavement. Appl. Sci. 2026, 16, 1909. [Google Scholar] [CrossRef] [Scilit]
- Li, N. Study on Cross-Tensioned Prestressed Concrete Pavement. Master’s Thesis, Chang’an University, Xi’an, China, 2011. [Google Scholar]
- Li, N.; Zhang, D.; Xu, X.; Han, W. Numerical simulation on cross tensioned prestressed concrete pavement. In Proceedings of the ICTE 2013: Safety, Speediness, Intelligence, Low-Carbon, Innovation, Chengdu, China, 19–20 October 2013. [Google Scholar]
- Guo, C.; Zhang, M.; Wang, Z.; Wang, X. Research on Key Technologies of Cross-Tensioned Concrete Pavement. In International Society for Concrete Pavements (ISCP); Oakland, MD, USA, 2017. [Google Scholar]
- Meng, C.; Cai, L.; Wang, G.; Shi, X.; Ling, J. An Approximate Model to Predict Stress and Displacement of Cross-Tensioned Prestressed Concrete Pavement Under Temperature Loading. ACI Mater. J. 2020, 117, 193–207. [Google Scholar] [CrossRef] [Scilit]
- Han, S.; Chen, D.; Ling, C.; Zhang, D. Study on sliding layer of cross-tensioned concrete pavement. Road Mater. Pavement Des. 2015, 16, 518–535. [Google Scholar] [CrossRef] [Scilit]
- Yu, K.; Wang, Y.; Yu, J.; Xu, S. A strain-hardening cementitious composites with the tensile capacity up to 8%. Constr. Build. Mater. 2017, 137, 410–419. [Google Scholar] [CrossRef] [Scilit]
- Kuz’min, M.P.; Larionov, L.M.; Kondratiev, V.V.; Kuz’mina, M.Y.; Grigoriev, V.G.; Kuz’mina, A.S. Use of the burnt rock of coal deposits slag heaps in the concrete products manufacturing. Constr. Build. Mater. 2018, 179, 117–124. [Google Scholar] [CrossRef] [Scilit]
- Kuz’min, M.P.; Larionov, L.M.; Kuz’mina MYu Kuz’mina, A.S.; Ran, J.Q.; Burdonov, A.E.; Zenkov, E.V. Production of portland cement using fluorine gypsum—Hydrofluoric acid waste. Mag. Civ. Eng. 2022, 111, 11113. [Google Scholar]
- DB61/T 979-2015; Technical Specifications for Cross-Tensioned Prestressed Concrete Pavement. Shaanxi Provincial Department of Transportation: Xi’an, China, 2015.
- De Silva, S.; Muthukrishna, S.; Siriwardana, S. Estimating early-age in situ strength development of concrete slabs. Constr. Build. Mater. 2011, 25, 3762–3770. [Google Scholar]
- Liao, G.; Huang, X. Application of ABAQUS Finite Element Software in Road Engineering; Southeast University Press: Nanjing, China, 2008. [Google Scholar]
- Pang, M.; Liu, X.; Dong, Y.; Lou, T. Numerical assessment on bonded and unbonded prestressed concrete beams. Buildings 2022, 12, 1658. [Google Scholar] [CrossRef] [Scilit]
- Fang, H.; Shi, H.R.; Li, X.H.; Wang, C.-L.; Zeng, B. Experimental evaluation of bonded/unbonded prestressed precast concrete joints under repetitive loading scenarios: Seismic performance and retrofit intervention. Eng. Struct. 2024, 321, 118980. [Google Scholar] [CrossRef] [Scilit]
- Bian, W.H.; Yang, J.; Wang, K.X.; Zhan, J.-W.; Fang, Y.; Dong, M.-Q.; Li, Z. Analysis of non-uniform force distribution characteristics among tendons of prestressed anchor cable and experimental study on equal stress tensioning. Eng. Struct. 2025, 329, 119869. [Google Scholar] [CrossRef] [Scilit]
- Lou, T.J. Finite Element Modeling and Performance Analysis of Unbonded Prestressed Beams. Master’s Thesis, Zhejiang University, Hangzhou, China, 2005. [Google Scholar]
- Abdelaziz, M.M.; El-Ghazaly, H.A.; Gomaa, M.S. Numerical simulation of unbonded prestressed concrete beams using improved applied element method. Eng. Struct. 2021, 245, 112962. [Google Scholar] [CrossRef] [Scilit]

Disclaimer/Publisher’s Note: The statements, opinions and data contained in all publications are solely those of the individual author(s) and contributor(s) and not of MDPI and/or the editor(s). MDPI and/or the editor(s) disclaim responsibility for any injury to people or property resulting from any ideas, methods, instructions or products referred to in the content. |
© 2026 by the authors. Licensee MDPI, Basel, Switzerland. This article is an open access article distributed under the terms and conditions of the Creative Commons Attribution (CC BY) license.