Article

Shear Creep Failure Characteristics of Cement-Grouted Sandstone Structural Planes

1
Department of Geotechnical Engineering, College of Civil Engineering, Tongji University, Shanghai 200092, China
2
Key Laboratory of Geotechnical and Underground Engineering of Ministry of Education, Tongji University, Shanghai 200092, China
3
School of Civil Engineering, Central South University, Changsha 410075, China
4
Ocean College, Zhejiang University, Zhoushan 316021, China
*
Author to whom correspondence should be addressed.
Buildings 2026, 16(8), 1585; https://doi.org/10.3390/buildings16081585

Submission received: 11 March 2026 / Revised: 12 April 2026 / Accepted: 13 April 2026 / Published: 17 April 2026

Abstract

The rheological behavior of rock masses governs long-term stability, yet the time-dependent properties of grouted structural planes remain insufficiently quantified. Graded shear creep tests were conducted on artificially split sandstone structural planes with controlled grout thicknesses, complemented by scanning electron microscopy (SEM), to clarify creep evolution and long-term shear strength. The results show that the total shear creep displacement of grouted specimens exhibits limited sensitivity to grout thickness, while the ratio of long-term to theoretical shear strength increases by approximately 10% at a grout thickness of 2 mm; this strengthening effect, however, diminishes at greater thicknesses. Moreover, the creep rate evolution of grouted specimens differs fundamentally from that of ungrouted specimens, with about 60% of grouted samples exhibiting an accelerated creep stage characterized by a U-shaped rate curve. The failure mode shifts from asperity-controlled slip in ungrouted structural planes to damage concentrated at the grout–rock interface in grouted specimens. SEM observations further reveal that micro-defects at this interface initiate and propagate cracks, ultimately governing the macroscopic creep failure process. Overall, this study establishes an isochronous curve-based method for determining long-term strength and demonstrates that interface micromechanics critically control the long-term performance of grouted rock masses. These findings provide practical guidance for grouting reinforcement in underground engineering.

1. Introduction

The rheological behavior of rock masses is among their most significant mechanical properties. It directly influences the long-term stability and safety of underground engineering structures, such as rock tunnels [1,2,3]. Owing to the inherent heterogeneity and anisotropy of rock, the stress–strain state evolves with time under sustained loading, leading to pronounced time-dependent deformation and strength degradation [4,5,6]. Early studies can be traced back to Griggs [7], who observed creep in limestone, shale, mica, and sandstone under stress levels ranging from 12.5% to 80% of peak strength. Langer [8] subsequently synthesized the methodologies and engineering significance of rock rheology, emphasizing the importance of creep research in rock mechanics. Later investigations demonstrated that, in jointed rock masses, structural planes rather than intact rock govern long-term deformation [9,10,11]. For example, Tu [12] and Jiang et al. [13] confirmed that structural planes enter an accelerated creep stage once the shear stress ratio exceeds a critical threshold. Wang [14] further showed that joint roughness and morphology strongly influence creep rate evolution and brittle shear failure. More recent studies have examined creep in concealed or non-persistent planes [15], providing valuable insights into landslide and slope instability. Zhu et al. [16] further demonstrated that the shear response and frictional sliding behavior of rough joint surfaces are strongly affected by dynamic normal displacement conditions, highlighting the continued importance of joint morphology and loading path in time-dependent interface behavior.
With the development of grouting technology, grouting reinforcement of weak rock masses has been widely applied in hydraulic, transportation, and underground engineering [17,18,19,20]. Grouting can significantly enhance the strength and stiffness of fractured rock masses; however, under long-term loading, progressive damage of both the grout body and the grout–rock interface may induce stress redistribution and gradual weakening [21,22,23,24,25]. Despite this practical importance, systematic investigations into the rheological behavior of grouted structural planes remain limited. For instance, Li et al. [26] carried out confined shear creep tests on grouted marble specimens and identified the three classical creep stages, although their results were constrained by the lack of controlled grout-filling ratios. Sun et al. [27] made preliminary attempts to investigate the long-term strength of grouted joints, but without detailed analysis of interface micromechanics. More recently, Fu et al. [28] investigated the shear mechanism at the grout–rock interface through physical testing and PFC3D simulation, showing that interface damage evolution plays a key role in debonding and shear resistance. Rong et al. [29] further reported that stress level and initial hydration damage jointly govern the shear response and failure evolution of rock–grout composite structures. Numerical studies have also indicated that evolving interface properties, such as variable shear stiffness, may significantly affect the creep deformation and long-term stability of jointed rock masses [30]. Overall, compared with intact or ungrouted structural planes [31,32,33,34,35], the time-dependent properties of grouted planes have received far less attention.
Recent studies have increasingly addressed the time-dependent behavior of rock and interface systems under sustained loading. For example, Yao et al. [36] conducted shear creep tests on clay–concrete interfaces and demonstrated that interface roughness and shear-stress path significantly affect creep displacement and stability time. Tarifard et al. [37] reviewed recent creep constitutive models for rocks and highlighted the continuing challenge of describing accelerated creep and long-term instability in predictive frameworks. In the field of rock joints, Zhu et al. [3] proposed a creep constitutive model for bolted rock joints and showed that reinforcement modifies the transition characteristics from stable to accelerated creep. More recently, Dong et al. [38] investigated the influence of grout thickness on slip behaviour of joint surfaces under triaxial conditions, revealing that thickness directly affects the tendency for shear creep instability, although long-term creep data were not provided. Nevertheless, two major knowledge gaps remain for grouted structural planes: (1) most existing studies focus on short-term strength or deformation responses and fail to capture the full creep life cycle, particularly the steady and accelerated stages under sustained shear–normal loading; and (2) although grout or fill has been shown to affect joint behavior, few studies have systematically controlled grout thickness, joint morphology, and interface quality, or linked the micro-damage evolution of the grout–rock interface to macroscopic creep responses.
Against this background, the present study considers cement-grouted sandstone structural planes as the target material system in an engineering-oriented context. By controlling grout thickness and applying sustained shear and normal loading, this work addresses a key gap in the long-term mechanical behavior of grouted rock masses and provides useful implications for reinforcement design and material selection in underground engineering. Artificially split sandstone planes were adopted to reduce the randomness associated with natural discontinuities, and grout thickness was precisely controlled to evaluate its influence on creep evolution. Long-term strength was assessed using both the transition-creep method and the isochronous curve method, while SEM analysis was employed to reveal the micromechanisms at the grout–rock interface underlying macroscopic creep deformation and failure. The results contribute to a better understanding of the time-dependent deformation, strength evolution, and failure mechanisms of grouted structural planes, thereby supporting performance-based grouting design in underground engineering.

2. Tests and Methods

2.1. Shear Strength Model

The shear strength of rock mass structural planes plays a crucial role in maintaining overall stability [39,40,41]. Since grouting substantially modifies their contact conditions and mechanical response, it is necessary to distinguish between ungrouted and grouted cases when developing shear strength models. This section introduces the respective models for both conditions and analyzes their mechanical characteristics.

2.1.1. Shear Strength Model of Ungrouted Rock Structural Planes

The ungrouted rock structural planes served as the control group in this experiment. Their peak shear strength was estimated with reference to the rock shear strength model proposed by Xia et al. [42], as expressed in Equation (1).
τ p = σ n tan φ b + 4 A 0 θ max C + 1 1 + exp 1 9 A 0 θ max C + 1 σ n σ t
In the formula, A0, θ m a x * , and C are three-dimensional morphological parameters representing the distribution characteristics of the effective shear-resistant inclination angles in the shear direction, where θ m a x * is the maximum effective shear inclination angle (°), A0 is the ratio of effective shear area to total area, and C is the roughness parameter. In addition, τp denotes the shear strength (MPa), σn represents the normal stress (MPa), φb is the internal friction angle (°), and σt corresponds to the shear stress (MPa).
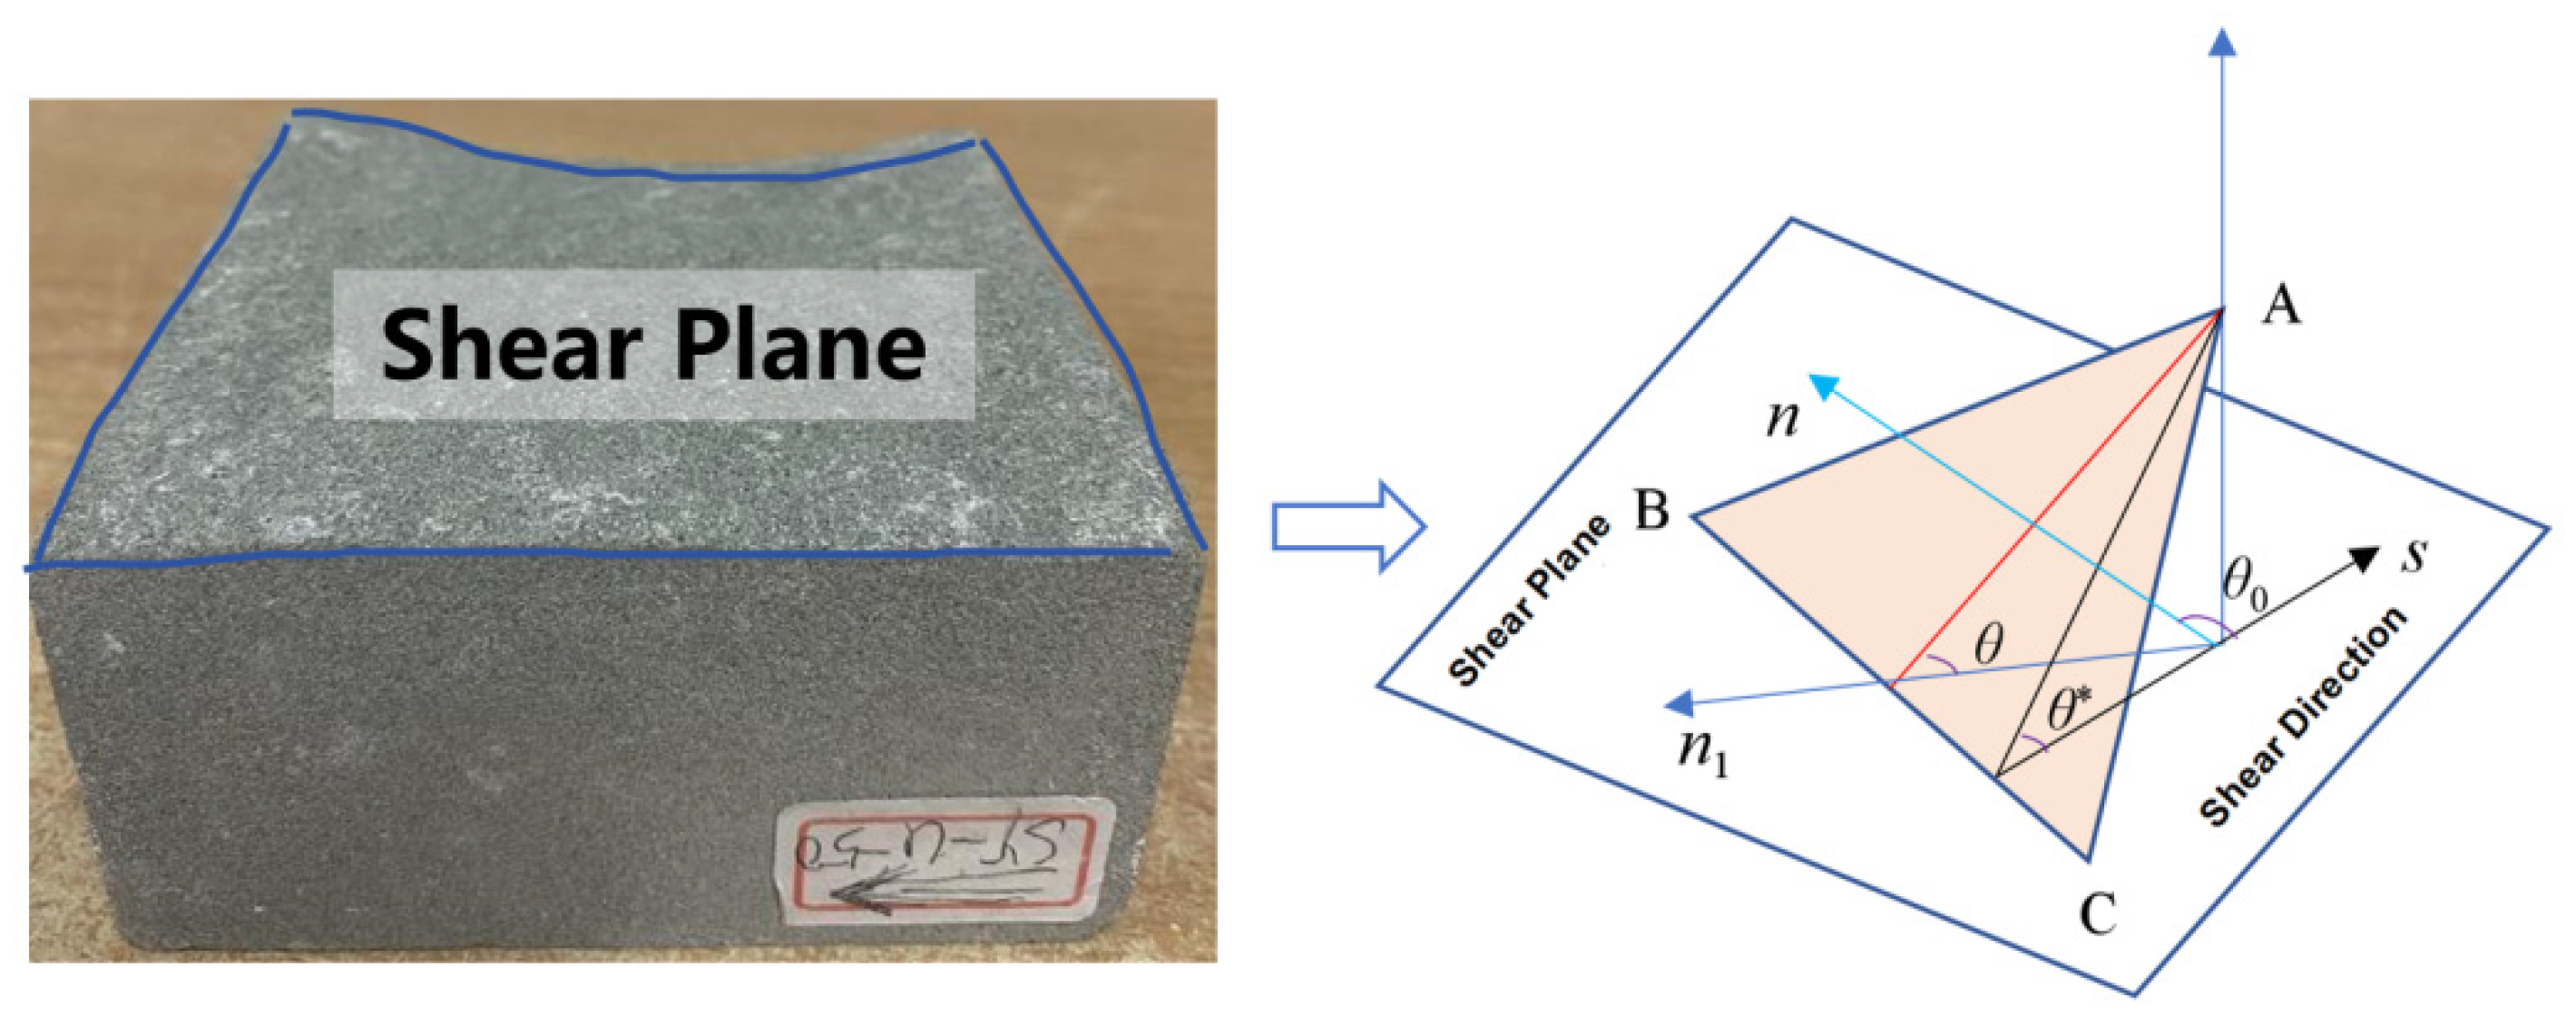
The geometric relationship between the effective shear inclination θ* and the shear direction, based on shear tests of the specimen, is shown in Figure 1.
Based on the shear direction, the relationship between the effective shear inclination θ* and the true inclination θ can be established, leading to the theoretical calculation formula for the effective shear inclination θ* of the structural plane:
θ * = tan 1 ( tan θ × cos θ 0 )
cos θ = n n 0 n n 0
cos θ 0 = s n 1 s n 1
In Figure 1 and Equations (3) and (4), θ represents the true inclination of the triangular element on the structural plane (°); θ0 is the angle between the shear direction of the structural plane element and the inclination direction (°); n0 is the normal vector of the shear plane; s is the vector along the shear direction of the structural plane; n is the outward normal vector of the structural plane element; and n1 is the projection of n along the shear direction.

2.1.2. Shear Strength Model of Grouted Rock Structural Planes

Compared with ungrouted structural planes, grouting substantially modifies the contact conditions [43,44], transforming the interface from a direct rock–rock contact into a composite rock–grout–rock interface. The cement mortar exhibits mechanical properties broadly similar to those of rock, with high compressive strength but low tensile strength, while the cement-rock interface behaves in a manner comparable to natural joint surfaces.
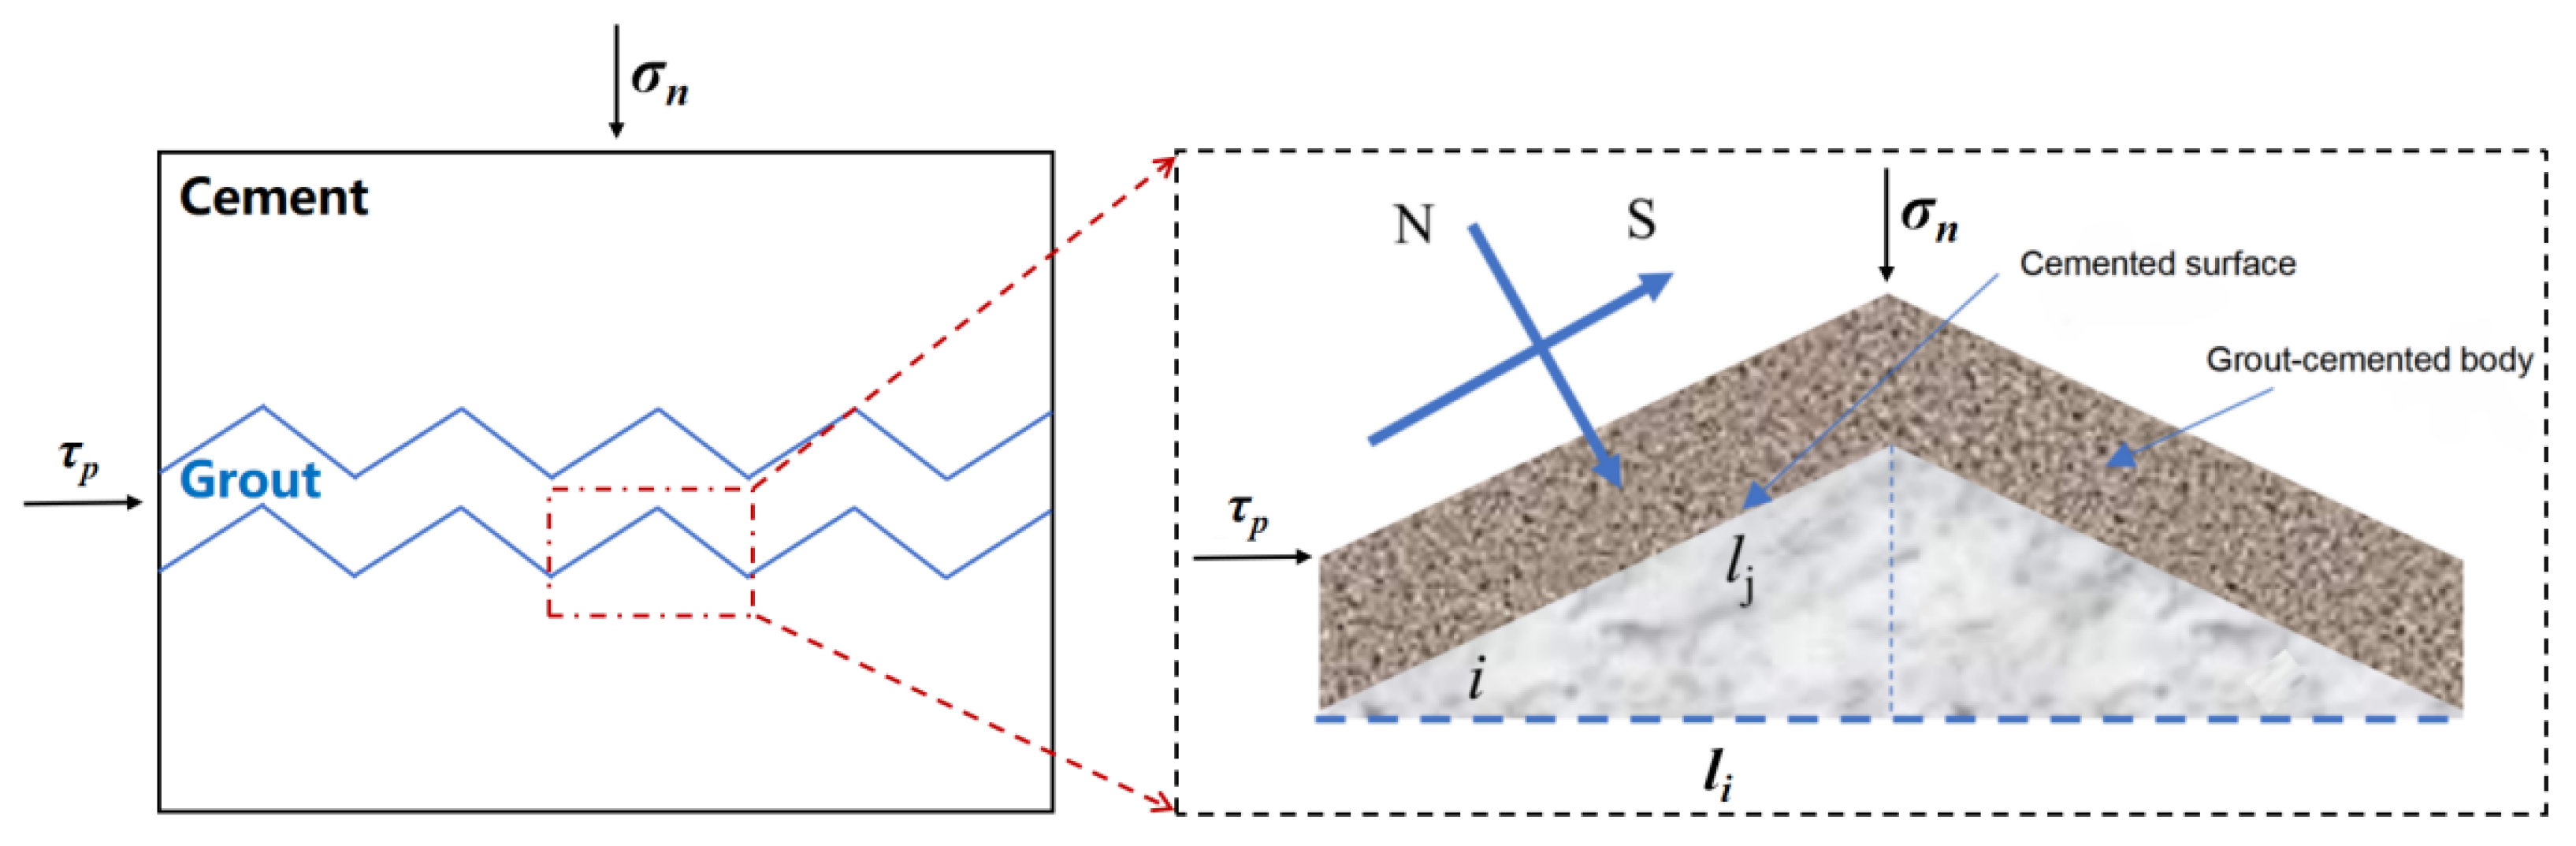
In this study, the structural surface is simplified as a regular serrated profile with negligible mortar thickness. Under these conditions, the grout contributes primarily cohesion, whereas the jointed rock walls possess much higher strength. As a result, before shear failure, the elements near the interface are predominantly subjected to a combined compressive–shear stress state (Figure 2).
In the figure, the cemented surface and grout-cemented body are explicitly indicated. S denotes the shear direction vector of the structural plane, and N denotes the outward normal vector of the structural plane element. The parameters i, li, and lj characterize the local geometry and bonded interface, where i is the dilation angle (°), li is the projected length in the shear direction (mm), and lj is the bonded length in the shear direction (mm). Based on the stress relationships illustrated in Figure 2, the three-dimensional rough structural surface is simplified and analyzed as an equivalent regular serrated structure. Under quasi-static conditions, the static equilibrium equation of the grouted structural surface prior to failure can be expressed as:
N sin i + S cos i = τ p l i
N cos i S sin i = σ n l i
The failure criterion of the cemented mortar body and the jointed rock wall is expressed as:
S = N tan φ 1 + c h l j
In the equation, φ1 denotes the basic internal friction angle between the cemented mortar body and the jointed rock wall (°), and ch is the cohesion along the bonding interface between the mortar and the joint wall (MPa). By combining Equations (5)–(7), the peak shear strength formula of the regular serrated structural surface can be obtained as:
τ p = σ n tan φ 1 + i + c h l j l i cos i sin i tan φ 1
By substituting the maximum dilation angle into the above equation and applying the area equivalence between the projected structural surface and the bonded surface in the shear direction, where li corresponds to the projected area At and lj corresponds to the bonded area Aj, the three-dimensional shear strength equation can be expressed as:
τ p = σ n tan φ 1 + i + c h A j A t cos i sin i tan φ 1
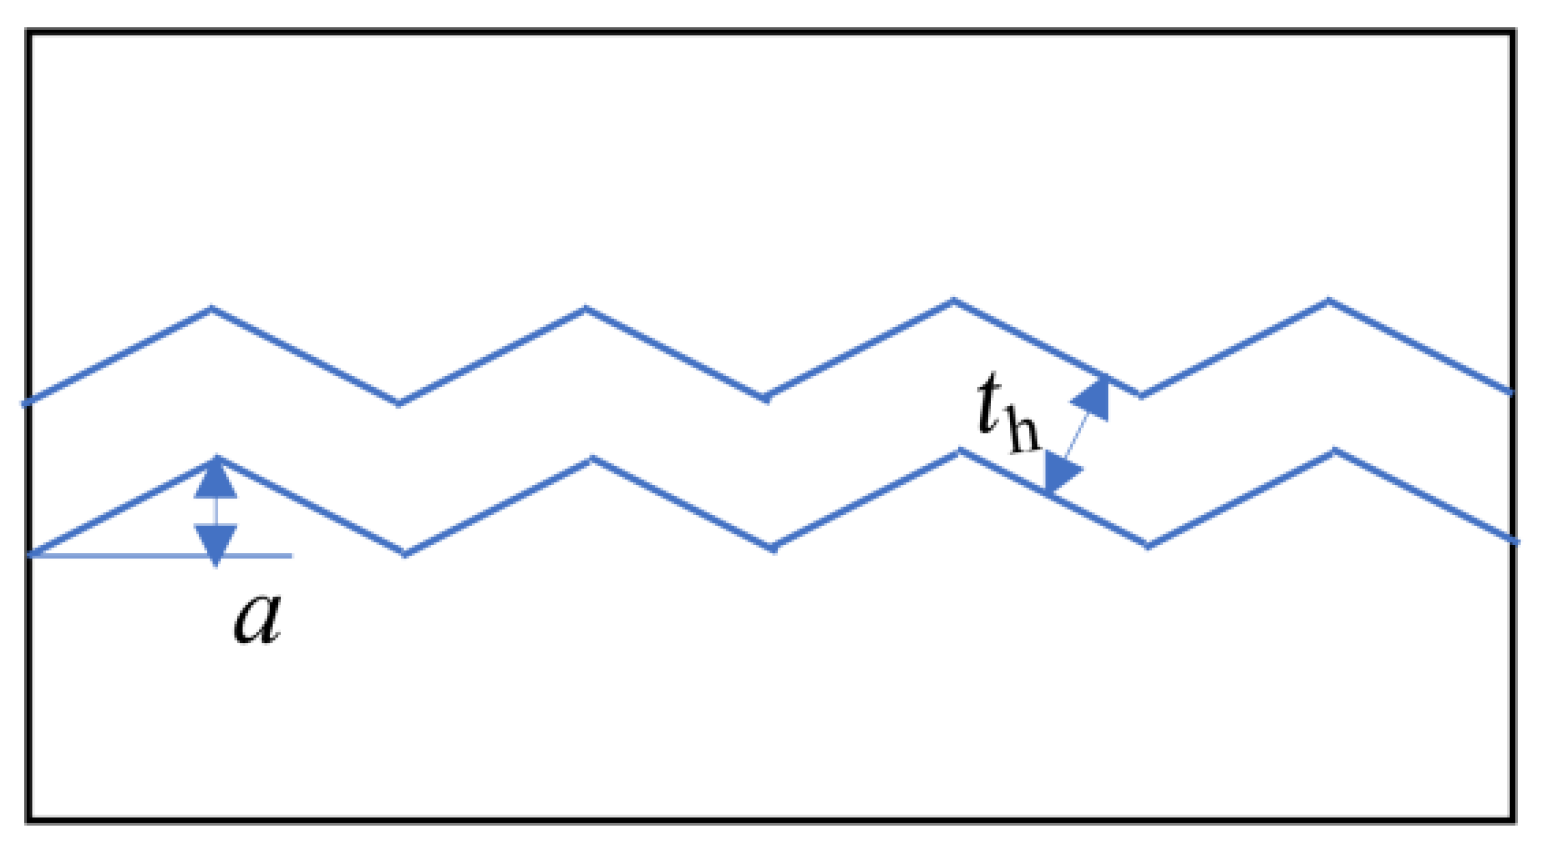
However, for grouted structural planes, the finite grout thickness may alter the filling condition of surface asperities and should therefore be incorporated into the theoretical treatment. To account for the influence of grout thickness on the shear behavior of grouted structural planes, the concept of grouting filling degree is introduced. As shown schematically in Figure 3, the filling degree is defined as:
λ = τ h a
where a is the asperity height of the structural surface (mm) and th is the grout filling thickness (mm). The filling degree thus provides a quantitative measure of the relative relationship between grout thickness and surface relief.
Based on previous studies on grouted jointed rock masses [27], the compressive strength of the grouted structural plane is represented by the composite parameter JICS, which is jointly governed by the rock wall strength, grout strength, and grout filling condition. Considering the effect of filling degree on both the shear angle and the compressive resistance of the grouted interface, the shear strength of a rough grouted structural plane can be expressed as
τ p = σ n tan φ 1 + i p + A j A t cos i p sin i p tan φ 1 c h
With
i p = θ max * 2 A 0 C + 1 0.5 exp σ n J I C S C 0.5
And
J I C S = σ g 0.5 σ r σ g λ λ + 1 p + 0.5
where ip is the peak dilation angle (°), JICS is the composite compressive strength of the grouted structural plane (MPa), σr is the uniaxial compressive strength of the rock (MPa), σg is the uniaxial compressive strength of the grout (MPa), λ is the filling degree, and p is a fitting parameter. The meanings of θ m a x * , C, and A0 are the same as those defined above. In this study, p is taken as 0.8.

2.2. Experimental Method for Shear Creep Test

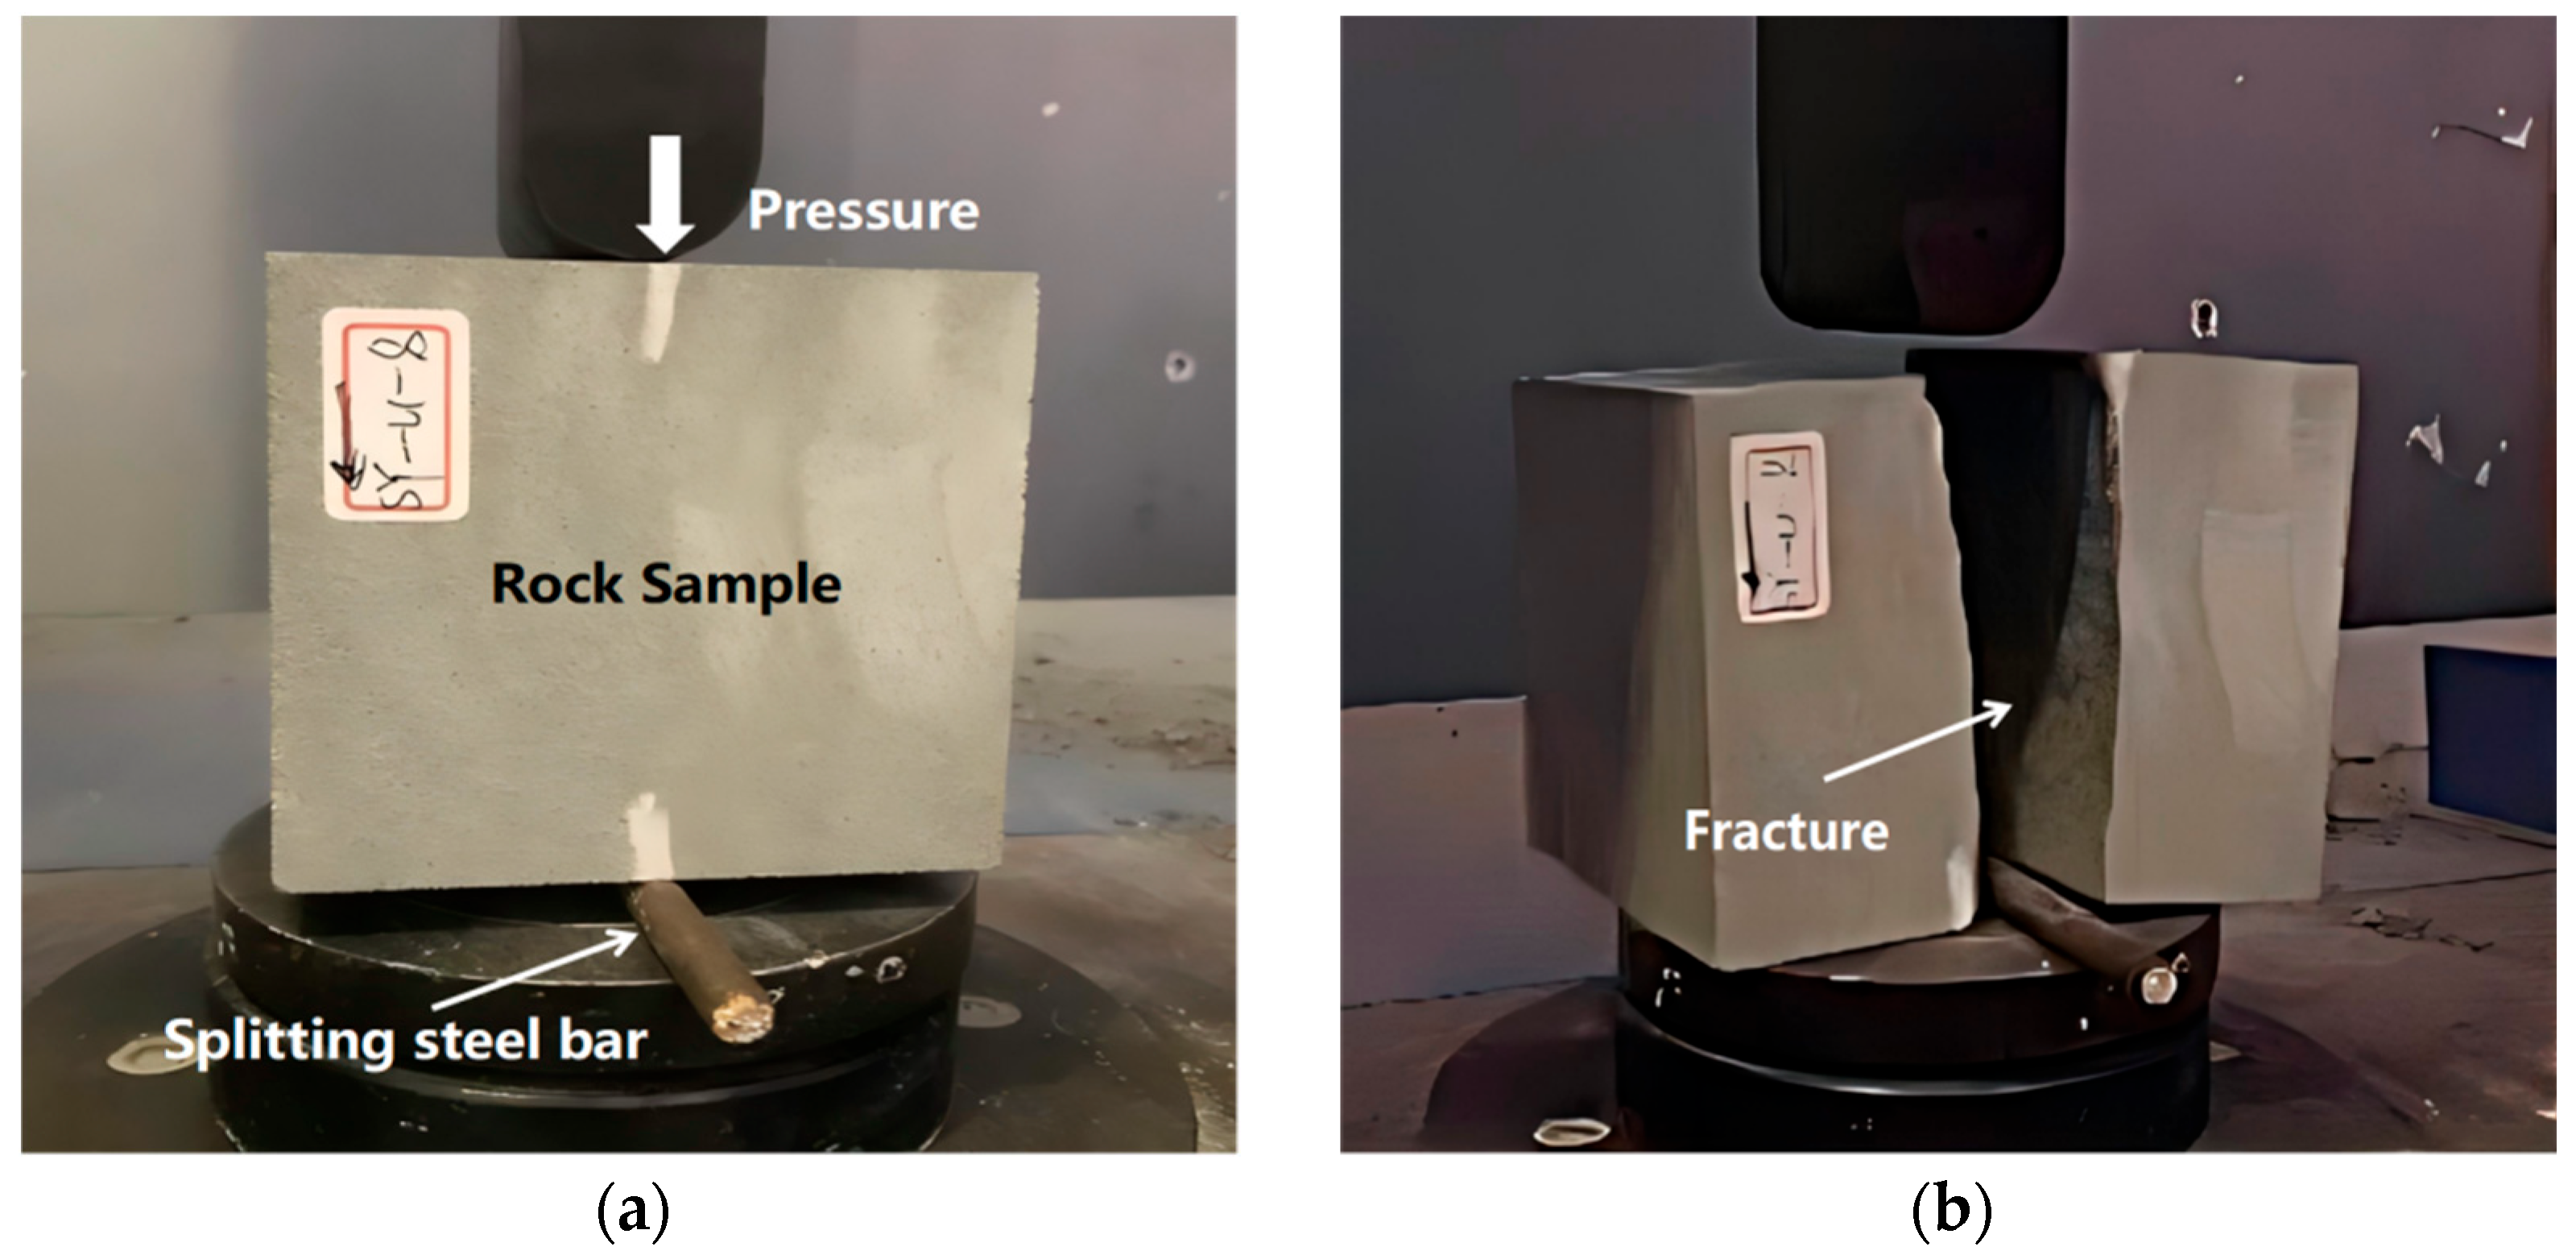
In this test, an improved Brazilian splitting method was adopted to produce fractured specimens [45]. In accordance with GB/T 50266–2013 [46] (Standard for Test Methods of Engineering Rock Masses), blocks were machined into 100 mm cubic specimens. This geometry was adopted mainly to maintain consistency with the specimen configuration used in the subsequent shear creep tests and related theoretical derivations, rather than for standard tensile strength determination. It is also more compatible with underground rock engineering conditions, in which compression–shear loading is generally more representative than pure tensile loading. The flatness deviation at both end faces did not exceed 0.1 mm, and the edge-length deviation along the specimen height did not exceed 0.5 mm. Each specimen was installed in the splitting device and aligned coaxially with the loading strip (Figure 4). Unlike the conventional Brazilian test, which typically uses cylindrical or disc-shaped specimens, the present study employed cubic samples to facilitate fractured structural plane preparation and preserve geometric consistency across the experimental program. Diametral compression was then applied via a servo-controlled loading system, producing through-going fractures passing through the specimen center.
A total of 16 specimens were prepared and used for the shear creep tests in this study. In the specimen code, ‘SY’ denotes the abbreviation of specimen, and the numbers 30–45 represent the specimen IDs. Specimens exhibiting excessive surface protrusions on the structural plane or a fracture trace deviating by more than ±4.0 mm from the specimen midline were rejected, and only specimens meeting the quality requirements were retained for the subsequent creep shear tests. The overall acceptance rate was about 60%. The resulting structural planes showed comparable geometry and roughness, thereby mitigating, to some extent, the difficulty of reproducing natural joints.
According to the Grouting Technical Code (YS/T 5211-2018) [47], the recommended water-cement ratio for grouting ranges from 0.5:1 to 1:1. A ratio that is too low may hinder grout penetration into the formation, whereas a ratio that is too high may fail to meet the strength requirements of the consolidated body. The final mix proportion should therefore be determined through site-specific grouting tests.
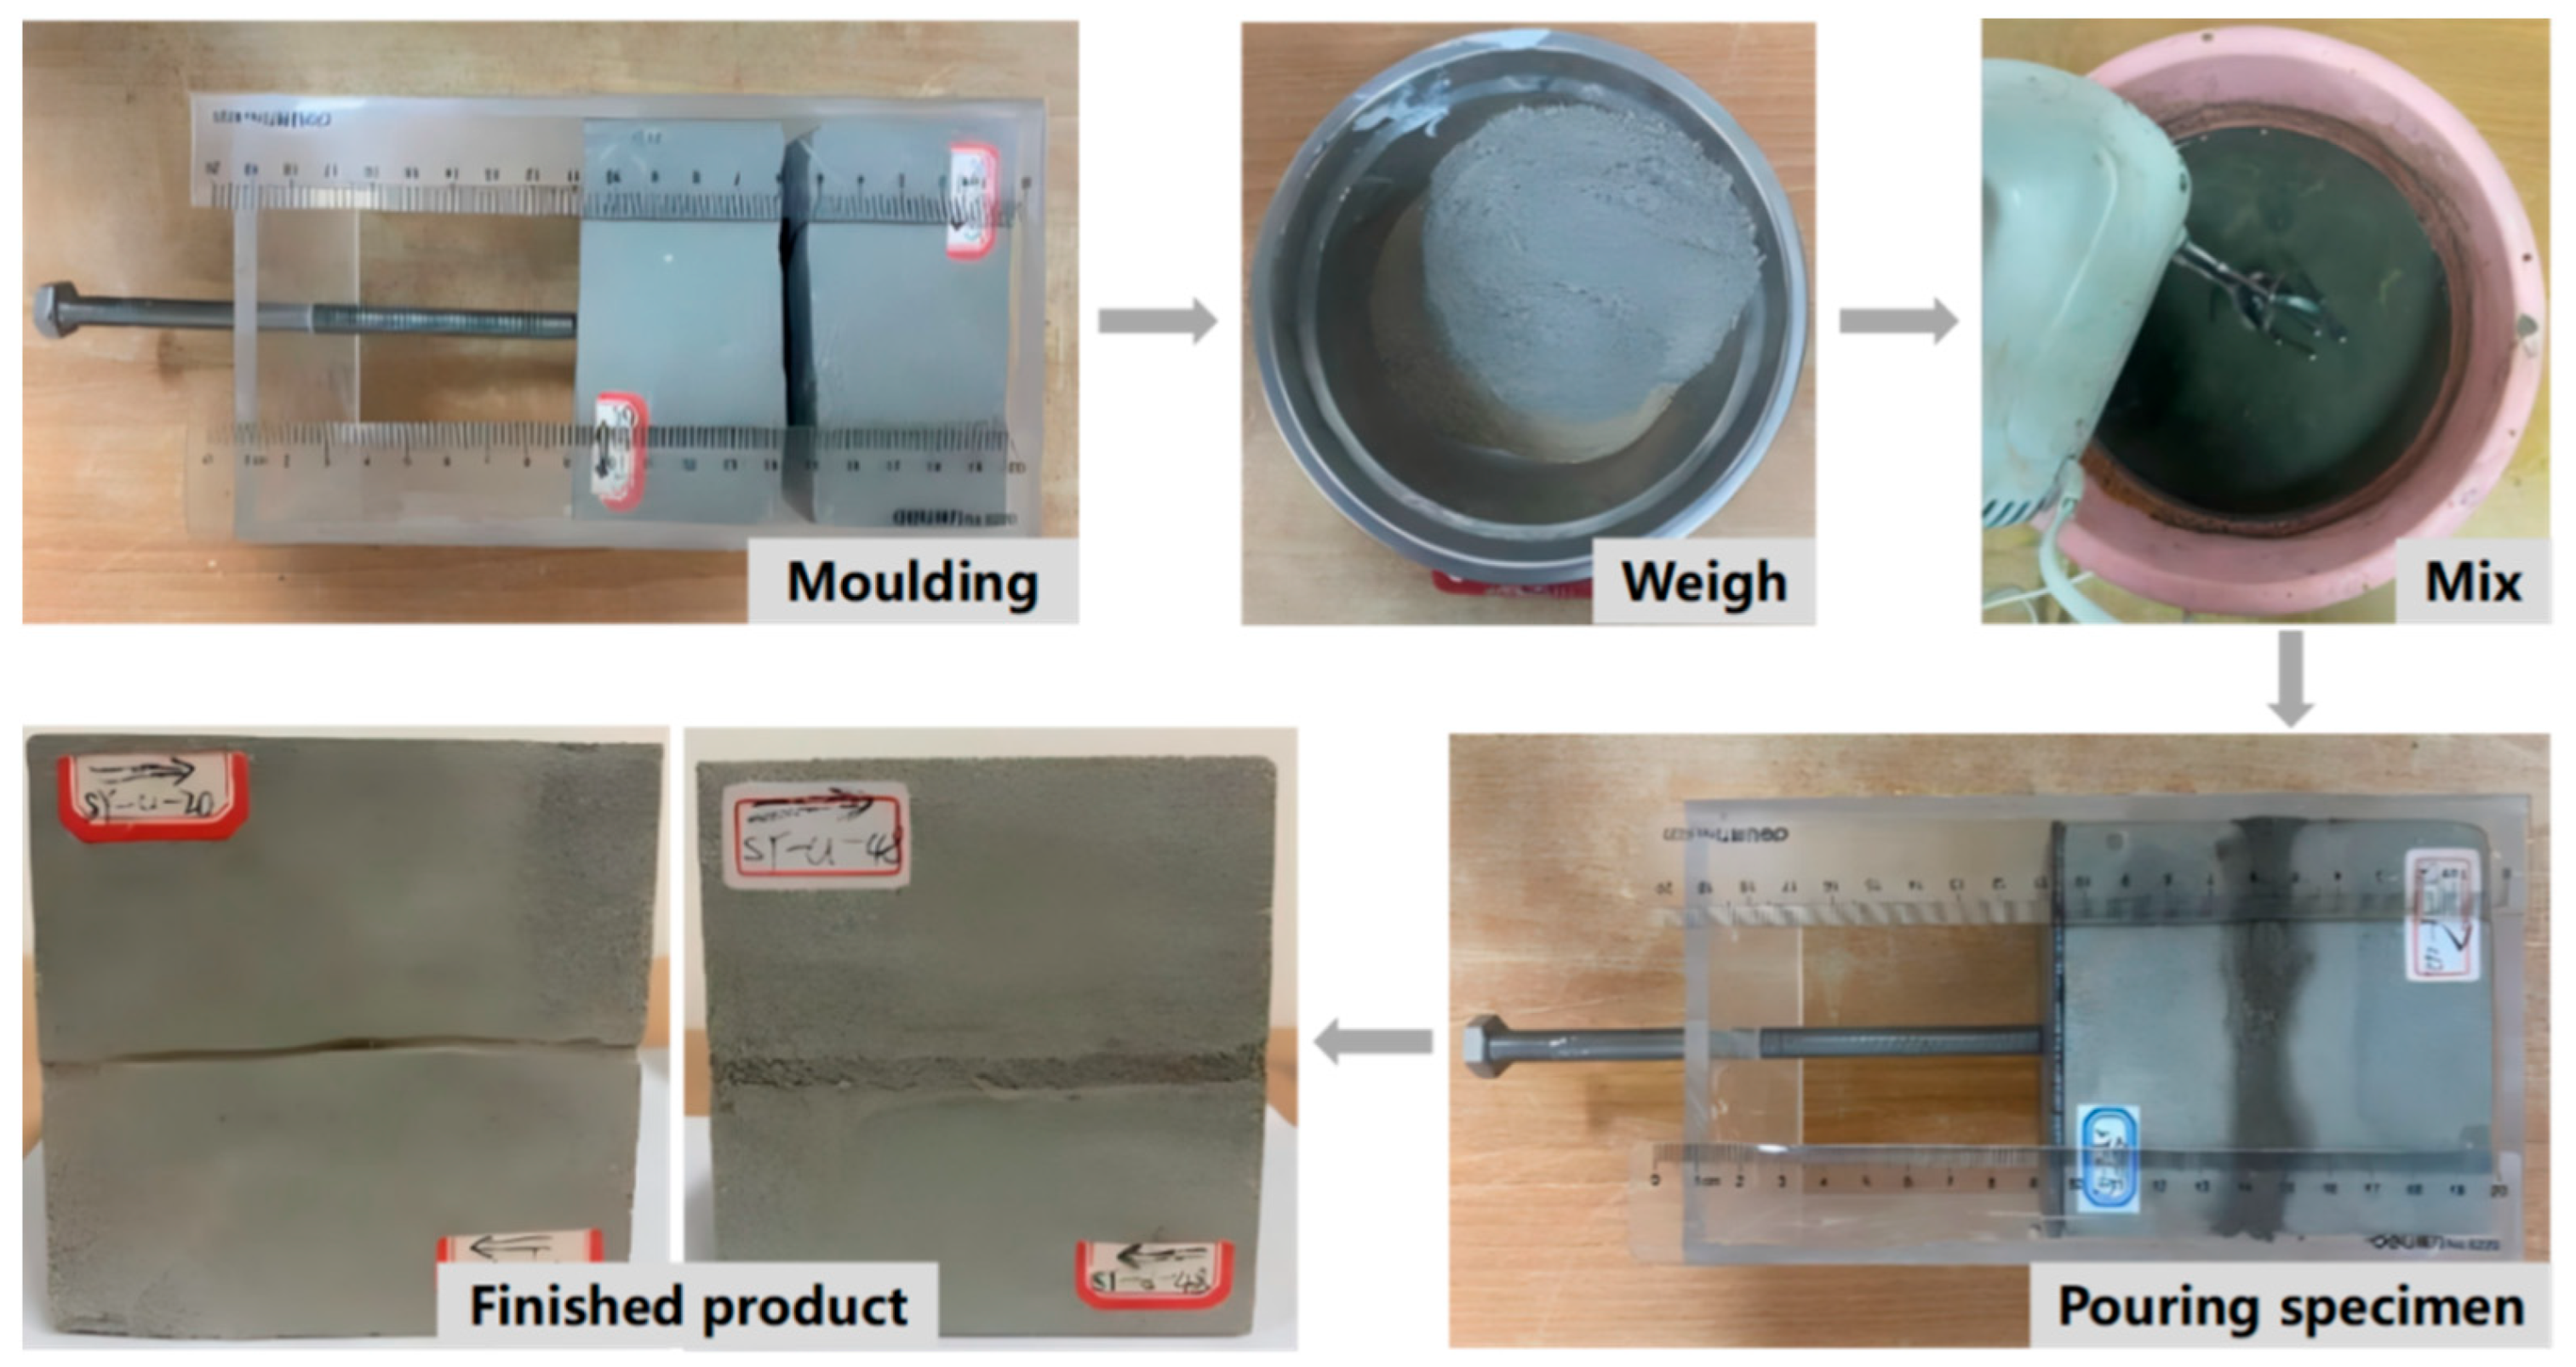
In this study, to investigate the enhancement of shear strength of rock structural planes by cement grouting, a water–cement ratio of 0.8 and a sand-cement ratio of 2.0 were adopted. This composition was selected with reference to commonly used cement-based grouting materials in underground rock engineering reinforcement, while also considering the requirements of grout fluidity, injectability, and the mechanical integrity of the hardened grout. In particular, the adopted water–cement ratio of 0.8 ensured adequate filling of rough joint surfaces and effectively reduced the risk of bleeding and segregation. The cement used was ordinary Portland cement (P.O. 42.5), where ‘P.O.’ denotes ordinary Portland cement and ‘42.5’ indicates the cement strength grade; its density was 1744 kg/m3. The sand was medium-grade with an average particle size of 0.35–0.5 mm, consisting of hard, clean particles free of deleterious impurities such as clay, leaves, alkalis, and other organic matter. The specimen preparation procedure for the grout tests is illustrated in Figure 5.
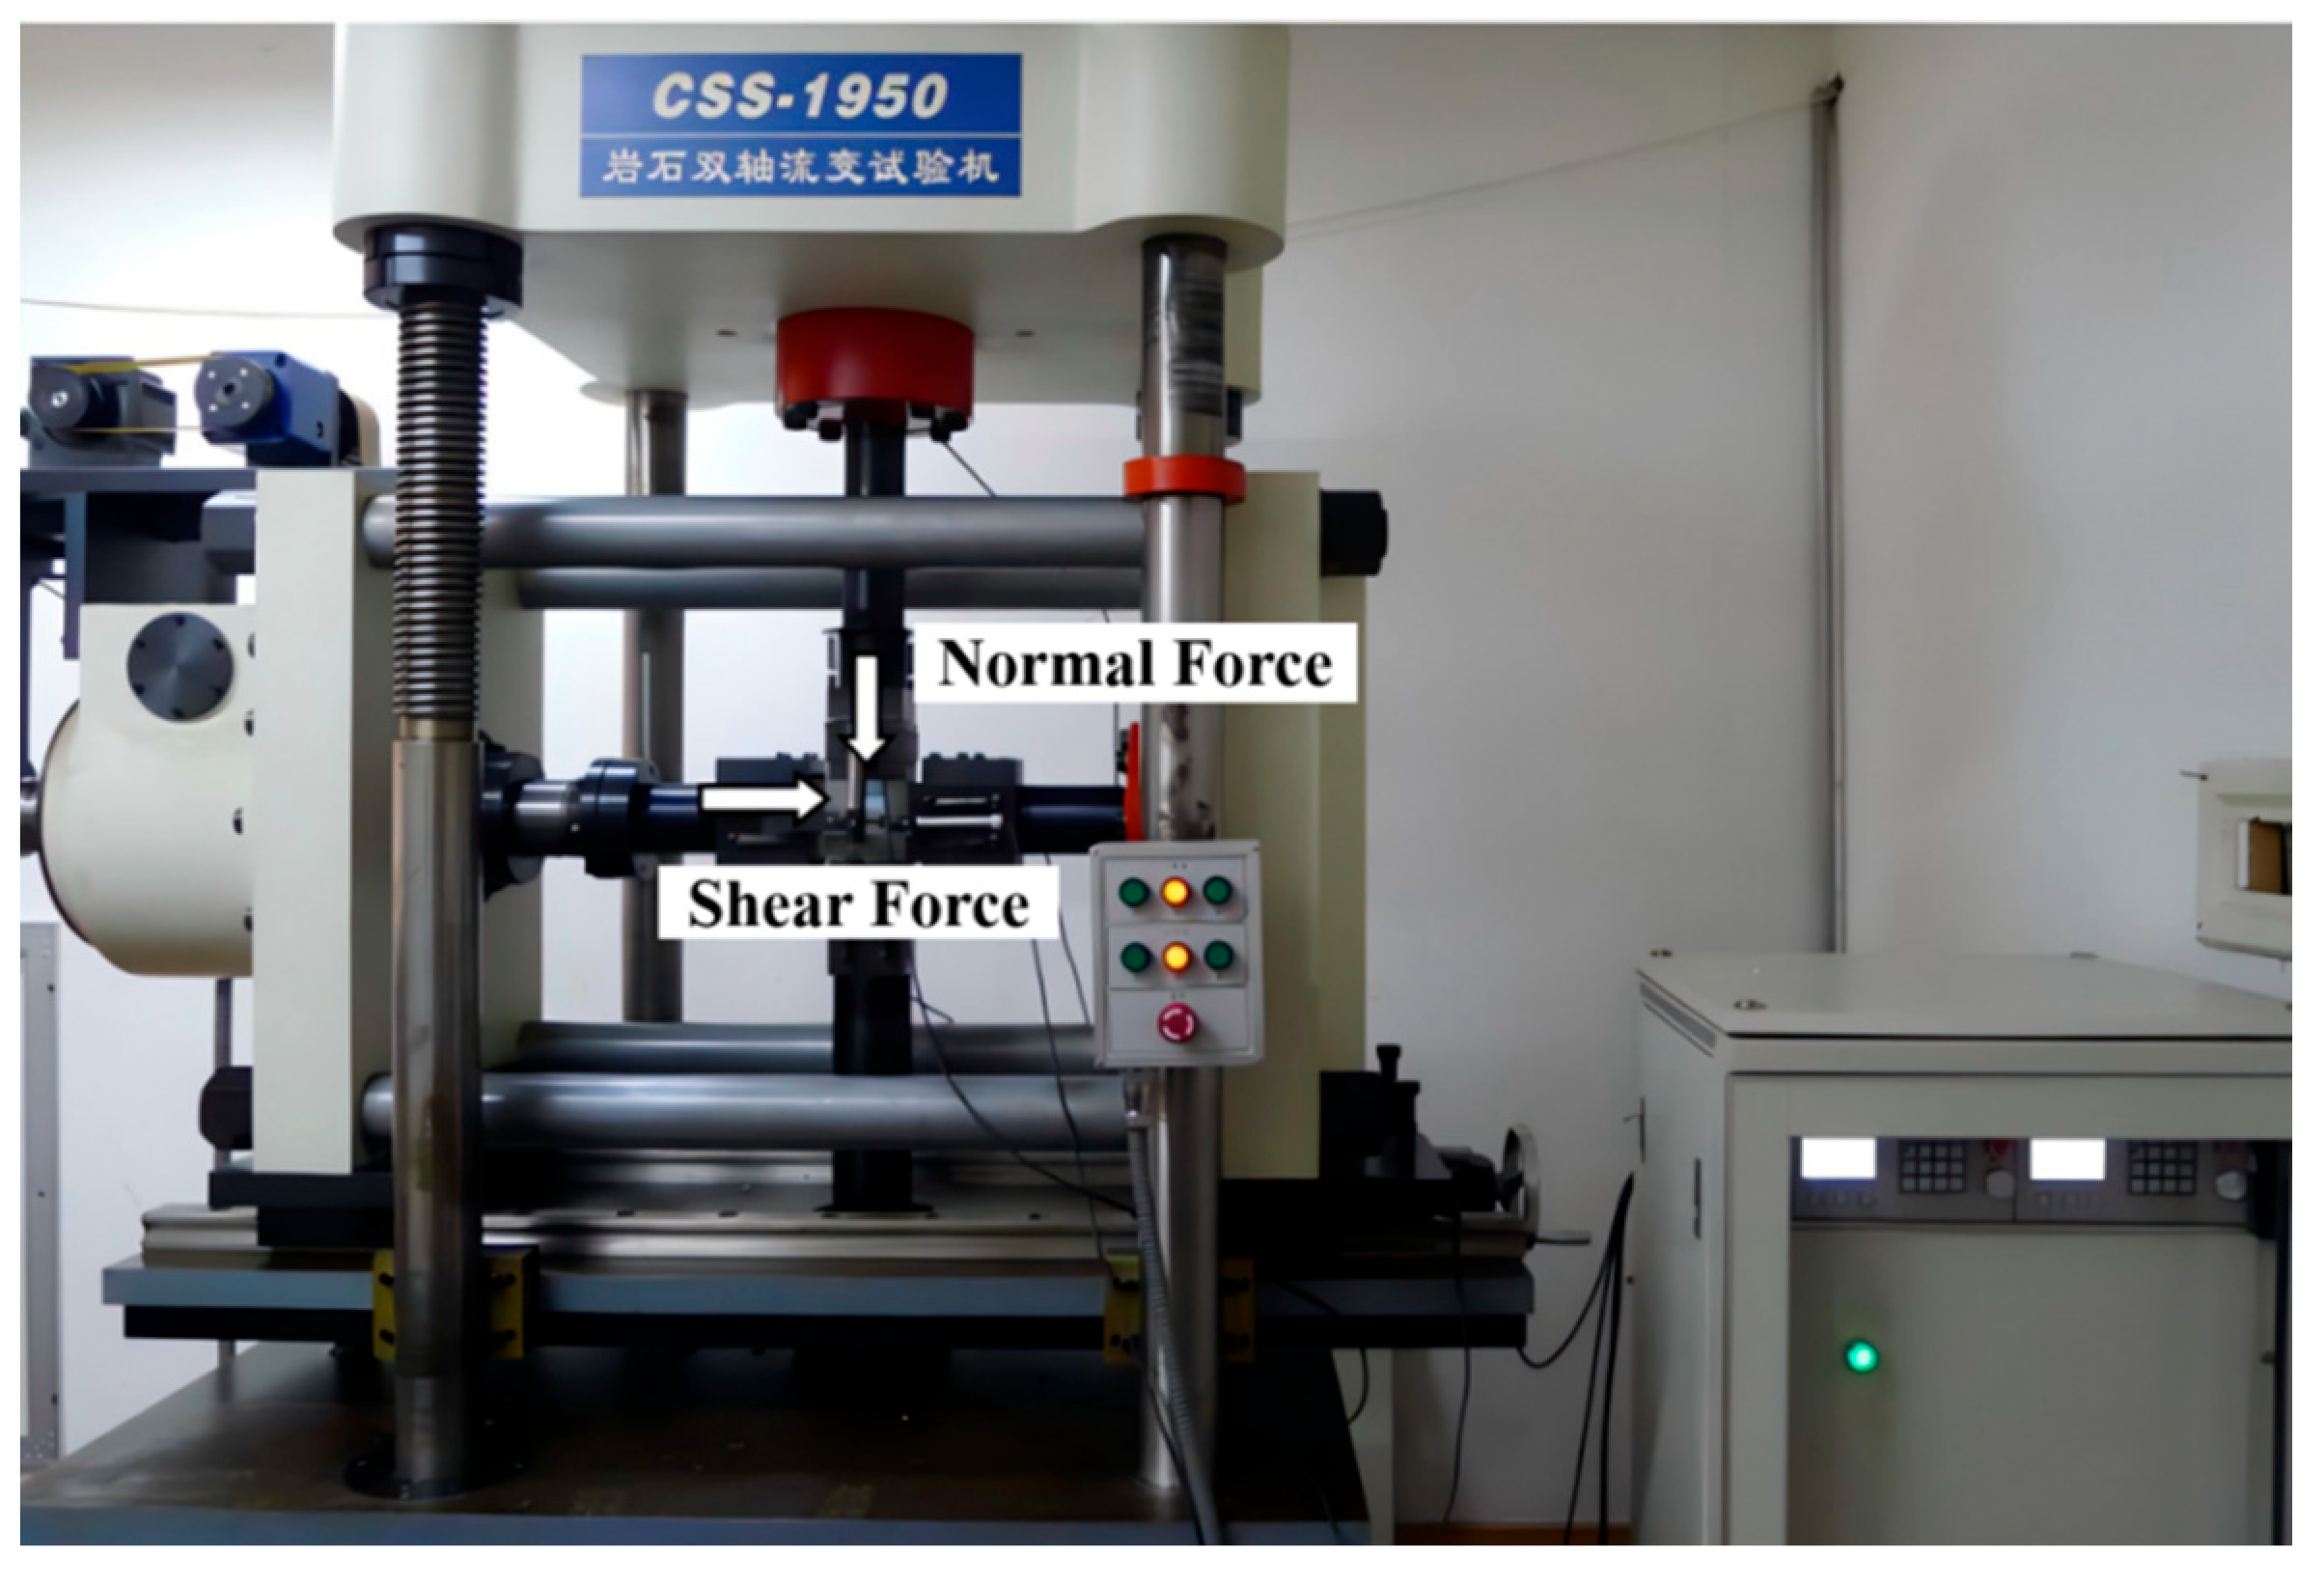
The shear mechanical properties of grouted structural planes were investigated through shear creep tests using a CSS-1950 rock biaxial shear rheometer (SINOTEST Equipment Co., Ltd., Changchun, China) at the Key Laboratory of Geotechnical and Underground Engineering, Ministry of Education, Tongji University (Figure 6). All tests were performed under constant normal force conditions.
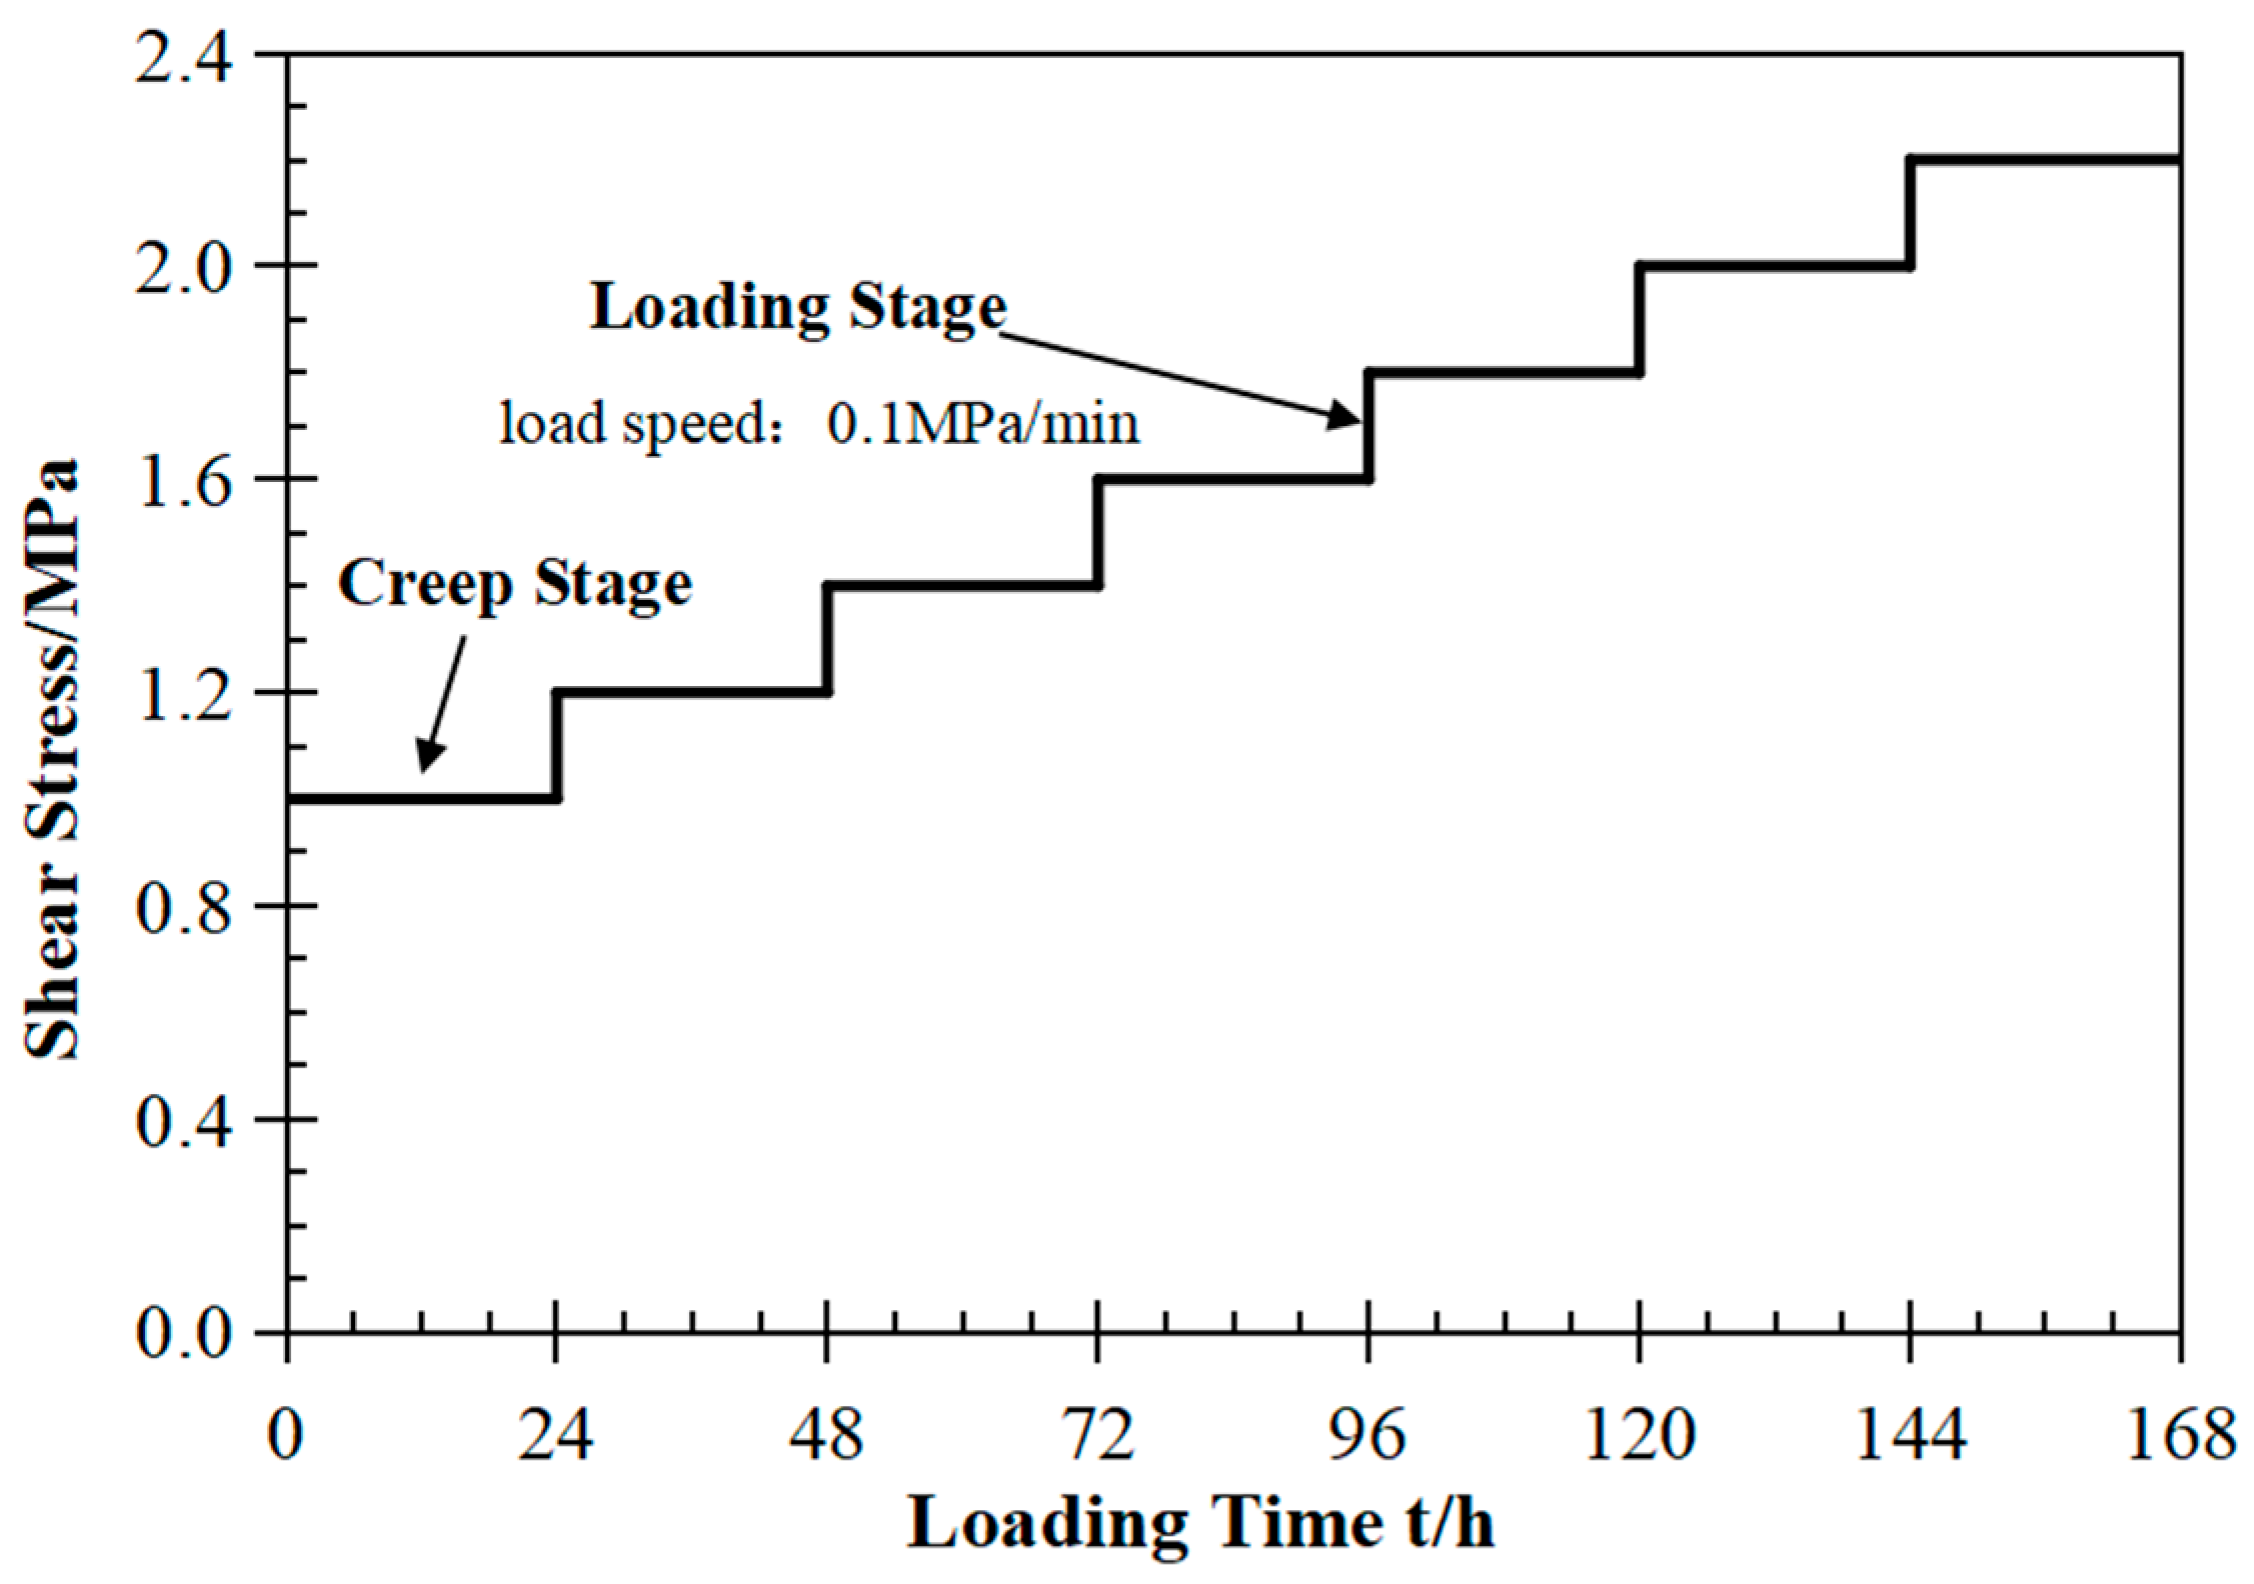
The shear failure characteristics of the rock samples were further examined with a high-definition Nikon camera, which captured the entire crack evolution process in the grout and rock during loading. Images were taken every 1.0 s when the shear displacement was less than 2.0 mm and every 8.0 s when it exceeded 2.0 mm. Figure 7 presents a schematic loading path for the graded shear creep tests, illustrating the general stepwise loading mode adopted in this study rather than the exact stress–time history of a specific test condition. Each horizontal segment represents a creep stage at a constant shear stress level, and each vertical increment denotes loading to the next stress level. The shear stress values on the vertical axis are illustrative only, while the actual graded stress levels were determined according to the shear strength of each test condition.
The surface topography of the structural planes before and after shear was measured using a TJXW-3D portable rock-joint surface profilometer. The raw point clouds were interpolated in MATLAB R2022a to a regular 500 × 500 grid (500 samples along both length and width), from which the three-dimensional morphological descriptors of the structural plane (e.g., A0, θ m a x * , C) were computed to quantify the pre- and post-shear topographic evolution. For the grouted specimens, the parameters used in the theoretical-strength calculation were still taken from the original rock structural plane before grouting. The calculated three-dimensional morphological parameters of the rock specimens are summarized in Table 1.
According to Equation (1) [42], the peak shear strengths of samples SY30-33 (ungrouted rock structural planes) were calculated as 0.60 MPa, 1.19 MPa, 1.80 MPa, and 2.25 MPa. The graded shear stresses were set at 50.0%, 60.0%, 70.0%, 80.0%, 90.0%, and 100% of the theoretical shear strength. Each load level was maintained for 24.0 h as a unified graded-loading duration in the present experimental program, primarily to ensure comparability among different specimens and groups within a feasible test period. The graded shear creep tests were conducted using the stepwise loading mode shown in Figure 7, and the specific loading levels for the control group are listed in Table 2.
For grouted rock structural planes, shear creep tests were conducted on specimens with different grouting thicknesses, with the normal stress kept consistent with that used in the direct shear tests. The theoretical peak shear strength of each grouted specimen was first calculated using Equations (11)–(13). Specifically, by substituting the scanned morphological parameters, the normal stress, and the filling degree into the above equations, the intermediate quantities JICS and ip, as well as the corresponding theoretical peak shear strength τt, were obtained for each specimen. The calculated results are summarized in Table 3.
Based on these theoretical strengths, the graded horizontal shear stresses used in the creep tests were then determined as 50–110% of τt. Each load level was maintained for 24 h. The loading sequence is shown in Figure 7, and the corresponding stress design scheme is presented in Table 4. Displacement data were recorded at each loading stage.

3. Test Results and Discussion

3.1. Displacement Decomposition Method

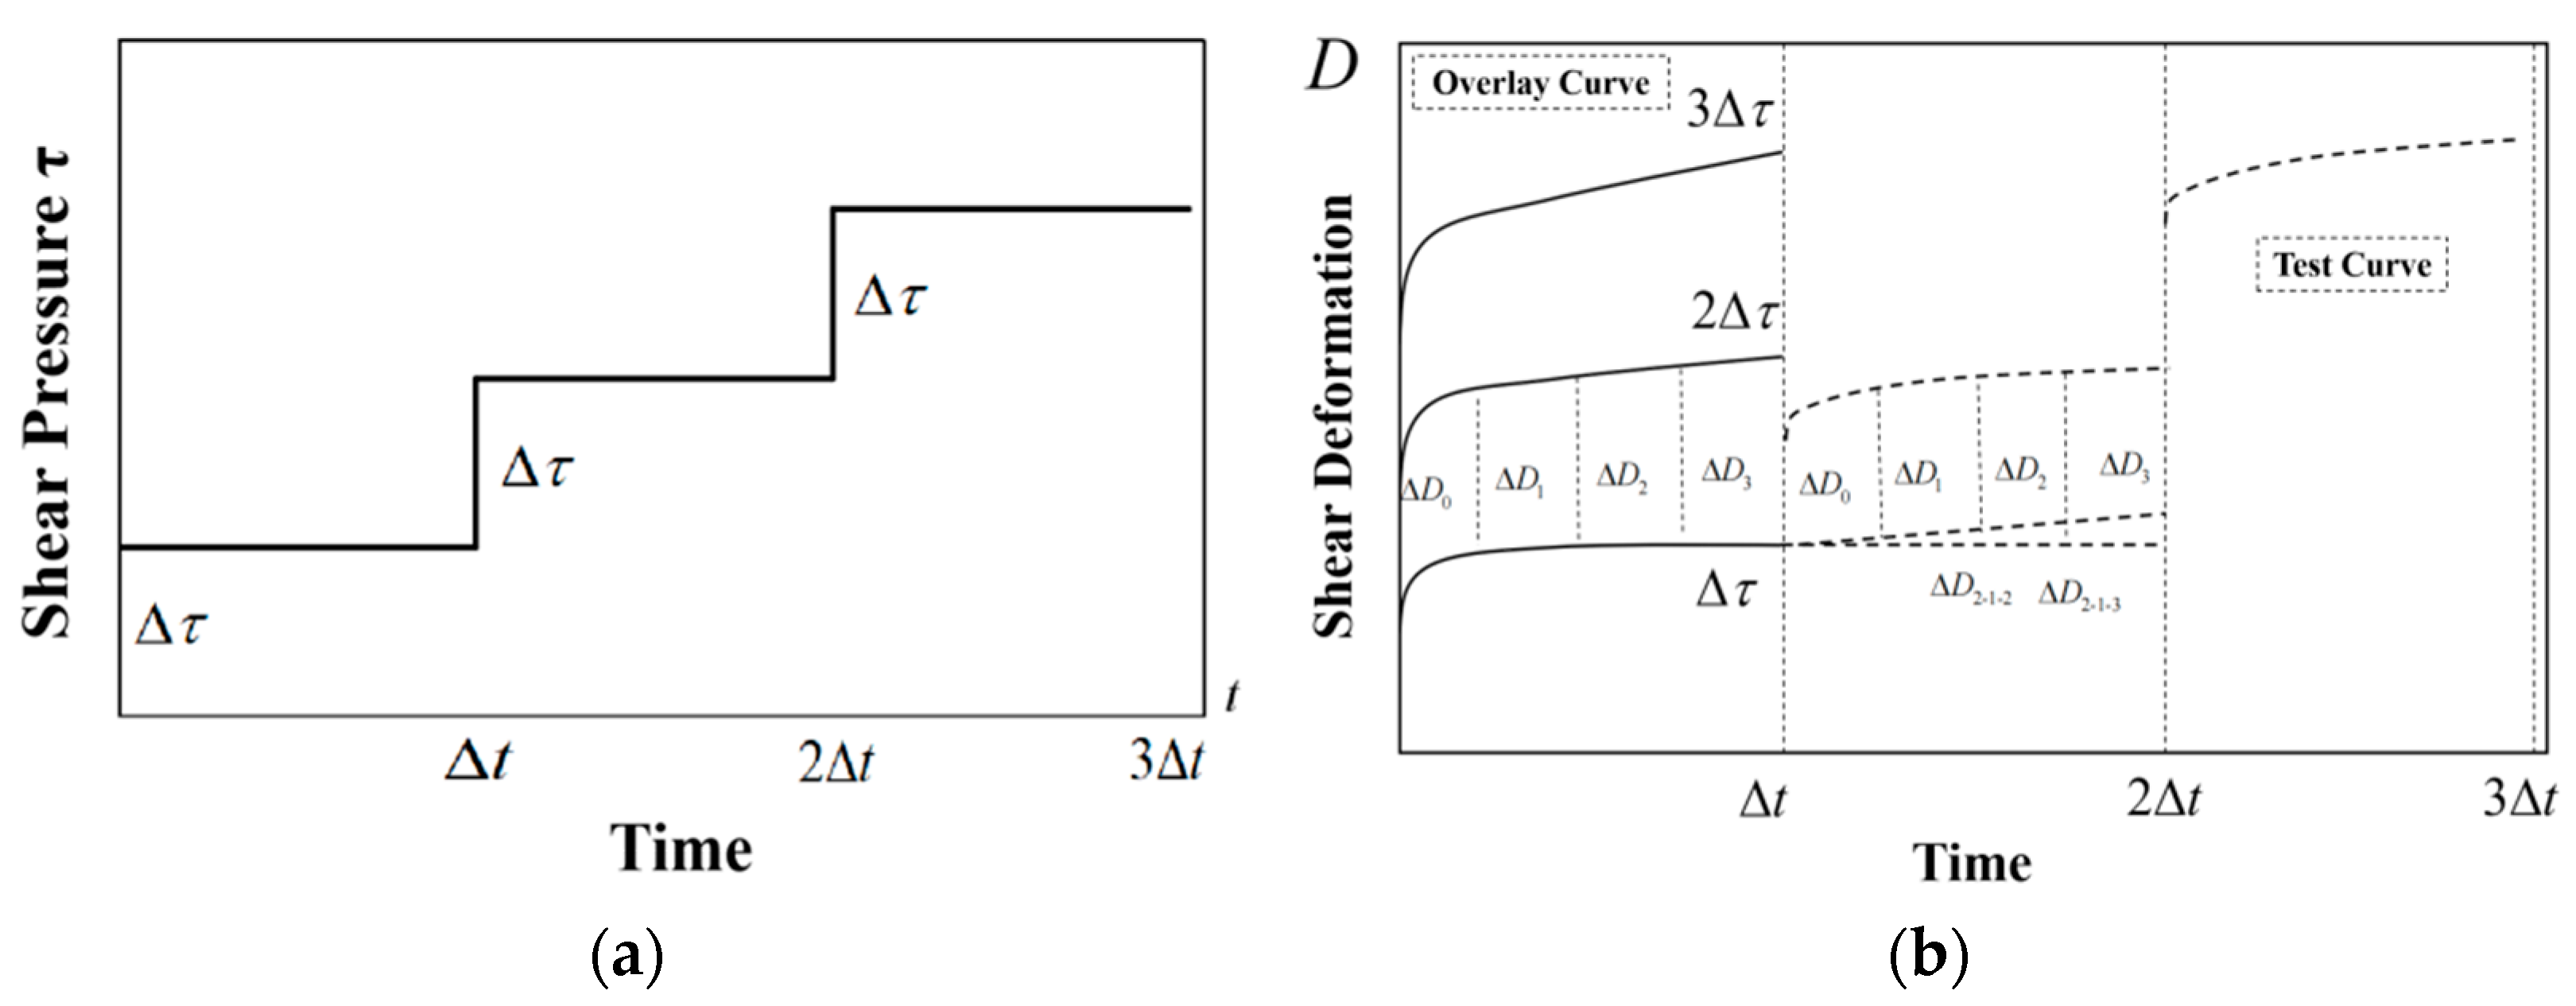
To account for the effect of graded loading, the shear rheological results were processed using Chen’s Loading Method to establish the relationship between shear deformation and time. The effect of this processing on the creep curves is shown in Figure 8. Due to the memory effect of the structural plane associated with the stress loading history, the shear displacement increment during the second loading stage consists of two parts: the displacement Δ D n caused by the stress increment Δ τ of the second stage within the time interval Δ t ~ 2 Δ t , and the displacement Δ D 2 1 n induced by the shear stress Δ τ of the first stage within the same time interval. More generally, Δ D i j n represents the displacement produced by the stress increment of the j-th stage during the i-th time interval.
Δ D 2 0 = Δ D 0 + Δ D 2 1 0 Δ D 2 1 = Δ D 1 + Δ D 2 1 1 ...... Δ D 2 n = Δ D n + Δ D 2 1 n
Therefore, when the second stage stress 2 Δ τ is applied, the total shear displacement can be expressed as follows:
D 2 Δ τ t = Δ D 1 t + Δ D t D Δ τ t = Δ D 1 t + Δ D 2 t + Δ D 2 1 t
The superimposed displacement is obtained by adding the creep displacement generated by the first-stage shear stress Δ τ and that generated by the second-stage shear stress Δ τ . As illustrated in Figure 8b, the final superimposed curve equals the actual displacement of the second stage in the graded loading test, plus the creep displacement from the first-stage load during the interval Δ t ~ 2 Δ t . Using this method, the graded loading creep results can be converted into an equivalent creep curve under single-step loading.

3.2. Test Results of the Control Samples

Here, “theoretical strength” denotes the ultimate shear strength of the structural plane computed from Equation (1) in Section 2.1 using the Mohr–Coulomb criterion. This value is used to normalize loading levels and to benchmark creep strength and failure thresholds in the grouted tests.
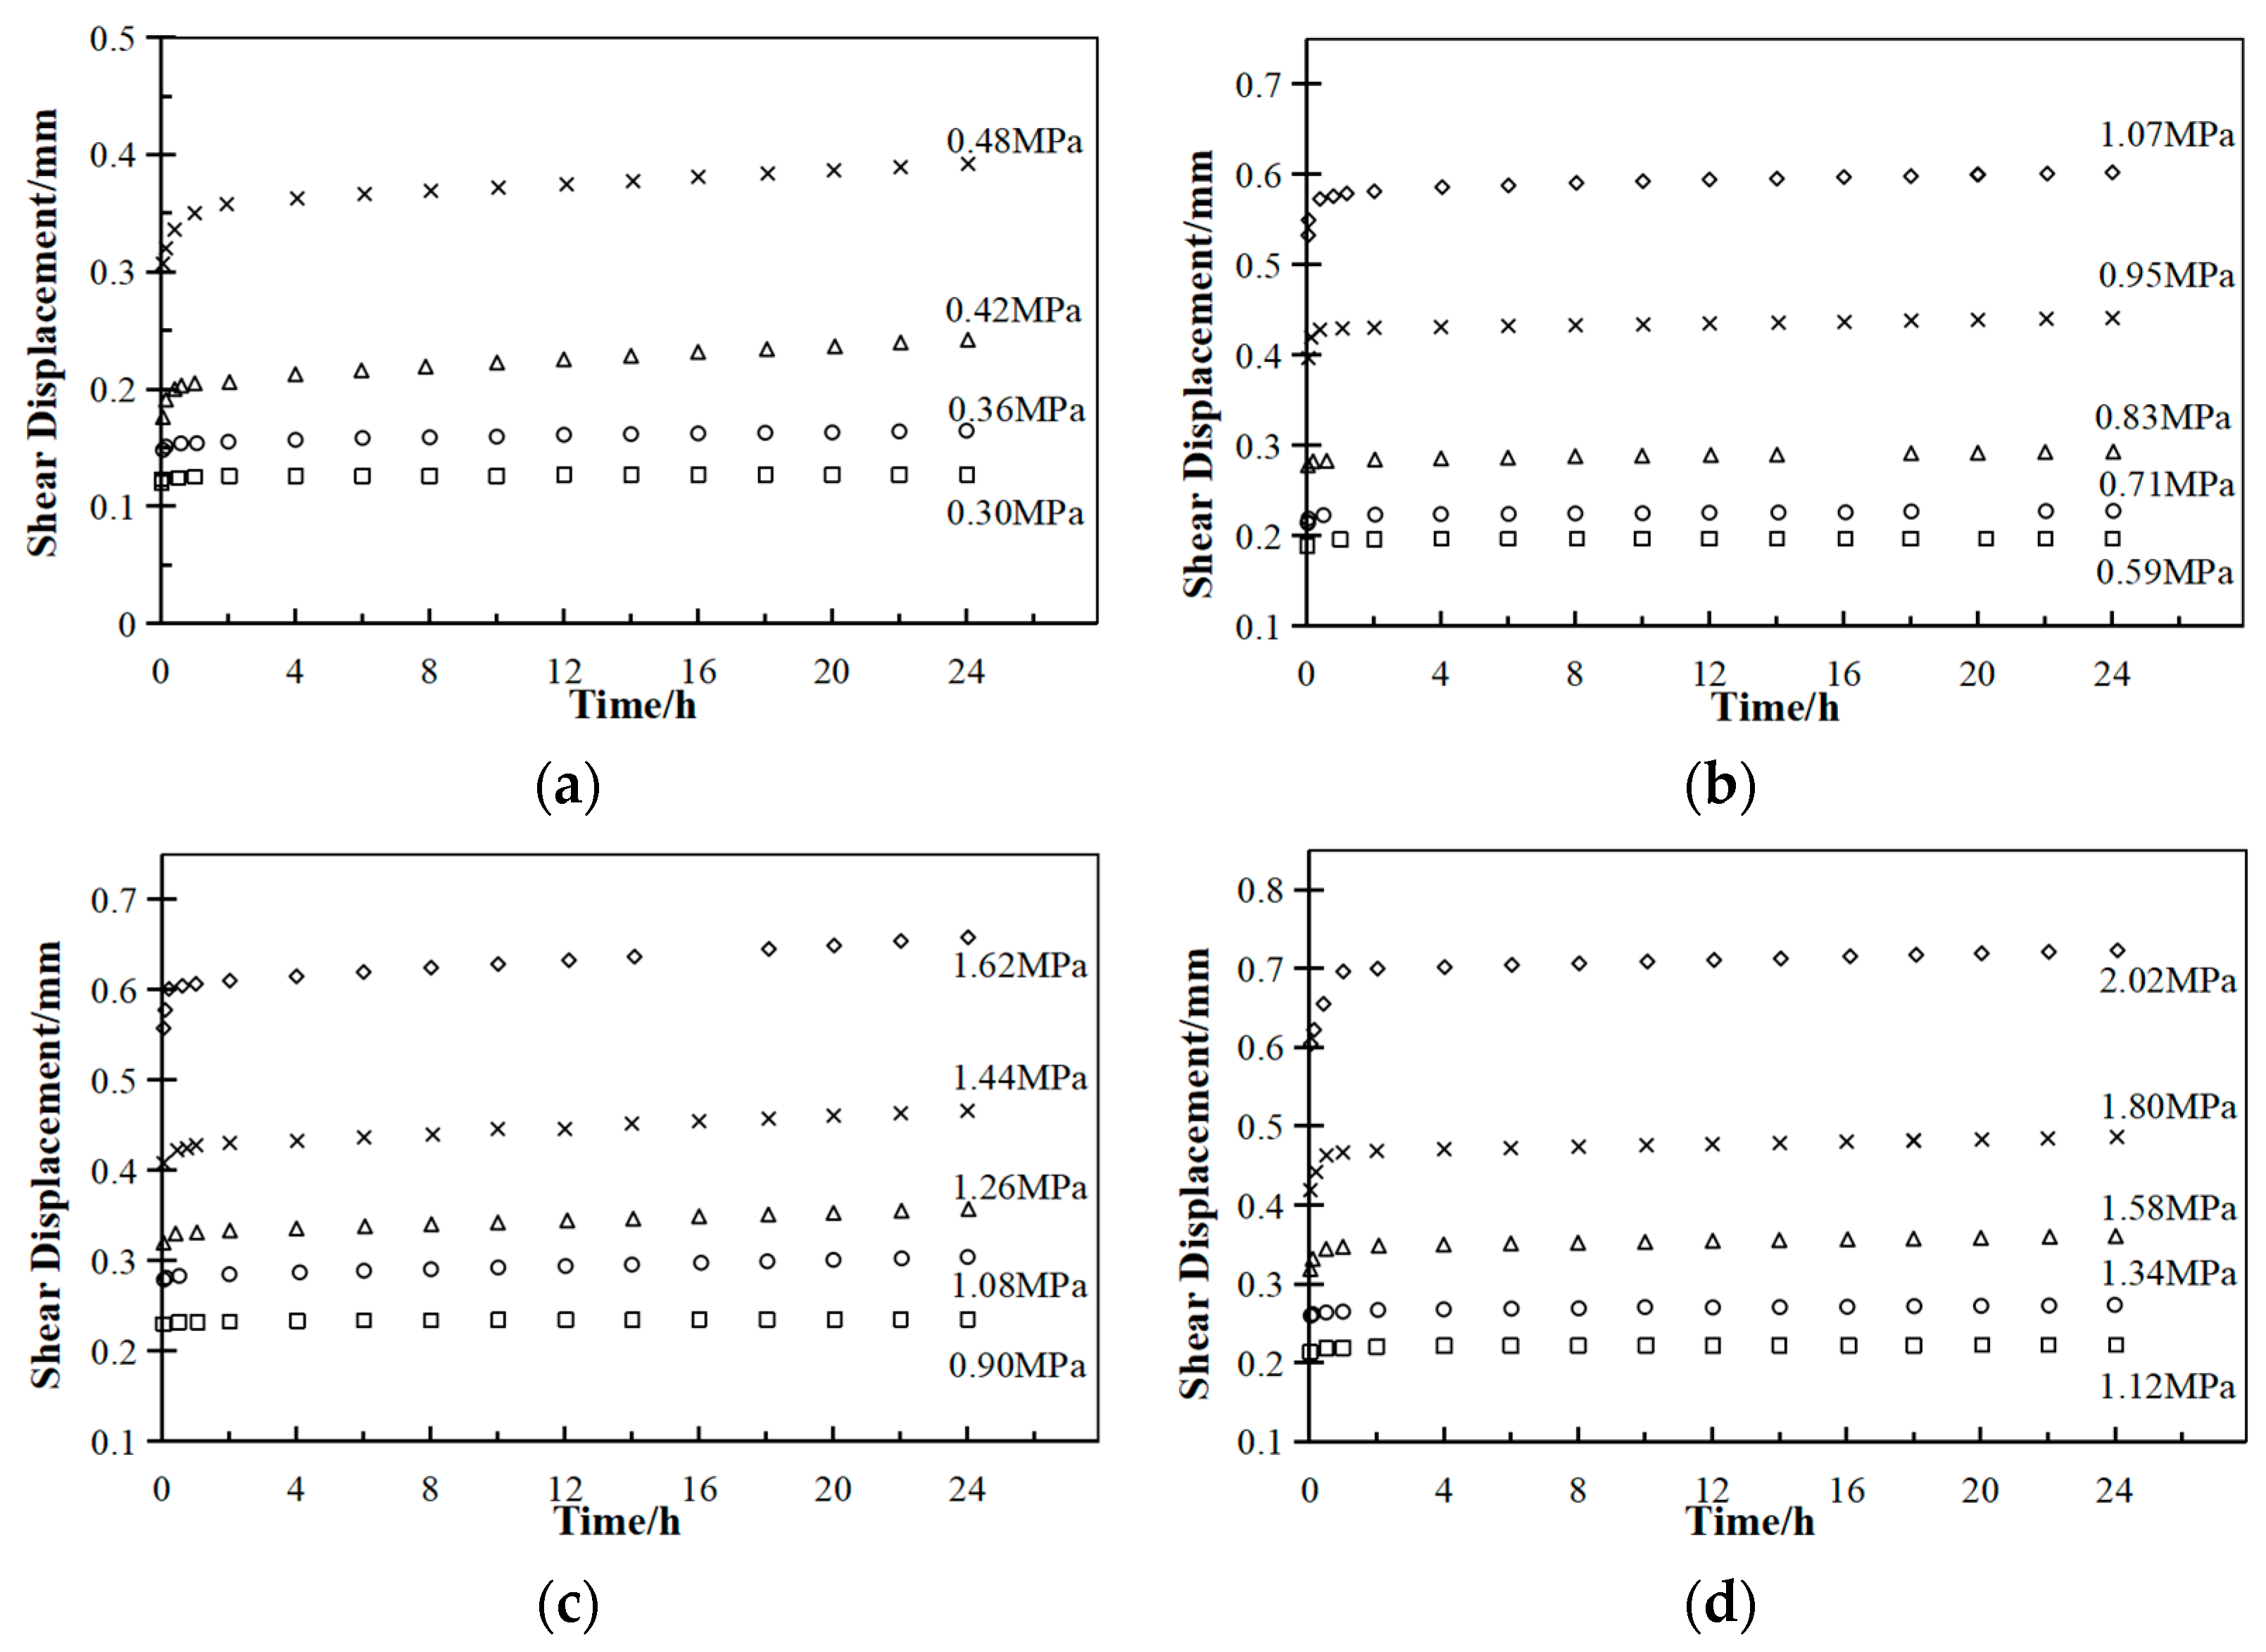
After processing the data of four specimens (SY-30~SY-33) with Chen’s loading method, graded creep curves at different shear-stress levels were obtained (Figure 9). The four specimens exhibit consistent trends.
Taking SY-33 as representative: at τ = 1.12 MPa and 1.34 MPa, the creep curve shows a small, gently varying slope; at τ = 1.58 MPa, a distinct early-time transition (elbow) emerges; at τ = 1.80 MPa and 2.02 MPa, the initial concave segment enlarges and the late-time (steady-state) slope becomes steeper. The other specimens show the same pattern: initial creep remains limited, the steady-state slope is negligible at low levels, and it progressively increases with higher graded levels. The only exception occurs at σn = 0.5 MPa, where creep failure initiated at 90% of the theoretical strength, whereas in all other cases failure occurred at 100%.
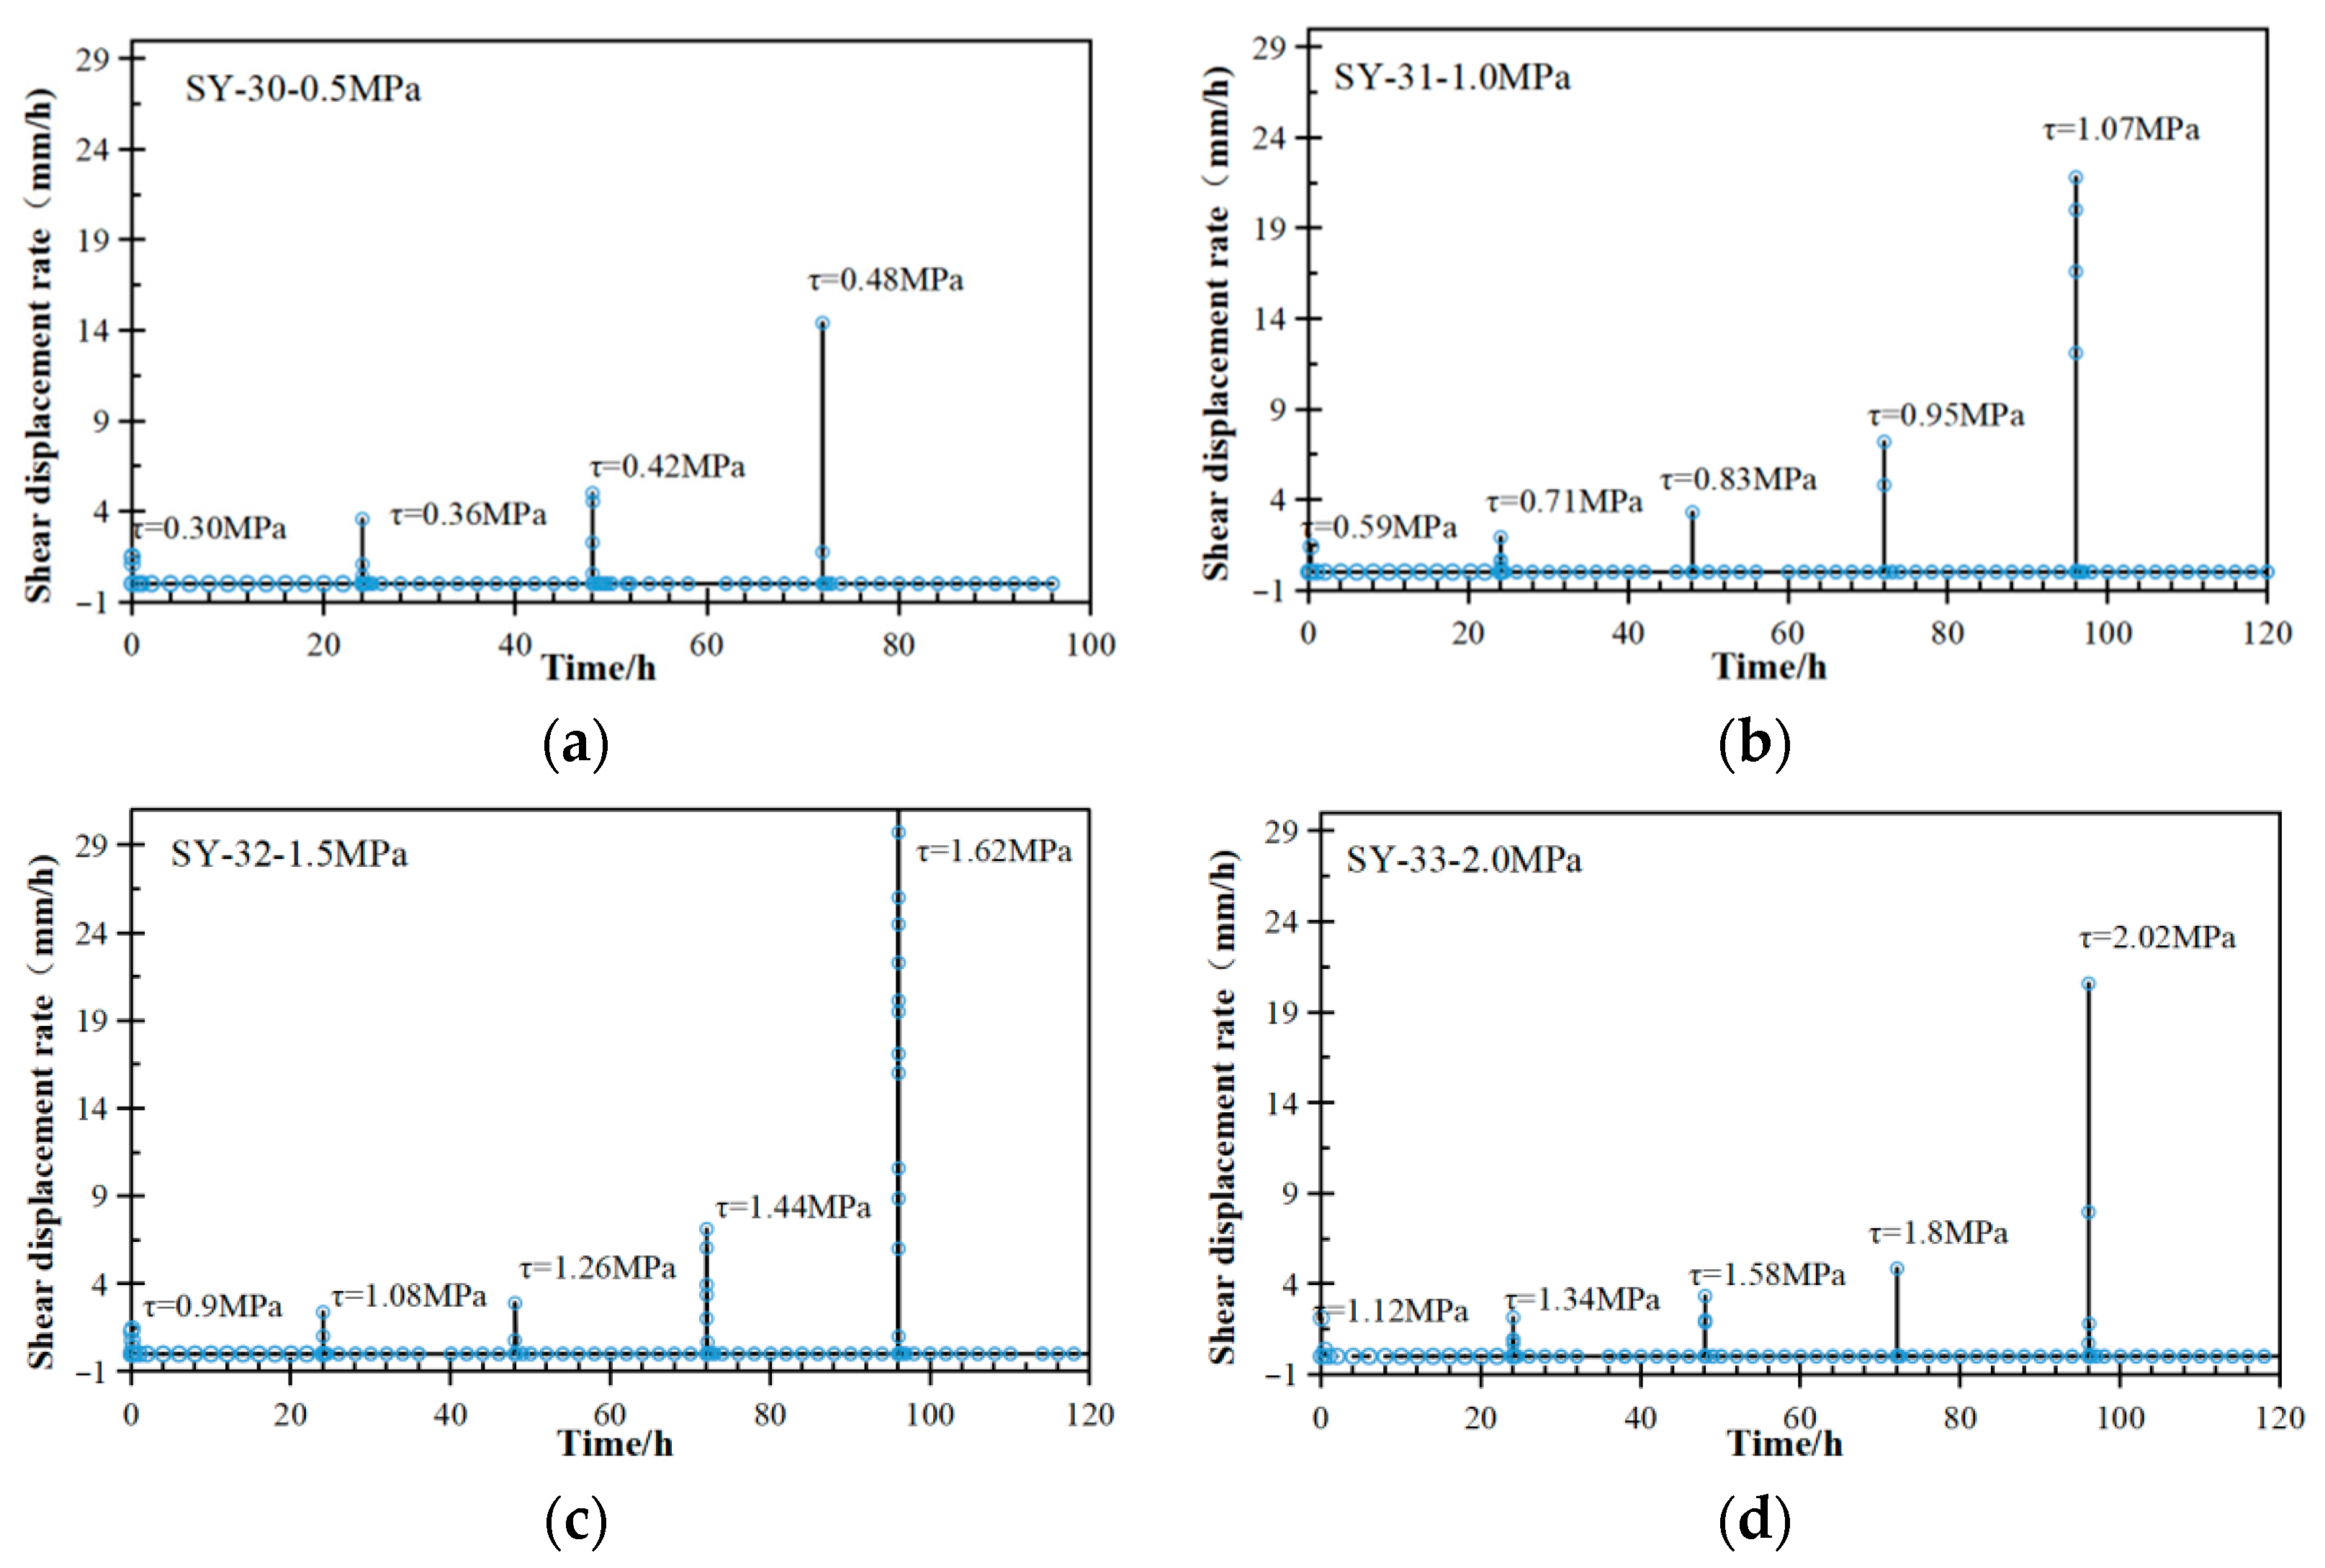
Figure 10 illustrates the time-dependent evolution of creep rates for the structural planes under different normal stresses. The rates were obtained from single-stage loading data processed using Chen’s Loading Method, defined as the ratio of creep displacement to the corresponding time increment. Notably, the creep rate during the failure stage is exceptionally high; if plotted on the same scale, it would obscure the creep response at lower stress levels. To ensure clarity and comparability, the failure-stage creep rates are therefore excluded from the figure.
From Figure 10, the creep rate under each shear-stress level decays from an initially elevated value through a rapid-decay stage and then approaches a near-zero steady state. For a given normal stress (σn), the initial creep rate increases with rising shear stress (τ); however, the increment is marginal at the initial loading levels. Once τ exceeds a threshold, the rate exhibits an abrupt increase. For example, in SY-30 the initial rate at the first three levels is nearly constant, whereas at τ = 0.48 MPa it is 2.88 times that at τ = 0.42 MPa (Figure 10a). Comparable behavior is observed for SY-31, SY-32, and SY-33, with clear jumps at τ = 1.07, 1.62, and 2.02 MPa, respectively (Figure 10b–d).
Comparing across normal stresses, the effect of σn on the shear creep rate is minor at the initial loading levels, with only small variations among σn. By contrast, at the final loading level the influence becomes pronounced: the creep rate increases with σn, except for a slight reduction at σn = 2.0 MPa.

3.3. Test Results of the Grouted Samples

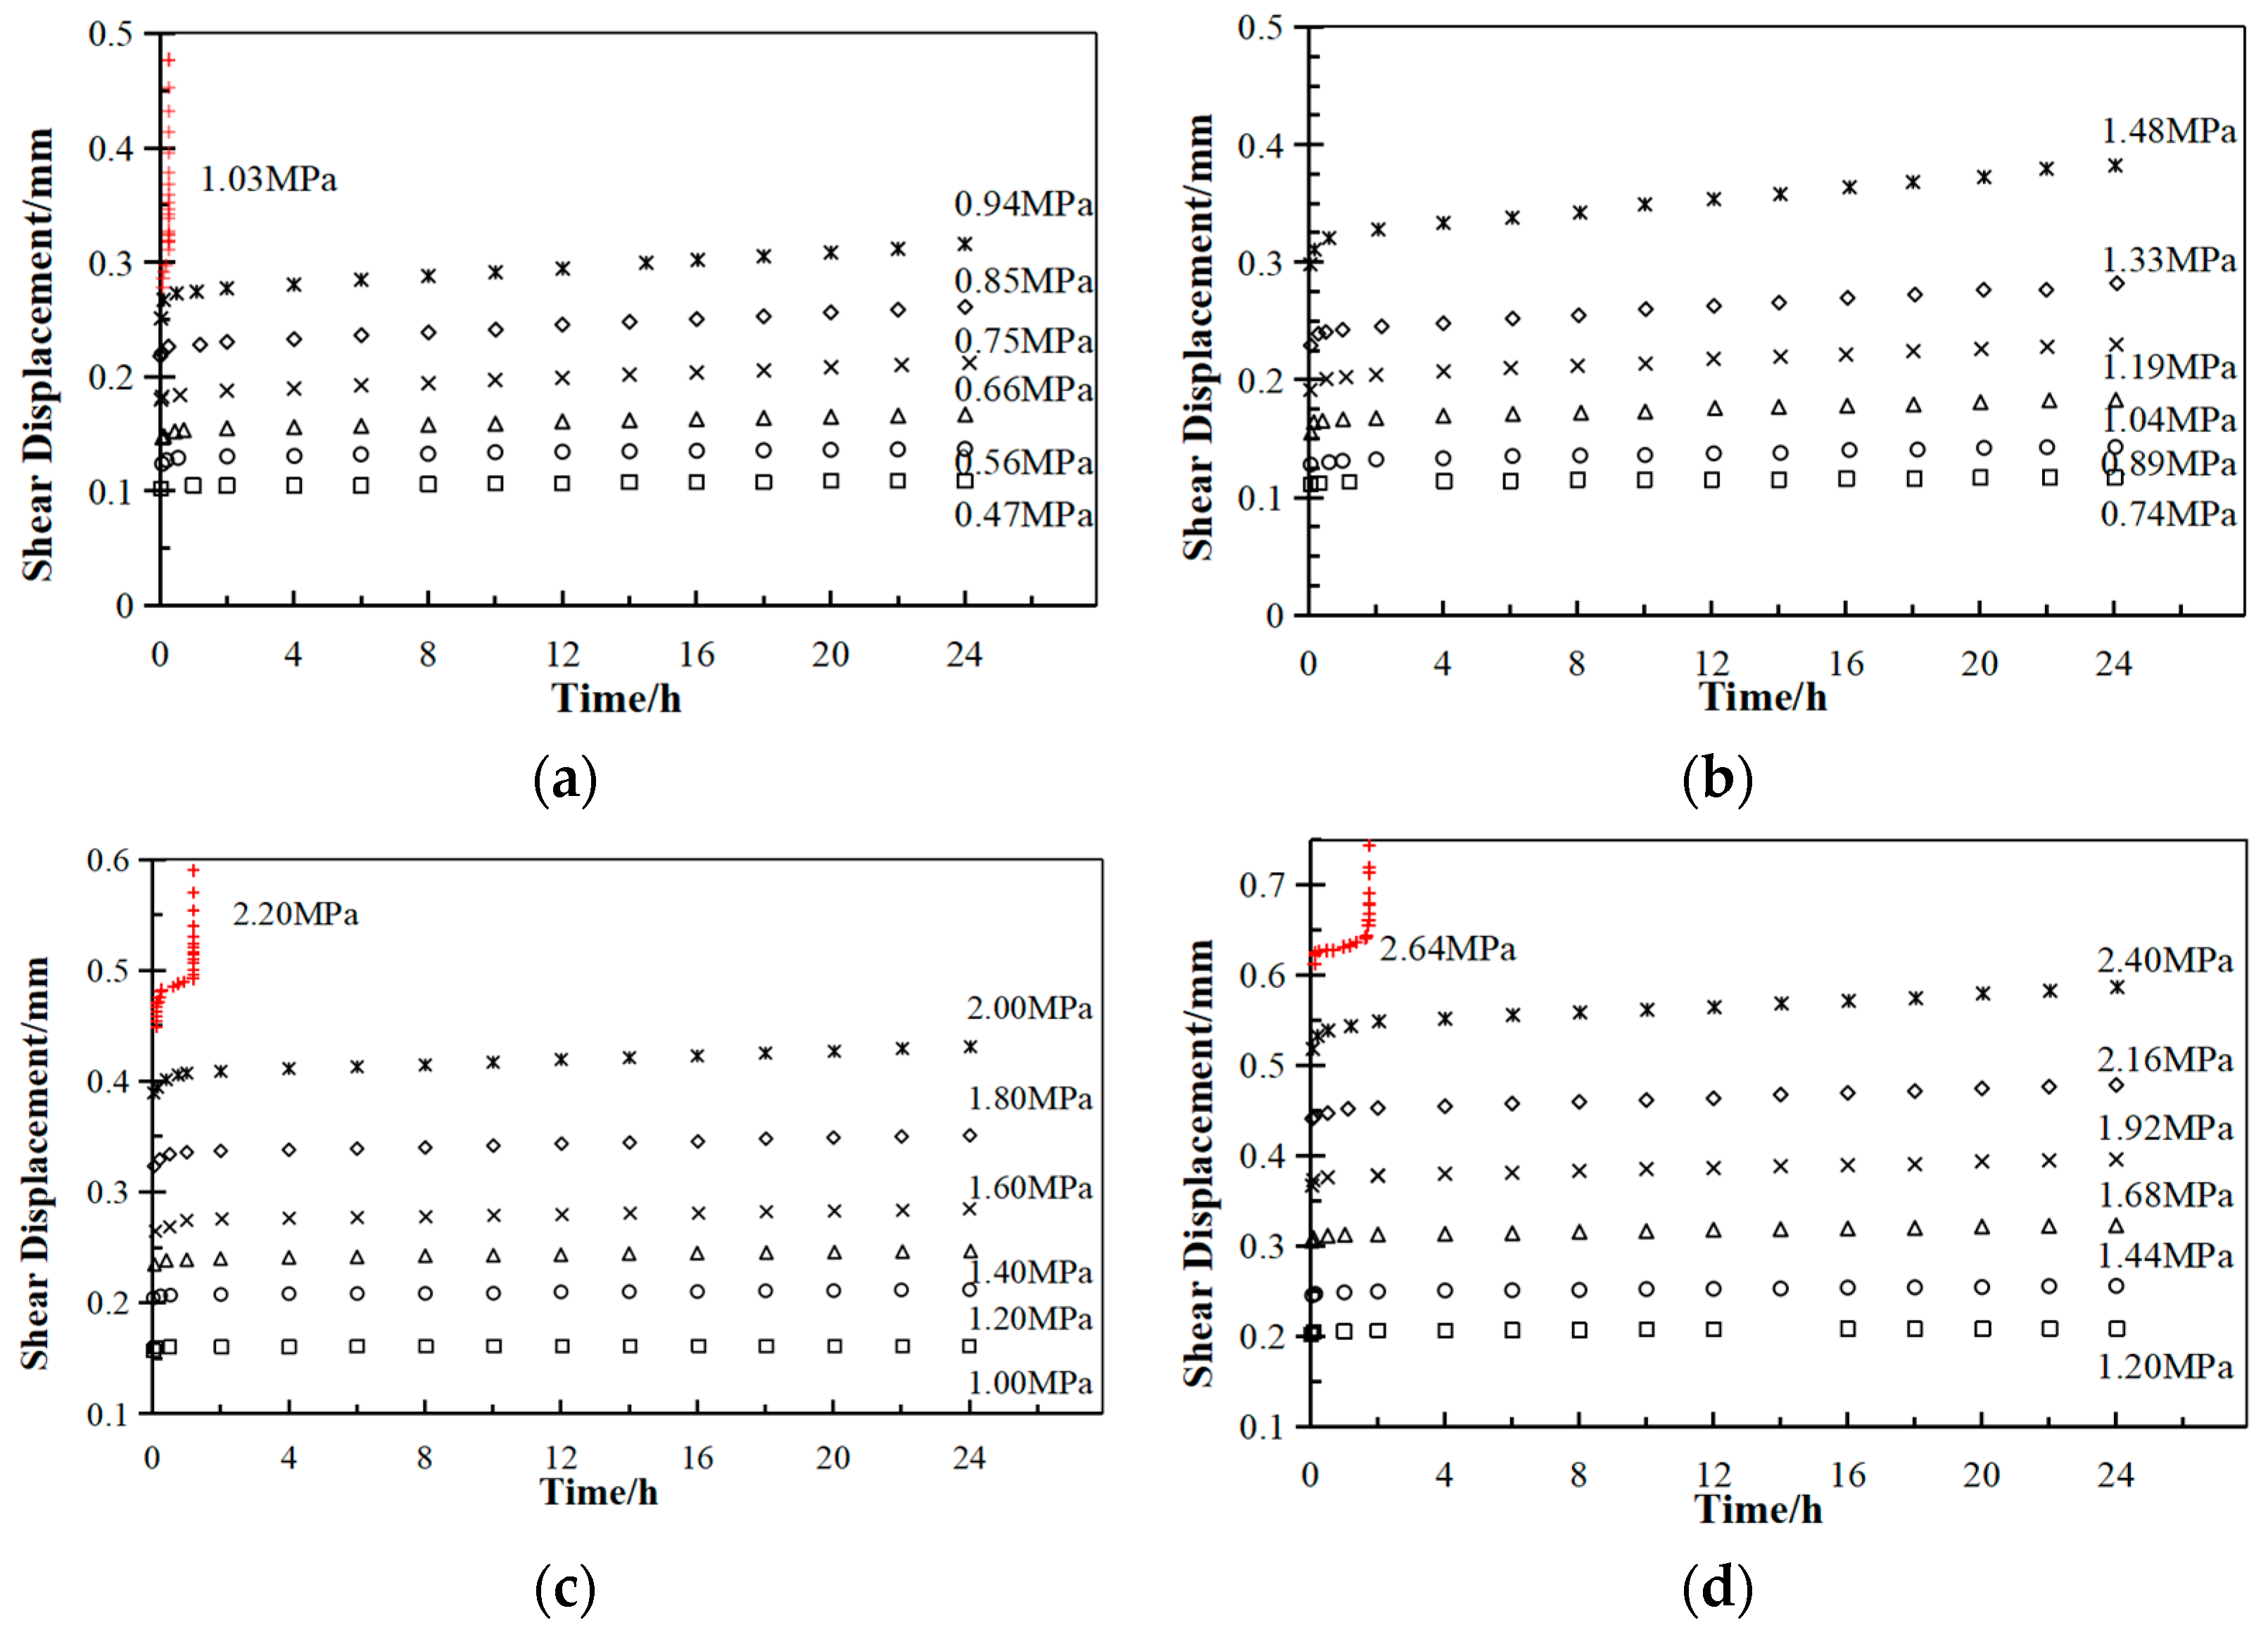
Compared with ungrouted structural planes, grouted samples display similar creep characteristics at low stress levels but diverge markedly at higher levels. Using Chen’s loading method, the creep responses were processed; the specimen with a grout thickness of 2.0 mm is taken as representative (Figure 11). Under different normal stresses, the creep histories are organized into six loading levels. At the lower levels, the increment of creep displacement remains small and the steady-state slope is nearly zero. With increasing loading level, however, the steady-state slope progressively increases. In addition, compared with the ungrouted control group under similar stress conditions, the grouted specimens generally exhibit larger total shear displacement, and this displacement increases noticeably with rising normal stress.
For a given normal stress, the creep curves at each loading level generally comprise an initial decay stage followed by a steady-state stage; with time, the displacement rate diminishes and the curves become approximately linear. For example, in SY-35, the curves at τ = 0.74 MPa and 0.89 MPa are nearly straight. As τ increases, a pronounced early-time decay segment emerges, and the late-time segment tilts upward, indicating a continuous increase in slope. Between τ = 1.04–1.48 MPa, the overall pattern persists; however, both the duration of the decay stage and the steady-state slope grow with stress.
At higher loading levels, a tertiary (accelerated) creep stage may develop prior to failure. In SY-34, when τ = 1.63 MPa, shear displacement rises rapidly, culminating in abrupt (near-instantaneous) failure. The other three specimens also enter an accelerated stage before failure, showing similar trends though the detailed curve evolution differs during acceleration. Notably, as normal stress increases, the duration of the accelerated stage systematically extends, indicating a strong dependence on σn.
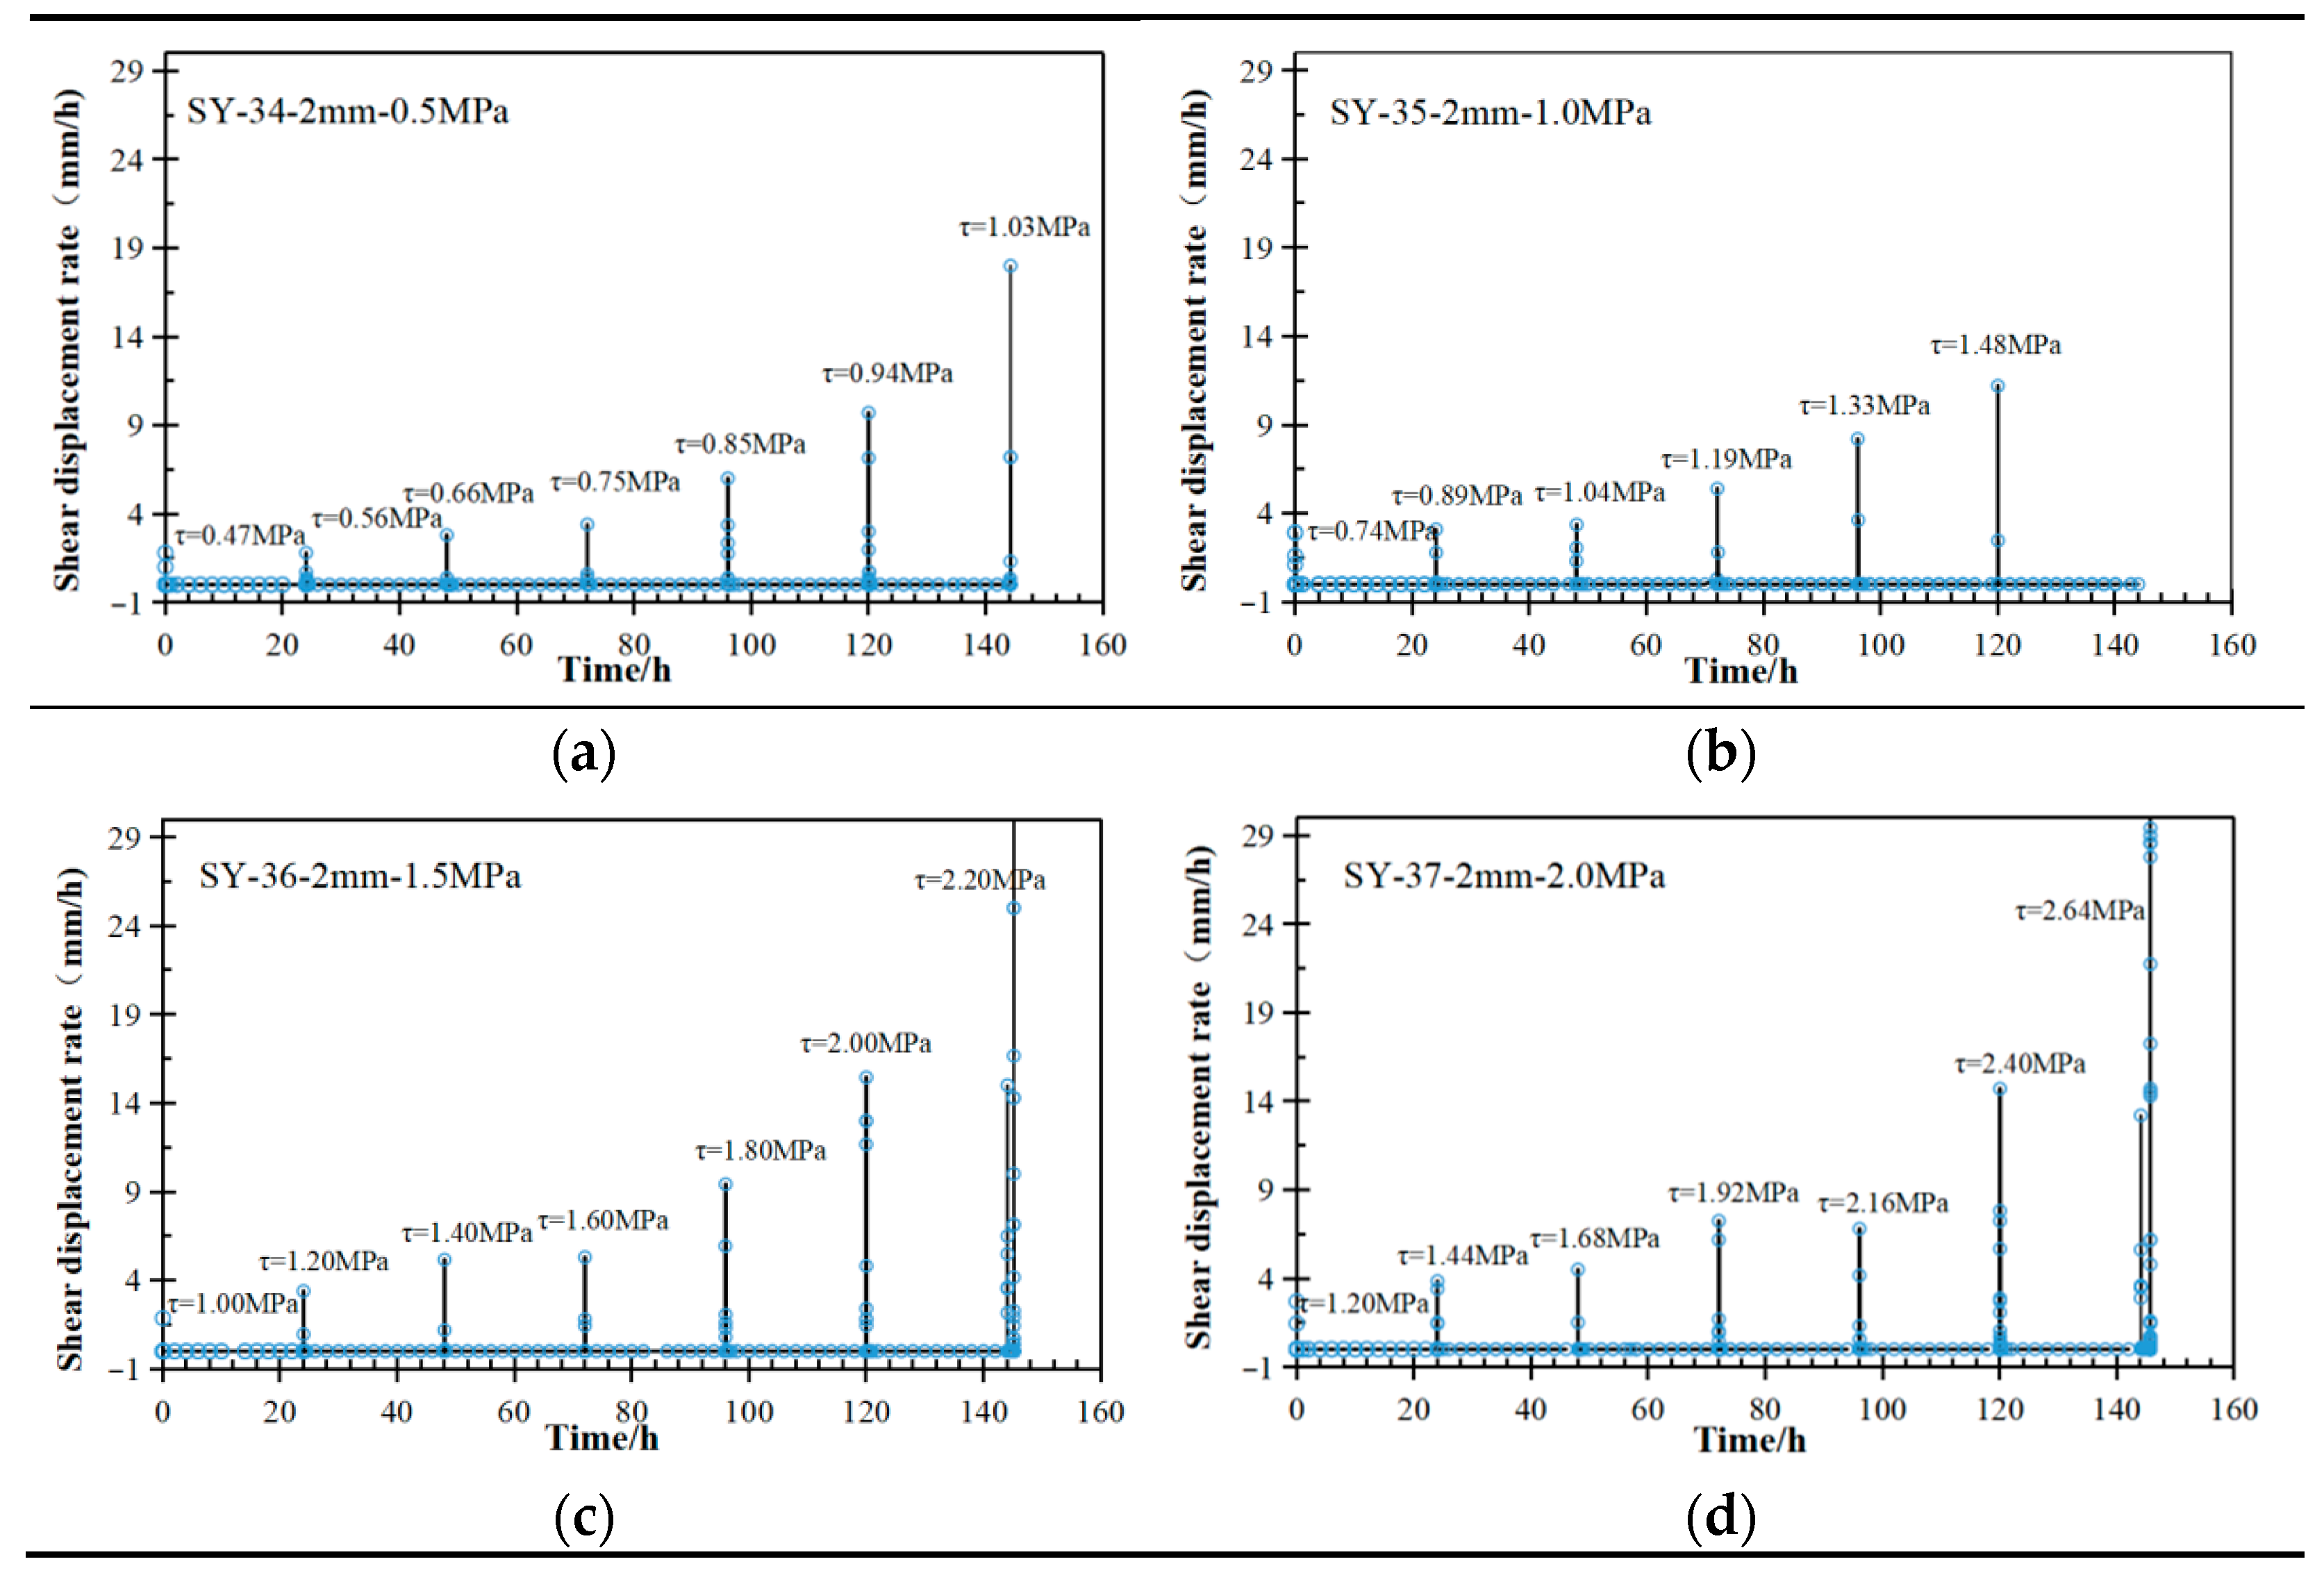
Processing the single-stage creep segments via Chen’s loading method and computing the rate as Δδt yielded the creep rate curves shown in Figure 12. Under each shear-stress level (τ), the creep rate decays from an initially elevated value through a rapid-decay stage and then approaches a near-zero steady state. For a given normal stress (σn), the initial creep rate increases with τ; however, the increment is small at the initial loading levels. Once the creep stress exceeds a threshold, the initial rate rises markedly. For example, in SY-34, the initial rates at the first four levels are nearly identical, whereas at τ = 0.85 MPa the value is 1.76 times that at τ = 0.75 MPa (Figure 12a). Comparable “jumps” occur in SY-35, SY-36, and SY-37 at τ = 1.33, 1.80, and 2.40 MPa, respectively (Figure 12b–d).
Comparisons across normal stresses indicate that the influence of σn on the creep rate is minor, with only small variations observed at the initial loading levels. At the final loading level, however, the effect becomes pronounced (except for SY-35): the time history of the creep rate assumes a U-shaped form, and increasing σn widens the low-rate (bottom) segment prior to failure, after which the displacement rate rises sharply. This U-shaped evolution indicates that the creep process undergoes a transition from an initial decelerating stage to a relatively stable stage, followed by an accelerated stage associated with progressive grout–rock interface degradation and imminent failure. Within this overall trend, some variability still exists among individual specimens. For the 2 mm grouting thickness, local nonuniformity in slurry distribution cannot be completely ruled out; such mesoscopic heterogeneity may be one possible factor contributing to the variation in creep rate evolution among specimens.
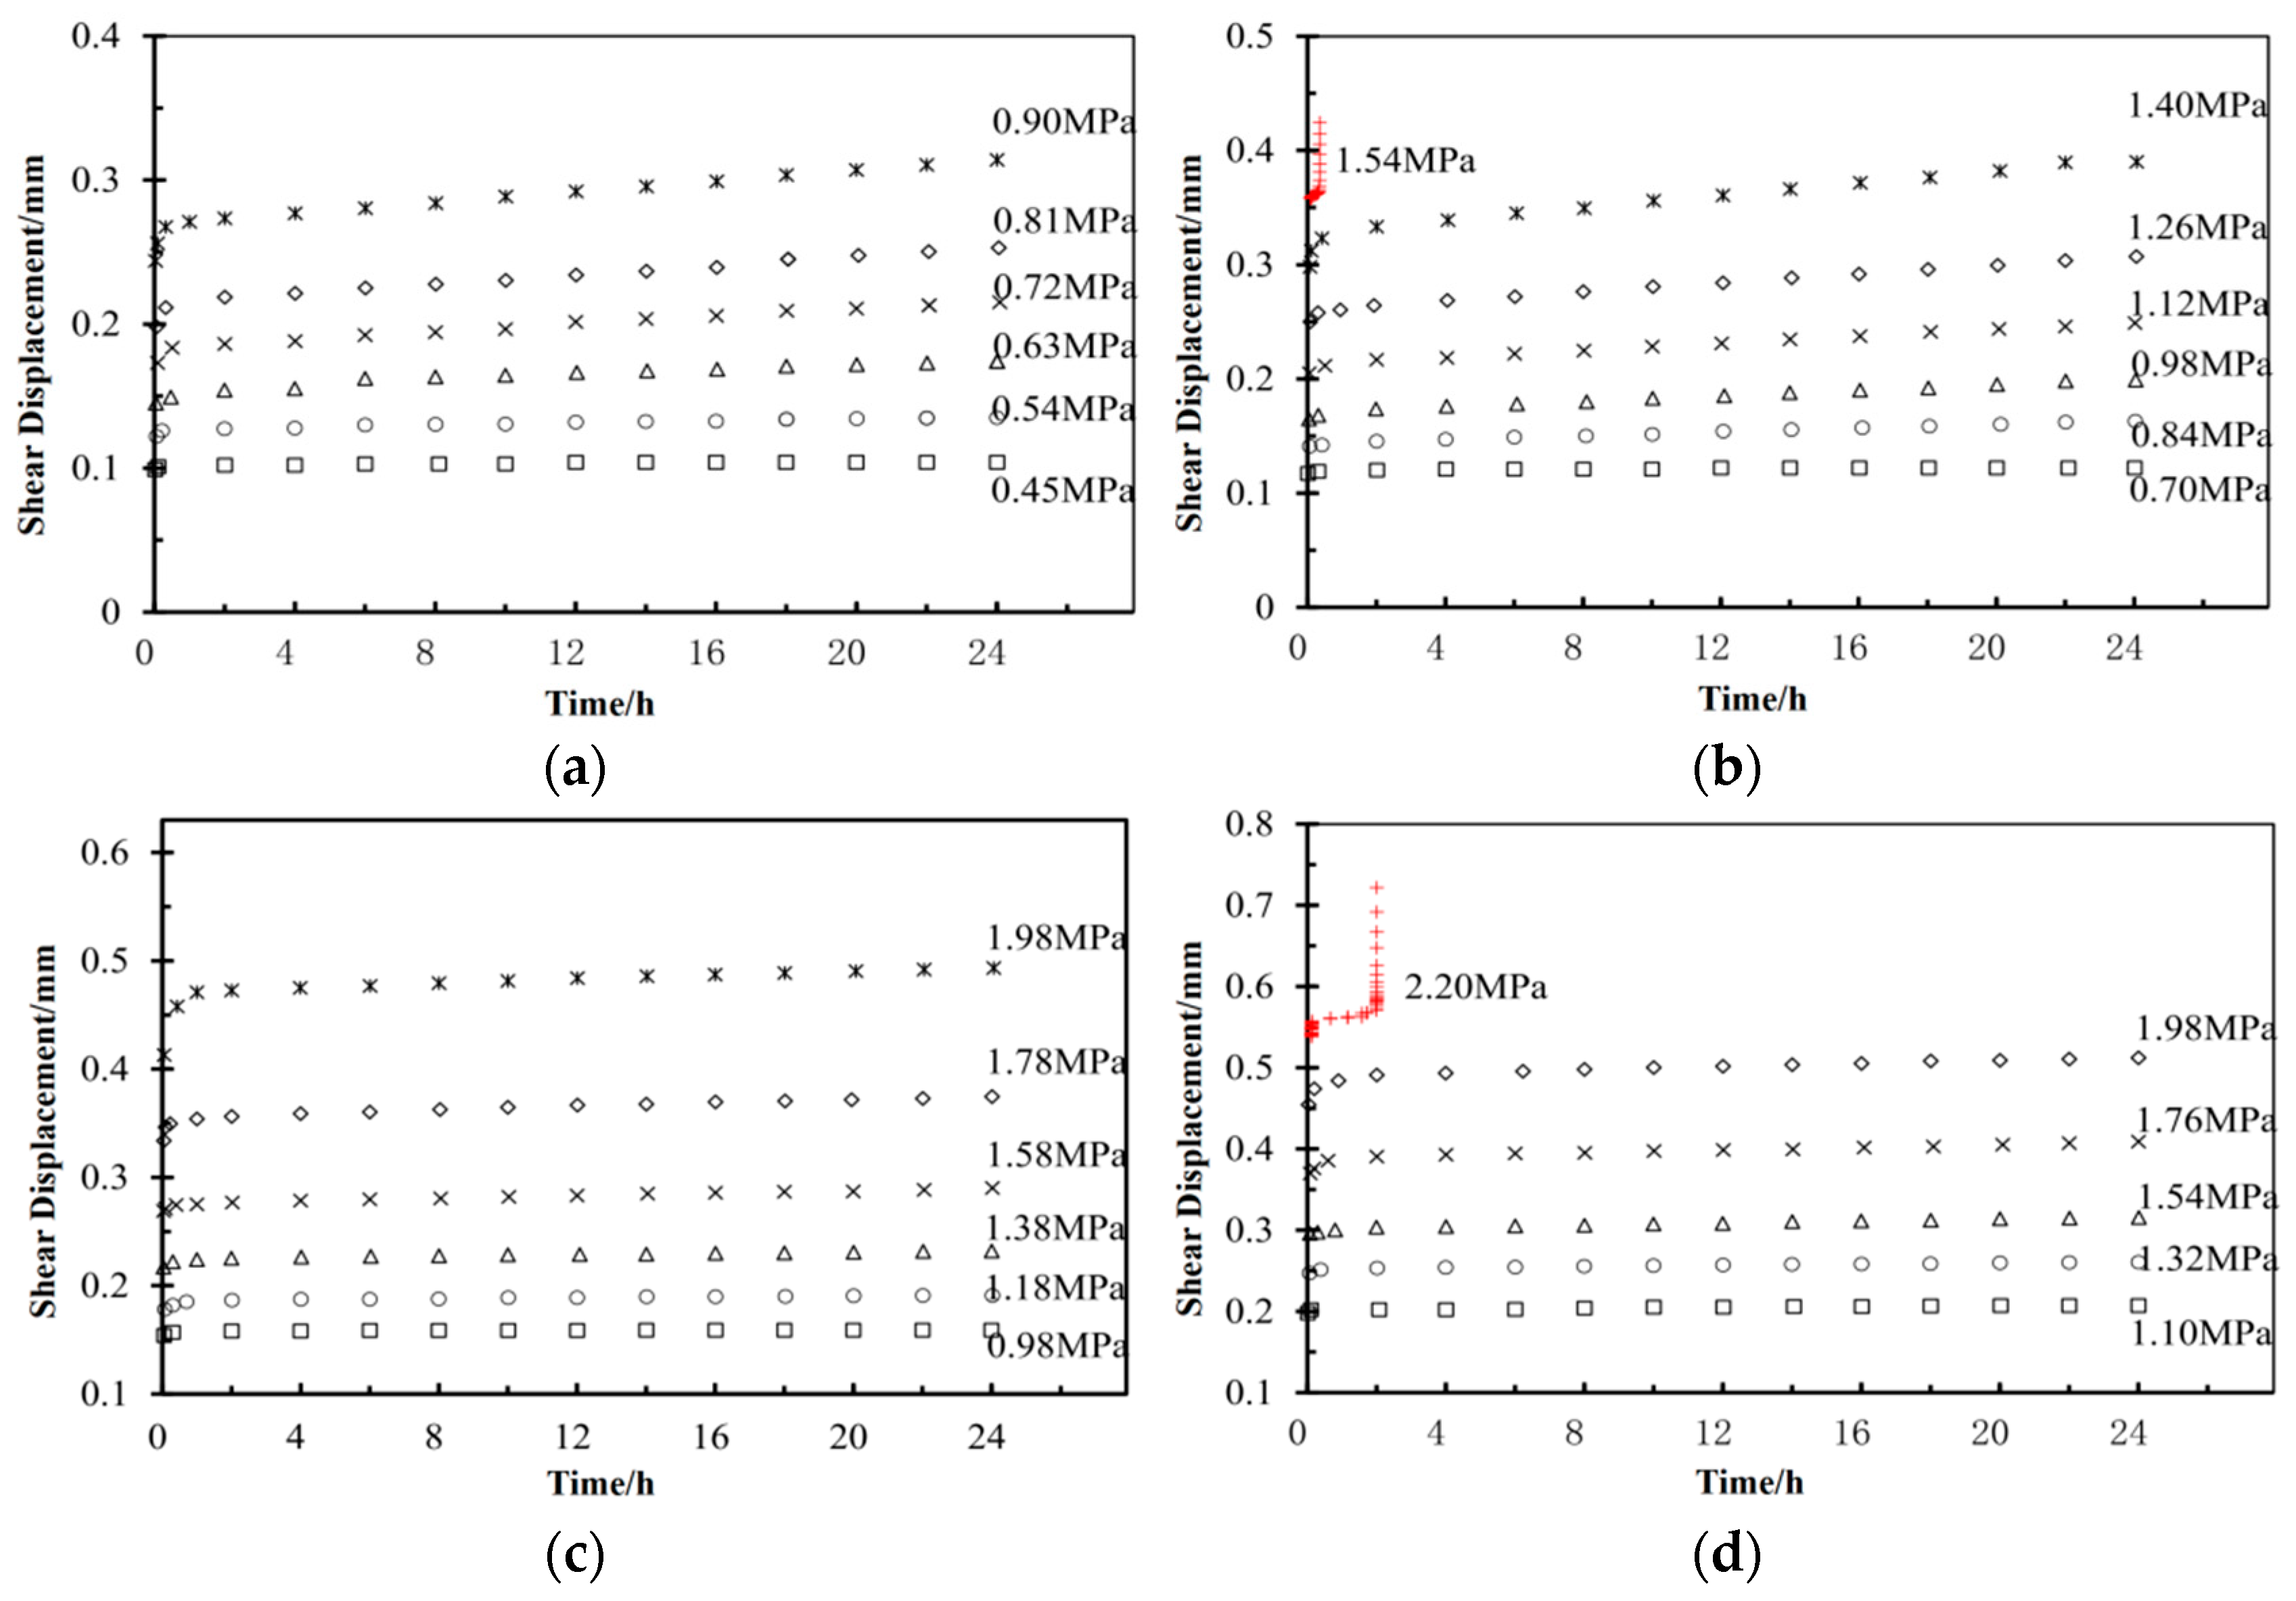
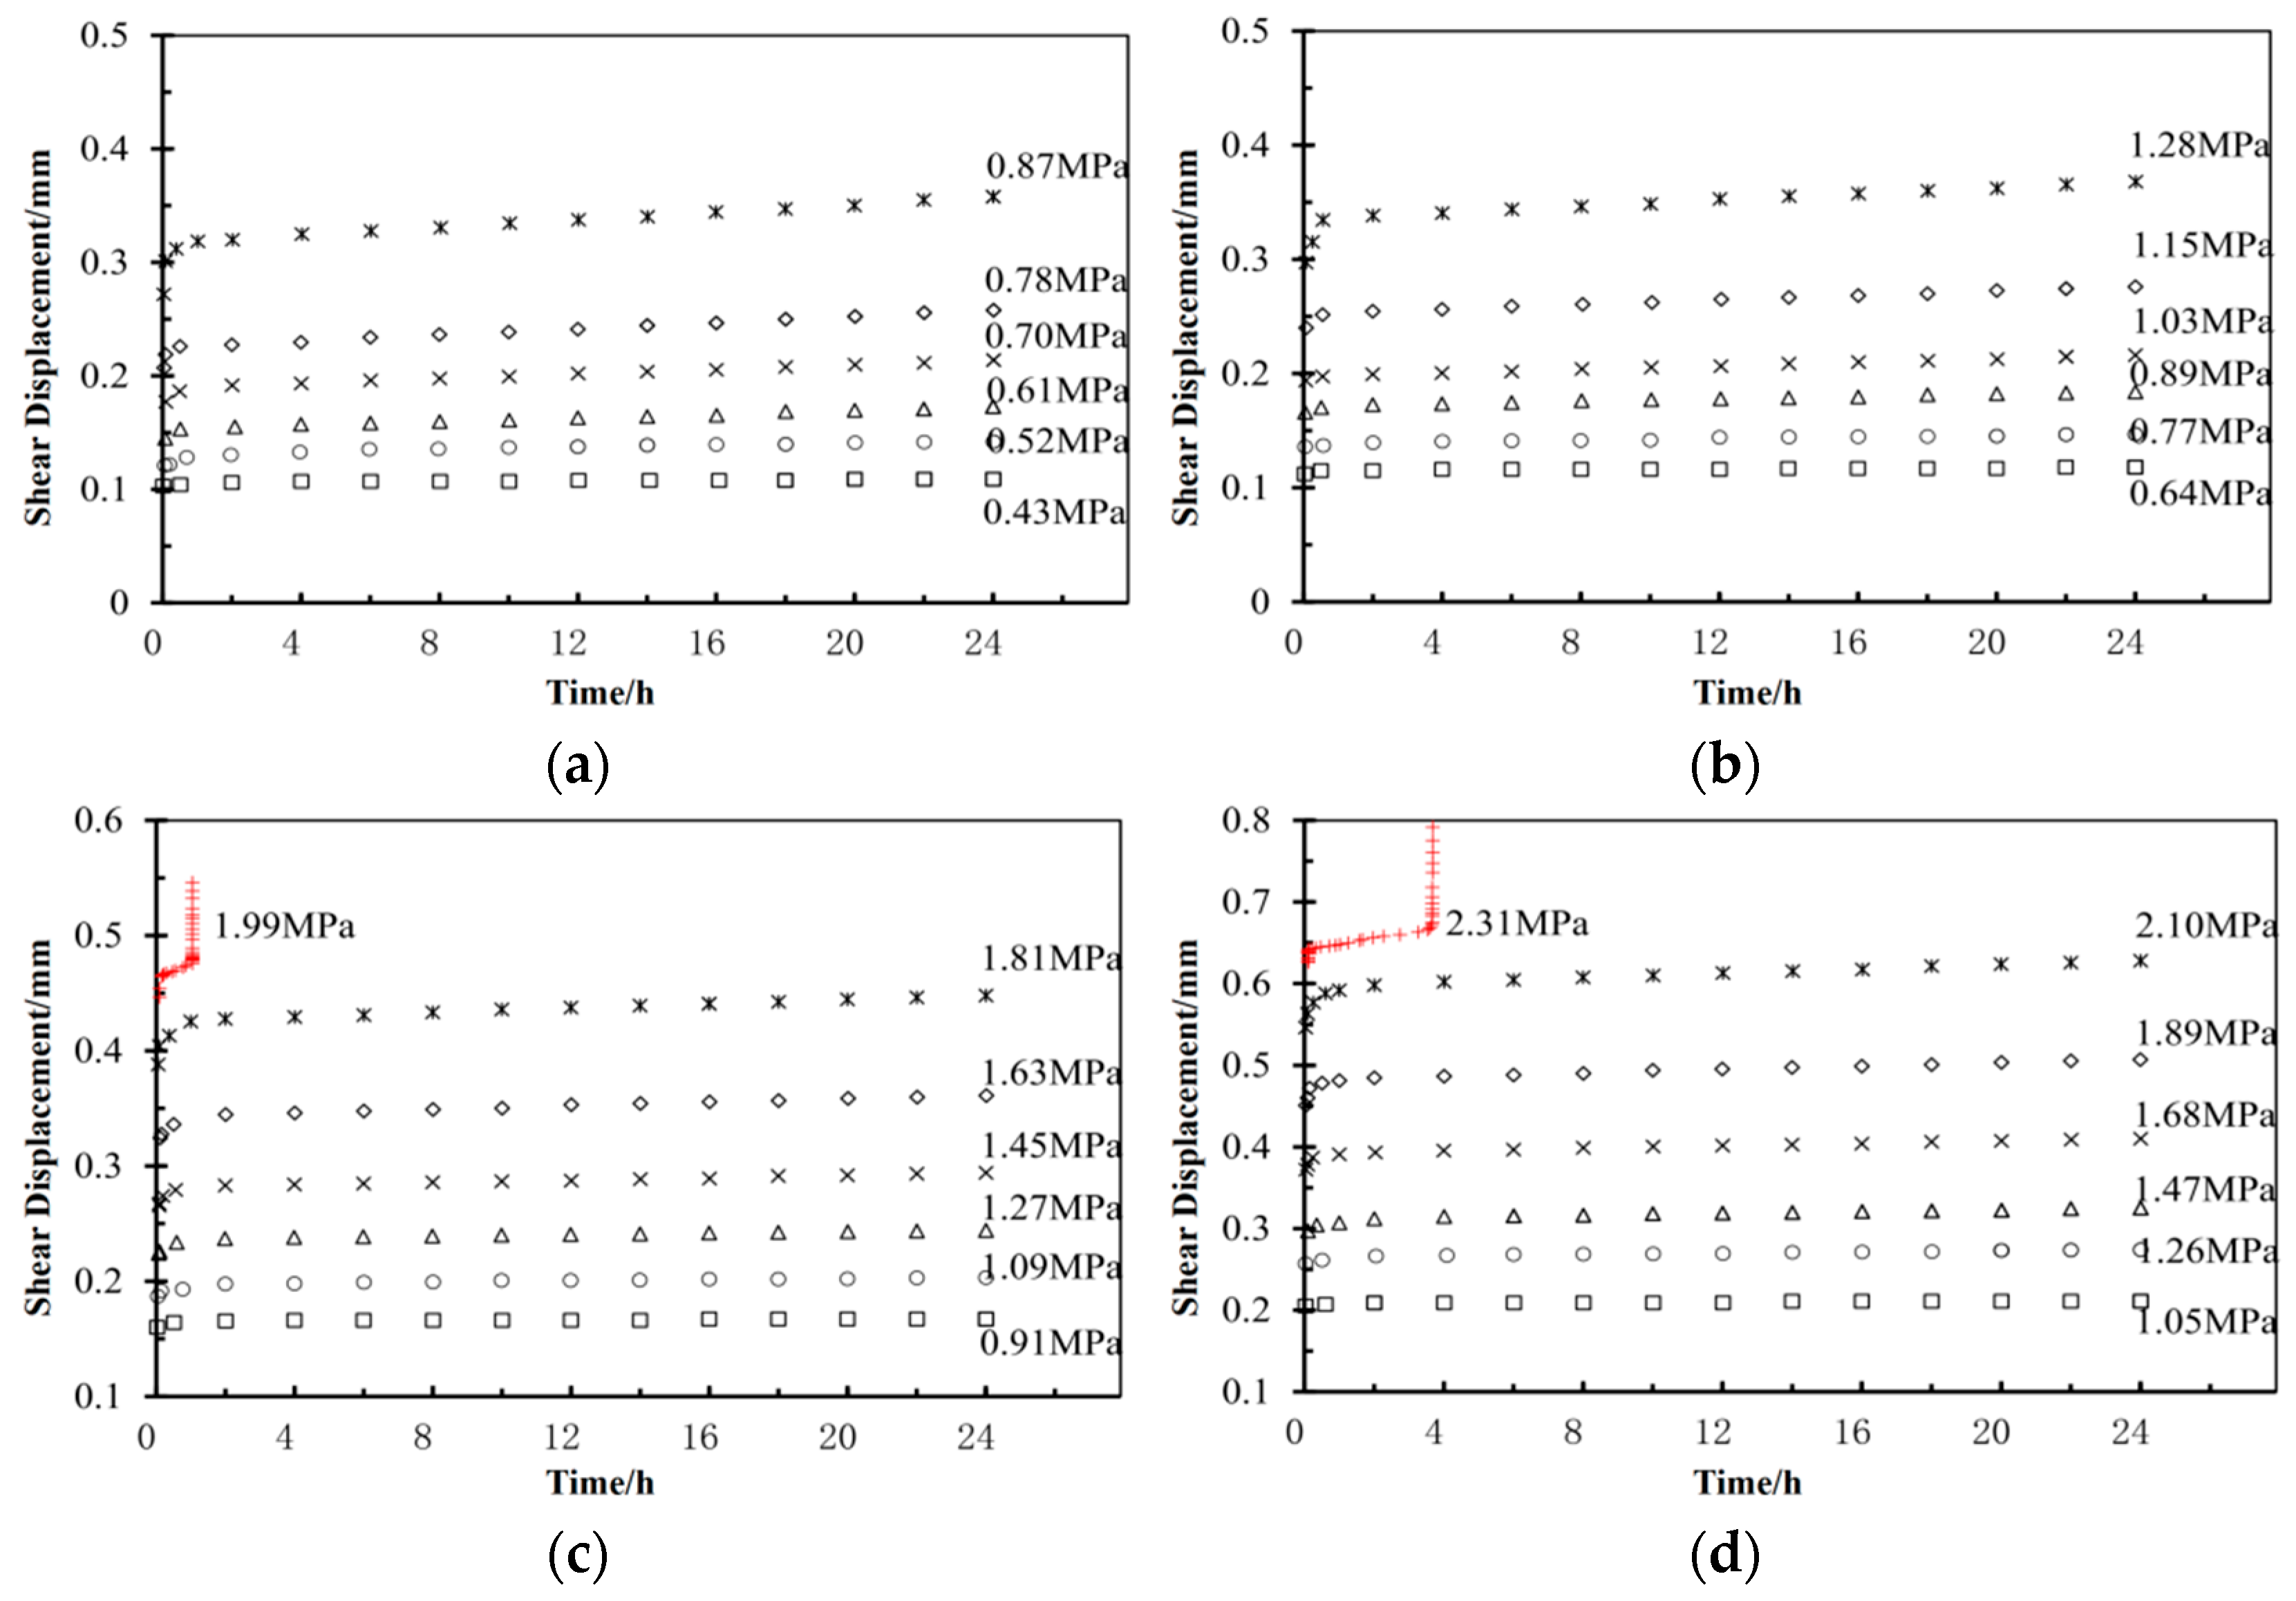
Since the specimens with grout thicknesses of 4.0 mm and 8.0 mm exhibited overall evolution patterns similar to those described above, their test phenomena and response processes are not discussed repeatedly here in the same level of detail. Their representative graded-loading creep curves and displacement evolution are still presented in the main text, as shown in Figure 13 and Figure 14. For data completeness, the detailed statistical results for all three grout thicknesses at each loading stage are compiled in Appendix A Table A1, Table A2 and Table A3 and are used as the basis for the subsequent comparative analysis of failure characteristics.
It should be noted that the present study focuses on the macroscopic creep response of the grouted sandstone structural plane as a composite system, without separately quantifying the individual contributions of grout body creep and grout–rock interface creep. In addition, due to the limited number of specimens in each group and the absence of parallel repeated tests, the present results are better interpreted as revealing the overall evolution trends and comparative characteristics under different grout thicknesses, rather than statistically definitive quantitative relationships. Further targeted interface/grout testing and verification based on larger sample sets will be needed in future work.

3.4. Long-Term Strength and the Influence of Grouting Thickness

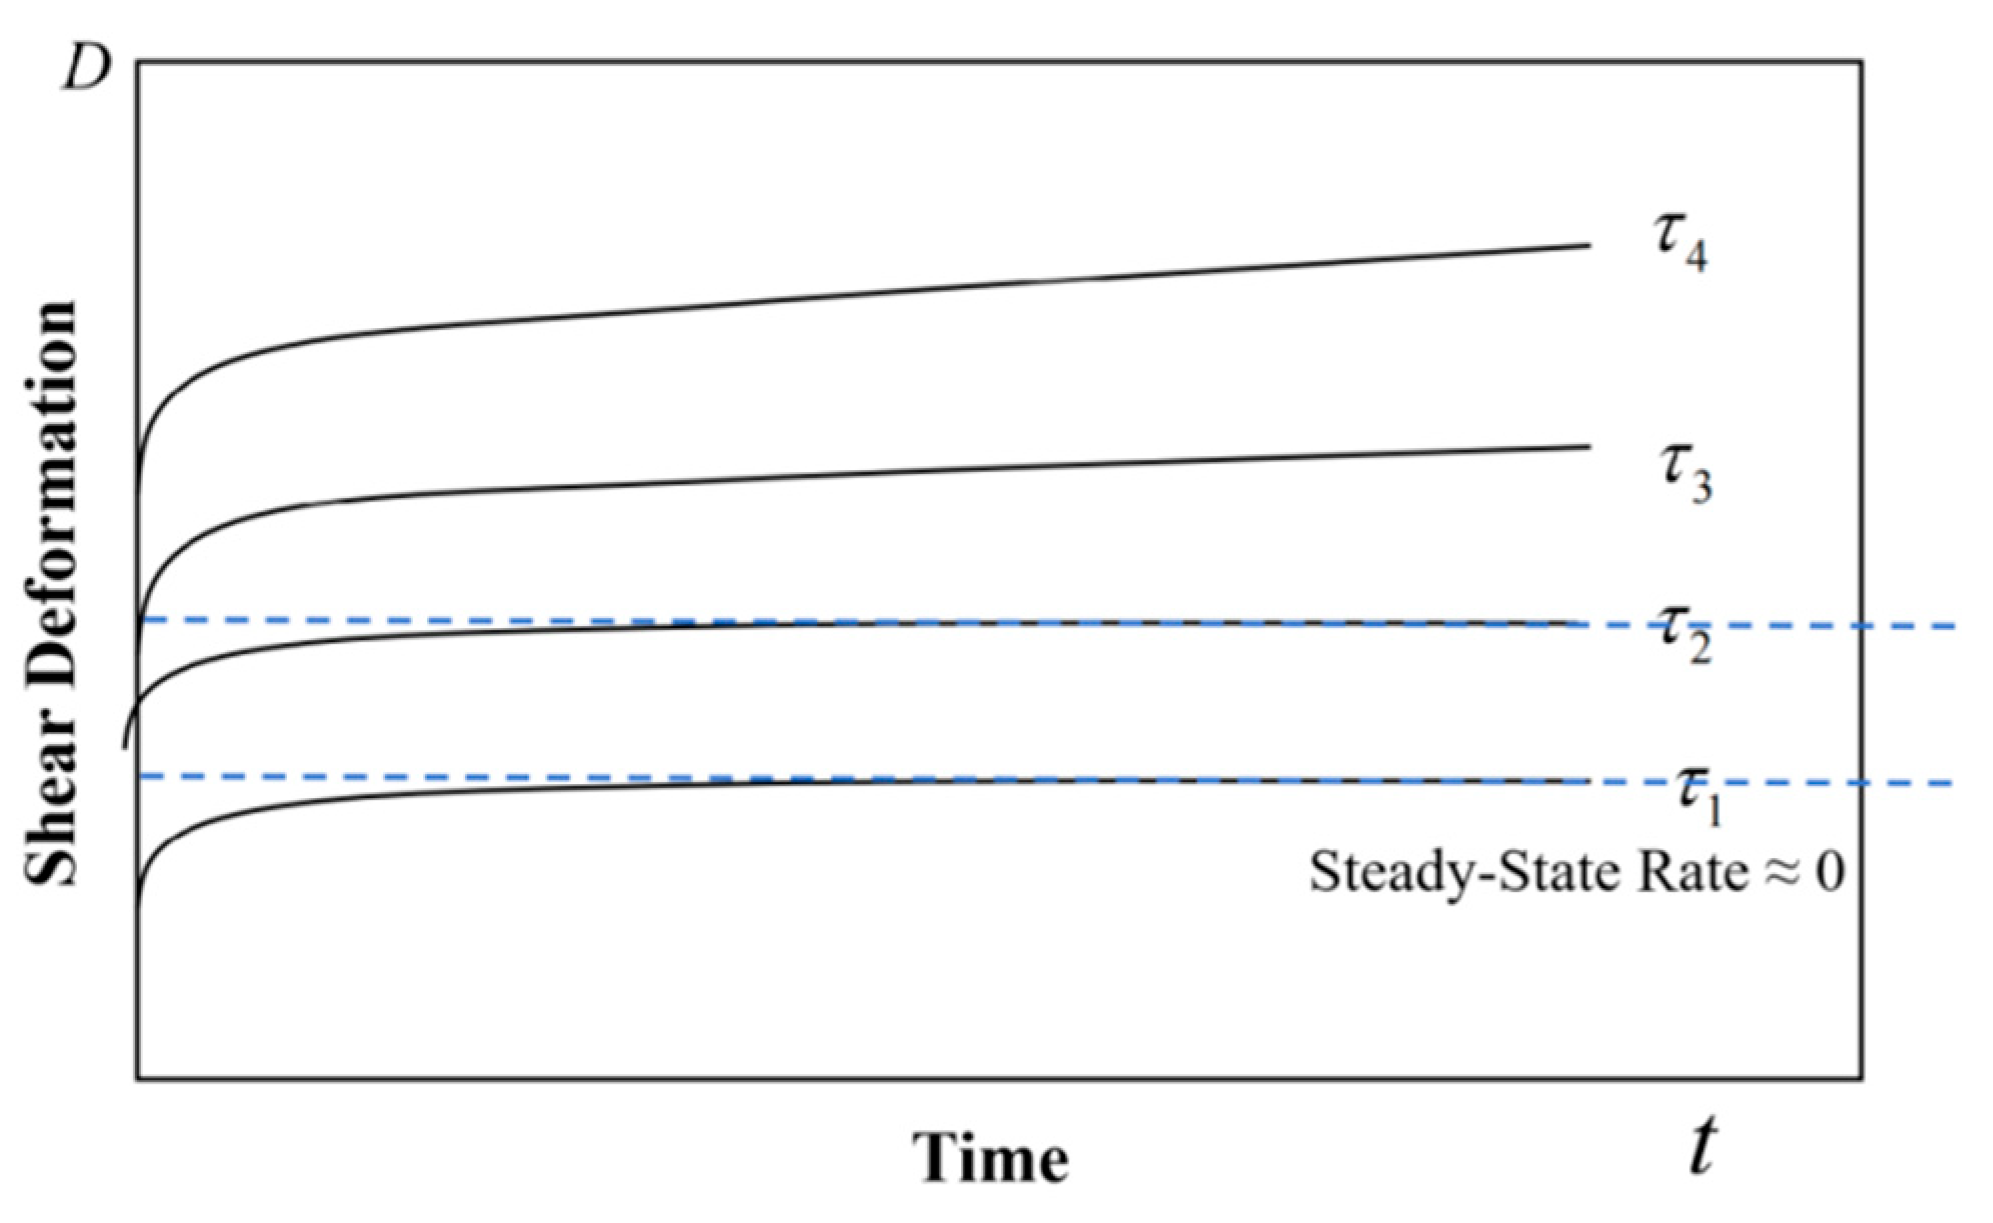
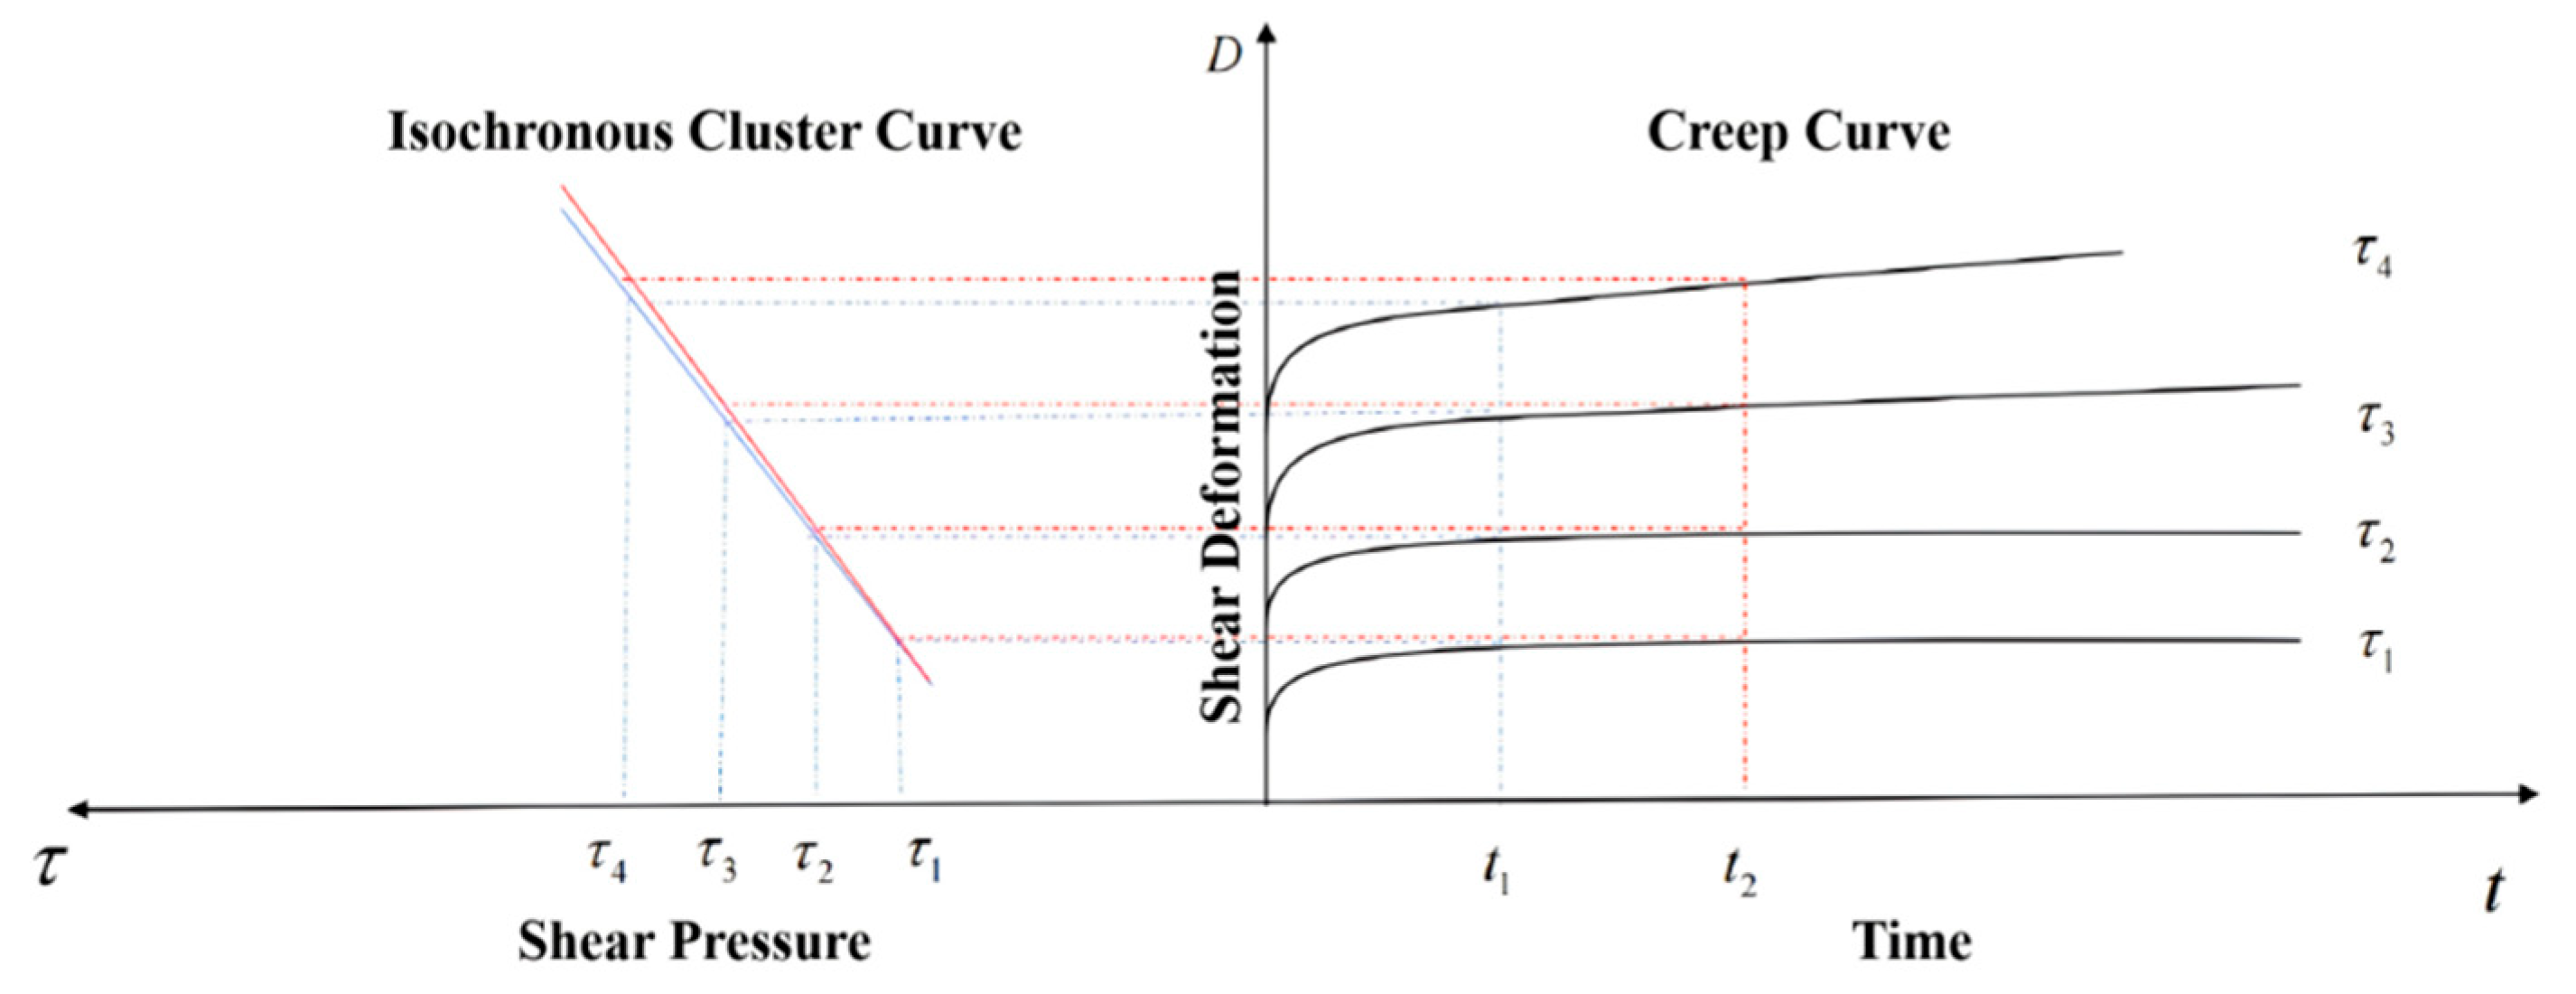
The long-term strength of grouted structural planes was determined using two approaches: the transition creep method (where long-term strength is defined as the maximum applied stress corresponding to a zero steady-state creep rate, Figure 15) and the isochronous curve method (based on the correspondence among shear stress, displacement, and time, Figure 16). For comparison, the theoretical peak strength of structural planes with different roughness levels, both before and after grouting, was calculated using analytical formulas. The long-term strength values obtained from both methods were then compared with those of the ungrouted control group, and the results are summarized in Table 5.
From Table 5, it is evident that the long-term strength values obtained by the two methods are generally consistent. The transition creep method offers a more straightforward approach, as it identifies a range of long-term strength based on the steady-state creep rate. In contrast, the isochronous curve method provides a specific value, which closely matches the lower bound of the range determined by the transition creep method. This agreement demonstrates the good reliability of the isochronous curve approach.
The long-term strength obtained from the isochronous curve method is close to the lower bound of the interval derived from the transition creep method. For conservative evaluation, the isochronous curve estimate is therefore adopted as the reference in this study. In the ungrouted control group, the ratio of long-term to theoretical strength is 63–74%, consistent with Shen et al. [11], who reported 60–80% of the direct-shear strength.
Based on shear tests of structural planes with different fill ratios, long-term strength values under various normal stresses were determined (using the isochronous curve estimate as the reference). For a grout thickness of 2.0 mm, the ratio of long-term to theoretical strength is 74–82%, exceeding that of ungrouted planes. Grouting changes the contact state from rock–rock to rock–grout–rock, introducing additional cohesion at the interface; however, because the grout is intrinsically weaker than the rock, the mobilized frictional resistance is reduced. Under the combined action of these two mechanisms, the net effect is an increase in long-term strength at modest grout thickness.
As shown in Table 5, for 4.0 mm grout thickness, the ratio is 72–79%, whereas for 8.0 mm it decreases to 72–77%. Thus, increasing grout thickness leads to a gradual reduction in both peak and long-term shear strength, lowering the long-term-to-theoretical strength ratio. Overall, although grouting enhances long-term strength relative to ungrouted conditions, excessive grout thickness may induce strength reduction and should be carefully controlled in engineering applications.

4. Failure Modes and Mechanisms of Grouted Rock Structural Planes

4.1. Macroscopic Failure Modes and Contact Mechanisms

According to Sun Futing [48], the long-term shear strength of grouted marble is about 50% of its peak direct-shear strength. However, because the rock type, the definition of “peak strength,” and the experimental conditions differ from those in the present study, the two results are not directly comparable. In the present study, tests on grouted sandstone structural planes show that grouting increases the ratio of long-term strength to theoretical strength by about 10% under the investigated conditions, suggesting a positive contribution to both peak resistance and long-term stability.
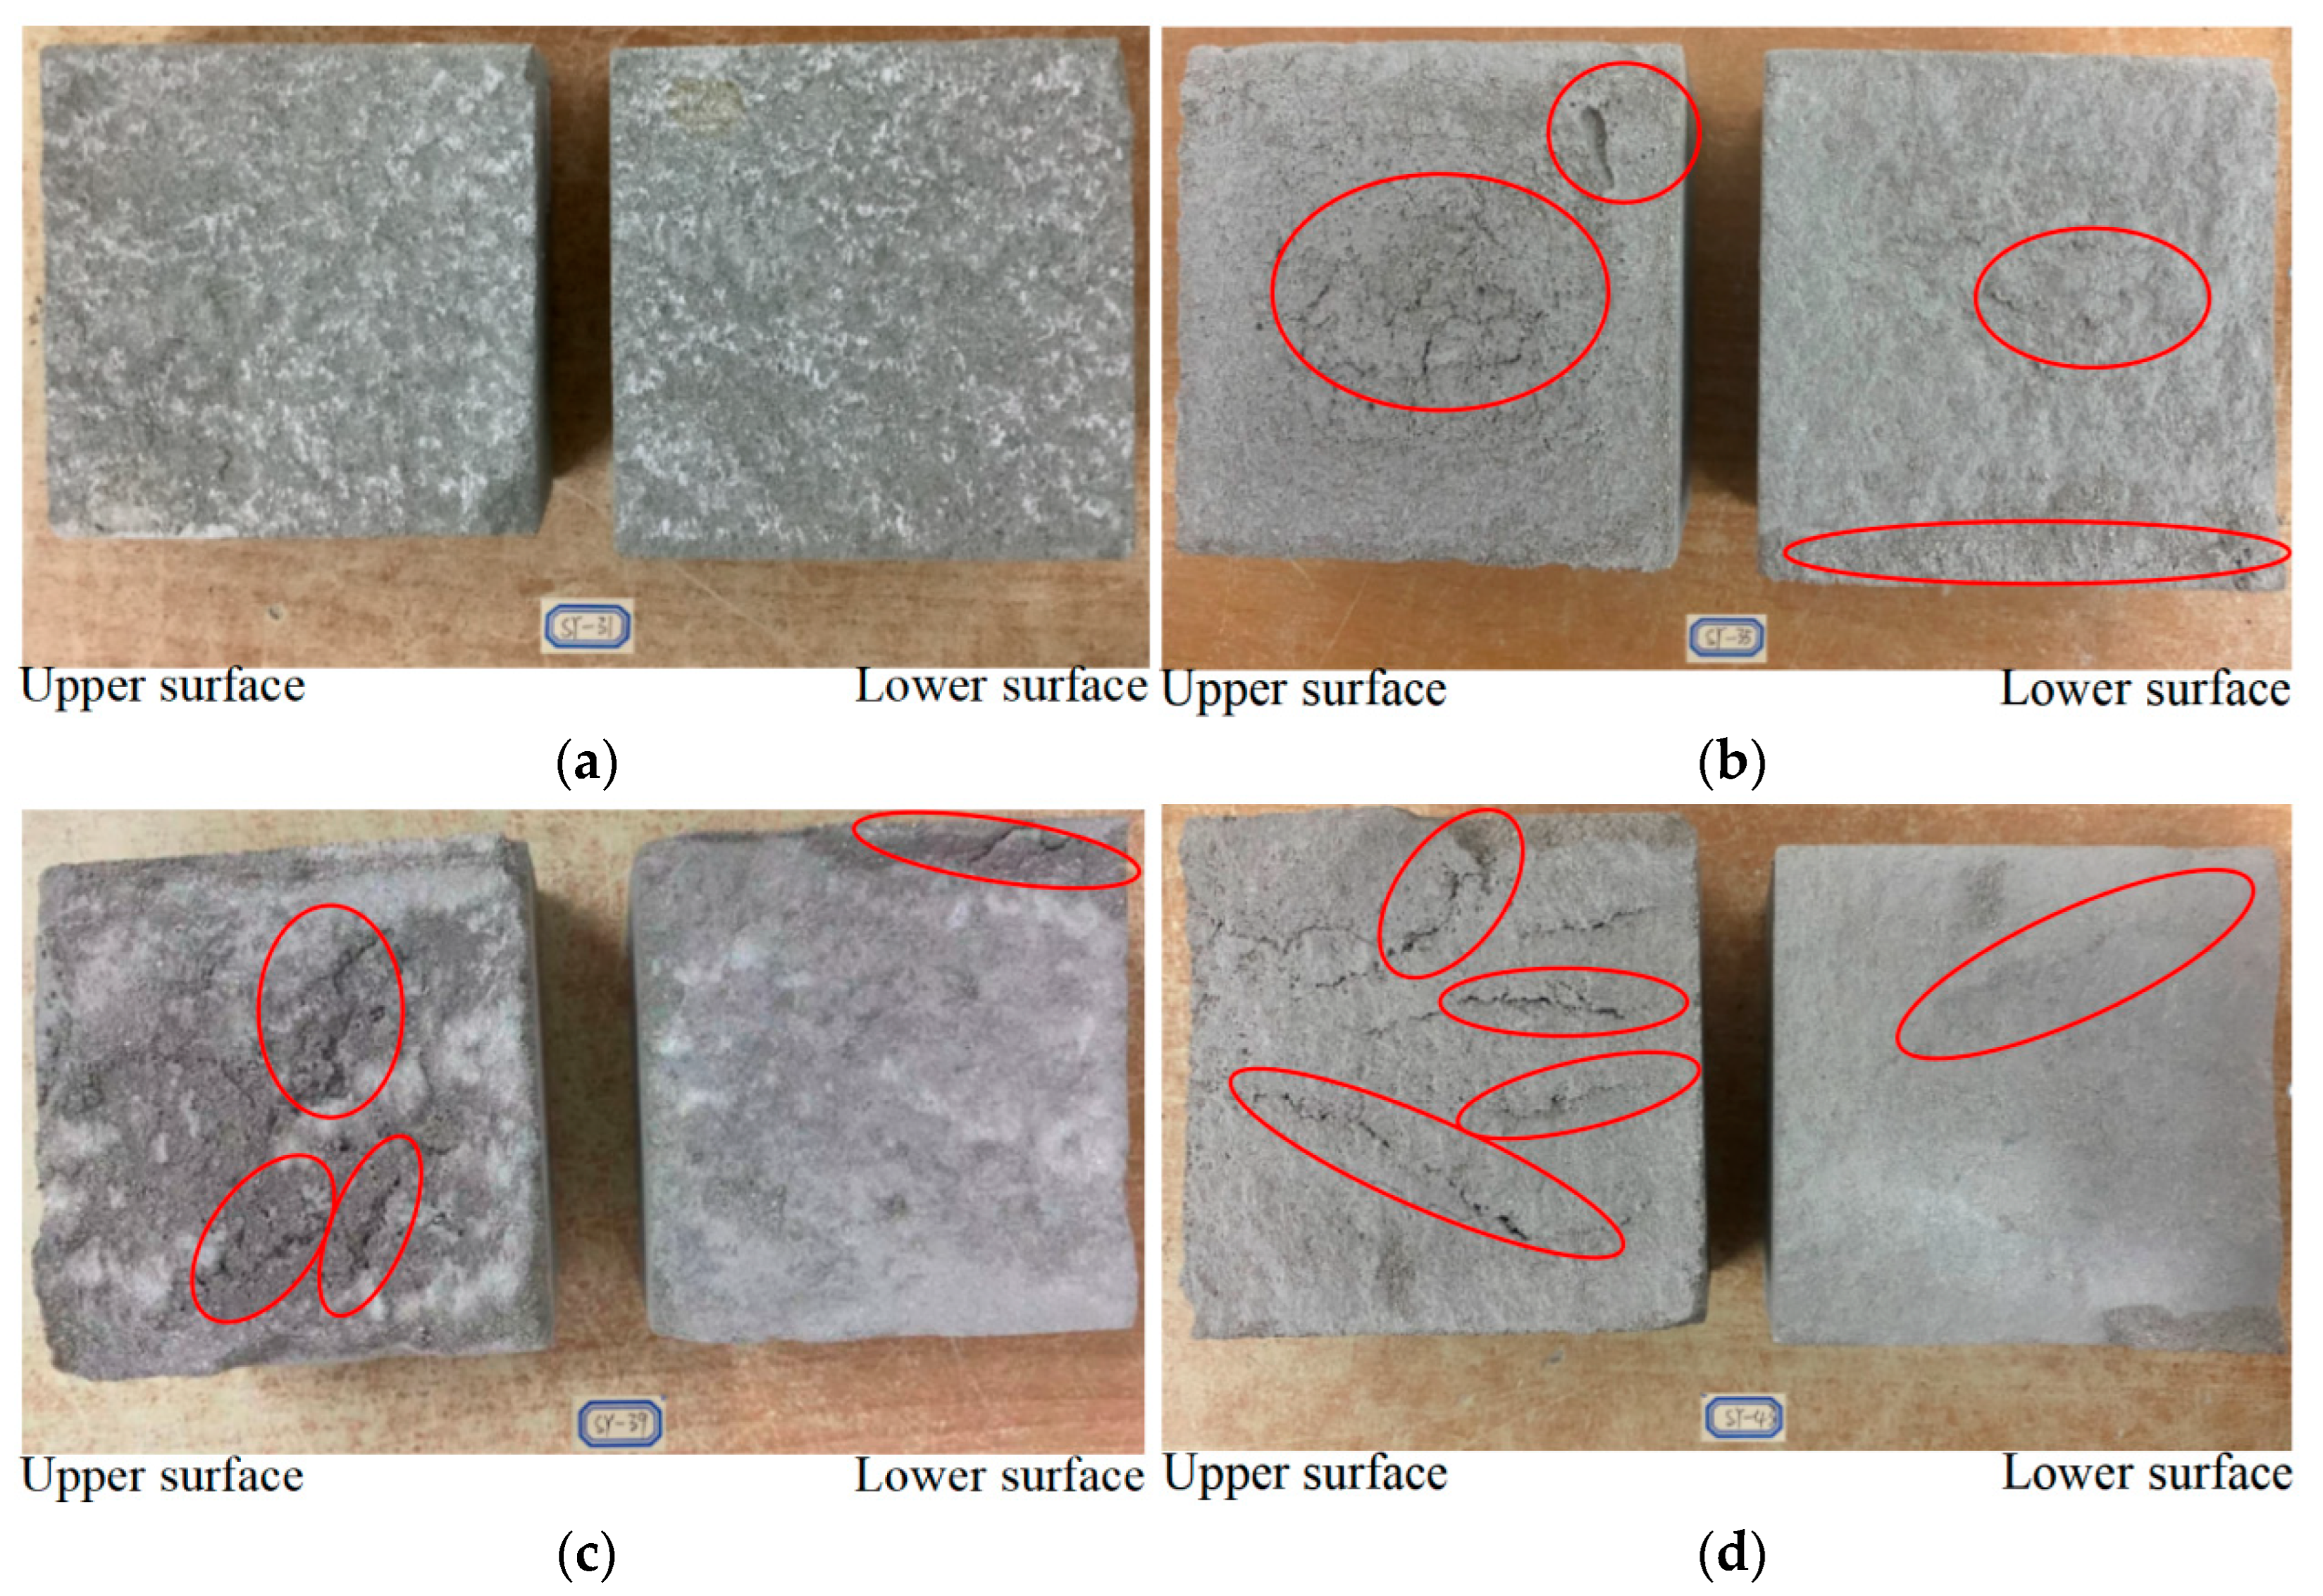
As illustrated in Figure 16, this improvement arises from macroscopic changes in contact conditions along the structural plane. In ungrouted specimens, the opposing surfaces are slightly misaligned and some asperities are missing; shear resistance is therefore governed by friction and asperity interlocking (Figure 17a). After grouting, the cementitious body bonds tightly to the rock, producing better-matched interfaces and adding cohesion at the grout–rock contact. The applied shear stress must consequently overcome both cohesion and friction to initiate failure (Figure 17b–d).
The role of grout thickness further modulates this effect. At 2.0 mm, bonding occurs mainly in the central upper region, with exposed rock along the edges and grout debris on the lower surface. At 4.0 mm (Figure 17c), the upper surface is fully coated and exhibits scratches and several cracks, while debris accumulates below. At 8.0 mm (Figure 17d), the coating is continuous, with deeper scratches and multiple cracks, and abundant fragments render the lower surface relatively smooth in plain view. These macroscopic observations indicate that grouting fundamentally alters the interface state of structural planes, thereby enhancing load-bearing capacity and long-term strength.

4.2. Micromechanical Mechanisms in Grouted Rock Structural Planes

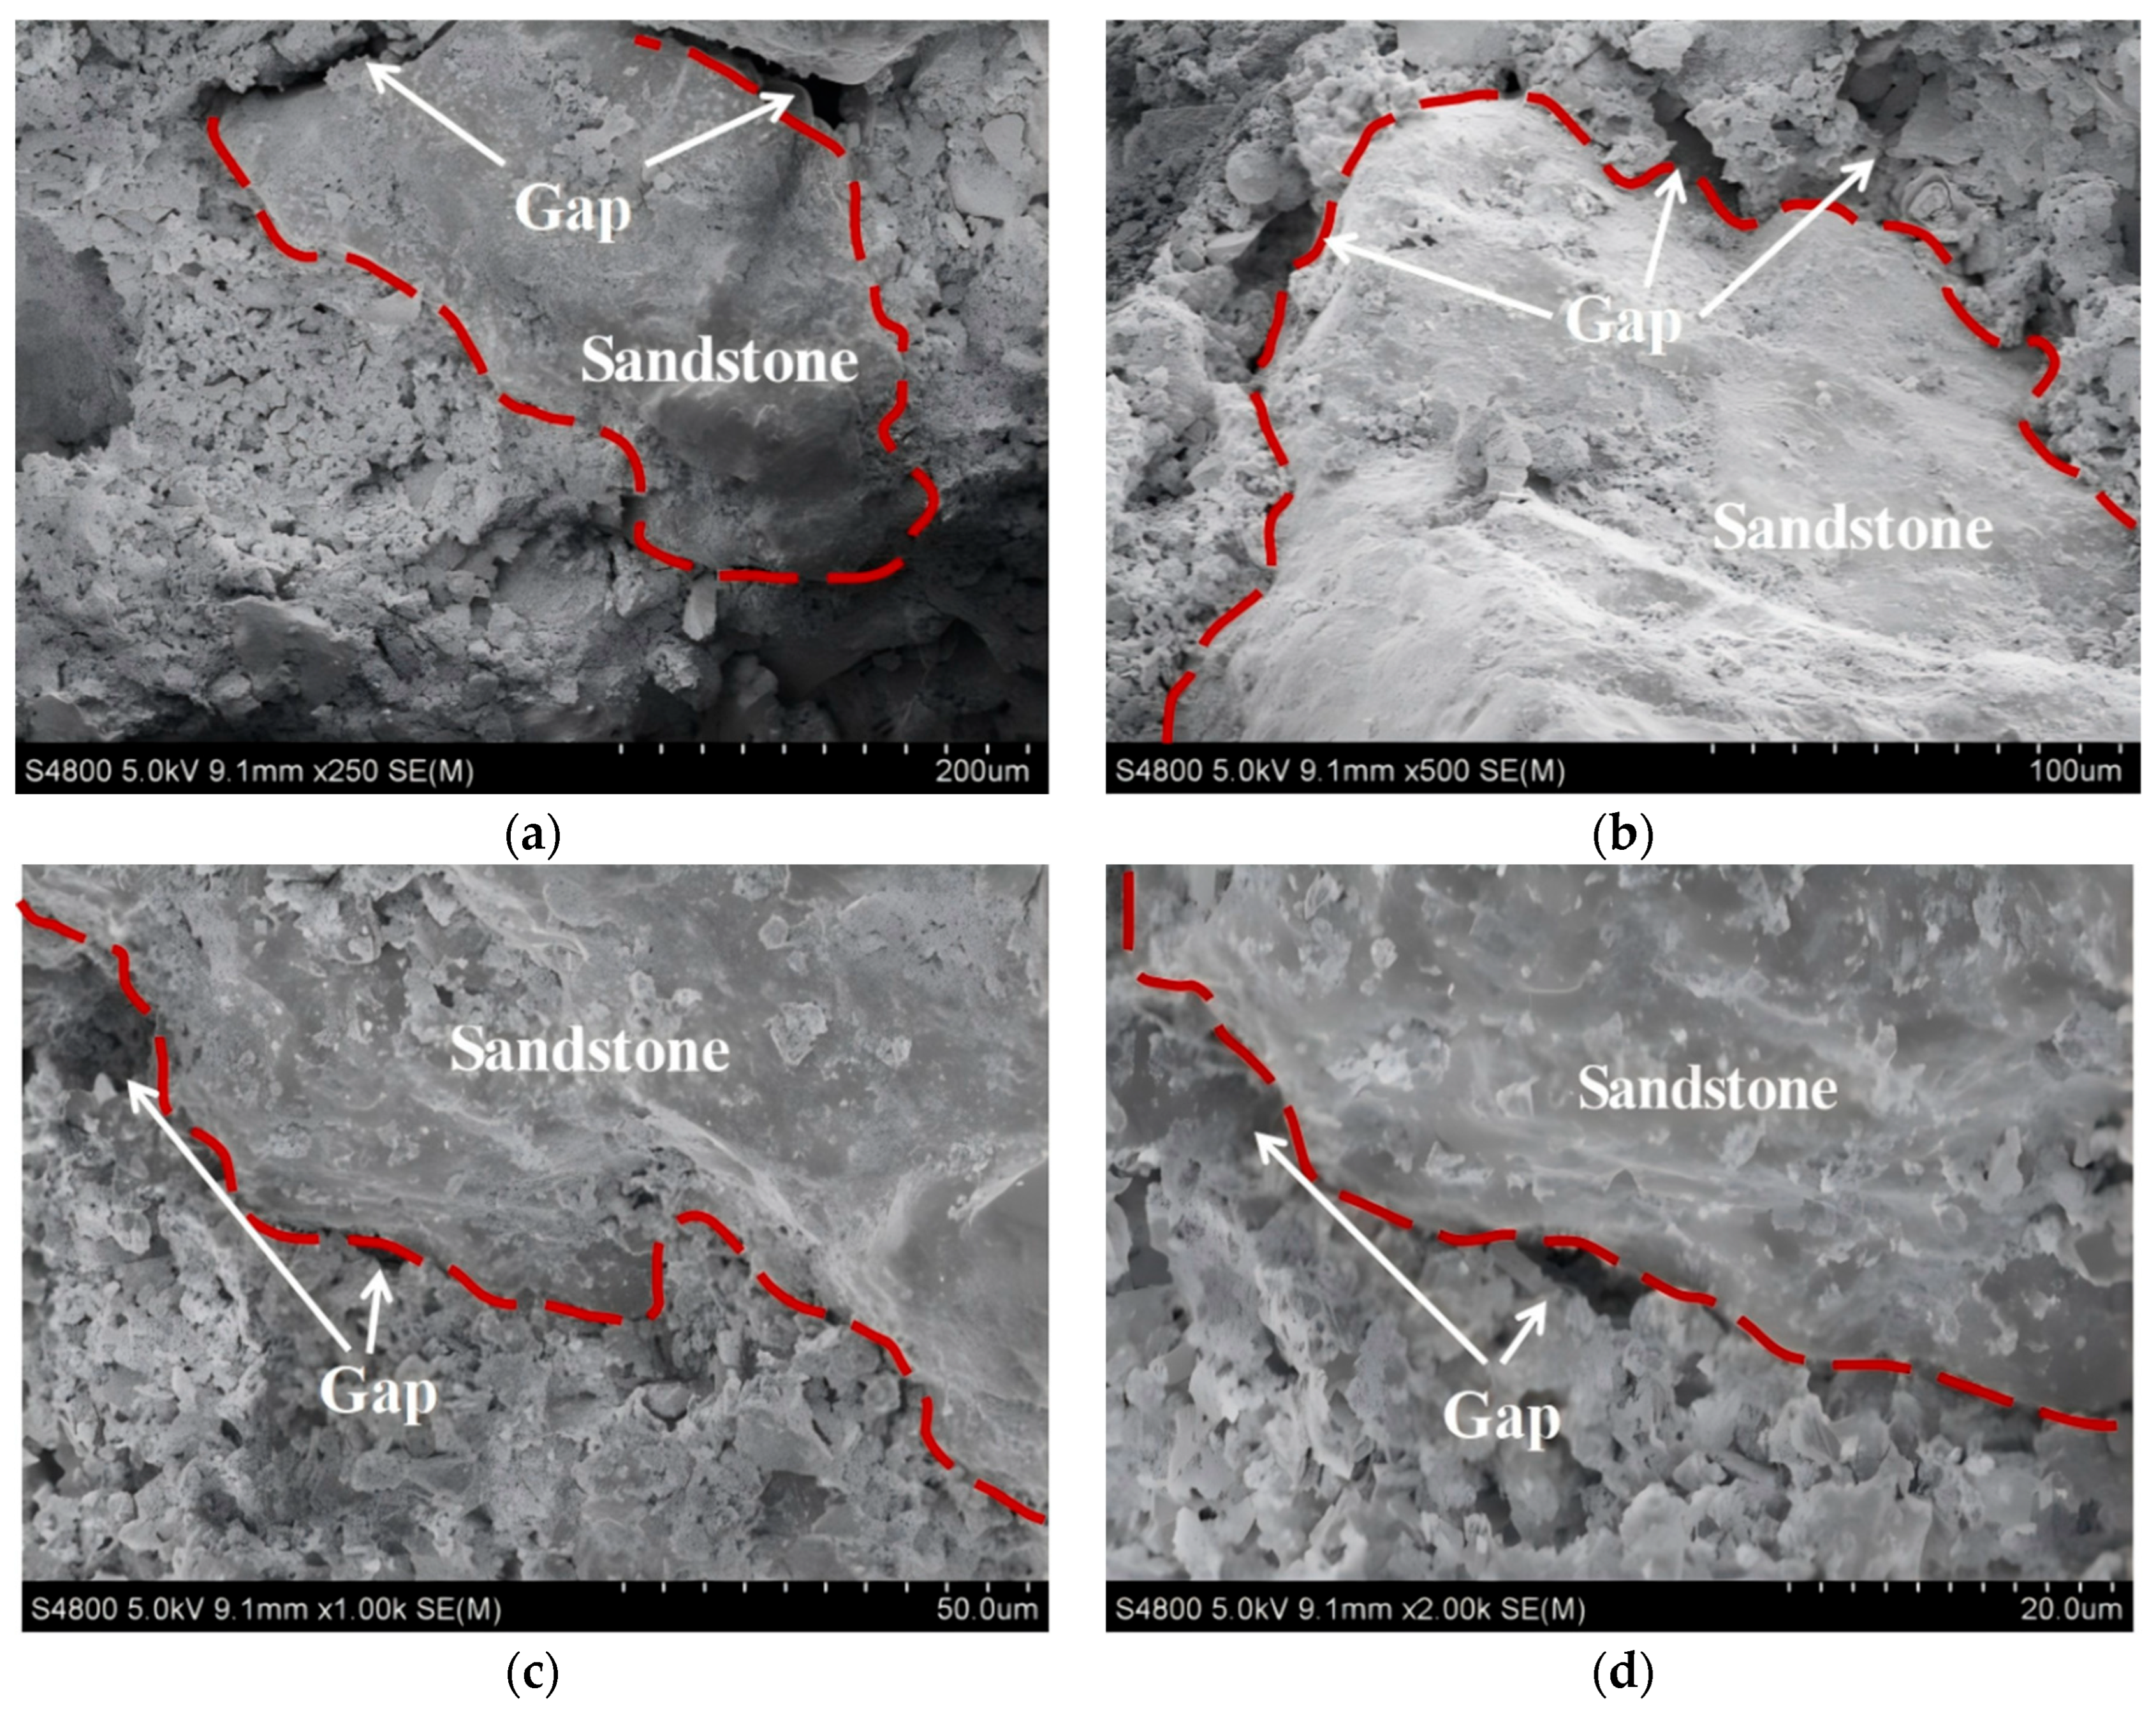
The shear creep failure of grouted sandstone structural planes is dominated by the grout–rock interface. As shown in the magnified microstructural images in Figure 18, numerous voids are distributed along the contact zone between the cementitious layer and the sandstone joint wall, far more abundant than internal defects within the grout. These voids act as weak points where stress is concentrated during long-term loading [49]. As shear stress increases, micro-cracks initiate at these sites, propagate along the interface, and eventually coalesce into macro-cracks, which explains why the interface becomes the preferential failure path over time.
The micro-voids at the grout–rock interface are primarily attributed to matrix shrinkage, insufficient wetting of rough asperities, and air entrapment during grouting. By disrupting bonding continuity and inducing local stress concentrations, these voids accelerate interfacial damage and promote the transition from micro-crack growth to macroscale debonding. From an engineering standpoint, their occurrence can be reduced through measures such as pre-wetting, the application of interface agents, pressure-grouting to remove trapped air, and the use of low-shrinkage or admixture-modified grout materials. Such practices enhance interface integrity and help delay the onset of accelerated creep, underscoring the need for strict interface quality control in grouting works.
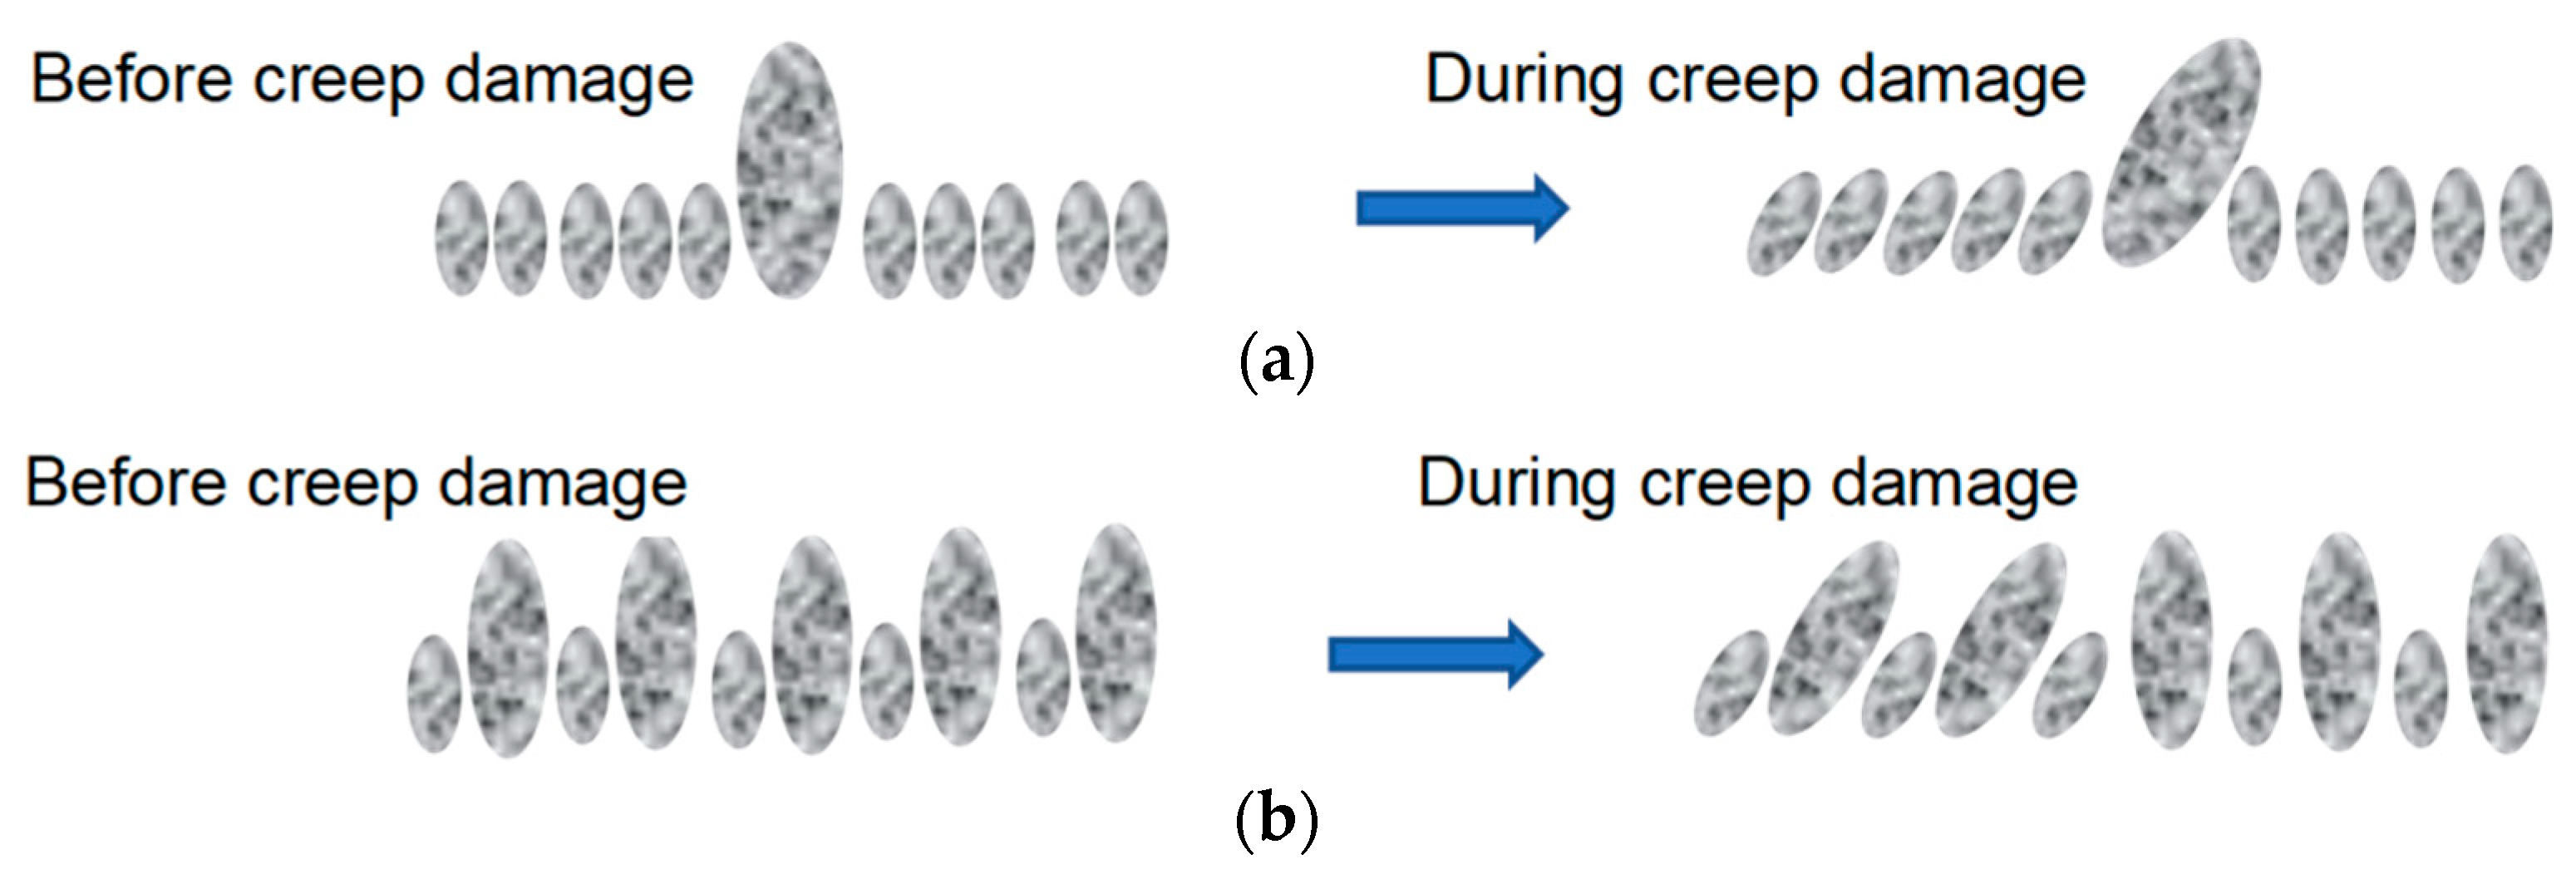
As schematically illustrated in Figure 19, the failure mechanisms of ungrouted and grouted samples are different. For ungrouted samples (Figure 19a), shear resistance mainly arises from asperity interlocking. Once the larger asperities are sheared off, the remaining smaller ones cannot sustain the stress, leading to abrupt failure after the stable creep phase. In contrast, grouted samples (Figure 19b) exhibit a different mechanism: the cementitious layer initially bonds tightly with the rock surface, and creep deformation involves progressive debonding at the grout–rock interface. Overcoming the combined effects of cohesion and friction delays failure, but once separation initiates, debonding propagates rapidly and produces an accelerated creep stage before final shear slip.
Thus, while grouting enhances the peak and long-term strength of structural planes, the long-term creep behavior is fundamentally constrained by the weakness of the grout–rock interface. The combined effects of interfacial voids, local stress concentration, and progressive crack (and coalescence) development form the essential micro-mechanism of creep failure in grouted sandstone structural planes.

5. Conclusions

This study systematically investigated the shear creep behavior and failure mechanisms of sandstone structural planes with and without grouting, based on controlled laboratory experiments and microscopic observations. The main conclusions are as follows.
(1)
The shear creep displacement of grouted structural planes shows limited sensitivity to grout thickness. For a given normal stress, the total displacement increases with increasing shear-stress level. Compared with the ungrouted control group under similar loading conditions, the grouted specimens generally exhibit larger total shear displacement.
(2)
Grouting was found to increase the ratio of long-term strength to theoretical strength by about 10%, thereby enhancing both peak strength and long-term stability. However, this benefit diminishes when the grouting thickness becomes excessive, highlighting the engineering need for optimized grouting design.
(3)
The creep rate evolution of grouted samples differs fundamentally from that of ungrouted ones. While ungrouted samples fail abruptly after the stable creep stage, about 60% of grouted samples display accelerated creep with a U-shaped rate curve, and higher normal stress prolongs the stable stage. This demonstrates the significant regulatory role of grouting in creep failure processes.
(4)
Grouting modifies the macroscopic failure modes of structural planes by shifting the failure surfaces from asperity-controlled slip to the grout–rock bonding interface. This change reveals the governing role of interface bonding conditions in long-term shear resistance.
(5)
At the microscale, voids and defects at the grout–rock interface concentrate stresses and lead to micro-crack initiation and propagation. These micro-cracks eventually evolve into macro-cracks and accelerate creep failure. Thus, the interface microstructure is the key factor controlling the long-term performance of grouted rock masses.
Overall, the present findings offer fresh evidence on the long-term durability of grouted rock masses subjected to sustained shear loading. They underscore that optimal grout thickness and high-quality interface bonding are pivotal parameters for achieving enhanced long-term strength and structural stability in underground construction materials and reinforcement applications.

6. Limitations and Future Work

The present study considers sandstone structural planes grouted with one cement-based mixture under a limited normal stress range, selected to represent a typical grouting reinforcement scenario in underground rock engineering. Therefore, the reported trends should be interpreted within this specific experimental context, and direct quantitative extrapolation to other rock types, grout materials, or highly confined deep underground environments should be made with caution. In addition, due to the limited number of specimens and the absence of parallel repeated tests, the current results are better regarded as revealing overall trends and comparative characteristics rather than statistically definitive quantitative relationships. Future work should include broader validation under wider material and stress conditions, together with the development of predictive creep constitutive models for grouted structural planes.

Author Contributions

Conceptualization, W.D. and D.Z.; methodology, W.D., F.L. and D.Z.; software, F.L.; validation, F.L., Q.Z. and C.G.; formal analysis, F.L.; investigation, F.L.; resources, C.G. and D.Z.; data curation, F.L.; writing—original draft preparation, F.L.; writing—review and editing, W.D., Q.Z., C.G. and D.Z.; visualization, F.L.; supervision, W.D.; project administration, W.D.; funding acquisition, W.D. All authors have read and agreed to the published version of the manuscript.

Funding

This research was funded by the Major Science and Technology Special Program of the Yunnan Provincial Department of Science and Technology, grant number 202302AD080007, and the National Key Research and Development Program of China, grant number 2023YFB3711605.

Data Availability Statement

The original contributions presented in this study are included in the article. Further inquiries can be directed to the corresponding author.

Acknowledgments

The authors would like to thank all the reviewers and editors for their valuable comments and efforts in handling this manuscript.

Conflicts of Interest

There are no competing financial interests or personal relationships that could have appeared to influence the work reported in this paper.

Appendix A

To maintain the conciseness of the main text, the detailed statistical results of the graded-loading creep tests for specimens with different grout thicknesses are compiled in the Appendix A. Table A1, Table A2 and Table A3 present the displacement statistics at each loading stage for grout thicknesses of 2.0 mm, 4.0 mm, and 8.0 mm, respectively, thereby providing complete data support for the interpretation in the main text and the subsequent comparative analysis of failure characteristics.
Table A1. Statistical summary of graded-loading creep displacements at a grouting thickness of 2.0 mm.
Number SY-xxNormal Stress/MPaCreep Stress/MPaTotal Displacement/mmInstantaneous Displacement/mmCreep Displacement/mmCreep/Total%
340.50.470.1090.1020.0076.42
0.560.1370.1250.0128.76
0.660.1670.1470.02011.98
0.750.2120.1800.03215.09
0.850.2610.2180.04316.48
0.940.3160.2510.06520.57
351.00.740.1280.1210.0075.47
0.890.1610.1460.0159.32
1.040.1980.1700.02814.14
1.190.2290.1940.03515.28
1.330.2820.2380.04415.60
1.480.3580.2980.06016.76
361.51.000.1590.1500.0095.66
1.200.2120.1980.0146.60
1.400.2470.2270.0208.10
1.600.2900.2580.03211.03
1.800.3570.3110.04612.89
2.000.4560.3870.06915.13
372.01.200.2230.2150.0083.59
1.440.2600.2470.0135.00
1.680.3190.3010.0185.64
1.920.3860.3530.0338.55
2.160.4870.4450.0428.62
2.400.5980.5410.0579.53
Table A2. Statistical summary of graded-loading creep displacements at a grouting thickness of 4.0 mm.
Number SY-xxNormal Stress/MPaCreep Stress/MPaTotal Displacement/mmInstantaneous Displacement/mmCreep Displacement/mmCreep/Total%
380.50.450.1040.0990.0054.81
0.540.1350.1220.0139.63
0.630.1740.1450.02916.67
0.720.2150.1730.04219.53
0.810.2530.1980.05521.74
0.900.3140.2440.07022.29
391.00.700.1220.1170.0054.10
0.840.1630.1410.02213.50
0.980.1990.1650.03417.09
1.120.2490.2050.04417.67
1.260.3070.2500.05718.57
1.400.3900.2980.11423.59
401.50.980.1590.1540.0053.14
1.180.1910.1780.0136.81
1.380.2320.2170.0156.47
1.580.2910.2690.0227.56
1.780.3750.3340.04110.93
1.980.4950.4130.08216.57
412.01.100.2070.1980.0094.35
1.320.2610.2470.0145.36
1.540.3160.2960.0206.33
1.760.4090.3700.0399.54
1.980.5120.4540.05811.33
Table A3. Statistical summary of graded-loading creep displacements at a grouting thickness of 8.0 mm.
Number SY-xxNormal Stress/MPaCreep Stress/MPaTotal Displacement/mmInstantaneous Displacement/mmCreep Displacement/mmCreep/Total%
420.50.430.1090.1030.0065.50
0.520.1420.1210.02114.79
0.610.1730.1450.02816.18
0.700.2140.1770.03717.29
0.780.2560.2070.04919.14
0.870.3580.2720.08624.02
431.00.640.1180.1120.0065.08
0.770.1470.1360.0117.48
0.890.1840.1660.0189.78
1.030.2160.1940.02210.19
1.150.2760.2400.03613.04
1.280.3680.2930.07520.38
441.50.910.1670.1600.0074.19
1.090.2030.1870.0167.88
1.270.2440.2240.0208.20
1.450.2940.2650.0299.86
1.630.3610.3240.03710.25
1.810.4480.3880.06013.39
452.01.050.2110.2050.0062.84
1.260.2740.2570.0176.20
1.470.3240.2970.0278.33
1.680.4100.3720.0389.27
1.890.5070.4510.05611.05
2.100.6280.5460.08213.06

References

  1. Wu, L.Z.; Li, B.; Huang, R.Q.; Sun, P. Experimental Study and Modeling of Shear Rheology in Sandstone with Non-Persistent Joints. Eng. Geol. 2017, 222, 201–211. [Google Scholar] [CrossRef] [Scilit]
  2. Lyu, C.; Liu, J.; Ren, Y.; Liang, C.; Liao, Y. Study on Very Long-Term Creep Tests and Nonlinear Creep-Damage Constitutive Model of Salt Rock. Int. J. Rock Mech. Min. Sci. 2021, 146, 104873. [Google Scholar] [CrossRef] [Scilit]
  3. Zhu, L.; Wang, L.; Zheng, L.; Xie, N.; Wang, C.; Sun, Z.; Wang, C.; Wu, S.; Fan, B. Shear Creep Characteristics and Creep Constitutive Model of Bolted Rock Joints. Eng. Geol. 2023, 327, 107368. [Google Scholar] [CrossRef] [Scilit]
  4. Xu, T.; Xu, Q.; Tang, C.; Ranjith, P.G. The Evolution of Rock Failure with Discontinuities Due to Shear Creep. Acta Geotech. 2013, 8, 567–581. [Google Scholar] [CrossRef] [Scilit]
  5. Jia, C.J.; Xu, W.Y.; Wang, R.B.; Wang, S.S.; Lin, Z.N. Experimental Investigation on Shear Creep Properties of Undisturbed Rock Discontinuity in Baihetan Hydropower Station. Int. J. Rock Mech. Min. Sci. 2018, 104, 27–33. [Google Scholar] [CrossRef] [Scilit]
  6. Frenelus, W.; Peng, H.; Zhang, J. Creep Behavior of Rocks and Its Application to the Long-Term Stability of Deep Rock Tunnels. Appl. Sci. 2022, 12, 8451. [Google Scholar] [CrossRef] [Scilit]
  7. Griggs, D. Creep of Rocks. J. Geol. 1939, 47, 225–251. [Google Scholar] [CrossRef] [Scilit]
  8. Langer, M. Rheological Behaviour of Rock Masses. Int. J. Rock Mech. Min. Sci. Geomech. Abstr. 1981, 18, 5–6. [Google Scholar] [CrossRef] [Scilit]
  9. Ding, X.; Liu, J.; Liu, X. Experimental Study on Creep Behaviors of Hard Structural Plane in TGP s Permanent Lock Regions. J. Yangtze River Sci. Res. Inst. 2000, 8, 30–33. [Google Scholar]
  10. Ding, X.; Liu, J.; Bai, S.; Sheng, Q.; Xu, P. Study on Numerical Simulation of Structure Effects of Rock Mass Creep. Chin. J. Rock Mech. Eng. 2006, 25, 3642–3649. [Google Scholar]
  11. Shen, M.; Zhu, Y. Testing Study on Creep Characteristic of Regularly Dentate Discontinuity. Chin. J. Rock Mech. Eng. 2004, 23, 223–226. [Google Scholar]
  12. Tu, G.X. Evaluation of Long-Term Stability of Zipingpu Hydropower Station Spillway Slope During Operation Period. Master’s Thesis, Chengdu University of Technology, Chengdu, China, 2005. [Google Scholar]
  13. Jiang, Y.; Xu, W.; Wang, R.; Wang, R.; Zhang, Z. Experimental Study of Rheological Mechanical Properties of Arch Dam Abutment Rock and Its Long-Term Stability Analysis. Chin. J. Rock Mech. Eng. 2010, 29, 3699–3709. [Google Scholar]
  14. Wang, Z.; Shen, M.; Tian, G.; Zhang, Q. Time-Dependent Strength of Rock Mass Discontinuity with Different Values of JRC. Chin. J. Rock Mech. Eng. 2017, 36, 3287–3296. [Google Scholar]
  15. Li, R.-J.; Ji, F.; Feng, W.-K.; Wang, D.-P.; Zhang, J.-M. Shear Creep Characteristics and Constitutive Model of Hidden Non-Persistent Joints. Chin. J. Geotech. Eng. 2019, 41, 2253–2261. [Google Scholar]
  16. Zhu, Q.; Yin, Q.; Tao, Z.; He, M.; Zheng, B.; Jing, H.; Ren, S.; Zhang, Q.; Meng, B.; Bai, D.; et al. Shear Mechanical Properties and Frictional Sliding Responses of Rough Joint Surfaces under Dynamic Normal Displacement Conditions. J. Cent. South Univ. 2024, 31, 2393–2410. [Google Scholar] [CrossRef] [Scilit]
  17. Sun, F.T.; She, C.X.; Li, K. Research on Creep Property of Cement Grouted Joint. Adv. Mater. Res. 2011, 243, 2819–2824. [Google Scholar] [CrossRef] [Scilit]
  18. Meng, F.; Chen, R.; Kang, X. Effects of Tunneling-Induced Soil Disturbance on the Post-Construction Settlement in Structured Soft Soils. Tunn. Undergr. Space Technol. 2018, 80, 53–63. [Google Scholar] [CrossRef] [Scilit]
  19. Bian, X.; Hu, H.; Zhao, C.; Ye, J.; Chen, Y. Protective Effect of Partition Excavations of a Large-Deep Foundation Pit on Adjacent Tunnels in Soft Soils: A Case Study. Bull. Eng. Geol. Environ. 2021, 80, 5693–5707. [Google Scholar] [CrossRef] [Scilit]
  20. Cao, Z.; Guo, F.; Rong, T.; Li, Z.; Du, F.; Wang, W.; Zhao, Y. Field Application and Diffusion Law of Grouting Slurry in Floor Aquifer of a Coal Mine. Sci. Rep. 2026, 16, 8329. [Google Scholar] [CrossRef] [Scilit]
  21. Lu, Y.; Wang, L.; Li, Z.; Sun, H. Experimental Study on the Shear Behavior of Regular Sandstone Joints Filled with Cement Grout. Rock Mech. Rock Eng. 2017, 50, 1321–1336. [Google Scholar] [CrossRef] [Scilit]
  22. Ma, H.; Liu, Q. Prediction of the Peak Shear Strength of Sandstone and Mudstone Joints Infilled with High Water–Cement Ratio Grouts. Rock Mech. Rock Eng. 2017, 50, 2021–2037. [Google Scholar] [CrossRef] [Scilit]
  23. Le, H.; Sun, S.; Kulatilake, P.H.S.W.; Wei, J. Effect of Grout on Mechanical Properties and Cracking Behavior of Rock-like Specimens Containing a Single Flaw under Uniaxial Compression. Int. J. Geomech. 2018, 18, 04018129. [Google Scholar] [CrossRef] [Scilit]
  24. Yang, Y.; Kang, Z.; Qiu, S.; Yan, L.; Peng, J. Study on Influence of Grouting on Mechanical Characteristics and Stress Concentration in Hole-Containing Rock. Appl. Sci. 2025, 15, 5245. [Google Scholar] [CrossRef] [Scilit]
  25. Jin, Y.; Yang, S.; Guo, H.; Han, L.; Huang, P.; Chen, M.; Shan, H.; Huang, L.; Su, S.; Wang, S.; et al. Dynamic Mechanical and Failure Properties of Grouted Fractured Rock Based on Nano-Grouting Material. Processes 2025, 13, 765. [Google Scholar] [CrossRef] [Scilit]
  26. Li, K.; She, C. Test for Shearing Properties and Shearing Creep Properties of Cement-Filled Joint. Eng. J. Wuhan Univ. Wuhan Daxue Xuebao 2011, 44, 423–426. [Google Scholar]
  27. Sun, F.; She, C.; Wan, L. A Peak Shear Strength Model for Cement Filled Rock Joints. Chin. J. Rock Mech. Eng. 2014, 33, 2481–2489. [Google Scholar]
  28. Fu, J.; Haeri, H.; Sarfarazi, V.; Rafiei, N.; Amiri, A.A.; Marji, M.F. Investigation of the Shear Mechanism at the Interface Between Grout and Brittle Rock: Physical Testing and PFC3D Simulation. Int. J. Numer. Anal. Methods Geomech. 2025, 49, 1491–1505. [Google Scholar] [CrossRef] [Scilit]
  29. Rong, H.; Li, G.; Xu, J.; Liang, D.; Lin, F. Macro- and Meso- Shear Mechanical Properties of Rock-Grout Composite Structures under Different Stress Level and Initial Hydration Damage. Sci. Rep. 2025, 15, 42494. [Google Scholar] [CrossRef] [Scilit]
  30. Zhou, D.; Zhang, W.; Dong, L.; Ying, P.; Hussain, B.M. Numerical Simulation Investigating the Creep Behavior of Jointed Rock Masses Incorporating Variable Shear Stiffness. Buildings 2026, 16, 977. [Google Scholar] [CrossRef] [Scilit]
  31. Drescher, K.; Handley, M.F. Aspects of Time-Dependent Deformation in Hard Rock at Great Depth. J. S. Afr. Inst. Min. Metall. 2003, 103, 325–335. [Google Scholar]
  32. Asanov, V.A.; Pan’kov, I.L. Deformation of Salt Rock Joints in Time. J. Min. Sci. 2004, 40, 355–359. [Google Scholar] [CrossRef] [Scilit]
  33. Zhang, Q.-Z.; Shen, M.-R.; Ding, W.-Q.; Jang, H.-S.; Jang, B.-A. Experimental Investigation of Long-Term Characteristics of Greenschist. Geomech. Eng. 2016, 11, 531–552. [Google Scholar] [CrossRef] [Scilit]
  34. Wang, Z.; Gu, L.; Zhang, Q.; Jang, B.-A. Influence of Initial Stress and Deformation States on the Shear Creep Behavior of Rock Discontinuities with Different Joint Roughness Coefficients. Rock Mech. Rock Eng. 2021, 54, 5923–5936. [Google Scholar] [CrossRef] [Scilit]
  35. Ji, F.; Li, R.; Feng, W.; Wang, D. Modeling and Identification of the Constitutive Behavior of Embedded Non-Persistent Joints Using Triaxial Creep Experiments. Int. J. Rock Mech. Min. Sci. 2020, 133, 104434. [Google Scholar] [CrossRef] [Scilit]
  36. Yao, W.; Zhang, T.; Chen, Q.; Sun, J.; Xu, S.; Ding, Z.; Wang, Z. Effects of Shear Stress Path and Roughness on Shear Creep Behavior of Marine Clay-Concrete Interface. Sci. Rep. 2023, 13, 10686. [Google Scholar] [CrossRef] [Scilit]
  37. Tarifard, A.; Török, Á.; Görög, P. Review of the Creep Constitutive Models for Rocks and the Application of Creep Analysis in Geomechanics. Rock Mech. Rock Eng. 2024, 57, 7727–7757. [Google Scholar] [CrossRef] [Scilit]
  38. Dong, F.; Feng, X.; Liu, R.; Li, S.; Zhu, X.; Sun, J. Experimental Study on the Effect of the Thickness of Filled Joint on Unloading-Induced Granite Slip Behavior. KSCE J. Civ. Eng. 2025, 29, 100036. [Google Scholar] [CrossRef] [Scilit]
  39. Hoek, E.; Brown, E.T. Practical Estimates of Rock Mass Strength. Int. J. Rock Mech. Min. Sci. Géoméch. Abstr. 1997, 34, 1165–1186. [Google Scholar] [CrossRef] [Scilit]
  40. Bieniawski, Z.T. Rock Mechanics Design in Mining and Tunneling; A.A. Balkema: Rotterdam, The Netherlands, 1984. [Google Scholar]
  41. Goodman, R.E. Introduction to Rock Mechanics; John Wiley & Sons: Hoboken, NJ, USA, 1991. [Google Scholar]
  42. Xia, C.-C.; Tang, Z.-C.; Xiao, W.-M.; Song, Y.-L. New Peak Shear Strength Criterion of Rock Joints Based on Quantified Surface Description. Rock Mech. Rock Eng. 2014, 47, 387–400. [Google Scholar] [CrossRef] [Scilit]
  43. Grasselli, G.; Wirth, J.; Egger, P. Quantitative Three-Dimensional Description of a Rough Surface and Parameter Evolution with Shearing. Int. J. Rock Mech. Min. Sci. 2002, 39, 789–800. [Google Scholar] [CrossRef] [Scilit]
  44. Zheng, Z.; Li, S.; Liu, R.; Zhang, S.; Li, X.; Wang, X. Shearing Strength of Single Structural Surface of Grouted Rock Mass. Chin. J. Rock Mech. Eng. 2016, 35, 3915–3922. [Google Scholar]
  45. Zhang, Q.Z.; Shen, M.R.; Jang, B.A.; Ding, W.Q. Creep Behavior of Rocks with Rough Surfaces. J. Mater. Civ. Eng. 2016, 28, 04016063. [Google Scholar] [CrossRef] [Scilit]
  46. GB/T 50266–2013; Standard for Test Methods of Engineering Rock Mass. China Architecture & Building Press: Beijing, China, 2013.
  47. YS/T 5211–2018; Technical Specification for Grouting. Standards Press of China: Beijing, China, 2018.
  48. Sun, F.T. Experimental Study on the 3D Morphological Characterization of Tension-Type Hard Rock Joints and Shear Strength Characteristics Before and After Grouting. Ph.D. Thesis, Wuhan University, Wuhan, China, 2015. [Google Scholar]
  49. Wang, J.; Wang, Y.; Cao, Q.; Ju, Y.; Mao, L. Behavior of Microcontacts in Rock Joints under Direct Shear Creep Loading. Int. J. Rock Mech. Min. Sci. 2015, 78, 217–229. [Google Scholar] [CrossRef] [Scilit]
Figure 1. Geometric relationship of the effective shear inclination θ*.
Buildings 16 01585 g001
Figure 2. Schematic illustration of the stress state of an equivalent serrated bonded surface.
Buildings 16 01585 g002
Figure 3. Schematic illustration of grout filling thickness in a rough structural plane.
Buildings 16 01585 g003
Figure 4. Rock specimens before and after splitting: (a) Pre-splitting; (b) Post-splitting.
Buildings 16 01585 g004
Figure 5. Workflow for preparation of grouted specimens.
Buildings 16 01585 g005
Figure 6. CSS-1950 rock biaxial shear rheometer.
Buildings 16 01585 g006
Figure 7. Schematic diagram of the shear stress–time path for the graded shear creep test.
Buildings 16 01585 g007
Figure 8. Schematic illustration of Chen’s loading method and creep curve processing: (a) Loading path; (b) Creep curve superposition procedure.
Buildings 16 01585 g008
Figure 9. Graded creep curves of structural planes under different normal stresses: (a) SY-30 (Normal Stress: 0.5 MPa); (b) SY-31 (Normal Stress: 1.0 MPa); (c) SY-32 (Normal Stress: 1.5 MPa); (d) SY-33 (Normal Stress: 2.0 MPa).
Buildings 16 01585 g009
Figure 10. Creep rate–time curves of structural planes under different normal stresses: (a) SY-30; (b) SY-31; (c) SY-32; (d) SY-33.
Buildings 16 01585 g010
Figure 11. Graded creep curves for specimens with a grouting thickness of 2.0 mm: (a) SY-34 (Normal Stress: 0.5 MPa); (b) SY-35 (Normal Stress: 1.0 MPa); (c) SY-36 (Normal Stress: 1.5 MPa); (d) SY-37 (Normal Stress: 2.0 MPa). Red “+” symbols indicate the final shear-stress level at failure.
Buildings 16 01585 g011
Figure 12. Creep rate–time curves for specimens with a grouting thickness of 2.0 mm: (a) SY-34; (b) SY-35; (c) SY-36; (d) SY-37.
Buildings 16 01585 g012
Figure 13. Creep grading curves for grouting thickness of 4.0 mm: (a) SY-38 (Normal Stress: 0.5 MPa); (b) SY-39 (Normal Stress: 1.0 MPa); (c) SY-40 (Normal Stress: 1.5 MPa); (d) SY-41 (Normal Stress: 2.0 MPa). Red “+” symbols indicate the final shear-stress level at failure.
Buildings 16 01585 g013
Figure 14. Creep grading curves for grouting thickness of 8.0 mm: (a) SY-42 (Normal Stress: 0.5 MPa); (b) SY-43 (Normal Stress: 1.0 MPa); (c) SY-44 (Normal Stress: 1.5 MPa); (d) SY-45 (Normal Stress: 2.0 MPa). Red “+” symbols indicate the final shear-stress level at failure.
Buildings 16 01585 g014
Figure 15. Schematic diagram of the transition creep method.
Buildings 16 01585 g015
Figure 16. Schematic diagram of the isochronous cluster curve method.
Buildings 16 01585 g016
Figure 17. Shear creep failure of samples with different grouting thicknesses under a normal stress of 1.0 MPa: (a) SY-31; (b) SY-35; (c) SY-39; (d) SY-43.
Buildings 16 01585 g017
Figure 18. SEM images of the grout-sandstone interface at different magnifications: (a) 250×; (b) 500×; (c) 1000×; (d) 2000×.
Buildings 16 01585 g018
Figure 19. Diagram of the failure process of the samples before and after grouting (the deflected structure indicates failure): (a) Ungrouted sample; (b) Grouted sample.
Buildings 16 01585 g019
Table 1. Calculated three-dimensional morphological parameters of the structural planes.
SY-xxA0 θ m a x * CSY-xxA0 θ m a x * C
300.51958.6310.364380.51158.809.124
310.49654.029.623390.56954.849.841
320.51361.0010.692400.45865.5410.312
330.53455.079.773410.47162.4910.015
340.43864.2710.511420.54855.719.495
350.46157.618.934430.48662.419.798
360.48758.019.296440.57858.3910.538
370.45663.039.954450.64156.7510.228
Table 2. Stress schedule for graded shear creep tests on ungrouted structural planes.
SY-xxNormal Stress/MPaGraded Shear Stress/MPa
300.50.300.360.420.480.540.60
311.00.590.720.830.951.071.19
321.50.901.081.261.441.621.80
332.01.131.351.581.802.032.25
The graded shear stress values correspond to 50%, 60%, 70%, 80%, 90%, and 100% of the theoretical shear strength under each normal stress condition.
Table 3. Calculated intermediate parameters and theoretical peak shear strengths of grouted specimens.
SY-xxσn/MPaσn/JICSIpJICS/MPaλτt/MPa
340.50.02819.7417.780.450.94
351.00.05617.5217.980.471.48
361.50.08616.1917.350.412.00
372.00.10414.0919.160.592.40
380.50.02318.5322.040.940.90
391.00.04615.7521.900.921.40
401.50.07215.9120.810.781.98
412.00.08111.4324.641.352.20
420.50.01817.5627.551.980.87
431.00.03413.1129.412.531.28
441.50.05313.2828.072.121.81
452.00.06410.7731.373.322.10
The graded horizontal shear stress values correspond to 50–110% of the theoretical shear strength τt.
Table 4. Stress schedule for graded shear creep tests on grouted specimens.
SY-xxNormal Stress
/MPa
Grouting Thick/mmGraded Shear Stress/MPa
340.520.470.560.660.750.850.941.03
351.00.740.891.041.191.331.481.63
361.51.001.201.401.601.802.002.20
372.01.201.441.681.922.162.402.64
380.540.450.540.630.720.810.900.99
391.00.700.840.981.121.261.401.54
401.50.981.181.381.581.781.982.18
412.01.101.321.541.761.982.202.42
420.580.430.520.610.700.780.870.96
431.00.640.770.891.031.151.281.41
441.50.911.091.271.451.631.811.99
452.01.051.261.471.681.892.102.31
Table 5. Long-term and theoretical peak strengths of rock structural surfaces determined by different methods.
SY-xxGrouting
Condition
Normal Stress/MPaTransition Creep Method/MPaIsochronous Cluster-Curve Method/MPaTheoretical Peak Strength/MPa
30/0.50.42~0.480.380.60
31/1.00.83~0.950.821.19
32/1.51.26~1.441.331.80
33/2.01.80~2.021.612.25
342.0 mm0.50.75~0.850.700.94
352.0 mm1.01.19~1.331.211.48
362.0 mm1.51.60~1.801.522.00
372.0 mm2.01.92~2.161.952.40
384.0 mm0.50.63~0.720.710.90
394.0 mm1.01.12~1.261.061.40
404.0 mm1.51.58~1.781.541.98
414.0 mm2.01.76~1.981.582.20
428.0 mm0.50.61~0.700.670.87
438.0 mm1.00.89~1.030.961.28
448.0 mm1.51.45~1.631.391.81
458.0 mm2.01.68~1.891.512.10
Disclaimer/Publisher’s Note: The statements, opinions and data contained in all publications are solely those of the individual author(s) and contributor(s) and not of MDPI and/or the editor(s). MDPI and/or the editor(s) disclaim responsibility for any injury to people or property resulting from any ideas, methods, instructions or products referred to in the content.