Article

A Matrix-Driven Cellular Automata Model for Analyzing Urban Decay and Vitality Indicators at the Neighborhood Scale

by
Ayşe Tüzün Güner
1 and
Süheyla Büyükşahin
2,*
1
Department of Architecture, KTO Karatay University, 42020 Konya, Turkey
2
Department of Architecture, Sakarya University, 54187 Sakarya, Turkey
*
Author to whom correspondence should be addressed.
Buildings 2026, 16(8), 1528; https://doi.org/10.3390/buildings16081528
Submission received: 19 February 2026 / Revised: 23 March 2026 / Accepted: 8 April 2026 / Published: 14 April 2026
(This article belongs to the Special Issue Emerging Trends in Architecture, Urbanization, and Design)

Abstract

Urban decay and urban vitality are widely used concepts in architecture and urban studies to describe the negative and positive characteristics of urban environments. However, they are commonly addressed through qualitative or static approaches, limiting their applicability in neighborhood-scale spatial assessment and design-oriented decision-making processes. This study proposes a matrix-based cellular automata model for analyzing urban decay and urban vitality indicators at the neighborhood scale. Indicators related to urban decay and urban vitality were identified through a comprehensive literature review, and repetitive, overlapping, and context-inappropriate criteria were removed. A data-based decision matrix was then constructed using five criteria: theoretical validity, data accessibility, spatial applicability, model compatibility, and impact level. Indicators were scored on a 1–5 scale, and those with a total suitability score of four or higher were selected as model inputs. The finalized indicator set was incorporated into a cellular automata model with a regular grid structure, defined for a study area of approximately 600 m × 600 m in the Semsi Tebrizi neighborhood of Konya, Turkey, using 15 m × 15 m cells. The model is not intended as a predictive tool but functions as an indicator-based decision-support framework for pre-design spatial analysis and interpretation.

1. Introduction

Urban decay areas are defined as spaces where physical and social deterioration coexist, accompanied by multidimensional problems such as economic decline [1]. Interventions in these areas are carried out under the broader concept of urban regeneration through various approaches, including renewal, rehabilitation, conservation, revitalization, redevelopment, restructuring, improvement, and infill development [2]. However, these approaches, long employed in the literature, have largely been shaped by qualitative definitions and planning practices. The identification of areas requiring intervention, the selection of intervention types, and the determination of implementation methods are generally addressed within institutional decision-making processes, highlighting the need for objective and comparable evaluation criteria.
With increasing access to data and advancements in spatial information technologies, urban problems can now be examined through computational design and modeling tools [3]. In this context, it has become important not only to analyze existing decay areas but also to identify decay tendencies and risk potentials through quantitative data. Indeed, a recent study examining urban decay and its impacts through cognitive mapping suggests the development of systems capable of measuring real-time deterioration indicators in urban neighborhoods and mitigating such decline as a key direction for future research [4].
Within this context, urban regeneration practices implemented in informal settlement areas, along with the formation processes and socio-economic transformations of these areas, have been extensively addressed in the literature and continue to be examined. Ferreira et al. [5] mention three important interventions for eliminating urban decay. First, the identification of damaged buildings, then determining their effects on decline areas, and finally determining the costs and benefits of improvement strategies. The main objective is to improve the quality of life of people living in areas affected by decay. In this context, improvement strategies were determined by using cognitive mapping and the multi-criteria decision-making method. Many strategies have been identified such as developing social innovation projects that respond to social problems, revitalizing local trade, promoting the history and past of places, and obtaining safe spaces [5,6].
In the study titled “Analyzing blight impacts on urban areas: A multi-criteria approach,” an analysis was conducted regarding the problem that the way of determining the effects of urban deterioration is uncertain and that the relationships between these effects are not examined. The effects are determined in three stages. Accordingly, in the first stage, the effects caused by urban deterioration were addressed through cognitive mapping. In the second stage, the relationships between these effects were examined using the DEMATEL technique. In the final stage, the results were discussed and suggestions and recommendations were presented. In this study, four groups of impact factors were identified: governance (political actions, prioritization of properties for renewal, maintenance of public spaces, legal regulations for urban renewal, social integration plans, emergency planning, need for large-scale interventions); construction and real estate market (deteriorated buildings, building maintenance and protection, development of better urbanization plans, worsening living conditions, disaster risk, decaying urban infrastructure, illegal occupations); sociability and security (low quality of life, social deterioration, abandonment of deteriorated areas, committing crimes, high protection and security costs, education); and health and environment (mental disorders, decline in quality of life, health problems, spread of diseases, deterioration of hygiene conditions) [4]. According to the most recent study titled “Revisiting the notion of urban blight in the context of Global South: A discursive approach,” the characteristics of urban decay consist of indicators under physical, social, functional, and environmental categories. Accordingly, ten indicators were identified: abandoned buildings, deterioration of building conditions, unfinished building construction lasting for years, newly constructed buildings left vacant for years, unhealthy living conditions, decline in public health, garbage and waste on streets, drug trafficking and substance addiction, violence and crime, and social unrest [7]. In contrast, studies focusing on decay areas located in city centers within the Turkish context remain limited. Existing research predominantly concentrates on parcel- or building-scale analyses, while comprehensive spatial evaluations at the neighborhood scale are relatively scarce. Many existing studies on urban decay focus on parcel- or building-scale analyses, while neighborhood-scale spatial evaluations remain relatively limited. Although some studies have addressed urban decline at broader spatial scales, comprehensive indicator-based analyses that integrate multiple socio-economic, physical, and cultural dimensions at the neighborhood level are still relatively scarce. Moreover, it has been argued that public authorities often define and address decay areas in city centers primarily through physical construction problems [8,9]. Moreover, it has been argued that public authorities often define and address decay areas in city centers primarily through physical construction problems [10]. This approach makes it difficult to assess decay areas in terms of their social, economic, and spatial dimensions and may delay the early identification of emerging problems as well as the development of preventive interventions for areas at risk of decline.
This study addresses the limited approaches in the literature concerning how urban decay can be quantified and how such quantification can be integrated into spatial analysis processes. Today, not only structural deterioration but also spatial and social decline have emerged as critical urban issues. These areas are characterized not only by physical degradation but also by weakened urban vitality and reduced social interaction [11]. However, the concept of urban vitality is generally defined through densely populated, central, and active areas, and its inverse relationship with decay areas has received limited attention. This gap indicates both a theoretical and methodological deficiency. Although Cellular Automata (CA), as a computational design tool, has been widely used to examine urban change patterns, existing studies mainly focus on measurable parameters such as physical transformation and land use [12]. Research that holistically incorporates human-centered socio-cultural parameters within the framework of urban vitality remains limited. However, the relationship between these two processes has received relatively limited attention within integrated spatial analysis frameworks. In particular, there remains a need for analytical approaches that can simultaneously evaluate indicators related to both urban decline and urban vitality at the neighborhood scale. In this context, the present study proposes an indicator-based modeling framework that integrates these two dimensions through a decision matrix and a Cellular Automata model. By translating indicator-based evaluations into a grid-based spatial simulation environment, the proposed framework aims to provide a systematic approach for analyzing the spatial interaction between urban vitality and decline patterns.
The primary objective of this study is to develop an evaluation system that analyzes urban decay not only in terms of physical deterioration but also through the intersection of urban vitality and regionalism approaches, adopting a human-centered perspective encompassing economic, social, physical, and cultural dimensions. To this end, indicators identified through a literature review were quantified using a decision matrix and integrated into a Cellular Automata (CA) model [4,7].
The proposed approach provides an indicator-based decision-support framework that enables the analysis of spatial patterns of urban decay and potential risk areas at the neighborhood scale prior to design and planning processes. In this respect, the study aims to contribute to data-driven, measurable, and context-sensitive evaluations in urban regeneration and intervention practices. In recent years, urban vitality and urban decline have also been discussed within the broader framework of sustainable urban development. Sustainable Development Goal 11 (SDG-11), which aims to create inclusive, safe, resilient, and sustainable cities, highlights the importance of improving urban living conditions, enhancing public spaces, and strengthening the social and functional vitality of urban environments. In this context, analytical approaches capable of identifying areas of decline and evaluating vitality patterns at the neighborhood scale can contribute to evidence-based urban planning and regeneration strategies that support sustainable urban development [13].

2. Literature Review

The concepts of urban decay and urban vitality represent two opposing yet complementary dimensions of urban space. Urban decay is generally defined through negative processes such as physical deterioration, economic decline, and social disintegration, whereas urban vitality focuses on positive attributes including intensity of use, level of social interaction, and continuity of public life. Although these two concepts are often addressed under separate headings in the literature, the reciprocal relationship between decay processes and the weakening of vitality has been discussed only to a limited extent.
However, urban decay areas are not merely spaces characterized by physical deterioration; they also emerge as environments where urban vitality declines and social interaction weakens. Similarly, reductions in vitality indicators can often be interpreted as early signs of emerging decay processes. For this reason, addressing urban decay and urban vitality together enables a more comprehensive understanding of urban problems, encompassing not only their outcomes but also the spatial and social dynamics that give rise to them.

2.1. Urban Decay and Urban Vitality in Urban Studies

While cities continuously and independently renew themselves (Lefebvre [14]), societies, spaces, regions, and even entire cities that fail to regenerate become focal points of decline. Although the concept of “urban decay” is often perceived primarily as physical deterioration and the formation of obsolete spaces, it fundamentally reflects a socio-economic condition [15]. In rapidly growing cities, new developments often conceal impoverished, neglected, and disorderly areas. These areas, which urban residents tend to avoid and gradually attempt to eliminate, are defined as “urban decay” [4,16]. Urban decay refers to spaces that undergo morphological transformation as a result of losing their functions and negatively affecting urban identity [10]. Problems arising from poor planning at the neighborhood or district scale, as well as voids created by various other factors, are defined as urban voids [17]. Areas that become vacant and lose their economic vitality often turn into abandoned and distressed environments. These spaces are typically occupied by low-income residents or migrants seeking affordable housing [4]. Urban vacancy has become one of the most prevalent urban issues today, affecting cities and specific neighborhoods differently depending on local conditions [18]. Doron [19] argues that urban voids are never truly empty; rather, they possess historical layers, are used by different groups, and exist as suspended spaces.
Over time, vandalism in such areas may increase crime rates and erode social cohesion [20]. According to the “broken windows” theory, visible disorder in public space may contribute to more serious crimes and deepen urban decline [21]. Urban decay thus encompasses multidimensional processes involving social, economic, and physical regression [22].
Urban decay thus encompasses multidimensional processes involving social, economic, and physical regression [23,24]. Slums are typically characterized by physically deteriorated environments, high population density, and social isolation [25]. The concept of the ghetto intersects social and spatial exclusion and was first defined by sociologist Louis Wirth [26], who emphasized the distinct social life of marginalized communities. In contrast, suburbs emerged as planned responses to rapid industrial urbanization, often shaped by state policies [27].
Although these concepts reflect forms of socio-spatial segregation, they differ from one another. Urban decay areas are distinct from slums that emerge as a result of urban housing shortages [28]. Residents of urban decay areas often live primarily for survival, without expectations of full integration into the broader urban system. In contrast, slum areas have been described as places where hope begins. Individuals migrating from rural to urban areas often do so in pursuit of better opportunities in health, education, and employment, striving to improve their living conditions [27]. Nevertheless, slums and decay areas share adverse living conditions, such as poor building quality and aesthetics, inadequate infrastructure, insufficient public amenities (parks, schools, hospitals), and social isolation from the broader urban context. Residents of these areas frequently experience economic, social, cultural, political, and spatial exclusion. Factors such as youth, low educational attainment, migrant status, prolonged unemployment, lack of social security, and economic insecurity intensify feelings of exclusion. When such characteristics become concentrated within a neighborhood, a broader sense of marginalization may emerge, often accompanied by deepening poverty processes [29].
As urbanization accelerates globally, housing shortages continue to grow, triggering socio-spatial segregation [28]. Ghettos are characterized by distinctive social structures formed through ethnic, political, or religious exclusion. Slums result from rapid internal migration and informal construction, whereas suburbs emerge as planned residential areas, often shaped by state policies and post-colonial migration processes [27,30]. Unlike ghettos and suburbs, slums are distinguished by residents’ efforts to claim permanence and gradually improve their living conditions [27]. Thus, slums denote unplanned and necessity-driven settlements, ghettos reflect exclusion-based spatial segregation, and suburbs represent voluntary or policy-driven separation. In such areas, processes such as population decline, building aging, and housing inadequacy may lead to urban decay [31]. As residents relocate from historic city centers to areas offering better living conditions, central housing stock may become vacant, leading to physical deterioration, functional decline, and value loss. Urban decay consequently results in declining property values, unemployment, crime, and security concerns, ultimately exerting negative long-term impacts on national economies [4,7].
Arabacıoğlu and Yılmaz [9] argue that when the unique identity and urban fabric of a city cannot be preserved, decay areas undergo physical deterioration, become obsolete, and are eventually forgotten. Decay areas may arise at building, regional, or urban scales and evolve through layered stages of existence, impact, collapse, abandonment, and eventual transformation [15]. Işıkkaya emphasizes that three stages—stagnation, obsolescence, and aging—must sequentially occur for an area to be considered a decay zone. Political and economic crises further intensify these processes, while legal interventions often remain insufficient to fully resolve them. Aytaç [32] conceptualizes the formation of decay areas through four stages: physical aging, deterioration, obsolescence, and ultimately urban regeneration.
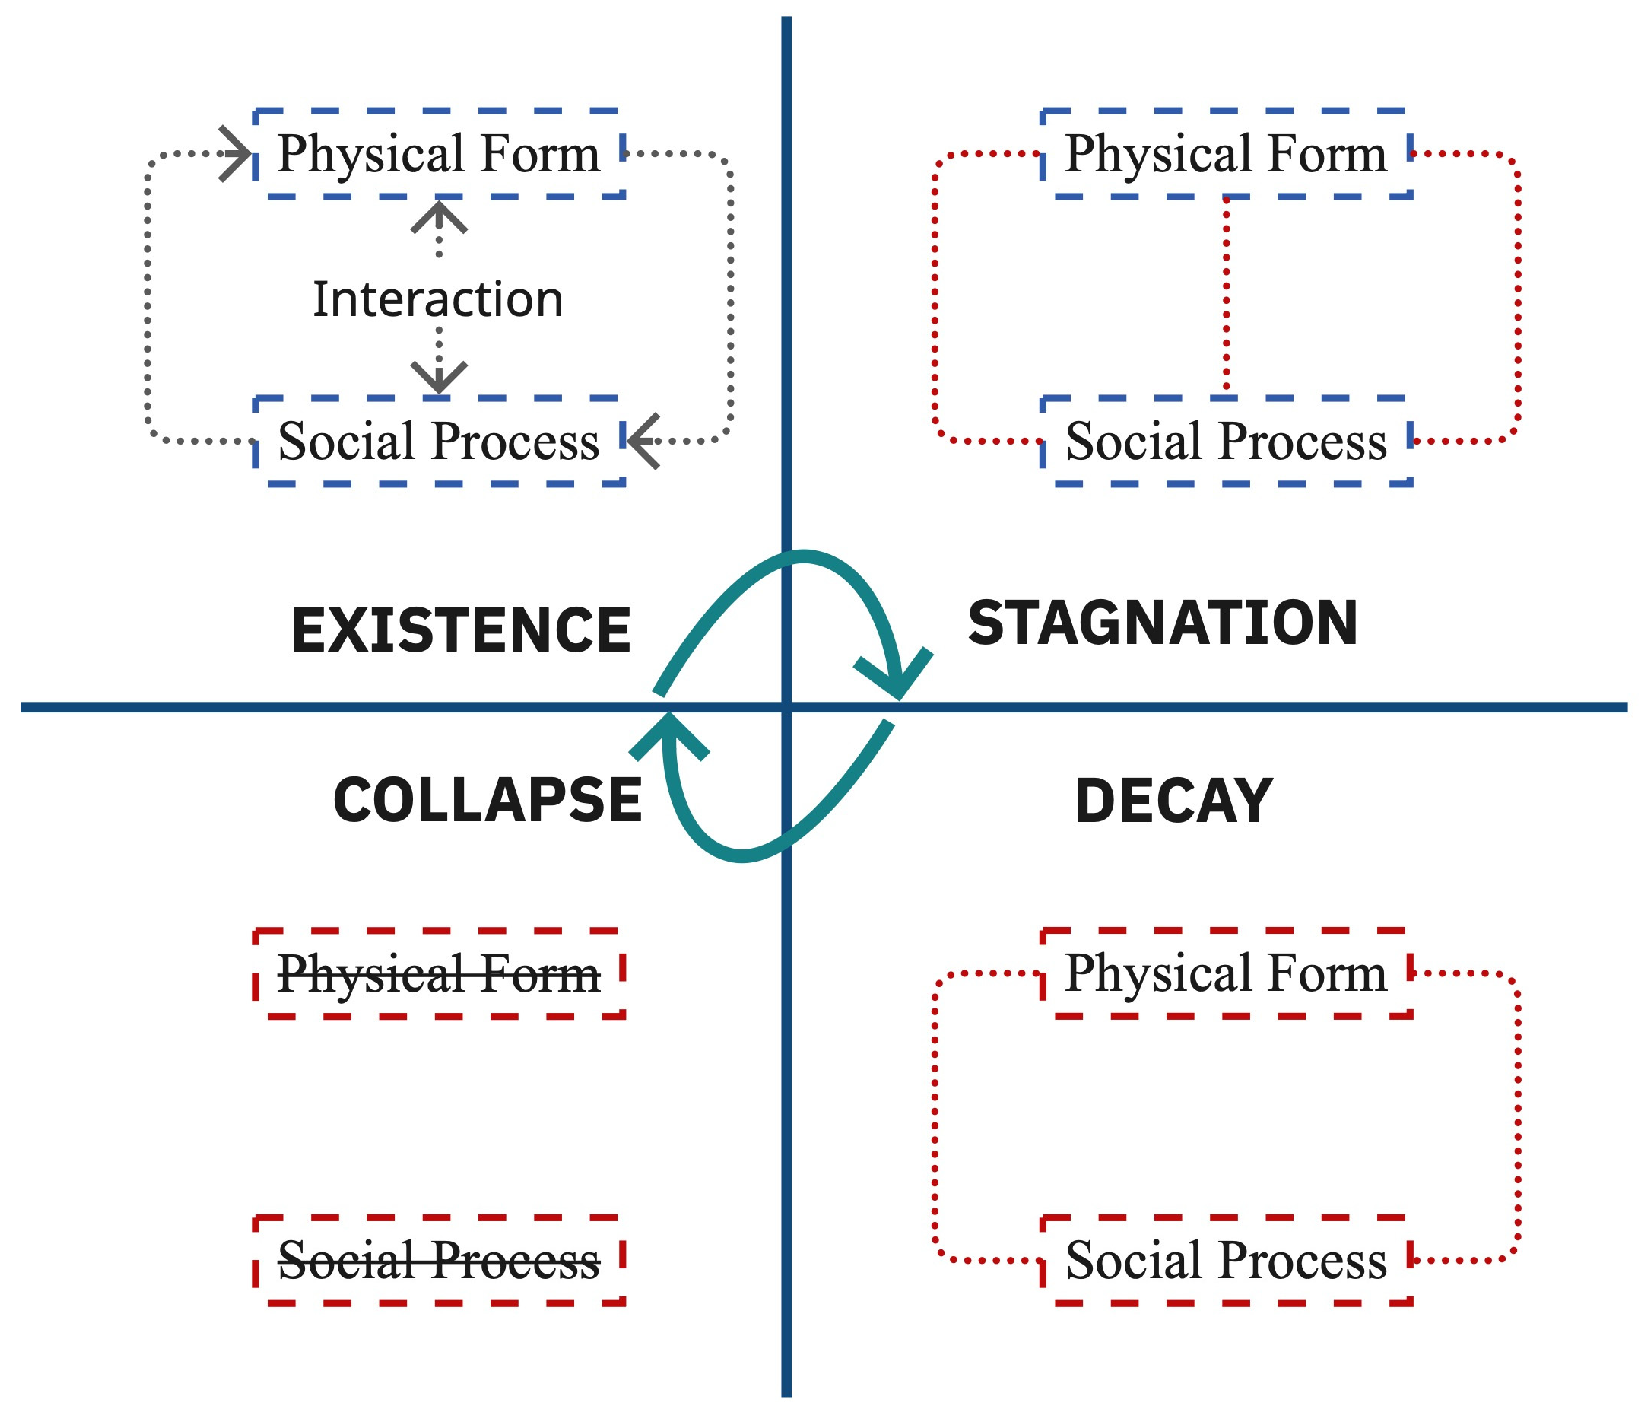
Although individual studies emphasize different variables, most approaches converge on the notion that economic and functional weakening precede physical and social deterioration. Some decay areas may eventually enter a revitalization phase. As illustrated in Figure 1, decay areas emerge through identifiable stages and may develop at structural, regional, or urban scales. Initially, the physical form and social processes interact dynamically; however, as this interaction weakens, stagnation occurs. Over time, changing social, economic, and physical conditions lead to building aging and population decline, marking the obsolescence stage. With further deterioration of the physical environment and disintegration of the social fabric, the area enters collapse and eventual abandonment. Urban regeneration may reintegrate such areas into the city, breaking the cycle of decline and fostering renewed social cohesion and sense of place [33].
Urban vitality holds critical importance for urban life. The health, social, economic, and environmental values of a place collectively reflect its overall quality. Vitality, beginning at the street scale, directly influences urban quality of life [34]. Jacobs [35] argued that isolated and lifeless urban spaces devoid of human presence were being produced and introduced the concept of “eyes on the street” in The Death and Life of Great American Cities as a sociological framework. She defined urban vitality as the diversity of activities and intensity of human presence in specific spaces such as streets and sidewalks. By emphasizing sidewalks as the primary elements of urban life, Jacobs suggested that pedestrian activity and visual surveillance from building windows contribute to street safety. She maintained that a vibrant and well-functioning city requires density (of people and buildings), diversity (a mix of old and new buildings and mixed uses), interaction, and permeability [35]. In large urban areas, promoting diversity, improving accessibility, and minimizing spatial voids are essential to encourage pedestrian activity and foster safe, high-quality built environments.
Lynch, in Good City Form, identified vitality as one of five fundamental dimensions of a good city, alongside sense, fit, access, and control. He considered vitality a primary condition for sustaining quality of life, relating it to the extent to which urban environments support human needs and capabilities. A safe environment enables diverse activities and enhances overall well-being [36]. Maas [37] conceptualized urban vitality through three components: people in public space, their activities, and the physical environment in which these activities occur. He associated vitality with diversity, uniqueness, social interaction, and the scale and diversity of pedestrian populations. Montgomery [38] argued that urban vitality emerges from the interaction between people’s activities and the diversity of urban functions, forming the foundation for sustainable and safe cities. Gehl [39] emphasized that social activities in public space positively influence urban environments, defining vitality as the presence of everyday street life. Jin [40] demonstrated a strong relationship between urban morphology and vitality through spatial regression analysis. More recently, Paköz and Işık [41] examined the relationship between vitality, healthy environments, and density during the COVID-19 period, highlighting the importance of functional diversity. Eloah et al. [42] suggested that urban vitality can be analyzed computationally in relation to place quality and urban morphology.
Jacobs and Montgomery identified key built environment characteristics influencing urban vitality, including mixed land use, building density, small block sizes, and intersection density [35]. Beyond these earlier criteria, recent studies demonstrate that vitality measurement indicators have diversified and vary according to scale. Following Warnke’s [43] area-based study, vitality assessments have been conducted at multiple scales—from city-wide analyses to neighborhood-level investigations—highlighting the increasing importance of scale-sensitive approaches in vitality research.
Urban vitality is examined in some studies under three main dimensions—social, economic, and cultural—while others also include environmental vitality. Rapidly growing cities and increasingly complex urban structures demonstrate that urban vitality is influenced not only by physical environmental factors but also by social and cultural dynamics. For this reason, urban vitality is currently regarded as an abstract yet complex concept encompassing multiple dimensions, including social, economic, and cultural components [44]. Creating vitality in urban areas contributes to improving residents’ quality of life and promoting sustainable urban development. Accordingly, urban vitality holds significant importance for urban planning, development, and governance. Recent studies on urban governance also highlight that urban vitality outcomes may be influenced not only by spatial characteristics but also by governance arrangements and stakeholder collaboration in regeneration processes [45]. It has been widely studied across disciplines such as urban studies, geography, sociology (human–space interactions, street life, and social dynamics), urban planning, economics, culture, and ecology [46,47]. This multidisciplinarity underscores the complexity of measuring urban vitality. Diverse human activities occurring at different times shape urban functions, which in turn sustain the dynamic character of urban areas and support their progression. The formation of a vibrant urban environment depends on well-designed urban morphology, appropriately developed urban functions that respond to residents’ needs, and a variety of opportunities that encourage active participation [46].
The disappearance of factors that sustain urban vitality may create conditions conducive to urban decay. Within the scope of this study, the urban vitality literature suggests that decay areas are closely associated with very low levels of vitality. While vitality reflects dynamism and activity within an area, it simultaneously reveals degrees of stagnation and inactivity. Due to its abstract nature, measuring urban vitality remains challenging. Indicators of vitality reflect whether an area can be considered “vibrant” based on the interaction among various urban components. Ensuring vitality therefore requires spatially operationalizable parameters. In this context, recent analytical approaches in urban vitality research have been examined. The measurement criteria, applied methods, case study contexts, and scales of analysis used in each study were systematically classified. This process clarifies how measurable vitality indicators have been operationalized and provides the analytical foundation for the decision matrix developed in this research.

2.2. Indicator-Based Approaches for Urban Analysis

The literature review was conducted to identify relevant studies on urban decay and urban vitality, with a particular focus on indicator-based spatial analysis approaches. Rather than following a strictly systematic database-driven review protocol, this study adopts a purposive literature selection strategy. Relevant studies were identified through academic databases, including the Web of Science and Scopus, as well as through reference tracking of key publications.
The search process was primarily based on the core keywords urban vitality and urban decay, which define the main conceptual framework of the study. To expand the search and ensure comprehensive coverage, additional related terms such as urban decline, street vitality, city vitality, and neighborhood vitality were also incorporated. The selection process was based on the relevance of studies to the research objectives, particularly their contribution to indicator-based approaches, spatial analysis methods, and applicability to urban vitality and urban decay processes. Studies that did not provide measurable indicators or were not applicable to spatial modeling frameworks were excluded. Consequently, Table 1 summarizes the results of this review, focusing on 20 recent case studies addressing urban vitality and urban decay, as well as the relevant methodological approaches. The selected studies were classified according to their analytical methods, data sources, and the spatial scale of the analyses. This approach allowed for the inclusion of studies that are both theoretically significant and methodologically compatible with the proposed modeling framework. Most of the reviewed studies employ measurement criteria aimed at identifying the relationship between urban form and urban vitality. These criteria are applied in various case studies through different methodological approaches. Previous research has demonstrated strong connections between urban vitality and factors such as functional structure, urban morphology, population density, and economic characteristics. In particular, variables such as distance, accessibility, density, building typology, and diversity are frequently identified as key spatial determinants of urban vitality [40,44,46,48,49,50,51,52,53,54].
Table 1 summarizes the methodological approaches, spatial scales, and data types used in recent urban vitality studies. The comparison shows that existing studies employ different analytical techniques and datasets, often focusing on city-scale analyses. However, indicator-based modeling approaches that integrate multiple spatial dimensions at the neighborhood scale remain relatively limited.
Indicator-based approaches in the evaluation of urban areas are addressed through various methods, including index-based assessments, multi-criteria decision-making techniques, spatial data analyses, deep learning, and machine learning. While these approaches contribute to the quantification of urban phenomena, they often produce static evaluations and address the spatial interactions among indicators only to a limited extent. Moreover, in many of these studies, where physical indicators tend to dominate, the holistic integration of social and cultural dimensions into the modeling process remains limited.
At the neighborhood scale, however, local socio-economic, physical, and cultural conditions play a decisive role in shaping urban processes. The literature emphasizes the importance of considering criteria such as data availability, spatial applicability, and contextual relevance in the selection of indicators [52,64]. In this context, the indicators derived from the literature in this study were evaluated through a context-sensitive approach. Criteria that were not suitable for the research area, could not be spatially represented, or were incompatible with the model structure were eliminated to establish the final set of parameters. This process aimed to enable meaningful and comparable spatial analyses at the neighborhood scale.

3. Methodology

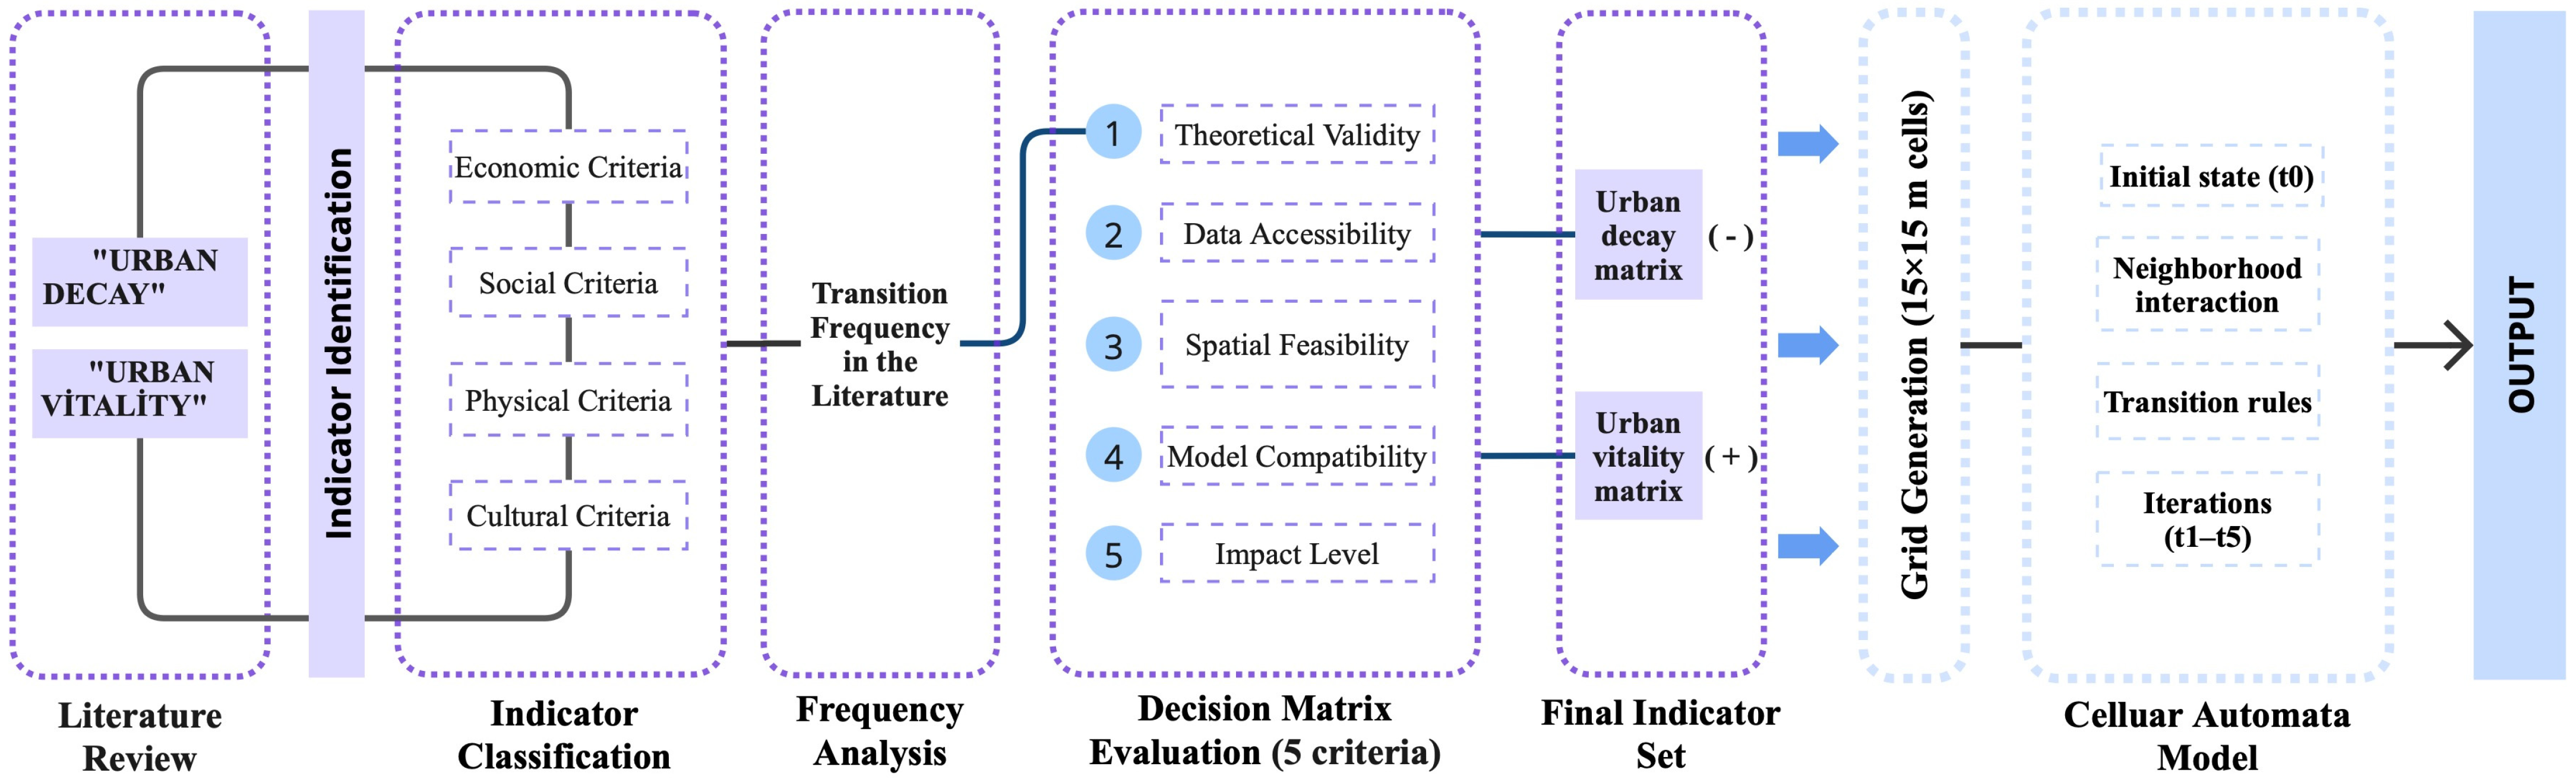
During the selection process of parameters to be used in the Cellular Automata model, a literature-based decision matrix was developed. This matrix enabled the systematic identification of variables to be integrated into the model. Since urban decay and urban vitality processes are governed by different dynamics, the criteria were evaluated through two separate decision matrices within the scope of this study. As illustrated in Figure 2, urban decay and urban vitality criteria identified in the literature were first grouped into four categories and analyzed according to their frequency of occurrence. The most frequently cited criteria were then listed. However, it was anticipated that a selection approach based solely on frequency would not sufficiently address the spatial requirements of the model. Following the literature-based identification of indicators described in Section 2.2, the selected criteria were further evaluated using a decision matrix method based on five assessment criteria: theoretical validity, data accessibility, spatial applicability, model compatibility, and impact level. Although the scoring process involves author evaluation, it is guided by clearly defined criteria derived from the literature to ensure methodological transparency. The frequency of occurrence in the literature was incorporated into the matrix under the criterion of theoretical validity. In this way, indicators demonstrating both strong representation in the literature and high compatibility with the Cellular Automata framework were selected as model parameters. As a result of the evaluation based on these five criteria, a final set of high-scoring indicators was established. This final set defines the parameters to be used in the Cellular Automata model.

Construction of the Decision Matrix

This study determines the parameters using a multi-criteria evaluation method based on five criteria [65]. The five criteria used to determine the criteria in the decision matrix were obtained from both literature and application-based studies. A systematic evaluation was conducted regarding the literature validity of the criteria [4,66], data accessibility, and suitability for the modeling process [52,64].
  • Theoretical validity indicates how valid the criteria are in the urban decay and urban vitality literature. Concepts with high scores have strong recognition in the literature. The scoring of this criterion was obtained from an analysis of the frequency of occurrence in the literature.
  • Data accessibility relates to the availability of data for the criterion and the reliability of the data. Data obtained from sources such as municipalities, TÜİK, or open data sources are highly rated.
  • Spatial applicability refers to whether the criteria can be modeled or analyzed at the cellular level. Data that can be converted into a cell or grid format has high applicability.
  • Model fit indicates the extent to which the criteria can be integrated into the Cellular Automata model. Variables determining cell state have high scores.
  • Impact level indicates the criterion’s power to determine the urban decay and urban vitality processes. Criteria that directly affect (trigger or slow down) decay and vitality have a high impact level.
The five different evaluation criteria used in the decision matrix are evaluated on a scale of 1 to 5, where 1 is weak and 5 is strong. When making the evaluation, the limits of the score ranges were determined based on the literature and are shown in Table 2. Each criterion is scored according to these limits, increasing the objectivity of the decision matrix. In this context, urban decay and urban vitality decision matrices have been prepared.
The urban decay and urban vitality decision matrix, as shown in Table 2, applied a scale of 1–5 points based on five criteria—theoretical validity, data accessibility, spatial adaptability, model fit, and impact level—to be used for parameter selection, and importance weights (Wi) were calculated. The total score was obtained using the weighted sum method, commonly used in multi-criteria evaluation, according to the formula below [65].
S   =   i = 1 5 W i X i
Wi = pi/Σpi
Accordingly:
S = Total suitability score of the parameter
Wi = Importance weight assigned to the i-th criterion
Xi = Scaled score obtained by the parameter from the i-th criterion (1–5)
n = Number of criteria (n = 5)
pi = Importance score
The total suitability score of a parameter represents the numerical equivalent of the indicator’s importance and level of fit with the model. This approach has made the relative importance and level of fit with the model of each indicator numerically comparable. Thus, the importance level of the parameters has been made comparable.
After evaluation, parameters with a total suitability score of 4 or higher were accepted as parameters that would contribute to the cellular automata model and were included in the analysis model.

4. Study Area and Model Definition

4.1. Study Area Description

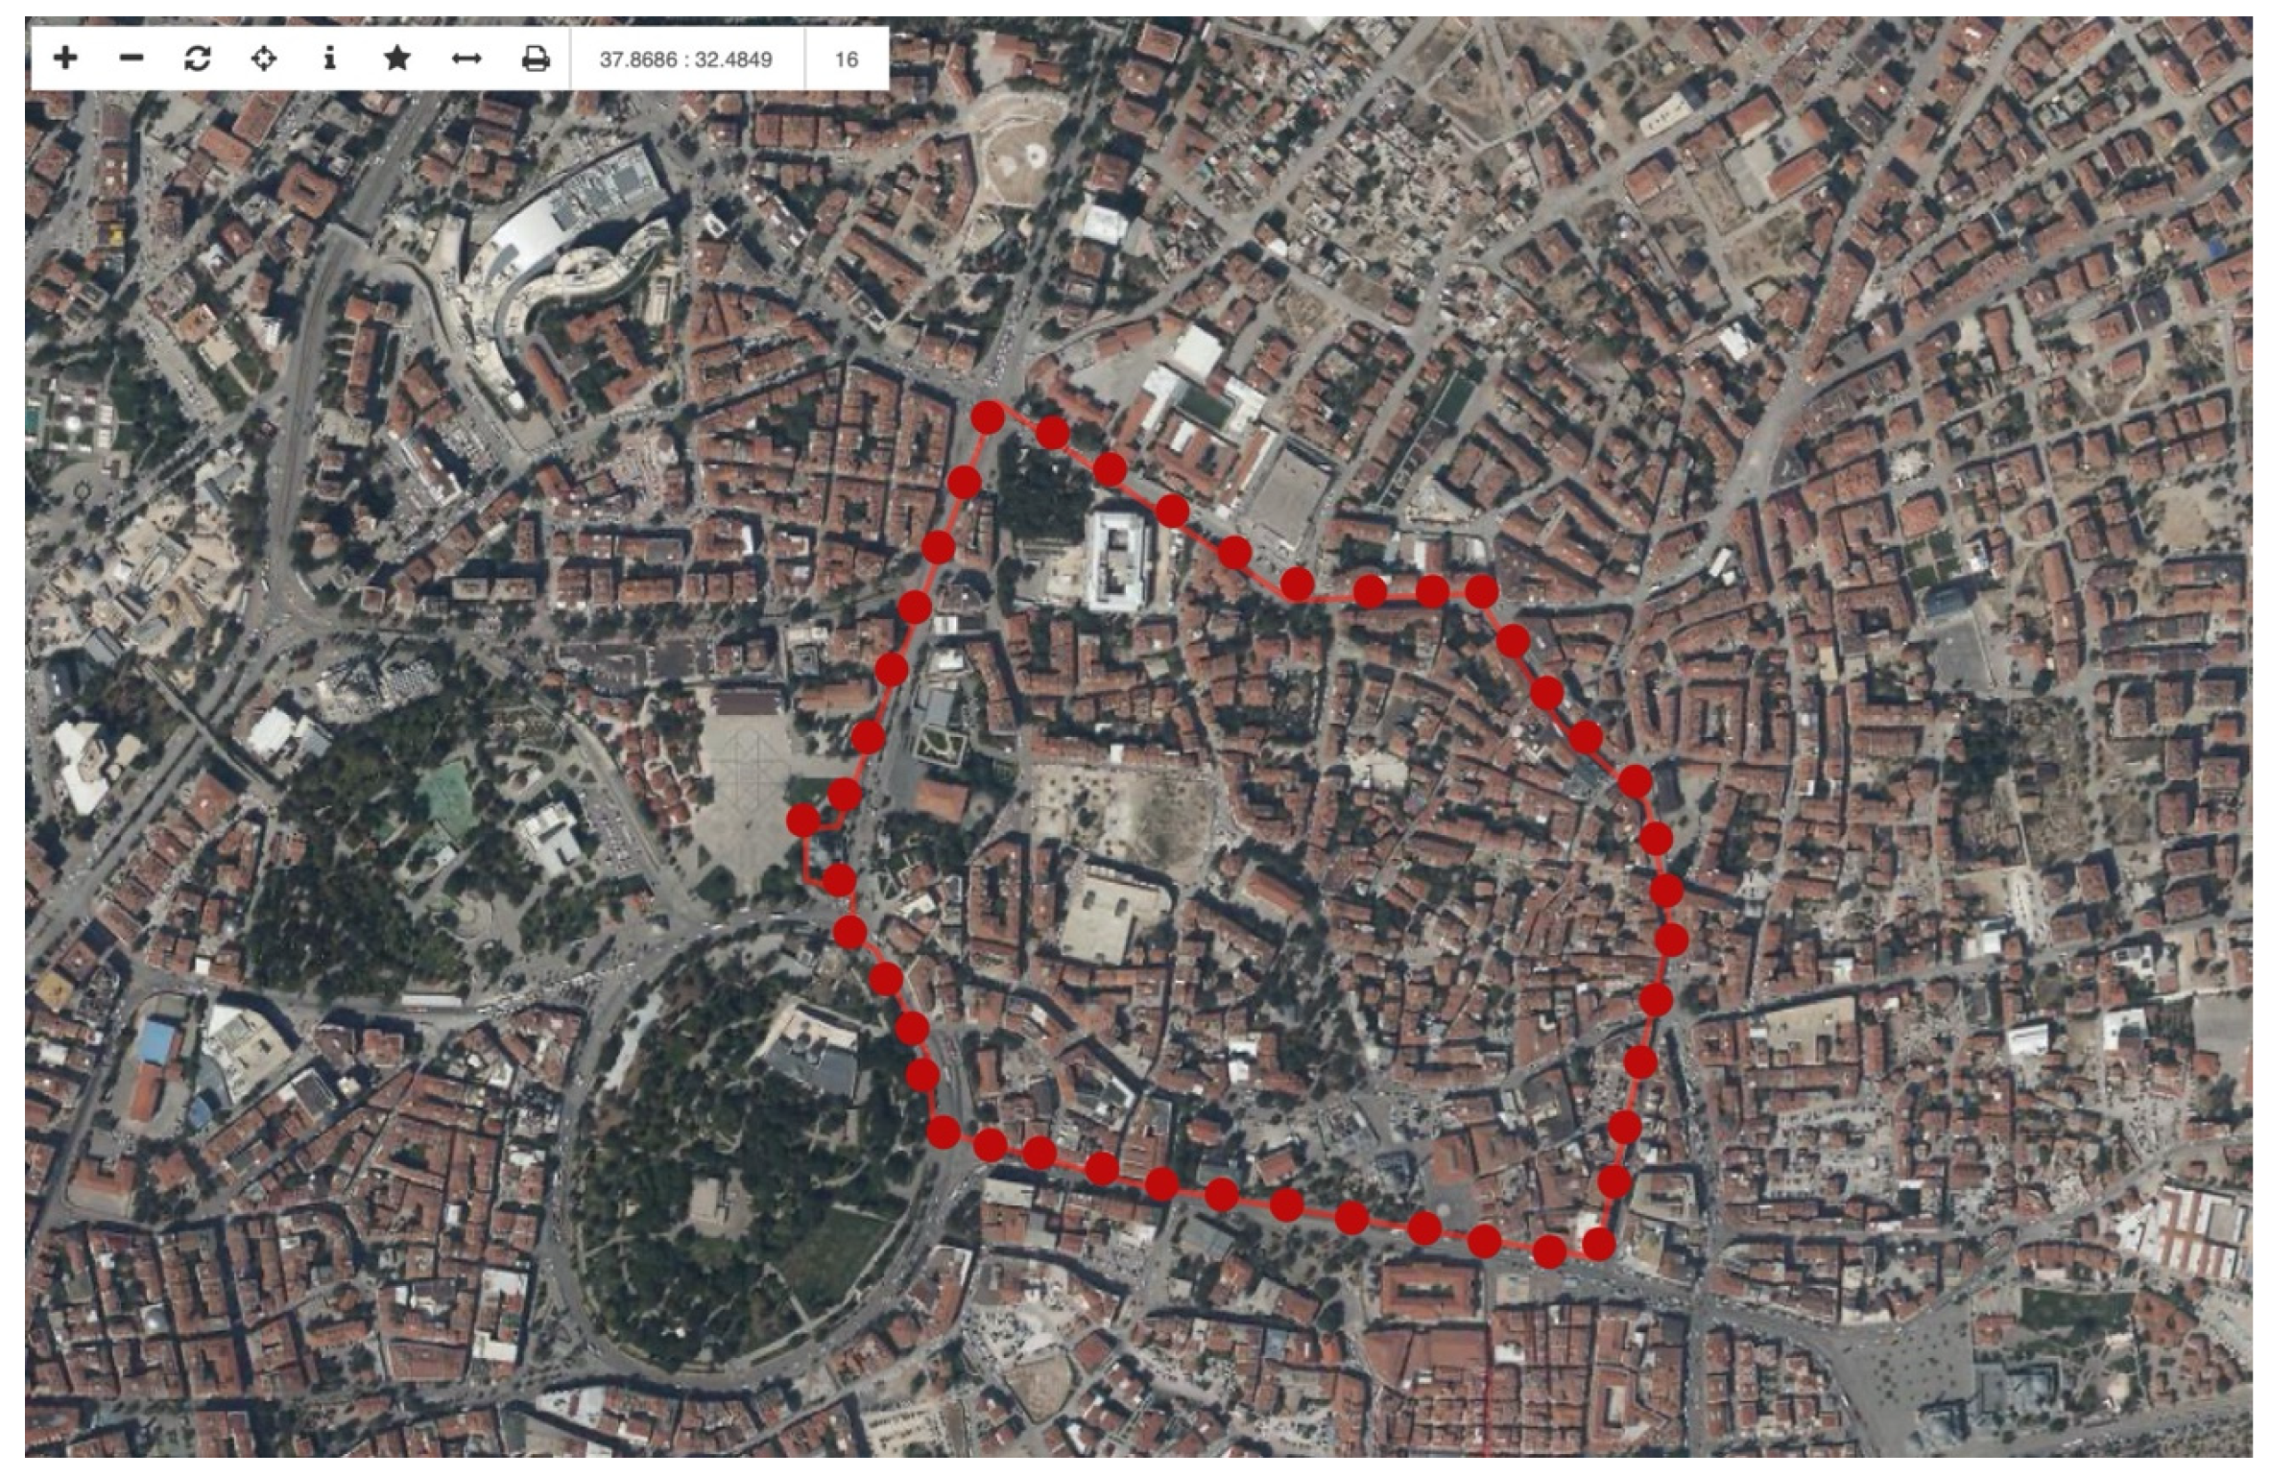
The CA model will be applied in the Semsi Tebrizi Neighborhood, located between Istanbul Street, Mevlana Street, Sultan Veled Street, and Ankara Street in the historic city center of Konya, as shown in Figure 3. The Şemsi Tebrizi Neighborhood, selected for fieldwork within the scope of this study, allows for the simultaneous observation of urban vitality and decay processes within the same area. It was chosen as the study area due to its diverse range of uses, organic street fabric, and high pedestrian traffic. Although the neighborhood has cultural attractions, there are significant spatial differences in terms of physical environmental quality and functional continuity. In this context, it provides a suitable ground for testing the cellular automata model’s decay and vitality states through neighborhood interactions. The study area covers approximately 600 m × 600 m in extent and represents an irregular urban morphology. In order to represent spatial patterns within the Cellular Automata framework, the study area was converted into a regular grid structure consisting of 15 m × 15 m cells. This spatial resolution was selected to capture variations at the neighborhood and street scale while maintaining compatibility with the grid-based modeling structure of Cellular Automata. The chosen resolution allows the model to reflect façade-level spatial characteristics, accessibility relationships, and local neighborhood interactions. At the same time, it provides a sufficient level of spatial detail while maintaining computational feasibility for the simulation process. This creates approximately 1500 cells. This number of cells has been determined to distinguish between facades, buildings, and streets.
The study area was transformed into a regular grid structure to enable the implementation of the Cellular Automata model. This grid-based representation does not aim to replicate real parcel geometries but provides an abstract and standardized spatial framework required for defining neighborhood relationships and transition rules. The selected 15 m × 15 m resolution allows the model to capture fine-grained spatial variations at the neighborhood scale while maintaining computational feasibility. Grid-based approaches are not limited to large-scale urban analyses but have also been applied at smaller spatial scales, including parcel-level modeling, to support rule-based spatial simulations [67]. Therefore, the use of a grid system in this study represents a methodological abstraction that facilitates spatial interaction modeling rather than a direct representation of real-world parcel structures.

4.2. Cellular Automata (CA) Model Structure

Generative systems, which are part of contemporary design applications, enable the creation of new and original design alternatives. Generative systems create design alternatives through features such as evolution, reproduction, and crossbreeding. These systems have the ability to generate complexity, the complex and interconnected relationship between organisms and their environment, the ability to self-maintain and repair, and the ability to create new structures, behaviors, outcomes, or relationships [66]. In this context, generative systems in computational design offer different rule-based models for deriving complex spatial patterns. These systems include the following: Shape Grammars are a method used to express architectural form, in which design variations are generated by directly computing sets of rules for shapes [68]. L-Systems are systems that model the growth logic of plant forms in nature and produce fractal designs [69]. Swarm Intelligence and Multi-Agent Systems aim to measure complex behaviors performed by independent agents, particularly those based on movement, interaction, and orientation [6]. Genetic Algorithm is a computational system that seeks to find the best option in the selection, mutation, and evolution cycle to produce solutions to optimization problems [70].
Cellular automata (CA) is a system of cells on a regular or irregular grid that develops according to a set of rules and time intervals, guided by the state of the neighboring cells around a cell [71]. It is a model that represents the grid-based spatial structure of the urban fabric, its neighborhood interactions, and the transformation process it undergoes over time. It allows for the systematic simulation of spatial parameters such as urban decay and urban vitality based on cell states. Therefore, CA was selected as the most suitable generative system for this study because it is compatible with the process of recurring change and development in the city over time and allows for the transfer of multi-criteria decision-making outputs to cellular behavior on the grid.
The overall modeling procedure is illustrated in Figure 2. The workflow summarizes the indicator selection process, the construction of the decision matrix, and the integration of the selected parameters into the Cellular Automata model. The Cellular Automata (CA) model operates on a grid-based spatial structure in which the study area is divided into cells representing basic spatial units. Each cell is assigned a state that reflects the spatial condition of that location based on the indicator values derived from the decision matrix. These states represent different levels of urban vitality or decline and allow the classification of spatial units into categories such as vitality clusters, transition areas, or decline zones. The evolution of cell states is governed by transition rules that consider both the intrinsic characteristics of each cell and the influence of neighboring cells within the grid. Through successive iterations, these interactions enable spatial conditions to propagate across the study area and generate neighborhood-scale patterns. The spatial scale of the model is defined by the grid resolution, while the simulation begins with initial conditions representing the existing urban structure. The outputs of the model illustrate the spatial distribution and evolution of urban vitality and decline patterns, and the model performance can be evaluated through calibration and verification procedures by comparing simulated patterns with observed spatial conditions.
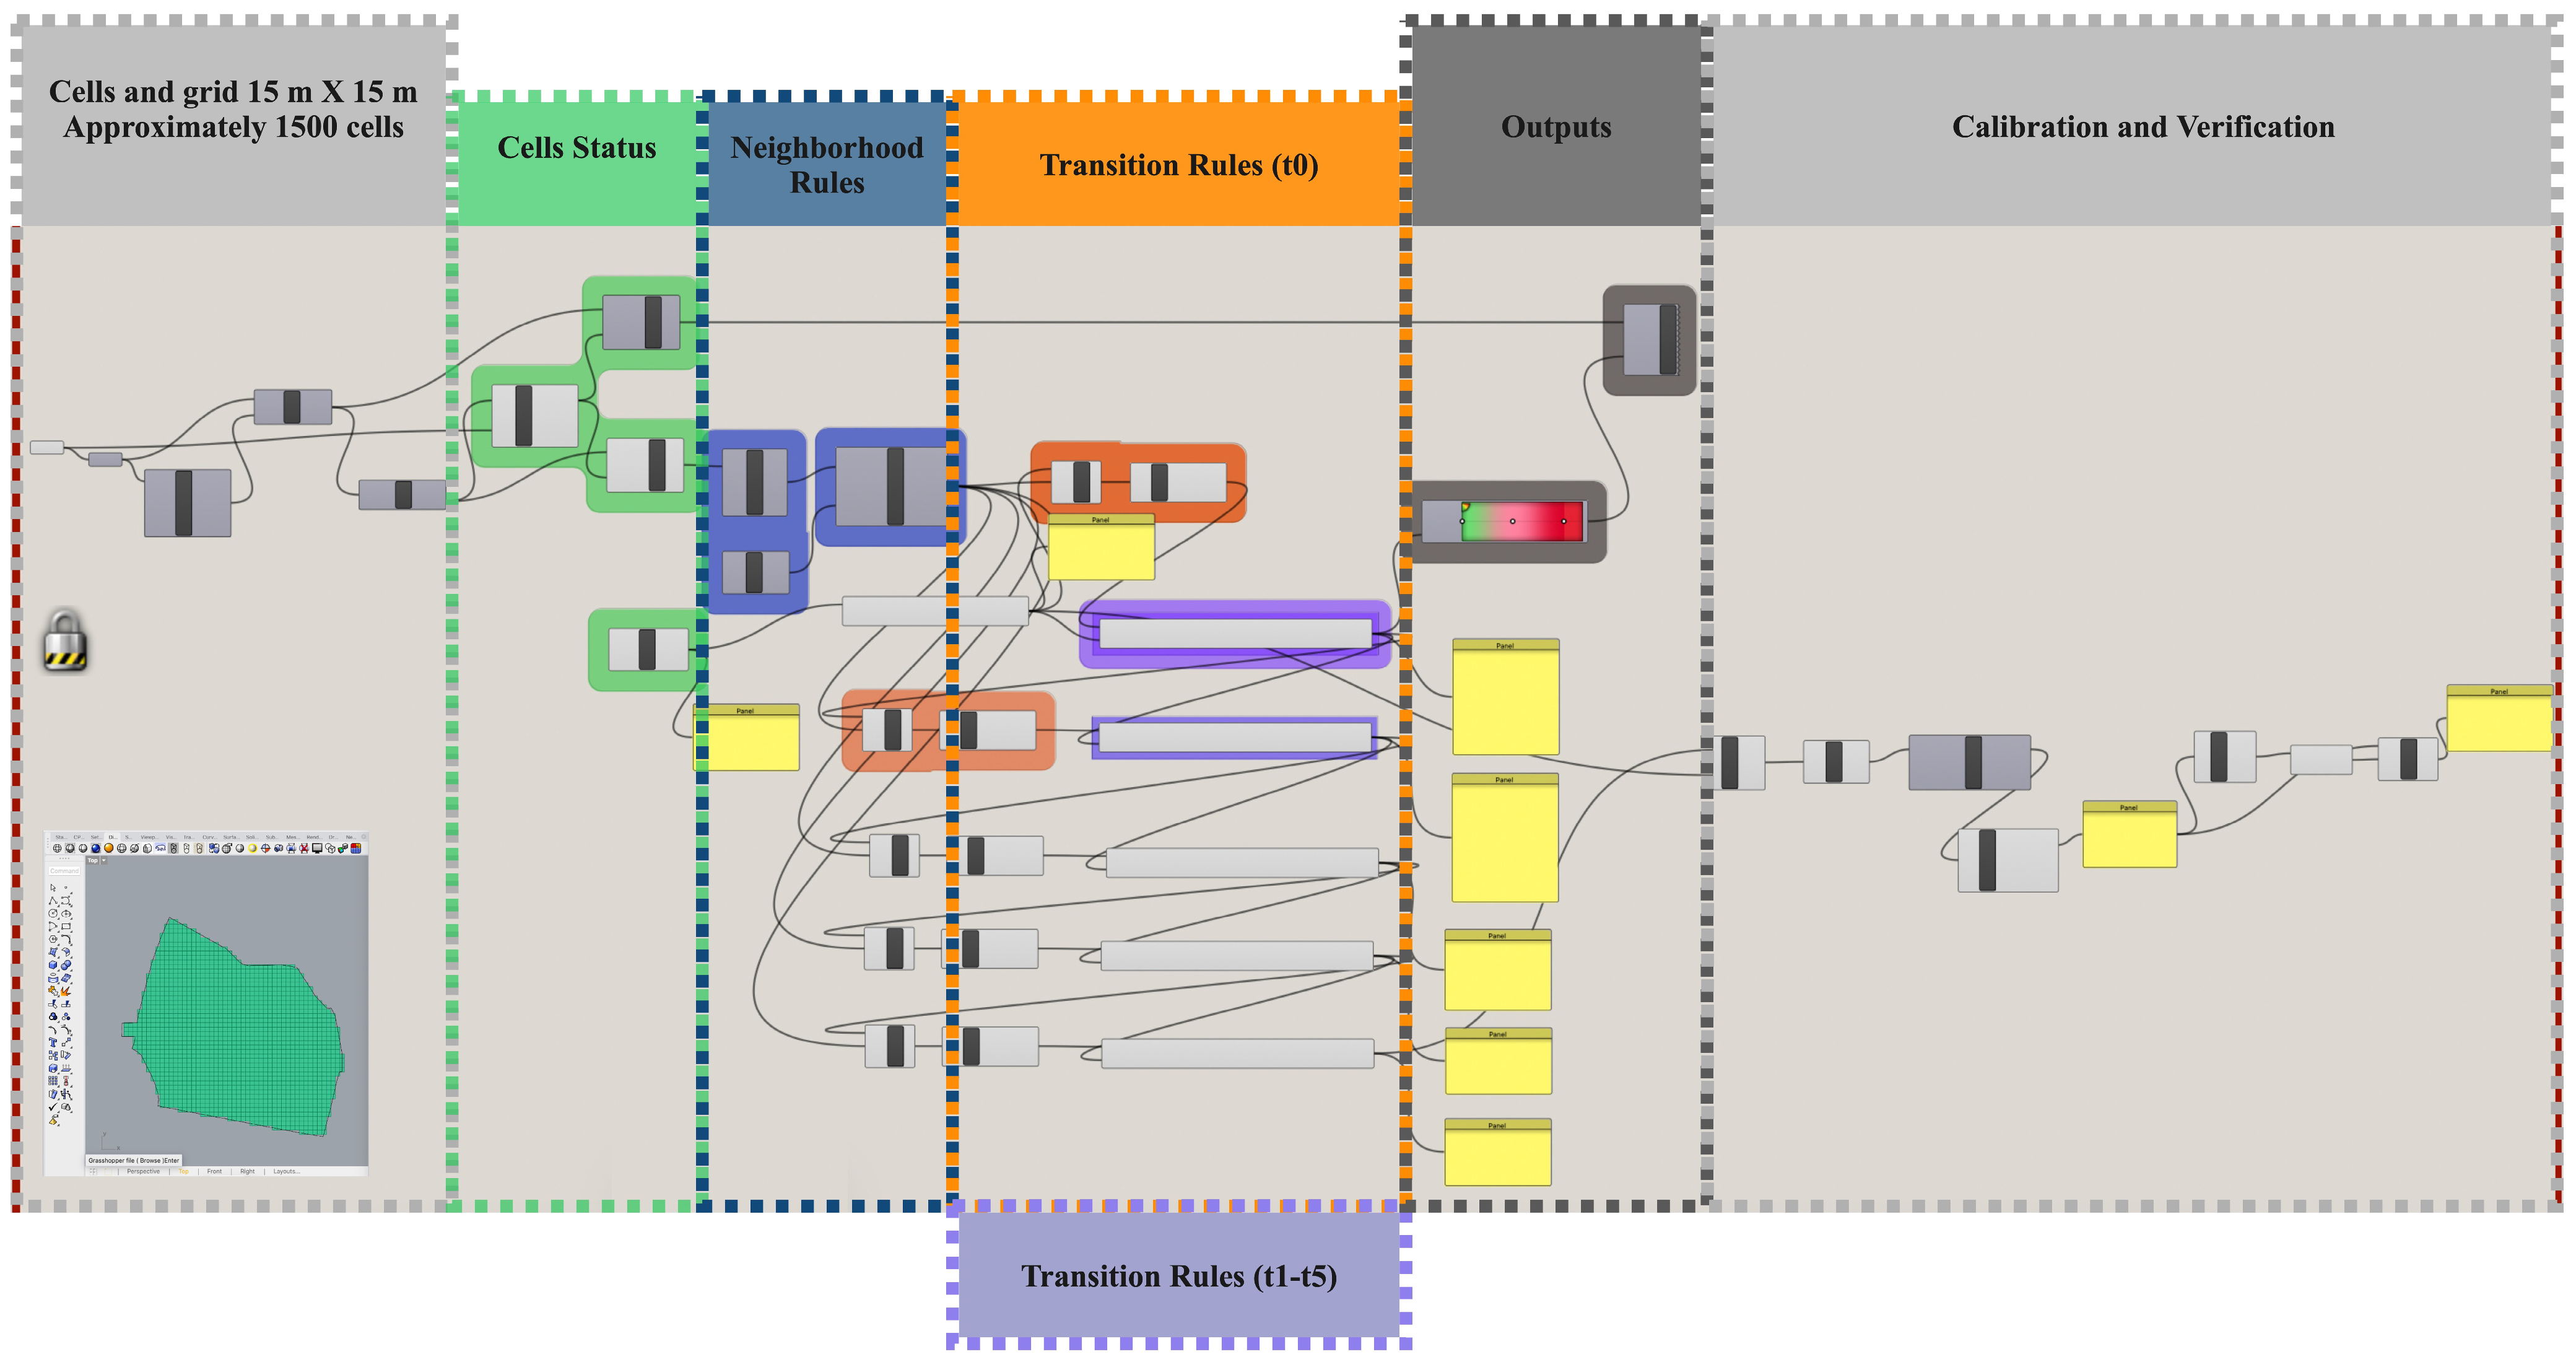
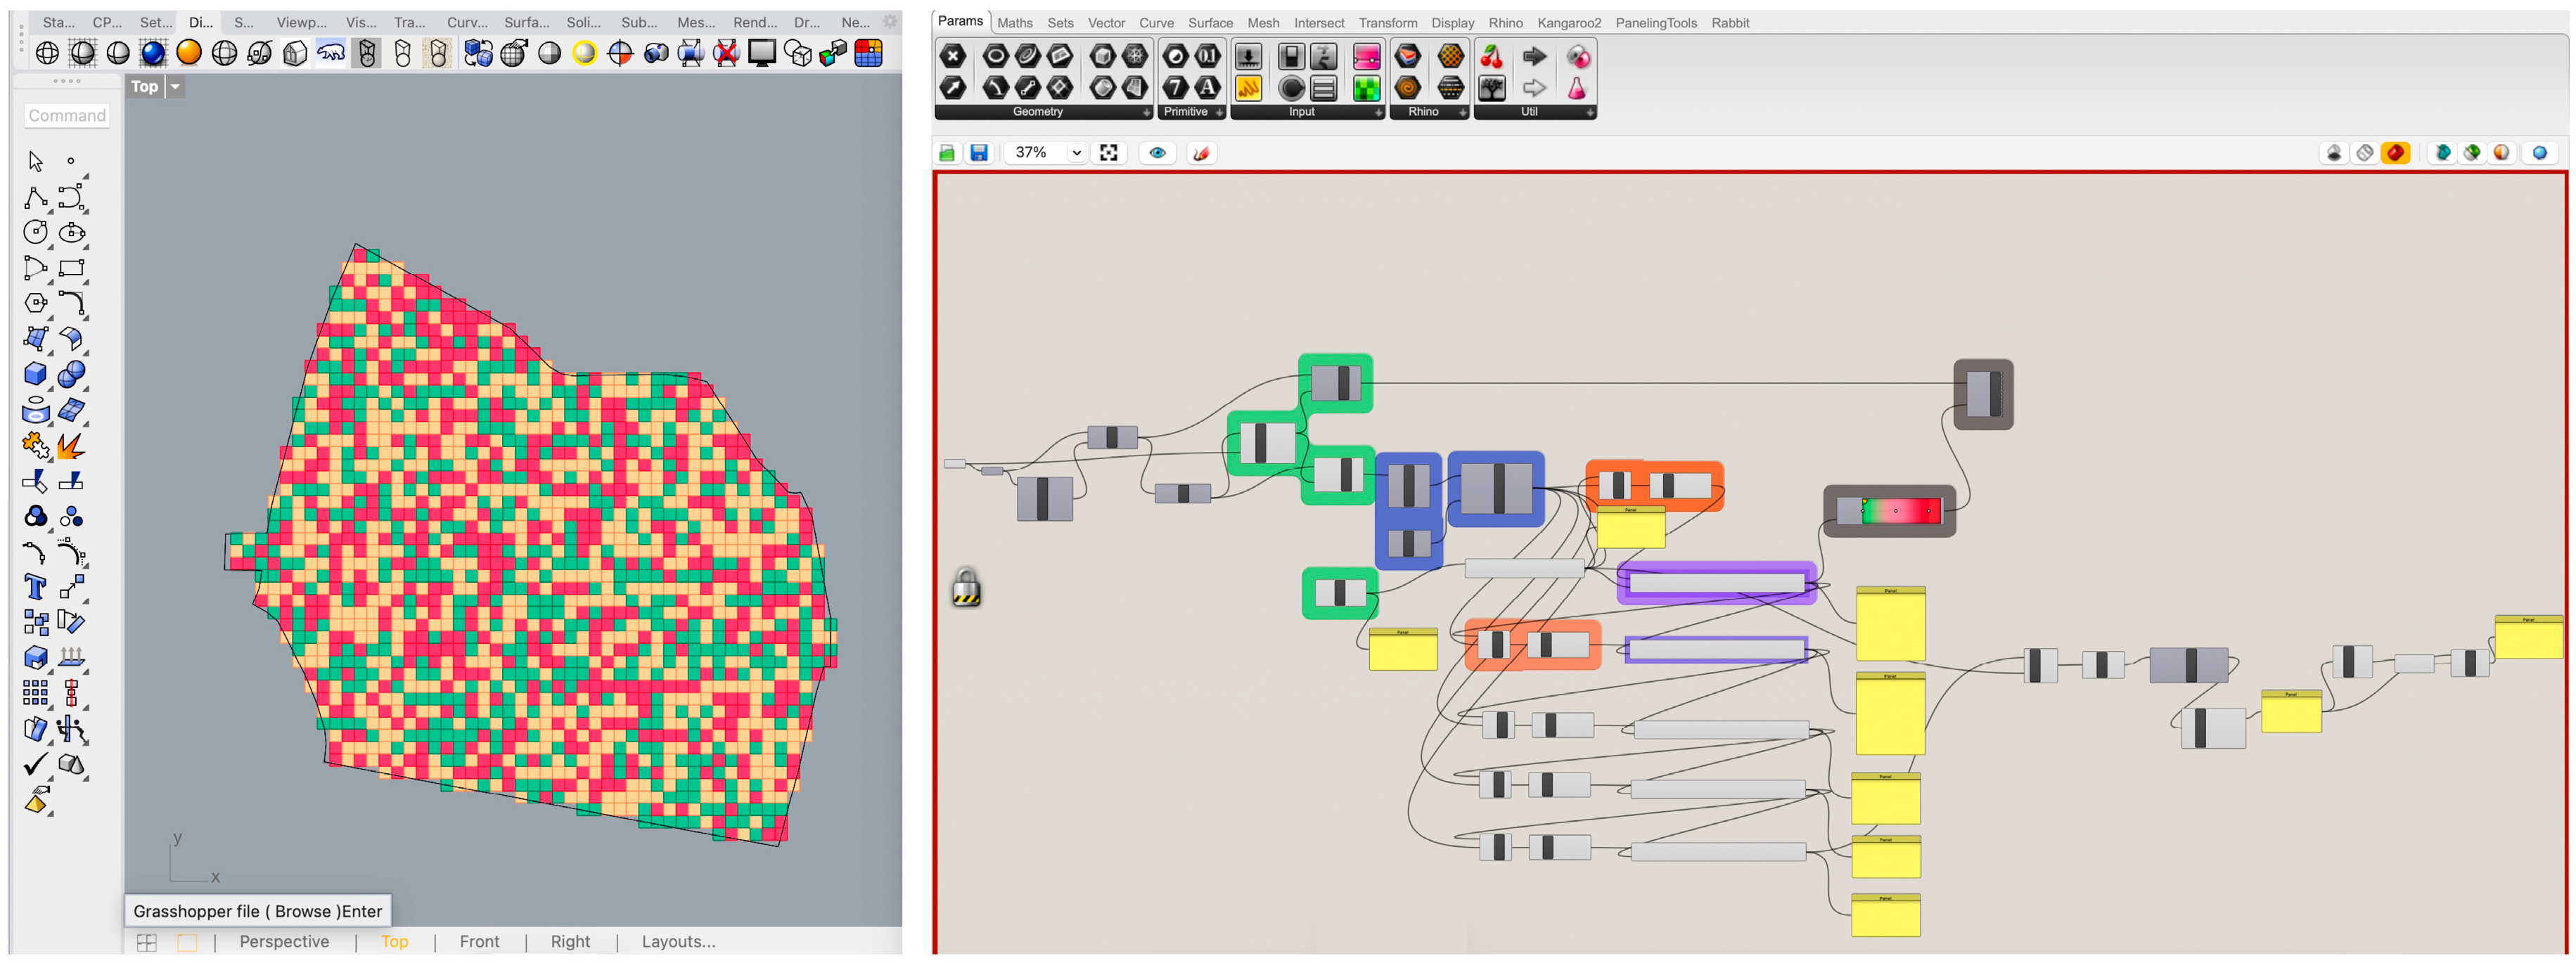
The model implementation relies on the indicators selected through the decision matrix procedure. While this section explains how these parameters are integrated into the model, the detailed evaluation and ranking of the indicators are presented in the Results section. The decision matrix resulted in a total of 13 parameters, both positive and negative. These parameters were converted to a standardized 1–5 scale to illustrate the model’s operational logic and integrated into the cellular automata framework. Scale values were defined to represent low and high vitality/collapse states. Accordingly, a value of 1 indicates a very low vitality and high collapse state, while a value of 5 indicates a very high vitality and low collapse state. Figure 4 shows the integration of the indicators determined by the decision matrix into the cellular automata model developed in the Rhino–Grasshopper environment. Workflow of the Cellular Automata model developed in the Rhino–Grasshopper environment. The model consists of several sequential stages, including grid generation (15 m × 15 m cells), assignment of cell states based on the selected indicators, definition of neighborhood rules, and implementation of transition rules. The model operates iteratively through multiple generations (t0–t5) to simulate spatial interactions among cells. The number of iterations (t0–t5) was selected to illustrate the operational logic of the model and the emergence of spatial patterns through successive interactions, rather than to represent real temporal dynamics. The outputs illustrate the spatial distribution of urban vitality and decline patterns, while the final stage includes calibration and verification procedures to evaluate the model performance.
Each cell produces a single state for 13 parameters. The average score is defined as S1 for 1.0–2.0, S2 for 2.0–3.5, and S3 for 3.5–5.0. Within the scope of the study, transition rules are defined as follows: when the average vitality level of neighboring cells exceeds certain threshold values, the cell transitions to a higher state; when it falls below the thresholds, it regresses to a lower state. Rules are determined based on the average state of neighboring cells to realistically represent interaction between cells, time-spanning transformation, and the urban process. In this context, there are three different situations:
  • If a cell’s neighbors are predominantly S3, the cell is pulled up.
  • If its neighbors are predominantly S1, the cell moves down.
  • If it is intermediate in S2 weight, the cell state is maintained.
Following this rule logic, the model was run over five successive generations (t0–t5), and the relative changes in cell states were observed.

5. Results

5.1. Literature-Based Indicator Identification

Within the scope of the literature review of urban decay, the frequency with which each criterion was repeated in each study was analyzed, and the most frequently used parameters were determined based on transition frequency. In this context, 20 studies conducted on decay areas in the literature were examined, and according to the analysis:
  • Poor physical order and facade quality was the most common parameter, appearing in 18 different sources. This parameter refers to elements such as abandoned buildings, facade deterioration, and lack of maintenance in the physical category.
  • Deterioration in quality of life was mentioned in 14 different sources. This parameter, in the social category, refers to a decrease in urban satisfaction and an increase in the tendency of the people living in the area to move away from the area.
  • Low public space ratio and poverty were mentioned in 13 different sources. Low public space ratio is in the physical category; it shows the importance of spatial planning. The poverty parameter is in the economic category; it also indicates that there are many households receiving social assistance due to the low income level of the people in the region.
  • Unemployment rate, lack of social interaction (social segregation/exclusion), building maintenance status, low housing value, crime rate and security issues, loss of place identity or cultural alienation, high emigration (migration), and low level of social solidarity (neighborhood) parameters were evaluated as priority criteria, appearing 8–12 times in different sources.
  • The decline in industrial employment rates and the neighborhood-segregating effect of transportation infrastructure (railway lines, etc.) are the least recurring criteria, appearing in only four different sources. Upon examination, these criteria are found in the literature depending on the region where the fieldwork was conducted.
As a result of this analysis, an objective evaluation was performed based on the level of acceptance in the literature, rather than just the validity of the parameters to be used in the model. As a result, Table 3 brings together the reasons emphasized by different studies under these four categories, showing that the urban decay approach is a holistic process formed at the intersection of economic, social, physical, and cultural factors.
Recent case studies have been limited to a detailed screening aimed at identifying urban decay, urban vitality, and current methods, and 21 urban vitality studies related to the subject have been identified and examined. The urban vitality measurement criteria used in the studies were analyzed and classified according to the research methods and scale. Of the 21 studies, 6 were examined at the city scale, 4 at the regional scale, 3 at the historic district scale, 4 at the neighborhood scale, 3 at the street scale, and 1 at the block scale. The studies generally used measurement criteria aimed at determining the relationship between urban form and urban vitality. These criteria were applied in case studies using different methods. The link between urban vitality and function, morphology, population density, and different aspects of the economy was revealed in many studies. Research emphasizes that distance, accessibility, density, building typology, and diversity are important spatial variables that determine urban vitality [40,46,48,49,50,51,52,54,59].
The frequency with which the measurement criteria identified in the detailed literature review on urban vitality are used to demonstrate their importance in the concept of vitality is shown in Table 4. Ref. [80] was not included in the evaluation because their review study contained conceptual explanations, and the evaluation was based on 20 studies. According to this analysis:
  • Land use diversity was the most common parameter, appearing in 12 different sources. This parameter, in the physical category, refers to the diversity in the spatial distribution of different types of use in an area, such as residential, commercial, public space, industrial, etc.
  • Commercial density and quality appeared in 11 different sources. This parameter, in the economic category, refers to commercial spaces, and quality can be measured by the number of stores, ratings, and user reviews.
  • POI (point of interest) density is found in 10 different sources. This parameter refers to the density of service, commercial, and recreational areas in a region.
  • The parameters of activity intensity in the economic category, activity intensity in the social category, and destination accessibility (walkability) in the physical category are included in 9 different sources. In addition, the parameters of building density, building size diversity, road density, public transport accessibility in the physical category, and cultural facility density/diversity in the cultural category are evaluated as priority criteria, as they are found in 8 different sources.
  • Real estate values/housing prices, street usage behaviors, population characteristics, building age diversity, active facades and permeability, distance from boundary gaps, cultural activity density, and cultural symbols parameters appear in 1–5 sources and are the least recurring criteria. When these criteria are examined, they are found in the literature depending on the area where the fieldwork was conducted.

5.2. Decision Matrix Result

The final indicator set based on the decision matrix evaluation is presented in Table 5.
Based on the urban decay literature, 5 out of 14 criteria were identified; based on the urban vitality literature, 8 out of 19 criteria were identified through decision matrices and integrated into the Cellular Automata (CA) model. In total, 13 parameters were selected, consisting of 5 negative (decay) and 8 positive (vitality) indicators. These parameters are categorized as 1 economic, 2 social, 9 physical, and 1 cultural. The decision matrix analysis produced a ranked set of parameters based on their overall evaluation scores. In the urban decay matrix, the parameters are ranked in order of importance as follows: IN1—Crime rate/security issues, IN4—Low public space ratio, IN5— Poor physical order and facade quality, IN9— Transport infrastructure’s effect of dividing neighborhoods (railway lines, etc.), and IN11— Building maintenance status. When examining the urban vitality matrix, the order of importance is IN2—Land use diversity-function, IN3—Commercial density and quality, IN6—Activity density, IN7—Active facades and permeability, IN8—Destination accessibility (walkability), IN10—POI (Point of Interest) density, IN12—Building density, and IN13—Cultural facility density and diversity. The final set of criteria to be transferred to the CA model is presented in Table 6.
The crime rate/security issue parameter is a critical indicator in terms of the causes of decline and its spatial reflection, as it has the highest total score [7]. This parameter was evaluated by examining official crime records, spatial crime densities, the area’s surveillance camera coverage, and lighting levels through field observations. The land use diversity parameter has the highest total score and is a decisive criterion for vitality in the region. This parameter refers to the diversity of functions such as residential, commercial, service, and recreational [63]. The Commercial Density and Quality parameter directly affects the economic and social structure of the area and refers to the number, diversity, and accessibility of commercial structures in the area [44]. The low public space ratio parameter refers to the ratio of parks, green spaces, and public open spaces to the total area in a region [79]. The physical order and facade quality parameter refers to the spatial assessment of problems such as lack of maintenance, material deterioration, and discontinuity of facades in buildings when evaluated through the street silhouette [9]. The activity density parameter refers to activities such as social interaction, pedestrian mobility, and frequency of use occurring in an urban area. The active facades and permeability parameter refers to the level of interaction between building facades and pedestrians in the street silhouette and the continuity of pedestrian movement in spaces [42]. The destination accessibility (walkability) parameter refers to the capacity of individuals to reach basic functions used in daily life quickly and without interruption [62]. The transportation infrastructure’s neighborhood-dividing effect parameter refers to the degree to which busy roads and railway lines disrupt a region’s spatial integrity and interrupt pedestrian mobility [9]. The POI (Point of Interest) density parameter indicates the spatial density of commercial, social, cultural, and service functions in an urban area [63]. The building maintenance condition parameter indicates the physical condition and maintenance level of structures in the area [17]. The building density parameter represents the density of structures in an area [7]. Density values were determined by calculating the number of buildings and floor area in each grid cell using satellite images, zoning plans, and field observations. They were scored from 1 (very low building density) to 5 (very high building density) and integrated into the model. The parameter is positively correlated and represents urban vitality. The cultural facility density and diversity parameter indicates the number and functional diversity of spaces such as libraries, museums, cultural centers, theaters, and art studios in the urban area [42].

5.3. Spatial Pattern Generation

The model was run over generations t0–t5 to examine relative spatial changes in cell states. In each generation, the composite state values of cells were recalculated based on neighborhood effects and indicator densities, and spatial patterns were observed.
The final generation map presented in Figure 5 shows distinct clustering at the neighborhood scale. Red cells represent depression clusters, green cells represent vitality foci, and yellow cells represent transition zones. When examining the spatial distribution, it is seen that the decline areas are concentrated in specific foci and have a gradual effect on the cells surrounding these areas. Similarly, positive clusters have formed in areas with high vitality indicators, and it has been determined that these cells show spatial continuity with neighboring areas.
The distribution obtained reveals that the indicators interact spatially not only through individual values but also through neighborhood relationships. Thus, the model provides an analytical framework that makes the relative distribution of fragility and vitality trends visible at the neighborhood scale.
From a planning perspective, the proposed framework may support the identification of spatial patterns of vitality and decline at the neighborhood scale and provide an analytical basis for urban regeneration strategies. In particular, the model can help planners identify priority intervention areas, evaluate the spatial effects of potential planning actions, and support evidence-based decision-making processes. This approach may be particularly useful in historic or mixed-use urban centers where complex spatial, social, and functional interactions influence urban vitality. By integrating multiple indicators within a spatial modeling environment, the framework may contribute to more informed and context-sensitive urban regeneration policies.
This study aims to integrate the indicators determined by the decision matrix into the cellular automata model and to present the spatial analysis logic. The algorithmic and structural design of the model has been completed, and the indicator set can be integrated into the grid-based system. However, within the scope of this study, the parameters have not been calibrated with field data. The model provides an open framework for application and validation with context-specific datasets. The proposed model offers a decision-support tool for identifying priority intervention areas and supporting urban regeneration strategies at the neighborhood scale.

6. Discussion

This study addresses urban decay and urban vitality as opposing yet interrelated processes and proposes a methodological framework that quantifies this dual structure through an indicator-based decision matrix and transfers it into the spatial domain using a cellular automata model. In the literature, urban decay is generally examined through physical deterioration, while urban vitality is often assessed through indicators of density and centrality. By integrating economic, social, physical, and cultural dimensions, this study develops a more comprehensive evaluation approach.
The primary contribution of the proposed model lies not only in identifying indicators but also in integrating them into a spatial grid system and transforming them into an interactive, cell-based analytical framework. This approach makes the relative distribution of vulnerability areas and vitality nodes visible at the neighborhood scale, offering an analytical basis for planning and design processes. Rather than producing a predictive growth simulation, the model is positioned as a decision-support tool that reveals the spatial co-effect of indicators.
However, within the scope of this study, the model has not been calibrated with context-specific field data. Therefore, the resulting spatial distributions do not claim temporal validation but aim to demonstrate the operational logic of the method. Although the model presented in this study was not calibrated with empirical field data, future studies may evaluate the model performance through sensitivity analysis or by comparing simulated spatial patterns with observed urban vitality conditions. Future research integrating local datasets and conducting comparative applications across different neighborhoods will be essential to enhance the model’s generalizability and validation.
In addition to representing existing spatial patterns, the proposed Cellular Automata framework may also support scenario-based explorations of urban vitality dynamics. By modifying indicator values, the model can simulate potential spatial outcomes under different planning interventions. Table 7 illustrates three hypothetical scenarios that demonstrate how changes in selected indicators may influence vitality and decline patterns at the neighborhood scale. The proposed framework may also support scenario-based explorations of urban vitality dynamics.
In this respect, the study contributes to making urban decay and vitality processes measurable and spatially operational and proposes a methodological approach for integrating computational design tools into neighborhood-scale decision-support mechanisms. The model has not been calibrated using empirical field data and therefore does not aim to produce validated predictive outputs. Instead, it is positioned as an exploratory decision-support framework. Future research may incorporate validation strategies such as sensitivity analysis, comparison with observed spatial patterns, and integration of empirical datasets. The findings of this study may also contribute to broader discussions on sustainable urban development. In particular, identifying spatial patterns of urban vitality and decline at the neighborhood scale can support evidence-based planning strategies aimed at improving urban living conditions, enhancing public spaces, and strengthening local urban dynamics. In this sense, indicator-based spatial analysis frameworks such as the one proposed in this study may contribute to planning approaches aligned with the objectives of Sustainable Development Goal 11, which aims to create inclusive, safe, resilient, and sustainable cities.

Author Contributions

Conceptualization, A.T.G. and S.B.; Methodology, A.T.G. and S.B.; Software, A.T.G.; Validation, A.T.G.; Formal analysis, A.T.G. and S.B.; Investigation, A.T.G.; Resources, A.T.G.; Data curation, A.T.G.; Writing—original draft, A.T.G.; Writing—review and editing, S.B.; Visualization, A.T.G.; Supervision, S.B.; Project administration, S.B.; Funding acquisition, S.B. All authors have read and agreed to the published version of the manuscript.

Funding

This research received no external funding.

Data Availability Statement

The original contributions presented in this study are included in the article. Further inquiries can be directed to the corresponding author.

Conflicts of Interest

The authors declare no conflicts of interest.

Abbreviations

The following abbreviations are used in this manuscript:
CACellular Automata
INIndicator/Parameter

References

  1. Accordino, J.; Johnson, G.T. Addressing the vacant and abandoned property problem. J. Urban Aff. 2000, 22, 301–315. [Google Scholar] [CrossRef] [Scilit]
  2. Roberts, P.; Sykes, H. Urban Regeneration: A Handbook; Routledge: London, UK, 2000. [Google Scholar]
  3. Batty, M. Cities and Complexity: Understanding Cities with Cellular Automata, Agent-Based Models, and Fractals; MIT Press: Cambridge, MA, USA, 2005. [Google Scholar]
  4. Pinto, A.M.F.; Ferreira, F.A.F.; Spahr, R.W.; Sunderman, M.A. Analyzing blight impacts on urban areas: A multi-criteria approach. Land Use Policy 2021, 108, 105661. [Google Scholar] [CrossRef] [Scilit]
  5. Ferreira, F.A.F.; Spahr, R.W.; Sunderman, M.A.; Marjan, S. A prioritisation index for blight intervention strategies in residential real estate. J. Oper. Res. Soc. 2017, 5682, 1269–1285. [Google Scholar] [CrossRef] [Scilit]
  6. Akyol, S.; Alataş, B. Güncel sürü zekâsı optimizasyon algoritmaları. Nevşehir Univ. J. Sci. Technol. 2012, 1, 36–50. [Google Scholar]
  7. Chakraborty, B.; Dey, P. Revisiting the notion of urban blight in the context of Global South: A discursive approach. In Proceedings of the ISOCARP World Planning Congress 2024; ISOCARP: The Hague, The Netherlands, 2024. [Google Scholar]
  8. Egercioğlu, Y.; Yakıcı, N.; Ertan, T. Urban Decline and Revitalization Project in Izmir-Tire Historical City Center. Procedia Soc. Behav. Sci. 2016, 216, 330–337. [Google Scholar] [CrossRef] [Scilit]
  9. Arabacıoğlu, F.P.; Yılmaz, L. Kentsel Terk Alanların Oluşum Süreci ve Mekânsal Sürdürülebilirliği. Master’s Thesis, Istanbul Technical University, Istanbul, Türkiye, 2023. [Google Scholar]
  10. Çağlayandereli, M.; Mazlum, A.; Tanaydın, M. The Tendency of Slumization in the Gecekondu: The Example of Mersin Province. Int. J. Eurasia Soc. Sci. 2018, 9, 648–671. [Google Scholar]
  11. Lees, L.; Slater, T.; Wyly, E. Gentrification; Routledge: New York, NY, USA, 2008. [Google Scholar]
  12. Batty, M. Cellular automata and urban form. Environ. Plan. B 1997, 24, 266–274. [Google Scholar]
  13. United Nations. Transforming Our World: The 2030 Agenda for Sustainable Development; United Nations: New York, NY, USA, 2015.
  14. Lefebvre, H. Writings on Cities; Blackwell Publishers: Oxford, UK, 1973. [Google Scholar]
  15. Işıkkaya, D. Kentsel Çöküntü Bölgelerinin Örgütlenmesi ve Yeniden Kullanımı. Master’s Thesis, Yıldız Technical University, Istanbul, Türkiye, 2008. [Google Scholar]
  16. Breger, G.E. The concept and causes of urban blight. Land Econ. 1967, 43, 369–376. [Google Scholar] [CrossRef] [Scilit]
  17. Al-Mohannadi, A.S.; Al-Mohannadi, M.S.; Pokharel, S. Mitigation of urban voids in traditional neighborhoods: The case of the Al-Najada zone in Doha, Qatar. J. Urban Manag. 2023, 12, 327–343. [Google Scholar] [CrossRef] [Scilit]
  18. Johnson, M.P.; Hollander, J.; Hallulli, A. Maintain, demolish, re-purpose: Policy design for vacant land management using decision models. Cities 2014, 40, 151–162. [Google Scholar] [CrossRef] [Scilit]
  19. Doron, G.M. Architecture of Transgression; Wiley: London, UK, 2000. [Google Scholar]
  20. Sampson, R.J.; Raudenbush, S.W. Seeing disorder: Neighborhood stigma and the social construction of broken windows. Soc. Psychol. Q. 2004, 67, 319–342. [Google Scholar] [CrossRef] [Scilit]
  21. Kelling, G.L.; Coles, C.M. Fixing Broken Windows: Restoring Order and Reducing Crime in Our Communities; Touchstone: New York, NY, USA, 1996. [Google Scholar]
  22. Mireku, S.A.; Abubakari, Z.; Martinez, J. Dimensions of Urban Blight in Emerging Southern Cities: A Case Study of Accra, Ghana. Sustainability 2021, 13, 8399. [Google Scholar] [CrossRef] [Scilit]
  23. Doğaner, A. Türkiye’de Kentsel Dönüşüm Politikaları ve Finansman Modelleri. Ph.D. Thesis, Istanbul University, Istanbul, Türkiye, 2017. [Google Scholar]
  24. Fabiyi, O. Analysis of Urban Decay from Low Resolution Satellite Remote Sensing Data: Example from Organic City in Nigeria. Ph.D. Thesis, University of Ibadan, Ibadan, Nigeria, 2011. [Google Scholar]
  25. Clinard, M.B. Slums and Community Development; Collier-Macmillan Press: Toronto, ON, Canada, 1966. [Google Scholar]
  26. Wirth, L. The Ghetto; University of Chicago Press: Chicago, IL, USA, 1928. [Google Scholar]
  27. Arık, F. Gecekonduyu Wacquant’la düşünmek: Umut mekânlarında toplumsal ve mekânsal dönüşüm. Kent Araştırmaları Derg. 2019, 10, 278–315. [Google Scholar] [CrossRef] [Scilit]
  28. Ambey, A.; Srivastava, K. Leaders of slum dwellers: A study based on slums of Jaipur city. Int. J. Soc. Sci. 2013, 8, 18–24. [Google Scholar]
  29. Adaman, F.; Keyder, Ç. Türkiye’de Büyük Kentlerin Gecekondu ve Çöküntü Mahallelerinde Yaşanan Yoksulluk ve Sosyal Dışlanma; Boğaziçi University: Istanbul, Türkiye, 2005. [Google Scholar]
  30. Ergönül, E. Kentsel çöküntü alanları üzerine teorik bir tartışma. Kafkas Üniv. İktisadi İdari Bilim. Fakültesi Derg. 2020, 11, 155–180. [Google Scholar] [CrossRef] [Scilit]
  31. Carter, T. Winnipeg’s Inner City in 2001; Canada Research Chair in Urban Change and Adaptation: Winnipeg, MB, Canada, 2003. [Google Scholar]
  32. Aytaç, D.Ö. Mahalle Ölçeğinde Dayanıma Yönelik Bütünleşik Bir Model Önerisi: Soğanlı Mahallesi Örneği. Master’s Thesis, Bursa Uludağ University, Bursa, Türkiye, 2022. [Google Scholar]
  33. Gobster, P.H.; Hadavi, S.; Rigolon, A.; Stewart, W.P. Measuring landscape change, lot by lot: Greening activity in response to a vacant land reuse program. Landsc. Urban Plan. 2020, 196, 103729. [Google Scholar] [CrossRef] [Scilit]
  34. Kırdar Bakraç, G. A Decision Support Model Based on Bayesian Belief Network to Evaluate Urban Vibrancy. Ph.D. Thesis, Istanbul Technical University, Istanbul, Türkiye, 2023. [Google Scholar]
  35. Jacobs, J. The Death and Life of Great American Cities; Random House: New York, NY, USA, 1961; ISBN 978-0-394-42159-9. [Google Scholar]
  36. Lynch, K. Good City Form; MIT Press: Cambridge, MA, USA, 1984. [Google Scholar]
  37. Maas, P. Towards a Theory of Urban Vitality; Delft University Press: Delft, The Netherlands, 1984. [Google Scholar]
  38. Montgomery, J. Making a city: Urbanity, vitality and urban design. J. Urban Des. 1998, 3, 93–116. [Google Scholar] [CrossRef] [Scilit]
  39. Gehl, J. Life Between Buildings: Using Public Space; Island Press: Washington, DC, USA, 2011. [Google Scholar]
  40. Jin, X.; Long, Y.; Sun, W.; Lu, Y.; Yang, X.; Tang, J. Evaluating cities’ vitality and identifying ghost cities in China with emerging geographical data. Cities 2017, 63, 98–109. [Google Scholar] [CrossRef] [Scilit]
  41. Paköz, M.Z.; Işık, M. Rethinking urban density, vitality and healthy environment in the post-pandemic city: The case of Istanbul. Cities 2022, 124, 103598. [Google Scholar] [CrossRef] [Scilit]
  42. Eloah, A.; Noronha, M.; Tuncer, B.; Celani, G. Achieving urban vitality in knowledge territories: Morphology assessment for the early design stages. Buildings 2025, 15, 3393. [Google Scholar] [CrossRef] [Scilit]
  43. Warnke, J. Mobility and migration: The challenge to community vitality in the Eastern Townships of Quebec. J. East. Townsh. Stud. 2005, 26, 65–79. [Google Scholar]
  44. Wang, Z.; Wang, X.; Liu, Y.; Zhu, L. Identification of 71 factors influencing urban vitality and examination of their spatial dependence: A comprehensive validation applying multiple machine-learning models. Sustain. Cities Soc. 2024, 108, 105491. [Google Scholar] [CrossRef] [Scilit]
  45. Nederhand, J.; Avelino, F.; Awad, I.; Jong, P.; Duijn, M.; Edelenbos, J.; Engelbert, J.; Fransen, J.; Schiller, M.; Stapele, N. Reclaiming the city from an urban vitalism perspective: Critically reflecting smart, inclusive, resilient and sustainable just city labels. Cities 2023, 137, 104257. [Google Scholar] [CrossRef] [Scilit]
  46. Gao, C.; Li, S.; Sun, M.; Zhao, X.; Liu, D. Exploring the relationship between urban vibrancy and built environment using multi-source data: Case study in Munich. Remote Sens. 2024, 16, 1107. [Google Scholar] [CrossRef] [Scilit]
  47. Gao, F.; Deng, X.; Liao, S.; Liu, Y.; Li, H.; Li, G.; Chen, W. Portraying business district vibrancy with mobile phone data and optimal parameters-based geographical detector model. Sustain. Cities Soc. 2023, 96, 104635. [Google Scholar] [CrossRef] [Scilit]
  48. Gökçe, D. An Empirical Investigation of the Interplay Between Typo-Morphological Transformation of Historic House form and Sense of Place. Ph.D. Thesis, University of Liverpool, Liverpool, UK, 2017. [Google Scholar]
  49. Lee, J.A.; Lee, J.H.; Je, M.H. Guidelines on unused open spaces between buildings for sustainable urban management. Sustainability 2021, 13, 13482. [Google Scholar] [CrossRef] [Scilit]
  50. Li, M.; Pan, J. Assessment of influence mechanisms of built environment on street vitality using multisource spatial data: A case study in Qingdao, China. Sustainability 2023, 15, 1518. [Google Scholar] [CrossRef] [Scilit]
  51. Ling, Z.; Zheng, X.; Chen, Y.; Qian, Q.; Zheng, Z.; Meng, X.; Kuang, J.; Chen, J.; Yang, N.; Shi, X. The nonlinear relationship and synergistic effects between built environment and urban vitality at the neighborhood scale: A case study of Guangzhou’s central urban area. Remote Sens. 2024, 16, 2826. [Google Scholar] [CrossRef] [Scilit]
  52. Ye, Y.; Li, D.; Liu, X. How block density and typology affect urban vitality: An exploratory analysis in Shenzhen, China. Urban Geogr. 2018, 39, 631–652. [Google Scholar] [CrossRef] [Scilit]
  53. Qian, X.; Chengzhi, Y. From redevelopment to gentrification in Hong Kong: A case study of Kwun Tong Town Center Project. Open House Int. 2018, 43, 83–93. [Google Scholar] [CrossRef] [Scilit]
  54. Zumelzu, A.; Barrientos-Trinanes, M. Analysis of the effects of urban form on neighborhood vitality: Five cases in Valdivia, Southern Chile. J. Hous. Built Environ. 2019, 34, 897–925. [Google Scholar] [CrossRef] [Scilit]
  55. Zhu, J.; Liu, W.; Liu, Y.; Wang, D.; Qu, S.; Duan, Y.; Yao, J. Smart city oriented optimization of residential blocks on intensive urban sensing data based on fuzzy evaluation algorithm. J. Ambient Intell. Humaniz. Comput. 2021, 12, 911–921. [Google Scholar] [CrossRef] [Scilit]
  56. Wang, S.; Deng, Q.; Jin, S.; Wang, G. Re-examining urban vitality through Jane Jacobs’ criteria using GIS-sDNA: The case of Qingdao, China. Buildings 2022, 12, 1586. [Google Scholar] [CrossRef] [Scilit]
  57. Huang, X.; Jiang, P.; Li, M.; Zhao, X. Applicable framework for evaluating urban vitality with multiple-source data: Empirical research of the Pearl River Delta urban agglomeration using BPNN. Land 2022, 11, 1901. [Google Scholar] [CrossRef] [Scilit]
  58. Garau, C.; Annunziata, A. A method for assessing the vitality potential of urban areas: The case study of the metropolitan city of Cagliari, Italy. City Territ. Archit. 2022, 9, 15. [Google Scholar] [CrossRef] [Scilit]
  59. Zou, H.; Liu, R.; Cheng, W.; Lei, J.; Ge, J. The association between street built environment and street vitality based on quantitative analysis in historic areas: A case study of Wuhan, China. Sustainability 2023, 15, 1732. [Google Scholar] [CrossRef] [Scilit]
  60. Lyu, Y.; Abd Malek, M.I.; Ja’afar, N.H.; Sima, Y.; Han, Z.; Liu, Z. Unveiling the potential of space syntax approach for revitalizing historic urban areas: A case study of Yushan historic district, China. Front. Archit. Res. 2023, 12, 1144–1156. [Google Scholar] [CrossRef] [Scilit]
  61. Li, J.; Li, J.; Song, Z.; Wen, J.; Cai, C.; Tang, P. Exploring nonlinear relationship between built environment and street vitality using machine learning. In Proceedings of the 29th International Conference of the Association for Computer-Aided Architectural Design Research in Asia (CAADRIA), Hong Kong, China, 23–25 April 2024. [Google Scholar]
  62. Wei, H.; Wang, G. Investigating the spatiotemporal pattern between street vitality in historic cities and built environments using multisource data in Chaozhou, China. J. Urban Plan. Dev. 2024, 150, 04024010. [Google Scholar] [CrossRef] [Scilit]
  63. Chen, J.; Ren, K.; Li, P.; Wang, H.; Zhou, P. Toward effective urban regeneration post-COVID-19: Urban vitality assessment to evaluate people preferences and place settings integrating LBSNs and POI. Environ. Dev. Sustain. 2024, 28, 10047–10070. [Google Scholar] [CrossRef] [Scilit]
  64. Wahyudi, A.; Liu, Y. Cellular automata for urban growth modelling: A review on factors defining transition rules. Int. Rev. Spat. Plan. Sustain. Dev. 2016, 4, 60–75. [Google Scholar] [CrossRef] [Scilit]
  65. Rikalovic, A.; Cocic, I.I. GIS based multi-criteria decision analysis for industrial site selection: The state of the art. J. Appl. Eng. Sci. 2014, 12, 177–186. [Google Scholar] [CrossRef] [Scilit]
  66. McCormack, J.; Dorin, A.; McCormack, J. Generative design: A paradigm for design research. In Proceedings of the Design Research Society Conference, Melbourne, Australia, 17–21 November 2004; pp. 17–21. [Google Scholar]
  67. Dinçer, A.E. Hücresel Özdevinim Yaklaşımı ile Kitlesel Konut Tasarımında Sayısal Bir Model. Ph.D. Thesis, İstanbul Teknik Üniversitesi, Fen Bilimleri Enstitüsü, İstanbul, Türkiye, 2014. [Google Scholar]
  68. Knight, T.; Stiny, G. Classical and non-classical computation. Archit. Res. Q. 2001, 5, 355–372. [Google Scholar] [CrossRef] [Scilit]
  69. Singh, V.; Gu, N. Towards an integrated generative design framework. Des. Stud. 2012, 33, 185–207. [Google Scholar] [CrossRef] [Scilit]
  70. Taşkın, Ç.; Emel, G. Genetik algoritmalar ve uygulama alanları. Uludağ Univ. J. Econ. Adm. Sci. 2002, 21, 129–152. [Google Scholar]
  71. Rocker, I.M. When code matters. Archit. Des. 2006, 76, 16–21. [Google Scholar] [CrossRef] [Scilit]
  72. Medhurst, F.; Lewis, P. Urban Decay: An Analysis and a Policy; Macmillan: London, UK, 1969. [Google Scholar]
  73. Baransü, B. Şehir Yenileme; Reyo Basımevi: Istanbul, Türkiye, 1989. [Google Scholar]
  74. Friedrichs, J. A theory of urban decline: Economy, demography and political elites. Urban Stud. 1993, 30, 907–917. [Google Scholar] [CrossRef] [Scilit]
  75. Kompil, E.I.; Avar, A.A. Deprivation analysis in declining inner city residential areas: A case study from Izmir, Turkey. In Proceedings of the 46th Congress of the European Regional Science Association: Enlargement, Southern Europe and the Mediterranean, Volos, Greece, 30 August—3 September 2006. [Google Scholar]
  76. Işıkkaya, D.; Önel, H. Kentsel çöküntü bölgelerinin örgütlenmesi ve yeniden kullanımı. YTÜ Arch. Fac. E J. 2008, 3, 187. [Google Scholar]
  77. Günday, E. Urban Decline and Low Demand Housing Case Study: Damlacık (İzmir) District. Master’s Thesis, Dokuz Eylül University, Izmir, Türkiye, 2009. [Google Scholar]
  78. Costa, J.B.; Ferreira, F.A.F.; Spahr, R.W.; Sunderman, M.A.; Pereira, L.F. Intervention strategies for urban blight: A participatory approach. Sustain. Cities Soc. 2021, 70, 102901. [Google Scholar] [CrossRef] [Scilit]
  79. Vanhuysse, S.; Georganos, S.; Abascal, A.; Rodríguez-Carre, I.; Sliuzas, R.; Wolff, E.; Kuffer, M. Identifying degrees of deprivation from space using deep learning and morphological spatial analysis of deprived urban areas. Comput. Environ. Urban Syst. 2022, 95, 101820. [Google Scholar] [CrossRef] [Scilit]
  80. Liu, S.; Ge, J.; Ye, X.; Wu, C.; Bai, M. Urban vitality assessment at the neighborhood scale with geo-data: A review toward implementation. J. Geogr. Sci. 2023, 33, 1482–1504. [Google Scholar] [CrossRef] [Scilit]
Figure 1. The formation process of decay areas.
Buildings 16 01528 g001
Figure 2. Workflow of the indicator-based cellular automata modeling framework.
Buildings 16 01528 g002
Figure 3. Konya Şemsi Tebrizi neighborhood; red dots indicate the neighborhood boundaries.
Buildings 16 01528 g003
Figure 4. Workflow of the cellular automata model showing the integration of selected indicators in the Rhino–Grasshopper environment.
Buildings 16 01528 g004
Figure 5. Spatial pattern distribution formed during the t0–t5 process within the cellular automata model (red: collapse, yellow: transition, green: vitality).
Buildings 16 01528 g005
Table 1. Analytical comparison of indicator-based approaches used in urban vitality studies.
StudyResearch FocusMethod/Analytical ApproachData TypeCase Study/Spatial Scale
[1]Vacant and Abandoned Properties and Urban VitalityUrban AnalysisSurvey + Property Data AssessmentThe 200 Largest Cities in the U.S./City center
[40]Urban form and vitalitySpatial-Scale Data Analysis
Spatial regression analysis
POI + Road links50 Different Cities in China/City
[52]Urban morphology and urban vitalityBig data analysisMobile phone data, POIShenzhen, China/Neighborhood
[53]Urban renewal and urban vitalityField ResearchInterviewsKwun Tong-Hong Kong/City center
[54]Urban form and vitalitySpatial AnalysisStatic Snapshot MethodValdivia, Sili/Neighborhood
[55]Urban form and vitalityFuzzy Evaluation AlgorithmMulti-source big dataXi’an, China/City
[49]Urban vitality distributionField ResearchSurvey + interviewSeoul/City Micro-Scale
[56]Urban vitality assessmentMulti-source spatial data analysisGIS + big data + POIQingdao, China/Historic City
[57]Urban development, urban environment, and urban activityBPNN (Backpropagation Neural Network)GIS + big dataTianjin, China/City
[58]Urban vitality distributionMulti-source spatial data analysisSpace Syntax + POICagliari, Italy/City
[50]Urban vitality evaluationUrban AnalysisMGWR Analysis
+ TOPSIS Method + POI
Qingdao, China/Street Life, City
[59]Urban vitality analysisSpatial Analysis
-Statistical Modeling
POI + Road network data + Baidu heatmap dataWuhan, China/Street Life, Historic District
[47]Urban vitality analysisInteraction Analysis Using the Geographical Detector ModelPOI + Mobile Phone dataBeijing, China/District (Business Center)
[60]Urban vitality assessmentSpace SyntaxMulti-source dataYushan, China/Historic District
[61]Urban vitality analysis3D Street Data Analysis
-Deep Learning
SHAP-GBDT ModelsDingshu, China/Street vitality, Neighborhood
[62]Spatially and temporally dependent urban vitalitySpatial and Time-Weighted Regression (GTWR)POI + Street View Data + Baidu Heat MapChaozhou, China/Historic District
[51]Human movement and the built environmentMulti-source spatial data analysisMGWR + Xgboost-SHAP Model + NDVI +POI
+ Baidu Heat Map
Guangzhou, China/Neighborhood
[44]Urban vitality modelingMachine LearningSpatial Dependency AnalysisChina/Regional and City
[63]Urban vitality analysisLogistic Regression AnalysisPOI + Social Media DataSuzhou, China/District
[42]Urban morphology and urban vitalityRhino- Grasshopper modelingGoogle Earth data + GIS + Field research + InterviewsSaclay Moulon, Paris/Block
Table 2. Decision matrix criteria evaluation guide.
CriterionDescriptionScale (1–5)
Theoretical ValidityFrequency of occurrence in the literature1 = low frequency, 5 = high frequency
Data AccessibilityAvailability and reliability of data1 = no data, 5 = directly measurable
Spatial FeasibilitySuitability for grid-based spatial modeling1 = not spatially measurable, 5 = directly grid-compatible
Model CompatibilityRelevance to CA transition rules1 = weak relation, 5 = directly linked
Impact LevelStrength of influence on decay/vitality processes1 = negligible, 5 = determinant
Table 3. Frequency of parameter occurrence in the urban decay literature (n = 20).
CategoryIndicatorFrequency
EconomicPoverty13
EconomicUnemployment Rate12
EconomicDecline in industrial employment rate4
EconomicLow housing value9
SocialLack of Social Interaction (Social Segregation/Exclusion)10
SocialCrime rate/Security issues9
SocialHigh external migration (Migration)8
SocialDeterioration in quality of life14
PhysicalLow ratio of public space13
PhysicalBuilding maintenance status10
PhysicalPoor physical order and facade quality18
PhysicalTransport infrastructure’s effect of dividing neighborhoods (railway lines, etc.)4
CulturalLoss of place identity or cultural alienation9
CulturalLow level of social solidarity (neighborhood)8
Note: [4,7,9,10,16,17,21,22,24,25,29,31,72,73,74,75,76,77,78,79].
Table 4. Frequency of parameter occurrence in the urban vitality literature (n = 20).
CategoryIndicatorFrequency
EconomicCommercial density and quality11
EconomicActivity density9
EconomicProperty values/Housing prices2
SocialActivity density9
SocialStreet use behaviors3
SocialPopulation characteristics4
PhysicalBuilding density8
PhysicalPOI (Point of Interest) density10
PhysicalLand use diversity-function12
PhysicalBuilding age diversity3
PhysicalBuilding size diversity8
PhysicalActive facades and permeability1
PhysicalRoad density8
PhysicalPublic transportation accessibility8
PhysicalDestination accessibility (walkability)9
PhysicalDistance from boundary gaps2
CulturalCultural facility density, diversity8
CulturalCultural activity density5
CulturalCultural symbols1
Note: [1,40,42,44,47,49,50,51,52,53,54,55,56,57,58,59,60,61,62,63].
Table 5. Final indicator set based on decision matrix evaluation.
IndicatorCategoryDecay ScoreVitality ScoreSelected
PovertyEconomic3.625-no
Unemployment RateEconomic3.705-no
Decline in industrial employment rateEconomic2.818-no
Low housing valueEconomic3.947-no
Lack of Social Interaction (Social Segregation/Exclusion)Social2.818-no
Crime rate/Security issuesSocial4.739-yes
High external migration (Migration)Social3.133-no
Deterioration in quality of lifeSocial3.947-no
Low ratio of public spacePhysical4.454-yes
Building maintenance statusPhysical4.052-yes
Poor physical order and facade qualityPhysical4.428-yes
Transport infrastructure’s effect of dividing neighborhoods (railway lines, etc.)Physical4.111-yes
Loss of place identity or cultural alienationCultural3.133-no
Low level of social solidarity (neighborhood)Cultural2.818-no
Commercial density and qualityEconomic-4.545yes
Activity densityEconomic-3.947no
Property values/Housing pricesEconomic-3.4no
Activity densitySocial-4.428yes
Street usage behaviorsSocial-3.142no
Population characteristicsSocial-2.846no
Building densityPhysical-4.052yes
POI (Point of Interest) densityPhysical-4.1yes
Land use diversity-functionPhysical-4.739yes
Building age diversityPhysical-3.142no
Building size diversityPhysical-3.705no
Active facades and permeabilityPhysical-4.222yes
Road densityPhysical-3.705no
Public transportation accessibilityPhysical-3.888no
Destination accessibility (walkability)Physical-4.2yes
Distance from boundary gapsPhysical-3.75no
Cultural facility density, diversityCultural-4.052yes
Cultural activity densityCultural-3.588no
Cultural symbolsCultural-2.2no
Table 6. Selected indicators and operational definitions.
IndicatorCategoryDirectionScoreMeasurement ApproachScale (1–5)
IN1—Crime rate/Security issuesSocial4.739Official crime records and spatial density1 = low risk, 5 = high risk
IN2—Land use diversity-functionPhysical+4.739Land-use mix analysis per grid cell1 = single use, 5 = mixed use
IN3—Commercial density and qualityEconomic+4.545Count and diversity of commercial units1 = none, 5 = high & diverse
IN4—Low ratio of public spacePhysical4.454Ratio of public/open space per cell1 = high ratio, 5 = low ratio
IN5—Poor physical order and facade qualityPhysical4.428Visual condition scoring1 = well maintained, 5 = deteriorated
IN6—Activity densitySocial+4.428Pedestrian and activity observation1 = very low, 5 = very high
IN7—Active facades and permeabilityPhysical+4.222Ground-floor activity continuity1 = low, 5 = high
IN8—Destination accessibility (walkability)Physical+4.2Network-based accessibility index1 = low, 5 = high
IN9—Transport infrastructure’s effect of dividing neighborhoods (railway lines, etc.)Physical4.111Presence of major transport barriers1 = none, 5 = strong division
IN10—POI (Point of Interest) densityPhysical+4.1Spatial density of points of interest1 = low, 5 = high
IN11—Building maintenance statusPhysical4.052Building condition assessment1 = good, 5 = poor
IN12—Building densityPhysical+4.052Building footprint per grid cell1 = low, 5 = high
IN13—Cultural facility density, diversityCultural+4.052Number of cultural facilities per cell1 = low, 5 = high
“+” indicates a positive (direct) relationship, while “−” indicates a negative (inverse) relationship.
Table 7. Potential scenario-based applications of the Cellular Automata model.
Scenario NameParameters IntervenedIntervention Logic
1Current Situation (Reference)None (IN1–IN13 current values)The model’s behavior is observed while preserving the existing spatial conditions of the study area.
2Physical Improvement ScenarioIN5—Poor physical order and facade quality
IN11—Building maintenance status
The impact is measured by improving only the quality of the physical environment without altering social, economic, and cultural values.
3Social and Commercial Revitalization ScenarioIN3—Commercial density and quality
IN6—Activity density
IN7—Active facades and permeability
IN10—POI (Point of Interest) density
By aiming for vitality to spread through neighborhood interactions, commerce and pedestrian-oriented everyday uses are strengthened.
4Integrated Intervention ScenarioIN3—Commercial density and quality
IN4—Low ratio of public space
IN5—Poor physical order and facade quality
IN6—Activity density
IN7—Active facades and permeability
IN8—Destination accessibility (walkability)
IN10—POI (Point of Interest) density
IN11—Building maintenance status
IN13—Cultural facility density, diversity
A realistic policy approach is achieved by addressing economic, social, physical, and cultural parameters together.
Disclaimer/Publisher’s Note: The statements, opinions and data contained in all publications are solely those of the individual author(s) and contributor(s) and not of MDPI and/or the editor(s). MDPI and/or the editor(s) disclaim responsibility for any injury to people or property resulting from any ideas, methods, instructions or products referred to in the content.