


Abstract
To address issues such as web and bottom plate cracking and insufficient bending capacity in in-service prestressed concrete box girder bridges, this study proposes internal prestressing and section enlargement composite reinforcement. Firstly, taking a bridge of Shenhai Expressway as the background project, the combined reinforcement method is designed and the reinforcement effect is analyzed by MIDAS/Civil. Secondly, through numerical analysis, the influence of the bond shrinkage of self-compacting concrete with different mix ratios on the stress of the web of the original box girder is analyzed, and the interface between the new and old concrete is carried out. The analysis of the loss of the new prestress on the bonding surface of the new and old concrete is carried out by parameters such as the interface planting rate, the interface shear stiffness and the reinforcement structure. Furthermore, the theoretical calculation method of prestress loss rate of new and old concrete bonding interface is obtained. The results show that the flexural capacity of the normal section of the main beam is significantly improved after reinforcement, and the surplus coefficient is 1.18, which meets the requirements of the secondary safety level, and the mid-span deflection is improved by 34.28%, which verifies the effectiveness and feasibility of the combined reinforcement method. When the content of fly ash is 54%, the bond shrinkage strain and shrinkage stress of self-compacting concrete are reduced to the lowest level, which has the least influence on the existing box girder structure. It is suggested that the reinforcement ratio between the new and old concrete interface is 0.6%, and the interface roughness is 0.9 mm, which can increase the shear resistance of the new and old concrete interface and effectively reduce the transfer loss of prestress at the interface. Error analysis shows that the proposed semi-empirical calculation method has high accuracy with a deviation of less than 10%.
1. Introduction
China possesses a vast inventory of bridges and continues to experience strong construction demand, having entered an era that places equal emphasis on new construction and the replacement of reconstruction with repair. Consequently, the effective maintenance, retrofitting, and strengthening of existing aging bridges have become important strategies for enhancing the service level of transportation infrastructure. These measures improve structural mechanical performance, restore and enhance functionality, and extend service life [1].
When the safety performance of structural members fails to meet the required standards, local reinforcement—such as increasing section reinforcement—can be applied. If the overall structural performance is inadequate, it can be enhanced by strengthening the structural system, for example, through external prestressing reinforcement [2]. The combined method of internal prestressing with increased section reinforcement integrates the advantages of both passive and active reinforcement [3]. Consequently, scholars worldwide have conducted extensive research on bridge maintenance and reinforcement technologies. Tan et al. [4] experimentally investigated twelve two-span continuous T-beams strengthened using various external prestressing configurations and cross-sectional forms. The results demonstrated that external prestressing tendons effectively enhance the ductility of continuous beams at ultimate load. To address excessive mid-span deflection in long-span continuous rigid-frame bridges with unequal spans, Zhang et al. [5] performed construction monitoring and load tests on a variable cross-section continuous box girder bridge reinforced with external prestressing, revealing significant improvements in flexural capacity and stiffness. Ghallab et al. [6] experimentally investigated the effects of different external prestressing configurations, shear span ratios, and concrete strengths on the shear performance of externally prestressed concrete beams. Shwalia et al. [7] strengthened the tensile zones of concrete beams using UHPC layers of varying lengths to enhance sectional reinforcement; four-point bending tests showed that the UHPC layers significantly delayed crack initiation and increased load-carrying capacity. Jiang et al. [8] examined RC beams strengthened with different cross-sectional reinforcement schemes, layer thicknesses, and interface treatments, and found that U-shaped and double-sided reinforcements markedly improved ultimate shear capacity, crack resistance, and ductility. In a subsequent study, Fan et al. [9] experimentally evaluated unbonded prestressed UHPC-strengthened beams with varying UHPC thicknesses and prestressing levels, demonstrating substantial improvements in cracking resistance, flexural capacity, and stiffness. Zhang et al. [10] investigated damaged RC beams strengthened with prestressed UHPC layers and confirmed that both cracking and ultimate loads were significantly higher than those of unstrengthened beams. Xia et al. [11] reported that the addition of reinforcing bars or the application of normal pressure at the interface between new and existing concrete enhances the interfacial cracking stress, ultimate shear strength, and residual shear strength. After the ultimate shear stress is reached, the interaction of the reinforcing bars further improves the shear resistance of the concrete interface, thereby enhancing its ductility and overall interfacial shear performance. Bai et al. [12] conducted direct shear tests on the interface between new and existing concrete and observed that, within a certain range, the shear strength of the bonded interface increases with increasing surface roughness. Moreover, interfaces with identical roughness but different surface treatment methods exhibit different shear capacities.
However, when restrained by existing concrete, newly cast concrete may develop internal tensile stresses during shrinkage, leading to cracking and potential failure at the interface between new and old concrete [13]. Cheng et al. [14] investigated the influence of steel fiber volume fraction on the bond performance between new and old concrete through shrinkage tests and found that the inclusion of steel fibers reduces shrinkage differentials and enhances interfacial bonding. Chen et al. [15,16,17] analyzed interfacial stresses between self-compacting concrete (SCC) and new concrete and proposed a finite element approach to simulate shrinkage-induced bonding behavior. Zhang et al. [18] proposed an analytical model for the concrete ring test that accounts for the combined effects of restrained shrinkage and tensile creep, based on the age-adjusted effective modulus theory. The model was validated using concrete specimens with compressive strengths ranging from 25 MPa to 100 MPa. Hua et al. [19] conducted experimental investigations on the shrinkage behavior of concrete confined by steel plates of varying thicknesses and materials, as well as concrete specimens with different diameters, heights, and numbers of studs. Based on these tests, they proposed a method for predicting the shrinkage strain of concrete restrained by studs and steel plates. Wang et al. [13] performed an experimental study on the effects of parameters such as shrinkage-reducing agents, fiber content, and the roughness of the interface between new and existing concrete on restrained shrinkage behavior. A mechanical model for restrained shrinkage was subsequently developed.
In summary, existing studies primarily focus on enhancing structural bearing capacity through cross-section enlargement, external prestressing, and combined reinforcement methods. However, when combined reinforcement is adopted, the shrinkage of newly cast concrete under the restraint of the existing bridge, as well as the interfacial bonding parameters between new and old concrete, can significantly influence the transfer of newly introduced prestress across the interface. This issue has received limited attention in the current literature. Therefore, this study first proposes a combined reinforcement method and subsequently validates its effectiveness through numerical analysis and experimental investigation. The influence of shrinkage-induced bonding behavior of self-compacting concrete with different mix proportions on interfacial force transfer is examined. On this basis, the loss of newly applied prestress at the bonding interface is analyzed considering both interface parameters and reinforcement configuration, and a calculation method for the interface loss rate of internal prestress is established. The results of this study provide new insights for similar bridge strengthening projects and offer a scientific and rational basis for engineering design and construction.
2. Internal Prestress-Increasing Section Combination Reinforcement Method
2.1. The Proposal of Combined Reinforcement Method
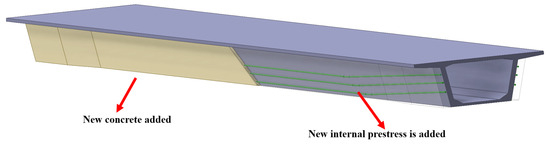
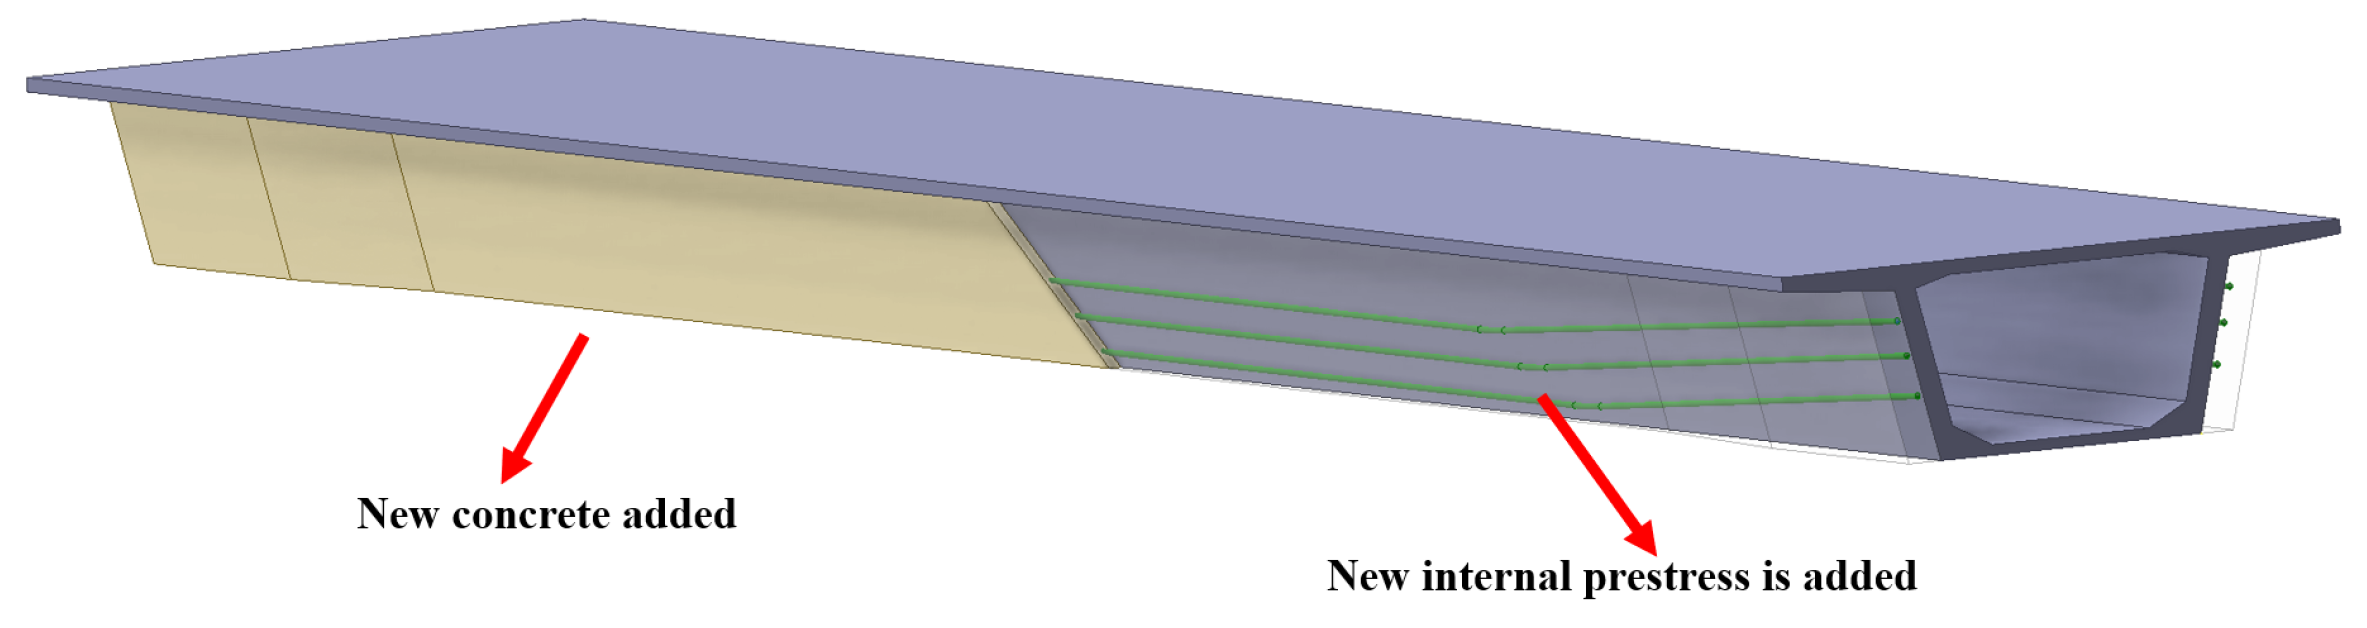
To overcome the limitations of traditional single reinforcement methods in mitigating web and slab cracking and enhancing the flexural capacity of structures, a combined strengthening approach that integrates internal prestressing with section enlargement is proposed, as illustrated in Figure 1.
Figure 1.
Composite reinforcement diagram.
2.2. Design of Prestressing-Enlarged Cross-Section Composite Reinforcement Test
2.2.1. Background Project
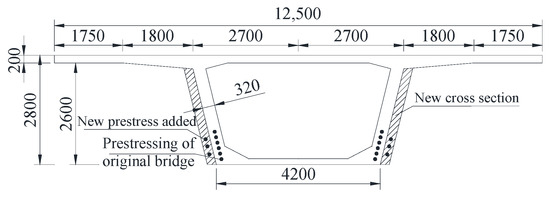
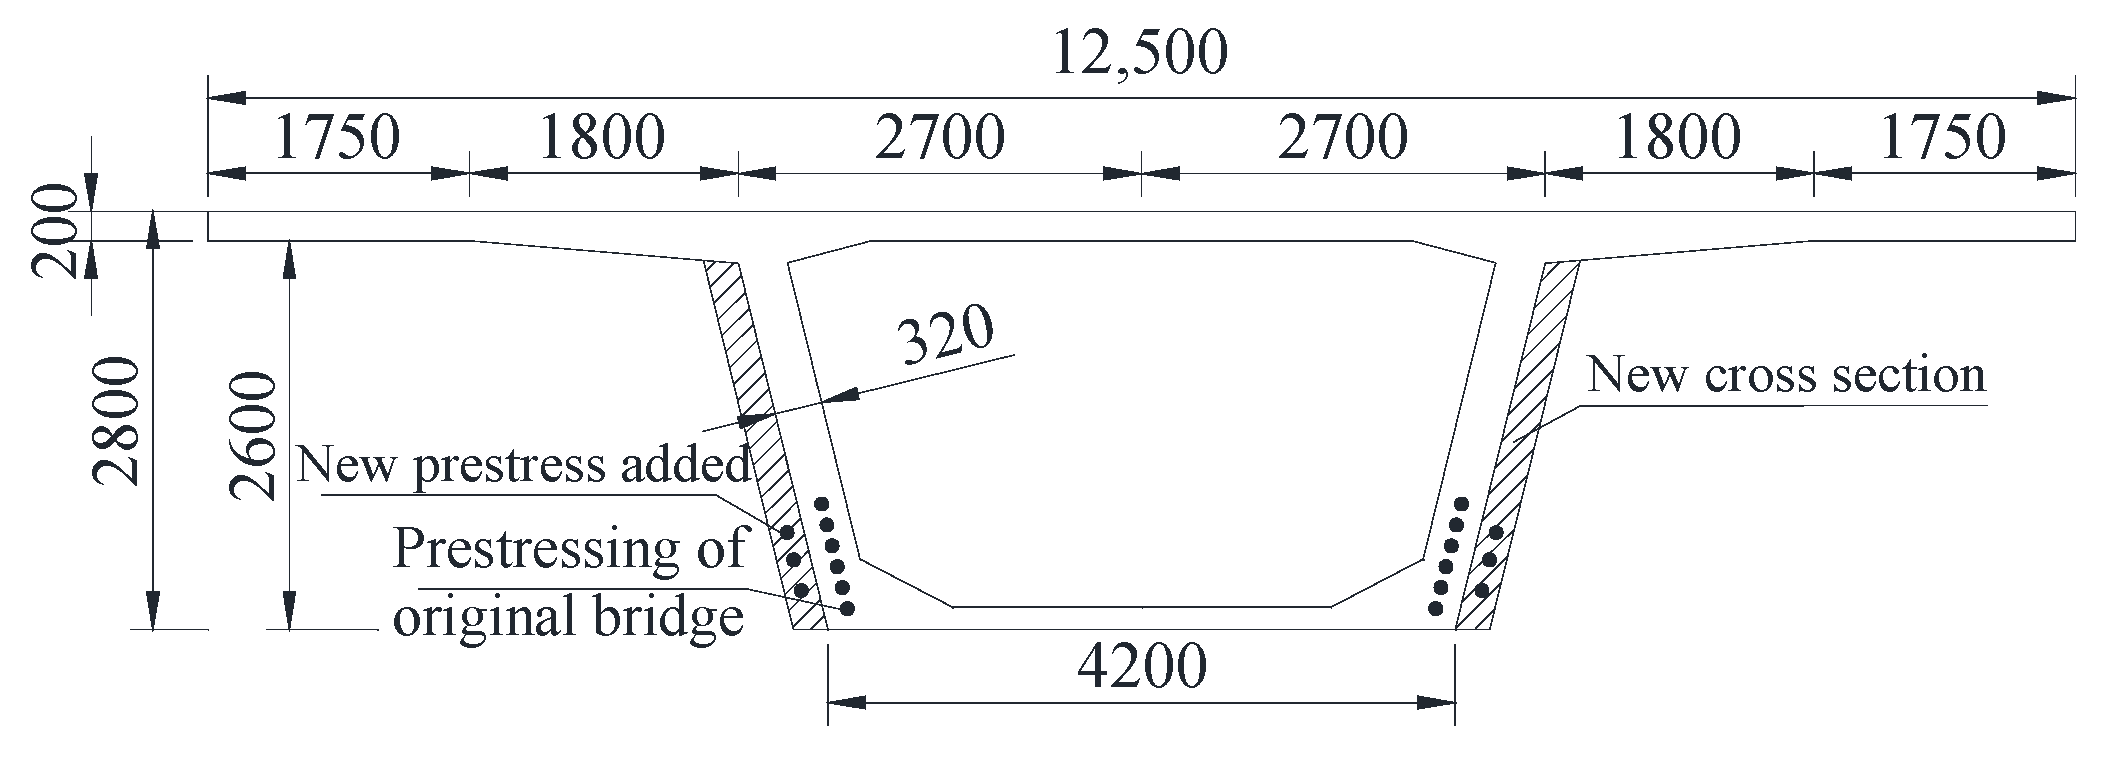
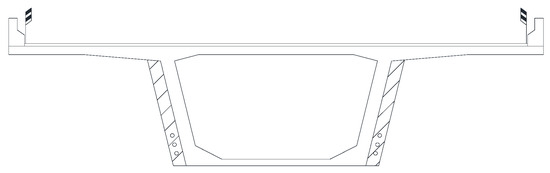
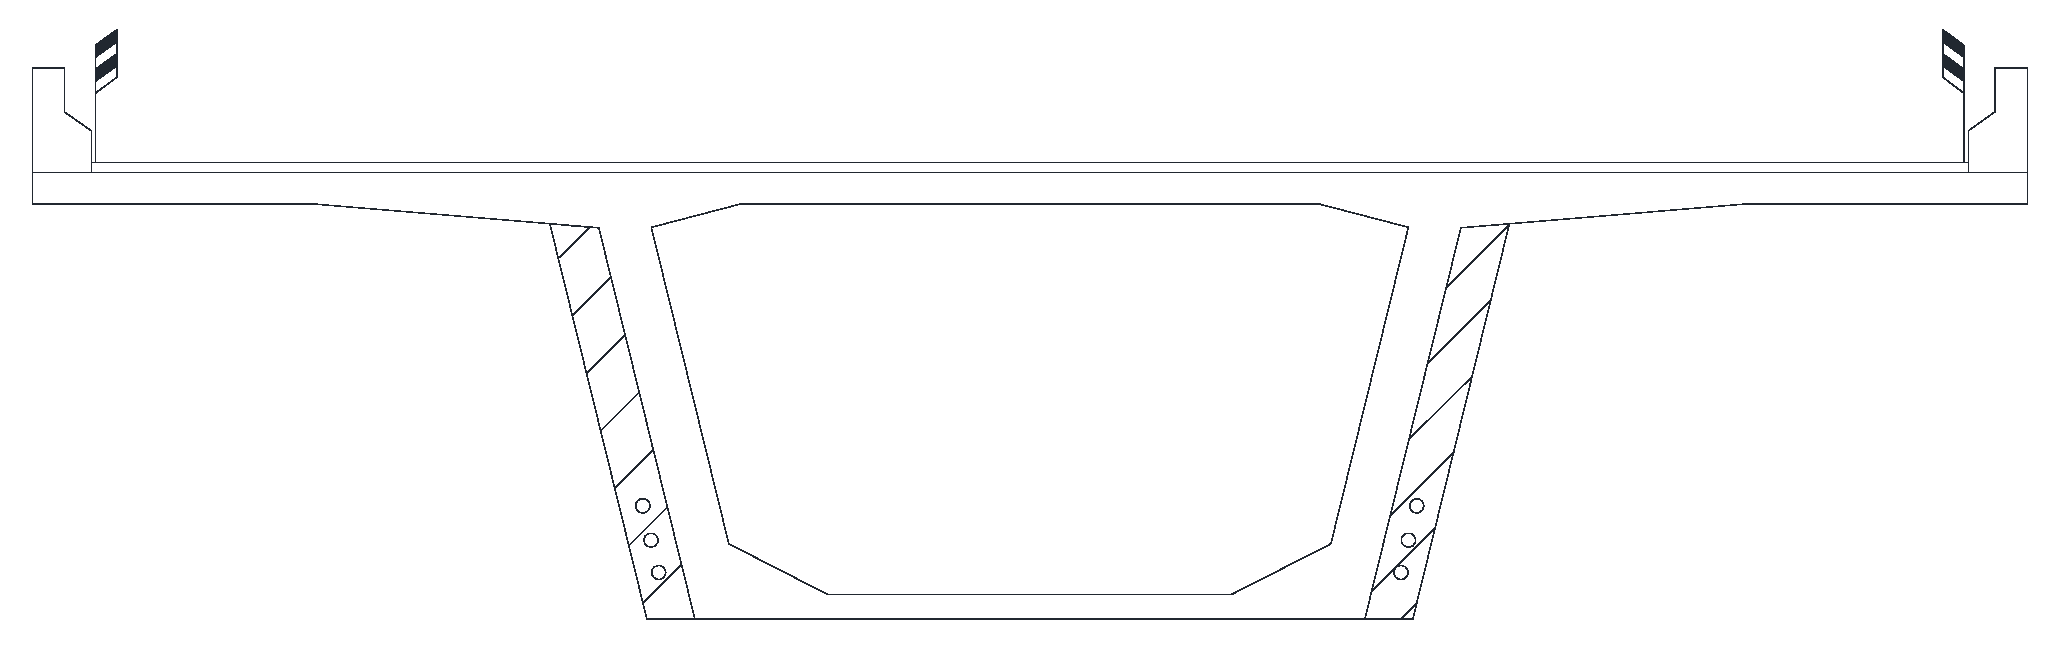
Using a bridge on the Shenhai Expressway as the background project, the superstructure of the main bridge adopts a prestressed concrete (PC) continuous box girder with a span arrangement of (31.6 + 3 × 50 + 45.8) m, and the mid-span cross-section is shown in Figure 2. Results from static and dynamic load tests conducted in 2016 indicate that the left and right widths of the bridge no longer satisfy the normal service requirements specified by the design live-load standards. Considering the actual traffic conditions, existing damage, strengthening requirements, structural constraints, strengthening effectiveness, and economic factors of the original bridge, a composite strengthening scheme combining internal prestressing and section enlargement for the PC box girder bridge was designed in accordance with relevant specifications [20,21,22].
Figure 2.
Mid-span cross-section.
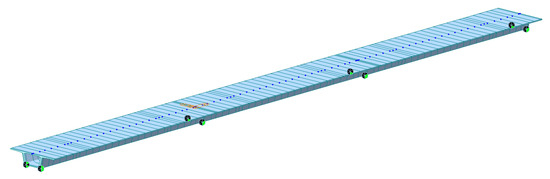
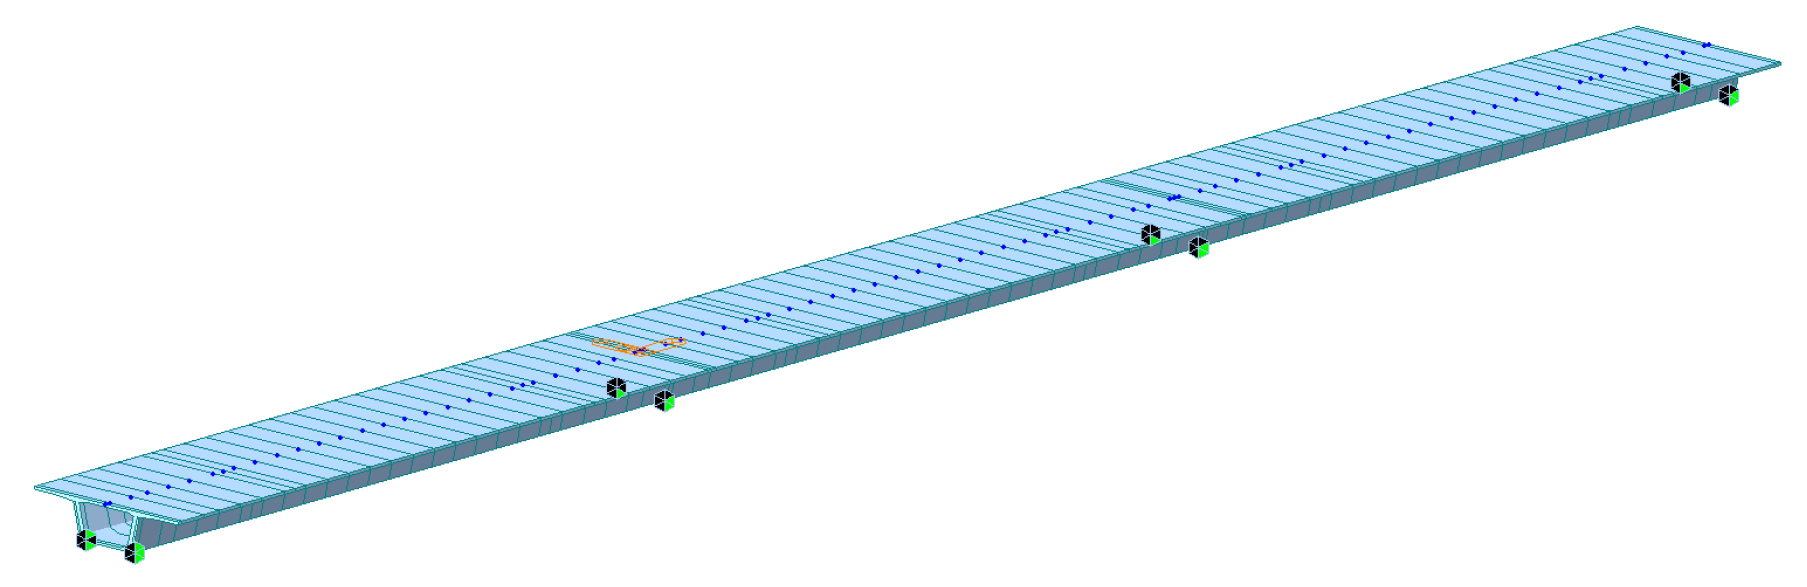
To analyze the impact of the new web section on the load response of the original bridge, a finite element model of the entire bridge, incorporating internal prestressing and section enlargement, was established using the general-purpose software MIDAS/Civil. The new web section was modeled using the double-element method, with the new web and the original main girder sharing common nodes. This approach not only distinguishes between the original girder and the thickened web concrete but also enhances modeling efficiency by eliminating the need to define boundary conditions between them. The complete bridge model consists of 88 nodes and 174 elements, as shown in Figure 3. The original bridge concrete is C50, while the new web section uses C55 concrete. Prestressing is applied using 12Φs 15.2 (1 × 7) prestressed steel strands, and the material parameters are summarized in Table 1 and Table 2. Static analysis considers structural self-weight, overall temperature variations, temperature gradients, as well as concrete shrinkage and creep effects.
Figure 3.
Finite element model.
Table 1.
The strength design value of concrete (unit: MPa).
Table 2.
Strength design value of steel (unit: MPa).
2.2.2. Trial Design of Web Reinforcement Thickness
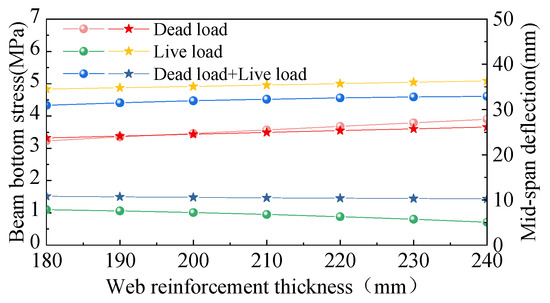
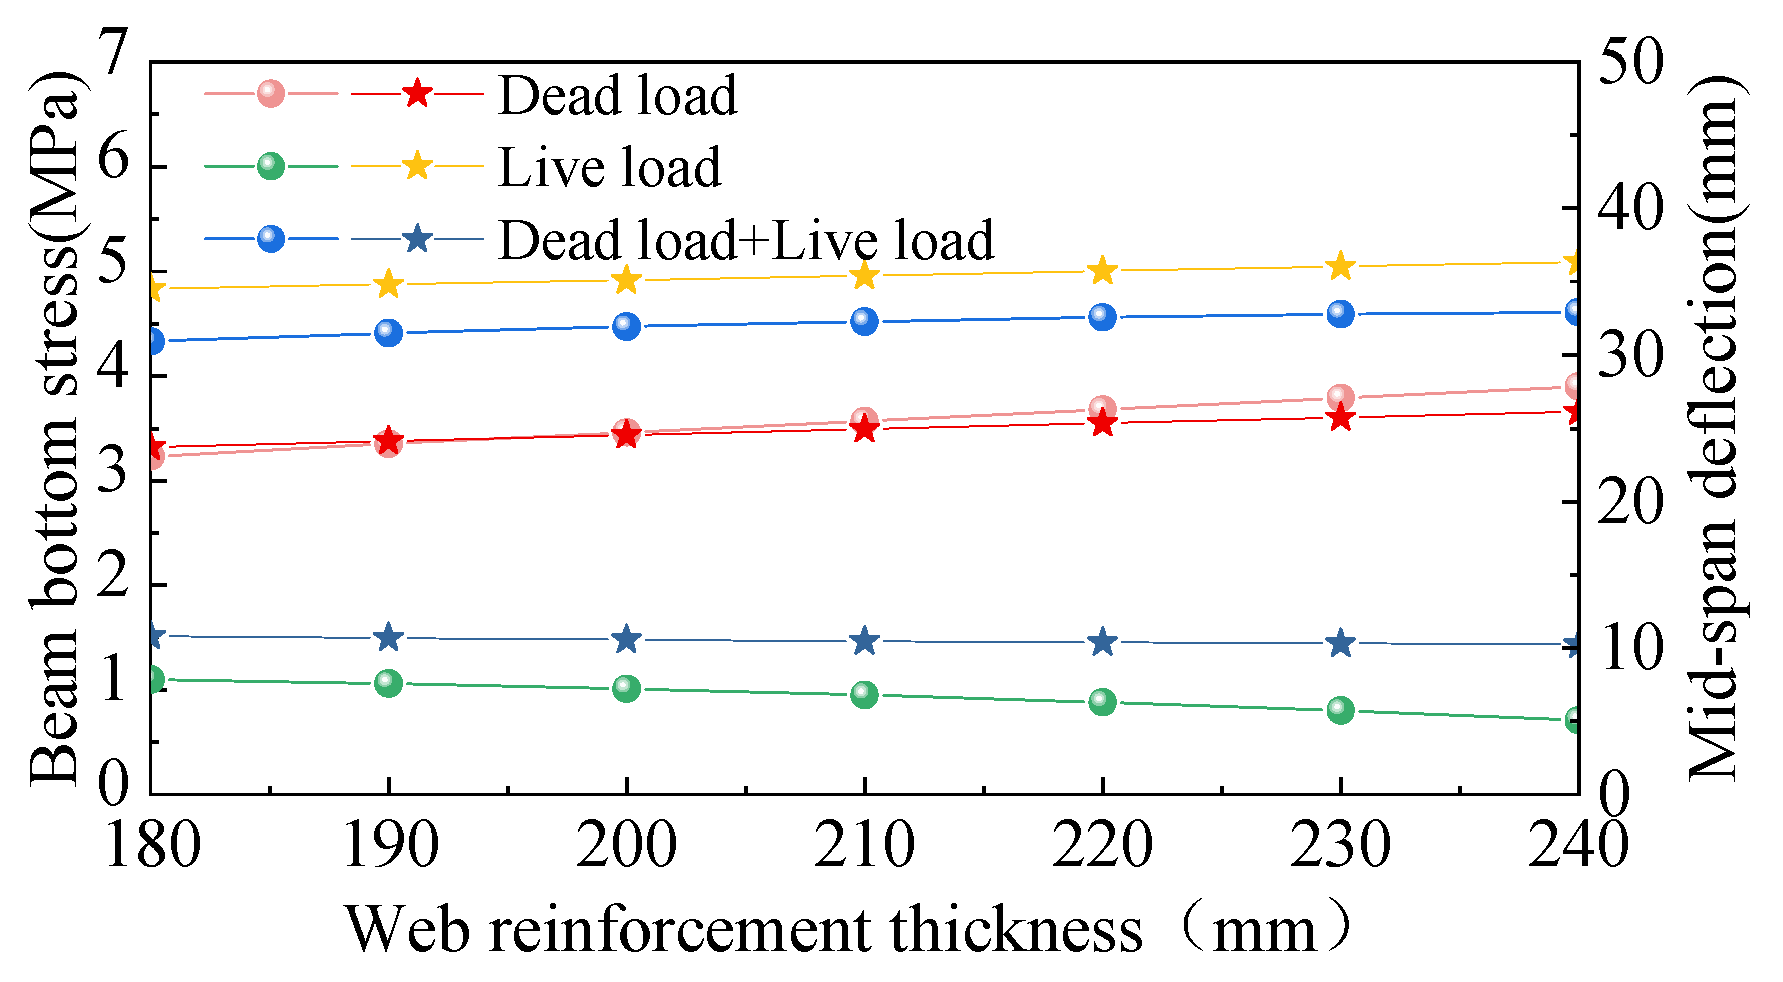
To determine the web reinforcement thickness, the diameter of the longitudinal tensile reinforcement is taken as 12 mm, and the stirrup diameter is 8 mm. Based on the bridge environmental exposure category, the concrete cover thickness is 25 mm, and the diameter of the prestressing duct is 90 mm. Accordingly, the minimum required web reinforcement thickness is calculated as 90 + 2 × (12 + 8 + 25) = 180 mm. For finite element parameter analysis, the web reinforcement thickness of the box girder bridge with combined internal prestressing and section enlargement is set to 180 mm, 190 mm, 200 mm, 210 mm, 220 mm, 230 mm, and 240 mm, while all other parameters remain unchanged.
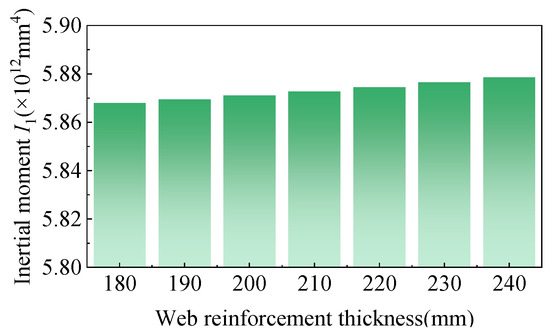
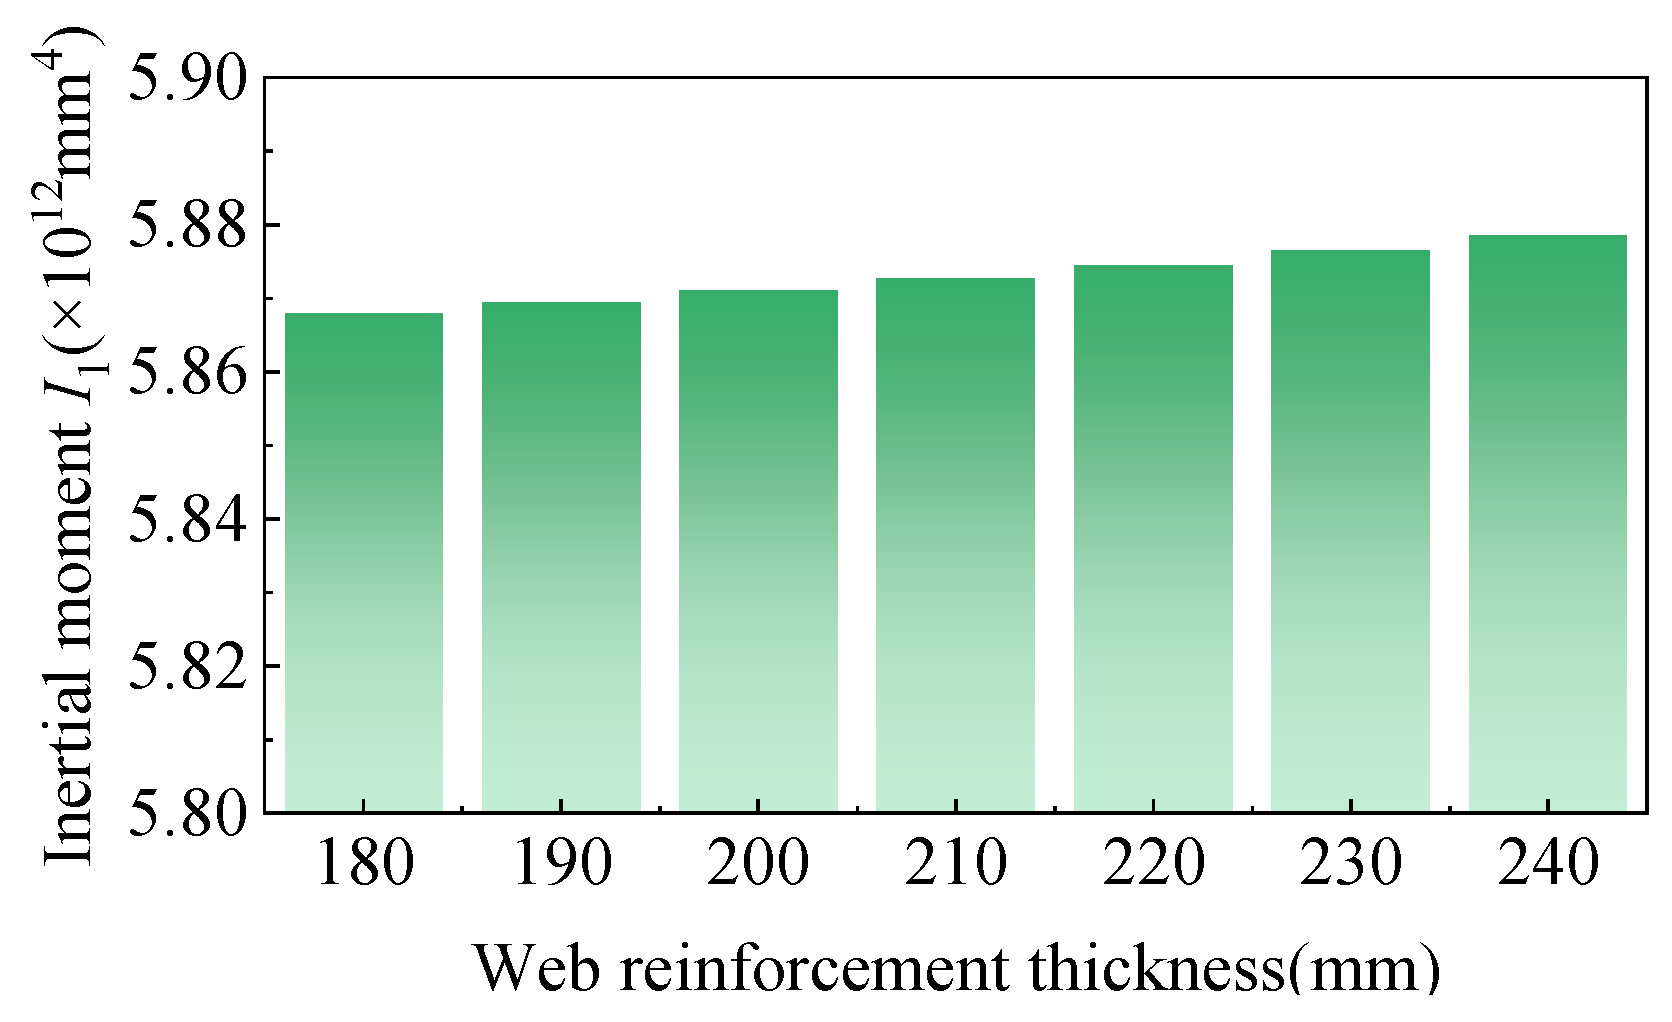
The effects of web thickening on sectional properties, girder stress, and mid-span deflection are illustrated in Figure 4 and Figure 5. When the web thickness increases from 180 mm to 240 mm, the bending moment of inertia of the cross-section increases by approximately 4.88–5.07% compared with the original section. As the web thickness increases, the structural response of the box girder varies under different loading conditions. Under dead load, the tensile stress at the bottom of the box girder at mid-span increases from 3.23 MPa to 3.90 MPa, while the corresponding mid-span deflection increases from 23.71 mm to 26.13 mm. Under live load, however, the tensile stress at the bottom edge of the mid-span section decreases from 1.10 MPa to 0.71 MPa, and the mid-span deflection decreases from 10.82 mm to 10.23 mm. Under the combined action of dead and live loads, both the tensile stress and deflection at the bottom of the box girder at mid-span exhibit an overall increasing trend. When the web thickness reaches 180 mm, the tensile stress at the bottom edge of the box girder attains its minimum value. Nevertheless, simply increasing the web thickness contributes only marginally to enhancing the stiffness of the original section. Therefore, a web thickness of 180 mm is recommended as the minimum value for the added web section.
Figure 4.
Comparison of bending moment of inertia of web thickening section.
Figure 5.
Influence of web thickness on main girder.
2.2.3. Internal Prestress Trial Design
The addition of internal prestressing is intended to counteract the increased self-weight of the enlarged section and the internal forces induced by external loads by generating a reverse bending moment, thereby enhancing the mechanical performance of the box girder. Based on the actual conditions of the combined strengthening scheme incorporating internal prestressing and section enlargement, and in accordance with the relevant specification [20], the internal forces of the mid-span section were evaluated for different web thickening thicknesses under both the ultimate and serviceability limit states. When the web thickening thickness is 180 mm, the design internal force combinations for the most unfavorable mid-span section are presented in Table 3. The required amount of reinforcing steel was determined based on the geometric properties of the modified section, and the corresponding calculation parameters and effective prestressing results for the 180 mm thickened web are summarized in Table 4.
Table 3.
Load internal force calculation results (unit: kN·m).
Table 4.
Geometric characteristics of cross-section.
The design uses Φs 15.2 steel strands, each with a nominal cross-sectional area of Ap1 = 139 mm2 and a standard tensile strength of fpk = 1860 = MPa. The tension control stress is taken as fcon = 0.7fpk = 1302 MPa, and prestress losses are estimated as 20% of the tension control stress. The required number of prestressed steel strands is calculated based on the normal-section crack-resistance requirements, with the results shown in Table 5. For the cross-sectional calculation, the number of steel strands is rounded to 90, corresponding to six prestressed tendon bundles. The total cross-sectional area of the prestressing tendons is Ap = 12,510 mm2. A 90 mm-diameter reserved duct is provided for the tendons.
Table 5.
Calculation results of prestressed steel strand.
2.3. Evaluation of Reinforcement Effect of Internal Prestress-Increasing Section Combination
2.3.1. Comparison of Flexural Bearing Capacity Before and After Composite Reinforcement
Based on the combined internal prestressing and section enlargement reinforcement design, the web thickness was specified as 180 mm, and the prestressed steel girder was configured with six strands. A comparison of the flexural capacity of the normal section before and after strengthening is presented in Table 6. After applying the combined strengthening scheme, the main girder satisfies the flexural capacity requirements for the normal section, with a reserve coefficient of 1.18. This result meets the initial strengthening design objective corresponding to a second-level structural safety requirement, thereby demonstrating the effectiveness of the combined reinforcement method using internal prestressing and section enlargement.
Table 6.
Comparison of flexural bearing capacity before and after reinforcement (unit: kN·m).
2.3.2. Comparison of Control Sections Before and After Combined Reinforcement
Based on the structural characteristics and site conditions of the bridge, the static load test for the right span of the case-study bridge was conducted under an eccentric loading condition that produced the maximum positive bending moment at the mid-span section. BQ-120 strain gauges were installed to measure the surface strain of the concrete at each section, and a precision level was employed to record the deflection at each measurement point. The layout of the strain and deflection measurement points is shown in Figure 6.
Figure 6.
Schematic diagram of deflection measuring point arrangement at mid-span section.
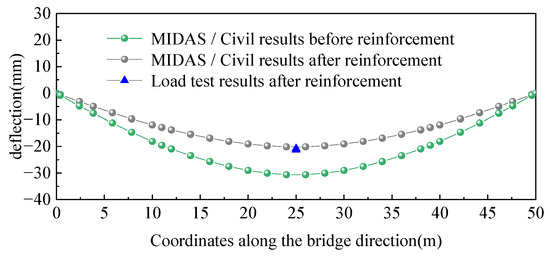
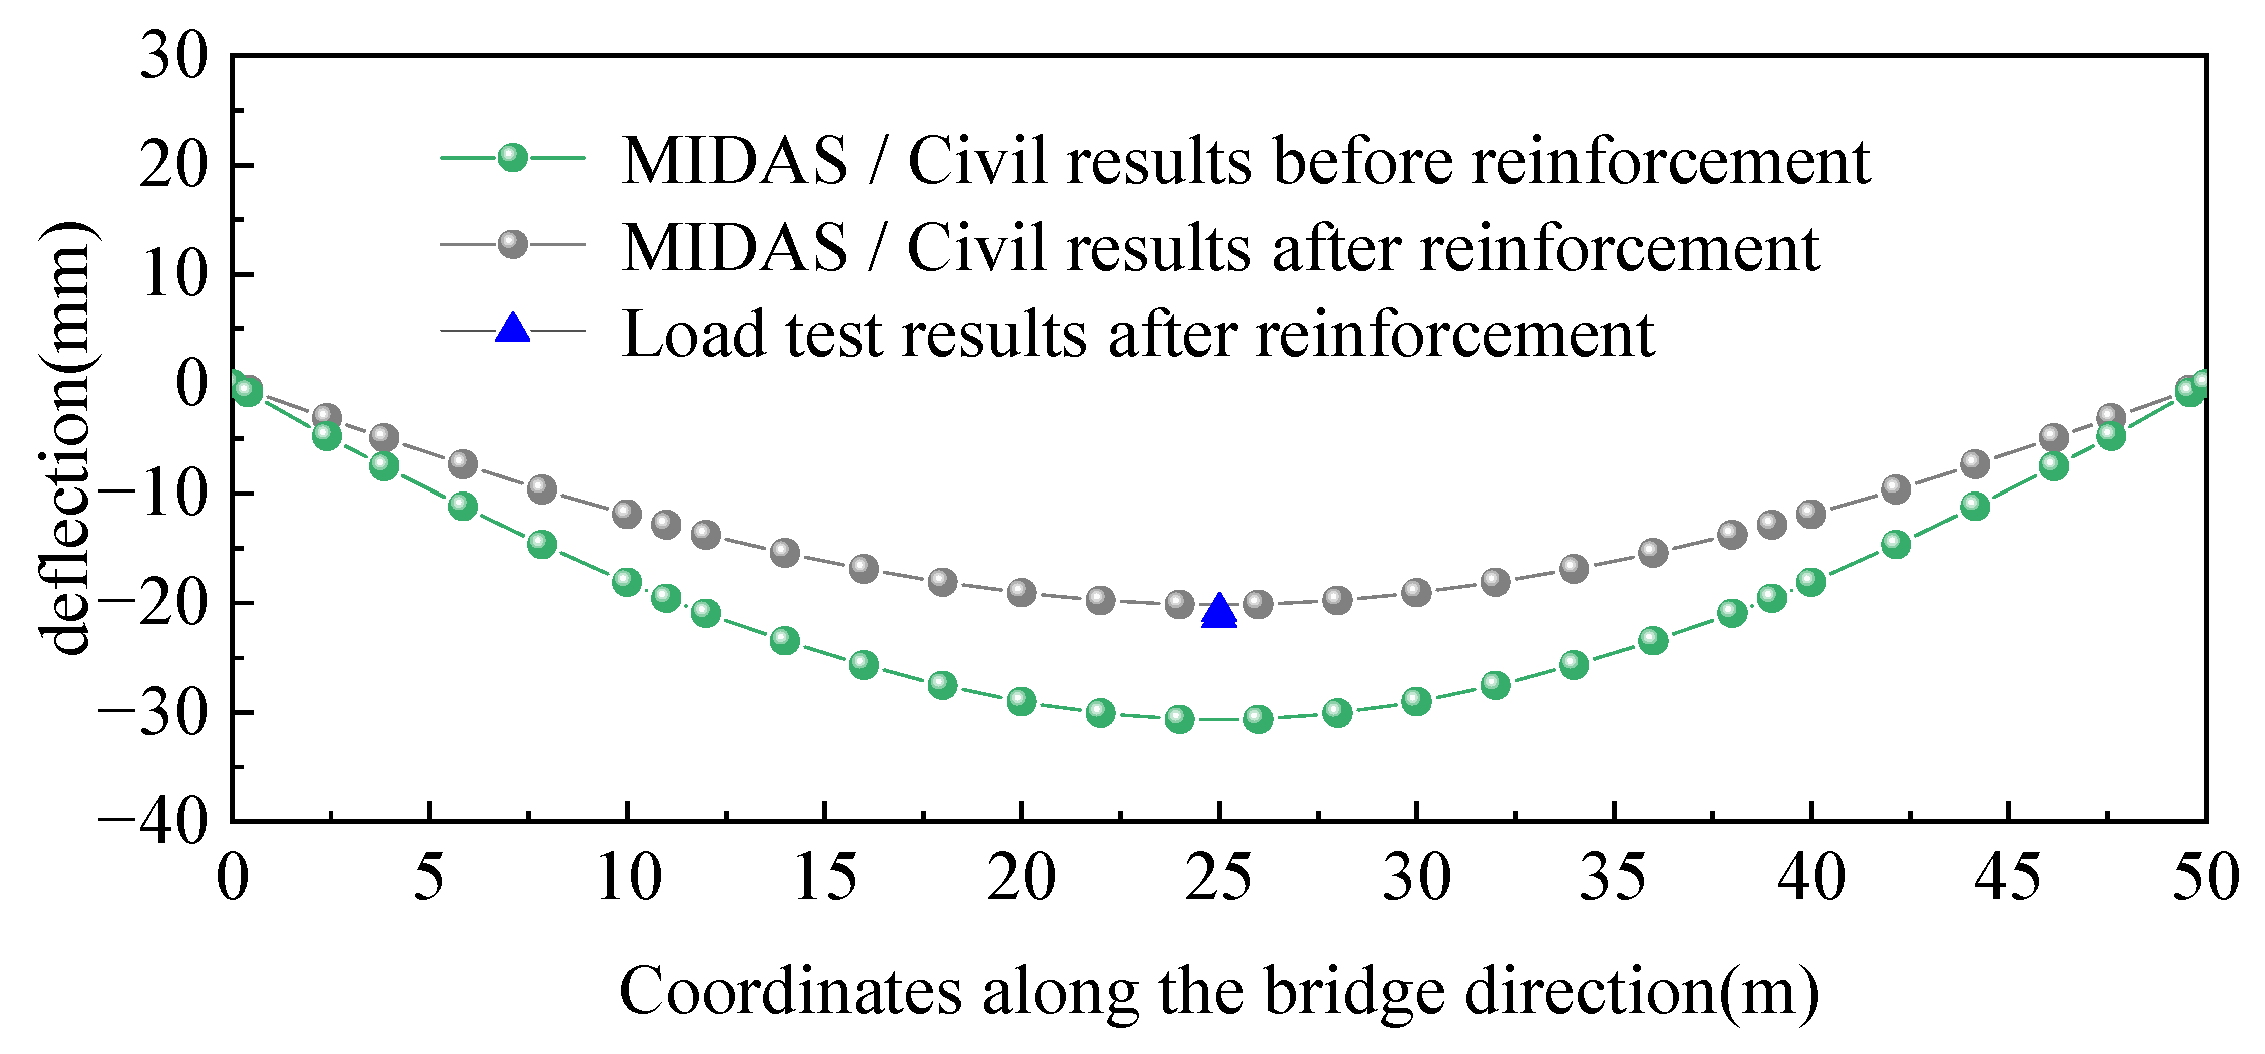
Using finite element software in conjunction with specification requirements, the serviceability limit state of the most unfavorable section of the project was evaluated, as shown in Figure 7. Under the short-term load combination during the operational stage of the original design, the mid-span deflection reached 30.63 mm. After reinforcement, the mid-span deflection improved by 34.28%, resulting in a value of 20.13 mm, which satisfies the deflection limits for prestressed A-type members specified in the code.
Figure 7.
Comparison of deflection results.
3. Establishment of Solid Finite Element Model
3.1. Finite Element Modeling Method
3.1.1. Internal Prestress-Increasing Section Simulation
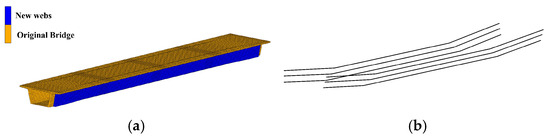
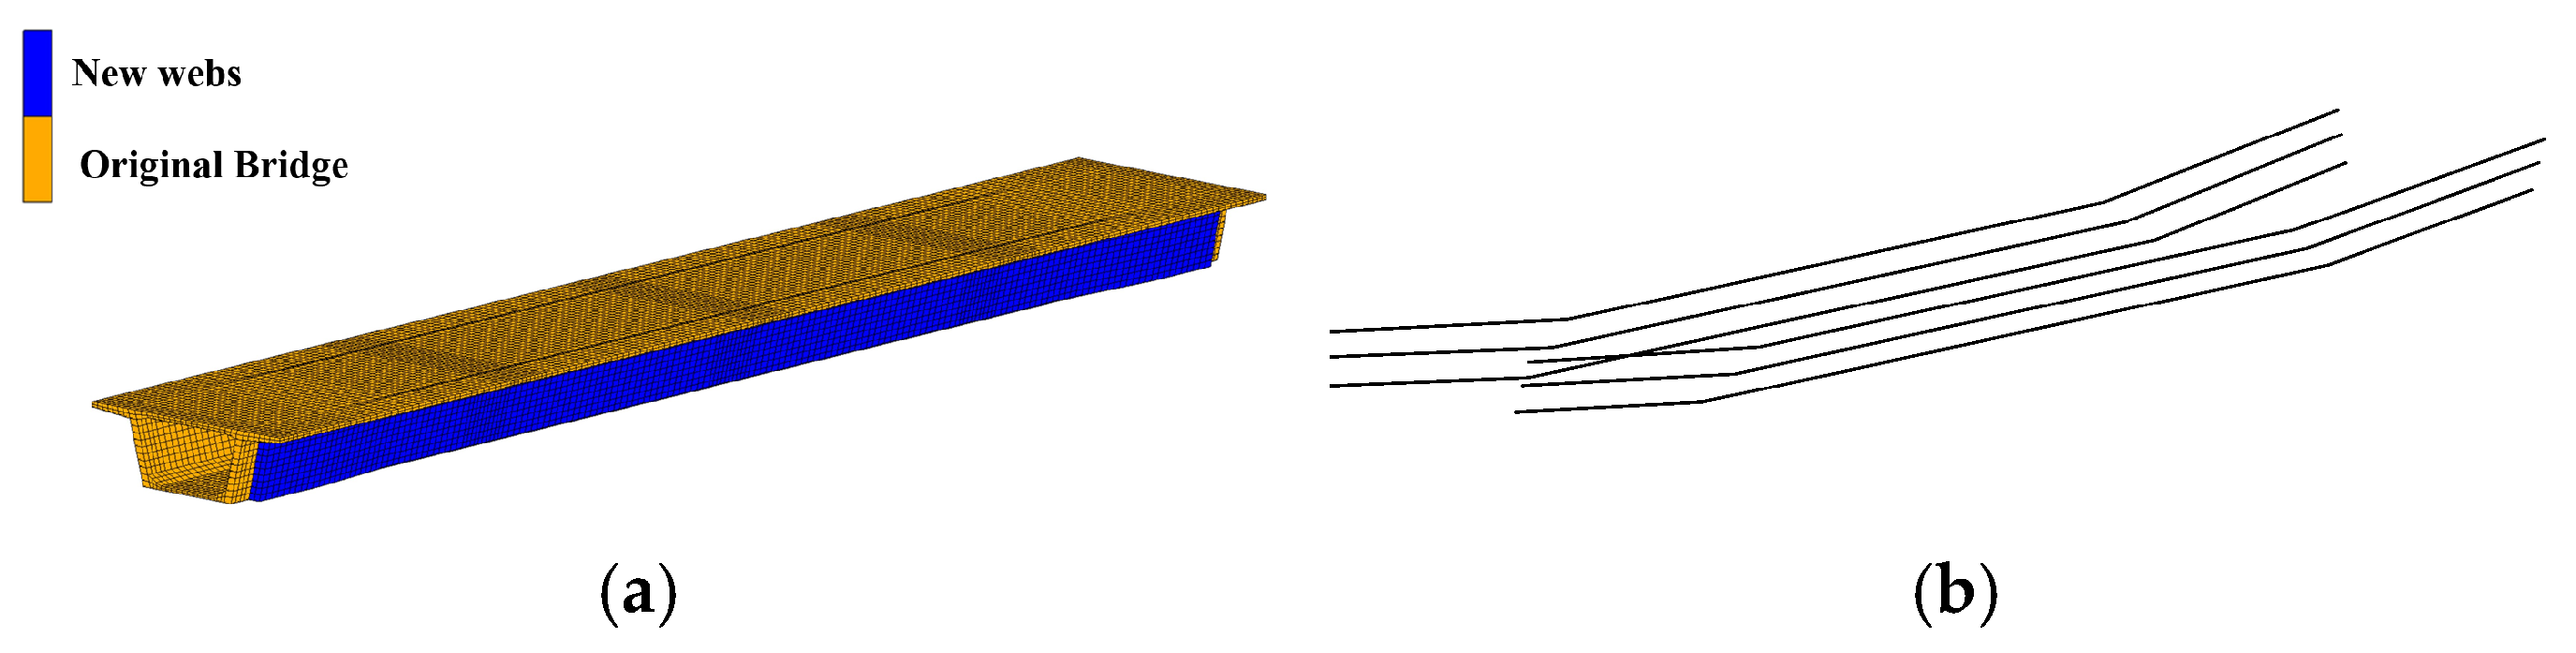
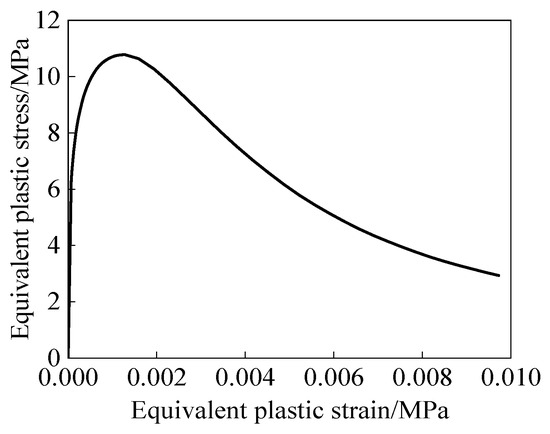
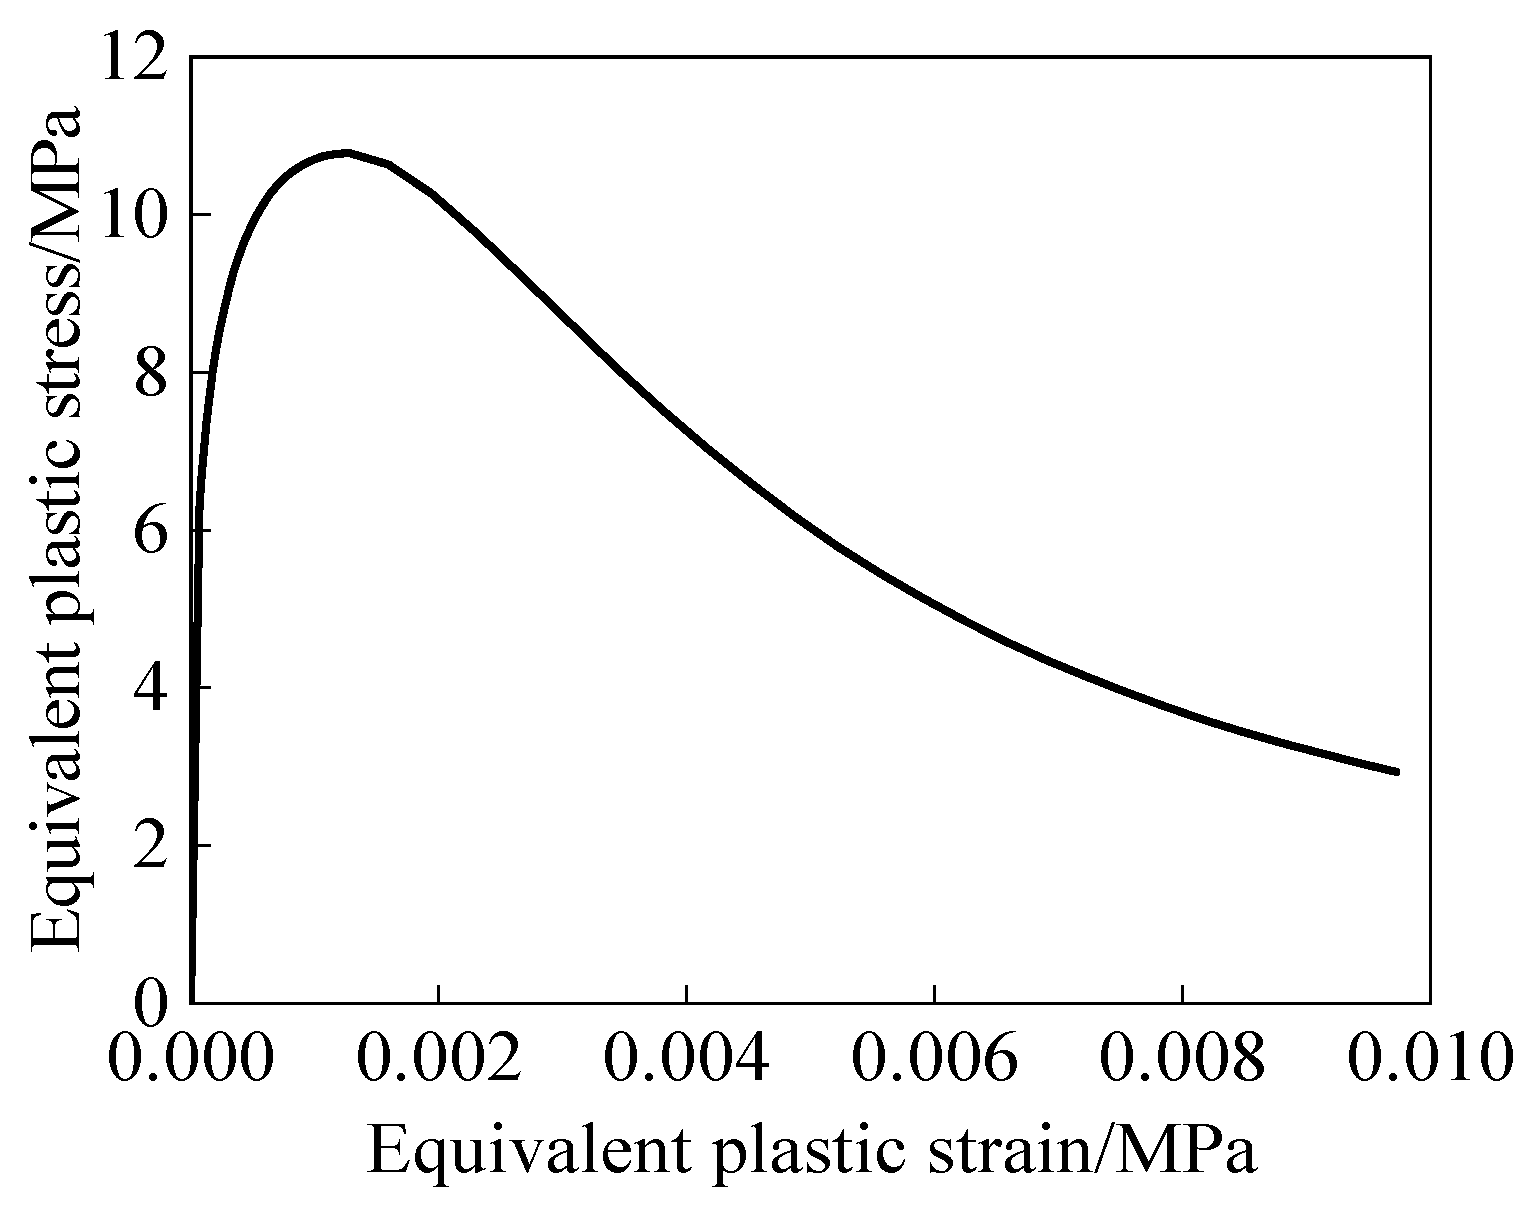
MSC.MARC was used to develop a finite element model of a prestressed concrete (PC) box girder bridge strengthened using a combined internal prestressing and section enlargement scheme, with the aim of analyzing the influence of the newly added web on force transfer at the interface between new and existing concrete. Given that the total bridge length is 227.4 m, modeling the entire bridge would result in excessive computational cost; therefore, only a 50 m simply supported span was considered. To prevent abnormal deformation of the contact interface between the original bridge and the reinforced thickened web caused by mesh misalignment, which may lead to an excessively large convergence ratio and render the finite element model inoperable, the meshes of the reinforced thickened web and the original bridge web are generated using shared nodes. The model comprises 63,320 elements, including 21,120 elements for the original bridge, 30,300 elements for the new concrete, 60 elements for the existing prestressing tendons, and 11,840 elements for the newly added prestressing, as shown in Figure 8. The model employs nonlinear static analysis, uses the Full Newton–Raphson method for iteration, adopts the relative residual force criterion, and has a convergence tolerance of 0.1. The compressive constitutive relationship of concrete is illustrated in Figure 9. The concrete constitutive model was established in accordance with the Specifications for Design of concrete structures (GB 50010–2010) [23], as expressed in Equations (1)–(3), while the Buyukozturk criterion available in MSC.MARC was adopted to derive the equivalent plastic stress–strain curve. The parameter β was assigned the recommended value, and γ was taken as 0.2. Concrete cracking behavior was modeled by incorporating damage effects into the tensile softening response, with the linear softening modulus specified as 0.1 EC.
Figure 8.
MSC.MARC Finite element model. The panels illustrate: (a) concrete element; (b) new prestressed unit added.
Figure 9.
Equivalent plastic stress–strain curve of concrete.
The concrete was modeled using an eight-node hexahedral solid element (HEX8). The bond–slip behavior at the interface between new and existing concrete was simulated using the TABLES function to define interface roughness and reinforcement ratio, together with the Glued option to represent interfacial bonding and slip. Interfacial bonding properties are usually characterized by bond–slip curves. Reference [24] points out that the bond–slip relationship between new and old concrete can be simulated using a bilinear model. The peak normal tensile strength of the interface, ft, was calculated according to Equation (4) [25]. In addition, the tangential shear strength at the interface between self-compacting concrete and existing concrete was determined using the equation proposed by Chen et al. [16], as given in Equation (5).
Among them, α1 and α2 are concrete strength and interfacial agent coefficient; ρv is the bar planting rate; fy is the design value of tensile strength of shear reinforcement; τρ is the shear strength of the original bridge concrete, which can be calculated by Equation (6).
Among them, fc is the compressive strength of concrete; ft is the shear strength of concrete.
The prestressed reinforcement of the existing bridge was modeled using Rebar elements, with the prestressed steel strands embedded into the concrete through the software’s Insert function. This method establishes a full coupling between the reinforcement and the concrete while neglecting interfacial slip. The newly added prestressed steel beams were modeled using eight-node hexahedral solid elements (HEX8), with a friction coefficient of 0.2 relative to the new web [21].
3.1.2. Simulation of Concrete Bond Shrinkage
The temperature reduction method is commonly used to address the shrinkage of newly added concrete, with temperature differences applied to element nodes to simulate the resulting structural deformation. Accordingly, based on Equation (7) [26], the conversion temperature curve over time is calculated and fitted. The evolution of the elastic modulus with age is fitted using Equation (8) [16], and the free shrinkage strain curve with age is fitted using Equation (9) [27]. These curves are then correlated to establish the relationship between the elastic modulus and the conversion temperature. Since the actual bonding surfaces of new and old concrete have certain interface treatments such as roughening and rebar installation, and the newly added concrete does not have a direct external force, the finite element method considers the new and old concrete to be rigidly bonded when simulating the bonding shrinkage of new and old concrete.
Among them, αc is the linear expansion coefficient of the new concrete, taking 1 × 10⁻⁵; E0 is the final value of elastic modulus of concrete; that is, the elastic modulus of concrete at 28 days is similar to the final value of elastic modulus; t is the age; and α and β are constants.
3.1.3. Restart Simulation
In the simulation of the internal prestress section enlargement, the effect of interface parameters on the force transfer of the new prestress was evaluated based on the combined analysis of self-weight, prestress load, and new concrete shrinkage. Given the large number of parameters, each simulation must first account for self-weight, prestress load, and shrinkage before applying the new prestress load. To improve computational efficiency, the ‘RESTART’ function in MSC.MARC was used to retain the results of self-weight, prestress load, and concrete shrinkage. Subsequently, by loading the saved file and restarting the analysis, only the interface bonding parameters needed to be modified for further evaluation.
3.2. Reinforced by Increasing Section Area
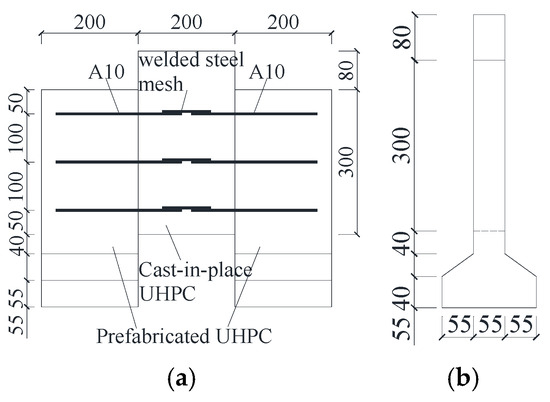
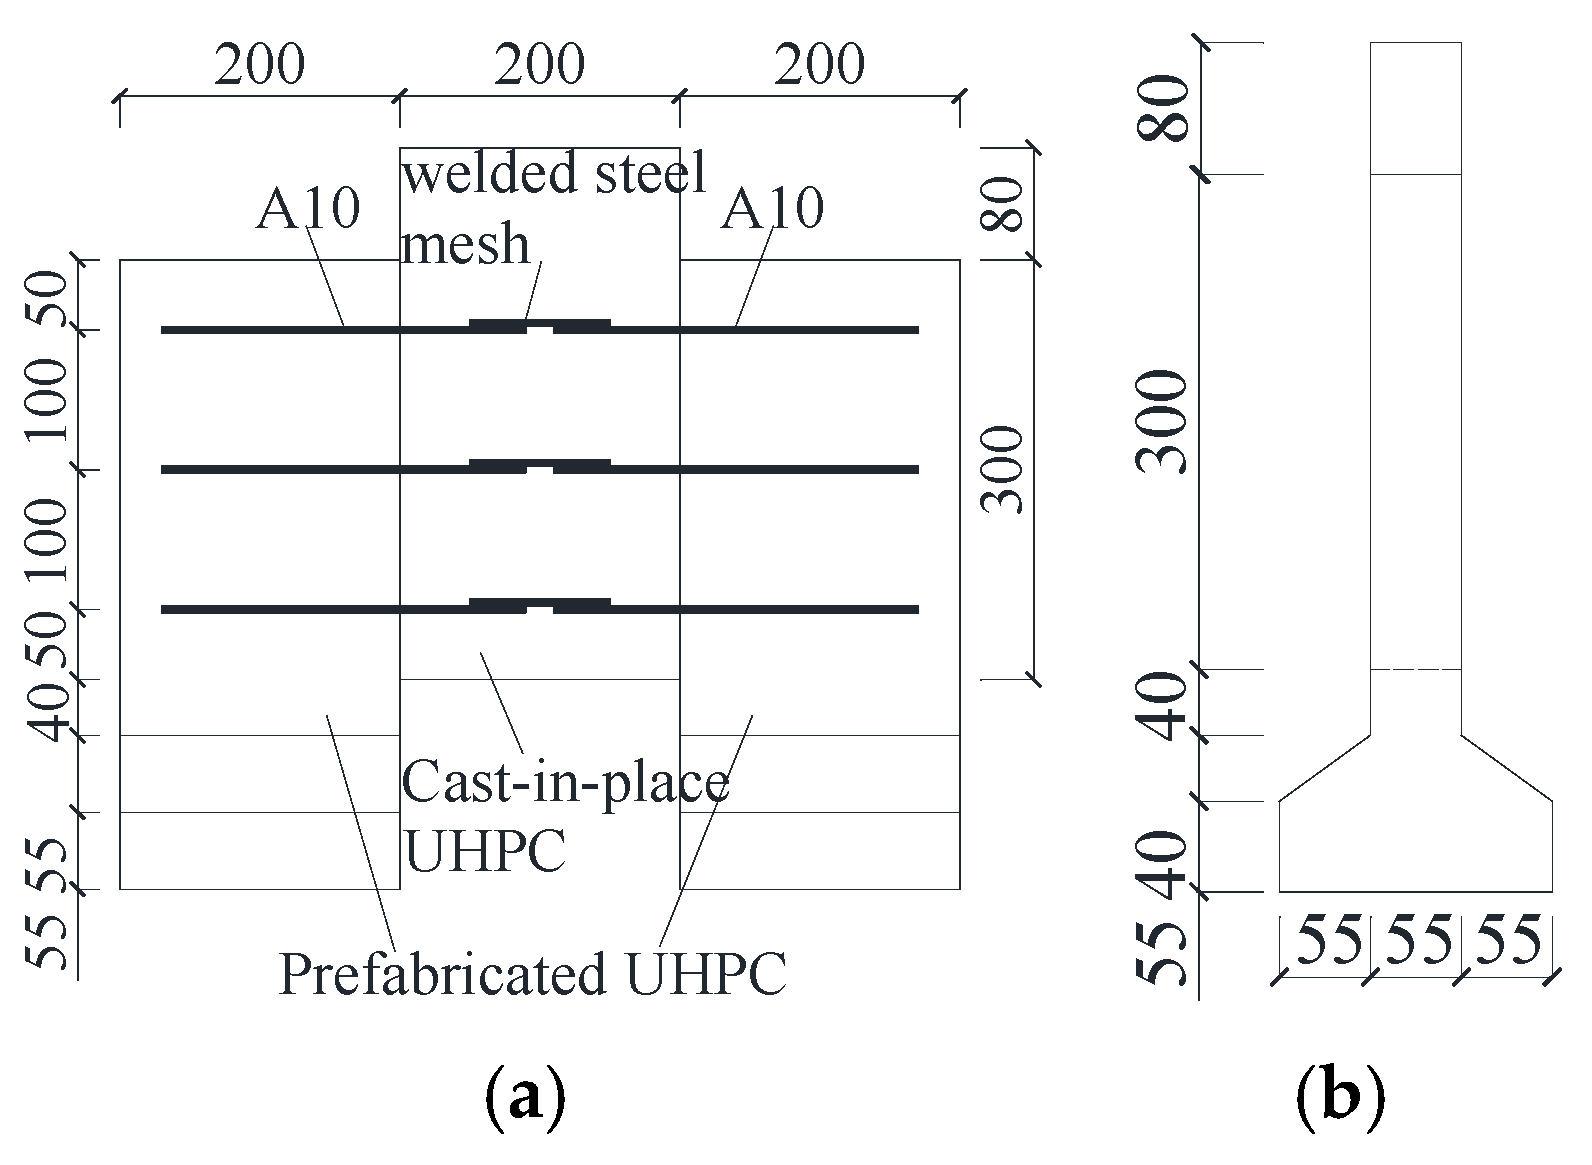
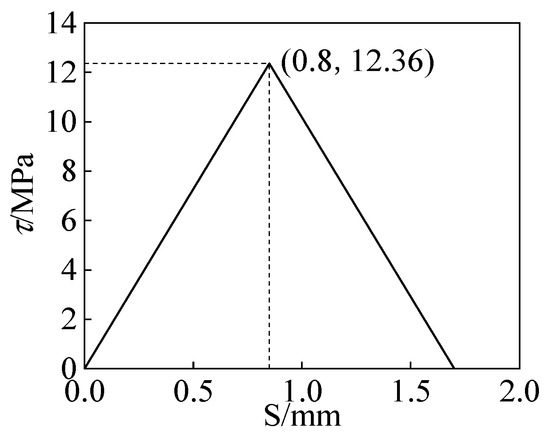
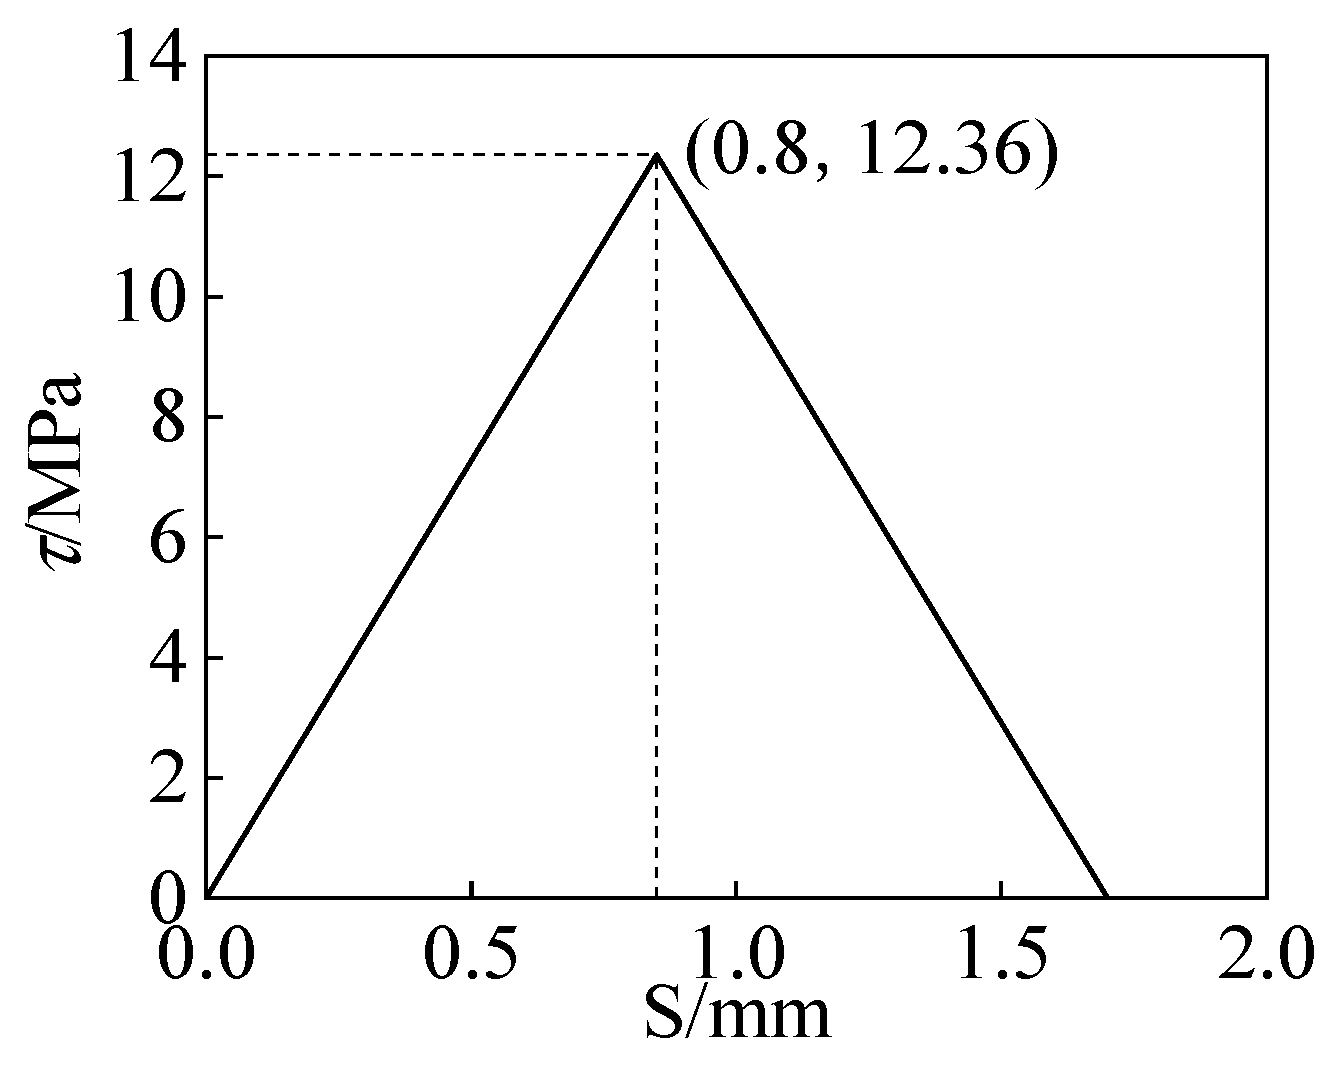
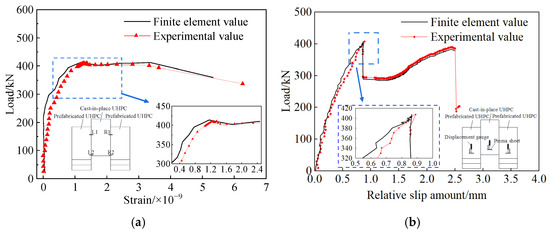
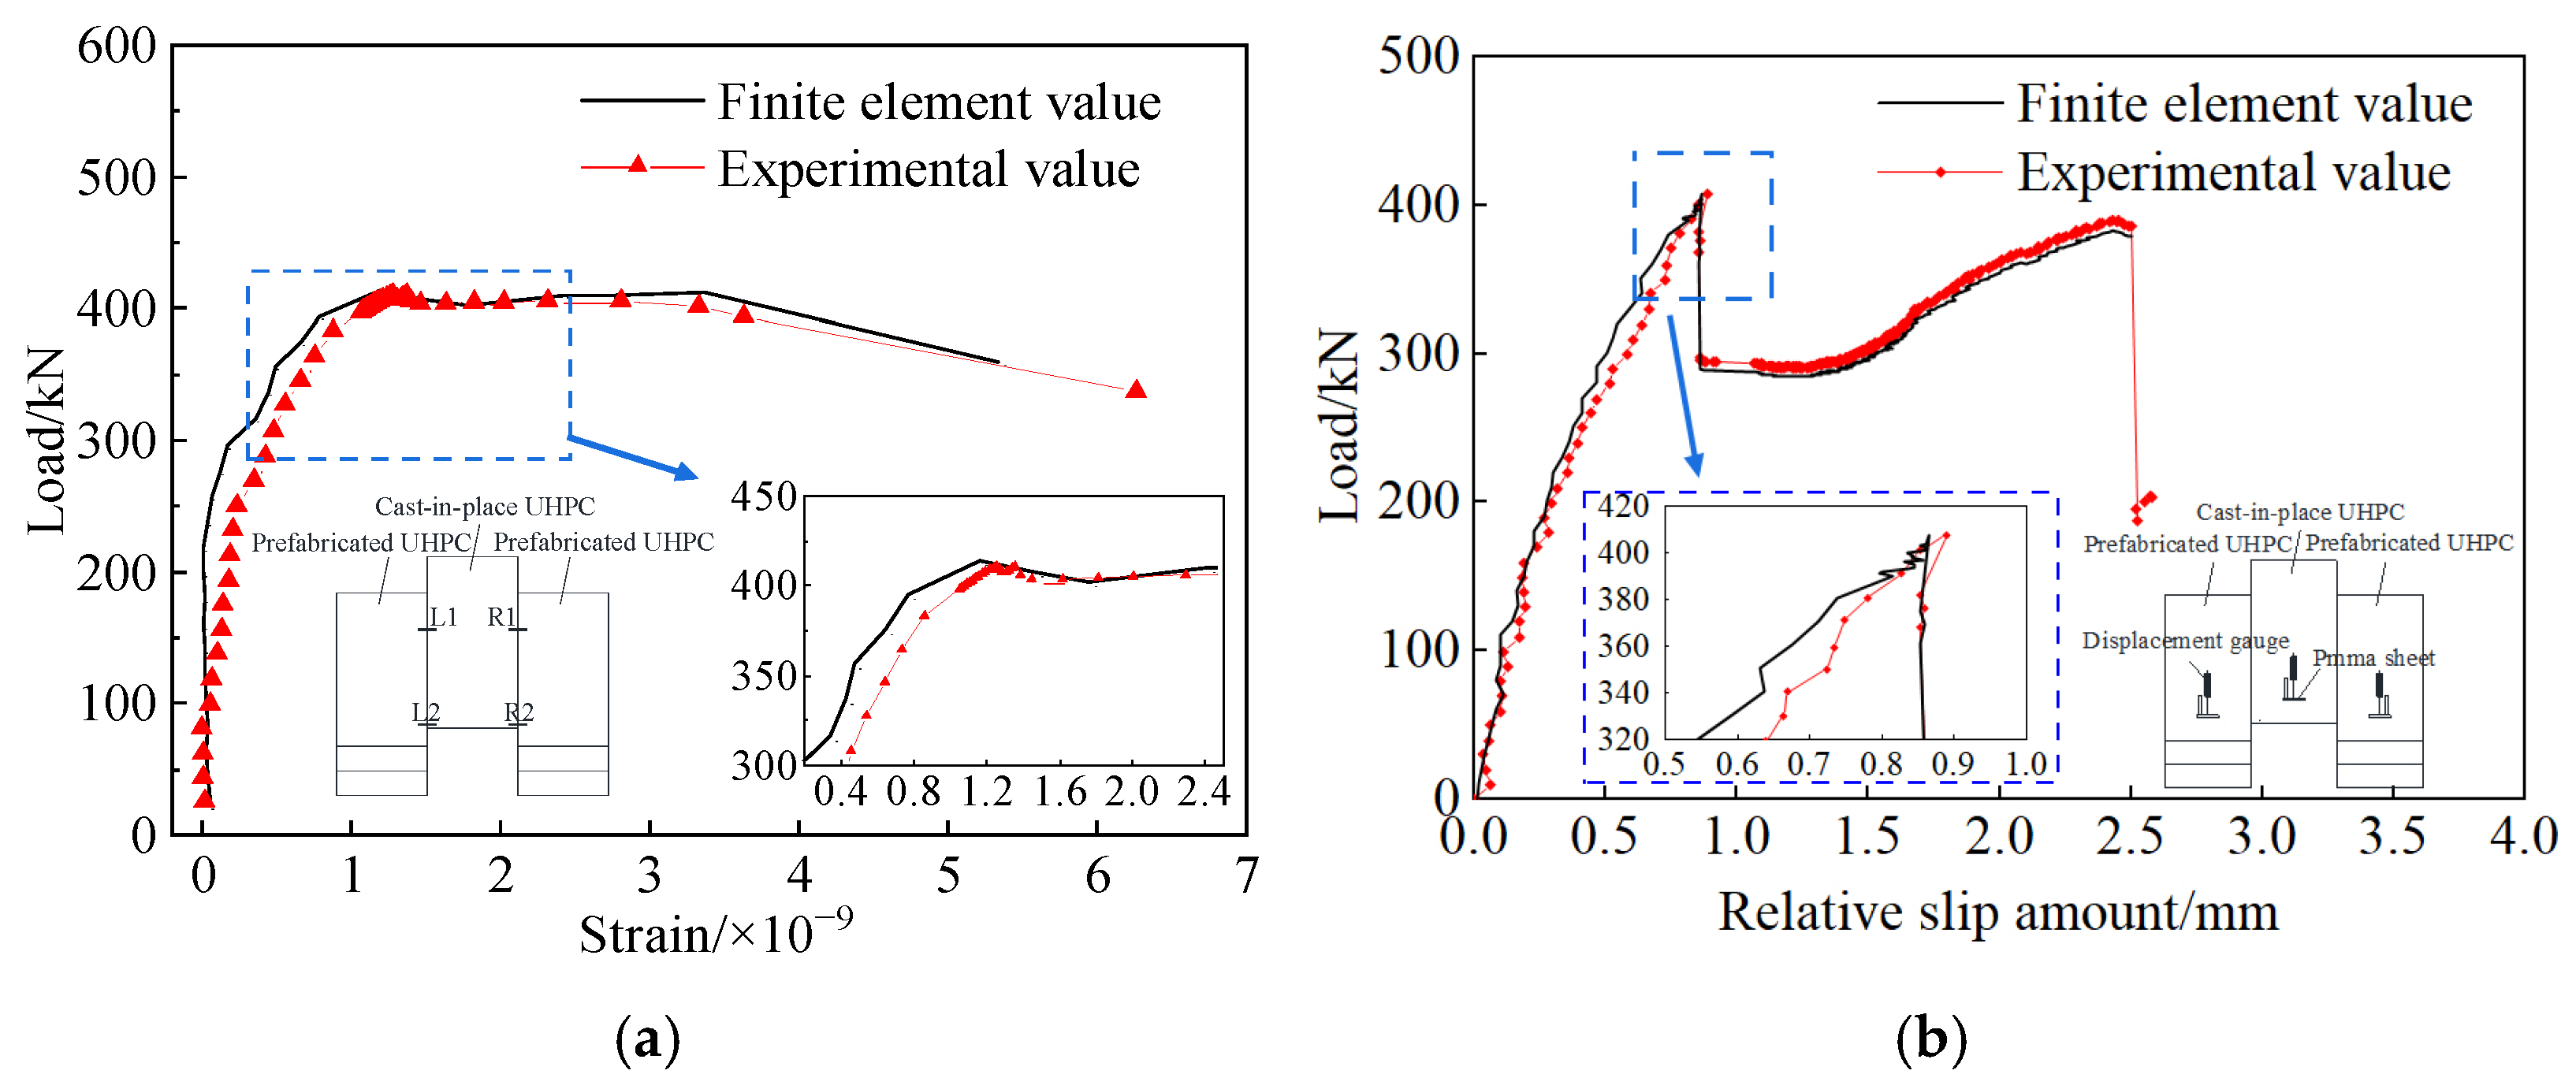
To validate the accuracy of the bond–slip curve used in this study, a shear performance test of the interface between precast and cast-in-place UHPC was conducted [28]. In the test specimens, the two outer layers were precast ultra-high-performance concrete (UHPC) panels, and the middle layer was cast-in-place UHPC. The UHPC panels were connected with 10 mm diameter HRB400 steel bars. After steam curing, the specimens were divided into two groups based on the interface treatment method: a roughened surface group and a smooth surface group, with three specimens in each group, as shown in Figure 10. The bond–slip curve of the specimen interface is shown in Figure 11. To verify the finite element model, a model with a chiseled interface was established and compared with the experimental results, as shown in Figure 12. When the maximum failure load was reached, the relative displacement error was 2.8%, and the interface strain error was 7.3%.
Figure 10.
Prefabricated and cast in situ UHPC interface shear test specimen. The panels illustrate: (a) elevation drawing; (b) side view.
Figure 11.
Bond-slip curve of precast-cast UHPC joint surface.
Figure 12.
Comparison of test and finite element values. The panels illustrate: (a) strain; (b) relative slip amount.
3.3. New Prestress Added
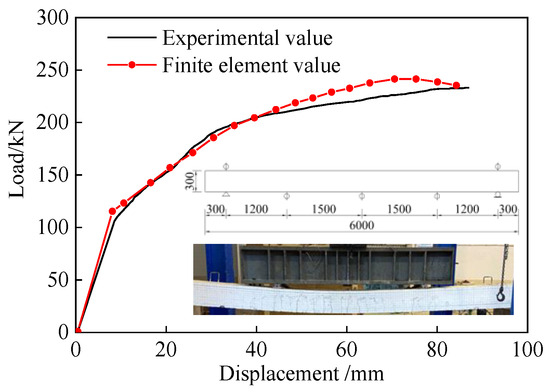
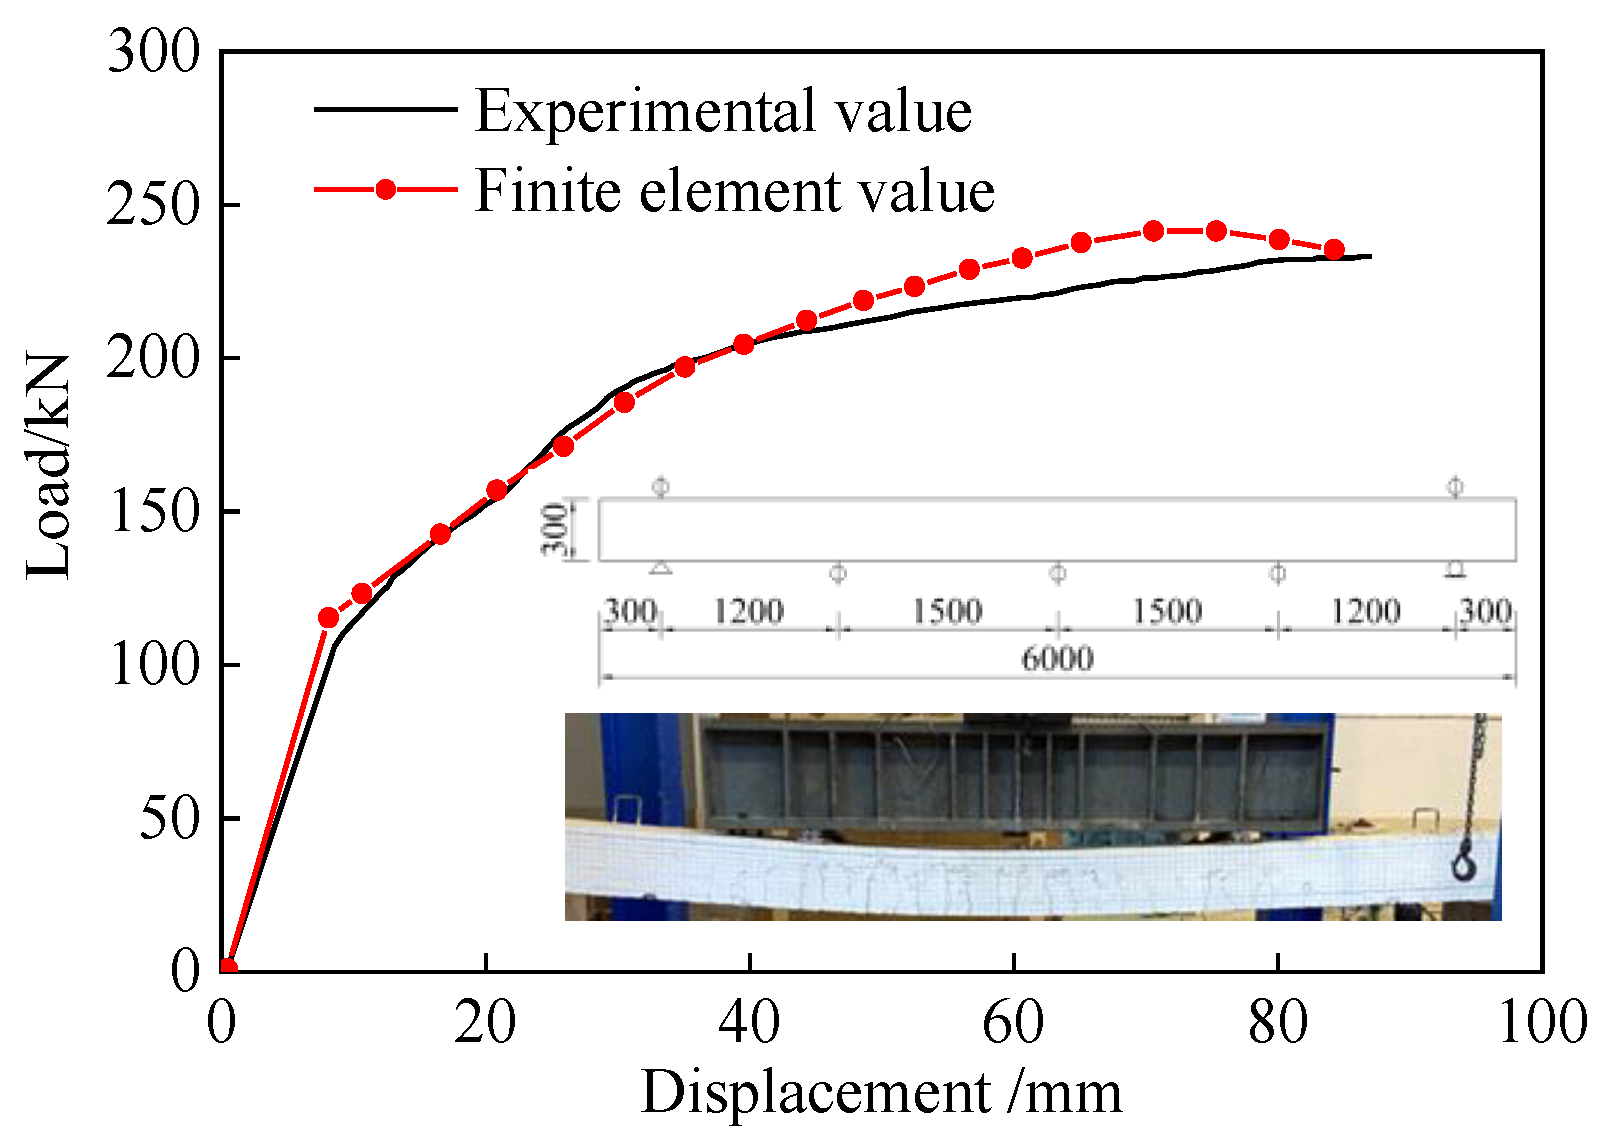
To validate the finite element model, a bending test of hollow slab beams was conducted [29], as shown in Figure 13. Two simply supported hollow slabs were tested, each with a total length of 6 m, a calculated span of 5.6 m, a cross-sectional width of 0.5 m, and a height of 0.3 m. The specimens included an unreinforced beam and an externally prestressed reinforced beam. C40 concrete was used, with HRB400 as the main reinforcement and HRB335 for the stirrups. The longitudinal reinforcement ratio was 0.7%. The unreinforced beam was provided with 3Φs 15.2 internal prestress, whereas the externally prestressed beam used external prestressing instead of internal prestress, with 2Φs 15.2 internal prestress and 1Φs 15.2 external prestress. The tension control stresses of the internal and external prestress were 1209 MPa and 1170 MPa, respectively. Two-point loading was applied at the midspan using a 100 t hydraulic jack. The prestress was applied in stages, and deflection was measured using a displacement meter.
Figure 13.
Hollow slab beam reinforcement test and finite element comparison.
Using the finite element modeling method described above, a finite element model of the hollow slab beam strengthened by external prestressing was established. The load–displacement curve of the beam was extracted and compared, as shown in Figure 13. The cracking and ultimate loads predicted by the finite element method (FEM) are in good agreement with the experimental results, and the numerical response closely matches the experimental curves. The calculated cracking load is 114.0 kN, compared with an experimental value of 106.0 kN, resulting in an error of 7.55%. Similarly, the predicted ultimate load is 241.6 kN, whereas the experimental value is 232.8 kN, corresponding to an error of 3.78%. Both discrepancies are within 10%, thereby validating the reliability of the finite element simulation approach adopted in this study.
3.4. New and Old Concrete Bond Shrinkage
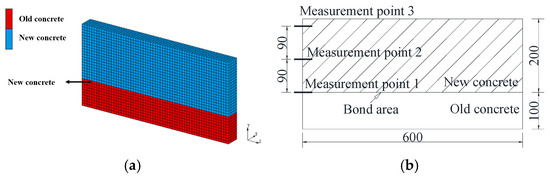
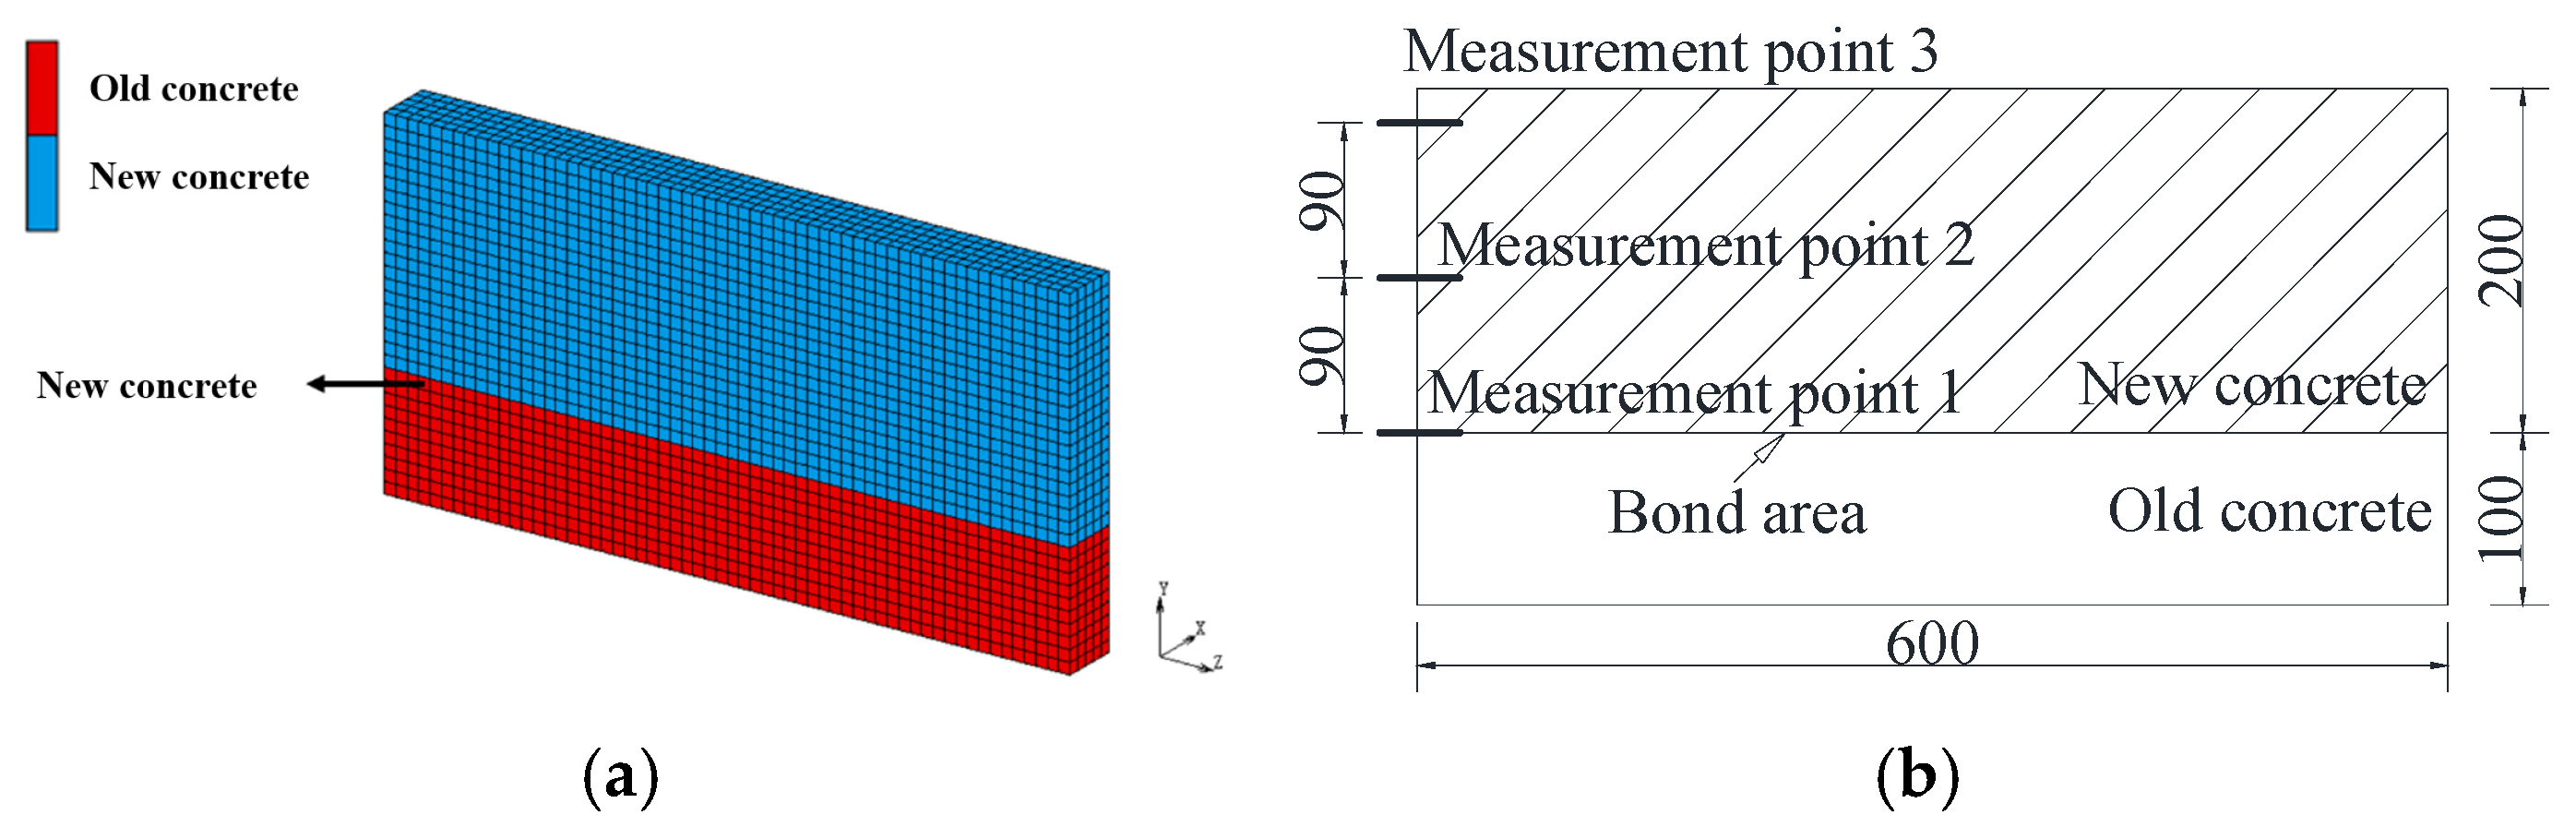
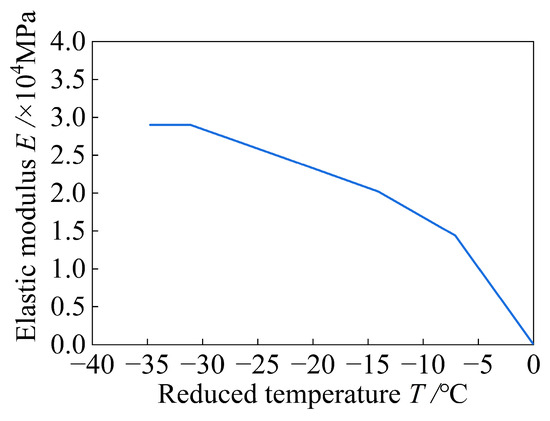
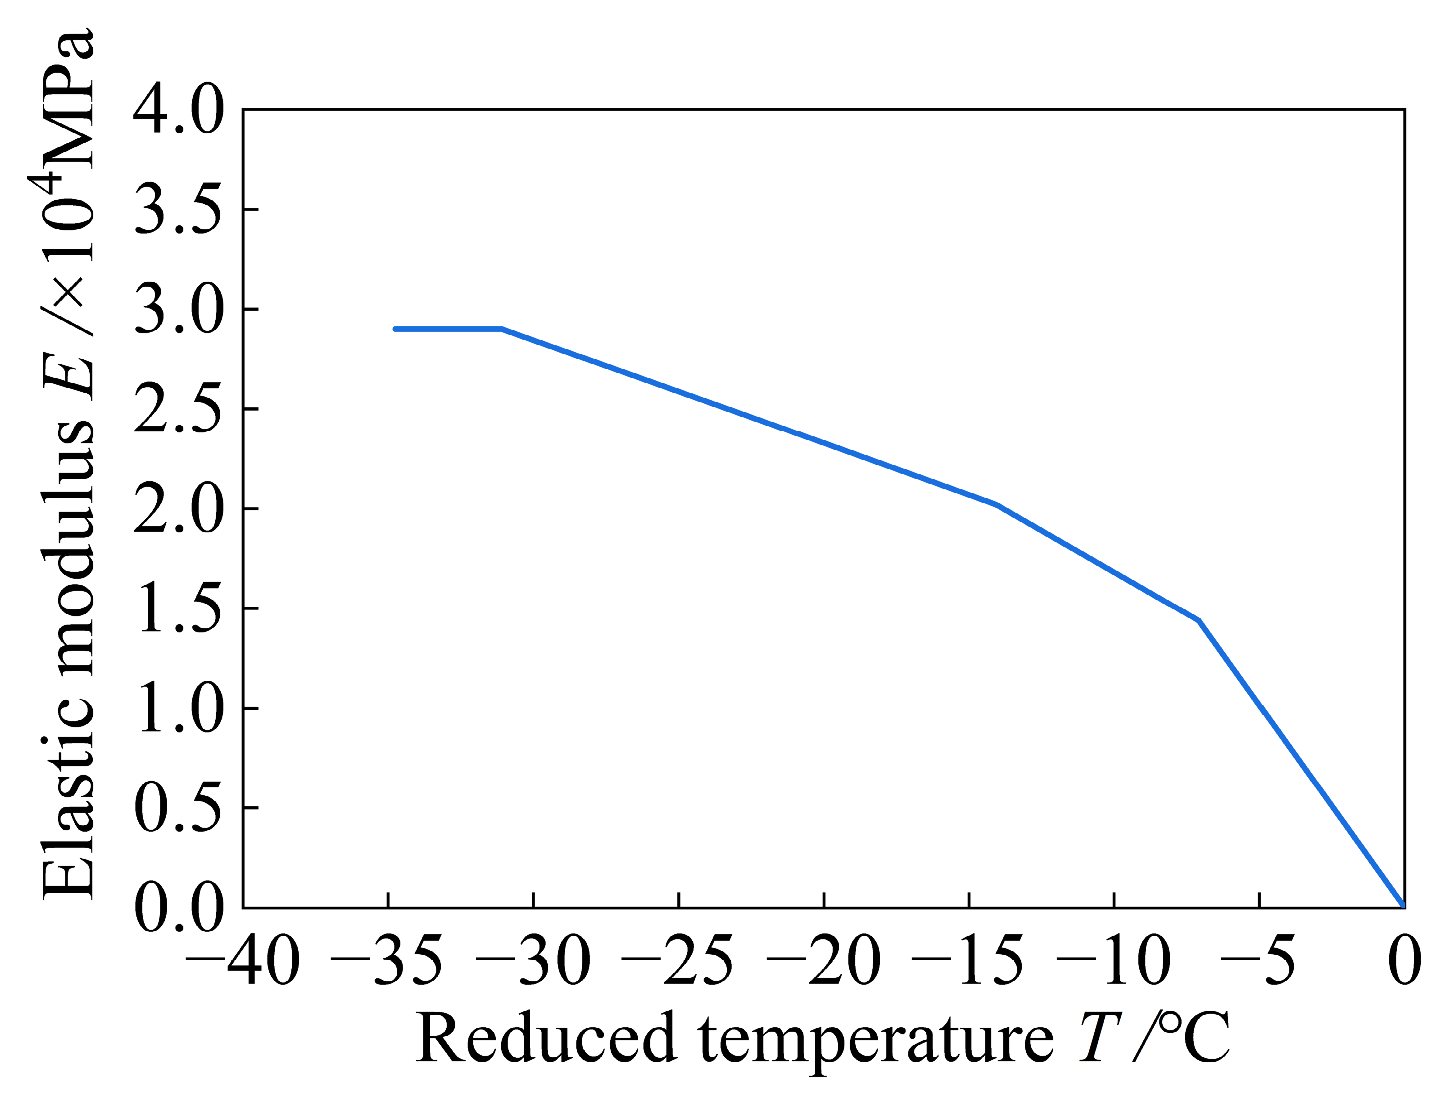
To validate the bond-shrinkage curve of new and old concrete used in this study, a finite element model of the bond-shrinkage test between self-compacting concrete and old concrete reported in the literature was established, following the modeling method described in Section 3.1 [15,16,17]. The old concrete in the specimen was C30 ordinary concrete, while the new concrete was C40 self-compacting concrete. The overall finite element model is shown in Figure 14, and the variation in the elastic modulus with temperature is presented in Figure 15.
Figure 14.
New and old concrete bonding finite element model. The panels illustrate: (a) finite element model; (b) layout of measurement points.
Figure 15.
Elastic modulus and temperature relation curve.
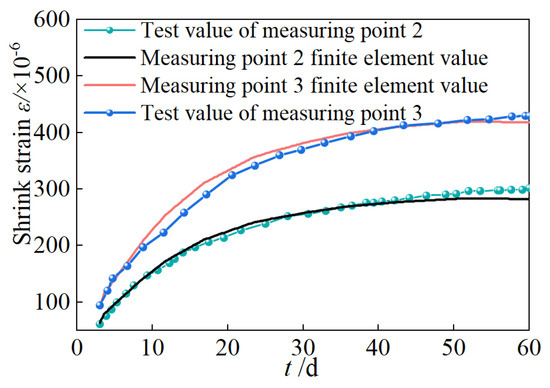
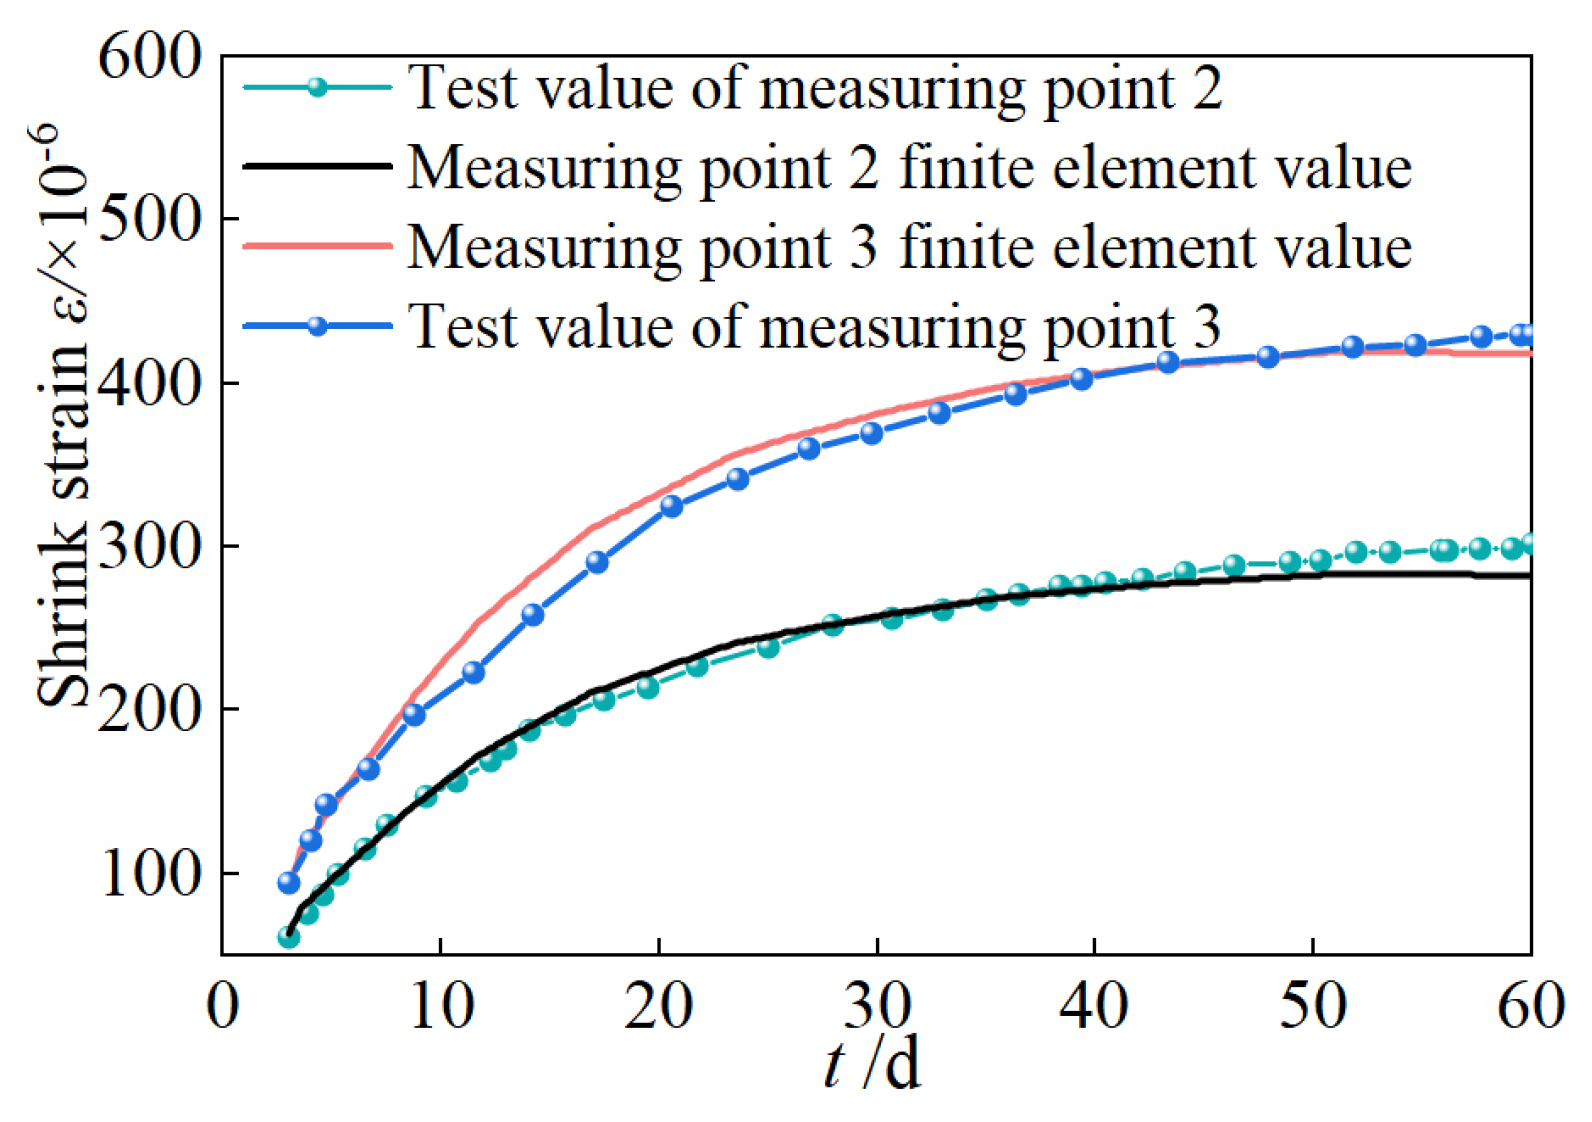
Because the new concrete is restrained by the old concrete at the bonding surface (measuring point 1), the shrinkage at this location is negligible. Therefore, only the data from measuring points 2 and 3 were selected for comparative analysis. Figure 16 presents a comparison between the bond test results of new and old concrete and the finite element simulation results. The maximum error between the two is 8.14%, indicating that the modeling method used is reasonable.
Figure 16.
MSC.MARC Finite element model.
4. The Effect of New Concrete Bond Shrinkage on Interface Force Transmission
4.1. New Concrete Shrinkage Problem
Under free shrinkage conditions, newly cast concrete does not develop internal tensile stress. However, when the section enlargement method is adopted for strengthening, the shrinkage of the existing concrete has essentially stabilized, whereas the shrinkage deformation of the newly added concrete during hardening is rigidly restrained by the existing concrete. This restraint induces tensile stress within the newly added concrete, generating shear stress at the interface between the old and new concrete, tensile stress along the side of the newly added concrete, compressive stress on the outer side of the existing concrete web, and tensile stress on its inner side. When these tensile stresses exceed the tensile strength of the newly added concrete, or when the interfacial shear stress surpasses the bond strength between the old and new concrete, cracking may occur in the newly added concrete or shear failure may develop at the interface. Such damage significantly compromises the integrity of the strengthening layer and the overall effectiveness of the section enlargement method.
4.2. Concrete Material Properties
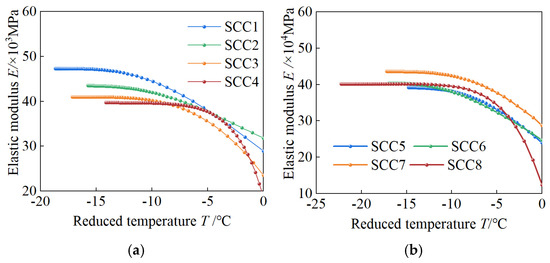
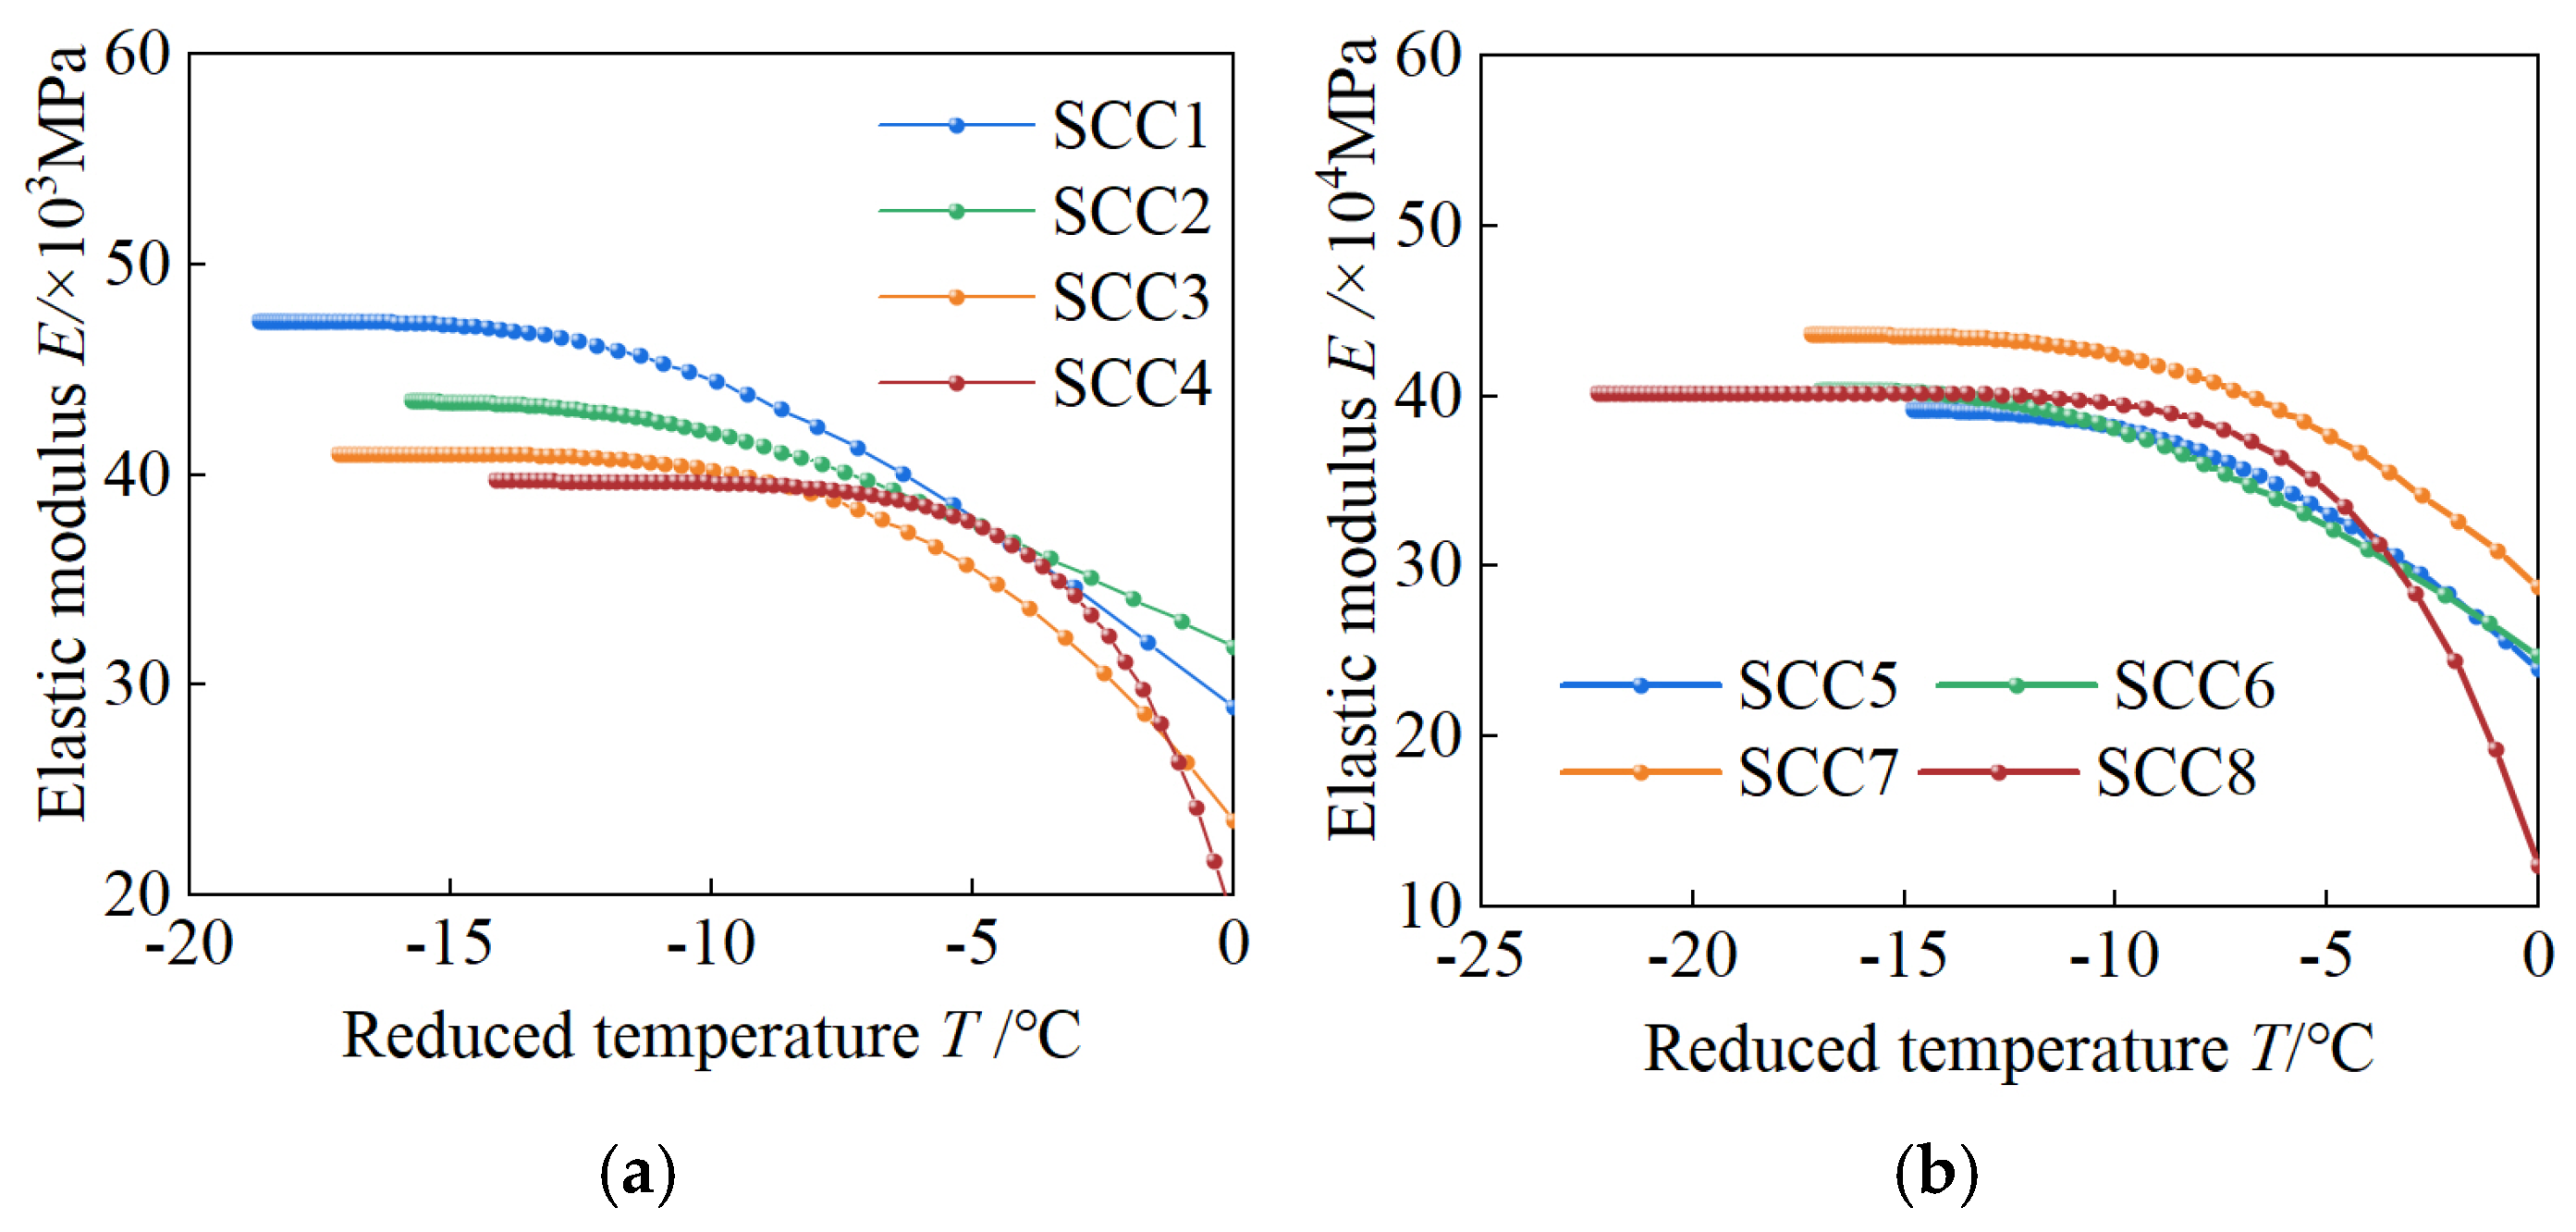
The original bridge concrete in the background project is C50. The mix proportion of the self-compacting concrete used in the reinforcement design is cement 550 kg/m3, water 178 kg/m3, river sand 780 kg/m3, gravel 850 kg/m3, admixture 6.0 kg/m3, and binder 550 kg/m3; this mix was used as the reference group (SCC3). To analyze the influence of different mix proportions on the bond shrinkage of the new concrete, the mix proportions from the shrinkage tests of self-compacting concrete conducted by Wang et al. [30,31] were used as parameters for analysis. Key parameters included variations in fly ash content in the binder and different mixing ratios of fly ash and slag, which were labeled SCC1 to SCC8. The material properties of the original bridge concrete and the self-compacting concrete of each mix proportion are presented in Table 7, and the shrinkage strain of the self-compacting concrete at each age is shown in Table 8. According to Section 3.1, the relationship between the elastic modulus and temperature of the new self-compacting concrete was calculated using Equations (7)–(9), as shown in Figure 17.
Table 7.
Material properties.
Table 8.
Measured value of free shrinkage test.
Figure 17.
The relationship between elastic modulus and temperature. The panels illustrate: (a) fly ash; (b) expanding agent.
4.3. Shrinkage Effect of New Concrete
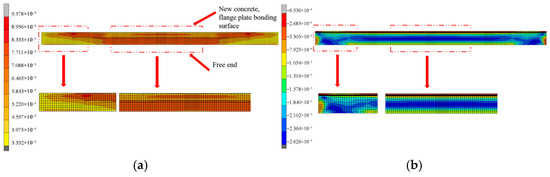
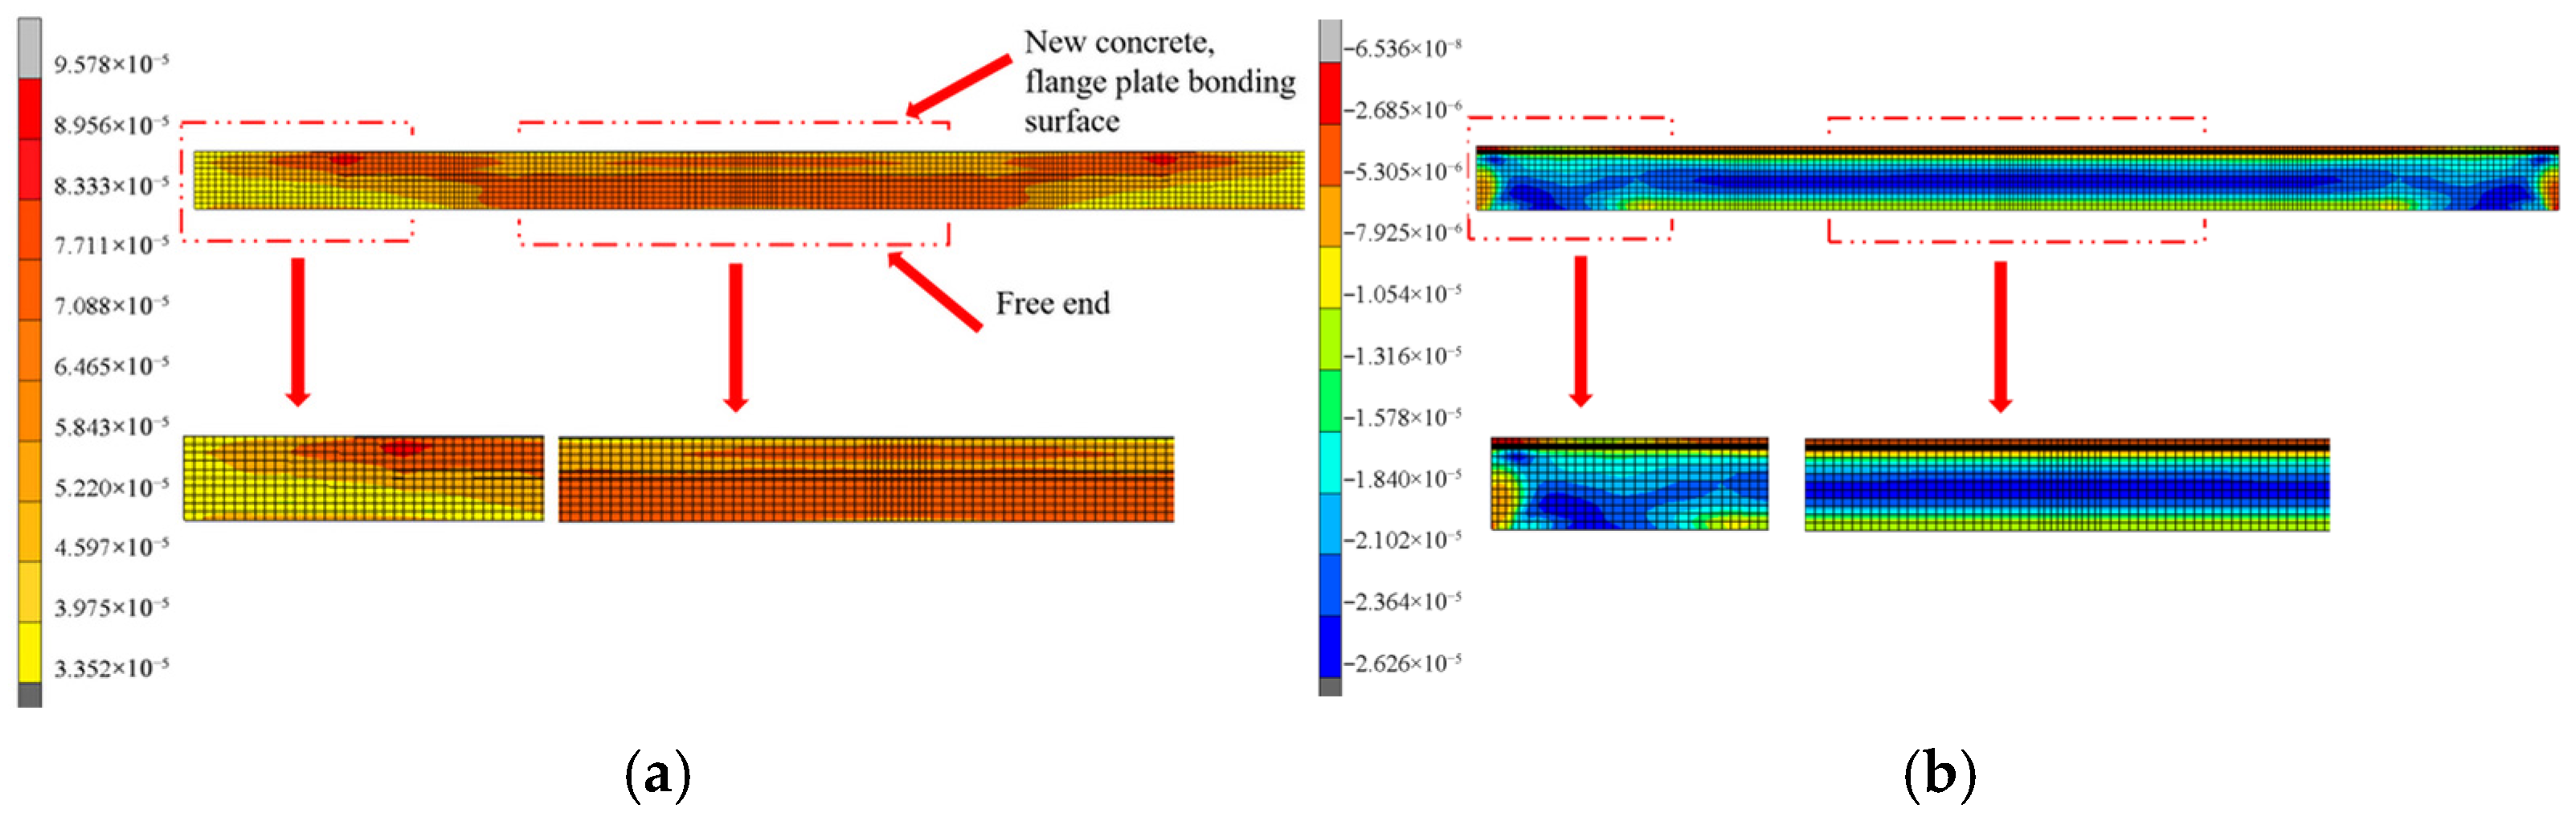
When unconstrained, concrete shrinkage is isotropic. However, under the restraint of the existing web and flange plate, the shrinkage deformation of the new concrete exhibits non-uniform characteristics. Taking the prestress and self-weight of the original bridge as initial conditions, the bond shrinkage strain of the new concrete SCC3 at 60 days is shown in Figure 18. The figure indicates that, under the constraints of the original box girder, the maximum shrinkage of the new web occurs at the bonding surface between the new concrete and the flange plate at the mid-span and near the supports, with a maximum shrinkage strain of 88.90 × 10⁻⁶. The maximum strain in the original bridge web, induced by the shrinkage of the newly added web, occurs at the supports, with a value of 26.26 × 10⁻⁶. The stress pattern of the new web mirrors the shrinkage strain distribution, with the maximum tensile stress of 3.77 MPa appearing at the bonding surface between the new web concrete and the flange plate of the original bridge box girder.
Figure 18.
Web concrete bond shrinkage strain cloud map. The panels illustrate: (a) added concrete outer surface; (b) outer surface of web of original bridge.
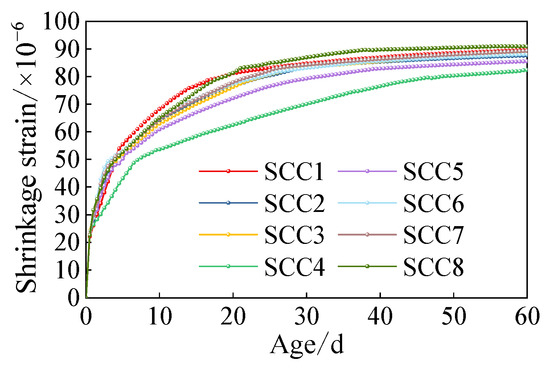
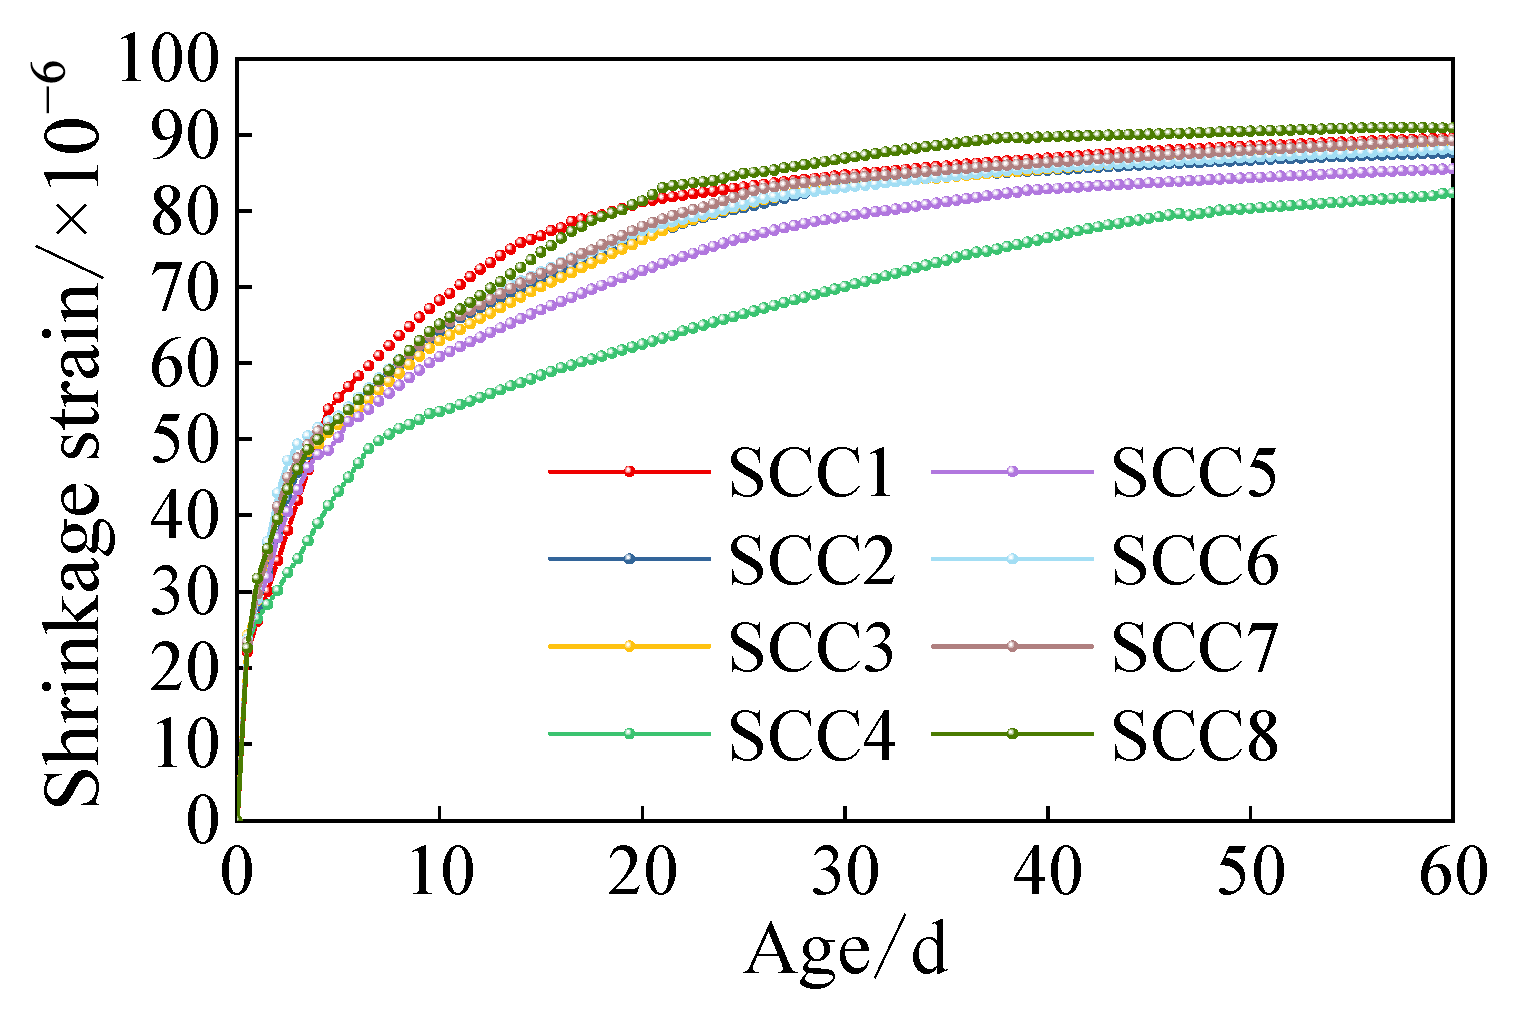
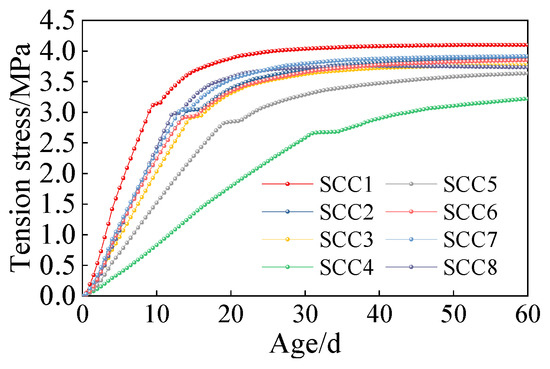
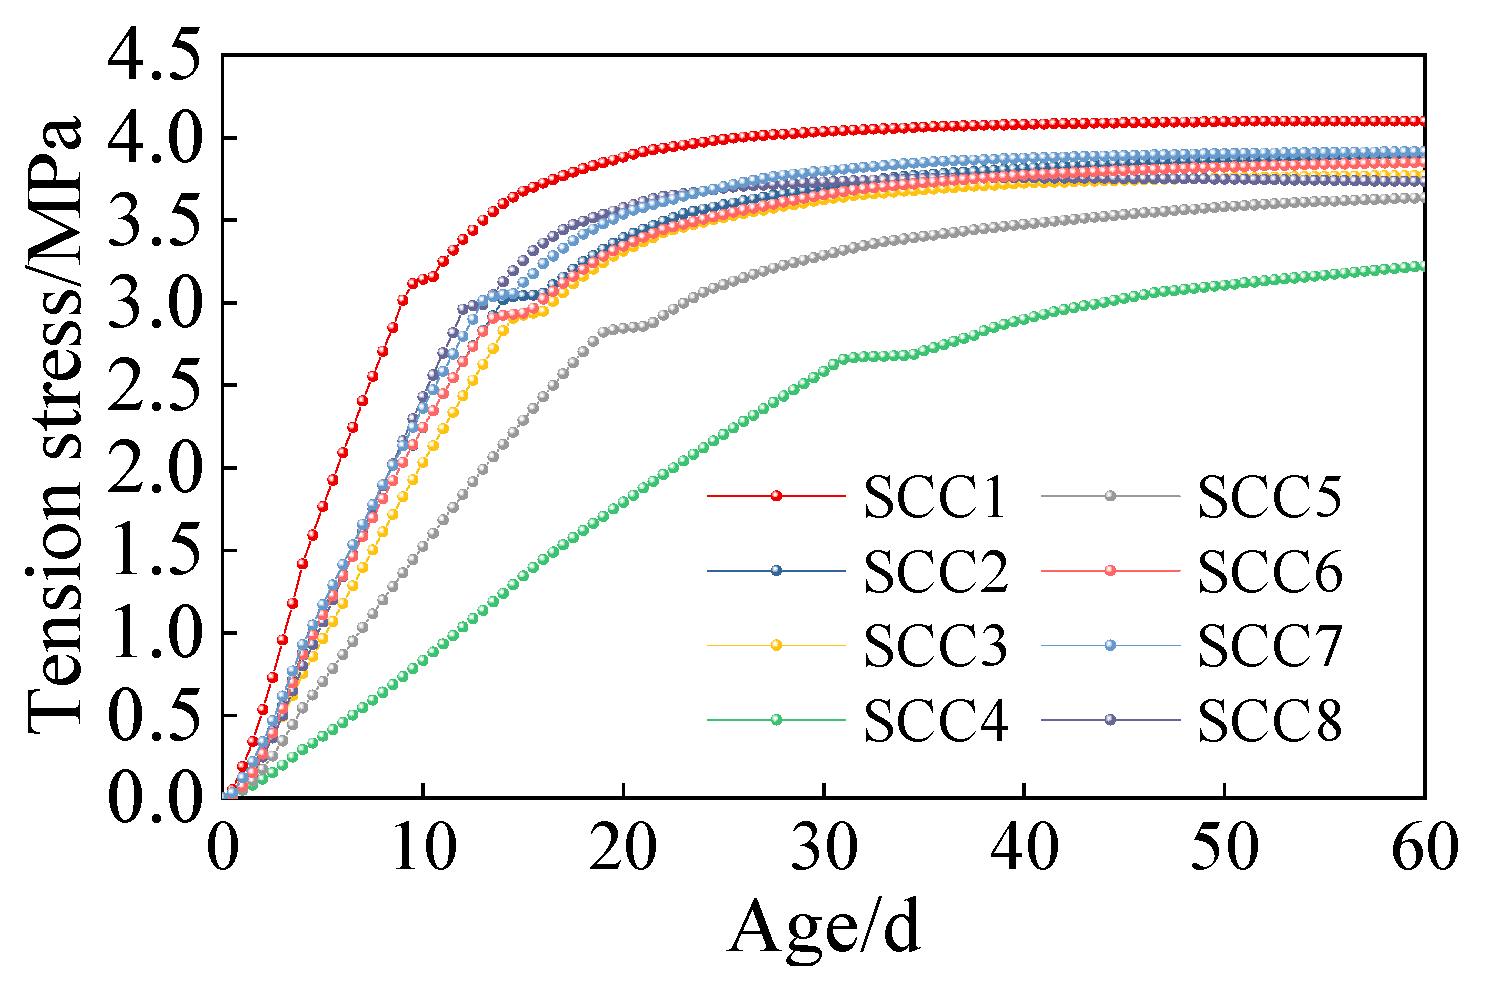
To investigate the influence of the restraint effect of the original bridge box girder on the shrinkage of self-compacting concrete with different mix proportions, the maximum shrinkage strain and stress positions of the new concrete were extracted, and the age-dependent variations in shrinkage strain and stress were compared, as shown in Figure 19 and Figure 20. SCC1 exerted the greatest influence on the shrinkage-induced bond behavior of the newly added web. When the fly ash replacement ratio reached 54% (SCC4), the reductions in shrinkage stress and strain of the newly added web were the most significant. At 28 days, the shrinkage strain decreased from 84.10 × 10⁻⁶ to 68.70 × 10⁻⁶, while the shrinkage stress decreased from 4.02 MPa to 2.43 MPa, corresponding to a stress reduction of 39.56%. At 60 days, the shrinkage strain decreased from 89.60 × 10⁻⁶ to 82.4 × 10⁻⁶, and the shrinkage stress decreased from 4.10 MPa to 3.22 MPa, representing a reduction of 21.46%. The maximum tensile stress induced in the original bridge was 0.92 MPa. As the slag content in the concrete increases, the shrinkage strain of the newly added web correspondingly increases, leading to a higher shrinkage stress at the interface between the old and new concrete. Therefore, for combined strengthening using internal prestressing and section enlargement, a 54% fly ash replacement of cement is recommended.
Figure 19.
The effect of different binder contents on shrinkage strain.
Figure 20.
The effect of different binder contents on shrinkage stress.
5. The Influence of Interface Parameters and Structure on Interface Force Transmission
5.1. Reinforcement Interface Loss Analysis
When combined internal prestressing and section enlargement are adopted for strengthening, the new and existing concrete form a composite cross-section. The newly applied internal prestress initially acts on the web of the added concrete and is subsequently transferred to the original bridge web through the interface between the new and existing concrete. However, the transfer of the newly introduced prestress is influenced by factors such as the interfacial bond performance and the anchorage ratio at the interface. Therefore, a finite element model was established using MSC.MARC to investigate this transfer mechanism. To account for the bond shrinkage of the new concrete containing 54% fly ash, the stress at the bottom edge of the mid-span section of both the new concrete web and the original bridge web was extracted and compared before and after applying the new prestress, thereby determining the prestress loss rate across the new–old interface. Based on the principle of prestressing, this paper employs a cooling method to lower the temperature of prestressed steel bars from 0 °C to the calculated temperature. By defining the coefficient of linear expansion of the prestressed steel bars, they are made to shrink as the temperature decreases. In the finite element model, the two ends of the prestressed steel bars are fixed, restricting their shrinkage and thus generating tensile stress within the prestressed steel bars [32]. Because the existing bridge has experienced long-term operational damage, structural calculations indicate that a 10% prestress loss in the original bridge corresponds to a stress state consistent with the actual condition. Accordingly, a 10% prestress loss was considered when calculating the cooling magnitude for the original bridge prestress, resulting in a calculated cooling temperature of 541.04 °C according to Equation (10). To eliminate the influence of normal stress induced by the dead load of the original box girder on the bottom edge of the new concrete section, Equation (11) was used to calculate the prestress loss rate, δ, across the new–old concrete interface.
Among them, σ is the tensile stress of prestressed steel beam, α is the linear expansion coefficient, which is 1.2 × 10⁻⁵, and E is the elastic modulus of prestressed steel beam.
Among them, Δσold is the stress change in the bottom edge of the mid-span section of the original bridge, and Δσnew is the stress change in the bottom edge of the new concrete.
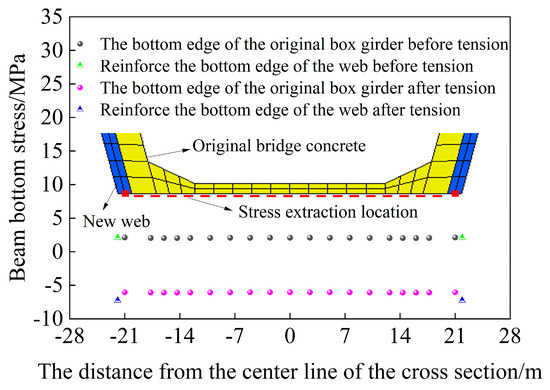
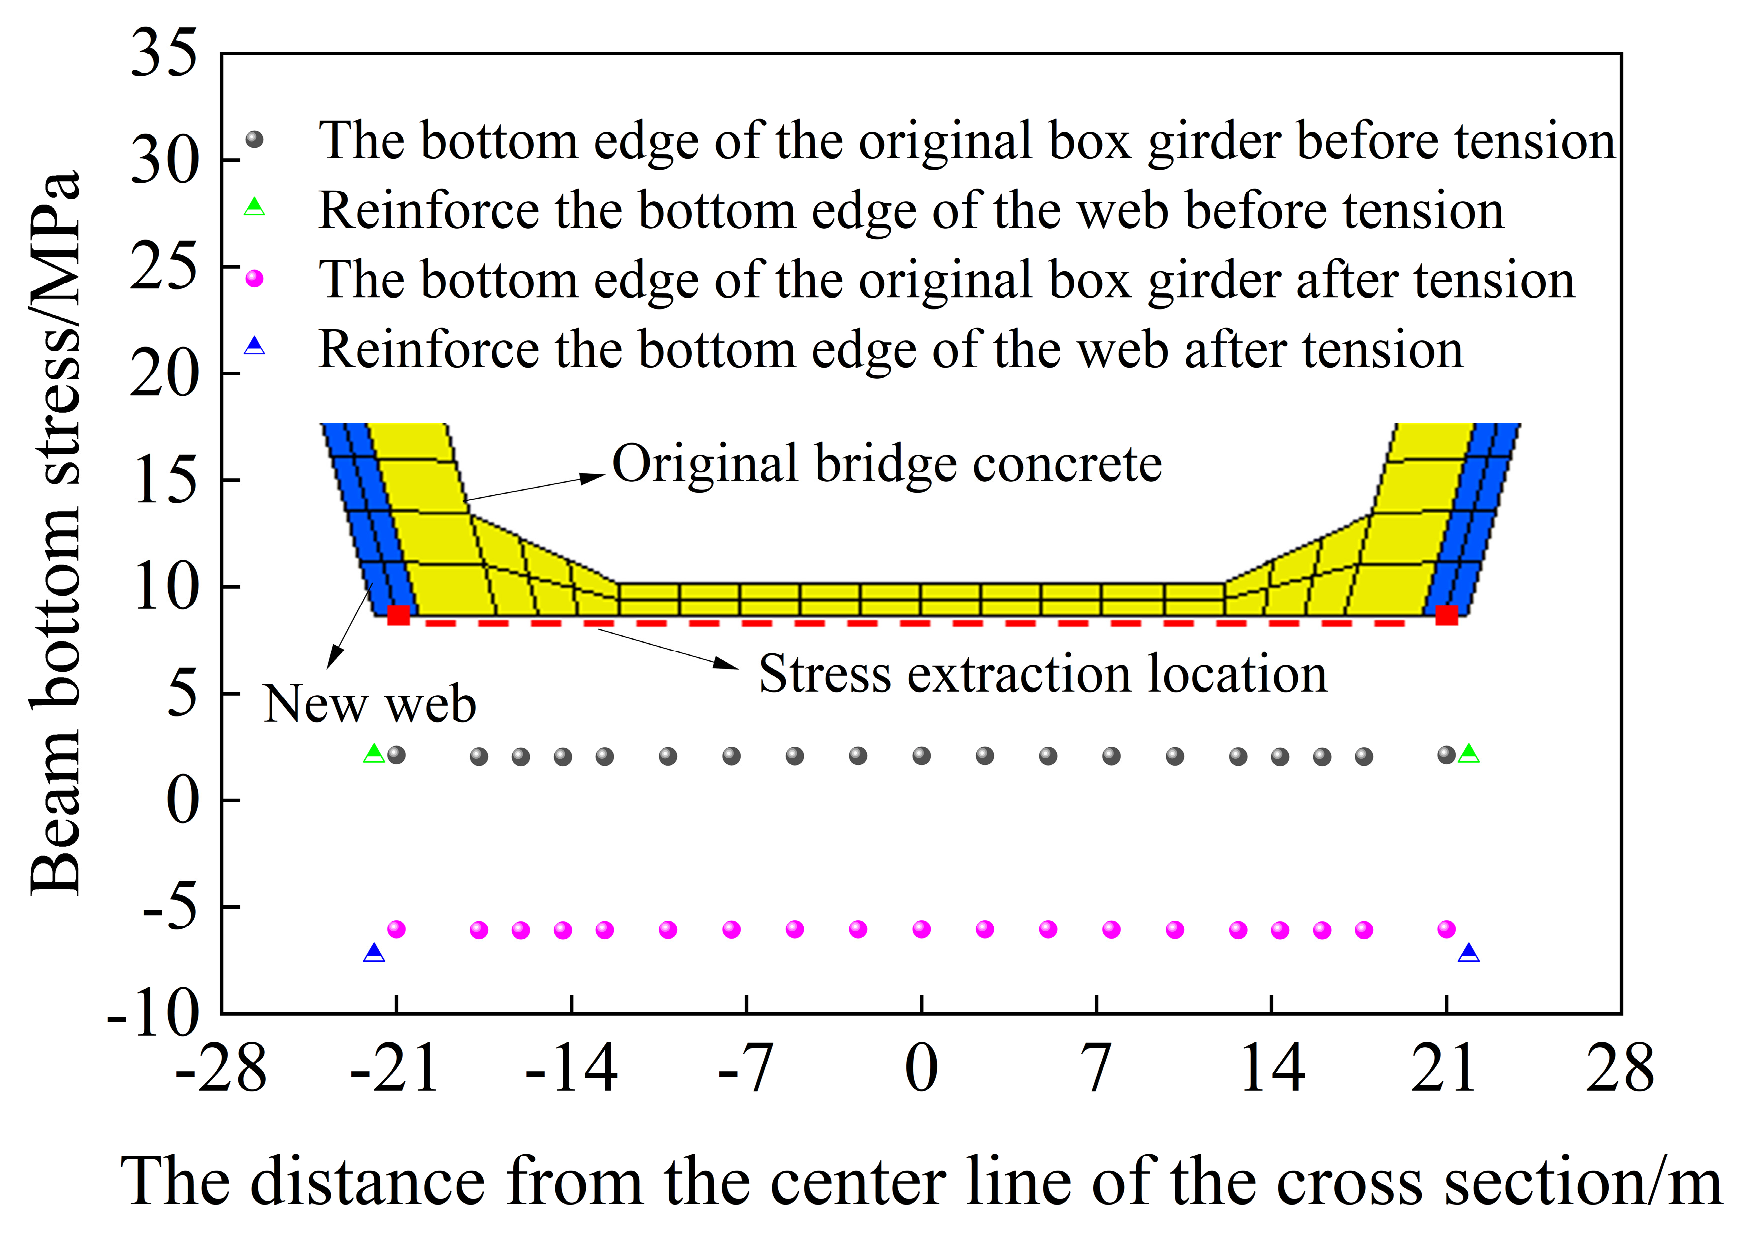
Figure 21 illustrates the variation in bottom-plate stress before and after the application of the new prestress. In the numerical model, a 10% loss of prestressing force in the original bridge tendons was assumed, together with a 15% reduction in overall sectional stiffness. After the web concrete was added, the stress at the bottom edge of the beam reached 2.08 MPa. Following prestress application, the normal stress at the bottom edge of the box-girder cross-section decreased substantially. Specifically, the normal stress change at the bottom edge of the original box girder was 8.12 MPa, whereas that at the bottom edge of the new web was 9.33 MPa. Substituting these values into Equation (11) yields a prestress loss rate of 12.90% across the new–old concrete interface. Therefore, to achieve the desired strengthening effect, prestress loss at the interface should be considered in the design of internal prestressing for box girder bridges strengthened using the internal prestress-increasing section method.
Figure 21.
The stress change in the floor before and after the new prestressed tension.
5.2. Interface Binding Property
Planting bars can significantly enhance the shear strength at the interface between new and old concrete; however, there is no linear relationship between the planting bar ratio and the interface shear strength. Based on the applicable range of Equation (5), for an interface reinforcement ratio of 0–0.7%, the bond-slip stiffness is 10 MPa/mm, and the ultimate slip is twice the slip corresponding to the peak shear strength [33]. To analyze the effect of varying the planting rate on prestress transfer efficiency, the shear strength corresponding to different planting rates is summarized in Table 9.
Table 9.
Shear strength of different planting rate.
When the normal stress at the bonding surface is held constant, the magnitude of the interfacial bonding force can be adjusted by varying the bond–slip stiffness K, allowing the effect of different roughness levels at the old and new concrete interfaces on interfacial loss to be considered. Accordingly, this study applies a roughening treatment to the contact surface and measures the surface roughness using the sand-filling method [34]. The tangential bond–slip stiffness of the contact surface was determined based on data reported by Liu et al. [24]. The bond–slip stiffness K resulting from surface roughness is taken to range from 5 to 15 MPa/mm. Specifically, when the normal stress is 2 MPa, a bond–slip stiffness of 7.4 MPa/mm corresponds to a roughness of 3.556 mm; 10.9 MPa/mm corresponds to 2.222 mm; and 12.7 MPa/mm corresponds to 0.933 mm. Keeping all other parameters constant and using a rebar anchoring rate of 0.3% as the baseline, the following bond–slip stiffness values were considered: 5, 7.5, 10, 12.5, and 15 MPa/mm.
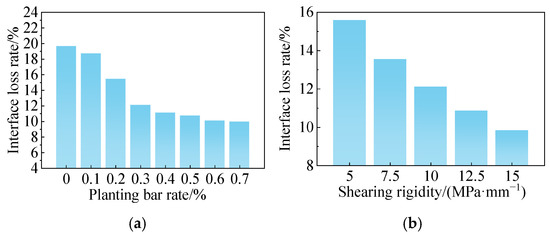
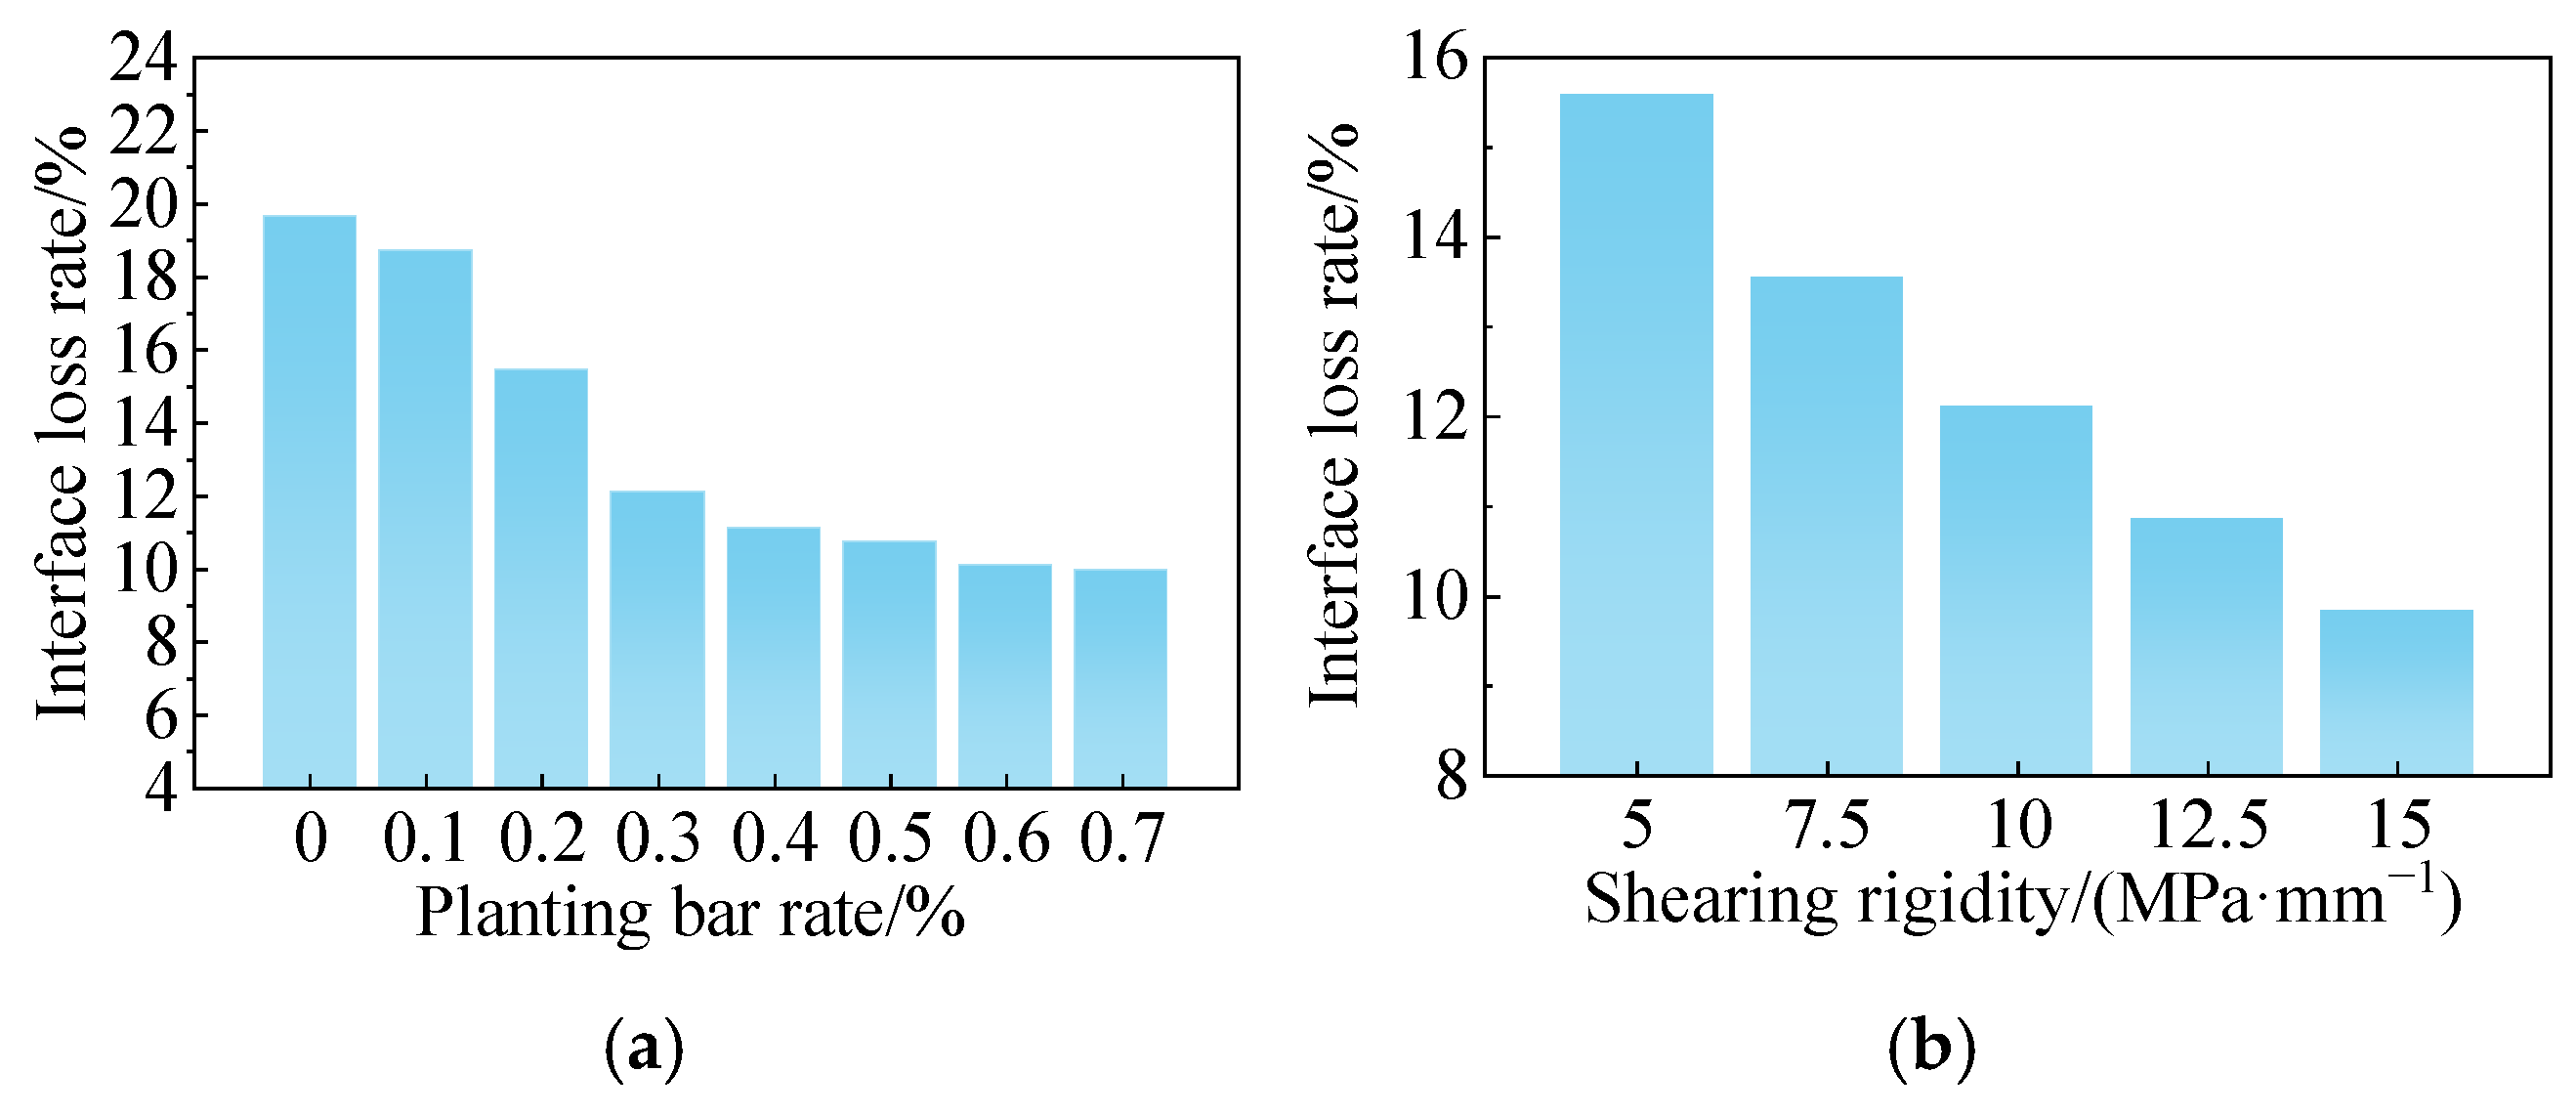
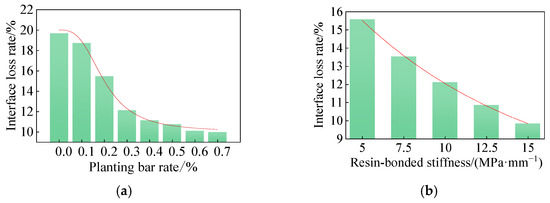
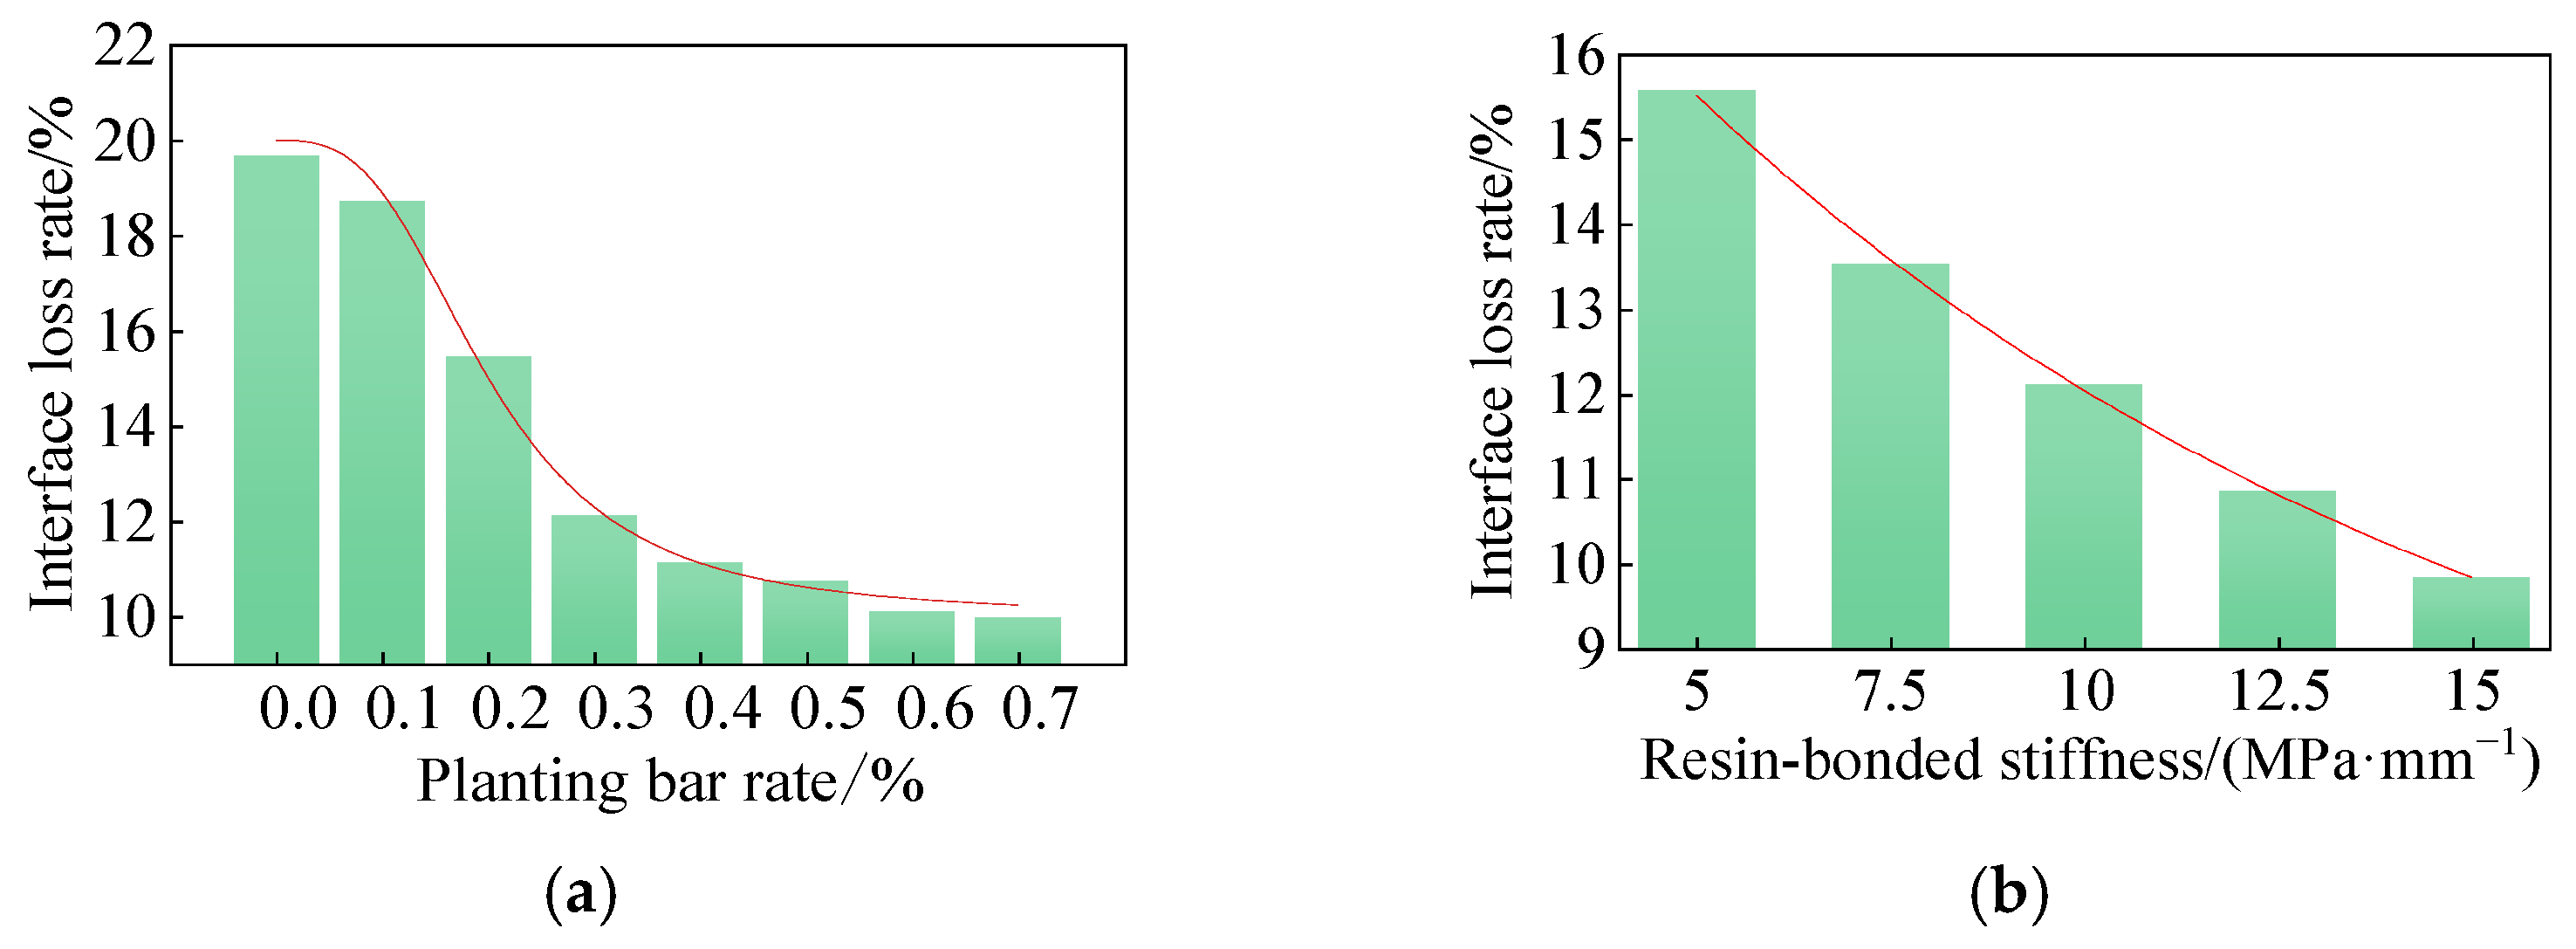
According to Equation (11), the influence of varying reinforcement ratios on the transfer efficiency of the new prestressed interface can be calculated, as shown in Figure 22. When the interface reinforcement ratio increases from 0% to 0.2%, the prestress loss rate gradually decreases from 19.67% to 15.44%. As the ratio further increases from 0.2% to 0.5%, the loss rate declines to 10.73%. When the interface reinforcement ratio rises from 0.5% to 0.7%, the prestress loss rate stabilizes at approximately 10.1%. Thus, increasing the interface reinforcement ratio not only enhances the shear performance of the new–old concrete interface but also improves prestress transfer efficiency. Based on these results, a reinforcement ratio of 0.6% is recommended.
Figure 22.
Shear strength of new and old concrete interface. The panels illustrate: (a) reinforcement ratio; (b) shear stiffness.
Similarly, when the bond–slip stiffness increases from 5 MPa/mm to 15 MPa/mm, the prestress loss rate shows a continuous downward trend, decreasing from 15.58% to 9.83%. As the bond–slip stiffness increases, the reduction in prestress loss rate gradually diminishes, indicating a weakening marginal improvement with higher stiffness. Therefore, increasing surface roughness can both enhance the shear resistance of the interface between new and old concrete and improve the efficiency of prestress transfer. According to the studies by Chen [17] and Liu et al. [24], the interface roughness after roughening treatment and sand-filling is recommended to be 0.9 mm.
5.3. Reinforcement Structure Parameters
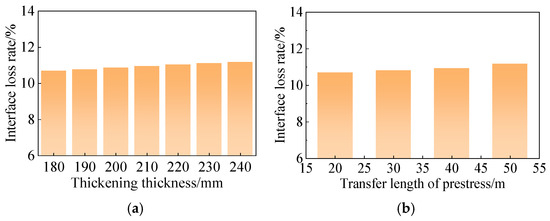
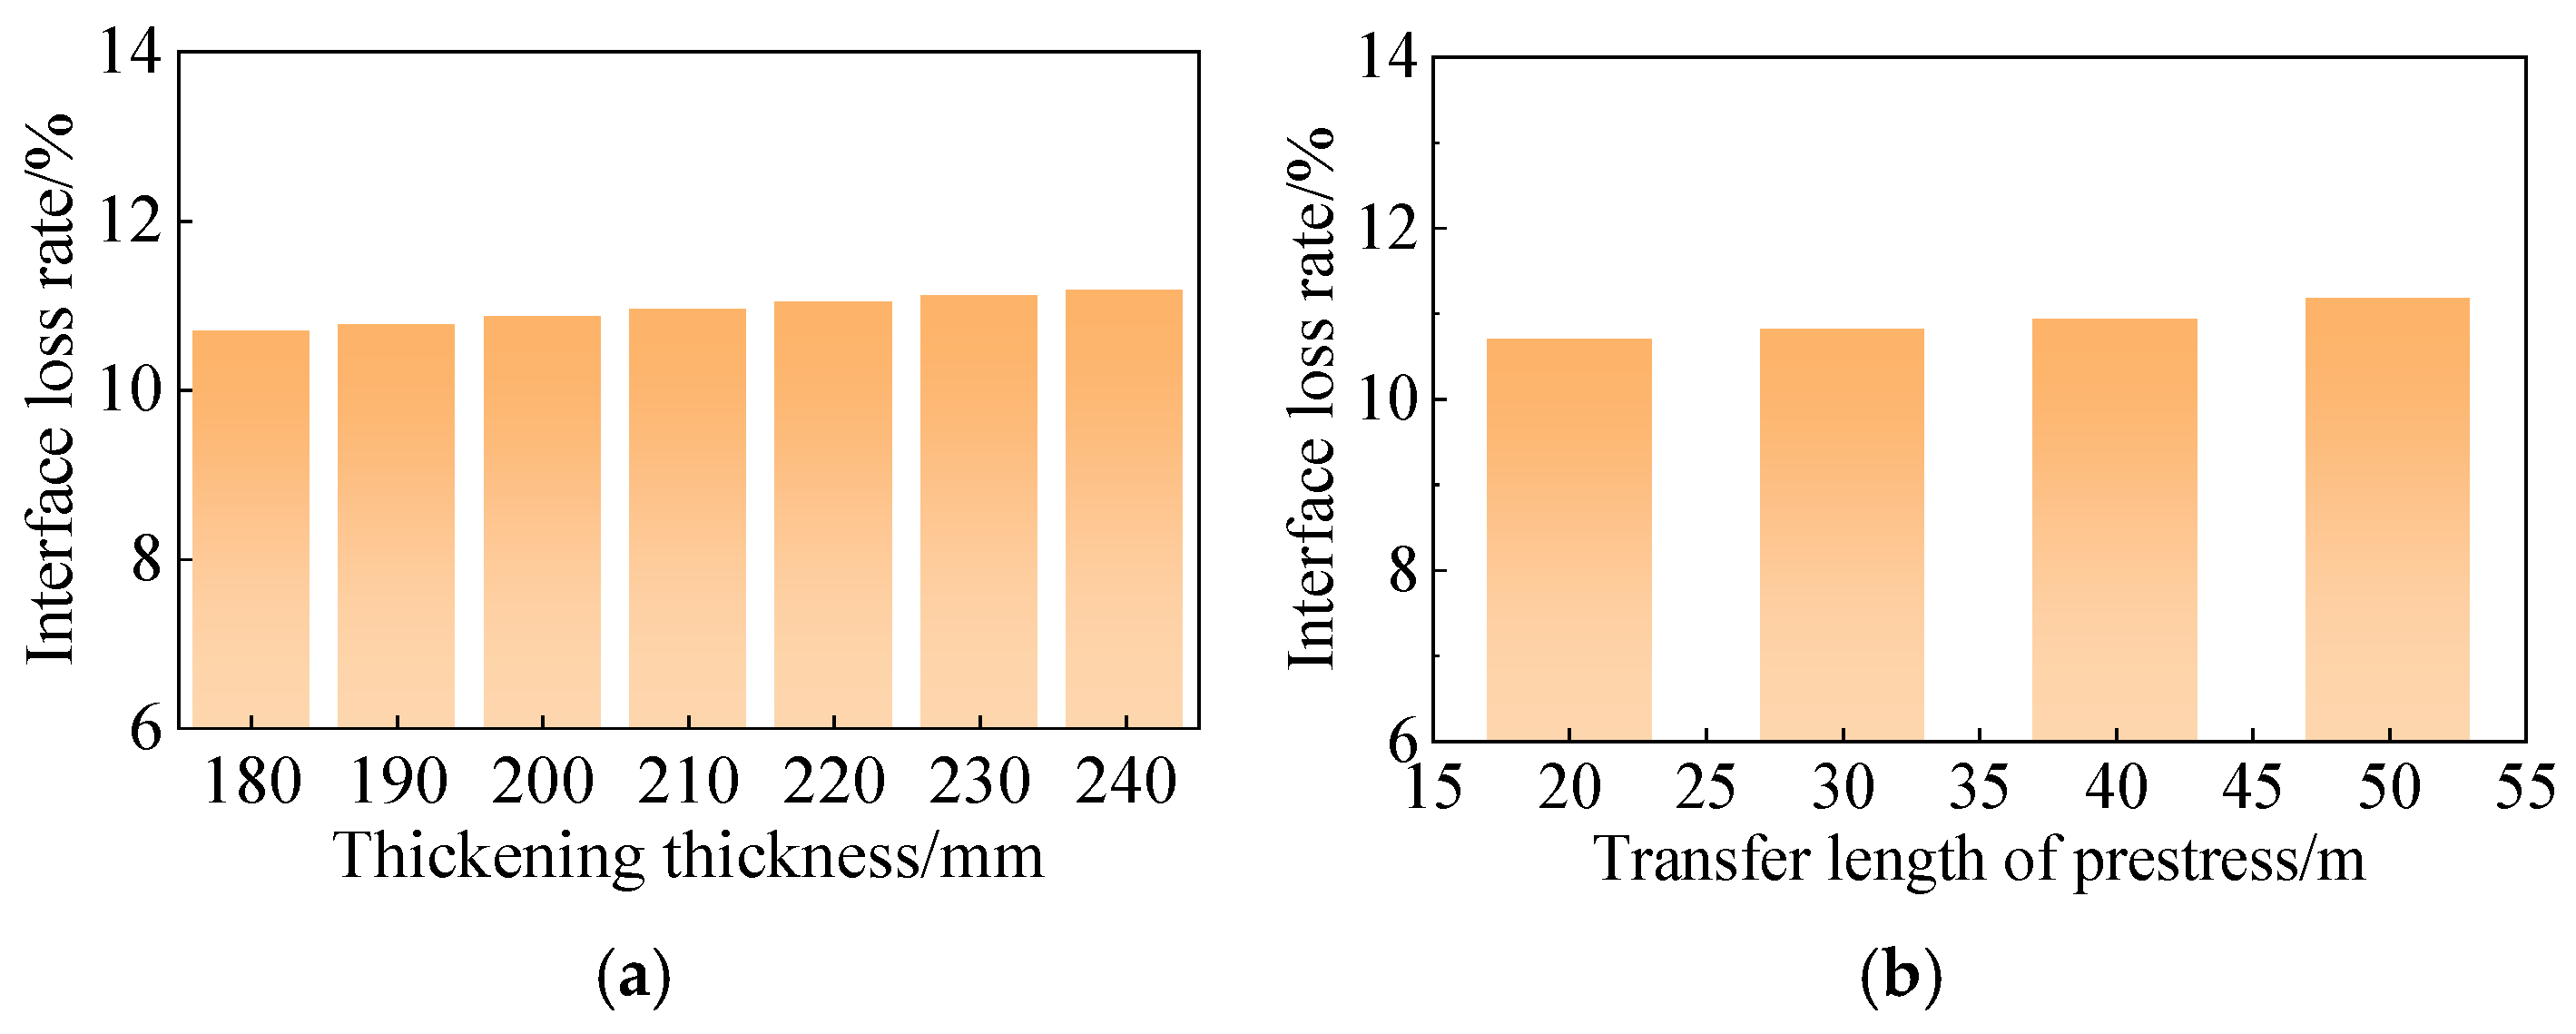
Assuming all other parameters remain constant, the effects of the new web thickness and the prestress transfer length on interface prestress transfer efficiency were analyzed. The new web thickness varied from 180 mm to 240 mm in 10 mm increments, yielding seven discrete values. The influence of prestress transfer length was assessed by examining prestress interface loss in reinforced box girder bridges of different spans, selecting 20 m, 30 m, and 40 m spans from the General Diagram of Highway Bridges and Culverts [35] as representative cases. Using Equation (11), the effects of new web thickness and prestress transfer length on the interface loss rate are shown in Figure 23. The prestress interface loss increases with both web thickness and transfer length. Specifically, when the web thickness increases from 180 mm to 240 mm, the prestress loss rate rises from 10.69% to 11.18%. When the prestress transfer length increases (e.g., for spans from 20 m to 50 m), the loss rate increases from 10.69% to 13.40%. These results indicate that increasing the new web thickness or the prestress transfer length adversely affects the transfer efficiency of prestress across the new–old concrete interface.
Figure 23.
The influence of section thickness and prestress length on the interface loss rate. The panels illustrate: (a) reinforcement thickness; (b) prestress transfer length.
5.4. Calculation Method of Interface Loss
Based on the previous analysis, the interface loss of the new prestress is primarily influenced by the planting rate and the shear stiffness of the bonding interface. Considering the shrinkage characteristics of new concrete containing 54% fly ash, this section investigates the effects of the interface planting reinforcement ratio (ρ) and the shear stiffness coefficient (K) through theoretical derivation and numerical regression. First, the independent effects of ρ and K on the interface loss rate (δ) are analyzed, and their magnitudes are quantified by the influence coefficients γρ and γK. The resulting fitting curves are presented in Figure 24. The relationship between δ and ρ exhibits an inverse S-shaped trend, consistent with a logistic function, effectively capturing the effects of rebar anchorage and dowel action. When the anchorage ratio is below a certain threshold, the dowel action is negligible. As the anchorage ratio increases, the shear strength rises rapidly and then gradually stabilizes; further increases in the reinforcement ratio yield diminishing returns in reducing prestress loss. The interfacial bond stiffness curve follows an exponential trend, indicating that increasing the interfacial bond stiffness leads to an exponential reduction in interfacial loss. However, as the interface approaches a perfectly rigid connection, the prestress loss progressively stabilizes within a limited range. The fitted relationships between γρ and ρ and between γK and K are expressed in Equation (12) and Equation (13), respectively. From the fitting, the minimum reinforcement ratio is ρmin = 0.2%, and the reference bond stiffness is K0 = 11 MPa/mm. The diagram also shows that, when either ρ or K is held constant, the interface loss rate decreases as the corresponding parameter increases. By considering the combined effect of γρ and γK (through addition or multiplication), the empirical relationship is Equation (14).
Figure 24.
Interface loss rate fitting curve. The panels illustrate: (a) reinforcement ratio; (b) shear stiffness.
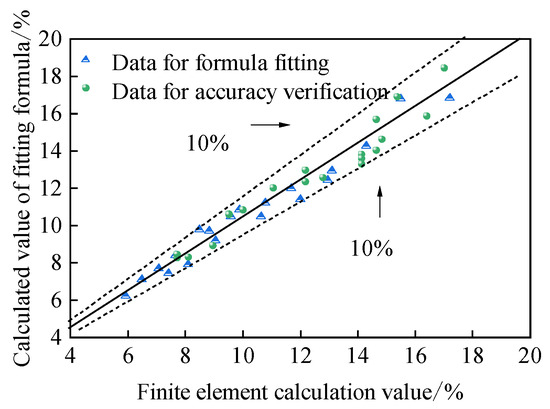
To verify the accuracy of the fitting functions, a finite element model of the equal-section box girder from the background project was established, using planting rate parameters of 0.05–0.45% and shear stiffness values of 6.25–13.75 MPa/mm. The errors between the finite element results and the fitting Equations were calculated, as shown in Figure 25 and Table 10. The discrepancies remain within 10%, indicating that the proposed interface loss calculation method is highly accurate and suitable for use in the combined reinforcement design of equal-section box girder bridges.
Figure 25.
Accuracy comparison of interface loss rate equation.
Table 10.
Interface loss rate calculation results.
6. Conclusions
The combined strengthening test results indicate that when the web reinforcement thickness is 180 mm and six prestressed steel strands are provided, the flexural capacity reserve factor of the strengthened main beam reaches 1.18. In addition, the mid-span deflection is significantly reduced, satisfying the design requirements for the second-level safety grade.
Finite element analysis shows that, within the range of mix proportions considered in this study, a fly ash content of 54% minimizes the bond-related shrinkage strain and shrinkage stress of the self-compacting concrete, thereby exerting the least adverse effect on the existing box girder. Accordingly, self-compacting concrete containing 54% fly ash is recommended as the strengthening material.
When the anchorage ratio is 0.3% and the bonding stiffness is 10 MPa/mm, the interface loss rate is 12.90%. By applying interface anchorage treatment (with a recommended anchorage ratio of 0.6%) and increasing the interface roughness to 0.9 mm, the shear performance of the new–old concrete interface can be enhanced, and the prestress transfer loss at the interface can be effectively reduced.
Based on the shrinkage characteristics of newly added concrete with a 54% fly ash content, a semi-empirical method was developed to calculate the prestress loss rate at the interface between new and existing concrete. Error analysis demonstrates that the prediction error of this method is less than 10%.
The research conclusion of this paper is mainly the analysis of interface force transfer mechanism of internal prestressing and section enlargement composite reinforcement in PC box girder bridges. However, whether this reinforcement scheme is suitable for bridges with different cross-section forms needs further study.
Author Contributions
Conceptualization, Q.W. (Qu Wang) and Q.W. (Qingxiong Wu); formal analysis, X.H. and K.C.; writing—original draft preparation, Q.W. (Qu Wang), X.H. and Z.F.; writing—review and editing, Q.H. and K.C.; supervision, Q.W. (Qingxiong Wu); Validation, Z.F. and Q.H. Data curation, X.H. and Y.X.; investigation, Z.F. and Y.X.; Funding acquisition, Q.W. (Qu Wang) and Q.W. (Qingxiong Wu). All authors have read and agreed to the published version of the manuscript.
Funding
This research was supported by the Project of National Natural Science Foundation of China (Grant No. 52578183) and Natural Science Foundation of Fujian Province (Grant No. 2024J01356). These supports are sincerely appreciated.
Data Availability Statement
The data underlying this article will be shared upon reasonable request to Qingxiong Wu (wuqingx@fzu.edu.cn).
Acknowledgments
We thank the laboratory Fujian Provincial Key Laboratory of Multi-Disasters for providing he test site and finite element simulation platform.
Conflicts of Interest
Author Ziming Fang is employed by the Zhejiang Highway & Waterway Engineering Consulting Limited Liability Company. The remaining authors declare that the research was conducted in the absence of any commercial or financial relationships that could be construed as a potential conflict of interest.
References
- Wang, Q.; Wu, Q.X.; Huang, W.K.; Chen, K.M. Experimental research on hollow slab bridge reinforced by prestressed CFRP plate. J. Nanchang Univ. Eng. Technol. 2019, 41, 247–252. (In Chinese) [Google Scholar]
- Huang, J.Y.; Ni, Y.S.; Zhang, Y.C.; Yang, D.H.; Zhang, X.F.; Song, C.X.; Gou, Y.T.; Du, H.X. Experimental study on bearing capacity hybrid reinforcement methods for cracked small box girder. J. Highw. Transp. Res. Dev. 2025, 42, 131–138. (In Chinese) [Google Scholar]
- Li, J.; Liu, T.; Huang, H.; Jiang, J.; Huang, Z. Experimental Test on Bridge Reinforcement by Enlarging Section-Prestress Method. E3S Web Conf. 2020, 165, 04015. [Google Scholar] [CrossRef] [Scilit]
- Tan, K.H.; Tjandra, R.A. Strengthening of RC continuous beams by external prestressing. J. Struct. Eng. 2007, 133, 195–204. [Google Scholar] [CrossRef] [Scilit]
- Zhang, K.X.; Qi, T.Y.; Li, D.C.; Liu, X.; Xue, X.; Wu, F. Health Monitoring-Based Assessment of Continuous Girder Bridge Reinforcement. J. Perform. Constr. Facil. 2022, 36, 04022001. [Google Scholar] [CrossRef] [Scilit]
- Ghallab, A.H.; Khafaga, M.A.; Farouk, M.F.; Essawy, A. Shear behavior of concrete beams externally prestressed with Parafil ropes. Ain Shams Eng. J. 2013, 4, 1–16. [Google Scholar] [CrossRef] [Scilit]
- Shwalia, A.S.I.; Al-Salim, N.H.A. Investigating the influence of UHPC layer length on the flexural response of prestressed concrete I-beams. Adv. Bridge Eng. 2025, 6, 36. [Google Scholar] [CrossRef] [Scilit]
- Jiang, H.B.; Li, J.R.; Gao, Y.Y.; Zhang, L.-F.; Fang, H.; Chen, Z.; Shi, Q. Shear strengthening of reinforced concrete (RC) beams using ultra-high performance concrete (UHPC) jacketing: Experimental analyses and calculation models. J. Build. Eng. 2026, 118, 114938. [Google Scholar] [CrossRef] [Scilit]
- Fan, F.; Pan, Z.F.; Pan, H.C. Experimental and theoretical study on flexural performance of concrete beams strengthened by unbonded prestressed ultra-high performance concrete layer. Sci. Rep. 2025, 15, 23146. [Google Scholar] [CrossRef] [Scilit]
- Zhang, Y.; Huang, S.; Liu, Y.; Fan, W.; Shao, X. Flexural behavior of damaged RC beams strengthened with prestressed UHPC layer. Eng. Struct. 2023, 283, 115806. [Google Scholar] [CrossRef] [Scilit]
- Xia, J.; Shan, K.; Wu, X.; Gan, R.-L.; Jin, W.-L. Shear-friction behavior of concrete-to-concrete interface under direct shear load. Eng. Struct. 2021, 238, 112211. [Google Scholar] [CrossRef] [Scilit]
- Bai, M.Y.; Ding, T.; Zhao, Y.; Zhao, Y. Shear performance of new-to-old concrete interface based on various surface preparation techniques and roughness. Case Stud. Constr. Mater. 2024, 21, e03549. [Google Scholar] [CrossRef] [Scilit]
- Wang, H.; An, D.; Nie, F.; Zhao, H.; Xu, C. Prediction of Restrained Shrinkage of New-to-old Concrete Interface. Period. Polytech. Civil. Eng. 2024, 68, 131–140. [Google Scholar] [CrossRef] [Scilit]
- Cheng, H.; Gao, D. Shrinkage Performance of Adherence of New Steel Fiber-reinforced Concrete to Old Concrete. Adv. Mater. Process. 2011, 163, 3569–3574. [Google Scholar] [CrossRef] [Scilit]
- Chen, F.; Zheng, J.L. Experimental Research on Shrinkage of Adherence of Self compacting Concrete on Old Concrete. J. Xiamen Univ. Nat. Sci. 2009, 48, 844–847. (In Chinese) [Google Scholar]
- Chen, F.; Zheng, J.L. A Finite Element Analysis of Adherence Between Old and Freshly Cured Self-Compacting Concrete. J. China Univ. Min. Technol. 2009, 38, 660–664. (In Chinese) [Google Scholar]
- Chen, F.; Zheng, J.L. Experimental research on direct shear behavior of adhesion of self-compacting concrete on existing concrete. J. Build. Struct. 2007, 28, 59–63. (In Chinese) [Google Scholar]
- Zhang, Y.D.; Afroz, S.; Nguyen, Q.D.; Kim, T.; Eisenträger, J.; Castel, A.; Xu, T. Analytical model predicting the concrete tensile stress development in the restrained shrinkage ring test. Constr. Build. Mater. 2021, 307, 124930. [Google Scholar] [CrossRef] [Scilit]
- Hua, J.M.; Huang, L.P.; Luo, Q.M.; Chen, Z.; Xu, Y.; Zhou, F. Prediction on the shrinkage of concrete under the restraints of steel plates and studs based on the capillary tension theory. Constr. Build. Mater. 2020, 258, 119499. [Google Scholar] [CrossRef] [Scilit]
- JTG D60-2015; General Specifications for Design of Highway Bridges and Culverts. China Communications Press Co., Ltd.: Beijing, China, 2015. (In Chinese)
- JTG 3362-2018; Specifications for Design of Highway Reinforced Concrete and Prestressed Concrete Bridges and Culverts. China Communications Press: Beijing, China, 2018.
- JTG/T J22-2008; Specifications for Strengthening Design of Highway Bridges. China Communications Press: Beijing, China, 2008. (In Chinese)
- GB 50010-2010; Specifications for Design of Concrete Structures. China Architecture & Building Press: Beijing, China, 2015. (In Chinese)
- Liu, P.L. Study on Behaviors of Hinge Joints for Fabricated Reinforced Concrete Simply-Supported Plate Girder Bridges. Master’s Thesis, Tsinghua University, Beijing, China, 2010. (In Chinese) [Google Scholar]
- Liu, J. Study on the Mechanics Performance of Adherence of Young on Old Concrete. Ph.D. Thesis, Dalian University of Technology, Dalian, China, 2000. (In Chinese) [Google Scholar]
- Wang, T.M. Cracking Control of Engineering Structure; China Architecture & Building Press: Beijing, China, 1997; pp. 17–100. [Google Scholar]
- Mei, M.R.; Ge, S.P.; Chen, J.; Zhuo, J.S. Study on Drying Shrinkage and Creep of Concrete Structures. J. Hohai Univ. (Nat. Sci.) 2002, 1, 73–78. (In Chinese) [Google Scholar]
- Chen, K.M.; Huang, Q.W.; Wu, Q.X. Study on Mechanical Performance of Steel Bridge Deck Pavement with Prefabricated and Cast-in-situ UHPC Slab. China J. Highw. Transp. 2022, 35, 130–143. (In Chinese) [Google Scholar]
- Zhou, C.Z. Study on Mechanical Performance and Design Theory of Hollow Slab Beam Strengthened by External Prestress. Master’s Thesis, Fuzhou University, Fuzhou, China, 2022. (In Chinese) [Google Scholar]
- Wang, G.J. Experimental Study on Restrained Shrinkage of Self-Compacting Concrete by Ring Test. Eng. Mech. 2014, 31, 173–180. (In Chinese) [Google Scholar]
- Wang, G.J.; Zheng, J.L. Experimental study and modeling on shrinkage of self-compacting concrete. J. Fuzhou Univ. (Nat. Sci. Ed.) 2014, 42, 923–929. (In Chinese) [Google Scholar]
- He, L.; Wang, J.L. Method of Equivalent Load and Temperature Reduction on Prestressing Tendon for Effective Prestress Simulation. J. Highw. Transp. Res. Dev. 2015, 32, 75–80. (In Chinese) [Google Scholar]
- Chen, K.M.; Wu, Q.X.; Huang, W.K.; Cheng, B.C. Parameter Analysis on Mechanical Property of Hinged Hollow Slab Bridge with Gate-type Steel Bars at Bottom of Junction Surface. J. Highw. Transp. Res. Dev. 2016, 33, 65–75. (In Chinese) [Google Scholar]
- Zhao, Z.F.; Zhao, G.F.; Huang, C.K. Research on the Tension-shear Behavior of the Adhesion of Young and Old Concrete. J. Build. Struct. 1999, 20, 26–31. (In Chinese) [Google Scholar]
- China Communications Press. General Diagram of Highway Bridges and Culverts; China Communications Press: Beijing, China, 2009. (In Chinese) [Google Scholar]

Disclaimer/Publisher’s Note: The statements, opinions and data contained in all publications are solely those of the individual author(s) and contributor(s) and not of MDPI and/or the editor(s). MDPI and/or the editor(s) disclaim responsibility for any injury to people or property resulting from any ideas, methods, instructions or products referred to in the content. |
© 2026 by the authors. Licensee MDPI, Basel, Switzerland. This article is an open access article distributed under the terms and conditions of the Creative Commons Attribution (CC BY) license.