


Abstract
During the process of damage identification and safety-state evaluation of cable-stayed bridges, the cable tension should also be incorporated into common monitoring, which usually includes displacement and strain. However, the testing process of cable tension is complicated, and the disassembly, installation and maintenance of the cable tension meter are higher priced and difficult. To improve the efficiency of damage evaluation regarding cable-stayed bridges, information-entropy theory is introduced and the curvature entropy index of the difference in the influence line of displacement is proposed. To obtain effective data parameters for damage evaluation, first, the dynamic disturbance in the displacement time-history response is removed through variational modal decomposition, and the multi-axle effect of vehicles is regularized, so as to identify the measured influence line of displacement of cable-stayed bridges. Second, the peak value of the curvature entropy index of the difference in the influence line of displacement under varied damage degrees of stay cables is extracted to construct the inverse fitting formula of damage degree. The entropy value of the measured influence line of displacement is then substituted into a PSO-BP neural network, so as to obtain the damage degree of the corresponding position of the measured data regarding the influence line of displacement of bridges. Finally, the health status of stay cables is evaluated using the information-entropy parameters of the influence line of displacement. The theoretical model and actual data are used for testing, and the research results show that: (1) the location and degree of cable damage can be effectively located and quantified by using the curvature entropy index of the difference in the influence line of displacement, and (2) the cable health index of the cable-stayed bridge tested by actual data is 96.73%, consistent with the conclusion of on-site technical evaluation.
1. Introduction
Cable-stayed bridges, one of the main forms of modern long-span bridges, are composed of three core components: the main tower, main girder and stay cables. Among them, stay cables are the main load-bearing component, transferring the majority of the load of the bridge. Its force-bearing state is directly related to the safety and service performance of the overall bridge structure. However, in the long term and with the continuous influence of a complex environment (such as temperature change, wind load, and vehicle load) and repeated loads, stay cables are prone to fatigue, corrosion and even fracture, significantly reducing the overall safety performance of the bridge and even causing serious engineering accidents. This significantly weakens the structural load-bearing capacity and, in severe cases, may lead to structural safety accidents. For cable-supported structures such as cable-stayed bridges, the stay cable plays a dominant role in the overall force system. Its damage leads to changes in the bending mechanism of the cable–beam system and causes redistribution of the main beam’s alignment and internal forces. Due to environmental erosion and dynamic load, stay cables are vulnerable to wire breaking and other forms of damage [1,2]. Due to inevitable reasons such as aging and damage, accidental impact and natural factors, the structure of bridges is damaged [3,4]. Therefore, the safety evaluation of stay cables of long-span cable-stayed bridges is crucial for the strength of the whole structure and the bearing capacity under conditions of an external environment [5,6].
The current methods for safety-state evaluation of stay cables include traditional methods based on manual inspection or non-destructive testing [7,8], direct methods based on cable force monitoring and evaluation [9,10], analysis methods based on modal parameters and structural responses [11,12], and health monitoring methods based on multi-source data fusion and intelligent evaluation [13,14,15]. ① Traditional methods based on manual inspection or non-destructive testing are the most direct approach for safety-state evaluation of cables. The health status of cables can be evaluated by monitoring their appearance and testing the internal damage of the steel wires. However, long-term monitoring is unfavorable due to the complicated testing process, as well as high-cost and difficult maintenance. ② Direct method based on cable force monitoring and evaluation: security evaluation of cables is indirectly conducted by analyzing the influence of cable damage on the static performance of the whole bridge. For example, Yuan Lingfeng discovered the relationship between frequency and cable force by simulating the boundary conditions of simple support and fixed support and directly monitored the time-varying cable force by using the wavelength change in the fiber grating sensor, so as to analyze and evaluate the influence on the performance of the cable-stayed bridge. ③ Analysis methods based on modal parameters and responses: dynamic information such as acceleration, radar, deflection, cable vibration frequency and damping are used to construct a damage index or discrimination rules of abnormalities, which are suitable for rapid screening and online early warning [16]. For example, considering the influence of cable sag and geometric nonlinearity, Chen Shuisheng et al. derived the nonlinear vibration equation of in-plane and out-of-plane coupling of stay cables, thereby obtaining the first-order modal coupling vibration characteristics and exploring the relationship between vibration frequency range and vibration amplitude, and cable sag. However, such methods need to deal with the strong uncertainty of environmental loads such as temperature, wind noise and traffic. ④ Health monitoring methods based on data fusion and intelligent evaluation usually integrate multi-source information such as inspections, NDT, cable force and structural response to establish a health monitoring system, and they realize automatic state classification and register abnormal locations using evidence theory and time series classification, which is suitable for long-term online monitoring scenarios. For example, Li Hui et al. designed and implemented a long-term real-time health monitoring system and a regular real-time health monitoring system for two large cable-stayed bridges, analyzed the bridge structural loads and monitored static and dynamic response during the process of bridge completion, testing and operation.
However, the aforementioned studies are based on the damage identification of the cable force of the entire bridge or the structural health monitoring system deployed on the entire bridge, which has a complicated testing process, has a higher cost and is unsuitable for long-term monitoring and maintenance. In recent years, structural damage identification methods based on deflection influence lines have gradually gained attention due to their high sensitivity to local stiffness changes. However, these methods often focus on qualitative analysis or local damage localization, and there is still a lack of systematic research that combines local geometric features of influence line differences with information entropy and assesses the safety status of stay cables despite the interference from measurement noise and the multi-axle effects of vehicles. This remains an urgent issue to be addressed. Based on this, this paper takes the deflection influence line of cable-stayed bridges as the research object and proposes a method for assessing the safety status of stay cables based on the curvature information entropy of deflection influence line differences. By performing variational mode decomposition on the deflection time-history response to remove dynamic disturbances and combining regularization methods to mitigate the influence of the multi-axle effects of vehicles, the true deflection influence line of the bridge is identified. To enhance the effectiveness of damage identification of cable damage on the internal force of the bridge deck, the curvature entropy of the displacement difference is analyzed based on information-entropy theory, so as to increase the confidence of the damage identification method. An inverse relationship for damage severity is established and an improved PSO-BP neural network is introduced to quantitatively assess the damage severity of stay cables. Taking a practical engineering example of a low-pylon cable-stayed bridge with corrugated steel webs and PC composite box girders, verification is conducted for different cable damage locations and degrees to assess the operational condition of the stay cables of the cable-stayed bridge.
2. Theoretical Methods
2.1. Theory of the Influence Line of Displacement
Assuming that the bending stiffness of the bridge is abruptly changed due to local damage, the influence line will change accordingly. The difference in the influence line of the bridge before and after the damage is established to reflect the local stiffness change in the structure and then amplified by calculating the curvature of the difference index curve. A similar outcome is obtained by calculating the quadratic central difference in the measured influence line discrete series [17,18,19]. The equation of deflection influence lines (DIL) can be derived as follows:
where is the length of the bridge span; is the mobile concentrated force located at the bridge span position; is the location of response test points; is the location of the data collection point; is the magnitude of the moving load force; is the location of the damage point; is the damage area of the bridge; is the bending strength; and is the bending strength of damage.
2.2. Information-Entropy Theory
Information entropy is a macroscopic indicator used in information theory to measure the uncertainty and complexity of a system. The concept of information entropy proposed by Shannon aims to characterize the complexity of system signals. The greater the disorder of signals, the greater the information entropy and vice versa. When the curvature of a bridge undergoes a sudden alteration at the damaged location, more information needs to be transmitted, and a rapid change will increase the information entropy [20].
where Q is the amount of information carried by a certain information point, reflecting the disorder degree of the information; Pi is the probability that the i-th source signal appears; is the self-information quantity of the i-th source signal; and .
In this article, information entropy is used to measure the distribution characteristics of the curvature sequence of the difference values of deflection influence lines. Firstly, the curvature sequence of the difference values is calculated based on the deflection influence lines before and after damage, and the curvature sequence is regarded as a set of discrete samples. The numerical range is discretized and statistically analyzed through an interval division method. Assuming that the number of curvature samples in the ith interval is ni and the total number of curvature samples is N, the probability corresponding to the ith interval can be expressed as
Based on this, the probability distribution Pi satisfying the normalization condition is constructed and substituted into Equation (5) to calculate the information entropy value of the curvature of the deflection influence line difference.
A deflection influence line curvature entropy index (DILS) is established to measure its information disorder degree:
A generalized value of deflection influence line curvature entropy before and after damage can be established:
where and are, respectively, the value of deflection influence line curvature entropy before and after damage and is the difference between them.
2.3. Variational Modal Decomposition Denoising
The key idea of variational mode decomposition (VMD) aims to decompose the original signal into k intrinsic mode function (IMF) with limited bandwidth and obtain the optimal solution of variational mode through iteration. Assuming that each IMF component has a certain central frequency, K modes can be searched through iteration. The sum of all modes equal to the original signal is taken as the constraint condition to minimize the sum of estimated bandwidths of each mode. The constrained variational expression is as follows [21,22,23]:
where is the k-th IMF component, is the center frequency of the k-th IMF component, and f(t) is the original signal.
To find the optimal solution of the constrained variational problem, the constrained variational problem is transformed into an unconstrained variational problem by using the Lagrange multiplication operator λ(t) and the quadratic penalty factor α. Among them, Lagrange multiplication operator λ(t) can ensure the strictness of the constraint conditions and the quadratic penalty factor α can ensure the accuracy of signal reconstruction in a Gaussian noise environment. The extended Lagrange expression can be expressed as follows:
Using the alternating direction method of multipliers (ADMM), each IMF component and its central frequency are continuously updated to solve the “saddle point” in the Lagrange expression. The value of , and is updated through the cyclic process. The updating formula is as follows:
where ^ is Fourier transform and τ is the time step.
Initialize {wk1}, {uk1}, λ1 and n and iteratively update uk, ε, and λ until the allowable error ε is met, then the decomposition stops, and finally K IMF components are output. The allowable error discriminant is as follows:
The main frequency of each IMF component is obtained by Fast Fourier Transform (FFT) after the bridge time-history response is decomposed by VMD, and the IMF component with a main frequency greater than the fundamental frequency of the bridge is removed as the dynamic component. To avoid excessive decomposition or incomplete decomposition of the original signal, the values are gradually taken from K = 2. When the main frequency of IMF(K−1) is lower than the fundamental frequency of the structure, the signal of IMF(K−1) and IMF(K) is reconstructed, and the required reconstructed signal is the measured quasi-static time-history response of the bridge. To determine the optimal number of modes, K, the observed center frequency method is employed. When K = 5, the center frequencies of each IMF component can be clearly distinguished without mode mixing. The penalty factor α is set to 2000 based on experience and trial calculations, aiming to strike a balance between mode bandwidth and reconstruction accuracy.
2.4. Tikhonov Regularization Stripping Vehicle Multi-Axle Effect
To further remove the multi-axle effect of vehicles in the response, the influence line identification model is solved through Tikhonov regularization, assuming that the structural responses of the bridge derived from vehicles’ axes are independent of each other; that is, the measured bridge responses are the outcome of the vehicle-axle-induced superposition of bridge responses. The specific bridge response is as follows:
where R(c) is the measured bridge response, N is the number of vehicle axles, Ai is the axle load of the vehicle on the i-axle, is the influence coefficient of the vehicle on the i-axle, and Gi is the distance of the vehicle front wheelbase on the i-axle.
An error exists between the quasi-static time-history response of each lane of the bridge pretreated by VMD and the actual static time-history response of the bridge. An error term is therefore introduced to modify the influence line identification matrix model, as shown in the following formula:
where is the error and is the modified influence line identification matrix model.
The Tikhonov regularization method can limit the least squares expression by using L2 norm as a penalty function, thereby effectively solving the ill-conditioned mathematical equation of the influence line identification model caused by an error term, and its regularization expression is as follows:
The regularization matrix is usually as follows:
The vehicle information matrix is determined by parameters such as sampling frequency, vehicle axle weight, axle number, wheelbase and vehicle speed, with the upper axle of the front axle and the lower axle of the rear axle as the starting and ending points of timing. The vehicle information matrix is shown in the following formula:
The expression for solving the influence line is created by substituting the regularized matrix into the derivative and making its derivative function 0:
where λ is the regularization coefficient; the regularization coefficient λ is determined using the L-curve method. By plotting the relationship curve (L-curve) between the residual norm and the solution norm, the λ value corresponding to the point of maximum curvature is selected as the optimal parameter.
3. PSO-BP Theory-Based Safety-State Evaluation Method and Process
3.1. PSO-BP-Based Theory and Process
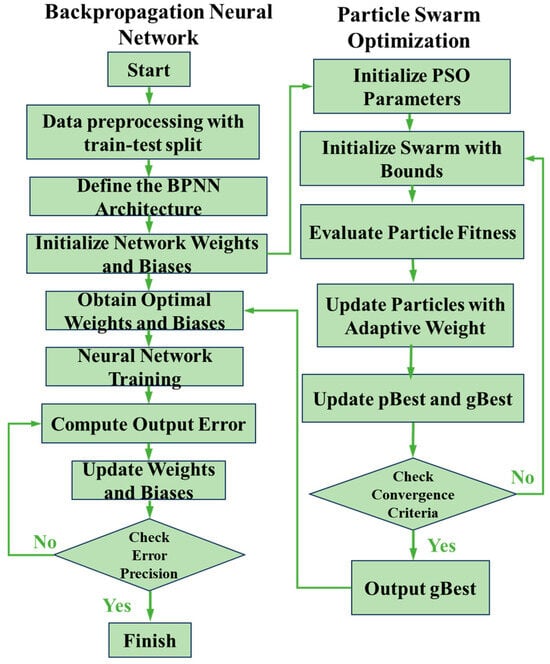
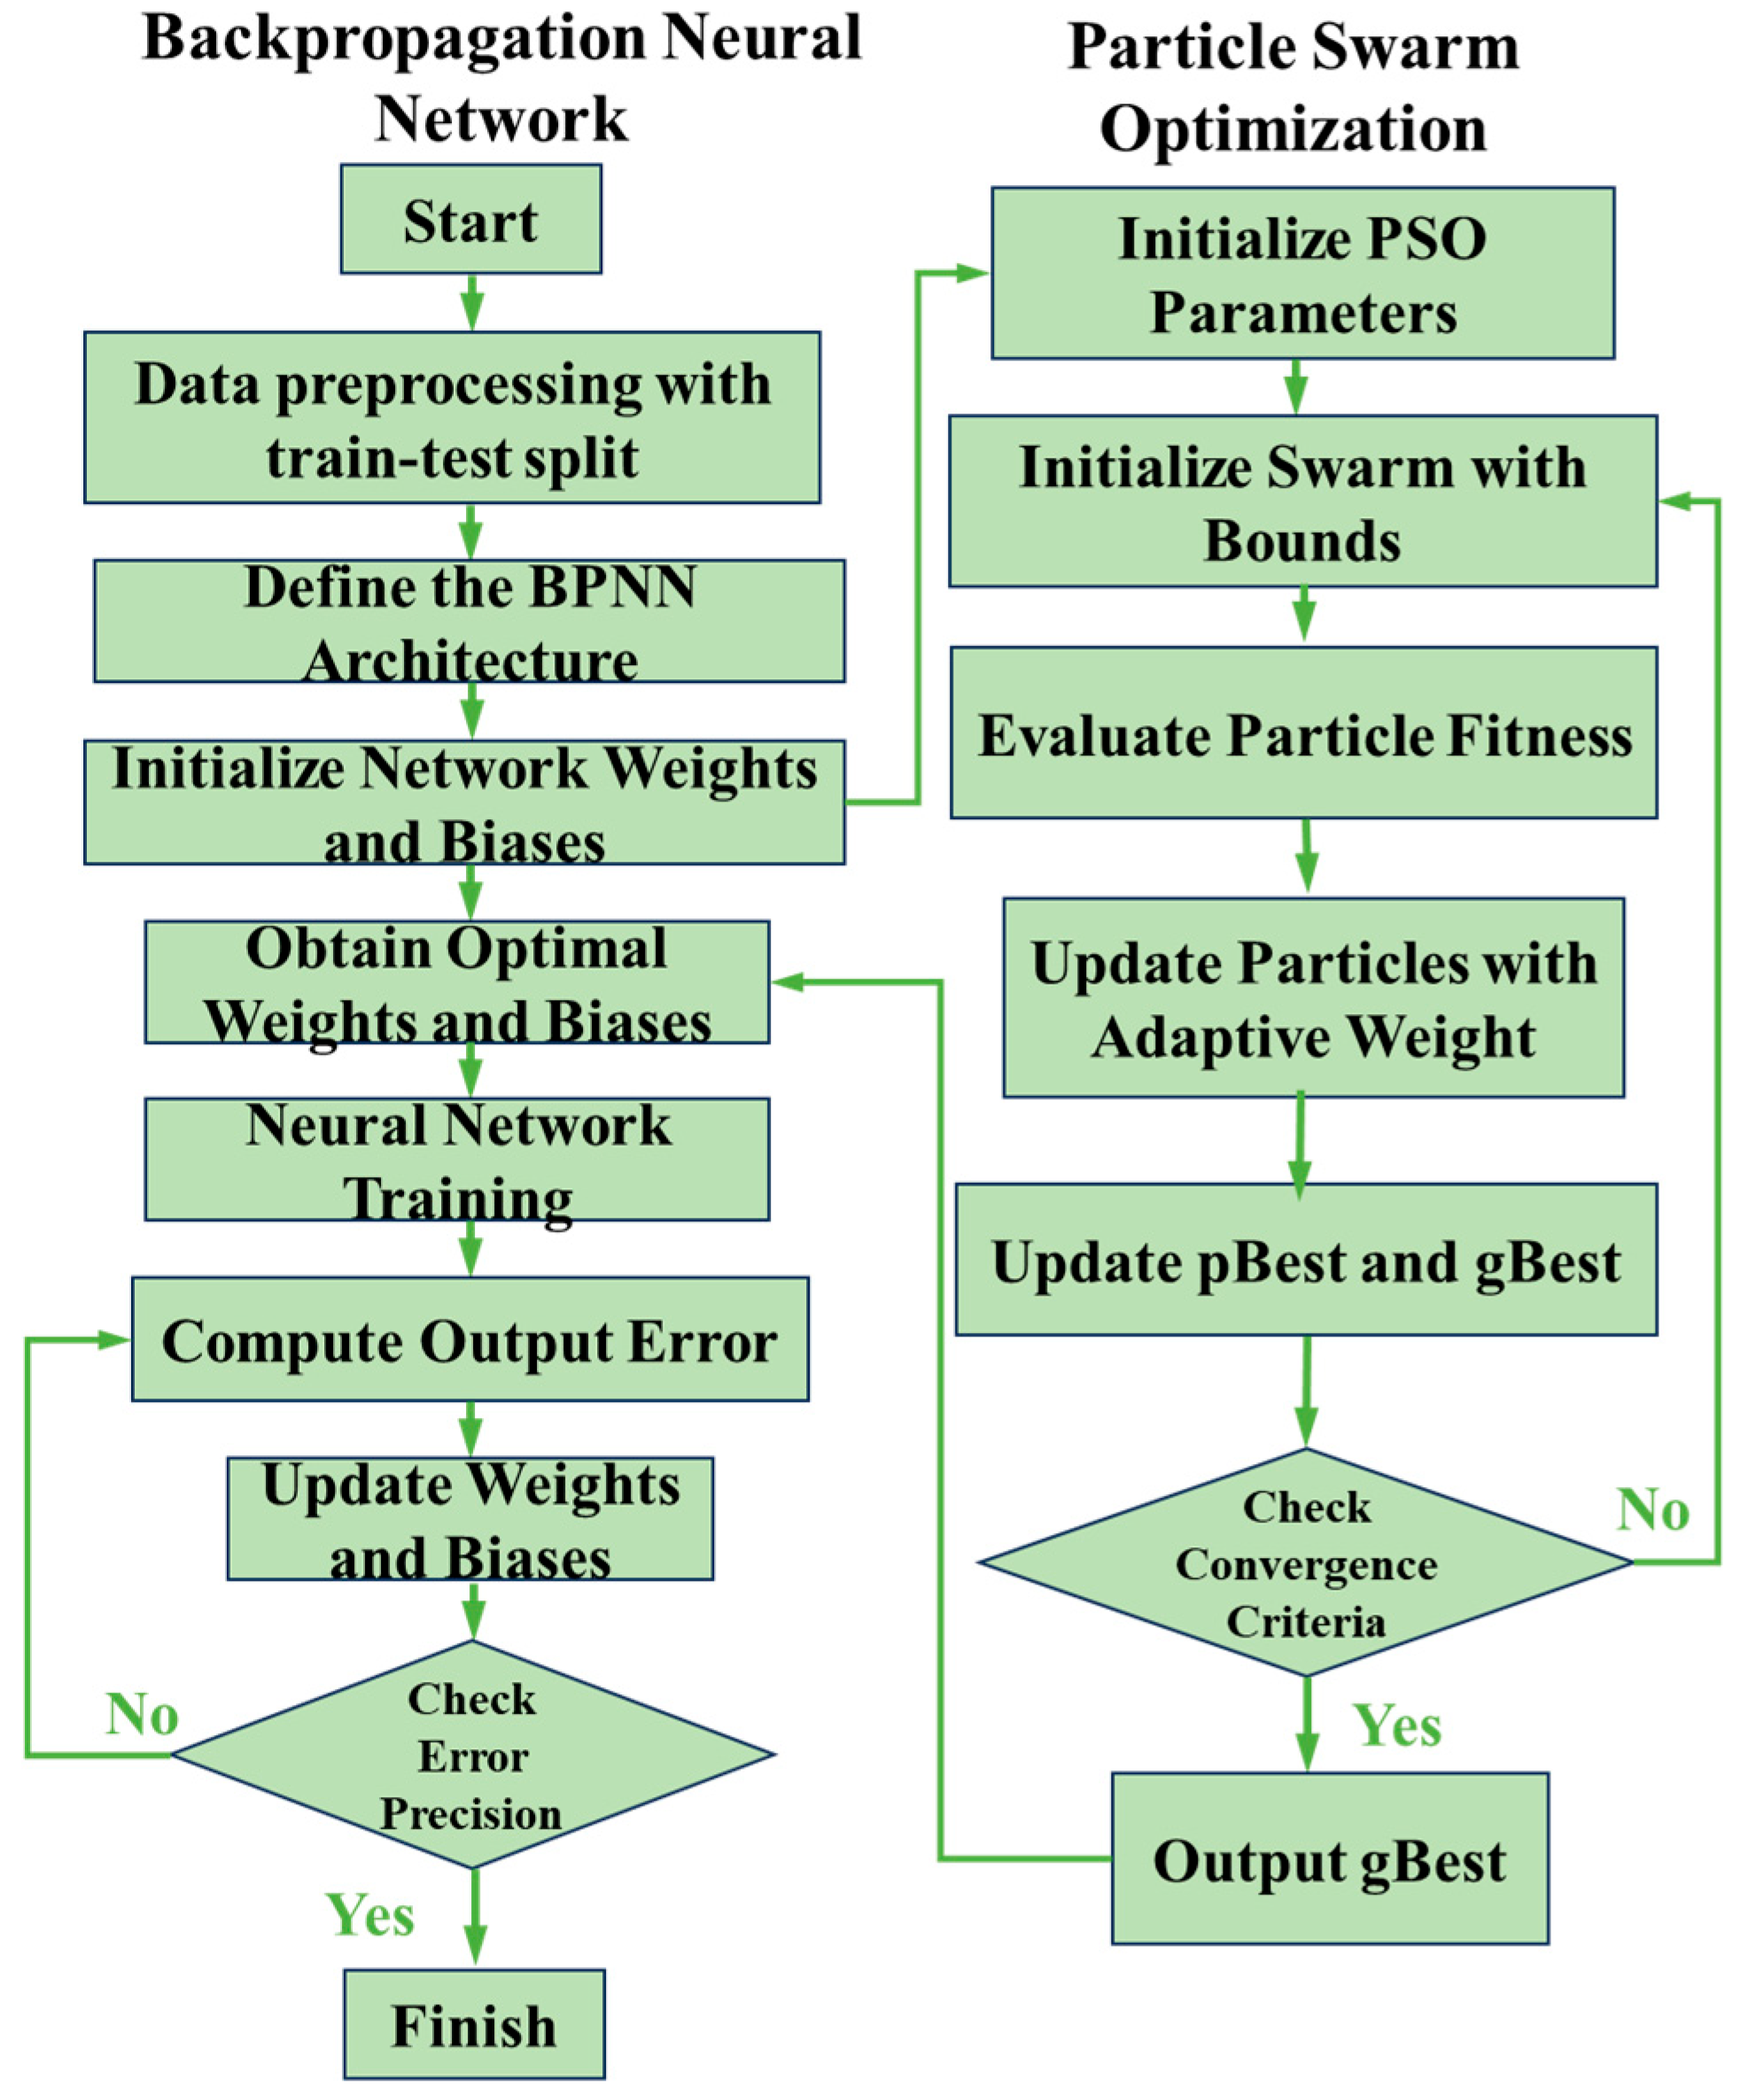
The traditional BP neural network is sensitive to initial weights, slow in convergence and prone to overfitting. Using the PSO algorithm, the initial weight and bias of the BP neural network are optimized, so as to accelerate convergence while improving the accuracy of the model. The calculation flow is shown in Figure 1. Every iteration of the PSO algorithm is accompanied by the update of particle velocity and position. Particles move to the optimal center of individual history, making the population approach the optimal solution and realizing the optimization effect. The specific update formula is as follows [24,25,26,27]:
where is the velocity of particle in the -th dimension, is the position of particle in the -th dimension, is the inertia weight, is the individual optimal solution of particle in the -th dimension, is the global optimal solution of the entire group in the -th dimension, and are the individual learning factor and social learning factor respectively, and are random numbers of (0, 1). The inertia weight w adopts a linear decreasing strategy, decreasing from 0.9 to 0.4; the individual and social learning factors c1 = c2 = 2.0; the particle swarm size is 30; the evolution count is 50; and the maximum iteration count is 1000.
Figure 1.
Calculation flow of PSO-BP neural network.
The safety-state evaluation theory of a bridge beam structure based on a PSO-BP neural network can be used to judge the degree of beam damage. The signal of beam deflection can be amplified by analyzing the deflection influence line difference curvature and information entropy, and the curvature entropy of deflection influence line difference can be quantified through a PSO-BP neural network. As shown in Figure 1.
3.2. Structure Safety-State Evaluation Process of the Bridge
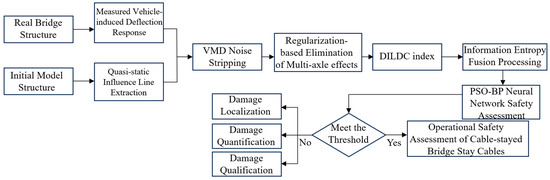
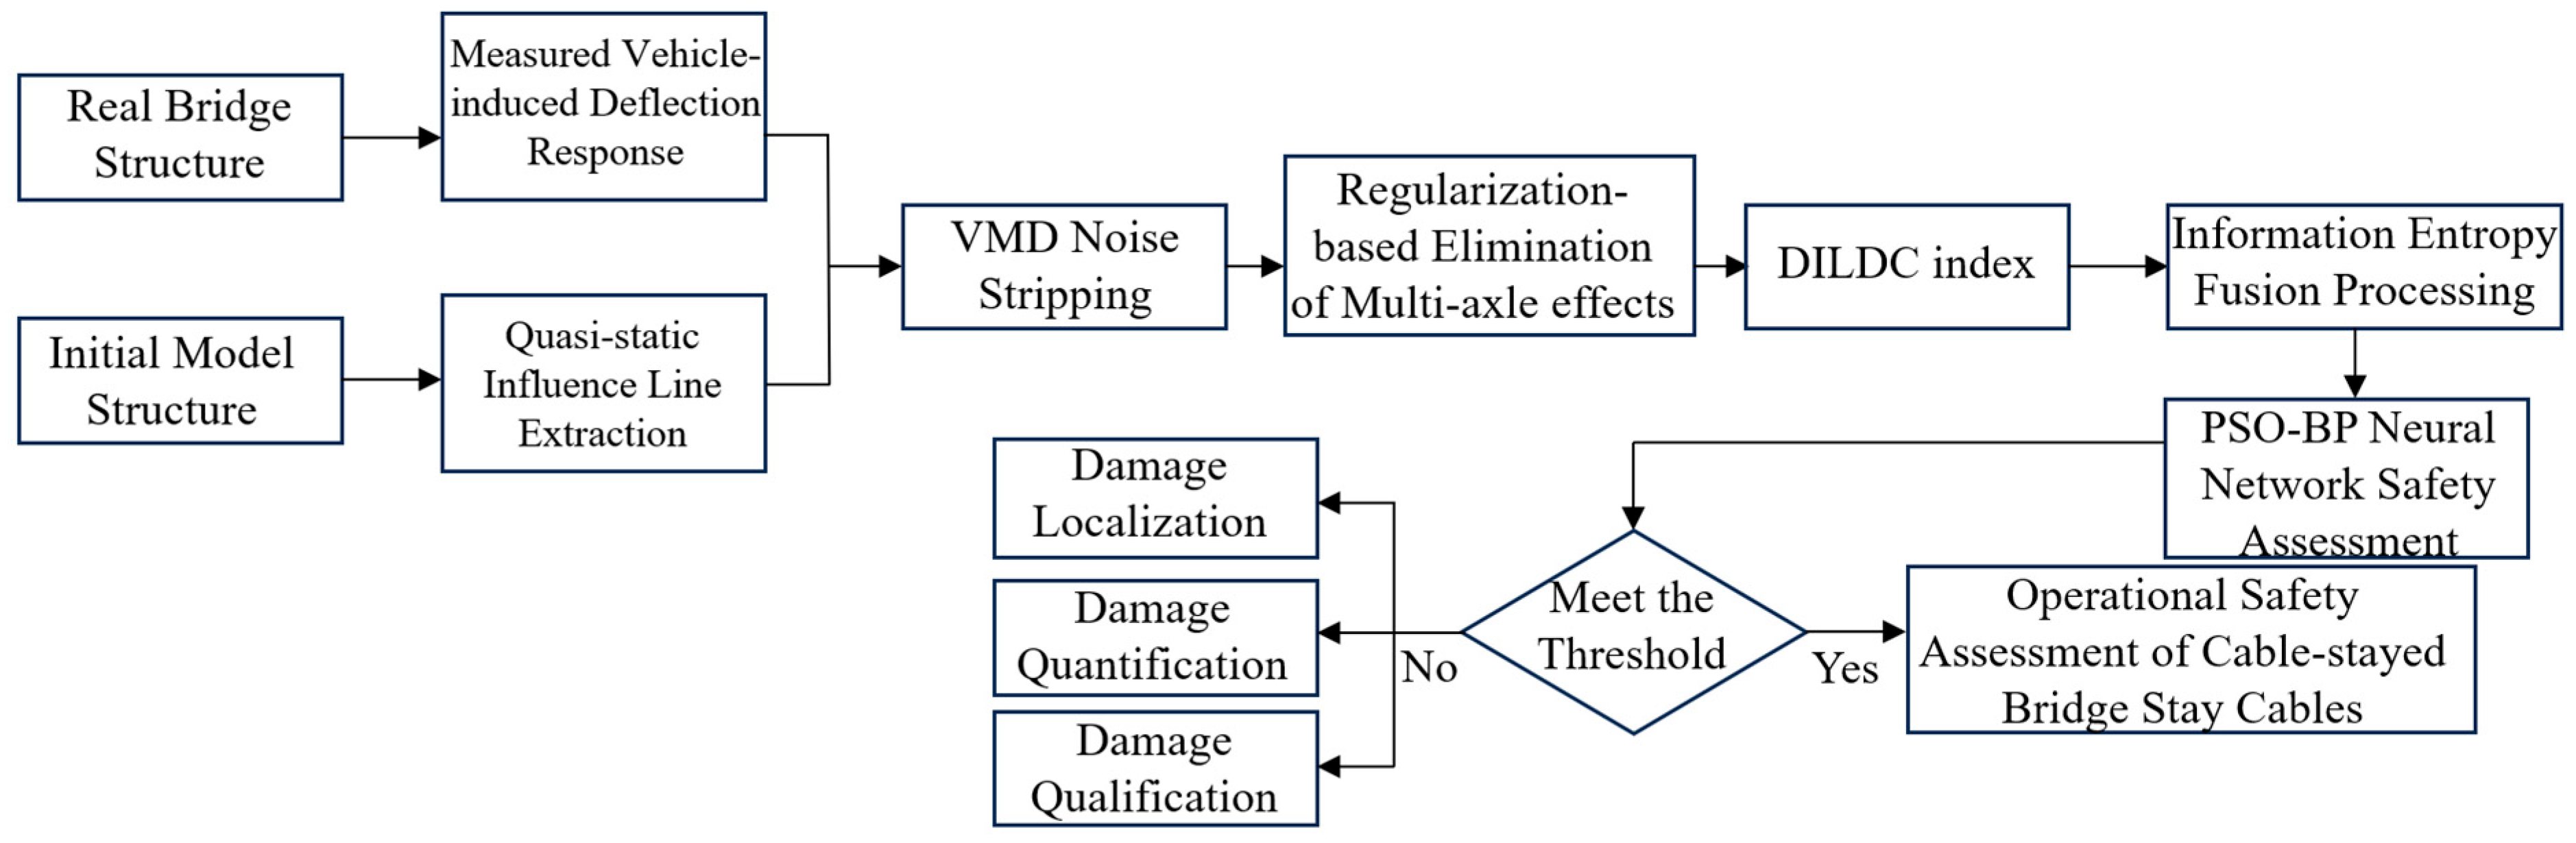
In this paper, a set of safety-state evaluation processes for the cable operation state of a cable-stayed bridge is constructed, with details as follows, as shown in Figure 2:
Figure 2.
Flow chart of full-text safety-state evaluation.
(1) Taking the actual bridge structure as the object, the influence line is measured to obtain the original response sequence reflecting the overall stiffness and local damage sensitivity of the structure.
(2) The signal is subjected to time-frequency domain adaptive filtering using variational modal decomposition VMD. A regularization strategy is introduced to inhibit multi-axle coupling disturbance and unstructured noise, so as to reconstruct the influence line with a high signal-to-noise ratio.
(3) Combined with the initial model structure, the damage sensitive features such as influence line difference curvature are calculated, and the multi-index information quantity is measured and weighted through information-entropy theory to achieve a unified health representation quantity.
(4) The evaluation is conducted by comparing results to the pre-set safety-state evaluation threshold. If the evaluation quantity does not meet the threshold requirement, it enters the damage diagnosis branch to successively finish the qualitative judgment of the damage occurrence, damage location and quantitative characterization of damage degree.
(5) If the evaluation quantity meets the threshold requirements, the PSO-BP neural network is further introduced to intelligently discriminate and check the measured data based on the prior mapping relationship constructed by the damage inversion fitting formula.
(6) Finally, the cable operation security grade and comprehensive evaluation conclusion of the cable-stayed bridge are output, achieving the structural health evaluation method of “signal preprocessing–feature extraction–entropy weight fusion–threshold discrimination–intelligent diagnosis/security evaluation”.
4. Theoretical Model Test
4.1. Model Parameters
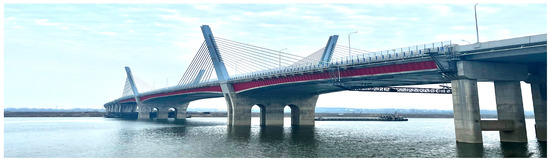
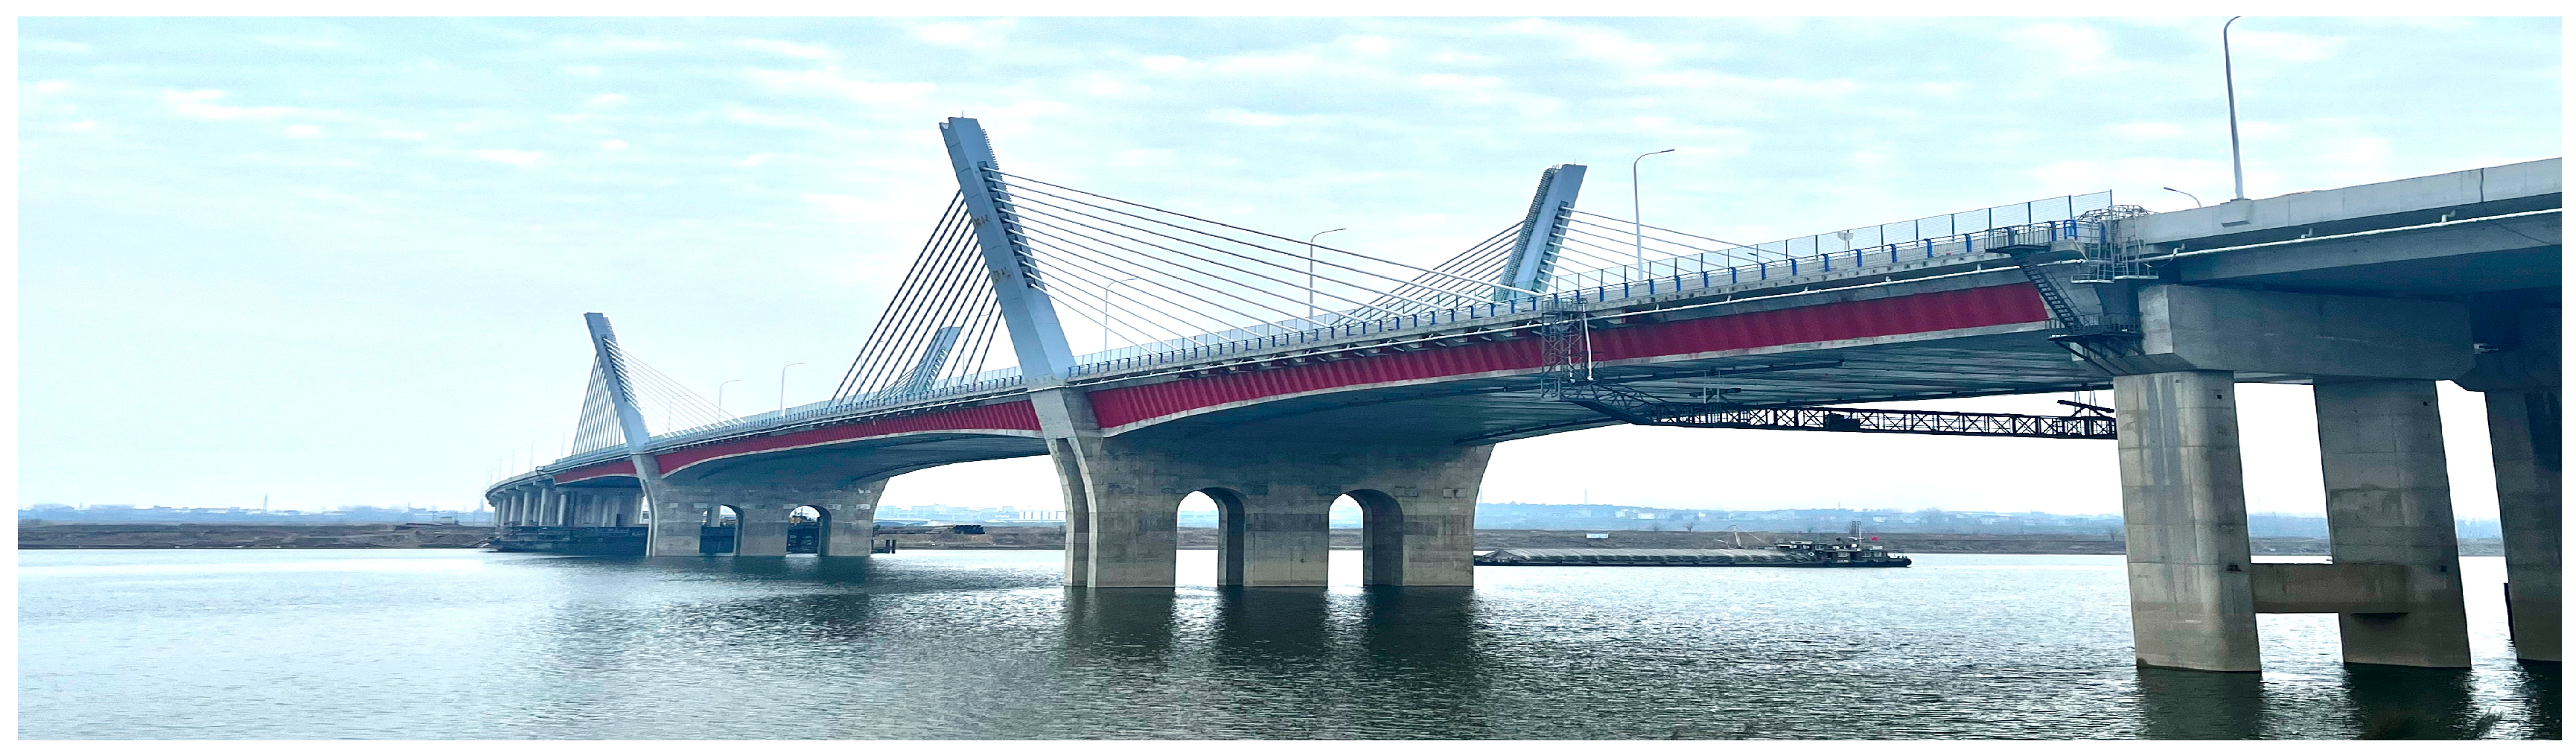
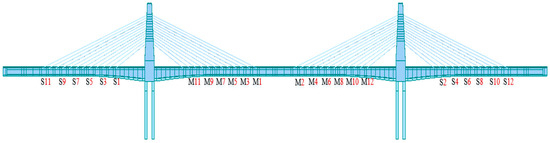
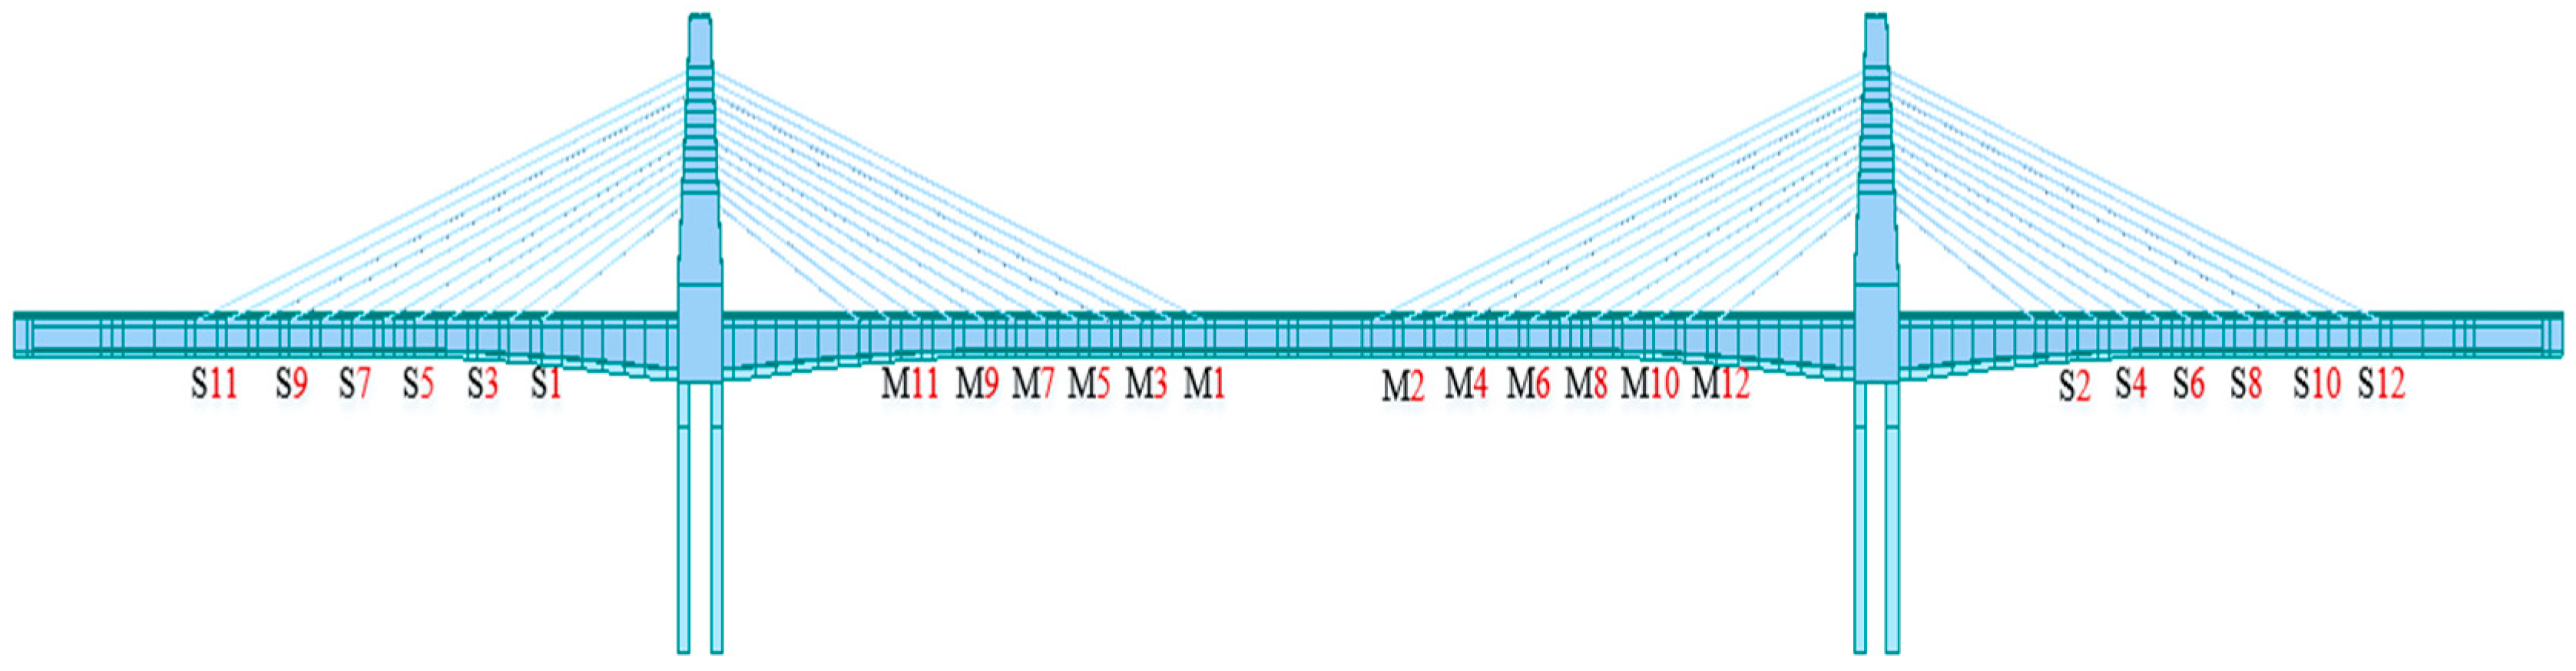
Numerical simulation analysis is carried out on a low-pylon cable-stayed bridge with a classic three-span corrugated steel web–PC composite box girder. The span combination of the entire bridge is 105 + 180 + 105 = 390 m. According to the design drawings, a finite element model is established using MIDAS/Civil: the main girder bridge deck is made of C50 concrete, with an elastic modulus E of 3.45 × 10⁷ kn/m and a width of 35.5 m. The main girder web is made of Q345D steel, and the corrugated steel web is made of type 1600 steel. The stay cables have a single cable plane, arranged in double rows across the bridge, with cable spacing of 4.8 m on the beam and 1.2 m on the tower, and are made of galvanized steel strands. The substructure of the bridge adopts a double-column rectangular pier, which is 3.9 m long along the bridge direction and 2.0 m wide across the bridge direction. The actual bridge diagram of the cable-stayed bridge and the schematic diagram of the number of stay cables are shown in Figure 3 and Figure 4.
Figure 3.
Actual bridge diagram of low-pylon cable-stayed bridge with corrugated steel webs and PC composite box girder.
Figure 4.
Schematic diagram of stay cable numbering.
4.2. Damage Condition of Stay Cables
The stress and damage of the cables of the cable-stayed bridge are closely related to the entire bridge system, load conditions, structural details and external environment. Under the action of live load, the bridge floor will bend vertically and swing laterally. For short cables, a slight displacement at the end of the bridge floor will cause a large percentage change in cable force, resulting in a very large amplitude of stress variation. For long cables, the sag effect of extra-long cables will significantly increase their internal forces and reduce their effective elastic modulus. The extremely high static tension will make them more sensitive to long-term damage such as relaxation and corrosion.
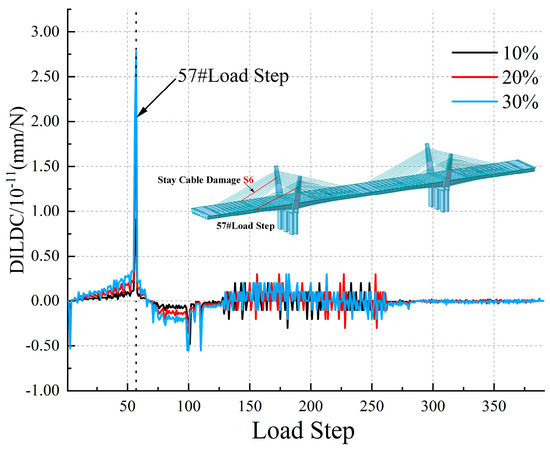
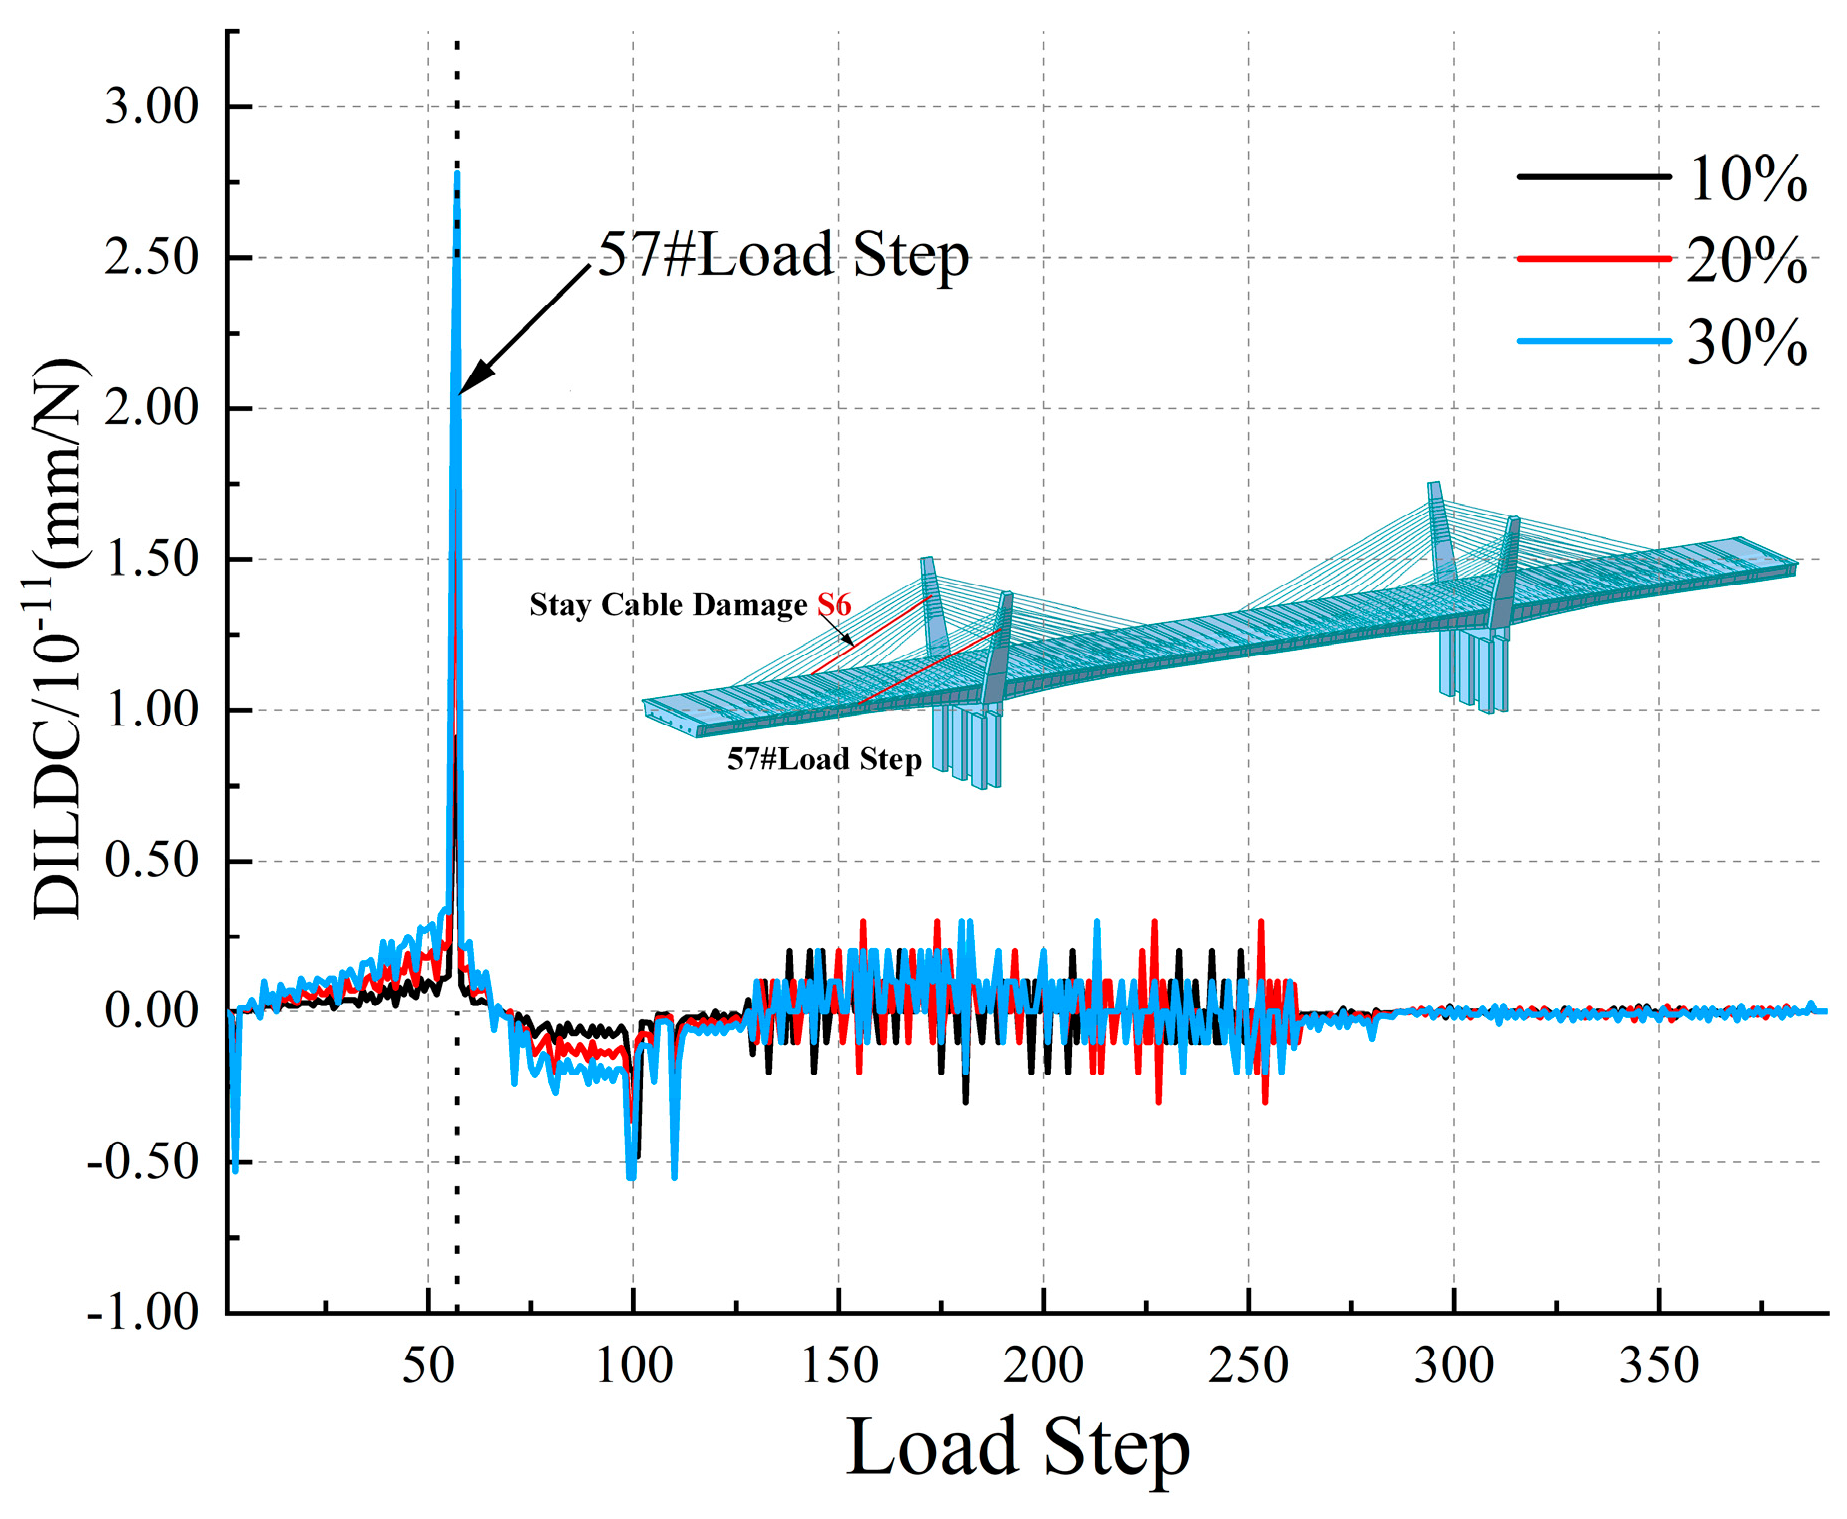
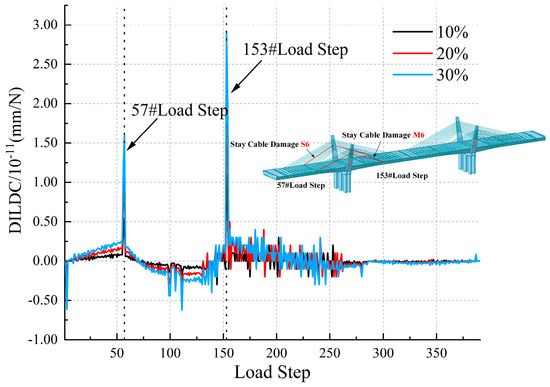
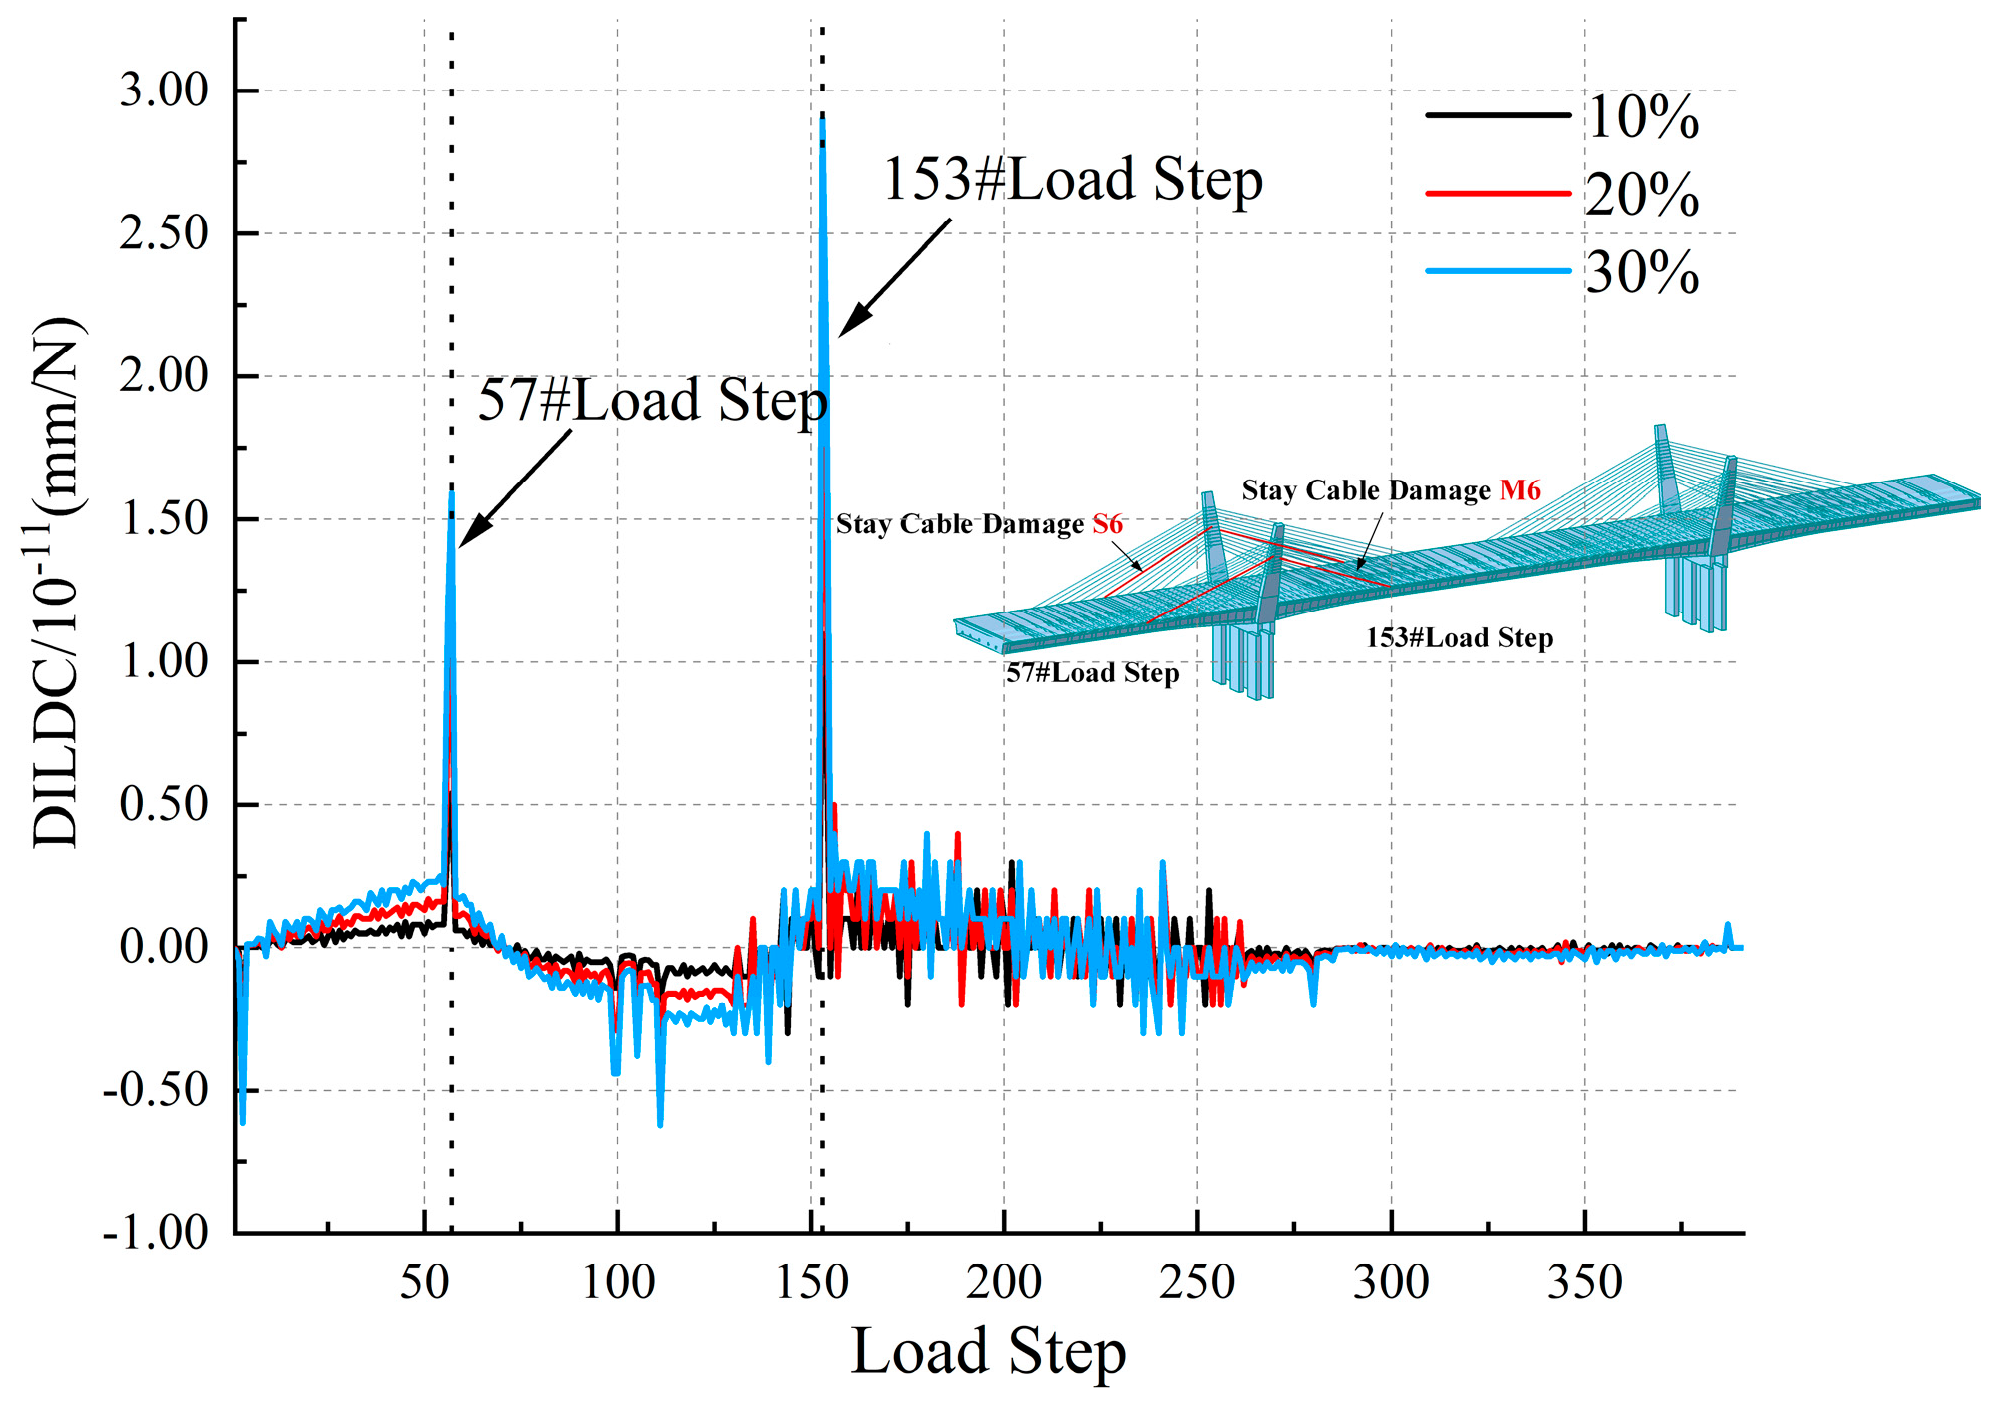
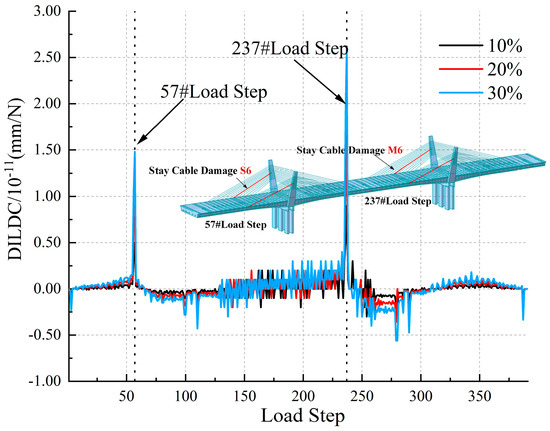
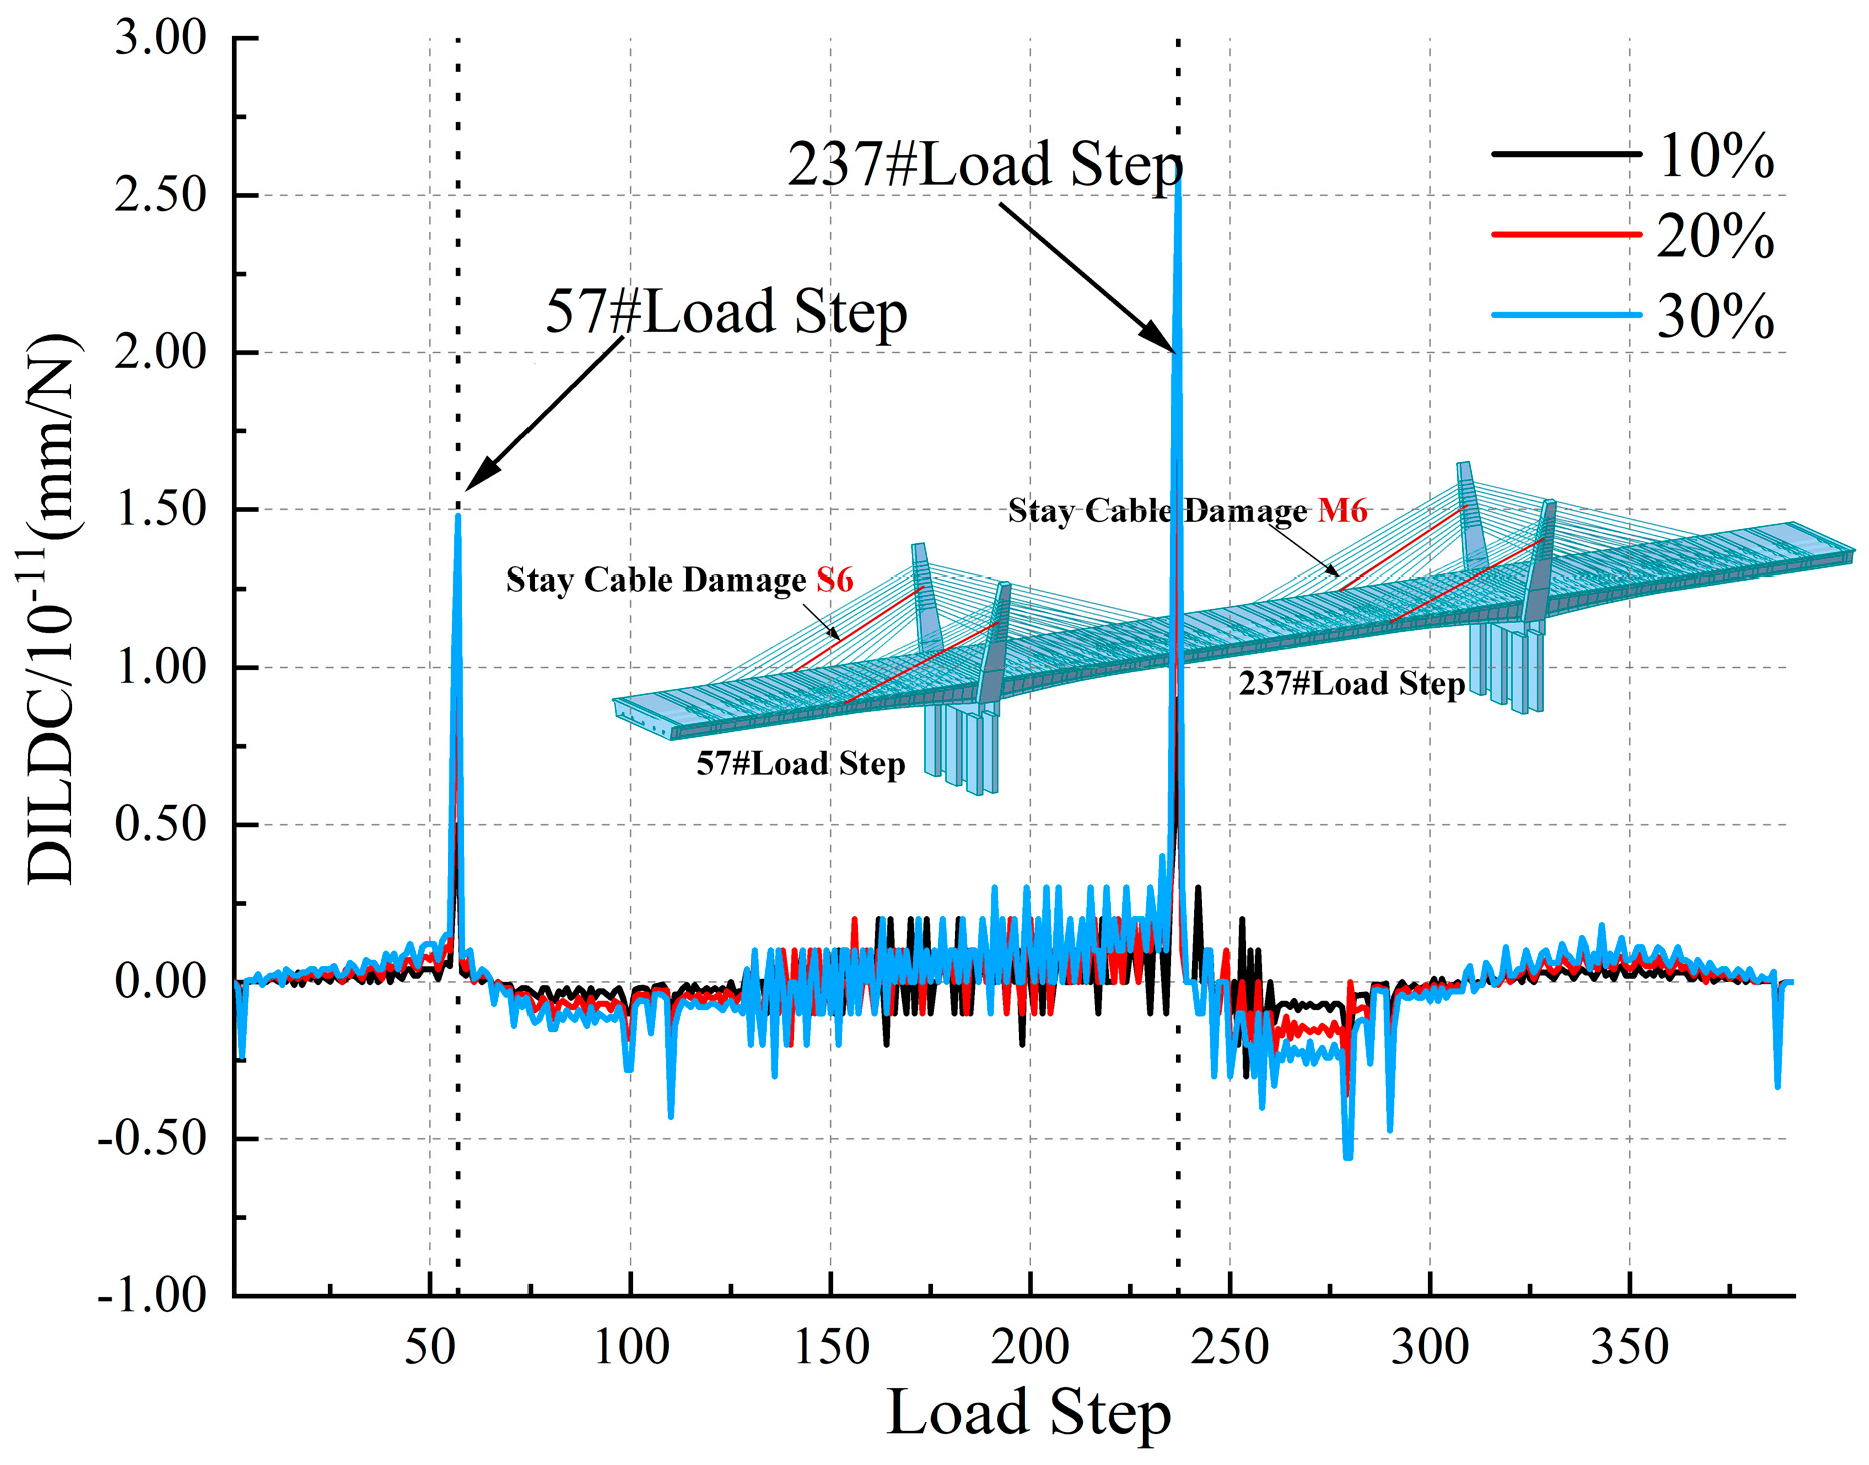
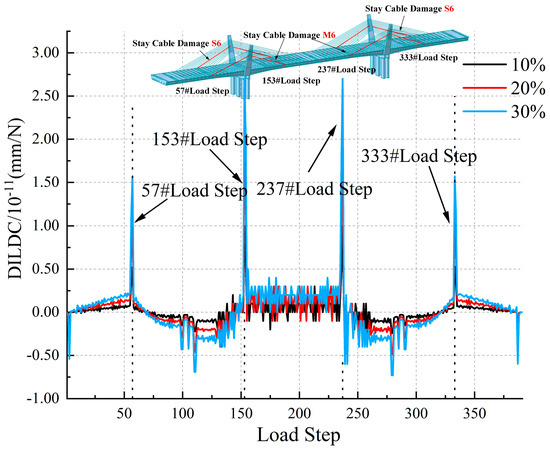
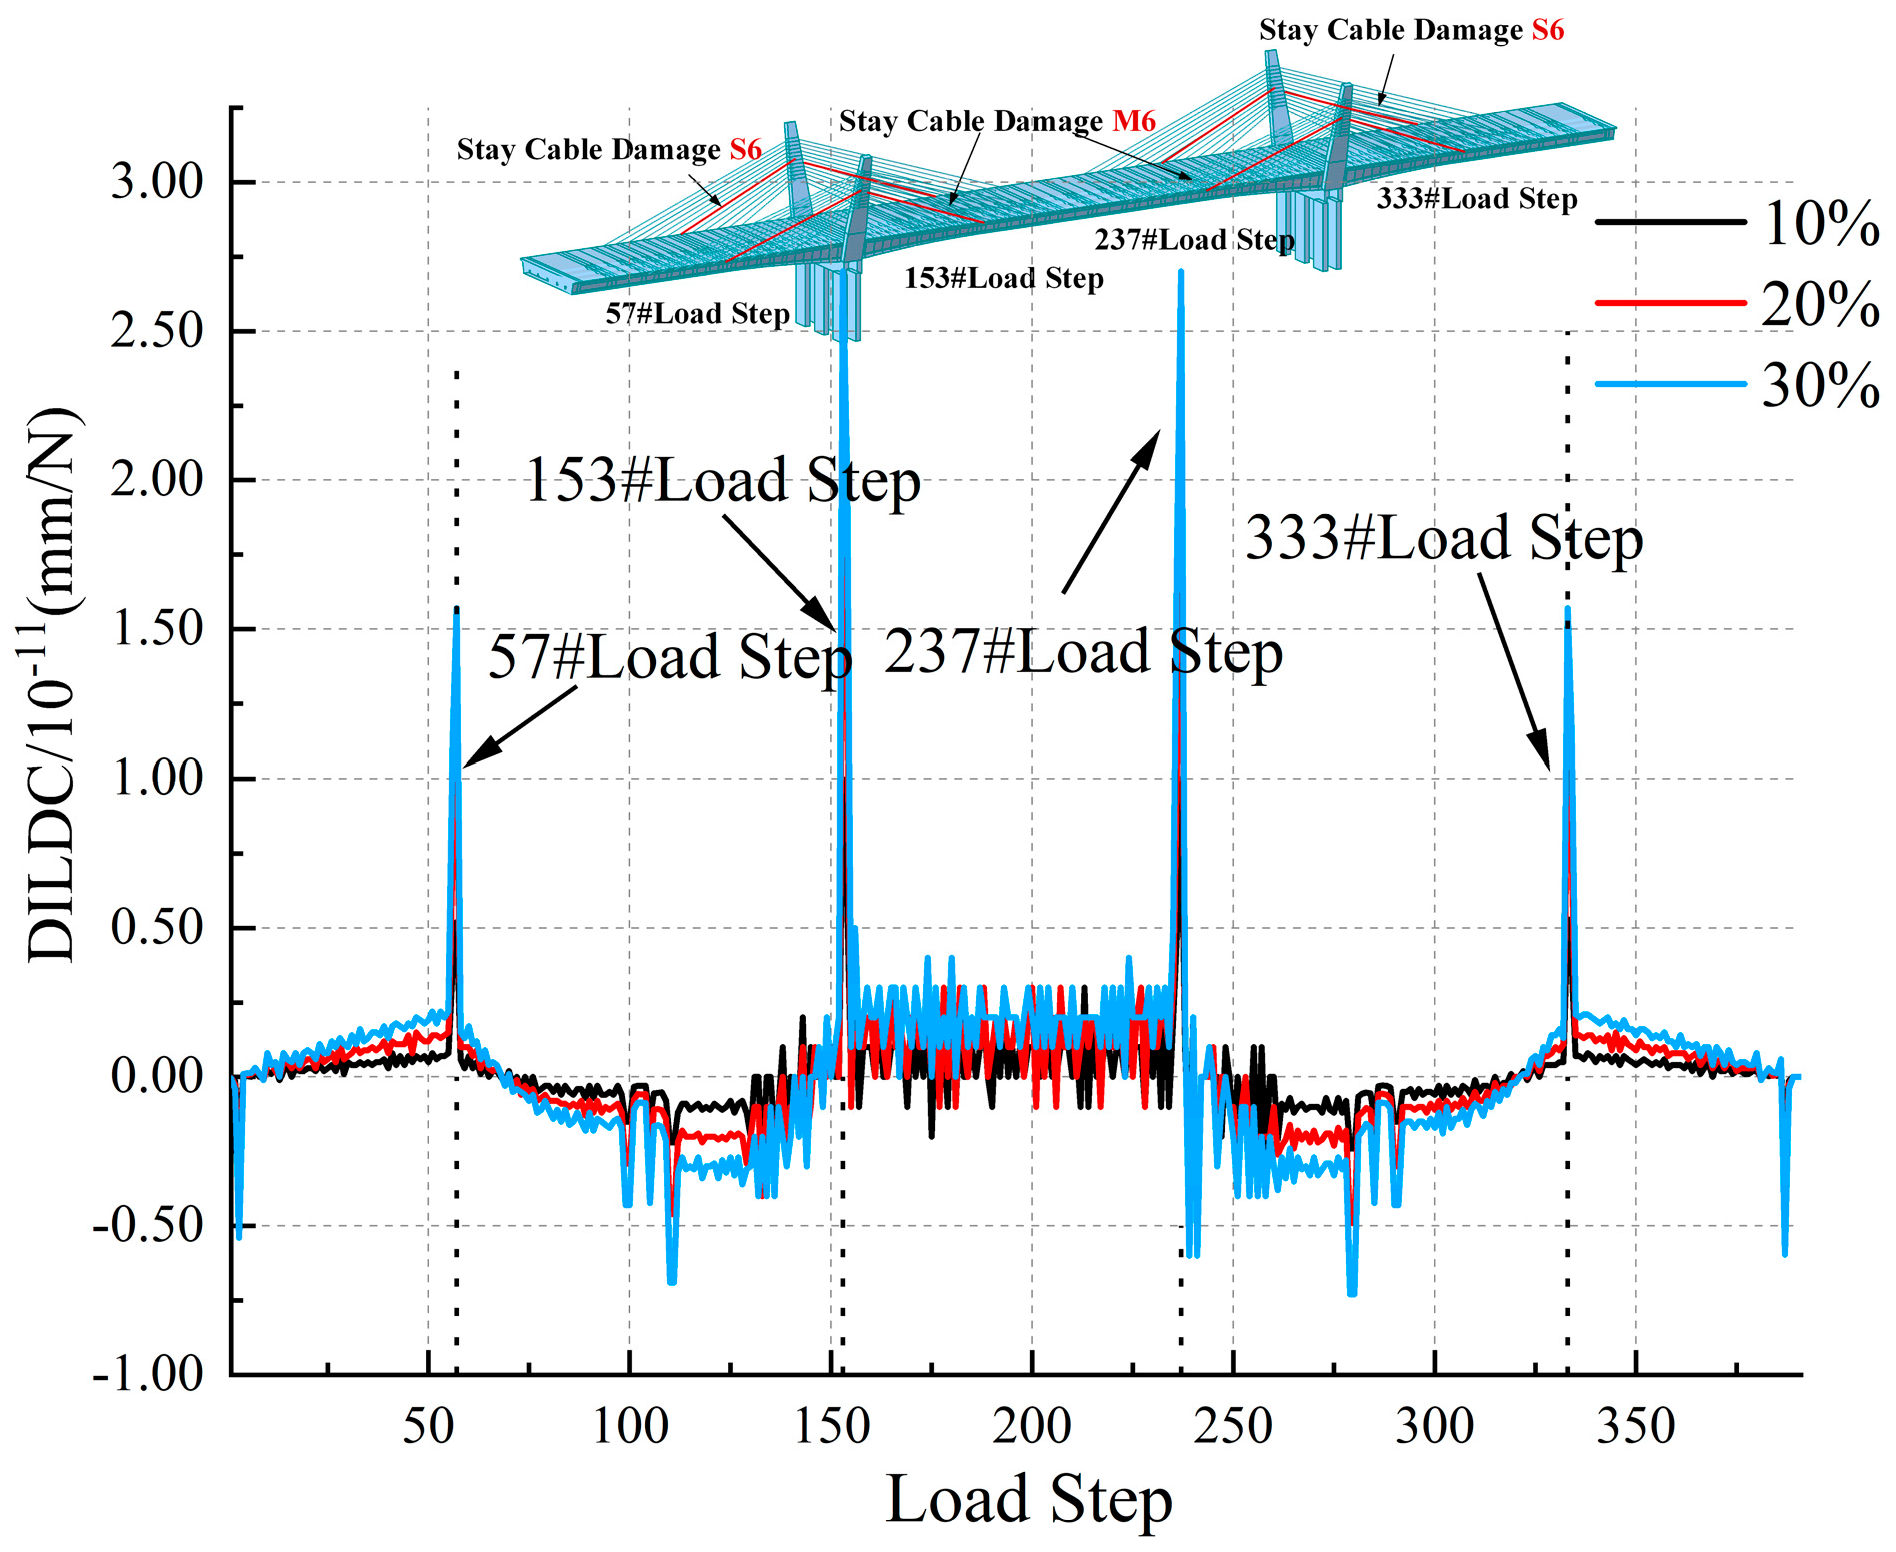
Therefore, the sixth cable group of each cable plane should be selected to establish four damage conditions when designing damage conditions. Working condition 1 is the single-tower–single-point damage condition of cable S6 of the damaged left tower. Working condition 2 is a single-tower–multi-point damage condition of cables S6 and M6 of the damaged left tower. Working condition 3 is the multi-tower–multi-point damage working condition of cable S6 of the damaged left tower and right tower. Working condition 4 is a multi-tower–multi-point damage condition of cable S6 and M6 of the damaged left tower and right tower. Damage identification, location and quantitative analysis can be carried out by extracting data of the deflection influence line before and after cable damage, as shown in Figure 5, Figure 6, Figure 7 and Figure 8 (The notation DILDC/10−11 used in Figure 5, Figure 6, Figure 7 and Figure 8 is solely for the purposes of numerical scaling and visual representation and does not alter the physical meaning of the indicators).
Figure 5.
Single-point damage response characteristics of cable S6.
Figure 6.
Multi-point damage response characteristics of cables S6 and M6.
Figure 7.
Multi-point damage response characteristics of the twin towers of cable S6.
Figure 8.
Multi-point damage response characteristics of twin towers of cables S6 and M6.
Figure 5 shows the single-tower–single-point damage condition of cable S6 of the damaged left tower. From the damage degrees of 10%, 20% and 30% of cable S6 of the cable-stayed bridge, there is a significant mutation at loading step 57#, and the curves of the other positions are smooth. The peak value of the DILDC curve increases with the increase in damage degree to 10%, 20% and 30%. The results show that, under the premise of cable damage of the cable-stayed bridge, accurate damage location and damage degree quantification can be achieved using the damage identification method based on the difference curvature of the deflection influence line. Damage location and damage degree can be effectively determined through the peak point. The peak point of the curve increases with the increase in the damage degree.
Figure 6 shows the single-tower–multi-point damage condition of cable S6 and cable M6 of the damaged left tower. From the damage degrees of 10%, 20% and 30% of cable S6 and cable M6 of the cable-stayed bridge, there is a significant mutation at loading steps 57# and 153#, and the curves of the other positions are smooth. The peak value of the DILDC curve increases with the increase in damage degree to 10%, 20% and 30%. Compared with Figure 5, the damage condition of the same cable with the same left tower can be seen at loading steps 57# and 153#. The DILDC curve shows a larger peak value as loading step 153# is closer to the testing point.
Figure 7 shows the multi-tower–multi-point damage condition of cable S6 of the damaged left tower and right tower. From the damage degrees of 10%, 20% and 30% of cable S6 of the cable-stayed bridge, there is a significant mutation at loading steps 57# and 237#, and the curves of the other positions are smooth. The peak value of the DILDC curve increases with the increase in damage degree to 10%, 20% and 30%. Compared with Figure 5, the damage condition of the same cable with the same left tower can be seen at loading steps 57# and 237#. The DILDC curve shows a larger peak value as loading step 237# is closer to the testing point.
Figure 8 shows the multi-tower–multi-point damage condition of cable S6 and cable M6 of the damaged left tower and right tower. From the damage degrees of 10%, 20% and 30% of cable S6 of the cable-stayed bridge, there is a significant mutation at loading steps 57#, 153#, 237#, and 333#, and the curves of the other positions are smooth. The peak value of the DILDC curve increases with the increase in damage degree to 10%, 20% and 30%. Compared with Figure 5, the damage condition of the same cable with the same left tower can be seen at the four loading steps. The DILDC curve shows a larger peak value as loading steps 153# and 237# are closer to the testing point.
As can be seen from Figure 5, Figure 6, Figure 7 and Figure 8, under the premise of cable damage of the cable-stayed bridge, the damage identification method based on deflection influence line difference curvature can achieve effective determination of damage location and damage degree through the peak point. However, the loading step near the damage position fluctuates, potentially affecting the location and accuracy of damage identification of the cable-stayed bridge. Therefore, it is necessary to integrate information-entropy theory and damage identification conditions to enhance the confidence of the data.
4.3. Information-Entropy Damage Identification Condition
According to Section 2.2, the differential curvature of the deflection influence line under the damage condition is fused. The differential curvature entropy index of the deflection influence line is constructed through the differential curvature data of the deflection influence line under the above four working conditions, so as to obtain the generalized differential curvature information entropy data of the deflection influence line before and after damage.
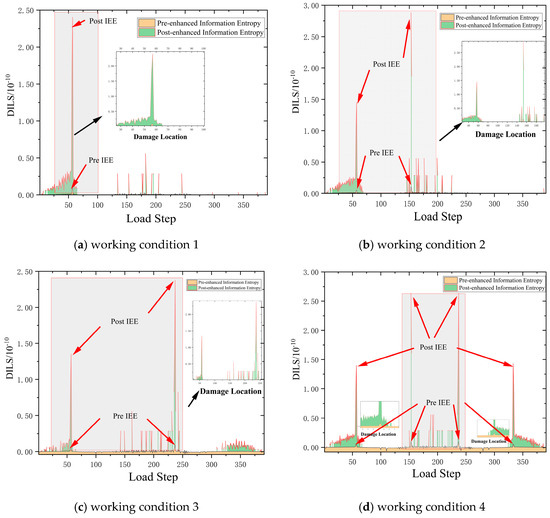
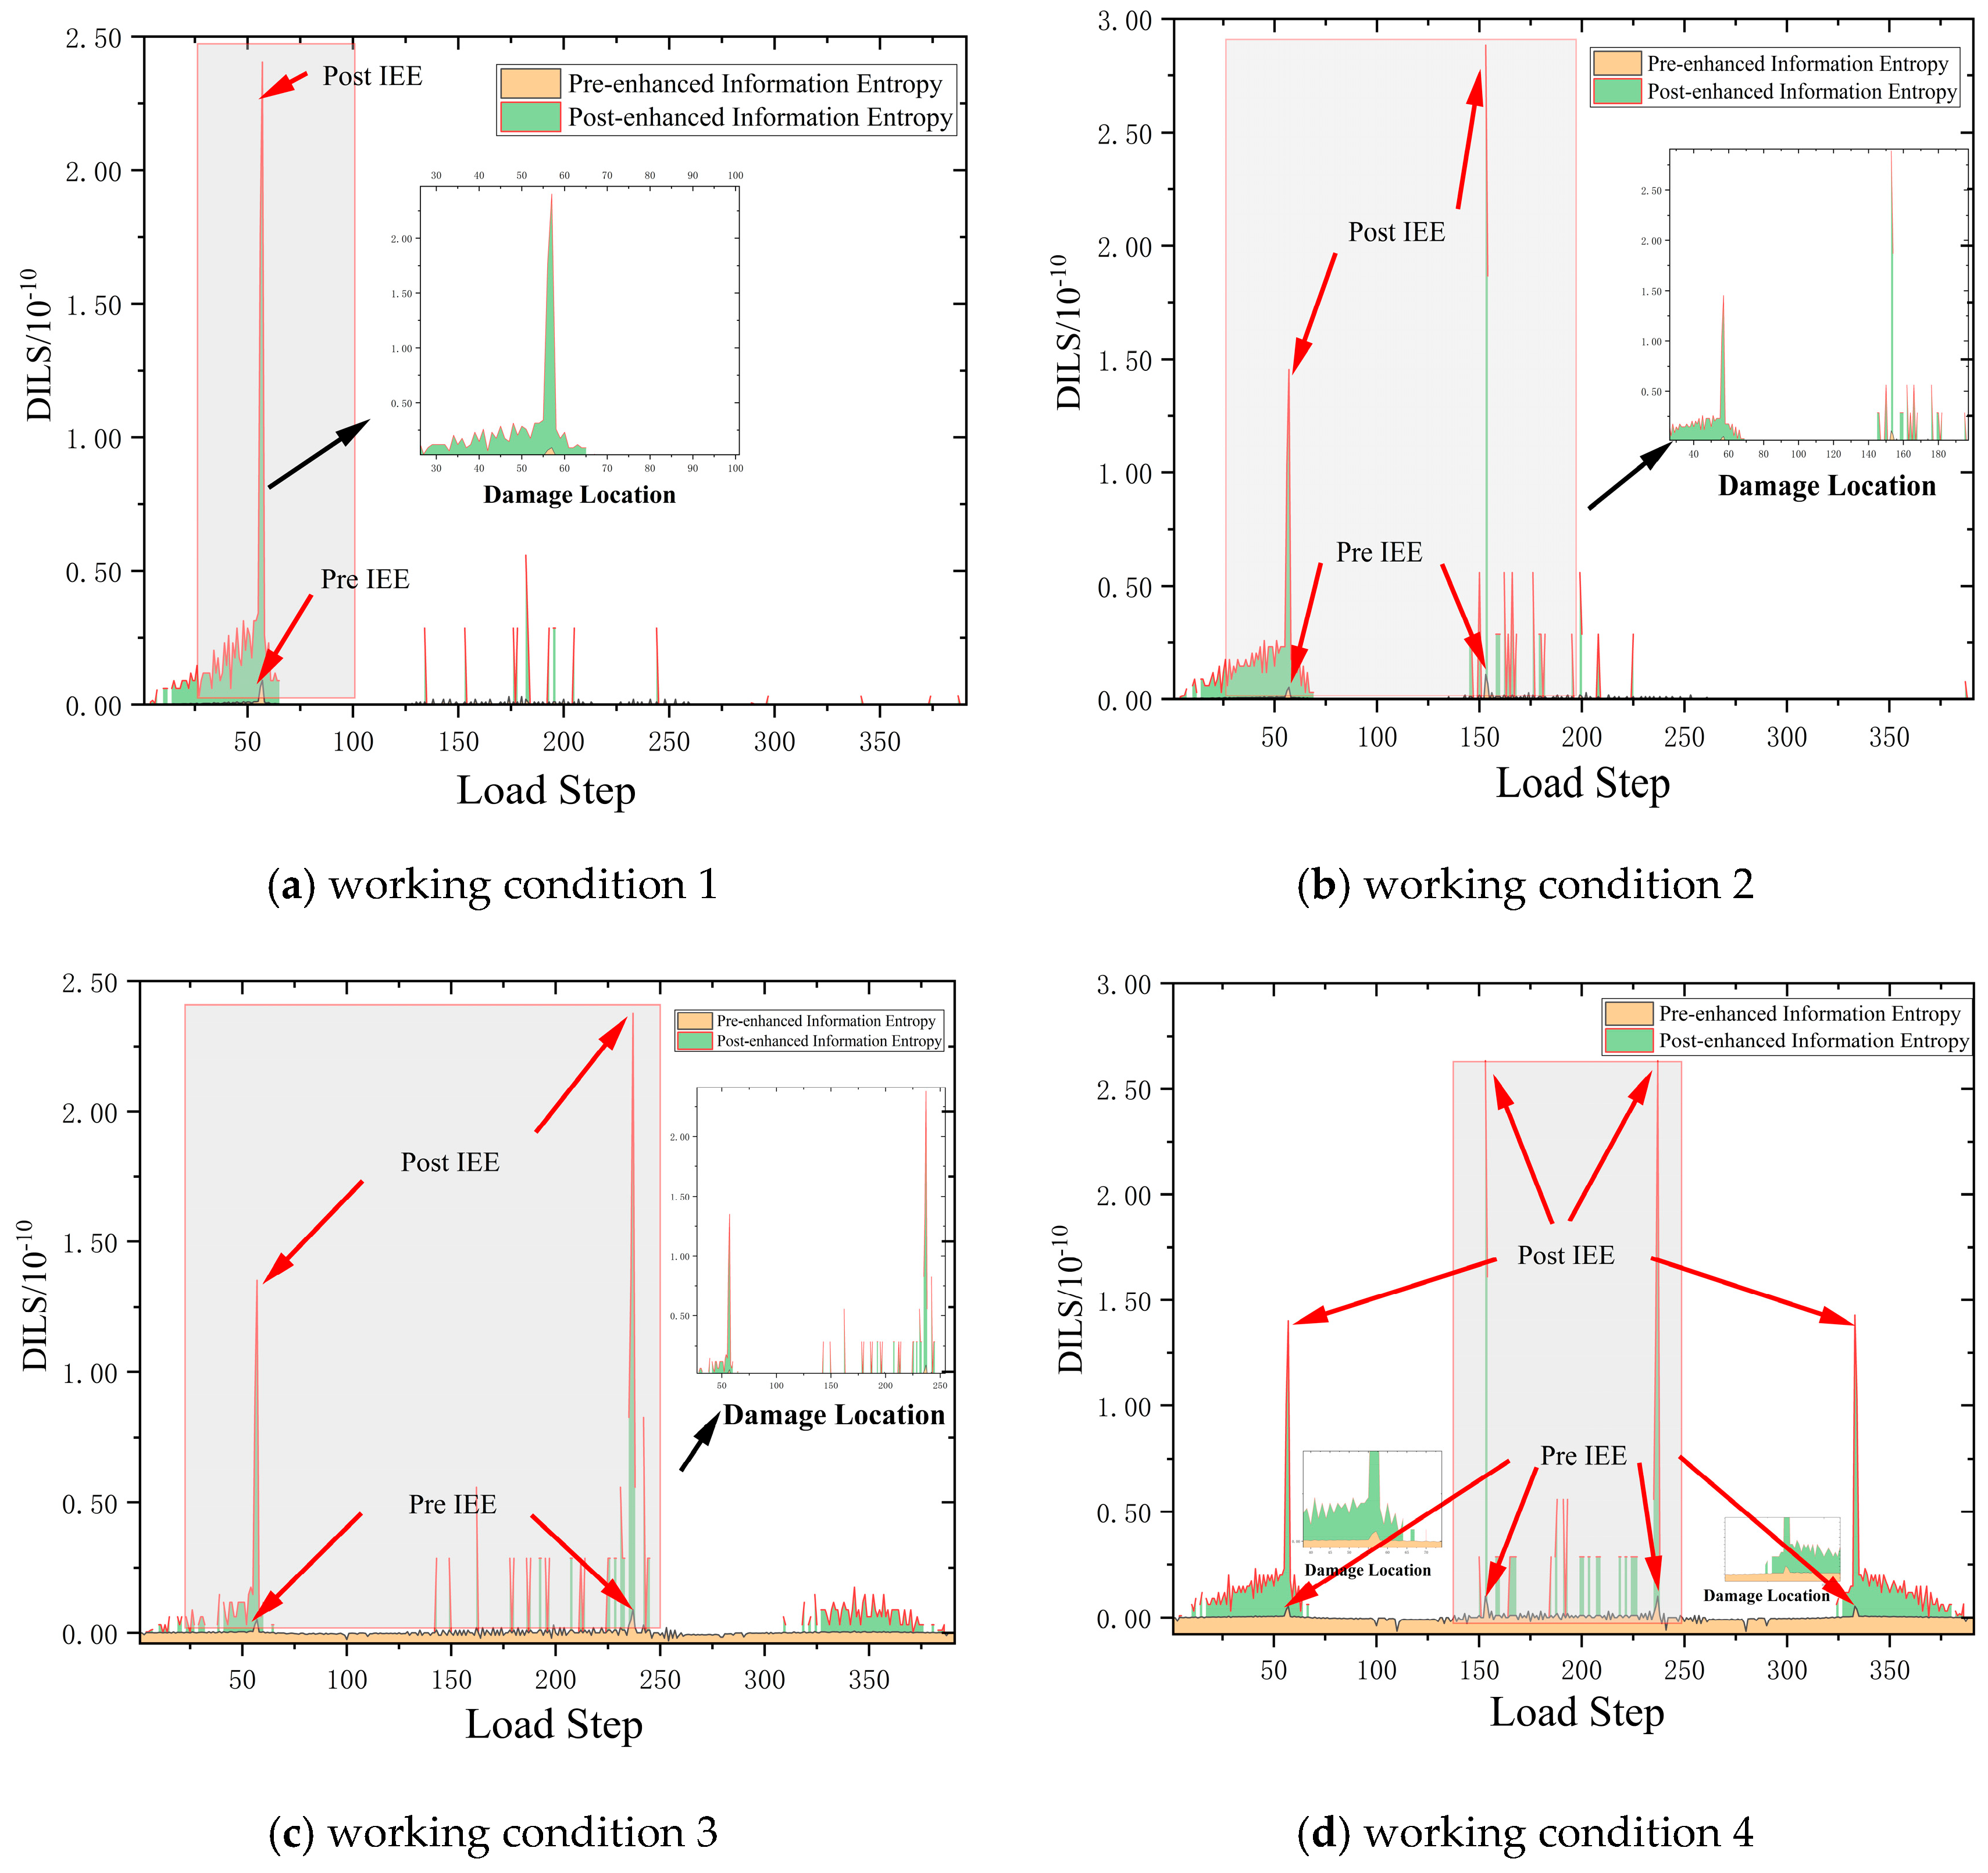
According to Section 3.2, the DILDC curve can identify the damage location, but there are still fluctuations at other loading steps except for the curve peak, making it prone to misjudgment of damage identification with small damage degrees. Information-entropy analysis is used to analyze the second-order difference in the deflection influence line difference in the beam as it can amplify the signal. The curvature entropy index of the deflection influence line difference (DILS) is obtained to further optimize the damage identification effect. To verify the effectiveness of the curvature of the difference in the deflection influence line and the entropy of the difference curvature under the condition with a small damage degree, a damage degree of 10% is taken as the example to compare the identification effectiveness of cable damage conditions 1–4 of the cable-stayed bridge. The results of damage identification are shown in Figure 9 (The representation method of DILS/10−10 used in Figure 9 is solely for the purpose of numerical scaling and visual display, without altering the physical meaning of the indicators).
Figure 9.
Results of information-entropy identification.
As shown in Figure 9, the curvature entropy index of the deflection influence line difference (DILS) can effectively remove the data fluctuation near the damage location and enhance the accuracy of damage identification. Taking working condition 1 as an example, the peak data of the damage position of the DILDC index is 0.8 × 10⁻¹¹, and that of the DILS index is 2.4 × 10⁻¹⁰. The value of the damage position is increased several times, while the data of the non-damage location remains unchanged. Therefore, the information-entropy damage identification method can increase the confidence of the damage location and can be effectively applied to the security diagnosis of cable damage of cable-stayed bridges.
5. Measured Data
5.1. Measured Acquisition Parameters
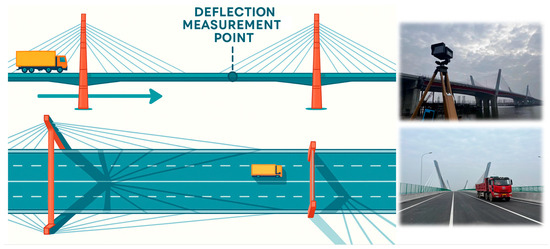
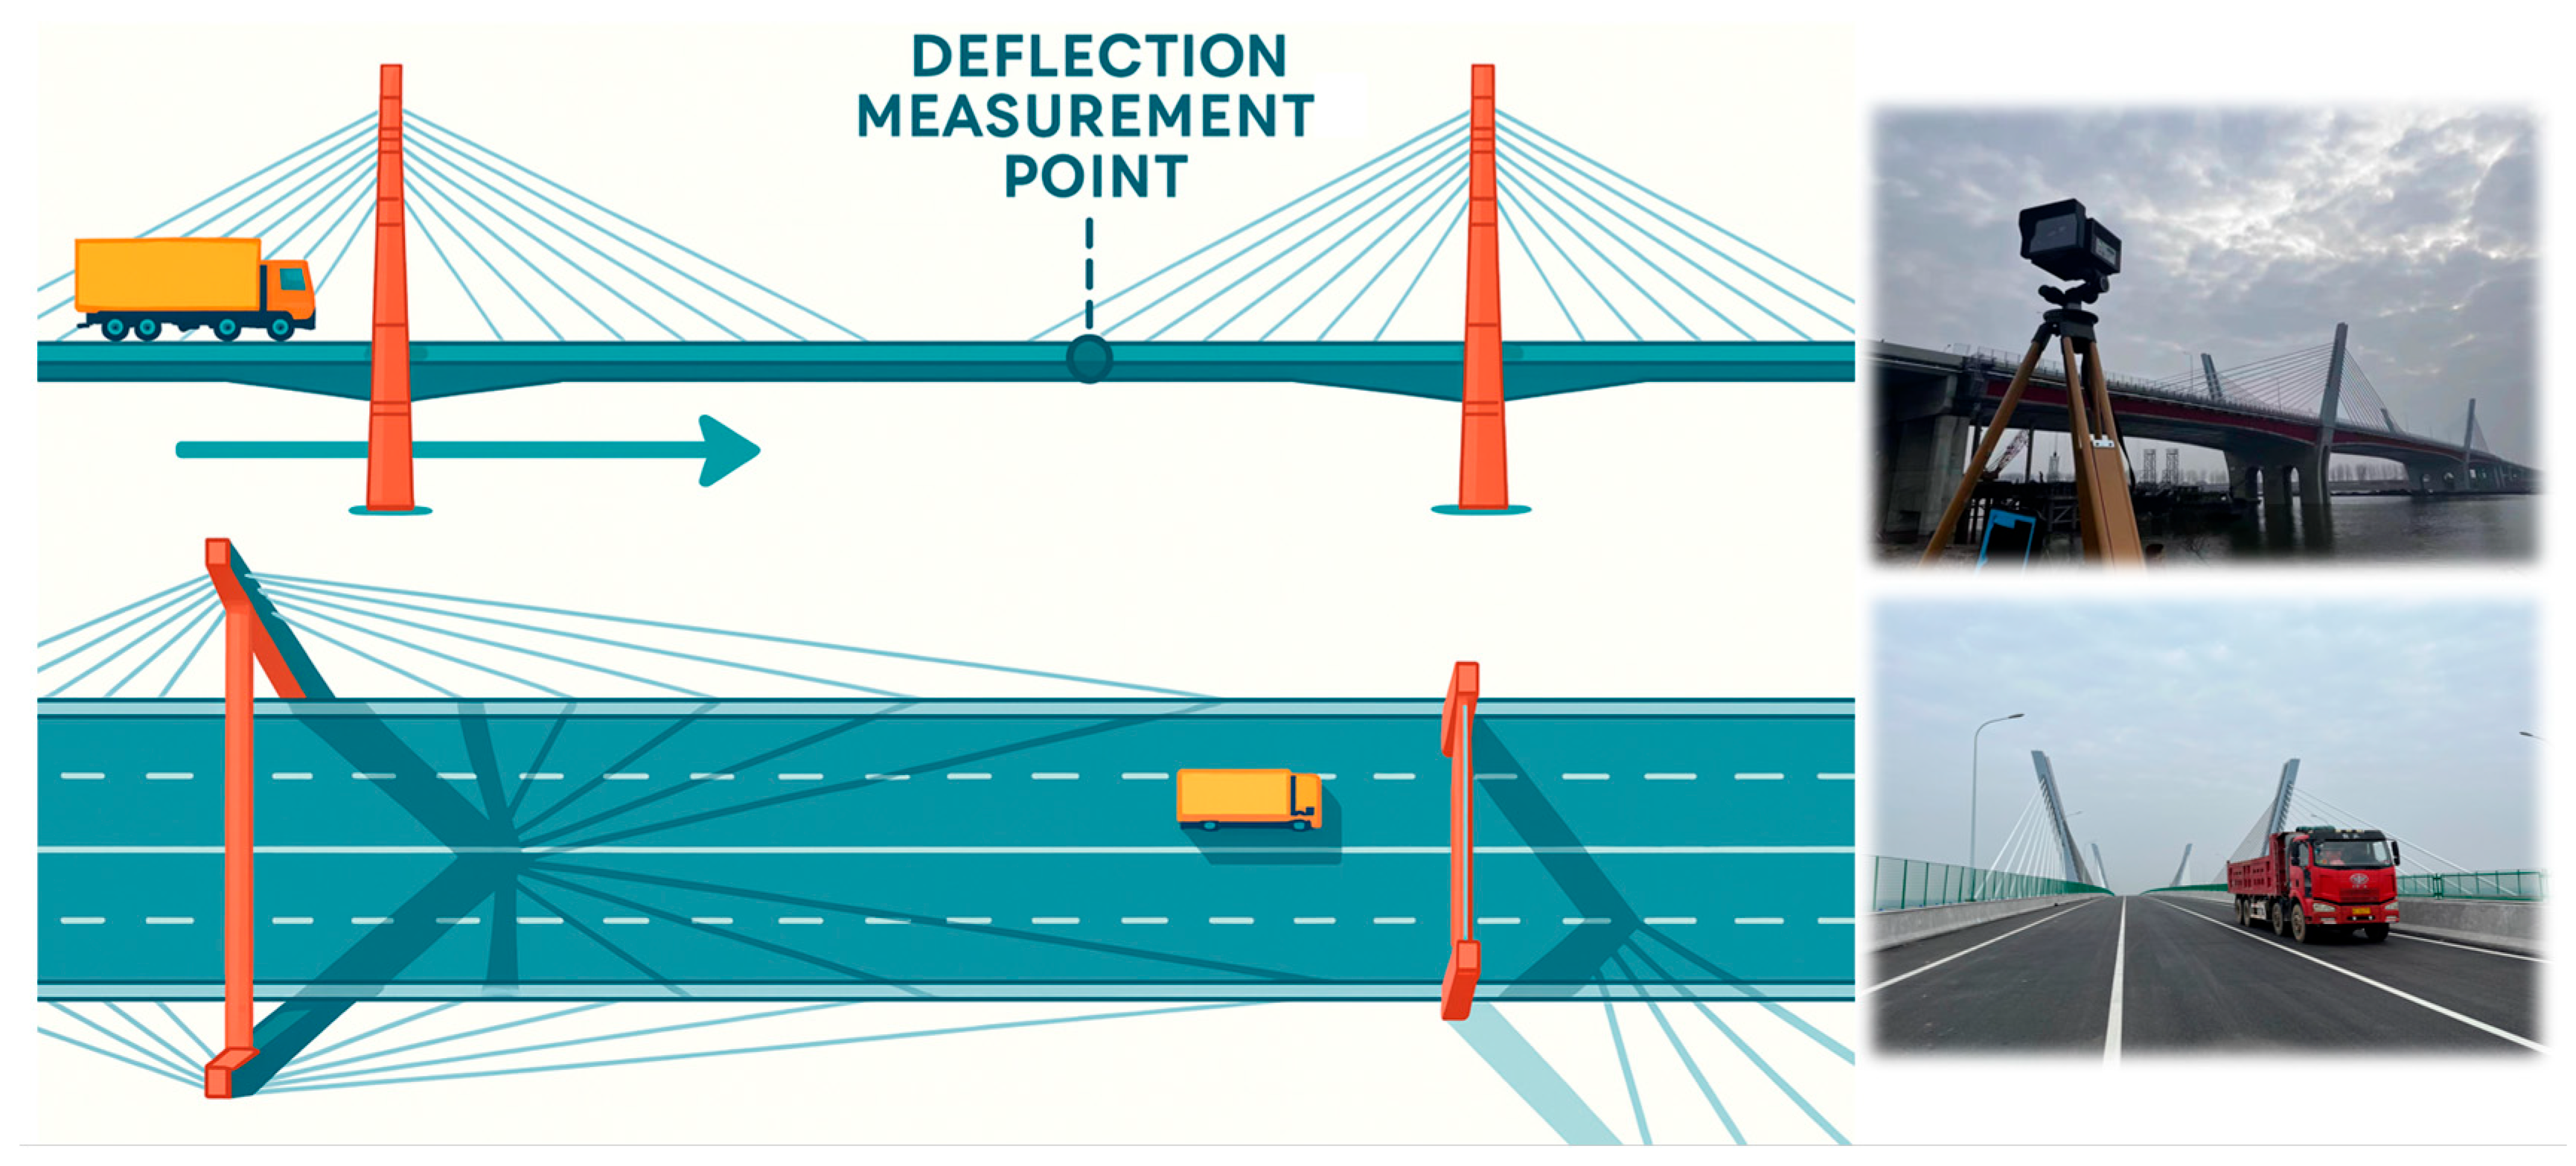
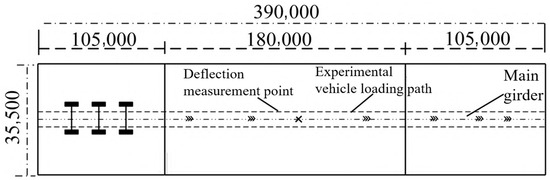
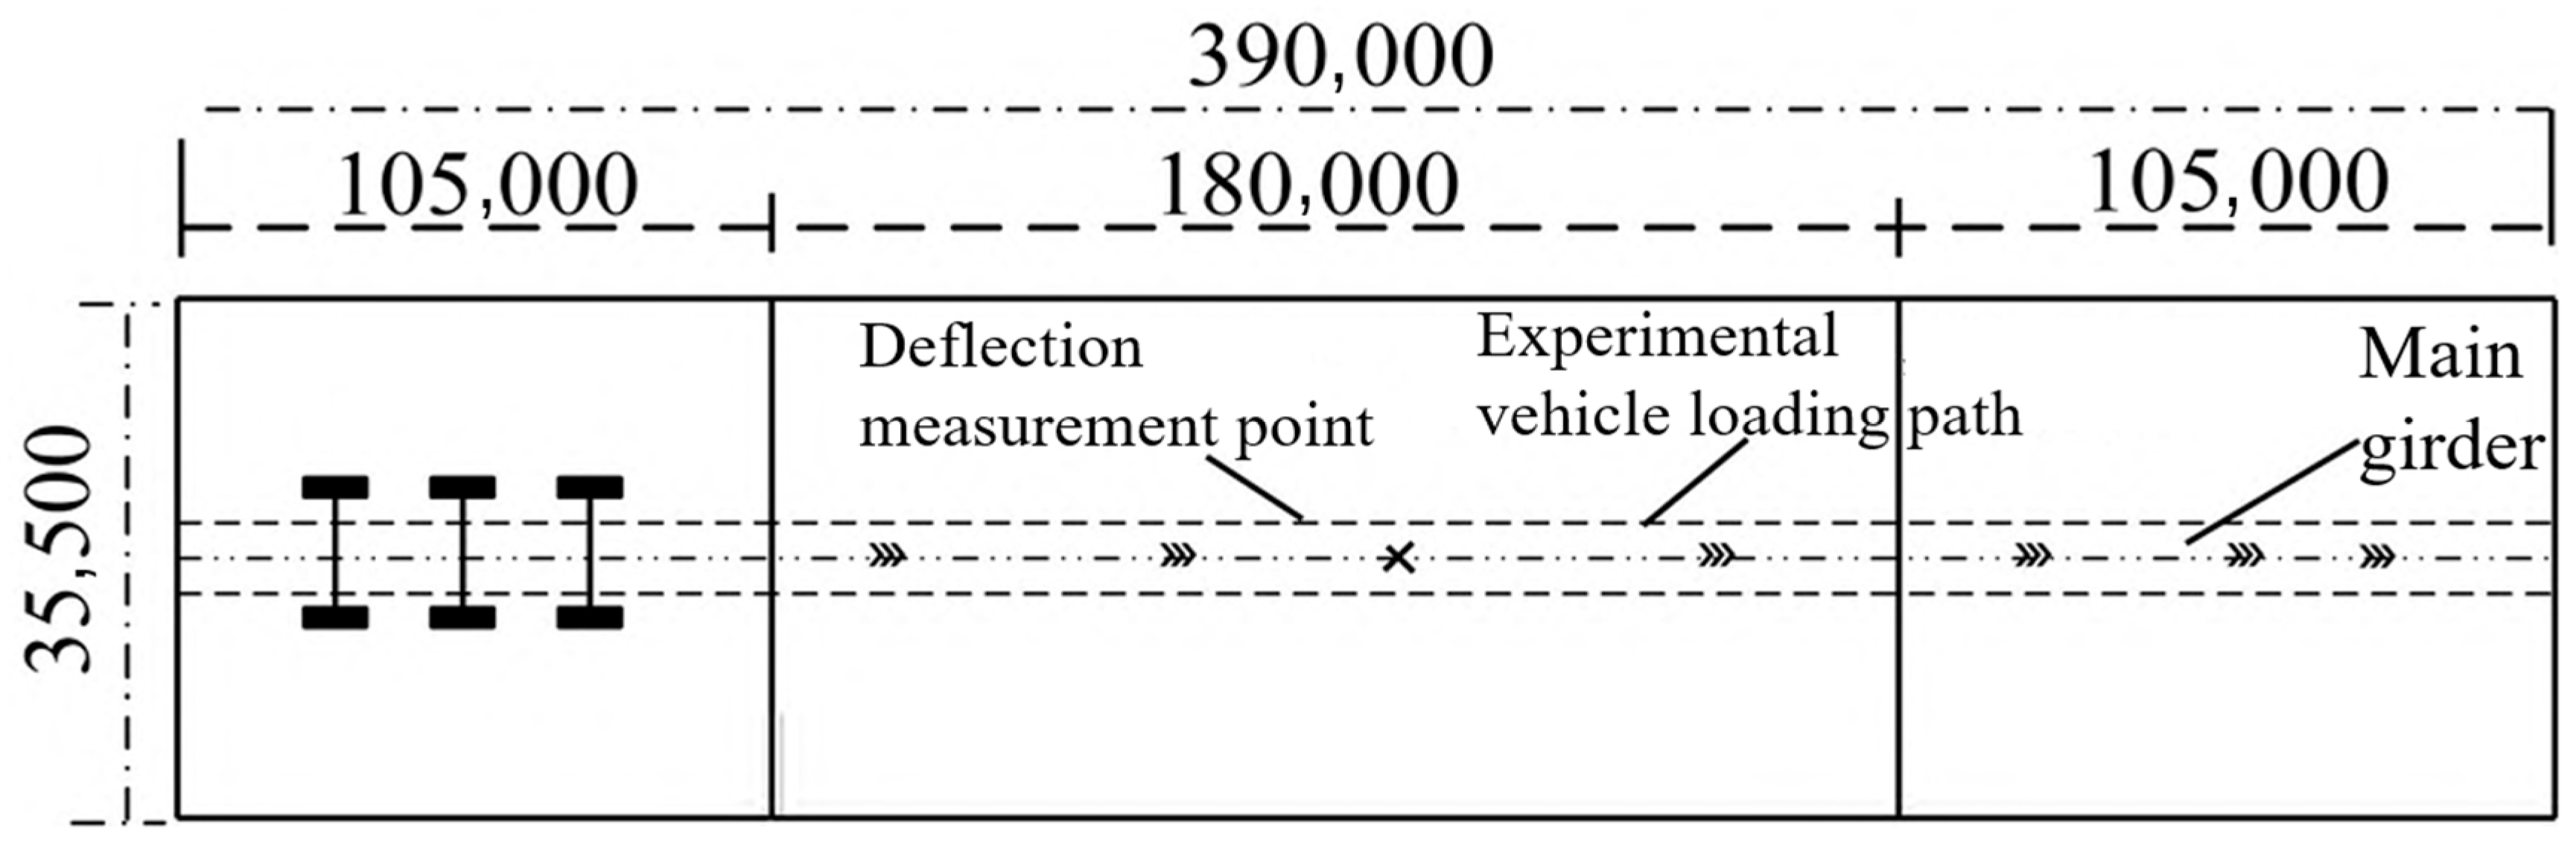
In the experiment, a cable-stayed bridge across Huaihe River was selected as the engineering research object, which is a low-pylon cable-stayed bridge with a classic three-span corrugated steel web–PC composite box girder. During the loading process, a four-axle vehicle with a total weight of 350 KN was selected, with axle weights of 44, 106, 99 and 101 KN and axle spacing of 1.9, 4.2 and 1.4 m respectively. To measure the deflection influence line response of the bridge structure, the vehicle was loaded by the quasi-static influence line, and the center line of the bridge was selected as the loading path. The four-axle testing vehicle with a load of 37 T was made to idle along the loading path, thereby measuring the deflection response data of the bridge structure under a quasi-static influence line loading test. The structural influence line of displacement under the unit load of the bridge was also identified. Using a dynamic deflectometer to locate the mid-span section, 14 working conditions were tested, and working condition 14 was selected as the measured data for verification. The measured diagram of the dynamic time-history response of vehicle moving and loading and the layout of the measuring points are shown in Figure 10 and Figure 11.
Figure 10.
Measured diagram of dynamic time-history response of vehicle moving and loading.
Figure 11.
Layout of measuring points.
5.2. Pretreatment of Vehicle-Induced Deflection Response
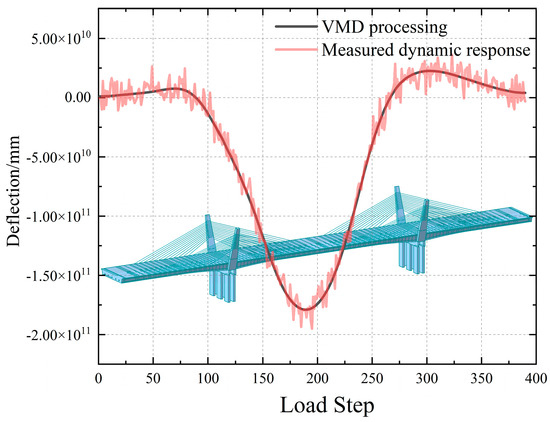
To accurately identify the bridge’s influence line of displacement with regards to time, the measured deflection response data are extracted, and the dynamic disturbance response in the mid-span is preprocessed based on the VMD method, thereby acquiring the quasi-static deflection response. Using the Tikhonov regularization method, the vehicle multi-axle effect on the quasi-static deflection response is removed to obtain the measured influence line of displacement of the bridge. In the engineering field measurements, acceleration sensors and dynamic deflection test equipment are installed on key sections of the bridge to collect vibration response signals under natural environmental excitation, thereby obtaining the fundamental frequency parameters of the bridge. A non-contact dynamic deflectometer is used in the actual measurement, with the mid-span section selected as the test point. The measured vehicle-induced deflection response data, loaded vehicle information and loading route are shown in Figure 12.
Figure 12.
Schematic diagram of measured data of vehicle-induced deflection response.
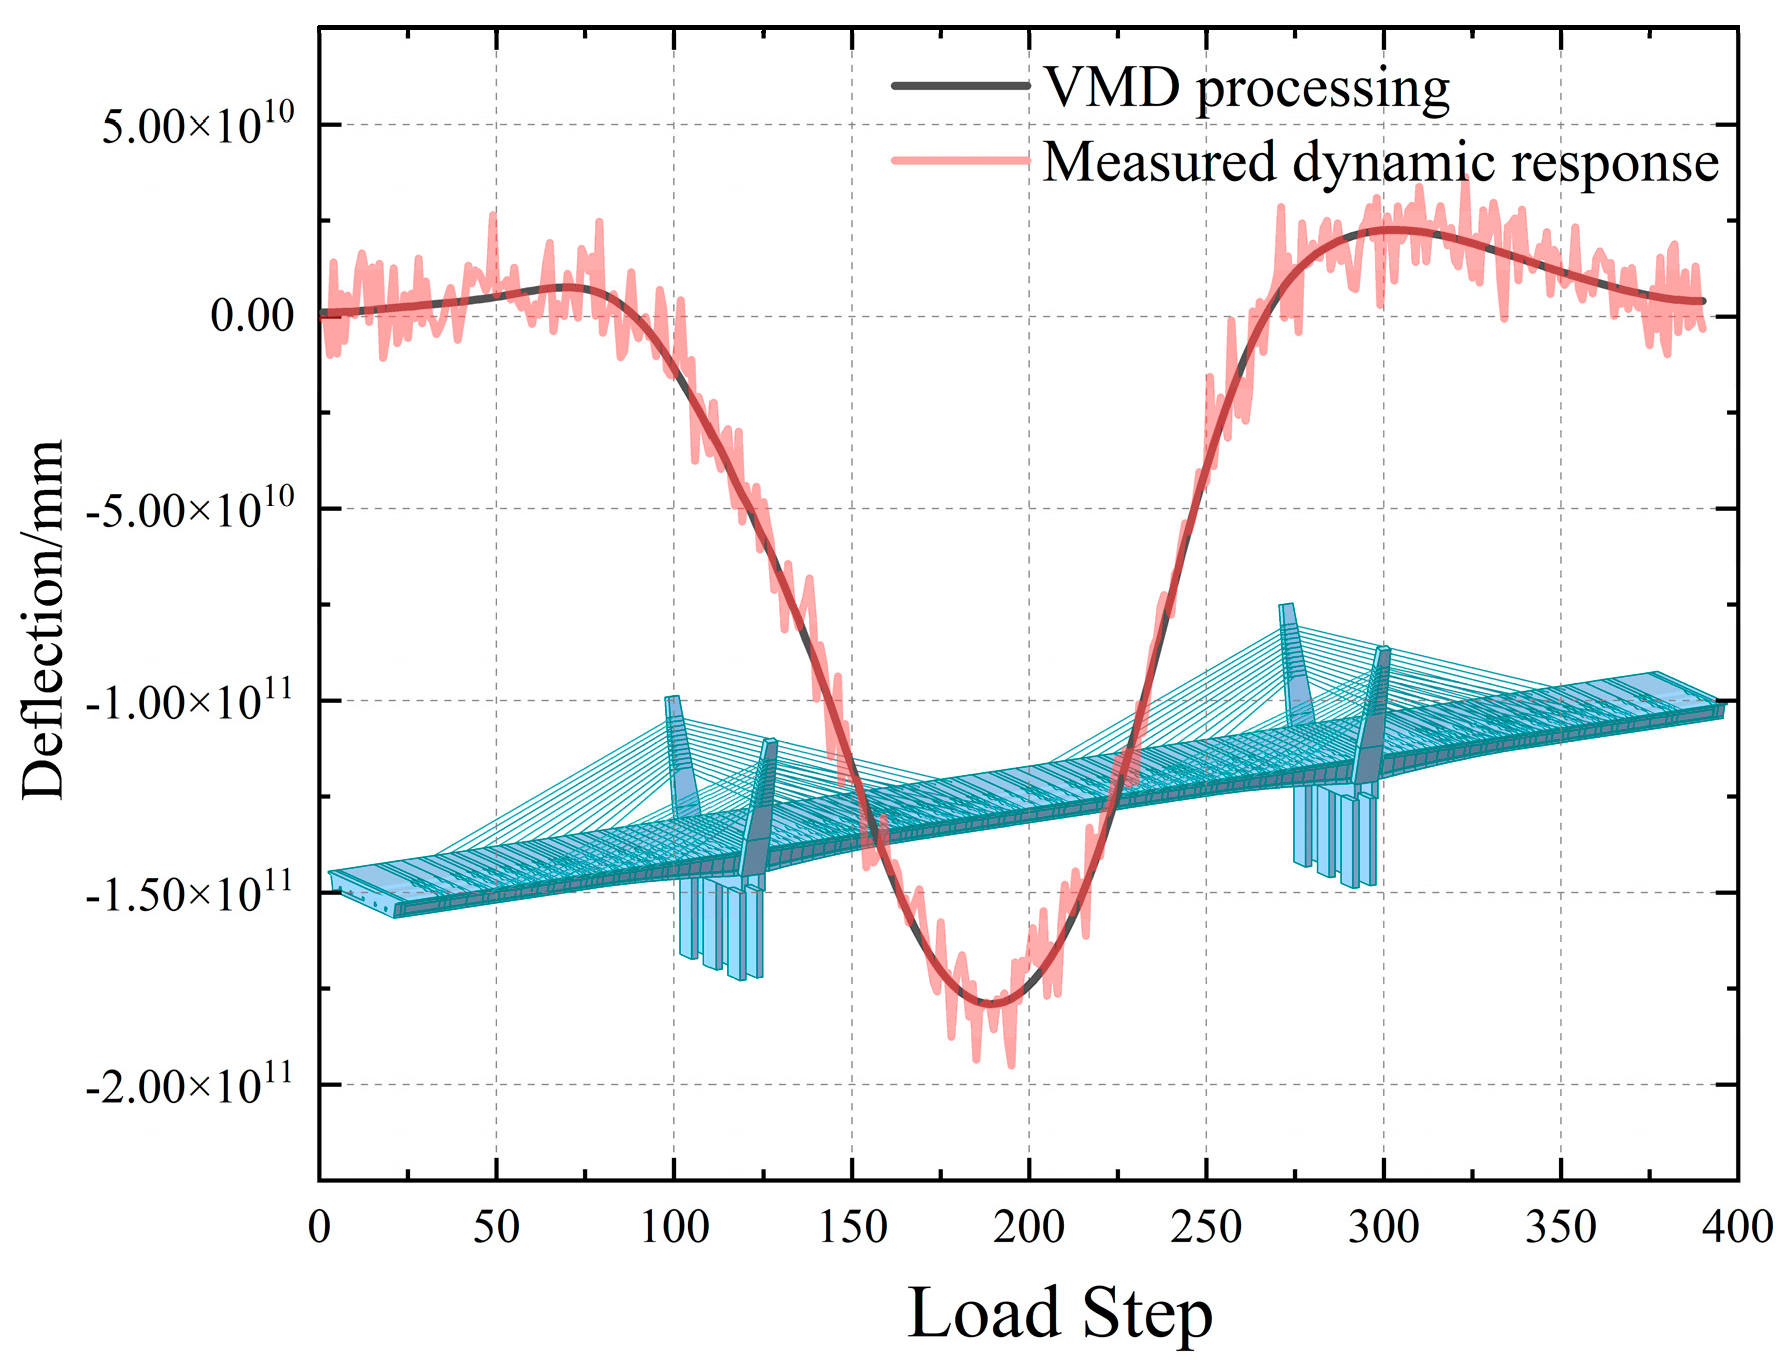
In the engineering measurements, 14 groups of working conditions are tested and their vehicle-induced deflection response data are obtained. Under the strong influence of environmental loads such as temperature, wind noise and traffic, the 14 groups of data tend to be consistent but with slightly different effects. Working condition 14, which had the best response, is selected as the benchmark data for the verification of the measured data. As shown in Figure 12, the vehicle-induced deflection response can be affected by strong environmental load, demonstrating data with unfavorable robustness. After the decomposition through VMD, a relatively smooth quasi-static deflection curve is obtained. As vehicle speed increases, the absolute peak value of the deconstruction result gradually decreases, and this value is less than the peak value of the quasi-static structural deflection response. Therefore, the VMD-based deconstruction method can effectively eliminate the dynamic components while ignoring the impact of vehicle speed. The deconstruction results are basically consistent with the quasi-static structural deflection response, as shown in Figure 13.
Figure 13.
VMD deconstruction-based deflection response.
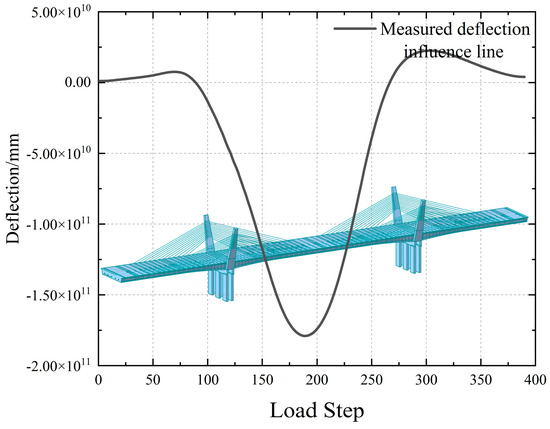
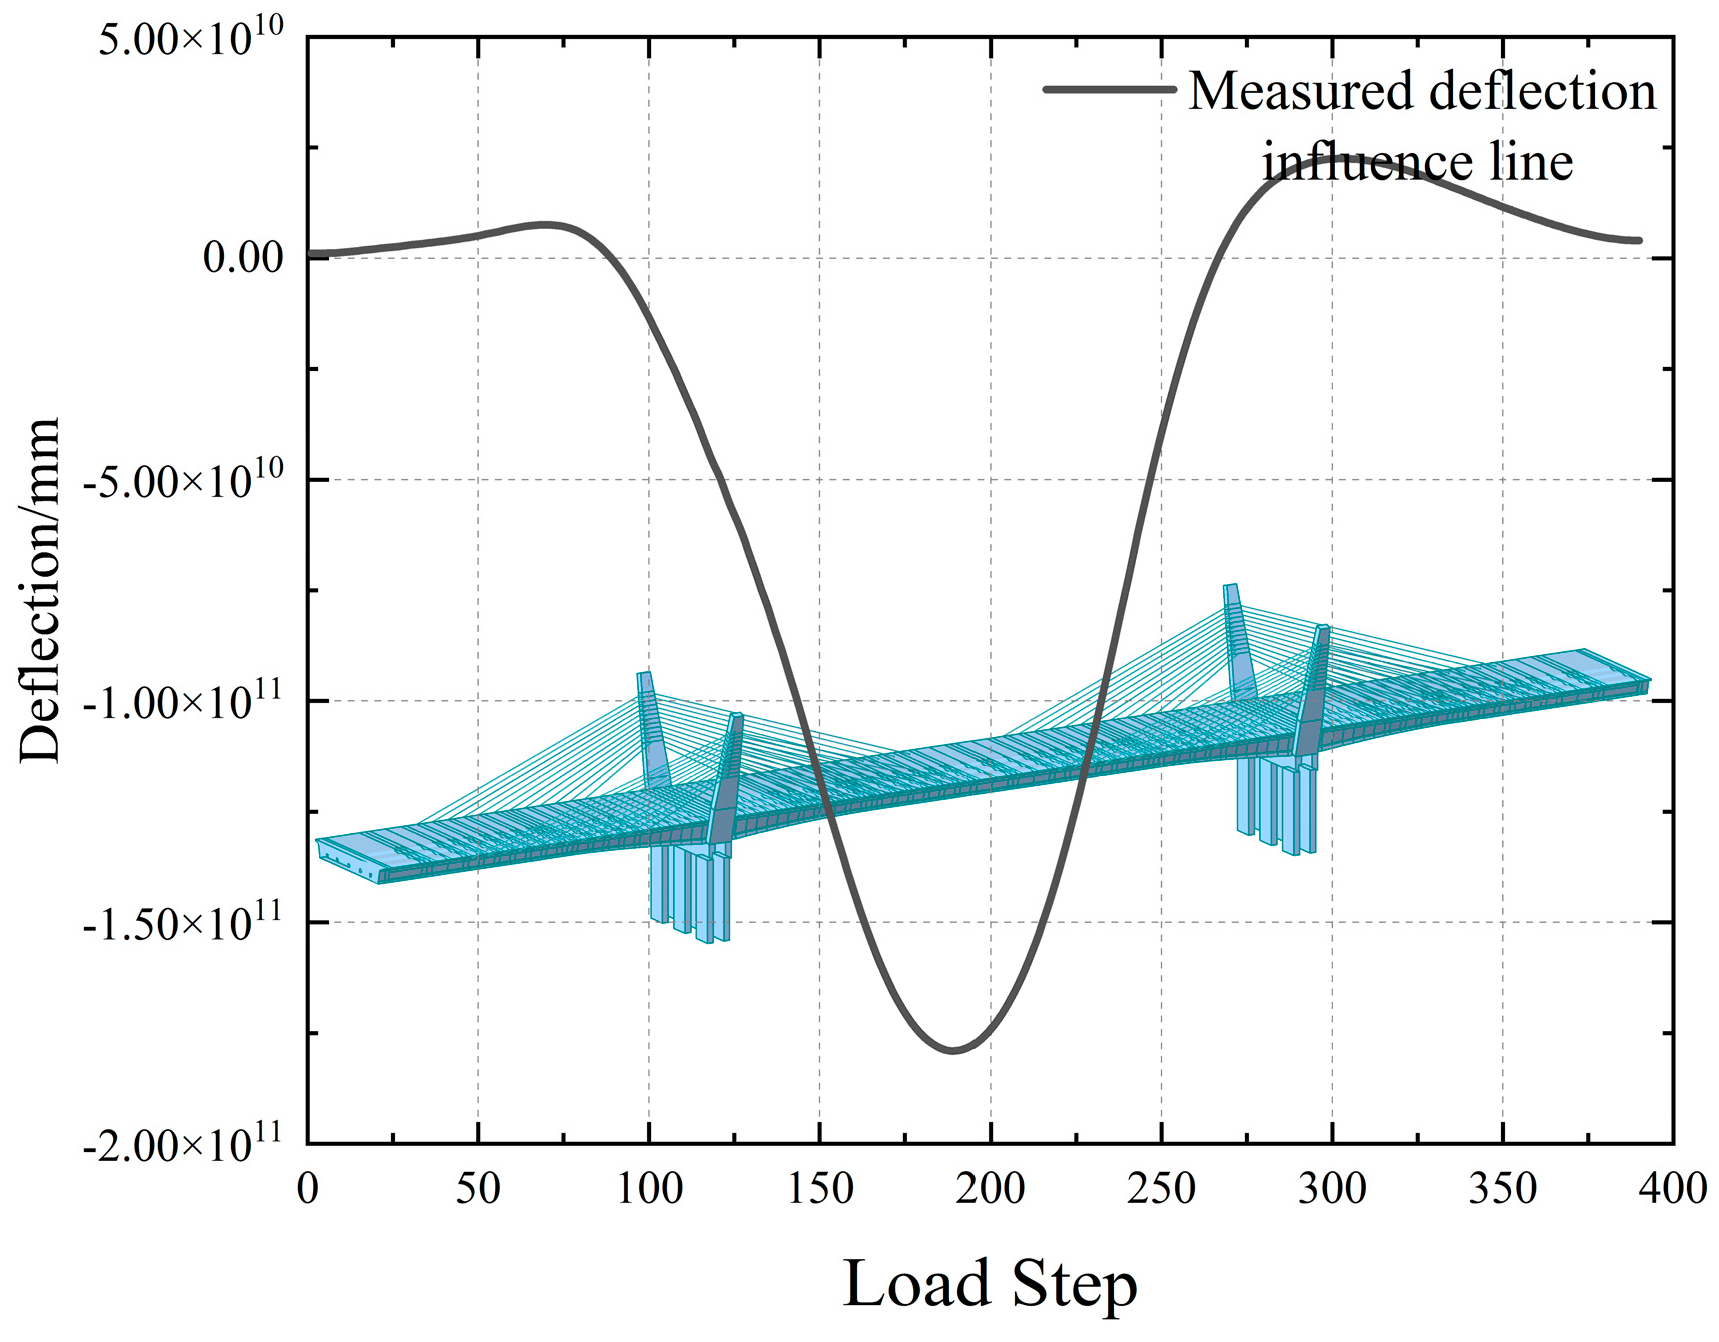
The influence line identification model is established and solved by Tikhonov regularization, thereby obtaining the influence line of displacement of the low-pylon cable-stayed bridge with a classic three-span corrugated steel web–PC composite box girder. The results of the deflection influence line identification of the low-pylon cable-stayed bridge based on VMD and Tikhonov regularization are shown in Figure 14.
Figure 14.
Extracted measured deflection influence line of vehicle multi-axle effect.
5.3. Curve Fitting of Entropy Value of the Influence Line of Displacement
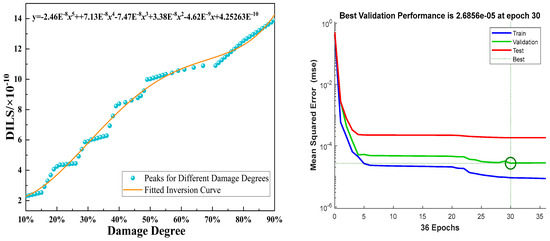
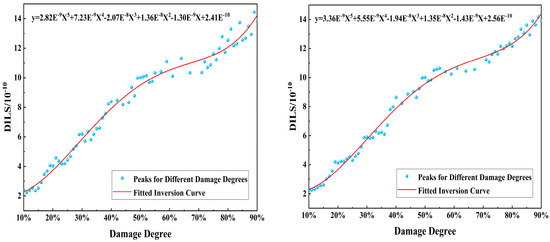
Through the measured deflection influence line data derived from the pretreatment of the vehicle-induced deflection response in Section 4.2, zk14 is fused by information entropy, with a damage degree ranging from 10% to 90%. The results show that the peak value of entropy increases with the increase in damage degree, making it possible to quantitatively evaluate the damage degree by fitting the entropy curve formula. To better investigate the relationship between the damage degree and the curvature entropy of the deflection influence line difference and accurately quantify the damage degree, a total of 13 damage degrees of the M6 stayed cable under the single-point damage condition are selected for polynomial fitting to achieve the corresponding damage inversion formula, so as to invert the peak value of the curvature entropy of the deflection influence line difference under different damage degrees. The fitted inversion formula is
To determine the appropriate polynomial order in the damage inversion model and to avoid potential overfitting caused by excessive model complexity, a comparative analysis of polynomials with different orders is conducted during the formulation of the inversion equation. Specifically, for the 13 damage degree samples selected under the single-point damage condition of stay cable M6, second- to sixth-order polynomials are employed to fit the relationship between the peak value of the deflection influence line difference curvature entropy and the damage degree.
The comparative results indicate that lower-order polynomials (≤3rd order) are insufficient to effectively capture the nonlinear evolution characteristics between the two variables, exhibiting relatively large fitting residuals and noticeable deviations in the medium- to high-damage ranges. Although higher-order polynomials (≥6th order) improve the fitting accuracy within certain local intervals, pronounced oscillations appear in the fitted curves, leading to reduced model stability and an increased risk of overfitting.
Considering fitting accuracy, curve smoothness, and physical rationality, the fifth-order polynomial achieves an appropriate balance between model complexity and fitting performance and can stably represent the mapping relationship between damage degree and the characteristic entropy index. Therefore, a fifth-order polynomial is selected as the damage inversion equation to describe the quantitative relationship between the stay cable damage degree and the peak value of the deflection influence line difference curvature entropy within the investigated working conditions. The fitting effect is shown in Figure 15:
Figure 15.
Fitting of damage inversion formula.
As shown in Table 1, the curvature entropy value of the deflection influence line difference increases as the damage degree increases. Such a growth trend slows down and then rises with a damage degree of between 50% and 60%. Considering the alteration of cable tension with a damage degree of 50% in engineering practice, the inversion formula of damage degree fits the actual engineering situation.
Table 1.
List of damage degrees and peak entropy values.
5.4. Verification of Safety-State Evaluation Method Based on PSO-BP Neural Network
Substituting the measured data of working condition 14 into the damage inversion fitting formula, an inversion fitting value of the peak point of the mid-span damage entropy value of 3.316 × 10⁻¹⁰ can be obtained. Working condition 14 shows a measured deflection influence line entropy value of 3.217 × 10⁻¹⁰.
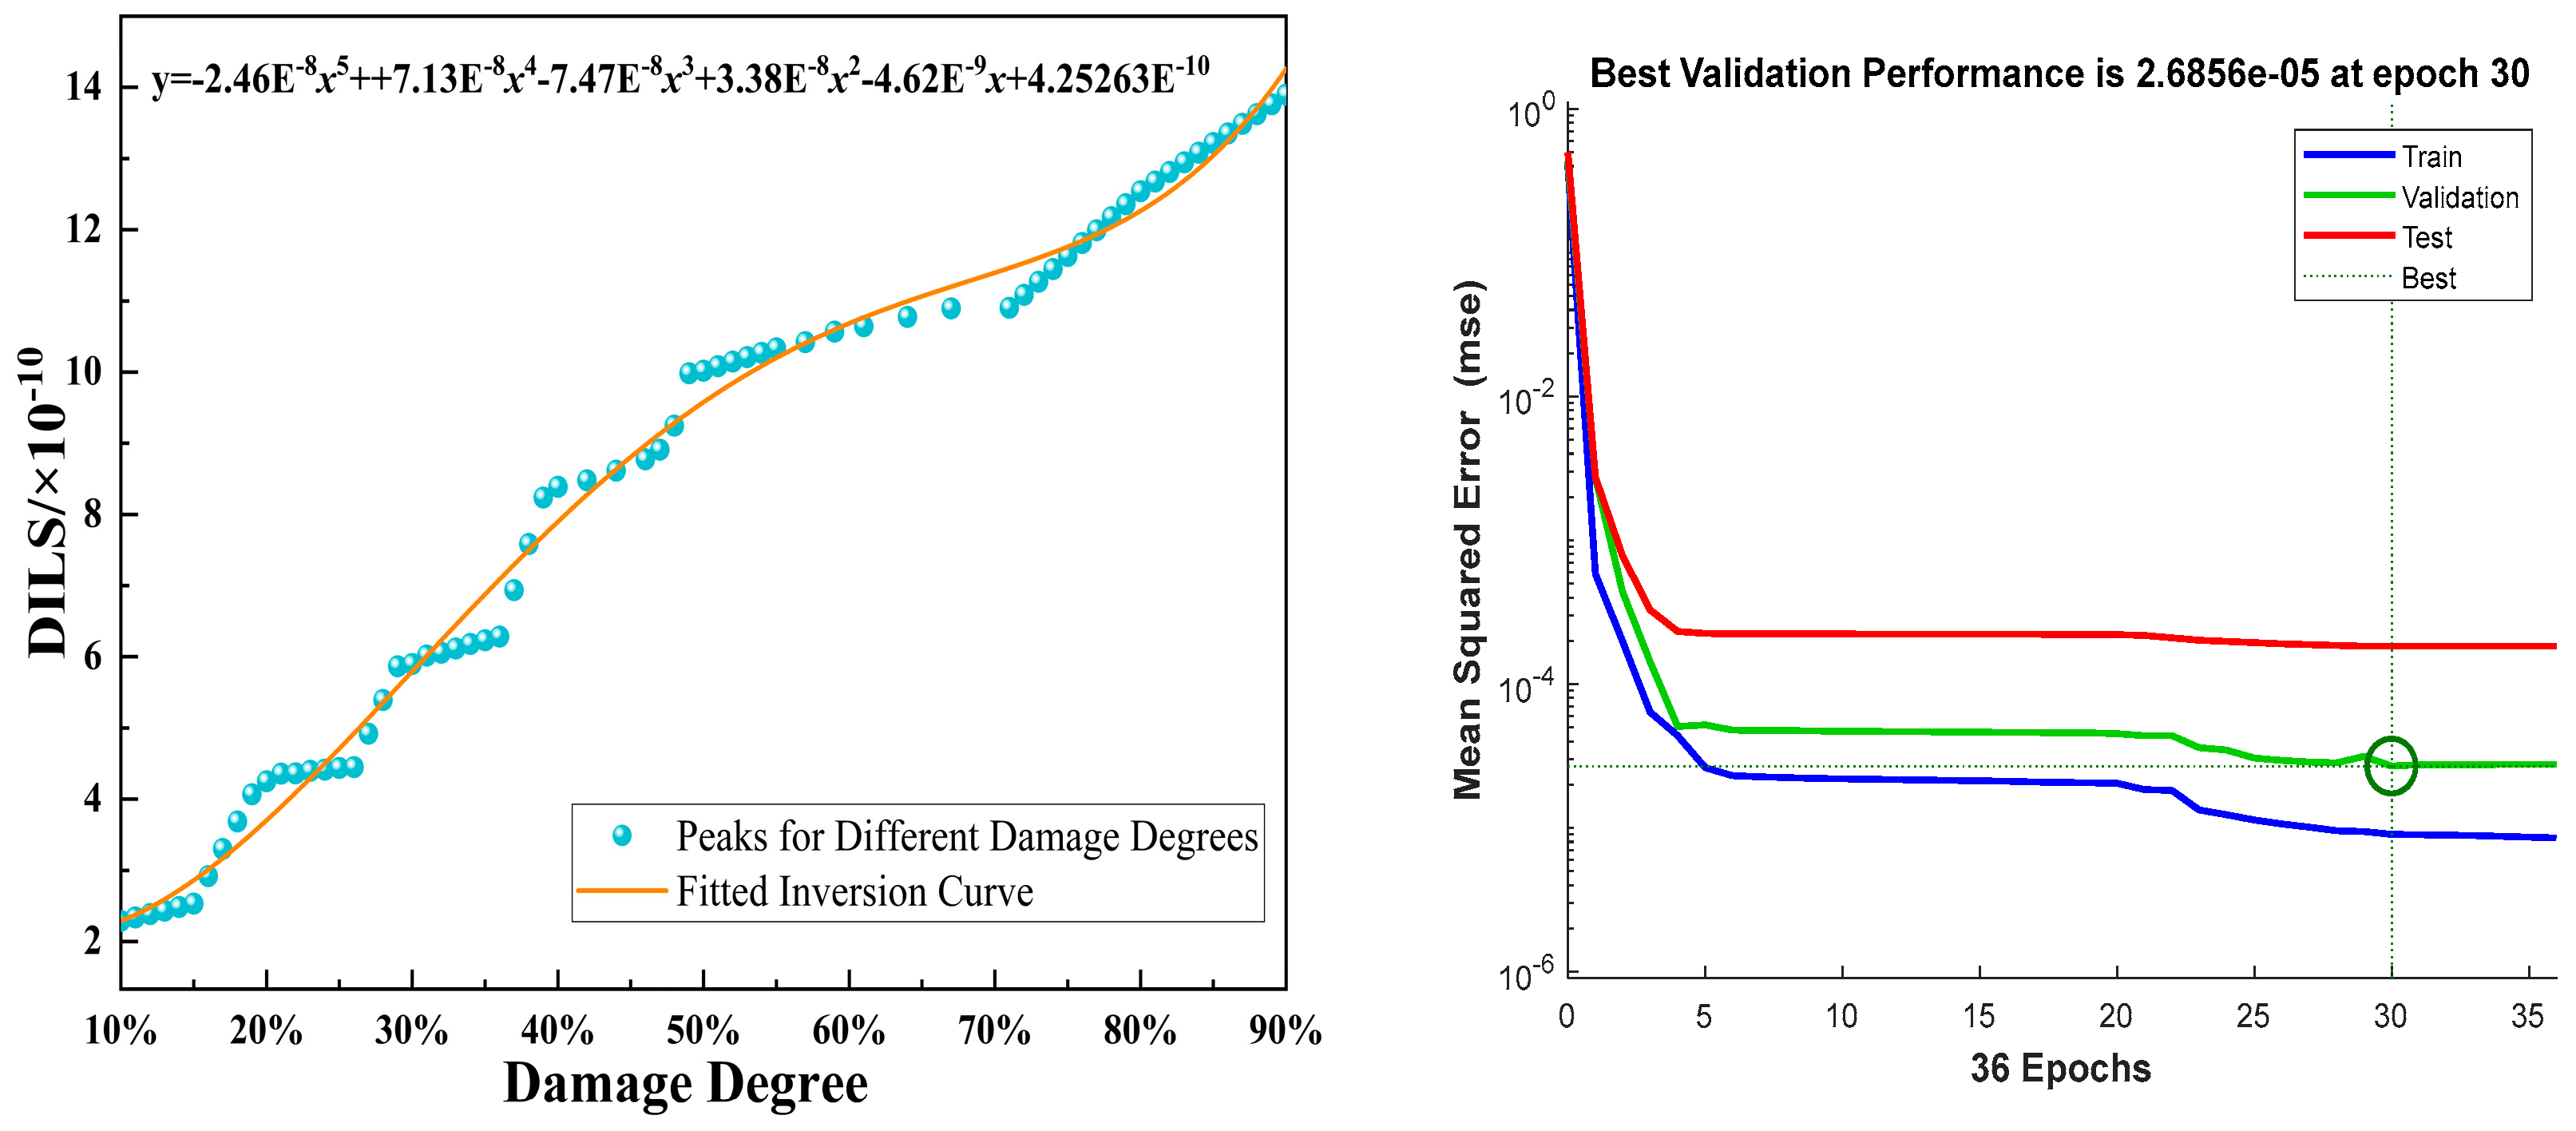
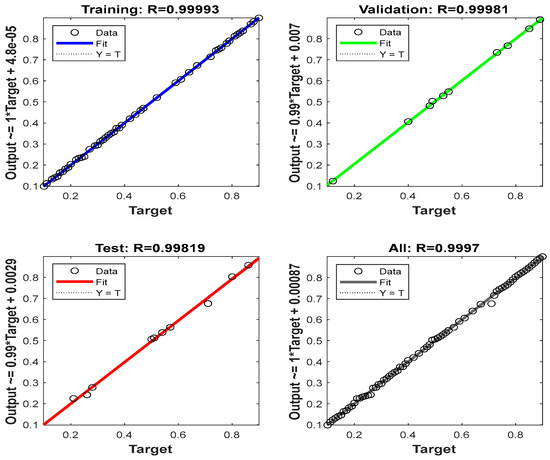
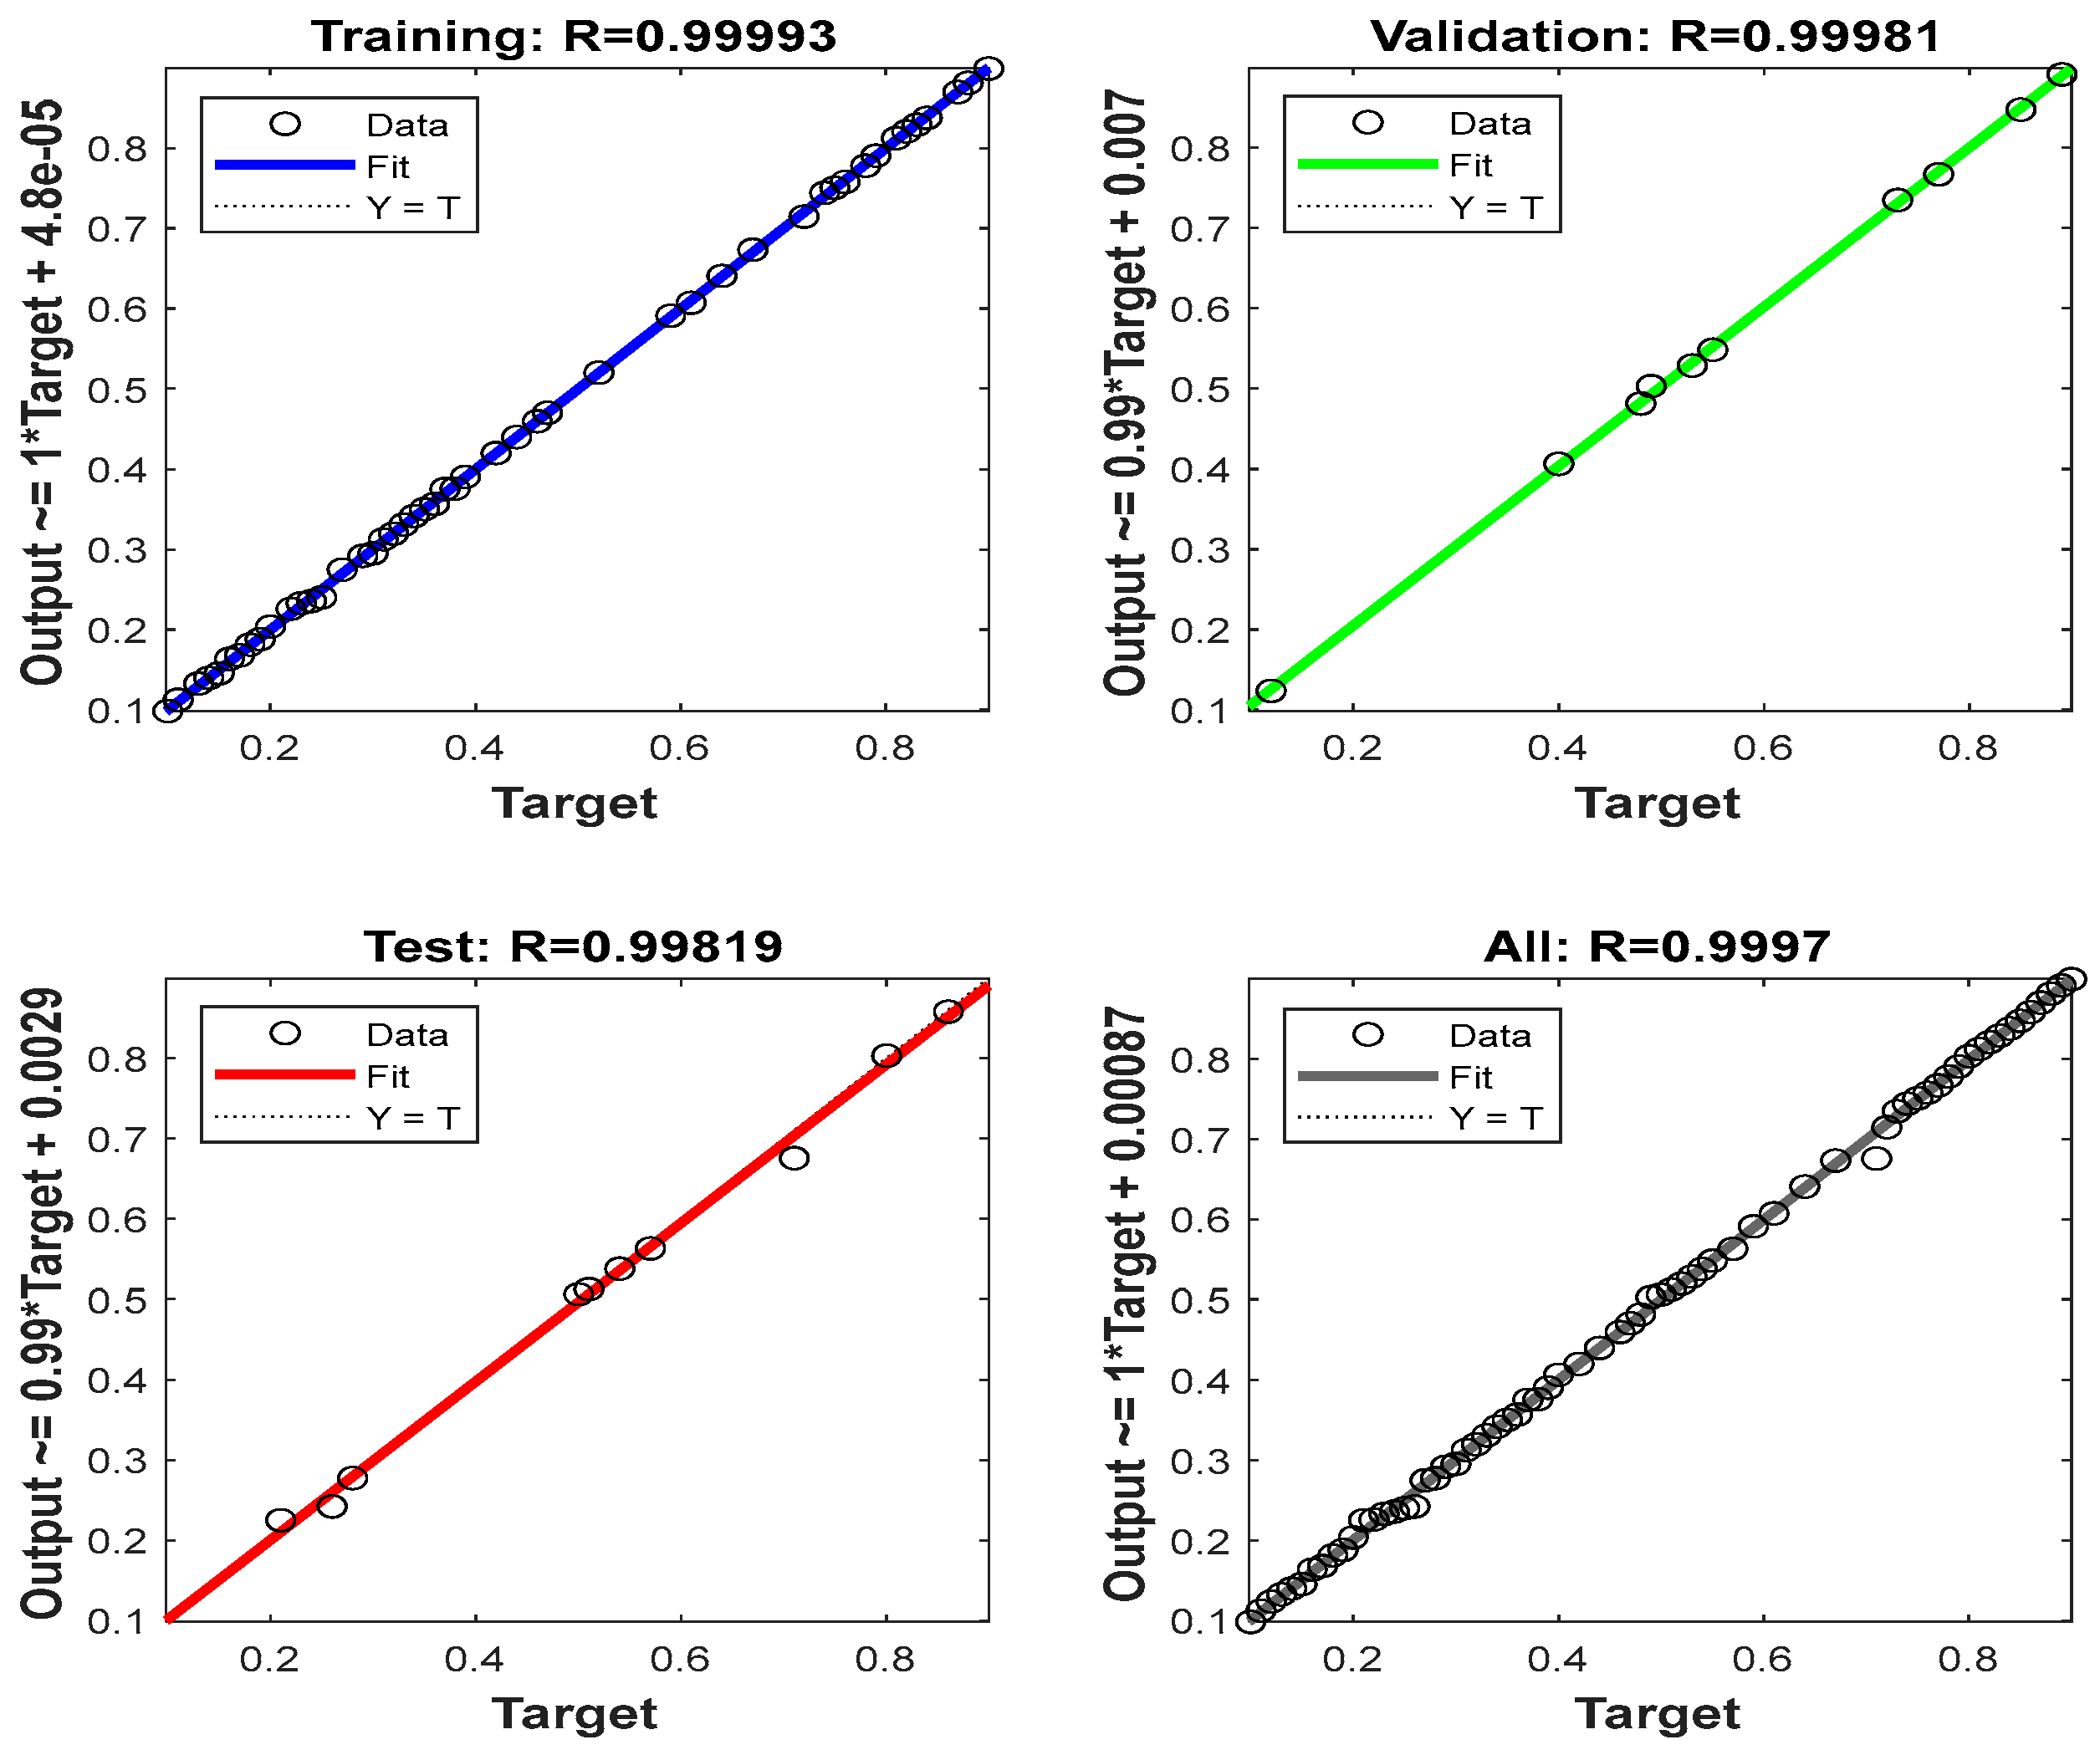
The improved PSO-BP neural network is trained by 68 training sets and 20 test sets. The sample set include 68 samples, divided into a training set, test set, and validation set (70%, 15%, 15%). The model structure is adopted, where the input layer is the curvature entropy of the influence line difference, the output layer is the damage degree, and the number of hidden layers is obtained according to an empirical formula and multiple rounds of debugging. The measured data of the deflection influence line of the cable-stayed bridge is verified, and the error is verified with the damage inversion fitting formula. The results show a security performance index of the beam structure of 96.73%, indicating safe operation of the cables of the low-pylon cable-stayed bridge with a classic three-span corrugated steel web–PC composite box girder. The target prediction results are shown in Figure 16.
Figure 16.
Result diagram of target prediction.
5.5. Robustness Analysis Under Environmental Changes
In practical engineering applications, the structural response of cable-stayed bridges is inevitably affected by changes in environmental and operational conditions, such as noise and temperature variations. To verify the stability and robustness of the proposed method for assessing the safety condition of stay cables based on the information entropy of deflection influence lines under complex environmental conditions, two types of environmental disturbances, namely noise and equivalent temperature variations, are further introduced on the basis of Section 5.1, Section 5.2, Section 5.3 and Section 5.4 for comparative analysis.
In actual deflection monitoring, sensor accuracy and environmental interference may introduce random noise. To evaluate the robustness of the proposed method to measurement errors, Gaussian white noise with a root mean square of 5% is superimposed on the deflection time-history response under condition 1 to simulate actual monitoring conditions. Subsequently, using the same data processing procedure as the baseline condition, the noisy response is subjected to variational mode decomposition to attenuate dynamic perturbations, and regularization is applied to mitigate the multi-axle effect of vehicles, thereby reconstructing the deflection influence line. Based on this, the curvature entropy index of the deflection influence line difference is extracted and compared. It was found that at a 5% noise level, the inversion results of damage severity only exhibited slight fluctuations, which did not affect the overall judgment of damage location and extent. This indicates that the method has good anti-interference capability against moderate measurement noise.
To assess the impact of temperature effects on the proposed method, a condition of an equivalent temperature increase of 5 °C is introduced into the theoretical model of condition 1. The structural elastic modulus is adjusted to simulate the stiffness changes caused by temperature rise, and based on this, the deflection response and its influence line are recalculated. Under the same data processing and feature extraction process, the curvature entropy index of the deflection influence line difference curve for temperature change conditions is analyzed. It was found that the overall stiffness changes solely caused by temperature rise did not produce significant damage characteristics in the entropy index, and the damage identification results remained consistent with the baseline condition, indicating that the index has a certain robustness to temperature changes.
Based on the aforementioned research, it can be concluded that the proposed method for assessing the safety status of stay cables, which is based on the information entropy of deflection influence lines, exhibits good robustness even in the presence of typical environmental disturbances. This method demonstrates high sensitivity to cable damage, while being relatively insensitive to noise and temperature variations at the practical engineering level. Consequently, it effectively reduces the risk of interference from environmental factors on damage identification results, providing reliable support for its promotion and application in the health monitoring and safety assessment of actual cable-stayed bridges. The robustness verification results of environmental impact are shown in Figure 17.
Figure 17.
Robustness verification results under environmental changes.
6. Discussions
6.1. Discussion on the Effectiveness and Engineering Applicability of the Information-Entropy Index of the Influence Line of Displacement
The cable evaluation method based on the information entropy of the influence line of displacement proposed in this paper has demonstrated remarkable advantages in coping with long-term safety evaluation of cable-stayed bridges, with the core of the method being the transformation of the subtle alteration of structural static behaviors derived from cable damage into a quantifiable and robust entropy index through the curvature of the influence line difference. Conventional modal parameter methods are typically environment-affected, while the deflection influence line is able to reduce the interference of the dynamic environmental noise through extraction and analysis by virtue of its static feature of the structure under the moving unit load. Using variational modal decomposition, the measured time-history response is processed to further strengthen this advantage and effectively separates the quasi-static influence line curve from the dynamic disturbance, which is crucial for the reliable application of field data.
The effectiveness of the information entropy index is mainly attributed to its ability to amplify and quantify local damage-induced anomalies. The lost cable stiffness changes the load transfer path inside the bridge structure, resulting in local distortion of the influence line of displacement of the corresponding beam segment. The deflection differential curvature, highly sensitive to such local change, has therefore become a favorable damage index. There is a standardized scalar during the process of transforming the curvature into an information-entropy measurement, aiming to measure the damage-induced degree of disorder or irregularity. It not only enhances the contrast between healthy state and injured state but also provides a stable basis for comparative analysis of different injury positions and degrees. The results of the measured data show the index’s capability of accurately locating the damaged cables and a quantifiable correlation with the damage degree, meeting the core requirements of damage identification.
This method has several practical advantages for engineering practice. First, non-contact continuous deflection monitoring is simpler and more economical than a cable tension or large-scale health monitoring system. Second, the entropy index-based damage inversion formula serves as a direct tool for preliminary quantitative evaluation in engineering practice. Finally, the integration of an improved PSO-BP neural network model can achieve an automatic and intelligent safety evaluation framework, which is crucial for health monitoring of modern bridge structures. However, its applicability relies on the quality of the extracted influence line, and the comparison with the benchmark (healthy state) model, requiring finite element model calibration or benchmark data collection at the initial stage of bridge operation.
6.2. Discussion on the Feasibility of Moving Towards Multi-Source Information Fusion
Despite the favorable prospect of the entropy method of the influence line of displacement as an independent index, multi-source information fusion should be considered due to the complexity of bridge degradation and the demand for higher reliability of safety-state evaluation. The results of this study have laid a solid foundation for such an integrated framework, with ongoing research on influence line entropy monitoring based on multi-source information fusion needed.
The proposed entropy index is a feature-level fusion, compressing the spatial information of deflection influence line curvature into a single damage-sensitive parameter and creating a compatible and low-dimensional feature, which is suitable for fusion with other data streams. It is highly feasible to extend this method to extensive multi-source fusion systems, such as strain influence line, corner influence line and bearing reaction influence line. A common basis for the establishment of multi-modal information fusion association can also be provided through global or local monitoring data (such as cable vibration frequency, environmental vibration mode or corrosion distribution map).
With the ability to adapt to multi-input architecture, the PSO-BP network-based intelligent evaluation framework can be retrained or extended to include additional input features besides entropy index, such as normalized cable-to-cable ratio, modal frequency shift or influence line value, thereby creating a more comprehensive damage index to improve the accuracy of damage location quantification and even classification. The output of the neural network, such as the damage probability or state rating of a cable, can be integrated with the conclusions of other independent evaluation modules, and frameworks such as D-S evidence theory or Bayesian reasoning can be adopted, thereby enhancing the confidence level and reducing false positives.
Research should shift its focus from method verification to deep optimization of fusion decision-making mechanisms in the future. Specifically, efforts should be made to establish a hybrid fusion framework to integrate the functions of dynamic weight distribution and intelligent threshold setting based on stability indicators such as deflection influence line entropy. The ultimate goal is to make the system not only “perceive” anomalies but also “evaluate” the credibility and urgency of anomalies, thereby providing truly accurate, reliable and operable intelligent support for the health monitoring of bridge structures.
6.3. Discussion on the Future Evolution Direction of Intelligent Inversion Models
In the damage inversion and safety assessment phase of this paper, the PSO–BP neural network is employed as the nonlinear mapping model. PSO–BP is a relatively mature shallow learning method that has been widely used in the fields of structural health monitoring and engineering fault diagnosis in recent years. However, we also fully recognize that with the development of deep learning technology, models for time series and tabular data, such as Transformer-based attention mechanism models, Temporal Convolutional Networks, TabTransformer, and TabNet, have demonstrated significant advantages in automatic feature extraction and cross-scenario generalization capabilities.
Existing research has shown that in the task of automatic fault detection and diagnosis (AFDD) for building energy systems and heating, ventilation, and air conditioning (HVAC) systems, models based on Transformers and attention mechanisms can effectively capture long-term dependencies and maintain good generalization performance in cross-building transfer learning scenarios. For instance, related studies have verified the effectiveness of Transformer-based methods and attention-based AFDD models in complex condition recognition based on long-term operational data from hospitals, auditoriums, and office buildings in real-world operating environments. These studies provide important insights into time series-driven structural and equipment condition assessment [28,29,30,31].
The existing research is based on single deflection influence line data with a small sample size, and the PSO-BP network model is suitable for this purpose. If the discussion on the feasibility of moving towards multi-source information fusion in Section 6.2 develops rapidly in future research and expands beyond the current field of bridge structural health research, we believe that the aforementioned model has propelling significance for research development.
7. Conclusions
In the context of a cable-stayed bridge across Huaihe River, this paper effectively identifies the location and degree of cable damage of the cable-stayed bridge based on the theory of deflection influence line difference curvature and information entropy and proposes deflection influence line difference curvature entropy as a new index to further optimize the damage identification effect. Through the field-measured influence line data, the dynamic disturbance in the deflection time-history response is removed by wavelet transform, the measured influence line of the bridge is extracted, and the safety evaluation of the stay cables of this cable-stayed bridge is carried out by using the inverse fitting formula. The following conclusions are obtained:
(1) The differential curvature of the deflection influence line can effectively verify the cable position and quantitative damage degree of stayed cable damage. The damage position can be effectively located and the damage degree can be quantified using the peak point of differential curvature under the condition of single-cable or multiple-cable plane damage. However, more clutter around the damage location easily interferes with the damage identification effect.
(2) To eliminate the interference near the damage location, information-entropy theory is introduced to measure the information order. A new index of the curvature entropy the of deflection influence line difference is established to enhance the confidence of the peak point of the damage location, remove the clutter near the damage location and improve the accuracy of damage identification.
(3) Using the variational modal decomposition method, the dynamic disturbance can be accurately removed and the influence line of displacement when the loaded vehicle crosses the bridge can be restored, with favorable effectiveness and extensive applicability. The cable security of a cable-stayed bridge in engineering practice can be verified by extracting the peak value of the curvature entropy of the deflection influence line difference for inverse fitting and substituting the measured deflection influence line data into the inverse fitting formula. Meanwhile, the robustness of the model under environmental changes is verified, demonstrating extensive applicability for the security evaluation regarding cable damage of the cable-stayed bridge.
Author Contributions
Conceptualization, B.W.; Formal analysis, D.Z.; Methodology, B.W.; Writing—original draft, D.Z.; Software, D.Z., Y.L. and Z.G.; Validation, D.Z.; Writing—review and editing, Y.L. All authors have read and agreed to the published version of the manuscript.
Funding
This research was funded by the Deep Earth Probe and Mineral Resources Exploration-National Science and Technology Major Project (Grant numbers:2024ZD1004103) and Jiangsu Provincial Innovation Capacity Building Program (Grant numbers: BM2022009 and BM2023017).
Data Availability Statement
The raw data supporting the conclusions of this article will be made available by the authors on request.
Conflicts of Interest
The authors declare no conflicts of interest.
Nomenclature
| Abbreviation | Terms |
| SHM | Structural Health Monitoring |
| DIL | Deflection Influence Line |
| DILDC | Deflection Influence Line Difference Curvature |
| DILS | Deflection Influence Line Entropy Index |
| VMD | Variational Mode Decomposition |
| IMF | Intrinsic Mode Function |
| PSO | Particle Swarm Optimization |
| BP | Backpropagation Neural Network |
| PSO-BP | PSO-optimized BP Neural Network |
References
- Wang, N.B.; Wang, C.; Zhou, H.; Zuo, Q. A novel extraction method for the actual influence line of bridge structures. J. Sound Vib. 2023, 553, 117605. [Google Scholar] [CrossRef] [Scilit]
- Khuc, T.; Catbas, F.N. Structural identification using computer vision–based bridge health monitoring. J. Struct. Eng. 2018, 144, 04017202. [Google Scholar] [CrossRef] [Scilit]
- Si, J.; Zhu, L.; Ma, W.; Meng, B.; Dong, H.; Ning, H.; Zhao, G. Study on vibration and noise of railway steel–concrete composite box girder bridge considering vehicle–bridge coupling effect. Buildings 2024, 14, 2509. [Google Scholar] [CrossRef] [Scilit]
- He, W.Y.; Li, Z.D.; Zhou, L.; Ren, W.X.; Li, Y. The effect of environmental temperature on influence line of concrete beam type bridge. Structures 2023, 48, 1468–1478. [Google Scholar] [CrossRef] [Scilit]
- Wang, N.B.; Shen, W.; Guo, C.R.; Wan, H.P. Moving load test-based rapid bridge capacity evaluation through actual influence line. Eng. Struct. 2023, 252, 113630. [Google Scholar] [CrossRef] [Scilit]
- Wu, K.; Wang, L.; Ge, W.; Shu, H.; Liu, Y.; Chen, K. Research on vehicle–bridge-coupled vibration of multi-tower high-pier partially cable-stayed bridge based on a single vehicle. Buildings 2025, 15, 2865. [Google Scholar] [CrossRef] [Scilit]
- Li, O.; Shi, G.; Wang, B.; Zhao, C.X. Technical condition inspection of stay cables in service bridges. World Bridges 2017, 45, 79–83. [Google Scholar]
- Lin, Y.Z.; You, M.Z.; Li, C.Z. Application of non-destructive testing technology for internal corrosion and broken wires of bridge cables. Highw. Transp. Technol. (Appl. Technol. Ed.) 2013, 9, 98–100. [Google Scholar]
- Zheng, G.; Ni, Y.Q.; Gao, Z.M. Theory and application of cable tension measurement and parameter evaluation for cable-stayed bridges. China Civ. Eng. J. 2005, 38, 64–69. [Google Scholar]
- Yuan, L.F. Cable Force Monitoring and Bridge Condition Assessment Analysis of Cable-Stayed Bridges; Southeast University: Nanjing, China, 2017. [Google Scholar]
- Chen, S.S.; Sun, B.N. Nonlinear resonance response characteristics of modal coupling in stay cables of cable-stayed bridges. Eng. Mech. 2003, 20, 137–143. [Google Scholar]
- Yang, Y.X. Research on Damage Identification Method of Stay Cables in Cable-Stayed Bridges Based on Girder Deflection; Shijiazhuang Tiedao University: Shijiazhuang, China, 2025. [Google Scholar]
- Li, H.; Ou, J.P. Design and implementation of structural health monitoring systems for cable-stayed bridges (II): System implementation. China Civ. Eng. J. 2006, 39, 45–53. [Google Scholar]
- Li, S.L. Research on Condition Assessment and Early Warning Methods of Bridge Structures Based on Health Monitoring Technology; Harbin Institute of Technology: Harbin, China, 2009. [Google Scholar]
- Weng, S.L. Research and Development of Health Monitoring and Assessment System for Wenhui Bridge; Zhejiang University: Hangzhou, China, 2004. [Google Scholar]
- Xiang, C.S.; Shi, H.; Yang, R. Research on bridge damage identification method based on modal frequency strain energy entropy and Tent–SSA–BP neural network. Highway 2023, 68, 143–150. [Google Scholar]
- Chen, Z.W.; Yang, W.B.; Li, J.; Yi, T.; Wu, J.; Wang, D. Bridge influence line identification based on adaptive B-spline basis dictionary and sparse regularization. Struct. Control Health Monit. 2019, 26, e2355. [Google Scholar] [CrossRef] [Scilit]
- He, W.Y.; Ren, W.X.; Zhu, S. Damage detection of beam structures using quasi-static moving load induced displacement response. Eng. Struct. 2017, 145, 70–82. [Google Scholar] [CrossRef] [Scilit]
- Zhou, Y.; Zhang, D.W.; Di, S.K. Research on damage diagnosis method of beam bridges based on multi-source influence line information fusion. China Earthq. Eng. J. 2024, 46, 1300–1310. [Google Scholar]
- Zhang, D.W.; Li, M. Research on damage identification method of cable-stayed bridges based on generalized flexibility curvature entropy. J. Anyang Inst. Technol. 2023, 22, 88–92. [Google Scholar]
- Zheng, Y.; Zheng, Y.; Deng, R.J.; He, Q.; He, G.J. Bridge monitoring signal denoising method based on CPO-VMD coupled improved wavelet threshold. J. Vib. Shock. 2026, 45, 115–125. [Google Scholar]
- Chen, Z.W.; Yang, W.B.; Cheng, Q.F. Bridge influence line identification method based on regularization and B-spline curve. China J. Highw. Transp. 2019, 32, 101–108. [Google Scholar]
- Wan, G.J.; Li, J.A.; Feng, D.M. Bridge influence line identification based on variational mode decomposition and piecewise polynomial truncated singular value decomposition. J. Zhejiang Univ. (Eng. Sci.) 2025, 59, 460–468. [Google Scholar]
- Li, X.; Luo, H.; Ding, P.; Chen, X.; Tan, S. Prediction study on the alignment of a steel-concrete composite beam track cable-stayed bridge. Buildings 2023, 13, 882. [Google Scholar] [CrossRef] [Scilit]
- Jing, Y.; Zhang, X.; Zhou, Y.; Zhao, Y.; Li, W. Dynamic response and impact force calculation of PC box girder bridge subjected to over-height vehicle collision. Buildings 2023, 13, 495. [Google Scholar] [CrossRef] [Scilit]
- Zhou, Y.; Li, M.; Shi, Y.D.; Xu, C.; Zhang, D.; Zhou, M. Research on damage identification of arch bridges based on deflection influence line analytical theory. Buildings 2024, 14, 6. [Google Scholar] [CrossRef] [Scilit]
- Shi, Y.; Wang, Y.; Wang, L.N.; Wang, W.N.; Yang, T.Y. Bridge cable performance warning method based on temperature and displacement monitoring data. Buildings 2025, 15, 2342. [Google Scholar] [CrossRef] [Scilit]
- Wang, S.; Eum, I.; Park, S.; Kim, J. A semi-labelled dataset for fault detection in air handling units from a large-scale office. Data Brief 2024, 57, 110956. [Google Scholar] [CrossRef] [Scilit]
- Wang, S. Real operational labeled data of air handling units from office, auditorium, and hospital buildings. Sci. Data 2025, 12, 1481. [Google Scholar] [CrossRef] [Scilit]
- Wang, S. Automated fault diagnosis detection of air handling units using real operational labelled data and transformer-based methods at 24-hour operation hospital. Build. Environ. 2010, 282, 113257. [Google Scholar] [CrossRef] [Scilit]
- Wang, S. Development of an automated transformer-based text analysis framework for monitoring fire door defects in buildings. Sci. Rep. 2025, 15, 43910. [Google Scholar] [CrossRef] [Scilit] [PubMed]

Disclaimer/Publisher’s Note: The statements, opinions and data contained in all publications are solely those of the individual author(s) and contributor(s) and not of MDPI and/or the editor(s). MDPI and/or the editor(s) disclaim responsibility for any injury to people or property resulting from any ideas, methods, instructions or products referred to in the content. |
© 2026 by the authors. Licensee MDPI, Basel, Switzerland. This article is an open access article distributed under the terms and conditions of the Creative Commons Attribution (CC BY) license.