


Abstract
To clarify the shear lag effect and flexural performance of glass fiber-reinforced polymer (GFRP) composite truss web girder bridges and verify the feasibility of substituting steel truss webs with GFRP members, a refined finite element (FE) model was established via ABAQUS. Transverse and longitudinal stress distributions in concrete slabs were systematically analyzed under mid-span concentrated, full-span distributed, and two-point symmetric loads, with a parallel performance comparison against steel truss web girder bridges. The transverse shear lag effect exhibited distinct interlayer differences, with the top slab effective width ratio 15–20% lower than that of the bottom slab; stress peaks at truss-slab joints stemmed from concentrated shear transfer, while bottom slab stress troughs were induced by boundary constraints. Longitudinally, the effective width ratio averaged 0.65 at beam ends, dropped to the minimum at loading points, and recovered to over 0.98 in non-loaded zones. Performance comparisons showed that under the applied load patterns, the GFRP system exhibited a flexural performance similar to that of the steel system, with mid-span deflection differences of 0.29–0.30 mm and normal stress deviations below 0.1 MPa. This study quantifies the multi-case shear-lag response characteristics, verifies that GFRP truss webs can achieve flexural behavior comparable to steel webs under the investigated conditions, and provides theoretical support for the refined design and engineering applications of this novel bridge structure.
1. Introduction
Structural spanning efficiency is significantly improved, and engineering self-weight is reduced, by substituting traditional concrete webs with truss-like members in composite truss web girder bridges. Consequently, remarkable technical and economic advantages are demonstrated in medium-span applications, leading to widespread adoption in recent global bridge construction. However, susceptibility to environmental corrosion is frequently observed in traditional steel truss members during long-term service. Cross-sectional weakening and increased maintenance costs are induced by this vulnerability, thereby constraining the sustainable development of this bridge type.
A novel avenue for truss member innovation is provided by the application of Fiber-Reinforced Polymer (FRP) owing to its superior corrosion resistance. Nevertheless, in complex structural systems such as thin-walled curved box girders, the shear lag phenomenon arises not only from material disparities between components but also from its coupling with torsional and distortional warping effects, resulting in a more intricate mechanical behavior [1]. Since investigations specifically focused on the shear lag effect in GFRP composite truss web girder bridges remain limited, a dedicated study of this phenomenon is deemed necessary.
Currently, global load-bearing capacity and joint details of composite truss web girder bridges have been extensively explored using experimental, finite element (FE), and analytical methods [2,3,4]; however, analyses of the shear lag effect have primarily focused on conventional vertical loading modes. Shih Toh Chang [5] investigated the shear lag effect under dead and live loads, deriving formulas for coefficients at various sections and calculating specific values; he also analyzed the influence of live load eccentricity. Liu et al. [6] noted that the discontinuous steel truss web members in composite girder bridges lead to distinctive shear lag behavior in the concrete slab, characterized by a wavelike stress distribution, stress concentrations at nodes, and alternating positive/negative shear lag effects. Zou et al. [7] proposed an analytical shear lag model applicable to materials including fiber-reinforced polymer (FRP) and concrete. Validated through the establishment of relevant finite element models for parameter-effect analysis, comparisons with existing empirical formulas, and T-beam tests on scaled models, the model accurately predicts the effective flange width of orthotropic bridge decks and offers broader applicability than existing empirical formulas. Chen et al. [8] investigated the shear lag effect of single-box multi-cell box girders with corrugated steel webs, defined the shear lag warping displacement function, and established the differential equations accounting for shear lag for single-box twin-cell and triple-cell girders via the energy variational method. Validated by comparing the finite element method (FEM) with the analytical method, the distribution law of shear lag under two types of loads was studied, and the influence of span-width ratio was analyzed. The results indicate that the analytical solution agrees well with the FEM solution (with modifications required at some key locations), and the shear lag coefficient was provided as a reference for the design of such box girders. Zheng et al. [9] used a 3D FE model to conduct a comparative study of corrugated steel web composite beams, finding significant shear lag effects in both top and bottom slabs under concentrated and distributed loads, with the effects more severe under concentrated loading. Zhou et al. [10] reported that a non-uniform profile is exhibited by the longitudinal normal stress distribution along the transverse flange direction due to shear lag. Additionally, Lei et al. [11] investigated the shear lag effect in simply supported and continuous systems under concentrated, two-point symmetric, and distributed loads, using theoretical derivations and FE validation to analyze the impact of structural geometric parameters.
As a critical mechanical characteristic of thin-walled composite structures, non-uniform stress distribution within the box girder may be induced by shear lag, potentially posing severe safety concerns that directly affect load-bearing efficiency and safety assessment. Current design codes often use simplified effective width ratios derived from conventional steel-concrete structures, which may not accurately capture the behavior of systems incorporating anisotropic materials such as GFRP. This gap underscores the need for a dedicated study to quantify the shear lag effect in GFRP truss web bridges, which is essential for their safe and economical design. Furthermore, by systematically comparing the performance with equivalent steel-truss bridges, this research aims to validate the structural feasibility of GFRP substitution and highlight its potential engineering advantages, such as weight reduction and enhanced durability, thereby providing directly applicable guidance for the design and promotion of this novel, corrosion-resistant bridge solution.
In this paper, a refined FE model of a GFRP composite truss web girder bridge is established. The distributions of transverse and longitudinal shear lag under three typical loading conditions—mid-span concentrated, full-span distributed, and two-point symmetric—are compared. Furthermore, a performance comparison between GFRP and steel truss web girder composite bridges is conducted, providing a theoretical basis for the engineering application of GFRP materials in composite bridge structures.
2. Finite Element Modeling
2.1. Model Overview
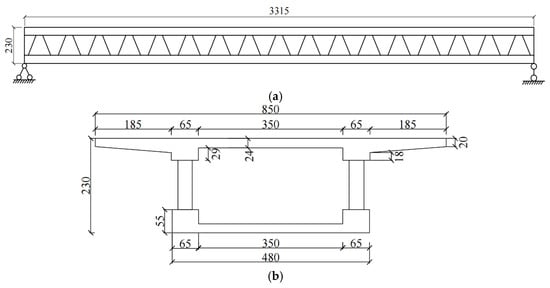
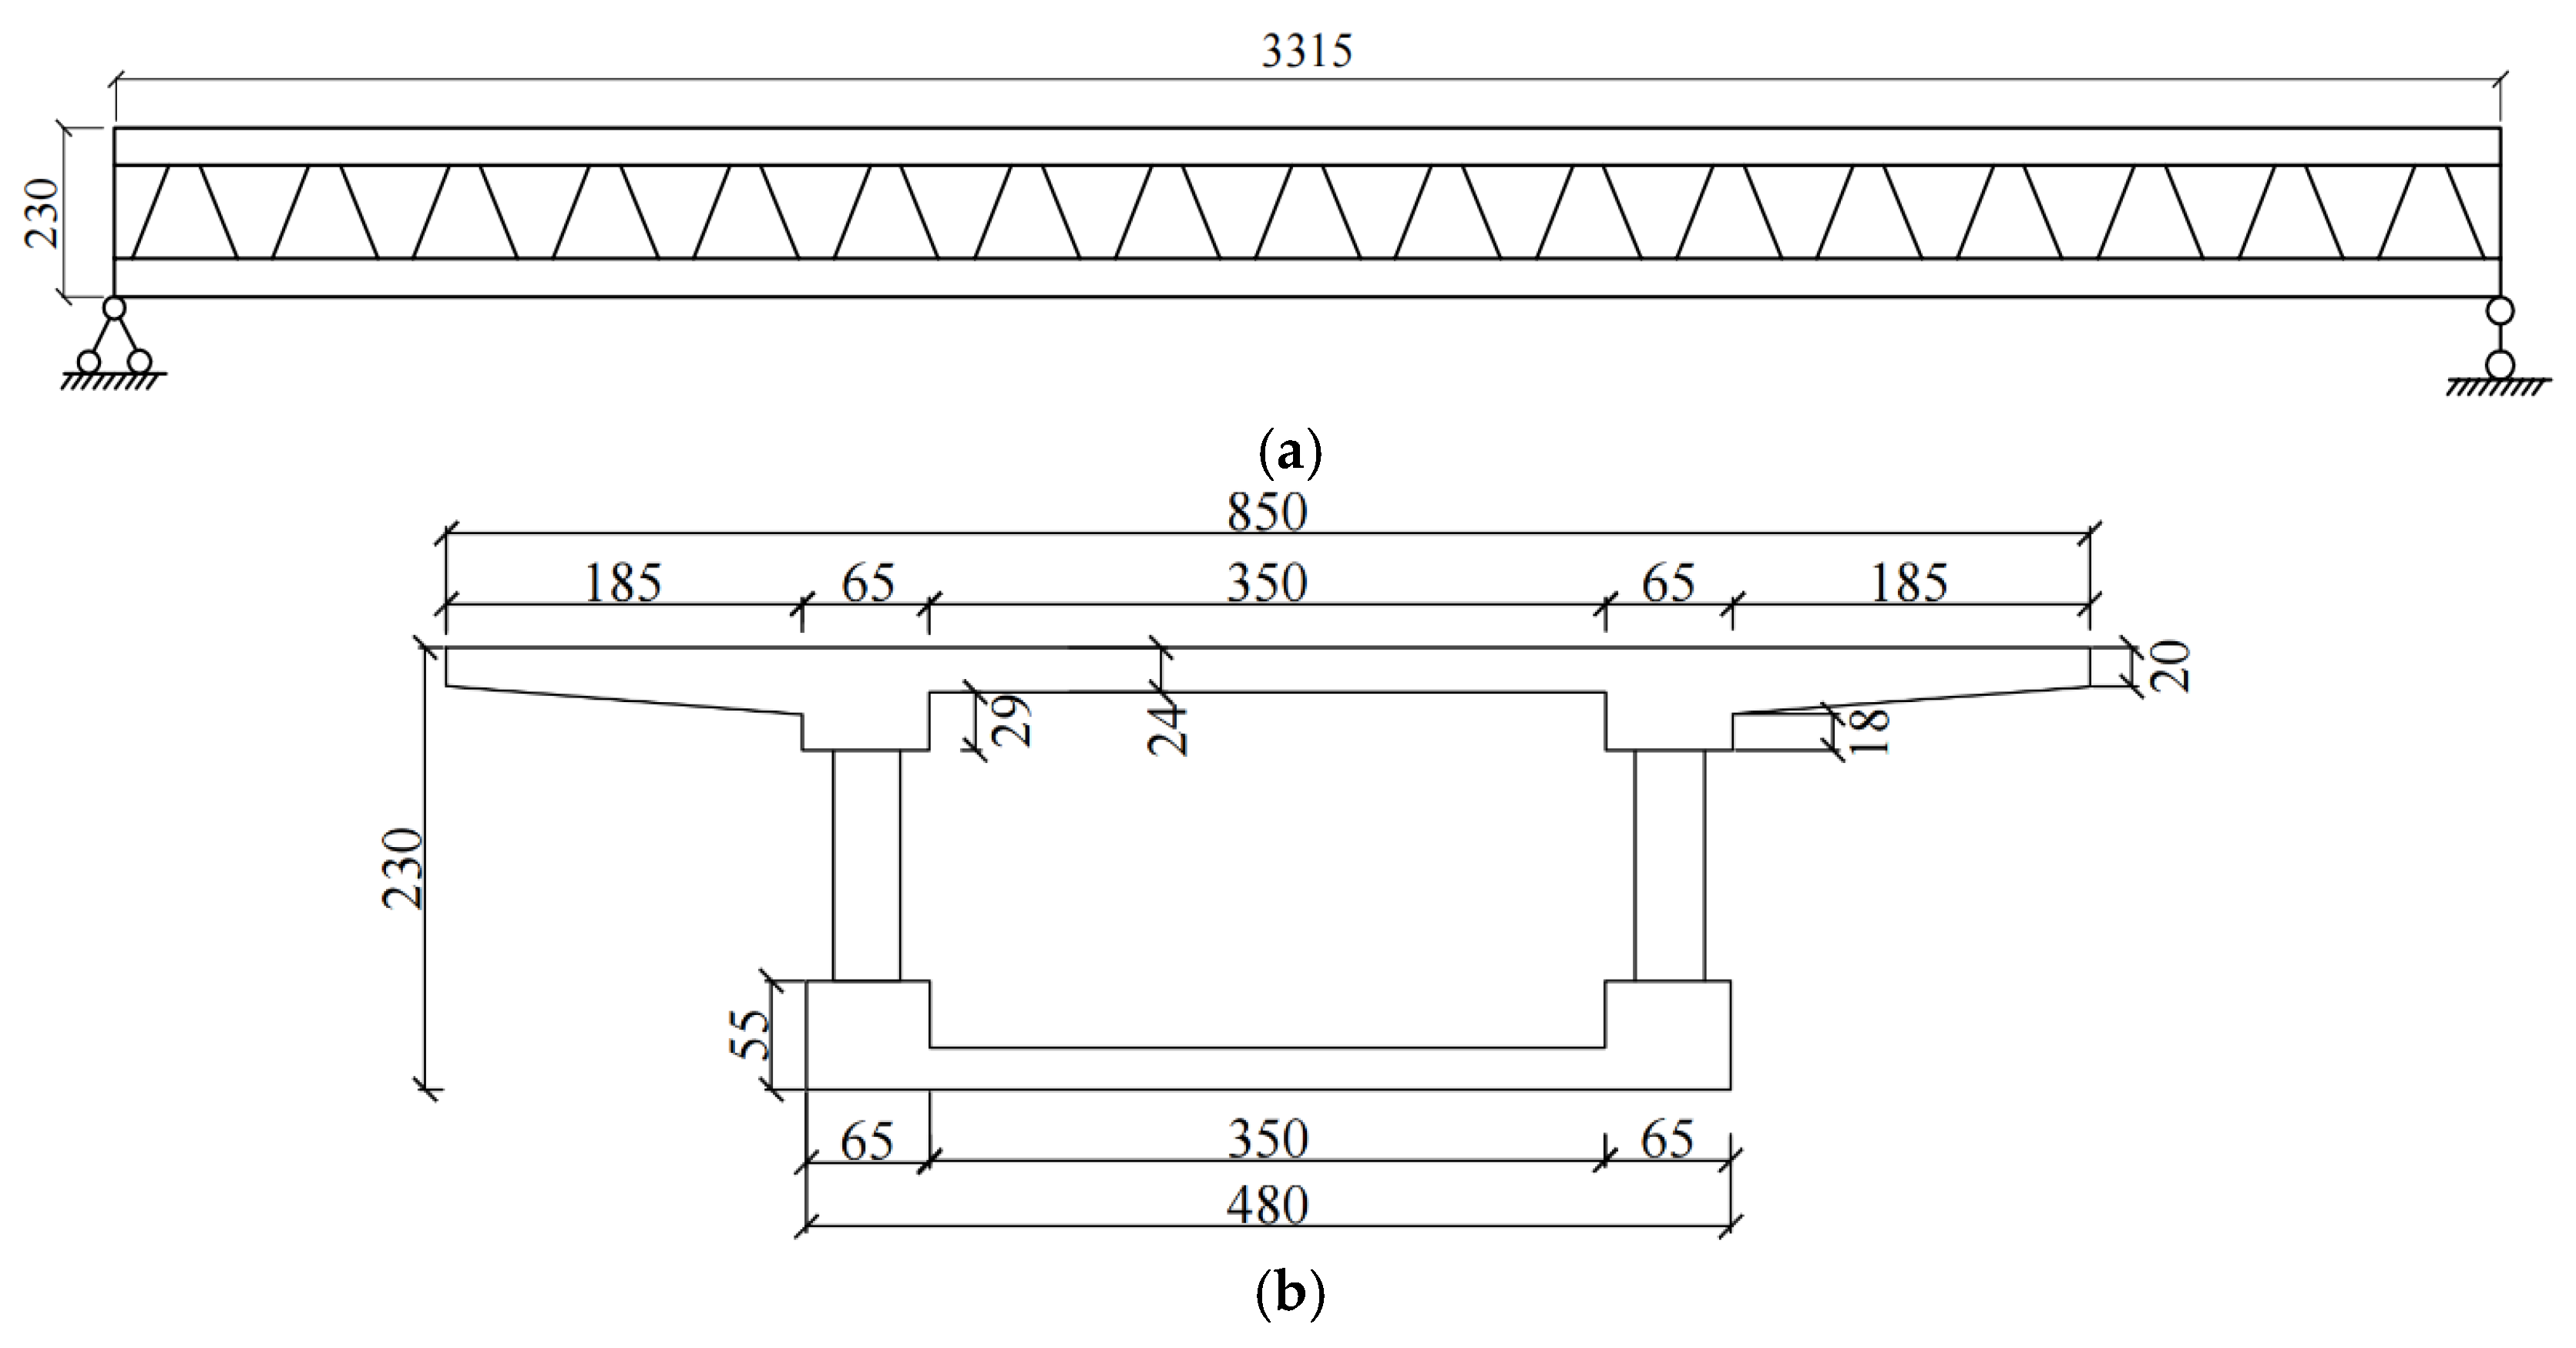
As illustrated in Figure 1, the elevation view and mid-span cross-sectional dimensions of the GFRP composite truss web girder bridge analyzed in this study are presented. A total span of 33.15 m is specified for the structure, characterized by a girder height of 2.3 m and concrete top and bottom slab widths of 8.5 m and 4.8 m, respectively. Regarding the GFRP truss members, an outer diameter of 351 mm, a wall thickness of 16 mm, an inclination angle of 67°, and an internode spacing of 1.95 m are adopted. Furthermore, during the model establishment, the interiors of the truss members are simulated as being fully filled with concrete.
Figure 1.
Dimensions of the GFRP Composite Truss Girder Bridge (Unit: cm). (a) Elevation view of the GFRP composite truss web girder bridge; (b) Mid-span cross-section.
2.2. Material Properties
2.2.1. Concrete Constitutive Model
The concrete used in this study is classified as C60, possessing an elastic modulus (E) of 3.6 × 10⁴ MPa and a Poisson’s ratio (ν) of 0.2. To represent the non-linear behavior of the concrete, the constitutive model provided in ABAQUS—based on the studies by Lubliner et al. and Lee and Fenves [12]—was adopted. The plasticity parameters for the concrete material are detailed in Table 1. The stress–strain relationships for compression and tension are illustrated in Figure 2 and Figure 3, which correspond to Equations (1) and (2), respectively.
where Ec denotes the elastic modulus of concrete; εc is set to 0.0025; k represents the plasticity index, calculated as Ec/fc; α is determined as 1.75 via linear interpolation; n is defined as ε/εc; and fc is the cubic compressive strength of concrete.
Figure 2.
Compressive stress–strain curve of concrete.
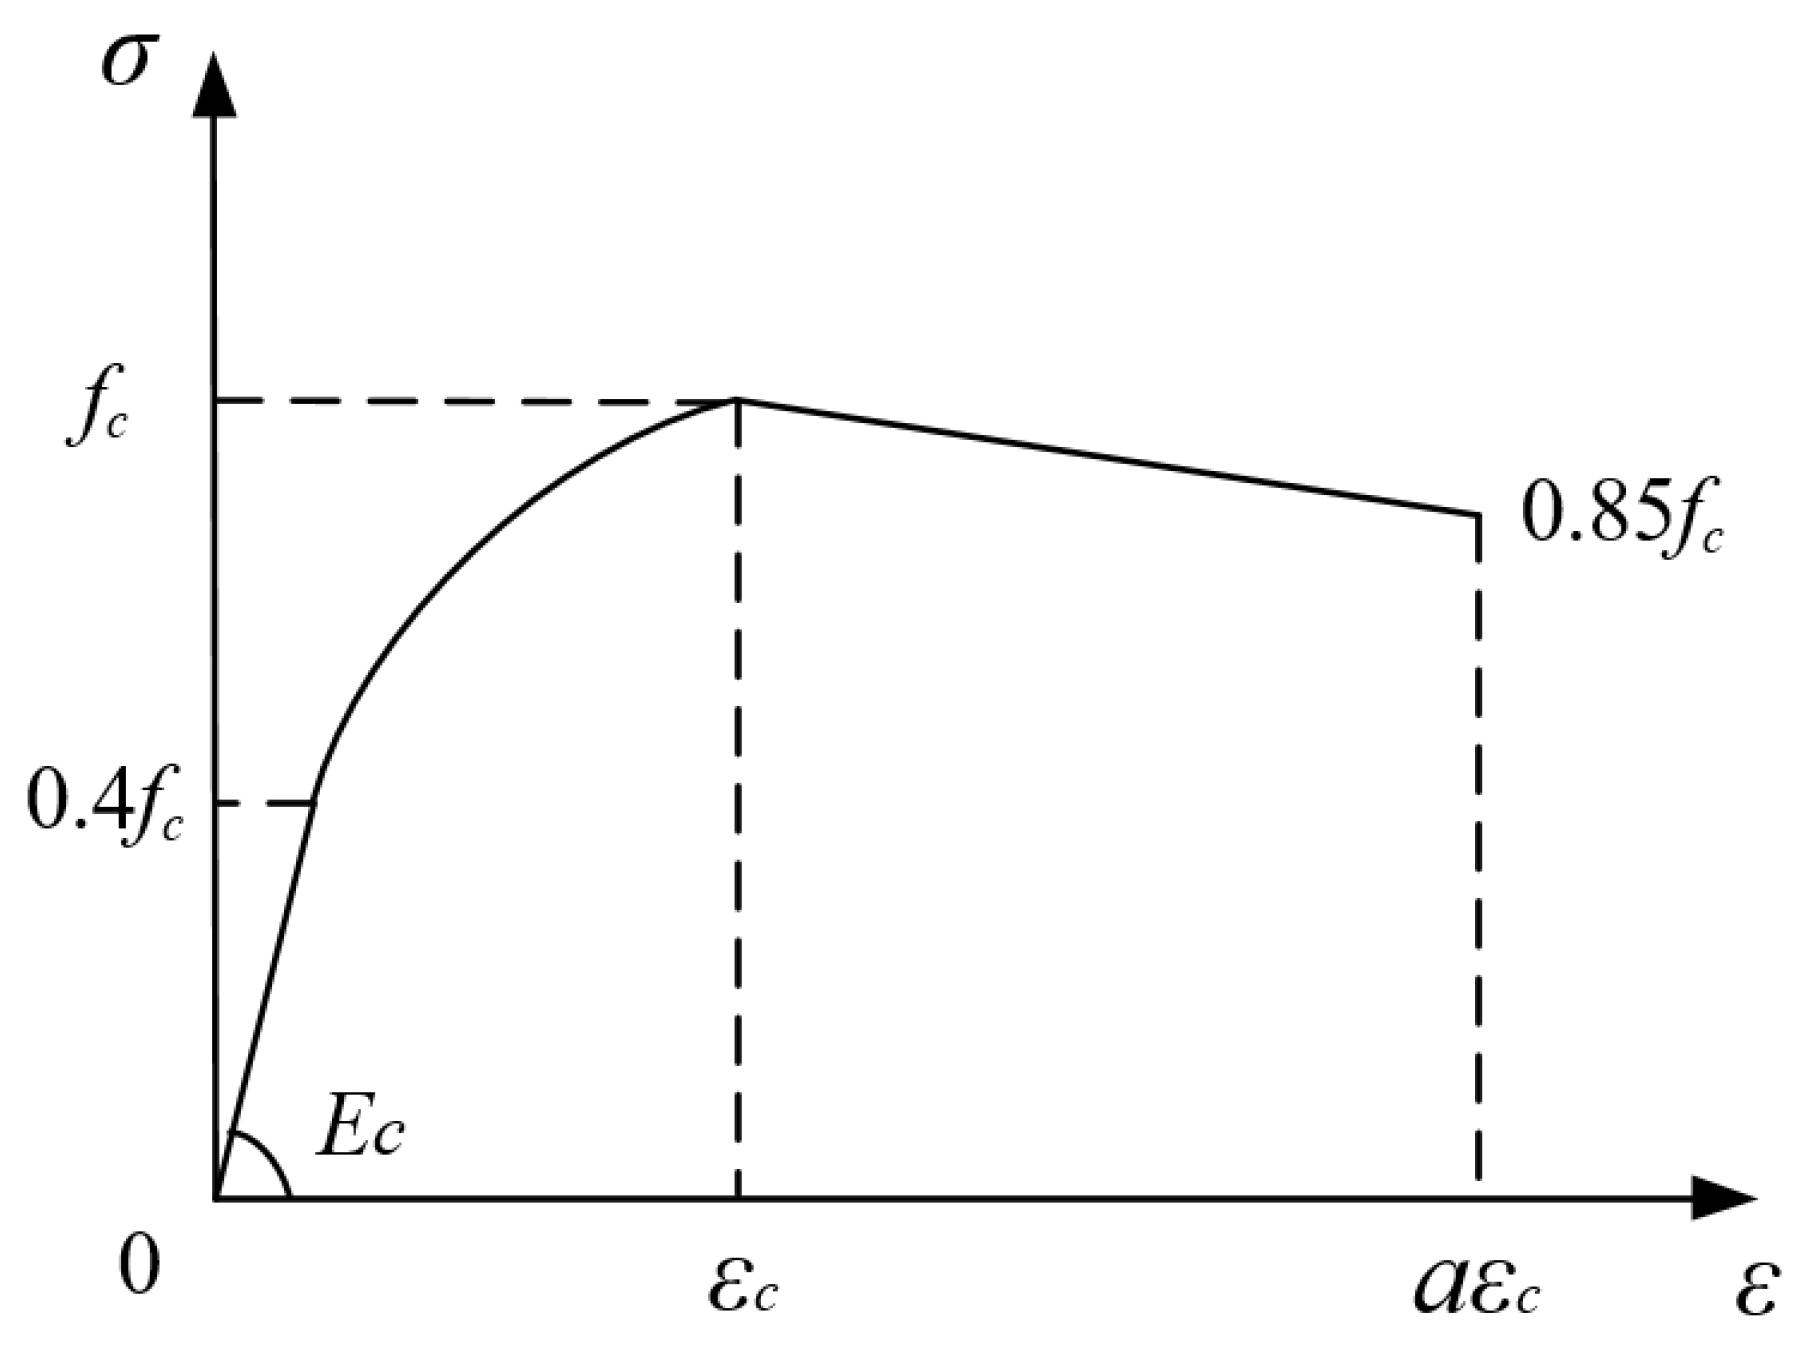
Figure 3.
Tensile stress–strain curve of concrete.
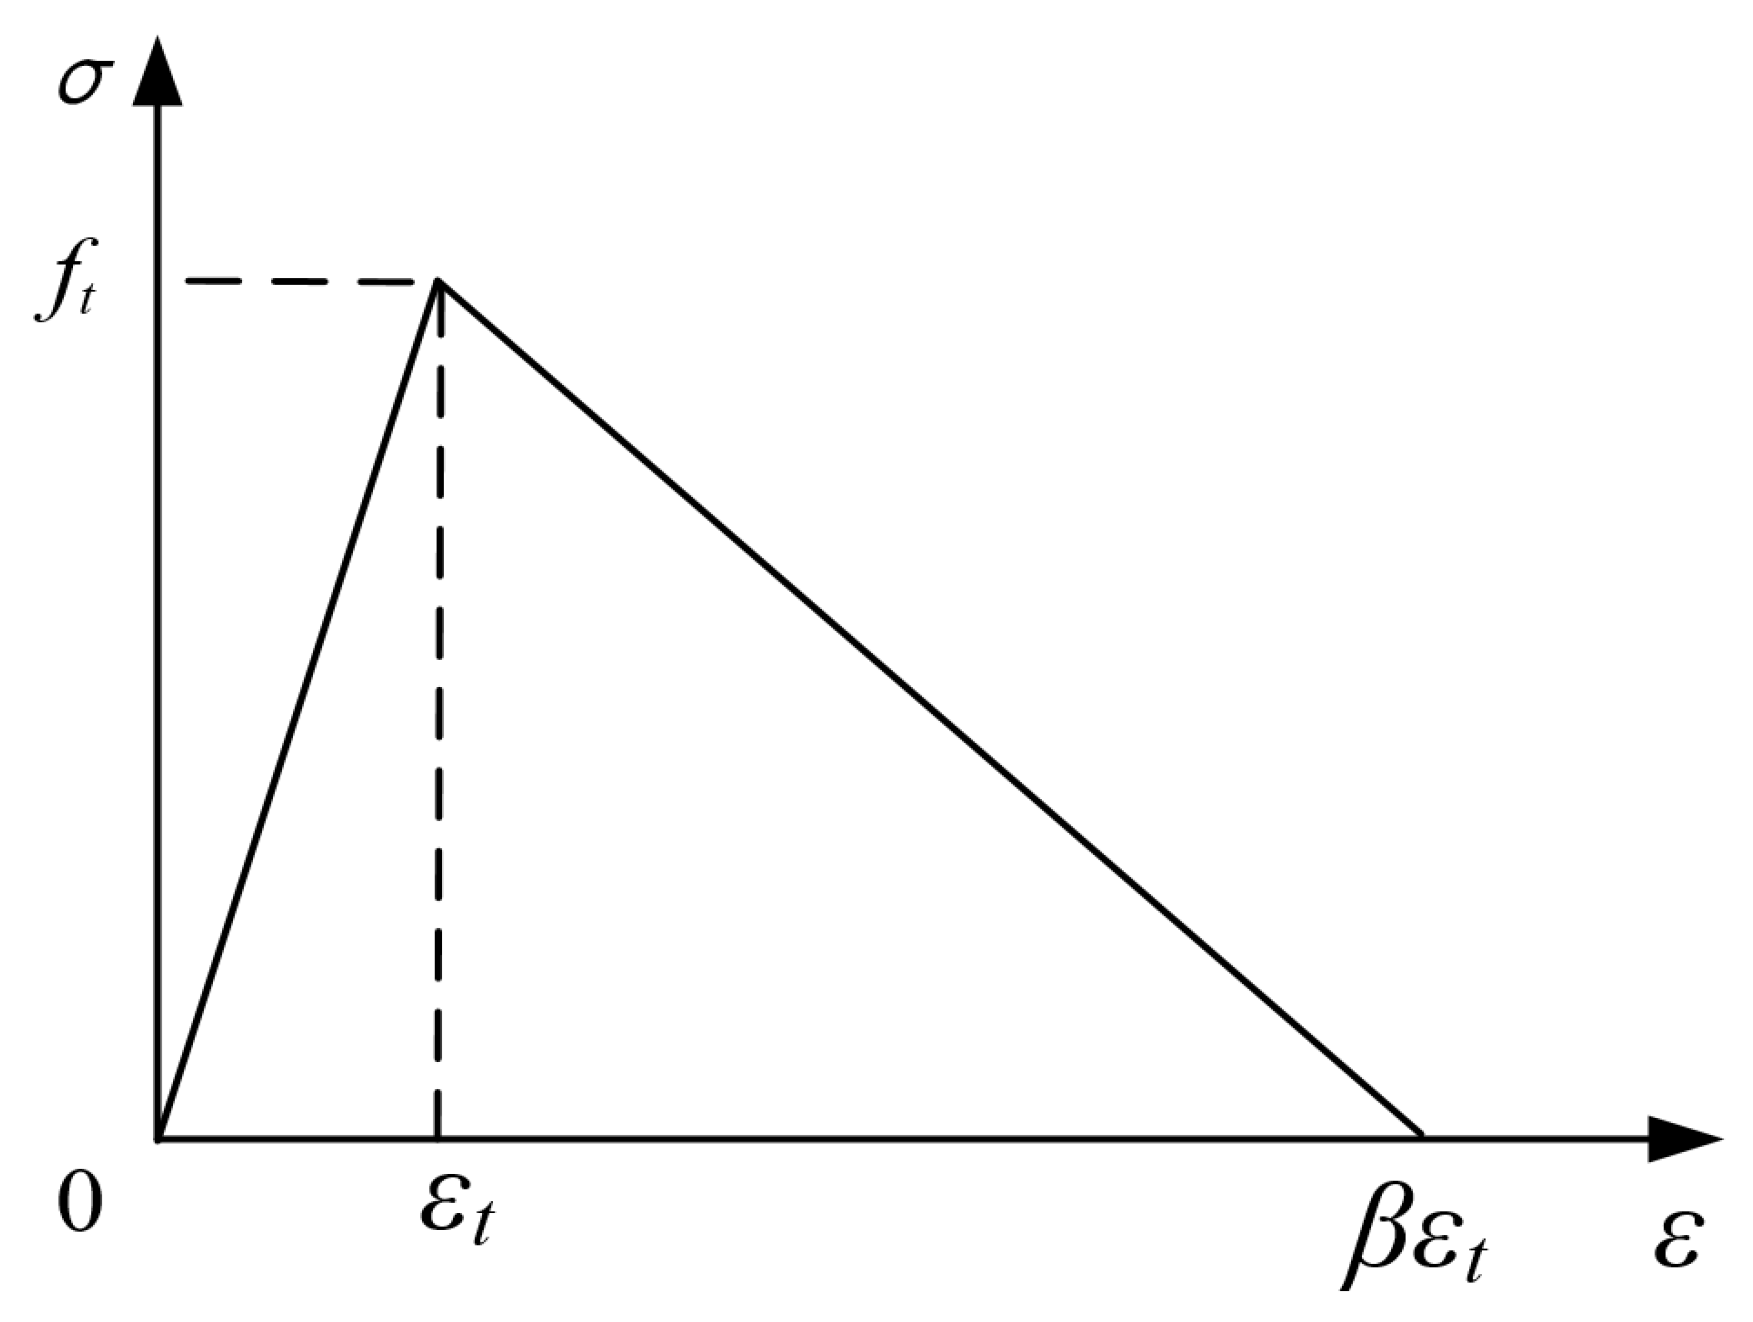
In Equation (2), ft represents the design tensile strength of concrete, εt denotes the cracking strain, and β is set as 50.
Table 1.
Plasticity parameters of concrete.
2.2.2. GFRP Material Constitutive Model
In contrast to the isotropic mechanical behavior of traditional steel and concrete, distinct anisotropy is exhibited by GFRP materials. Consequently, varying elastic moduli, shear moduli, and Poisson’s ratios across different directions were incorporated into the FE simulation. To enhance computational efficiency, the GFRP material was assumed to behave linearly elastic in the three principal directions, with identical mechanical properties assigned to each layer. The specific performance parameters [13] are listed in Table 2, while the ply thicknesses and stacking sequences are detailed in Table 3.
Table 2.
Mechanical Property Parameters of GFRP Materials.
Table 3.
Layer Parameters of GFRP Materials.
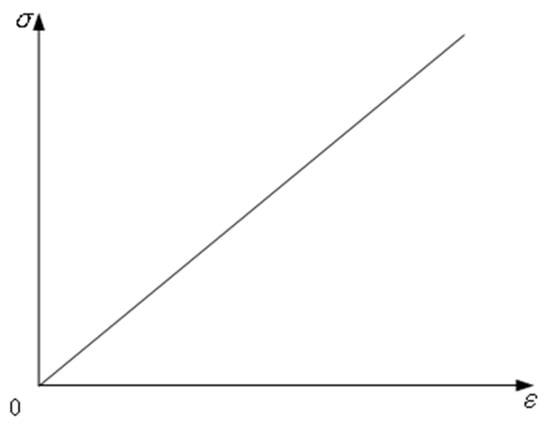
The constitutive model for common FRP profiles is illustrated in Figure 4, with the corresponding relationship expressed in Equation (3).
where σf is the tensile stress of the FRP material; Ef is the elastic modulus in the fiber direction; εf is the tensile strain; and εfu is the ultimate tensile strain.
Figure 4.
Stress–strain curve of linear elastic material.
The Hashin failure criterion, proposed by Hashin to characterize micro-damage in monolayers via macroscopic stress, was adopted. Owing to its simplicity and high applicability to fiber-reinforced composites, the built-in 2D Hashin criterion in ABAQUS was utilized to simulate damage evolution, encompassing four failure modes: fiber tension, fiber compression, matrix tension, and matrix compression. The GFRP strength parameters are presented in Table 4, and the criteria for these four damage modes are defined as follows:
Table 4.
Strength parameters of GFRP materials.
Fiber tensile failure:
Fiber compressive failure:
Matrix tensile failure:
Matrix compressive failure:
where σ11(σ22) denotes the normal stress; τ12 is the shear stress; Xt(Xc) represents the longitudinal tensile (compressive) strength; Yt(Yc) represents the transverse tensile (compressive) strength; SL(ST) is the longitudinal (transverse) in-plane shear strength; and α is the coefficient determining the influence of shear stress on fiber tensile failure.
2.2.3. Verification of GFRP Modeling Method
To verify the validity of the GFRP modeling approach employed in this study, a push-out test simulation was conducted.
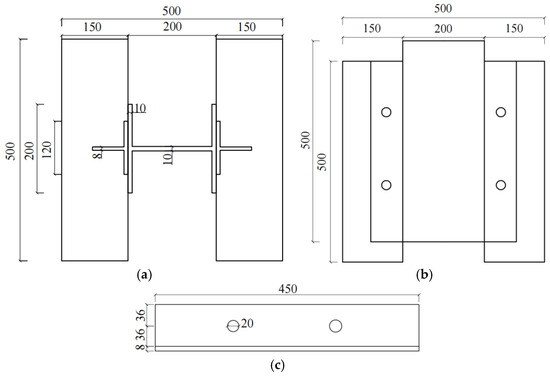
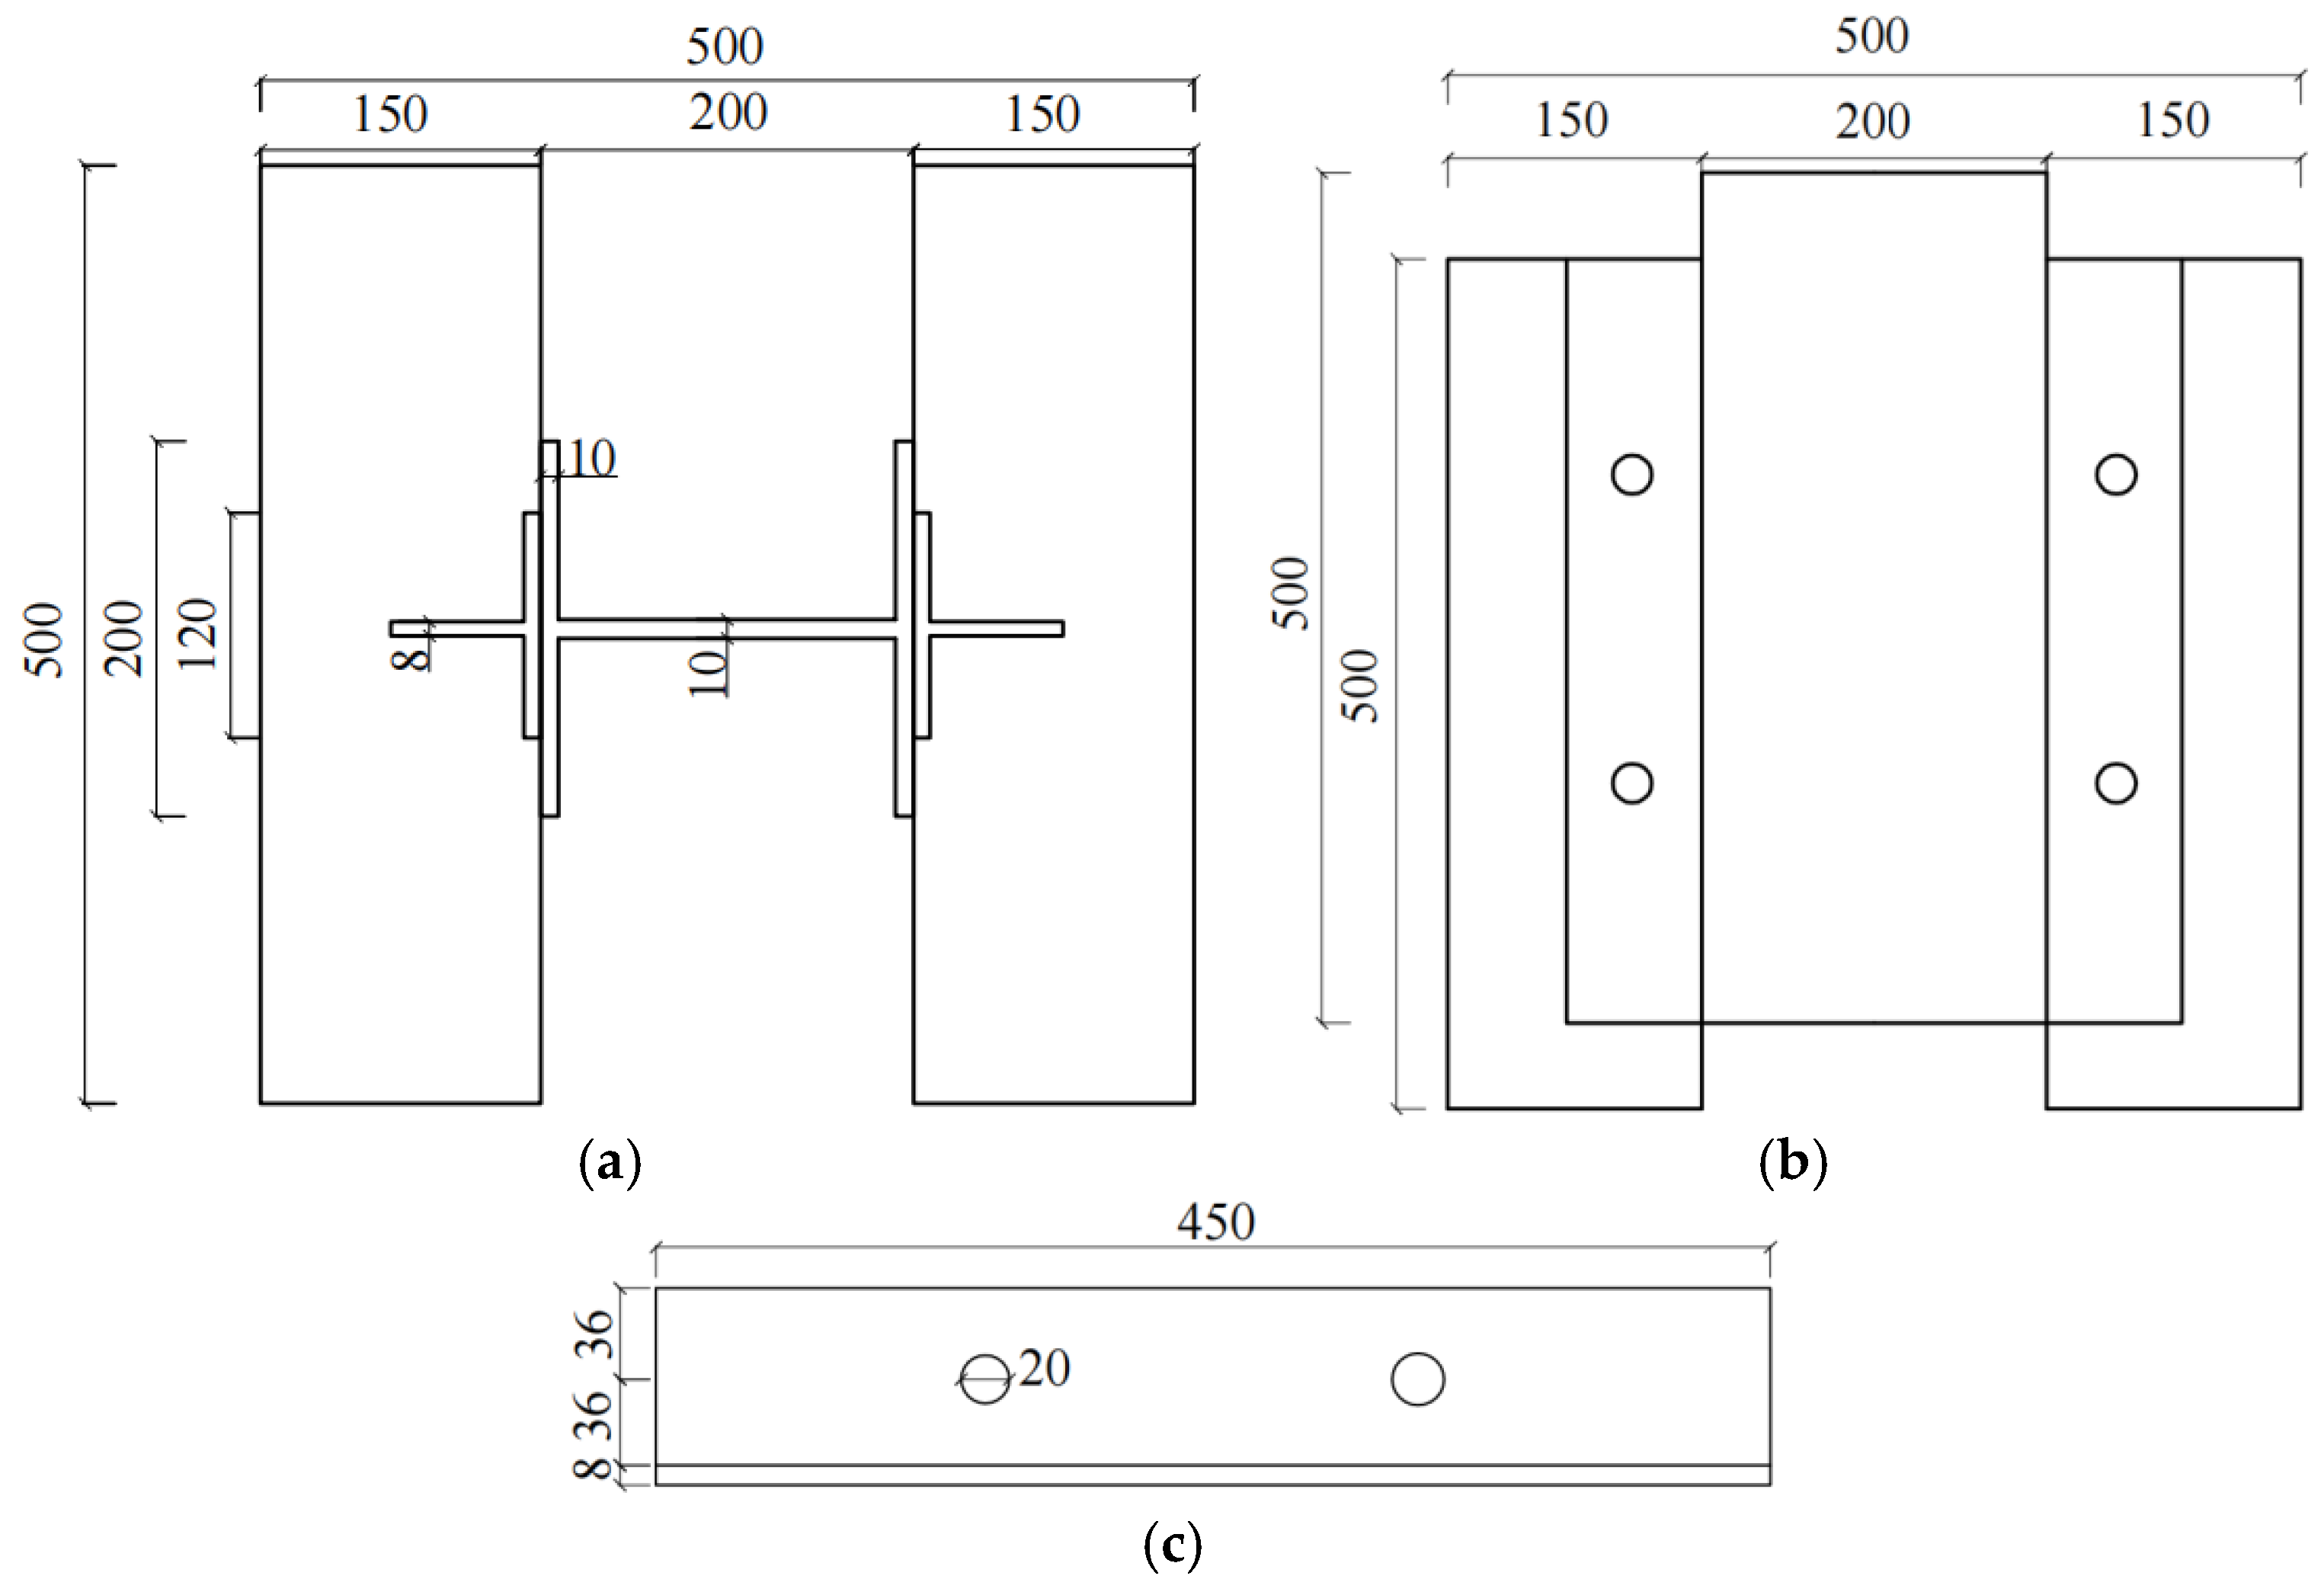
Di et al. [14] performed monotonic push-out tests on GFRP perforated plates to analyze the influence of hole quantity and spacing on structural performance. Based on these experimental results, a specimen group comprising an H-shaped GFRP plate, a GFRP perforated plate, a concrete block, concrete dowels, and penetrating reinforcement was designed. The dimensions of the specimen are illustrated in Figure 5.
Figure 5.
Dimensions of the specimen (Unit: mm). (a) Vertical sectional view of the specimen. (b) Transverse sectional view of the specimen. (c) Dimensions of the perforated plate.
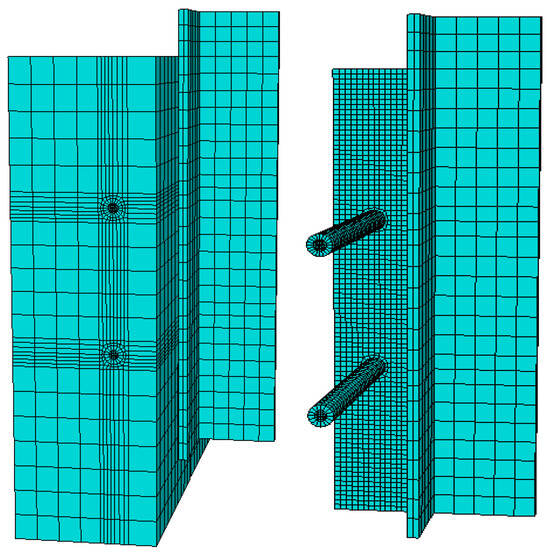
Given the structural symmetry, a half-structure analysis was conducted for the finite element simulation. The concrete, concrete dowels, H-shaped GFRP plate, penetrating reinforcement, and GFRP perforated plate were all modeled using eight-node linear brick elements (C3D8R). To accurately simulate the actual GFRP structure, the H-shaped GFRP plate and the perforated plate were discretized into two layers along the thickness direction. The meshing configuration of the model is shown in Figure 6.
Figure 6.
Finite element model.
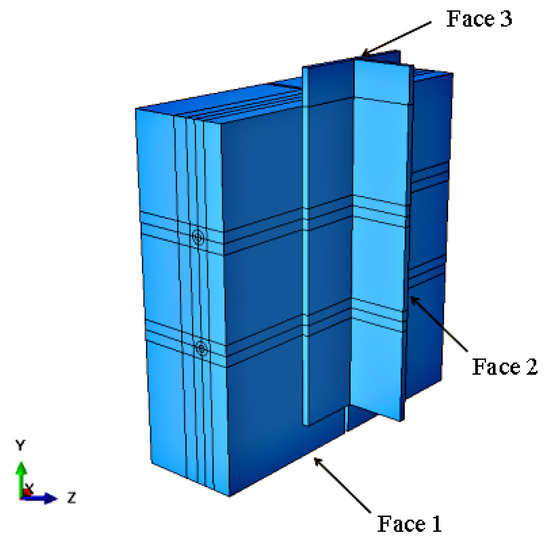
The boundary conditions for the push-out test simulation were established as illustrated in Figure 7. Specifically, the bottom surface (Face 1) of the concrete block was fully constrained (U1 = U2 = U3 = 0) to restrict all degrees of freedom. On the symmetry plane (Face 2) of the H-shaped GFRP plate, the moments in the X and Z directions were set to zero, while other directions remained free (U2 = UR1 = UR3 = 0). To eliminate the influence of eccentric loading, a coupling constraint was applied to the top surface (Face 3) of the H-shaped GFRP plate, connecting it to the centroid, where a vertical downward displacement load was applied in the Y-direction.
Figure 7.
Boundary conditions of the model.
The constitutive models for concrete and GFRP materials used in the test were consistent with those described in Section 2.2.1 and Section 2.2.2.
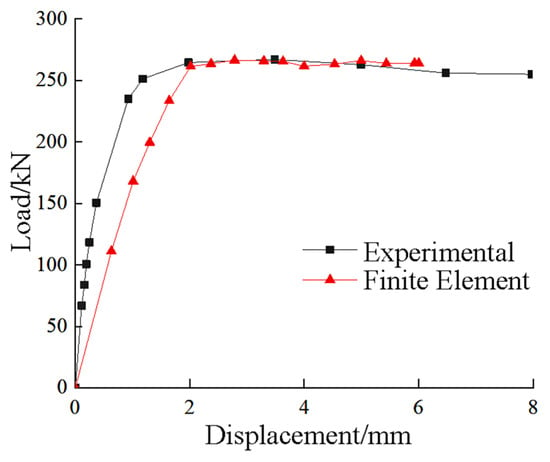
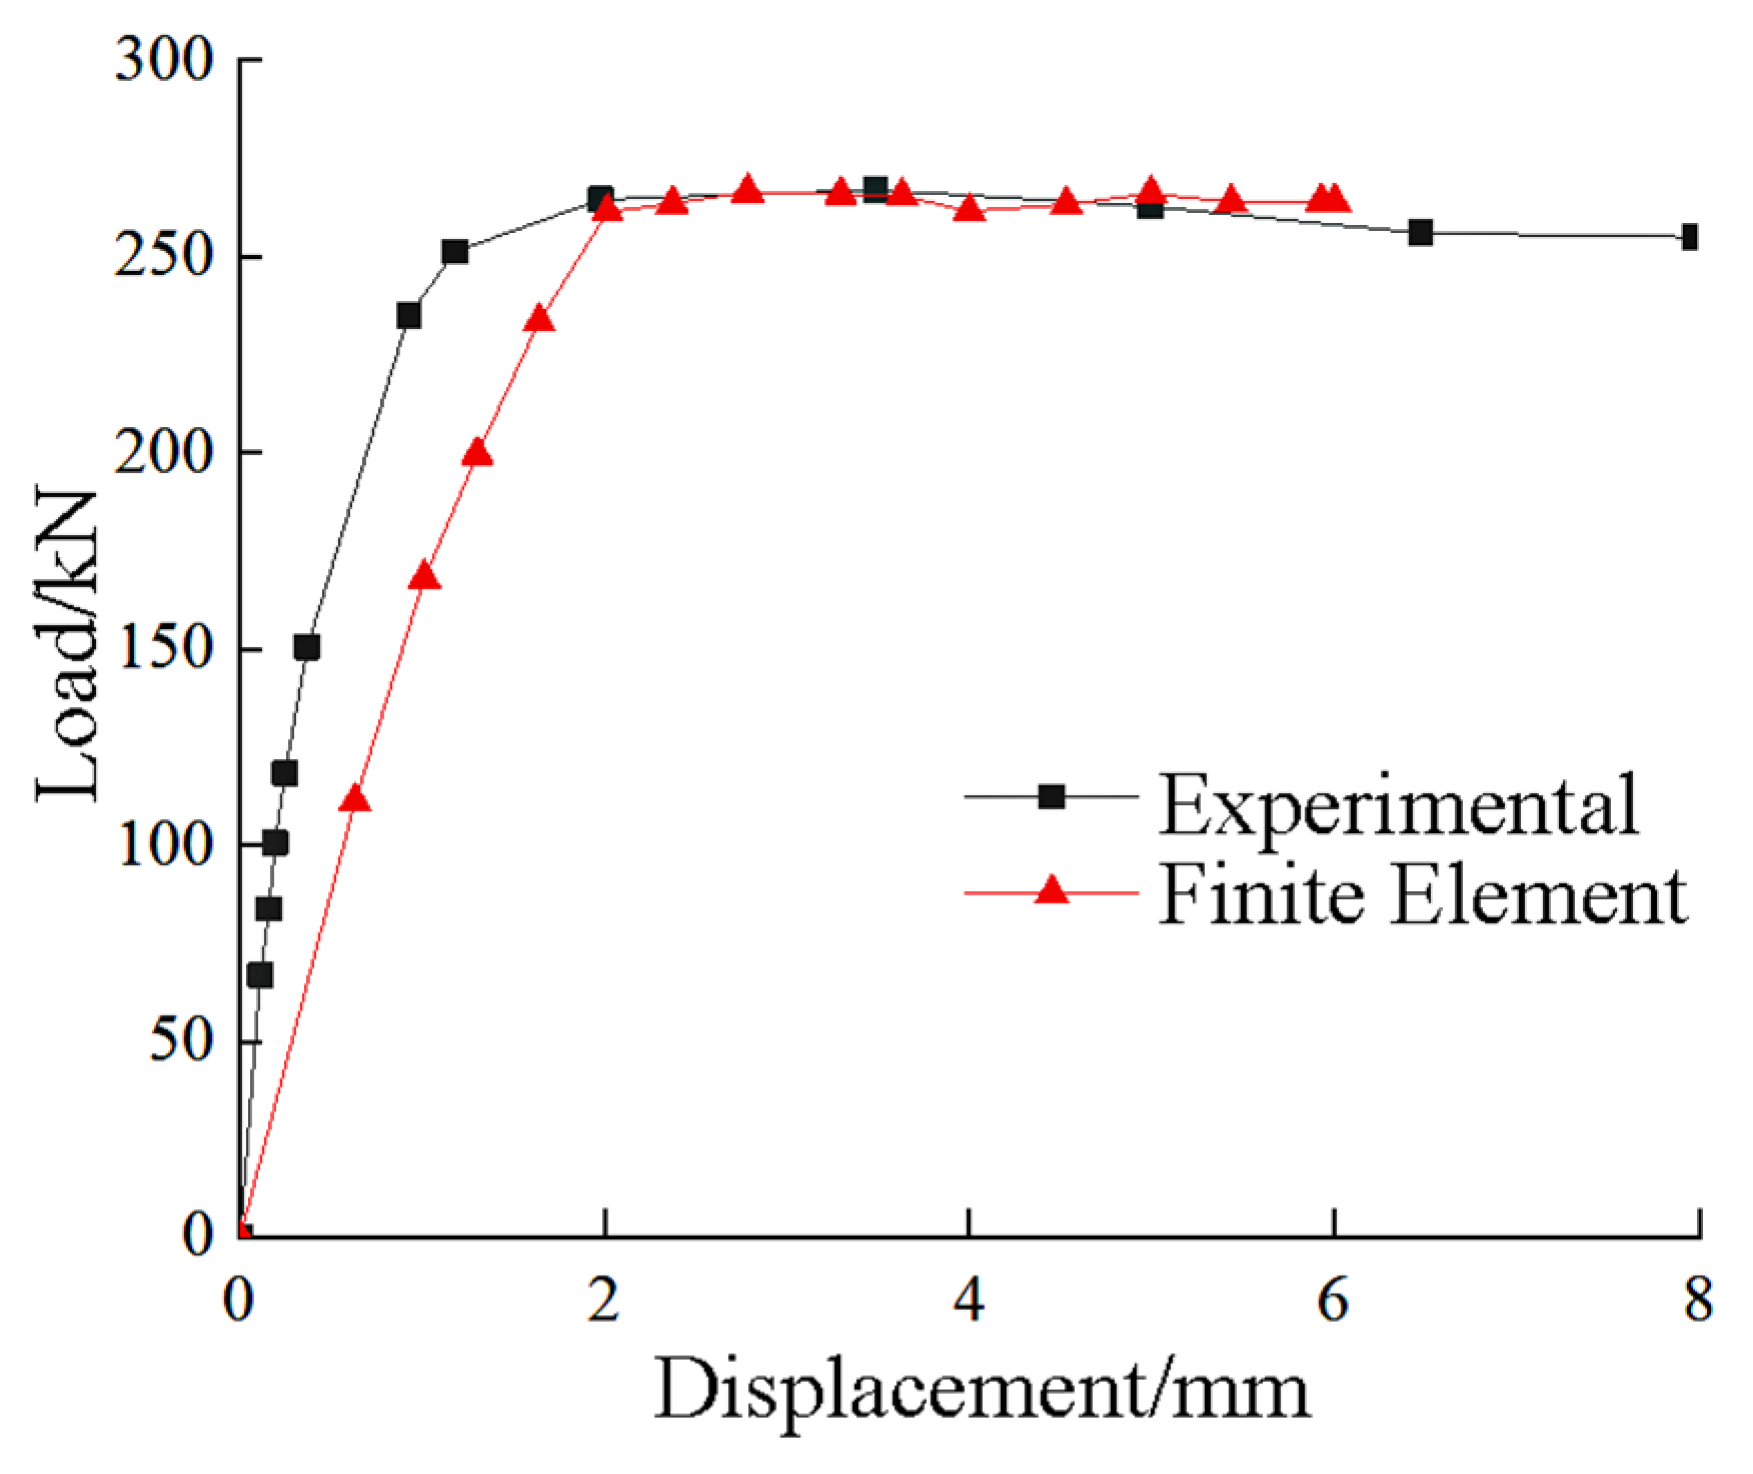
Based on the experimental results from Di et al., a comparative analysis was performed between the finite element calculations and the experimental data. The resulting load–displacement curves are presented in Figure 8. As observed, the shear resistance of the GFRP perforated plate involves two distinct stages: elastic and plastic. In the elastic stage, consistency is observed between experimental and numerical trends, with both entering plasticity at 2 mm; the slightly lower initial stiffness in the FE model is attributed to model simplification. In the plastic stage, load growth decelerates gradually with increasing relative displacement. The marginal deviation of 1.12% between the experimental and calculated ultimate bearing capacities and the general agreement between the curves verified that the proposed simulation method for GFRP materials is accurate.
Figure 8.
Comparison between finite element calculation and experimental values.
2.3. Element Type and Meshing
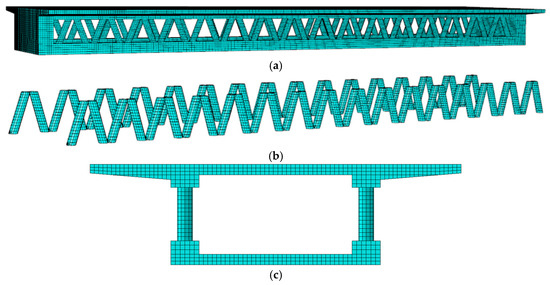
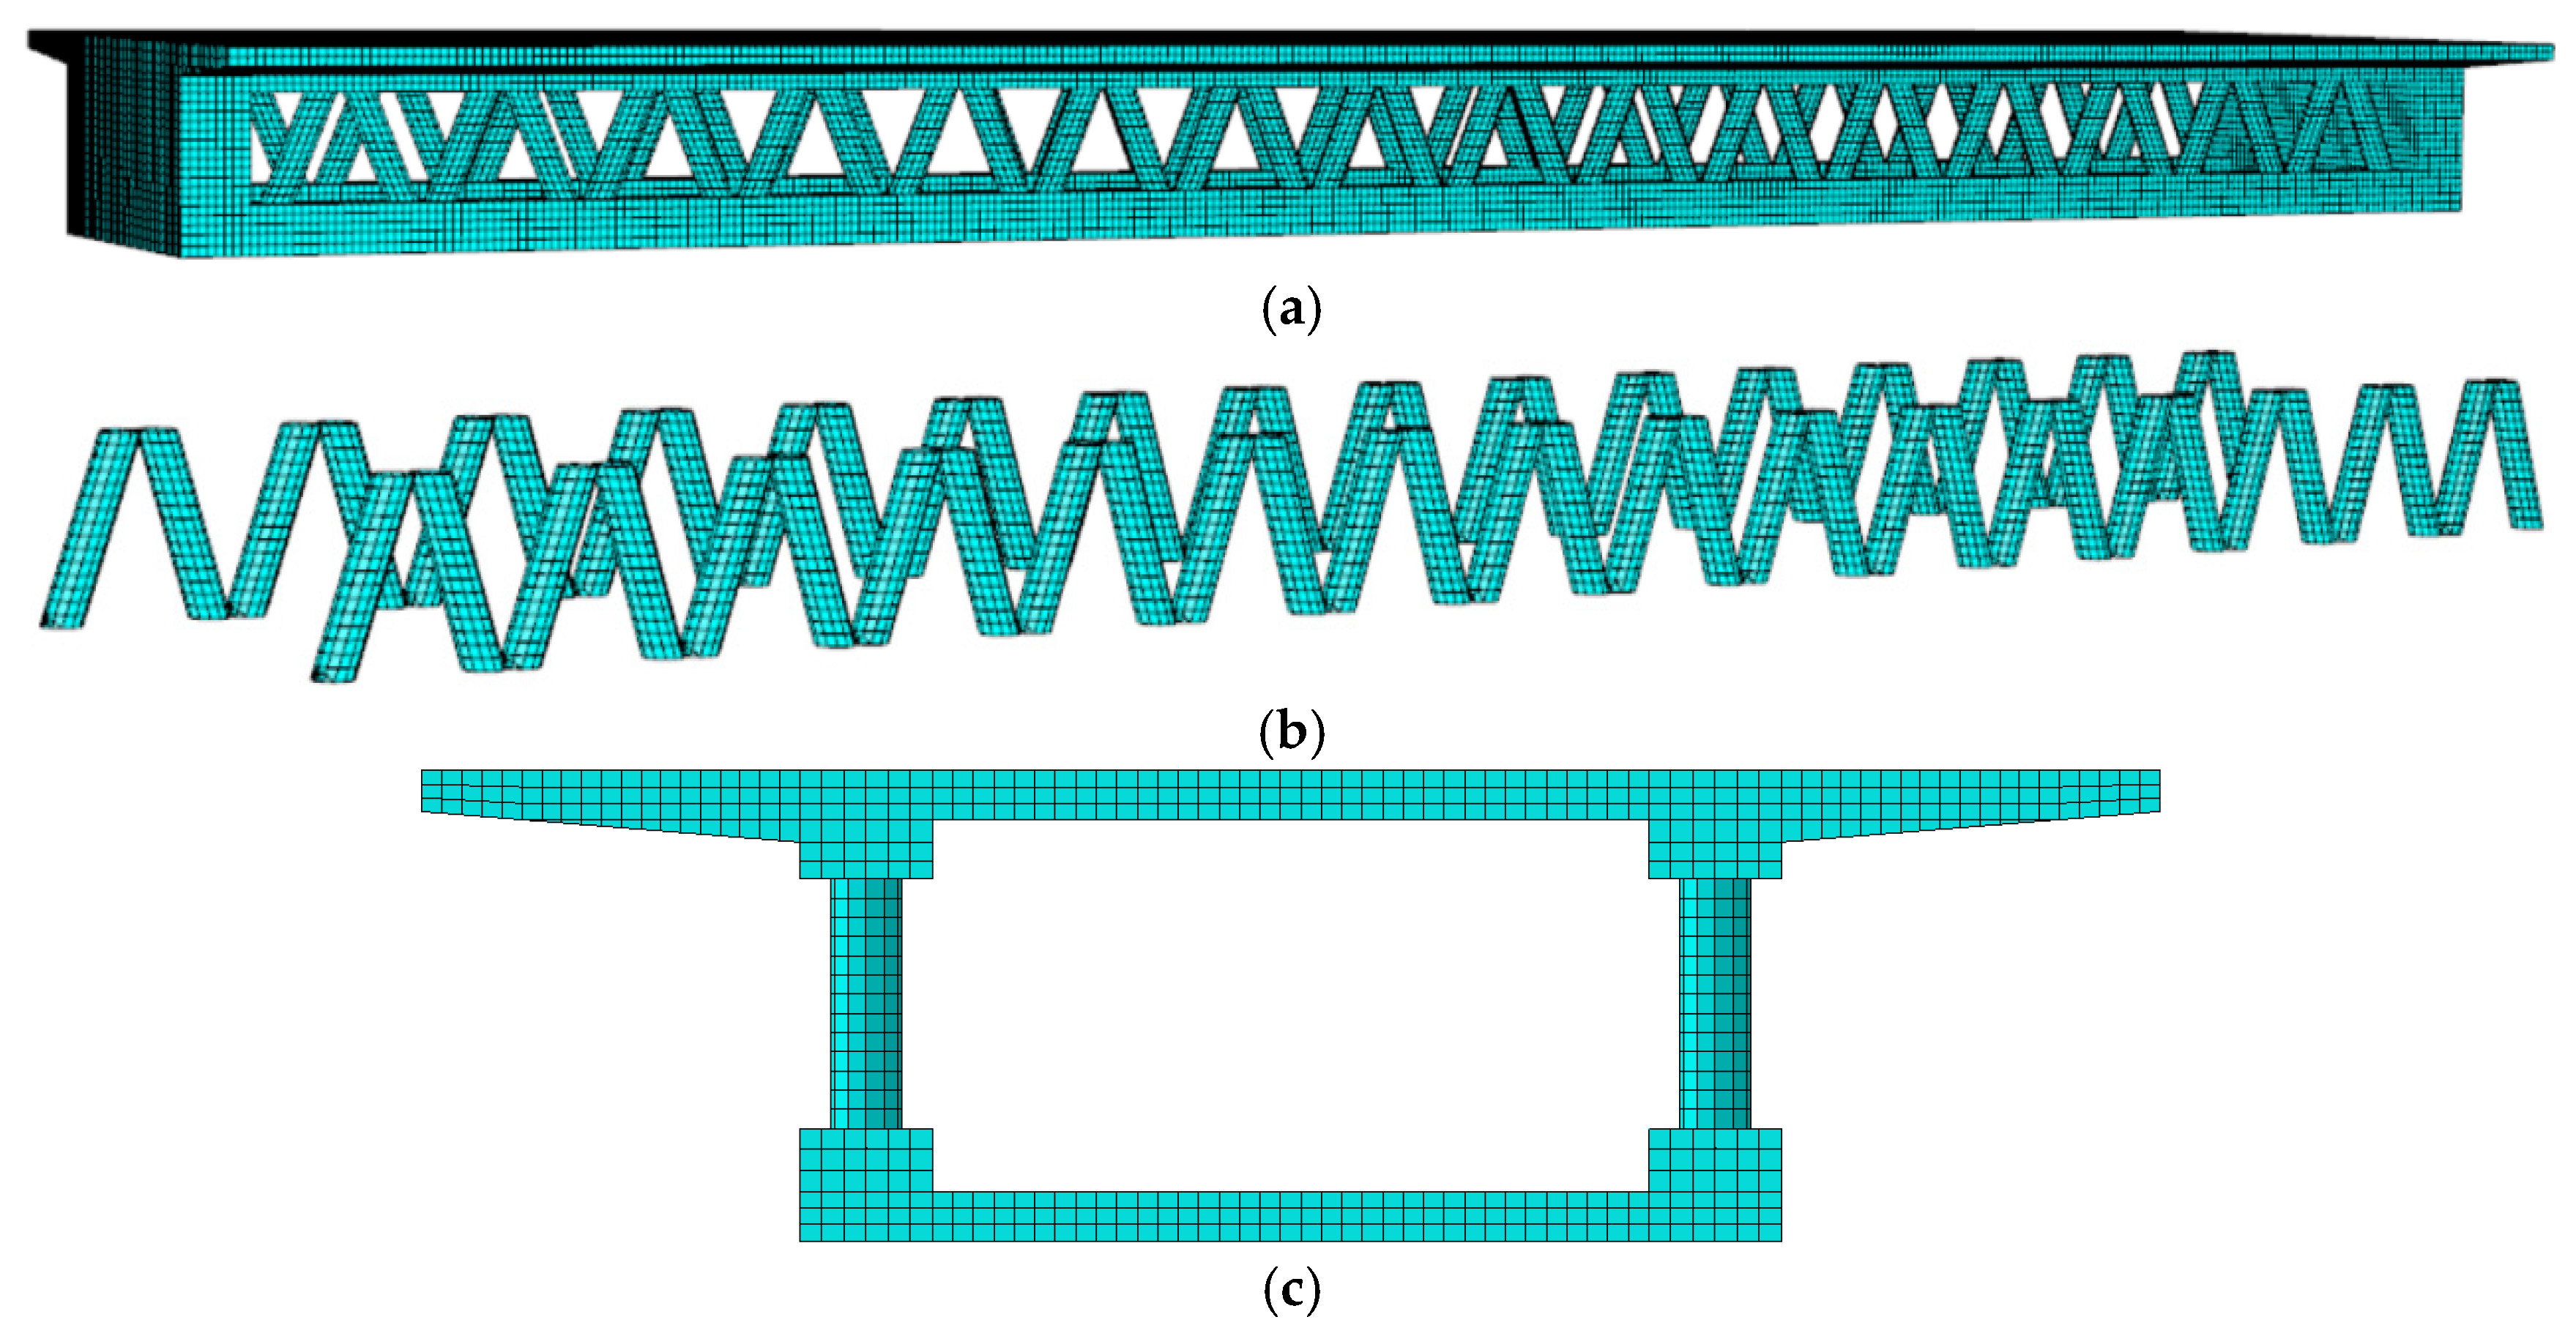
Mesh density significantly influences both computational efficiency and accuracy; excessive density increases time costs, while insufficient density compromises precision. Sensitivity analysis indicated that 3–5 elements along the thickness direction are optimal, as fewer elements result in excessive stiffness in the concrete slabs. Consequently, the concrete was simulated using eight-node linear brick elements (C3D8R), while the GFRP truss members were modeled with continuous shell elements (SC8R) [15]. Following iterative trials, a mesh size of 100 mm was determined to be optimal for both materials. The meshing details for each component are shown in Figure 9.
Figure 9.
Meshing details. (a) Global mesh of the GFRP composite truss web girder bridge. (b) Mesh of GFRP truss web members. (c) Mesh of the mid-span cross-section.
2.4. Interactions
Two primary contact interfaces exist in the FE model of the GFRP composite truss web girder bridge: the junction between the GFRP truss web and the concrete slabs, and the interface between the truss and the infill concrete. In engineering practice, the truss-slab connection is secured via shear connectors; given the negligible relative slip under loading, this connection is treated as rigid. To facilitate simulation, the shear connectors were simplified, and an embedded constraint was applied to integrate the GFRP truss members into the concrete slabs, effectively substituting the connectors’ function. This approach simulates a rigid connection based on the engineering assumption that shear connectors provide full composite action with negligible relative slip under service loads. This simplification effectively captures the global force transfer mechanism required for shear lag analysis while significantly optimizing computational efficiency. Regarding the contact between the GFRP truss and the infill concrete, a Tie constraint was adopted to simulate cooperative deformation, assuming no relative slip between the truss members and the core concrete.
2.5. Boundary Conditions and Loading Methods
The boundary conditions of the FE model were configured as simply supported to simulate the actual support environment of the truss web girder bridge. Specifically, one end of the girder was fully constrained with displacements restricted in all three directions (U1 = U2 = U3 = 0), while the other end was constrained in the vertical and longitudinal directions (U2 = U3 = 0), permitting displacement solely in the horizontal (transverse) direction. The locations of these boundary conditions are illustrated in Figure 10.
Figure 10.
Boundary conditions.
Based on experimental protocols, accurate mechanical performance data for composite truss web girder bridges can only be obtained when loads are applied at the truss-slab junction. Therefore, in the simulation, loads were applied to the concrete top slab strictly at the intersections with the GFRP truss members.
3. Finite Element Analysis of Shear Lag Effect in GFRP Composite Truss Web Girder Bridge
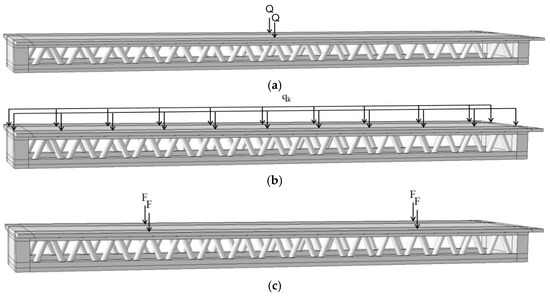
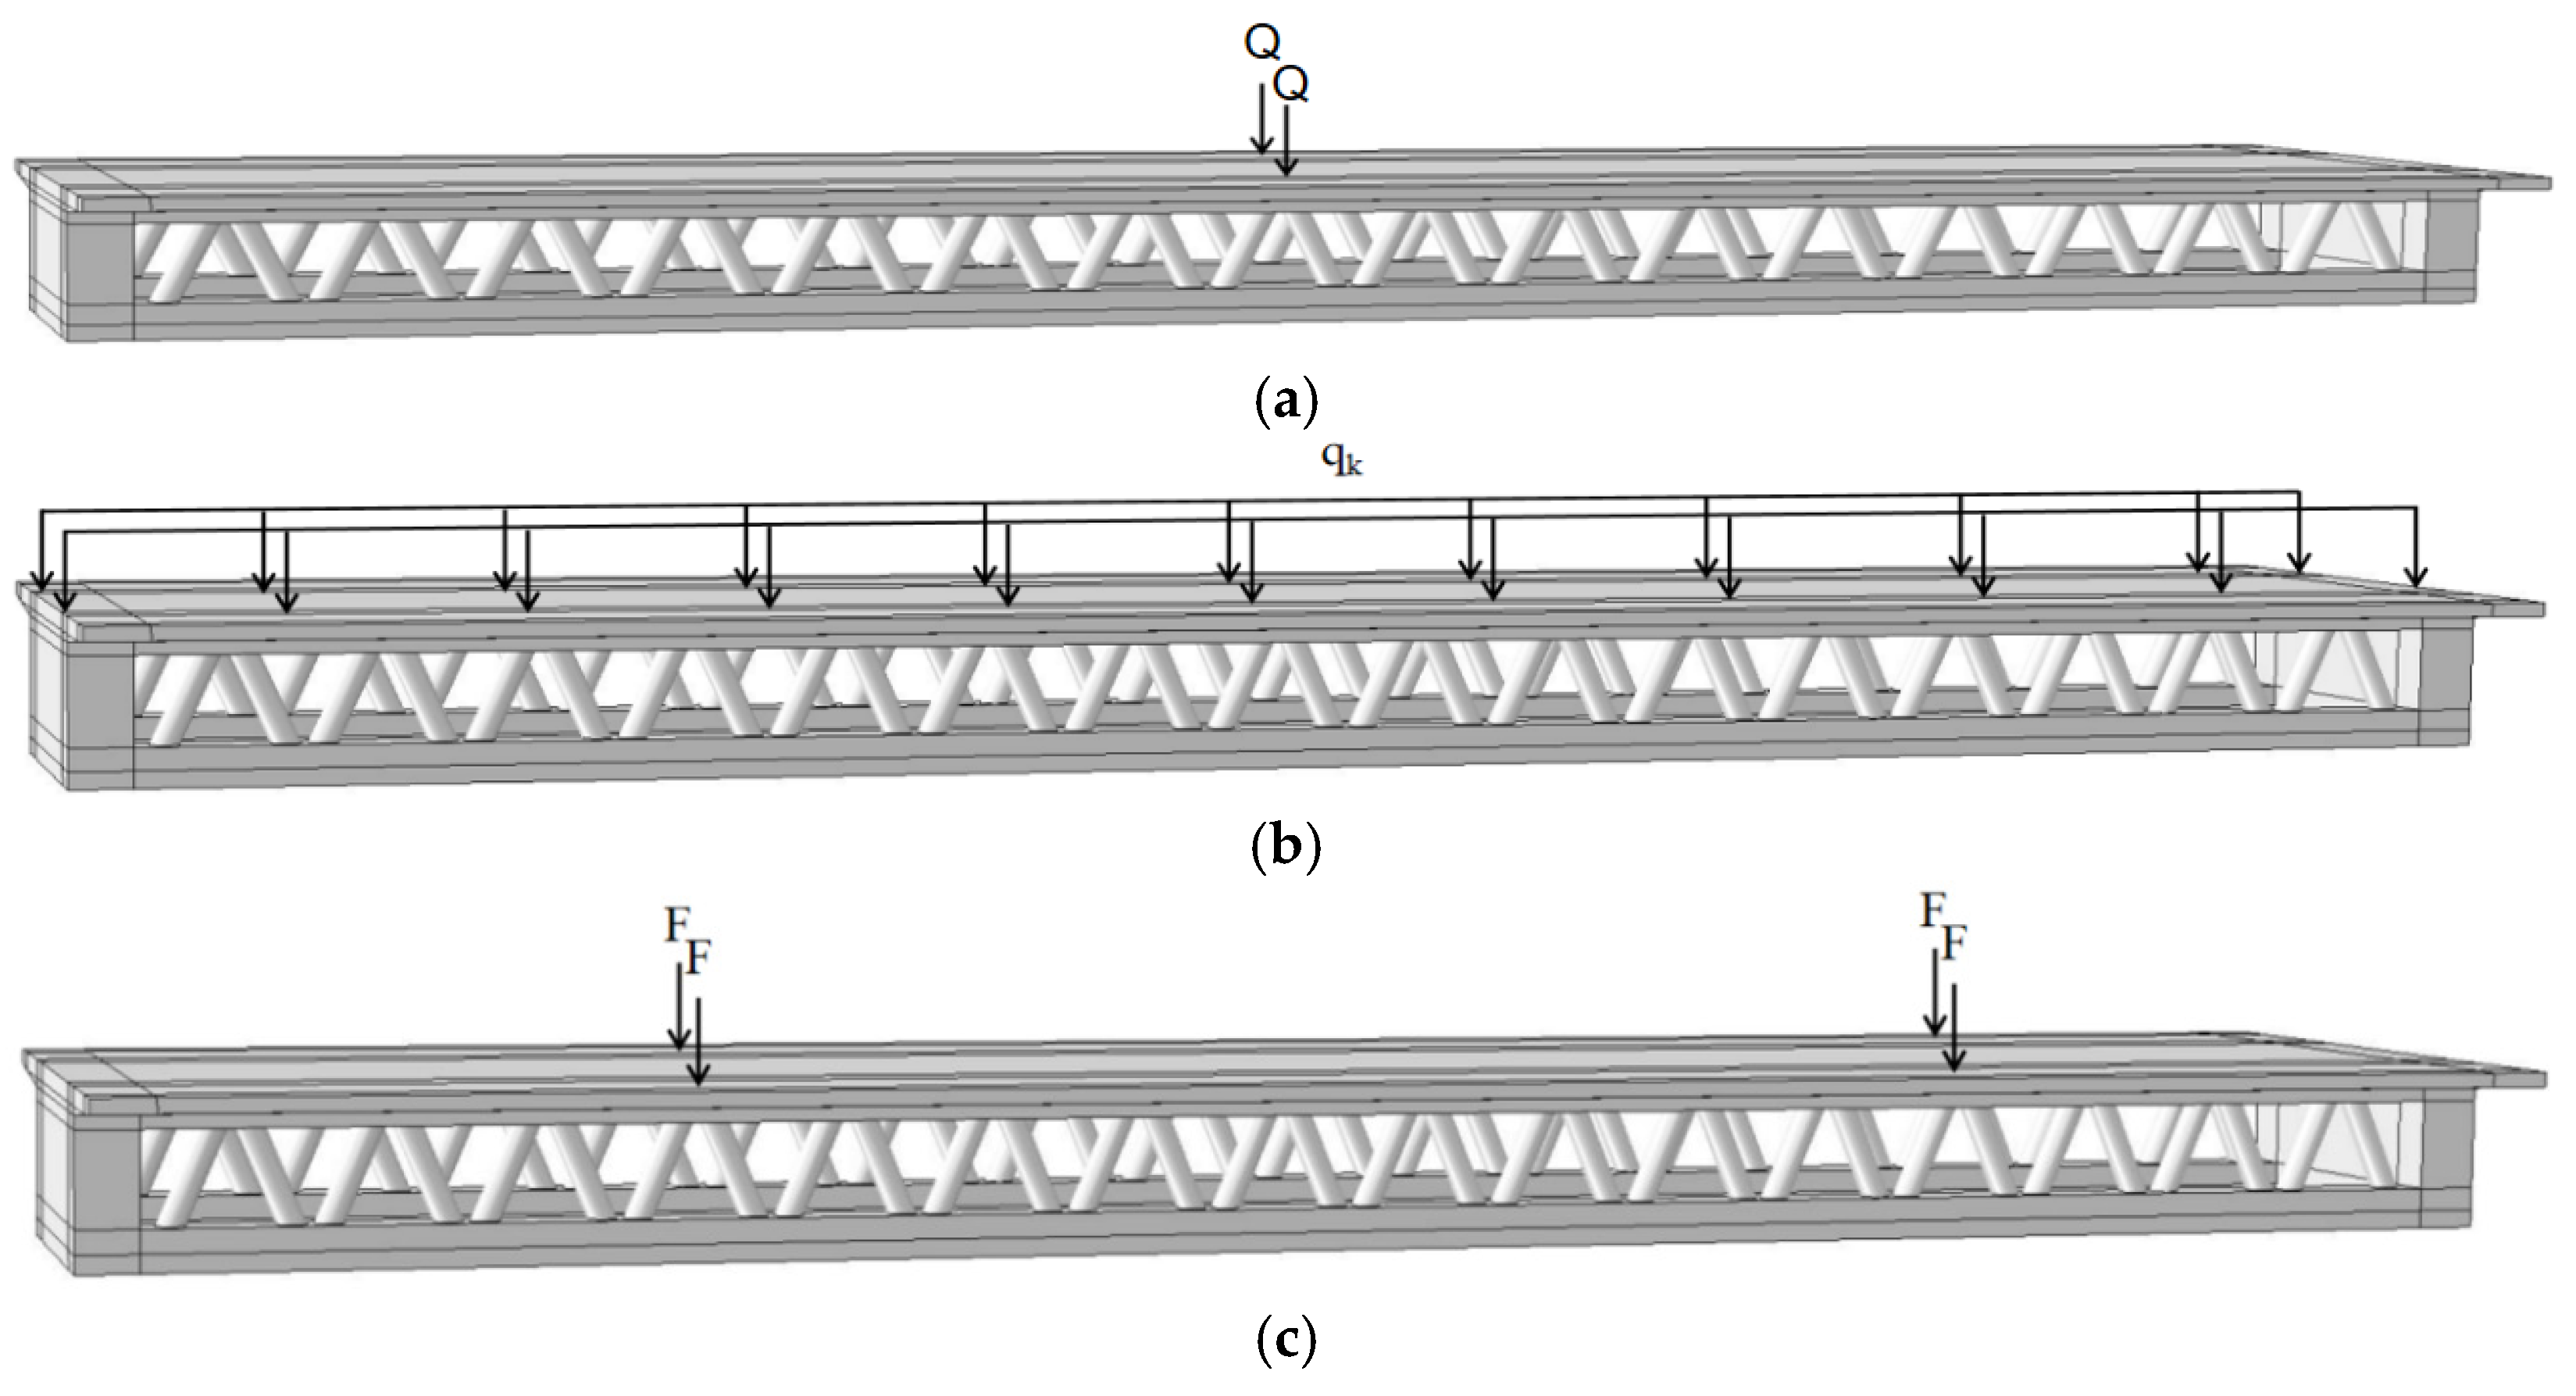
To investigate the shear lag effect of the GFRP composite truss web girder bridge under external loading, three typical load cases were considered in accordance with the General Code for Design of Highway Bridges and Culverts: (1) mid-span concentrated loading, (2) full-span uniformly distributed loading, and (3) two-point symmetric loading. The corresponding loading schemes are illustrated in Figure 11. The magnitudes of the applied loads were defined as follows: concentrated load Q = 162 kN, uniform load intensity qk = 10.5 kN/m, and each point load F = 162 kN for the symmetric case.
Figure 11.
Loading conditions for different scenarios. (a) Location of mid-span concentrated load; (b) Location of full-span uniformly distributed load; (c) Location of two-point symmetric load.
3.1. Transverse Shear Lag Effect Analysis
To investigate the transverse mechanical behavior, three characteristic zones were selected: the mid-span (Region A), the quarter-point of the side span (Region B), and the support area (Region C). Within each zone, three specific cross-sections encompassing both nodal and non-nodal locations were defined, as illustrated in Figure 12.
Figure 12.
Transverse Analysis Locations of the GFRP Composite Truss-Web Girder Bridge.
3.1.1. Mid-Span Concentrated Load
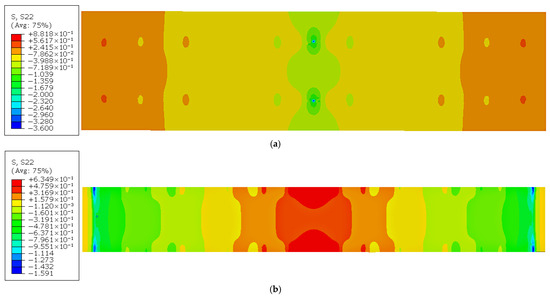
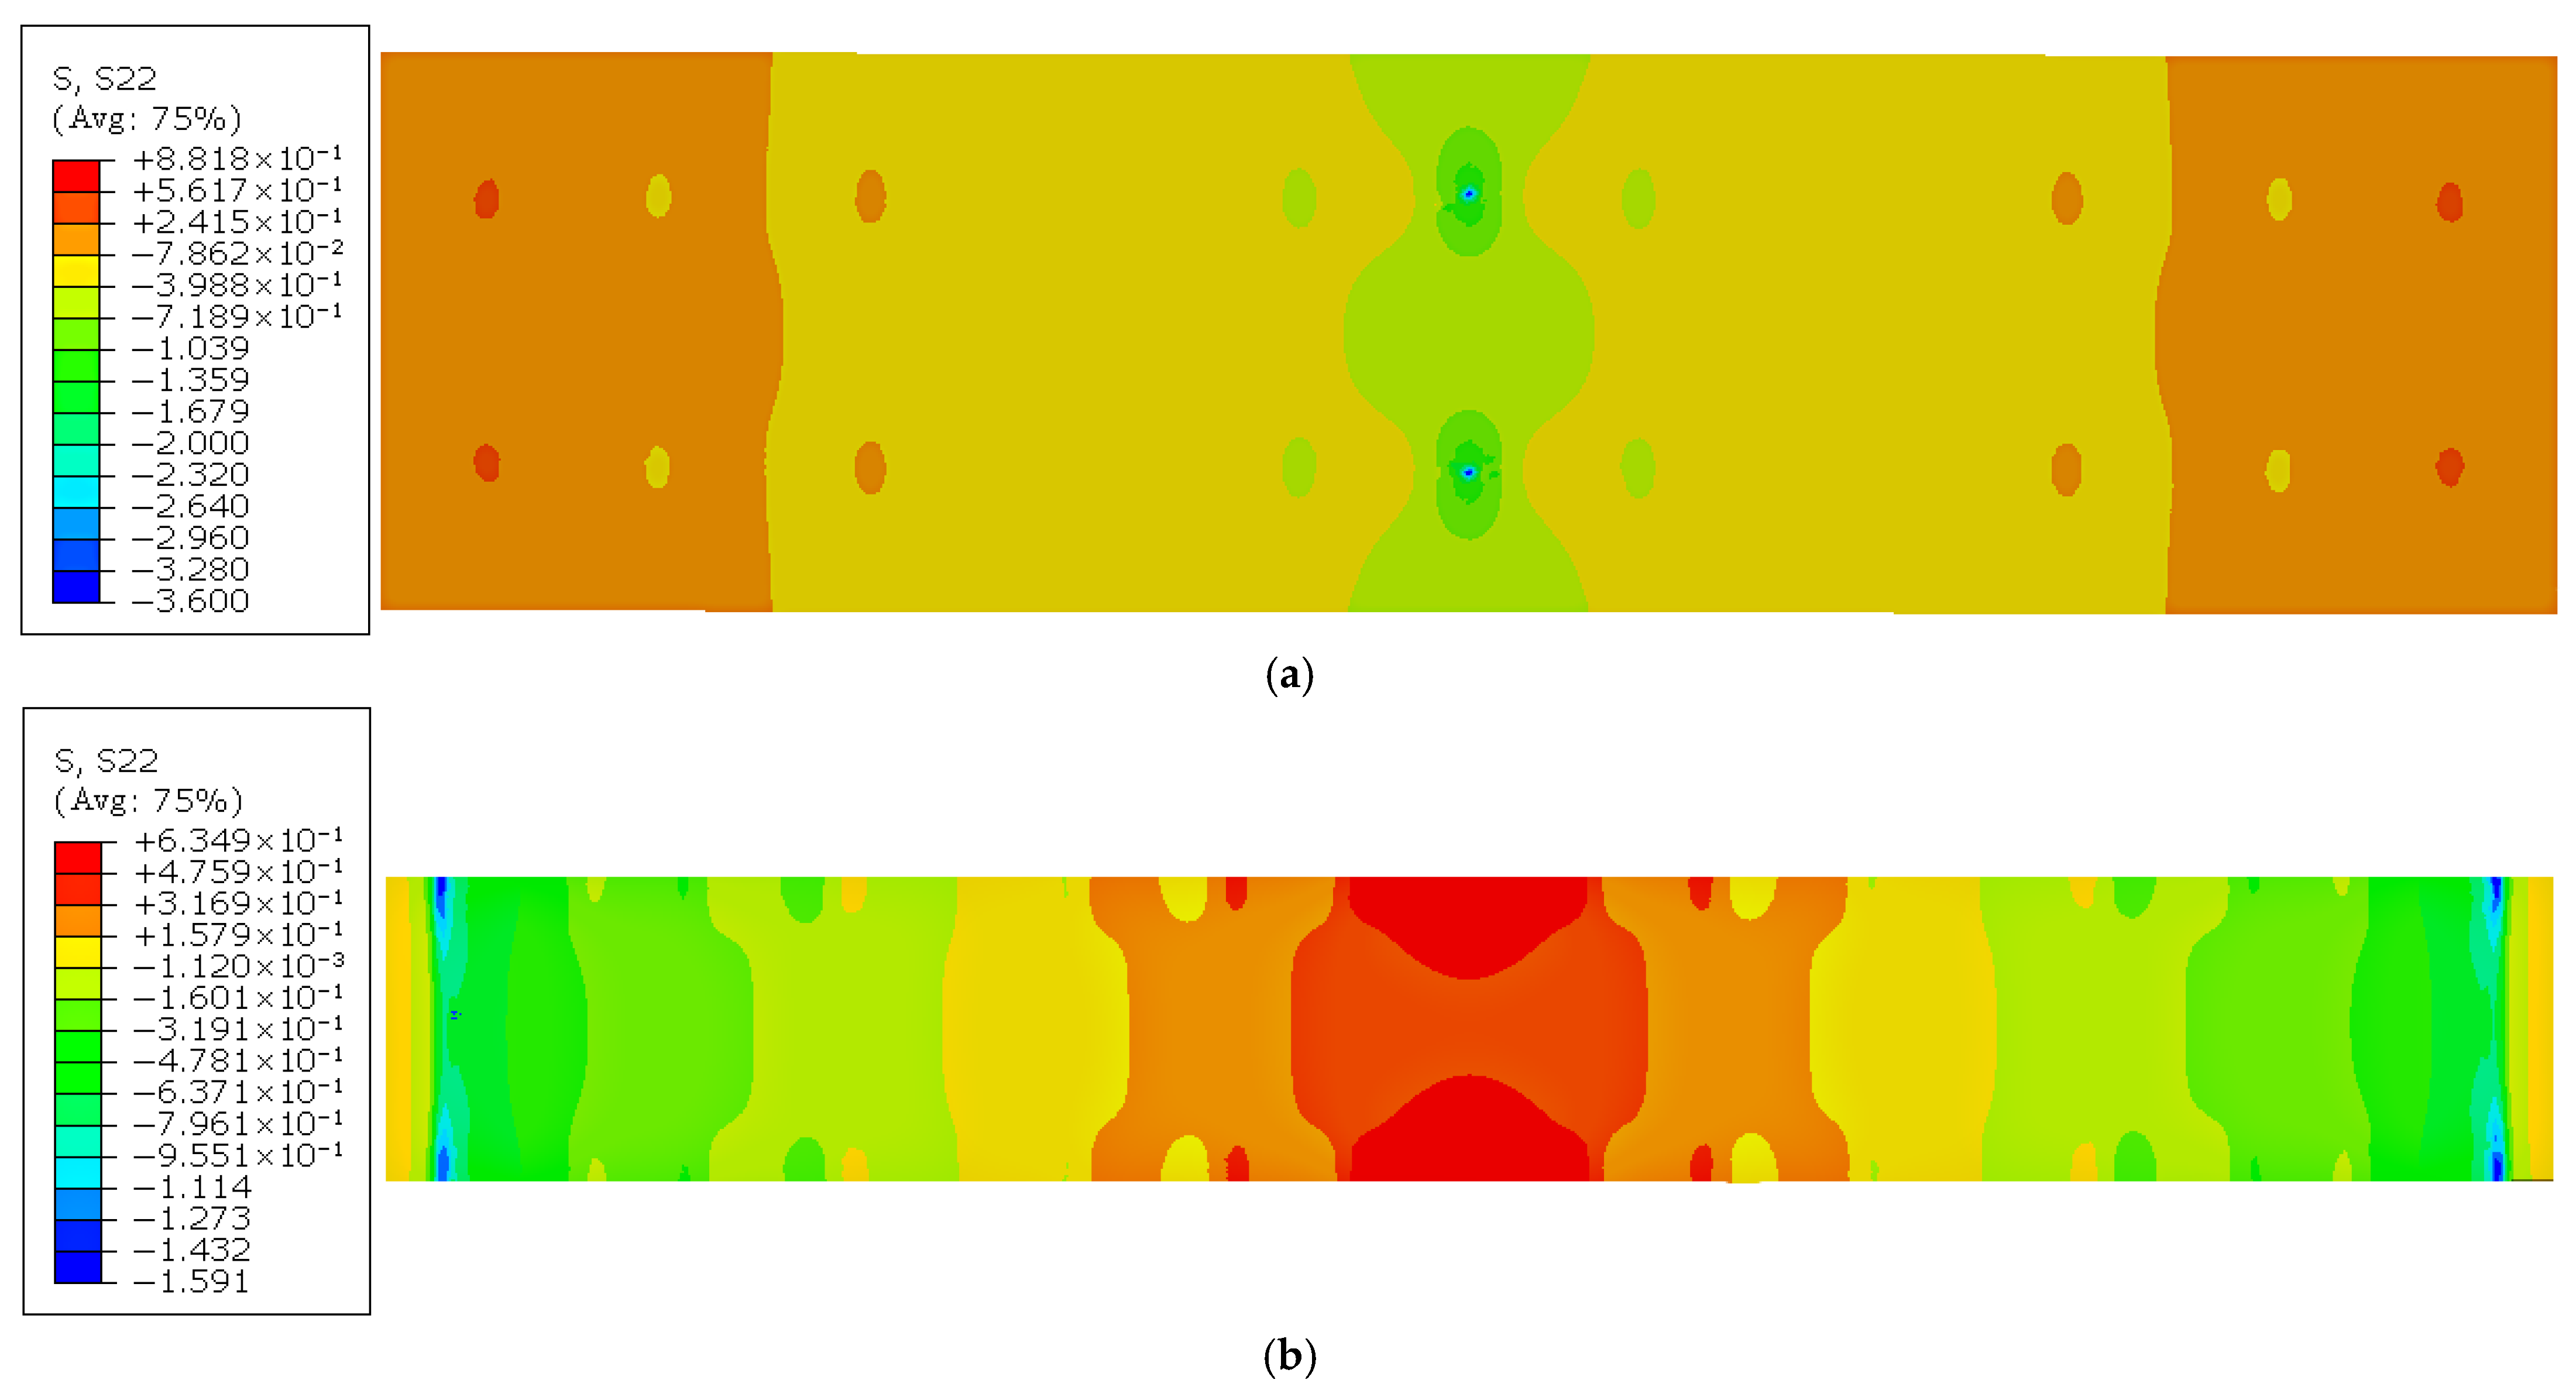
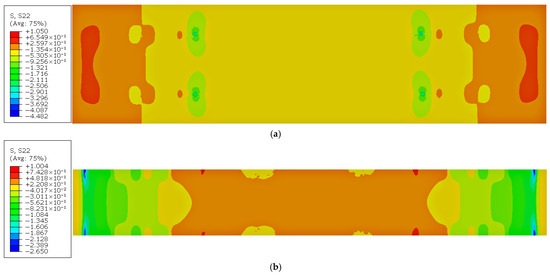
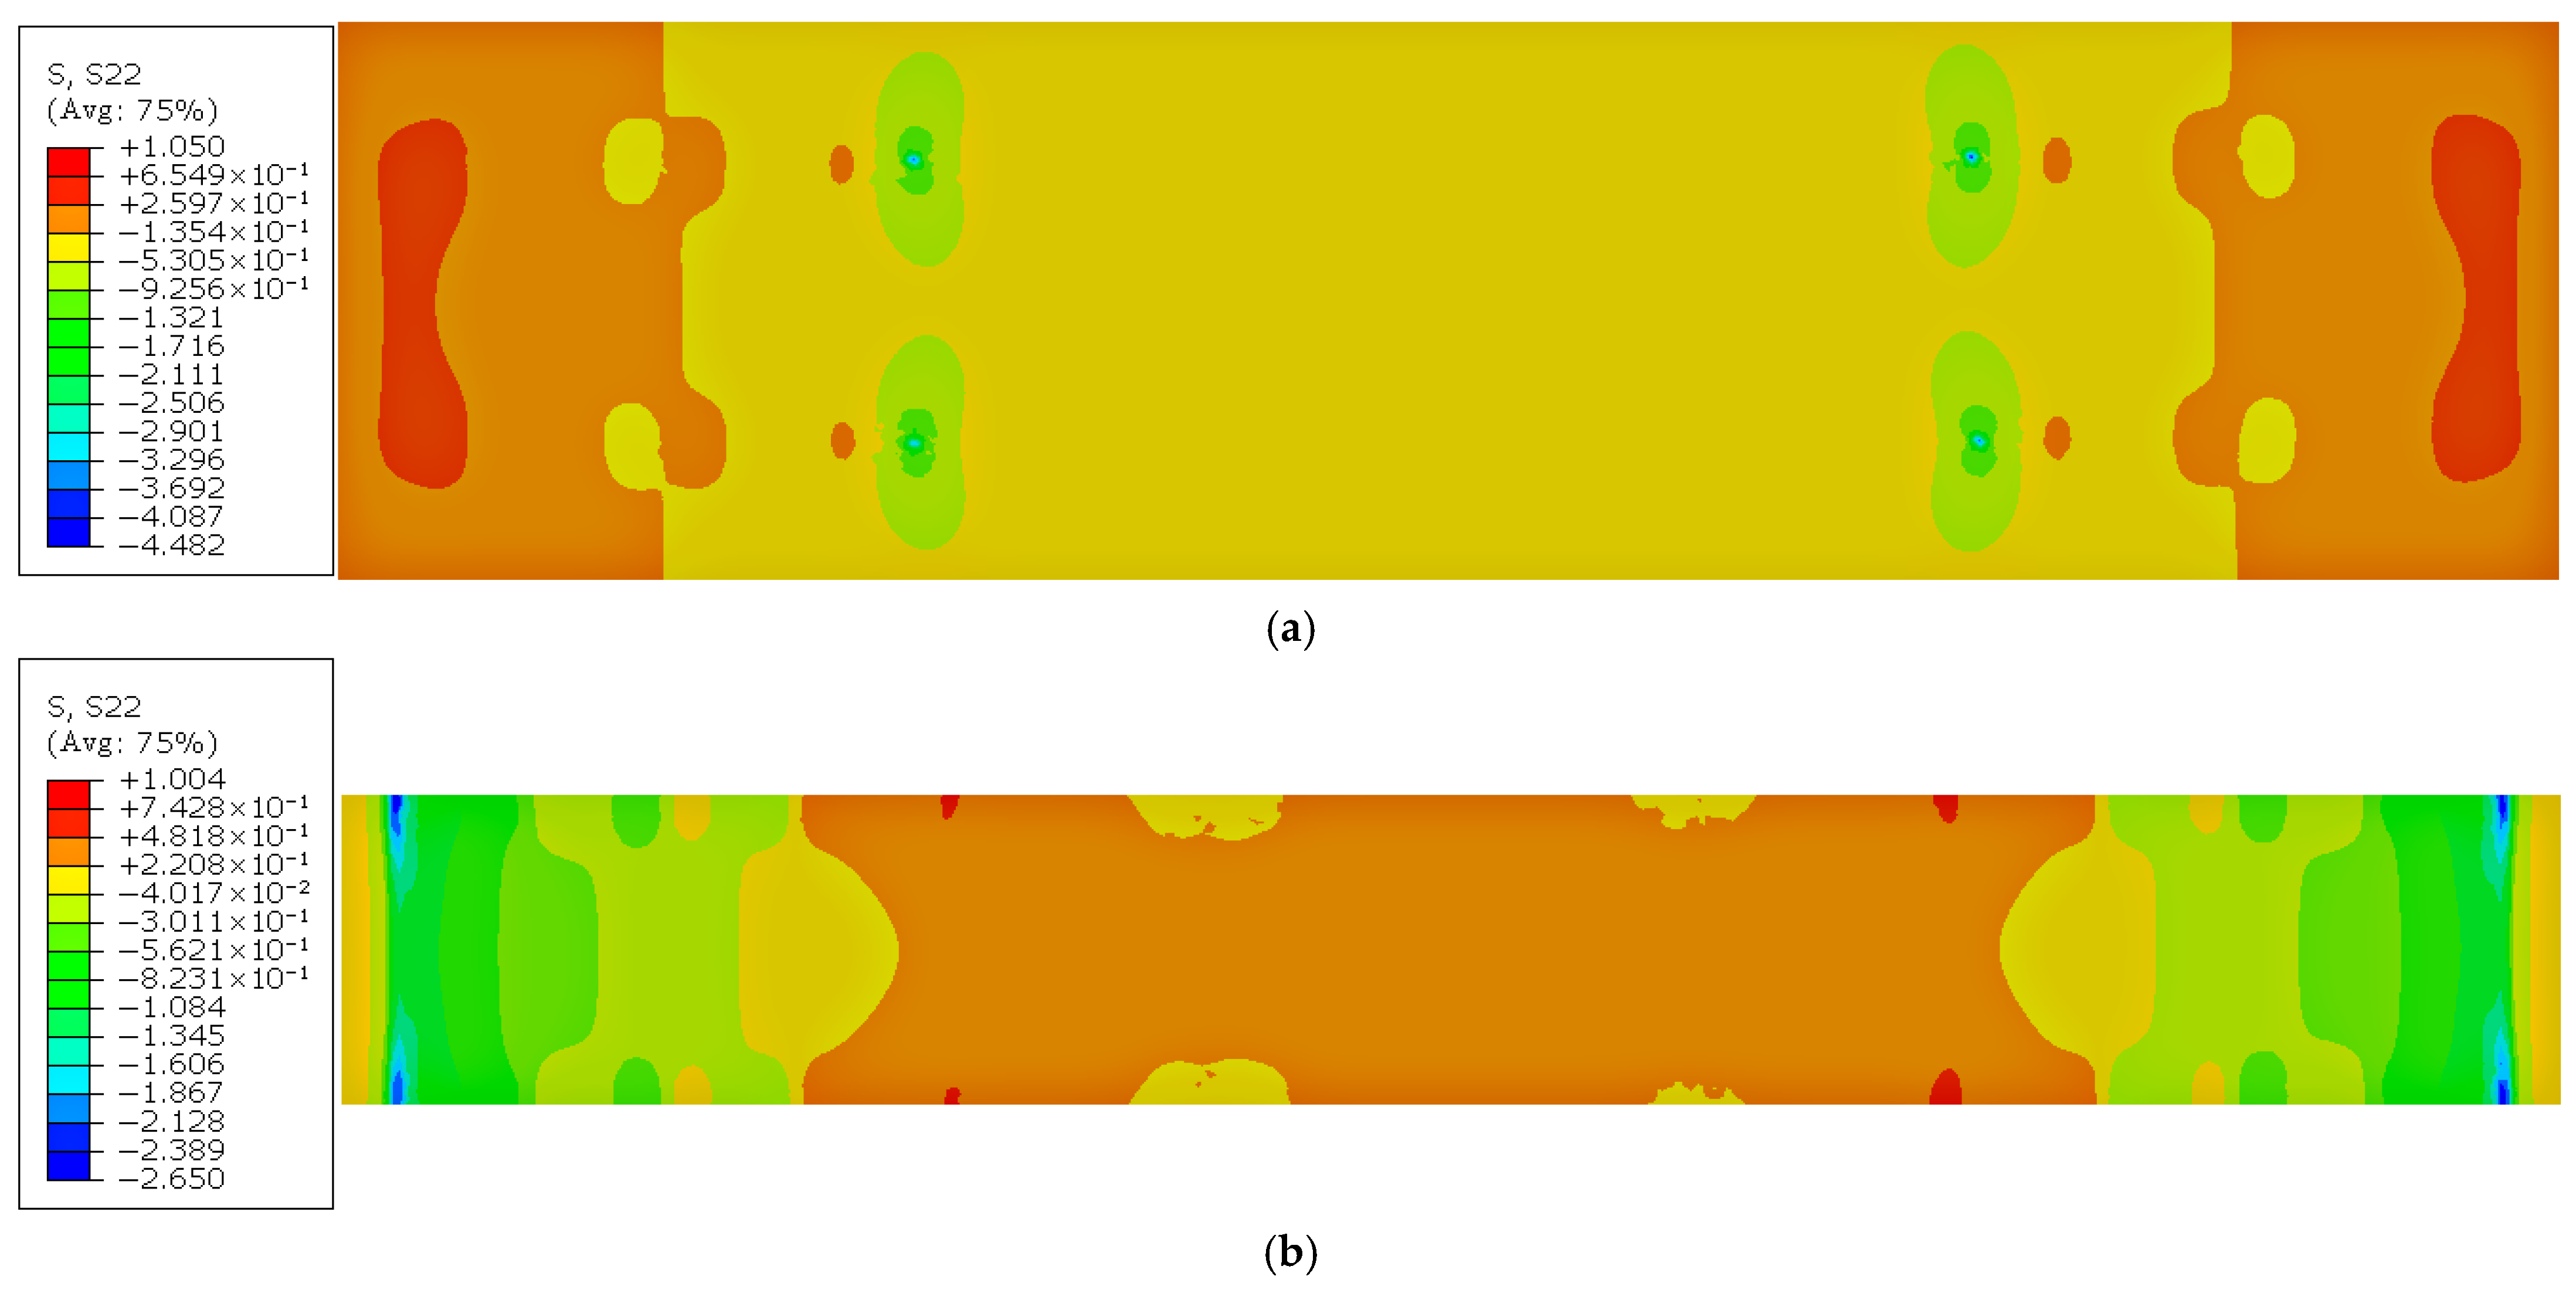
The normal stress distribution in the top and bottom slabs of the GFRP composite truss web girder bridge under mid-span concentrated loading is shown in Figure 13.
Figure 13.
Normal stress distribution contours of the concrete top and bottom slabs of the GFRP composite truss web girder beam bridge (MPa). (a) Normal stress contour of the concrete top slab; (b) Normal stress contour of the concrete bottom slab.
As presented in Figure 13, under a mid-span concentrated load, a symmetrical transverse stress distribution is exhibited by the concrete top and bottom slabs. A pronounced shear lag effect is observed, characterized by elevated stress magnitudes in the mid-span region.
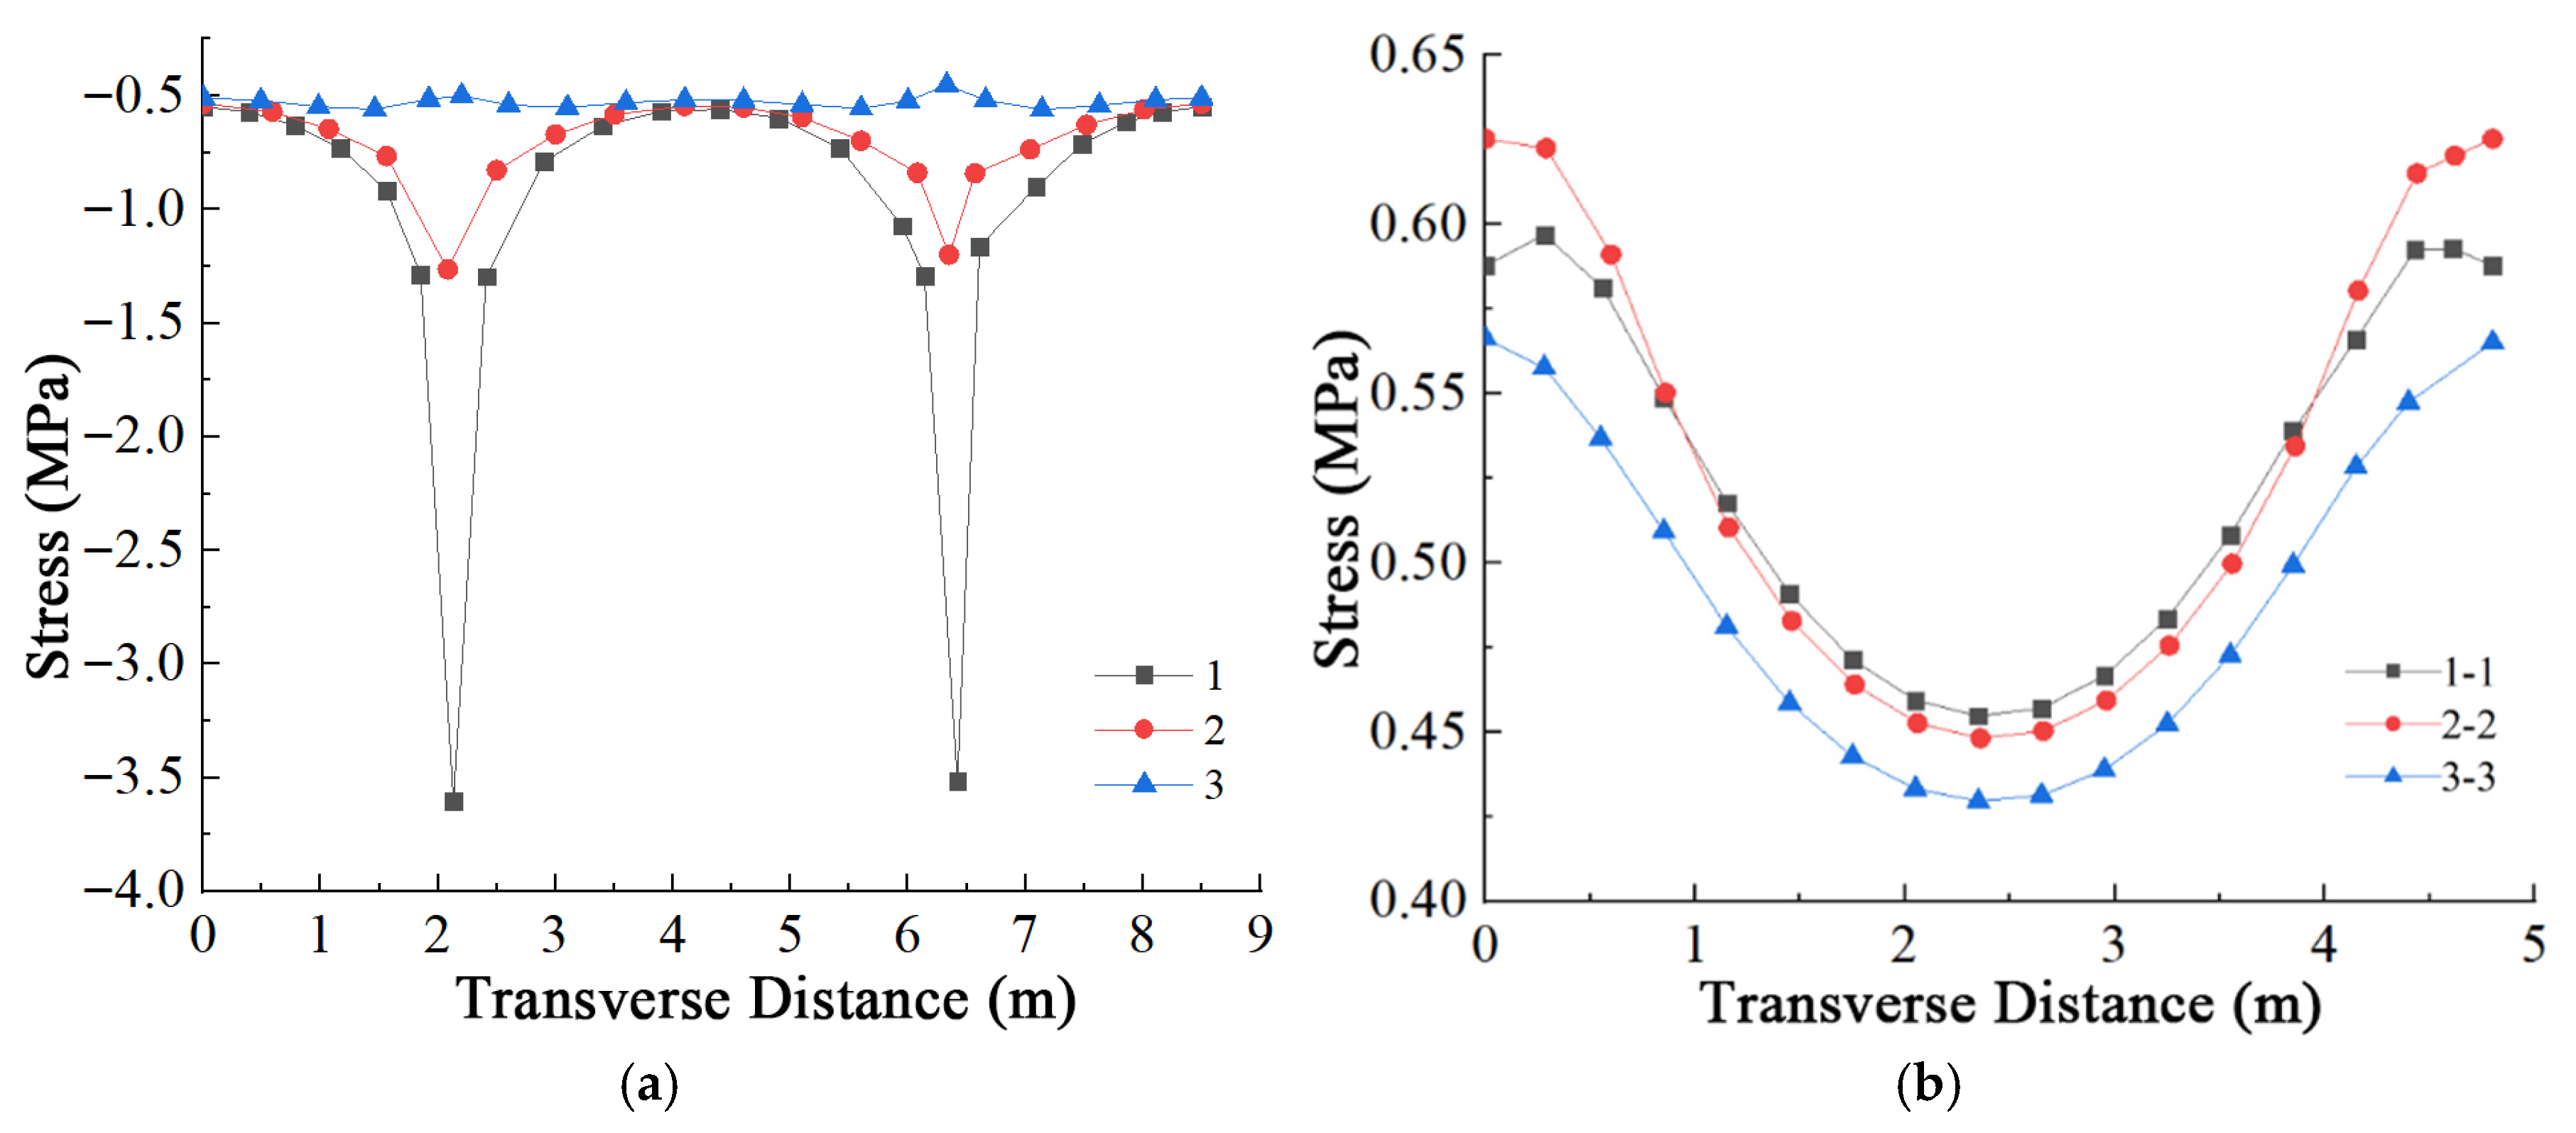
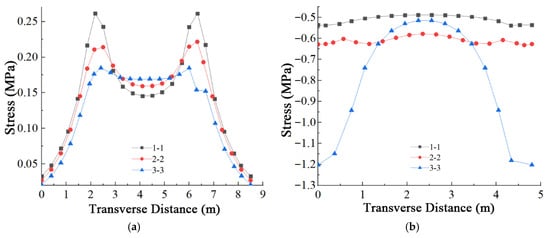
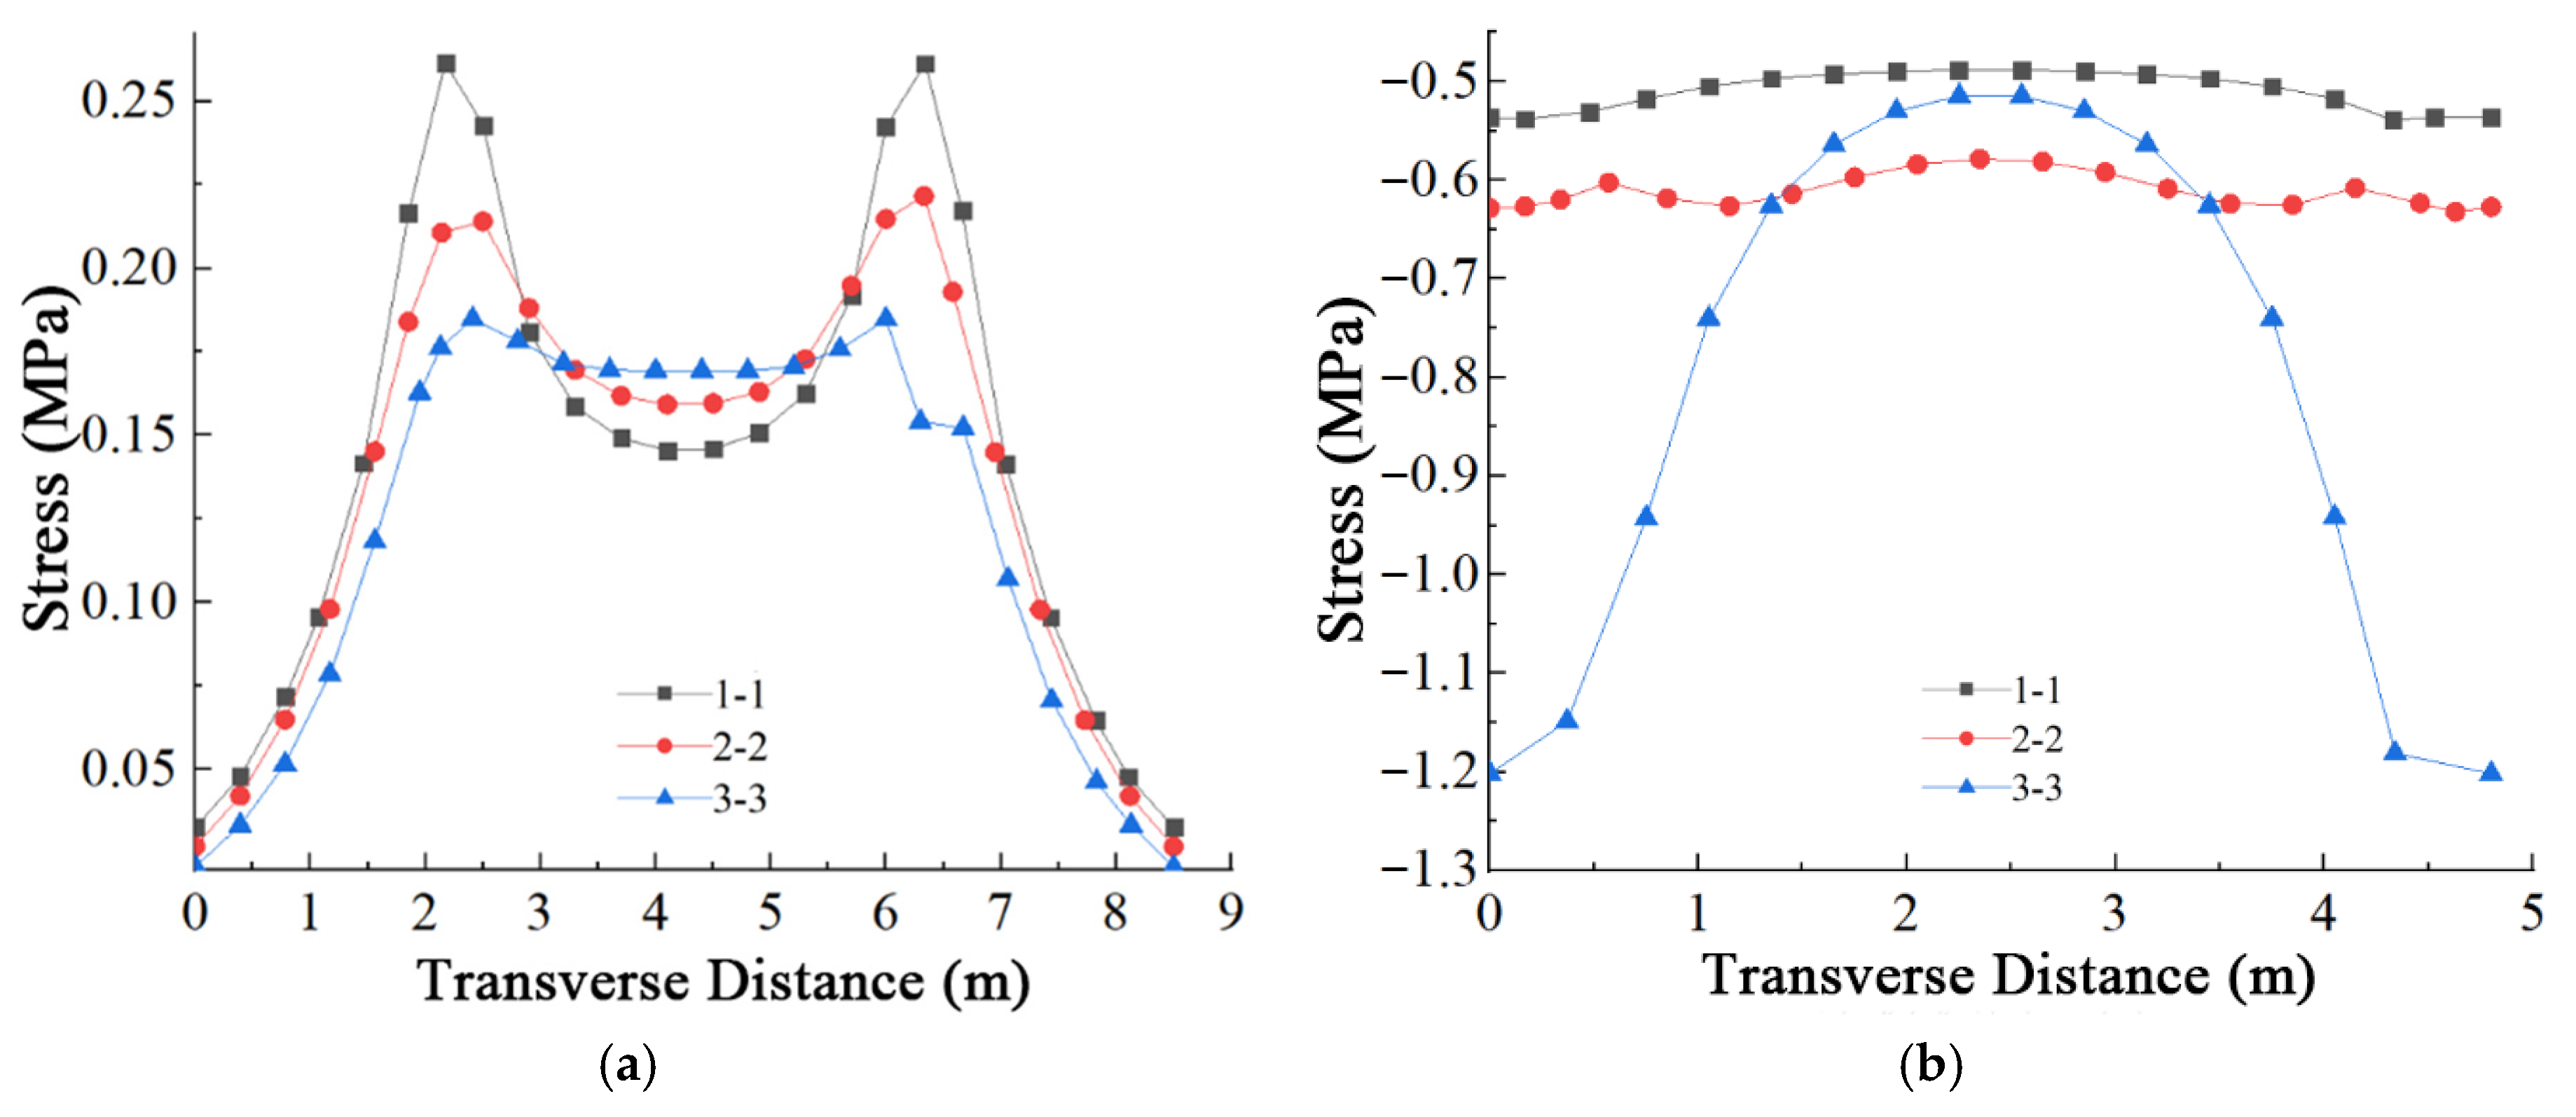
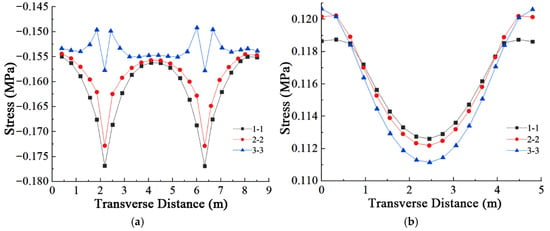
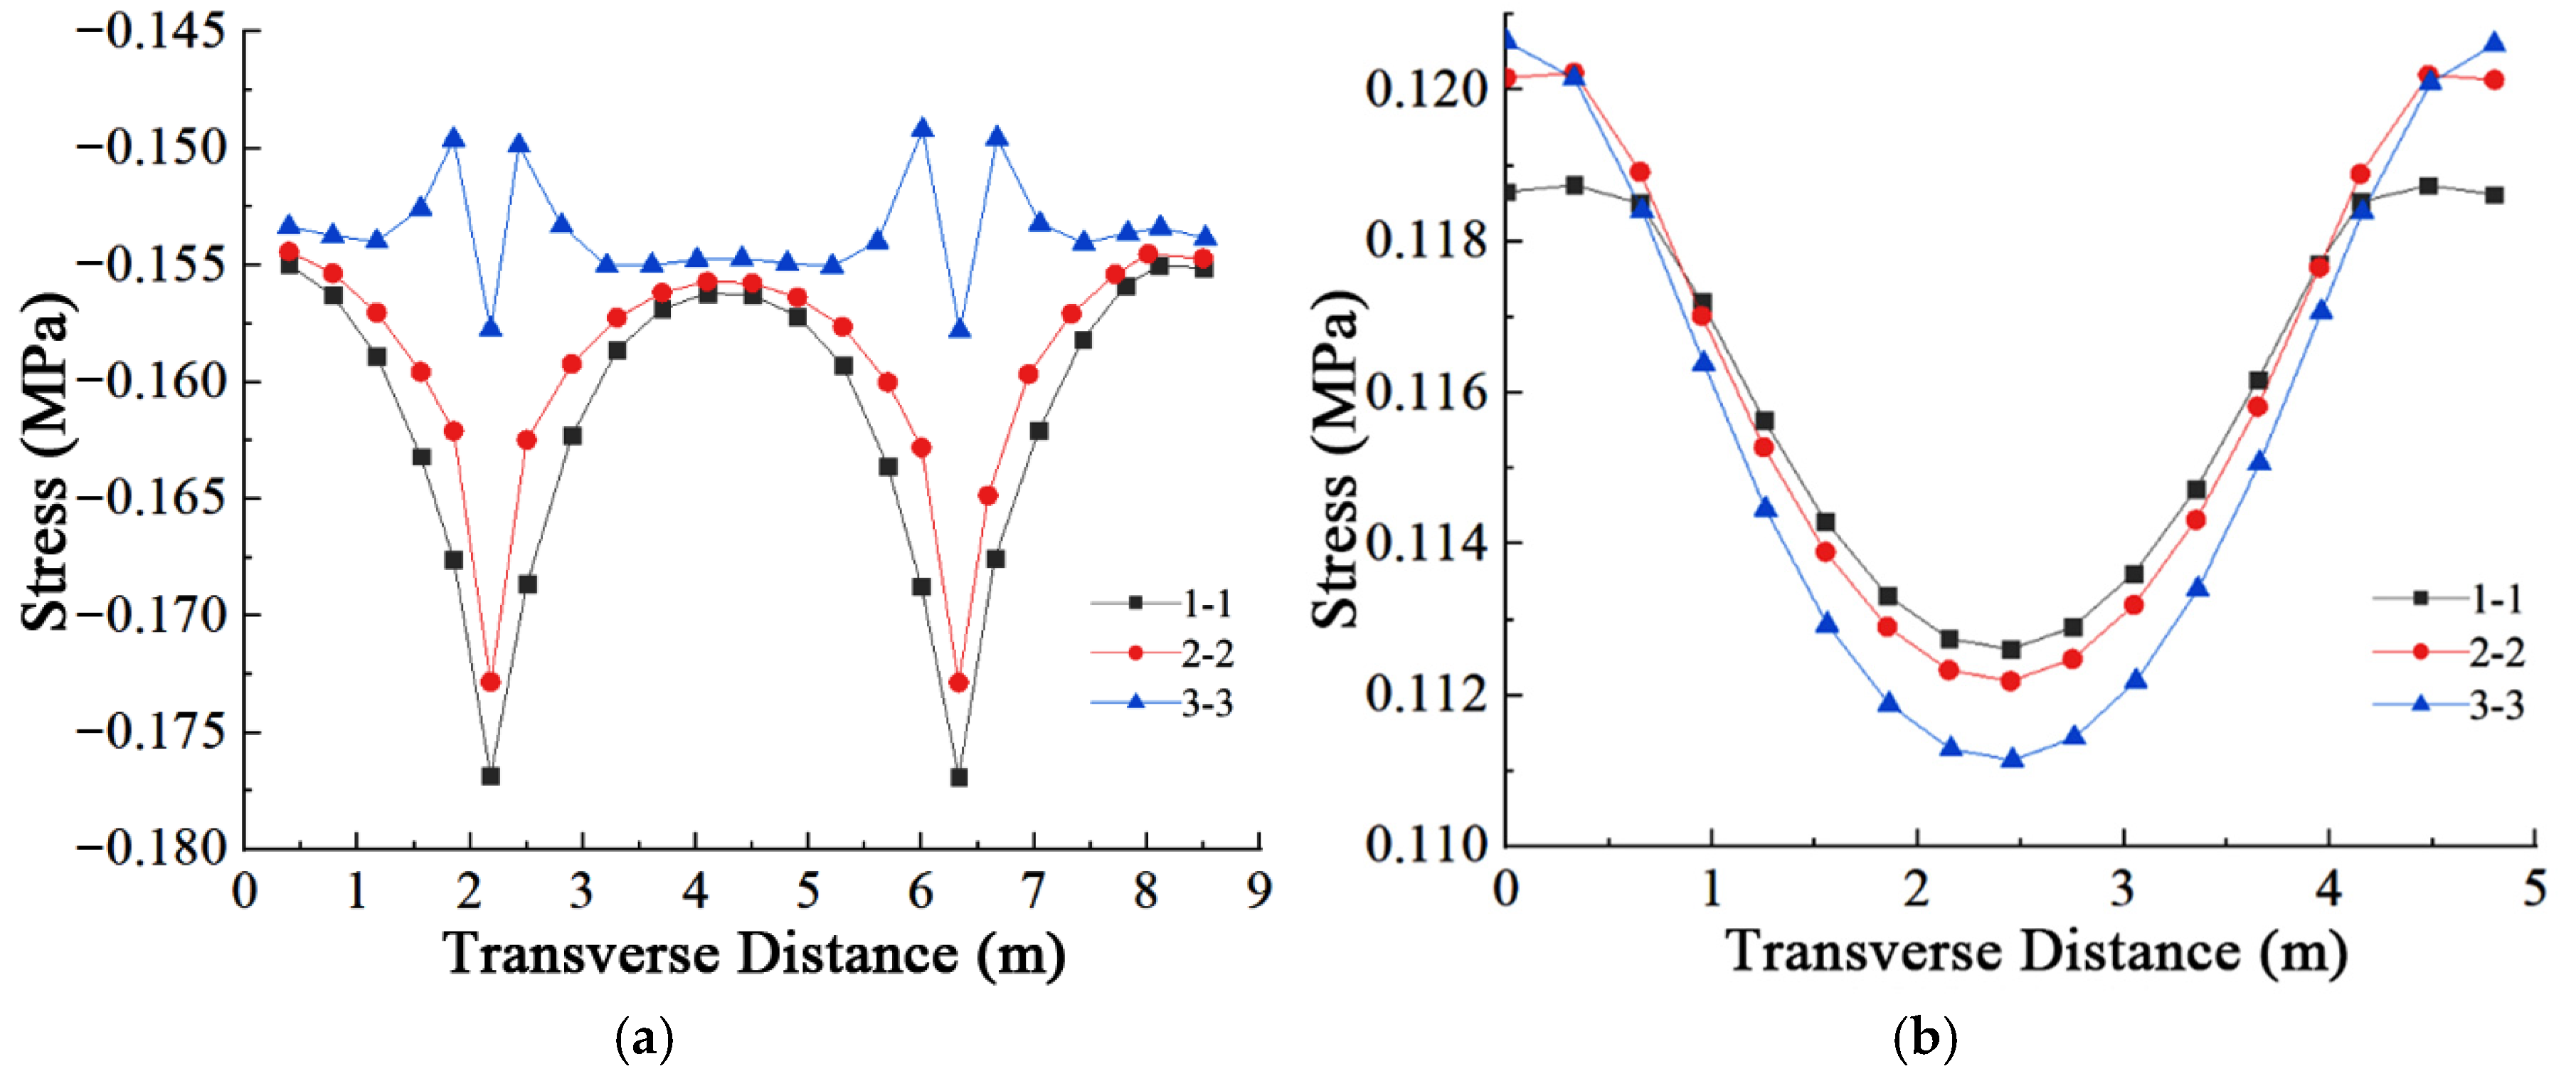
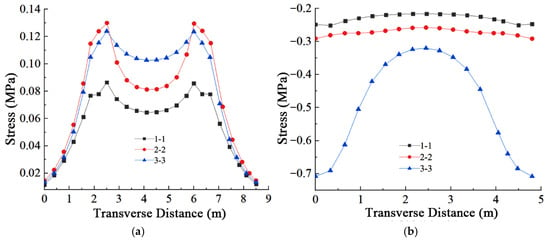
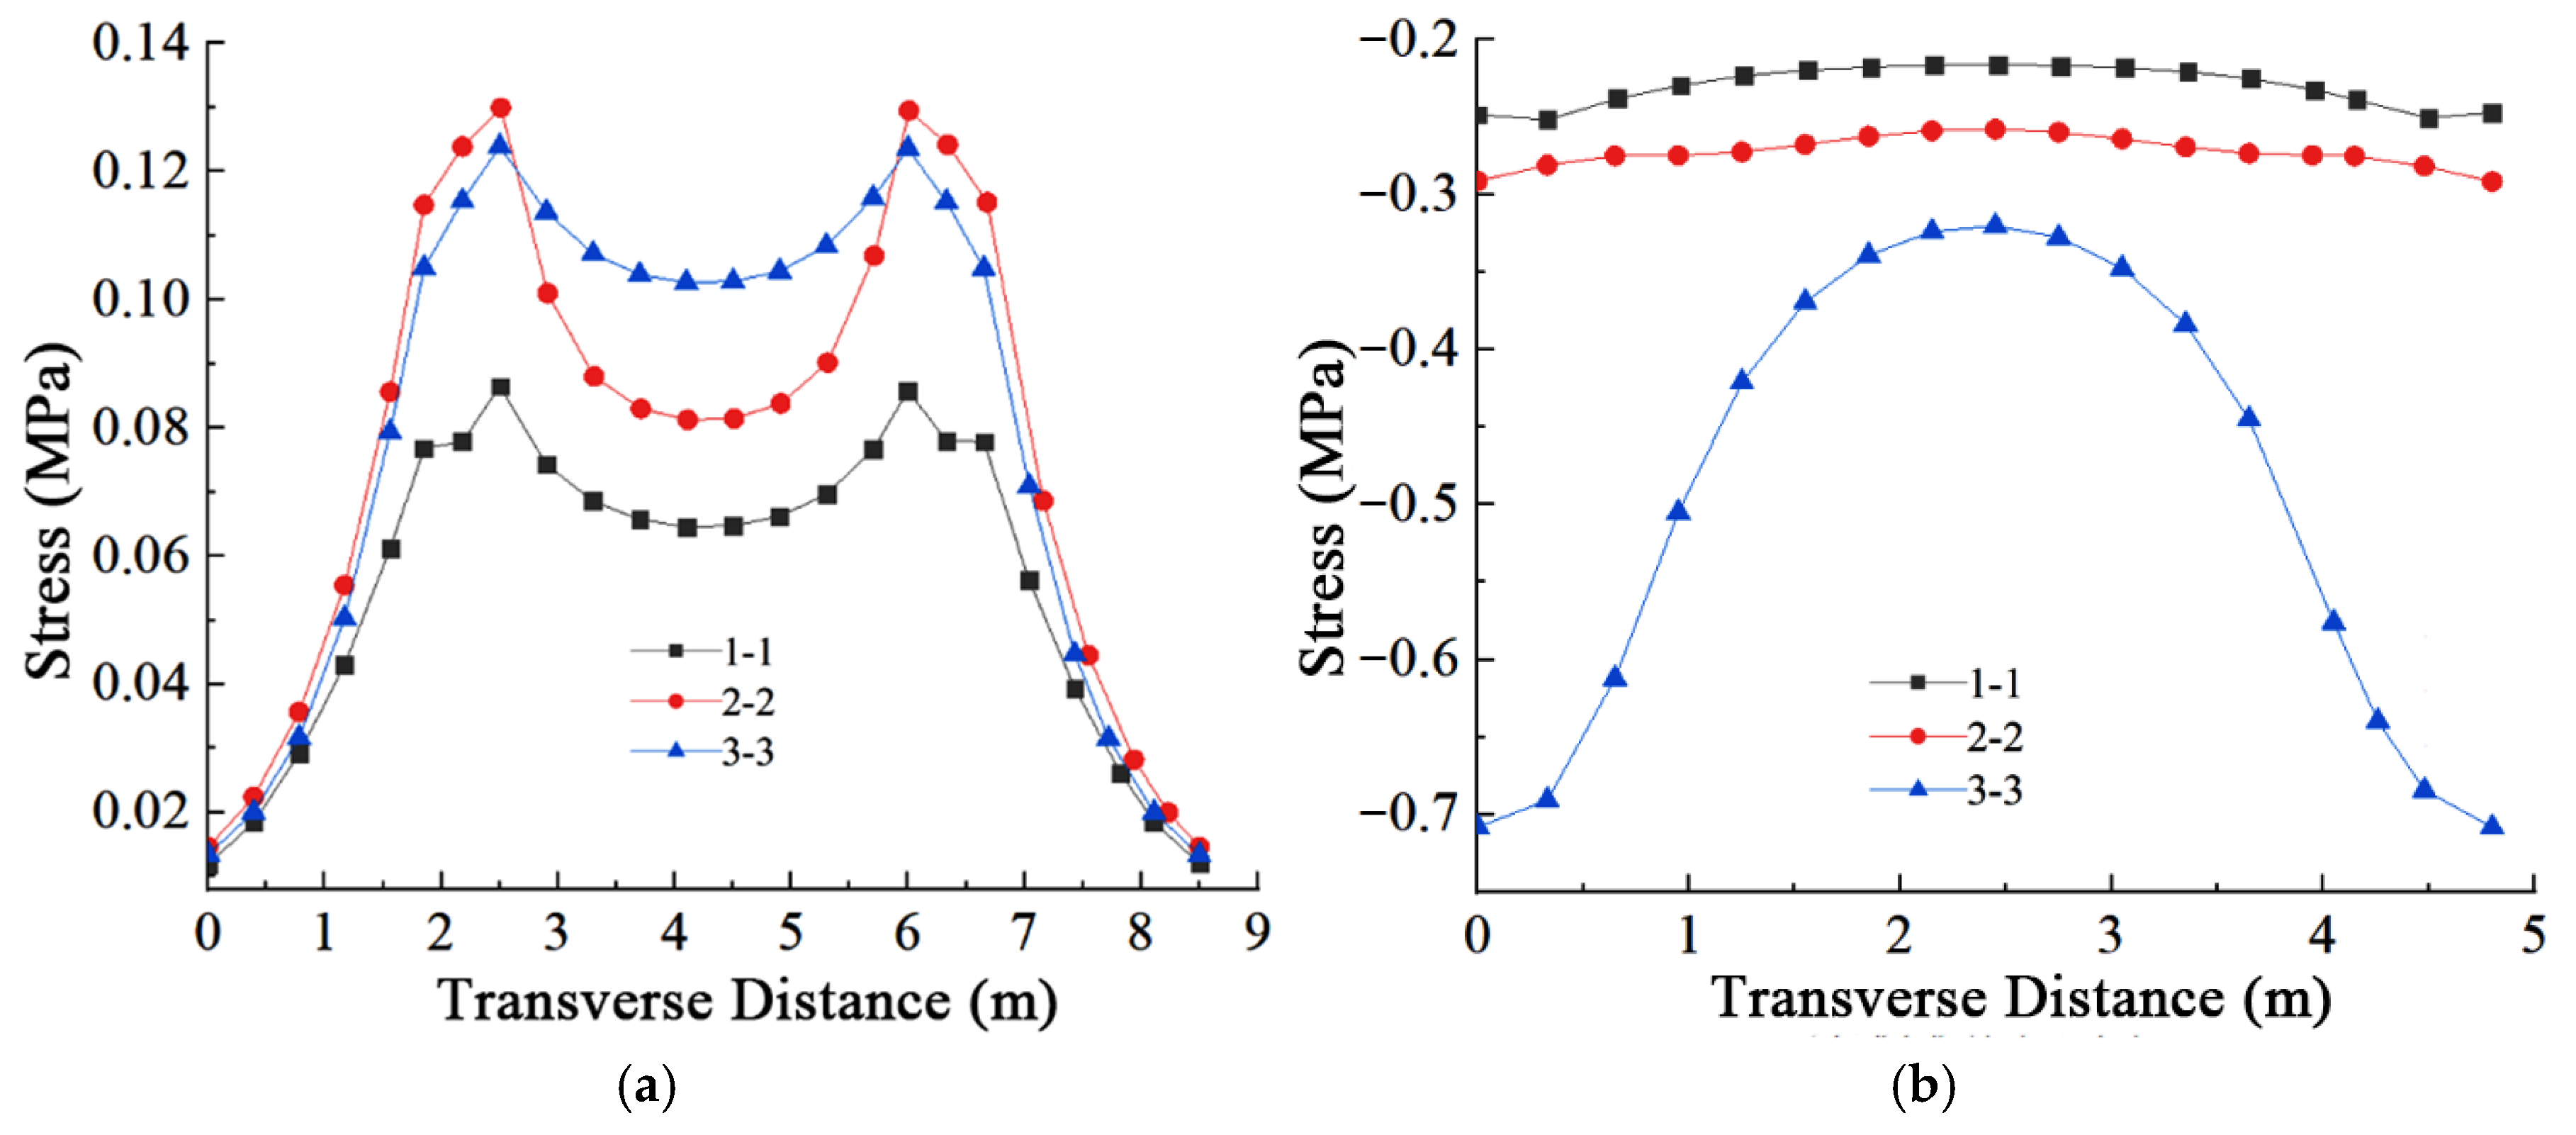
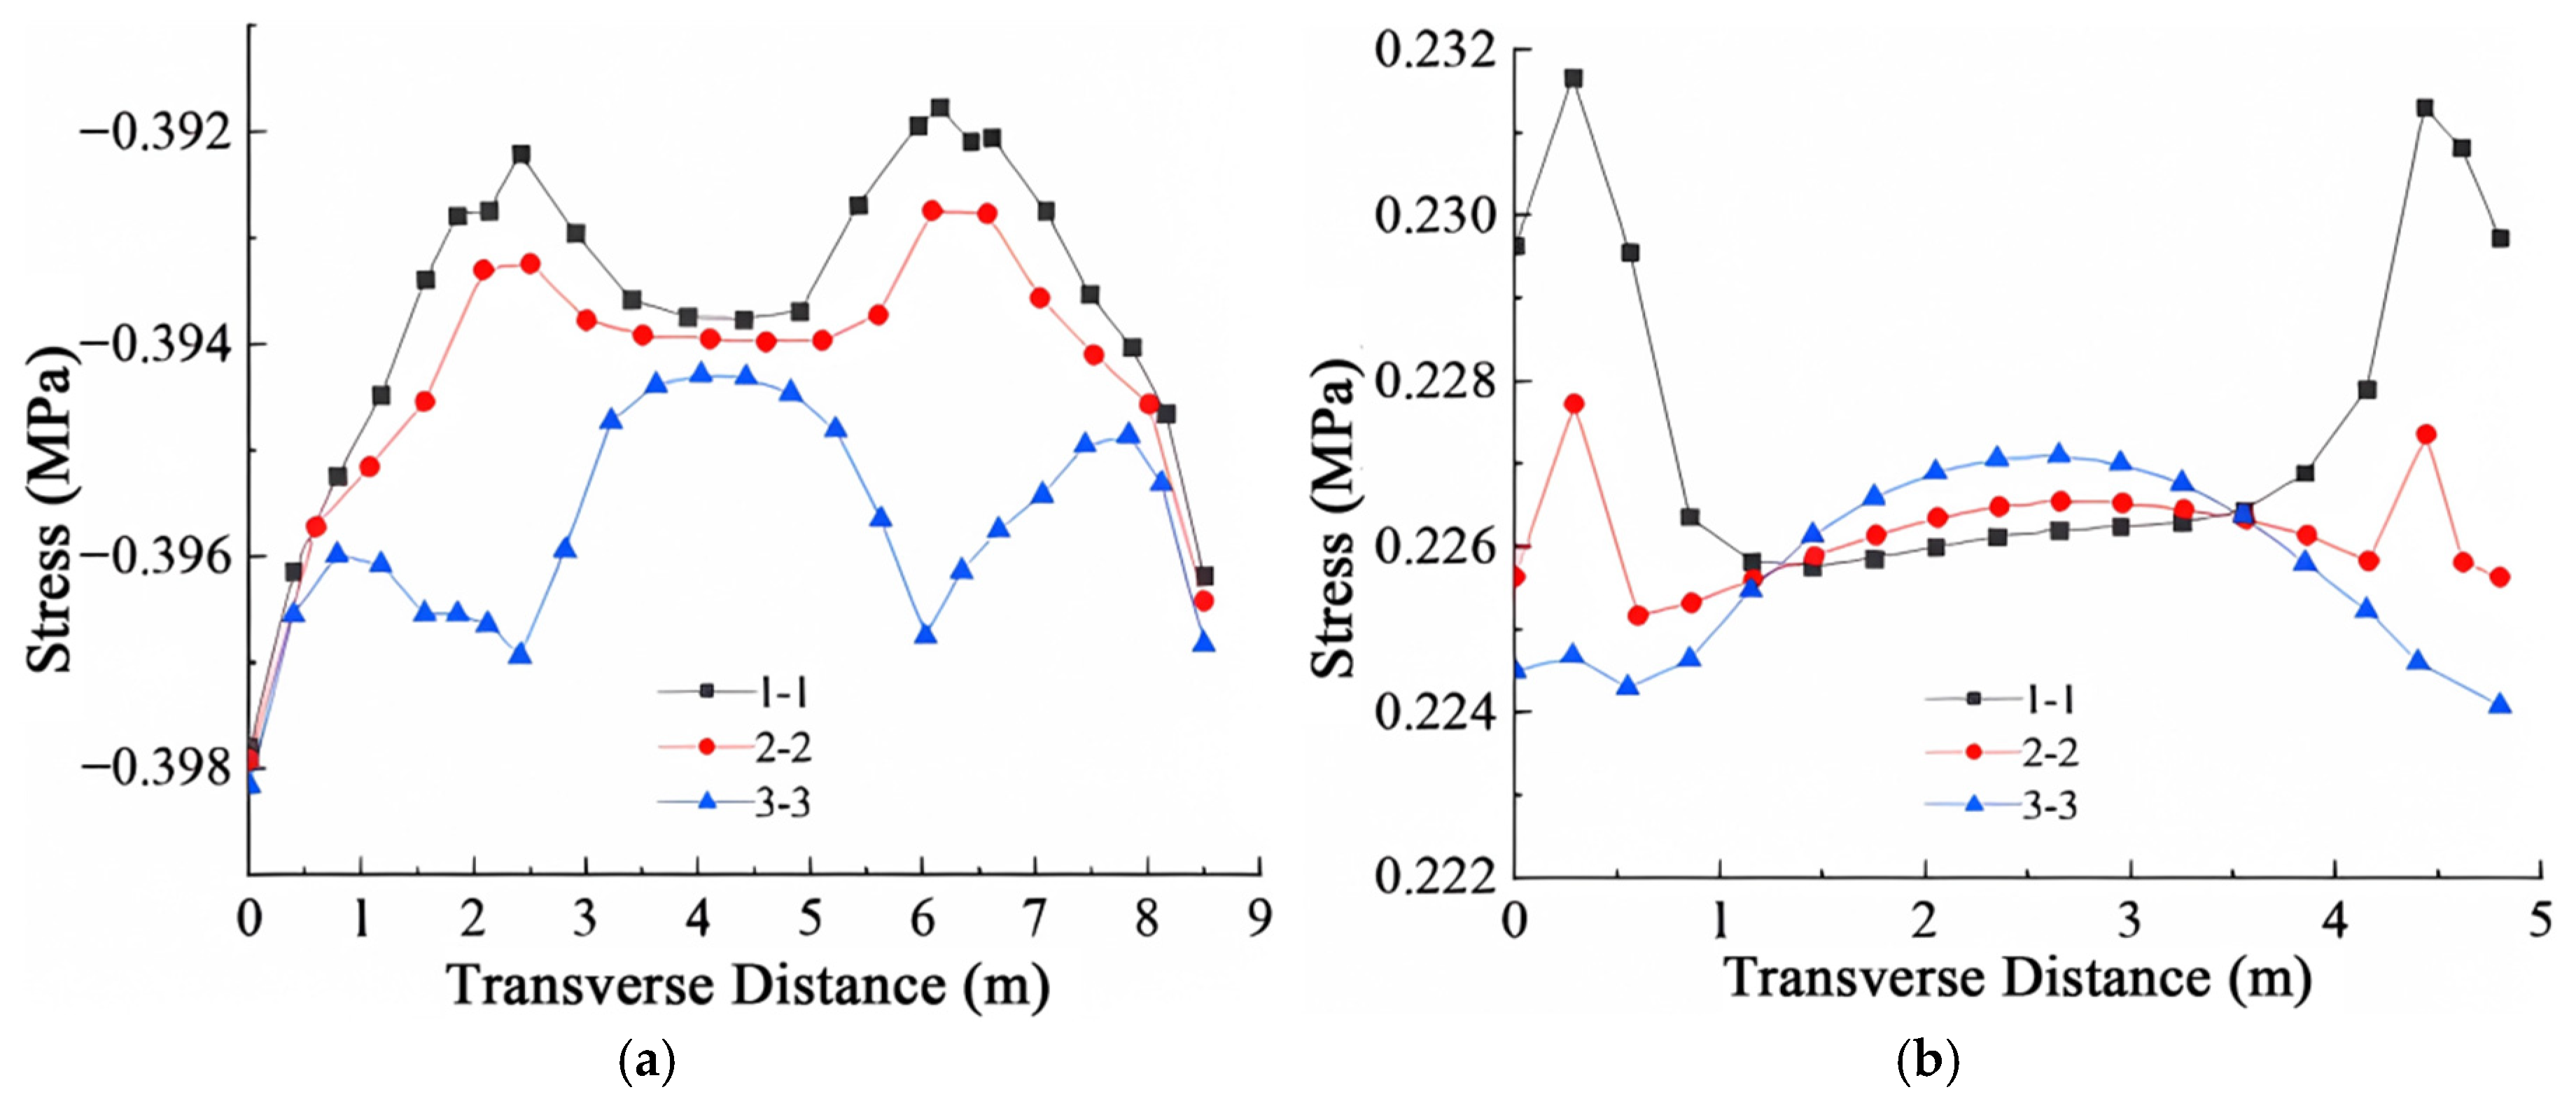
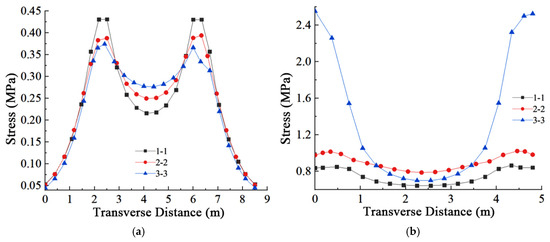
To further quantify these distributions, stress data across the various cross-sections were extracted and are detailed in Figure 14, Figure 15 and Figure 16.
Figure 14.
Stress distribution across cross-sections in the mid-span Region A. (a) Normal stress of the concrete top slab. (b) Normal stress of the concrete bottom slab.
Figure 15.
Normal stress distribution across cross-sections in the side-span Region B. (a) Normal stress of the concrete top slab; (b) Normal stress of the concrete bottom slab.
Figure 16.
Stress distribution across cross-sections in the support Region C. (a) Normal stress of the concrete top slab; (b) Normal stress of the concrete bottom slab.
Based on the transverse stress profiles presented in Figure 14, Figure 15 and Figure 16, the response characteristics of the GFRP composite truss web girder bridge under mid-span concentrated loading are summarized as follows:
- (1)
- Mid-span Region (A):
Significant stress gradients are observed in the concrete top slab at Sections 1-1 and 2-2, with peak compressive stresses localized at the truss-to-slab connections. This non-uniform distribution is directly attributed to the positive shear lag effect, where shear force is transferred from the truss members to the slab, causing stress concentrations at the nodal junctions that decay towards the geometric center. In contrast, the bottom slab exhibits a consistent trend of decaying magnitude from the transverse edges toward the center across all sections, further verifying the presence of shear lag diffusion across the flange width.
- (2)
- Side-span Region (B):
A transitional behavior is exhibited in this zone. While the stress profile in the top slab at Section 1-1 remains relatively stable, distinct fluctuations are detected in Section 2-2 and the lower portion of Section 3-3. These local variations stem from the discrete nature of the truss support mechanism, which induces localized stress concentrations even in regions with lower global bending moments. Conversely, the bottom slab maintains a largely uniform distribution, suggesting that the transverse shear lag effect is attenuated in the tension flange within this transition zone.
- (3)
- Support Region (C):
Substantial and synchronous stress variations are exhibited by all three top slab sections, characterized by peaks aligned with the truss connections. Conversely, a distinct spatial disparity is evident in the bottom slab: while Sections 1-1 and 2-2 maintain a relatively uniform stress state with negligible fluctuations, a complex concave profile is identified at Section 3-3, where stresses decrease initially before rising. It is acknowledged that for a simply supported system, the longitudinal bending stress at the supports should theoretically be zero. The observed stress concentrations in Region C are identified as local effects arising from the boundary condition modeling. In the FE model, the supports were simplified as rigid constraints applied to specific nodes, the concentrated reaction forces at these constrained nodes induce localized stress concentrations and complex redistribution in their immediate vicinity. According to Saint-Venant’s principle, restricting degrees of freedom at discrete points creates localized stress singularities and constrains lateral deformation due to the Poisson effect. The stress patterns captured at sections near the support result from the coupling of this local constraint effect with the shear lag mechanism, rather than representing the global flexural stress state. In an actual bridge, bearings and supporting elements would allow for a more gradual stress transfer, mitigating such extreme local variations. Nonetheless, the model correctly highlights that regions adjacent to rigid supports experience altered stress diffusion paths, which is a critical consideration for localized reinforcement design. This localized effect does not invalidate the overall shear lag analysis presented for the span regions.
3.1.2. Full-Span Uniformly Distributed Load
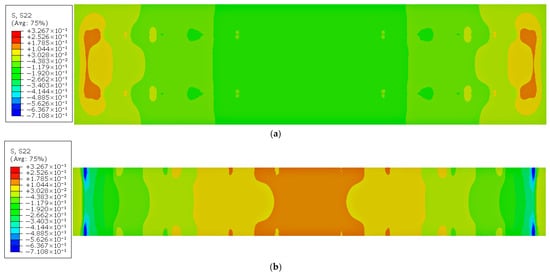
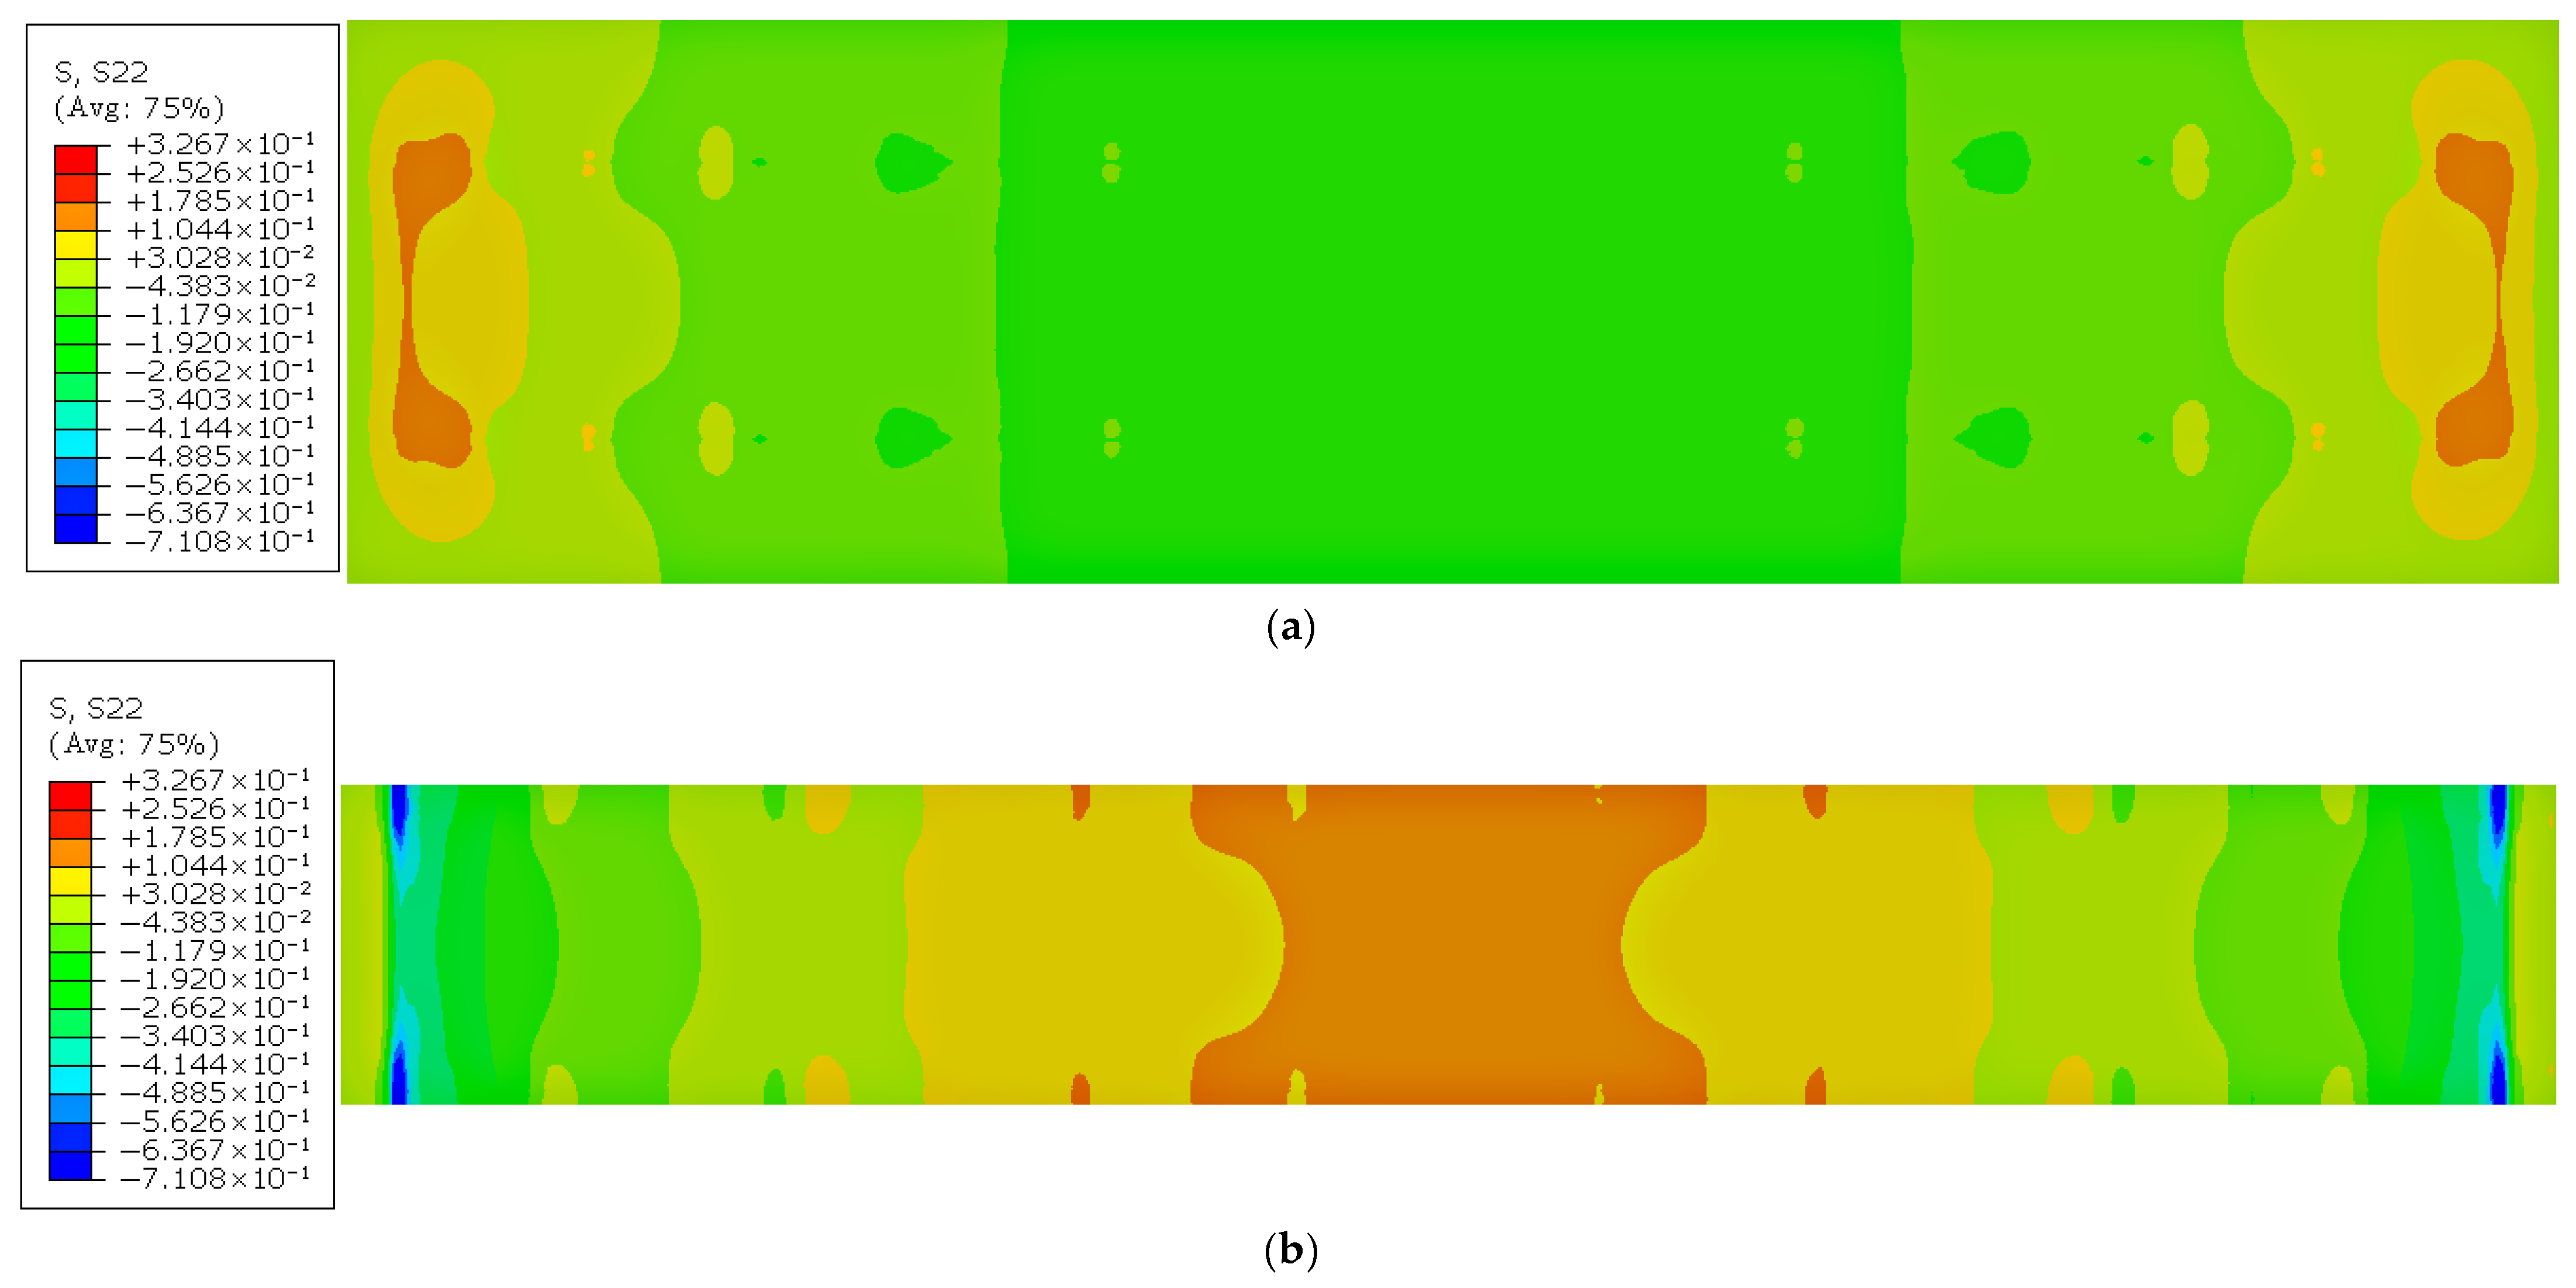
The normal stress distribution contours for the concrete top and bottom slabs under a full-span distributed load are illustrated in Figure 17.
Figure 17.
Normal Stress Distribution Contours of GFRP Composite Truss Girder Bridge Top and Bottom Slabs (MPa). (a) Normal Stress Contour of Concrete Top Slab; (b) Normal Stress Contour of Concrete Bottom Slab.
As observed, a symmetrical transverse stress distribution is exhibited by the structure, characterized by elevated stress levels near the support regions and a pronounced shear lag effect.
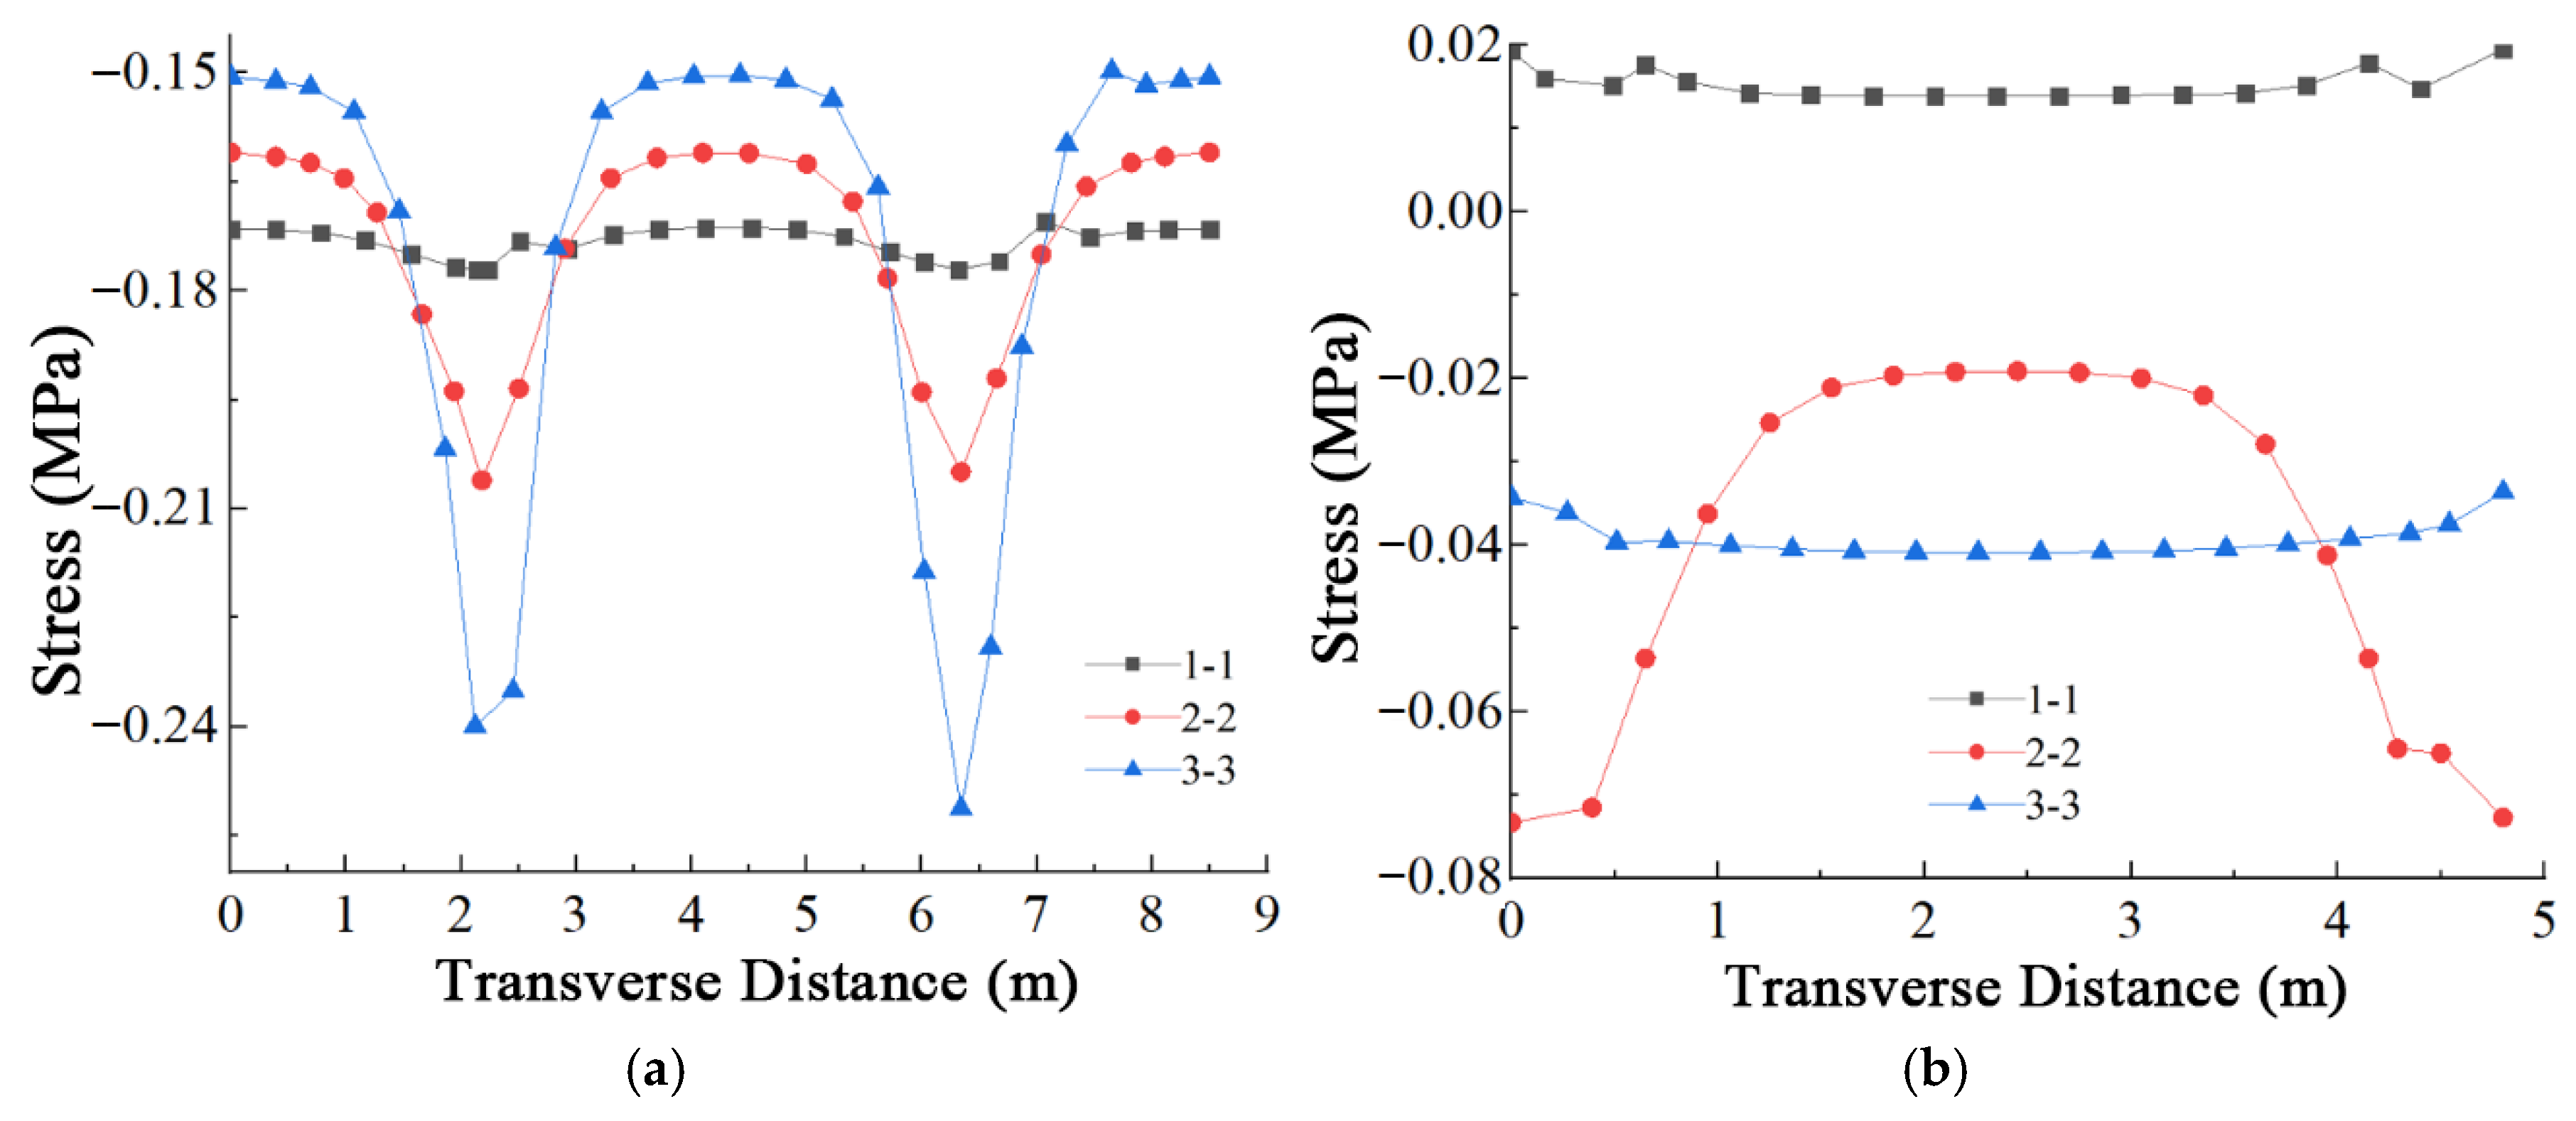
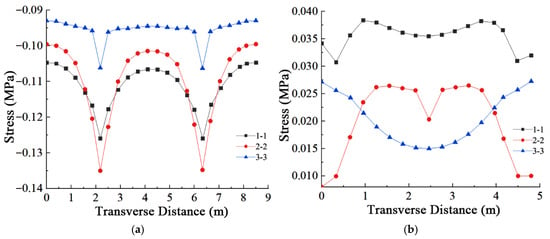
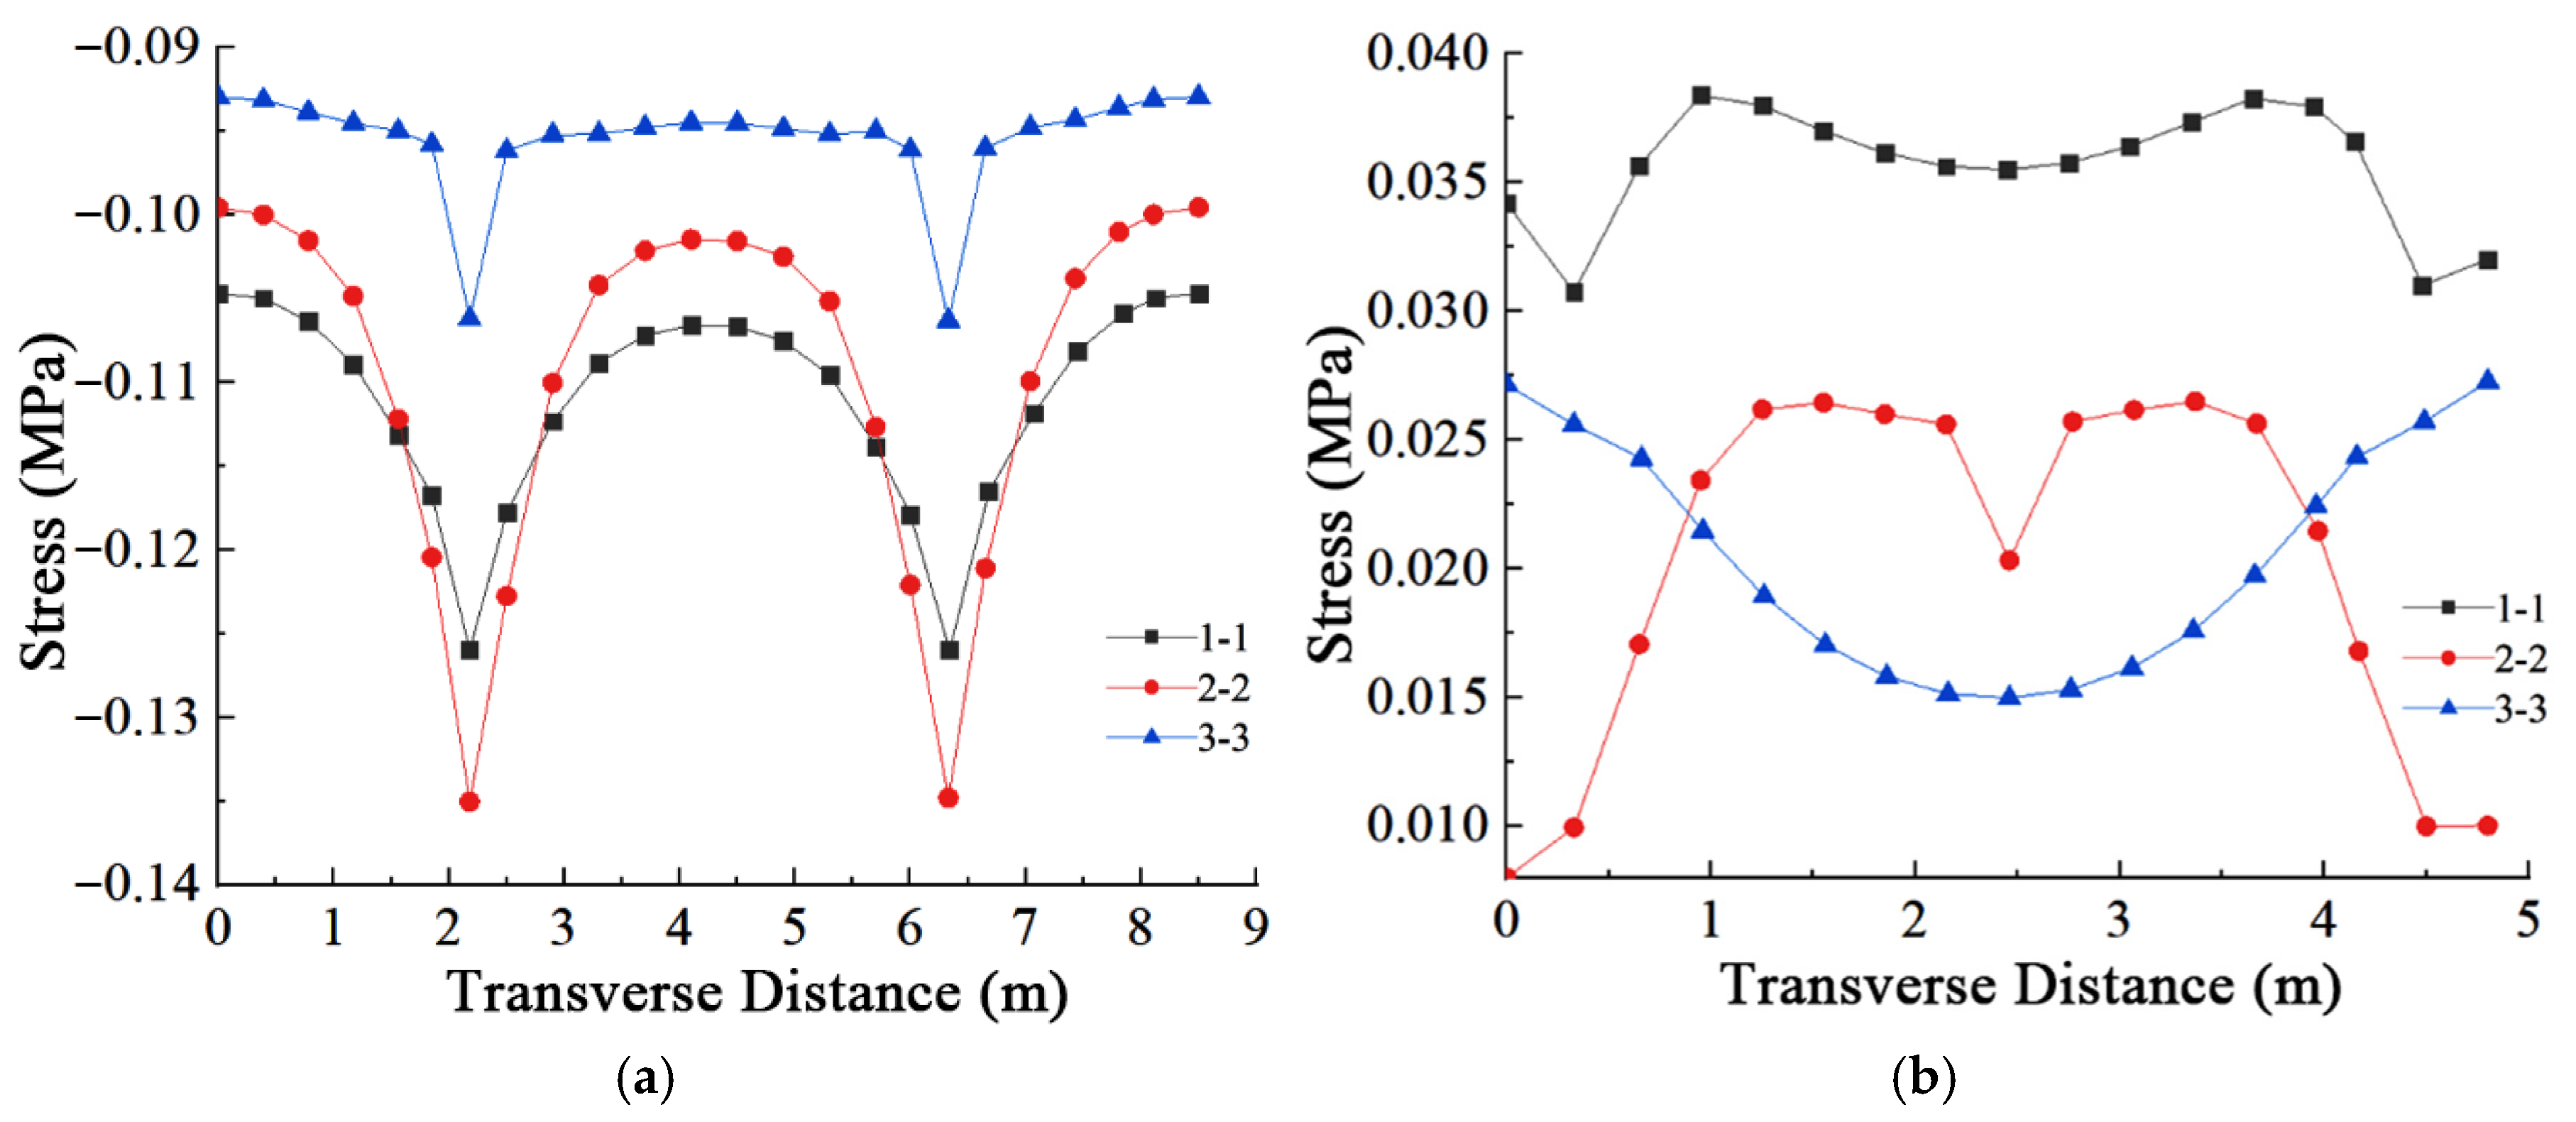
To quantify these behaviors, transverse stress data across the specific cross-sections were extracted and are presented in Figure 18, Figure 19 and Figure 20.
Figure 18.
Stress Distribution at Cross-Sections in Mid-Span Region A. (a) Stress of Concrete Top Slab. (b) Stress of Concrete Bottom Slab.
Figure 19.
Normal Stress Distribution at Cross-Sections in Side-Span Region B. (a) Stress of Concrete Top Slab. (b) Stress of Concrete Bottom Slab.
Figure 20.
Normal Stress Distribution at Cross-Sections in Support Region C. (a) Stress of Concrete Top Slab. (b) Stress of Concrete Bottom Slab.
Based on the transverse stress profiles presented in Figure 18, Figure 19 and Figure 20, the response characteristics of the concrete top and bottom slabs under full-span uniformly distributed loading are summarized as follows:
- (1)
- Mid-span Region (A):
Significant stress variations with similar trends are observed in the top slab at Sections 1-1 and 2-2, characterized by peak stresses localized at the truss-to-slab connections. Although Section 3-3 exhibits a reduced magnitude of variation, the stress maxima remain consistent with the truss support locations, reflecting the persistent influence of the discrete load transfer mechanism even under distributed loading, which directly intensifies the shear lag effect in this region.
- (2)
- Side-span Region (B):
A stress distribution pattern similar to the mid-span region is maintained in the top slab. Sections 1-1 and 2-2 exhibit pronounced variations peaking at the truss supports, indicating that localized stress concentrations persist across the span. Regarding the bottom slab, stress variations remain minimal, with the maximum deviation in Section 2-2 reaching only 0.016 MPa. This behavior indicates that the transverse shear lag effect is largely negligible in this transitional zone, a phenomenon attributed to the lower absolute stress levels and the gradual variation in the global bending moment.
- (3)
- Support Region (C):
Substantial and synchronous stress fluctuations are exhibited by all three top slab sections, following a complex multi-stage pattern: increasing initially, decreasing at 2.5 m, rising at 4.5 m, and declining again at 6 m. This fluctuation highlights the intense stress concentration and redistribution induced by the support reaction. Conversely, a distinct spatial disparity is evident in the bottom slab: while stable stress states are maintained in Sections 1-1 and 2-2, a pronounced gradient is observed in Section 3-3. Consistent with the mid-span concentrated load case, this anomaly at the centerline is attributed to localized stress concentrations arising from the rigid boundary constraints in the FE model. Although the theoretical longitudinal bending stress at the support is zero, the discrete nodal constraints induce local disturbances compliant with Saint-Venant’s principle. These effects are strictly confined to the boundary vicinity and do not compromise the accuracy of the global stress diffusion analysis.
3.1.3. Two-Point Symmetric Loading
The normal stress distribution contours for the concrete top and bottom slabs under two-point symmetric loading are presented in Figure 21.
Figure 21.
Contour Maps of Normal Stress in Top and Bottom Slabs of GFRP Composite Truss Girder Bridge (MPa). (a) Contour Plot of Normal Stress in Concrete Top Slab. (b) Contour Plot of Normal Stress in Concrete Bottom Slab.
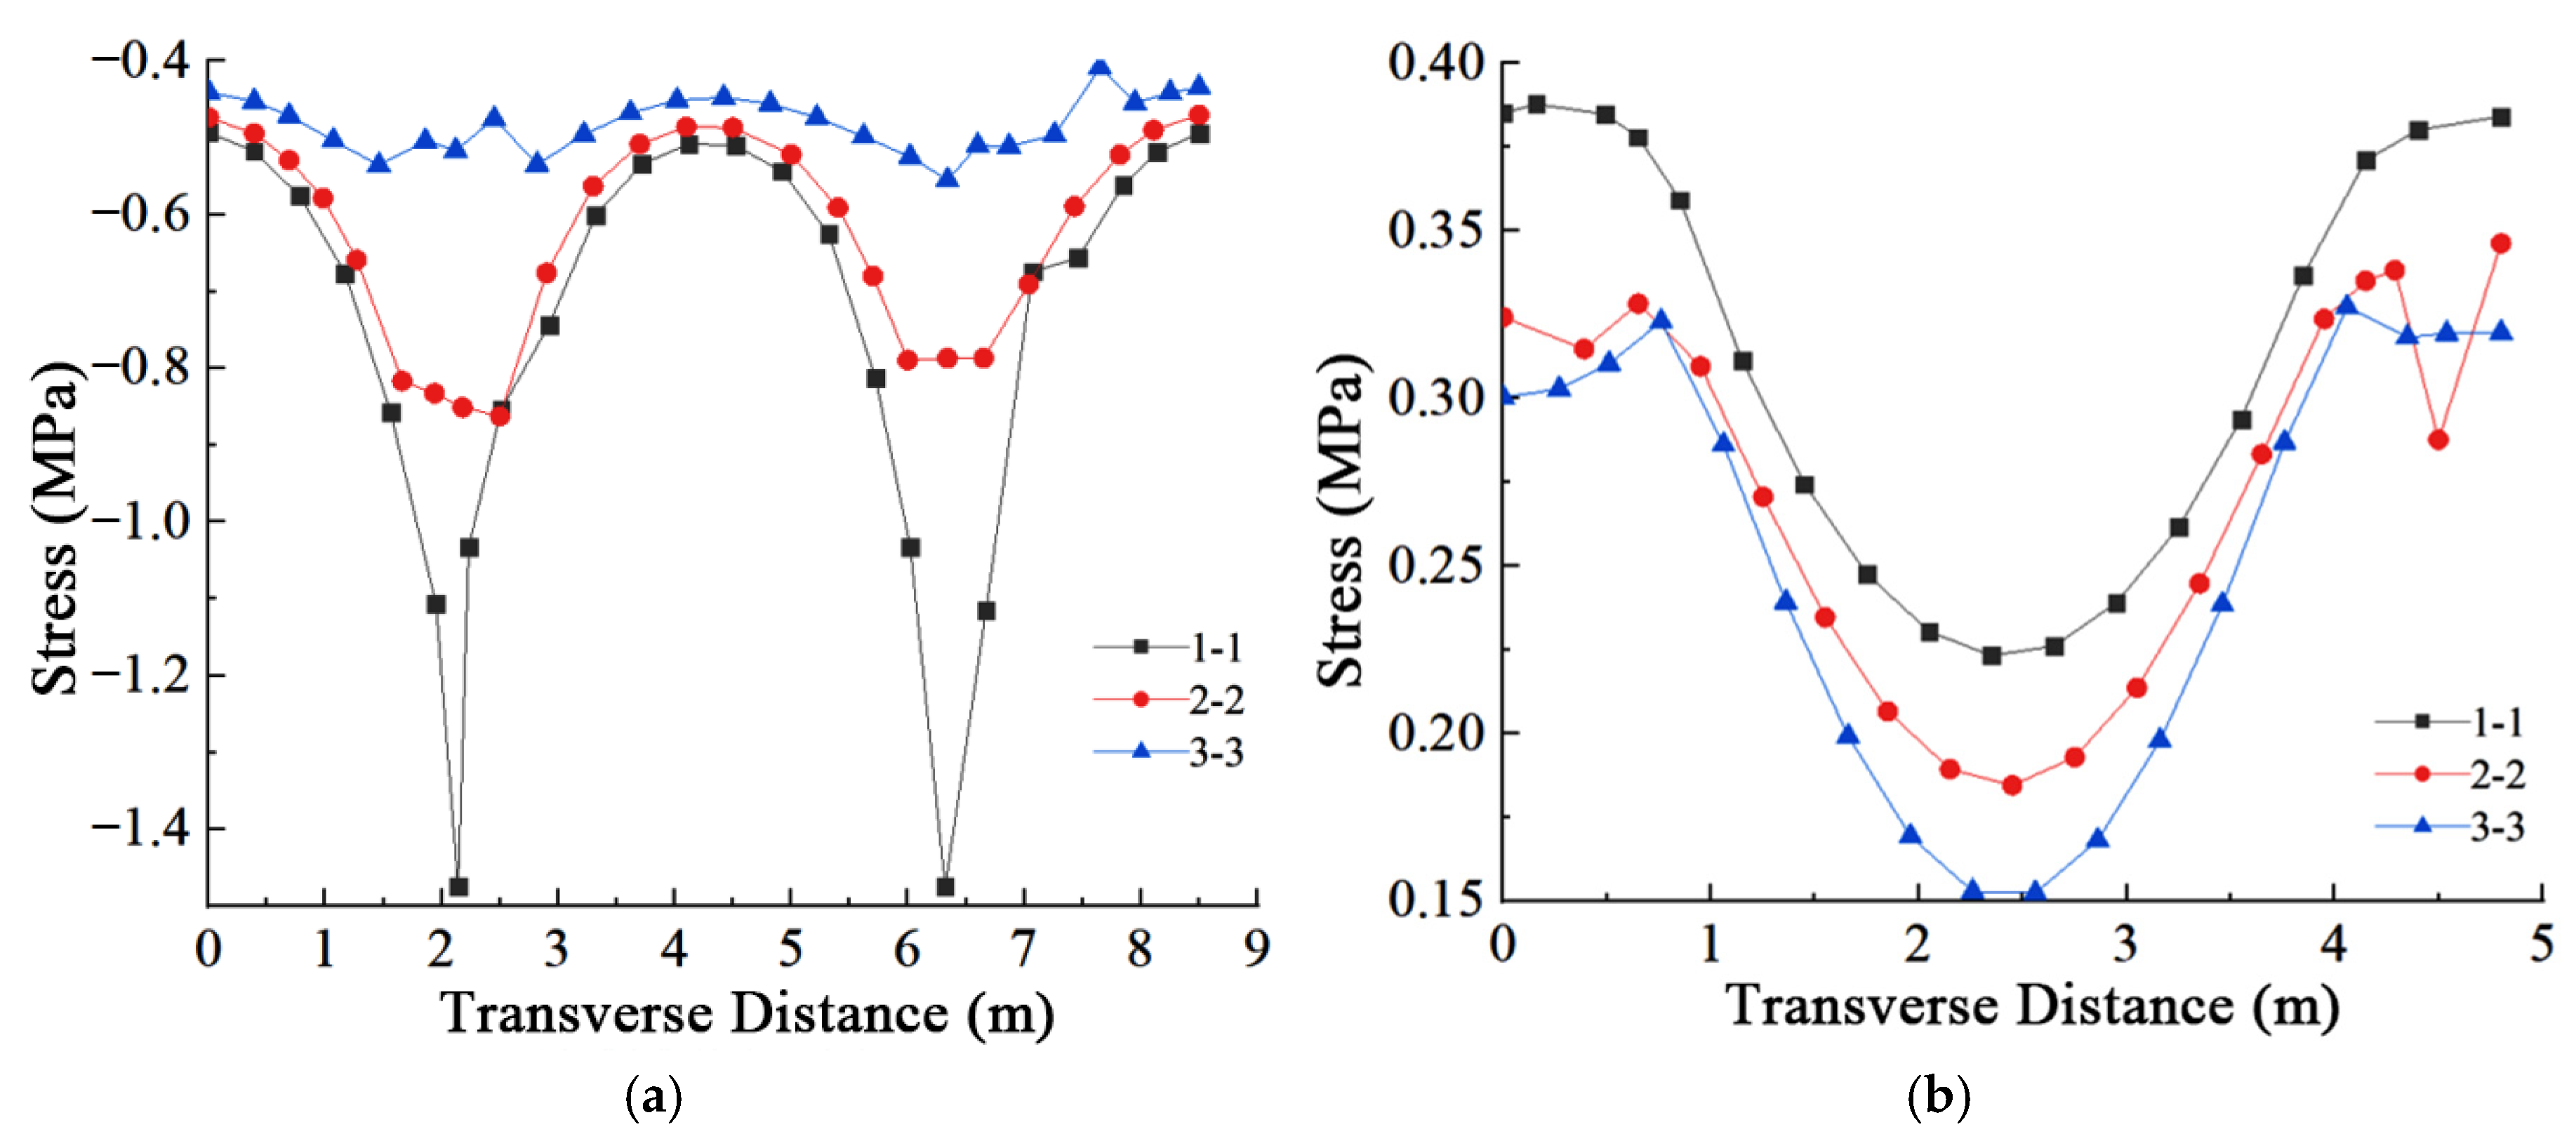
The structure’s transverse normal stress distribution was observed symmetrical, characterized by marked stress concentrations at loading and support locations and a pronounced shear lag effect. Transverse stress data across various cross-sections were extracted for quantifying these behaviors; the details are presented in Figure 22, Figure 23 and Figure 24.
Figure 22.
Normal Stress Distribution at Cross Sections in Midspan Region A. (a) Normal Stress in Concrete Top Slab. (b) Normal Stress in Concrete Bottom Slab.
Figure 23.
Normal Stress Distribution at Cross Sections in Side-Span Region B. (a) Normal Stress in Concrete Top Slab. (b) Normal Stress in Concrete Bottom Slab.
Figure 24.
Normal Stress Distribution at Cross Sections in Support Region C. (a) Normal Stress in Concrete Top Slab. (b) Normal Stress in Concrete Bottom Slab.
Based on the analysis of transverse stress distributions under two-point symmetric loading (as presented in Figure 22, Figure 23 and Figure 24), the following distinct regional behaviors are observed:
- (1)
- Mid-span Region (A):
A relatively uniform stress distribution is observed in the concrete top slab, where variations are minimal; the maximum stress difference, occurring in Section 1-1, is limited to 0.006 MPa. Specifically, stress minima are located at the truss supports for Sections 1-1 and 2-2, while Section 3-3 exhibits a minimum at the centerline. In the bottom slab, maxima are identified at the truss supports and the centerline. The overall uniformity in this region is attributed to the pure bending state established between the two loading points. In this zone, the vertical shear force is negligible, thereby eliminating the driving mechanism for the shear lag effect and resulting in an even stress distribution across the flange width.
- (2)
- Side-span Region (B):
In contrast to the mid-span, distinct stress non-uniformity re-emerges in this zone due to the presence of vertical shear force. In the top slab, Sections 1-1 and 2-2 exhibit pronounced peaks at the truss supports, whereas Section 3-3 remains relatively stable. Concurrently, substantial stress gradients are evident across all three bottom slab sections, consistently reaching minima at the transverse centerline. This distribution pattern characterized by peak stresses at the truss-to-slab connections and a progressive decay towards the geometric center, confirms the presence of the positive shear lag effect. The shear flow introduced at the truss nodes has not fully diffused across the flange width, resulting in higher stresses at the junctions compared to the central region.
- (3)
- Support Region (C):
Significant stress variations are exhibited by all three top slab sections, consistently characterized by stress minima at the cross-sectional geometric center. This pronounced gradient reflects an intense shear lag effect driven by the maximal shear force accumulation at the support. Regarding the bottom slab, while Sections 1-1 and 2-2 maintain relatively stable stress states, Section 3-3 displays a distinct gradient with a minimum at the centerline. As discussed in Section 3.1.1, this localized stress distribution does not represent global flexural behavior but is an artifact of the localized boundary constraints in the FE model. The rigid restriction of nodal displacements induces local stress concentrations consistent with Saint-Venant’s principle. Since these stresses result from the discrete load transfer at the support nodes rather than the shear lag effect of the truss web system itself, and considering their rapid decay away from the boundary, they are considered negligible for the overall structural performance evaluation.
3.2. Longitudinal Shear Lag Effect Analysis
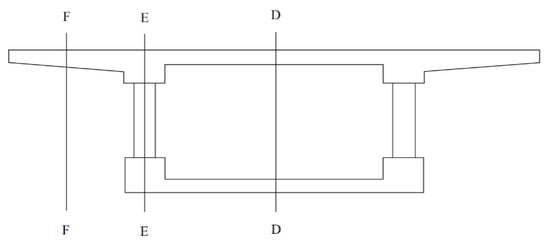
The longitudinal normal stress distribution patterns in the concrete slabs and flanges of the GFRP composite truss web girder bridge were investigated under mid-span concentrated, full-span distributed, and two-point symmetric loading. To facilitate this analysis, three characteristic longitudinal sections were defined as illustrated in Figure 25: the centerline (Section D-D), the truss-to-slab connection (Section E-E), and the flange (Section F-F).
Figure 25.
Longitudinal Analysis Positions of the GFRP Composite Truss-Web Girder Bridge.
3.2.1. Mid-Span Concentrated Load
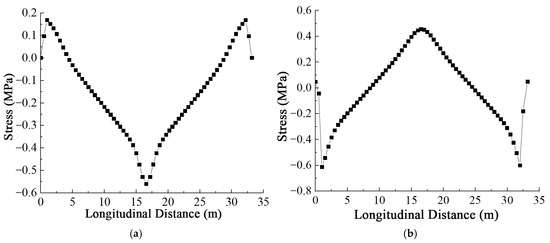
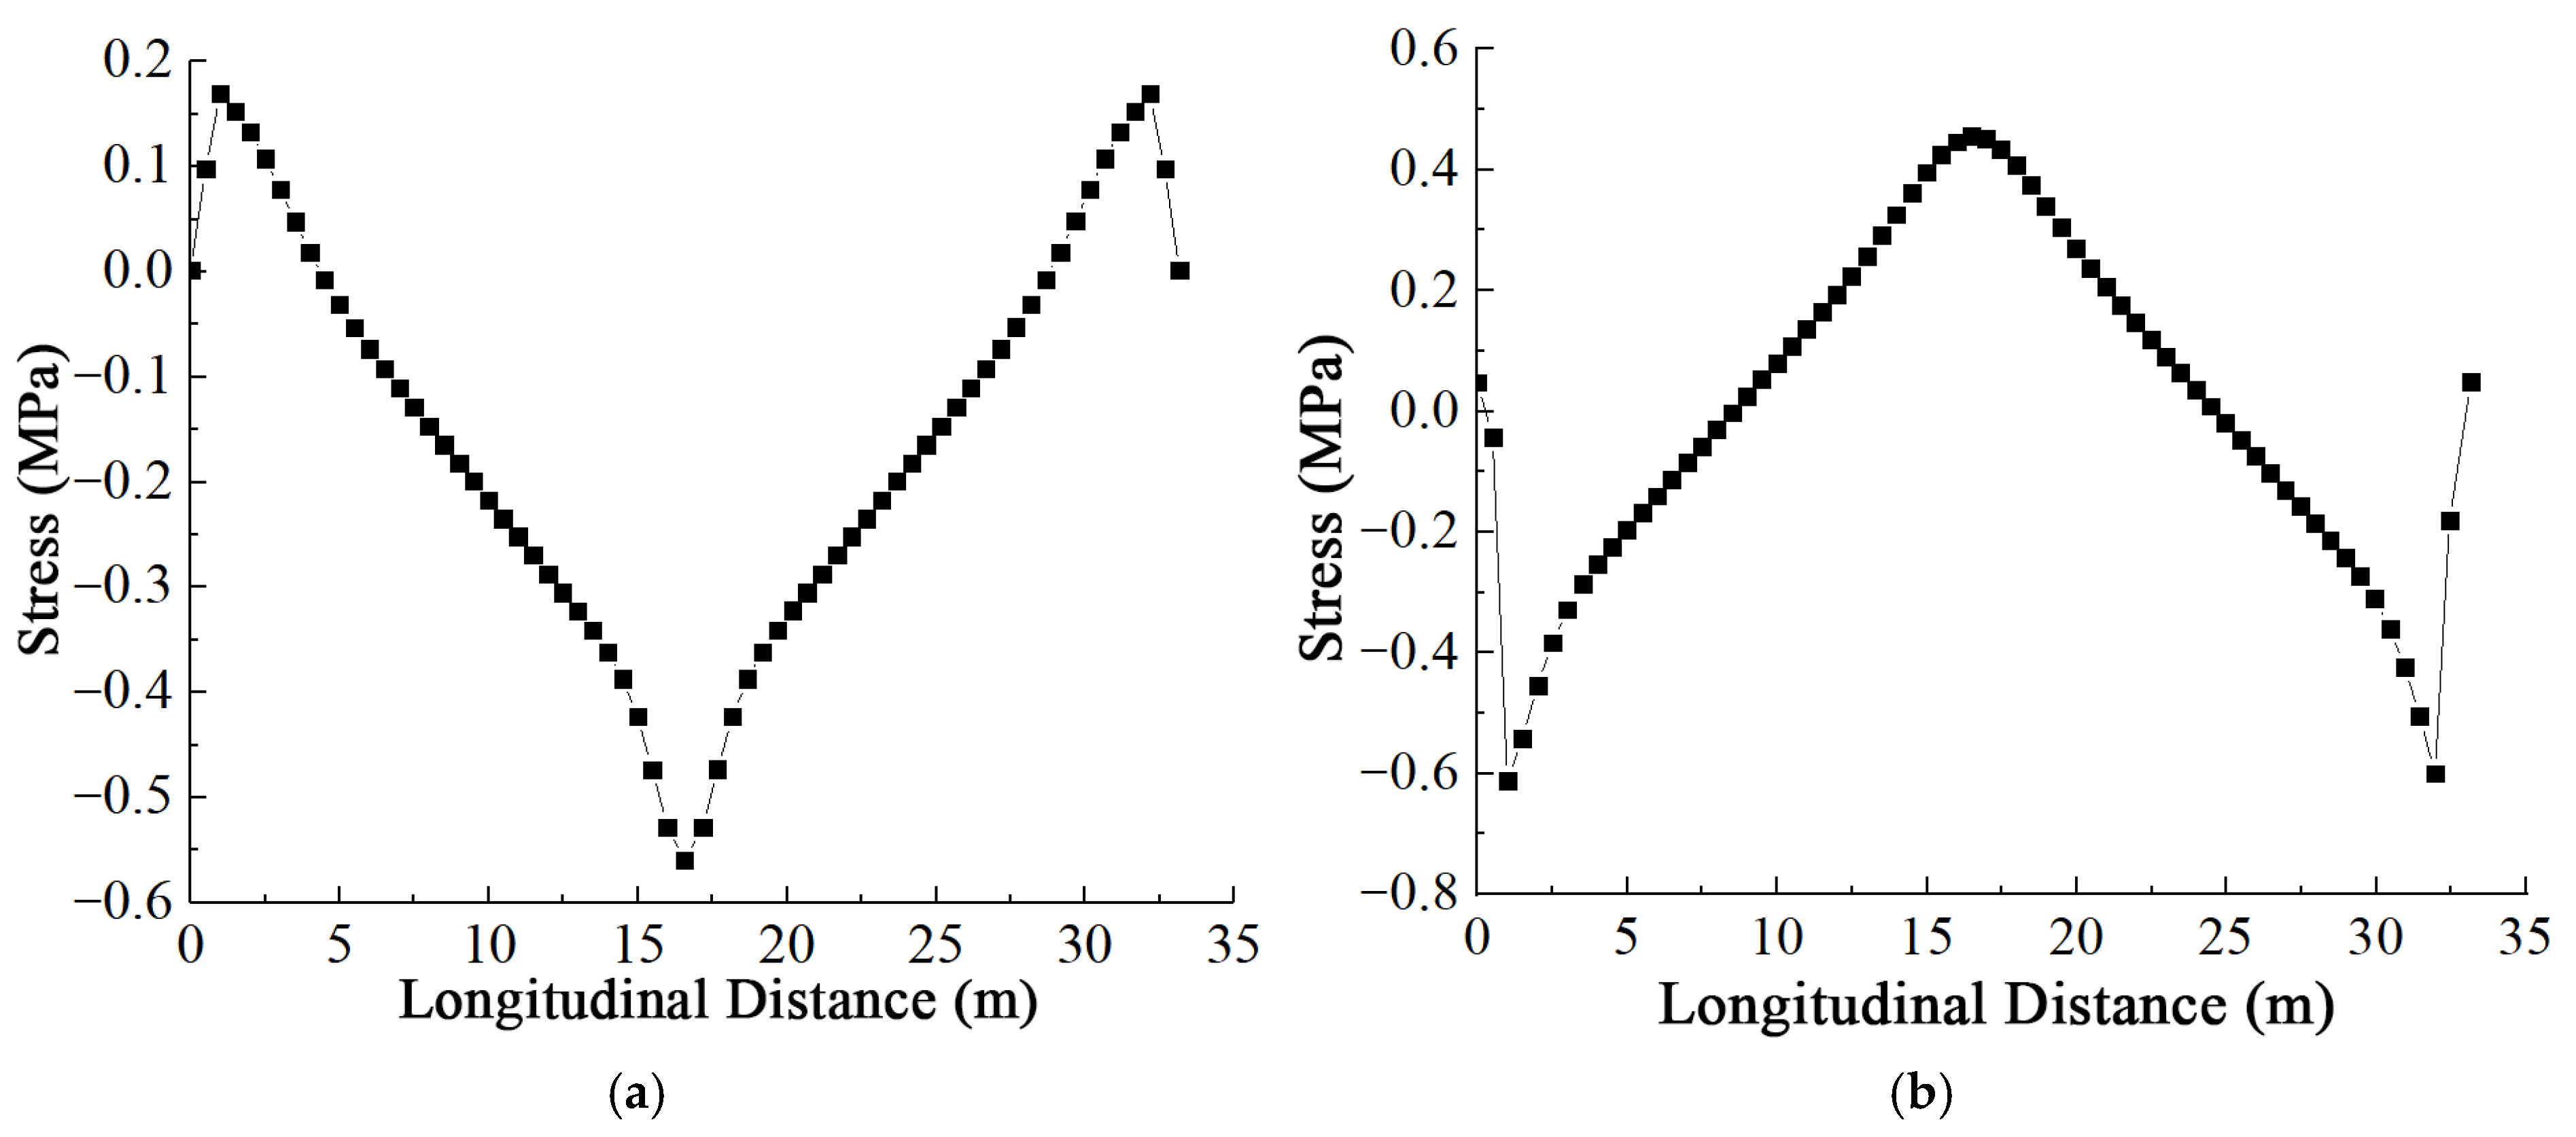
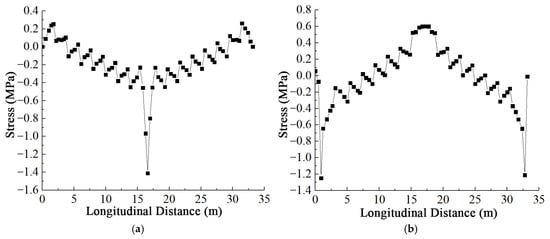
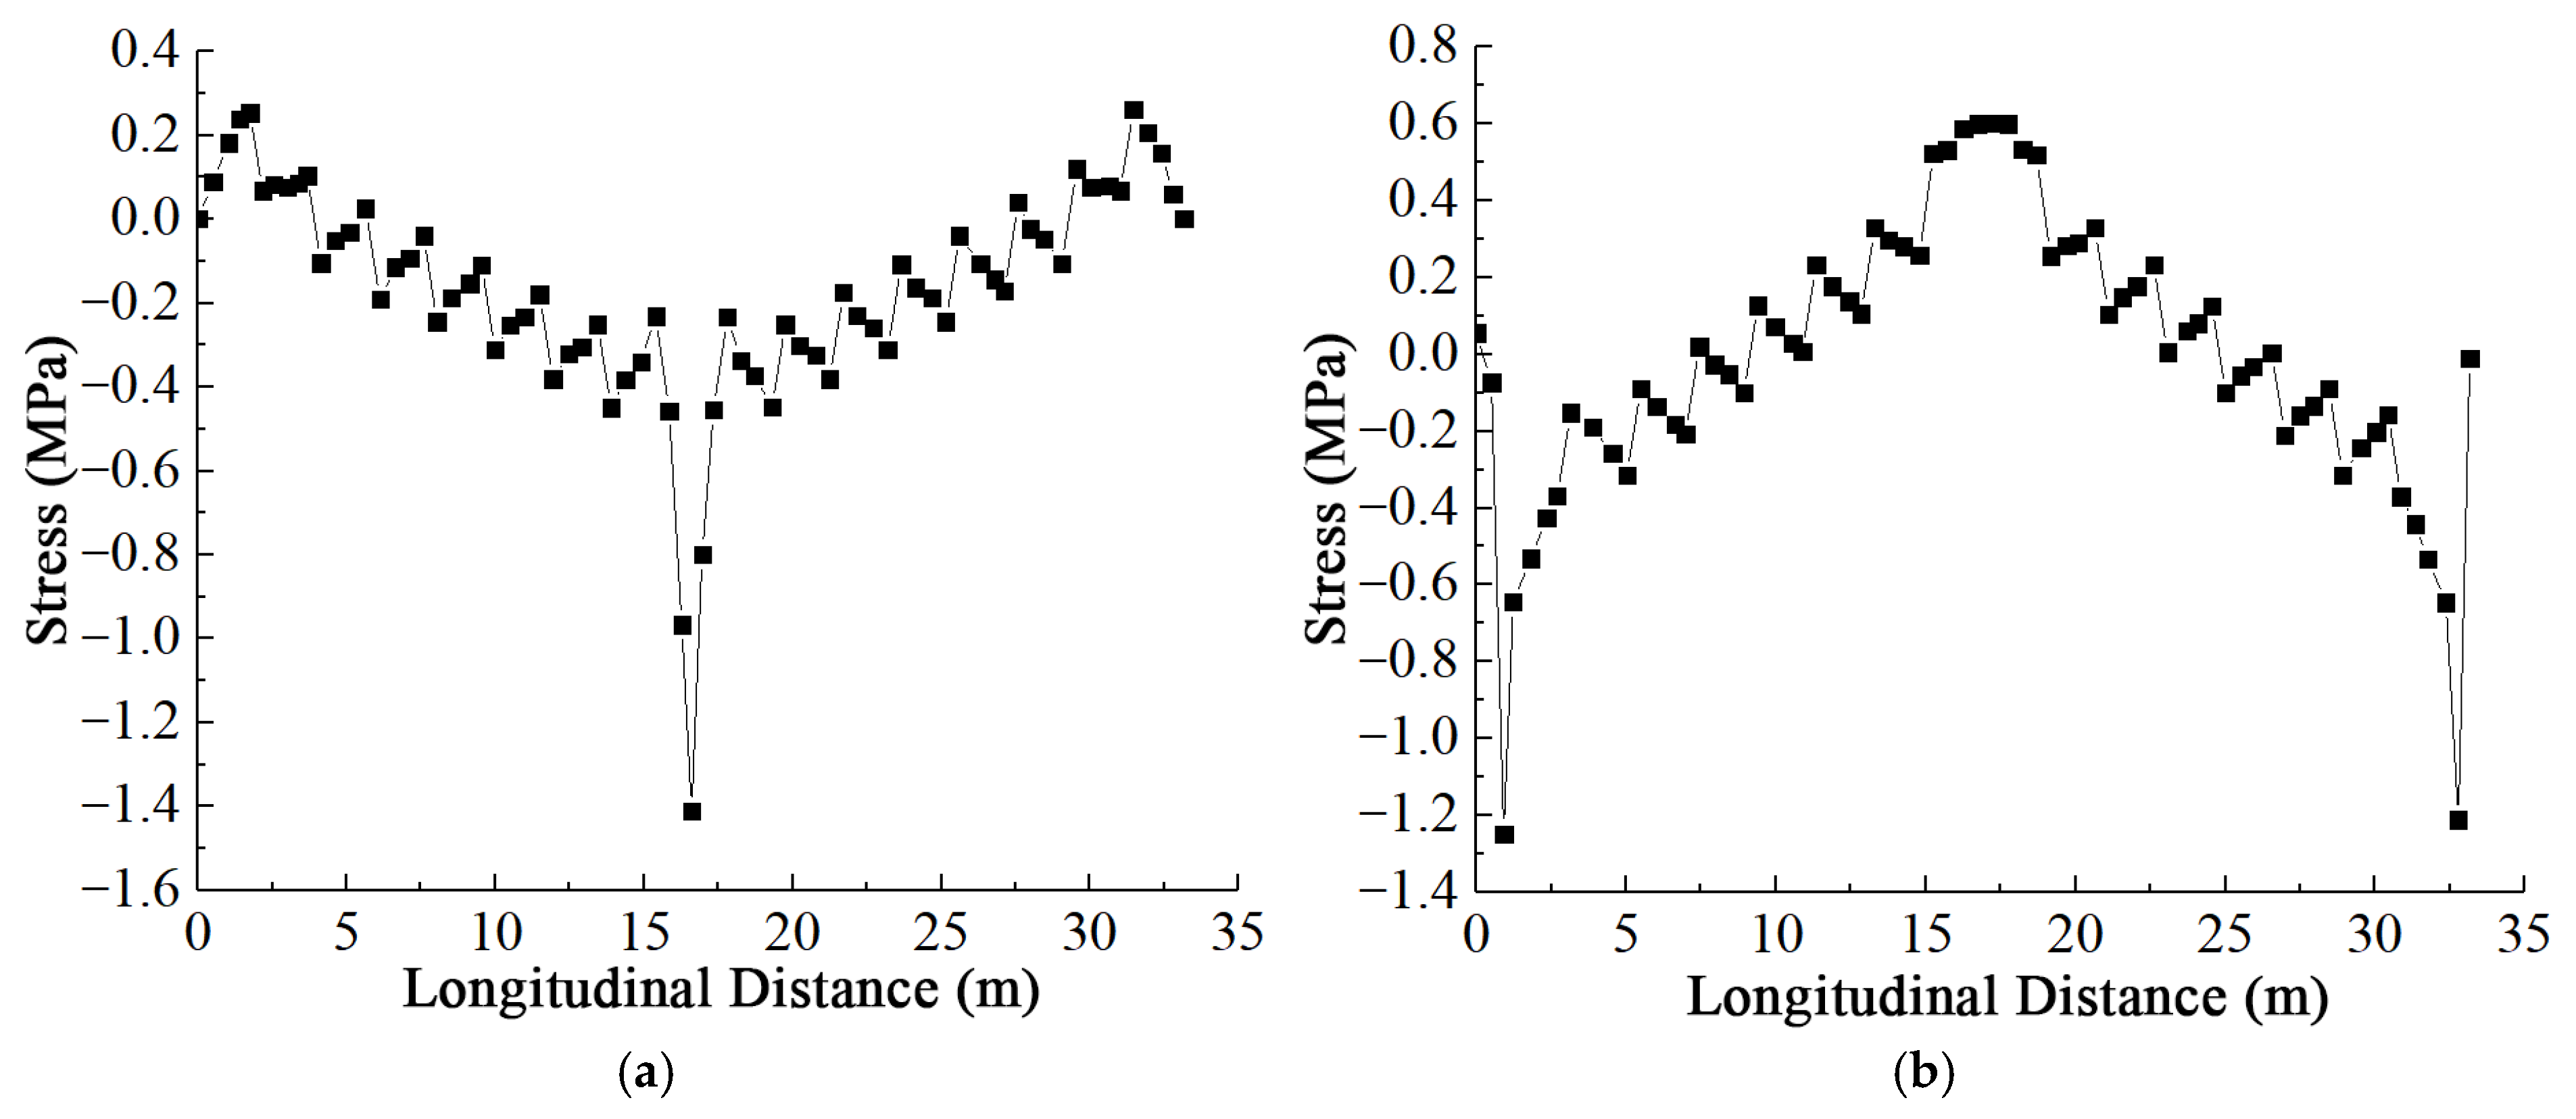
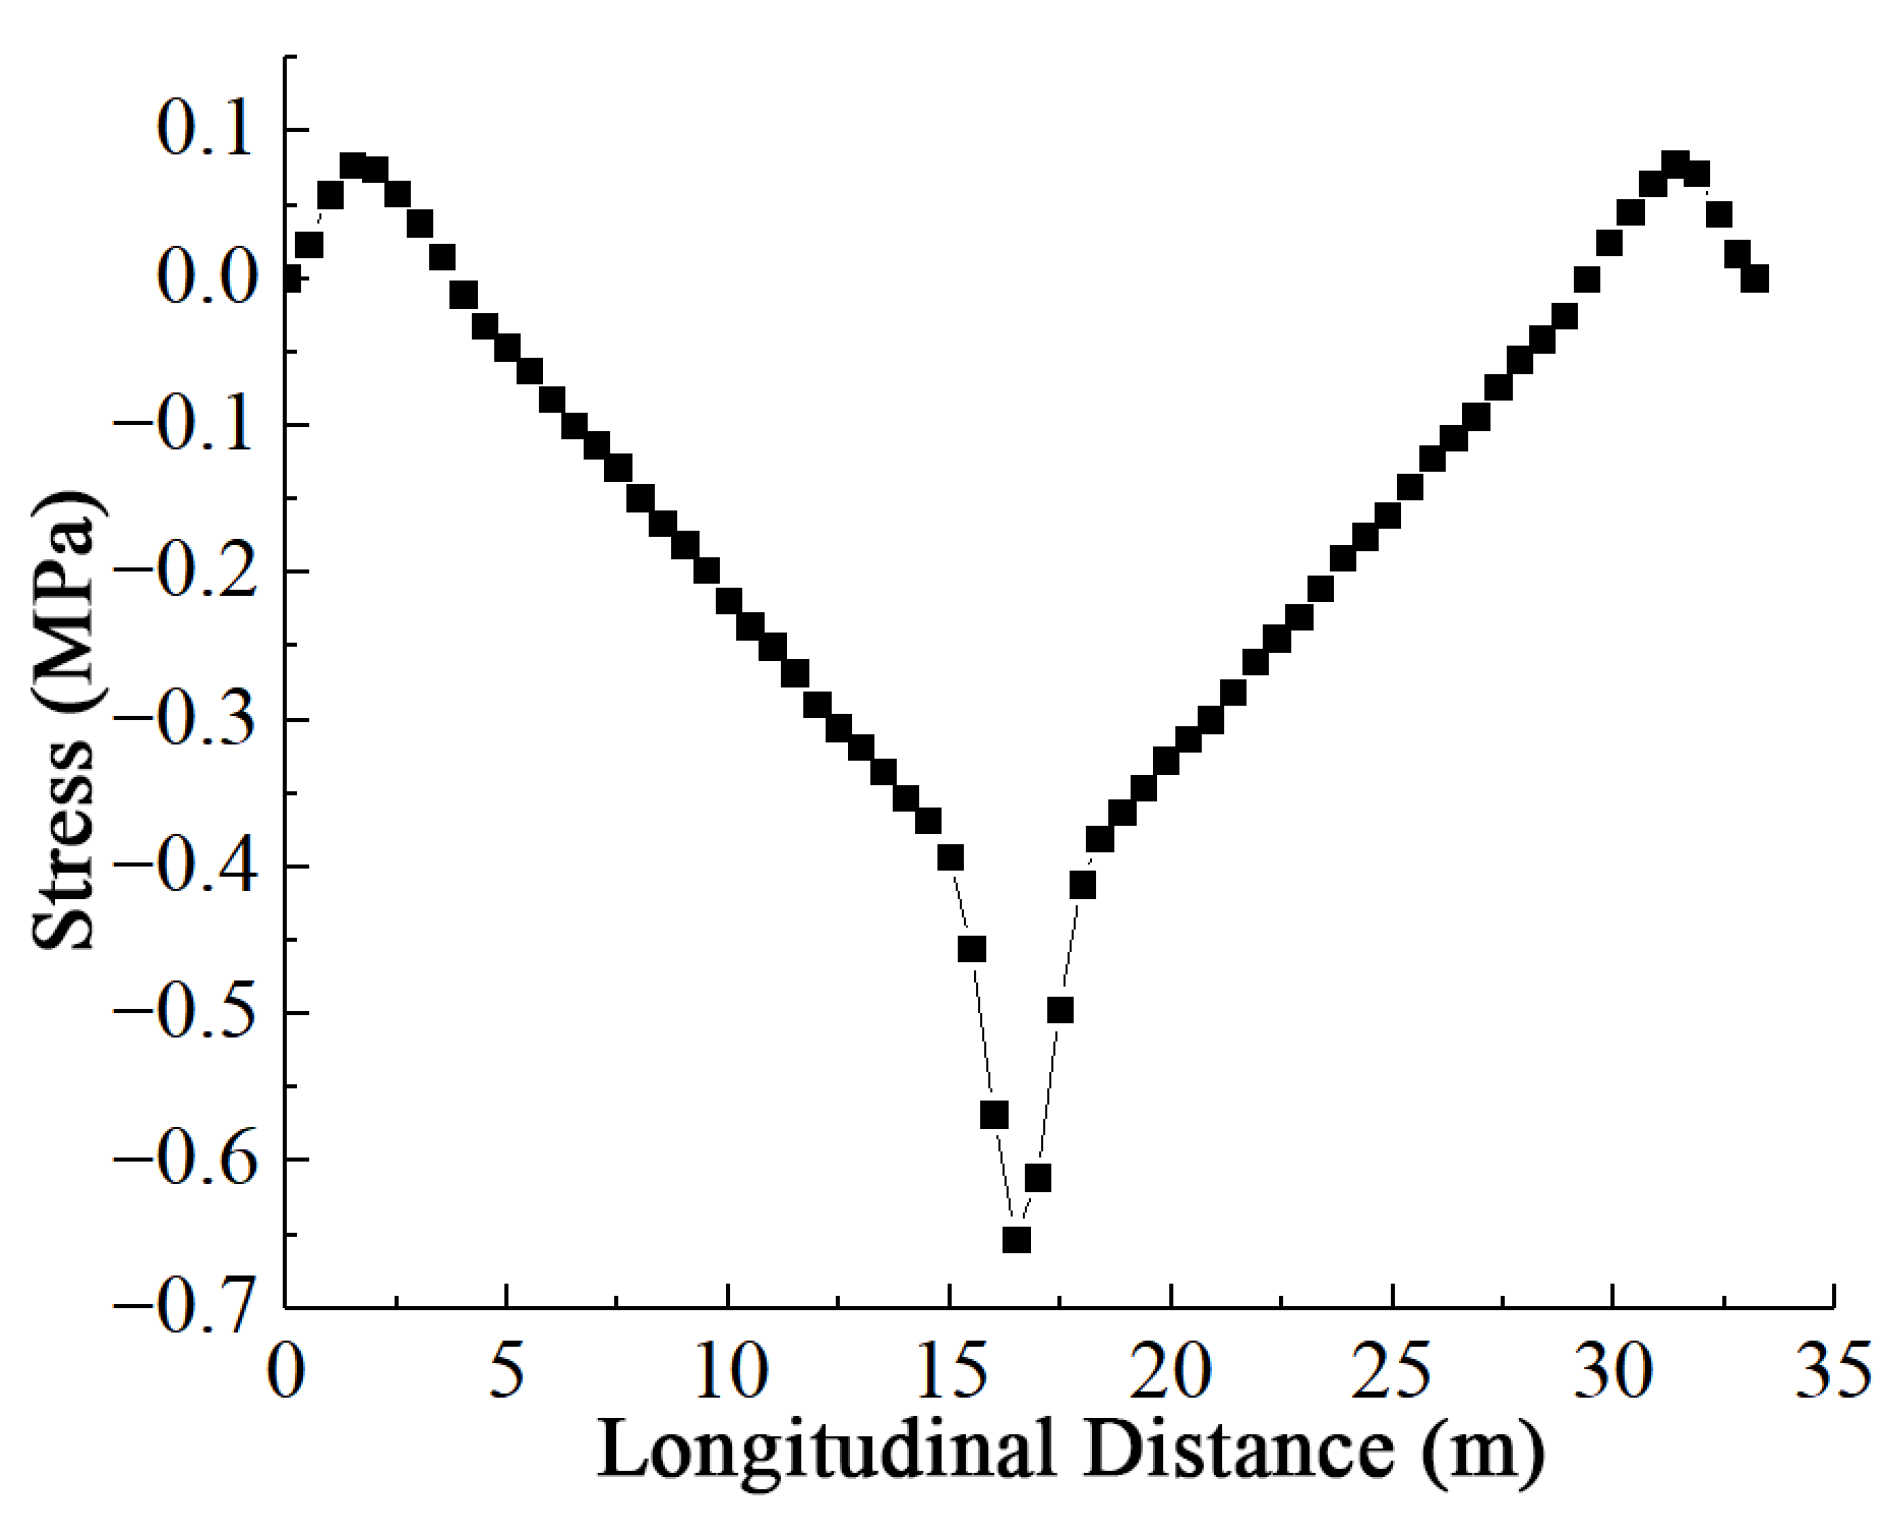
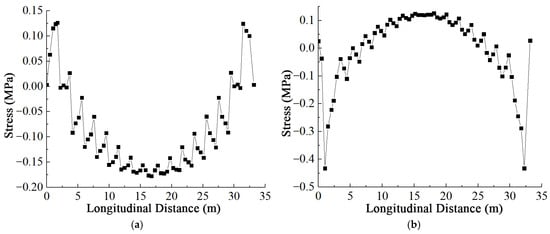
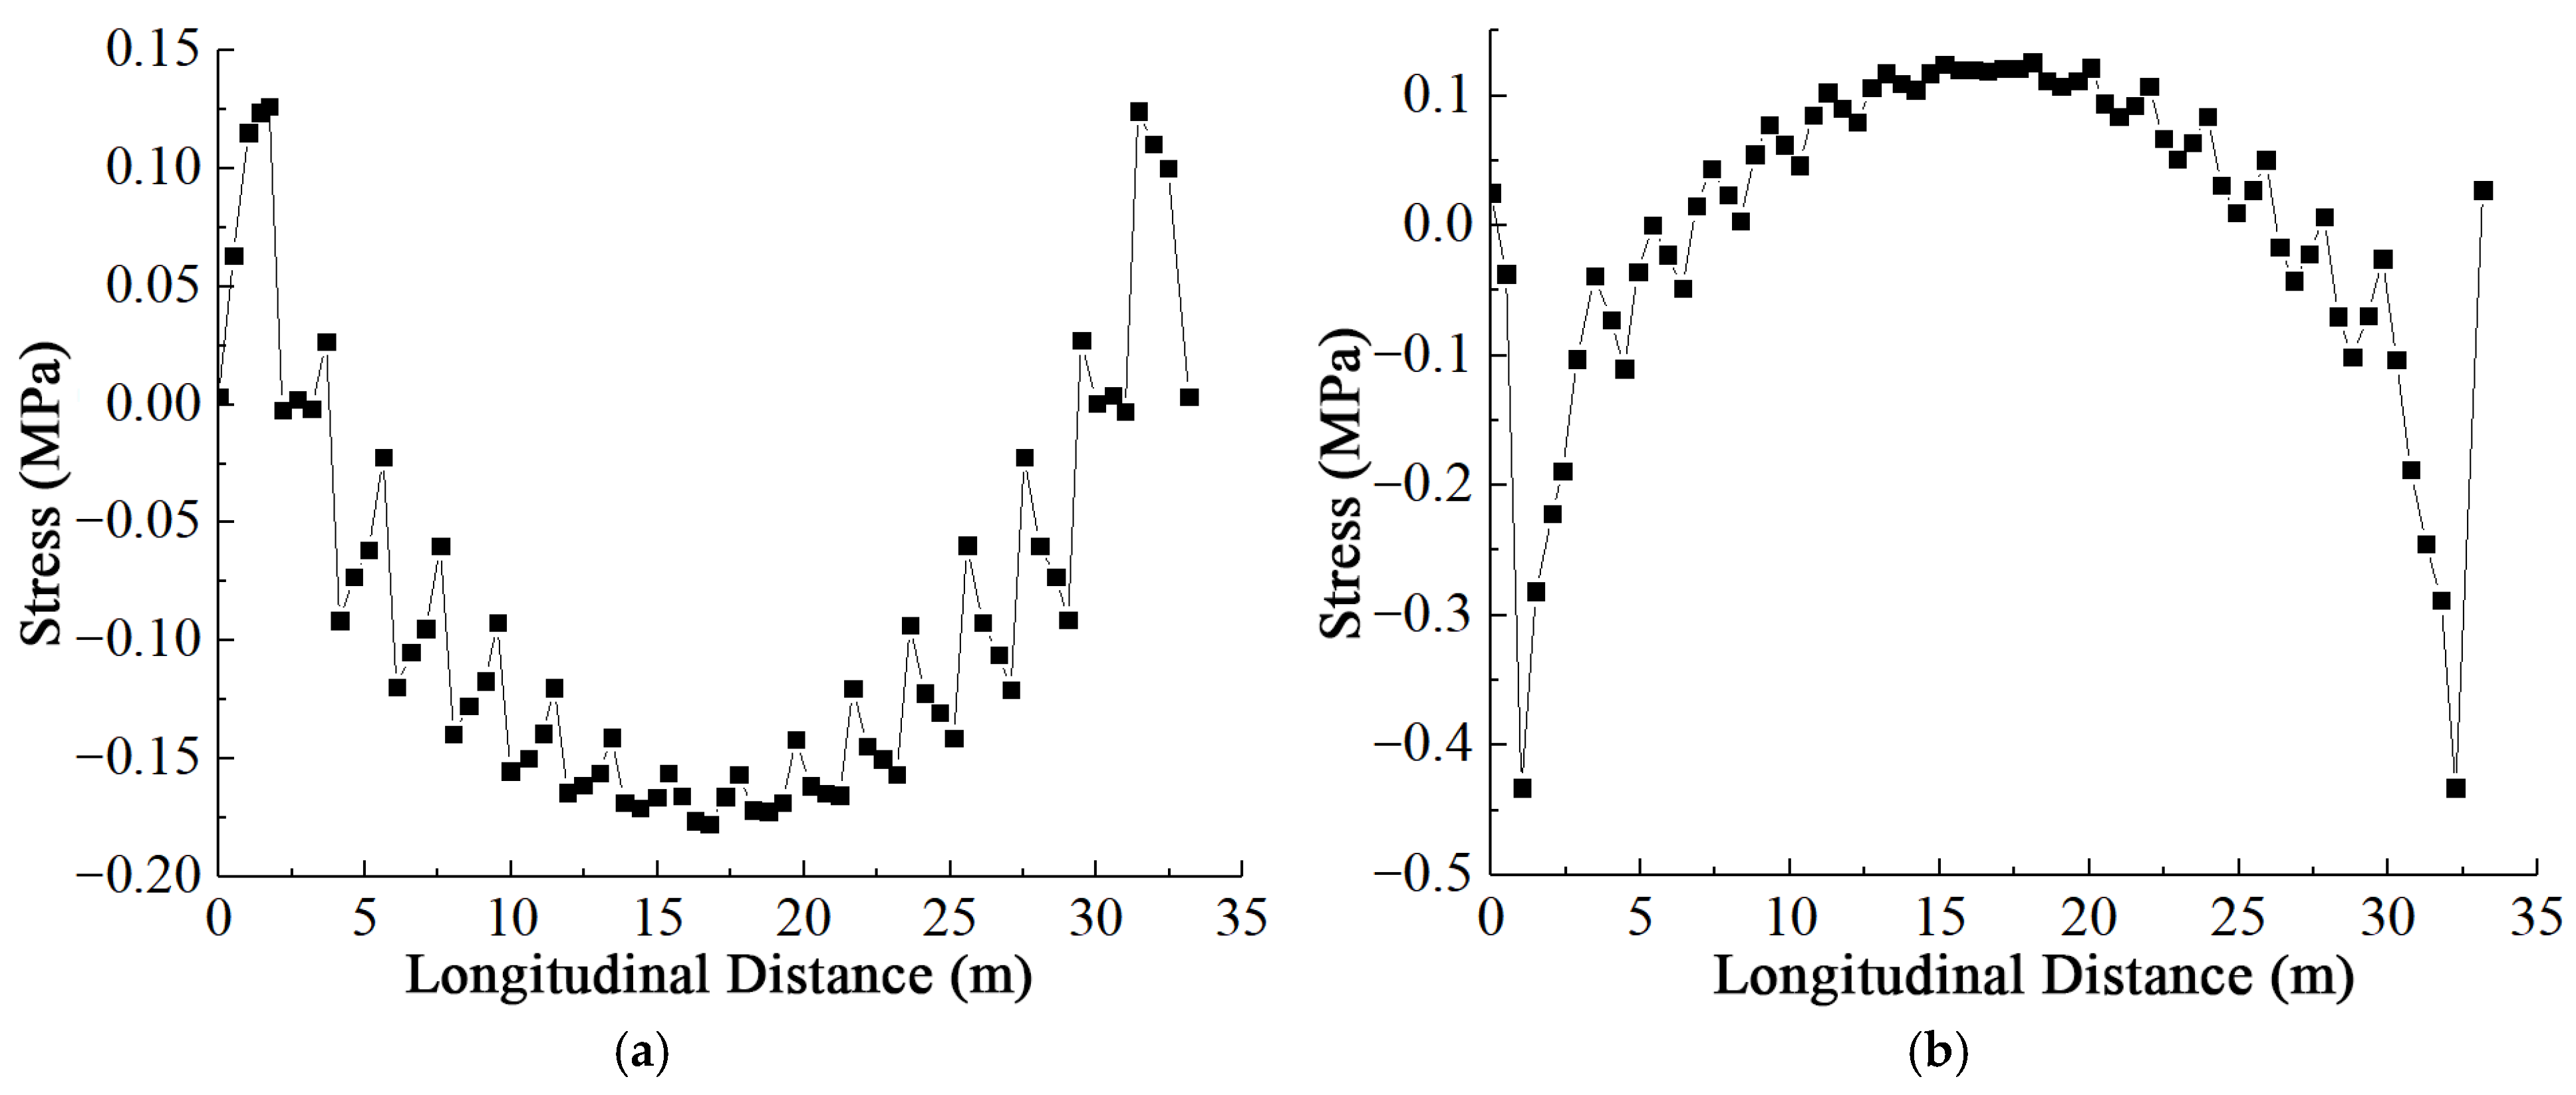
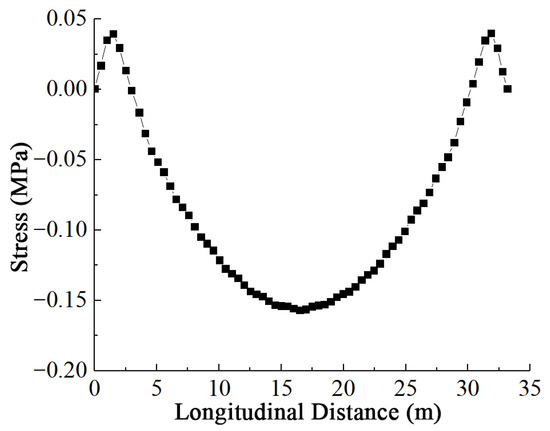
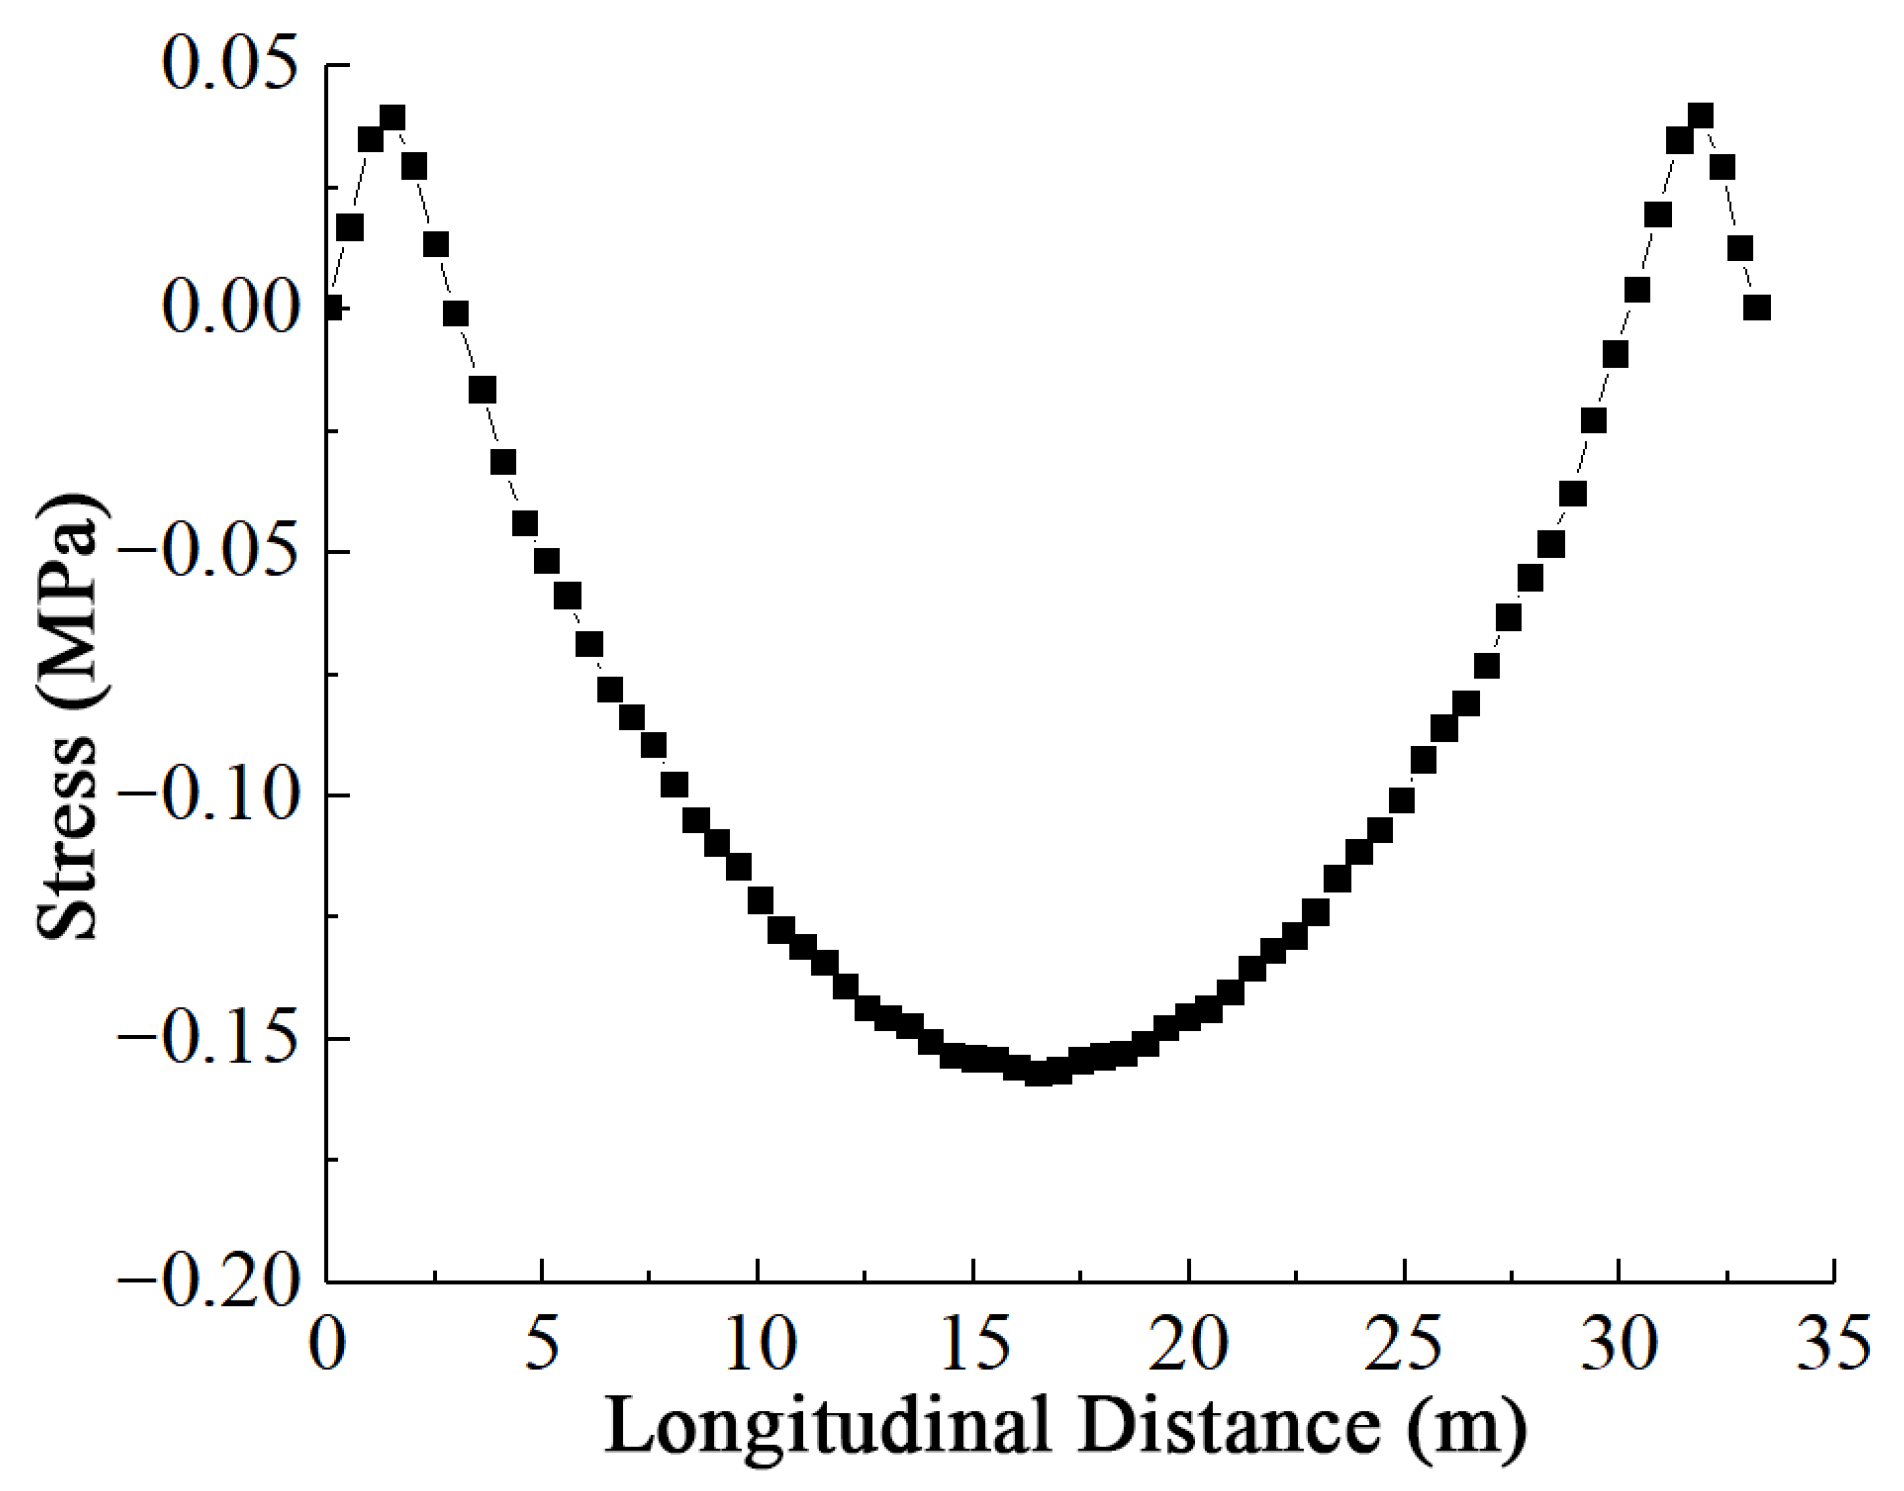
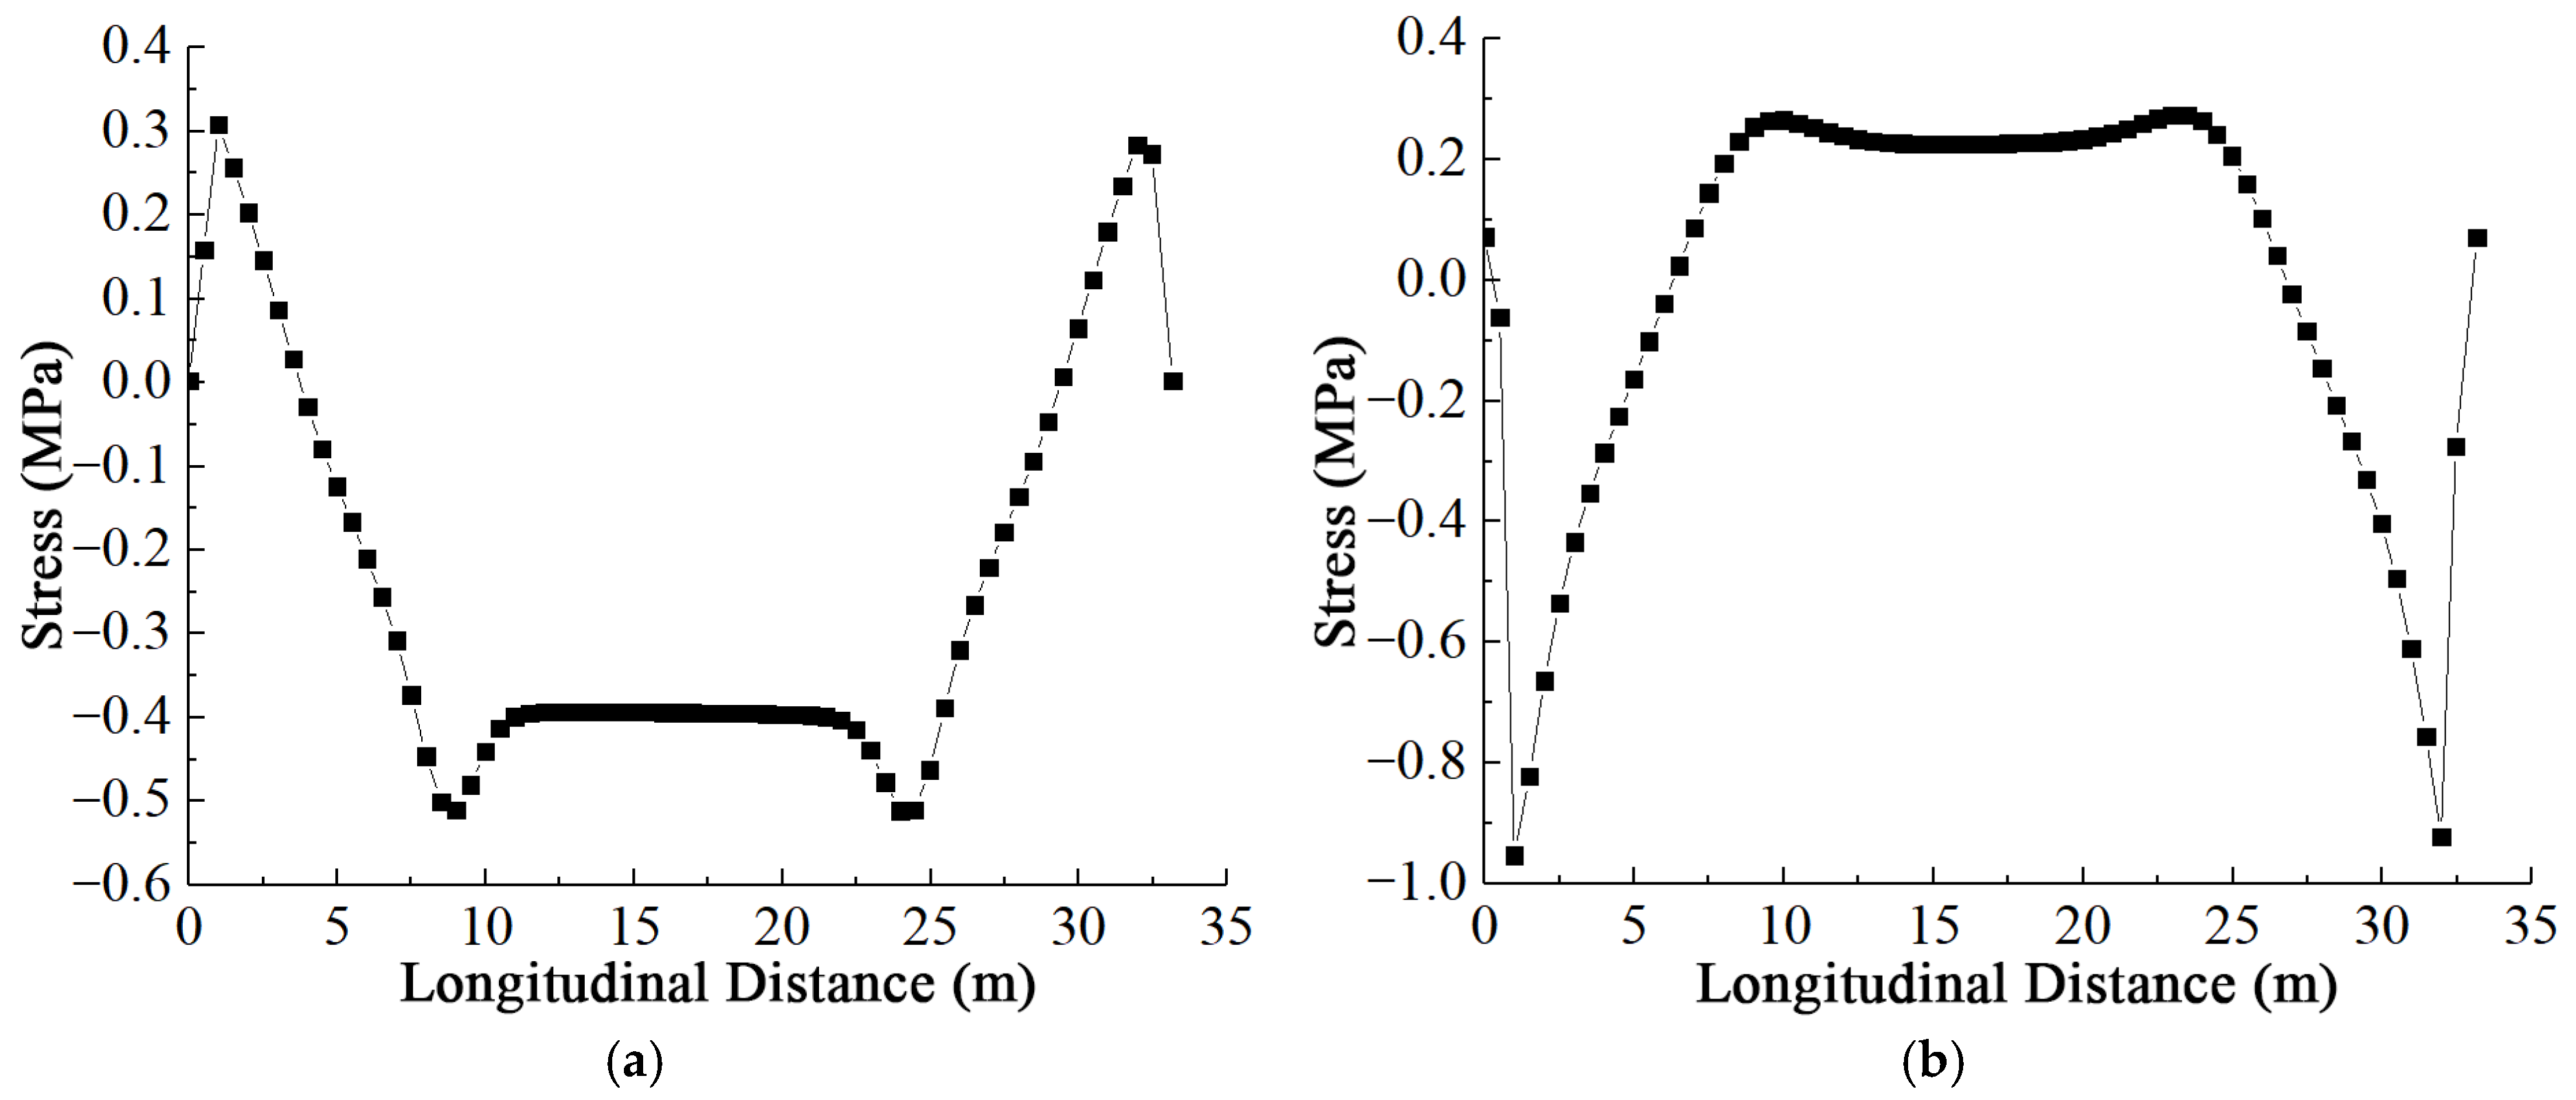
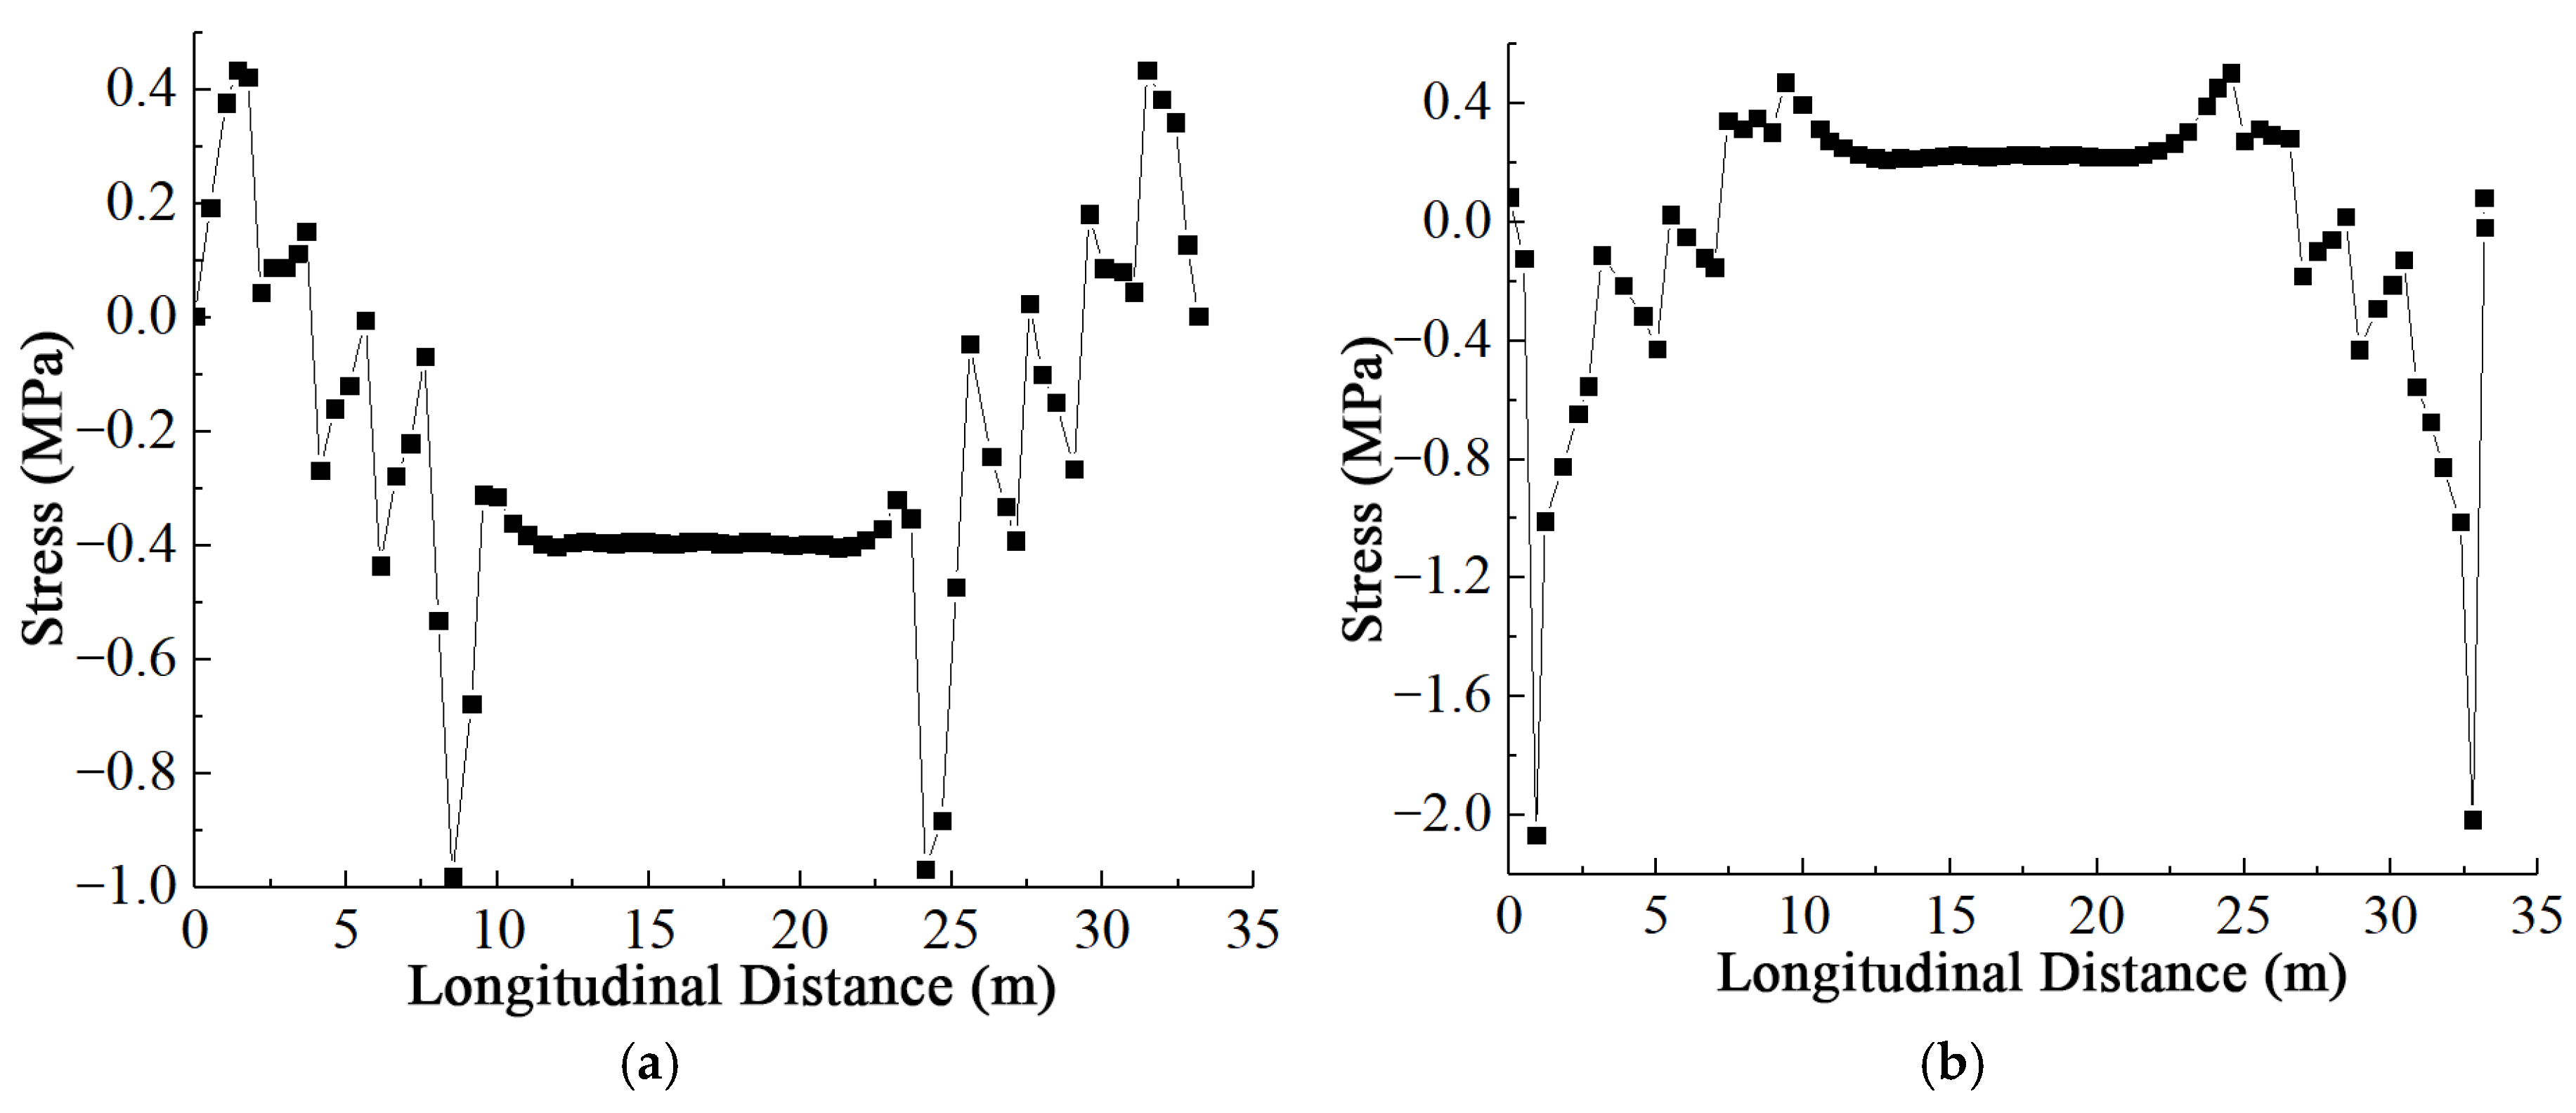
The longitudinal normal stress profiles for the top and bottom slabs across these sections under mid-span concentrated loading are presented in Figure 26, Figure 27 and Figure 28.
Figure 26.
Normal Stress Distribution at Midline Section D-D. (a) Normal Stress in Concrete Top Slab. (b) Normal Stress in Concrete Bottom Slab.
Figure 27.
Normal Stress Distribution at Diagonal Member Support Section E-E. (a) Normal Stress in Concrete Top Slab. (b) Normal Stress in Concrete Bottom Slab.
Figure 28.
Normal Stress Distribution at Flange Section F-F.
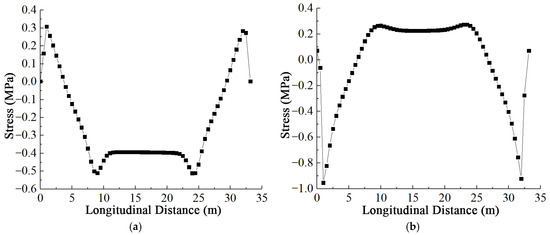
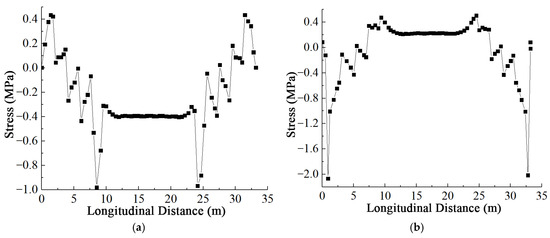
Based on the analysis of the longitudinal stress profiles, pronounced shear lag effects are observed in the concrete top and bottom slabs across the centerline (D-D), truss connection (E-E), and flange (F-F) sections under mid-span concentrated loading. Significant stress variations occur near the supports, with the bottom slab exhibiting greater magnitudes than the top slab. A symmetrical stress distribution peaking at the mid-span is evident across all sections; this maximum is directly attributed to the stress concentration induced by the applied concentrated force.
Notably, while stress variations along the centerline (D-D) and flange (F-F) remain relatively smooth and uniform, significant fluctuations are detected at the truss connection (Section E-E). This fluctuation stems from the discrete load transfer mechanism at the truss-slab interface: stress concentrations are formed at nodal intersections where GFRP truss members transfer force to the concrete, whereas non-nodal regions experience reduced stress due to the absence of direct force transmission, resulting in the observed wave-like stress pattern.
3.2.2. Full-Span Uniformly Distributed Load
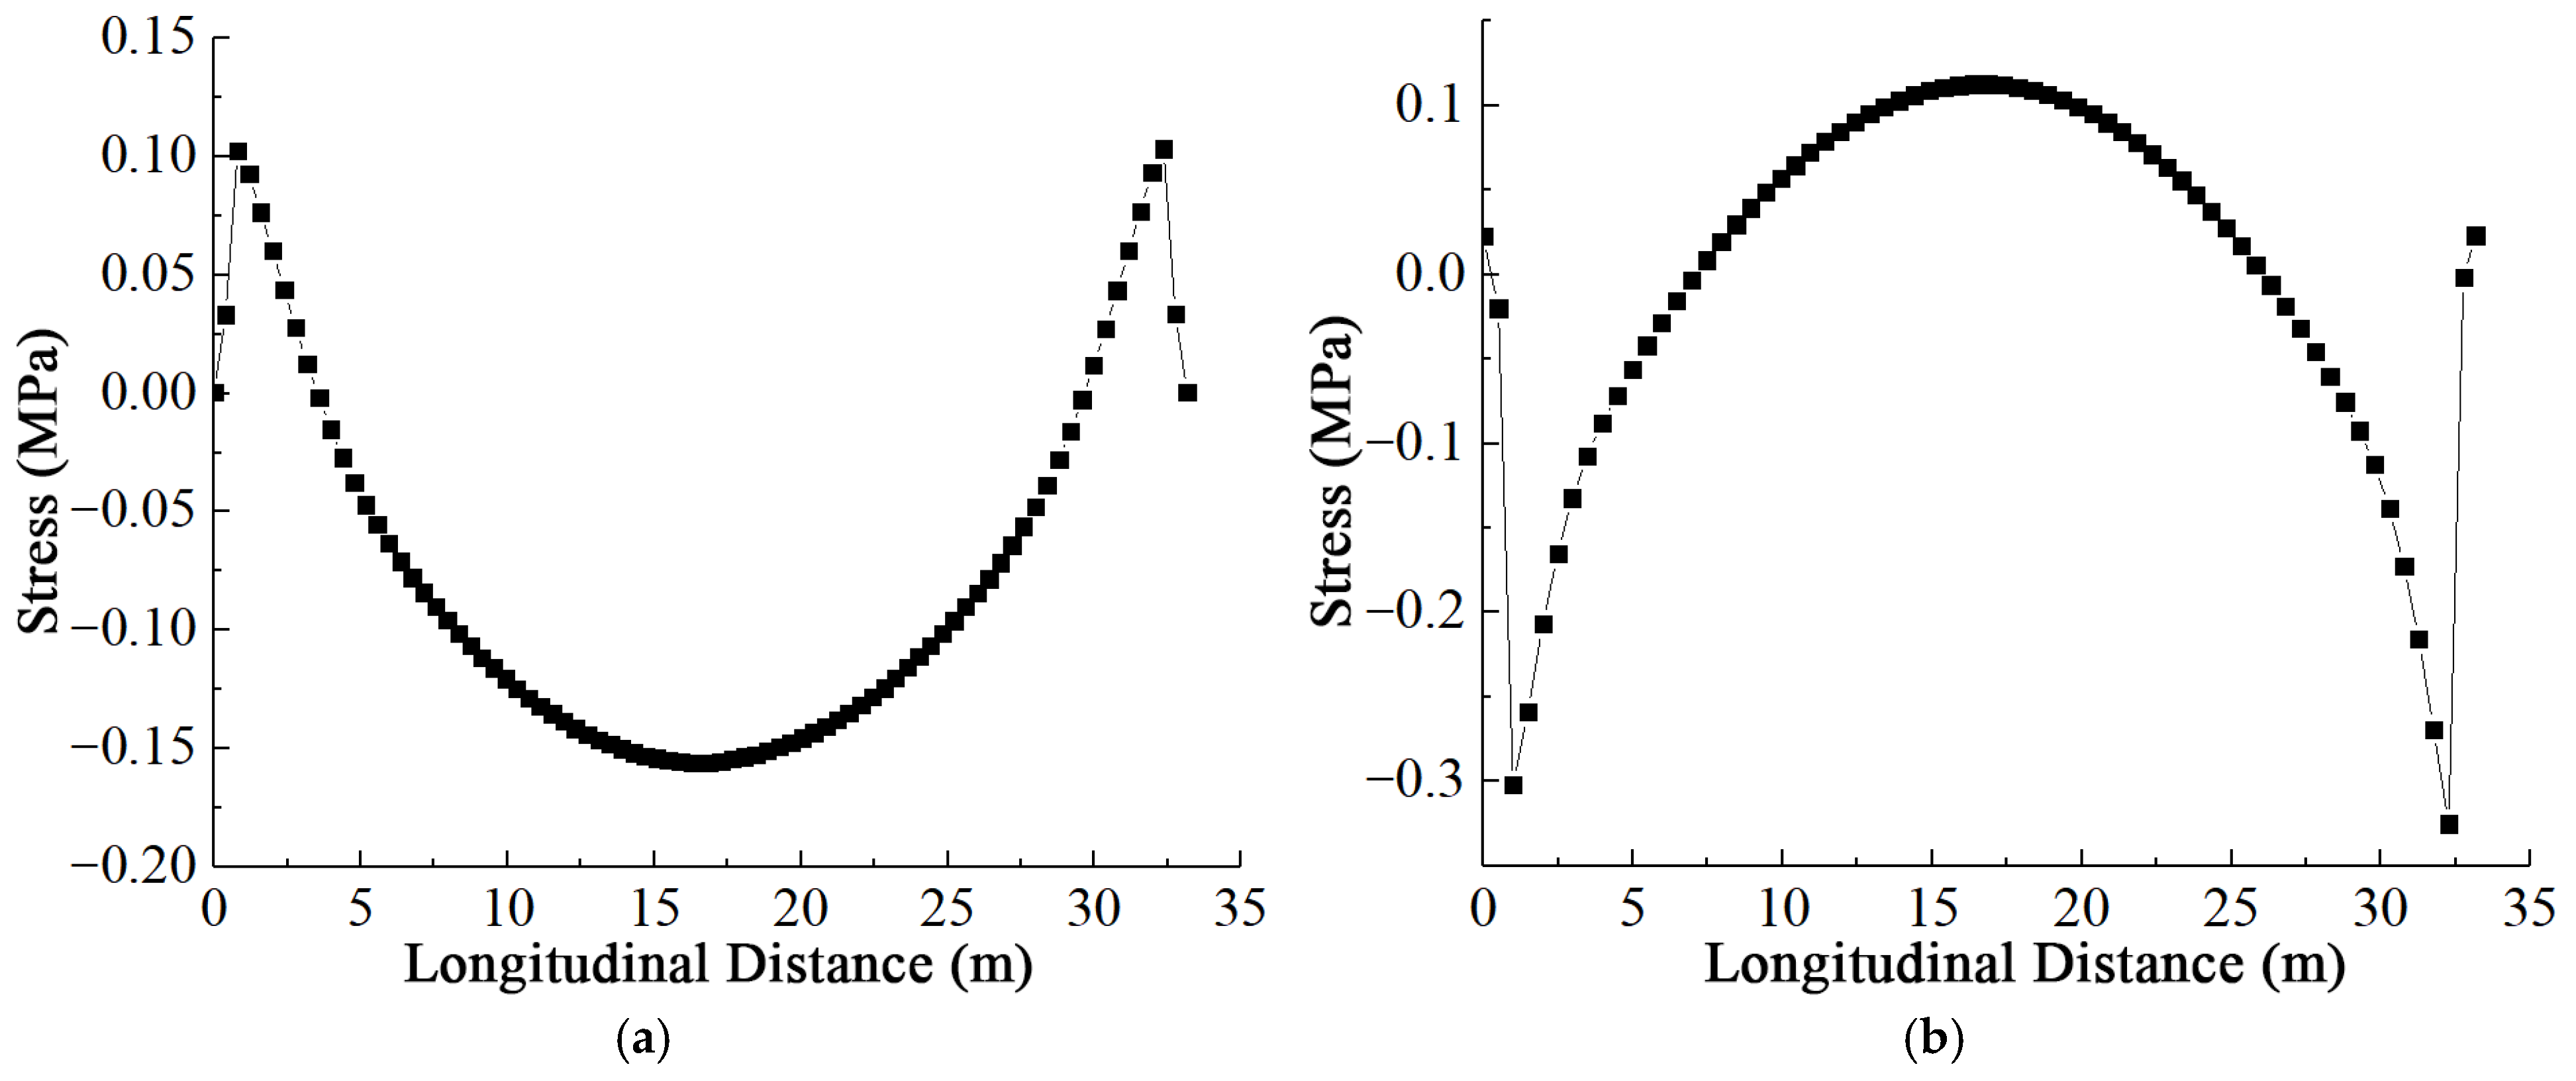
The longitudinal normal stress distributions for the concrete top and bottom slabs across the various sections under full-span distributed loading are illustrated in Figure 29, Figure 30 and Figure 31.
Figure 29.
Normal Stress Distribution at Midline Section D-D. (a) Normal Stress in Concrete Top Slab. (b) Normal Stress in Concrete Bottom Slab.
Figure 30.
Normal Stress Distribution at Diagonal Member Support Section E-E. (a) Normal Stress in Concrete Top Slab. (b) Normal Stress in Concrete Bottom Slab.
Figure 31.
Normal Stress Distribution at Flange Section F-F.
Based on the analysis of these figures, pronounced shear lag effects are observed in the concrete top and bottom slabs at the centerline (D-D), truss connection (E-E), and flange (F-F) locations. The stress profiles exhibit a maximum at the mid-span and significant variations near the supports, with greater magnitudes identified in the bottom slab compared to the top slab. Notably, large stress fluctuations are detected at the truss connection (Section E-E), which progressively diminish toward the mid-span. This attenuation is attributed to the reduction in internal shear force near the mid-span, which minimizes the differential stress transfer between nodal and non-nodal locations.
3.2.3. Two-Point Symmetric Load
The longitudinal normal stress profiles for the concrete slabs under two-point symmetric loading are presented in Figure 32, Figure 33 and Figure 34.
Figure 32.
Normal Stress Distribution at Midline Section D-D. (a) Normal Stress in Concrete Top Slab. (b) Normal Stress in Concrete Bottom Slab.
Figure 33.
Normal Stress Distribution at Diagonal Member Support Section E-E. (a) Normal Stress in Concrete Top Slab. (b) Normal Stress in Concrete Bottom Slab.
Figure 34.
Normal Stress Distribution at Flange Section F-F.
As indicated by the results, distinct shear lag effects are evident across the centerline (D-D), truss connection (E-E), and flange (F-F) sections, characterized by significant stress variations near the supports where bottom slab responses exceed those of the top slab. The stress distribution remains symmetric along the span, with elevated magnitudes concentrated at the loading points. Notably, the stress levels in the concrete top and bottom slabs remain essentially constant in the region between the two loading points. This plateau is attributed to the pure bending state in this central zone, where the shear force—and consequently the variation in axial force—is negligible.
3.3. Effective Width
To account for the shear lag effect, the concept of effective distribution width [16] was introduced. Fundamentally, this parameter serves as a geometric simplification of cross-sectional dimensions to facilitate structural calculation. Based on the actual distribution of flexural normal stress in the flange, a specific portion of the width is designated as the effective load-bearing section; thus, it functions as an equivalent converted section width [17,18]. Given the structural symmetry of the GFRP composite truss web girder bridge, a half-width model was adopted for the current analysis.
Mathematically, the effective distribution width (be) [19] is defined as the width of a theoretical rectangle with a height equal to the peak actual stress (σmax), such that its area is equivalent to the integration of the actual stress curve over the half-bridge width (b/2). The calculation formula is expressed as:
For practical engineering applications, an approximate numerical integration method is utilized to balance computational efficiency with sufficient accuracy. As illustrated in Figure 35, the semi-width (b/2) is discretized into multiple sub-segments (b1, b2, b3, …, bn). By incorporating the corresponding flexural normal stresses (σ1, σ2, σ3, …, σn) extracted from the FE results, the approximate effective distribution width is calculated according to Equation (9).
Figure 35.
Effective Width Distribution and Approximate Calculation. (a) Schematic Diagram of Effective Width Distribution. (b) Approximate Calculation Diagram of Effective Width.
To quantify the severity of the shear lag effect, the effective width ratio (φ) is introduced and defined in Equation (10). Physically, φ represents the proportion of the full flange width that effectively contributes to flexural resistance under non-uniform stress distribution. A φ value equal to 1.0 implies a nearly uniform longitudinal stress across the flange, indicating a negligible shear lag effect. Conversely, a φ value significantly less than 1.0 reflects a pronounced positive shear lag effect, where stresses concentrate near the web. In certain scenarios, a φ value greater than 1.0 is theoretically possible, corresponding to negative shear lag; however, this is less common and often conservatively treated in design. Thus, the magnitude of deviation of φ from unity directly characterizes the intensity of the shear lag phenomenon.
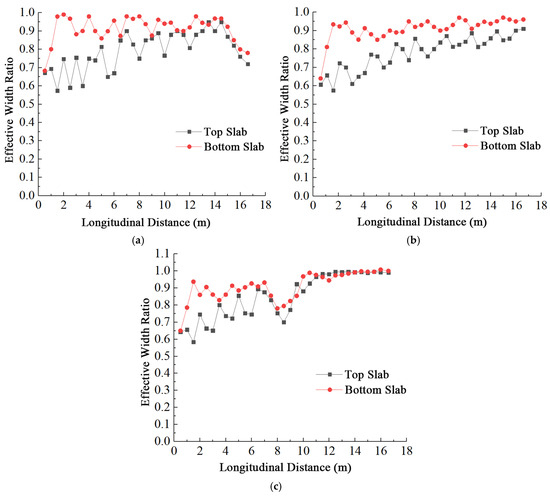
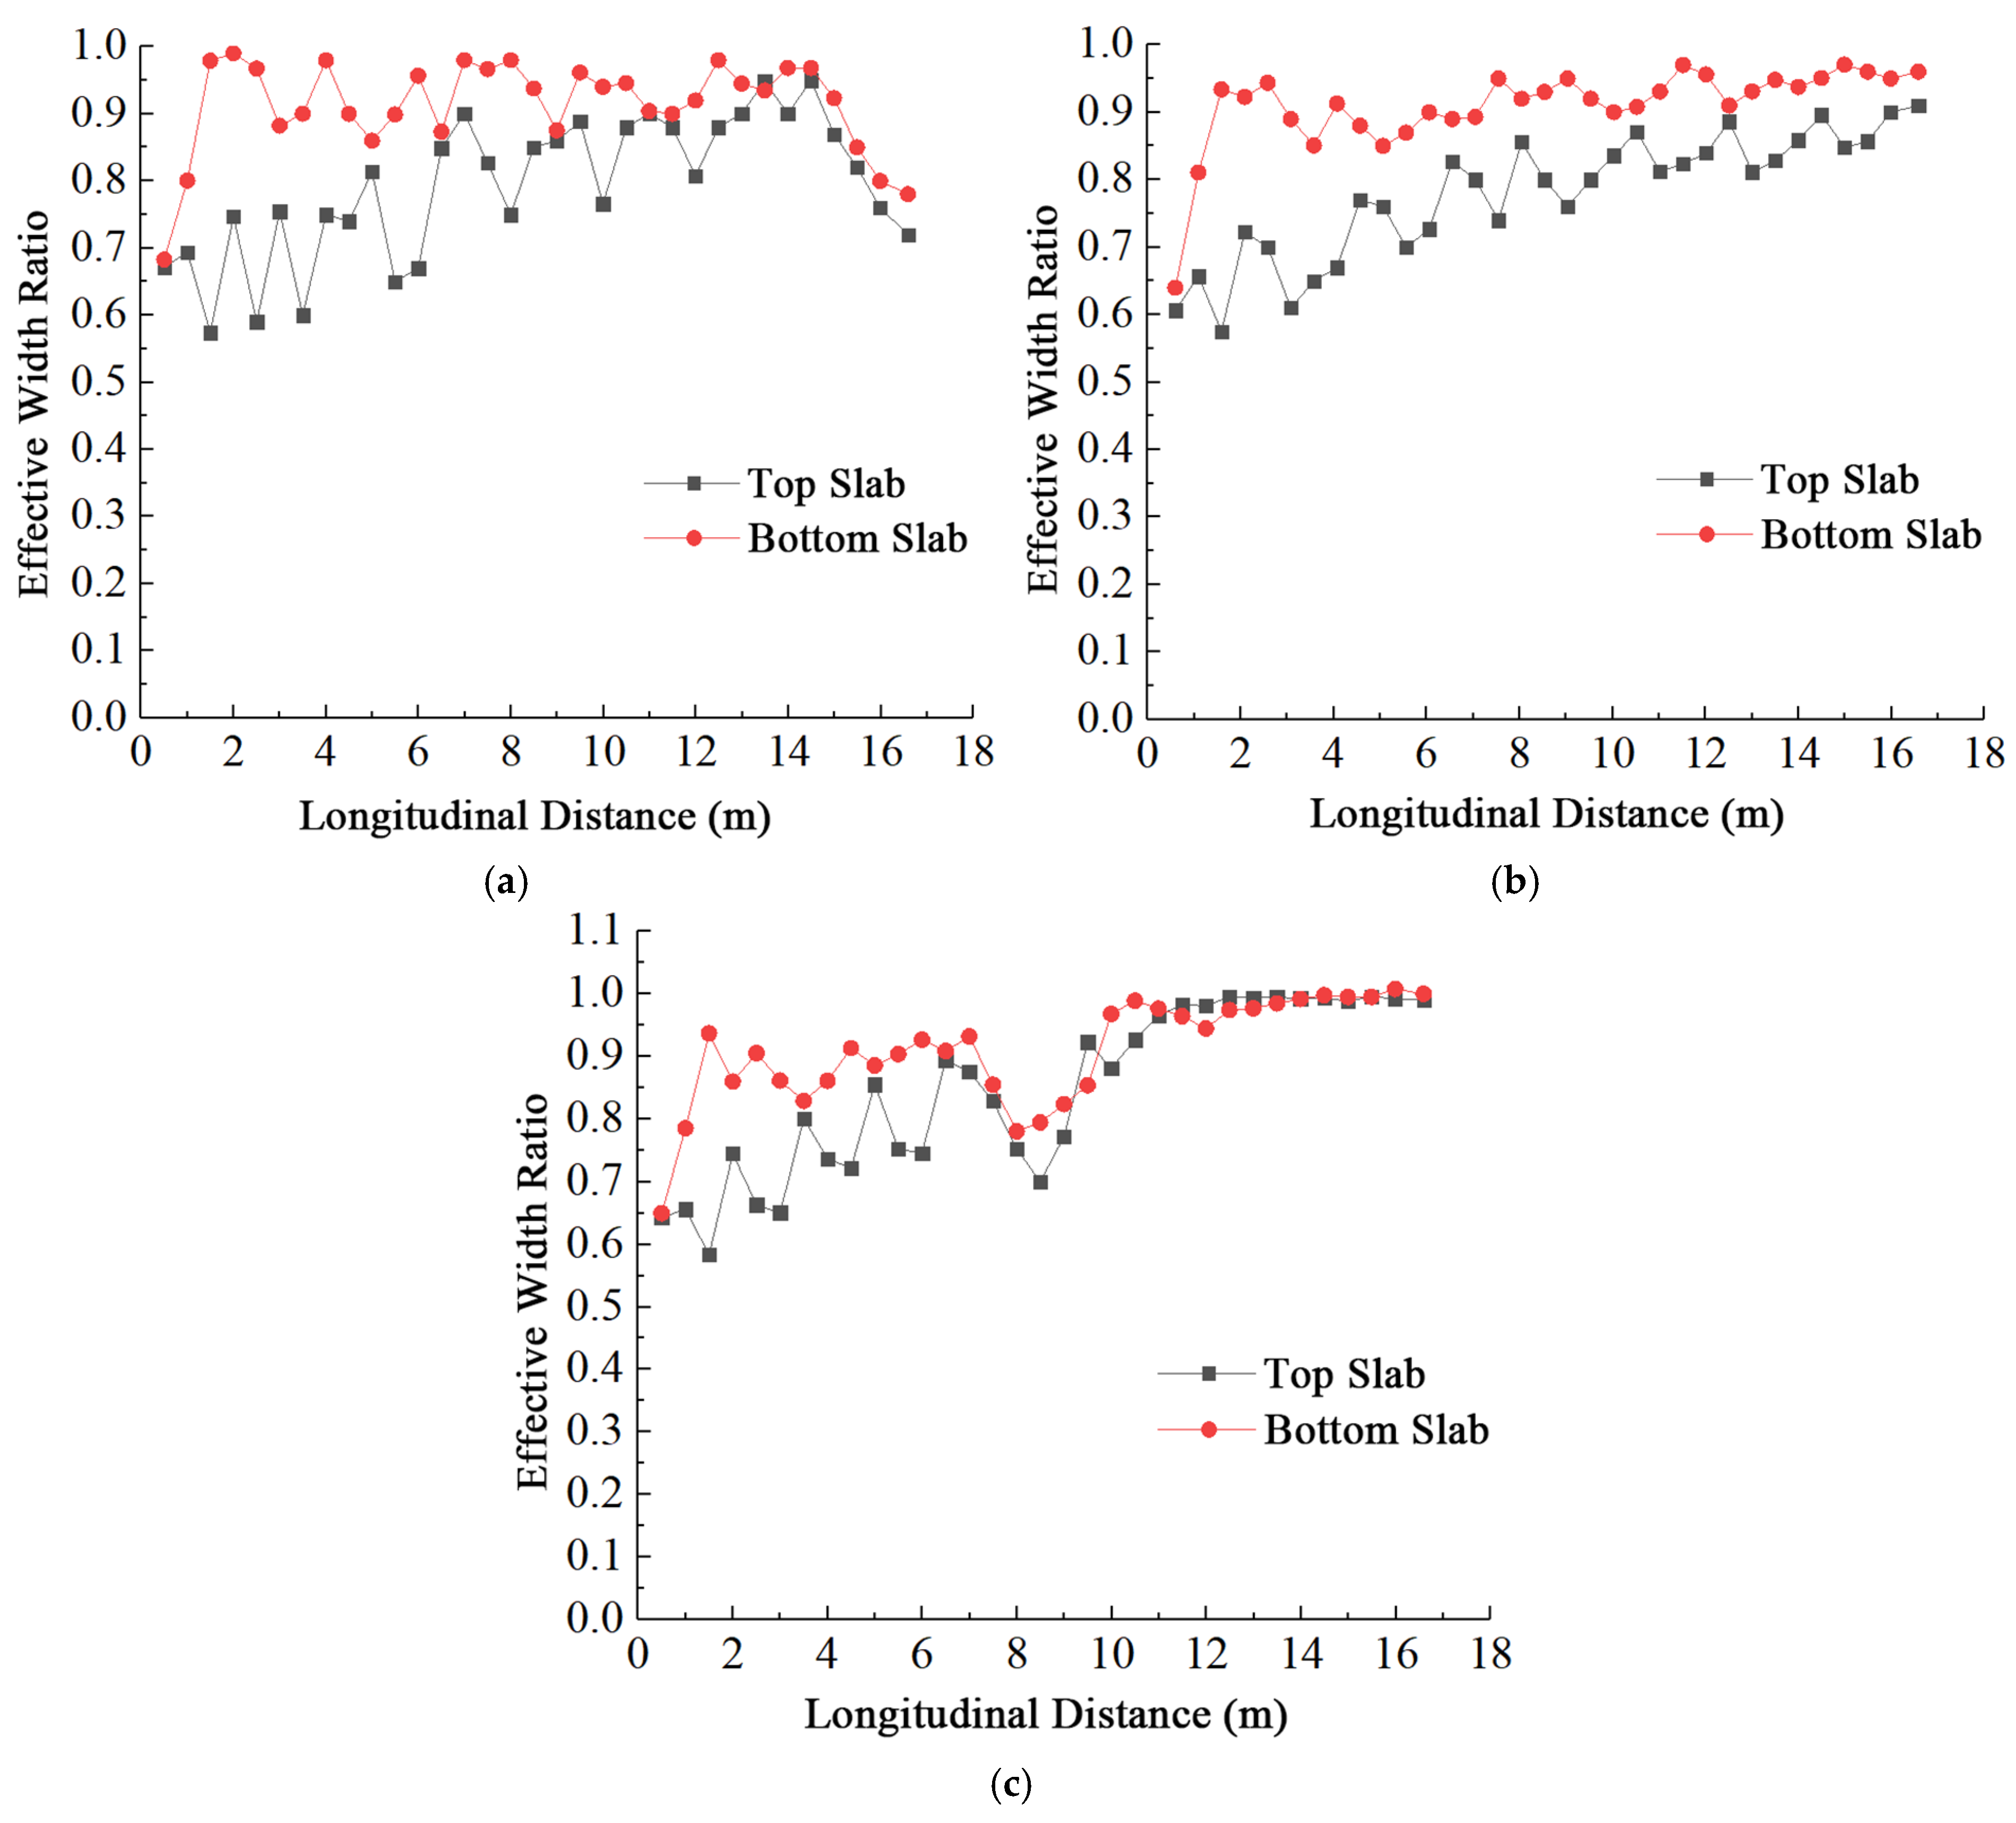
The effective width ratios along the longitudinal direction were computed under mid-span concentrated, full-span distributed, and two-point symmetric loading conditions using the FE model. Given the symmetry in both structure and loading, the analysis was restricted to the half-bridge section. The resulting longitudinal distributions of the effective width coefficients are presented in Figure 36.
Figure 36.
Effective Width Ratio under Three Loading Conditions: (a) Mid-Span Concentrated Load. (b) Full-Span Uniform Load. (c) Two-Point Symmetrical Load.
Based on Figure 36, the following conclusions can be drawn:
- (1)
- General Characteristics:
Under all three loading conditions, effective width ratios at the beam ends are consistently low, averaging approximately 0.65, indicating distinct shear lag effects in the end regions. Generally, the ratios for the top slab are lower than those for the bottom slab, implying that shear lag is more pronounced in the top slab. Furthermore, the top slab exhibits a fluctuating ascending trend, whereas the bottom slab is characterized by stable fluctuations.
- (2)
- Mid-span Concentrated Load:
The top slab ratio exhibits a fluctuating upward trend along the longitudinal direction, reflecting a weakening of the shear lag effect in regions distal to the concentrated load. Conversely, the bottom slab shows stable fluctuations, suggesting minimal sensitivity to direct loading action. Notably, within a 2.5 m range of the loading point, ratios for both slabs enter a continuous decline, reaching a minimum at the loading location. This demonstrates an intensification of shear lag as the loading distance decreases, culminating in a peak state characterized by maximum stress non-uniformity.
- (3)
- Full-span Distributed Load:
The top slab ratio displays a fluctuating ascent, peaking at the mid-span. This reflects a mitigation of shear lag as the load distribution range is extended, with the weakest effect occurring at the mid-span due to maximized stress uniformity. For the bottom slab, an initial upward trend is observed, followed by a stable fluctuation phase around 0.8 at a distance of 3 m from the beam end. This indicates that beyond this point, shear lag stabilizes with load transfer, maintaining a relatively balanced stress distribution.
- (4)
- Two-point Symmetric Load:
Initially, the top slab ratio exhibits a fluctuating ascent, while the bottom slab remains stable; this corresponds to the weakening of shear lag in the top slab as the load influence expands and the stability of the bottom slab in non-direct loading zones. At a longitudinal distance of 7.5 m from the beam end, a significant decline is detected in both slabs, reaching a minimum at the loading point. This reveals intensified stress non-uniformity and peak shear lag in this region. Subsequently, the ratios recover as the distance from the load increases; beyond 11 m from the beam end, both slabs enter a stable fluctuation phase around 0.98, indicating that stress uniformity is restored to a high level and the shear lag effect is significantly diminished.
4. Comparative Analysis with Steel Truss Web Girder Composite Girder Bridge
To evaluate the feasibility of GFRP truss members, a comparative steel truss web girder composite bridge model was established, sharing identical geometric parameters with the aforementioned GFRP bridge (33.15 m span, 8.5 m top slab width, 4.8 m bottom slab width, and 2.3 m girder height). In this model, GFRP members were replaced by concrete-filled steel tubes with an outer diameter of 351 mm, a wall thickness of 16 mm, an inclination of 67°, and an internode spacing of 1.95 m. Identical boundary conditions and a mid-span concentrated load (Q = 162 kN) were applied to facilitate a comparative analysis of flexural performance and to provide a basis for engineering applications.
The steel truss members are made of Q420E structural steel, a commonly used material in composite truss web girder bridges. In the finite element model, the elastic modulus is set to 2.06 × 10⁵ MPa, and the Poisson’s ratio is 0.3. A bilinear constitutive model is adopted, which follows the von Mises yield criterion. Yielding occurs when the equivalent stress reaches a predefined threshold, after which, plastic deformation initiates. In the plastic range, the equivalent stress remains constant, representing idealized perfectly plastic behavior.
4.1. Comparison of Vertical Deflection
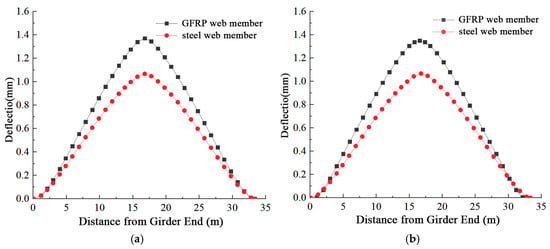
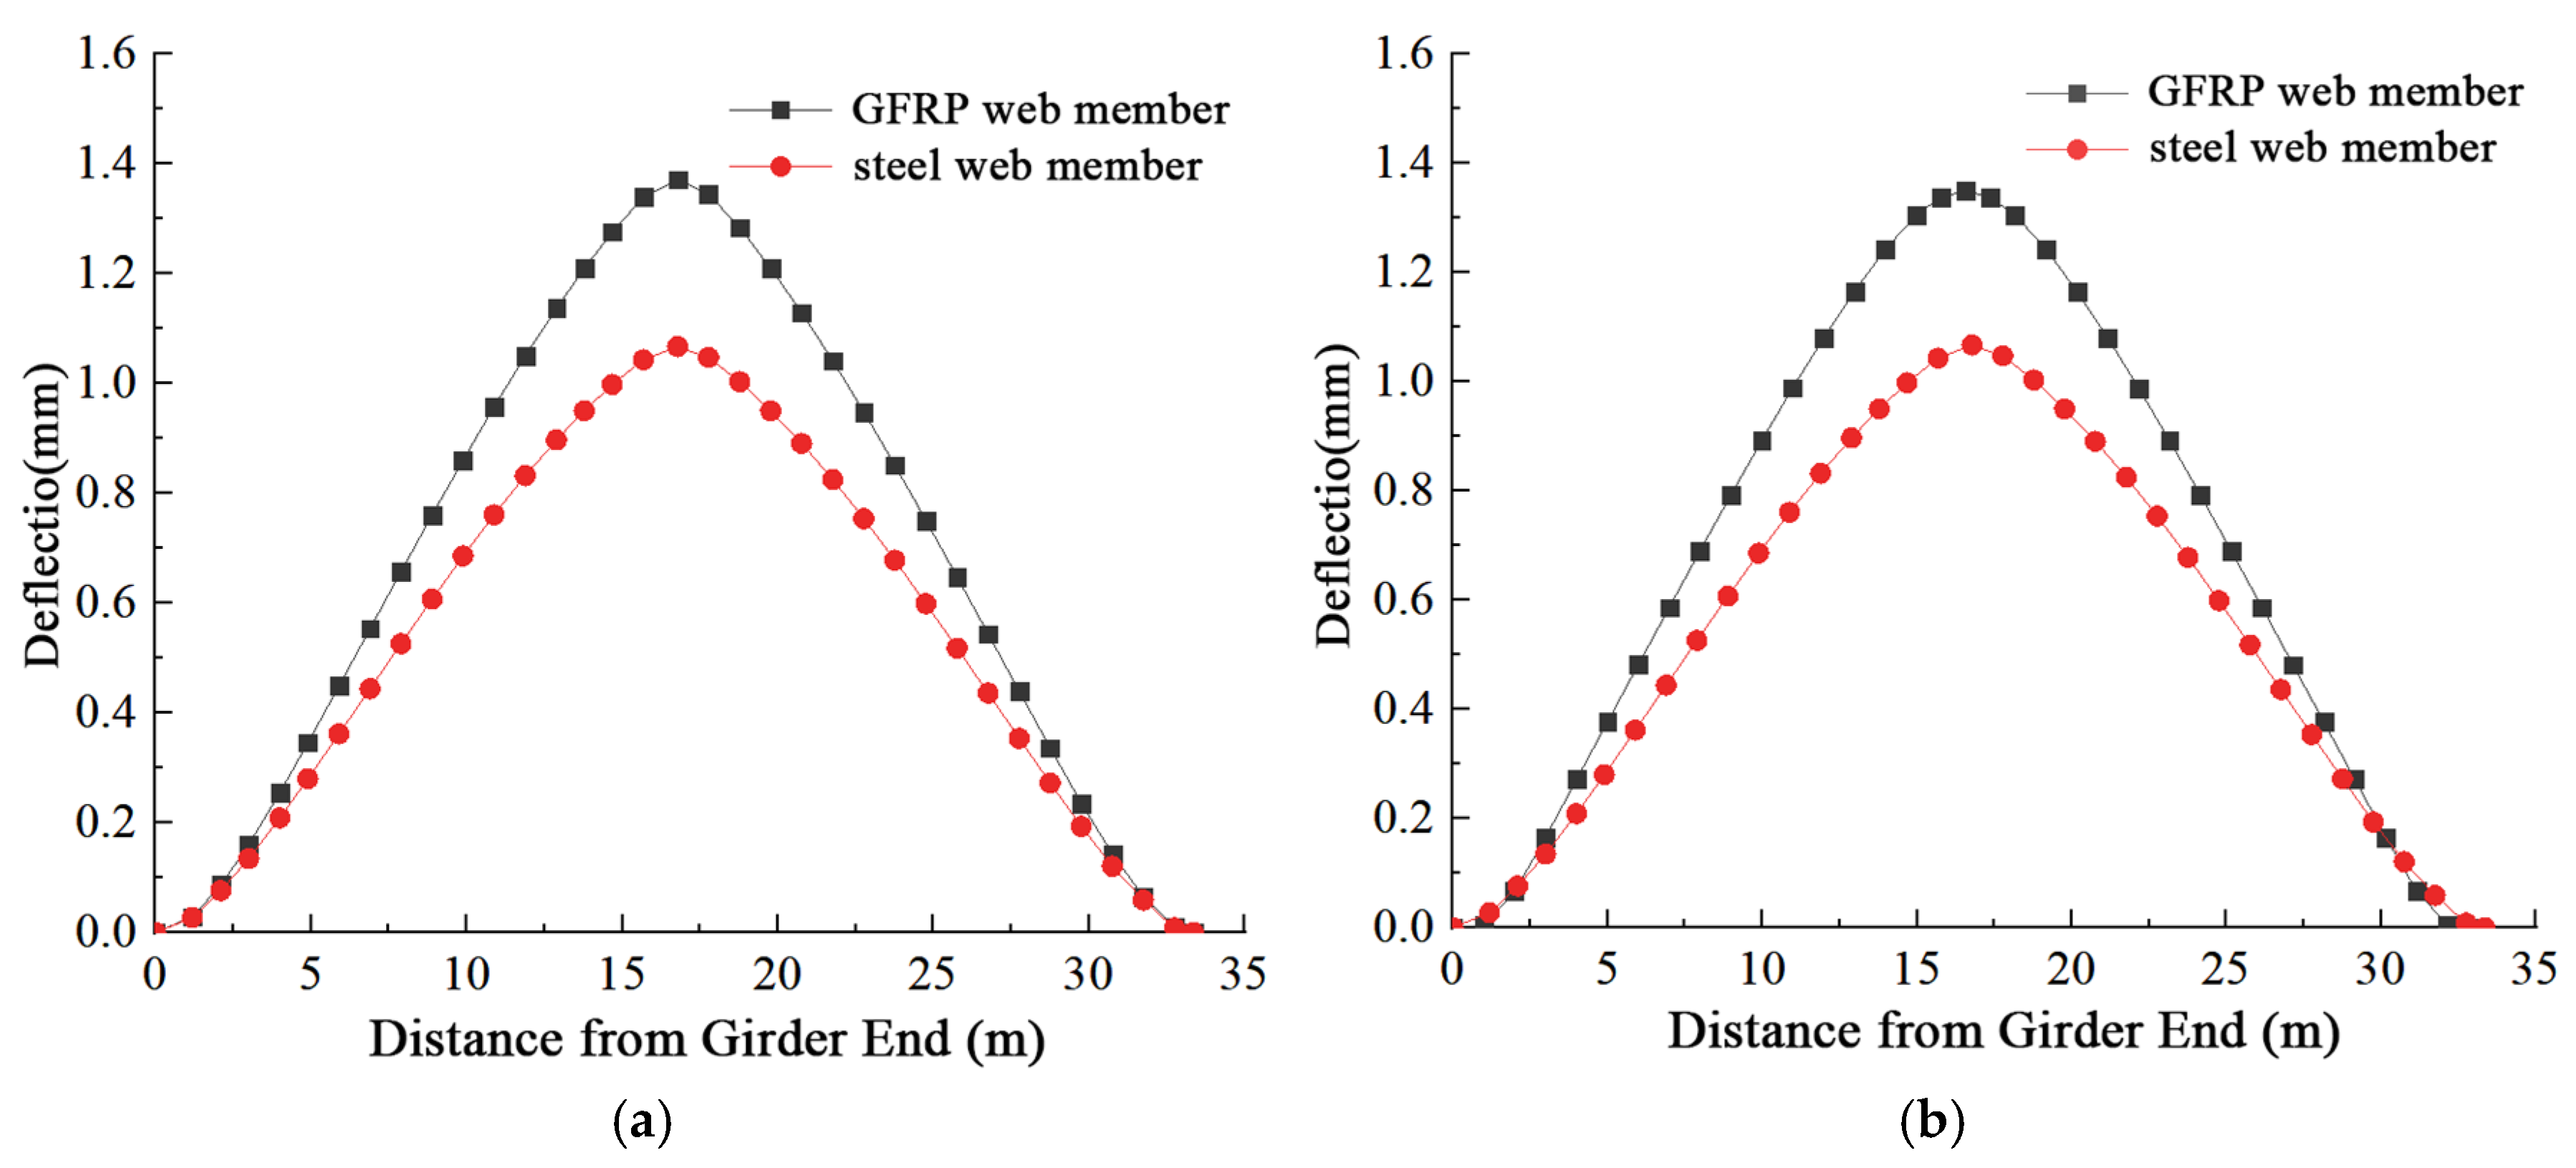
The comparison of longitudinal mid-span deflections for the concrete top and bottom slabs between the two bridge types is illustrated in Figure 37.
Figure 37.
Comparison of Deflections between Concrete Top and Bottom Slabs. (a) Deflection of Concrete Top Slab. (b) Deflection of Concrete Bottom Slab.
As observed in Figure 37, the GFRP bridge exhibits a maximum top slab deflection of 1.37 mm, which is approximately 28% higher than the 1.07 mm deflection of the steel bridge (a difference of 0.30 mm). Similarly, the bottom slab deflections are 1.34 mm and 1.05 mm, respectively, showing a comparable relative increase. This indicates a measurable reduction in global flexural stiffness in the GFRP-trussed system, primarily due to GFRP’s lower elastic modulus compared to steel. However, it is critical to evaluate this difference within an engineering context. Both absolute deflection values are very small, which is far below typical serviceability limits (e.g., L/600 to L/800) for bridge structures. Therefore, although a noticeable stiffness difference exists, the resulting deflections remain well within acceptable serviceability limits. Therefore, within the scope of this numerical study and under the specific load case examined, substituting steel webs with GFRP members demonstrates the feasibility of achieving flexural performance comparable to that relevant to serviceability limit states. The primary engineering trade-off involves accepting a modest increase in flexibility in exchange for significant benefits in corrosion resistance and potential weight savings.
4.2. Comparison of Transverse Shear Lag Effect
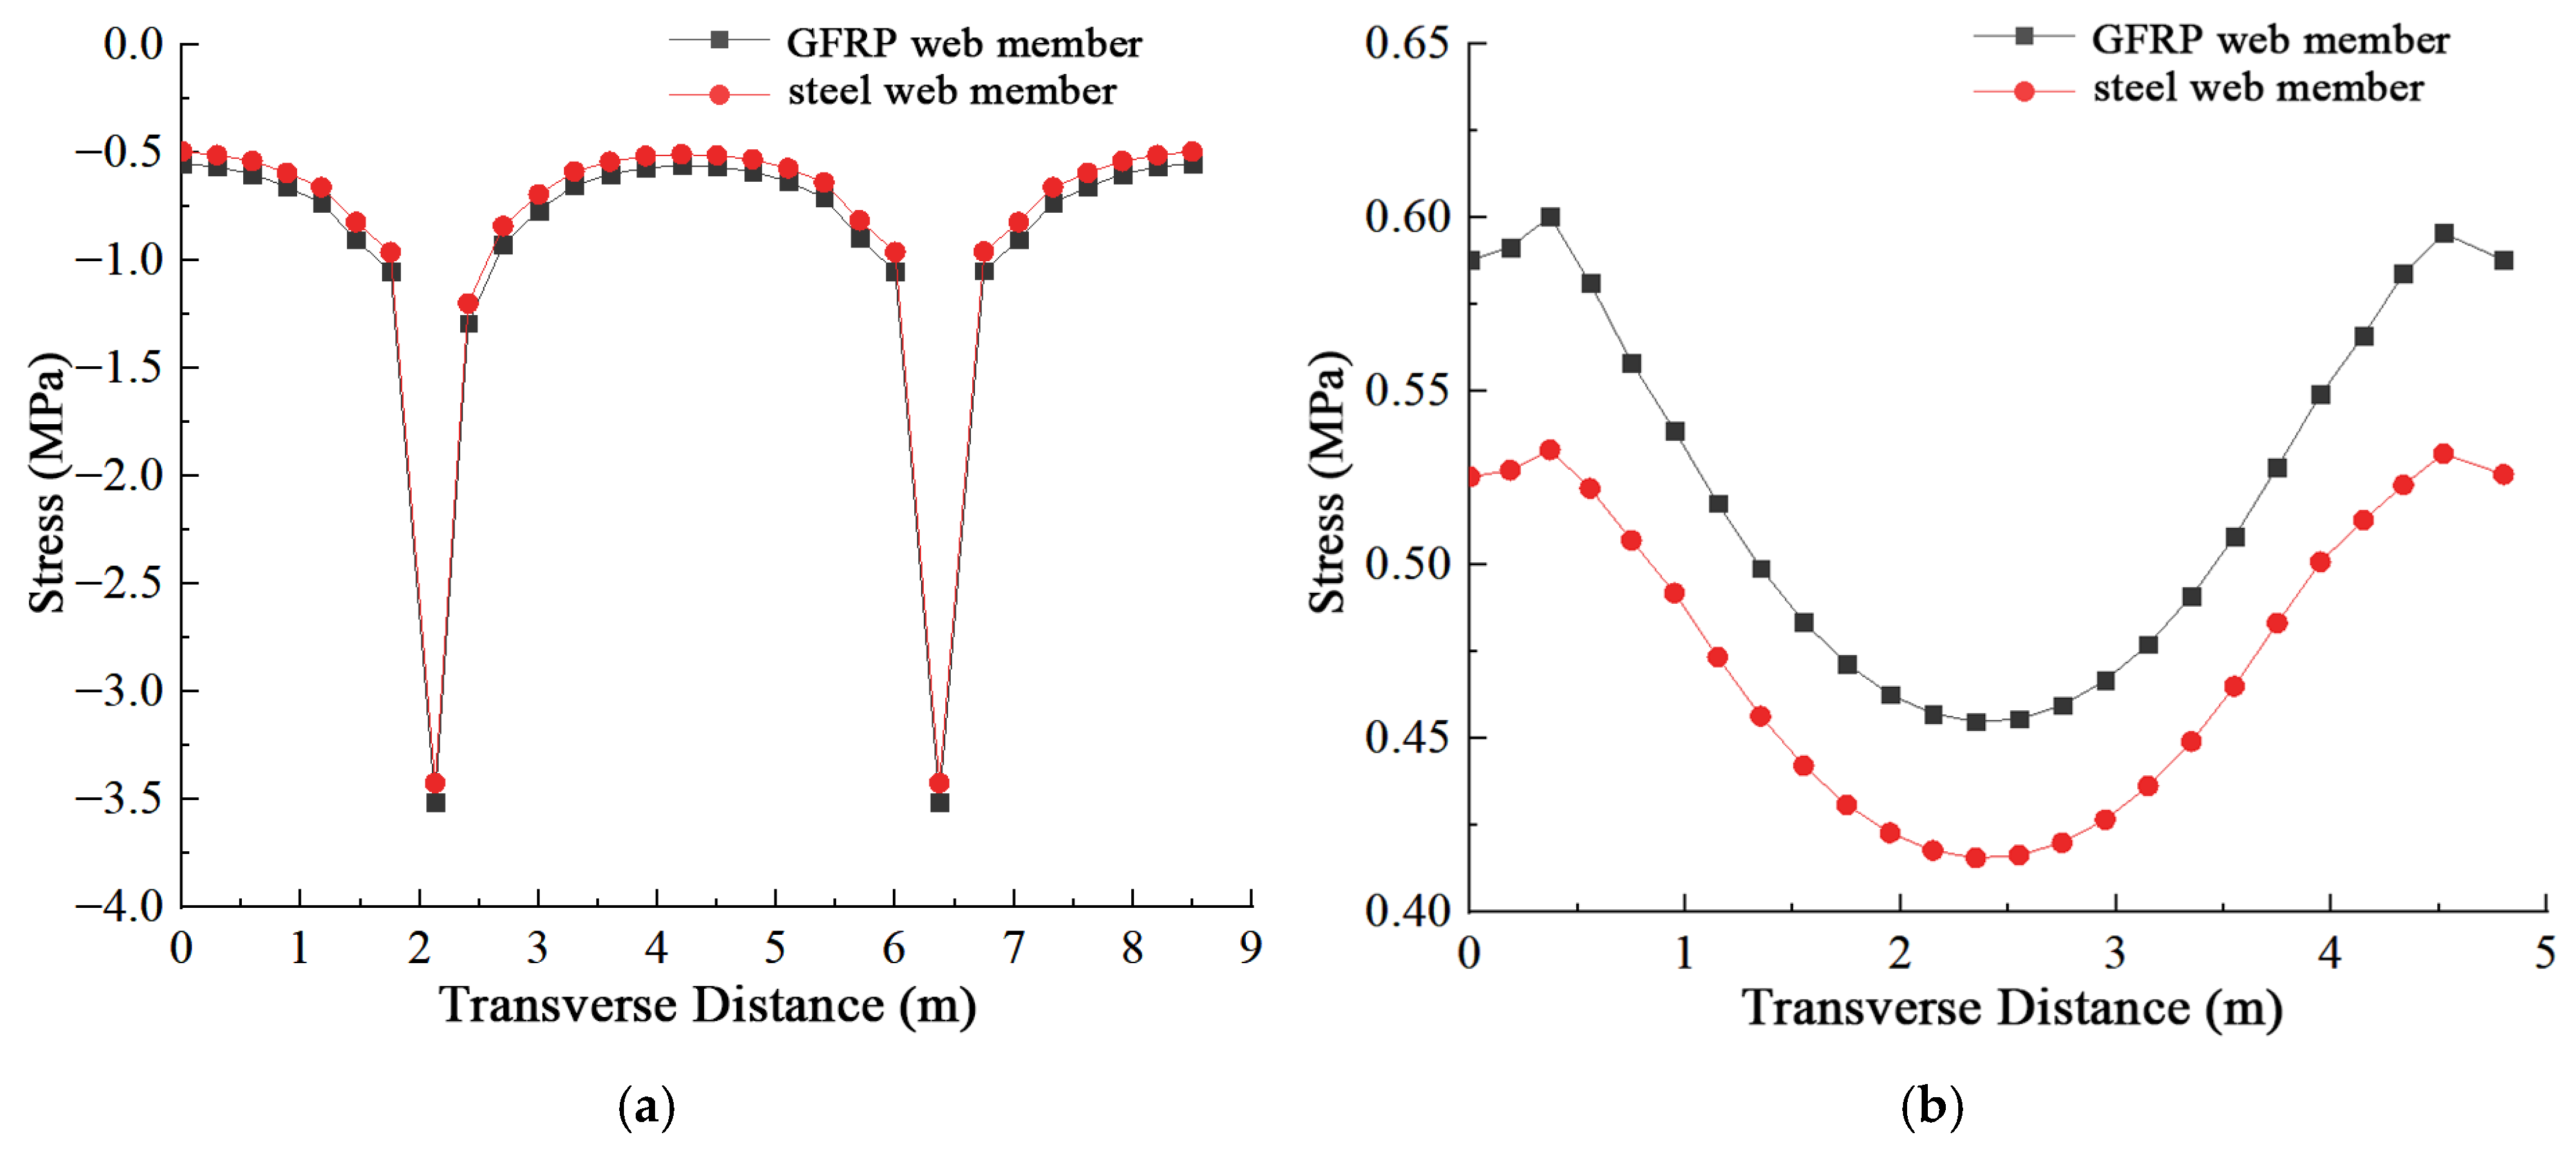
The comparison of transverse normal stresses in the concrete top and bottom slabs is illustrated in Figure 38.
Figure 38.
Comparison of Normal Stress in Concrete Top and Bottom Slabs. (a) Normal Stress of Concrete Top Slab. (b) Normal Stress of Concrete Bottom Slab.
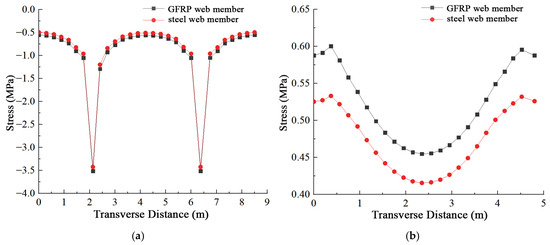
As observed from the analysis, similar transverse normal stress distribution patterns are exhibited by both the GFRP and steel truss web girder bridges, with stresses in the GFRP bridge being marginally higher at all locations. For the top slab, the maximum and minimum stress deviations between the two models are 0.092 MPa and 0.052 MPa, respectively; for the bottom slab, these values are 0.064 MPa and 0.039 MPa. Given these negligible differences, it is concluded that the transverse normal stresses in the concrete slabs are largely comparable between the two bridge types.
4.3. Comparison of Longitudinal Shear Lag Effect
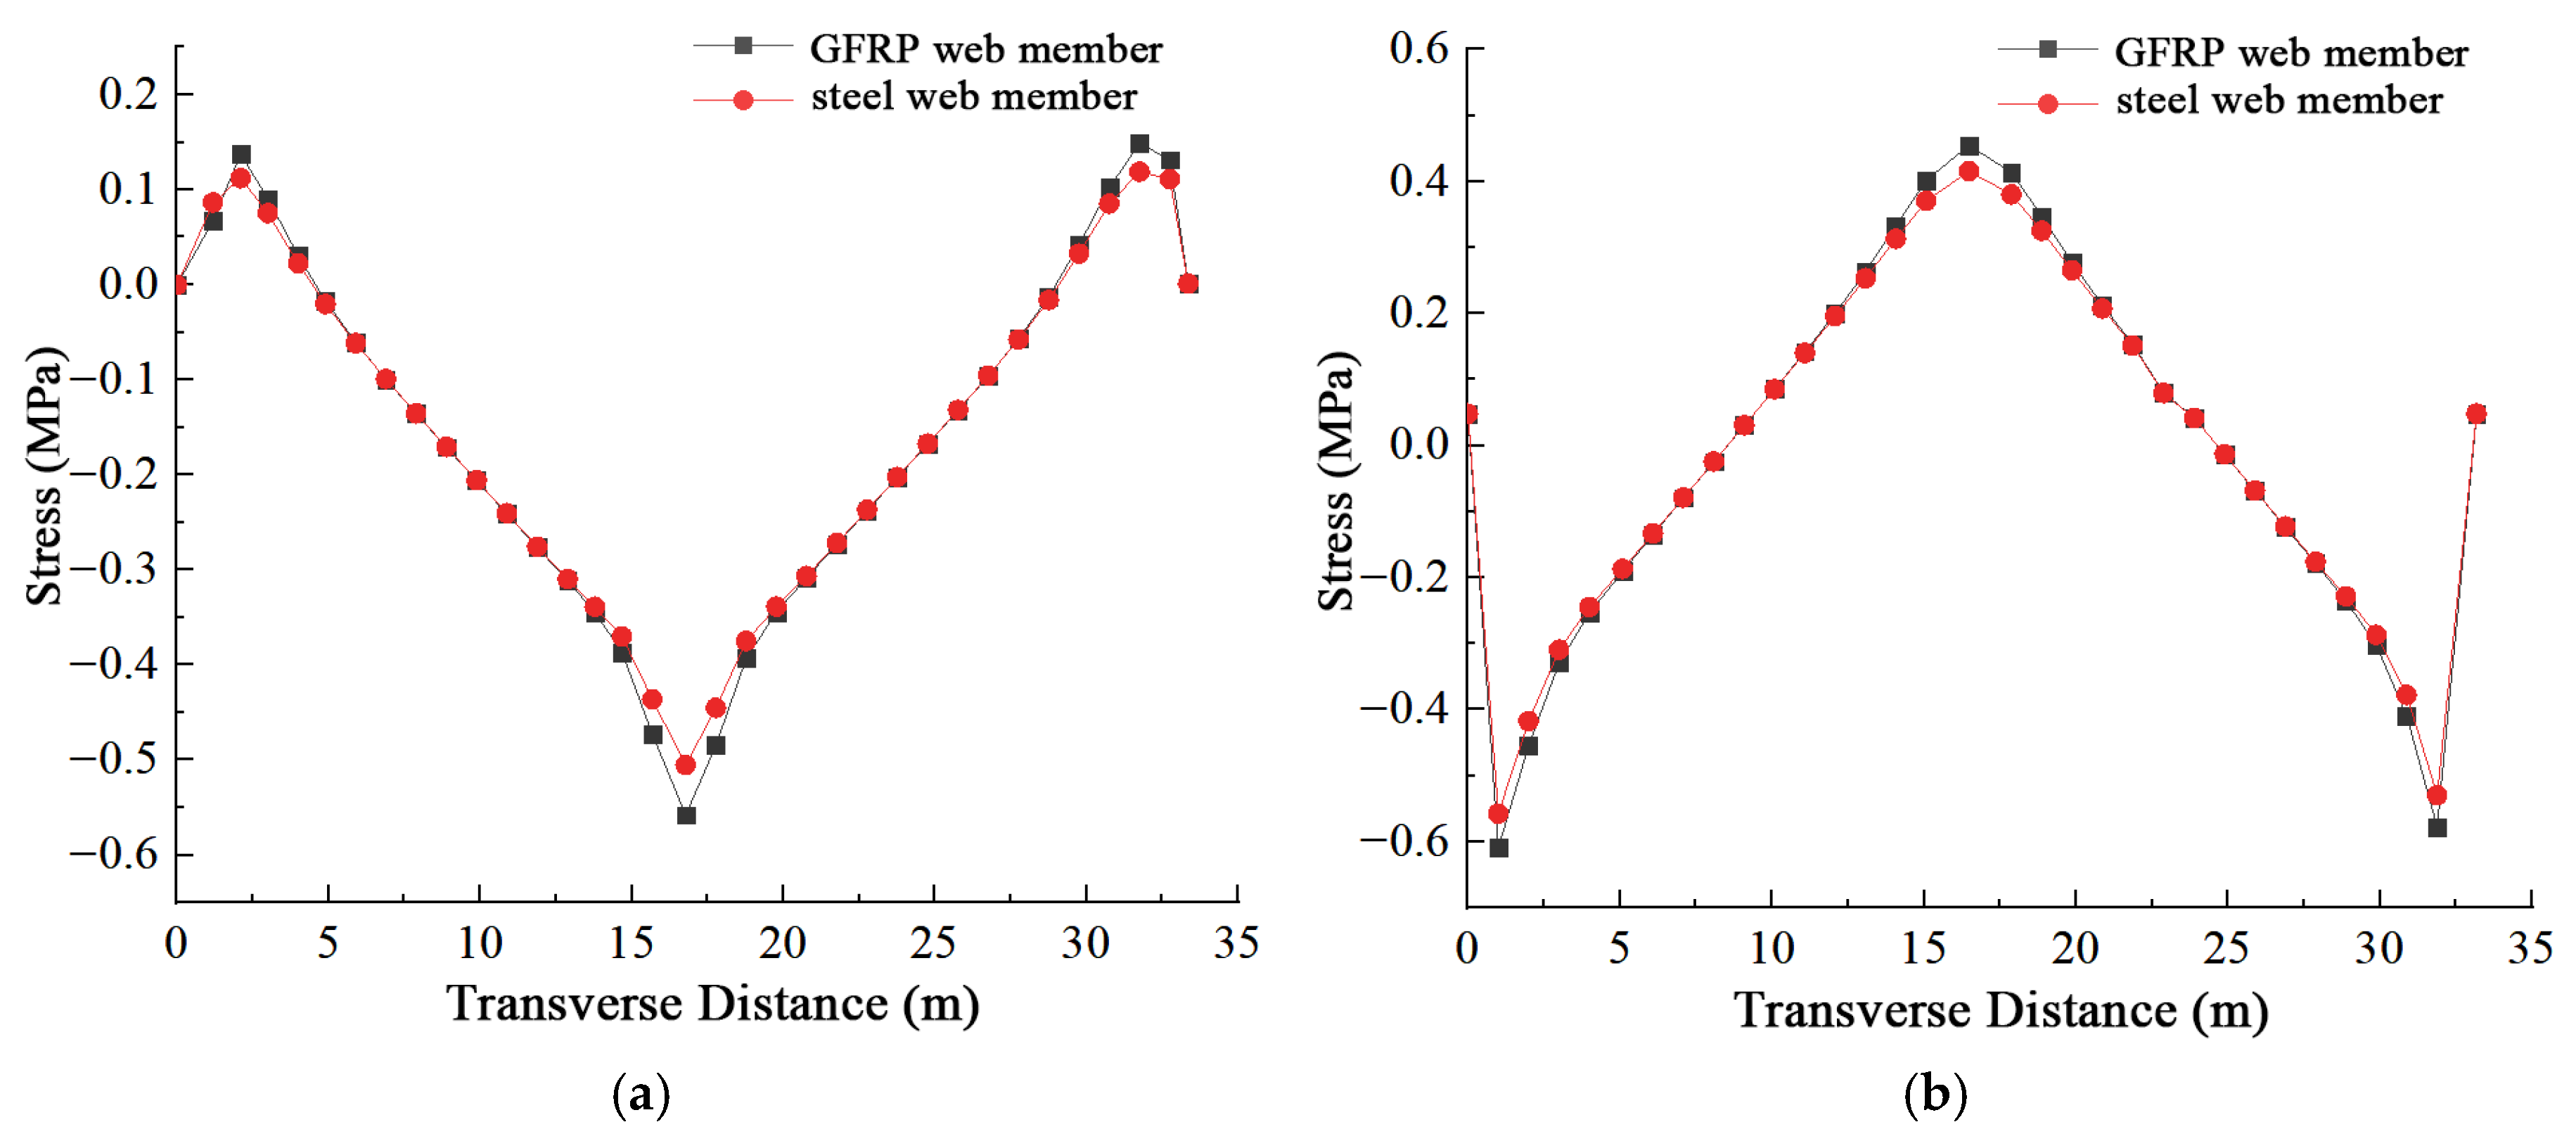
The longitudinal normal stress comparison of the concrete top and bottom slabs between the GFRP composite truss web girder bridge and the steel truss web girder composite girder bridge is illustrated in Figure 39.
Figure 39.
Comparison of Normal Stress in Concrete Top and Bottom Slabs. (a) Normal Stress of Concrete Top Slab. (b) Normal Stress of Concrete Bottom Slab.
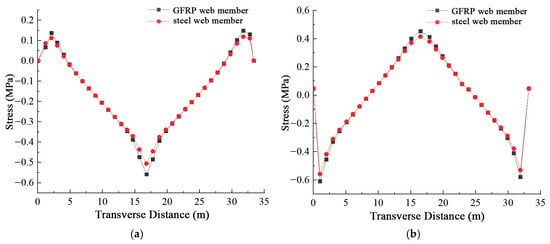
Based on the analysis of the longitudinal stress profiles, both the GFRP and steel truss web girder bridges exhibit highly similar normal stress distribution patterns in the top and bottom slabs. Although stresses in the GFRP bridge are slightly elevated near the mid-span and end regions, they remain nearly identical to those of the steel bridge at other locations. The maximum stress deviations for the top and bottom slabs, both occurring at the mid-span, are 0.052 MPa and 0.039 MPa, respectively. Consequently, it is determined that the longitudinal normal stresses in the top and bottom slabs of the two bridge types are virtually indistinguishable.
5. Conclusions
The investigation into the shear lag effect of the GFRP composite truss web girder bridge reveals significant interlayer heterogeneity in transverse stress distribution. The phenomenon is notably more pronounced in the concrete top slab than in the bottom slab. Specifically, stress peaks are consistently localized at truss-to-slab connections, a behavior driven by the discrete shear-transfer mechanism characteristic of the truss structure. Conversely, stress troughs observed at the geometric center of the bottom slab near supports are primarily governed by rigid boundary constraints, which restrict lateral deformation and alter the standard stress diffusion path.
Regarding the longitudinal evolution, the effective width ratio (φ) demonstrates high sensitivity to end effects and stress concentrations. Across all loading cases, this ratio drops to approximately 0.65 at the beam ends and loading points, indicating a severe lag phenomenon in these zones. However, in regions distal to the applied loads, the ratio recovers to over 0.98, signifying the restoration of full synergistic action between the flange and the web. This quantitative finding underscores the need to consider reduced effective widths in critical regions during design.
A comparative analysis of loading scenarios reveals distinct stress-diffusion mechanisms. Under mid-span concentrated loading, the structure exhibits the most severe local shear lag, characterized by sharp stress peaks at the top slab truss-slab joints and a rapid decline in the effective width ratio to its minimum at the loading point. Conversely, under full-span distributed loading, the stress distribution is significantly smoother; the shear lag effect is progressively mitigated towards the mid-span, resulting in a nearly uniform stress field in the central region. The two-point symmetric loading exhibits a unique hybrid behavior: while severe stress concentrations occur at the loading points, the central region between them enters a pure bending state in which the vertical shear force vanishes, leading to a uniform stress distribution across the flange width and negligible shear lag. Furthermore, across all load cases, the top slab consistently displays greater stress non-uniformity and sensitivity to local loading than the bottom slab, necessitating prioritized attention in reinforcement design.
Furthermore, the comparative analysis confirms that under the specific conditions of this study, the flexural response and serviceability performance of the GFRP truss web girder bridge are highly similar to those of its steel counterpart. The disparities in mechanical responses are minor and acceptable for engineering purposes, with maximum mid-span deflection differences limited to 0.29–0.30 mm and normal stress deviations remaining below 0.1 MPa. These results validate the feasibility of substituting traditional steel webs with GFRP truss members to meet serviceability limit states while demonstrating a moderate reduction in global stiffness. The primary engineering value of this substitution lies in the long-term benefits, including complete corrosion elimination, reduced lifecycle maintenance costs, and a lighter structure, which can lead to savings in foundation and seismic design.
Overall, this study quantifies the multi-case response characteristics of the shear lag effect and establishes the effective width ratio as a reliable design parameter. These findings provide a theoretical basis for the refined design and engineering application of GFRP composite truss web girder bridges, supporting the wider adoption of this novel bridge type. From a practical engineering perspective, this study provides two key design insights: First, the quantified effective width ratios, especially the lower values (around 0.65) at beam ends and load points, offer direct guidance for the refined design of GFRP truss web bridge flanges, suggesting where reinforcement detailing or careful load distribution considerations are most critical. Second, the identified interlayer stress heterogeneity underscores the importance of considering differential shear lag effects in the top and bottom slabs during the design phase to ensure accurate stress prediction and durability assessment. However, the applicable boundaries of this research must be acknowledged. The conclusions presented herein are based on a refined FE model assuming static elastic behavior and idealized rigid connections. Factors such as concrete long-term creep, interface slip between the truss and concrete slabs, and long-term fatigue performance under moving vehicular loads were not explicitly considered. Future research should extend to these coupled effects and full-scale testing to further substantiate the structural robustness of GFRP composite truss web bridges throughout their service life.
Author Contributions
Conceptualization, D.X.; methodology, D.X.; software, Z.X.; validation, R.C. and Z.Y.; formal analysis, D.X.; investigation, D.X.; resources, D.X.; data curation, R.C.; writing—original draft preparation, D.X.; writing—review and editing, D.X.; visualization, R.C.; supervision, D.X.; project administration, D.X.; funding acquisition, D.X. All authors have read and agreed to the published version of the manuscript.
Funding
This research received no external funding.
Data Availability Statement
The original contributions presented in this study are included in the article. Further inquiries can be directed to the corresponding author.
Acknowledgments
During the preparation of this work, the authors used ChatGPT (GPT-4o) in order to improve the language. After using this tool, the authors reviewed and edited the content as needed and take full responsibility for the content of the publication.
Conflicts of Interest
The authors declare no conflicts of interest.
References
- Arici, M.; Granata, M.F.; Longo, G. Symplectic analysis of thin-walled curved box girders with torsion, distortion and shear lag warping effects. Thin-Walled Struct. 2022, 175, 109244. [Google Scholar] [CrossRef] [Scilit]
- Jung, K.H.; Yi, J.W.; Kim, J.H.J. Structural safety and serviceability evaluations of prestressed concrete hybrid bridge girders with corrugated or steel truss web members. Eng. Struct. 2010, 32, 3866–3878. [Google Scholar] [CrossRef] [Scilit]
- Machacek, J.; Charvat, M. Study on shear connection of bridge steel truss and concrete slab deck. J. Civ. Eng. Manag. 2017, 23, 105–112. [Google Scholar] [CrossRef] [Scilit]
- Liu, Y.Q.; Xin, H.; He, J.; Xue, D.; Ma, B. Experimental and analytical study on fatigue behavior of composite truss joints. J. Constr. Steel Res. 2013, 83, 21–36. [Google Scholar] [CrossRef] [Scilit]
- Chang, T.S. Shear Lag Effect in Simply Supported Prestressed Concrete Box Girder. J. Bridge Eng. 2004, 9, 178–184. [Google Scholar] [CrossRef] [Scilit]
- Liu, D.; Miao, C.; Deng, W.; Zhang, J.; Zhang, L.; Gu, J. Shear lag effect of steel–concrete composite girder bridge with steel truss webs: Experiment, finite element, and theory. J. Struct. Eng. 2025, 151, 04025154. [Google Scholar] [CrossRef] [Scilit]
- Zou, B.; Chen, A.; Davalos, F.J.; Salim, H.A. Evaluation of effective flange width by shear lag model for orthotropic FRP bridge decks. Compos. Struct. 2010, 93, 474–482. [Google Scholar] [CrossRef] [Scilit]
- Chen, S.S.; Tian, Z.L.; Gui, S.R. Research on shear lag of single-box multi-cell box girders with corrugated steel webs. J. Highw. Transp. Res. Dev. 2015, 32, 69–75. [Google Scholar]
- Zheng, S.M.; Wan, S. Finite Element Analysis on Shear Lag Effect in Composite Girder with Steel Truss Webs. J. Highw. Transp. Res. Dev. 2013, 30, 68–72+77. [Google Scholar] [CrossRef] [Scilit]
- Zhou, M.D.; Li, L.Y.; Zhang, Y.H. Research on Shear-lag Warping Displacement Function of Thin-walled Box Girders. China J. Highw. Transp. 2015, 28, 67–73. [Google Scholar]
- Lei, C. Study on Mechanical Properties Hybrid Truss Bridges. Ph.D. Thesis, Southeast University, Nanjing, China, 2015. [Google Scholar]
- Alexandre, P. European Committee for Standardization. Dictionary Geotechnical Engineering//Wrterbuch Geotechnik; Springer: Berlin/Heidelberg, Germany, 2014; p. 486. [Google Scholar]
- Xiong, Z.; Liu, Y.; Zuo, Y.; Xin, H. Shear performance assessment of sand-coated GFRP perforated connectors embedded in concrete. Materials 2019, 12, 1906. [Google Scholar] [CrossRef] [Scilit] [PubMed]
- Di, J.; Cao, L.; Han, J. Experimental Study on the Shear Behavior of GFRP–Concrete Composite Beam Connections. Materials 2020, 13, 1067. [Google Scholar] [CrossRef] [Scilit] [PubMed]
- Li, H.; Liu, D.; Deng, W.; Zhang, J. Research on the shear performance of truss web steel-concrete composite box girder. Structures 2025, 79, 109602. [Google Scholar] [CrossRef] [Scilit]
- Zhao, P.; Rong, X.L.; Ye, J.S. Research on the Lateral Effective Width of Composite Box-girders with Corrugated Steel Webs. J. Hunan Univ. (Nat. Sci.) 2016, 43, 105–110. [Google Scholar]
- Chen, W. The Mechanical Model and Comparison of Steel Truss-Web Composite Bridge. Ph.D. Thesis, Huazhong University of Science and Technology, Wuhan, China, 2014. [Google Scholar]
- Zeng, F. Research on Effective Width of RPC-Steel Composite Beams. Ph.D. Thesis, Hunan University of Science and Technology, Changsha, China, 2014. [Google Scholar]
- Liu, X.Z.; Cheng, K.; Wu, G.; Jing, W.-w. Study on Effective Distribution Width of Long-span Continuous Girder Bridge with Corrugated Steel Webs. J. Highw. Transp. Res. Dev. 2022, 39, 85–92. [Google Scholar]





Disclaimer/Publisher’s Note: The statements, opinions and data contained in all publications are solely those of the individual author(s) and contributor(s) and not of MDPI and/or the editor(s). MDPI and/or the editor(s) disclaim responsibility for any injury to people or property resulting from any ideas, methods, instructions or products referred to in the content. |
© 2026 by the authors. Licensee MDPI, Basel, Switzerland. This article is an open access article distributed under the terms and conditions of the Creative Commons Attribution (CC BY) license.