


Abstract
Digital image-based determination of aggregate and rock gradation has been only limitedly addressed in the existing literature despite its considerable potential to transform conventional material characterization practices in civil engineering. Rapid and accurate estimation of aggregate and rock particle size distributions using advanced image-based analytical methods can significantly improve efficiency, consistency, and scalability in design, construction, and quality control processes, particularly in large-scale structural and geotechnical engineering projects where traditional sieve analysis is time-consuming, labor-intensive, and difficult to apply under field conditions. In this study, an image-based methodology is proposed to rapidly detect aggregate particles and determine their size-based proportions within a pile by employing image enhancement, segmentation, and boundary detection algorithms. The results obtained from digital image processing are comparatively evaluated against experimental sieve analysis data, demonstrating a strong correlation between the two approaches. Low RMSE values achieved for larger aggregate sizes, such as 25.4 mm and 19 mm, indicate high detection accuracy, while the relatively higher yet acceptable RMSE values obtained for smaller particles, including 12.7 mm and 9.5 mm, confirm that the method maintains practical sensitivity across different size ranges. By analyzing samples collected from various aggregate and rock piles, the study further demonstrates the originality, robustness, and effectiveness of the proposed approach in evaluating heterogeneous material groups. Overall, the findings highlight that digital image-based determination offers a fast, reproducible, and non-destructive alternative to traditional sieve analysis, making it particularly valuable for reinforced concrete aggregate assessment and port fill rock characterization in large-scale structural and geotechnical engineering applications.
1. Introduction
Recent advances in computer vision, image processing, and artificial intelligence have enabled the development of reliable and consistent alternatives to conventional experimental methods in civil engineering. In particular, image-based approaches have been widely applied for particle size distribution (PSD) estimation, aggregate characterization, and material performance assessment. A hybrid gradation prediction framework integrating visual foundation models and artificial neural networks demonstrated improved PSD estimation for densely packed coarse aggregates, significantly reducing prediction errors compared to earlier non-overlapping particle approaches [1]. Similarly, photogrammetric computer vision combined with artificial intelligence has been used to enhance the characterization of fresh concrete workability, establishing strong correlations between image-derived parameters and the Visual Stability Index (ASTM C1611) [2]. Deep learning-based image analysis has also proven effective in pavement engineering, enabling accurate prediction of the International Roughness Index (IRI) and detection of aggregate segregation from surface images [3].
Beyond pavement applications, multispectral satellite imagery integrated with machine learning algorithms has improved lithological mapping accuracy [4]. Experimental, numerical, and image-based approaches have also been employed to investigate fracture behavior in mass concrete, compressive failure mechanisms in recycled concrete, fracture parameters in asphalt concrete, and ballast condition assessment [5,6,7,8]. Similar methodologies have been extended to sludge floc morphology, colloidal aggregates, bitumen–aggregate interaction and recycled concrete characterization [9,10,11,12].
A variety of aggregate characterization techniques have been reported, including neural network-based classification with 3D laser scanning, hyperspectral image fusion methods, detailed digital image-based shape analysis, and real-time online detection systems [13,14,15]. Digital image processing has been extensively used for determining coarse aggregate PSD, evaluating aggregate–asphalt adhesion, assessing the influence of aggregate shape on asphalt concrete performance, and estimating aggregate gradation in asphalt mixtures [16,17,18,19]. Considering that aggregates constitute approximately 60–75% of concrete volume and strongly influence mechanical and durability properties [20], accurate and rapid PSD determination is critical for quality control. Experimental studies have confirmed the significant influence of aggregate gradation, size, and content on compressive strength and workability [20,21,22].
Despite these advances, achieving an optimal balance between speed and accuracy in aggregate analysis remains challenging. Automated detection systems have therefore been proposed to overcome limitations of conventional sieving. Image-based PSD results have shown good agreement with mechanical sieve analyses [19], while intelligent weight-prediction systems using Backpropagation Neural Networks have achieved high accuracy levels (89.49%) for coarse aggregates [23]. Additional studies have focused on aggregate morphology, including angularity, surface texture, and 3D shape indices [24,25]. However, many of these approaches rely on images of isolated or non-overlapping particles, limiting their applicability in real bulk-pile conditions.
Recent research has therefore shifted toward segmentation-based and machine learning–assisted methods capable of analyzing densely packed or piled materials. Multimodal feature learning models following Watershed segmentation have been proposed for rock fragment size estimation [26], and ANN-based frameworks trained on shape descriptors have successfully predicted PSD of densely packed aggregates [1]. Other methodologies have achieved over 92% accuracy in size class estimation [27], although performance may depend on particle circularity and roundness [28]. Video image processing and compaction-based image analysis techniques have also been introduced for rock-fill and aggregate gradation assessment [29,30].
Accurate image-based PSD estimation is influenced by multiple factors, including particle size distribution, texture, morphology, imaging angle, and lighting conditions. Nevertheless, image processing techniques remain attractive due to their practicality, cost-efficiency, and suitability for large-scale applications.
Particle size distribution is a critical parameter governing the durability, stability, and structural performance of civil engineering systems. In this study, an image processing-based methodology is proposed for estimating the PSD of aggregates, stones, and rock-fill materials in large heterogeneous piles. The results were validated against laboratory sieve analyses, demonstrating high consistency and robustness under different imaging orientations.
The proposed framework enables rapid, on-site, and cost-effective gradation characterization for large-scale fill materials used in earth and rock-fill dams, port embankments, and reinforced concrete structures. By significantly reducing time, labor, and operational costs while maintaining high accuracy, the method offers a practical alternative to conventional sieve analysis for bulk aggregate assessment.
2. Materials and Methods
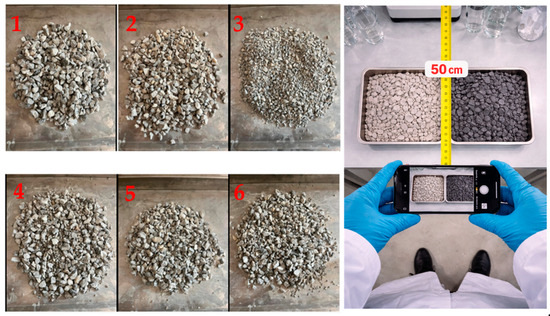
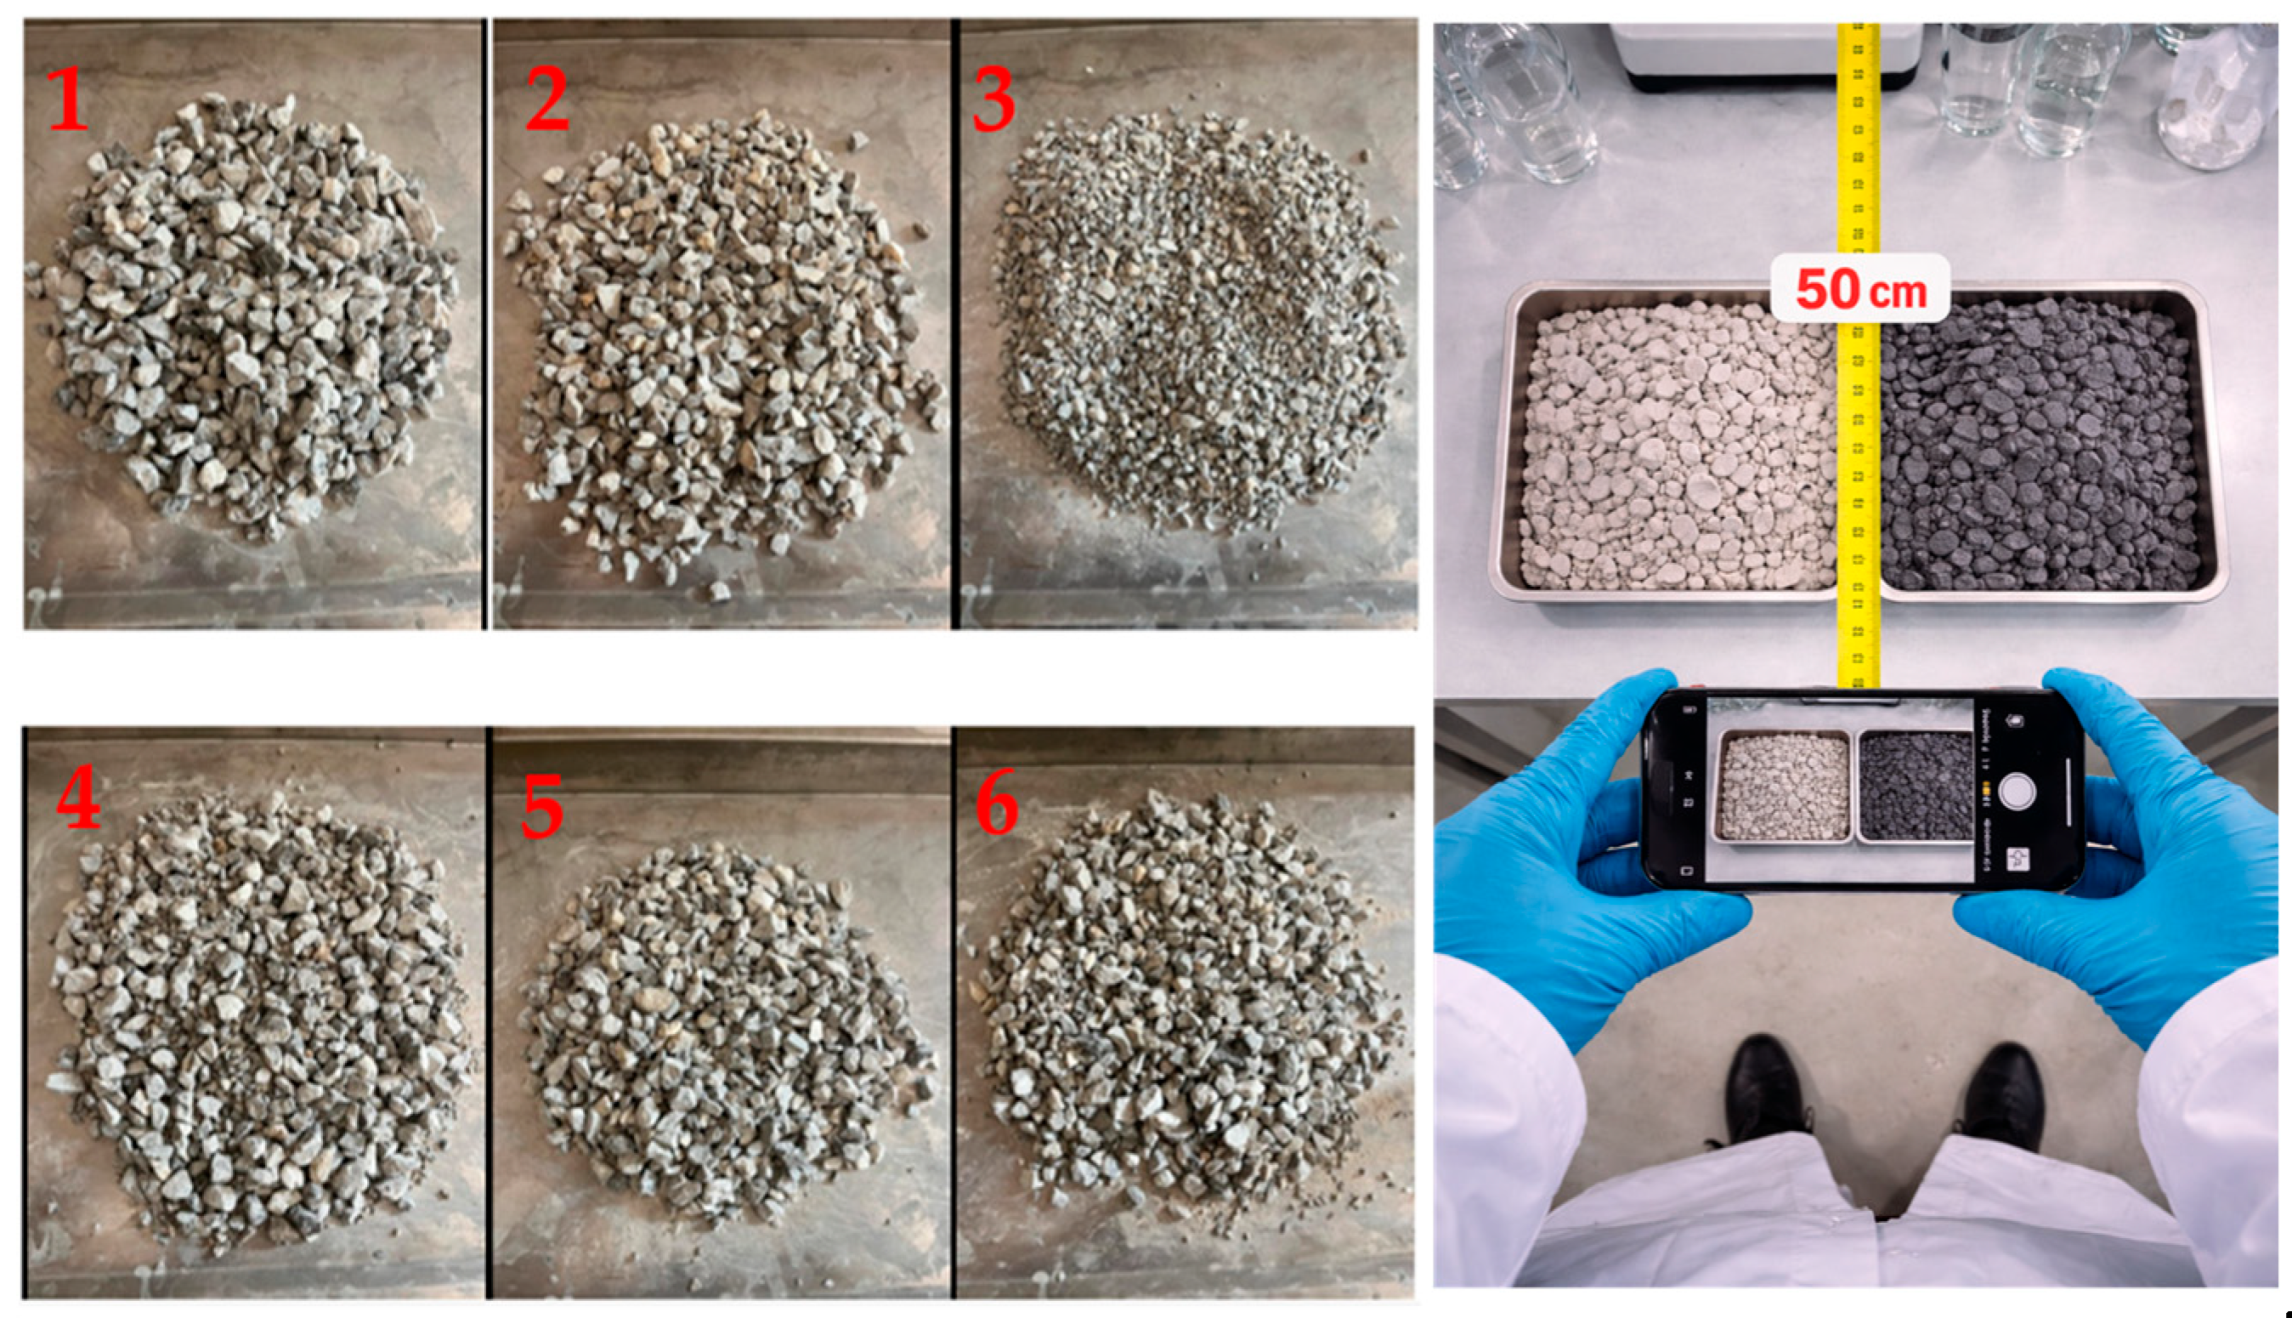
The basic properties of the aggregates used, including their angular shape and natural crushed origin, are now reported. In addition, the particle size distributions are presented through gradation curves. In addition, it should be specified that the aggregates used were derived from limestone and basalt rocks. In the laboratory, six different samples were prepared—L (large-1), M (medium-2), S (small-3), LS (large–small-4), LM (large–medium-5), and LMS (large–medium–small-6)— and then the aggregate specimens were captured as colored digital images (RGB, in JPEG format) in a vertical orientation, as shown in Figure 1.
Figure 1.
Randomly selected images obtained by mixing the six different aggregate samples obtained from the piles and digital images.
The images were captured using an iPhone 13 smartphone from a distance of 50 cm and from two different orientations, in order to verify the reliability of the prediction process based on the acquired images.
In addition, the background used during image acquisition was a gray-toned laboratory surface, which is relatively close to the color of the rock samples. From an image processing perspective, this makes the distinction between the sample and the background more challenging. Despite this difficulty, the proposed technique was able to successfully discriminate the aggregates from the background. It is therefore expected that the method would perform even more effectively for different environmental conditions and textures. The total weights of the samples used in the experimental study were 4.59 kg for L, 4.24 kg for M, 4.25 kg for S, 4.62 kg for LS, 4.82 kg for LM, and 5.05 kg for LMS. Sample 1 represented a coarser grain distribution, Sample 2 exhibited a medium grain distribution, and Sample 3 had the finest grain distribution. Subsequently, Samples 4, 5, and 6 were prepared using different combination ratios of these three initial samples, and their gradation properties were determined through sieve analysis. First, the actual values representing the percentage of particles passing through each sieve were obtained under laboratory conditions to establish the gradation curves of the samples.
2.1. Sieve Analysis
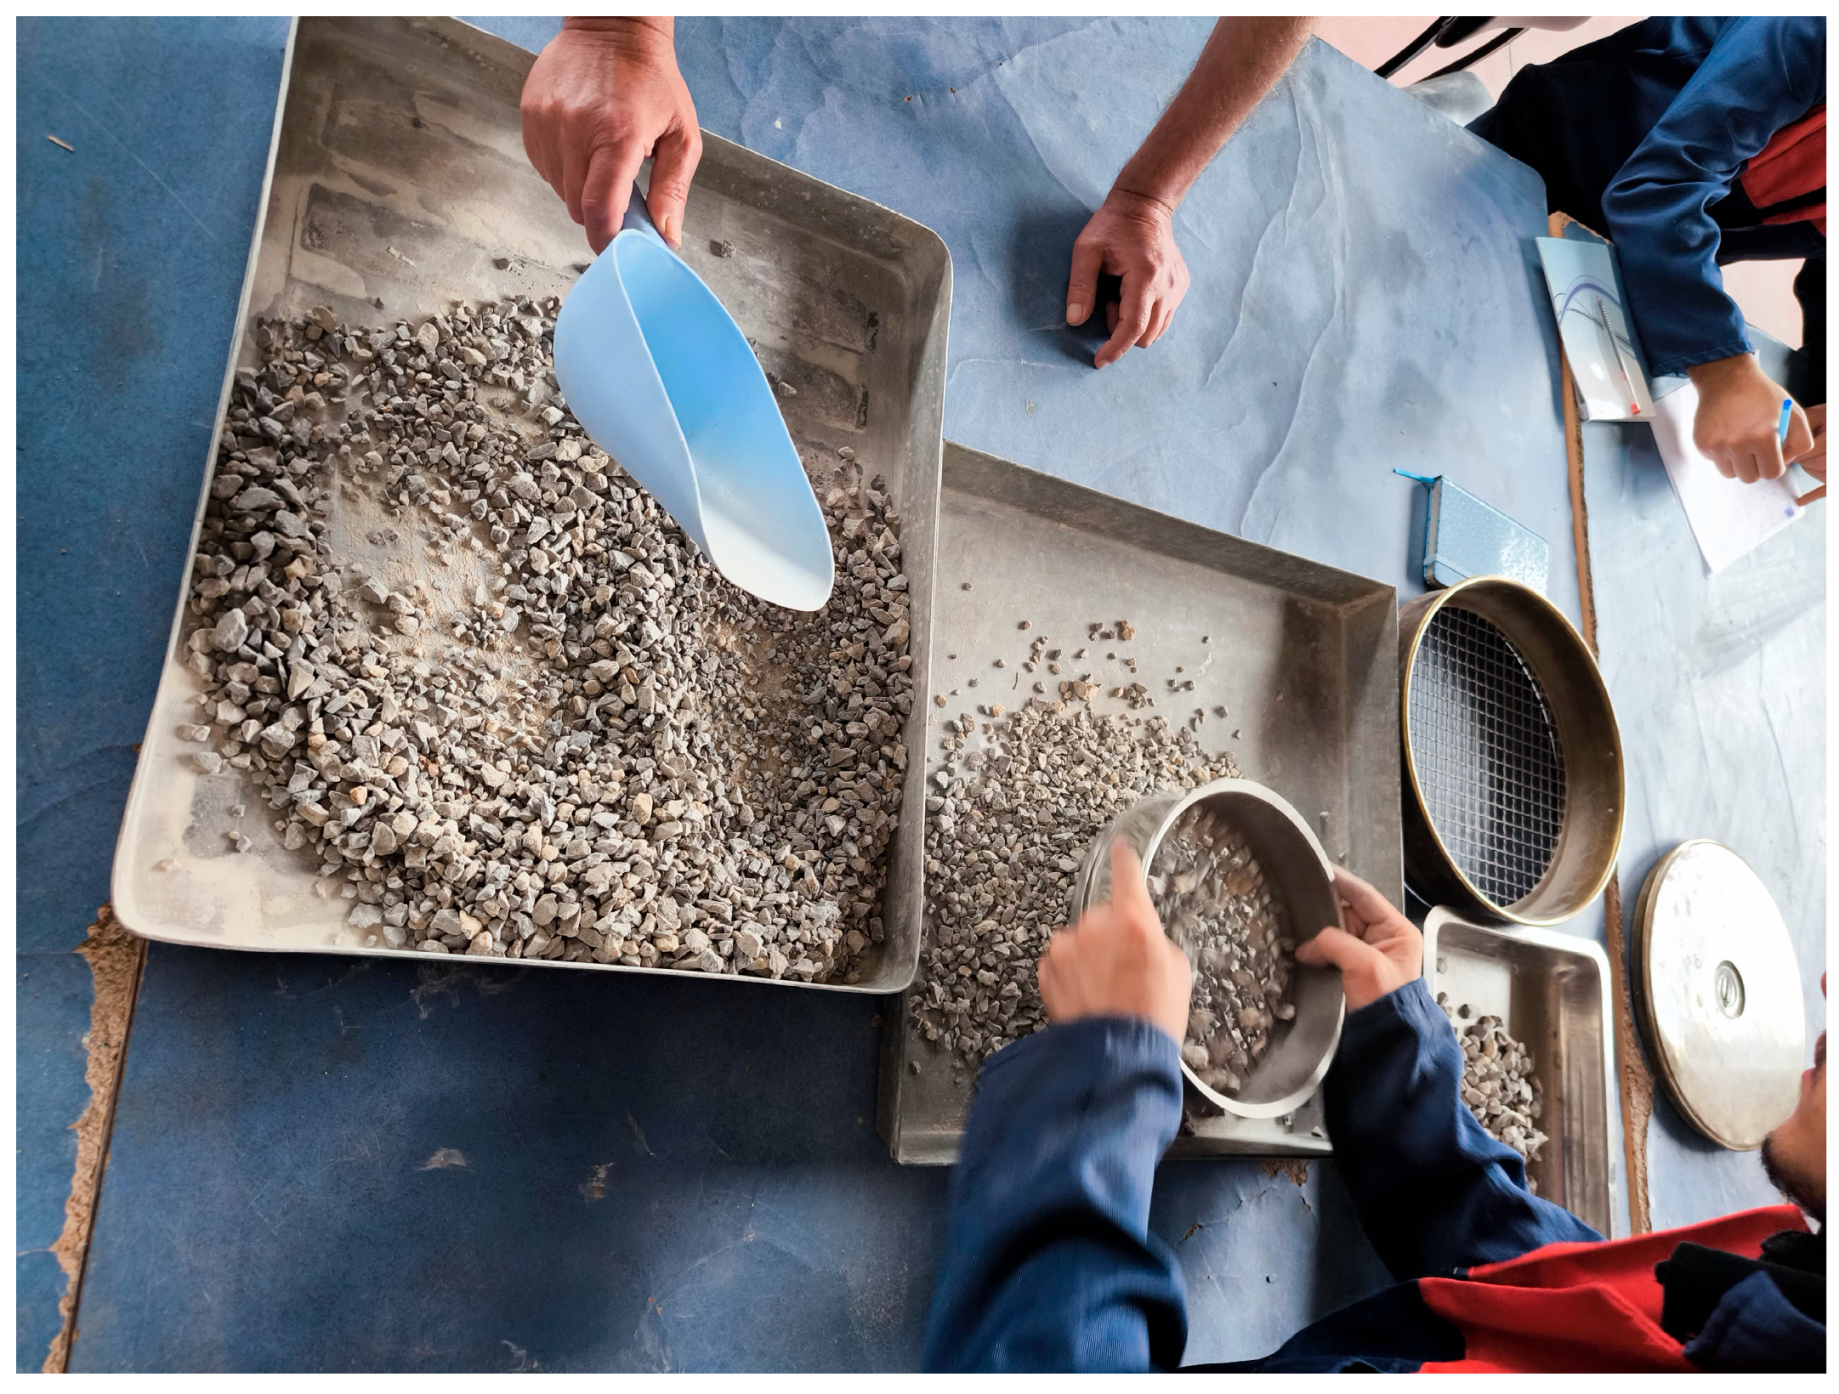
The sieve analysis method is a fundamental and widely used technique in civil engineering and material characterization for determining the particle size distribution (PSD) of granular materials such as aggregates, sands, soils, and rock fragments. The method is based on the principle of mechanical separation, in which a representative sample is passed through a series of sieves with progressively smaller openings to classify particles according to their size. In a typical procedure, the aggregate sample is first oven-dried to remove moisture and then placed in the top sieve of a stack arranged in descending order of mesh size. The stack is subjected to vibratory or mechanical shaking for a specified duration to ensure thorough separation of the particles. After sieving, the mass of material retained on each sieve is measured, and the percentage passing or retained is calculated relative to the total sample mass. These data are then used to plot a gradation curve, which represents the cumulative particle size distribution. Sieve analysis provides essential information for assessing aggregate quality, gradation uniformity, and suitability for construction applications such as concrete, asphalt, and geotechnical fill materials. Despite being a time-consuming and labor-intensive process, it remains the standard reference method (ASTM C136/EN 933-1) against which alternative and automated techniques—such as digital image processing—are evaluated for accuracy and efficiency.
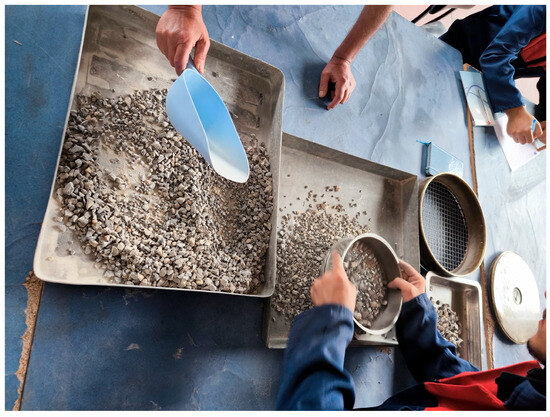
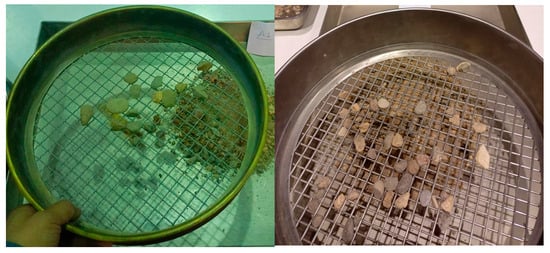
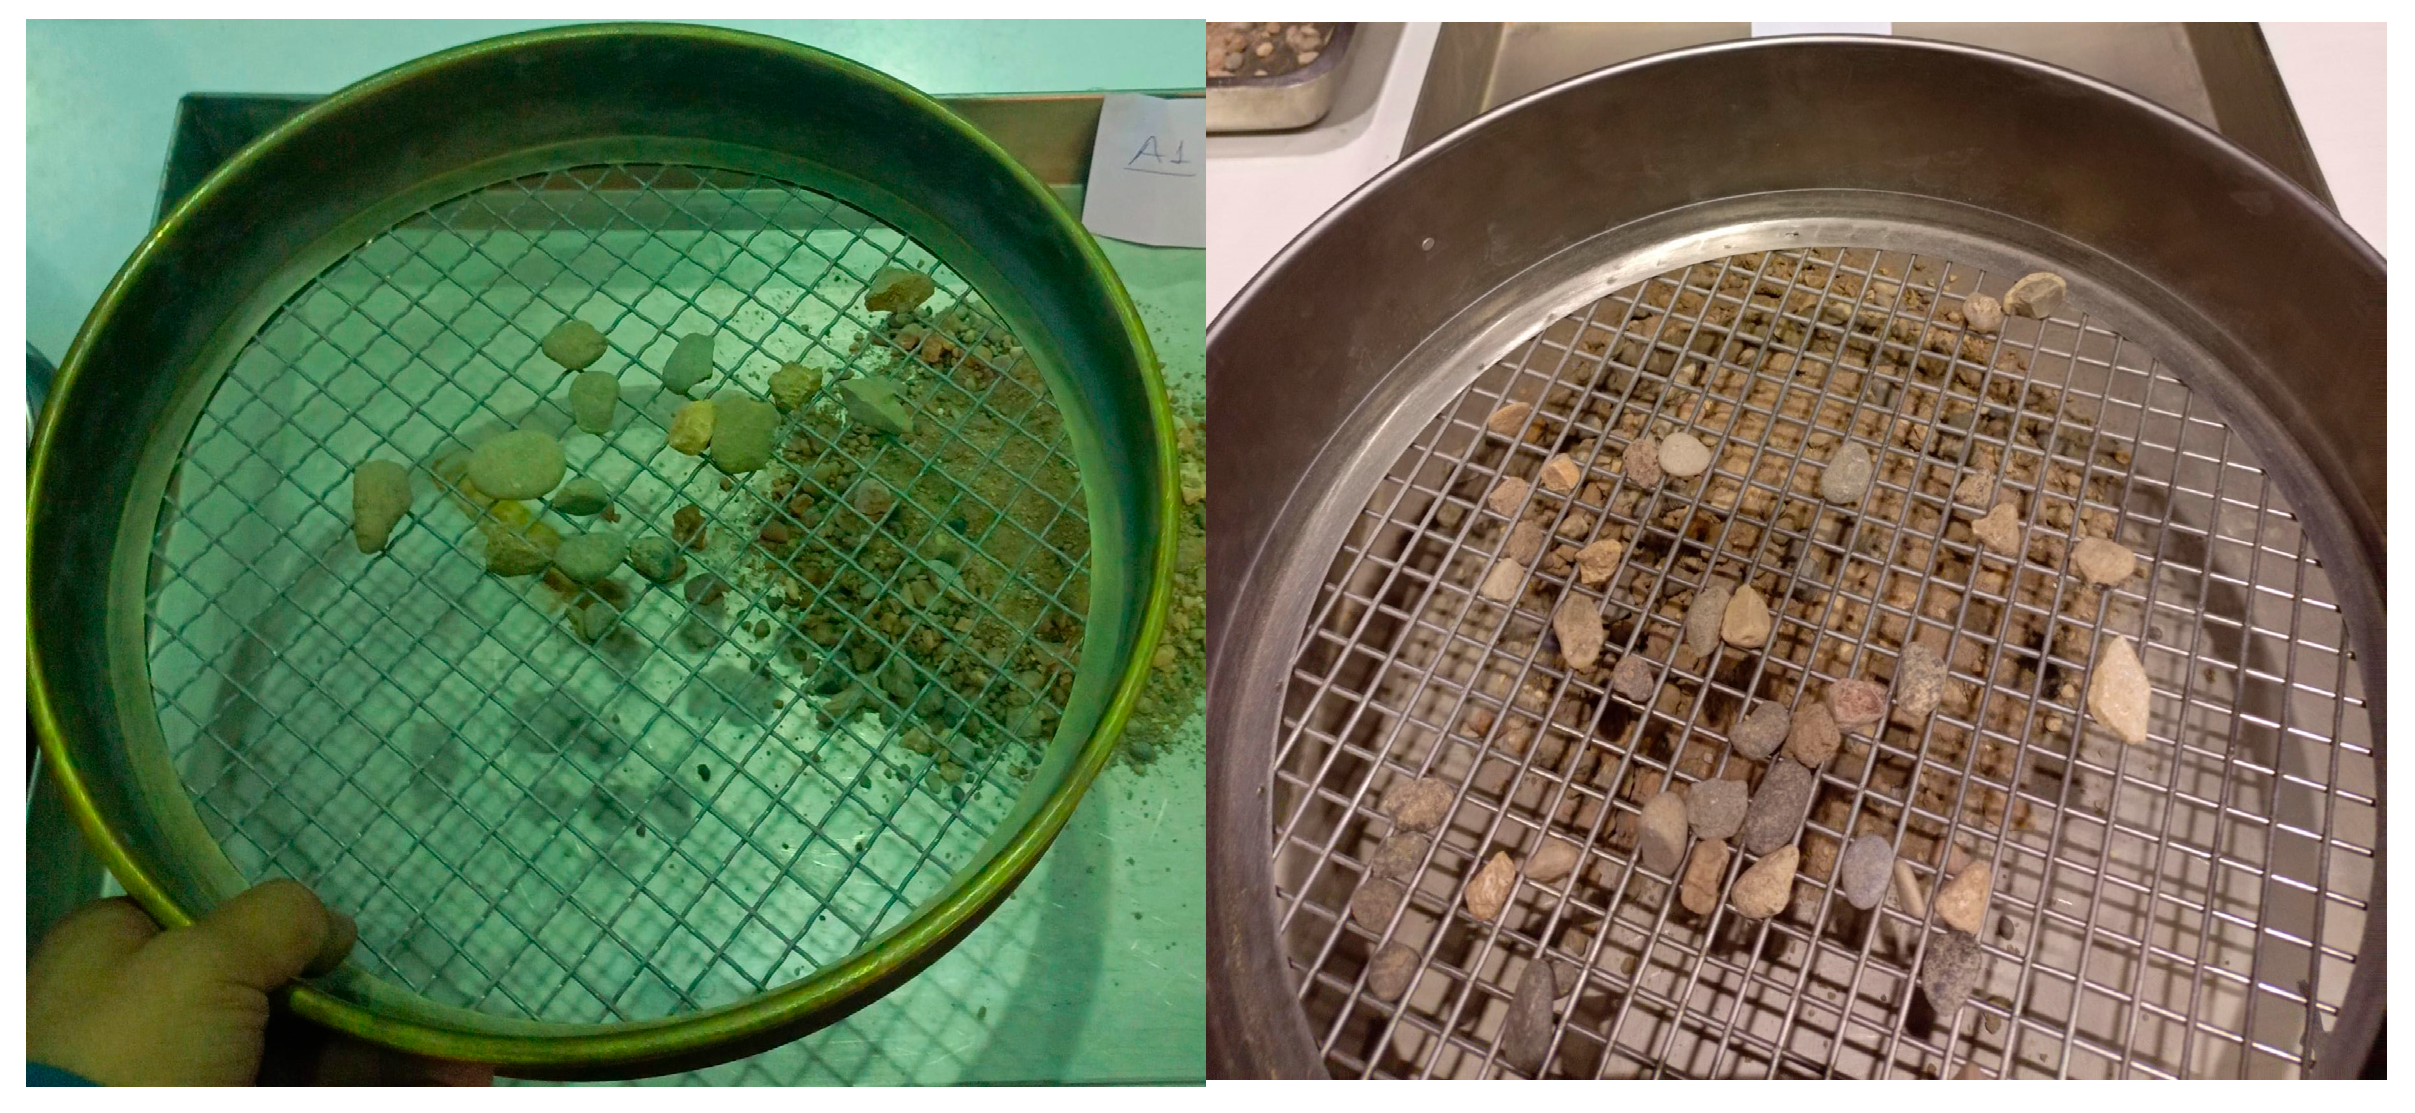
The aggregate materials used in the study and the corresponding sieve analysis procedures are presented in Figure 2.
Figure 2.
The aggregate materials used in the study and the corresponding sieve analysis procedures.
The particle size ratios contained in each sample were determined through sieve analyses and are presented in the table below. Here, Samples 1, 2, 3, 4, 5, and 6 correspond respectively to the L, M, S, LS, LM, and LMS aggregate pile sizes. Table 1 presents the sieve analysis results and the percentage of material passing through each sieve for the tested samples.
Table 1.
The percentage distributions of six different samples passing through each sieve.
As shown in the table, all samples passed 100% through the maximum-sized sieve. As the size of the sieve decreased, the proportion of passing particles in the L sample decreased rapidly. In contrast, for the other samples containing smaller particles, this ratio changed more gradually. Naturally, the proportion of particles passing through the same sieve size was higher in samples dominated by smaller (S-size) particles and lower in those dominated by larger (L-size) particles. The analyses also revealed that the smallest particle size in all samples was greater than 0.075 mm.
2.2. Digital Image Processing Analysis
In larger aggregate piles containing particles of various sizes, performing traditional sieve analyses may be impractical or constrained by time, labor, and financial limitations. To address these challenges, numerous image processing-based methods have been proposed to enable the rapid and efficient determination of aggregate particle sizes. However, research efforts continue to focus on achieving higher accuracy and faster computation.
The Otsu image processing method differs from other thresholding techniques by automatically determining the optimal threshold value through the maximization of between-class variance, without requiring any prior user-defined parameters. It rapidly generates predictions using the image. This characteristic reduces operator dependency and enables more objective and repeatable segmentation results, particularly for heterogeneous aggregate structures.
In this study, the effectiveness of the Otsu method was evaluated separately for aggregates with different particle sizes. In addition, aggregate samples mixed at specific proportions were analyzed using images acquired from two different orientations, namely 0° and 90°. The image processing results were compared with conventional sieve analysis test outcomes to assess the particle size distribution estimation capability of the proposed approach. The findings demonstrate that the Otsu-based image processing method provides reliable predictive performance across varying particle sizes and imaging orientations.
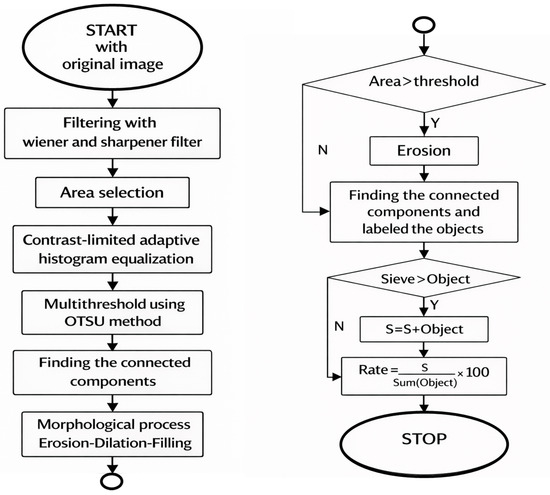
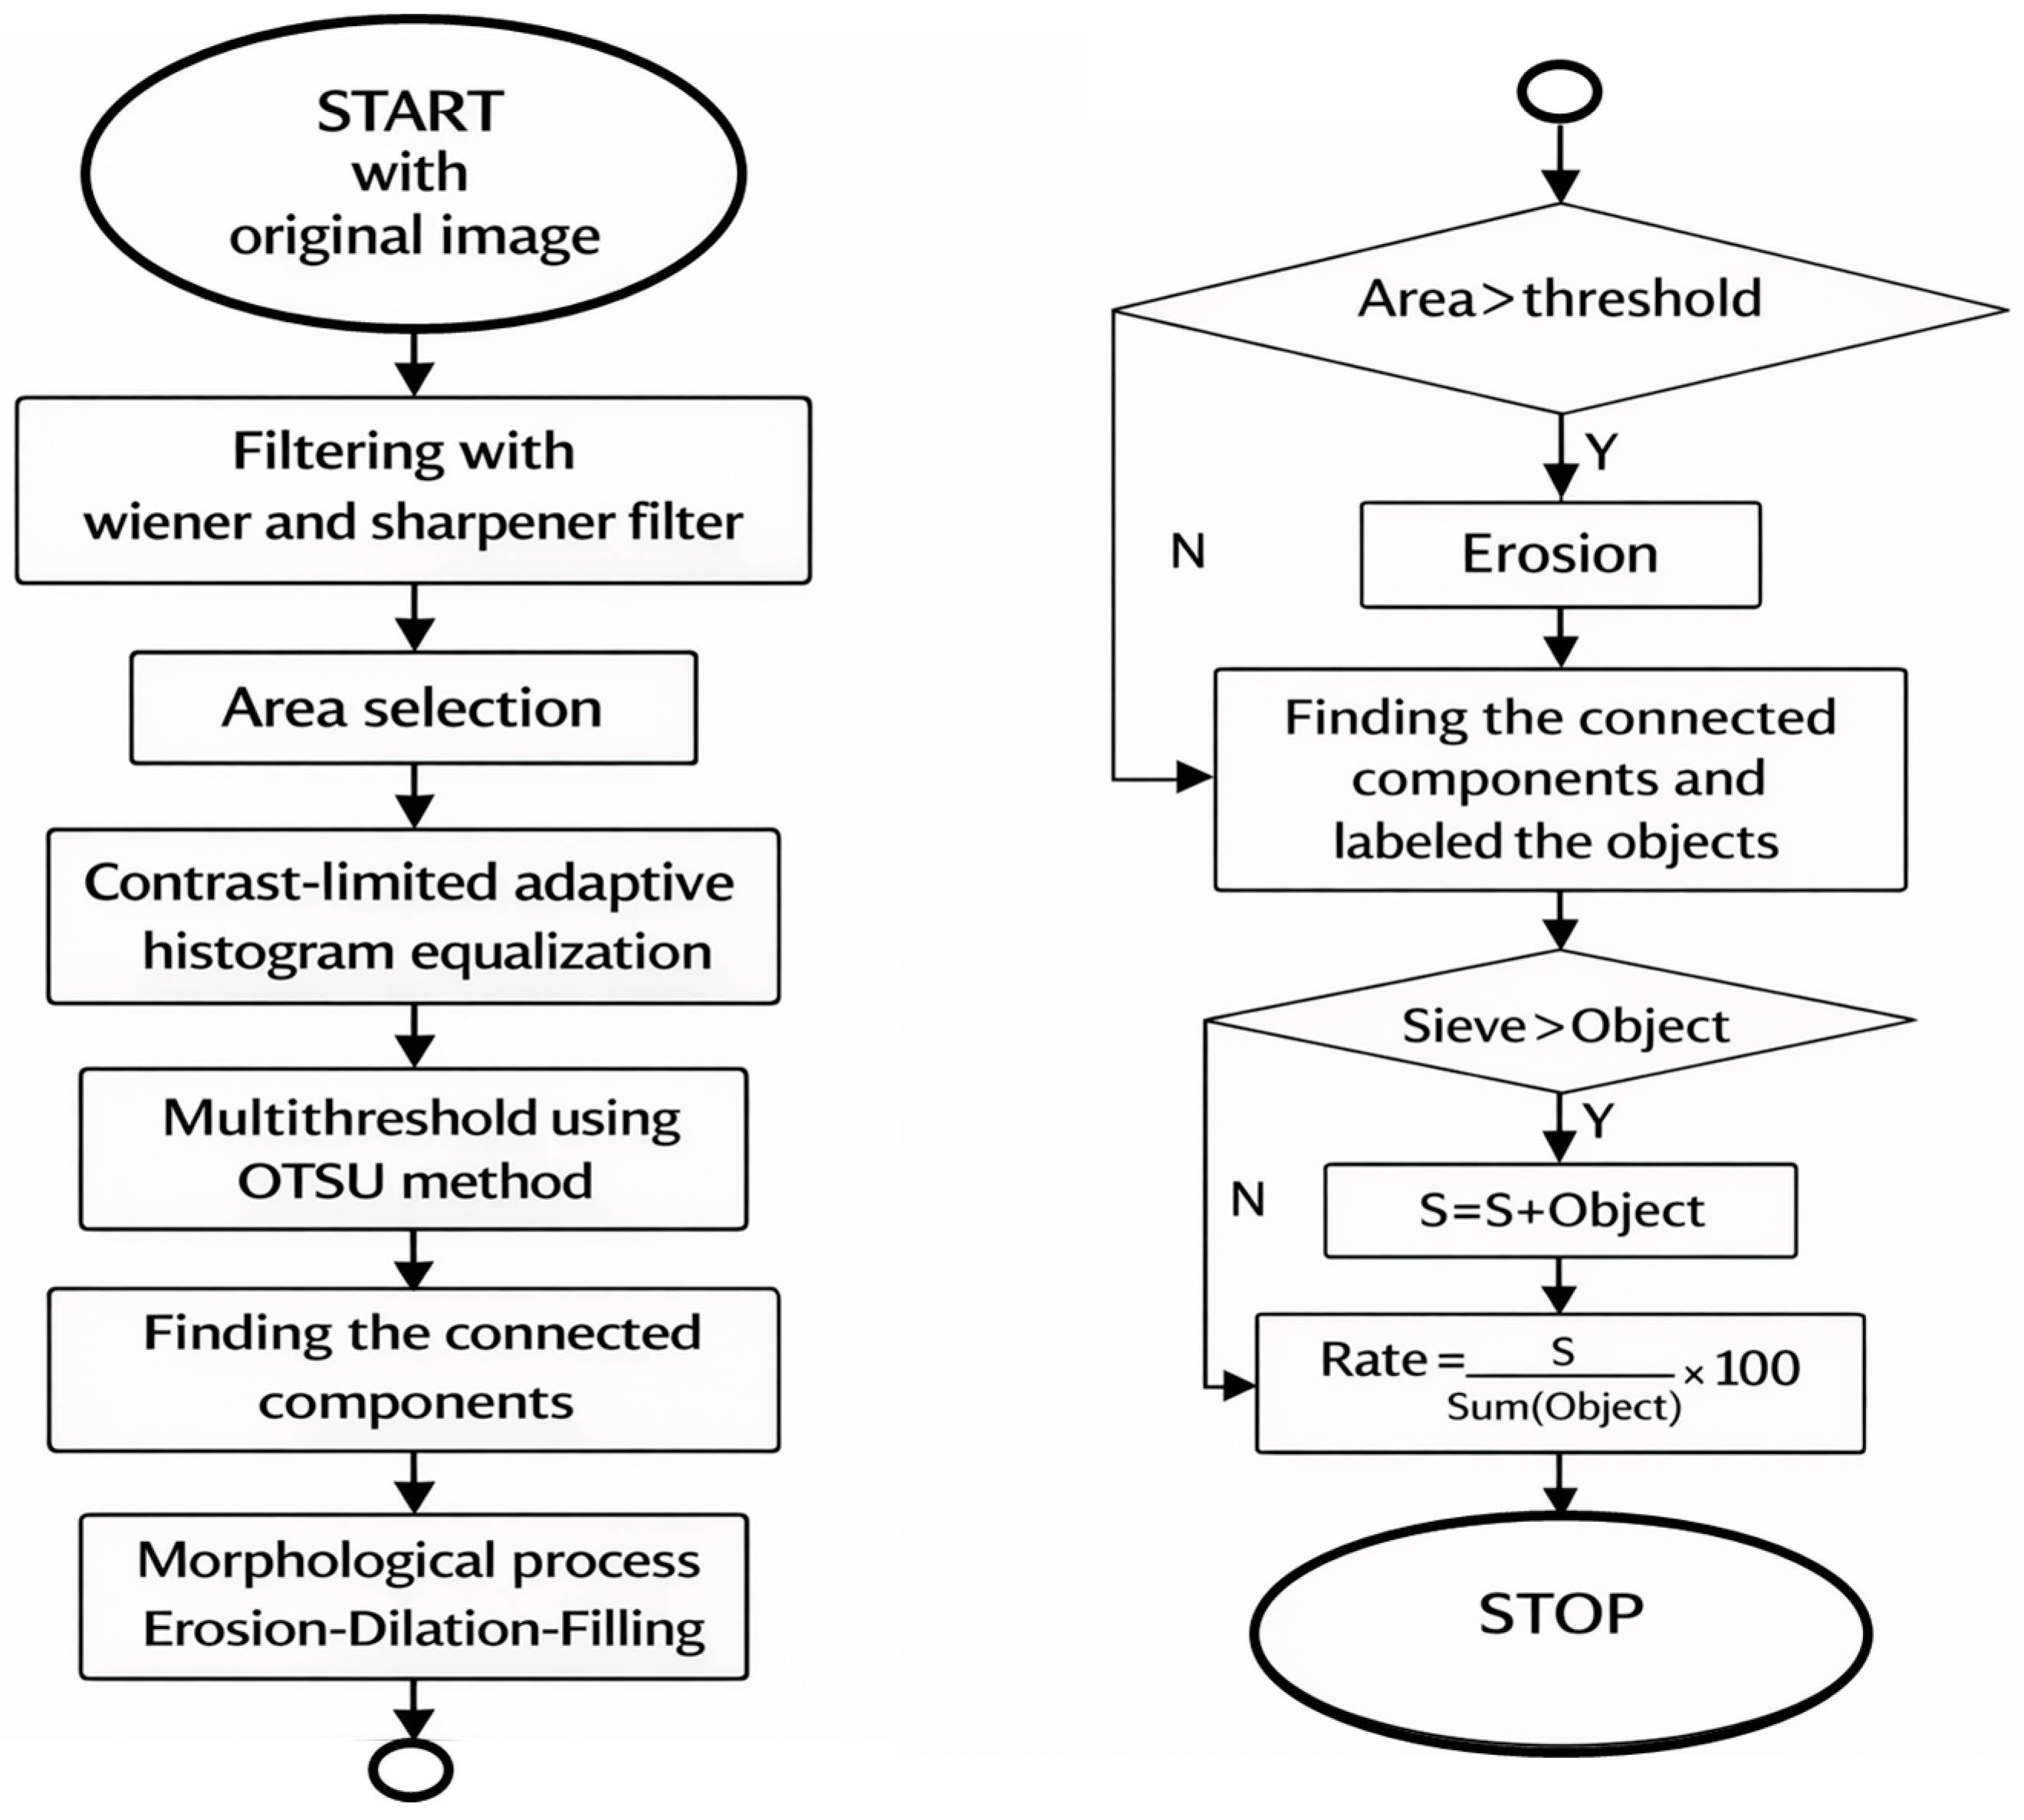
In this study, a framework is proposed that combines image processing, segmentation and computational analysis, and its methodology is illustrated in the flow chart specified in Figure 3.
Figure 3.
Flowchart of the gradation detection system for aggregates and rocks.
Digital images can be corrupted due to various noise sources, such as temperature and the type of sensor used. It is quite difficult to distinguish and filter the original signal from the low-frequency noise mixed into it. Many computational algorithms have been proposed to extract useful information or to improve the quality of the image by eliminating these factors that corrupt the image quality. Examples of these methods are linear filters and nonlinear filters such as mean, median and Wiener.
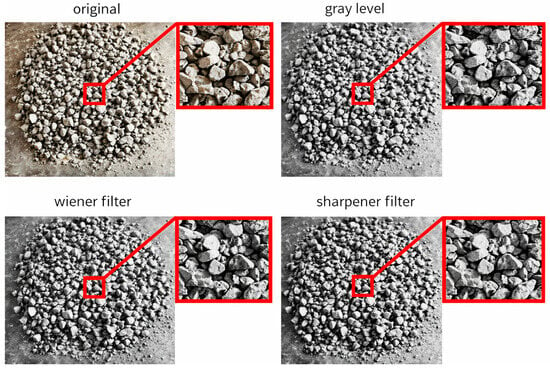
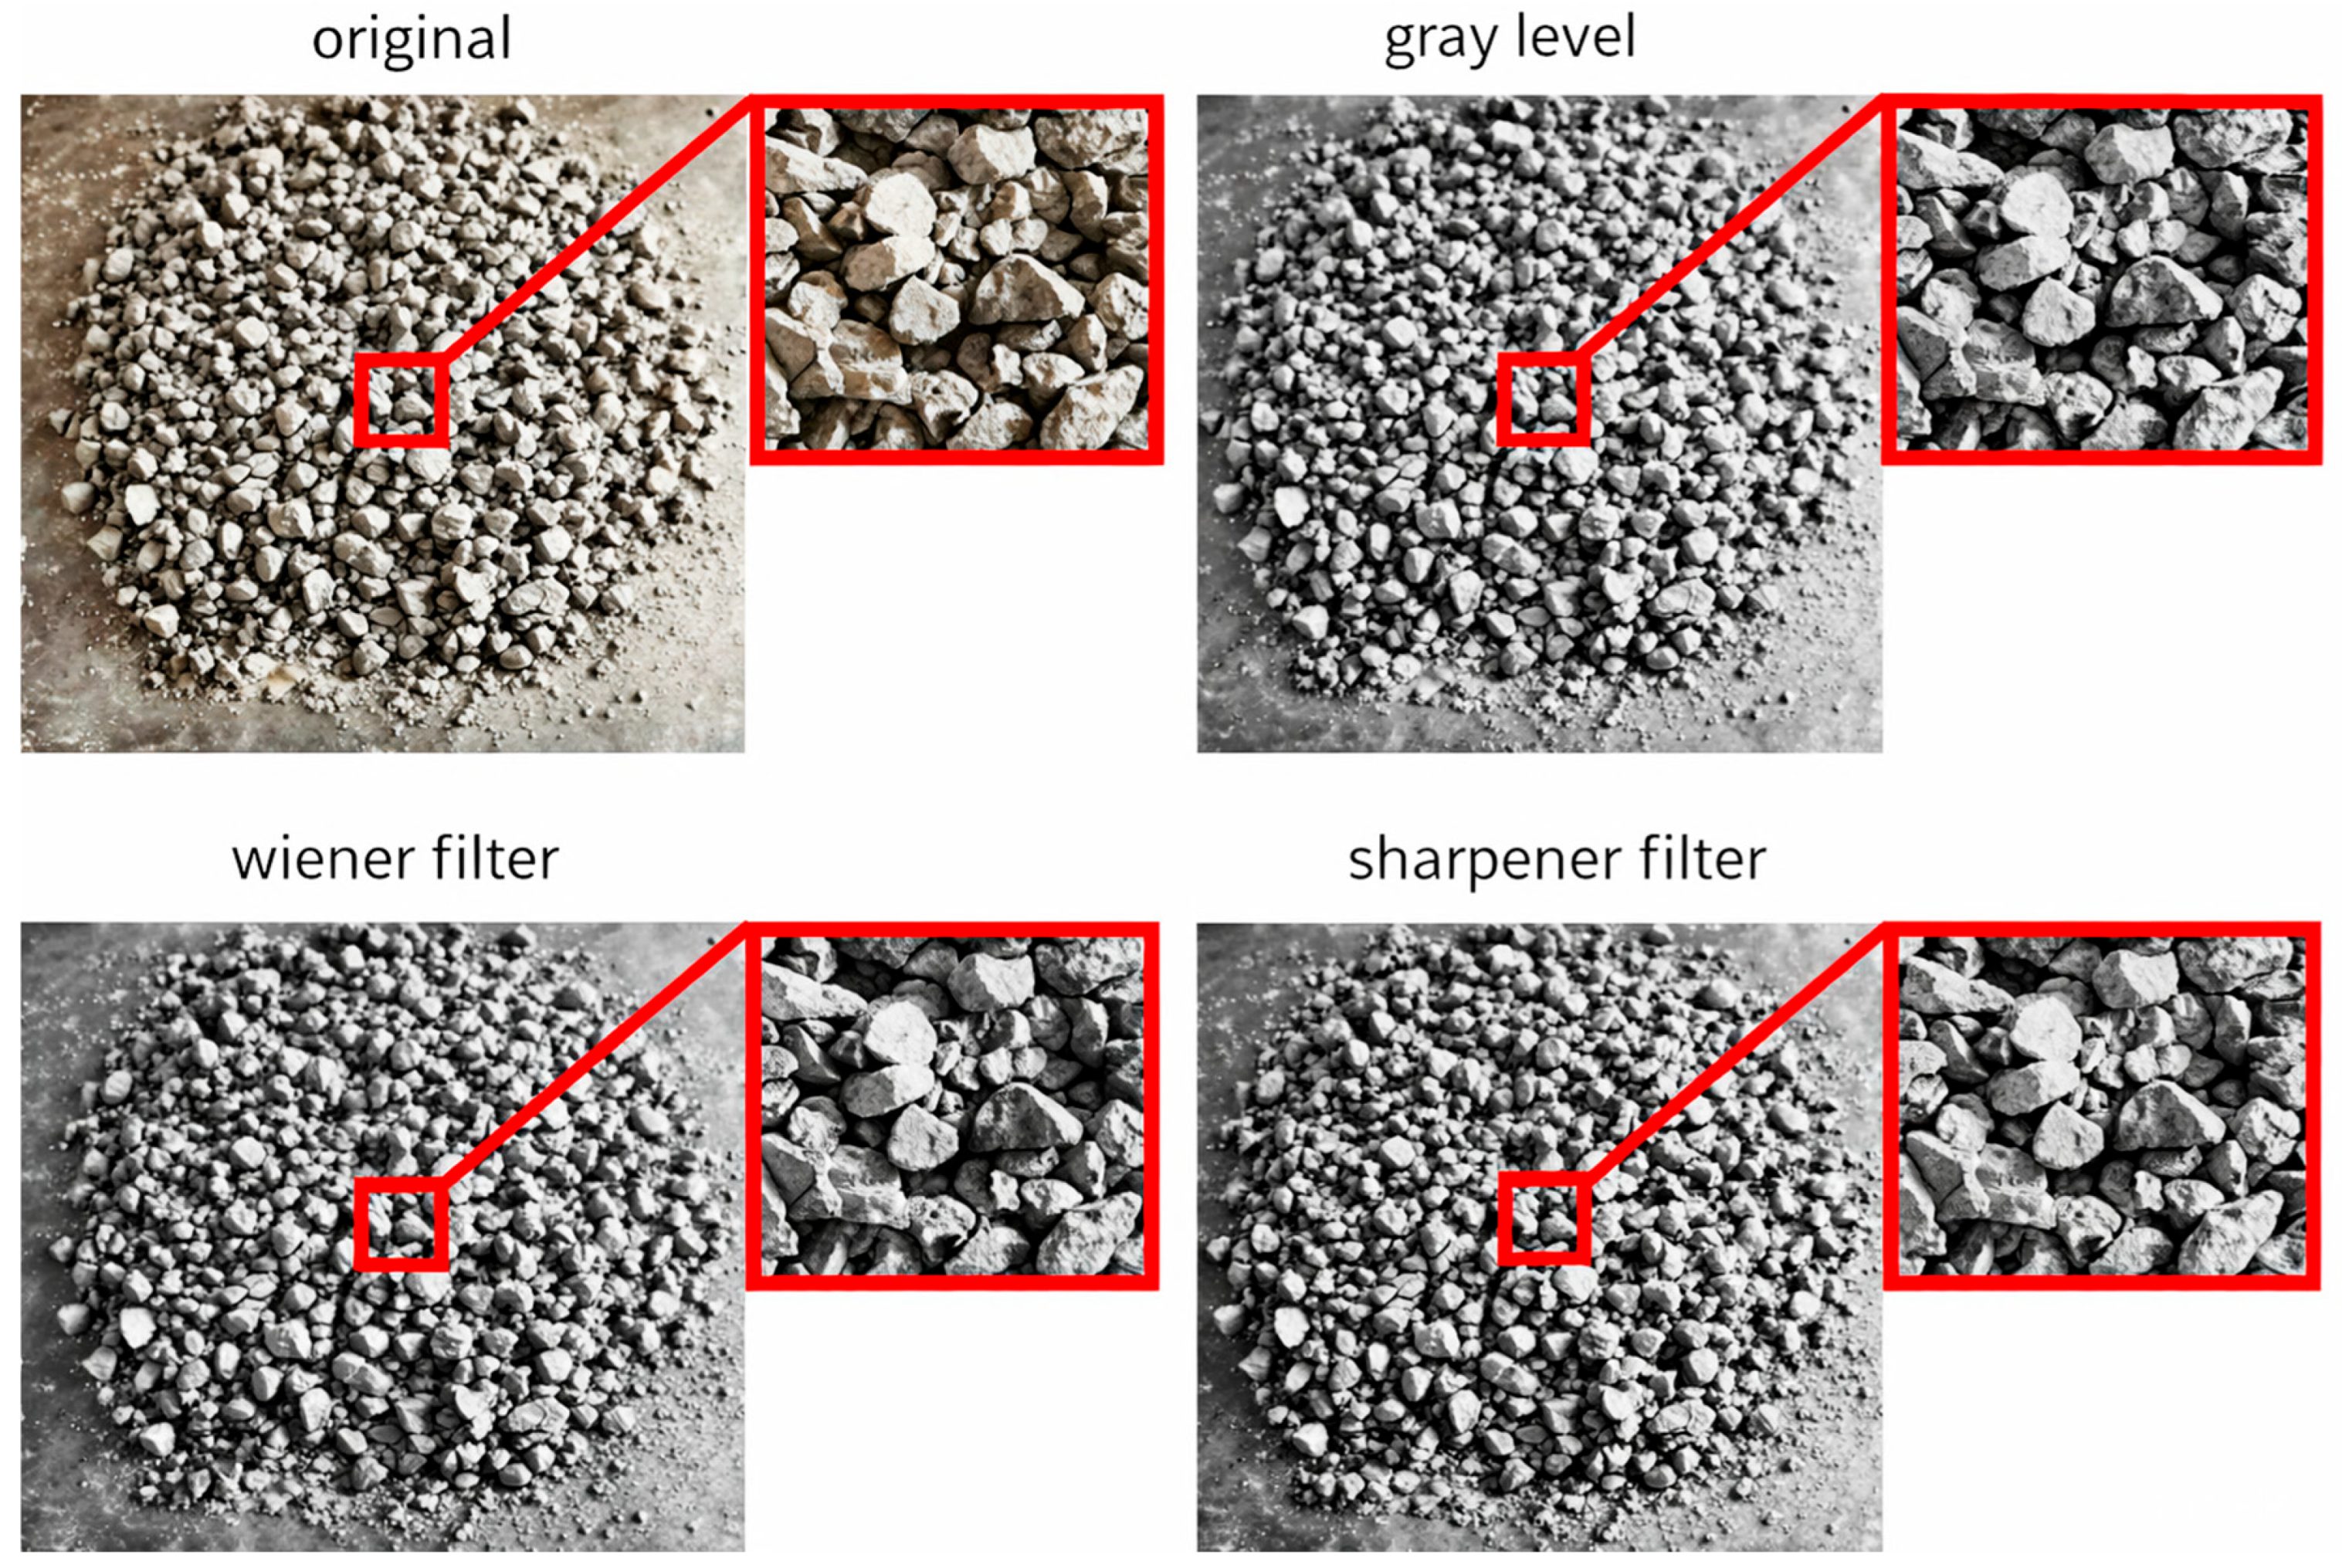
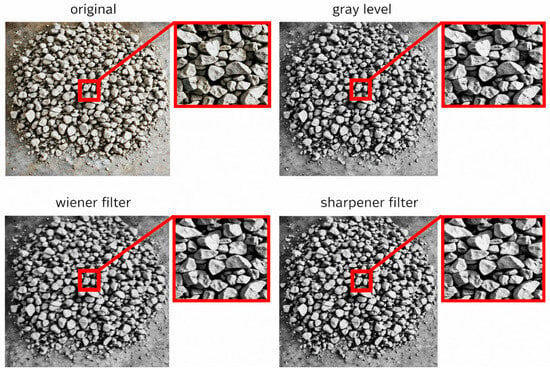
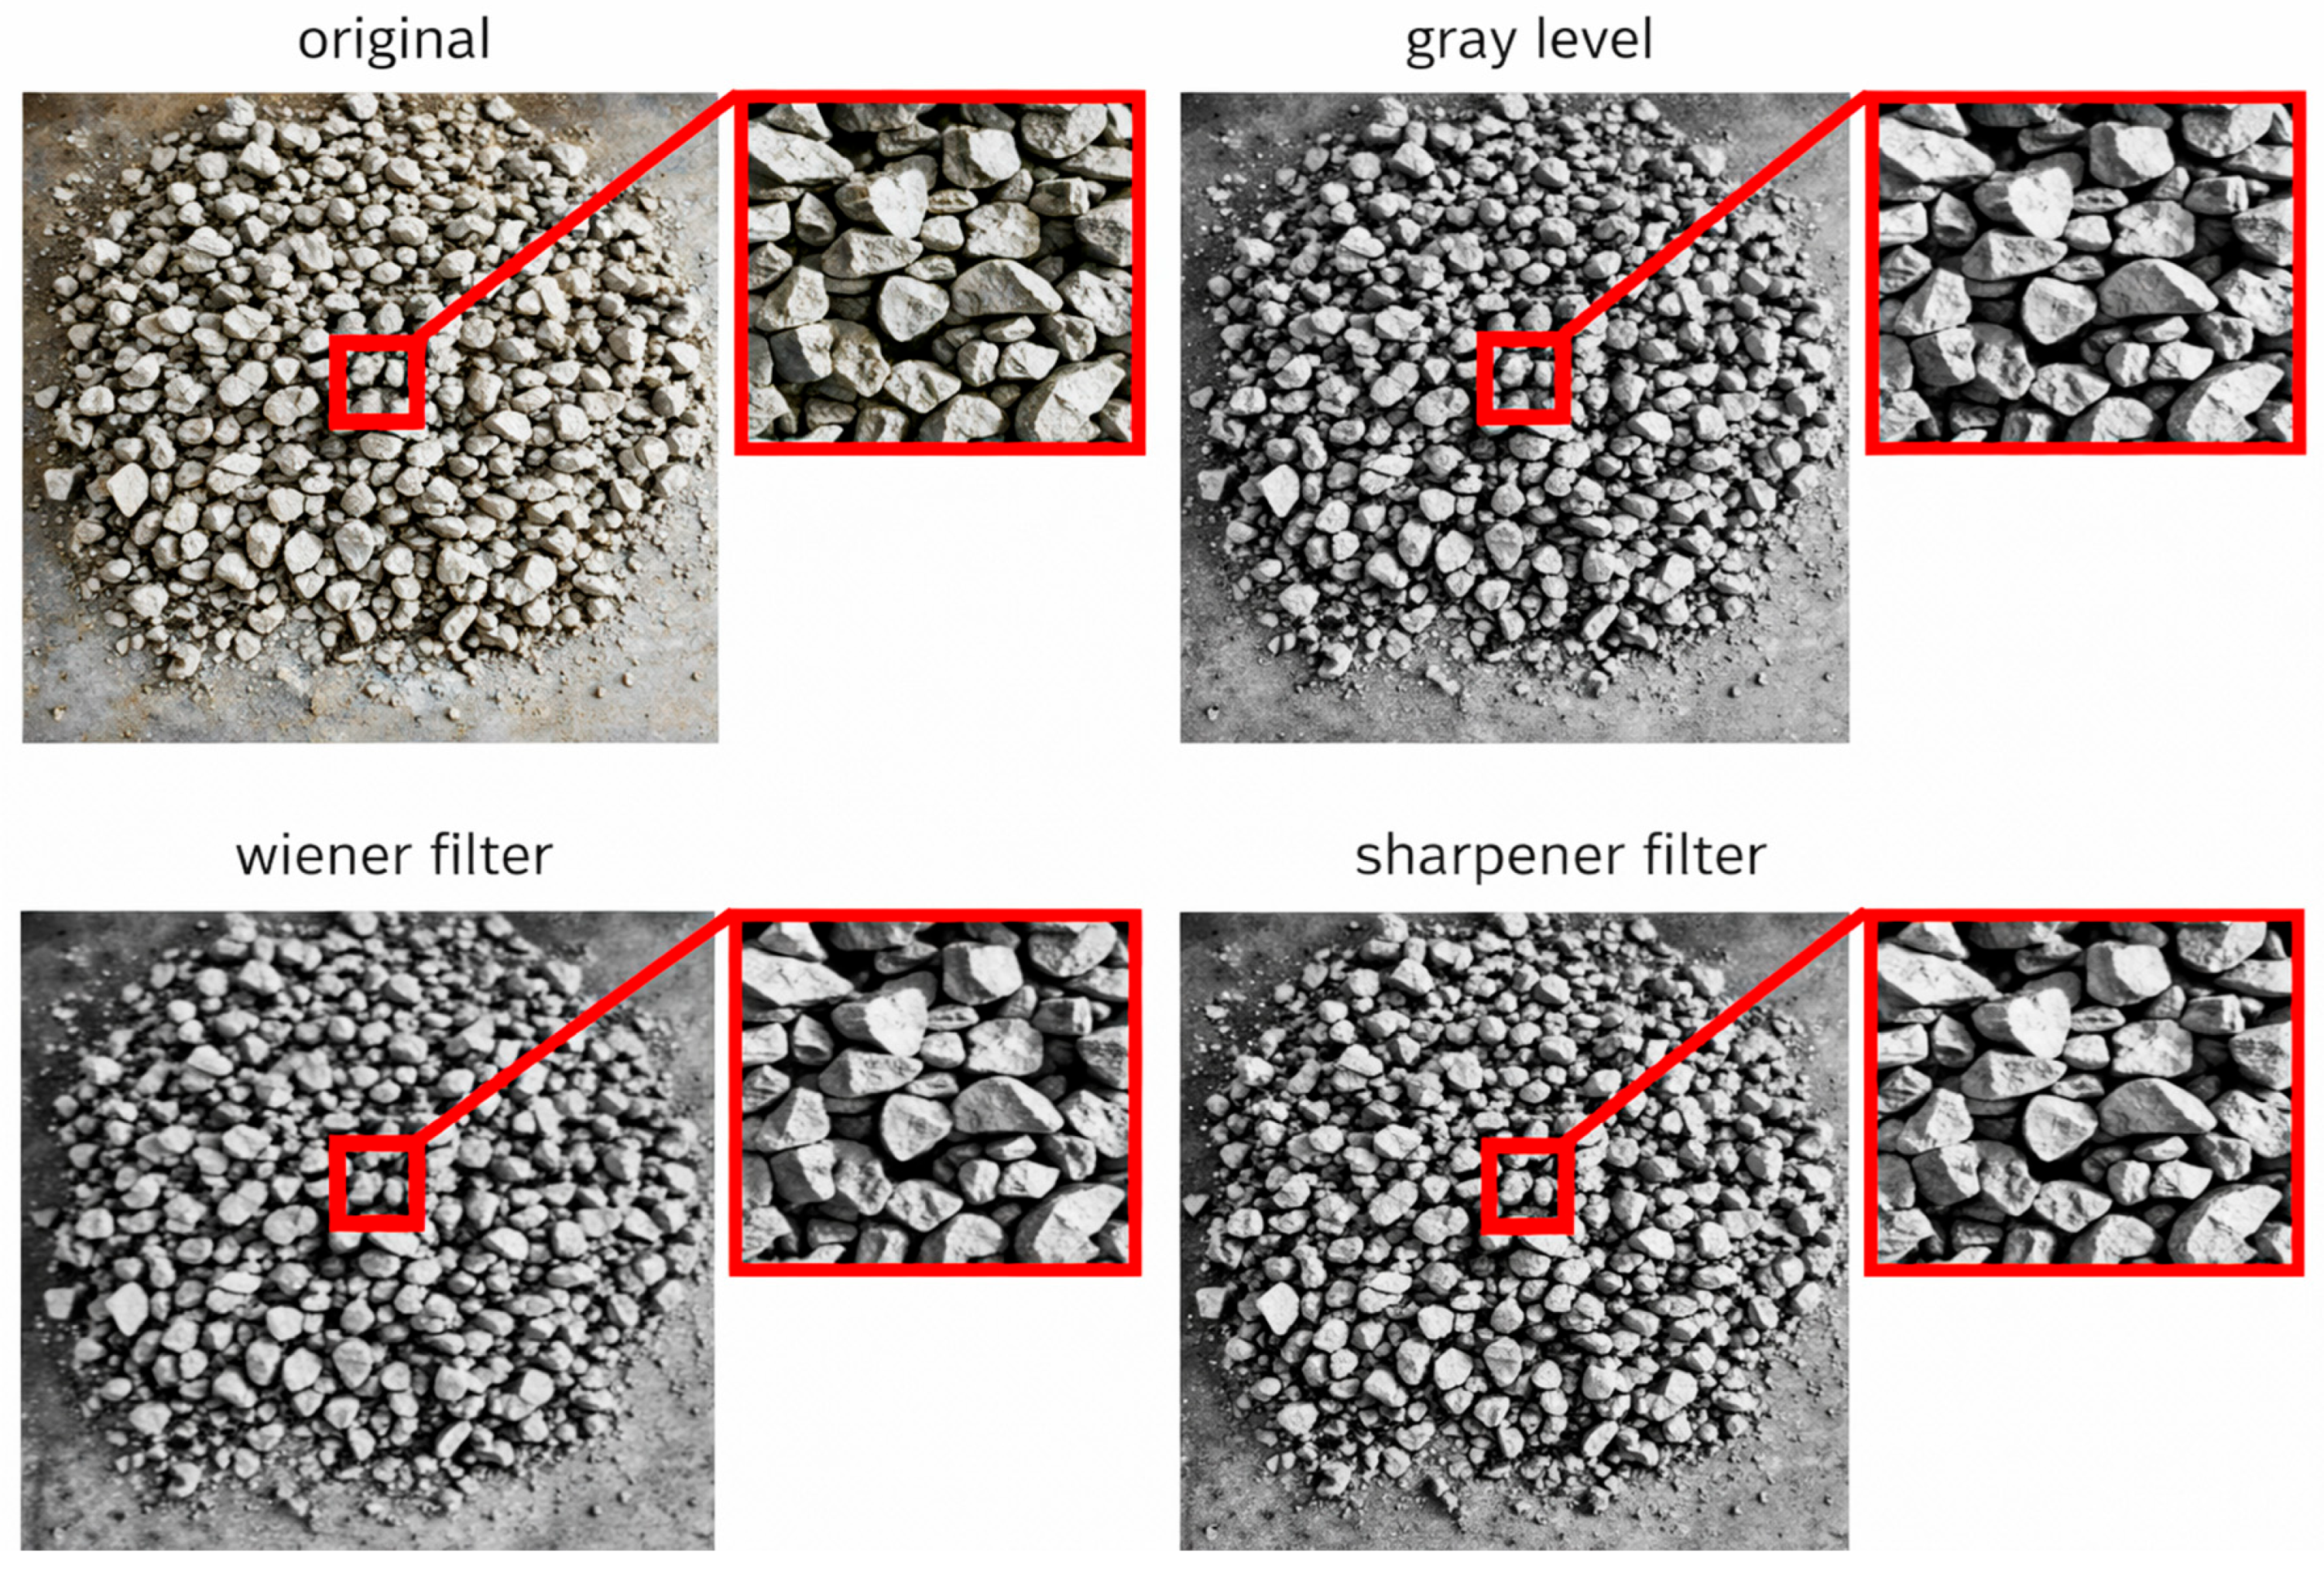
In this paper, to reduce the complexities of computational requirements, the original image in Figure 4 is converted to a grayscale format, where the hue and saturation information are eliminated but the brightness information is preserved. Then, the Wiener filtering (3 × 3) method is applied, which aims to reduce the noise by minimizing the mean square error with a statistical approach. As understood from the zoomed-in section of the third panel of Figure 4, this filter reduces the noise while at the same time reducing the clarity of the details in the image. To overcome this and to increase the contrast between neighboring pixels and make the edges more visible, a sharpening filter is performed.
Figure 4.
The vertically captured original image and its converted versions in grayscale, Wiener-filtered, and sharpener filter formats.
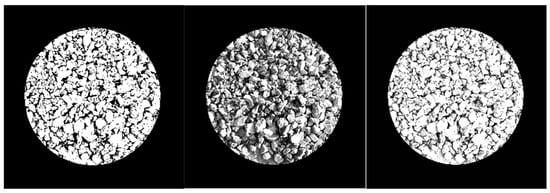
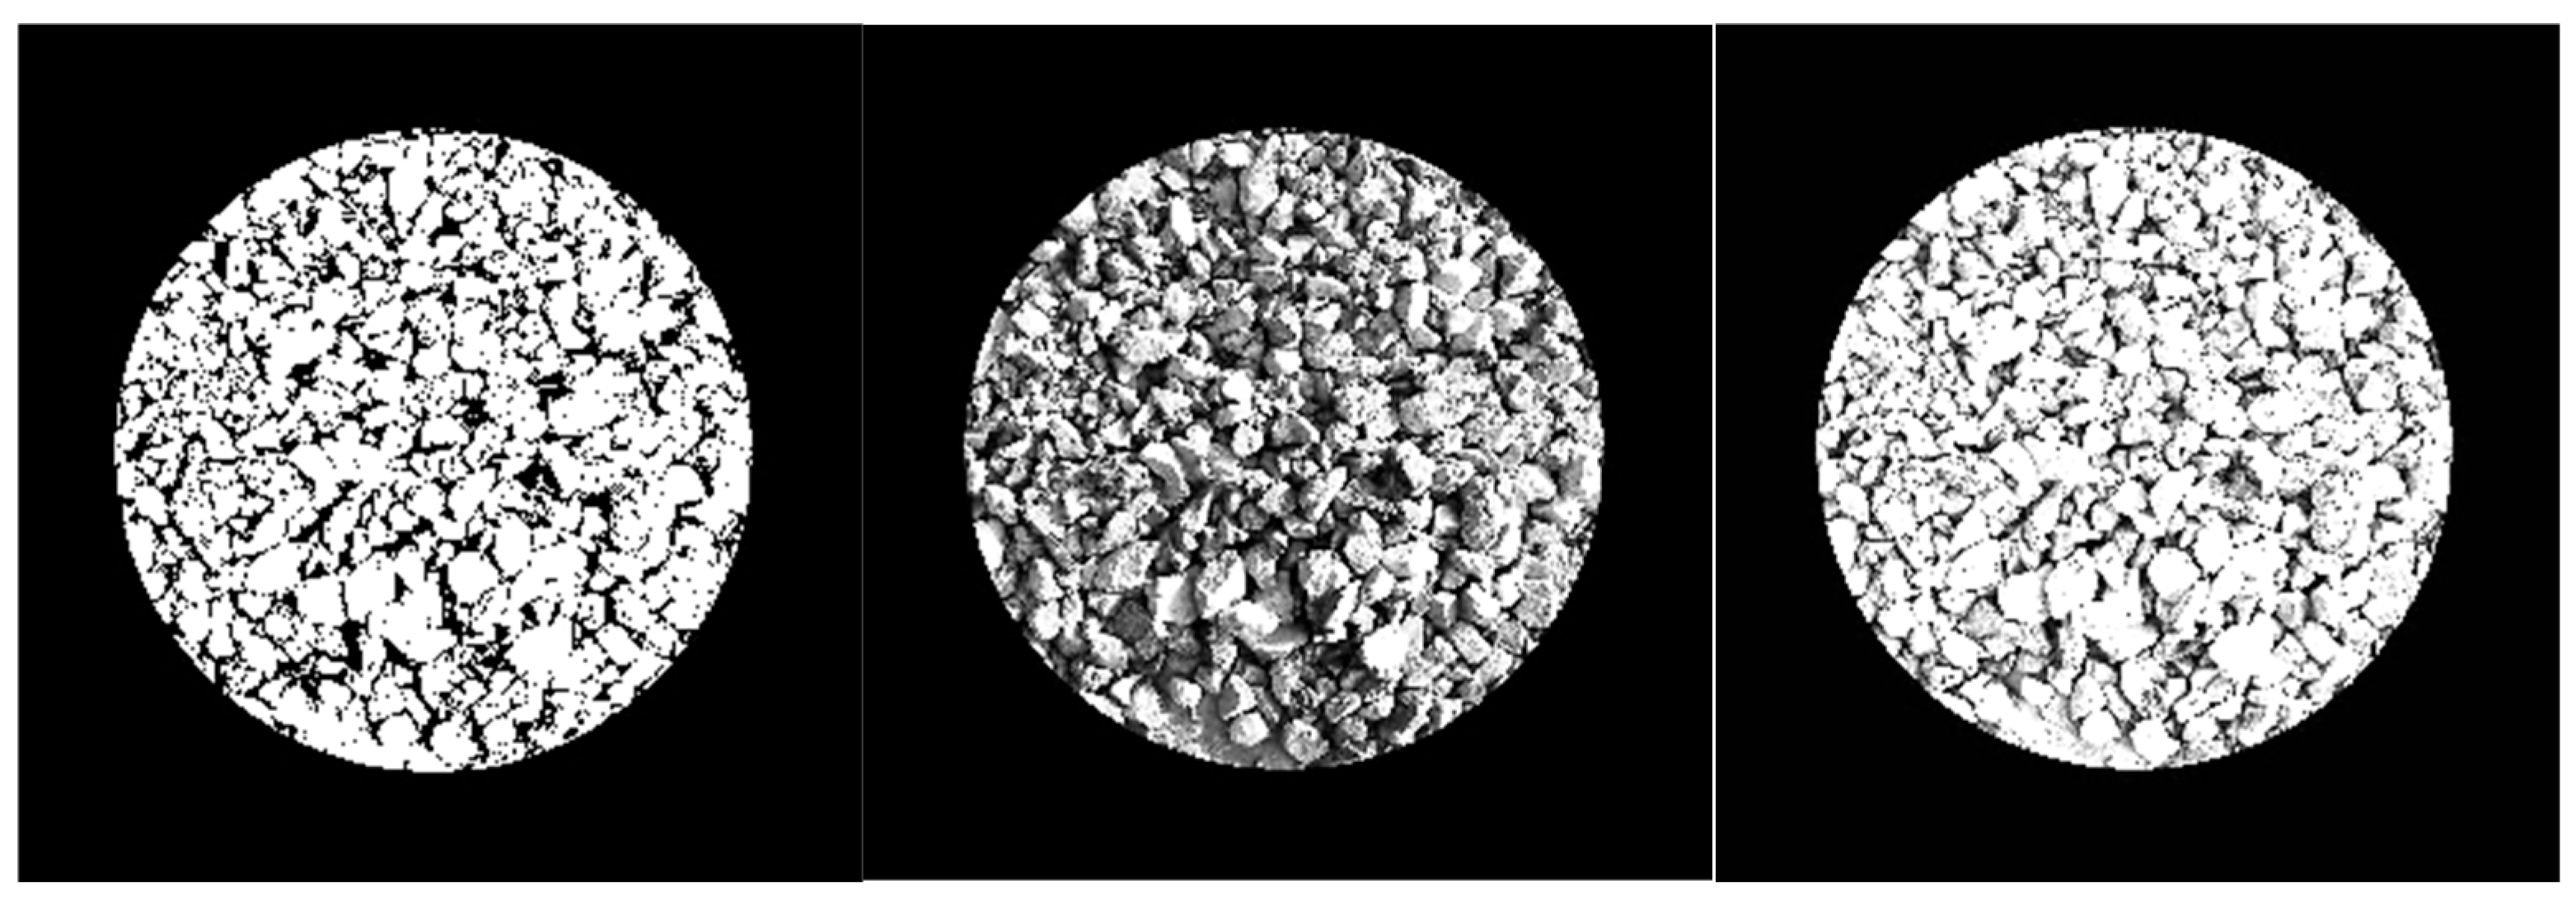
To evaluate all the obtained grayscale preprocessed images under equal conditions, a certain region of the images is selected and the contrast-limited adaptive histogram equation (CLAHE) algorithm, which works on small data regions, is used to further improve the contrast, as shown in Figure 5. The classical histogram equalization technique improves the pixel distribution of the image, resulting in better contrast and clarity. When the CLAHE method is used, images with irregular brightness values, such as piles, are divided into regions, and an adaptive algorithm is used to apply a separate histogram equalization process to each region.
Figure 5.
Grayscale preprocessed images under equal boundary conditions, selected area, histogram equation and OTSU, respectively.
In order to determine the boundaries of rock objects in the enhanced image, first, the Otsu method, which is frequently used in image segmentation, is performed. This method allows the determination of threshold values separating classes to create a specified number of classes using the grayscale histogram of the image. More specifically, converting a grayscale image to a binary image typically requires setting a threshold value. Pixels larger than this threshold are designated as white, while those smaller are designated as black. However, because not all images have the same characteristics, setting a fixed threshold value does not produce ideal or acceptable results for all images. Therefore, the threshold value must be determined based on the color distribution of the image in question. In this context, the Otsu algorithm creates two color classes in the image: foreground and background. The within-class variance is then calculated for all threshold values, and the value that minimizes the variance is determined as the optimal threshold value. Furthermore, the between-class variance value should also be maximum.
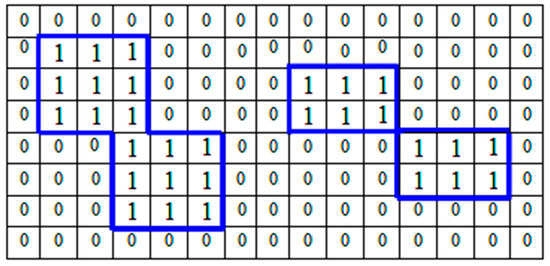
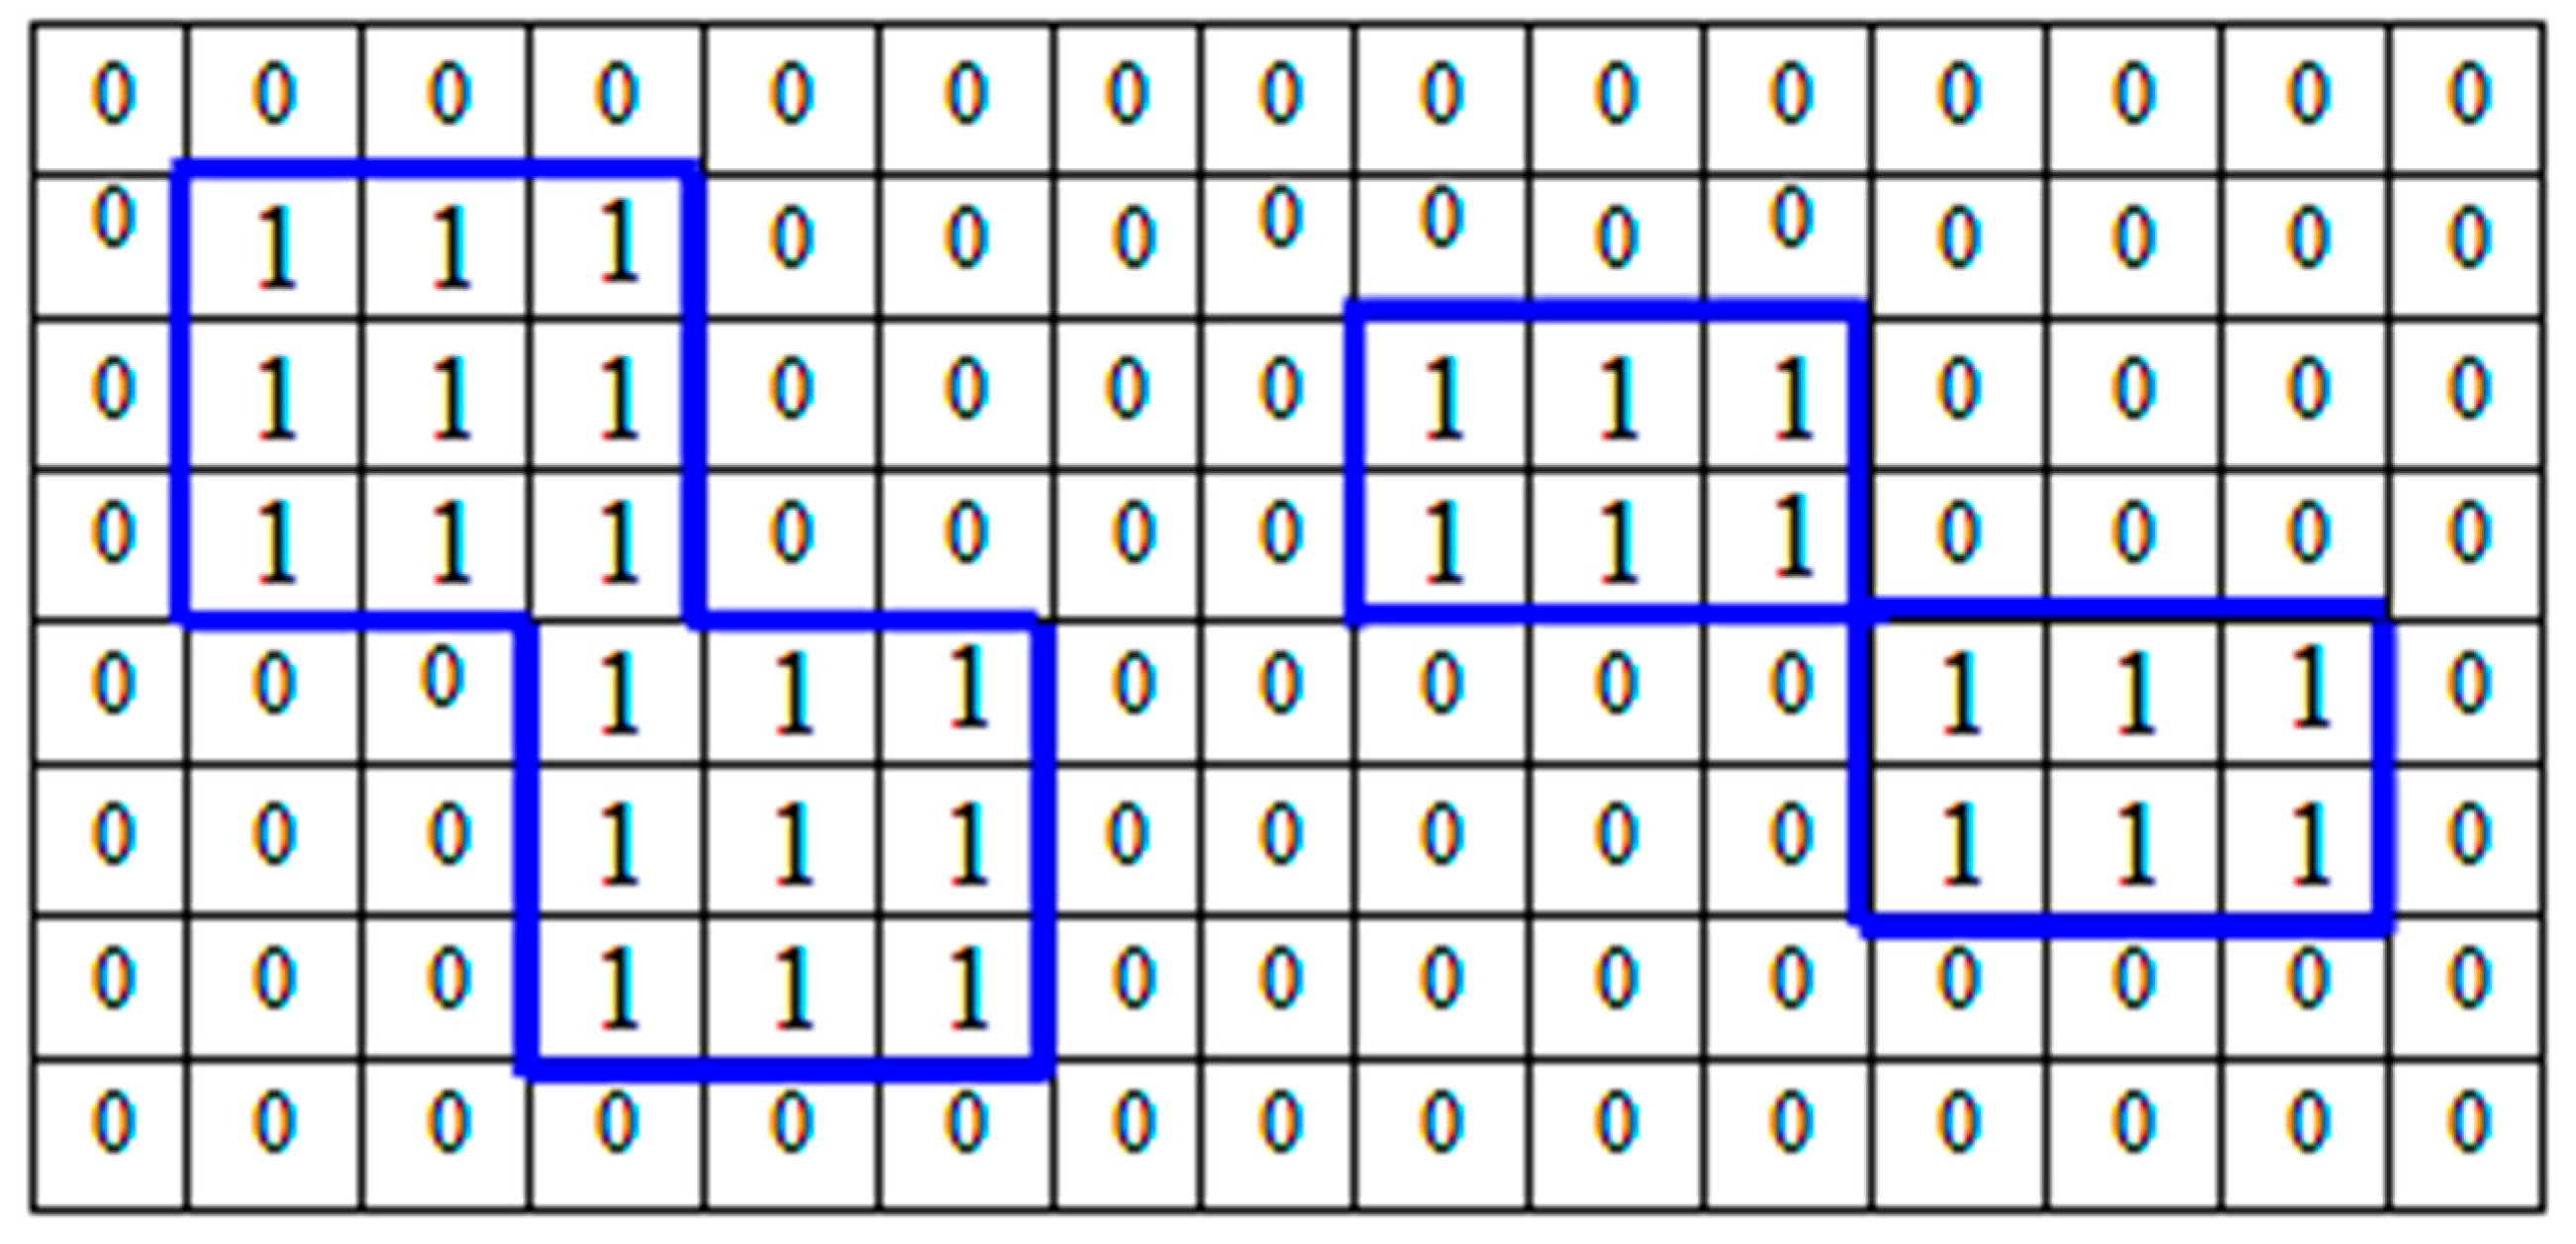
Then, two classes are created as foreground and background by determining a threshold value. To label each rock object in the foreground, firstly, connected components are detected and pixel indices assigned to each component are obtained. According to the result returned by the connected component function using the 4-connectivity standard, pixels whose edges touch each other horizontally or vertically are connected to each other and are part of the same object; if the edges do not touch, the pixels belong to different objects. This situation is explained in Figure 6 with a small binary image.
Figure 6.
Connected component method based on the 4-connectivity standard.
As can be seen, two separate objects with only their corners connected on the left and one object on the right are detected, since the horizontal and vertical pixels are connected to each other.
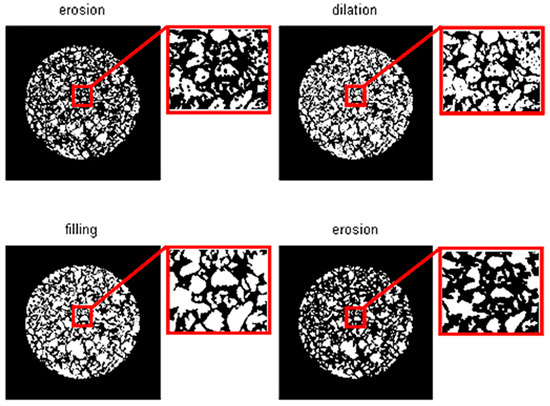
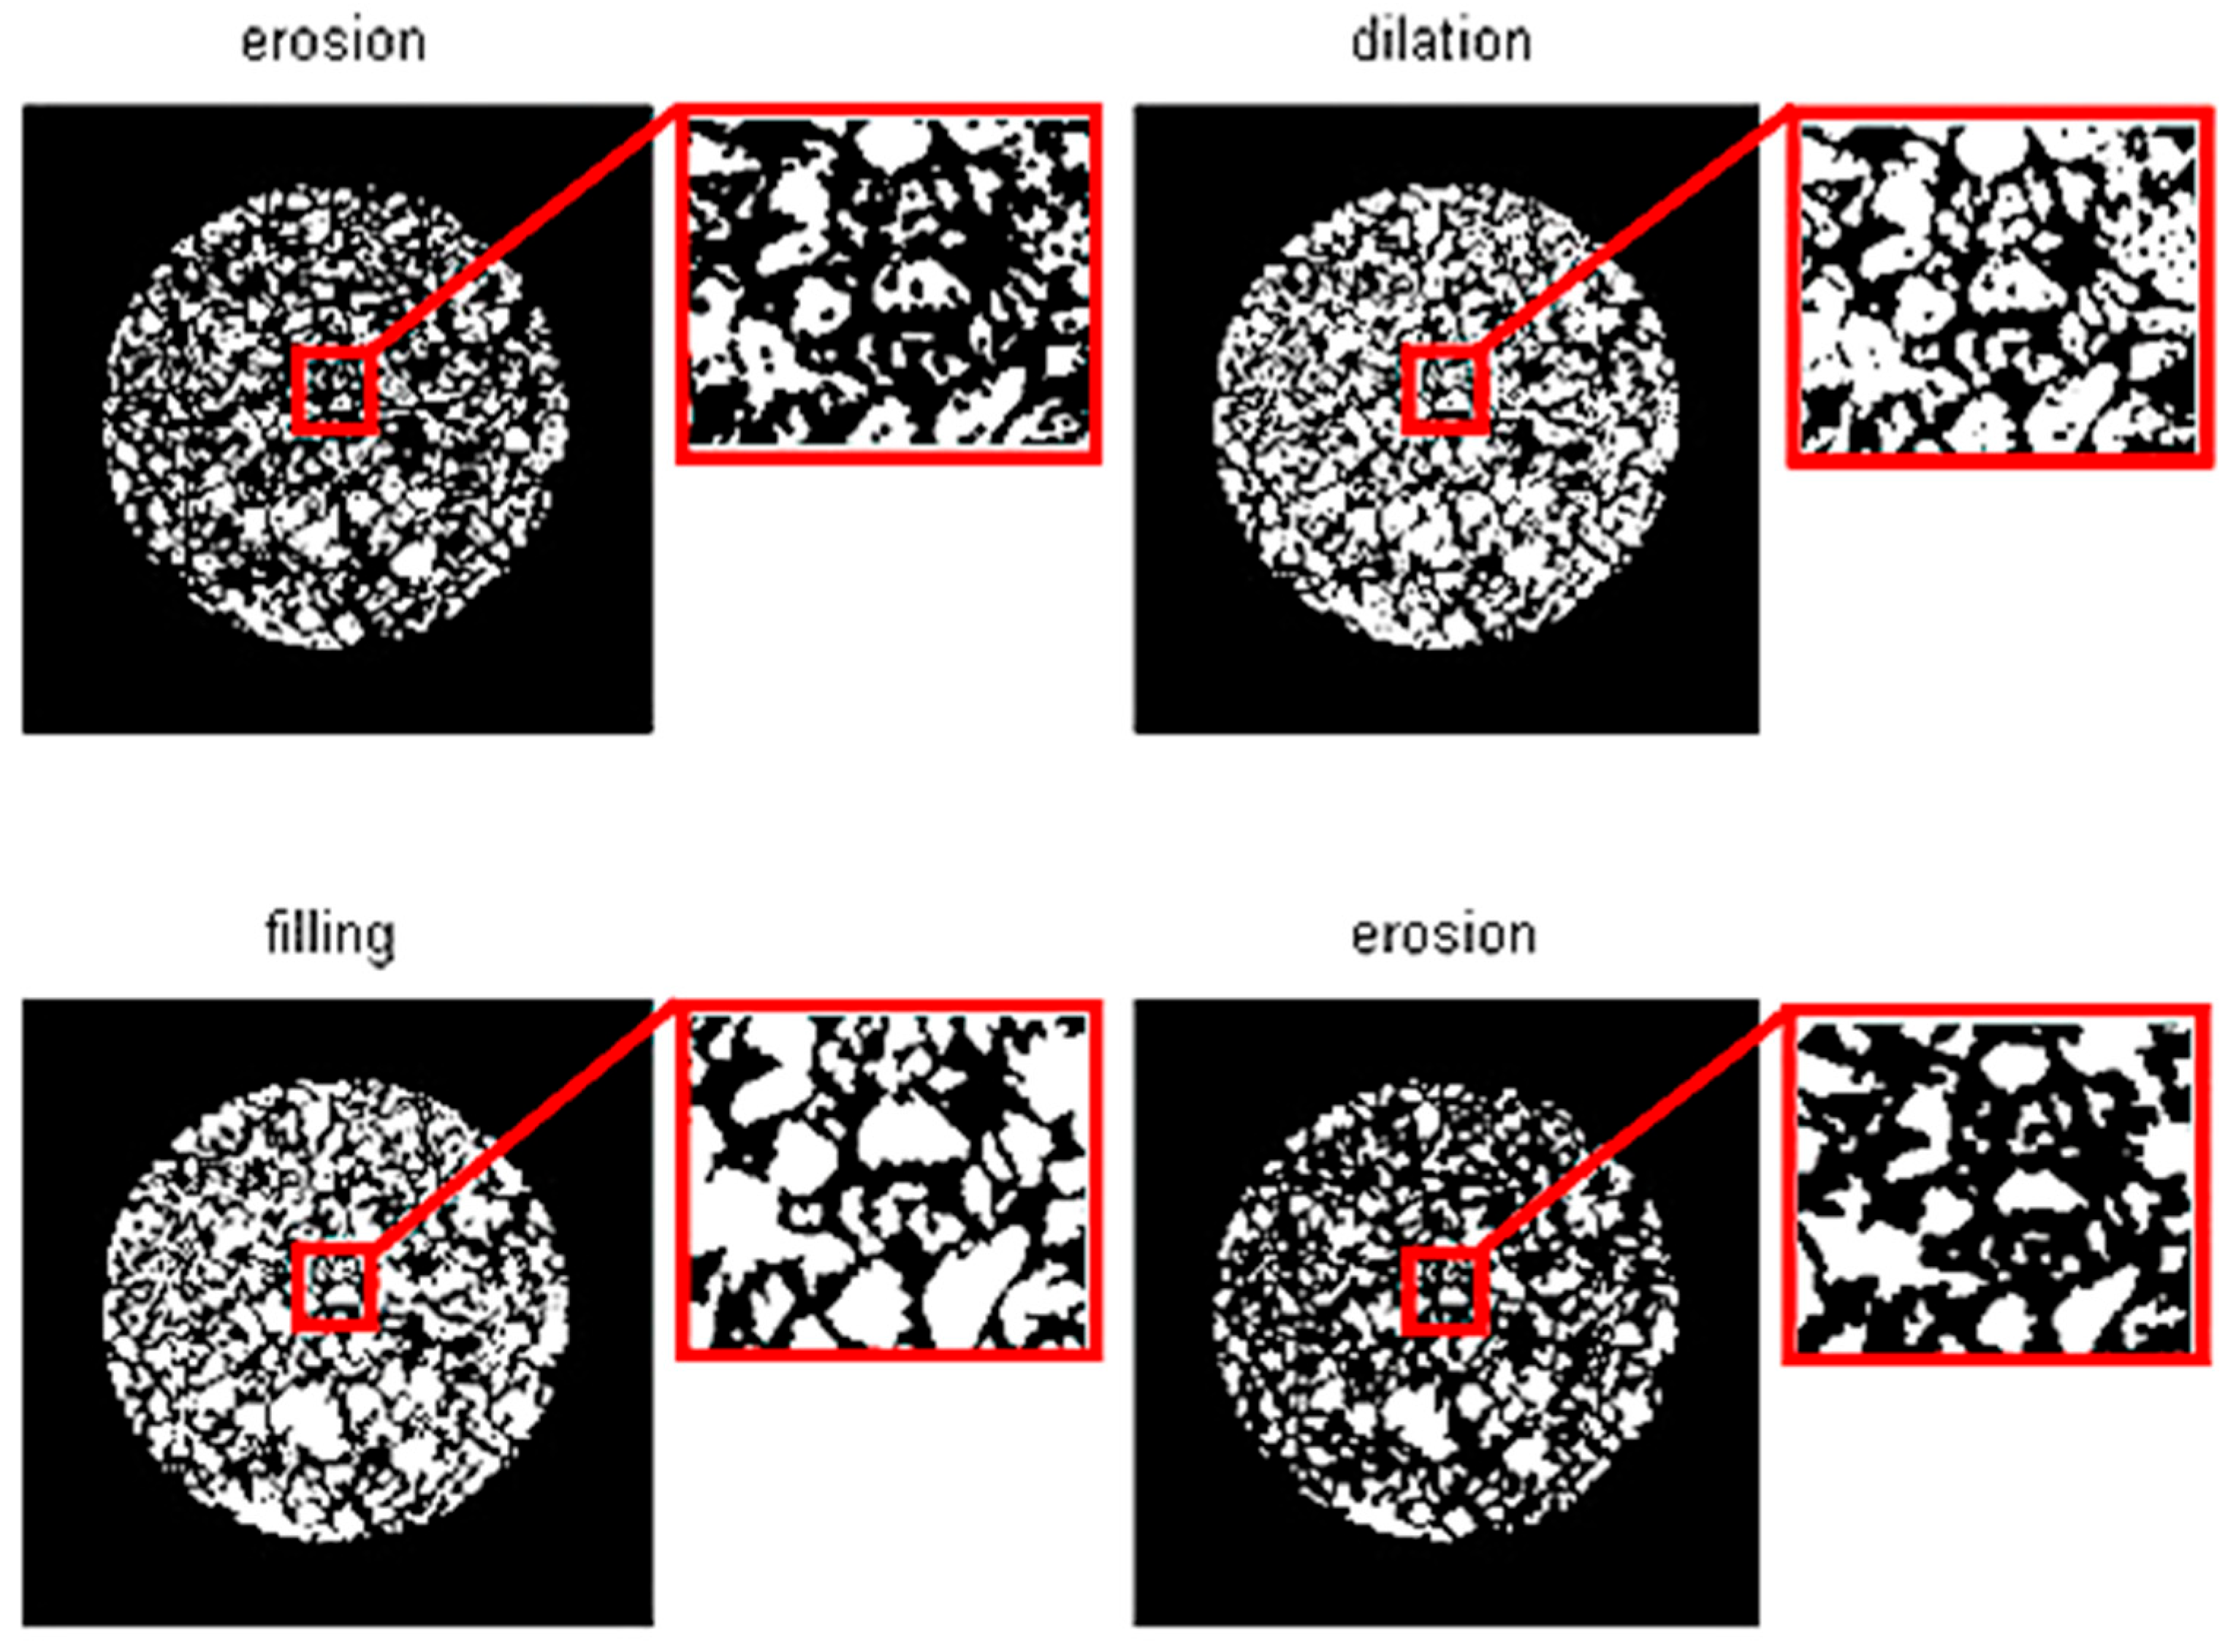
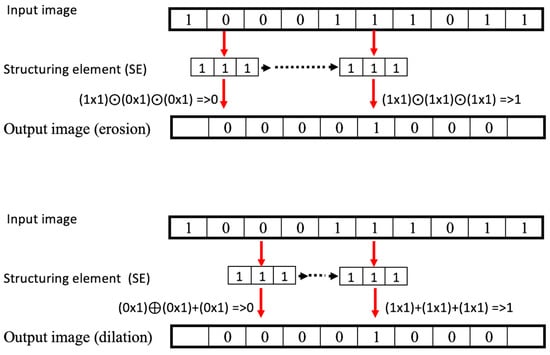
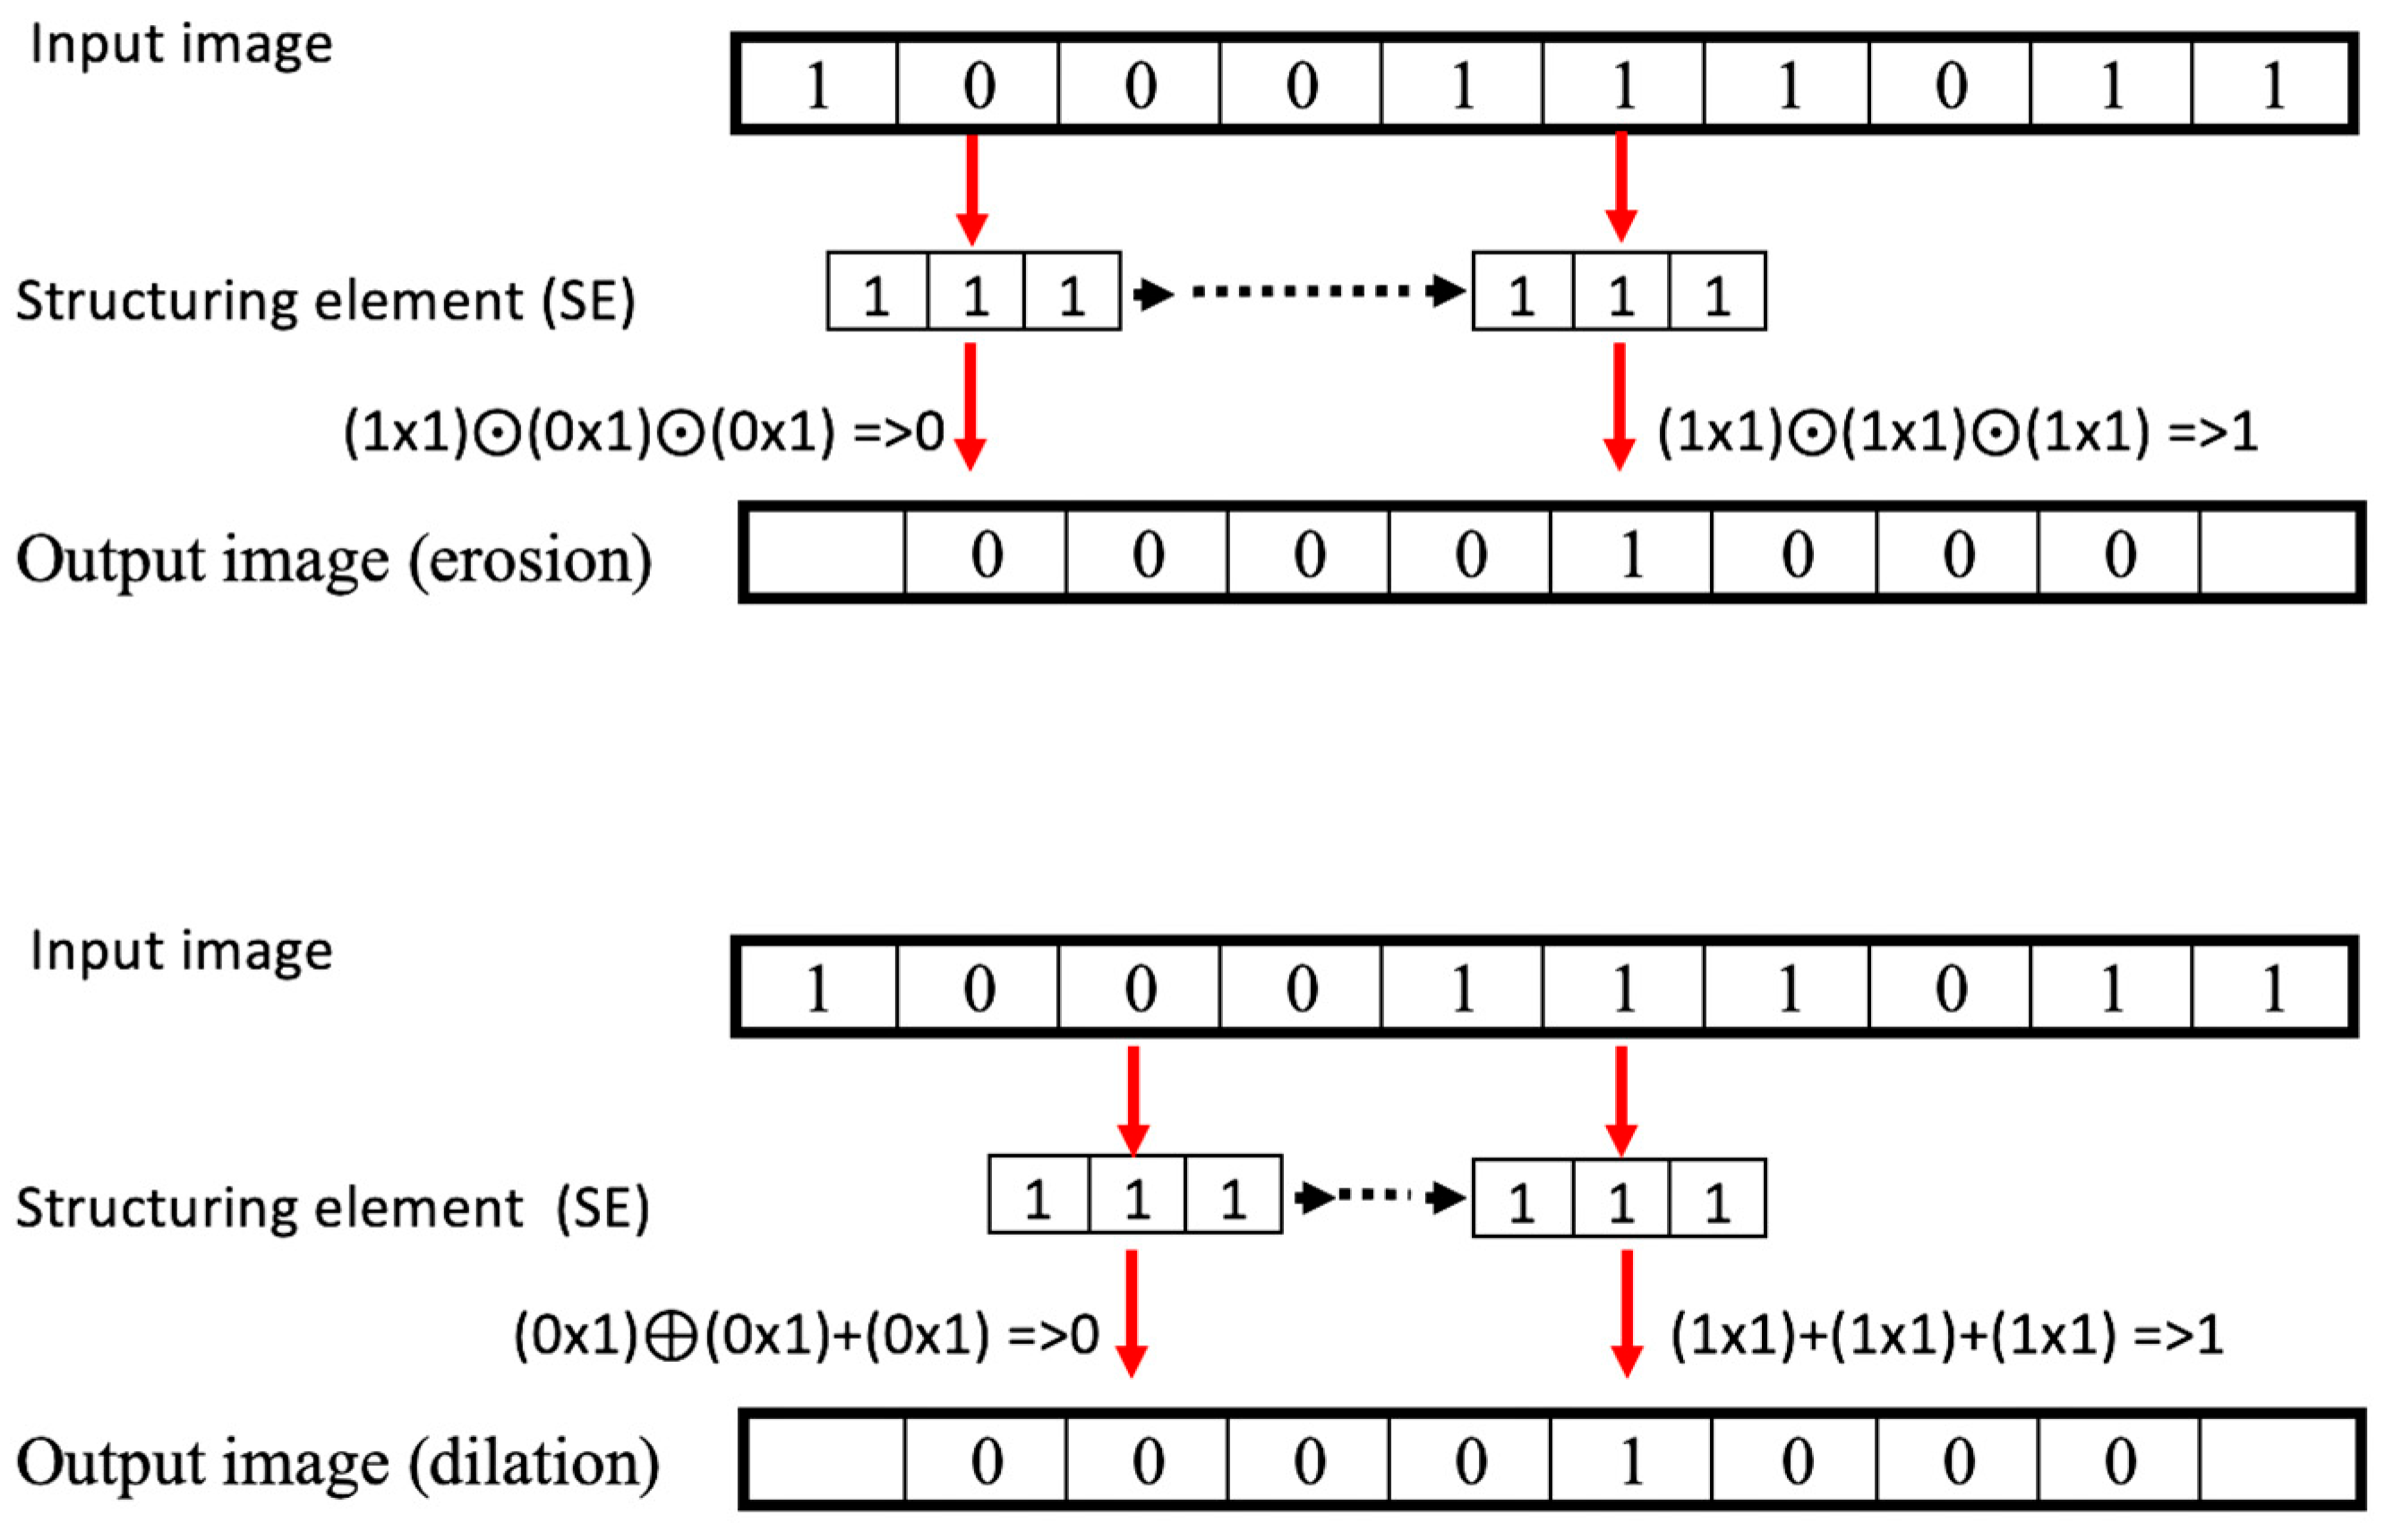
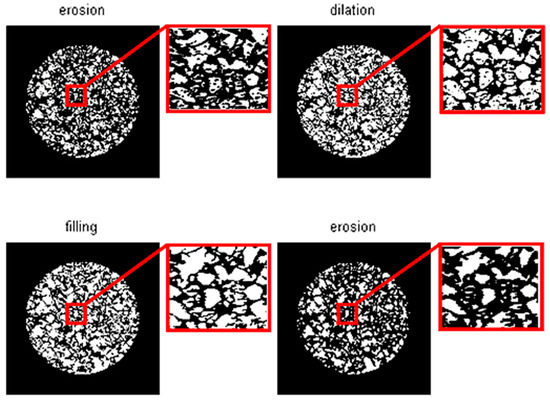
Label matrices are obtained for each 4-connected component (object). A struct is created that includes the measurement of features such as area, centroid, and bounding box that belong to the labeled regions. However, before this process, in order to prevent different objects with similar brightness information from being labeled as a single object due to their adjacent positions, commonly used erosion and dilation morphological operations are applied, followed by hole filling, as shown in Figure 7.
Figure 7.
Erosion and dilation morphological operations of images.
The morphological operations of erosion and dilation, including the filling operation, are defined in the z2 space as in Equation (1) and Equation (2), respectively:
A represents the input image, B represents the structuring element, and represents B’s complement of 1. Accordingly, the entire image is scanned step-by-step with the structuring element (SE) and the output images are obtained as shown below. The image processing stages of morphological operators are presented in Figure 8.
Figure 8.
Image processing stages of morphological operators.
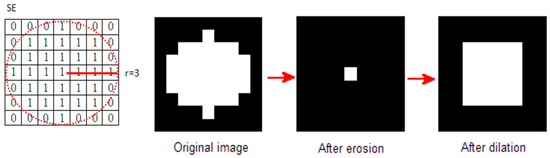
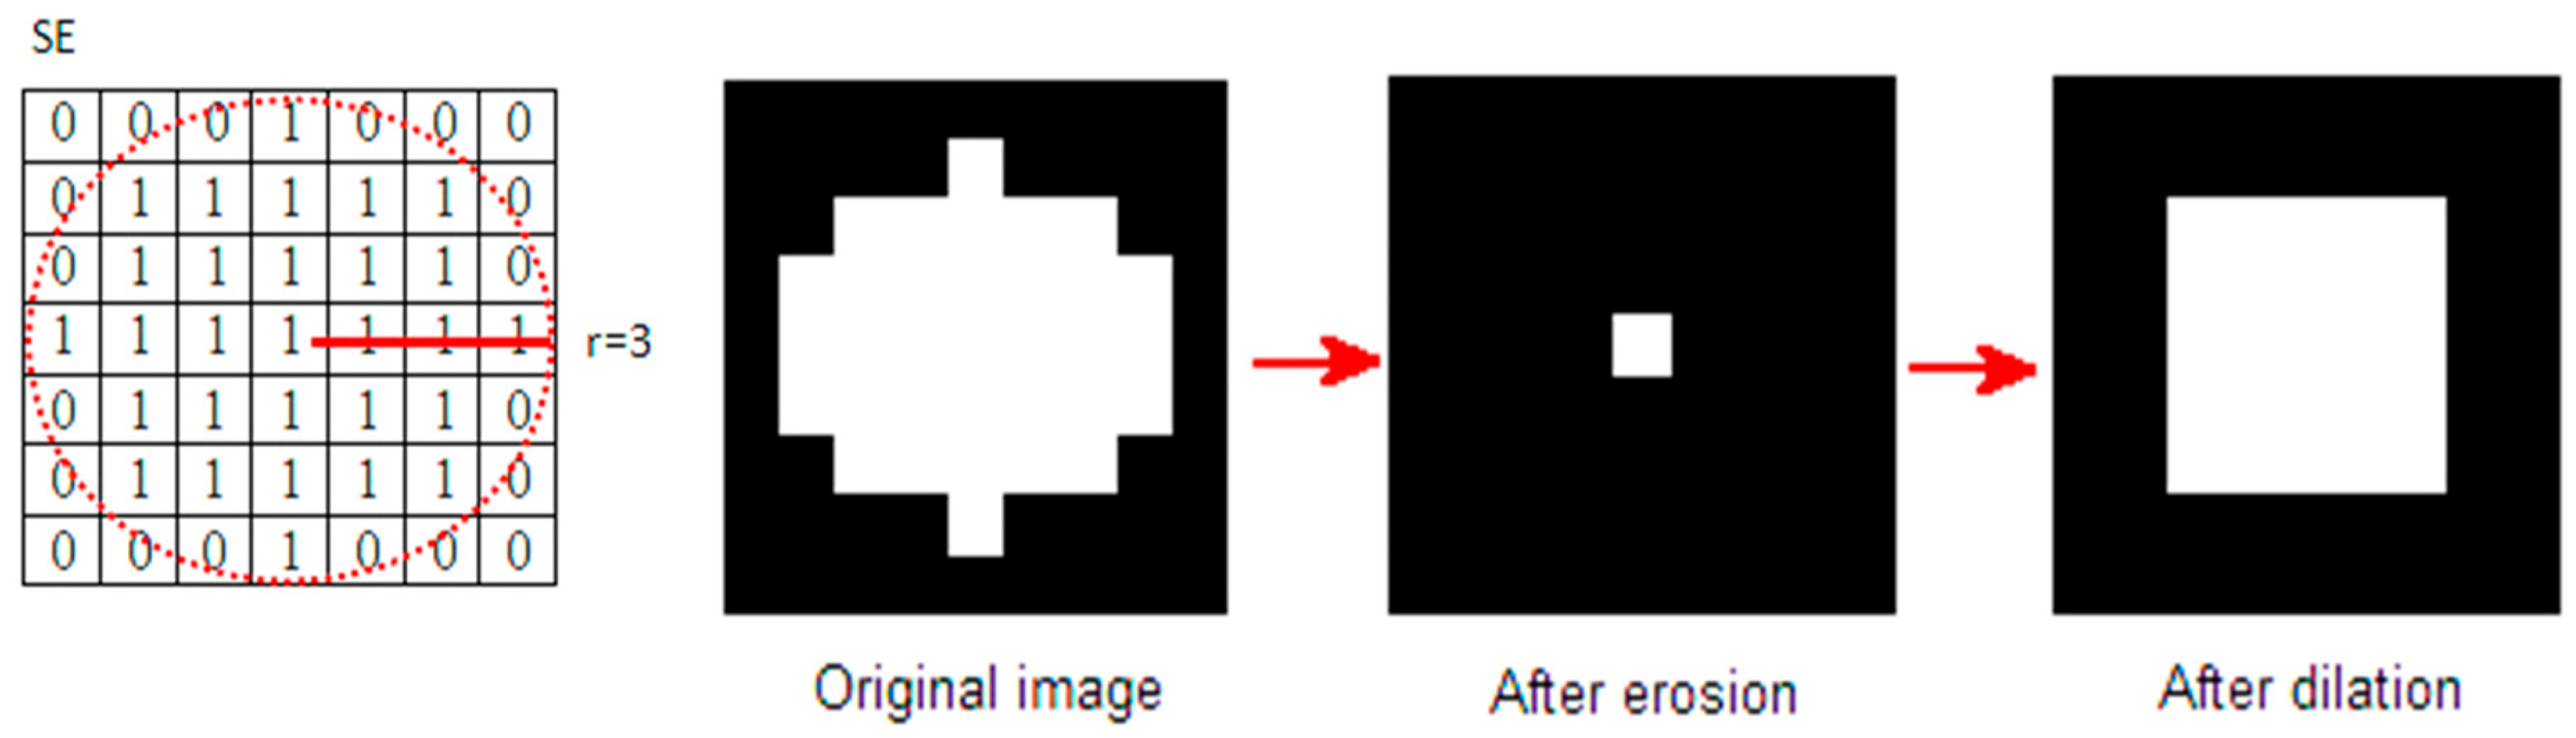
As explained above, in erosion, if the pixel values in the image within the area (according to the determined r radius value) covered by SE are 1, the new value of the center pixel is set to 1, and if any pixel is 0, the center pixel value is set to 0. Conversely, in dilation, only one 1 within the filter area is sufficient for the new pixel value to be 1. When the relevant operations are applied, an image with fewer edge details is obtained after the erosion and dilation operations, as shown in Figure 9. This process allows different connected objects in the image to be separated and labeled as two separate objects, rather than being perceived as a single object.
Figure 9.
Effect of morphological erosion and dilation operations.
A new erosion is applied again to images containing rock objects with a pixel area that is not too small after the dilation process. This condition is added to prevent the loss of necessary information in images that contain small objects. Thus, as a result of the re-applied connected component function, objects can be detected more accurately.
These morphological operations, used to determine the number of objects in an image by providing better separation of boundaries, can cause objects to differ slightly from their actual size. However, when the area of each object in the image is compared to the total area, the areas of the objects vary by approximately the same amount. Using sample number 1, L, as a reference, the maximum area value in each binary image is first calculated. Taking into account the coefficient of variation (1/CV), which indicates how much the data in a sample varies compared to the population mean, as well as the actual size values of the sieves, a transformation value for each sieve size is calculated as a ratio of this maximum area value. More specifically, a coefficient is initially computed by dividing the mean value of the areas of all detected objects in the image by the corresponding standard deviation, and this coefficient is subsequently multiplied by the maximum object area in order to estimate the initial sieve size. The remaining sieve sizes are then determined in a sequential manner by reducing the previously calculated sieve size according to the actual reduction ratio, while additionally incorporating a correction factor of 1/CV to account for variability in object size distribution. Based on these experimentally derived transformation values, which are defined relative to a reference image, each labeled object within the image is evaluated to determine the smallest sieve size through which it can pass, and for every object that satisfies this condition, the object count, denoted by S, is increased by one. Finally, the proportion of objects passing through the sieve relative to the total number of objects is calculated according to Equation (3) below and is shown in Table 2, scaled as stated above:
Table 2.
Considering the detected boundaries, the Rate values were calculated for each sample.
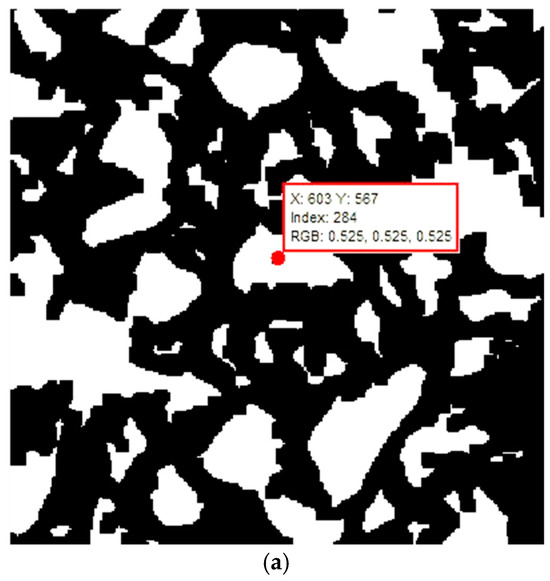
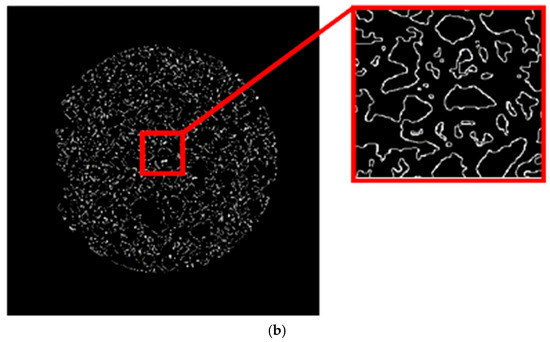
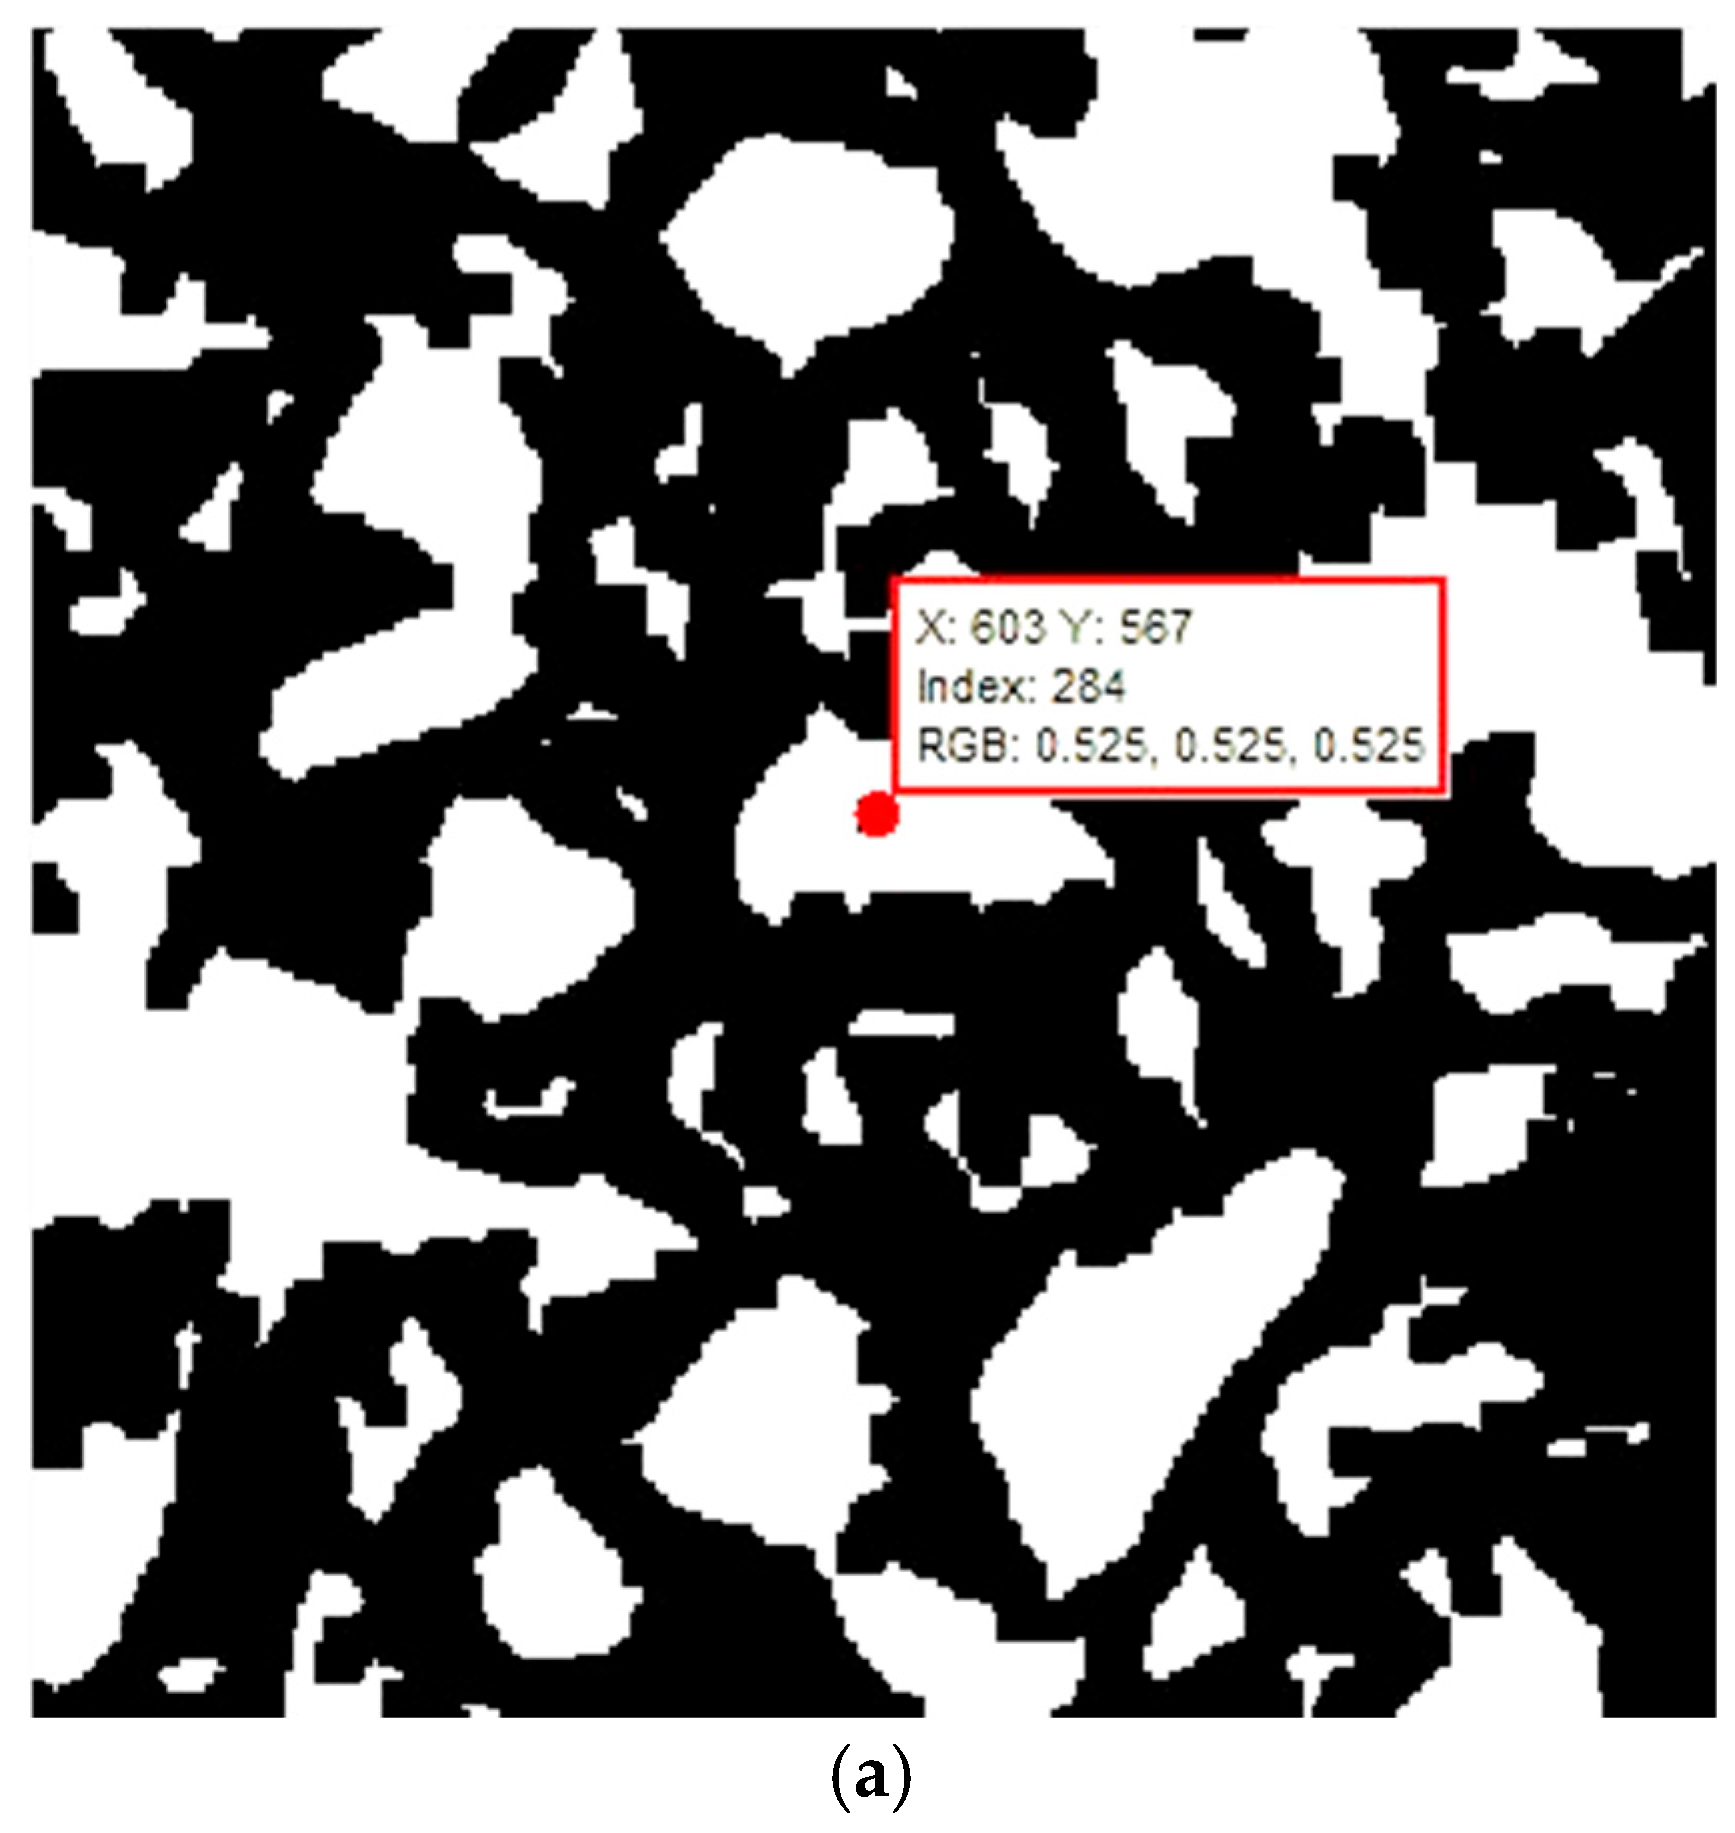
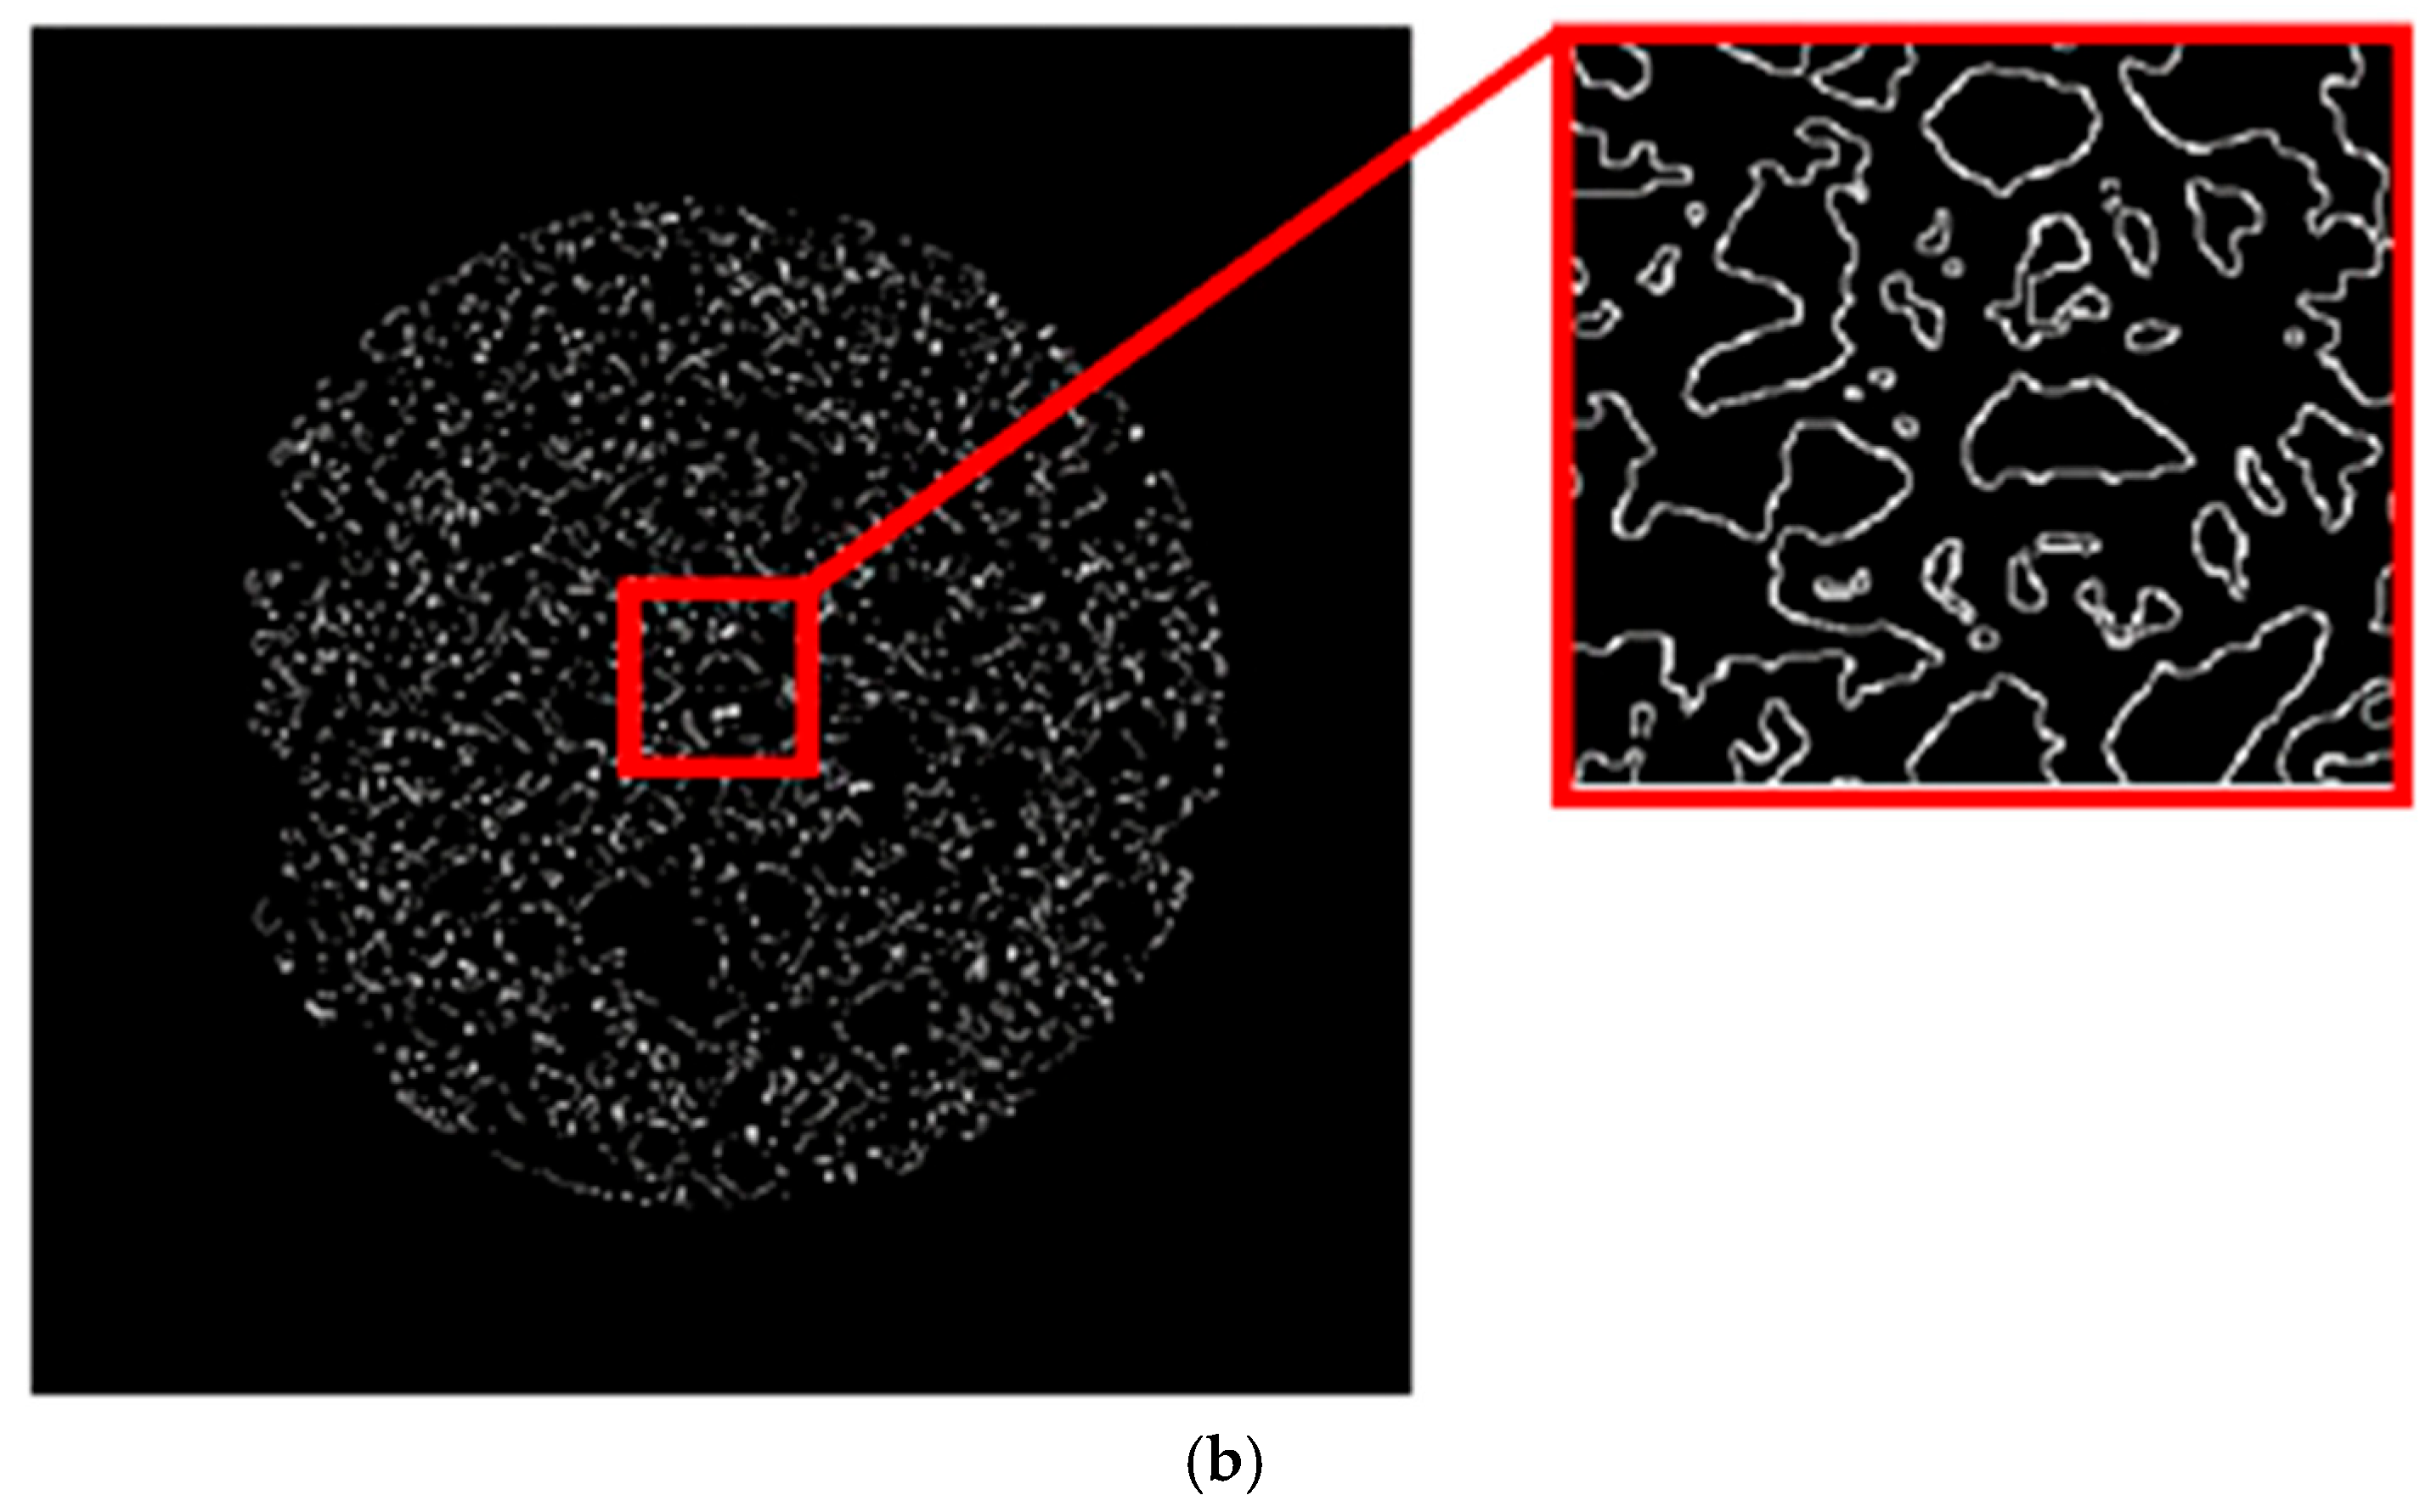
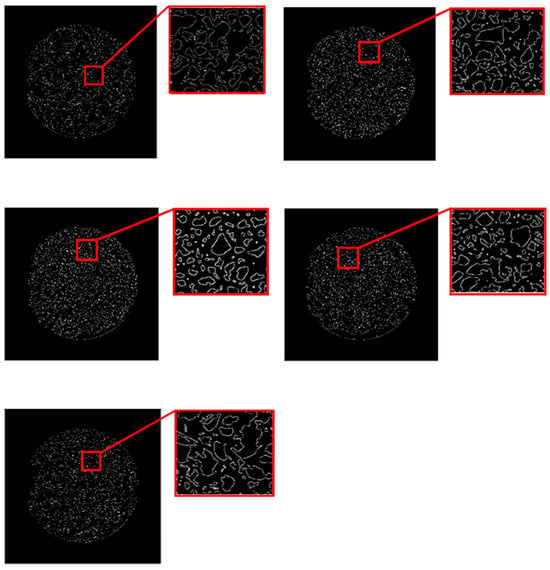
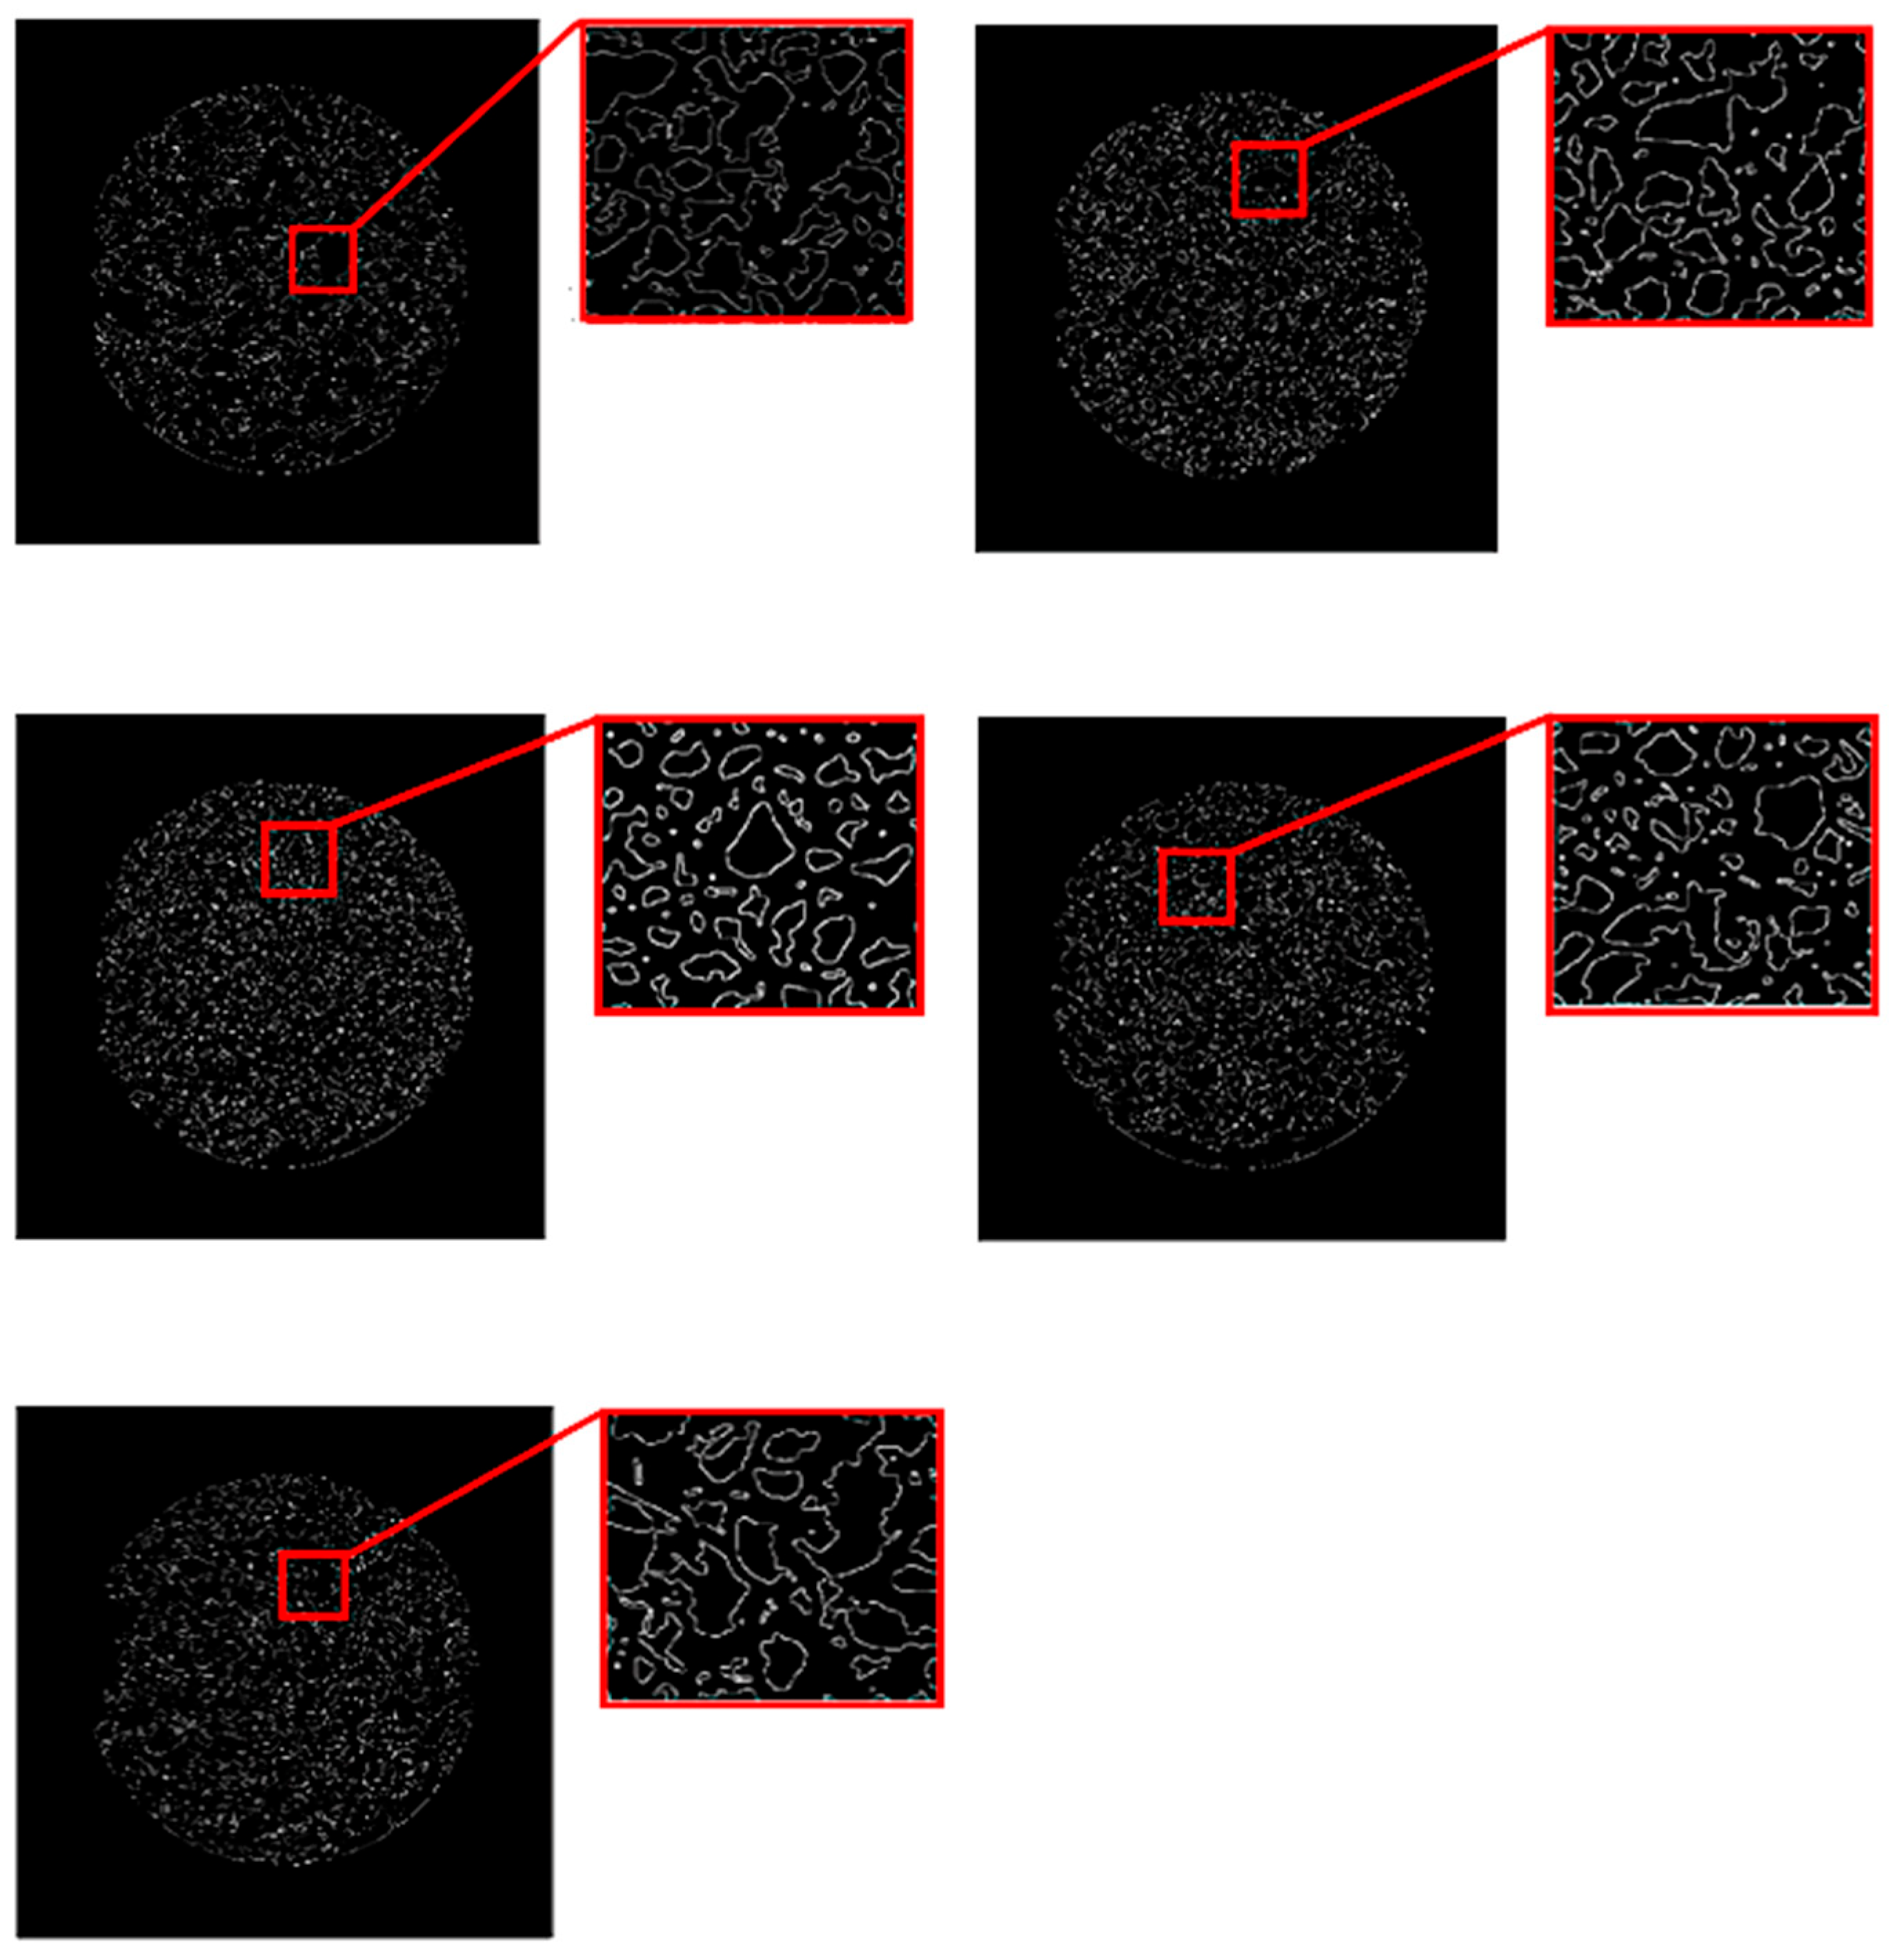
Specifically, this equation describes the proportion of objects associated with a given label, irrespective of their individual sizes, within the analyzed image. In other words, after the application of the transformation algorithms described in the preceding sections, the equation quantifies the number of labeled objects that fall within the corresponding scaled size range. Thus, it enables the results obtained in the superficial area of the pile, which is assumed to be homogeneously distributed, to be directly interpreted in terms of standard sieve analysis. Finally, to illustrate the boundaries of the labeled aggregates, whose proportions within the pile were calculated based on sieve sizes, the Canny edge detection algorithm was applied. The edge-detected aggregates are presented in Figure 9.
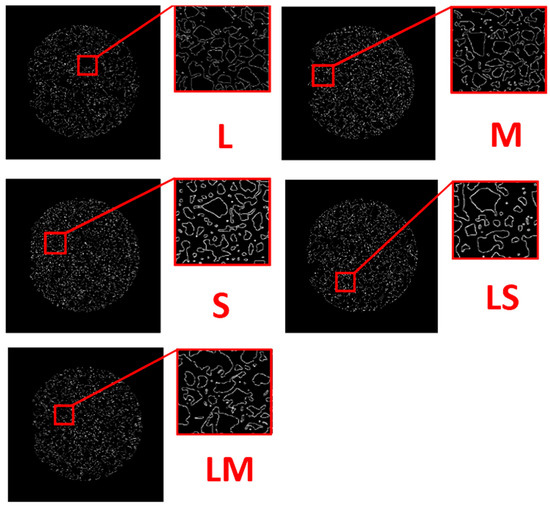
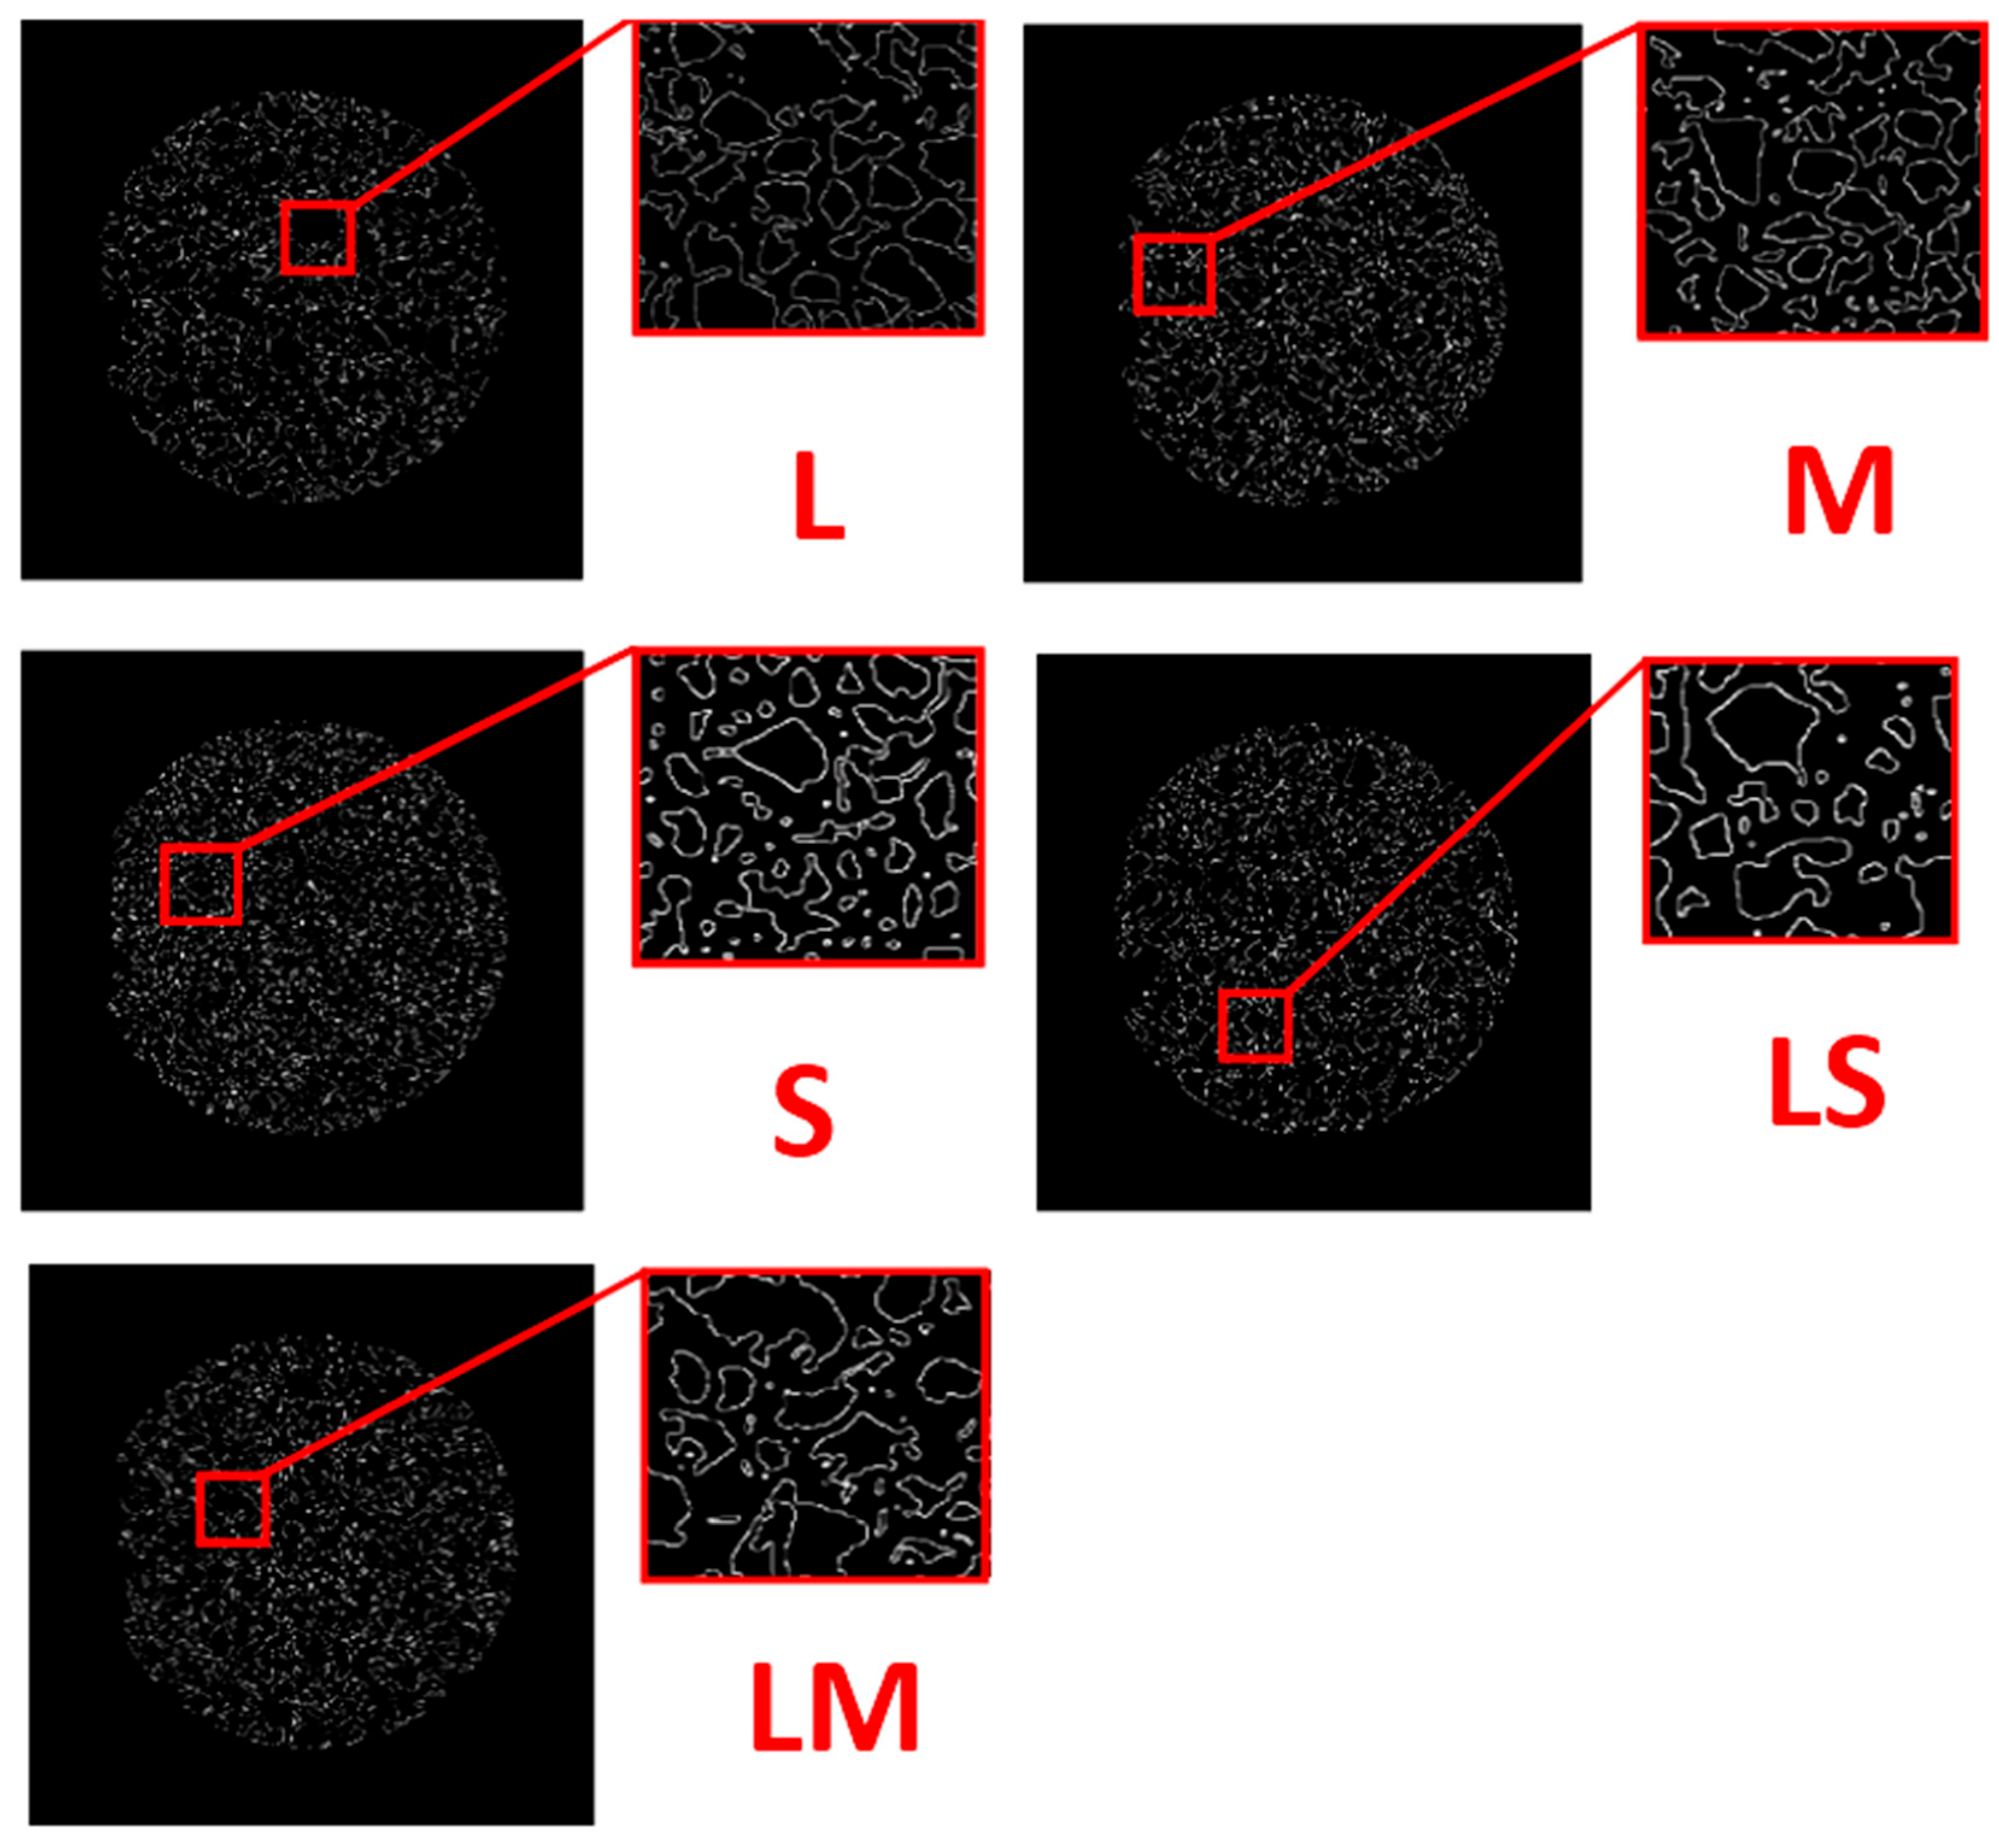
Note that the same original image region is zoomed in in all images in Figure 4, Figure 7 and Figure 10 to demonstrate that the objects were correctly detected as a result of image enhancement, morphological operations, and edge detection algorithms. Accordingly, as seen in panel (a), objects, namely each aggregate, are shown in white and labeled with an index number. Additionally, x and y values representing the minimum horizontal and vertical position of the object can be obtained. Using this information, the boundaries of the aggregates can be drawn, as seen in the zoomed-in frame on the right of panel (b). This allows us to clearly see how many objects are detected in the relevant region.
Figure 10.
Determining object boundaries. (a) Labeling the objects, (b) drawing boundaries of the objects using the Canny algorithm.
Figure 11 shows the region in which the Canny algorithm was applied to detect the aggregate boundaries.
Figure 11.
The region where the Canny algorithm was applied and the aggregate boundaries were detected.
To demonstrate the effect of each step of the methodology, detailed analyses are performed on the vertically oriented images of the LMS sample, which contained particles from all three size classes. Under the same conditions, all processing steps were also applied to the remaining samples (L, M, S, LS, and LM, as illustrated in Figure 2), and the resulting images with identified object boundaries are presented sequentially in Figure 10.
Here, it should be understood that objects of different sizes can be detected quite successfully in each pile by comparing the L, M, S, LS and LM panels with the original images in Figure 1.
3. Results
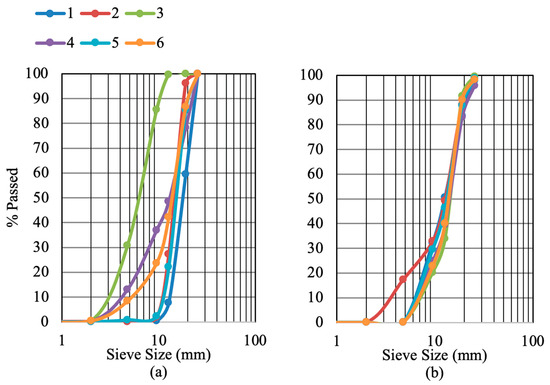
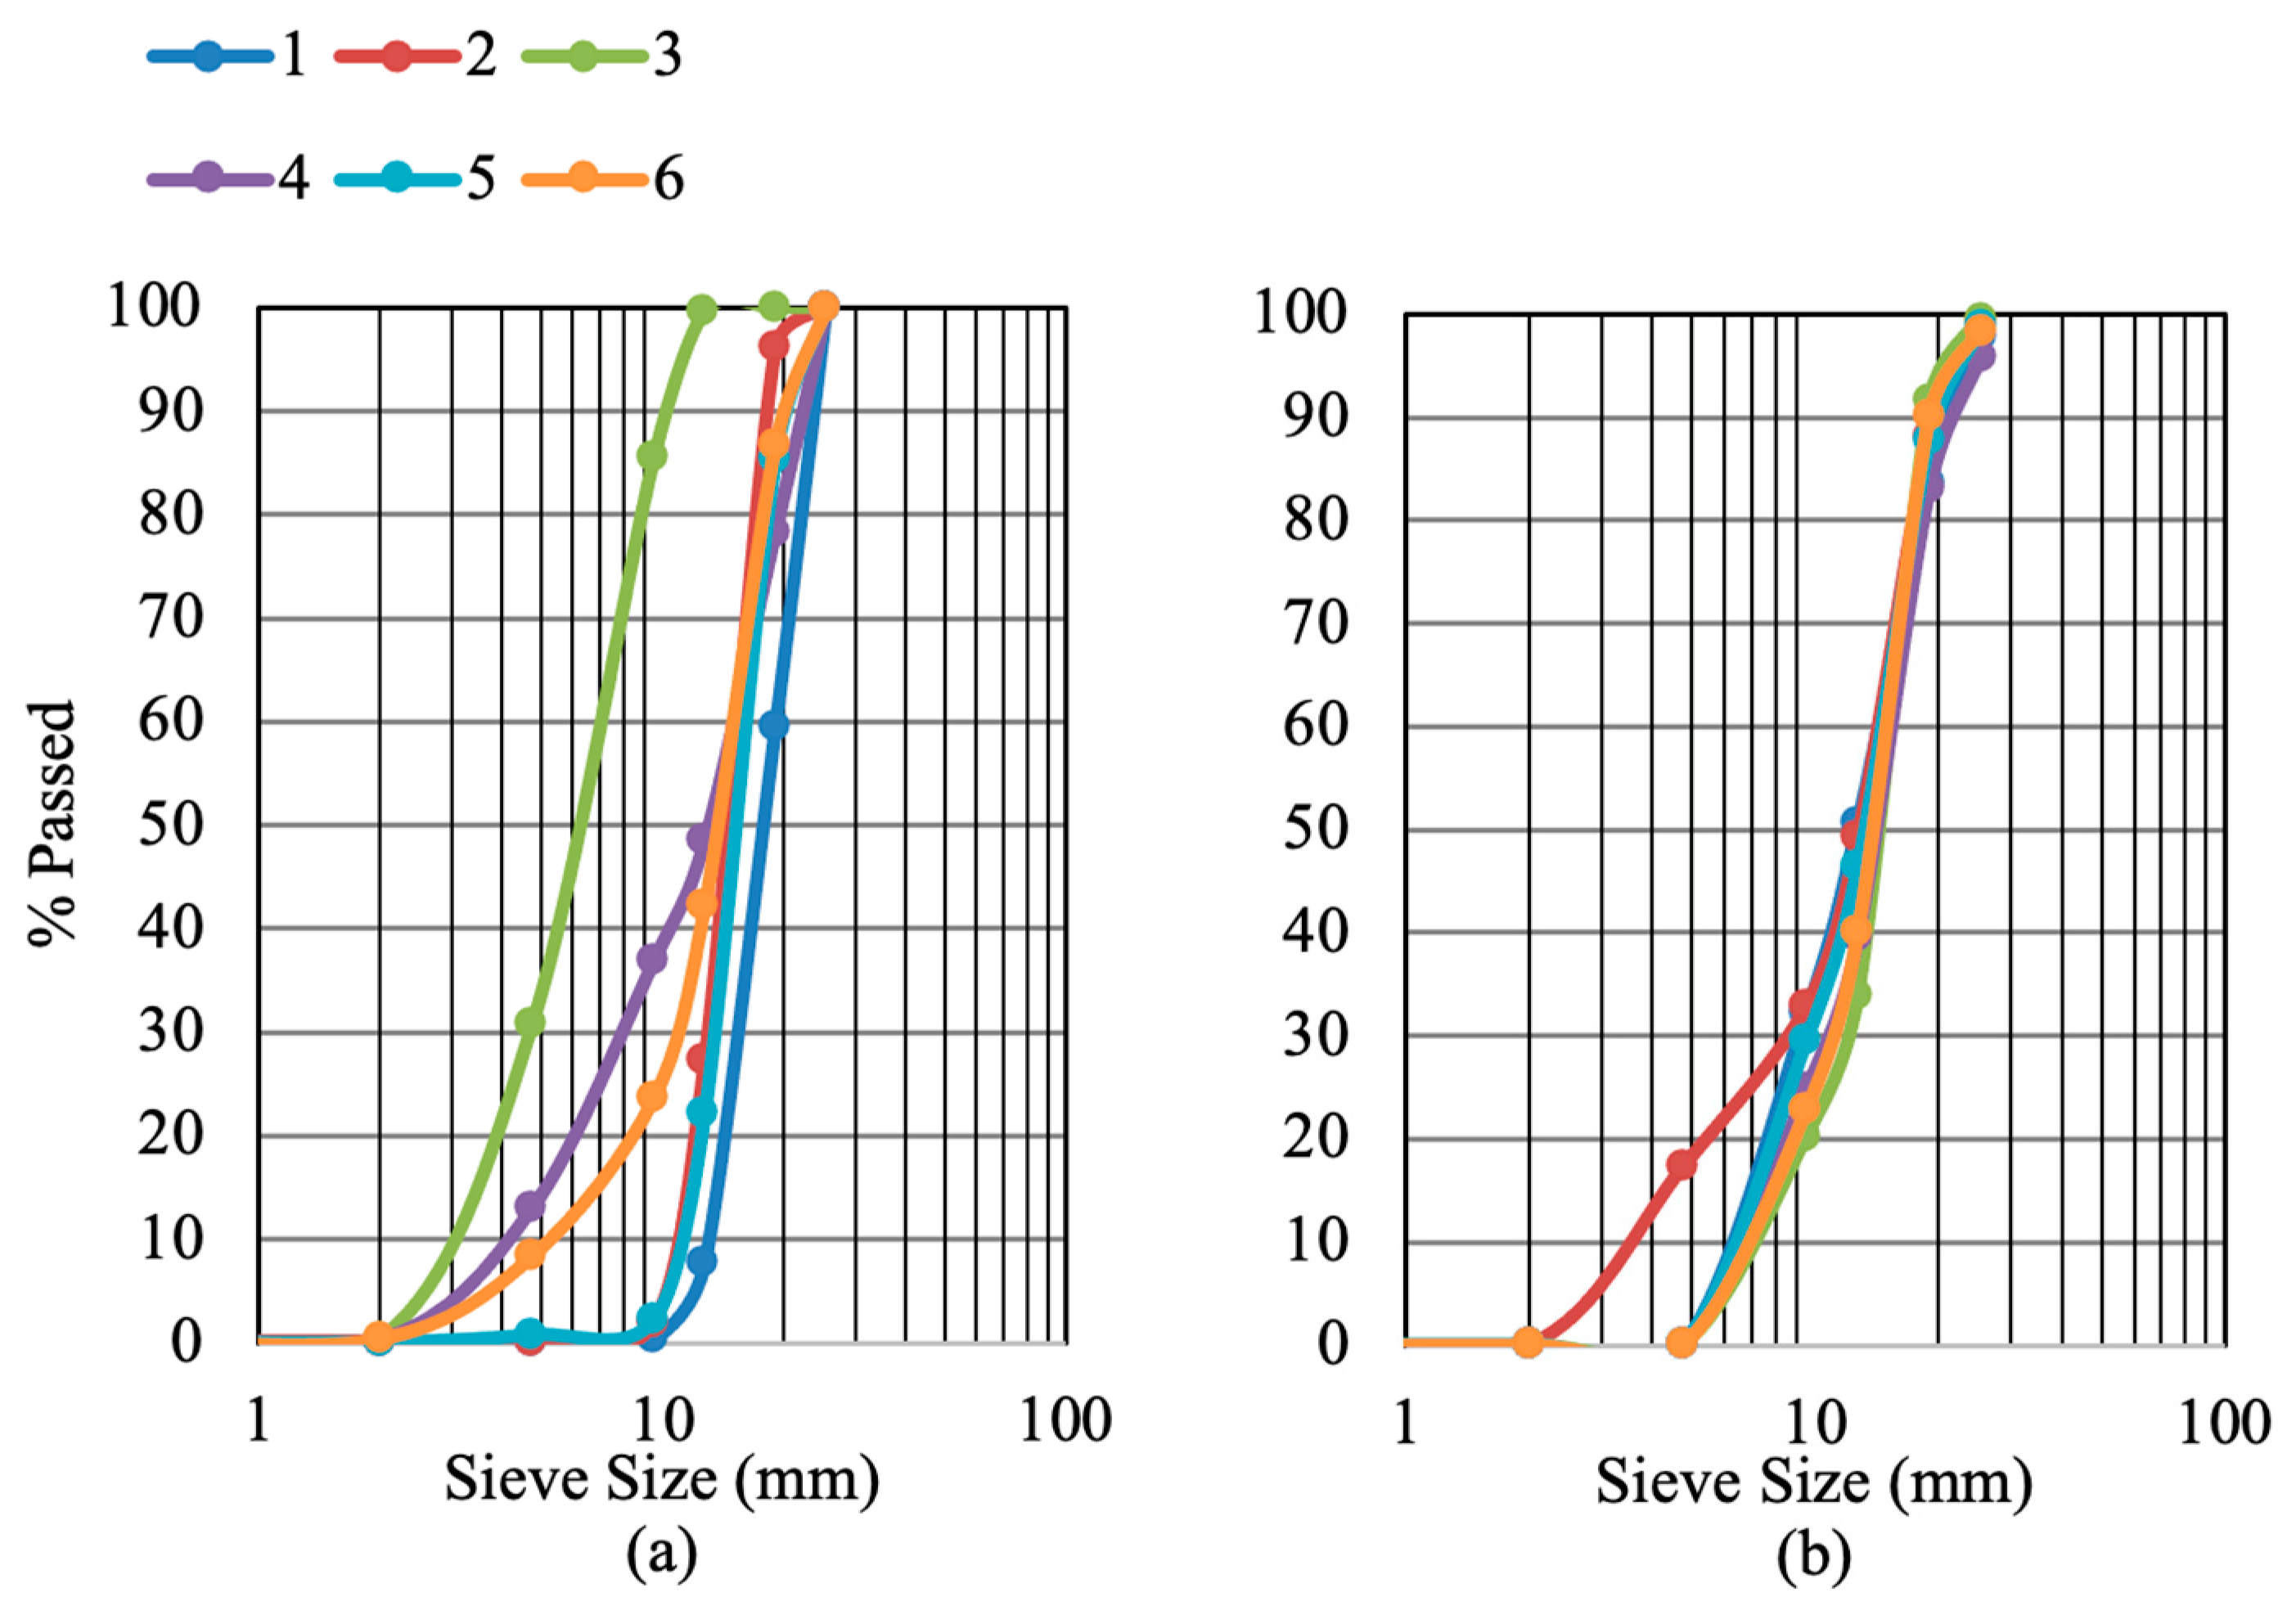
Figure 12 presents the six different samples prepared to determine the aggregate grain size along with their corresponding (a) classical sieve analysis and (b) digital image processing results. When Figure 2 and Figure 13 are compared, it is evident that large-sized particles in each sample are detected accurately to a significant degree. In Samples 1 and 2, which contain L and M-sized particles, some merged objects are observed; however, the detected boundaries are generally accurate. In Sample 3, composed mainly of S-sized particles, very small particles could not be detected. Nevertheless, in Samples 4, 5, and 6, which include a combination of L, M, and S-sized aggregates, each object was successfully separated, and its boundaries were clearly identified.
Figure 12.
The six different samples prepared to determine the aggregate grain size and their corresponding (a) classical sieve analysis results, (b) digital image processing results.
Figure 13.
The image of sample 6, taken from a different direction at a 90-degree angle.
Based on the detected boundaries, Rate values for each sample were scaled according to eight different sieve sizes and are presented in Table 2.
The pile ratios of the L, M, S, LS, LM, and LMS samples, whose vertical images are presented in Figure 2, are given in Columns 1 through 6, respectively. As shown in the table, almost all detected particles in each sample passed through the largest sieve size of 25.4 mm, and a substantial proportion also passed through the 19 mm sieve. When these results are compared with the experimental data in Table 1, a strong agreement is observed for these two larger sieve sizes. This observation is further supported by the RMSE (Root Mean Square Error) values calculated separately for each sieve size. These low deviation levels indicate that the proposed image-based method predicts the distribution of coarse aggregates with a high degree of reliability and stability. The consistency between the experimental and computational results at these sieve sizes confirms that the method performs particularly well in detecting and classifying larger particles, where boundary definition is clearer and segmentation errors are minimal. As the sieve size decreases, however, the deviation between experimental and predicted results increases. For the 12.7 mm and 9.5 mm sieves, the RMSE values are noticeably higher compared to those of the larger sieve sizes. While this level of error cannot be described as highly satisfactory in strict quantitative terms, it remains within an acceptable range when considering the inherent challenges associated with detecting smaller particles. These challenges include particle overlap, reduced image resolution relative to particle size, and the tendency of adjacent aggregates with similar characteristics to merge and be detected as a single object during segmentation. In particular, for Samples 1, 2, and 3—where particle size distributions are more uniform—the merging of aggregates contributed to a decrease in classification performance at the 12.7 mm sieve level. In contrast, for Samples 4, 5, and 6, which consist of mixed particle size classes, the segmentation process yielded comparatively improved results. The relatively lower RMSE values obtained for these mixed samples further support this observation and demonstrate that particle diversity can positively influence boundary discrimination. When all sieve sizes are evaluated collectively, the results indicate that the method achieves highly satisfactory performance for coarse aggregates (25.4 mm and 19 mm), while providing acceptable—though comparatively lower—performance for the smaller fractions (12.7 mm and 9.5 mm). A similar trend is observed for the 9.5 mm sieve size, where agreement with experimental data remains moderate but consistent. For the smallest sieve sizes, the experimental passing ratios were close to zero, and the computational results also yielded zero values, further confirming the internal consistency of the proposed approach. Overall, the findings demonstrate that the method is particularly robust and reliable for coarse aggregate estimation, while maintaining an acceptable level of agreement for smaller sieve sizes despite the increased segmentation complexity.
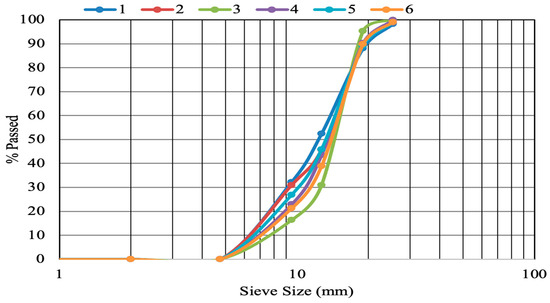
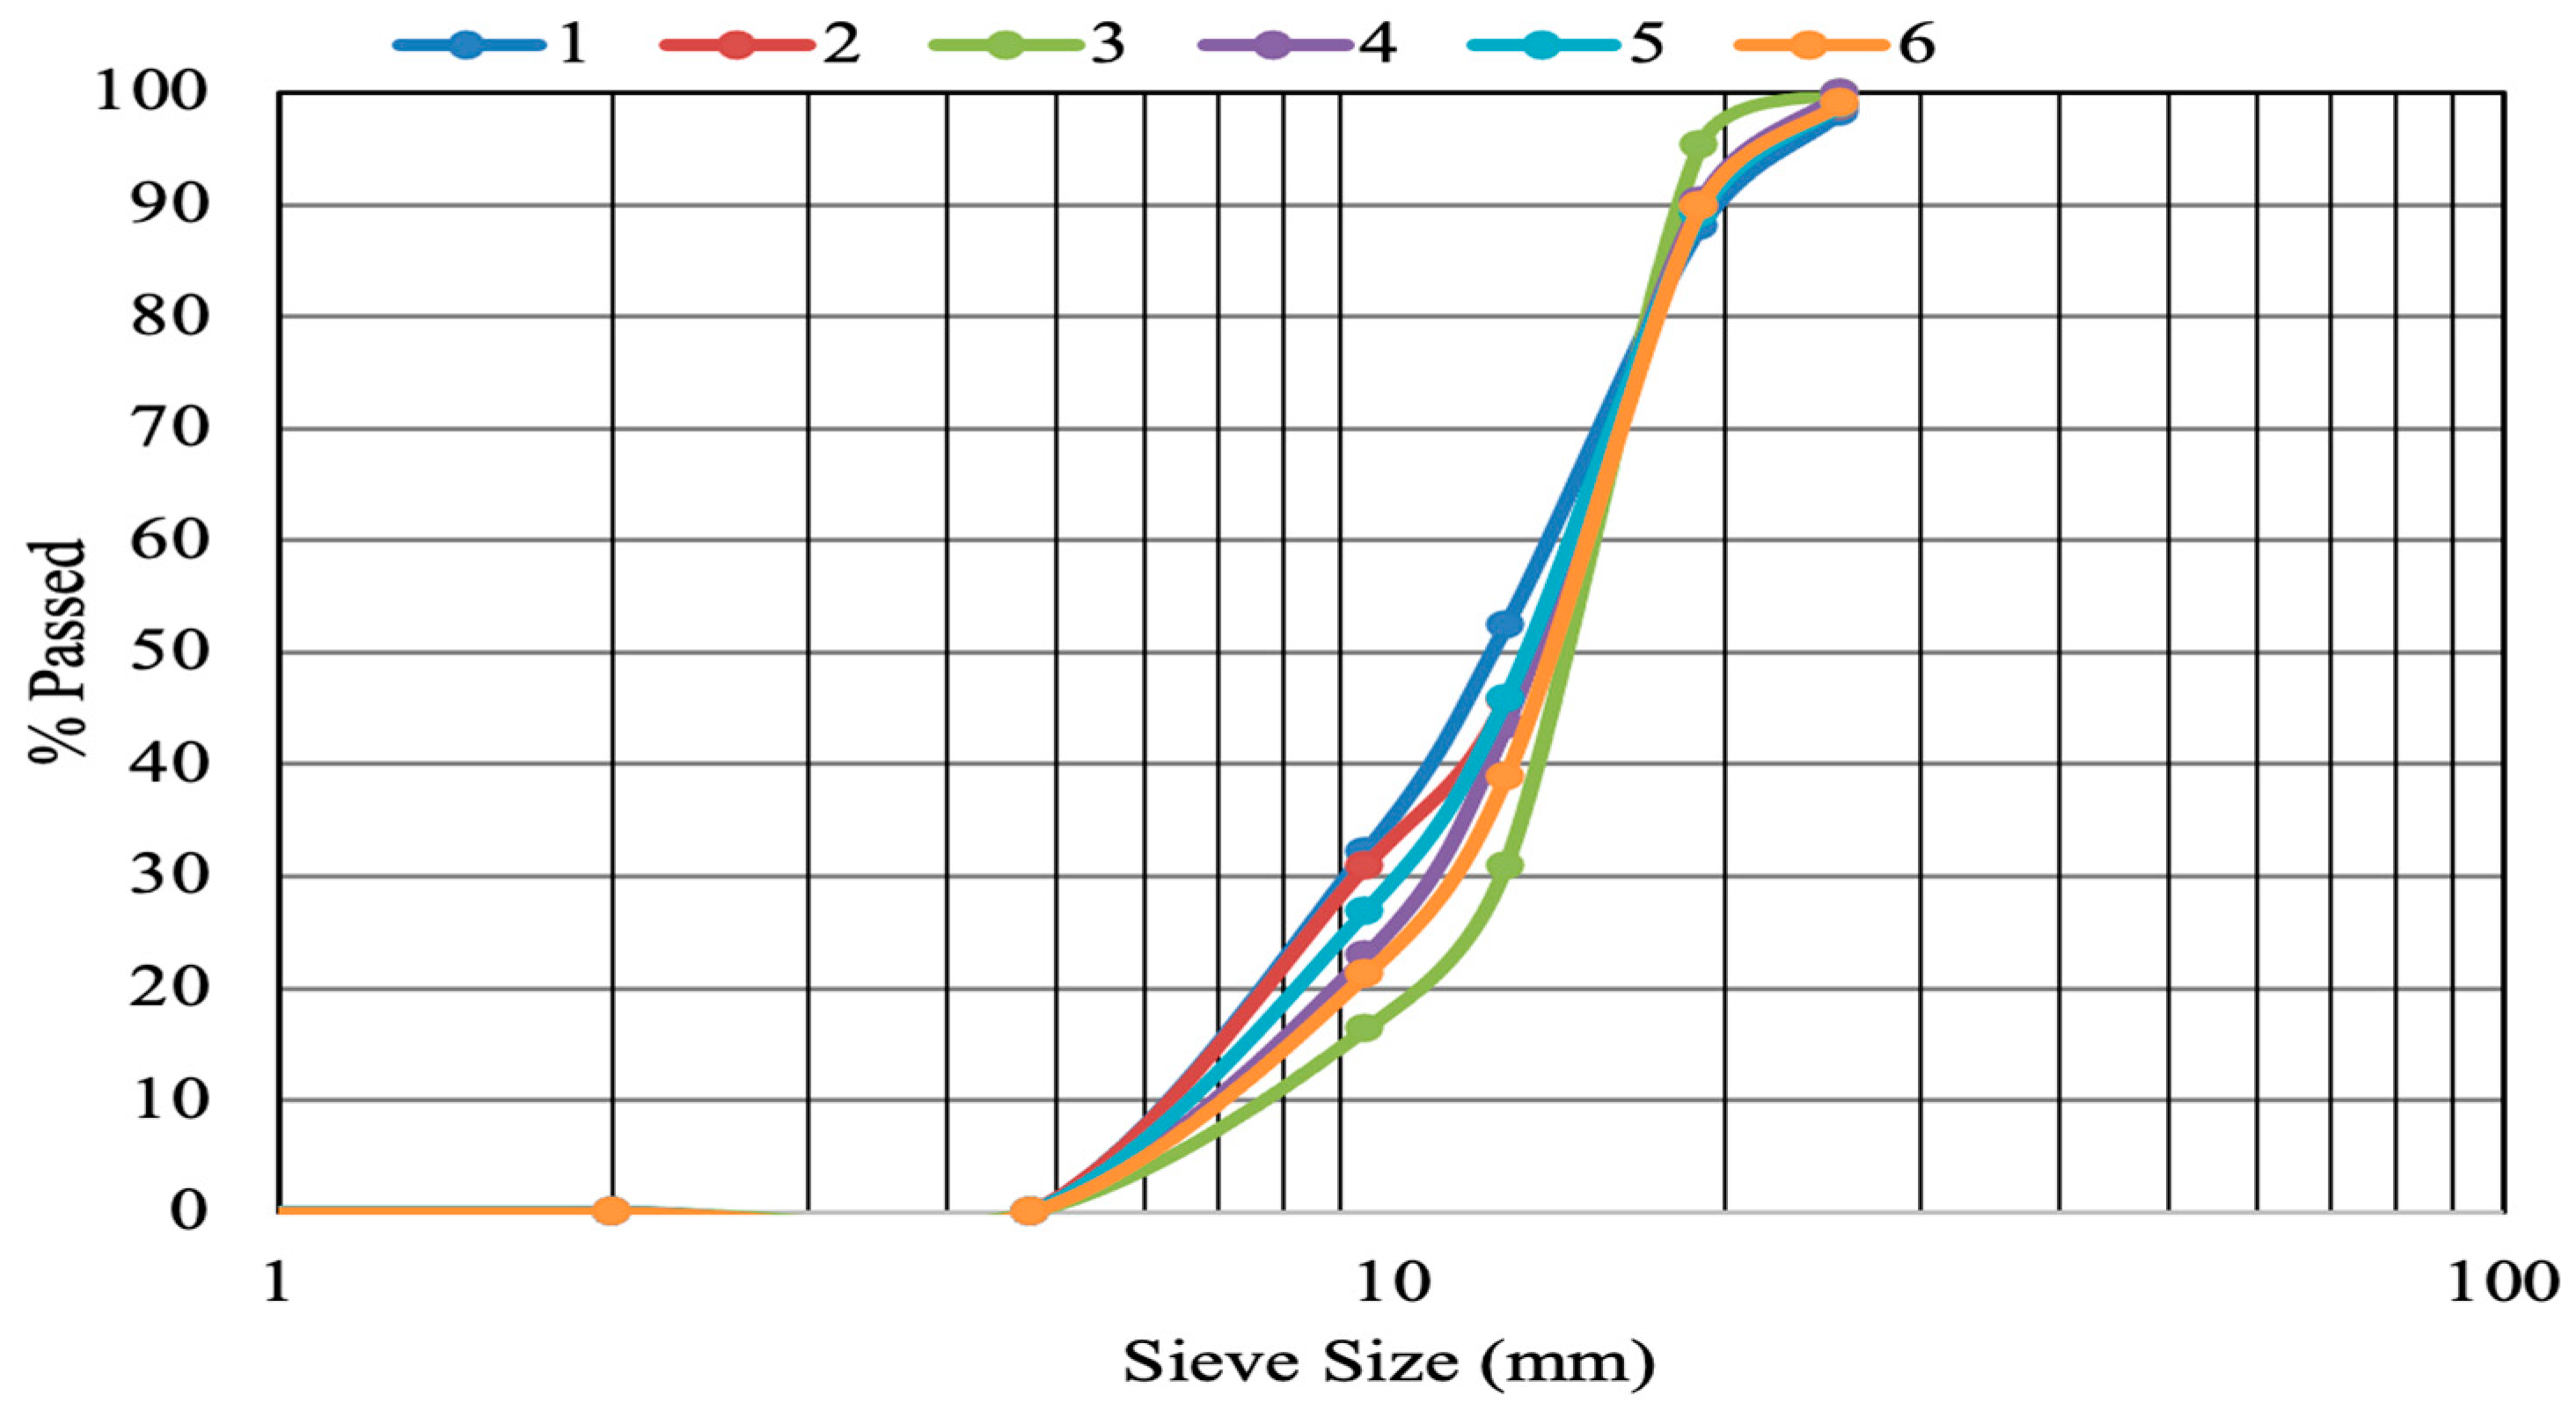
To provide a clearer understanding of the particle passing ratios through the sieves, a graphical representation of the data from Table 2 is presented in Figure 12.
The passing ratios obtained for 6 samples are approximately 100, 60–100, 10–50, 0–40, 0–30, and 0 for classical sieve analysis. These values are calculated as 95–100, 80–90, 30–50, 20–30, 0–20 with the proposed image processing method in a few seconds. In particular, for sieve sizes larger than 10 mm, the sample distributions exhibit a high degree of similarity, demonstrating the consistency between the experimental and computational analyses. To understand this, note that when the sieve size is around 10, the passed ratio is distributed in the ranges of 20–50 and 80–100 for the 6 samples in both graphs. At smaller values, the success of the proposed method decreases, with passed aggregates detected near 0. However, for very small sieve size values, passed aggregates close to 0 are detected by both techniques.
Furthermore, to verify the computational accuracy and assess the consistency of the proposed method, all procedures were repeated using images of the same samples captured from different angles. Figure 13 presents the image of Sample 6, which contains particles of S, M, and L sizes, taken from a different direction at a 90-degree angle. In the preprocessing stage, the original image was first converted to grayscale, followed sequentially by the application of Wiener and sharpening filters.
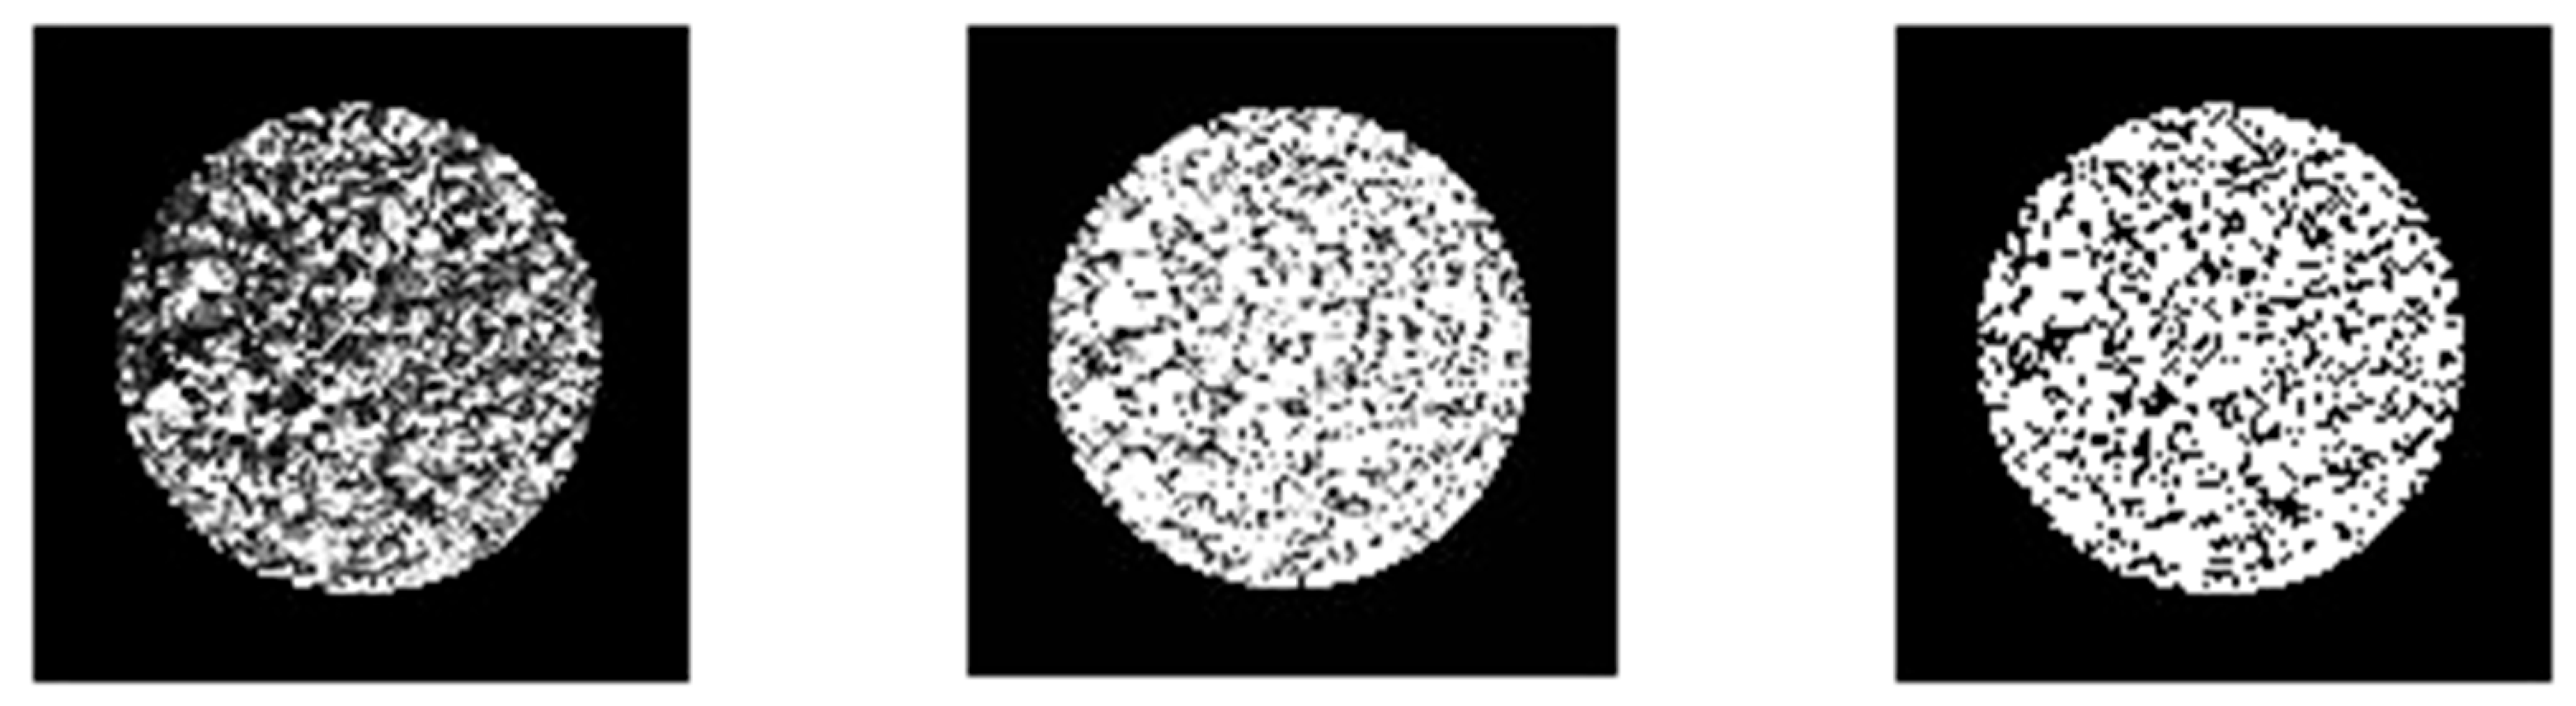
Subsequently, histogram equalization and the OTSU method were applied to the selected region, as shown in Figure 14.
Figure 14.
Application of histogram equalization and OTSU methods in the second and third columns for the selected region in the first column.
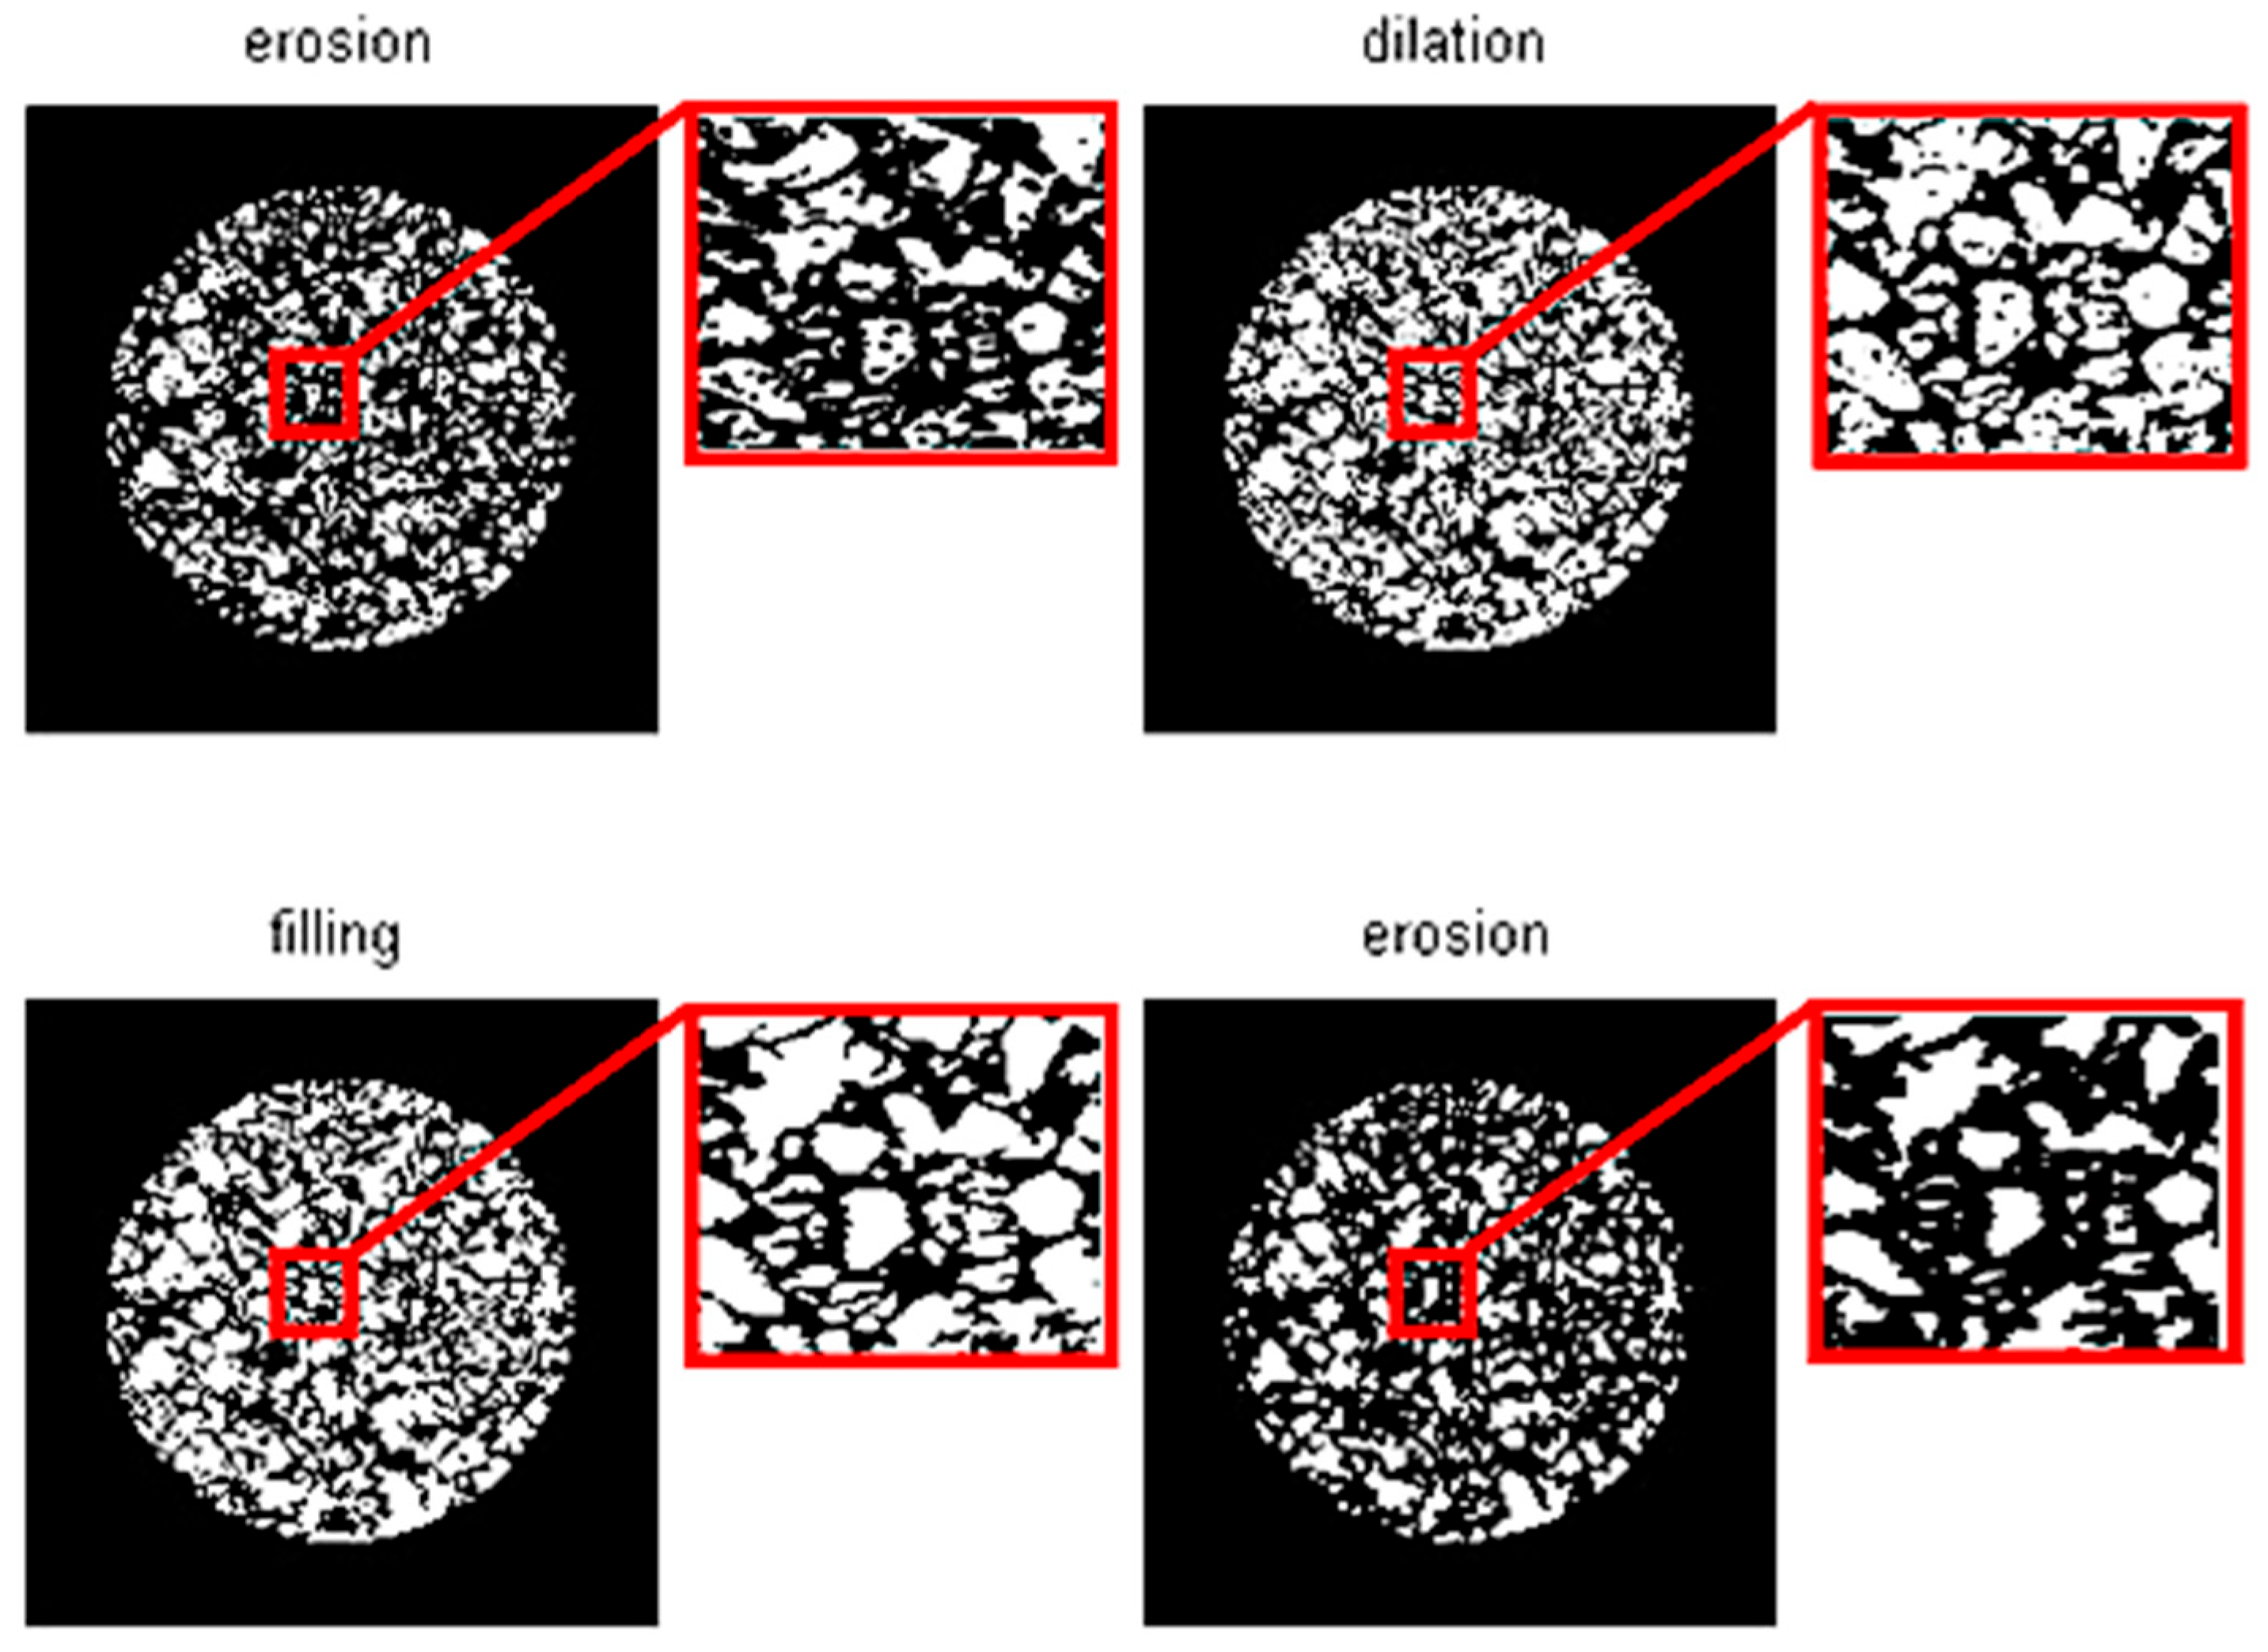
Finally, morphological operations were applied to enable the segmentation of objects. As shown in Figure 15, erosion was first applied to separate adjacent objects. While erosion successfully broke the boundaries, it also caused some fragmentation of the objects. Therefore, to restore each object, the dilation operation was used to expand the edges by the size of the structuring element, and filling was applied to close the internal gaps within the objects.
Figure 15.
Morphological operations that enable the segmentation of objects.
To ensure that the boundaries of larger particles were properly separated when the maximum particle size exceeded a predefined limit, a second erosion process was performed. This operation was controlled by a threshold value to prevent the loss of objects in images composed of small aggregate particles.
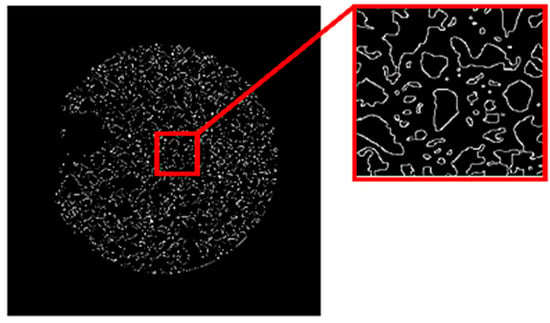
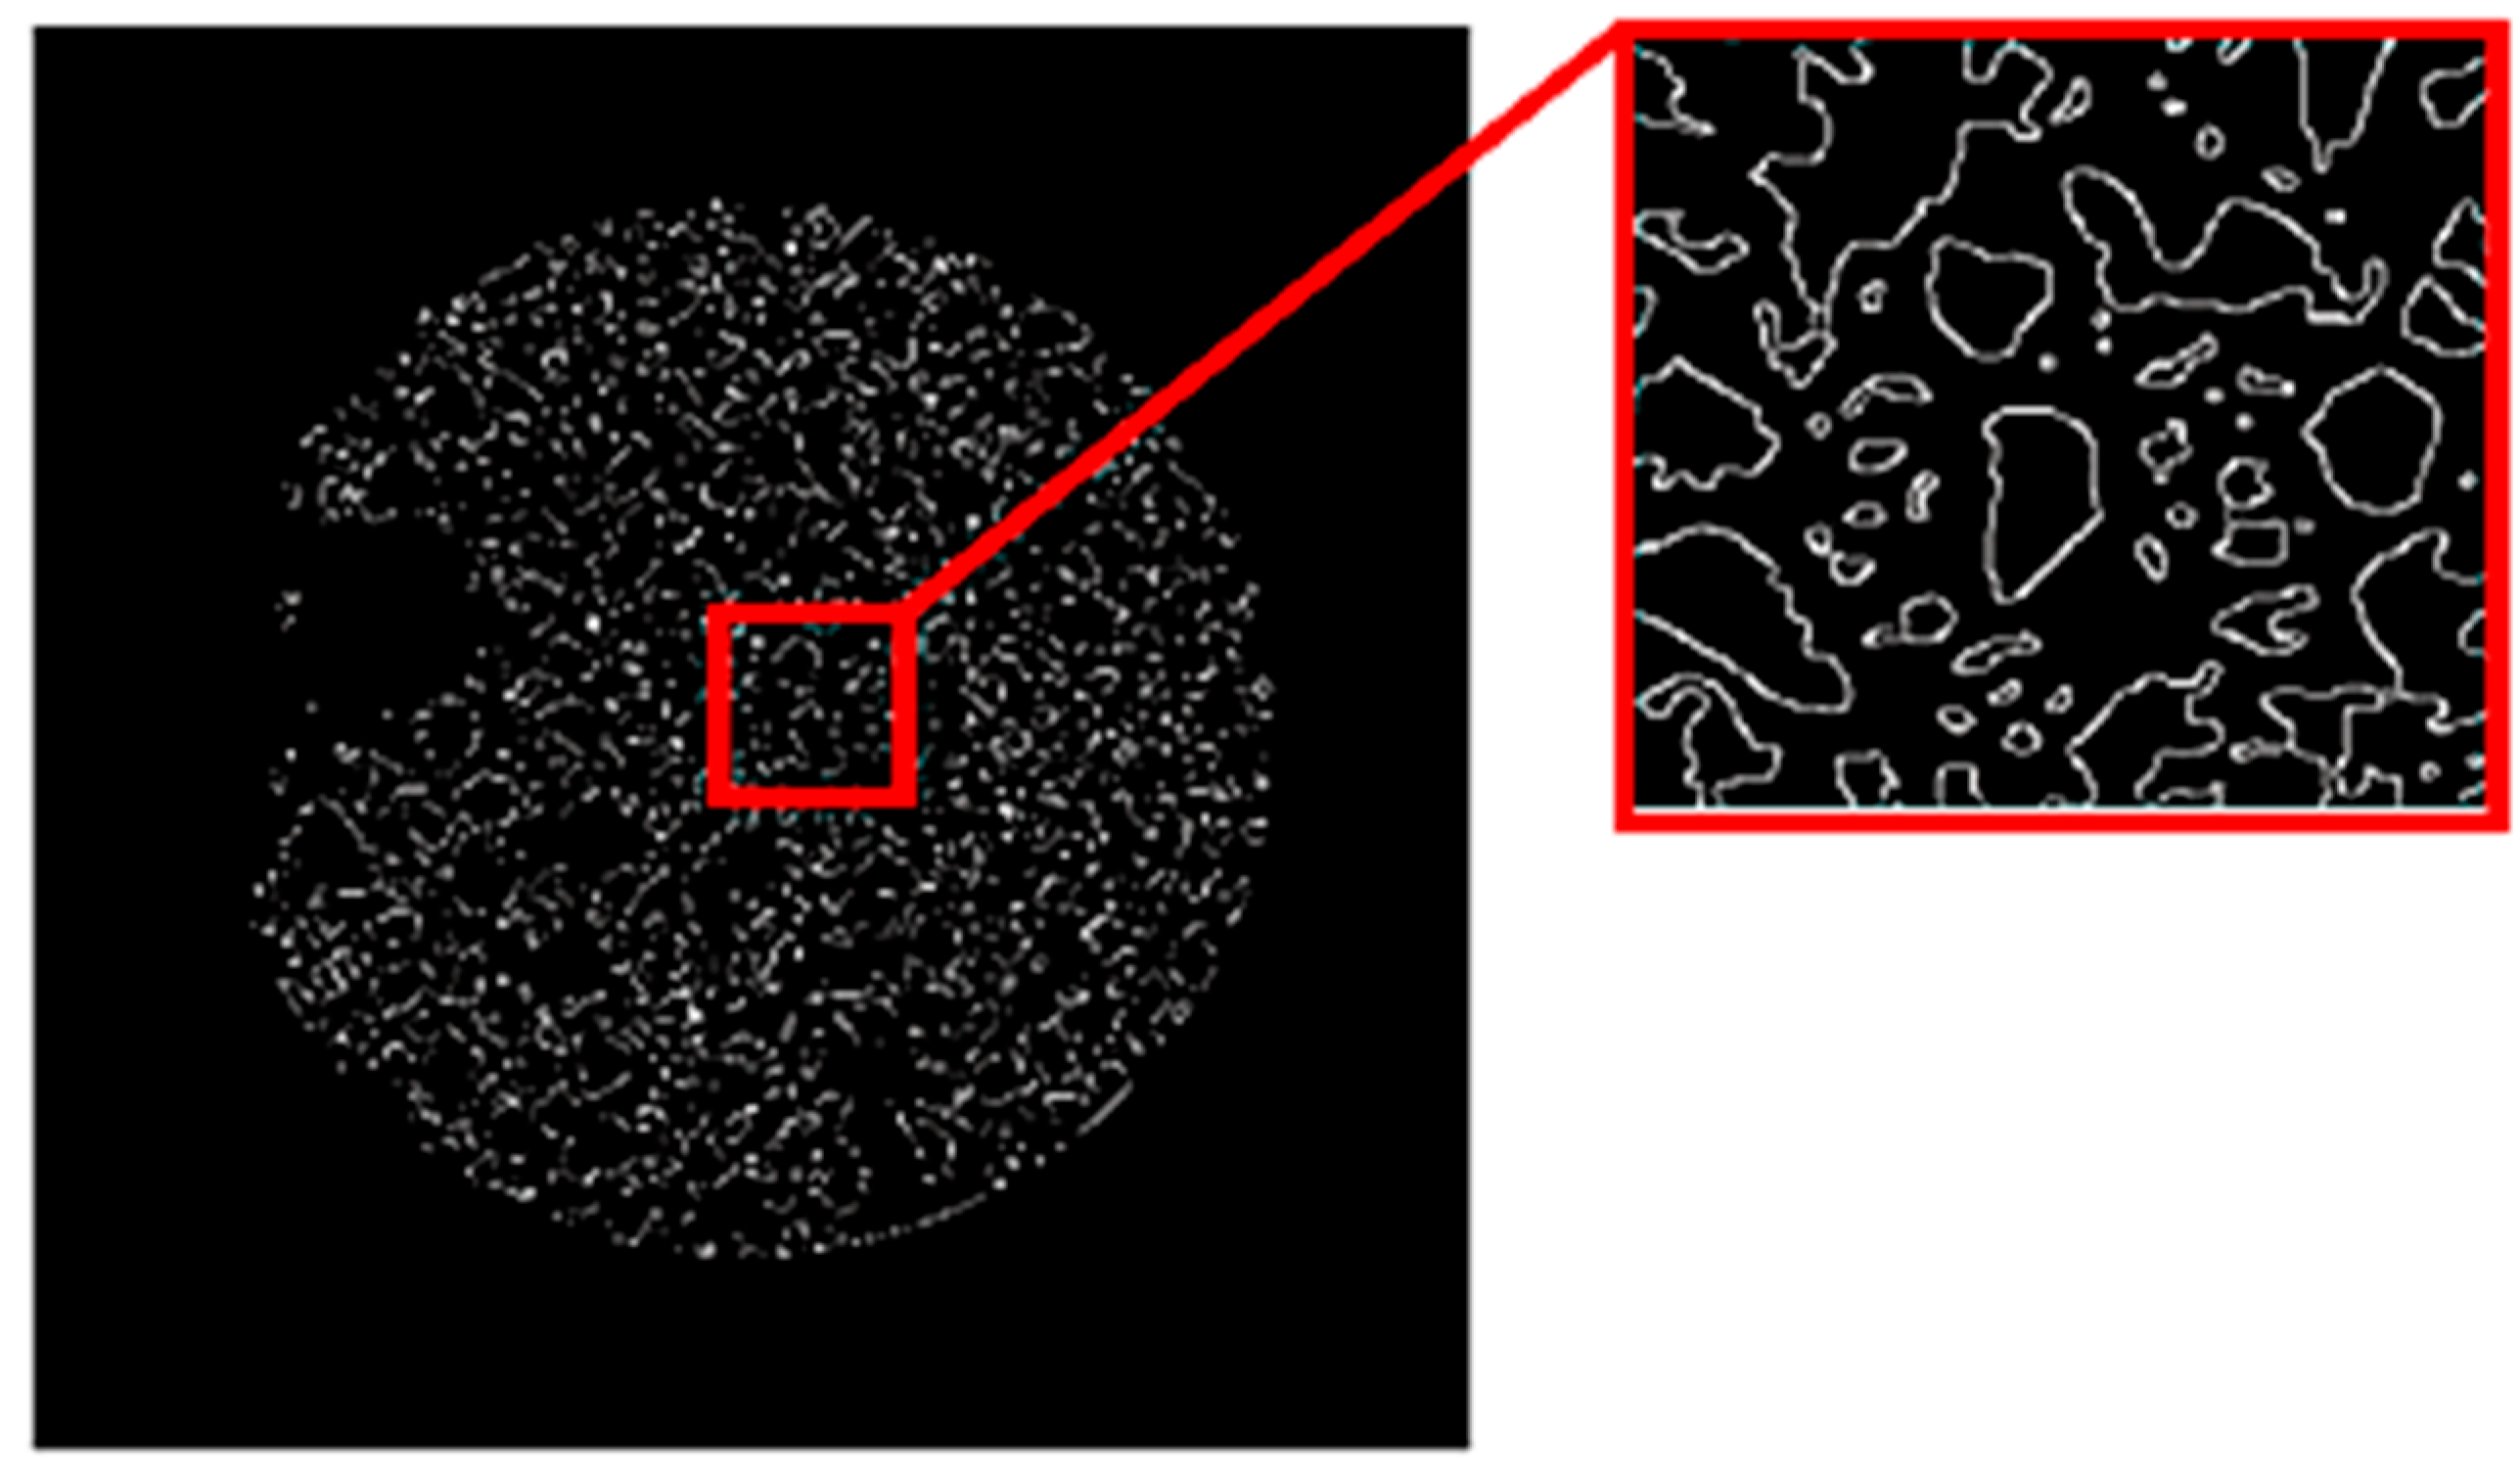
In the horizontal result images, all objects were labeled, and the area information of the aggregates was stored in an array. The boundaries of the identified regions were then determined using the Canny edge detection algorithm, as shown in Figure 16.
Figure 16.
Determining object boundaries using the Canny algorithm.
To provide a clearer and more comprehensive interpretation of the white-marked boundaries, the highlighted region was magnified and examined in detail. This zoomed-in visualization enables a more precise evaluation of particle edge detection performance and boundary continuity. When the enlarged area inside the red box is carefully compared with Figure 12, it can be observed that the majority of the particles are identified with nearly identical boundary contours, despite the difference in viewing orientation. The particle edges, shape characteristics, and separation lines between adjacent aggregates remain largely consistent, indicating that the detection algorithm preserves geometric integrity across perspectives.
This comparison demonstrates that the proposed method maintains robustness against changes in image orientation. In other words, whether the image is acquired in a horizontal or vertical configuration, the system is capable of detecting particle boundaries with a high degree of similarity and spatial accuracy. Such consistency confirms that the calibration procedure effectively compensates for perspective-related distortions and ensures stable segmentation performance.
To further strengthen this validation, additional samples were analyzed using vertically oriented images. For these samples, object boundaries were again extracted under the same processing framework. The corresponding magnified regions, highlighted in the vertical views shown in Figure 11, are presented in Figure 17. These additional comparisons consistently show that particle delineation remains reliable and reproducible across different samples and imaging orientations. Collectively, these results provide strong visual evidence that the proposed method delivers orientation-independent, accurate, and repeatable boundary detection.
Figure 17.
Determination of aggregate boundaries. The same regions marked in the vertically oriented image in Figure 10 were magnified and are presented here.
To present the sieve analyses of the marked regions, the particle passing ratios for each sample were calculated based on the scaled sieve size values, which were determined with reference to the experimental data, and the results are shown in Table 3.
Table 3.
Particle passing ratios for each sample, calculated based on sieve size values scaled according to the experimental data.
The close agreement between all obtained results and the vertical image results presented in Table 2 demonstrates that objects in the samples can be detected from any viewing angle and that the proposed method ensures reproducibility.
For ease of comparison, using the tabulated data, the particle passing ratios for each sample were plotted against the sieve sizes, as shown in Figure 18. When compared with the sieve analyses conducted using the vertical images of the six samples, it is evident that each curve exhibits the same behavior, and the aggregate ratios represented by the colored small circles—identical to those in Figure 12b—display a very similar distribution pattern.
Figure 18.
Sieve analysis diagram calculated based on the digital image processing results.
The use of aggregate particle sizes of different magnitudes is permitted in various types of reinforced concrete structures. Considering the design details of structures such as buildings, bridges, dams, power plants, towers, tunnels, culverts, and similar facilities, the classification of aggregate particle sizes for different structures in accordance with ASTM C33 is presented in Table 4 below.
Table 4.
Permitted aggregate particle sizes according to structural types in ASTM C33.
Table 5 presents the classification of aggregates in accordance with ASTM C33 based on sieve designation and opening size. Fine aggregates are defined as materials passing the No. 4 sieve (4.75 mm), consisting of natural sand, manufactured sand, or a combination of both, with 100% of the material smaller than or equal to 4.75 mm. In contrast, coarse aggregates are identified as materials retained on the No. 4 sieve, with particle sizes greater than 4.75 mm, and typically include gravel, crushed stone, or slag. This classification provides a standardized basis for distinguishing aggregate types according to particle size distribution and material characteristics. In Table 5 below, the distinction between coarse and fine aggregates according to ASTM C33 has been made.
Table 5.
Fine and coarse aggregate size classification according to ASTM C33.
4. Discussions
Sieving analysis is a reliable method for determining aggregate and rock gradation, but it requires labor and expert knowledge. In this context, the proposed method, which includes a fast algorithm and automatic classification methods for aggregate and rock sizes from a pile image, will provide a rapid analysis and evaluation process without requiring expertise, labor, or transportation. Furthermore, after verifying system stability by obtaining a database containing more samples, a practical application can be offered through an application. The proposed method showed significantly accurate detection success for coarse aggregates with sizes of 25.4 mm and 19 mm. It provides extraordinary convenience, particularly in the gradation analysis of port rock fills, by enabling the on-site evaluation of hundreds of tons of rock materials within large piles without the need for transportation.
One of the most significant findings of this study is that digital image processing-based gradation determination and size estimation methods provide high accuracy and reliability, particularly for large-sized rock fragments and coarse aggregates. Another advantage of the method is that it has a well-optimized algorithm that consumes minimal time and resources. This design allows the software to run very quickly, yielding results in addition to accurately identifying aggregate classes. It provides results very quickly in as little as a few seconds. The results show that image-based approaches achieve successful results, especially when applied to coarse-grained materials. Considering all the advantages, it can be said that the proposed method generally performs better than traditional methods such as sieve analysis, which are time-consuming, labor-intensive, and costly. This advantage becomes more pronounced for large-volume rock materials that are difficult or practically impossible to process using traditional mechanical sieving techniques. Consequently, the proposed methodology offers a substantial engineering benefit in terms of practicality and efficiency.
Based on the obtained results, further studies focusing on the estimation of the size and distribution of very large and massive rock fragments are strongly recommended. The findings suggest that digital image processing techniques have significant potential for application in large-scale engineering projects, such as harbor structures employing massive rock fills, rockfill dams, and bridge or viaduct constructions, where large cross-sections and coarse aggregates are commonly used. In such applications, the proposed method can play a rapid and effective role in determining material gradation, thereby contributing to improved material supply management, quality control, and on-site inspection processes. The adoption of this approach is expected to yield considerable benefits in terms of both time savings and operational efficiency.
To validate the performance and robustness of the image processing approach in gradation analysis, six distinct aggregate mixtures with varying particle size distributions were intentionally examined in this study. These mixtures included L (large-1), M (medium-2), S (small-3), LS (large–small-4), LM (large–medium-5), and LMS (large–medium–small-6). For each mixture, images were captured from two different camera angles and subsequently analyzed. This deliberate experimental design aimed to assess the capability of the proposed method to accurately identify gradation distributions under varying perspectives, thereby confirming the stability and consistency of the image-based analysis.
The OTSU thresholding method constituted a core component of the image processing workflow employed in this research. By automatically determining an optimal threshold value based on the image histogram, the OTSU method eliminates operator dependency and ensures objective and repeatable segmentation results. This characteristic represents a major advantage, particularly in applications involving large datasets and automated analysis procedures. Furthermore, the low computational cost and the absence of user-defined parameters enhance the method’s practicality and suitability for real-world engineering applications.
Despite these advantages, certain limitations of the OTSU method should also be acknowledged. The method’s performance may deteriorate under non-uniform lighting conditions, strong shadow effects, or low image contrast. Additionally, for complex images exhibiting multimodal histogram distributions, the use of a single global threshold may result in the misclassification of certain particle sizes. To address these limitations, future studies could integrate OTSU thresholding with adaptive thresholding techniques or machine learning-based segmentation approaches, which may further enhance classification accuracy and robustness.
Overall, the results of this study clearly demonstrate that digital image processing combined with OTSU-based thresholding represents an efficient, rapid, and reliable approach for gradation determination, particularly in engineering applications involving coarse aggregates and large rock materials. The proposed methodology shows strong potential for broader implementation in large-scale civil and geotechnical engineering practices, offering significant advantages in terms of accuracy, operational efficiency, and practical applicability.
5. Conclusions
Considering the ongoing demand for up-to-date, consistent, and highly reliable techniques for the effective characterization of complex and large aggregate piles, this study investigated six samples with different particle size distribution ratios. Sample 1 exhibited the coarsest grain distribution, Sample 2 represented a medium gradation, and Sample 3 consisted predominantly of finer particles. Subsequently, Samples 4, 5, and 6 were prepared by combining these three primary samples in different proportions. The gradation characteristics of all samples were determined through conventional laboratory sieve analysis and used as reference benchmarks.
For the image-based analysis, advanced preprocessing and segmentation techniques were implemented to improve detection performance and boundary clarity. The Contrast-Limited Adaptive Histogram Equalization (CLAHE) algorithm was applied to enhance local contrast and increase the visibility of particle edges, particularly in areas affected by uneven illumination. Following contrast enhancement, the Otsu thresholding method was employed for automatic segmentation, enabling objective separation of aggregate particles from the background based on grayscale intensity distributions. The integration of these two methods significantly improved edge definition and reduced segmentation ambiguity.
Each sample was uniformly spread on a flat surface to minimize excessive particle overlap and was photographed separately in both vertical and horizontal orientations under controlled imaging conditions. The two sets of images were analyzed independently in order to assess the consistency and robustness of the proposed image processing framework with respect to changes in orientation and perspective. The comparative analysis revealed a strong agreement between the digital image-based results and the laboratory sieve analysis data, demonstrating that the method provides reliable gradation estimates across aggregates of varying sizes.
Key findings of the study include:
- The combined use of CLAHE and Otsu thresholding enabled highly consistent and reproducible segmentation of aggregate particles, significantly improving boundary detection quality.
- The proposed approach demonstrated a high level of performance for larger aggregate sizes, while showing comparatively lower—but still practically acceptable—performance for smaller particle fractions. This behavior is consistent with the inherent challenges in detecting finer particles due to resolution limitations and particle overlap.
- The method produced largely similar results across vertical and horizontal image orientations, indicating strong repeatability and robustness against changes in viewing angle and illumination.
- The outcomes of the digital image-based analysis were in close alignment with experimental sieve analysis results, confirming the method’s validity when compared to a standard reference technique.
- Overall, the approach proved to be reliable, time-efficient, and cost-effective, making it suitable for practical applications such as reinforced concrete production and port fill rock classification involving coarse aggregates, particularly under controlled imaging conditions.
Author Contributions
Conceptualization, M.K. and D.M.; methodology, M.K. and T.P.; software, M.K. and T.P.; validation, T.P. and M.K.; formal analysis, M.K. and T.P.; investigation, M.K.; resources, M.K. and T.P.; data curation, M.K.; writing—original draft preparation, M.K. and T.P.; writing—review and editing, M.K.; visualization, D.M.; supervision, M.K. and D.M. All authors have read and agreed to the published version of the manuscript.
Funding
This research received no external funding.
Data Availability Statement
The experimental data is available upon request.
Acknowledgments
The authors are grateful to Zonguldak Bulent Ecevit University and the Technical University of Berlin for sample preparation, experiments and analysis.
Conflicts of Interest
The authors declare no conflicts of interest.
References
- Xiao, Y.; Peng, Y.; Wang, M.; Ning, Y.; Zhou, Y.; Kong, K.; Long, Y. A Novel Method for Predicting Coarse Aggregate Particle Size Distribution Based on Segment Anything Model and Machine Learning. Constr. Build. Mater. 2024, 429, 136429. [Google Scholar] [CrossRef] [Scilit]
- Schack, T.; Coenen, M.; Haist, M. Digital Slump Flow: Image-Based Assessment of Fresh Concrete Homogeneity as Part of the Slump Flow Test. Case Stud. Constr. Mater. 2024, 21, e03973. [Google Scholar] [CrossRef] [Scilit]
- Elseifi, M.A.; Sarkar, M.T.A.; Paudel, R.; Abohamer, H.; Mousa, M.R. A Machine Learning–Based Framework for Predicting Pavement Roughness and Aggregate Segregation during Construction. J. Transp. Eng. Part B Pavements 2024, 150, 04024029. [Google Scholar] [CrossRef] [Scilit]
- Gizdavec, N.; Gašparović, M.; Miko, S.; Lužar-Oberiter, B.; Ilijanić, N.; Peh, Z. Discrimination of Rock Units in Karst Terrains Using Sentinel-2A Imagery. Remote Sens. 2022, 14, 5169. [Google Scholar] [CrossRef] [Scilit]
- Bakour, A.; Ben Ftima, M. Investigation of Fracture Properties and Size Effects of Mass Concrete Using Wedge Splitting Tests on Large Specimens. Eng. Fract. Mech. 2022, 259, 108144. [Google Scholar] [CrossRef] [Scilit]
- Tan, X.; Hu, Z.; Li, W.; Zhou, S.; Li, T. Micromechanical Numerical Modelling on Compressive Failure of Recycled Concrete Using Discrete Element Method (DEM). Materials 2020, 13, 4329. [Google Scholar] [CrossRef] [Scilit]
- Huang, R.; Yang, S.; Liu, T.; Gong, G. Determination of J-Integral of Asphalt Concrete Based on SC(B) Test Configuration and Image Analysis. Constr. Build. Mater. 2020, 248, 118727. [Google Scholar] [CrossRef] [Scilit]
- Kim, J.; Park, B.-S.; Woo, S.I.; Choi, Y.-T. Evaluation of Ballasted-Track Condition Based on Aggregate-Shape Characterization. Constr. Build. Mater. 2020, 232, 117082. [Google Scholar] [CrossRef] [Scilit]
- Fung, J.; Hoang, S. Computational Assessment of an Effective-Sphere Model for Characterizing Colloidal Fractal Aggregates with Holographic Microscopy. J. Quant. Spectrosc. Radiat. Transf. 2019, 236, 106591. [Google Scholar] [CrossRef] [Scilit]
- Asensi, E.; Zambrano, D.; Alemany, E.; Aguado, D. Effect of the Addition of Precipitated Ferric Chloride on the Morphology and Settling Characteristics of Activated Sludge Flocs. Sep. Purif. Technol. 2019, 227, 115711. [Google Scholar] [CrossRef] [Scilit]
- Komačka, J.; Budjačová, E.; Remišová, E. Colour-Histogram-Based Assessment Procedure of the Rolling Bottle Test Considering the Drawbacks in the Digital Image Analysis of Bitumen–Aggregate Systems. Mater. Struct. 2019, 52, 59. [Google Scholar] [CrossRef] [Scilit]
- Wu, B.; Liu, C.; Wu, Y. Compressive Behaviors of Cylindrical Concrete Specimens Made of Demolished Concrete Blocks and Fresh Concrete. Constr. Build. Mater. 2014, 53, 118–130. [Google Scholar] [CrossRef] [Scilit]
- Yang, J.; Chen, S. An Online Detection System for Aggregate Sizes and Shapes Based on Digital Image Processing. Mineral. Petrol. 2017, 111, 135–144. [Google Scholar] [CrossRef] [Scilit]
- Maerz, N.H. Technical and Computational Aspects of the Measurement of Aggregate Shape by Digital Image Analysis. J. Comput. Civ. Eng. 2004, 18, 10–18. [Google Scholar] [CrossRef] [Scilit]
- Sinecen, M.; Topal, A.; Makinaci, M.; Baradan, B. Neural Network Classification of Aggregates by Means of Line Laser Based 3D Acquisition. Expert Syst. 2013, 30, 333–340. [Google Scholar] [CrossRef] [Scilit]
- Moon, K.H.; Cannone Falchetto, A.; Wistuba, M.P.; Jeong, J.H. Analyzing Aggregate Size Distribution of Asphalt Mixtures Using Simple 2D Digital Image Processing Techniques. Arab. J. Sci. Eng. 2015, 40, 1309–1326. [Google Scholar] [CrossRef] [Scilit]
- Arasan, S.; Yenera, E.; Hattatoglu, F.; Hinislioglua, S.; Akbuluta, S. Correlation between Shape of Aggregate and Mechanical Properties of Asphalt Concrete: Digital Image Processing Approach. Road Mater. Pavement Des. 2011, 12, 239–262. [Google Scholar] [CrossRef] [Scilit]
- Cui, P.; Wu, S.; Xiao, Y.; Wang, F.; Wang, F. Quantitative Evaluation of Active Based Adhesion in Aggregate-Asphalt by Digital Image Analysis. J. Adhes. Sci. Technol. 2019, 33, 1544–1557. [Google Scholar] [CrossRef] [Scilit]
- Mora, C.F.; Kwan, A.K.H.; Chan, H.C. Particle size distribution analysis of coarse aggregate using digital image processing. Cem. Concr. Res. 1998, 28, 921–932. [Google Scholar] [CrossRef] [Scilit]
- Meddah, M.S.; Zitouni, S.; Belâabes, S. Effect of Content and Particle Size Distribution of Coarse Aggregate on the Compressive Strength of Concrete. Constr. Build. Mater. 2010, 24, 505–512. [Google Scholar] [CrossRef] [Scilit]
- Denis, A.; Attar, A.; Breysse, D.; Chauvin, J.J. Effect of Coarse Aggregate on the Workability of Sandcrete. Cem. Concr. Res. 2002, 32, 701–706. [Google Scholar] [CrossRef] [Scilit]
- Ashman, M.R.; Hallett, P.D.; Brookes, P.C. Are the Links between Soil Aggregate Size Class, Soil Organic Matter and Respiration Rate Artefacts of the Fractionation Procedure? Soil Biol. Biochem. 2003, 35, 435–444. [Google Scholar] [CrossRef] [Scilit]
- Pei, L.; Yu, T.; Yuan, H.; Li, W.; Li, Y.; Hao, X. Aggregate Weight Prediction Based on Two-Dimensional Image Feature Extraction. IOP Conf. Ser. Earth Environ. Sci. 2021, 668, 012069. [Google Scholar] [CrossRef] [Scilit]
- Zhang, D.; Huang, X.; Zhao, Y. Investigation of the Shape, Size, Angularity and Surface Texture Properties of Coarse Aggregates. Constr. Build. Mater. 2012, 34, 330–336. [Google Scholar] [CrossRef] [Scilit]
- Sun, Z.; Wang, C.; Hao, X.; Li, W.; Zhang, X. Quantitative Evaluation for Shape Characteristics of Aggregate Particles Based on 3D Point Cloud Data. Constr. Build. Mater. 2020, 263, 120156. [Google Scholar] [CrossRef] [Scilit]
- Tang, Y.; Wang, Y.; Si, G. Vision-Based Size Distribution Analysis of Rock Fragments Using Multi-Modal Deep Learning and Interactive Annotation. Autom. Constr. 2024, 159, 105276. [Google Scholar] [CrossRef] [Scilit]
- Bianconi, F.; Di Maria, F.; Micale, C.; Fernández, A.; Harvey, R.W. Grain-Size Assessment of Fine and Coarse Aggregates through Bipolar Area Morphology. Mach. Vis. Appl. 2015, 26, 775–789. [Google Scholar] [CrossRef] [Scilit]
- Sitzia, F.; Beltrame, M.; Mirão, J. The Particle-Size Distribution of Concrete and Mortar Aggregates by Image Analysis. J. Build. Pathol. Rehabil. 2022, 7, 74. [Google Scholar] [CrossRef] [Scilit]
- Zhou, Y.; Zhou, H.; Chen, T.; Hu, C.; Liang, Z.; Zhao, C.; Wang, F. Detection of Rockfill Gradation Based on Video Image Recognition. Autom. Constr. 2023, 154, 104965. [Google Scholar] [CrossRef] [Scilit]
- Wang, W.; Li, C.; Zhao, X.; Song, P.; Li, J.; Zheng, J.; Bu, S.; Wang, X. An Image-Based Method for Evaluating Changes in Particle Size and Morphology Distributions of Aggregate Materials after Vibratory Compaction Test. Constr. Build. Mater. 2024, 430, 136483. [Google Scholar] [CrossRef] [Scilit]

Disclaimer/Publisher’s Note: The statements, opinions and data contained in all publications are solely those of the individual author(s) and contributor(s) and not of MDPI and/or the editor(s). MDPI and/or the editor(s) disclaim responsibility for any injury to people or property resulting from any ideas, methods, instructions or products referred to in the content. |
© 2026 by the authors. Licensee MDPI, Basel, Switzerland. This article is an open access article distributed under the terms and conditions of the Creative Commons Attribution (CC BY) license.