


Abstract
This study systematically investigates the effects of rope length, lifting position, and load on the dynamic behavior and wind-induced fatigue life of flat-jib tower cranes. Firstly, natural frequencies of a representative crane (40 m tower, 66 m jib) were accurately identified via on-site stress measurements. Subsequently, a finite element model was developed to analyze free vibration characteristics under various operational conditions. Fluctuating along-wind loads were simulated using harmonic synthesis, and transient dynamic analysis provided the wind-induced response. Finally, fatigue life of critical components was assessed through rain-flow counting, S–N curves per Chinese and European standards, and Miner’s linear damage rule. The results indicate that the first-order natural frequency in the along-wind direction decreases by approximately 12.5% and 14.2% with increasing lifted load and rope length, respectively, while the frequency at the jib tip is reduced by up to 37% compared to that at the jib root. Structural responses are more pronounced in the along-wind direction, predominantly exciting the first-order mode. Under operational conditions, stress in the jib’s main chord increases by approximately 30% to 50%, whereas stress fluctuations in other jib sections remain minimal. The fatigue life of tower crane components decreases by 13% to 21% relative to the unloaded state, with rope length exerting a greater influence than lifting load magnitude.
1. Introduction
Tower cranes [1] are extensively utilized in building construction, port and shipyard operations, bridge engineering, and wind energy projects [2] owing to their superior stability, broad operational range, and versatile functionality. Due to their tall and lightweight structures, tower cranes are highly susceptible to wind loads, which can induce considerable structural vibrations and compromise overall stability [3]. Under extreme wind conditions, they become particularly prone to wind-induced damage or even structural failure, as evidenced by the frequent occurrence of wind-related accidents. Such incidents pose significant threats to construction safety and project schedules, frequently resulting in substantial economic losses and human casualties [4,5,6]. The risk of structural instability may be further exacerbated by improper configurations of key operational parameters, such as lifting load, hoisting rope length, and lifting position during crane operations. The flat-jib tower crane combines a horizontal jib with a trolley-based luffing mechanism, offering distinct advantages such as a wide operating range, high positioning accuracy, and superior operational efficiency. Owing to these benefits, it has become one of the most commonly employed tower crane types in contemporary construction projects. A thorough investigation of how system parameters influence the dynamic behavior and wind-induced response of flat-jib tower cranes, along with an understanding of their fatigue damage patterns under complex operating conditions, is essential for accurately assessing potential risks.
Wind-induced response analysis of tower cranes provides essential theoretical support for risk assessment, structural optimization, and safety management. It enhances wind resistance and operational reliability, thereby ensuring structural safety during service. To analyze wind-induced responses, researchers typically employ field measurements, wind tunnel tests, numerical simulations, or integrated approaches that combine multiple methods to evaluate dynamic behavior under wind loading comprehensively. Li et al. [7] developed an IoT-based intelligent monitoring system for tower cranes and utilized field data to predict maximum structural displacement. Their results revealed a response delay under strong wind conditions during idle states, with peak displacement occurring after the maximum wind speed. Tomczyk et al. [8] developed a state simulator for tower cranes to enable real-time monitoring of operational status. They performed simulation analyses on load handling, positioning accuracy, and dynamic compensation under disturbance conditions. Lu et al. [3,9] combined numerical simulations and wind tunnel experiments to investigate the dynamic response of tower cranes under synthesized fluctuating wind speed profiles. They analyzed the effects of wind velocity, operating conditions, and overload during various construction stages, emphasizing the structure’s susceptibility to complex wind environments. Liu et al. [10] utilized a 3D numerical wind tunnel model to investigate aerodynamic load variations under varying wind directions. Wind speed time histories were generated via a linear filtering method, followed by a transient finite element analysis. Their results demonstrated that increases in tower crane height and jib length significantly amplify wind load effects. He et al. [11] conducted numerical simulations to evaluate the crane’s response under both operational conditions and tornado events, effectively assessing its safety against tornado-induced loads. Liu et al. [12] constructed a random function of correlated spectral parameters using multiple independent random variables. They applied the probability density evolution method to evaluate the stochastic response and reliability of wind-induced vibrations in tower cranes. Wang et al. [13] developed a finite element model of the side tower and employed CFD to investigate along-wind force coefficients across different aerodynamic cross-sections. They further analyzed the oscillation behavior and comfort level of the tower crane system. Chen et al. [14] utilized CFD to calculate wind load coefficients and analyze the dynamic response of tower crane components. Their results showed that maximum displacement and stress typically occurred on the windward side, with the first-order mode prominently excited at the jib–platform junction. Wu et al. [15] integrated high-frequency force balance tests with CFD to assess wind loads and dynamic responses, revealing that shielding and turbulence effects can mitigate peak loads. They emphasized the necessity of considering aerodynamic interference in structural design. Compared to wind tunnel tests and field measurements, numerical simulations provide cost- and time-efficient alternatives without the limitations of equipment or site availability. They facilitate rapid scenario modeling, flexible parameter adjustments, and detailed analyses of tower crane dynamics under complex wind conditions. With high repeatability and scalability, numerical methods are well-suited for evaluating crane responses in intricate wind environments.
Tower cranes, characterized by their slender and tall structures, are particularly vulnerable to cyclic wind loading. Consequently, fatigue life assessment is critical to ensuring their long-term operational safety. Previous research has predominantly focused on evaluating crane fatigue performance through field measurements and numerical simulations. Pástor et al. [16] estimated the remaining fatigue life of a bridge crane’s main girder using strain measurements from multiple critical locations. Wei et al. [17] combined field monitoring with stress spectrum analysis to predict fatigue life in localized crack regions. Xi et al. [18] developed a long-term fatigue evaluation approach integrating dynamic strain monitoring with ultimate load extrapolation techniques. Jiang et al. [19] developed a finite element model of a tower crane and performed fatigue life analysis using S–N curves. Yang et al. [20] constructed a virtual prototype of an overhead crane and established predictive models for fatigue damage and the service life of the main girder. Dong et al. [21] applied a support vector regression algorithm to derive the equivalent fatigue load spectrum and utilized the Forman model to predict the jib’s fatigue life. Additionally, Hectors et al. [22] systematically assessed the fatigue performance of overhead crane girders through the hot spot stress method combined with fracture mechanics analysis. Wind-induced vibration is a primary contributor to fatigue damage in slender structures; however, existing research has predominantly concentrated on wind turbines and transmission towers. Tao et al. [23] assessed the fatigue life of wind turbine towers by incorporating wind speed and turbulence intensity, utilizing the engineering stress method coupled with Miner’s fatigue damage theory. Fu et al. [24] investigated fatigue damage in wind turbine tower flanges and bolts by accounting for variations in wind speed and direction through the rain flow counting method. Ribeiro et al. [25] applied simulated wind loads to lattice steel towers and performed fatigue damage analysis. Rong et al. [26] evaluated the fatigue life of transmission towers under wind loading by considering the statistical distribution of wind speed and direction, employing the rain flow counting method combined with Miner’s rule. In summary, despite considerable advancements in fatigue life assessment of cranes and wind turbine towers, research focusing on the fatigue life of tower cranes under wind loading remains limited. In particular, the influence of operational parameters—such as lifted load, hoisting rope length, and lifting position—has yet to be thoroughly investigated.
As a complex multi-body coupled dynamic system, the interaction between the hoisting rope, lifting load, and tower crane structure significantly impacts the system’s vibration response and load oscillation characteristics [27]. Based on the principle of energy conservation and the Lagrange equation, Xin et al. [28] developed a dynamic model of the main beam of a ladle crane. Their study revealed the influence of parameters such as trolley speed and rope length on the amplitudes of both the main beam and load oscillations. Ye et al. [29] developed a coupled dynamic model of a tower crane jib and a moving distributed mass using analytical methods, elucidating the interaction mechanisms among jib deflection, load oscillation, and torsional behavior. Liu et al. [30] developed a dynamic model incorporating the coupled motions of lifting, slewing, and jib elevation. They systematically analyzed the effects of key parameters—such as effective payload mass, rope length, and initial jib angle—on the dynamic response. Feng et al. [31] employed a cantilever beam model to derive the dynamic equations governing the load–trolley–jib system and conducted an in-depth investigation into the effects of load mass and rope length on jib vibrations and load oscillations. Tong et al. [32] developed a coupled vibration model of a flat-jib tower crane and its load under jib elevation conditions, based on Euler–Bernoulli beam theory and the Lagrange equation. They further elucidated the influence mechanisms of load mass and rope length on the oscillatory behavior of the load. He [33] simplified the overhead crane as a supported beam model with distributed mass. He conducted an in-depth investigation into the effects of effective payload mass and pendulum length on vertical vibrations, using both numerical simulations and experimental validation. Rauscher et al. [34] performed an elastoplastic dynamic analysis of tower cranes via the finite element method, accounting for the dynamic coupling among the structural components, load motion, and hoisting rope. While specific studies have highlighted the effects of parameters such as hoisting rope length and lifted load on the dynamic behavior of tower cranes, the majority of existing research depends on overly simplified dynamic models. The jib is commonly modeled as an Euler–Bernoulli beam, whereas a simple pendulum model often represents the flexible hoisting rope and load system. These models inadequately represent the modal coupling between the hoisting system and the jib’s bending vibrations, thereby failing to capture the complex dynamic response of tower cranes fully.
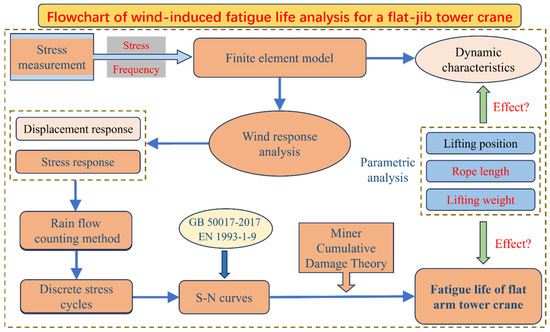
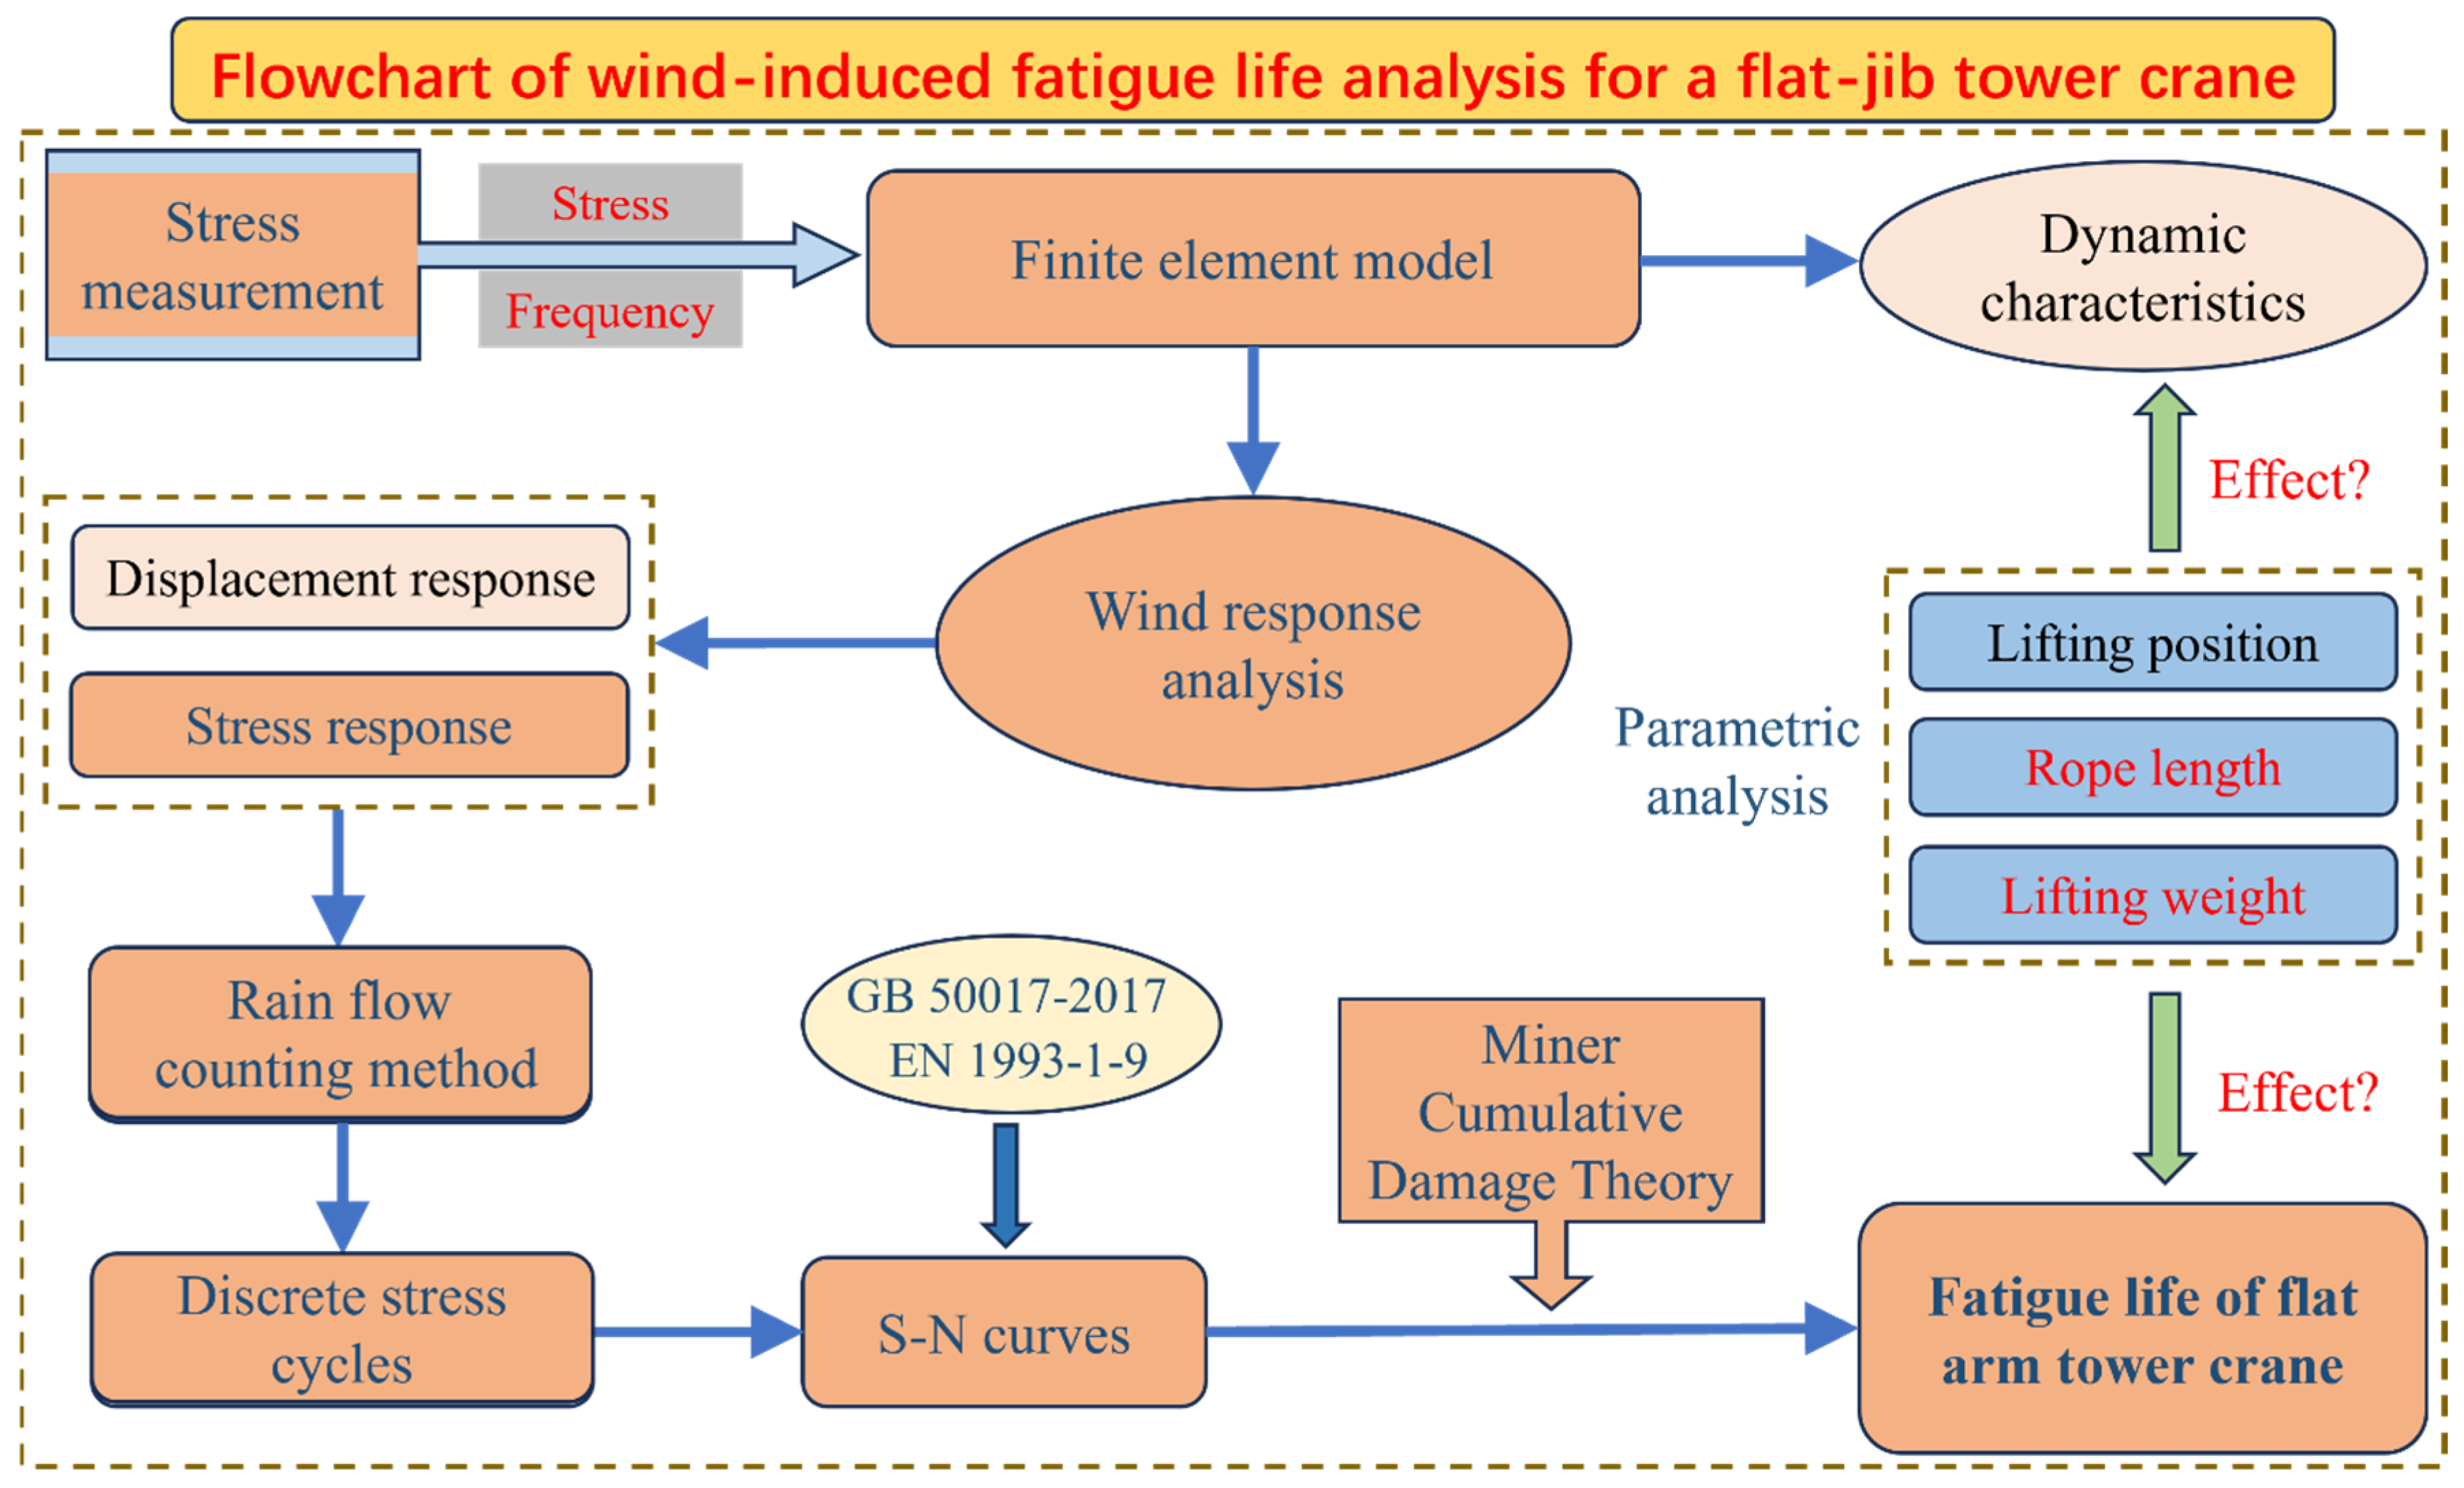
To address these challenges, this study integrates field measurements with numerical simulations to predict the wind-induced fatigue life of flat-jib tower cranes. In Section 2, stress measurements on critical crane components serve to inform and validate a finite element model. This model is then employed to systematically analyze the dynamic effects of lifted load, hoisting rope length, and lifting position. Section 3 simulates fluctuating along-wind loads to evaluate the crane’s dynamic response under extreme conditions, with a focus on the displacement and stress variations of critical components. Based on S–N curves from Chinese and European standards, fatigue damage and life are assessed in Section 4 using the rain flow counting method and Miner’s linear damage rule. The effects of lifted load and rope length on fatigue life were further examined. The overall analysis procedure is summarized in Figure 1.
Figure 1.
Flowchart of wind-induced fatigue life analysis for a flat-jib tower crane.
2. Stress Measurement and Finite Element Model of the Tower Crane
2.1. Stress Measurement of the Tower Crane
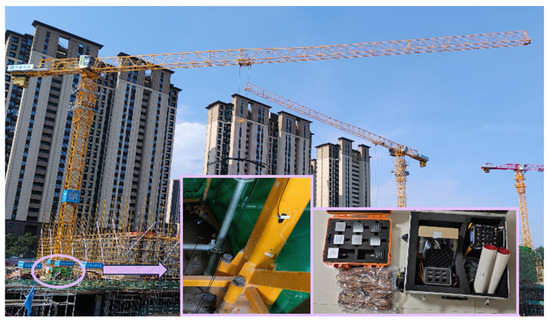
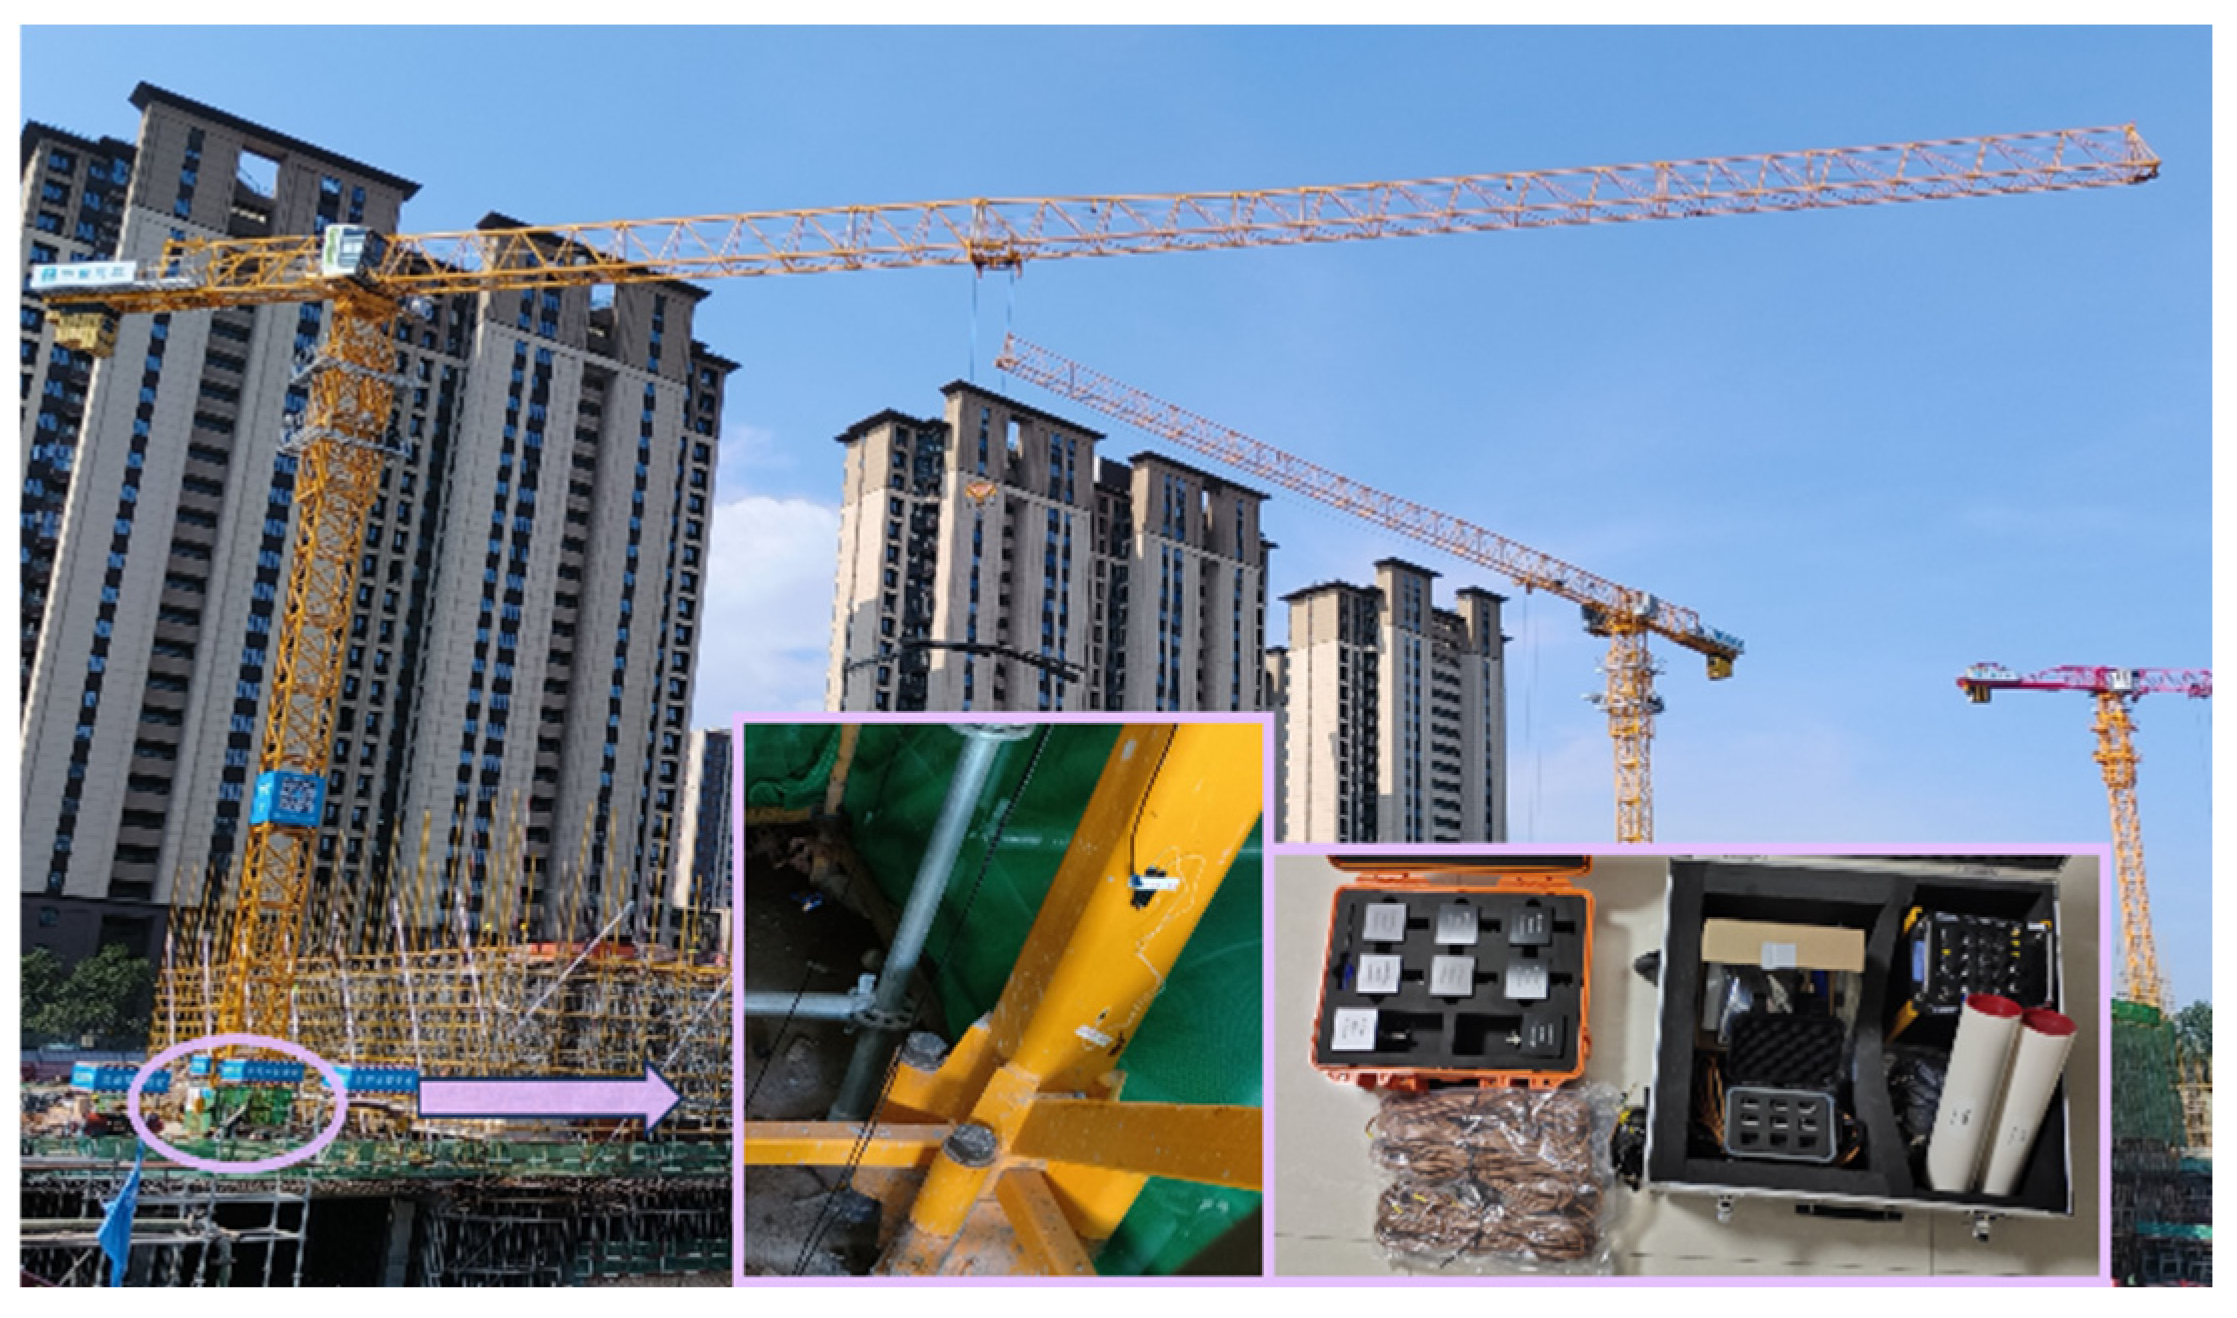
A real-time stress monitoring campaign was conducted on a flat-jib tower crane operating at the Zhongyuan Digital Industrial Park construction site in Zhengzhou, Henan Province, China. The key performance parameters of the crane are listed in Table 1. The field instrumentation primarily consisted of foil-type uniaxial resistance strain gauges and a DH5902N data acquisition and analysis system (Figure 2), developed by Jiangsu Donghua Testing Technology Co., Ltd., located in Taizhou, Jiangsu Province. The strain gauges had a nominal resistance of 119.8 ± 0.1 Ω, a gauge factor of 2.20 ± 1%, and an operational temperature range of −30 °C to 80 °C. They offered high flexibility, ease of installation, and reliable performance under demanding field conditions.
Table 1.
Main performance parameters of tower crane.
Figure 2.
On-site measurement of tower crane.
Given the complexity of field testing, the tower crane base was chosen as the monitoring location. Four strain gauges were installed on the cross-sections of four critical structural members at this site. A photograph of the experimental setup is presented in Figure 2. Before each test, the tower crane was positioned at the designated location and stabilized to ensure consistent test conditions. Stress data were subsequently collected using the dynamic signal acquisition system under various operational scenarios. A detailed summary of the test conditions is provided in Table 2.
Table 2.
Operating conditions during field testing.
2.2. Finite Element Modeling of the Tower Crane
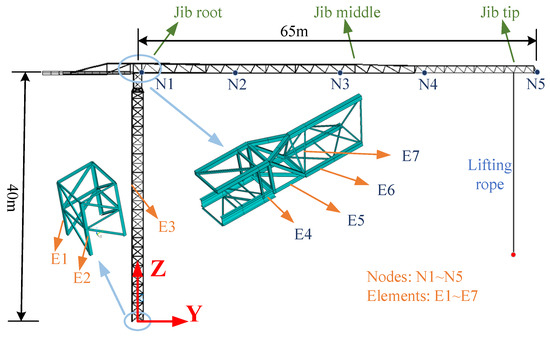
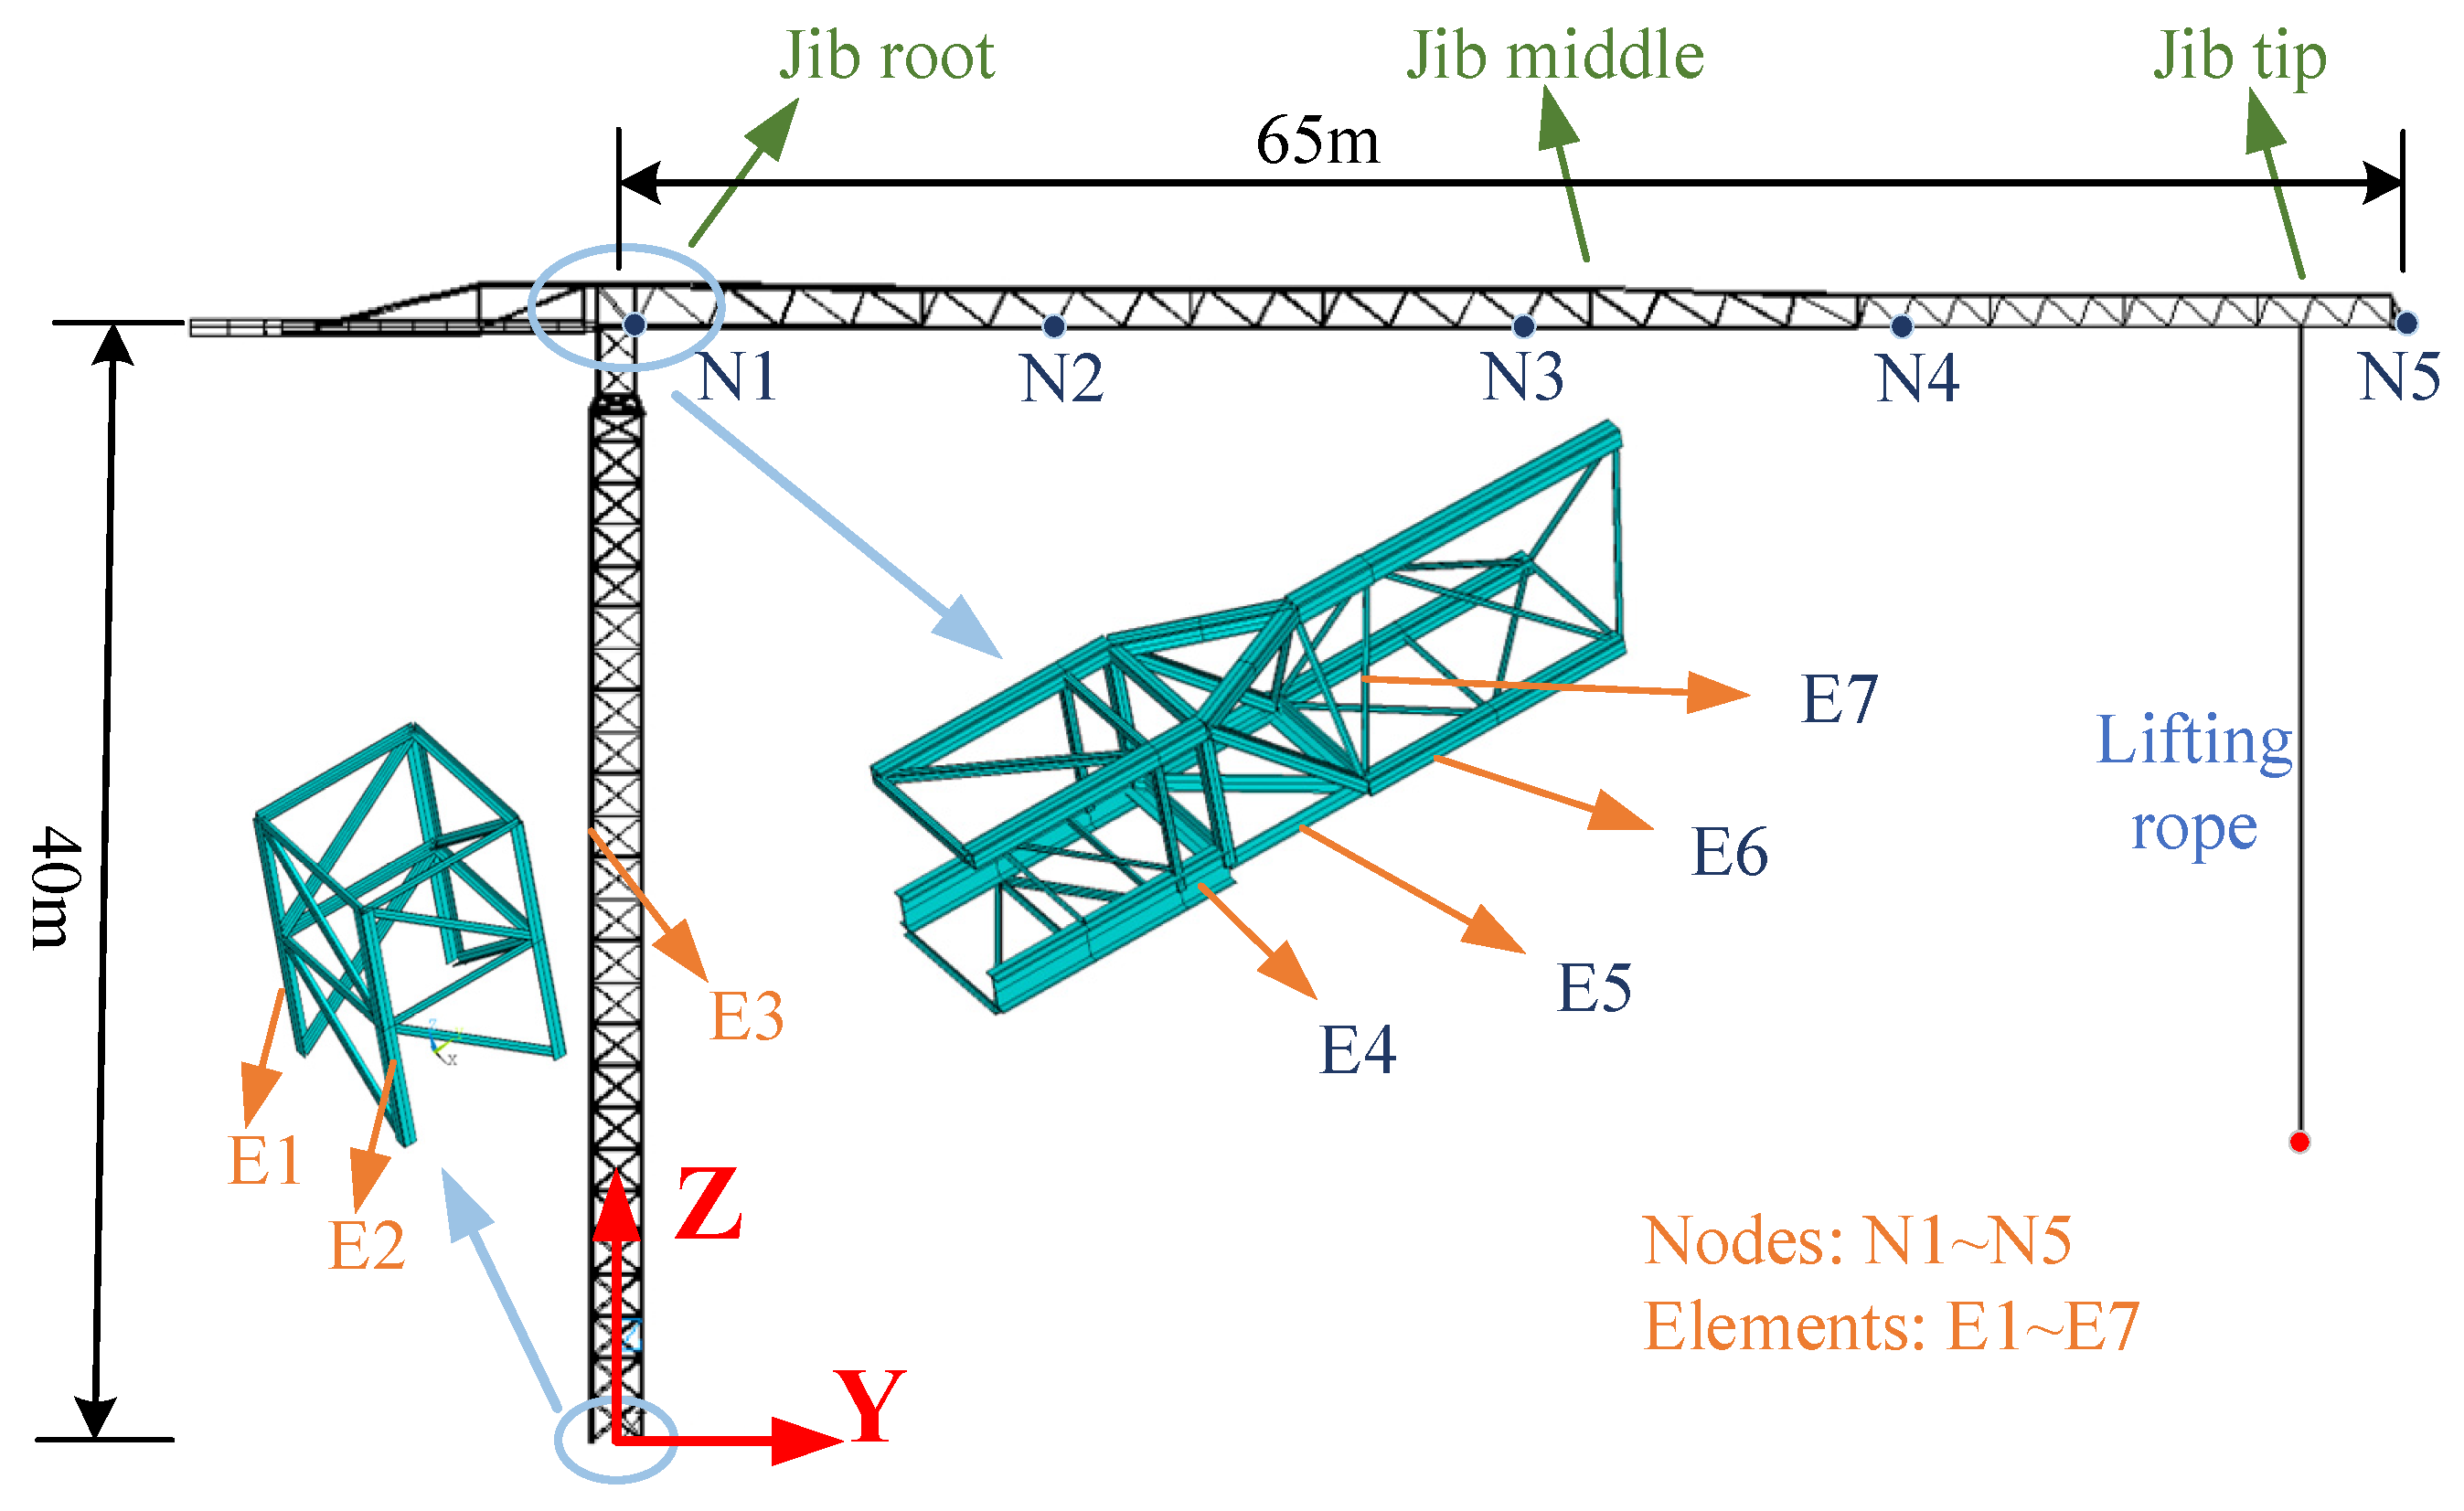
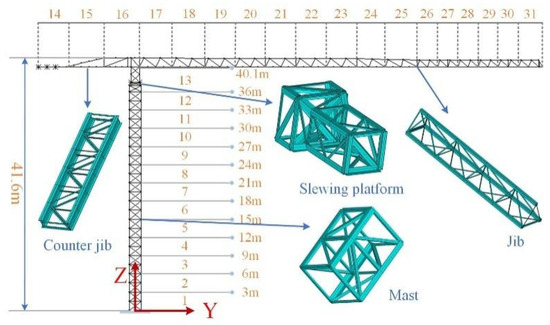
A three-dimensional finite element model of the flat-jib tower crane was developed in ANSYS. The crane structure was assumed to be composed of Q345 steel, with an elastic modulus of E = 210 GPa, Poisson’s ratio μ = 0.3, and density ρ = 7850 kg/m3. Key structural components, including the tower body, main jib, and counter-jib, were modeled using BEAM188 elements. Components with concentrated mass, such as counterweights and the slewing platform, were represented by MASS21 elements to capture their effects on the system’s dynamic characteristics accurately. The impact of secondary attachments, such as ladders, was incorporated by increasing the structural density [35]. The hoisting rope was modeled using BEAM188 elements. To represent its anisotropic mechanical behavior, an orthotropic material model was adopted: the axial elastic modulus was maintained, while the transverse modulus was set to 0.0001 times the axial value. This approach preserves the axial elastic modulus to ensure that the key load-bearing stiffness of the hoisting rope under tension/compression and bending is accurately simulated. Meanwhile, the transverse elastic modulus is artificially reduced to a negligible fraction of the axial value, thereby effectively eliminating its transverse stiffness. This efficiently replicates the realistic mechanical response of the rope. The finalized finite element model, shown in Figure 3, comprises 291 nodes and 821 elements.
Figure 3.
Finite element model of the flat-jib tower crane.
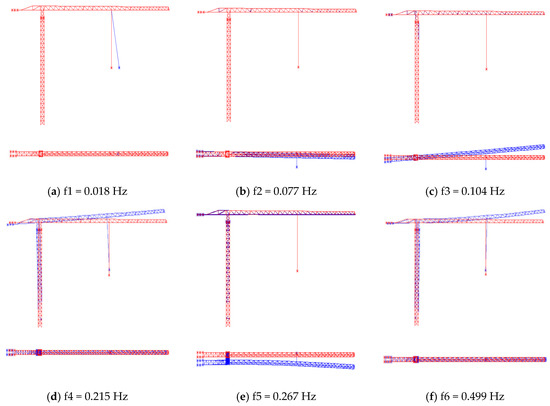
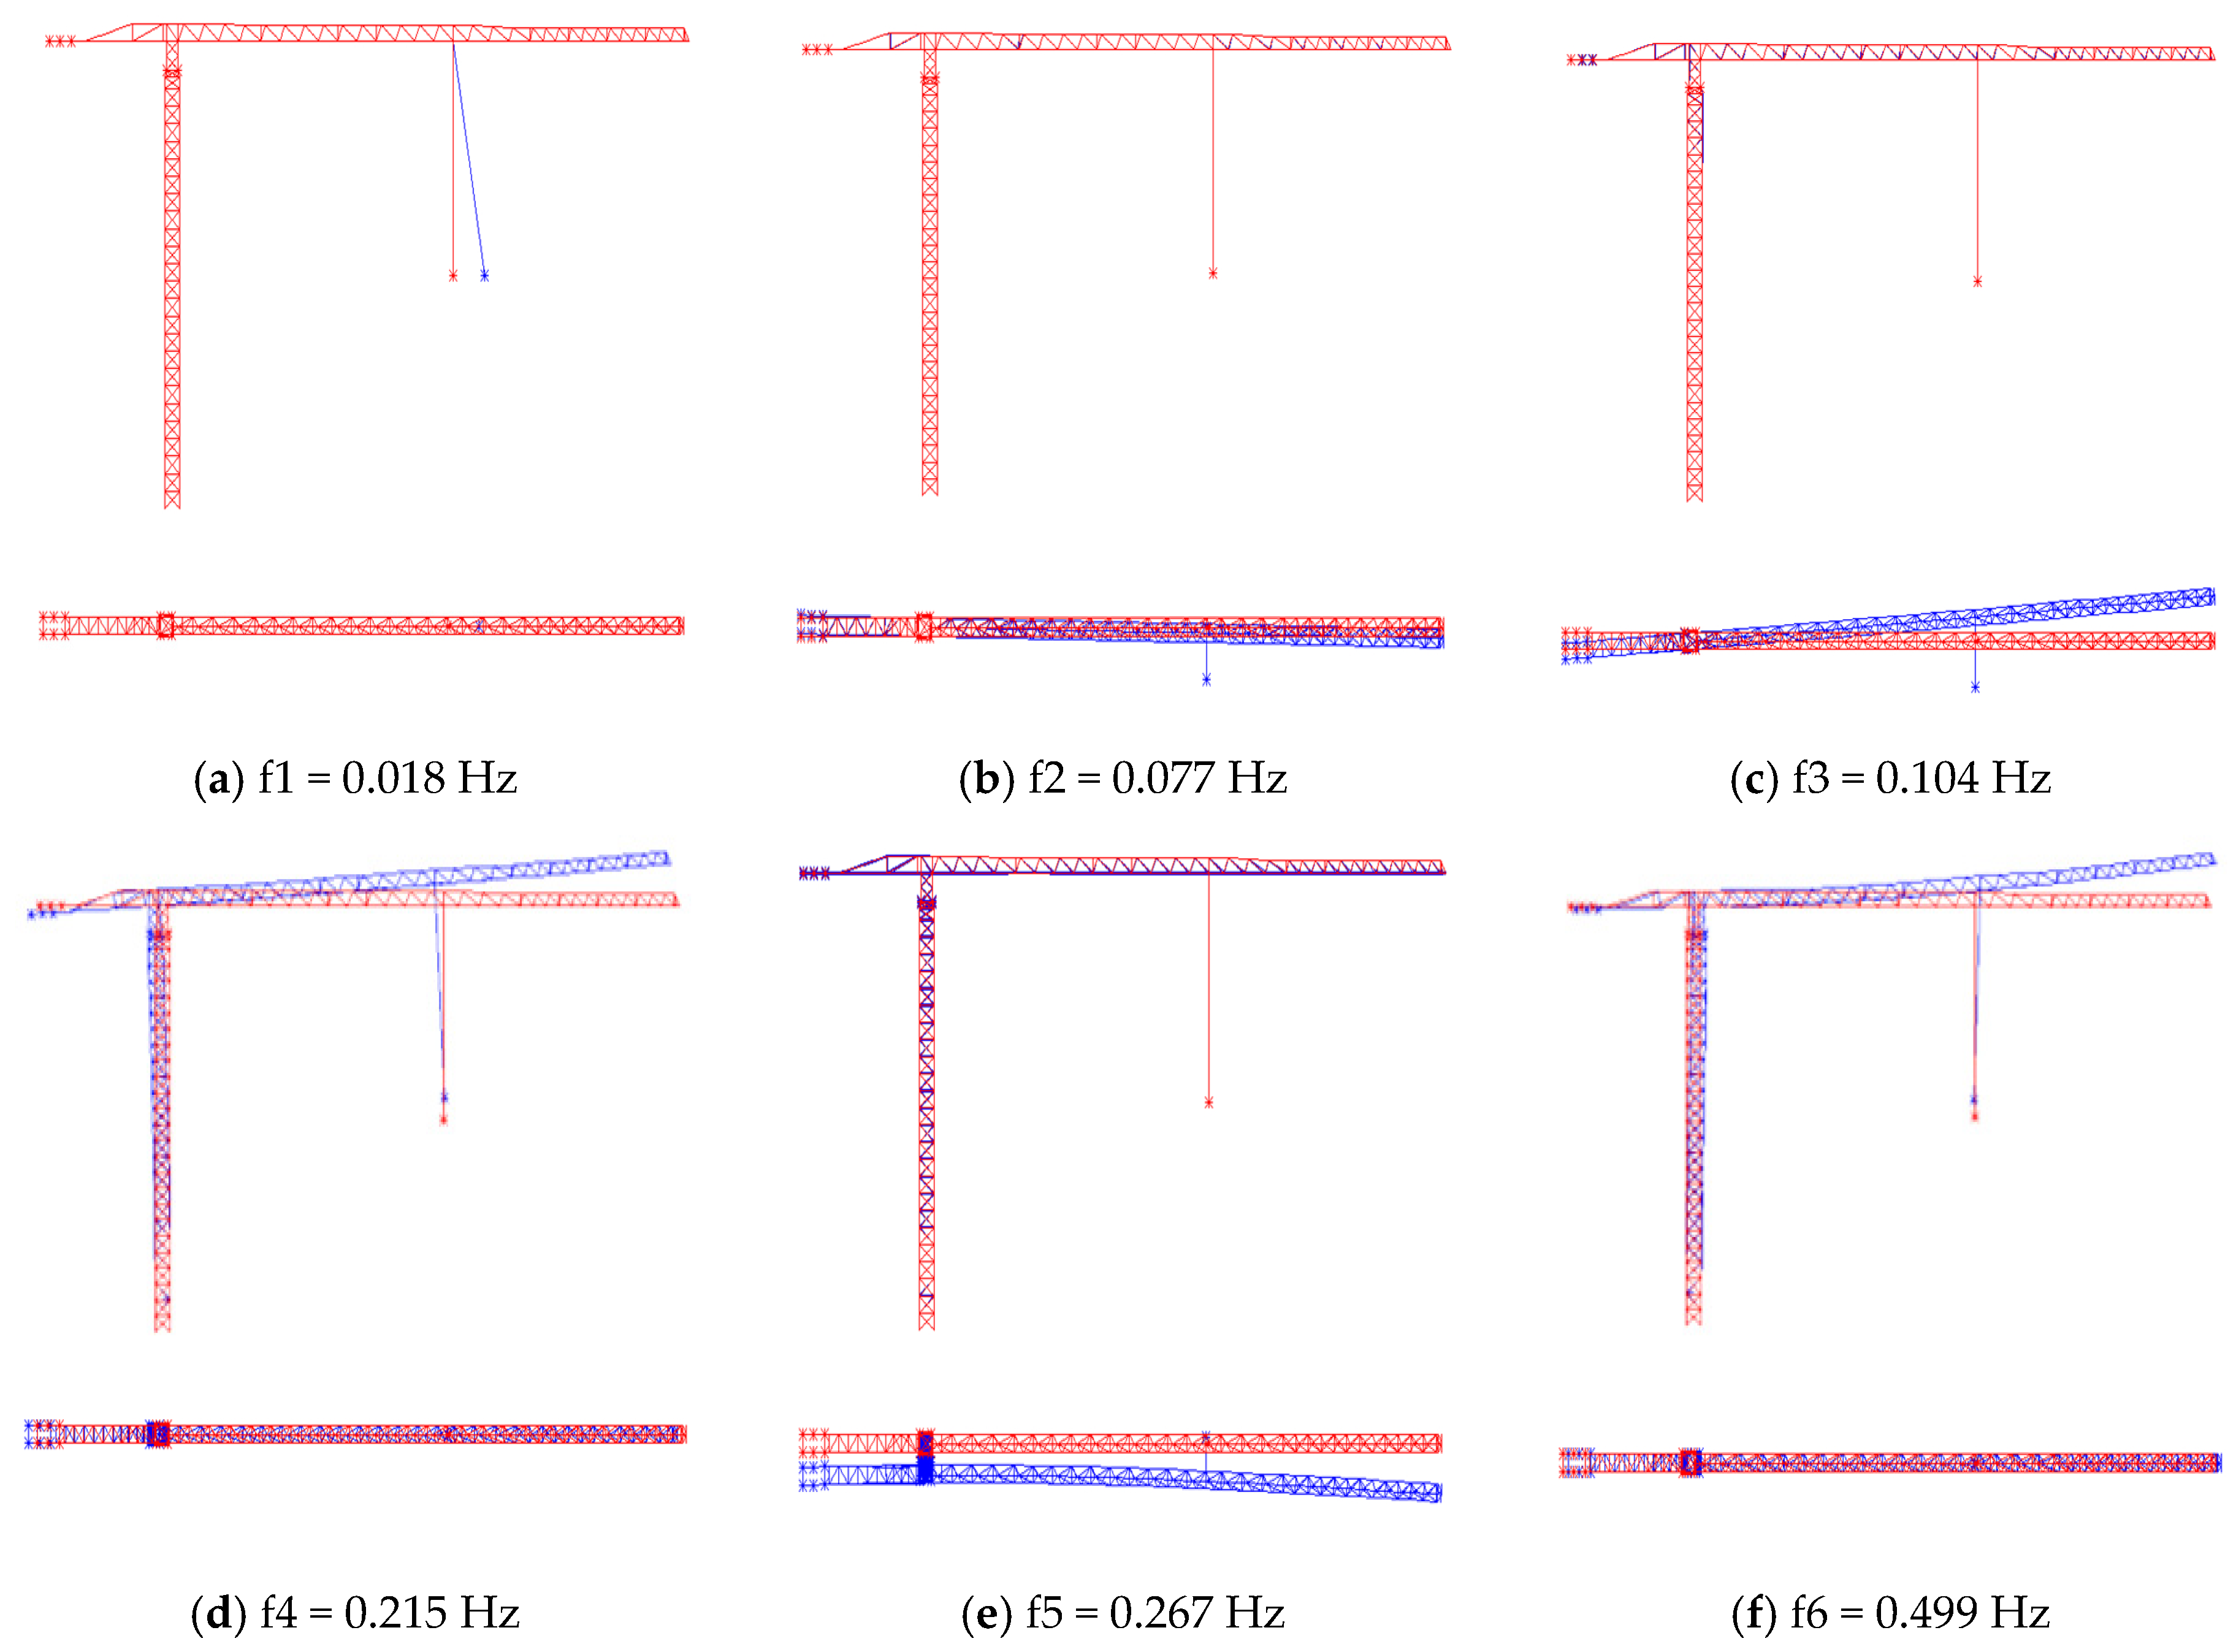
Since the low-order vibration frequencies of the tower crane are susceptible to excitation by external disturbances, the modal analysis primarily focuses on these lower-order modes to capture the global dynamic characteristics of the structure [14]. Table 3 summarizes the first eight modal frequencies under operating conditions A1 and A2, while Figure 4 depicts their corresponding mode shapes. Notably, the first two modes correspond exclusively to local vibrations of the hoisting rope and are therefore excluded from subsequent structural dynamic analyses.
Table 3.
The first eight modes of the tower crane under conditions A1 and A2.
Figure 4.
The first six natural frequencies and vibration modes of the tower crane under working condition A-1, where the undeformed structure is plotted in red and the modal deformation is superimposed in blue.
2.3. Model Validation and Comparison
2.3.1. Comparison of Natural Frequencies
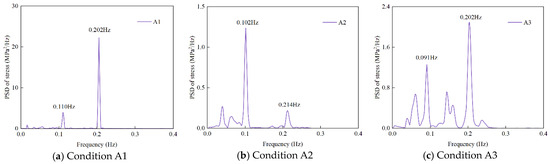
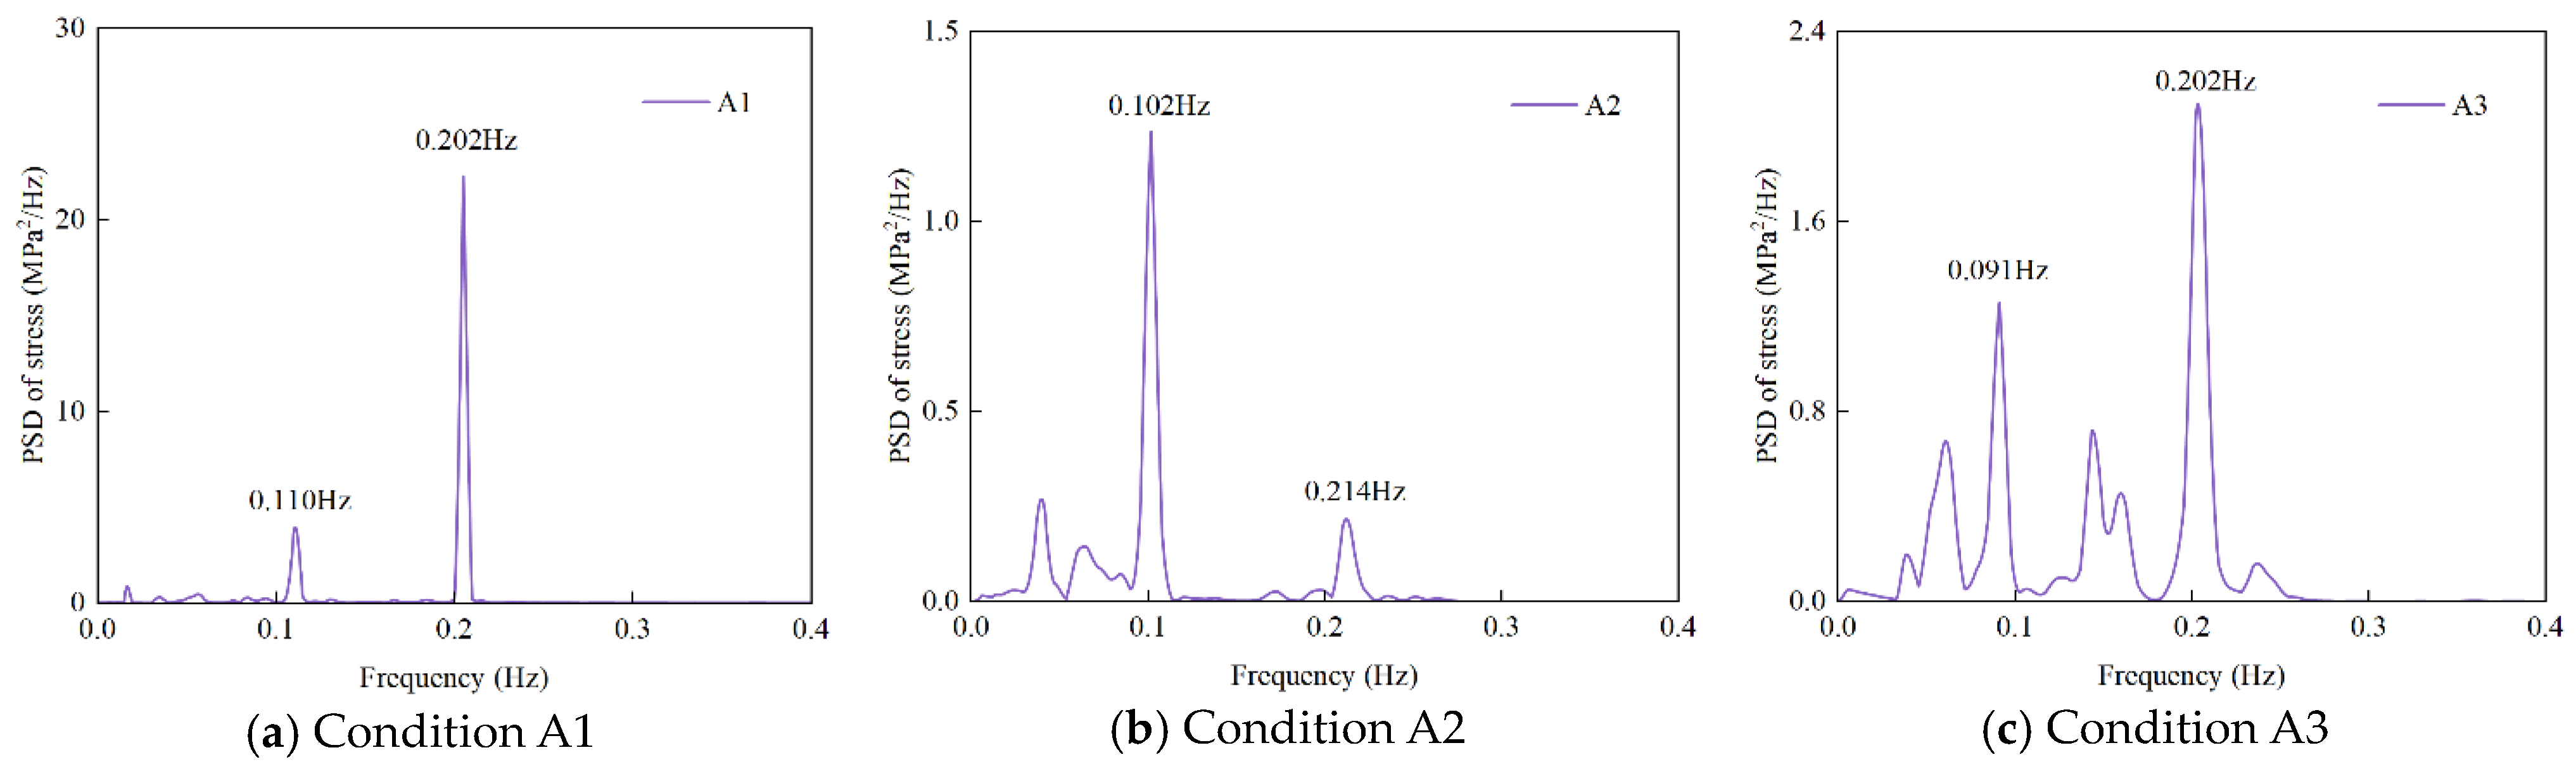
The power spectral density (PSD) analysis of root stress at the tower base under operating conditions A1, A2, and A3 revealed the frequency response characteristics of the tower crane. The corresponding PSD curves are illustrated in Figure 5. The first mode corresponds to the lateral vibration of the jib along the X-axis within the horizontal plane, representing the overall swinging motion of the crane structure. The second mode involves vertical vibration of the jib along the Z-axis, primarily induced by deformation at the tower base. The comparison of the measured and calculated values of the first two natural frequencies of the tower crane under each working condition is shown in Table 4. The results indicate a slight difference between the calculated and measured values; all discrepancies fall within an acceptable range, with errors not exceeding ±6%. The simulation results show a high level of consistency with the measured results, accurately reflecting the tower crane’s dynamic characteristics.
Figure 5.
Stress power spectral density analysis under different operating conditions.
Table 4.
Comparison of the first two natural frequencies of the tower crane.
2.3.2. Static Stress Comparison
Since the stress values obtained from field measurements represent the incremental stress relative to the unloaded condition, the simulated stress results were accordingly adjusted using Equation:
where is the stress at the tower crane base under the unloaded condition (in MPa), is the stress at the same location under working conditions A1 to A3 (in MPa), and ( = 1 to 3) denotes the corresponding stress increment relative to the unloaded state.
Table 5 presents a comparison between the simulated and measured stress values at the base of the tower crane, revealing a maximum deviation of –8.65%. This discrepancy is likely attributable to experimental uncertainties and the exclusion of light wind loads in the simulation model.
Table 5.
Comparison of measured and calculated stress values at the base of the tower body.
Based on the comparison of natural frequencies and stress analysis results, the developed finite element model demonstrates good agreement with the actual tower crane structure, effectively capturing both its dynamic and static characteristics.
2.4. Dynamic Characteristic Analysis of the Flat-Jib Tower Crane Under Operating Conditions
The dynamic characteristics of flat-jib tower cranes are critical in determining their structural response and operational safety under wind and working loads, particularly given the pronounced sensitivity of low-order modes to wind excitation. Investigating the influence of key parameters—such as lifting load, hoisting rope length, and lifting position—on the dynamic behavior of the structure is essential for developing effective wind-resistance strategies. Moreover, such analysis provides a scientific basis for fatigue damage evaluation and aids in mitigating the risk of resonance-induced failures, thereby enhancing the overall stability and safety of tower crane operations.
2.4.1. Influence of Lifting Load
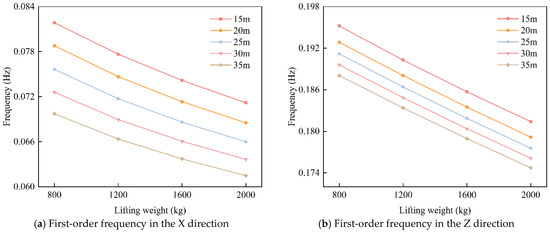
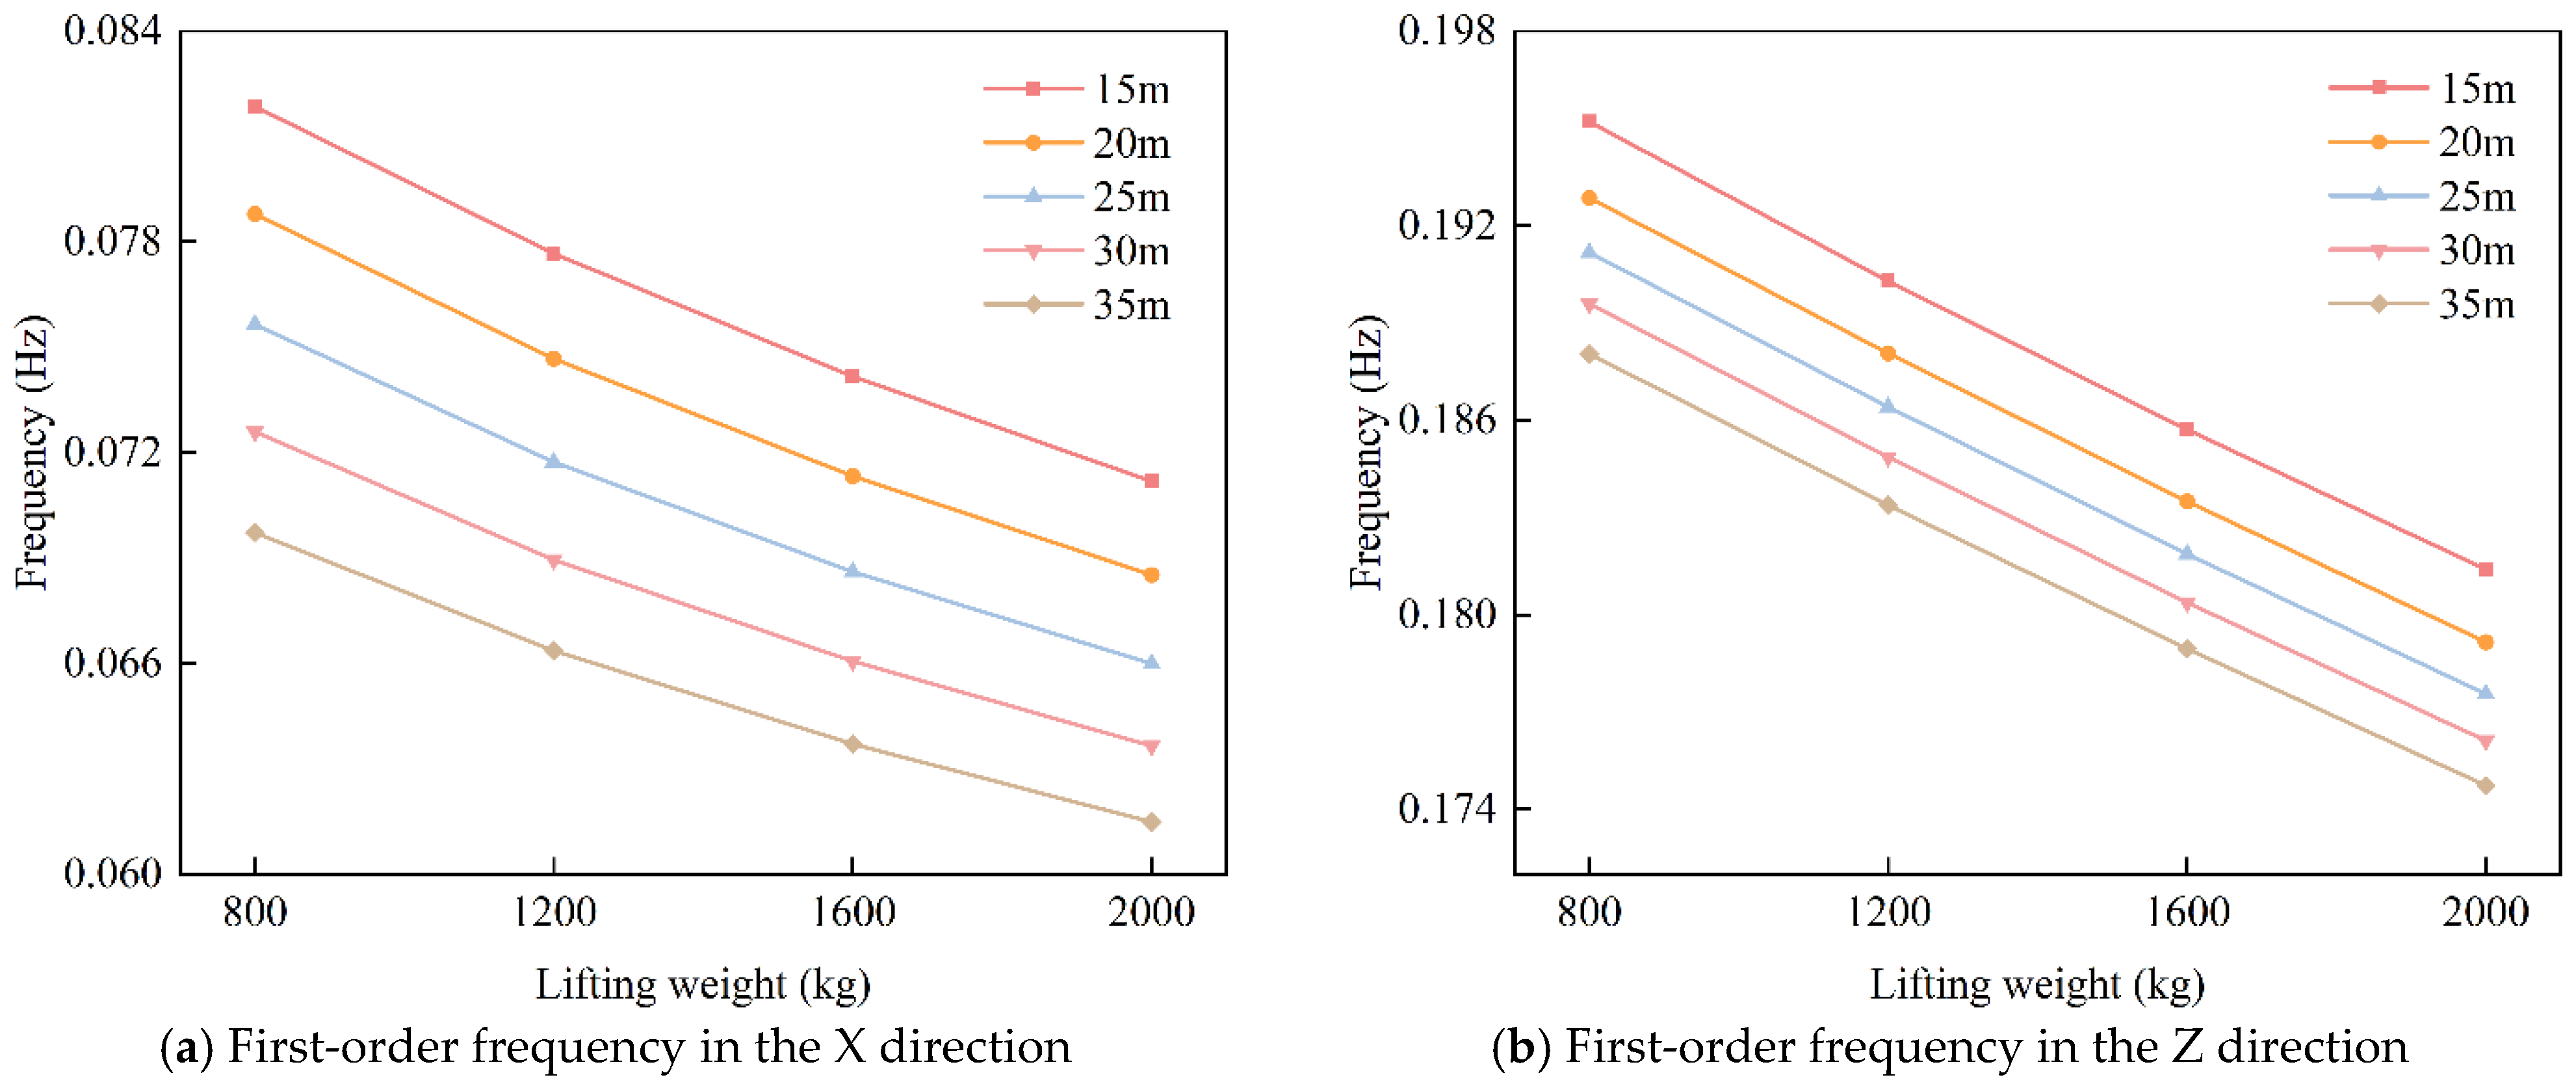
When the lifting position is located at the jib tip, Figure 6 illustrates the variation in the first-order natural frequencies of the tower crane along the X and Z directions under different rope lengths, plotted as a function of the lifting load. The results indicate that the natural frequencies in both directions decrease as the lifting load increases. This trend is primarily attributed to the increase in system mass, which raises the overall inertia, while the structural stiffness remains relatively constant. Acting as an added dynamic mass, the lifting load modifies the system’s mass distribution and reduces the effective stiffness of the structure, thereby lowering the low-order modal frequencies. Specifically, when the lifting load increases from 800 kg to 2000 kg, the first-order frequency in the X direction decreases by approximately 12.5%, indicating greater sensitivity to load variation. In comparison, the frequency in the Z direction decreases by approximately 7.1%, reflecting greater stability. This difference arises because the X-direction mode is more sensitive to variations in dynamic stiffness induced by the lifting load, leading to a more pronounced frequency reduction.
Figure 6.
Structural frequencies of the tower crane at the jib end under different rope lengths and lifting loads.
2.4.2. Influence of Rope Length
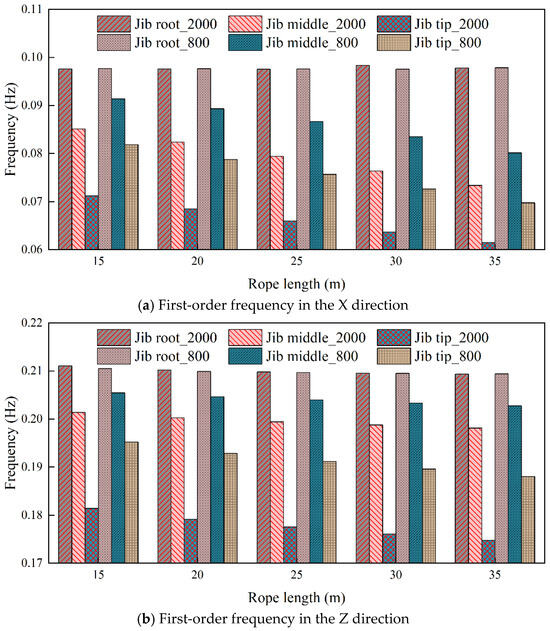
As shown in Figure 6, the first-order natural frequencies of the tower crane in both the X and Z directions decrease with increasing rope length, indicating that the increased flexibility of the hoisting rope reduces the overall structural stiffness. As the rope length increases, its axial stiffness decreases significantly. Specifically, when the rope length extends from 15 m to 35 m, the first-order natural frequency in the X direction declines by approximately 14.2%, demonstrating a pronounced sensitivity to rope length. In contrast, the frequency in the Z direction decreases by approximately 3.6%, indicating a comparatively minor impact. This difference arises because the X-direction mode primarily corresponds to the lateral oscillation of the entire tower crane, which is more sensitive to variations in dynamic stiffness caused by changes in the rope length.
The load movement resembles that of a pendulum. When the hoisting rope is short, the load’s swinging is constrained, and the crane mainly exhibits bending and torsional vibrations of the tower or jib. As the rope length increases, the load’s swing radius expands, resulting in greater system inertia. The enhanced swinging motion associated with a longer rope strengthens the dynamic coupling between the load and the crane. The complex relative motion among the tower, jib, and load leads to more intricate vibration modes and more substantial coupling effects. Therefore, in practical operations, the coupled effects of rope length and load weight on the modal characteristics must be thoroughly considered to mitigate the risk of resonance.
2.4.3. Influence of Lifting Position
Three lifting positions were considered—at the jib root, jib middle, and jib tip—as illustrated in Figure 3. For each position, lifting loads of 800 kg and 2000 kg were applied. Figure 7 illustrates the variation in the natural frequency of the tower crane structure concerning the lifting rope length at different lifting positions. The results indicate that the structural frequency decreases as the lifting position moves farther from the tower body. When the rope length reaches 35 m, the first-order frequency in the X direction at the jib middle and tip decreases by 18.1–25.0% and 28.8–37.1%, respectively, relative to the jib root. The frequency in the Z direction is reduced by 3.2–5.4% and 10.2–16.5%. The results indicate that the closer the lifting position is to the jib tip, the greater the reduction in structural frequency, resulting in increased vibration sensitivity.
Figure 7.
Structural frequencies of the tower crane at the jib root under different rope lengths and lifting loads.
When lifting occurs near the tower, the system’s mass distribution is more concentrated, resulting in higher overall structural stiffness. In this configuration, changes in natural frequency are minimal, rendering the system less sensitive to external dynamic disturbances and thereby enhancing operational stability. Under these conditions, the influence of both the lifted load and rope length on the natural frequency is negligible, allowing the crane to maintain higher stiffness and resilience. In contrast, when the lifting point is located at the jib tip, the mass distribution becomes more dispersed, and the extended lever arm significantly increases the system’s rotational inertia. Moreover, the lifting load introduces an additional bending moment on the jib, altering the stiffness distribution throughout the structure. These combined effects result in a significant reduction in the tower crane’s natural frequency.
When the lifting load is positioned near the tower base, the primary vibration mode of the tower crane typically manifests as bending or localized torsion of the tower and jib. The concentrated mass of the lifting load near the tower primarily influences the overall lateral bending of the tower. As the lifting load moves toward the jib tip, the bending moment on the jib increases, resulting in pronounced torsion and bending in the overall vibration mode of the tower crane. At this stage, the swinging motion of the lifting load becomes more pronounced. The horizontal swinging and vertical vibrations of the lifting load interact with the vibrations of the tower crane’s jib, resulting in coupled vibrations among the load, tower, and jib. The coupling effect between the swinging of the lifting load and the tower crane’s overall bending vibrations intensifies, leading to more complex vibration modes.
3. Wind-Induced Response Analysis of the Flat-Jib Tower Crane
3.1. Simulation of Fluctuating Wind Loads
3.1.1. Simulation of Fluctuating Wind Speed
Related studies indicate that the wind load primarily influences the dynamic response of the tower crane structure in the windward direction. In contrast, the crosswind load is relatively small and can be neglected [14]. This simplification effectively captures the response characteristics of tower cranes dominated by low-frequency vibrations, making it suitable for general engineering analysis and design. For tower cranes operating under complex terrain, strong turbulent winds, or variable wind directions, it is still necessary to conduct refined multi-directional coupled analyses based on specific wind conditions. Therefore, this study considers only the effect of wind load in the windward direction. The mean wind speed profile is modeled using an exponential law.
where represents the average wind speed at a height of z meters; is the average wind speed at the reference height, and is the wind speed profile exponent.
The wind speed at any point in space can be decomposed into a constant mean component and a fluctuating component with zero mean. The spectrum of the fluctuating wind speed follows the height-dependent Kaimal spectrum, whose empirical expression is given by:
where n is the frequency of the fluctuating wind speed; is the power spectral density of the fluctuating wind speed; is the root mean square (RMS) of the fluctuating wind speed. Using the Kaimal spectrum, the fluctuating characteristics of the wind speed at different heights can be accurately simulated. The power spectral density of the fluctuating wind characterizes its frequency and energy distribution, while the coherence function reflects the spatial correlation of the fluctuating wind components. The cross-power spectral density function of the fluctuating wind speed is expressed as follows:
where is the coherence function of the wind speed, which indicates the degree of correlation between different spatial points, and its empirical expression is
where the spatial attenuation coefficient is usually taken as = 16 and = 10. , , , and are the transverse and vertical coordinates of the two points, respectively. and denote the average wind speed at points and .
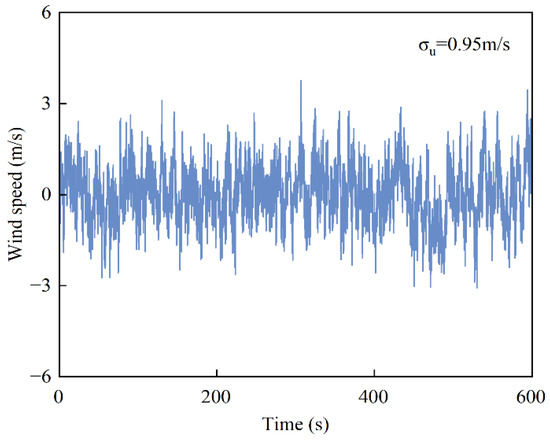
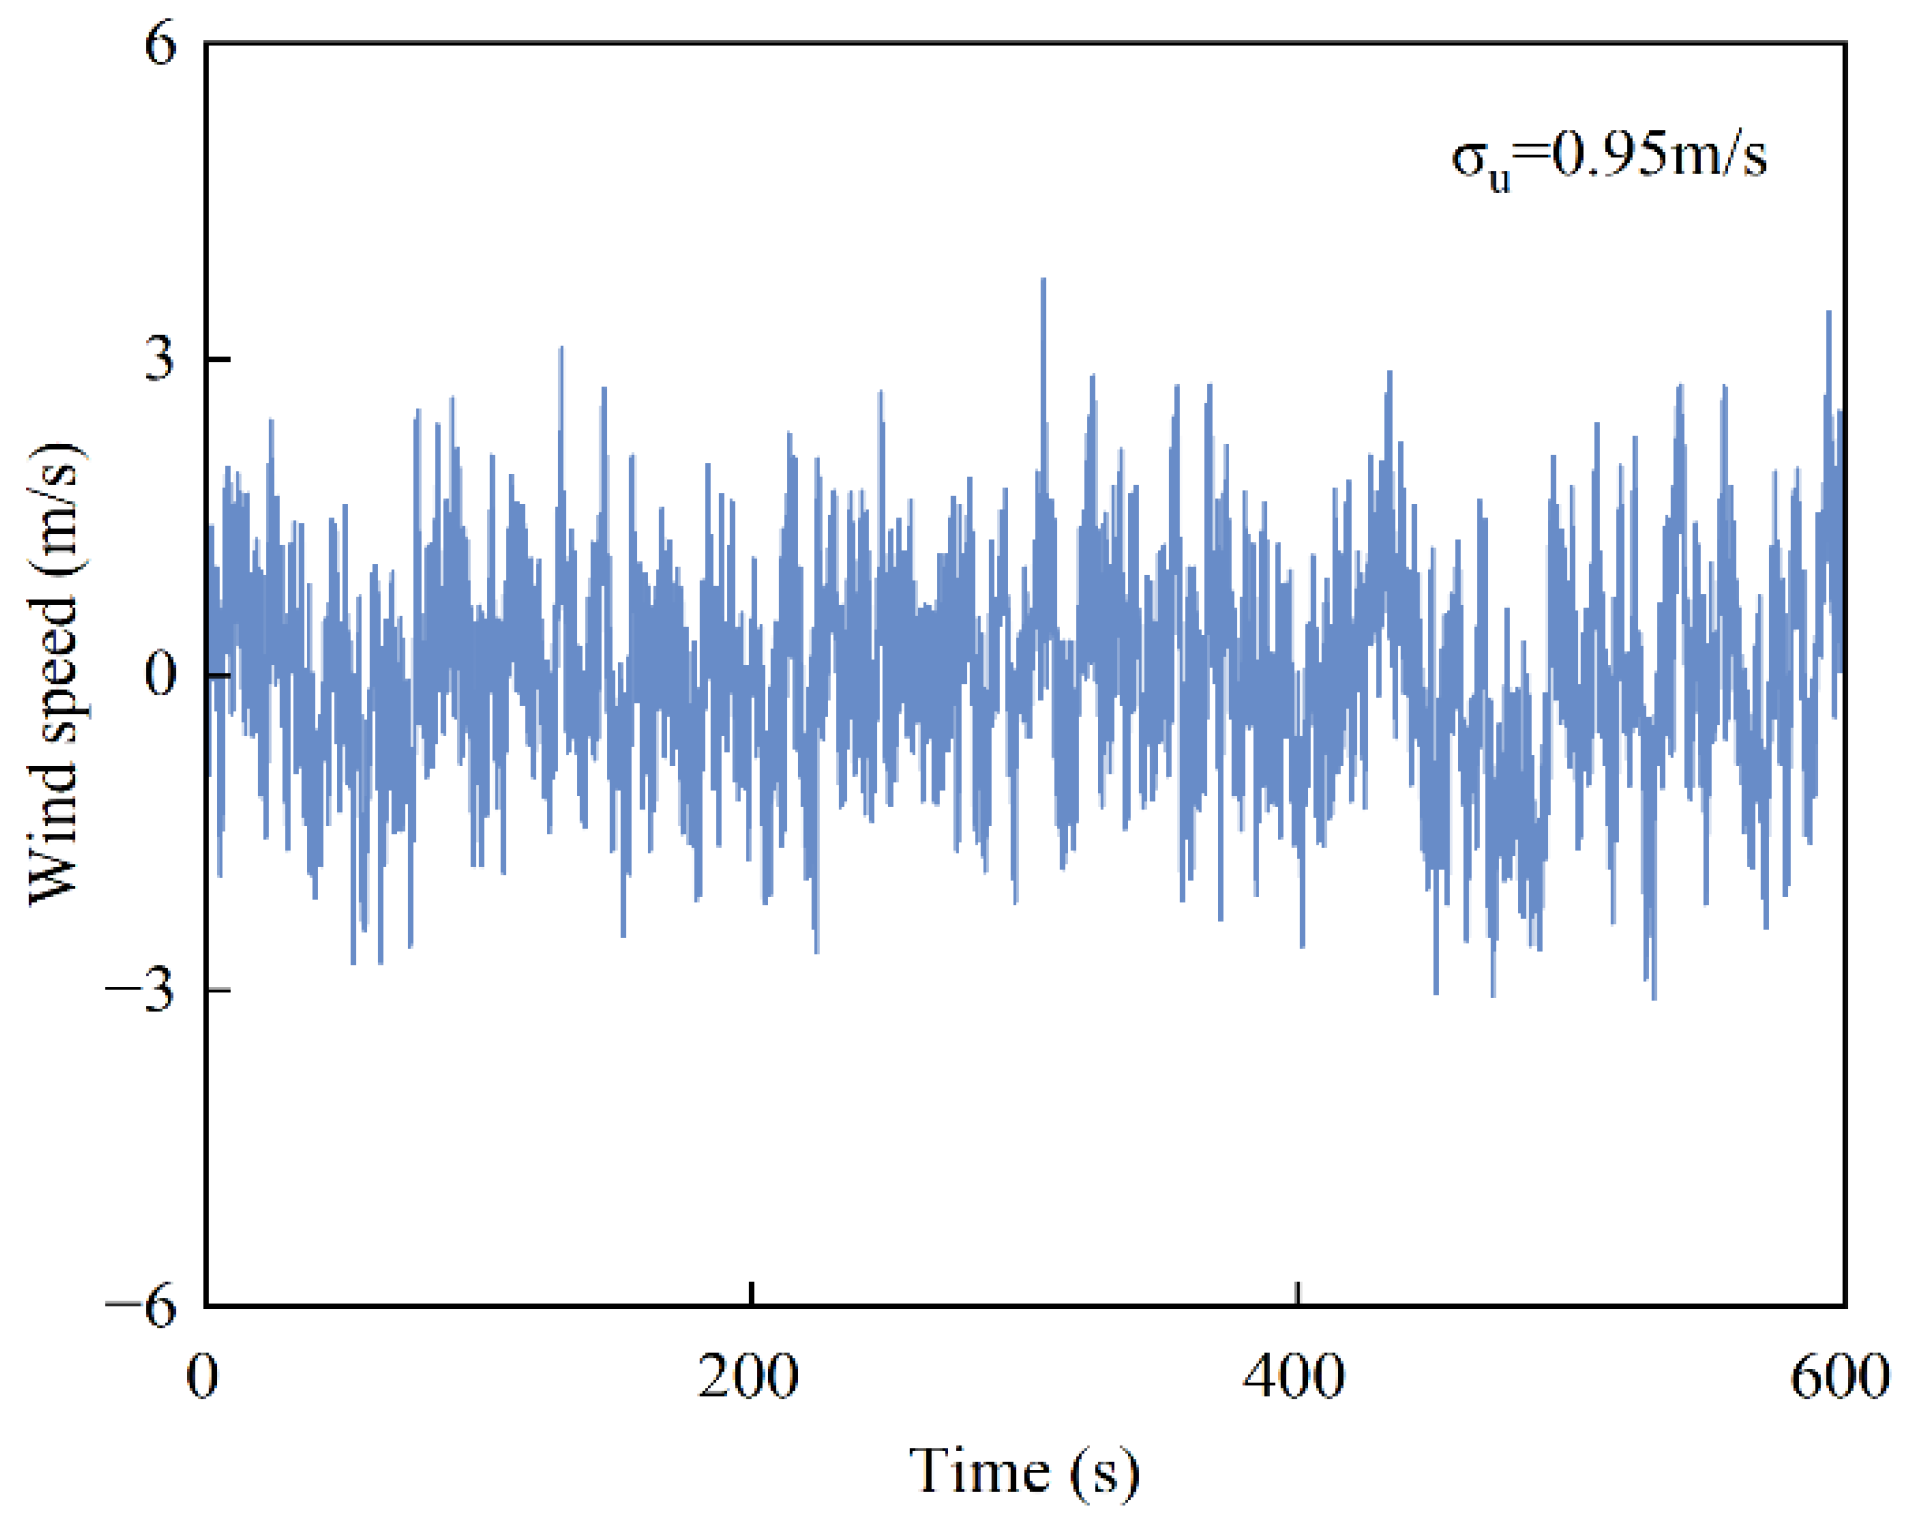
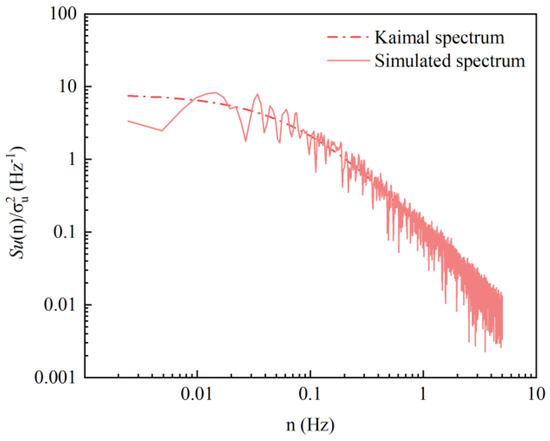
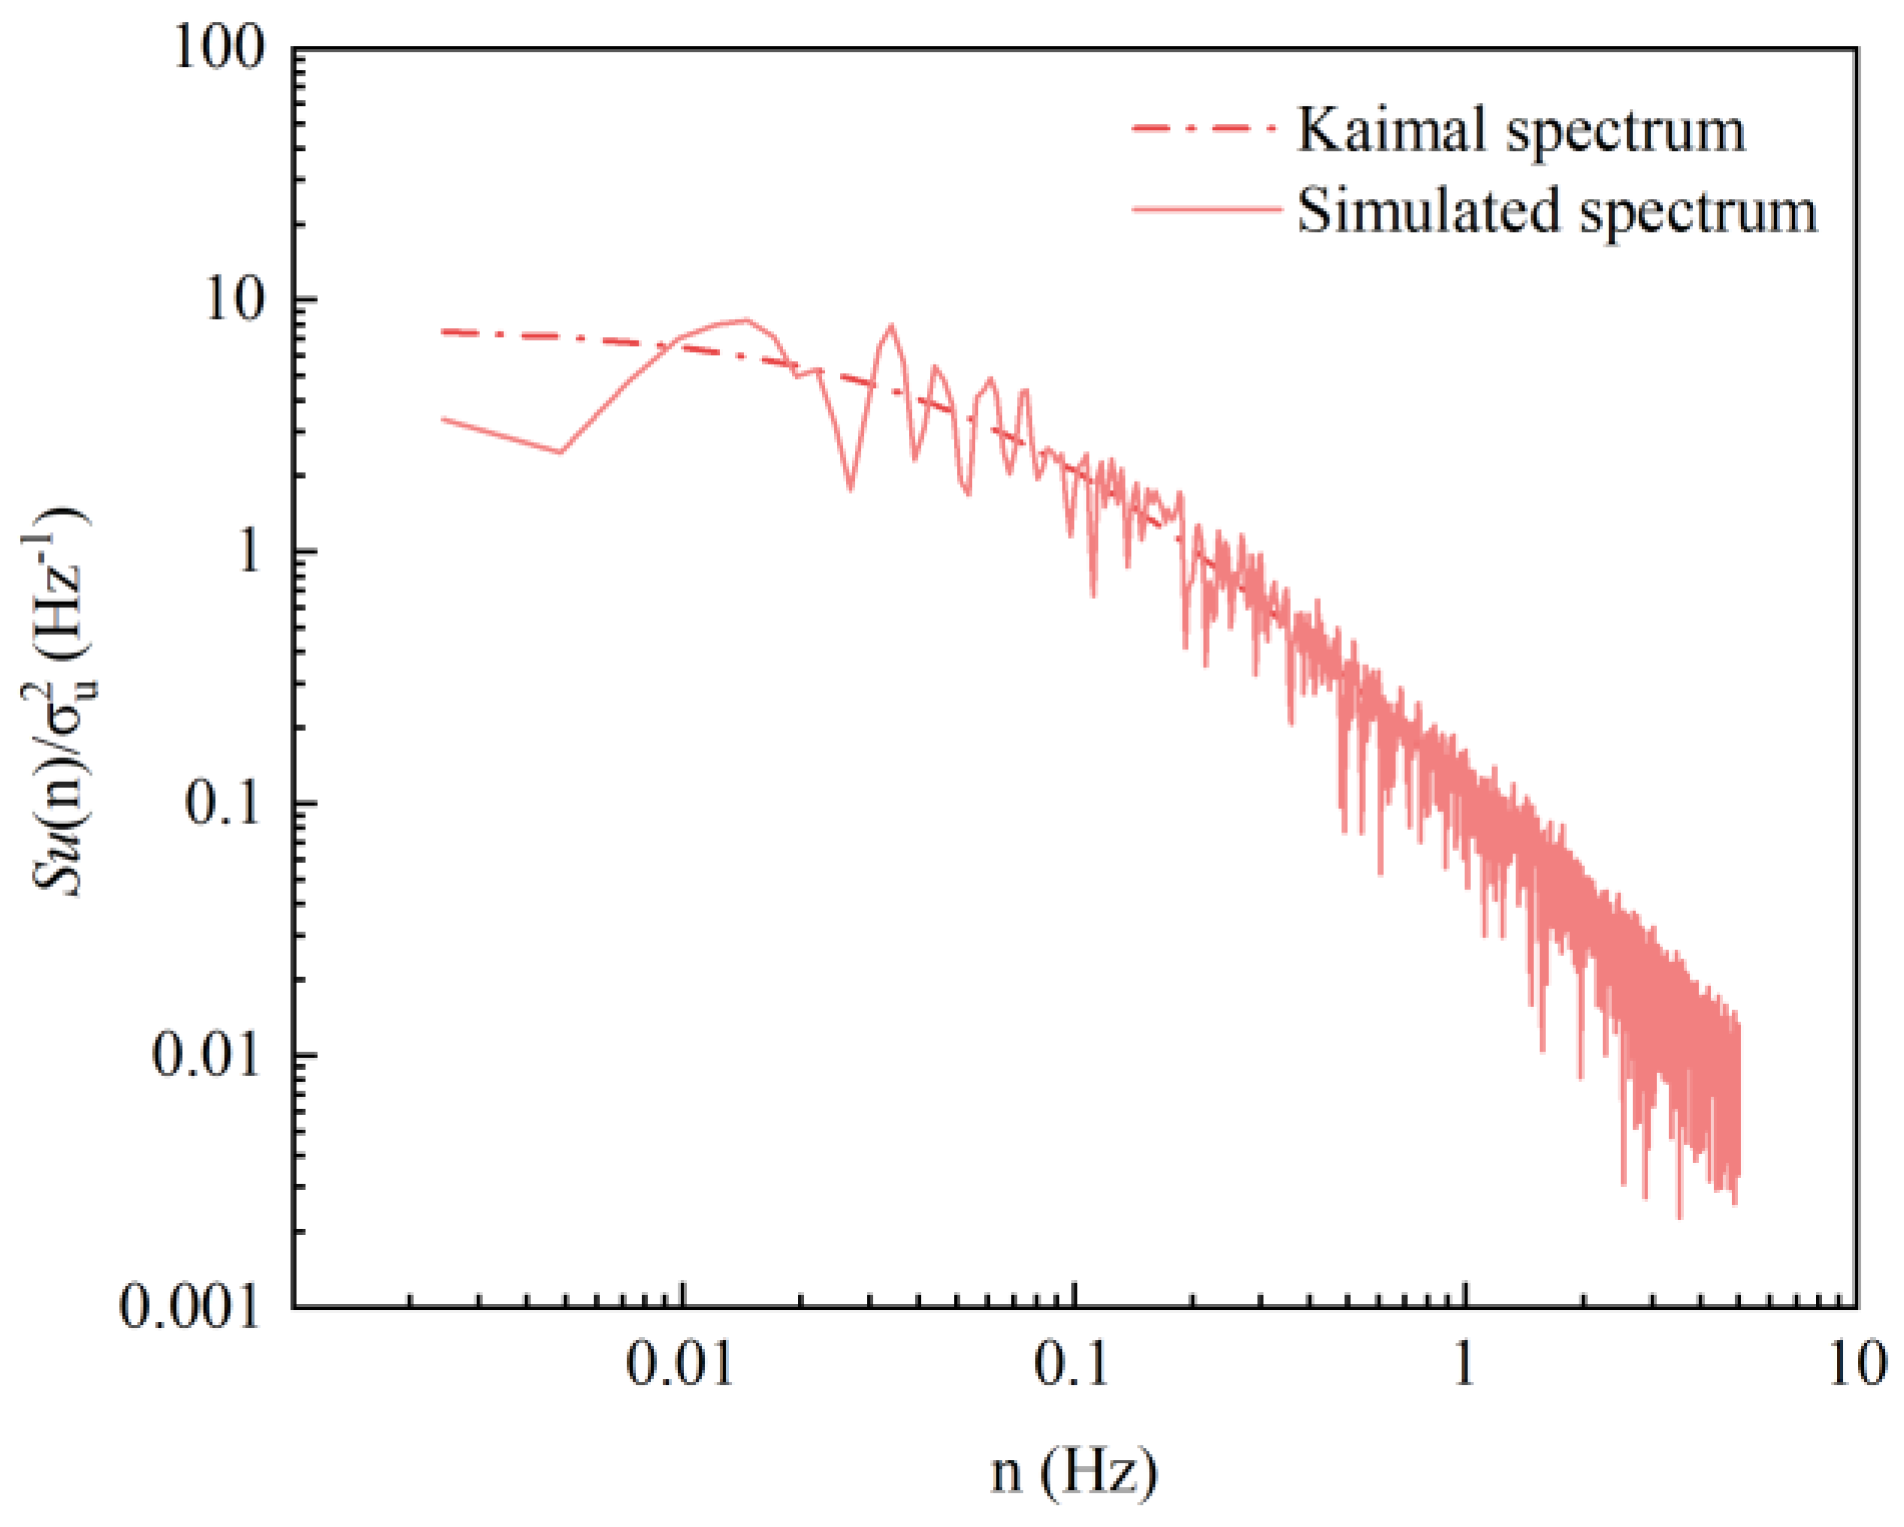
The crane was divided into 31 regions along the tower height and jib length directions (see Figure 8). The ground roughness was classified as Category C, and the wind speed profile exponent was [36]. GB/T 13752-2017 [37] stipulates that the wind force grade for tower cranes in normal operating conditions is level 6, with an average wind speed of m/s at a height of 10 m. The along-wind fluctuating wind speed time histories were generated using the harmonic synthesis method in MATLAB R2021b. A total of 31 wind speed records were simulated, distributed along the height of the tower body and the length of the jib. Each wind speed time history was generated with a time step of 0.1 s and a total duration of 600 s. Figure 9 presents the along-wind fluctuating wind speed time history at the top of the tower crane, located at a height of 41.6 m. In the figure, represents the fluctuating wind speed’s root mean square (RMS) value. Figure 10 presents a comparison between the simulated wind speed spectrum at the tower top and the theoretical Kaimal spectrum. The results exhibit good agreement, thereby validating the accuracy of the simulated fluctuating wind speed.
Figure 8.
Zoning of the tower crane.
Figure 9.
Time history of fluctuating wind speed at the top of the tower crane (41.6 m).
Figure 10.
Comparison of the wind speed spectrum.
3.1.2. Wind Load Simulation
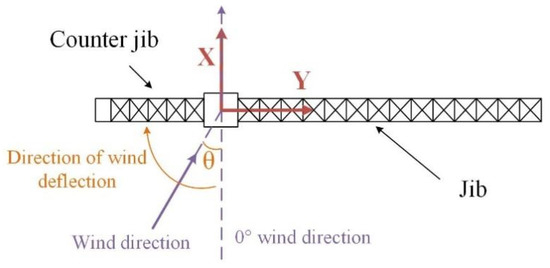
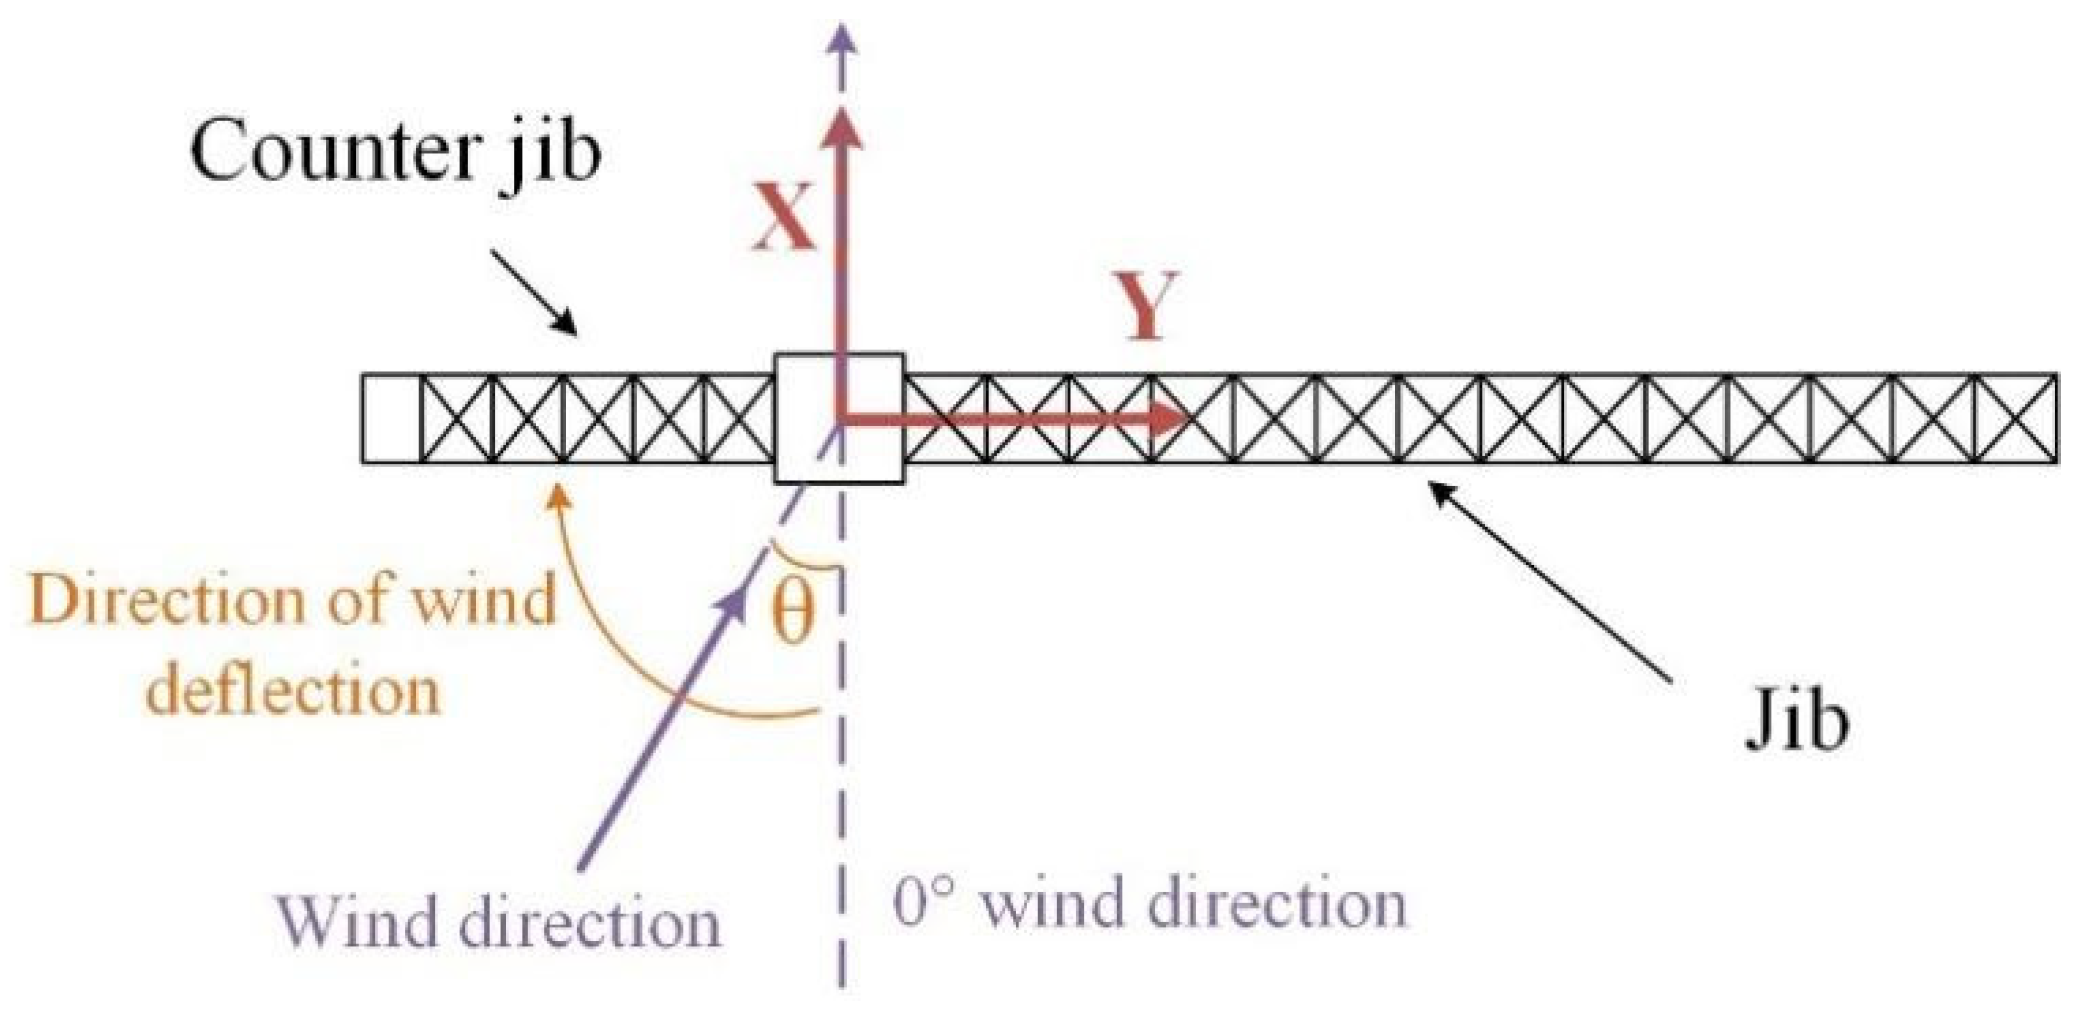
The wind direction angle is defined as 0° along the positive X-axis, with the crane jib oriented perpendicular to this wind direction. The angle between the incoming wind and the negative direction of the X-axis is defined as the wind direction angle θ, as illustrated in Figure 11. The along-wind load F(t) acting on the tower crane can be expressed by the following equation:
where represents the along-wind load time history; is the air density, taken as 1.25 kg/m3; is the incoming wind speed (m/s), , where is the mean wind speed, and is the fluctuating wind speed; is the wind shielding coefficient, , where is the actual wind-exposed area (m2), and A is the sectional projected area (m2); is the shape coefficient, which is calculated using the method provided in GB50009-2012 [36].
Figure 11.
Wind direction diagram of tower crane.
3.1.3. Calculation Conditions
When the wind direction angle θ = 0°, the tower crane presents the maximum windward area, resulting in the most unfavorable wind load condition on the structure [3]. Therefore, θ = 0° is selected for the analysis in this study. In ANSYS 2022 R1, each section’s wind load time series is uniformly applied to the corresponding section’s nodes. A damping ratio of 0.02 is selected for the structure, with Rayleigh damping coefficients used.
The lifting position is chosen at the jib tip, with rope lengths of 25 m, 30 m, and 35 m, and lifting loads of 800 kg, 1200 kg, and 1600 kg. Transient dynamic analysis was conducted to evaluate the vibration response of the tower crane under combined wind loads and lifting loads. The specific operating conditions considered for the wind-induced response analysis of the tower crane are summarized in Table 6, where C0 represents the no-load condition. Displacement and acceleration responses were extracted for key nodes N1 to N5 (see Figure 3). The stress distribution of key elements at the tower base, mid-tower section, and jib root (see Figure 3) was analyzed.
Table 6.
Wind response conditions of tower crane.
3.2. Displacement and Acceleration Response Parameter Analysis
3.2.1. Displacement and Acceleration Response
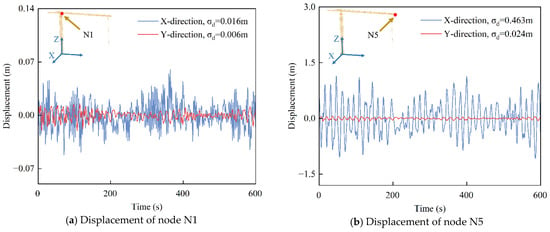
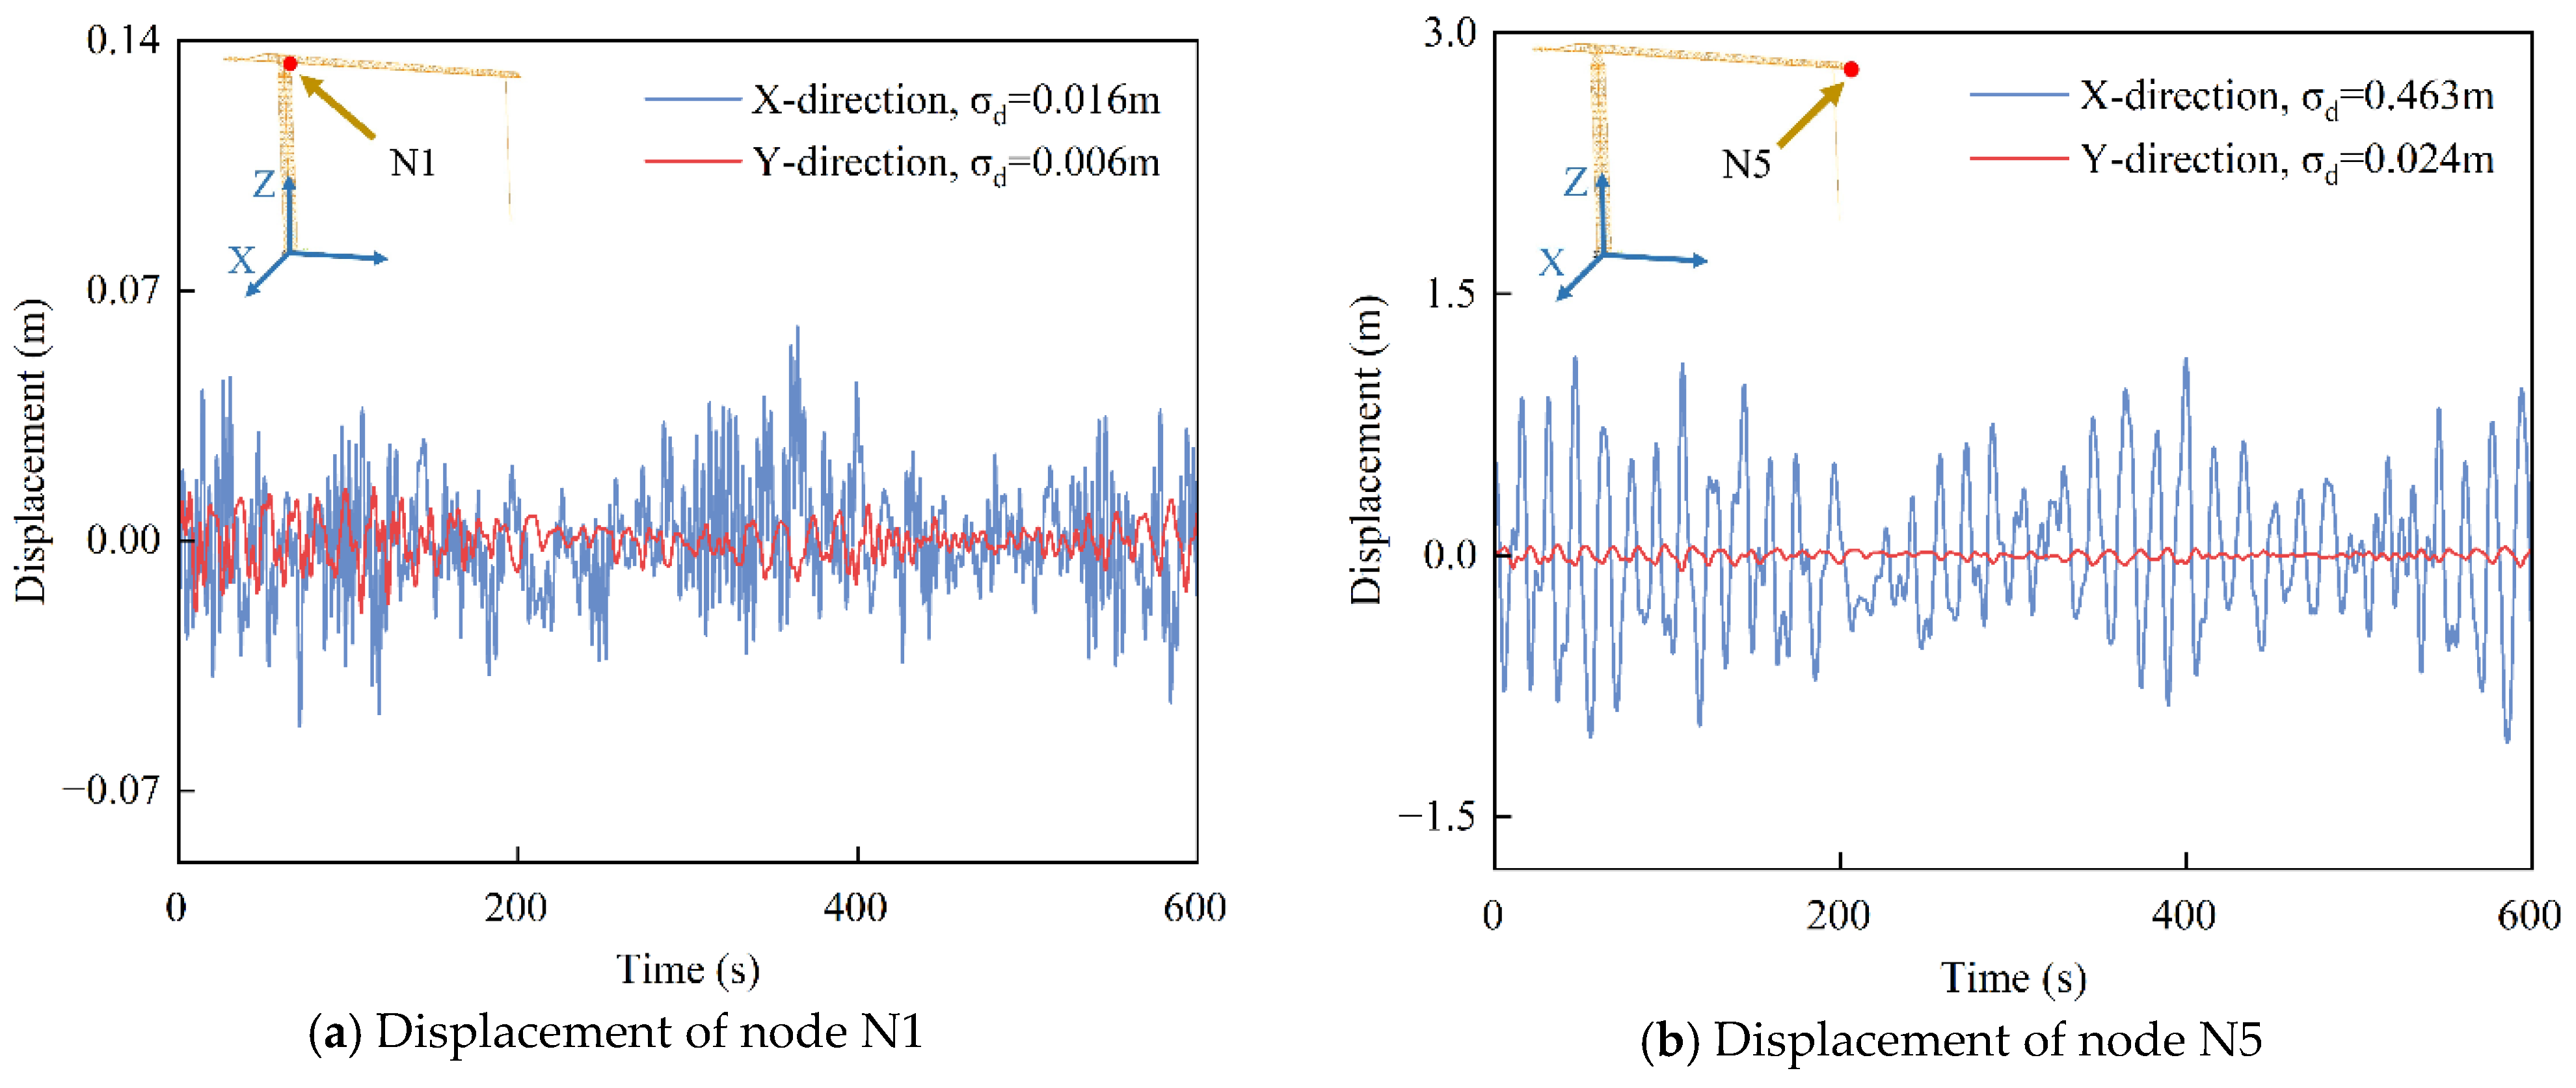
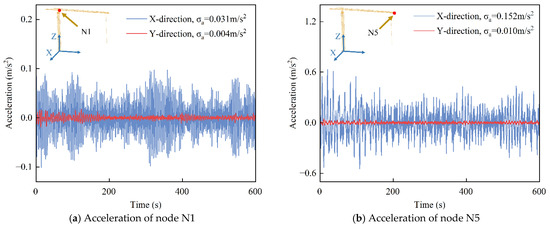
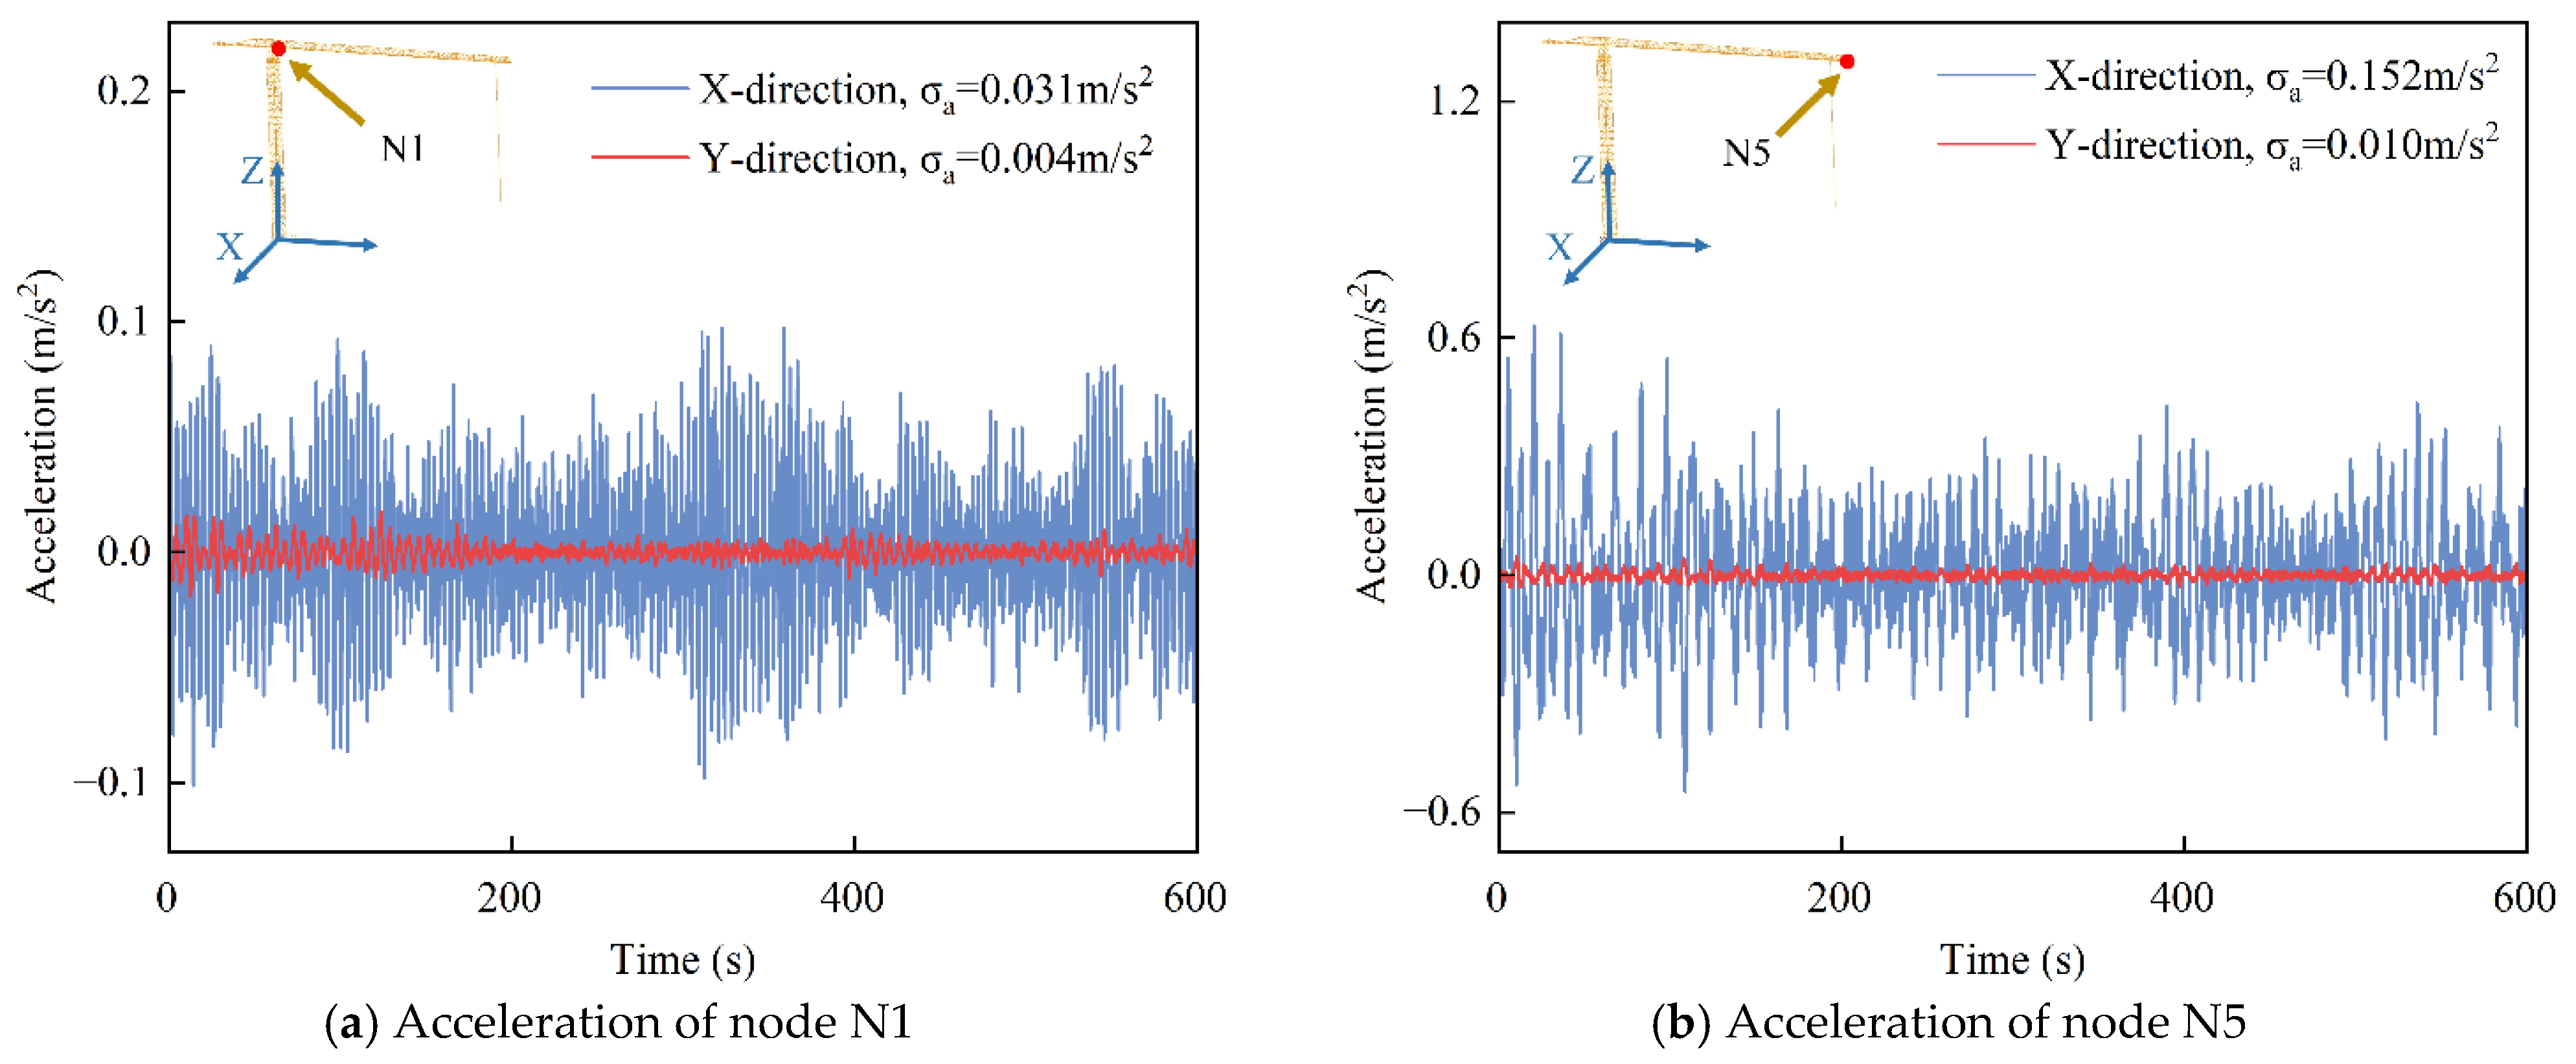
Figure 12 and Figure 13 depict the displacement and acceleration time histories at the jib root (Node N1) and jib tip (Node N5) of the tower crane under operating condition C9 with applied wind loading. In these figures, and represent the root mean square (RMS) values of displacement and acceleration, respectively. The displacement and acceleration responses at the jib tip (N5) are markedly higher than those at the jib root (N1), primarily owing to the greater distance from the tower support. This increased leverage amplifies the vibration intensity at the jib tip under load excitation. The along-wind load predominantly acts in the X-direction (perpendicular to the jib), resulting in significantly greater displacement and acceleration compared to the Y-direction.
Figure 12.
Displacements of nodes N1 and N5 under condition C9.
Figure 13.
Acceleration of nodes N1 and N5 under condition C9.
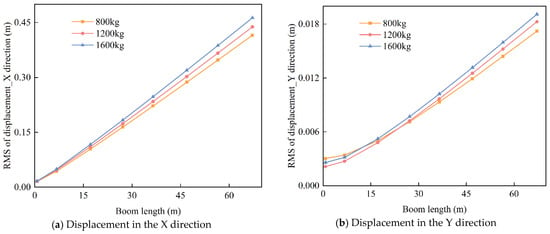
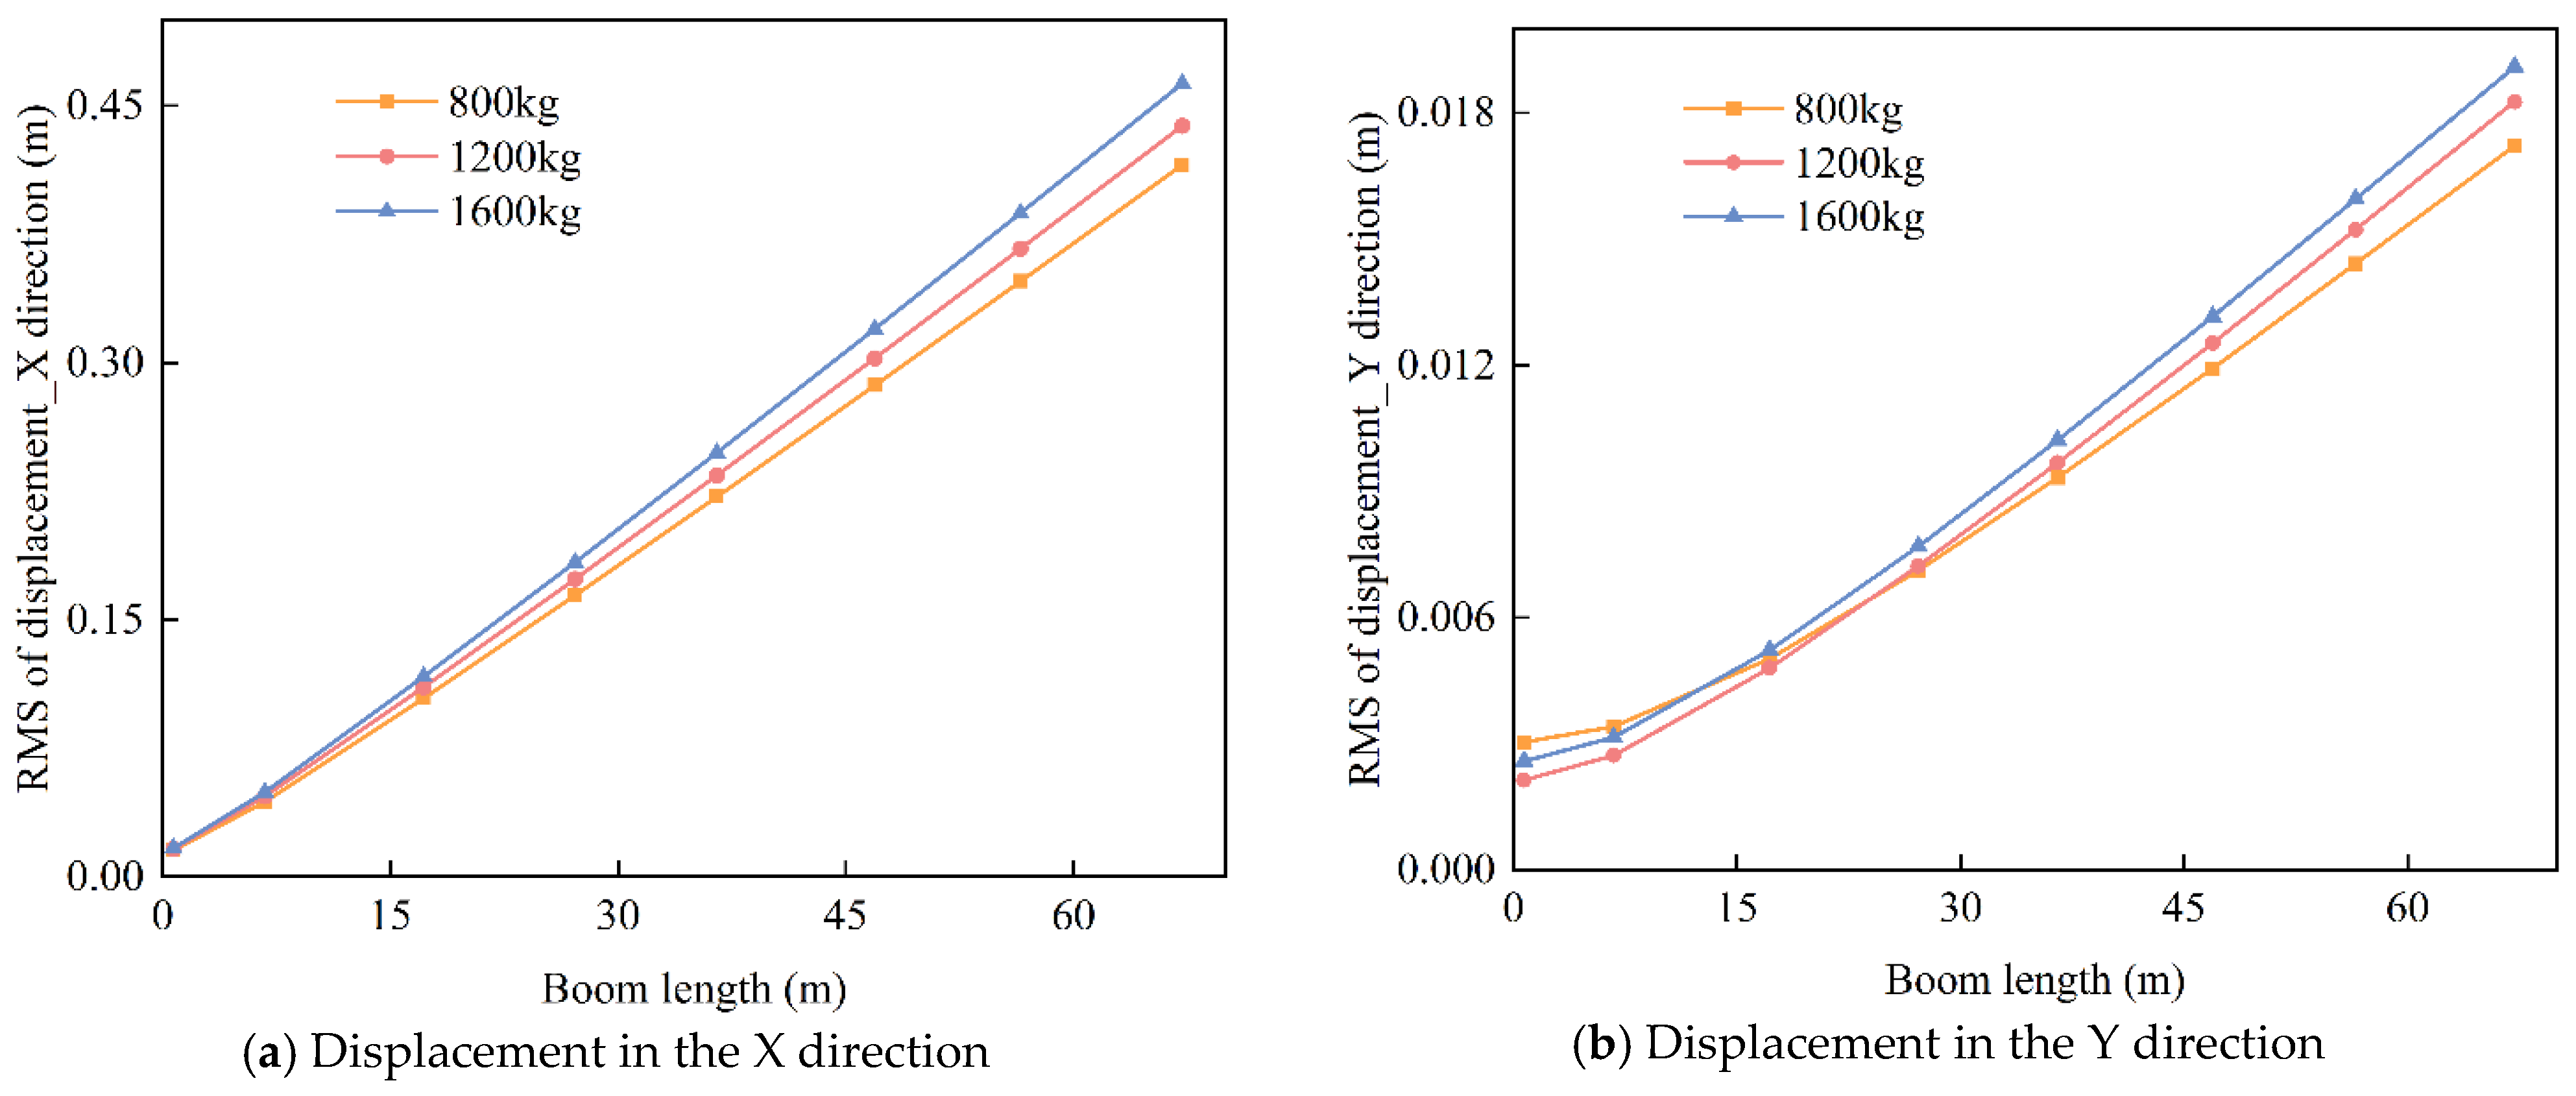
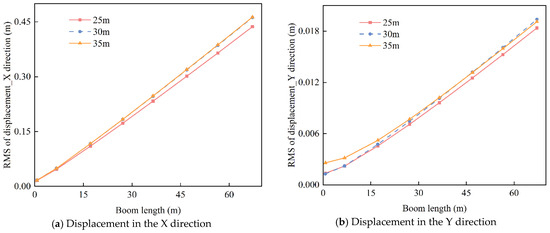
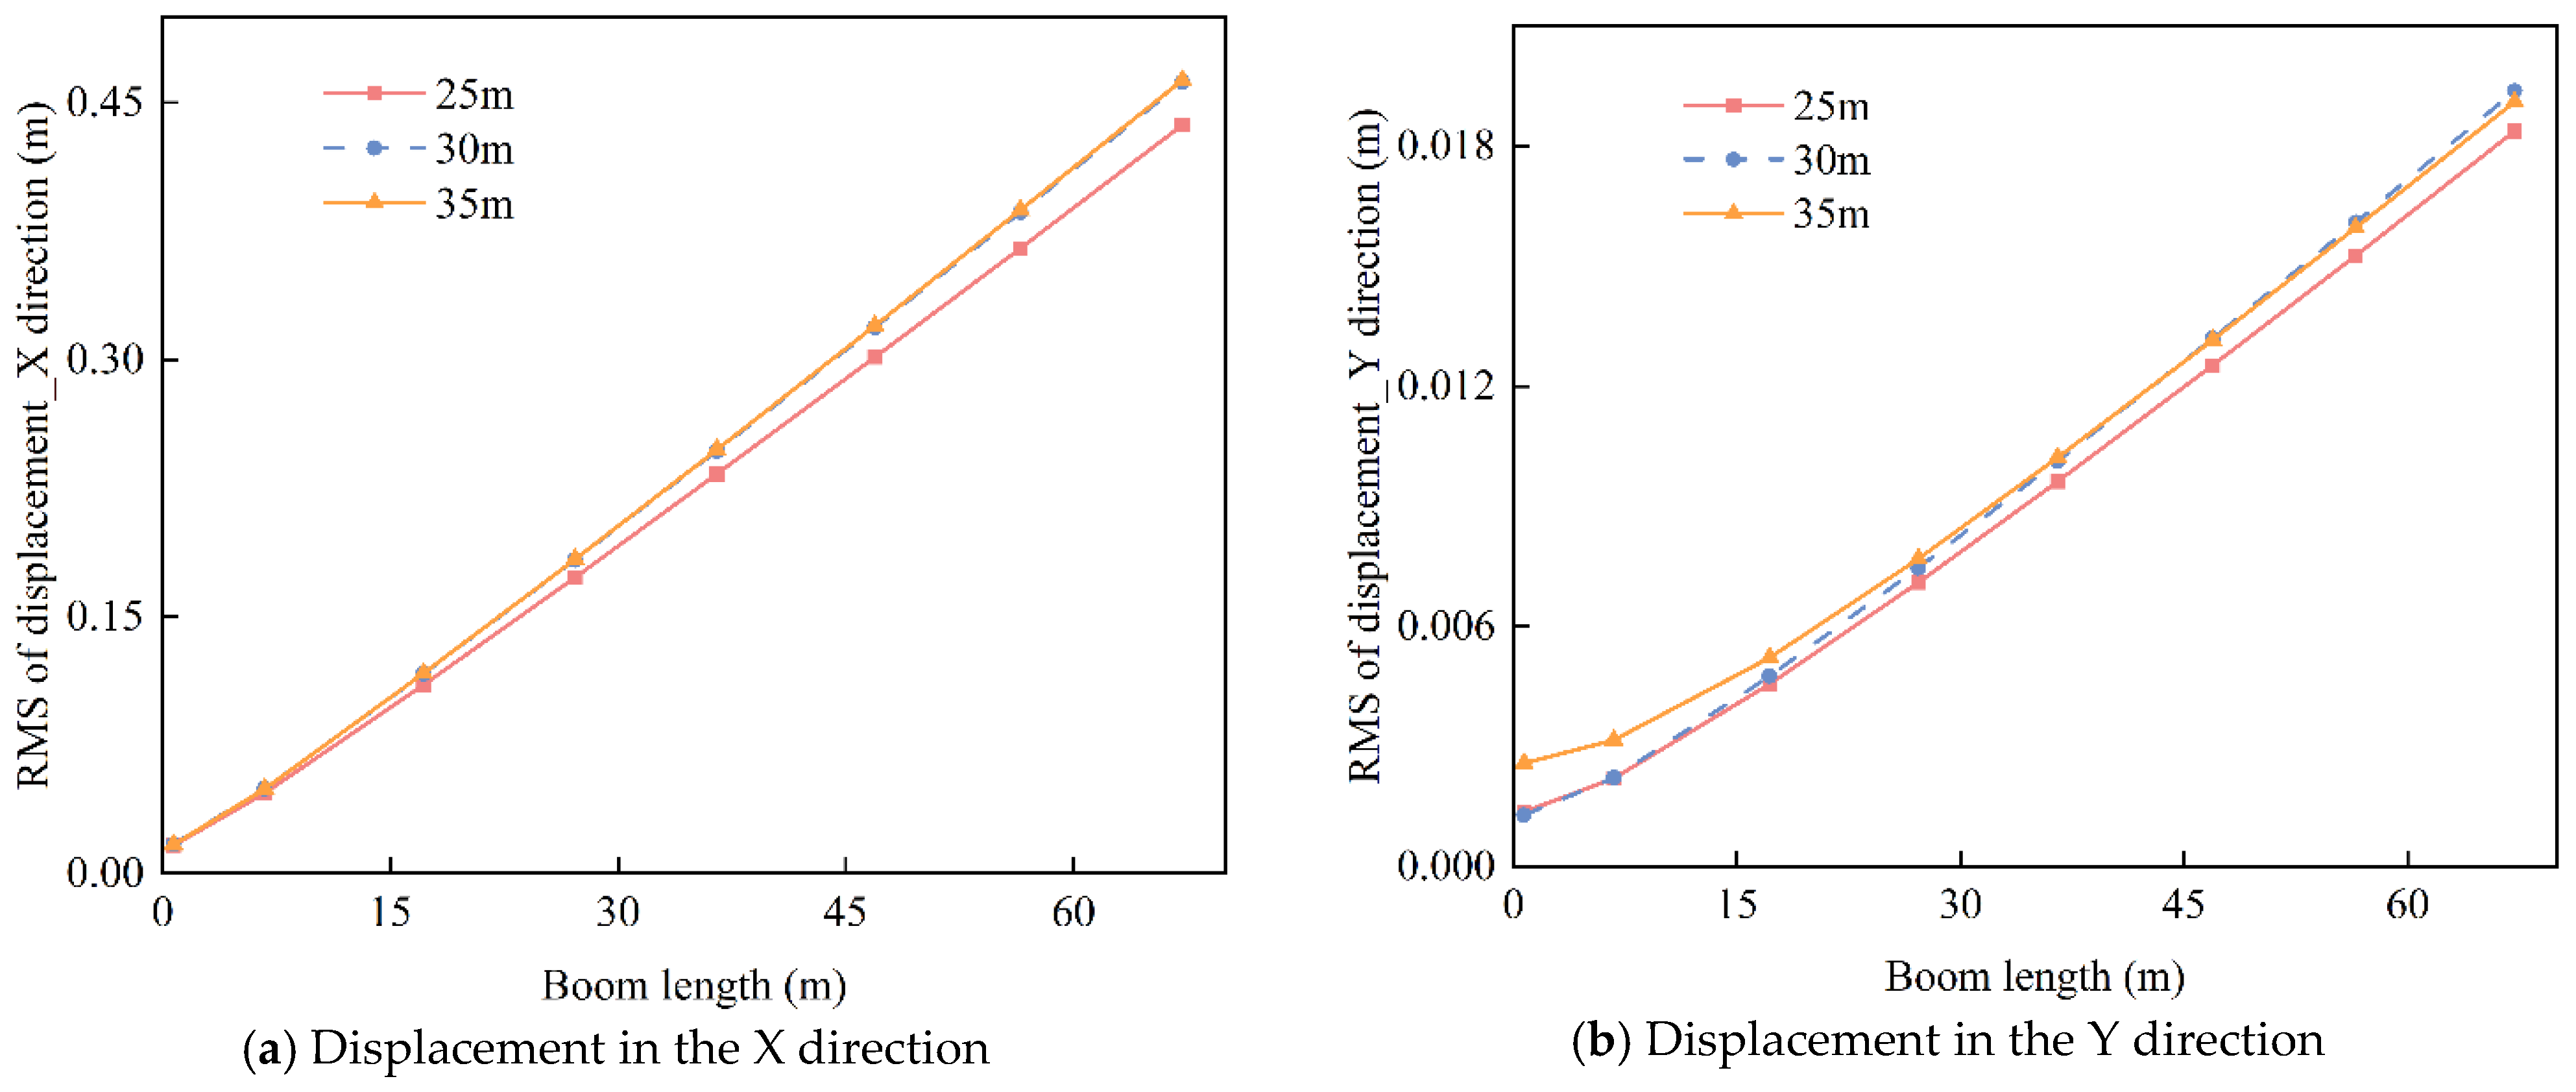
Figure 14 illustrates the effect of varying lifting loads on the root mean square (RMS) displacement of the jib at a rope length of 35 m. The jib displacement increases with increasing lifting load. This increase in lifting load raises the total system mass, thereby enhancing overall inertia and resulting in larger vibration amplitudes of the tower crane. Figure 15 further analyzes the effect of different rope lengths (25 m, 30 m, and 35 m) on the RMS displacement of the jib under a lifting load of 1600 kg. The results indicate that the jib displacement is minimal at a rope length of 25 m. As the rope length increases to 30 m and 35 m, the displacement stabilizes, showing no significant further increase. A longer hoisting rope increases the swinging inertia of the lifted load, potentially causing larger oscillations under external excitations and amplifying the tower crane’s structural vibration response. Additionally, the extended rope length enhances the coupling between the load’s swinging motion and the jib, intensifying the dynamic interaction.
Figure 14.
Root mean square value of tower crane jib displacement under different lifting loads (35 m rope length).
Figure 15.
Root mean square value of tower crane jib displacement under different rope lengths (1600 kg lifting load).
3.2.2. Power Spectral Density of Displacement Response
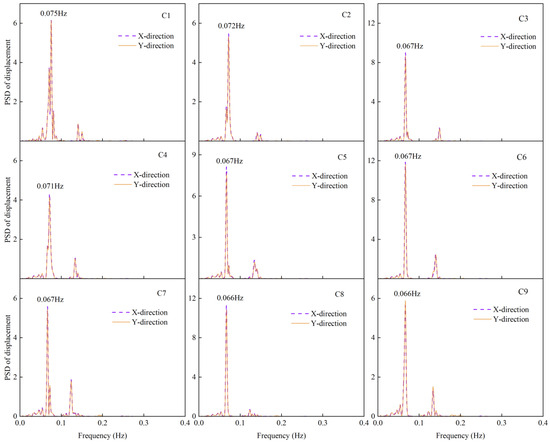
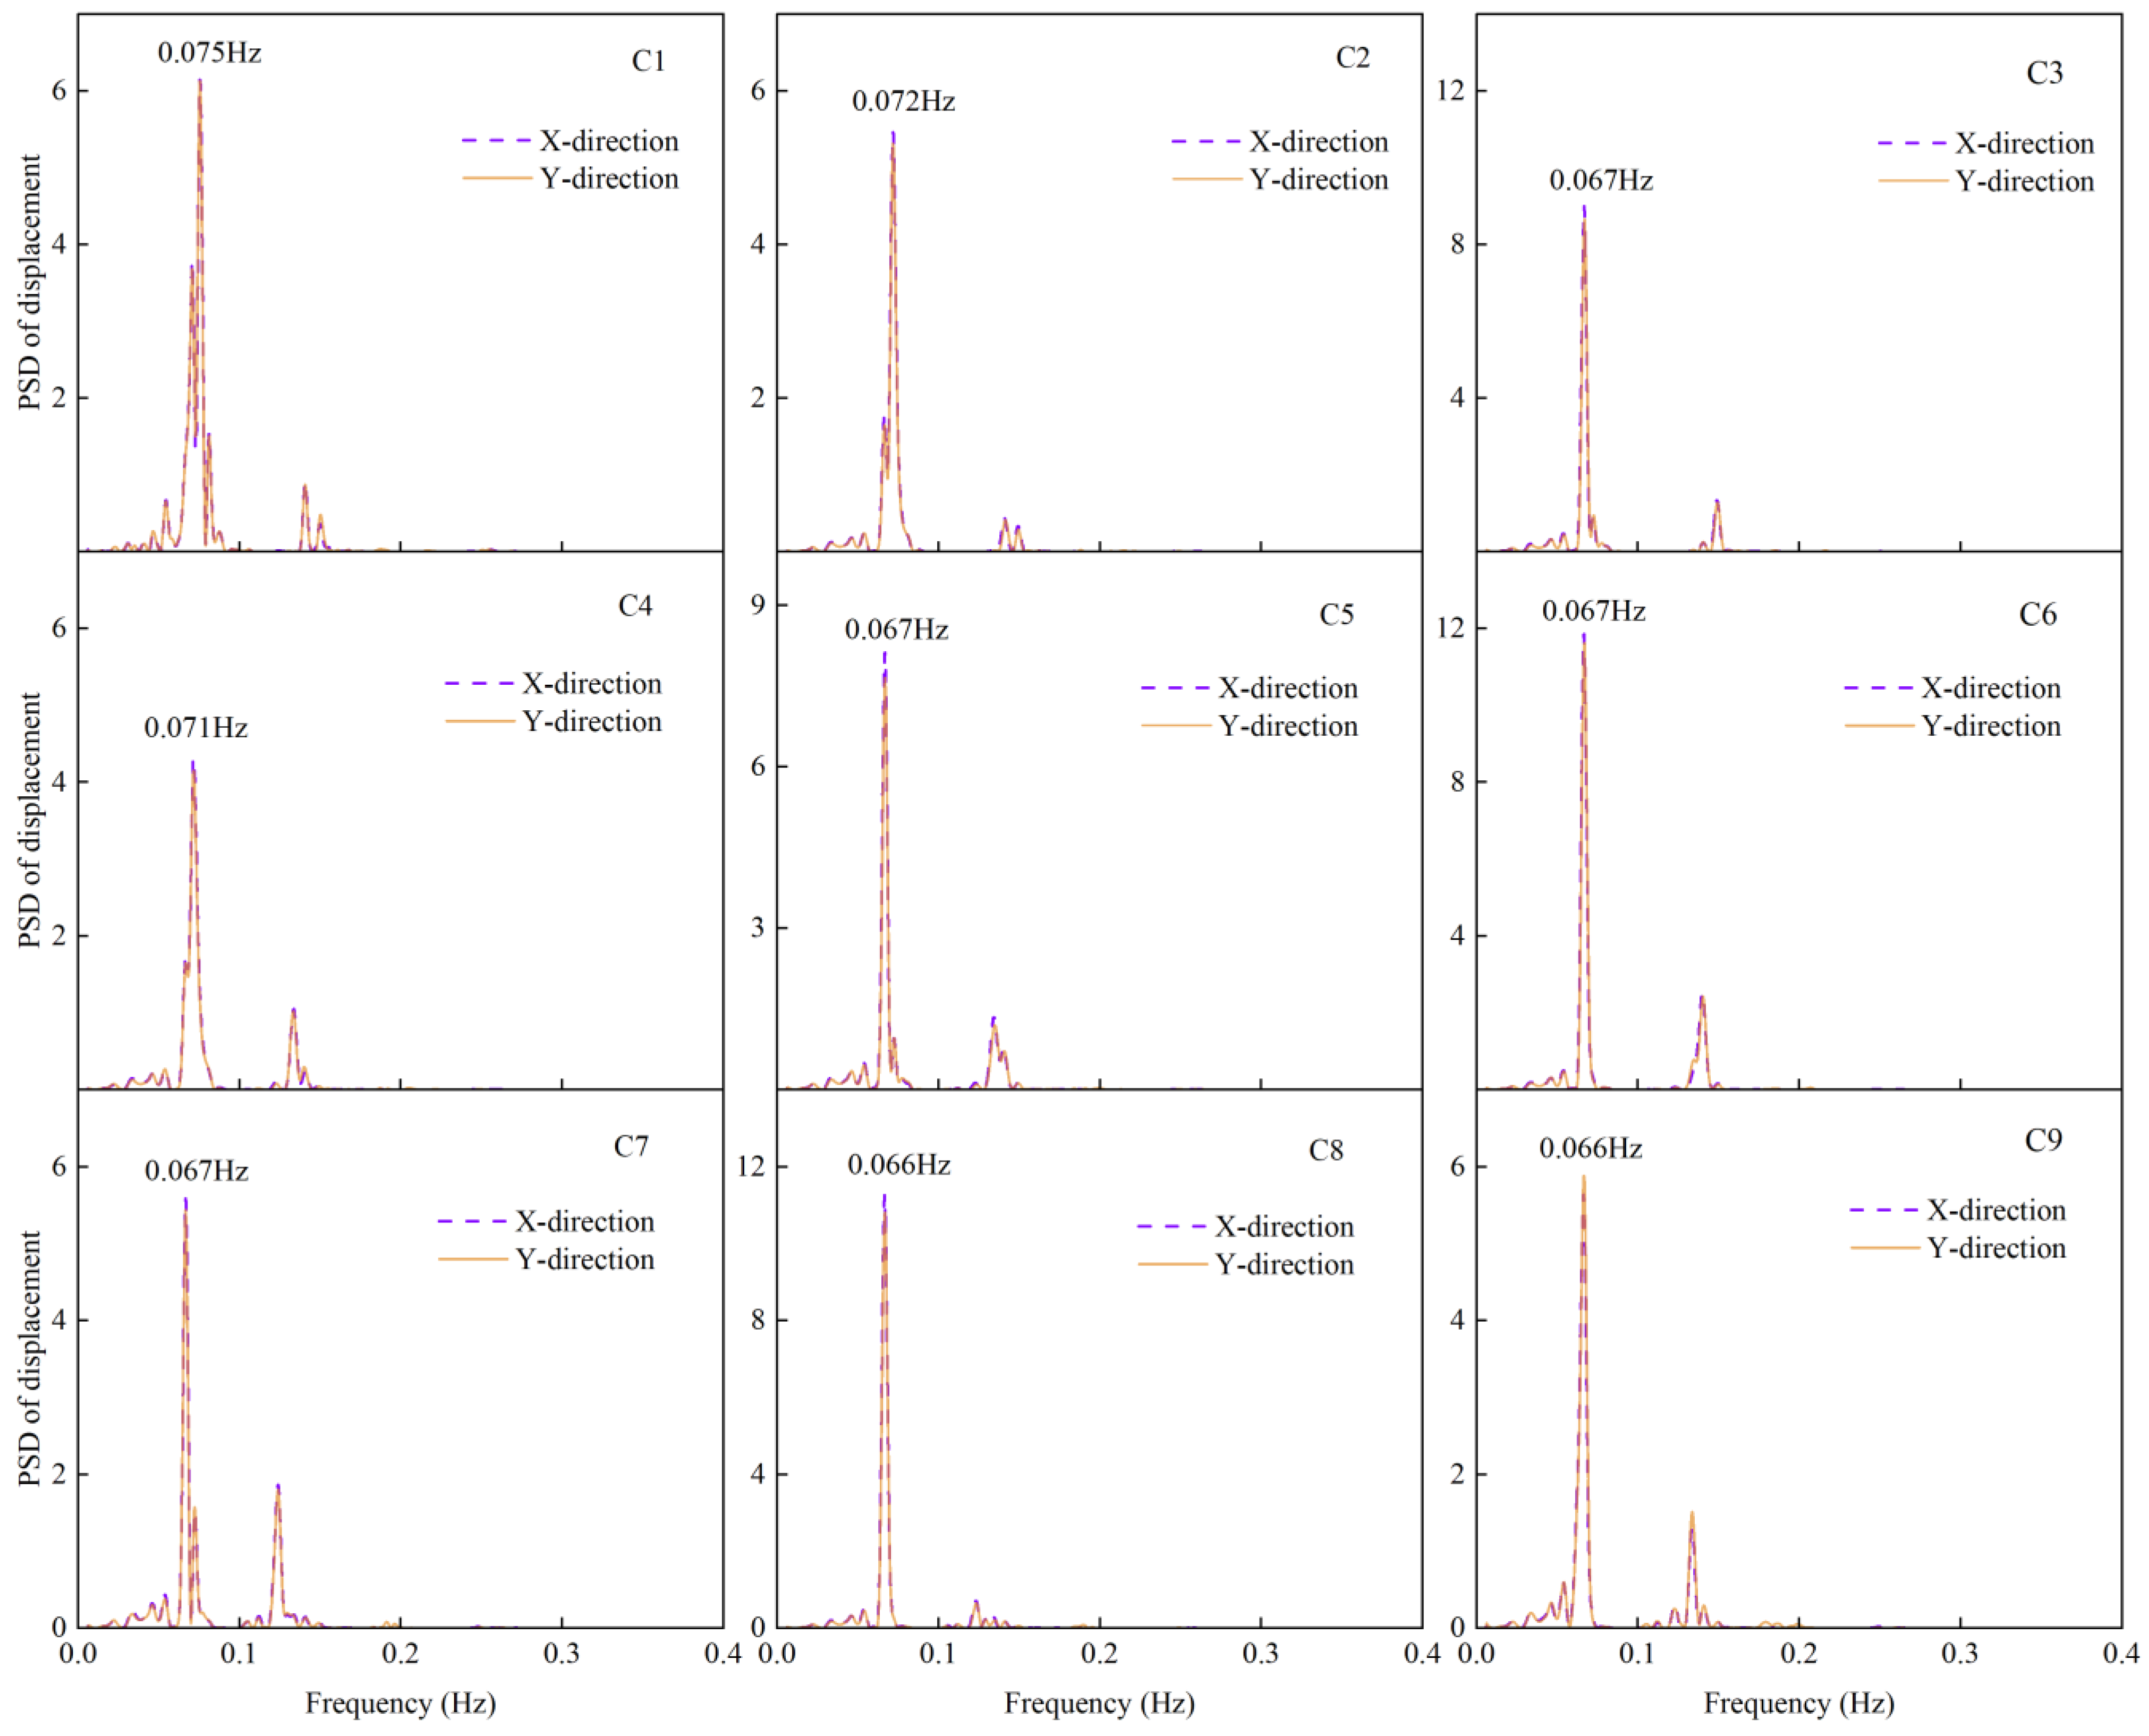
The displacement power spectral density (PSD) at the jib tip (Node N5) of the tower crane was computed and analyzed under varying rope lengths and load conditions using the Pwelch method. Figure 16 presents the displacement PSD at Node N5 under various rope lengths and load conditions. Given that the wind load predominantly acts along the X-direction, the displacement PSD in the X-direction is markedly higher than that in the Y-direction. For comparison, the displacement PSD results in both X and Y directions were nondimensionalized. The results indicate that, under varying rope lengths and load conditions, the power spectral density of the jib tip displacement exhibits a prominent peak at the structure’s first natural frequency, demonstrating that the first mode predominantly governs the tower crane’s dynamic response.
Figure 16.
PSD of displacement at the jib tip.
3.2.3. Variation Law of Displacement Response in Operating Conditions
To reflect the impact of different operating conditions on the tower crane, let the value of a specific parameter (such as displacement, stress, fatigue life) under various operating conditions be denoted as , and the value of the same parameter under the no-load condition be denoted as . The relative percentage change under each operating condition compared to the no-load state is expressed by the following equation:
where represents the relative change percentage for each working condition compared to the no-load condition; is the value under different operating conditions (such as displacement, stress, and fatigue life); and is the value under the no-load condition.
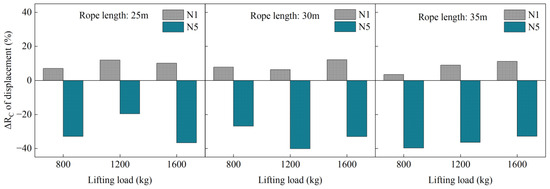
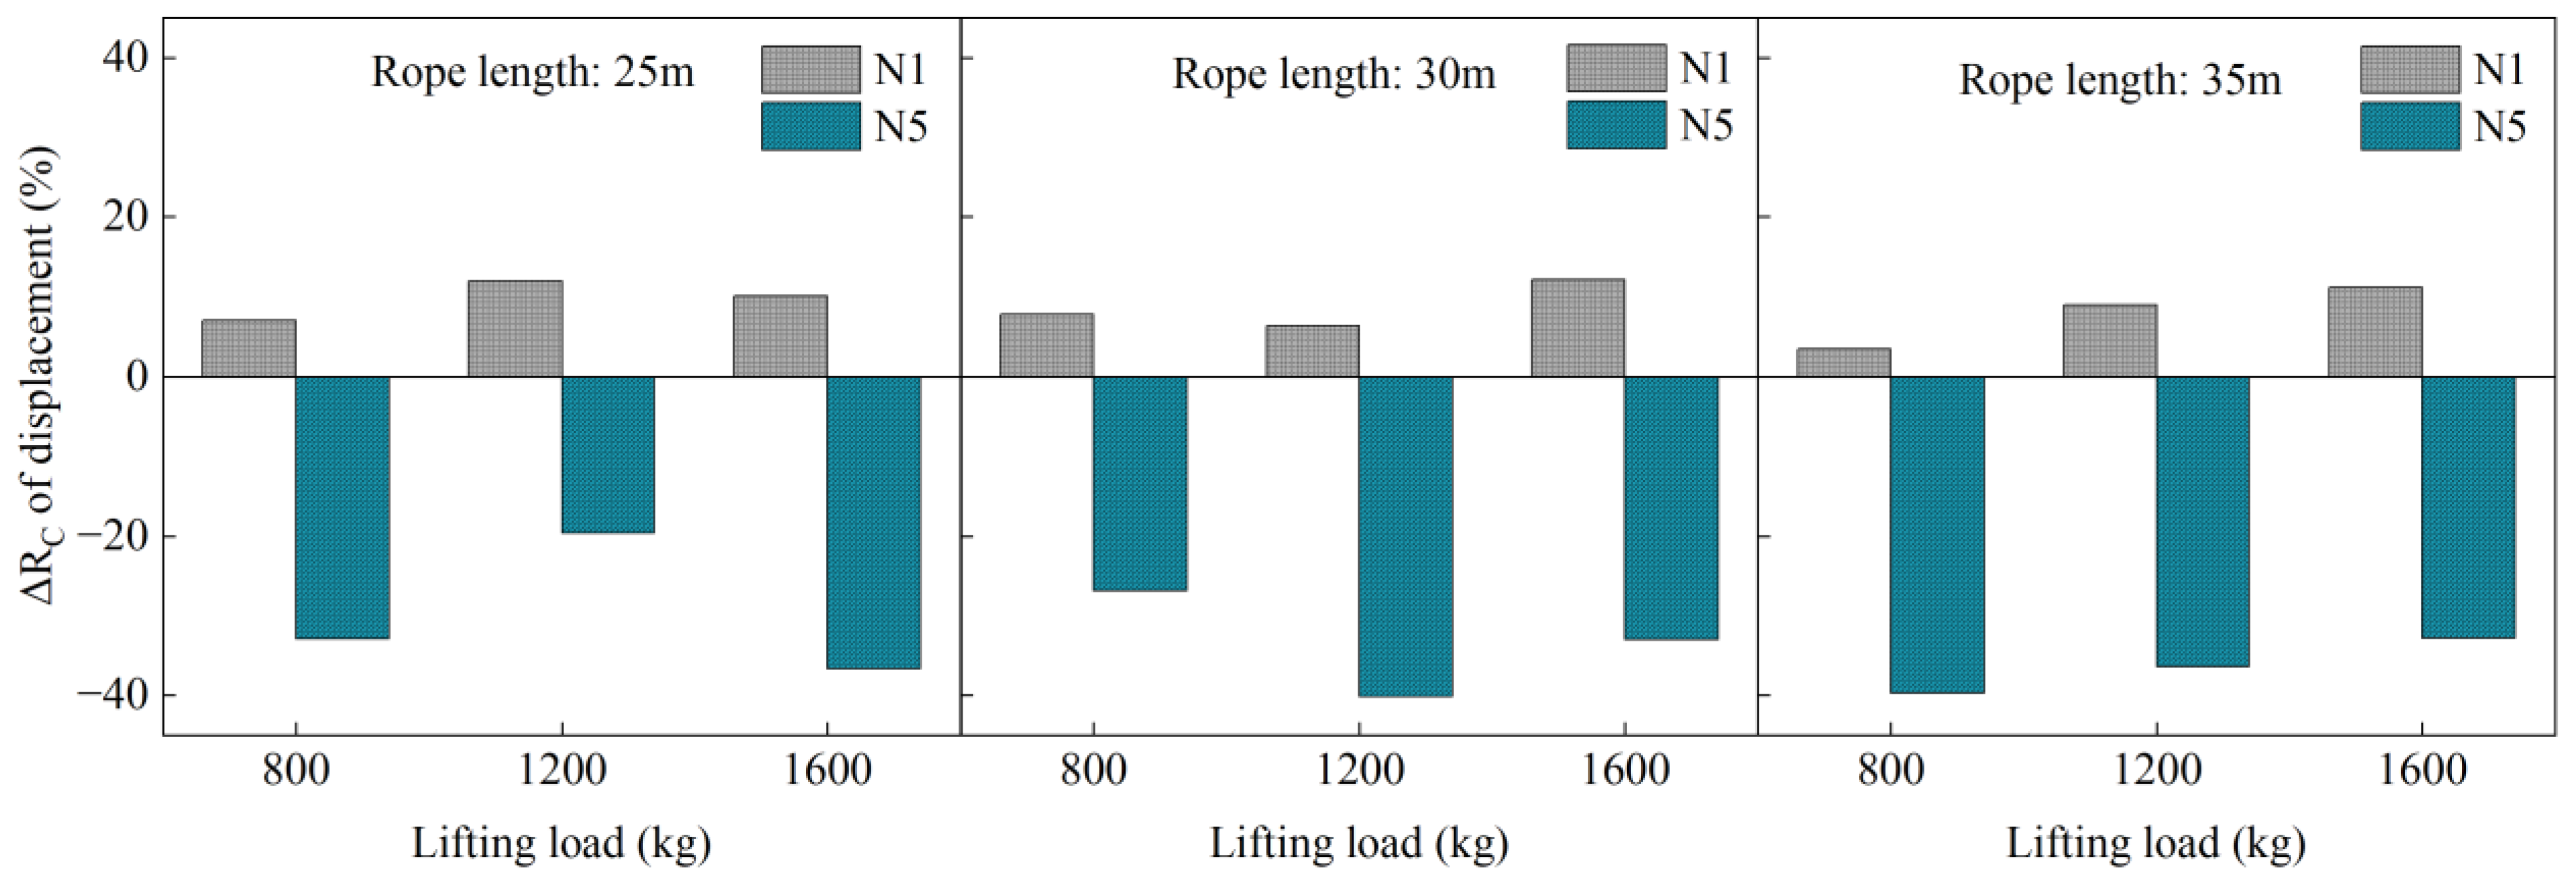
Figure 17 illustrates the variation in the fluctuating displacement in the X-direction at the jib root node (N1) and jib tip node (N5) relative to the no-load condition. The fluctuating displacement at node N1 exhibits minimal variation across different lifting loads. As the lifting load increases, the displacement variation at N1 remains relatively stable, ranging from 3% to 12%. The relative displacement variation at node N1 is consistently positive, indicating that lifting load and rope length changes lead to increased displacement at the jib root. It is likely due to the moments and tensile forces generated by the lifting load, which are transmitted through the jib to the tower body. As a result, the connection point bears more of the forces and bending moments from the entire structure. The increase in lifting load and rope length intensifies the load at this location, causing the displacement to increase. Variations in hoisting rope length and lifted load have a more pronounced impact on the displacement response at the jib tip node (N5) than at node N1. The relative percentage displacement at N5 is predominantly negative, with the pulsating displacement decreasing by 20% to 40% relative to the unloaded condition. While the suspended load increases the static bending moment at the boom end, the high structural stiffness in this region makes its primary effect the increase of overall system mass and inertia, thus altering the dynamic characteristics. The shifted mass distribution modifies the dominant vibration modes and natural frequencies, moving them away from the peak region of the wind load energy spectrum. This reduces the resonant response, demonstrating how the interaction between mass, stiffness, and load modulates structural behavior in a dynamic system.
Figure 17.
Relative percentages of displacement in the X direction of nodes N1 and N5.
3.3. Stress Response Parameters Analysis
3.3.1. Stress Response
Based on the structural symmetry and stress distribution characteristics of the tower crane, seven critical locations prone to fatigue damage were identified and selected for comparative analysis. These include the base elements of the tower body (E1, E2), a midsection element of the tower body (E3), the root element of the counter-jib (E4), a lower chord member of the slewing platform (E5), a lower chord member of the lifting jib (E6), and a diagonal member of the lifting jib (E7), as illustrated in Figure 3. Given that the structural components of the tower crane are primarily subjected to axial loading, axial stress was selected as the principal indicator for fatigue assessment. In the statistical analysis of stress data, the standard deviation is employed as a metric to quantify the degree of dispersion. A smaller standard deviation indicates that the stress values are tightly clustered around the mean, whereas a larger standard deviation reflects greater variability, typically corresponding to higher stress amplitudes. Given the high sensitivity of fatigue damage to stress amplitude, regions exhibiting relatively larger stress standard deviations were preliminarily identified as potential high-risk zones for fatigue failure. These regions were subsequently subjected to detailed fatigue life assessments.
Table 7 summarizes the mean stress values at various locations under different operating conditions. The highest stresses occur at the rotating platform and the lower chord of the jib base, whereas the tower midsection experiences the lowest stress levels. In all operating conditions, the stresses remain within the allowable stress range. A comparison of the average stress variation trends across different structural locations concerning rope length and lifted load indicates that the tower base experiences the most pronounced stress fluctuations. In contrast, stress changes at other locations remain relatively modest. Further analysis of the mean stress values at the tower base under different operating conditions reveals that, as the rope length and lifted load increase, the mean stress in unit E1 steadily rises, whereas that in unit E2 gradually decreases. This behavior is closely related to the sectional properties of the base structural components and the directions of the applied forces. The base is primarily constructed from angle steel, whose sectional eccentricity leads to an uneven distribution of internal forces. Specifically, the E1 is primarily subjected to tensile stress, whereas the E2 unit is mainly under compressive stress. These results underscore the distinct stress distribution patterns characteristic of angle steel structures under varying operational conditions, particularly emphasizing the influence of sectional eccentricity on the structural stress state.
Table 7.
Mean value of axial stress of tower crane (MPa).
Table 8 lists the stress standard deviation values at different locations under various operating conditions. The results show that the stress standard deviation at the tower’s base is significantly higher than at other places. Therefore, the tower base will be considered the key area for fatigue calculation in the subsequent fatigue analysis.
Table 8.
Standard deviation of axial stress of tower crane (MPa).
3.3.2. Variation Law of Jib Stress Response Under Operating Conditions
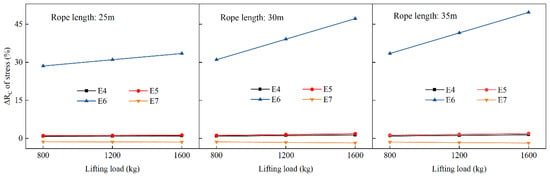
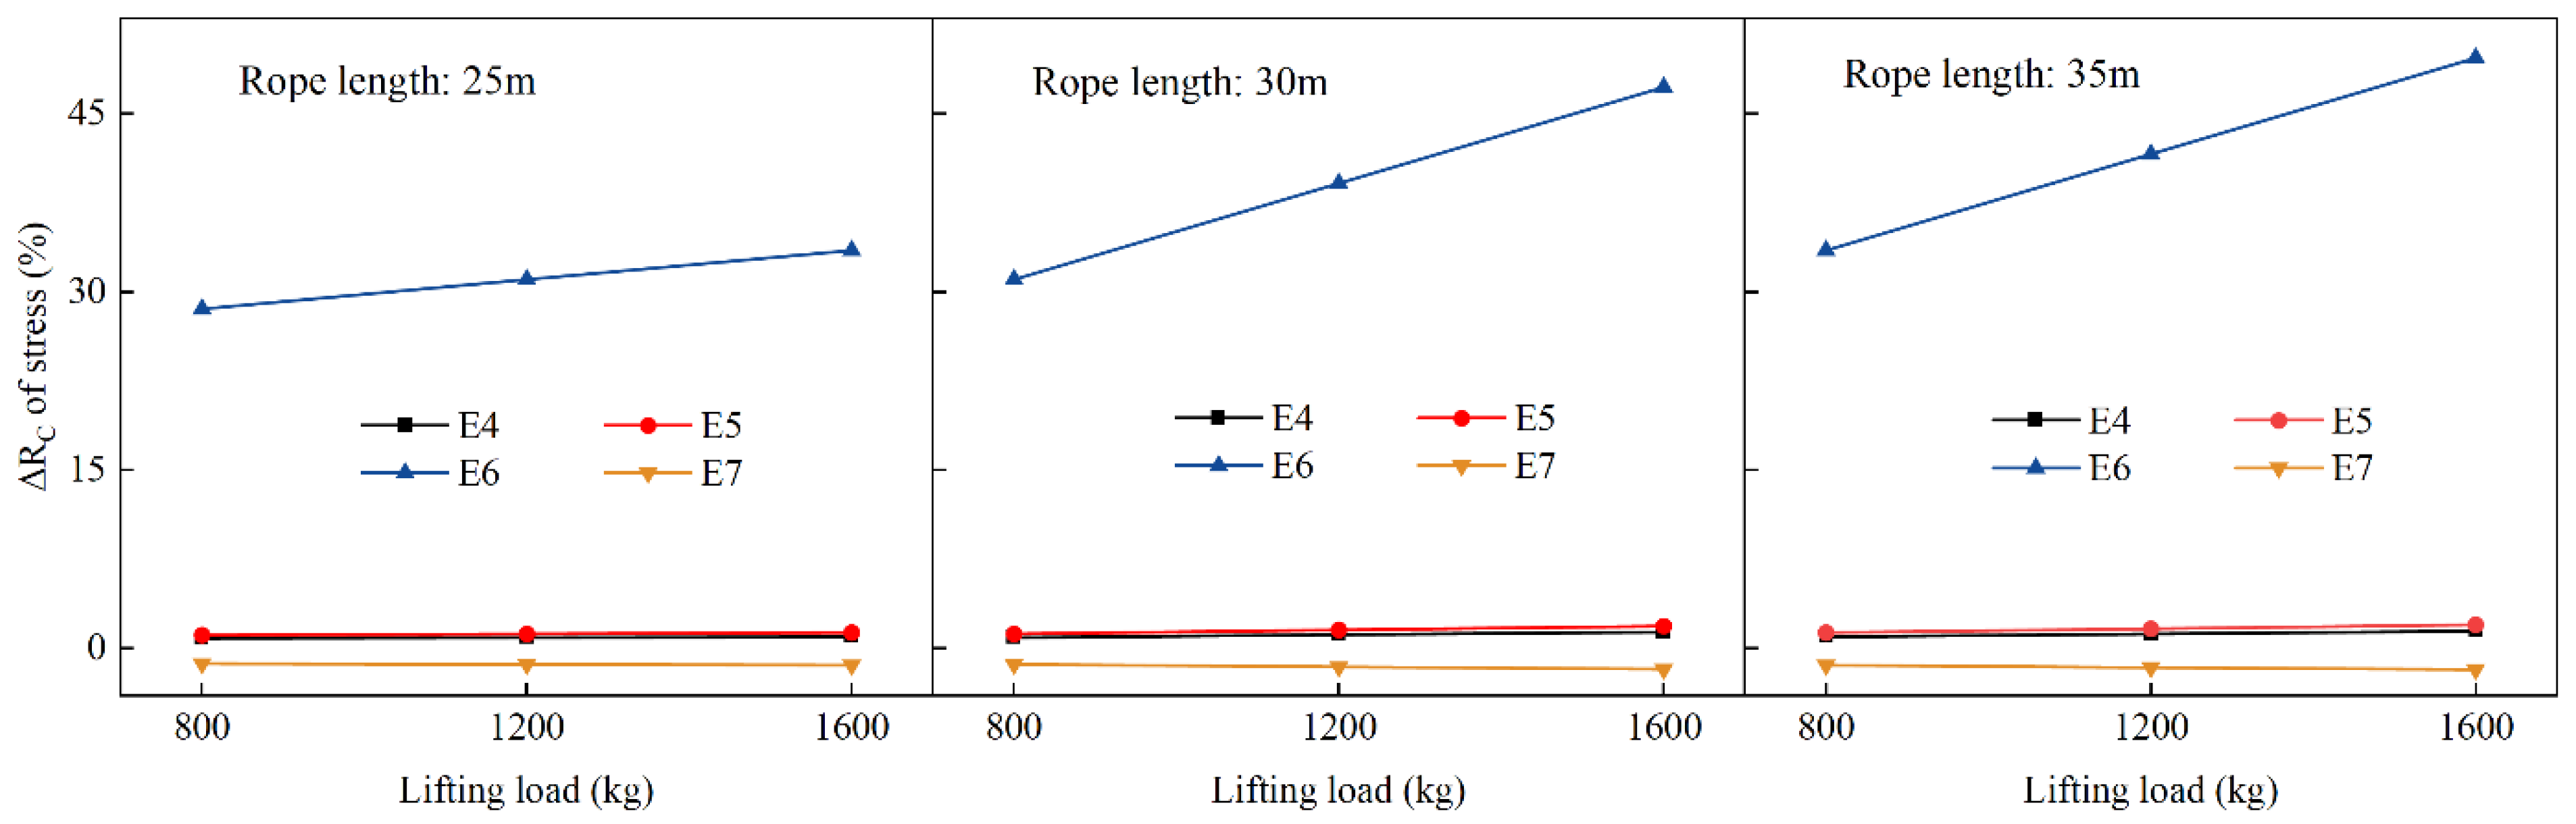
By analyzing the unit stresses in the connection area between the jib and the top of the tower, the relative percentage of the member stress under different operating conditions compared to the stress under the no-load condition was calculated. The key locations involved in the analysis include the balance arm root unit (E4), the lower chord of the tower top (E5), the lower chord of the jib (E6), and the jib diagonal member (E7). Figure 18 illustrates the variation in the relative stress percentage at different jib positions for different lifting loads and rope lengths (25 m, 30 m, 35 m). The stress variations at positions E4, E5, and E6 are positive, showing an increasing trend in stress with the rise in both rope length and lifting load. The stress variation at position E7 is negative, meaning that as the lifting load increases, the stress at position E7 decreases. It indicates that changes in rope length and lifting load mitigate the stress in the jib diagonal member. The design and structural characteristics of the jib diagonal member enable it to effectively accommodate variations in lifting load and rope length while transferring the changes in forces. The stiffness and load-bearing capacity of the diagonal member allow it to mitigate the impact of the load to some extent, reducing stress concentration, which results in a decrease in stress.
Figure 18.
The relative percentage of stress on the jib.
At positions E4, E5, and E7, the relative percentage change in stress remains within 2%, indicating that the impact of load and rope length changes is relatively small. The balance arm lower chord (E4) primarily bears the balancing moment, and its position near the support point results in minimal influence from external loads. The lower chord at the top of the tower (E5) is located at the top of the tower and primarily bears the moment and tensile forces transmitted from the tower. As a result, its sensitivity to changes in load and rope length is relatively low. The jib diagonal brace (E7) primarily bears the shear forces and diagonal tensile forces from the jib. Due to the large angle of the brace, it mainly experiences stress components that are different from those in the vertical direction. As a result, the load and rope length changes have a less significant effect on its stress than the prominent chord members.
Compared to other locations, the main chord member of the jib (E6) is most sensitive to variations in lifted load and hoisting rope length, with stress variations ranging from 29% to 50%. The stress at E6 increases approximately linearly with increasing lifted load. When the hoisting rope length is 25 m, the stress variation ranges from 29% to 45%; as the rope length increases to 35 m, it reaches up to 50%. The main chord members of the jib directly resist tensile and bending stresses induced by the lifted load. This effect is especially pronounced under conditions of longer hoisting ropes and heavier loads, where the lever effect becomes more significant. As the lifted load increases, the tensile force exerted by the hoisting rope directly acts on the main chord members, causing notable stress variations. With increasing rope length, larger bending moments are generated at the distal end of the jib, significantly amplifying the bending stress in the main chord members and resulting in an overall increase in their stress levels.
Overall, the increase in rope length and load primarily exacerbates the stress on the main chord member of the jib, with limited impact on the stress of other jib components. Therefore, special attention should be given to the main chord member of the crane arm, with reinforced structural design and optimization to enhance the safety and reliability of the tower crane.
4. Fatigue Life Assessment of the Tower Crane
4.1. Fatigue Damage Theory
Fatigue damage accumulation is a critical factor in predicting structural service life. The Palmgren-Miner linear cumulative damage theory (commonly referred to as Miner’s Rule) has been widely adopted in predicting the fatigue life of structures due to its simplicity, computational efficiency, and minimal parameter requirements [38,39,40,41]. It has been validated in numerous engineering applications, demonstrating reasonable accuracy in estimating structural fatigue life. The theory is particularly well-suited for high-cycle fatigue assessments. This approach assumes that stress cycles are independent and that fatigue damage accumulates linearly over time. Structural fatigue failure is considered to occur when the cumulative damage reaches a critical threshold [42]. The cumulative fatigue damage is evaluated using the following expression:
where represents the cumulative damage value; When D > 1, the structure fails and becomes ineffective. When 0 < D < 1, the structure has sustained damage but has not yet failed. represents the actual number of load cycles corresponding to the -th stress amplitude , which is obtained using the rain flow counting method. determined by the S–N curve, denotes the allowable number of cycles under the same stress amplitude .
The rain flow counting method is the most widely used due to its high computational efficiency and broad applicability. It is extensively employed in developing fatigue load spectra and fatigue life prediction. [43,44,45]. This method can identify the turning points within the load history and record complete hysteresis loops. By decomposing the measured load history—verified via peak and valley detection—into discrete load cycles, the method determines the number of cycles occurring at various stress amplitudes and mean stress levels. It enables an accurate reflection of the fatigue failure behavior of structural components under cyclic loading.
4.2. Comparison of Fatigue Assessment Standards
4.2.1. European Standard
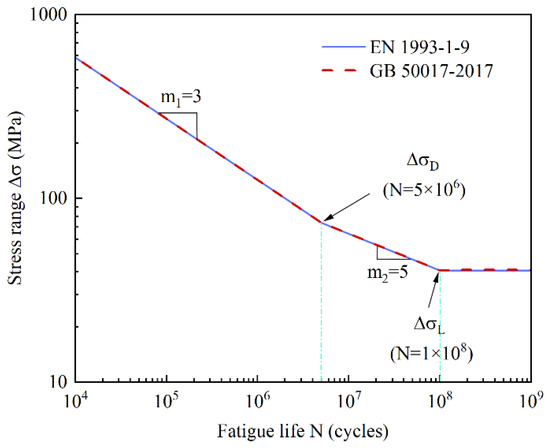
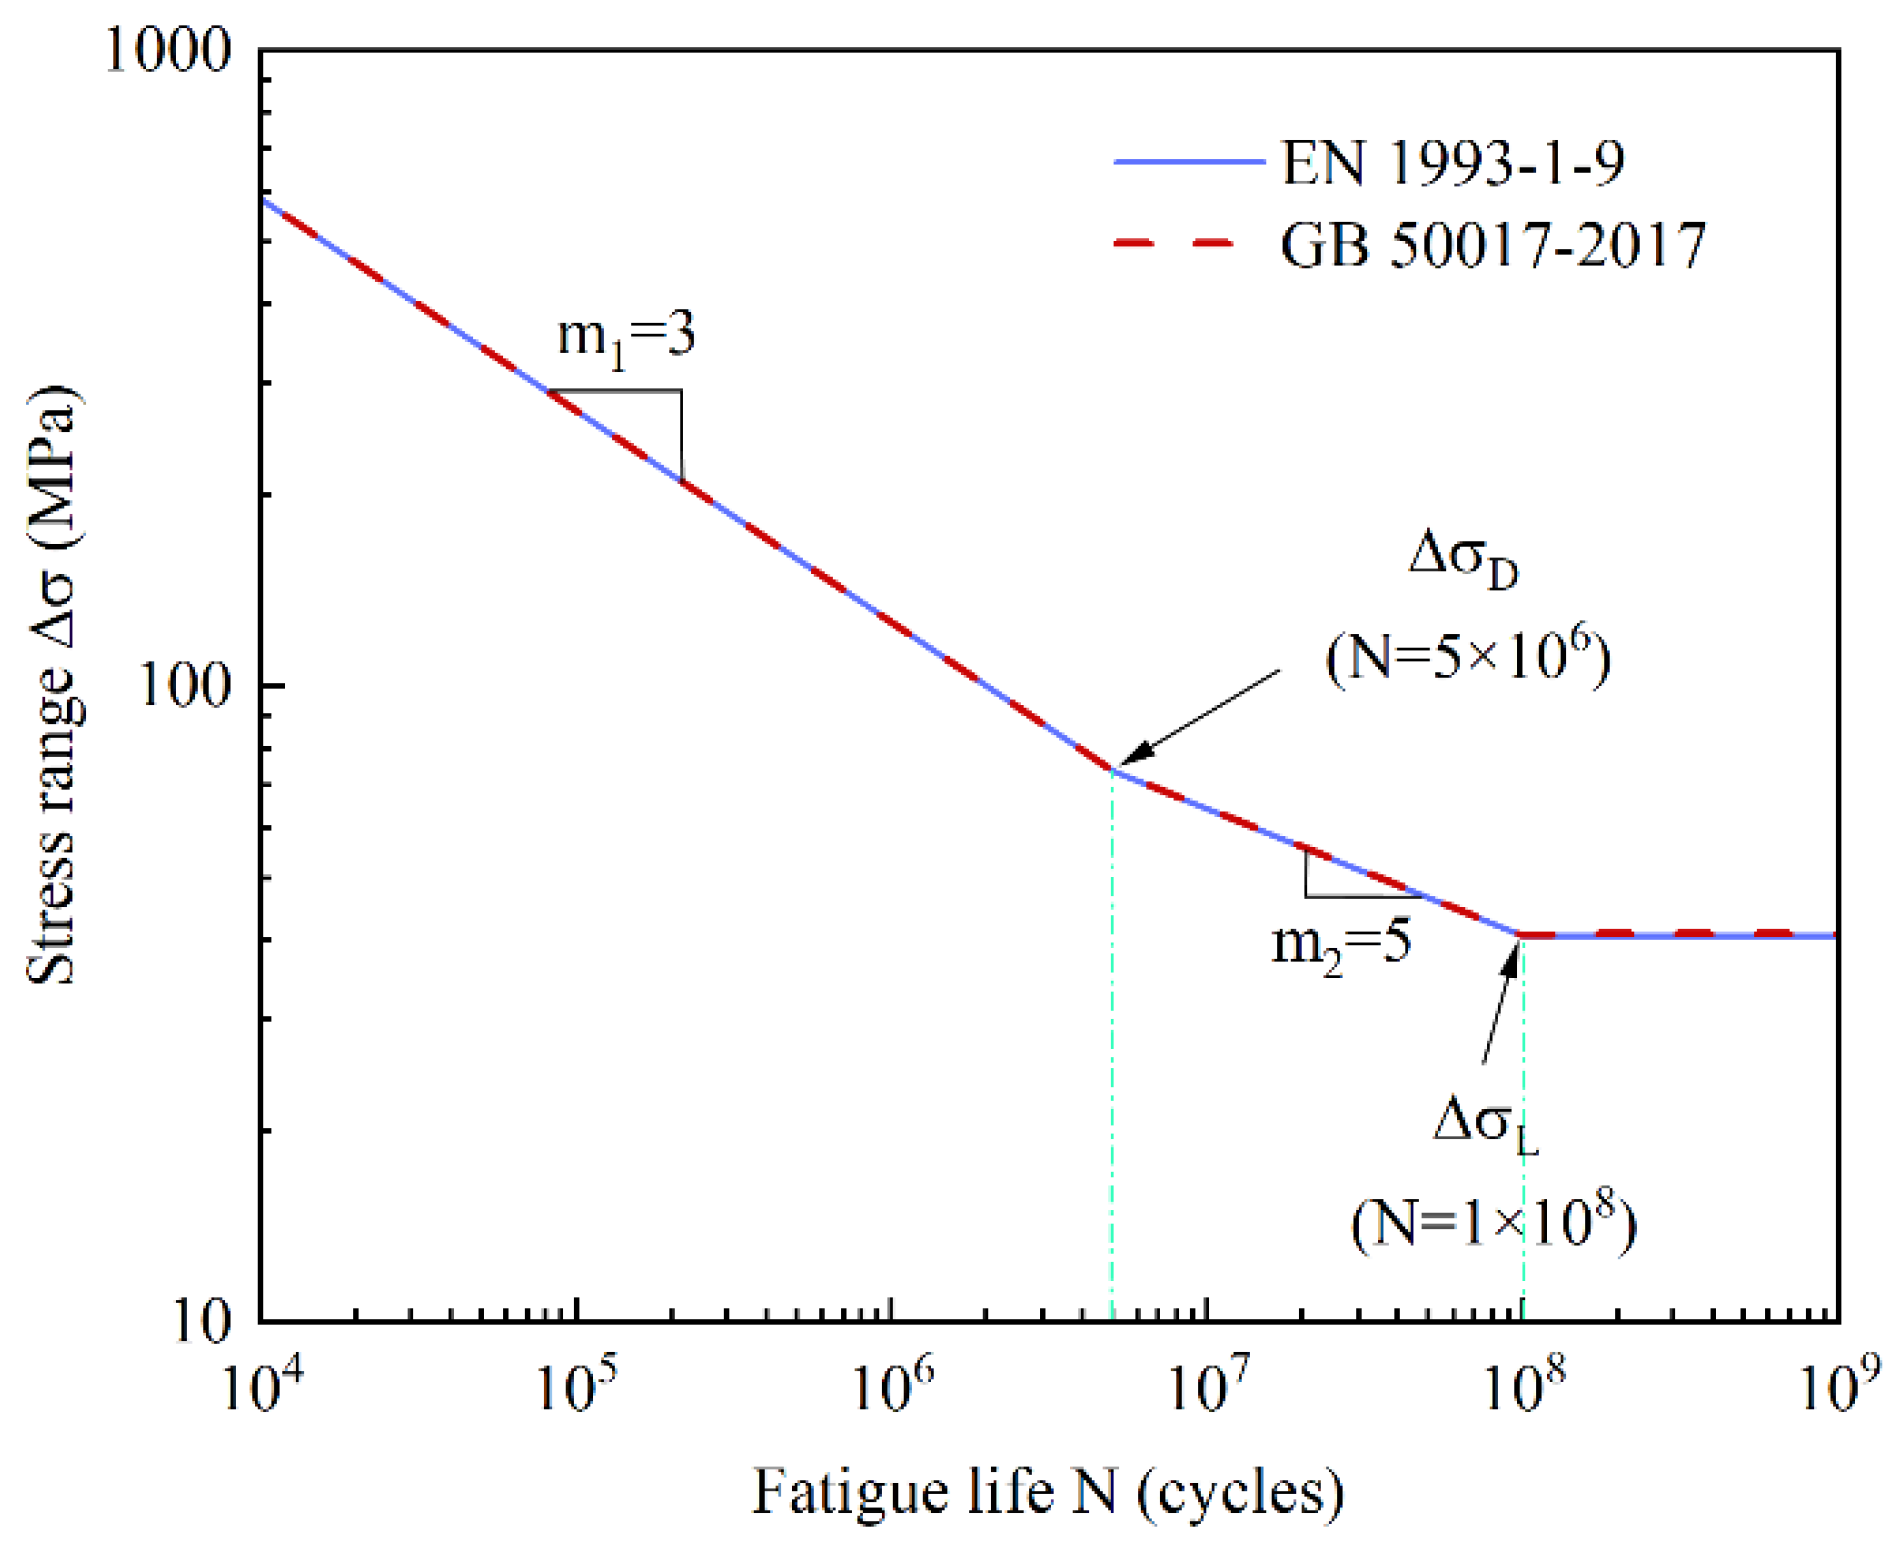
Following EN 1993-1-9 [46], fatigue assessments for tower cranes are performed by evaluating the cumulative fatigue damage derived from the obtained stress time histories. This standard adopts a limit state design method based on probabilistic theory and reliability concepts. It defines 14 S-N curves, covering various types of welded joints and connection details used for variable amplitude fatigue analysis of steel structures. The S–N curves specified in the standard are presented in a bilinear form, featuring distinct slopes for different fatigue life ranges to more accurately capture the effects of low-stress amplitudes on fatigue life. The specific form of the S–N curve is expressed as follows:
where represents the allowable stress range (MPa); is the stress range for 2 × 10⁶ cycles. Based on the welding type of the tower crane components, it is determined from the table that = 100 MPa; N is the number of stress cycles; is the constant amplitude fatigue limit, and is the fatigue cut-off limit.
4.2.2. Chinese Standard
GB 50017-2017 [47] adopts the allowable stress method for fatigue design. Its fatigue calculation approach is based on EN 1993-1-9 [46], utilizing a double-bend S-N curve to describe the fatigue life of steel structures. The fatigue life under the normal stress range is calculated using the following expressions:
where represents the stress range; and are parameters related to the component and connection category. According to the classification of this type of tower crane component, the tabulated values are = 2 × 10¹² and = 3. denotes the fatigue cut-off limit, with = 41 MPa.
Different steel structure design codes vary in terms of structural details, classification types, S-N curve forms, and parameter definitions. Both the European and Chinese standards adopt bilinear S-N curves. To account for the effects of low stress ranges, both codes establish a fatigue cut-off limit at N = 1 × 10⁸ cycles. As shown in Figure 19, the S-N curves from the European and Chinese standards are nearly identical, demonstrating a high degree of consistency between the two codes.
Figure 19.
S-N curve in the specification.
4.3. Fatigue Life of the Tower Crane
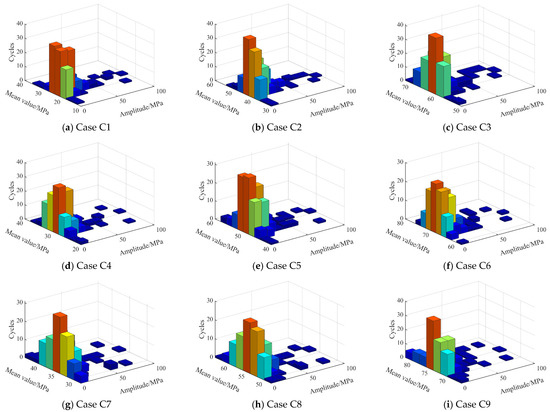
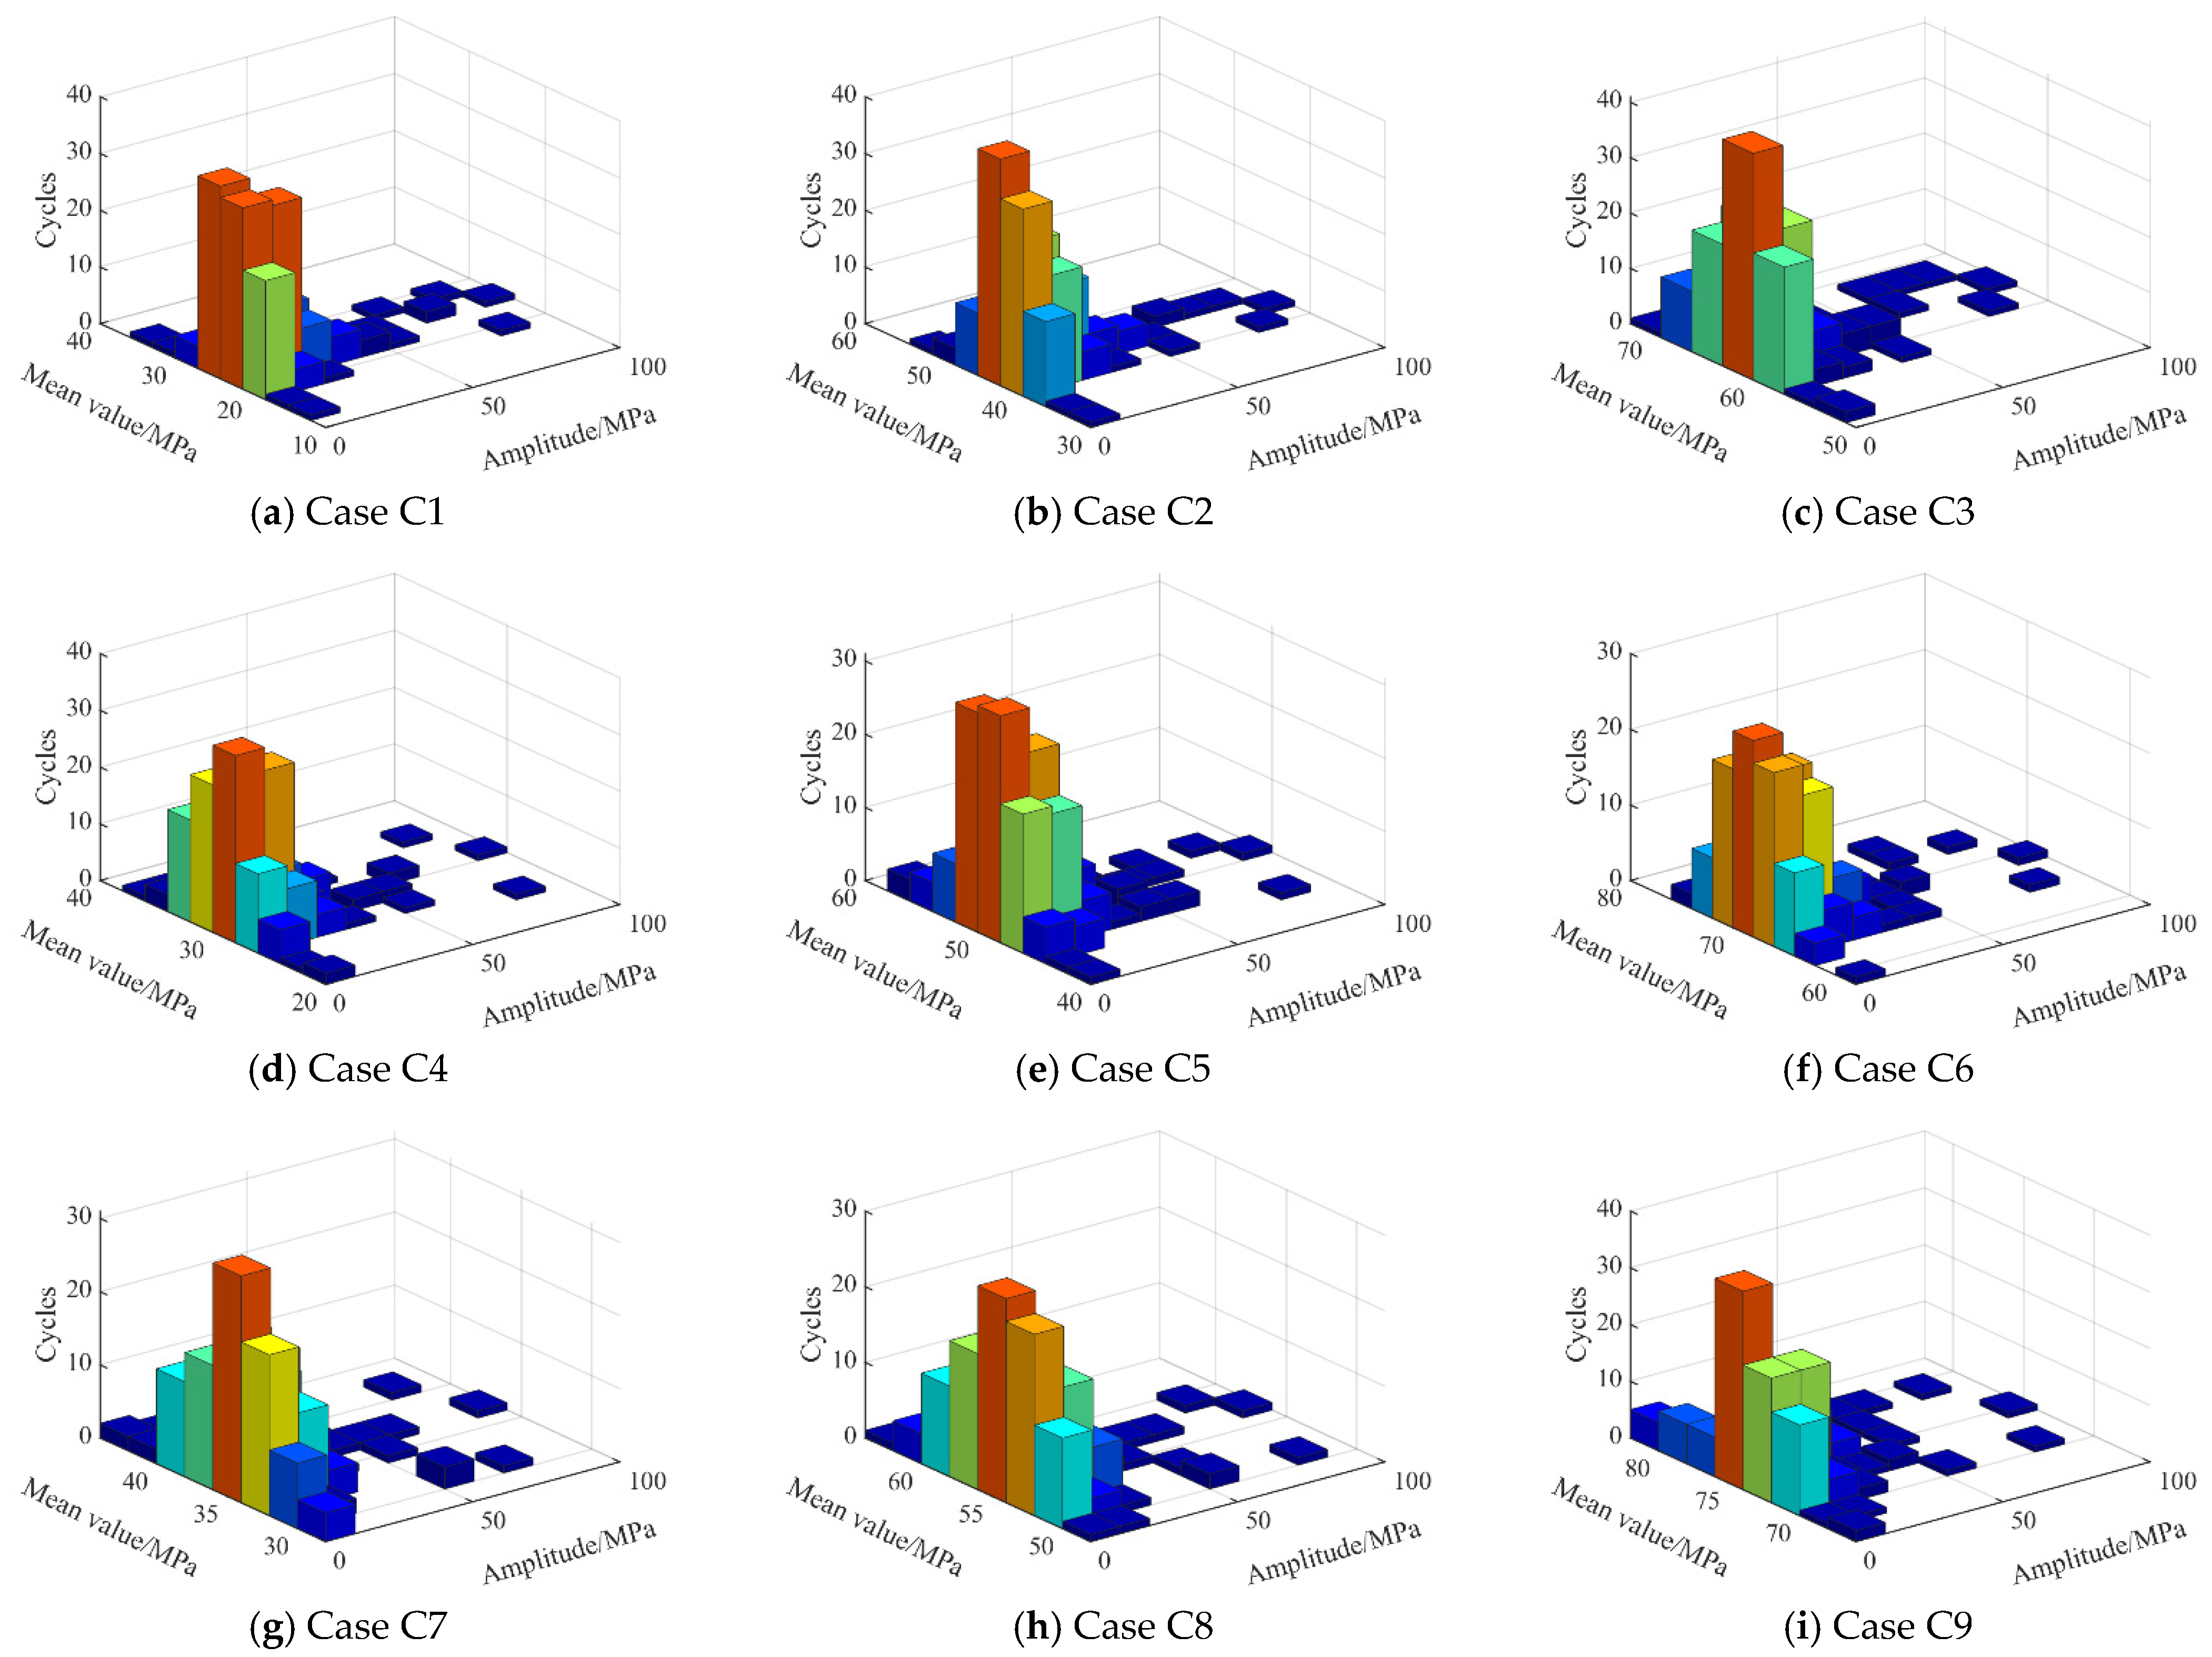
Based on the stress analysis results in Section 3.3, the stress time histories of the E1 and E2 elements at the tower crane’s base were extracted over 600 s under various operating conditions. The rain flow counting method was employed to statistically analyze the stress ranges and corresponding cycle counts within each time history. Subsequently, Miner’s Rule calculated fatigue damage values for the tower crane components. Assuming the tower crane operates 300 days per year, with 10 working hours per day, the fatigue life of its critical components was estimated. The rain flow counting method was applied to process the stress responses of the structural elements. Figure 20 presents the 3D histograms of rain flow stress distributions for the tower base elements under different operating conditions. In the figure, the X-axis represents the stress range, the Y-axis denotes the mean stress, and the Z-axis corresponds to the number of cycles.
Figure 20.
Stress distribution at the root of the tower under different loading cases (C1–C9). The three-dimensional histograms represent the joint distribution of stress mean value, stress amplitude, and corresponding cycle counts, where the color variation of the bars reflects the magnitude of the cycle counts.
Table 9 summarizes the fatigue life of the windward-side element E1 and the leeward-side element E2 at the tower base under various rope lengths and lifting loads, evaluated following Chinese and European standards. The results indicate high consistency between the two codes in fatigue life prediction. The fatigue life estimated based on the Chinese code is slightly higher than that of the European code, but the difference does not exceed 1%. The fatigue life predictions of GB 50017-2017 and EN 1993-1-9 exhibit significant convergence. This similarity arises from their shared adoption of the S-N curve and linear cumulative damage theory, along with comparable classifications for common structural details. While these standards offer consistent guidance for preliminary design under moderate stress ranges, it is essential to adhere to the local mandatory codes for final engineering application, as subtle differences in classification and detail provisions may lead to divergence in specific cases.
Table 9.
Fatigue life of tower root members.
Under load case C9, the tower crane exhibits the shortest fatigue life. The fatigue life of member E1 is longer than that of member E2, indicating that E2 is subjected to greater stress and deformation, leading to more severe fatigue damage and a shorter service life. The variation in fatigue life among members is closely related to their respective stress characteristics and load-bearing behavior. With the increase in lifting load, the fatigue life shows a gradual decreasing trend. Heavier lifting loads lead to shorter fatigue life of the structural members, as the induced stress amplitudes increase correspondingly, accelerating fatigue damage accumulation. Under the same lifting load, the fatigue life trends of E1 and E2 exhibit opposite behaviors: the fatigue life of E1 increases with increasing rope length, whereas that of E2 decreases as the rope length increases, indicating that variations in rope length have different effects on distinct regions of the tower crane.
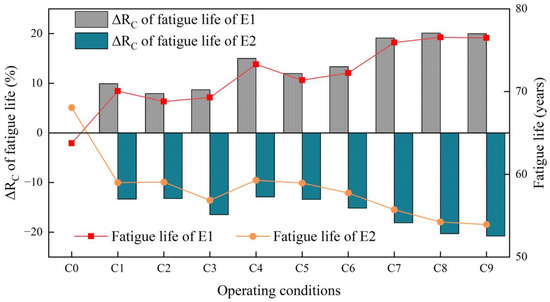
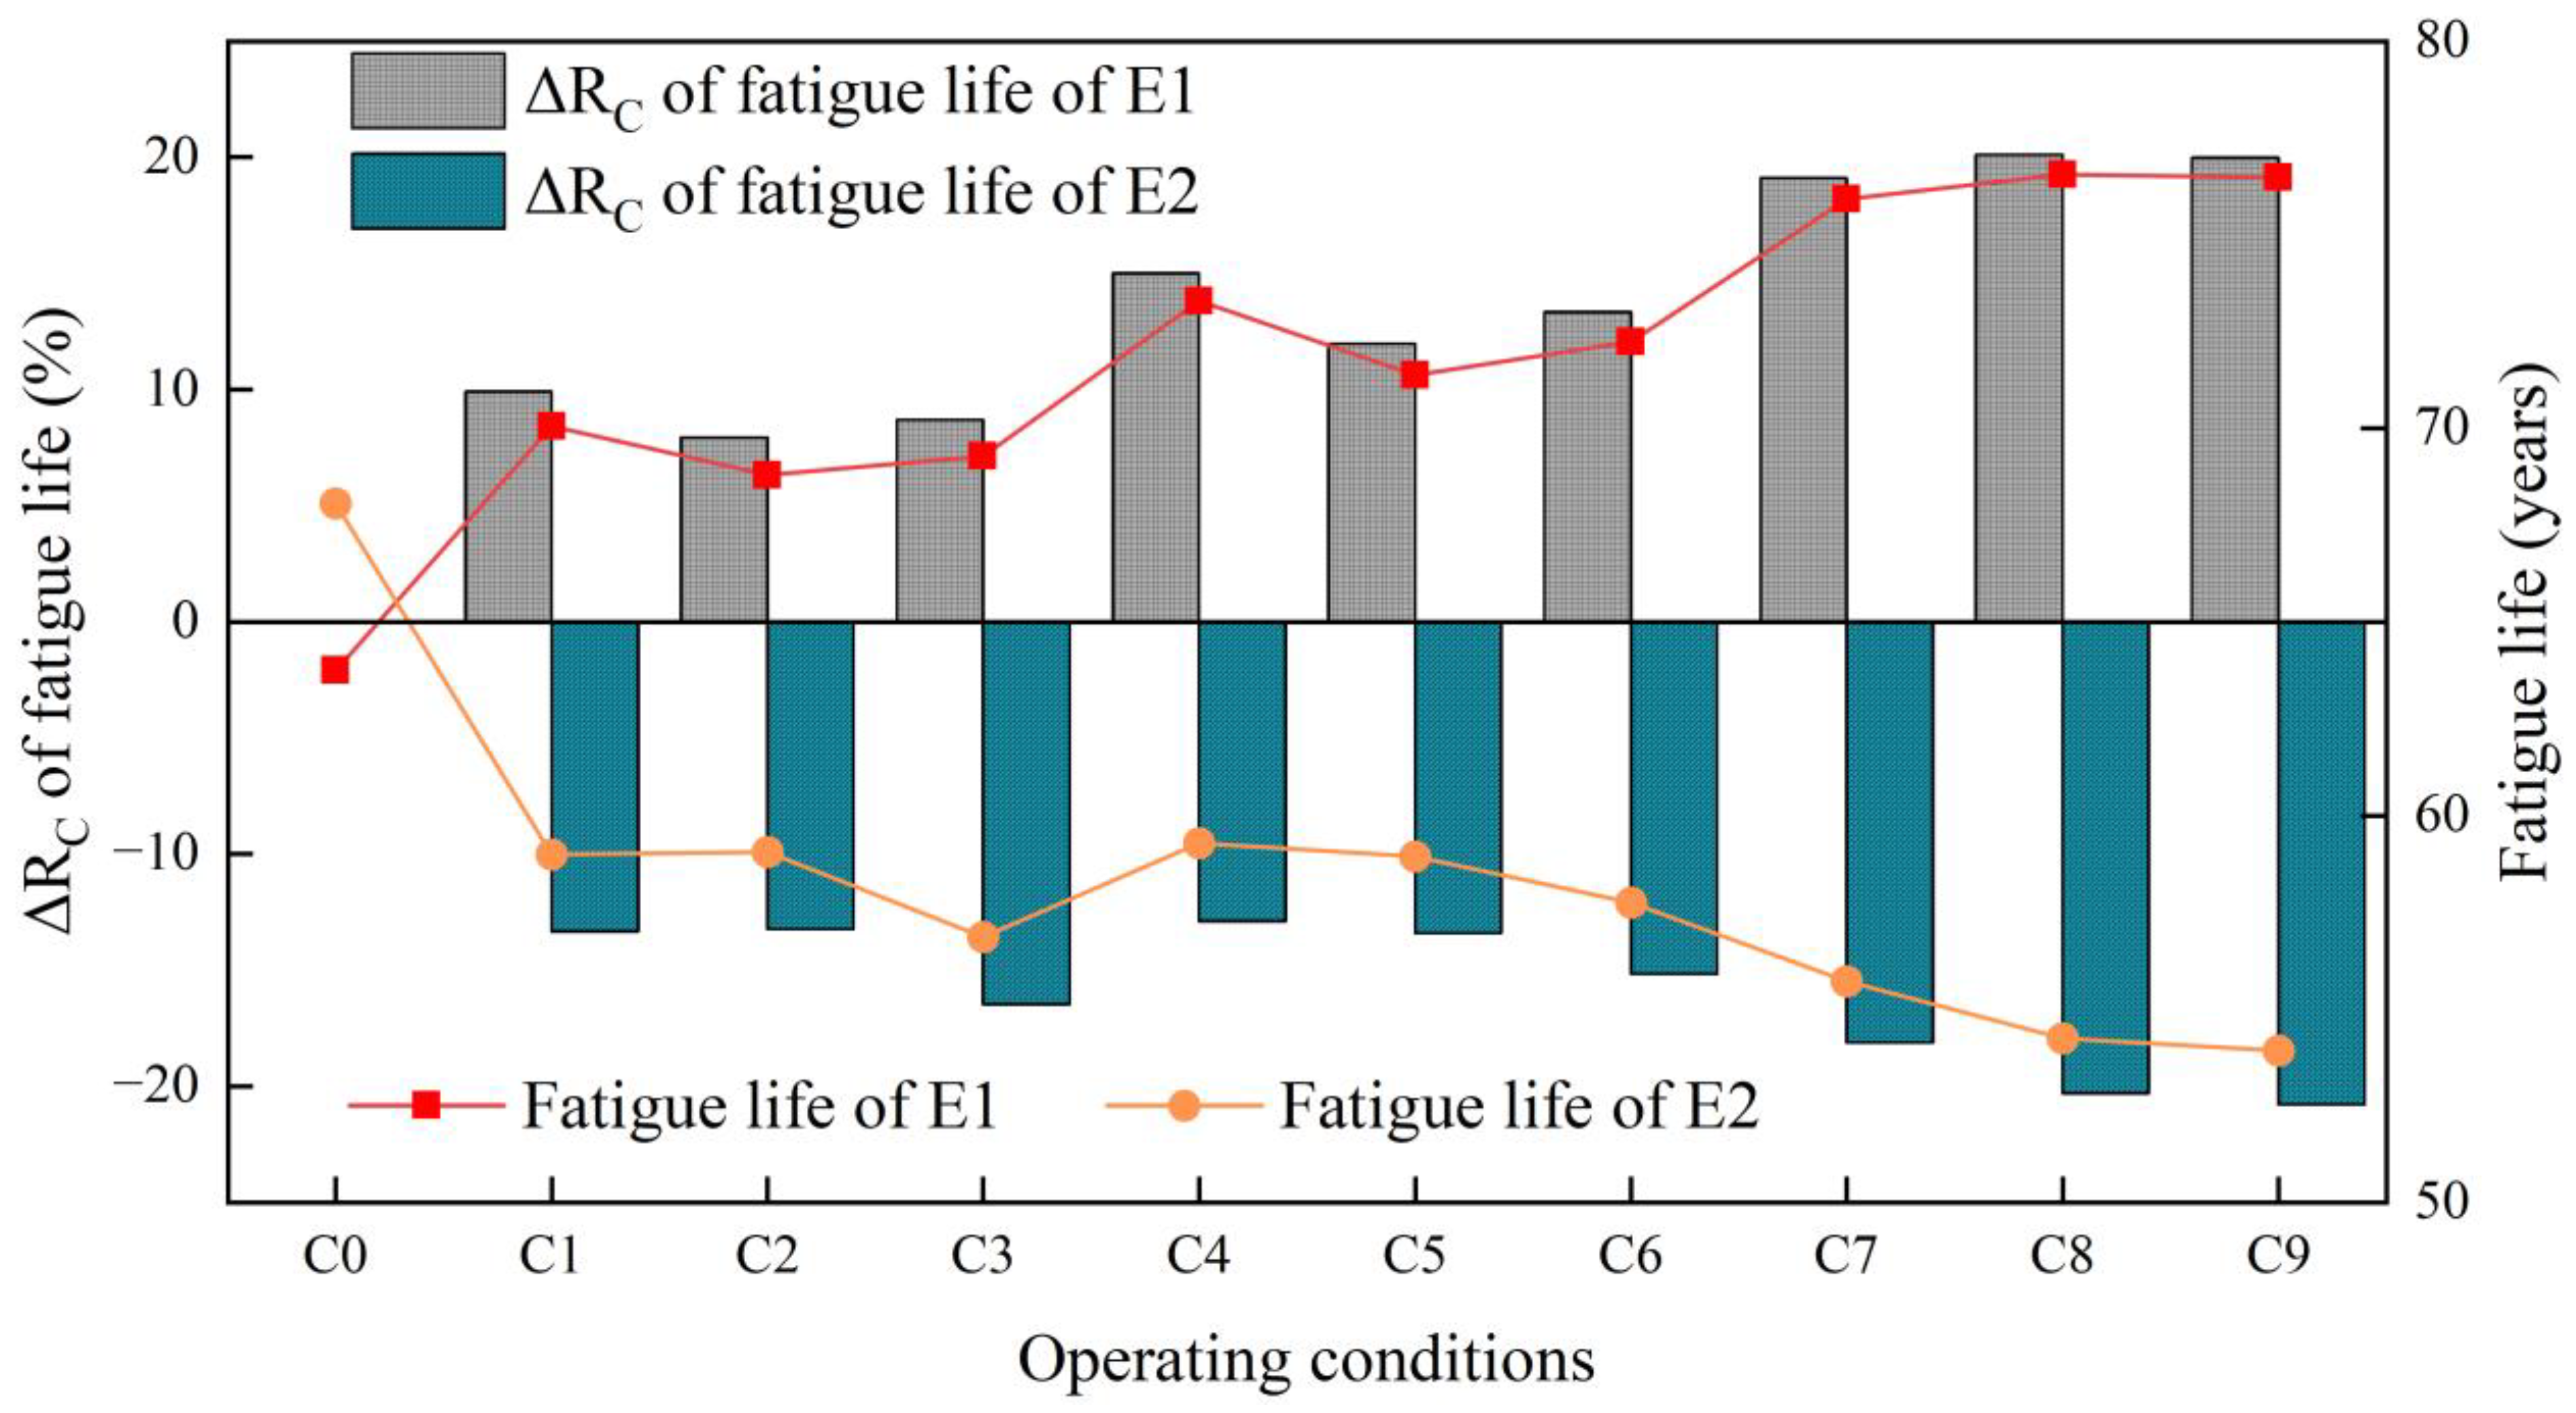
Given the high consistency between the Chinese and European code results, the fatigue life predictions based on the European code are used as an example. Figure 21 illustrates the percentage variation in the fatigue life of tower crane components under different load cases relative to the no-load condition. The results show that the relative change in fatigue life for component E1 is positive, whereas for component E2 it is negative. It indicates that, under operating conditions, the fatigue life of E1 is extended compared to the no-load case, while that of E2 is significantly reduced. Specifically, the fatigue life of E1 increases by approximately 8–20%, whereas E2 decreases by about 13–21%.
Figure 21.
The of fatigue life for E1 and E2 under different operating conditions.
Under wind loading, the windward-side member E1 is subjected to tensile forces, as indicated by the positive mean stresses in Table 7. The stress fluctuation amplitudes under operating conditions are consistently lower than those in the no-load condition (see Table 8). In contrast, the leeward-side member E2 experiences compressive stresses, and its stress fluctuation amplitudes under operating conditions exceed those observed in the no-load case. Since the stress range strongly influences the fatigue life of tower crane components, larger stress fluctuations correspond to increased fatigue damage. Consequently, the fatigue life of E1 increases relative to the no-load condition, while that of E2 decreases.
The fatigue life of the tower root components is fundamental to the crane’s long-term structural durability under cyclic operation. Serving as the critical structural nexus for load transfer, this region is subjected to complex stress cycles, rendering its fatigue resistance the life-limiting detail that governs the service lifespan of the entire crane.
Figure 21 illustrates that the influence of hoisting rope length on fatigue life is more pronounced. As the hoist rope length increases, the fatigue life of member E1 gradually increases, with a 10% increase in fatigue life when the rope length is 35 m compared to 25 m. Conversely, the fatigue life of member E2 gradually decreases, exhibiting a 6% reduction when the hoisting rope length increases from 25 to 35 m.
5. Conclusions
This study accurately identified the natural frequencies of the tower crane structure through stress measurements at the crane base. Subsequently, it developed a detailed finite element model of the flat-jib tower crane based on these findings. The effects of system parameters on the dynamic characteristics and wind-induced responses of the tower crane structure were investigated. The fatigue life of critical tower crane components was assessed, and the influence of system parameters on fatigue life under various operating conditions was comprehensively analyzed. The main conclusions are summarized as follows:
(1) The natural frequencies of the tower crane in the X (perpendicular to the jib) and Z (vertical) directions decrease with increasing lifted load and hoisting rope length. Additionally, the farther the lifting position is from the tower body, the more pronounced the frequency attenuation. When the lifted load increases from 800 kg to 2000 kg, the first-order natural frequency in the X-direction decreases by approximately 12.5%. Similarly, as the hoisting rope length increases from 15 m to 35 m, the first-order frequency in the X-direction decreases by about 14.2%. Under a rope length of 35 m, the first-order natural frequency at the jib tip is reduced by up to 37% compared to that at the jib root.
(2) The wind-induced response analysis under various operating conditions reveals that the power spectral density of the jib tip displacement exhibits a distinct peak at the structure’s first natural frequency, indicating that the first vibration mode predominantly governs the dynamic response of the tower crane. Under various operating conditions, the displacement of the jib tip node is most significantly influenced by the lifting load and hoisting rope length, exhibiting a reduction of 20–40% compared to the unloaded condition. In contrast, the displacement at the junction between the tower body and the jib is less sensitive to system parameters, showing an increase of only 3–12% relative to the unloaded state.
(3) Stress analysis reveals that the base of the tower crane experiences the most pronounced stress fluctuations and exhibits the highest standard deviation, identifying it as a critical region for fatigue assessment. The main chord member of the jib (E6) demonstrates high sensitivity to stress variations, with stress levels increasing linearly as hoisting rope length and lifted load increase, exhibiting a variation range of 29–50%. The results indicate that hoisting rope length and lifted load primarily influence the stress in the main chord members of the jib, whereas other jib components are less affected.
(4) A comparison of the fatigue life of tower base components under various operating conditions, evaluated according to both Chinese and European standards, demonstrates a high degree of consistency. Notably, the fatigue life estimated using the Chinese standard is slightly longer than that predicted by the European standard. The rope length exerts a more pronounced influence on fatigue life. With increasing rope length, the fatigue life of windward-side components gradually improves, while that of leeward-side components correspondingly declines. Under operating conditions, the fatigue life of windward-side components increases by 8% to 20% relative to the unloaded state, whereas that of leeward-side components decreases by 13% to 21%. In comparison, the lifted load exerts a comparatively minor influence on fatigue life.
This study conducted a wind-induced fatigue life prediction for the flat-jib tower crane. Regarding the fatigue issues of flat-jib tower crane components, the following preventive measures are recommended. During construction operations, operating conditions should be strictly controlled to avoid prolonged operation at the maximum lifting radius, and a reasonable safety threshold for lifted loads should be established to reduce the impact of alternating stress on fatigue life. Additionally, it is recommended to establish an intelligent monitoring system based on Internet of Things (IoT) technology. By deploying a network of sensors, real-time monitoring and early warning of fatigue damage in critical components can be achieved, thereby effectively enhancing the fatigue resistance and operational safety of the tower crane.
Author Contributions
Conceptualization, H.Y., X.H. and W.A.; methodology, B.M., K.W. and Z.W.; investigation, Y.Y., Q.Z. and Y.X. writing—original draft preparation, B.M., Q.Z. writing—review and editing, B.M. and Q.Z. All authors have read and agreed to the published version of the manuscript.
Funding
This work was supported by the Henan Province Science and Technology Research and Development Program Joint Fund (Applied Research Category) Project (242103810102), the Henan Province Science and Technology Research Projects (252102240082 and 242102320046), the Key Research Programs of Higher Education Institutions in Henan Province (24B560012), the China State Construction Engineering Corporation Scientific Research Project (CSCEC-2021-Q-63).
Data Availability Statement
The data presented in this study are available on request from the corresponding author.
Conflicts of Interest
Authors Kaiqiang Wang and Hui Yang were employed by the company China Construction Third Engineering Bureau Group Co., Ltd. Author Wei An was employed by the company Power China Henan Electric Power Engineering Co., Ltd. The remaining authors declare that the research was conducted in the absence of any commercial or financial relationships that could be construed as a potential conflict of interest.
References
- Hu, S.; Fang, Y.; Moehler, R. Estimating and visualizing the exposure to tower crane operation hazards on construction sites. Saf. Sci. 2023, 160, 106044. [Google Scholar] [CrossRef] [Scilit]
- Zhang, M.; Jing, X.; Zhou, Z.; Sun, M. Rapid and restricted swing control via adaptive output feedback for 5-DOF tower crane systems. Mech. Syst. Signal Process. 2024, 212, 111283. [Google Scholar] [CrossRef] [Scilit]
- Lu, Y.; Gao, M.; Liang, T.; He, Z.; Feng, F.; Pan, F. Wind-induced vibration assessment of tower cranes attached to high-rise buildings under construction. Autom. Constr. 2022, 135, 104132. [Google Scholar] [CrossRef] [Scilit]
- Chen, J.; Chi, H.; Du, Q.; Wu, P. Investigation of operational concerns of construction crane operators: An approach integrating factor clustering and prioritization. J. Manage. Eng. 2022, 38, 04022020. [Google Scholar] [CrossRef] [Scilit]
- Zhang, W.; Xue, N.; Zhang, J.; Zhang, X. Identification of critical causal factors and paths of tower-crane accidents in China through system thinking and complex networks. J. Constr. Eng. Manag. 2021, 147, 04021174. [Google Scholar] [CrossRef] [Scilit]
- Chen, Y.; Zeng, Q.; Zheng, X.; Shao, B.; Jin, L. Safety supervision of tower crane operation on construction sites: An evolutionary game analysis. Saf. Sci. 2022, 152, 105578. [Google Scholar] [CrossRef] [Scilit]
- Li, Q.; Fan, W.; Huang, M.; Jin, H.; Zhang, J.; Ma, J. Machine learning-based prediction of dynamic responses of a tower crane under strong coastal winds. J. Mar. Sci. Eng. 2023, 11, 803. [Google Scholar] [CrossRef] [Scilit]
- Tomczyk, J.; Cink, J.; Kosucki, A. Dynamics of an overhead crane under a wind disturbance condition. Autom. Constr. 2014, 42, 100–111. [Google Scholar] [CrossRef] [Scilit]
- Lu, Y.; Zhang, L.; He, Z.; Feng, F.; Pan, F. Wind-induced vibration fragility of outer-attached tower crane to super-tall buildings: A case study. Wind Struct. 2021, 32, 405–421. [Google Scholar] [CrossRef]
- Liu, Q.; Zhang, R.; Sun, S.; Zhang, J. Aerodynamic load variation and wind-induced vibration analysis of tower cranes under full wind angles. Int. J. Acoust. Vib. 2024, 29, 101–115. [Google Scholar] [CrossRef] [Scilit]
- He, Z.; Gao, M.; Liang, T.; Lu, Y.; Lai, X.; Pan, F. Tornado-affected safety assessment of tower cranes outer-attached to super high-rise buildings in construction. J. Build. Eng. 2022, 51, 104320. [Google Scholar] [CrossRef] [Scilit]
- Liu, Y.; Wang, H.; Xu, Z.; Mao, J. Wind-resistant reliability assessment of a super-high tower crane considering the randomness and correlation of turbulent spectral parameters. Thin-Walled Struct. 2024, 200, 111850. [Google Scholar] [CrossRef] [Scilit]
- Wang, H.; Liu, Y.; Xu, Z.; Mao, J.; Li, B. Wind-induced buffeting comfort assessment of tower cranes considering the wake effect of super-high bridge towers. J. Wind Eng. Ind. Aerodyn. 2023, 240, 105469. [Google Scholar] [CrossRef] [Scilit]
- Chen, W.; Qin, X.; Yang, Z.; Zhan, P. Wind-induced tower crane vibration and safety evaluation. J. Low Freq. Noise Vib. Act. Control 2020, 39, 297–312. [Google Scholar] [CrossRef] [Scilit]
- Wu, X.; Sun, Y.; Wu, Y.; Su, N.; Peng, S. The interference effects of wind load and wind-induced dynamic response of quayside container cranes. Appl. Sci. 2022, 12, 10969. [Google Scholar] [CrossRef] [Scilit]
- Pástor, M.; Lengvarský, P.; Hagara, M.; Kuľka, J. Experimental investigation of the fatigue life of a bridge crane girder using SN method. Appl. Sci. 2022, 12, 10319. [Google Scholar] [CrossRef] [Scilit]
- Wei, G.; Yin, Q.; Zhao, Y.; Dang, Z.; Lu, Z. Fatigue failure analysis and life prediction of wheel load local area of ladle crane. Meas. Sci. Technol. 2024, 35, 126120. [Google Scholar] [CrossRef] [Scilit]
- Xi, Y.; Li, H.; Sun, L.; Wang, Z. Extreme load extrapolation and long-term fatigue assessment of offshore wind turbine tower based on monitoring data. Ocean Eng. 2024, 300, 117180. [Google Scholar] [CrossRef] [Scilit]
- Jiang, H.; Jiang, X. Fatigue life prediction for tower cranes under moving load. J. Mech. Sci. Technol. 2023, 37, 6461–6466. [Google Scholar] [CrossRef] [Scilit]
- Yang, M.; Chang, Z.; Xu, G.; Wang, C.; Wang, P. Analysis on fatigue life of overhead travelling crane girder under impact load for sustainable transport system. IET Intell. Transp. Syst. 2020, 14, 1426–1432. [Google Scholar] [CrossRef] [Scilit]
- Dong, Q.; Yu, Y.; Xu, G. Fatigue residual life estimation of jib structure based on improved v-SVR algorithm obtaining equivalent load spectrum. Fatigue Fract. Eng. Mater. Struct. 2020, 43, 1083–1099. [Google Scholar] [CrossRef] [Scilit]
- Hectors, K.; Chaudhuri, S.; De Waele, W. Fracture mechanics and hot spot stress-based fatigue life calculation: Case study for a crane runway girder. Fatigue Fract. Eng. Mater. Struct. 2022, 45, 2662–2675. [Google Scholar] [CrossRef] [Scilit]
- Tao, T.; Yang, Y.; Yang, T.; Liu, S.; Guo, X.; Wang, H.; Liu, Z.; Chen, W.; Liang, C.; Long, K.; et al. Time-domain fatigue damage assessment for wind turbine tower bolts under yaw optimization control at offshore wind farm. Ocean Eng. 2024, 303, 117706. [Google Scholar] [CrossRef] [Scilit]
- Fu, B.; Zhao, J.; Li, B.; Yao, J.; Teifouet, A.; Sun, L.; Wang, Z. Fatigue reliability analysis of wind turbine tower under random wind load. Struct. Saf. 2020, 87, 101982. [Google Scholar] [CrossRef] [Scilit]
- Ribeiro, D.; Braganca, C.; Montenegro, P.; Carvalho, H.; Costa, B.; Marques, F. Wind-induced fatigue analysis of high-rise guyed lattice steel towers. Structures 2022, 36, 719–734. [Google Scholar] [CrossRef] [Scilit]
- Rong, K.; Tian, L.; Luo, J.; Wang, L. Study on wind-induced fatigue performance of large-span transmission tower-line system considering the combined distribution probability of wind direction and speed. Eng. Fail. Anal. 2024, 156, 107785. [Google Scholar] [CrossRef] [Scilit]
- Roman, R.; Precup, R.; Petriu, E. Hybrid data-driven fuzzy active disturbance rejection control for tower crane systems. Eur. J. Control 2021, 58, 373–387. [Google Scholar] [CrossRef] [Scilit]
- Xin, Y.; Xu, G.; Su, N.; Dong, Q. Nonlinear vibration of ladle crane due to a moving trolley. Math. Probl. Eng. 2018, 2018, 5756180. [Google Scholar] [CrossRef] [Scilit]
- Ye, J.; Huang, J. Control of beam-pendulum dynamics in a tower crane with a slender jib transporting a distributed-mass load. IEEE Trans. Ind. Electron. 2023, 70, 888–897. [Google Scholar] [CrossRef] [Scilit]
- Liu, F.; Yang, J.; Wang, J.; Liu, C. Swing characteristics and vibration feature of tower cranes under compound working condition. Shock Vib. 2021, 2021, 8997396. [Google Scholar] [CrossRef] [Scilit]
- Feng, R.; Zhang, E.; Dong, M. Jib vibration and payload swing of tower cranes in the case of trolley motion. Arab. J. Sci. Eng. 2021, 46, 12179–12191. [Google Scholar] [CrossRef] [Scilit]
- Tong, Z.; Wu, W.; Guo, B.; Zhang, J.; He, Y. Cargo swing analysis and swing angle optimization of flat-top tower cranes. J. Vib. Eng. Technol. 2024, 12, 4715–4727. [Google Scholar] [CrossRef] [Scilit]
- He, W. Vertical dynamics of a single-span beam subjected to moving mass-suspended payload system with variable speeds. J. Sound Vibr. 2018, 418, 36–54. [Google Scholar] [CrossRef] [Scilit]
- Rauscher, F.; Sawodny, O. Modeling and control of tower cranes with elastic structure. IEEE Trans. Control Syst. Technol. 2021, 29, 64–79. [Google Scholar] [CrossRef] [Scilit]
- Zhang, K.; Wang, H.; Zhou, Y.; Wang, K.; Fang, X.; Chen, B.; Mu, D. An inclined tower crane suited to bridge tower construction. Sci. Rep. 2022, 12, 21934. [Google Scholar] [CrossRef] [Scilit]
- GB 50009-2012; Load Code for the Design of Building Structures. China Architecture & Building Press: Beijing, China, 2012.
- GB/T 13752-2017; Code for Design of Tower Cranes. General Administration of Quality Supervision, Inspection and Quarantine of the People’s Republic of China. Standard Administration of the People’s Republic of China: Beijing, China, 2017.
- Weber, F.; Wu, H.; Starke, P. A new short-time procedure for fatigue life evaluation based on the linear damage accumulation by Palmgren-Miner. Int. J. Fatigue 2023, 172, 107653. [Google Scholar] [CrossRef] [Scilit]
- Yosri, A.; Leheta, H.; Saad-Eldeen, S.; Zayed, A. Accumulated fatigue damage assessment of side structural details in a double hull tanker based on spectral fatigue analysis approach. Ocean Eng. 2022, 251, 111069. [Google Scholar] [CrossRef] [Scilit]
- Hectors, K.; De Waele, W. Cumulative damage and life prediction models for high-cycle fatigue of metals: A review. Metals 2021, 11, 204. [Google Scholar] [CrossRef] [Scilit]
- Rajchel, M.; Siwowski, T. Fatigue assessment of a 100-year-old riveted truss railway bridge. J. Constr. Steel Res. 2024, 217, 108662. [Google Scholar] [CrossRef] [Scilit]
- Qian, H.; Wei, J.; Huang, H. Structural fatigue reliability analysis based on active learning Kriging model. Int. J. Fatigue 2023, 172, 107639. [Google Scholar] [CrossRef] [Scilit]
- Chen, Z.; Long, K.; Zhang, C.; Yang, X.; Lu, F.; Wang, R.; Zhu, B.; Zhang, X. A fatigue-resistance topology optimization formulation for continua subject to general loads using rainflow counting. Struct. Multidiscip. Optim. 2023, 66, 210. [Google Scholar] [CrossRef] [Scilit]
- Wu, S.; Shang, D.; Liu, P.; Hao, G.; Hou, G.; Shi, F.; Miao, B. Fatigue life prediction based on modified narrowband method under broadband random vibration loading. Int. J. Fatigue 2022, 159, 106832. [Google Scholar] [CrossRef] [Scilit]
- Bibbo, N.; Larsen, M.; Baumgartner, J.; Arora, V. An improved rainflow counting method for multiaxial stress states using the minimum circumscribed circle method to identify shear stress ranges. Int. J. Fatigue 2022, 163, 106997. [Google Scholar] [CrossRef] [Scilit]
- EN 1993-1-9; Eurocode 3: Design of Steel Structures-Part 1-9: Fatigue. European Committee for Standardisation: Brussels, Belgium, 2006.
- GB 50017-2017; Code for Design of Steel Structures. China Architecture & Building Press: Beijing, China, 2017.

Disclaimer/Publisher’s Note: The statements, opinions and data contained in all publications are solely those of the individual author(s) and contributor(s) and not of MDPI and/or the editor(s). MDPI and/or the editor(s) disclaim responsibility for any injury to people or property resulting from any ideas, methods, instructions or products referred to in the content. |
© 2026 by the authors. Licensee MDPI, Basel, Switzerland. This article is an open access article distributed under the terms and conditions of the Creative Commons Attribution (CC BY) license.