


Abstract
New luminescent coatings are increasingly being used in highway tunnels to address inadequate internal lighting conditions. However, there is currently a lack of scientifically reliable methods to evaluate the effectiveness of these paints in improving lighting conditions, reducing driver psychological stress, and quantifying these impacts. This study utilized new luminescent coatings to improve tunnel lighting conditions, conducting real-vehicle tests to measure drivers’ physiological parameters including pupil diameter and heart rate. It examined the mechanisms through which variations in lighting conditions within highway tunnels affect the psychological workload of drivers. A hierarchical analysis–fuzzy comprehensive evaluation (AHP-FCE) method was adopted to develop a quantitative evaluation system for highway tunnel driving psychological load. The results indicate that variations in tunnel lighting substantially influence the psychological workload experienced by drivers during operation. The new luminescent coatings effectively enhanced tunnel lighting conditions, increasing average brightness and illuminance by 37.71% and 40.95%, respectively. Following lighting improvements, pupil diameter variation rates during tunnel entry and exit phases decreased by 35.37% and 10.06%, respectively, while heart rate variation rates decreased by 12.50% and 4.36%. Quantitative analysis of driver mental load revealed a comprehensive score of 0.6230 before lighting enhancement, which decreased to 0.2702 after improvements. This research introduces an innovative integrative framework that combines physiological parameter monitoring with the AHP-FCE method to quantitatively assess the psychological workload experienced by drivers in tunnel environments. This approach addresses a significant gap in the literature concerning the quantitative relationship between tunnel lighting optimization and drivers’ psychological workload responses.
1. Introduction
Highway tunnels, as essential elements of transportation infrastructure, possess enclosed environments and low lighting conditions that may contribute to heightened anxiety levels among drivers during transit [1,2,3]. Conventional tunnel lighting systems rely on an uninterrupted power supply and are characterized by several limitations, including excessive energy consumption, increased maintenance expenses, and inadequate lighting continuity. These factors collectively hinder the ability to fulfill long-term safety operational standards [4]. Abrupt variations in luminance at the entrances and exits of tunnels, coupled with heterogeneous light distribution within the tunnel interior, induce substantial fluctuations in drivers’ pupil diameter and irregular heart rate patterns. These conditions contribute to challenges in visual adaptation and elicit physiological stress responses, thereby directly elevating the psychological workload associated with driving. As a result, tunnels represent environments with heightened risk for traffic accidents [5,6]. As a novel functional material, new luminescent coatings possess the capability to absorb and store energy, subsequently emitting light autonomously under low-light conditions. This property enables it to deliver continuous and uniform supplementary illumination within tunnel environments [7].
Feng et al. [8] empirically validated the optimization effects of energy storage, self-luminous multifunctional coatings within tunnel lighting environments through experimental modeling. Their research substantiated the practical utility of these coatings for auxiliary tunnel lighting and furnished critical performance data to inform engineering applications. Cai et al. [9] conducted a comprehensive review of wall reflective materials used in tunnel lighting, examining aspects such as material coverage, selection criteria, and reflectance ratios. Their study contributes valuable insights for optimizing the design of wall reflective materials, including the application of energy-storing luminescent coatings. Yu et al. [10] utilized DIAlux numerical simulation to perform experimental investigations on tunnel emergency lighting systems that integrate vehicle headlights with energy storage luminescent coatings. The results of their research offer important references for the design of emergency lighting in tunnels. Chen et al. [11] implemented multifunctional energy storage luminescent coatings in the renovation of tunnel walls within a specific tunnel project, resulting in an average brightness increase exceeding 30% in both entrance and exit zones. Huang et al. [12] verified, through controlled indoor experiments, the capabilities of energy storage luminescent coatings to enhance light intensity, provide delayed emission, and improve illumination uniformity, thereby offering valuable guidance for energy-efficient retrofitting of highway tunnel lighting systems. However, these studies fail to address the human-centered effects of luminescent coatings, particularly their measurable influence on diminishing the psychological workload experienced by drivers.
Kang et al. [13] conducted both dynamic and static control experiments, revealing that a gradual reduction in tunnel brightness substantially elevates drivers’ visual operational stress and psychological tension, which in turn leads to significantly increased reaction times. He et al. [14] demonstrated that non-uniform illumination significantly affects driving behavior by simulating spatial variations in brightness and color temperature between tunnel road surfaces and sidewalls. Zhu et al. [15] collected driver eye-tracking and physiological data and employed statistical methods to compare psychological load characteristics at tunnel exit sections of varying lengths. Zhu et al. [16] developed a psychological load calculation model based on factor analysis using real-time electrocardiogram signals from drivers. Guo et al. [17] gathered drivers’ eye-tracking and ECG data to construct a psychological load calculation model through factor analysis. Liang et al. [18] collected drivers’ eye-tracking and physiological data, combining TOPSIS with factor analysis to evaluate and analyze psychological load during tunnel driving. Hu et al. [19] developed a quantitative model for psychological load based on factor analysis by collecting drivers’ eye-tracking data. However, the majority of existing studies do not provide a comprehensive framework that integrates objective physiological monitoring with multi-criteria decision-making methodologies to quantitatively assess the relationship between lighting enhancements and psychological stress.
Currently, the Analytic Hierarchy Process (AHP), fuzzy comprehensive evaluation (FCE), and their combined methods are widely used for the comprehensive evaluation of complex engineering problems. The Analytic Hierarchy Process (AHP), proposed by American operations researcher Saaty in the 1970s, decomposes complex decision-making problems into hierarchical levels. It constructs a judgment matrix to determine factor weights, thereby facilitating the evaluation and selection of alternatives [20]. Fuzzy comprehensive evaluation (FCE) is a method designed to evaluate objects with inherent fuzziness. It constructs a fuzzy evaluation matrix and performs comprehensive calculations on indicators using weights to derive overall evaluation results [21]. The AHP-FCE method combines the indicator weighting determined by AHP with the advantage of FCE in handling fuzziness, serving as a scientific approach for the comprehensive evaluation of complex problems [22]. Zheng et al. [23] employed the AHP-FCE method to assess operational risks in complex mountain tunnels. Tang et al. [24] developed a dynamic evaluation model for lighting energy consumption in operational highway tunnels using AHP-FCE, enabling quantitative dynamic assessment of tunnel lighting energy usage. Chen [25] used the AHP-FCE method for a comprehensive evaluation of construction safety management in building projects. Li et al. [26] adopted the AHP-FCE method to establish a multidimensional, multilevel construction risk assessment indicator system for evaluating construction risks in high-rise buildings. However, its utilization in quantifying the relationship between lighting optimization achieved through luminescent coatings and the psychological load experienced by drivers has not been extensively investigated.
In summary, the efficacy of the new luminescent coatings within tunnel environments has been comprehensively validated. However, its influence on drivers’ psychological burden and the corresponding evaluative measures remains insufficiently investigated. The AHP-FCE method provides a systematic and adaptable framework for addressing complex problems, thereby justifying its wider application in engineering contexts. This research employs a physical tunnel as the experimental setting, applying new luminescent coatings independently developed by our institution to enhance tunnel lighting conditions. Additionally, an evaluation framework based on AHP-FCE methodology is developed to quantitatively measure the effects of lighting improvements on drivers’ psychological burden while navigating the tunnel.
2. AHP-FCE Method and Evaluation System
2.1. Method Overview
The AHP-FCE methodology proficiently manages uncertainty and complexity inherent in multi-criteria decision-making processes through the utilization of hierarchical weight distribution combined with fuzzy mathematical techniques, thereby exhibiting significant applicability within engineering disciplines [27]. As an integrative evaluation approach, AHP-FCE synthesizes multi-criteria decision analysis with fuzzy mathematics theory. Its principal strength resides in its capacity to harmonize qualitative and quantitative assessments, effectively addressing subjectivity and uncertainty in the evaluation of complex systems [28,29].
AHP supports systematic decision-making by employing hierarchical decomposition, quantitative evaluation, and stringent validation procedures. Its adaptability and scalability enable extensive application across a variety of disciplines [30,31]. Fundamentally, AHP decomposes decision problems into multiple levels comprising objectives, criteria, and alternatives, thereby establishing a hierarchical tree structure [32]. By pairwise comparing the importance of elements across these layers, a comparison judgment matrix is constructed, weights are calculated, and the consistency ratio (CR) is used to assess the matrix’s logical consistency. If CR < 0.1, the matrix is considered acceptable [33].
FCE proficiently combines qualitative and quantitative indicators through the application of fuzzy mathematics theory, with its principal advantage lying in its capacity to manage uncertainty within complex systems [34]. Initially, a hierarchical indicator system is constructed in accordance with the evaluation objectives, and corresponding fuzzy evaluation grades are delineated. Subsequently, expert assessments or fuzzy membership functions are utilized to quantify the associations between the indicators and the evaluation criteria [35].
2.2. Evaluation System Establishment Process
- Establishing a Hierarchical Model
The model architecture is structured into three hierarchical levels: the objective layer, the criterion layer, and the solution layer. The objective layer encapsulates the driver’s mental workload, denoted as U. At the criterion layer, this objective is further specified; for instance, abrupt luminance transitions at tunnel entrances and exits induce transient visual blind spots, compelling drivers to rapidly adapt their vision and thereby substantially elevating mental workload [36]. To ensure sustained driving comfort, tunnels necessitate stable and uniform illumination conditions [37]. Therefore, the first indicator at the target layer is brightness, U1. The solution layer under brightness U1 is subdivided into average brightness U11, overall brightness uniformity U12, and longitudinal brightness uniformity U13. The second target-layer metric is illuminance, U2, with its solution layer subdivided into average illuminance U21, total illuminance uniformity U22, and longitudinal illuminance uniformity U23. While navigating tunnels, drivers concurrently contend with abrupt lighting changes, spatial confinement, and potential hazards, factors that collectively induce irregular pupil responses [38,39]. Therefore, the third target-layer metric is pupil diameter, U3. Under pupil diameter U3, the solution layer is divided into pupil diameter change amplitude upon tunnel entry U31, pupil diameter standard deviation during tunnel travel U32, and pupil diameter change amplitude upon tunnel exit U33. Heart rate is a widely recognized physiological indicator of mental workload. Given the visual constraints and enclosed environment characteristic of tunnels, drivers must maintain heightened concentration levels, which may lead to sustained elevations in heart rate [40,41,42]. Therefore, the fourth indicator at the target layer is selected as heart rate U4. The scheme layer under heart rate U4 is divided into driver heart rate increase rate upon entering the tunnel U41, driver heart rate standard deviation during tunnel driving U42, and driver heart rate increase rate upon exiting the tunnel U43. The driving psychological workload indicator system is shown in Table 1.
Table 1.
Driver psychological load indicator system.
During tunnel driving, the psychological load experienced by drivers arises from the interplay between external lighting conditions and physiological responses [43,44,45]. Key lighting parameters, including brightness and illuminance, function as primary environmental factors that indirectly contribute to psychological stress by affecting the driver’s visual adaptation mechanisms [46,47]. Concurrently, physiological indicators such as pupil diameter and heart rate serve as direct measures, providing real-time insights into the driver’s load state. Collectively, these factors encompass the multidimensional aspects necessary for a thorough evaluation of psychological load [48,49]. Consequently, the integration of these variables into a cohesive framework for comprehensive assessment is justified and valuable in both practical engineering applications and theoretical investigations [50,51].
- 2.
- Establishing the Judgment Comparison Matrix
The judgment matrix constitutes a critical element of the AHP. In this matrix, elements situated at the same hierarchical level are subjected to pairwise comparisons, with corresponding values assigned to each comparison. Typically, a 9-point scale (1–9) is used as the judgment scale for elements in the matrix, as detailed in Table 2.
Table 2.
Comparison scale for judgment matrix elements.
By evaluating each pair of elements in the matrix according to the scale in Table 2 above, a comparison judgment matrix A of order n is obtained, as shown in Formula (1).
- 3.
- Consistency Check
The geometric mean method ensures consistency verification. The scoring matrices formed by m experts (m = 1,2,…k) are multiplied element-wise, and then the mth root is taken to obtain the unique integrated matrix , as shown in the formula below:
This paper employs the sum-product method to calculate the relative weights of the integrated matrix . The specific calculation steps are as follows:
First, normalize each column vector of the matrix = (aij) n×n to obtain B = (bij) n×n
Next, sum the row vectors of the normalized matrix B.
Finally, normalize the resulting vector
This yields the eigenvectors .
In practical applications, experts may produce inconsistent results when performing pairwise comparisons of indicators. Consequently, it is essential to conduct a consistency test on the existing judgment matrix to verify the validity of the assigned indicator weights. Meanwhile, the academic community generally uses CR as the standard for judging matrix consistency, where CR is the ratio of the consistency index CI to the random consistency index RI. If CR < 0.1, the matrix meets requirements and requires no modification; otherwise, experts should revise the judgment matrix until the calculated CR < 0.1.
The CR calculation formula is shown in Equation (6).
The formula for calculating CI is shown in Equation (7).
λmax represents the maximum eigenvalue of the judgment matrix, calculated as in Equation (8), where λmax is the maximum eigenvalue of the matrix. Here, A denotes the judgment matrix, W denotes the weight vector, and [AW]i denotes the i-th component of matrix [AW].
The RI value is related to the order of the matrix, with specific values shown in Table 3 below.
Table 3.
Average random consistency index (RI) values for decision matrix.
- 4.
- Establish a Set of Comments
The comment set is divided into five levels: V = [Extremely Low, Low, Medium, High, Extremely High], with corresponding values V = [0, 0.2, 0.4, 0.6, 0.8]. Experts are invited to evaluate each factor at the indicator level. The indicator evaluation grading is shown in Table 4.
Table 4.
Evaluation interval table.
- 5.
- Establishing the Fuzzy Relationship Matrix
Twenty evaluators are invited to assess each indicator layer based on the comment set. After quantifying the indicators, the membership degree F of factor i for evaluator j is obtained, where F represents the proportion of evaluators who assigned rating j to factor i out of the total number of evaluators. The fuzzy relationship matrix is constructed as shown in Formula (9).
- 6.
- Comprehensive Evaluation
Fuzzy operations between the weights Wi and the fuzzy matrix F(ij) are performed to obtain the row vector Ui, representing the fuzzy evaluation result for the indicator layer, as shown in Formula (10).
Then, based on Ui, the fuzzy evaluation result U for the criterion layer is derived. Following the maximum membership principle, the maximum value in the row vector U is obtained as the final evaluation comment, as shown in Formula (11).
Subsequently, the most commonly used weighted average operator M(+) mode is selected for fuzzy operations.
3. Test Plan and Results Analysis
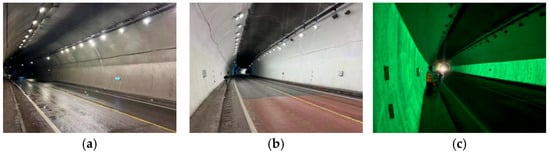
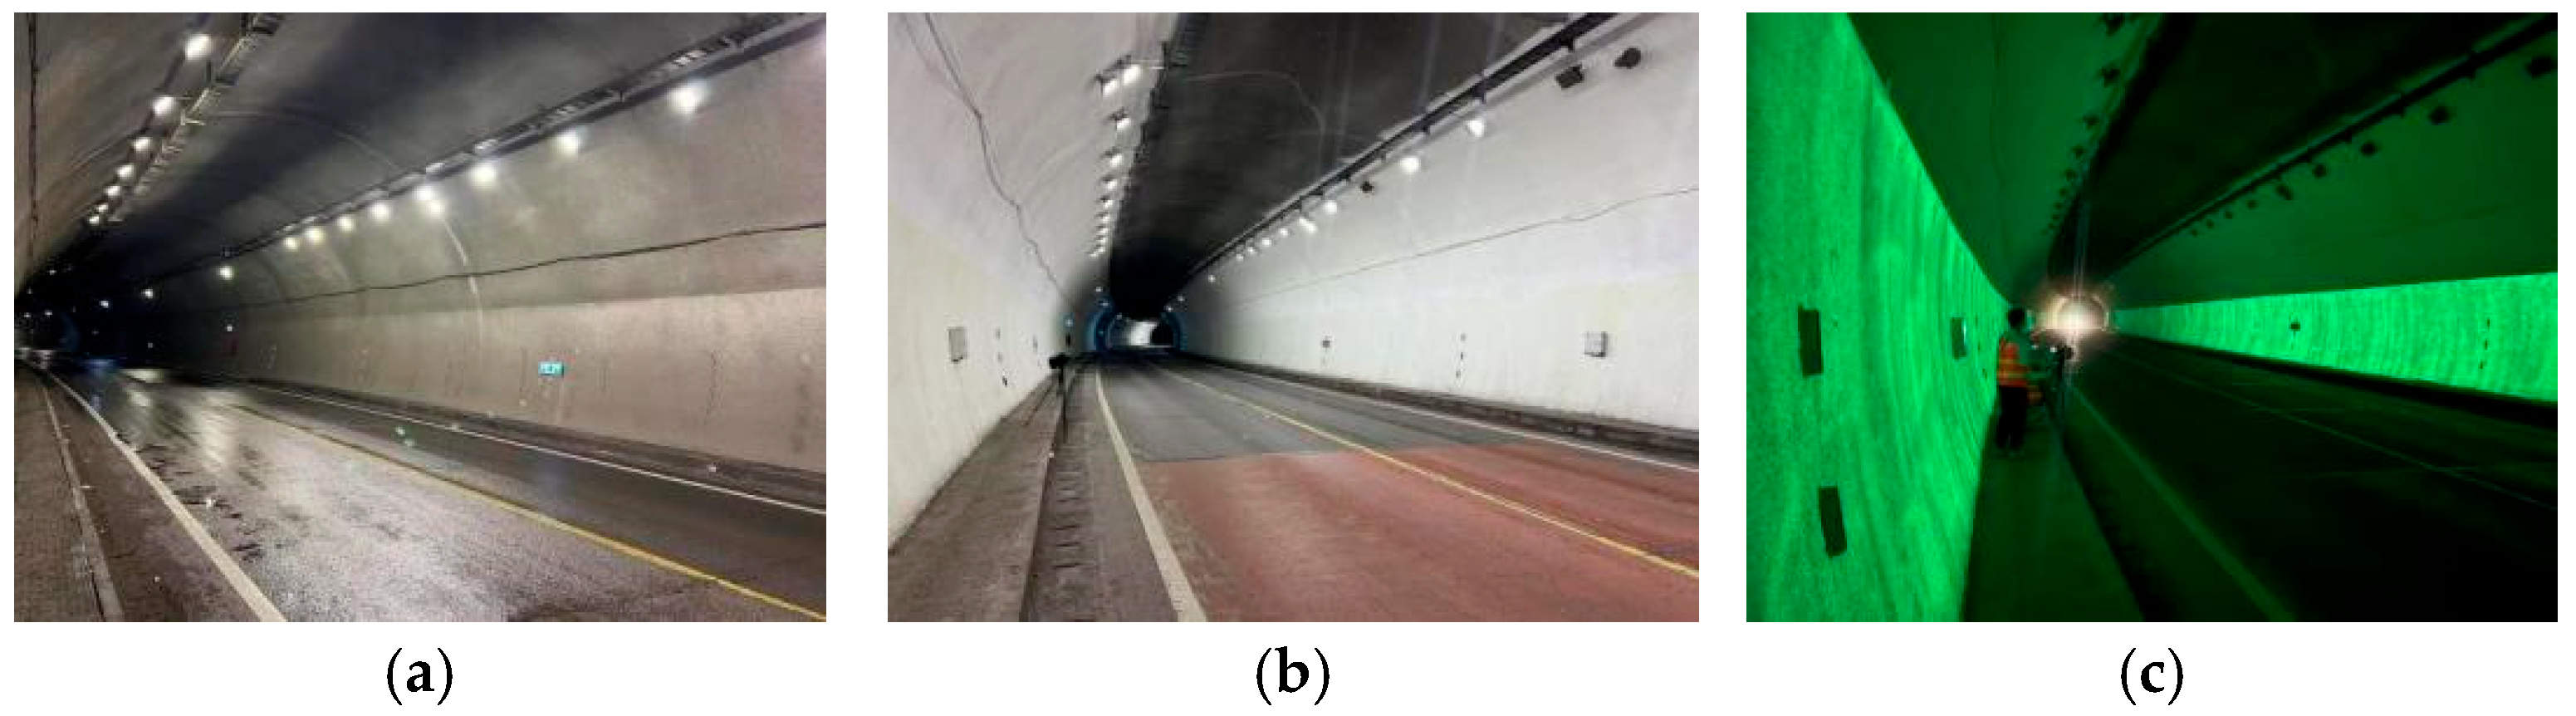
This research employs an actual tunnel as the experimental setting. The tunnel is designed for a speed of 60 km/h, with a subgrade width of 8.5 m and a roadway width of 7.5 m. During the experiment, the new luminescent coatings was applied to the interior surfaces of the tunnel. Figure 1 presents a comparative visualization of the tunnel’s appearance before and after the application. Key optical environmental parameters were measured, including average brightness, brightness uniformity, average illuminance, and illuminance uniformity on the tunnel pavement surface, both prior to and following the application. Concurrently, physiological metrics such as variations in pupil diameter and heart rate fluctuations of drivers traversing the tunnel were recorded, thereby providing essential data for subsequent analyses aimed at quantifying psychological load.
Figure 1.
(a) Pre-painting lighting rendering; (b) lighting effect rendering after painting; (c) pre-painting light-off rendering.
The research was predominantly carried out under clear weather conditions, deliberately excluding adverse meteorological phenomena such as heavy rainfall or thick fog. Testing sessions were scheduled consistently between 9:00 a.m. and 2:00 p.m. to guarantee sufficient natural illumination. Participants were instructed to sustain a constant velocity of 60 km/h with an allowable deviation of ±5 km/h, with instantaneous speed measurements recorded through an onboard GPS system. Furthermore, prior arrangements with traffic management authorities facilitated the closure of designated test lanes during the trials, thereby eliminating potential disruptions from other vehicular traffic. The sequence of the driver test remains unchanged both prior to and following the painting process.
In the assessment of variations in pupil diameter and heart rate during tunnel driving, it is essential to consider factors including driving proficiency, reaction time, visual acuity, and habitual driving behaviors. To mitigate the influence of these variables on the objectivity of the data, this study enlisted a heterogeneous sample of participants. All individuals possessed prior experience driving on secondary highways and exhibited diversity in critical attributes such as age, gender, and driving tenure, thereby representing a wide range of driver profiles. Detailed information on participating drivers is presented in Table 5.
Table 5.
Driver Information.
3.1. Tunnel Lighting Environment Testing and Results Analysis
3.1.1. Brightness Testing and Results Analysis
- 1.
- Test Plan
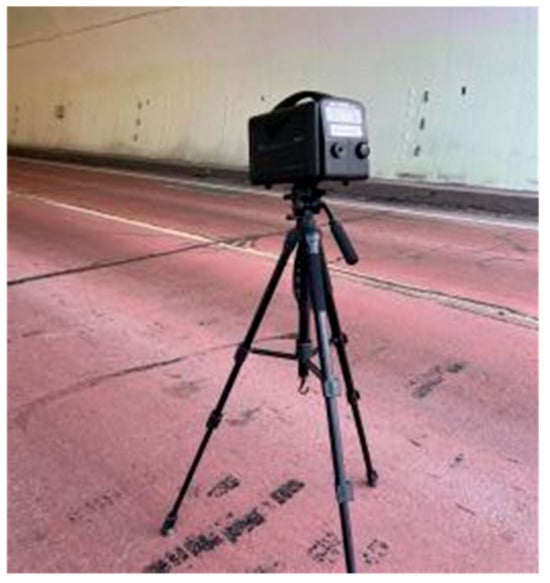
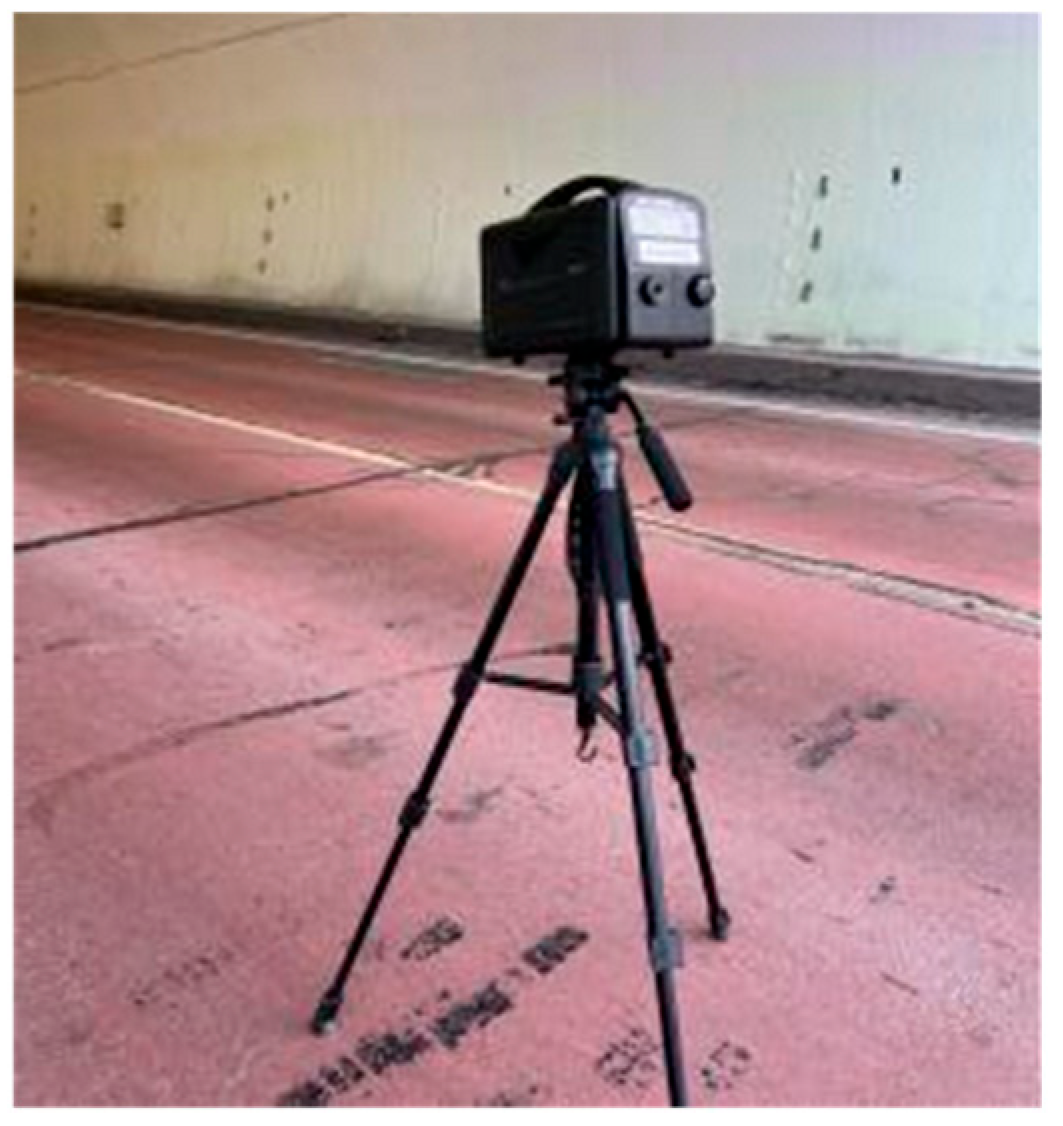
The tunnel brightness parameters were assessed utilizing a Yuanfang LM-3 multi-field brightness meter. Measurement points were horizontally situated at the W/4 position along the sidewall, corresponding to a distance of 0.875 m. Additionally, the observation points were positioned at a height of 1.5 m above the road surface. The brightness observation points are shown in Figure 2.
Figure 2.
Brightness observation points.
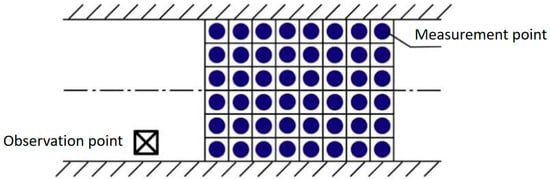
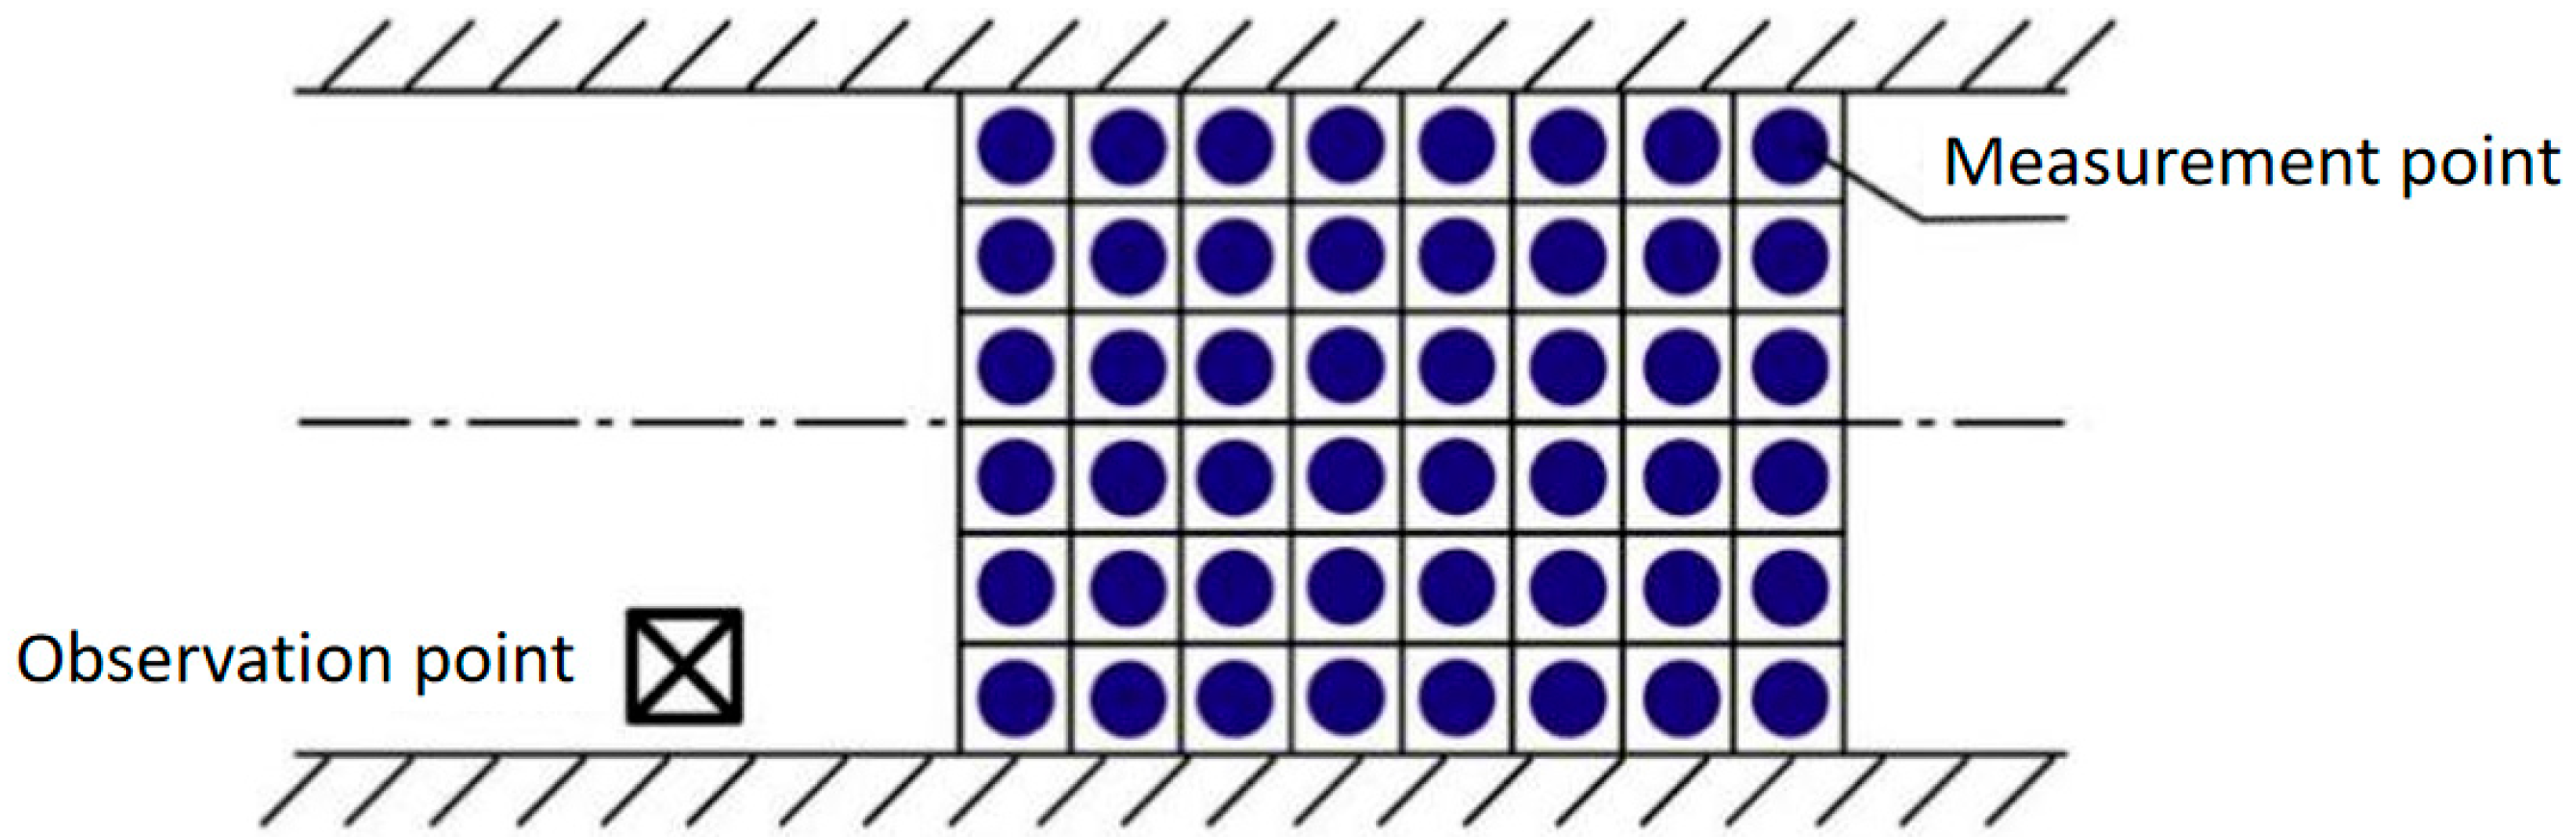
Brightness measurements were performed employing a central grid methodology. Considering the measurement area and the lighting arrangement present on-site, the test region was systematically partitioned into multiple uniform grids. The central points of these grids were designated as measurement locations, as depicted in Figure 3. At each measurement point, brightness was recorded three times, and the mean of these readings was regarded as the representative brightness value for that position. Subsequently, the arithmetic mean of the representative brightness values obtained from all measurement points within a given cross-section was computed to establish the effective brightness for that cross-section.
Figure 3.
Brightness test point diagram.
- 2.
- Results Analysis
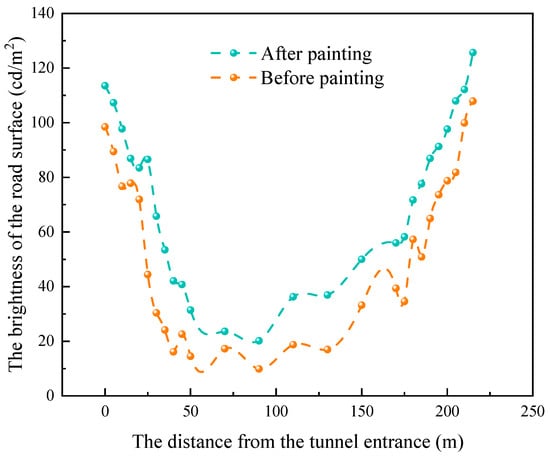
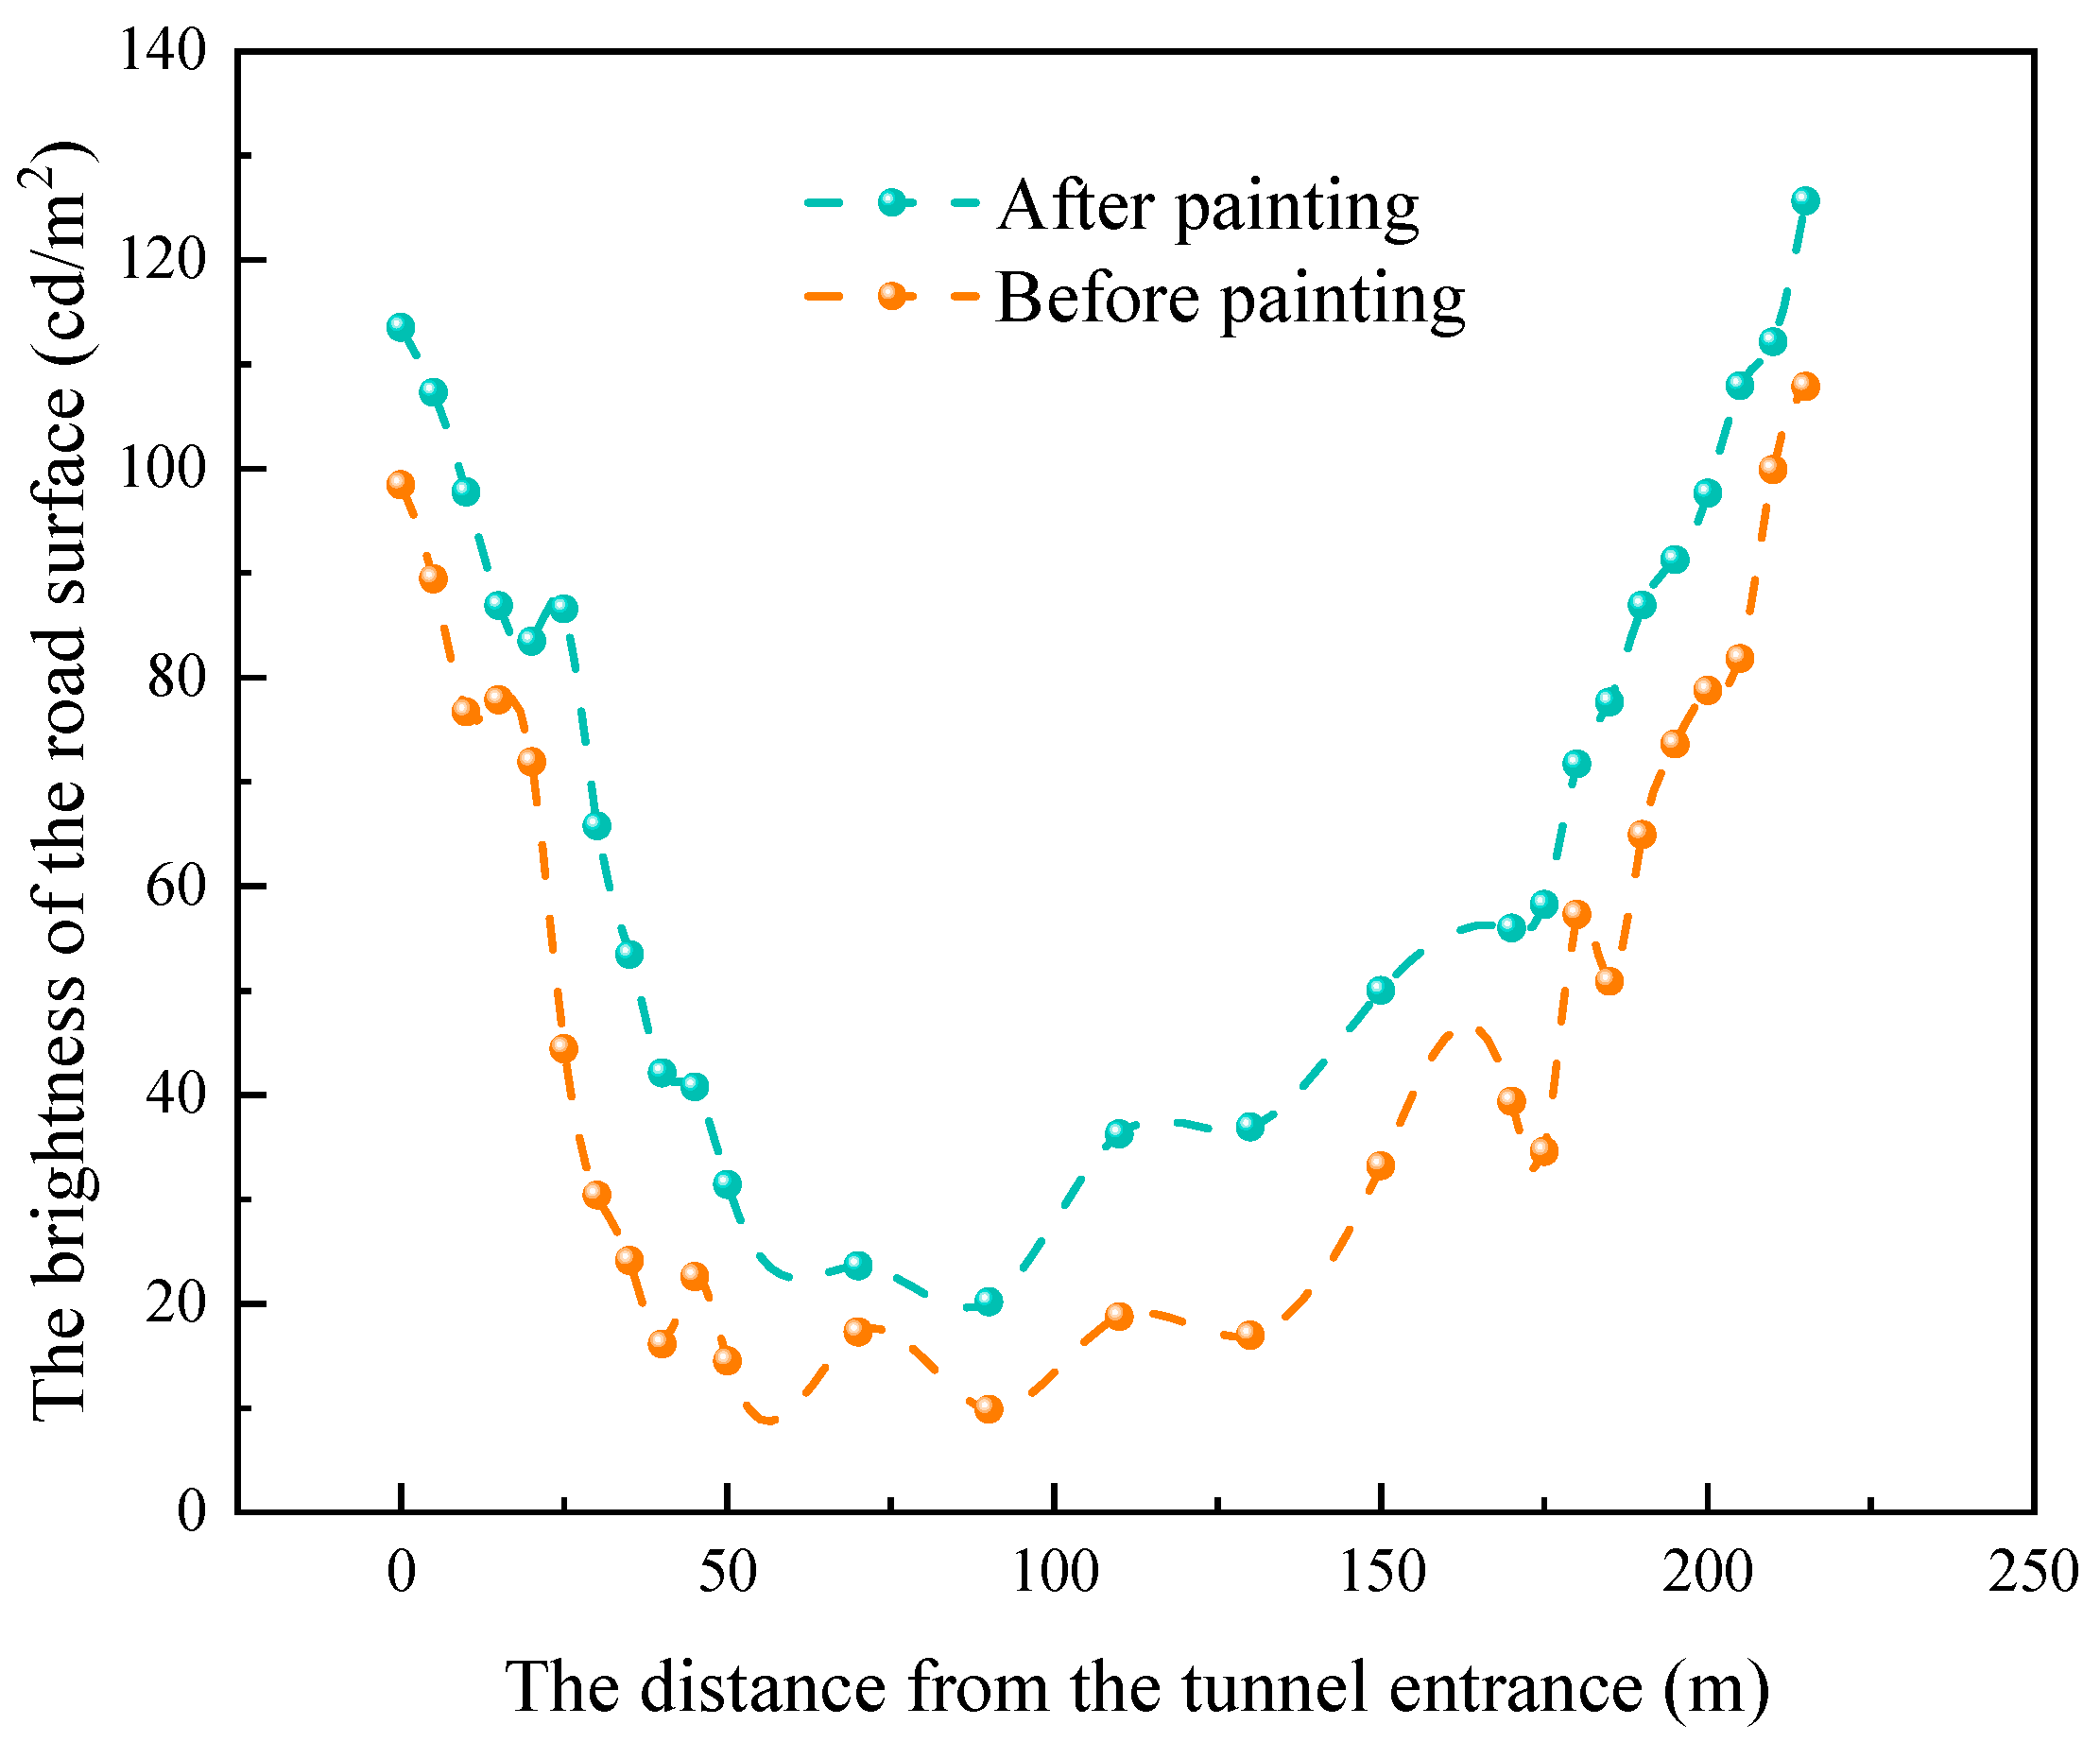
As illustrated in Figure 4, prior to the enhancement of the tunnel’s internal lighting environment, the maximum brightness at the tunnel entrance was measured at 98.46 cd/m2. Within the central section of the tunnel, the maximum brightness registered at 18.74 cd/m2, while at the tunnel exit, it reached 107.88 cd/m2. The overall average brightness across the tunnel was 51.98 cd/m2. The brightness uniformity in the middle section was calculated to be 0.63, with a longitudinal uniformity value of 0.53. Following the improvements to the tunnel’s internal lighting conditions, a marked enhancement in overall lighting performance was observed. Specifically, the maximum brightness at the entrance increased to 113.54 cd/m2, the maximum brightness in the middle section rose to 36.93 cd/m2, and the maximum brightness at the exit attained 125.65 cd/m2. Correspondingly, the overall average brightness increased to 71.58 cd/m2, the brightness uniformity in the middle section improved to 0.69, and the longitudinal uniformity in the middle section increased to 0.55.
Figure 4.
Comparison of brightness before and after tunnel lighting improvement.
3.1.2. Illuminance Testing and Results Analysis
- 1.
- Test Plan
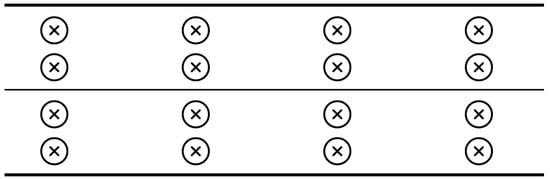
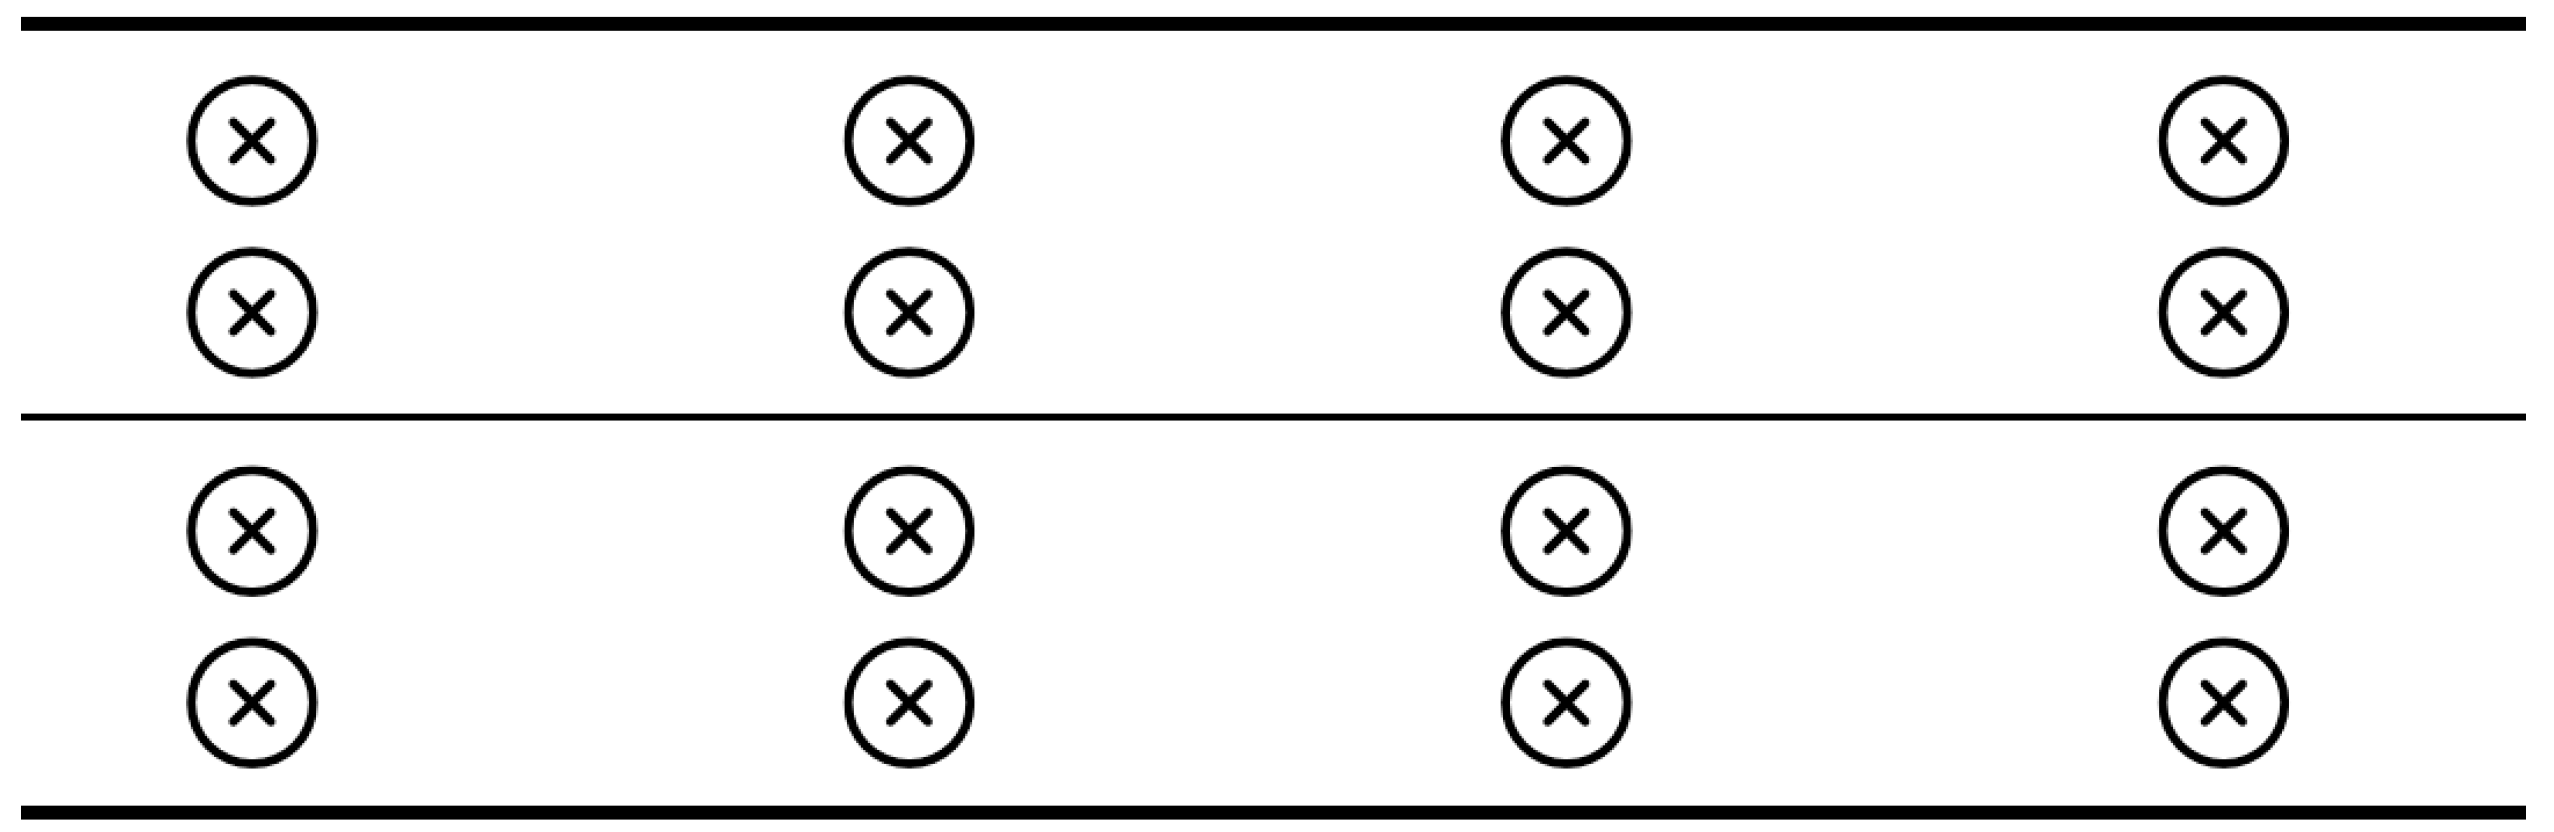
Illuminance measurements were performed employing a grid sampling approach, wherein adjacent measurement locations were spaced 5 m apart in the longitudinal direction and 1.875 m apart in the transverse direction. The specific illuminance test points are illustrated in Figure 5. At each measurement location, three readings were taken, and the arithmetic mean of these readings was considered the valid illuminance value for that point. Subsequently, the arithmetic mean of the valid illuminance values from all measurement points within the same cross-sectional area was computed to establish the representative illuminance for that cross-section.
Figure 5.
Schematic diagram of illuminance test points.
- 2.
- Results Analysis
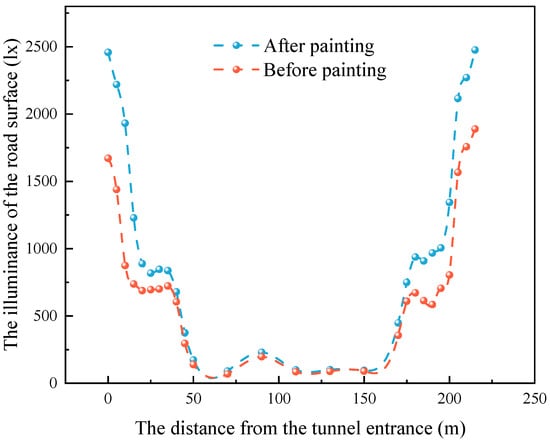
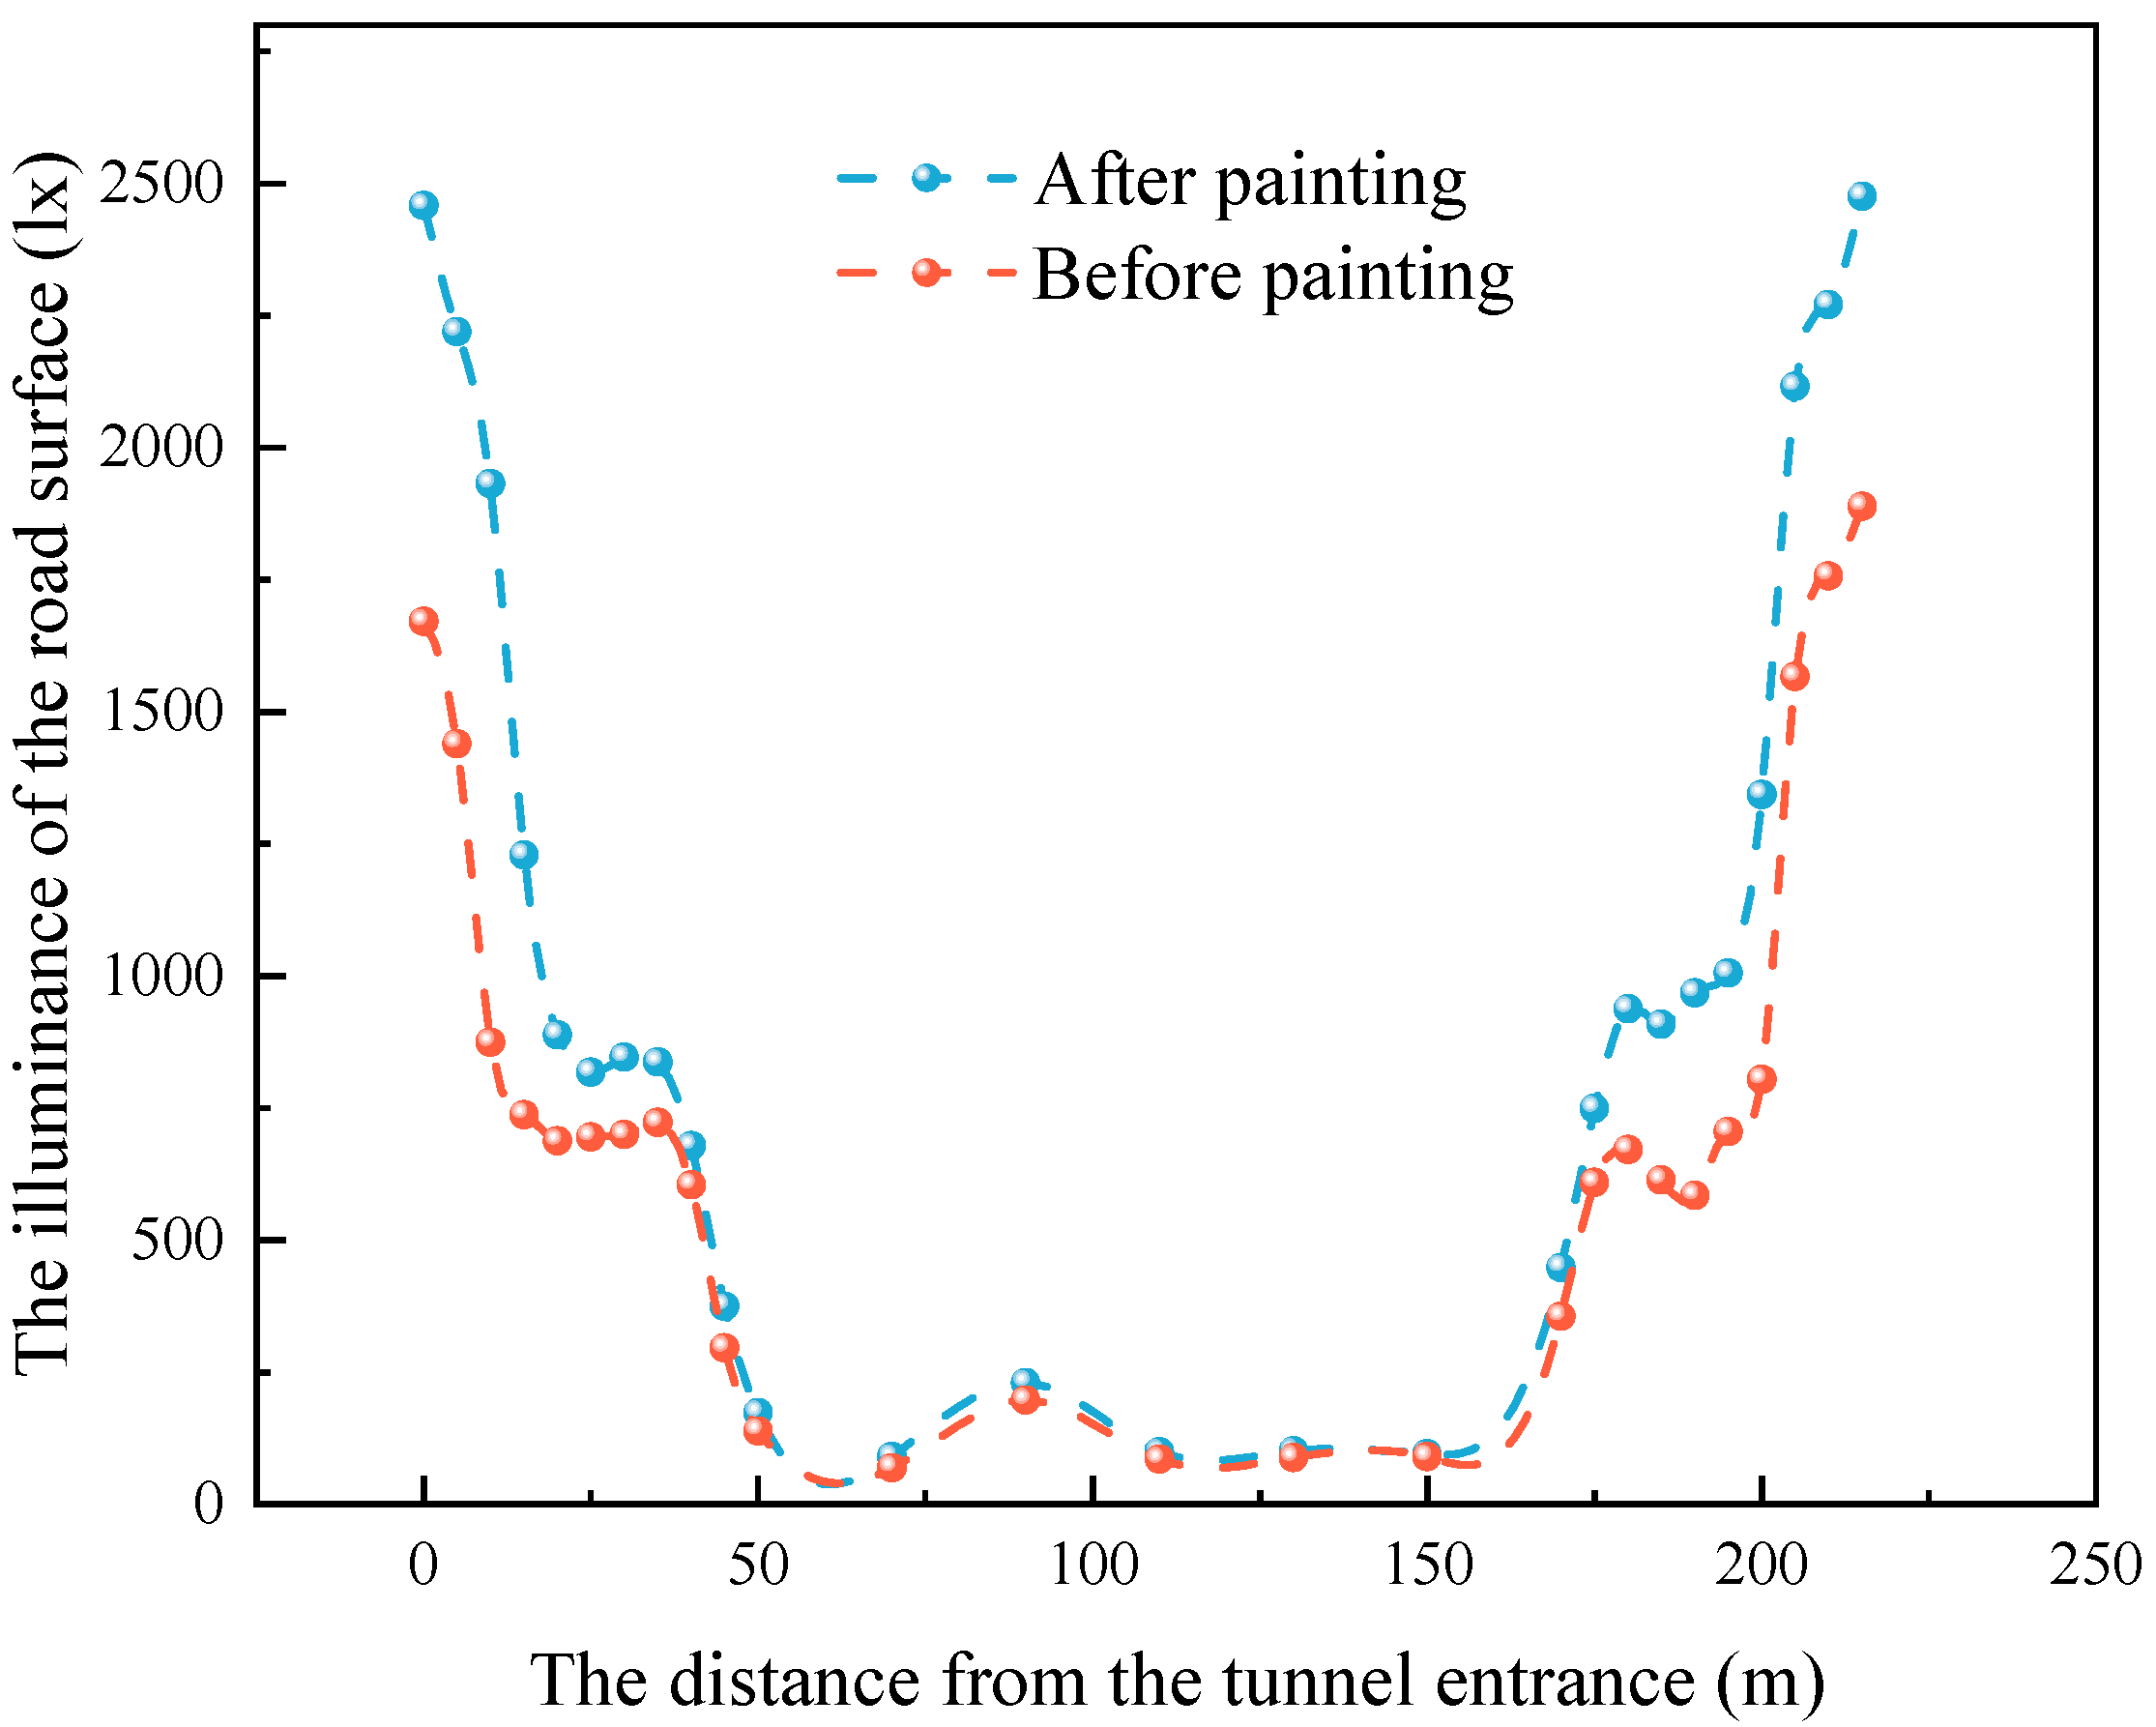
As illustrated in Figure 6, prior to the enhancement of the tunnel’s internal lighting conditions, the maximum illuminance measured at the tunnel entrance was 1670.75 lx, while the middle section exhibited a maximum illuminance of 197.05 lx, and the tunnel exit recorded a maximum illuminance of 1888.8 lx. The overall average illuminance across the tunnel was 717.63 lx, with an illuminance uniformity of 0.63 and a longitudinal uniformity of 0.35 within the middle section. Following the improvements to the tunnel’s internal lighting environment, the maximum illuminance at the entrance increased to 2457.55 lx, the middle section’s maximum illuminance rose to 230.9 lx, and the exit reached a maximum illuminance of 2476.2 lx. Correspondingly, the overall average illuminance increased to 1011.48 lx. Additionally, the illuminance uniformity in the middle section improved to 0.69, and the longitudinal uniformity increased to 0.39.
Figure 6.
Comparison of illuminance before and after tunnel lighting improvement.
3.2. Driver Physiological and Psychological Indicator Testing and Results Analysis
3.2.1. Pupil Diameter Testing
- 1.
- Test Plan
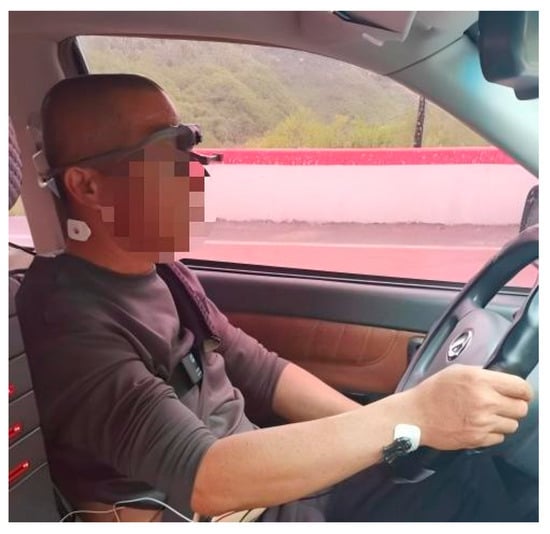
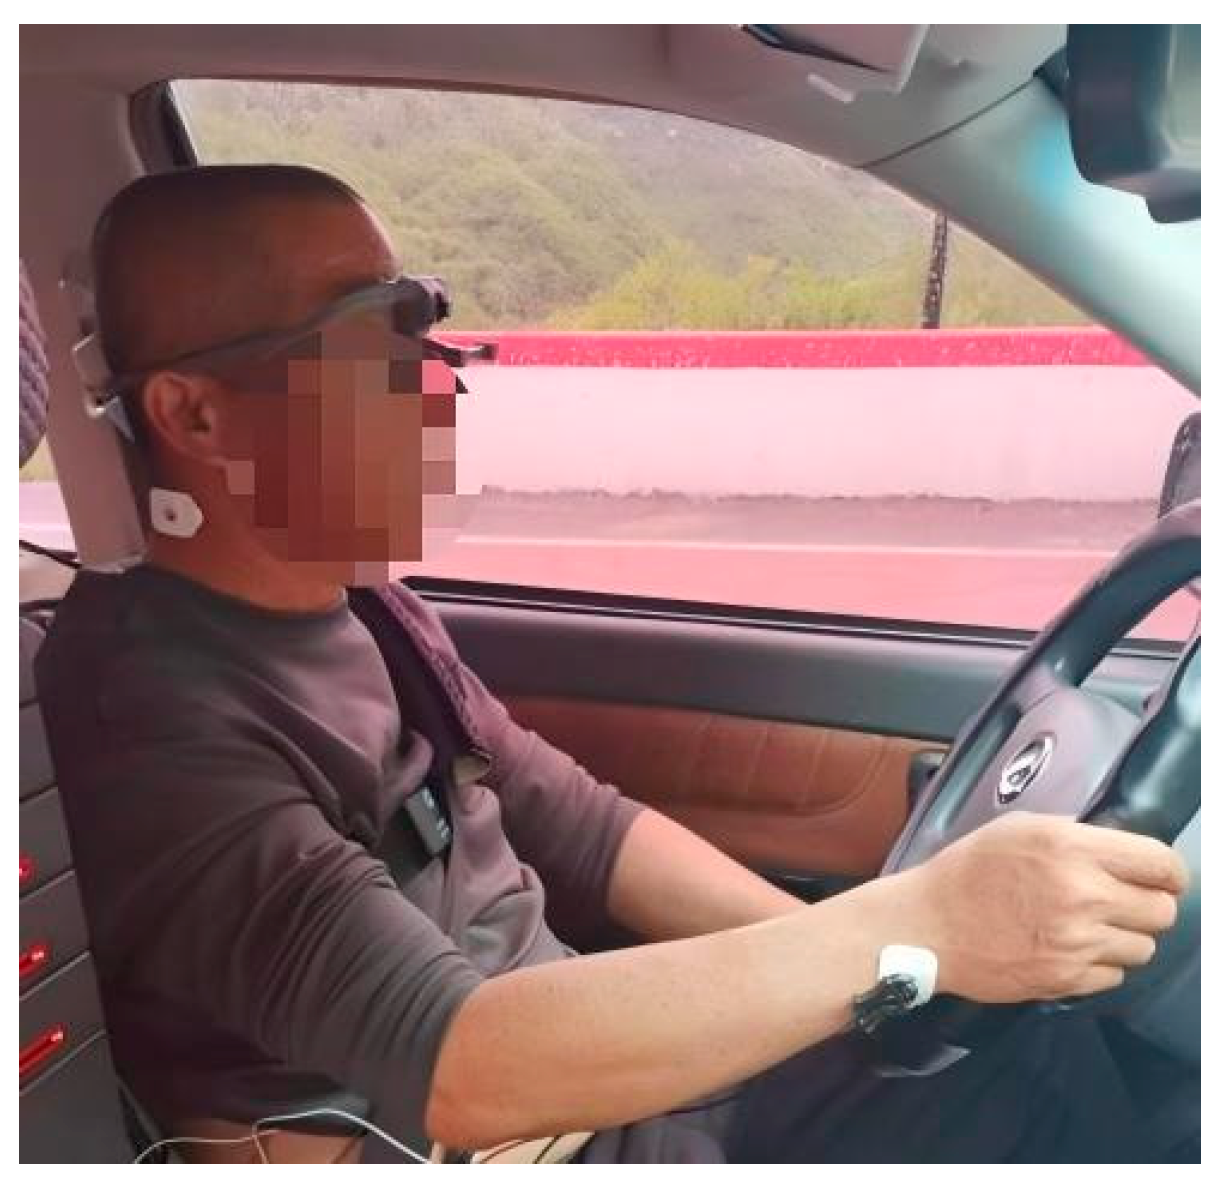
Utilizing the Dikablis Glass 3 eye-tracking system, variations in drivers’ pupil diameter were measured across three distinct scenarios: entering the tunnel, traversing the tunnel, and exiting the tunnel. These measurements were conducted both prior to and following the application of new luminescent coatings on the tunnel surface. To reduce experimental error and improve the reliability and accuracy of the data, each participant completed three repeated trials. Subsequent to each trial, the collected data were subjected to an initial review and systematic organization to verify their completeness and validity. The pupil diameter test procedure is illustrated in Figure 7.
Figure 7.
The pupil diameter test procedure.
- 2.
- Results Analysis
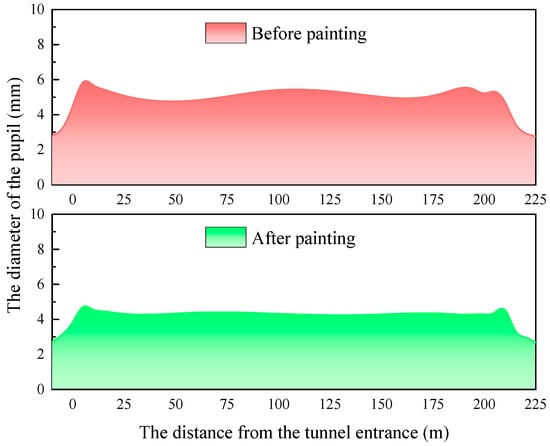
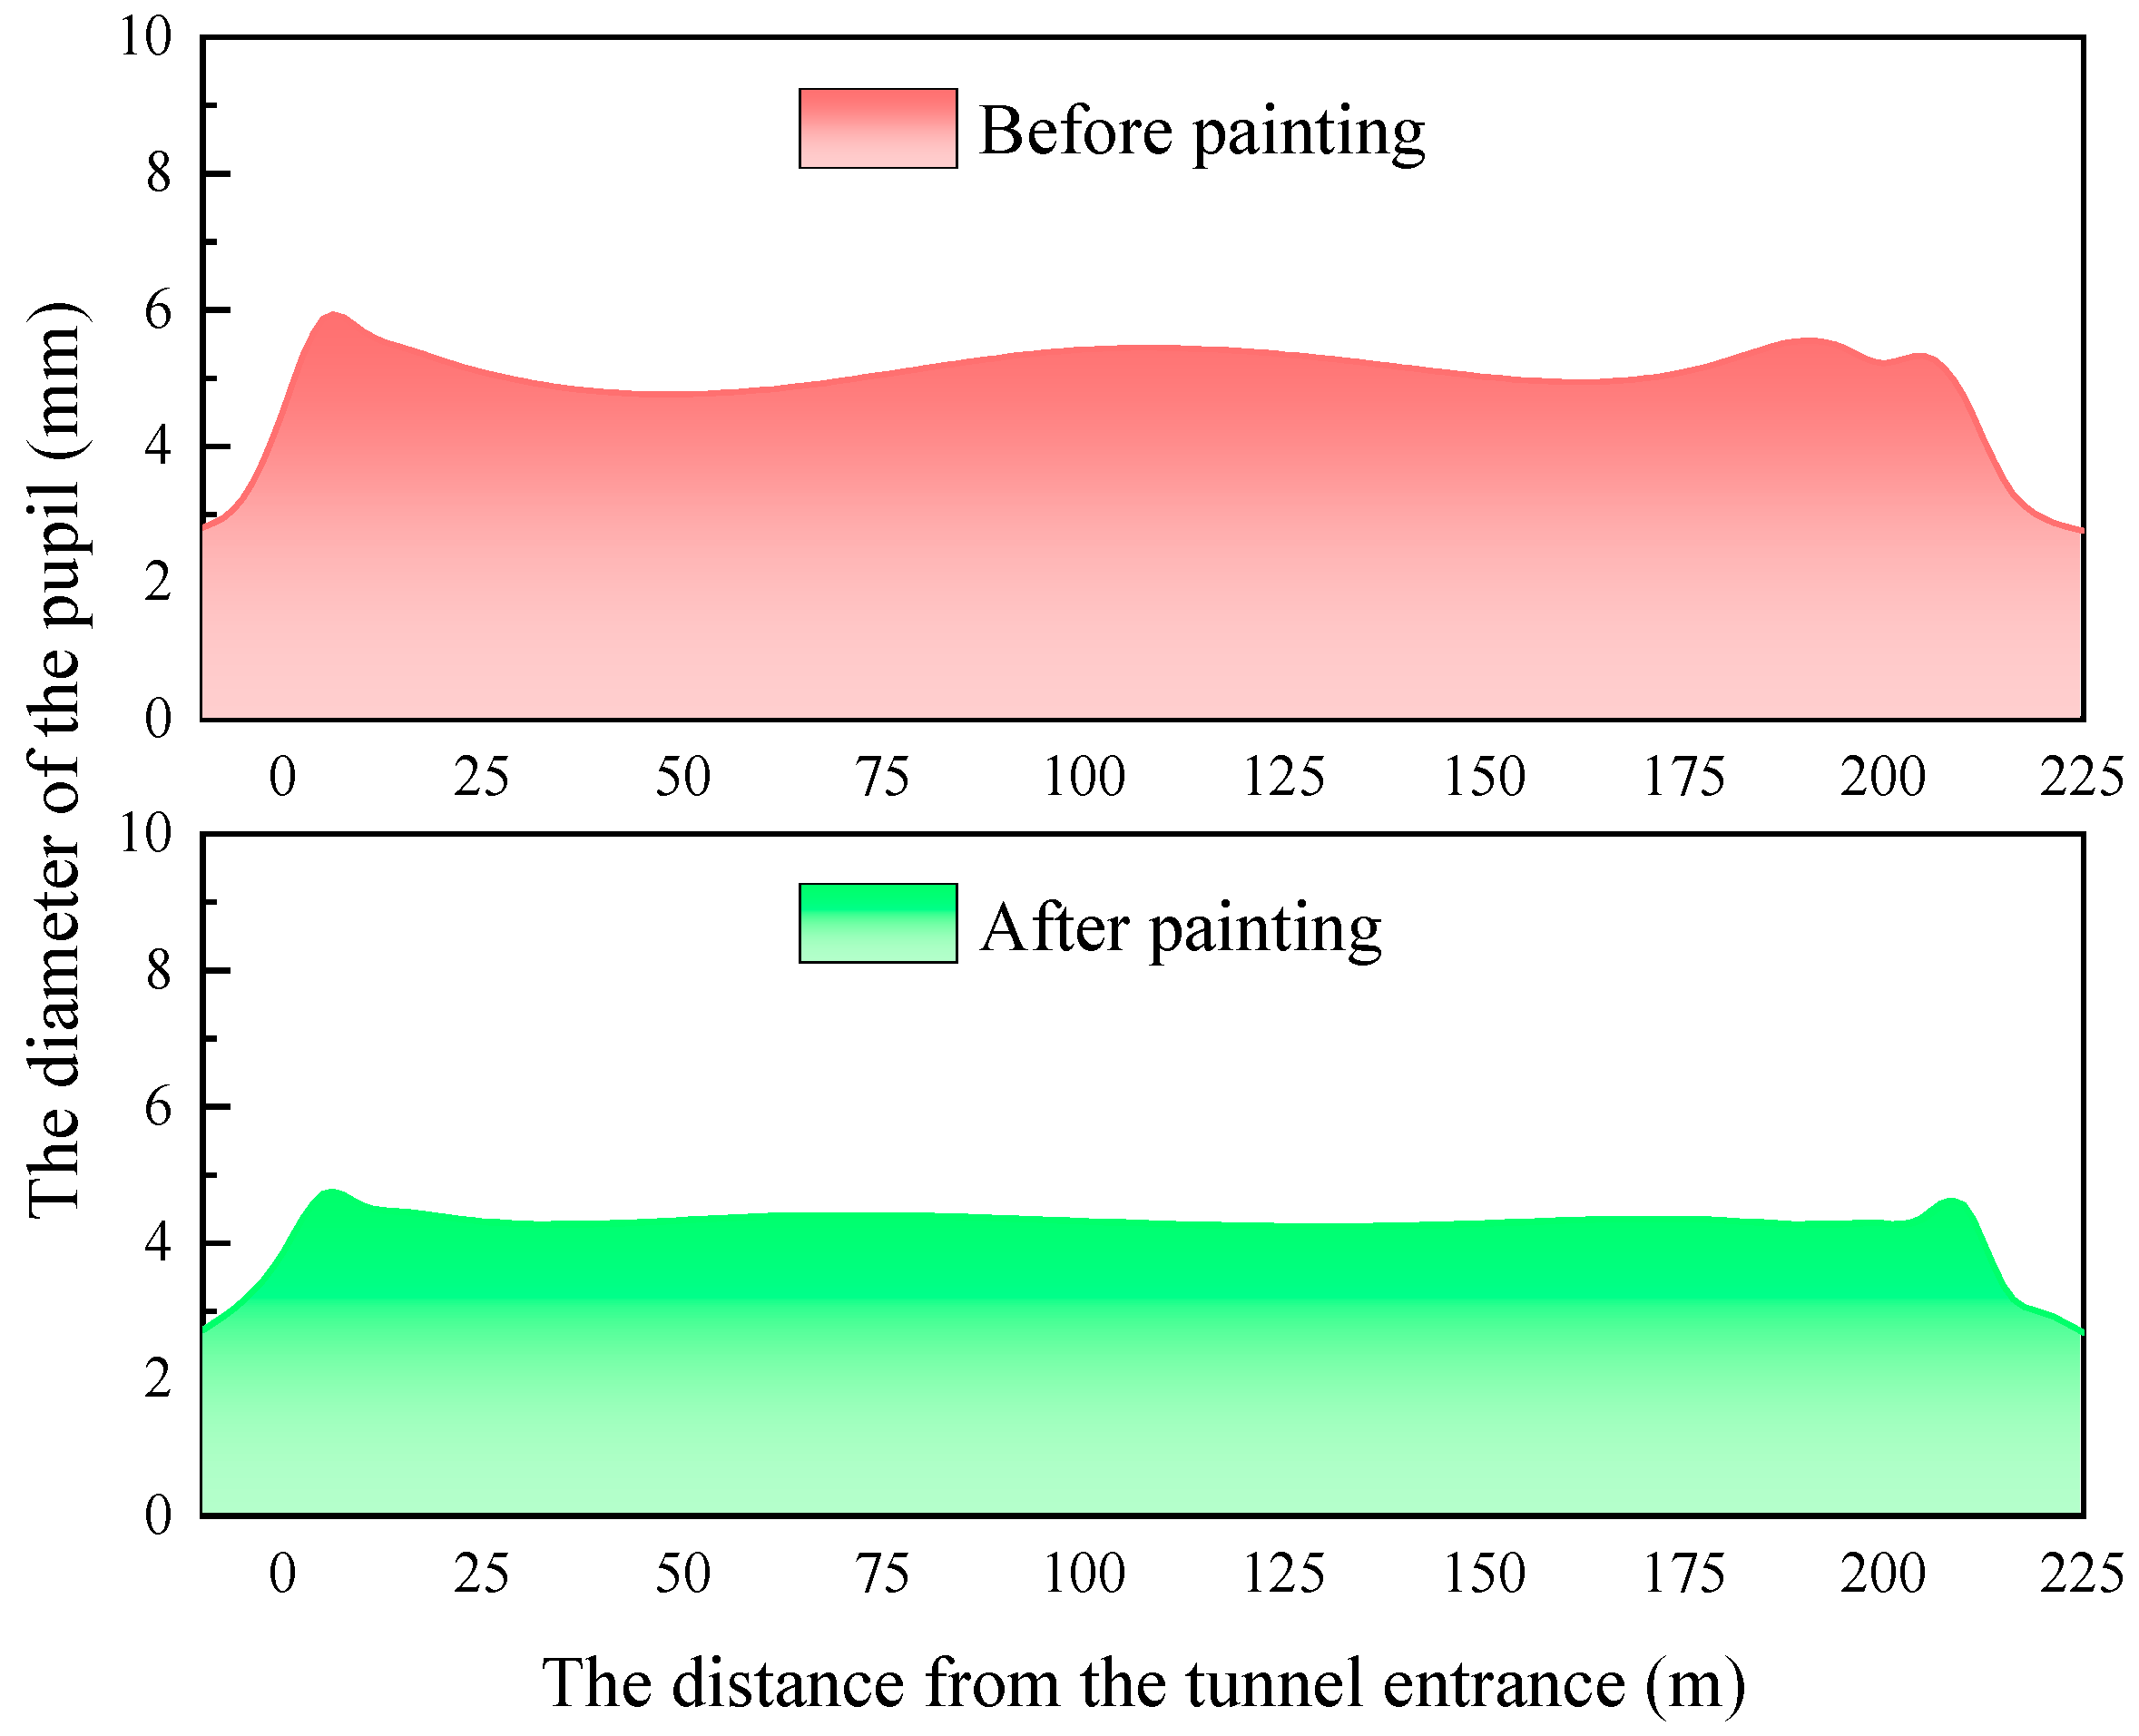
As illustrated in Figure 8, during the tunnel entry phase, prior to enhancements in the tunnel’s internal lighting environment, the average pupil diameter of drivers exhibited a rapid increase from approximately 2.81 mm to 5.87 mm, corresponding to a growth rate of 108.90%. Following the improvements in the tunnel lighting, the average pupil diameter increased from approximately 2.72 mm to 4.72 mm, indicating a growth rate of 73.53%.
Figure 8.
Comparison of driver pupil diameter before and after improvement of the tunnel’s internal light environment.
Throughout the tunnel driving phase, before the lighting enhancements, the average pupil diameter fluctuated between 5.42 mm and 5.16 mm, with a standard deviation of 0.20. After the lighting conditions were improved, this fluctuation range narrowed to between 4.25 mm and 4.39 mm, accompanied by a reduced standard deviation of 0.05.
During the tunnel exit phase, the average pupil diameter decreased sharply from 5.33 mm to 2.76 mm prior to the lighting improvements, representing a reduction of 48.22%. Subsequent to the lighting enhancements, the average pupil diameter decreased from 4.35 mm to 2.69 mm, reflecting a reduction of 38.16%.
3.2.2. Heart Rate Testing
- 1.
- Test Plan
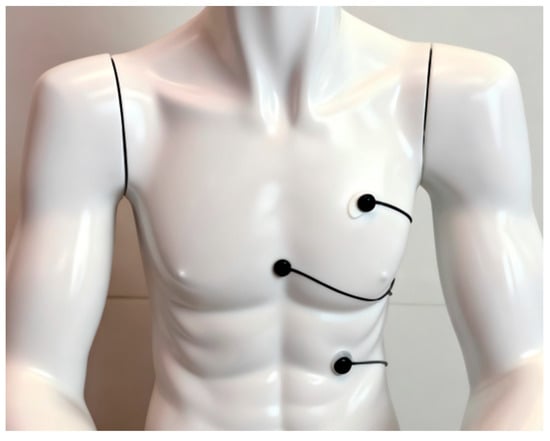
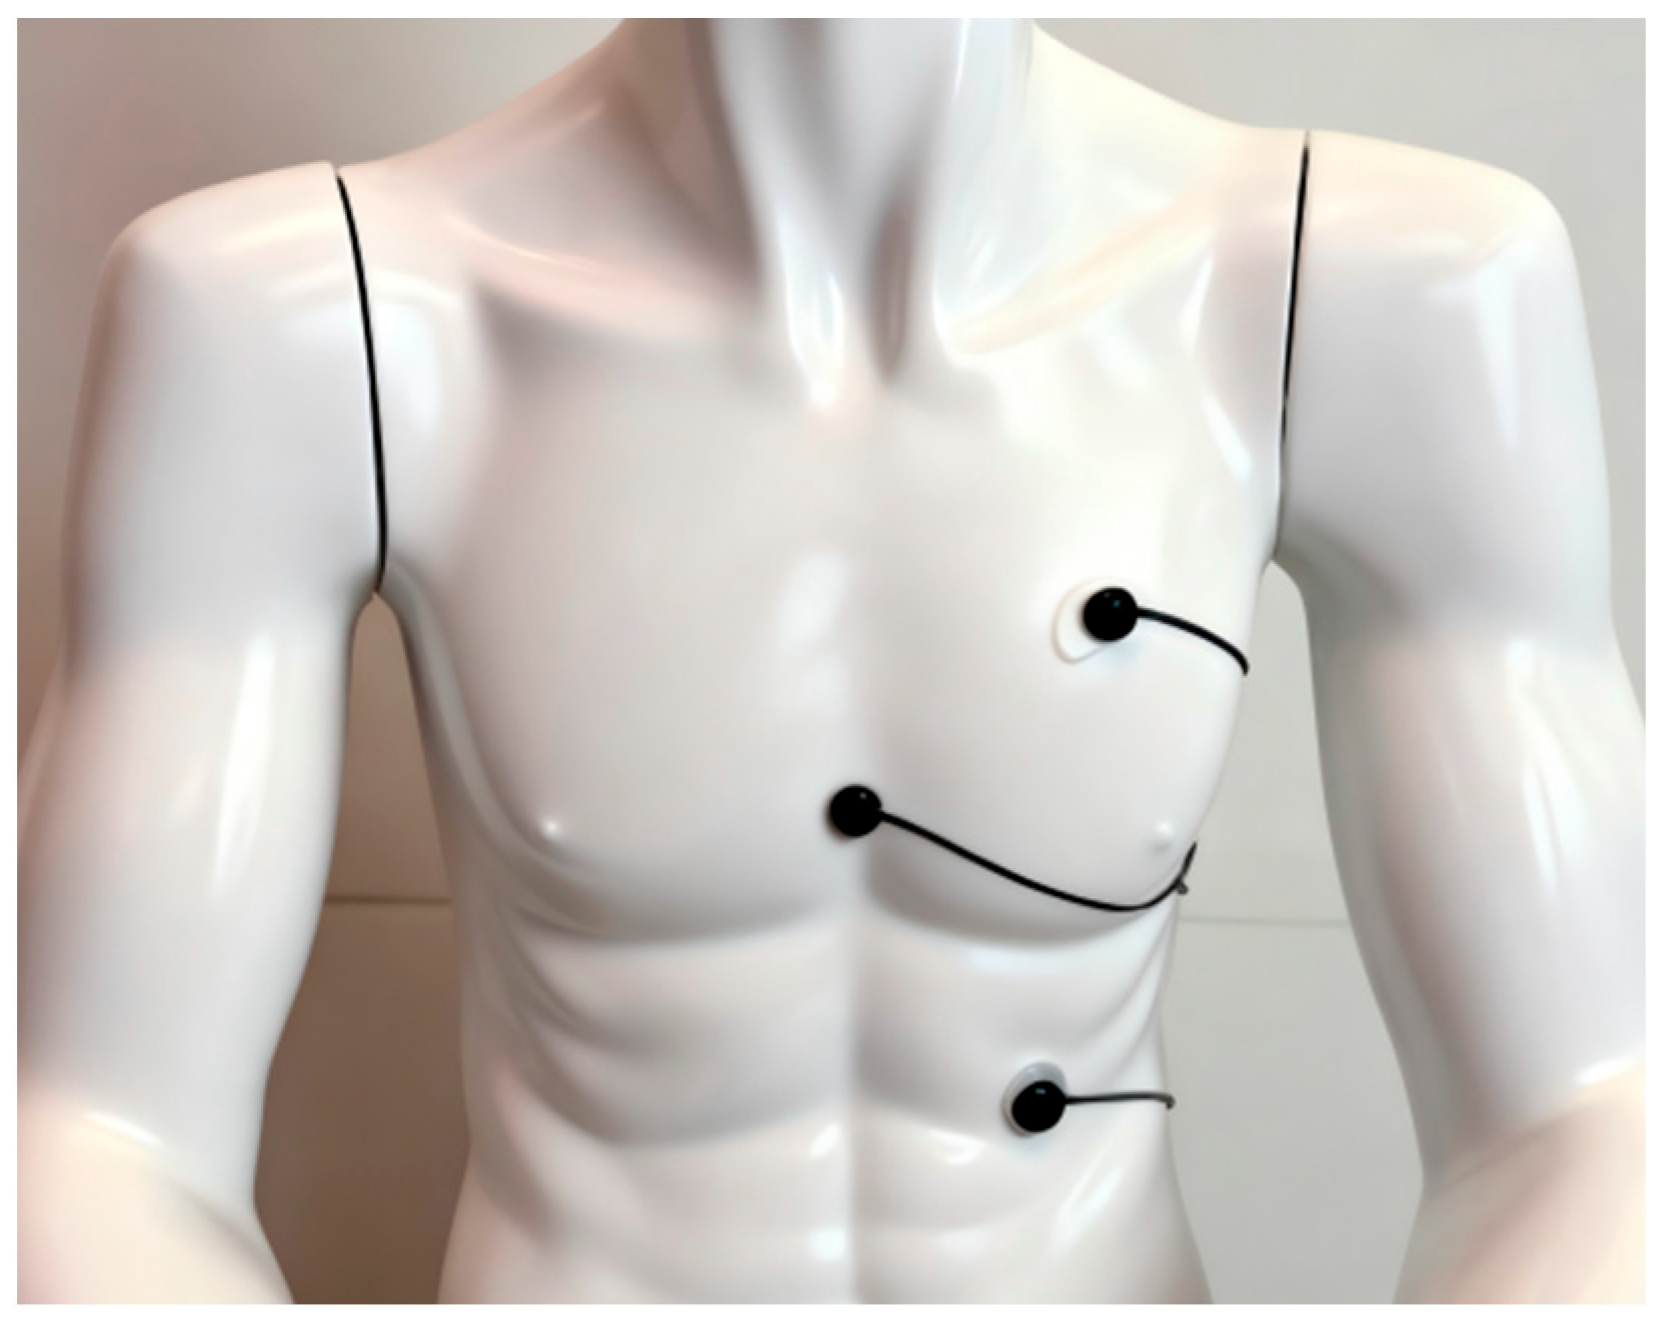
An MP160 multi-channel electrophysiological recording system was employed to monitor drivers’ heart rate variations across three distinct scenarios: prior to and following the application of the new luminescent coatings within the tunnel, during tunnel entry, while driving inside the tunnel, and upon tunnel exit. The heart rate monitor was worn as illustrated in Figure 9. Each participant completed three repeated trials. Following each trial, the collected experimental data were subjected to preliminary verification and organization to ensure data completeness and validity.
Figure 9.
Heart rate monitor attachment diagram.
- 2.
- Results Analysis
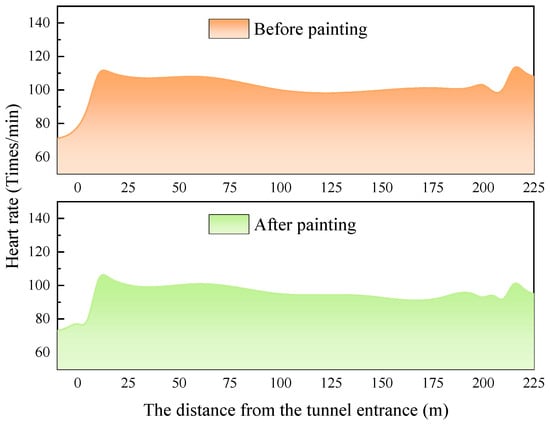
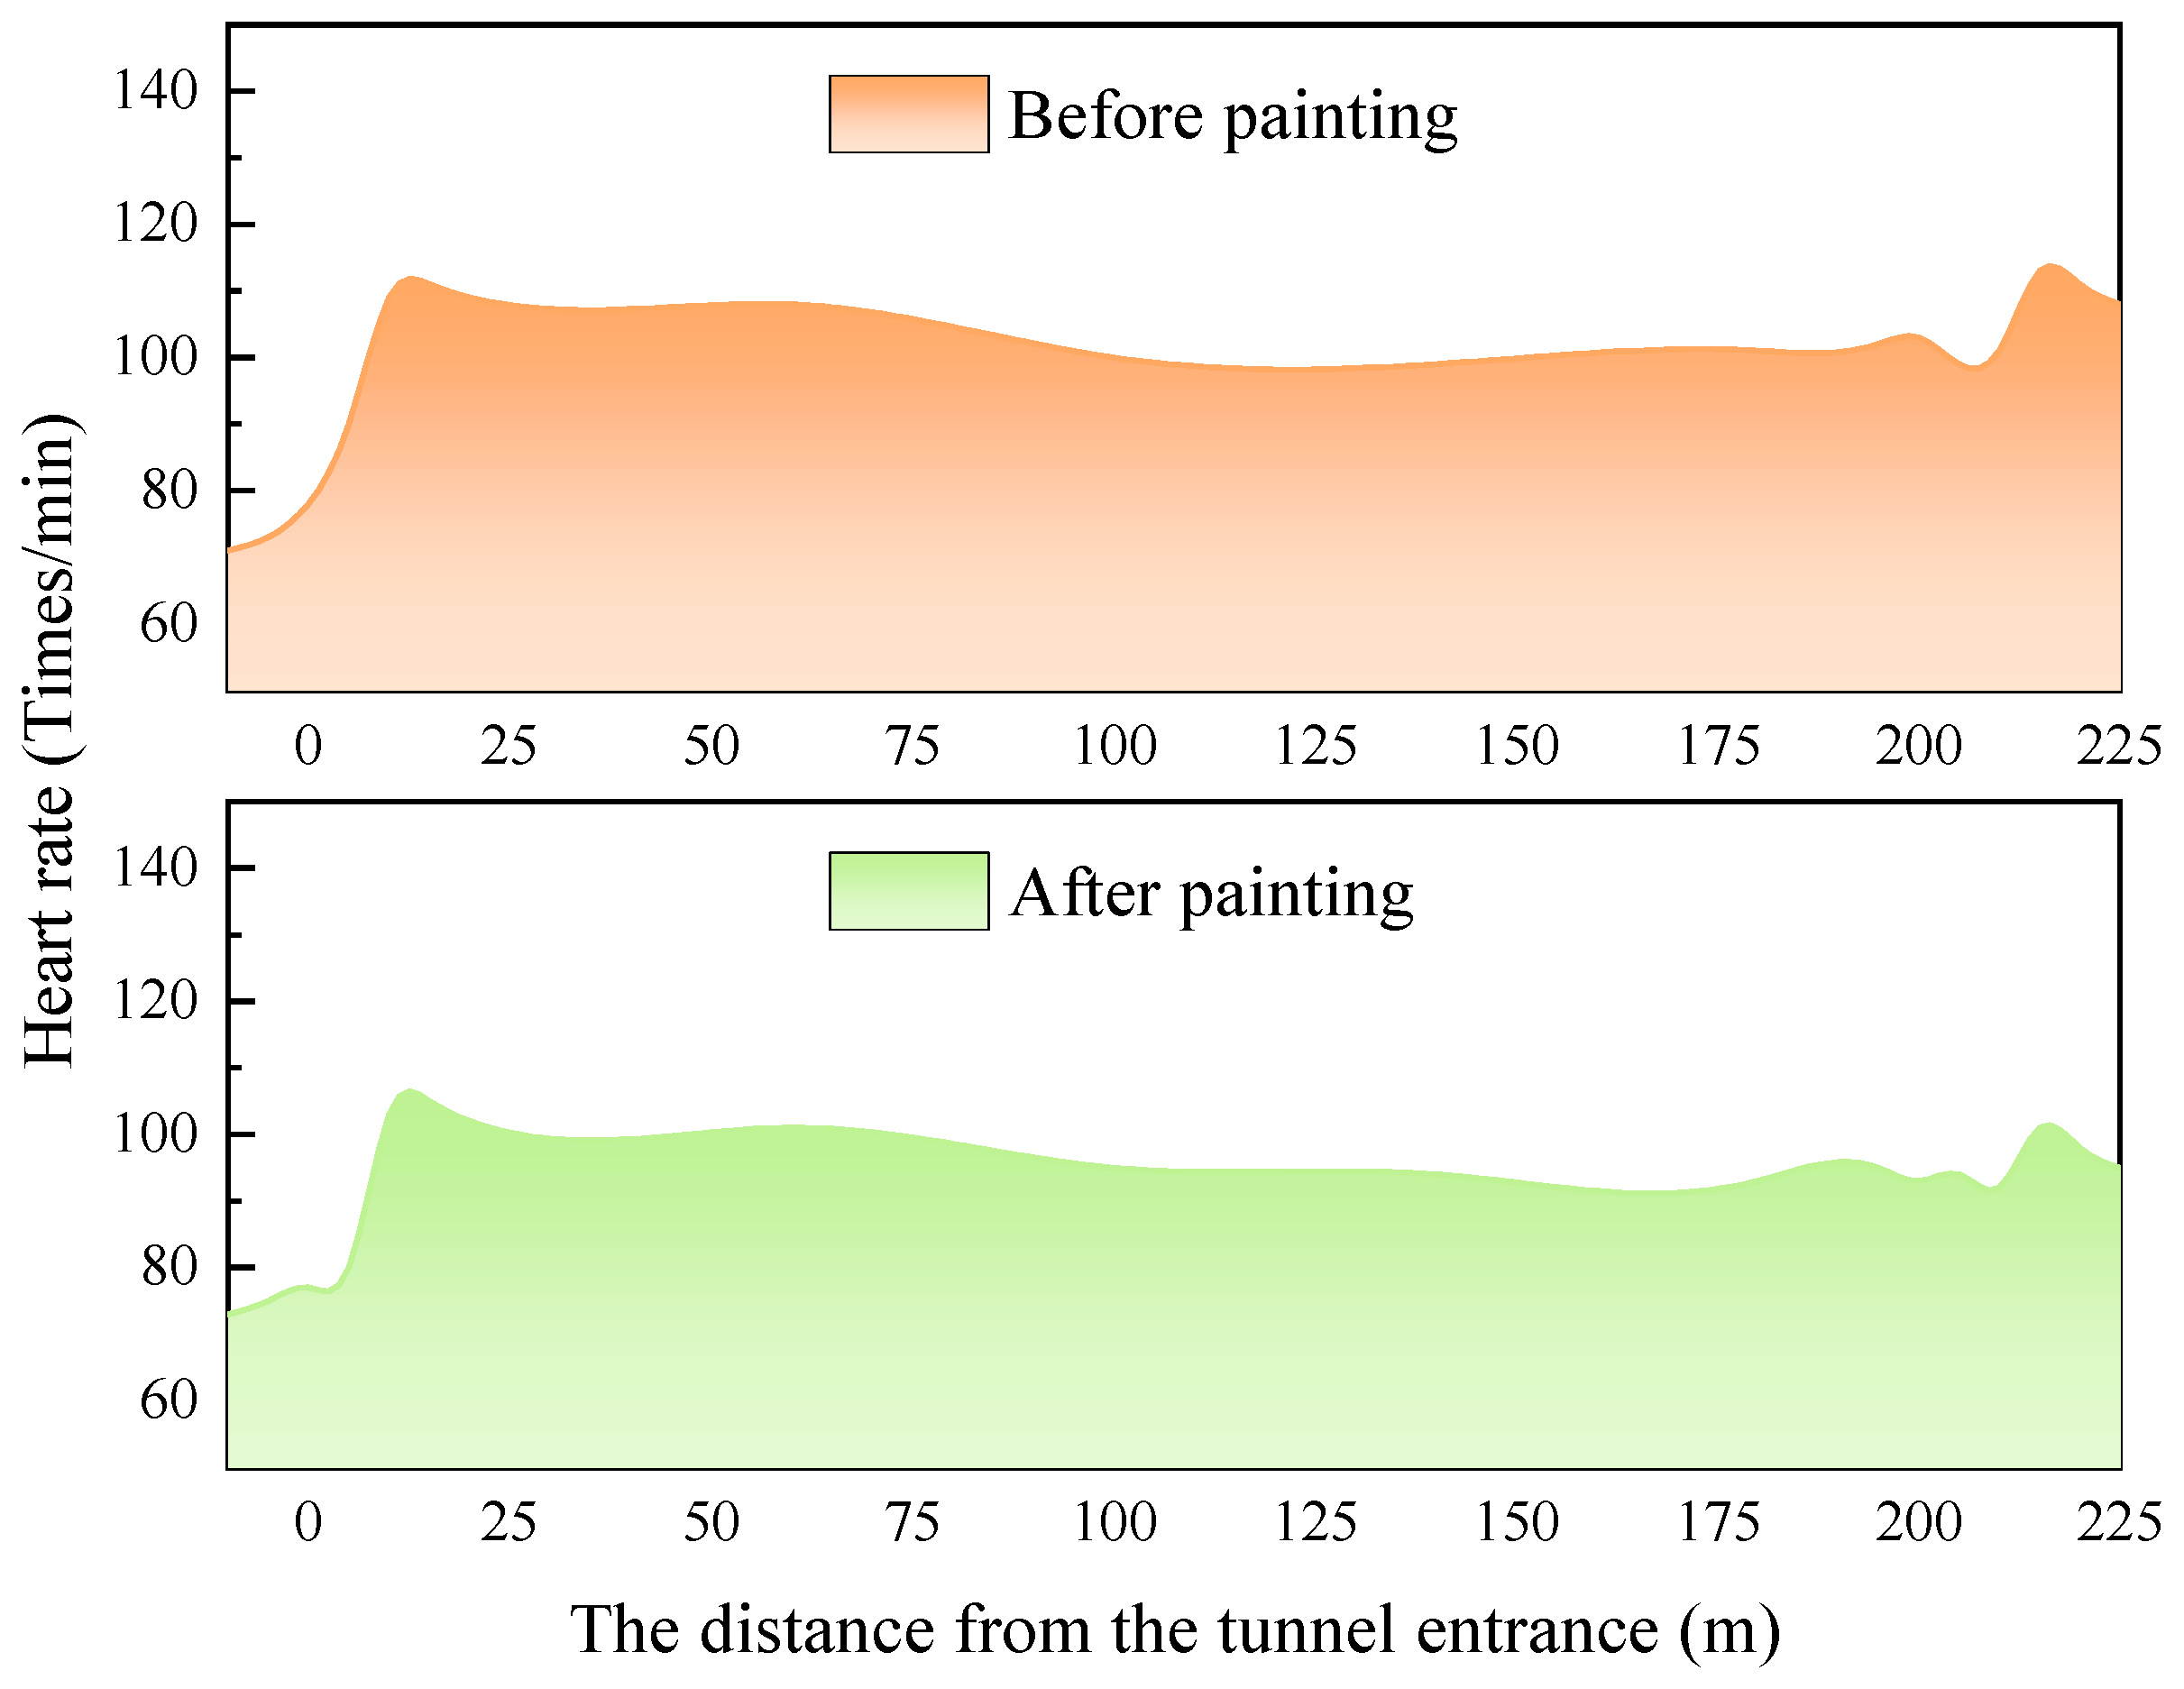
As illustrated in Figure 10, during the tunnel entry phase, the driver’s heart rate rose from 71 beats per minute to 111 beats per minute prior to enhancements in the tunnel’s internal lighting environment, corresponding to a 56.34% increase. Following the lighting improvements, the heart rate increased from 73 beats per minute to 105 beats per minute, reflecting a 43.84% rise.
Figure 10.
Comparison of driver heart rate before and after improvement of tunnel lighting conditions.
Throughout the tunnel driving phase, the driver’s heart rate fluctuated between 99 and 109 beats per minute, with a standard deviation of 3.89, before the lighting modifications. Subsequent to the improvements, the heart rate ranged from 93 to 102 beats per minute, with a standard deviation of 3.76.
During the tunnel exit phase, the heart rate increased from 99 beats per minute to 113 beats per minute before the lighting enhancements, indicating a 14.14% increase. After the improvements, the heart rate rose from 92 beats per minute to 101 beats per minute, representing a 9.78% increase.
3.2.3. Statistical Analysis
- 1.
- Methods
The present study utilized SPSS version 26.0 for the statistical analysis of the collected data. Given that all participants completed assessments under both the “before paint” and “after paint” conditions, the dataset followed a paired design. Consequently, a paired t-test was conducted to evaluate the statistical significance of differences between the two related groups. A 95% confidence interval was employed to estimate the range within which the population parameter is likely to lie. Effect sizes were quantified using Cohen’s d, with thresholds of 0.2 to 0.5 representing a small effect, 0.5 to 0.8 a moderate effect, and values exceeding 0.8 indicating a large effect. The significance level was set at α = 0.05 for two-tailed tests, with p-values less than 0.05 considered indicative of statistically significant differences.
- 2.
- Results Analysis
Statistical analyses indicated that following the application of the paint, both pupil diameter and heart rate in drivers exhibited significant reductions relative to pre-application measurements. Specifically, pupil diameter decreased by an average of 0.48 mm (Cohen’s d = 1.35), reflecting enhanced pupil constriction stability and a marked reduction in visual load after application. Concurrently, heart rate declined by an average of 7.7 beats per minute (Cohen’s d = 0.98), suggesting a substantial mitigation of driving-related fatigue. The 95% confidence intervals for all measured variables excluded zero, thereby reinforcing the statistical robustness of these observed differences. Collectively, these findings demonstrate that the luminous coating substantially improves physiological parameters associated with tunnel driving. The statistical analysis of drivers’ physiological indicators before and after painting application is shown in Table 6.
Table 6.
Statistical analysis table of driver physiological indicators before and after painting.
4. Driving Safety Evaluation
4.1. Weight Calculation
Weight calculations were conducted for the criterion layer. Upon verifying that the 20 expert judgment matrices satisfied the consistency criterion (CR < 0.1), these matrices were aggregated utilizing Formula (7). The aggregated matrix is presented in Table 7 below.
Table 7.
Integrated judgment matrix for criteria layer.
Next, λmax, CI, and CR were calculated using Formula (8), yielding the results shown in Table 8.
Table 8.
Weight calculation results.
Following the same calculation steps as the guideline layer, the judgment integration matrix and weight calculation results for the indicator layer are as follows:
The computed weights for the indicators corresponding to levels U1, U2, U3 and U4 are presented in Table A1, Table A2, Table A3 and Table A4, respectively.
Next, λmax, CI, and CR were calculated using Formula (8), yielding the results shown in Table 9.
Table 9.
Weight calculation results under U1, U2, U3 and U4.
All passed consistency testing.
Based on the assessment of each indicator, the calculation results for the integration matrix and weights are summarized in Table 10.
Table 10.
Weight summary table for driver mental load indicator system.
It is apparent that the assessment of driver cognitive load should predominantly concentrate on variations in pupil diameter and heart rate variability, especially during the phases of tunnel ingress and egress. These physiological metrics represent the most salient indicators. Furthermore, the inclusion of lighting environment parameters facilitates a comprehensive, multidimensional evaluation of driving workload.
4.2. Membership Function Calculation
This study engaged 20 participants who assessed the indicator layers within the indicator system table through a questionnaire survey grounded in a predefined set of evaluation criteria. Following the collection of the completed questionnaires, the results summarized in Table A1 and Table A2 were obtained. Subsequently, the membership degrees of each indicator across various evaluation criteria were computed, as detailed in Table A3 and Table A4, yielding fuzzy membership matrices corresponding to each hierarchical level. By integrating factor weights and employing matrix multiplication, fuzzy evaluation matrices were derived for each individual indicator or factor. The multilevel fuzzy comprehensive evaluation method thus synthesizes overall assessments by aggregating evaluations conducted at single hierarchical levels.
4.3. Evaluation Results Before Improvement of Tunnel Interior Lighting Environment
- 1.
- Criteria-Level Evaluation
Luminance U1 Factor Evaluation: Fuzzy evaluation matrix formed by scoring indicators for the luminance U1 factor layer:
The comprehensive evaluation of the influence factors for the luminance U1 factor is:
= (0 0.0457 0.302 0.4161 0.2362)
Illuminance U2 Factor Evaluation: Fuzzy evaluation matrix formed by scoring indicators under the illuminance U2 level:
The comprehensive evaluation of the influencing factors for illuminance U2 is:
= (0 0.0679 0.3407 0.3978 0.1936)
Pupil Diameter U3 Factor Evaluation: Fuzzy evaluation matrix formed by scoring indicators under the pupil diameter U3 factor hierarchy:
The comprehensive evaluation of the influence factors for the pupil diameter U3 factor is:
= (0 0.0377 0.1108 0.3958 0.4556)
Heart Rate U4 Factor Evaluation: Fuzzy evaluation matrix formed by scoring indicators under the heart rate U4 factor hierarchy:
The comprehensive evaluation of the influence factors for the heart rate U4 factor is:
= (0 0 0.0525 0.4896 0.4579)
- 2.
- Comprehensive Evaluation
Criterion-layer evaluation matrix:
Then the comprehensive evaluation of driving load indicators before improving the internal lighting environment of the tunnel is:
= (0 0.0346 0.1775 0.4256 0.3622)
Based on the principle of determining comments by scores, the final score is calculated. V represents the assigned values for the comment set, and Q represents the final score. Multiplying them bitwise yields:
4.4. Evaluation Results After Improvement of Tunnel Interior Lighting Environment
- 1.
- Criteria Layer Evaluation
Luminance U1 Factor Evaluation: Fuzzy evaluation matrix formed by scoring indicators for the luminance U1 factor layer:
The comprehensive evaluation of the influence factors for the luminance U1 factor is:
= (0.3746 0.352 0.1776 0.0957 0)
Illuminance U2 Factor Evaluation: Fuzzy evaluation matrix formed by scoring indicators under the illuminance U2 level:
The comprehensive evaluation of the influencing factors for illuminance U2 is:
= (0.3750 0.3985 0.1729 0.0536 0)
Pupil Diameter U3 Factor Evaluation: Fuzzy evaluation matrix formed by scoring indicators under the pupil diameter U3 factor hierarchy:
The comprehensive evaluation of the influence factors for the pupil diameter U3 factor is:
= (0.1407 0.4922 0.2538 0.0862 0.0269)
Heart Rate U4 Factor Evaluation: Fuzzy evaluation matrix formed by scoring indicators under the heart rate U4 factor hierarchy:
The comprehensive evaluation of the influence factors for the heart rate U4 factor is:
= (0.0698 0.2220 0.4930 0.1502 0.0651)
- 2.
- Comprehensive Evaluation
Criterion-layer evaluation matrix:
Then, the comprehensive evaluation of driving load indicators after improving the internal lighting environment of the tunnel is:
= (0.2143 0.3728 0.2865 0.0998 0.0264)
Based on the principle of determining comments by scores, the final score is calculated. V represents the assigned value for the comment set, and Q represents the final score. Multiplying them bitwise yields:
In summary, the driving load level prior to the enhancement of the tunnel’s internal lighting environment was categorized as “moderately high,” reflecting an elevated driver workload. Following the improvement of the lighting conditions, the driving load level was reduced to “moderately low.” These findings indicate that the implementation of the novel luminous paint significantly alleviates driver workload within the tunnel.
5. Conclusions
This study, situated within the domain of optimizing the internal lighting conditions of highway tunnels through the application of new luminescent coatings, utilizes the AHP-FCE methodology to establish an evaluative framework for assessing drivers’ psychological load within highway tunnels. The framework is organized hierarchically, comprising a target layer, four criterion layers, and twelve indicator layers. Empirical data were collected via real-vehicle experiments to analyze the mechanisms and patterns through which modifications in the lighting environment affect drivers’ psychological and physiological responses. The principal findings are as follows:
(1) The application of the new luminescent coatings to tunnel sidewalls resulted in a marked enhancement in the uniformity and stability of the lighting environment. Specifically, the overall average brightness and illuminance within the tunnel increased by 37.71% and 40.95%, respectively. Furthermore, the total uniformity of brightness and illuminance in the tunnel’s central section improved by 9.85% and 9.00%, respectively, while longitudinal uniformity of brightness and illuminance increased by 3.75% and 10.24%, respectively.
(2) Subsequent to the improvements in the tunnel’s internal lighting environment, the variability in drivers’ physiological indicators exhibited a significant reduction across all phases of tunnel navigation. During the tunnel entry phase, the pupil diameter growth rate decreased from 108.90% to 73.53%, and the heart rate growth rate declined from 56.34% to 43.84%. In the tunnel driving phase, the standard deviation of pupil diameter diminished by 75%, and the standard deviation of heart rate decreased by 3.34%. During the tunnel exit phase, the rate of pupil diameter reduction lessened from 48.22% to 38.16%, and the rate of heart rate increase declined from 14.14% to 9.78%, collectively indicating effective mitigation of drivers’ physiological stress levels.
(3) Quantitative assessments conducted via the AHP-FCE approach reveal that enhancements to the tunnel’s internal lighting environment substantially alleviate drivers’ psychological load. Prior to the intervention, the comprehensive tunnel driving load score was 0.6230, corresponding to a “moderately high” rating. Following the improvements, this score decreased to 0.2702, reflecting a shift to a “moderately low” rating.
(4) The AHP-FCE framework proposed in this study, which combines objective physiological metrics with subjective evaluations of psychological load, provides a standardized and replicable instrument for human factors research in tunnel engineering. Unlike assessment approaches based on singular indices, this framework facilitates the quantitative integration of lighting environment parameters, physiological responses, and psychological load, thereby constituting a methodological reference for human-centered investigations in traffic engineering.
This study employs new luminous coatings alongside the development of an AHP-FCE framework to demonstrate the mitigating impact of optimized tunnel lighting environments on drivers’ mental workload. Nonetheless, several limitations persist. Firstly, despite efforts to minimize interference from extreme weather, peak traffic volumes, and other external factors, it was not feasible to entirely eliminate confounding variables at both environmental and operational levels. For example, minor fluctuations in background luminance at tunnel entrances across different time periods may compromise the precision of driver pupil adaptation measurements. Furthermore, the implementation of a flexible speed control range of 60 km/h ± 5 km/h, rather than maintaining a constant velocity, could introduce slight variability in physiological indicators such as heart rate and pupil diameter due to speed fluctuations.
To overcome these limitations and further the integration of human factors engineering and lighting technology in tunnel environments, future research should pursue several avenues. These include adopting standardized experimental designs that systematically incorporate variables such as weather conditions, background luminance, and vehicle speed, employing techniques such as group comparisons and data calibration to control for confounding influences. Additionally, the development of tunnel driving simulators for controlled indoor experimentation would allow precise manipulation of factors like illumination and traffic flow. Validating findings from such simulations through real-vehicle trials would enhance the robustness and generalizability of research outcomes.
Author Contributions
Conceptualization and funding acquisition, F.Z.; methodology and writing—original draft preparation, H.X.; formal analysis and validation, L.C.; writing—review and visualization, C.W.; resources and investigation, Y.C.; project administration and formal analysis, L.W. All authors have read and agreed to the published version of the manuscript.
Funding
This research was funded by the Jilin Science and Technology Development Program Project: Research and Application of New Environmentally Friendly Multifunctional Waterborne Paints for Road Tunnels (Project No. 20250203182SF).
Institutional Review Board Statement
This study involved non-invasive collection of physiological data (eye tracking and heart rate) from human subjects during real-vehicle driving tests. The research is exempt from IRB review as all data were fully anonymized with no identifiable personal information recorded, and the study caused no harm to participants nor involved sensitive personal information.
Informed Consent Statement
Informed consent for participation was obtained from all subjects involved in the study.
Data Availability Statement
The original contributions presented in this study are included in the article material. Further inquiries can be directed to the corresponding author.
Conflicts of Interest
Author Yu Chen was employed by the company Jilin Province Expressway Group Co. Author Lidong Wang was employed by the company Jilin Provincial Highway Administration. The remaining authors declare that the research was conducted in the absence of any commercial or financial relationships that could be construed as a potential conflict of interest.
Appendix A
Table A1.
Weight calculation results for indicators under the brightness U1 level.
Table A2.
Weight calculation results for indicators under the illuminance U2 level.
Table A3.
Weight calculation results for indicators under the brightness U3 level.
Table A4.
Weight calculation results for indicators under the brightness U4 level.
Table A5.
Questionnaire results for evaluation of driving load indicators before improvement of tunnel interior lighting environment.
Table A6.
Questionnaire results collection form for evaluation of driving load indicators after improvement of tunnel interior lighting environment.
Table A7.
Membership functions of the driving load index evaluation system before improvement of the tunnel’s internal lighting environment.
Table A8.
Membership functions of the evaluation system for driving load indicators after improving the internal lighting environment of tunnels.
References
- Xin, S.; Wei, Y.; Zhao, Z.; Liu, N.; Liu, S.; Qu, Y. Tunnel Lighting Optimisation Study Based on Sunshade. Tunn. Undergr. Space Technol. 2024, 151, 105863. [Google Scholar] [CrossRef] [Scilit]
- Peña-García, A. The impact of lighting on drivers well-being and safety in very long underground roads: New challenges for new infrastructures. Tunn. Undergr. Space Technol. 2018, 80, 38–43. [Google Scholar] [CrossRef] [Scilit]
- Wang, B.-L.; Ye, Y.; Yan, B. Experimental Research on Application of the Natural Light to Tunnel Lighting Engineering. J. Light Vis. Environ. 2015, 39, 43–51. [Google Scholar] [CrossRef] [Scilit]
- Chen, L.; Feng, X.; Hu, X.; He, Z.; Chen, R.; Zhang, H.; Chen, H. Optimized mixing ratio and light environment simulation of long afterglow self-luminous coatings for tunnel inner wall. Tunn. Constr. 2025, 45, 1526–1537. [Google Scholar]
- Yu, S.; Shi, L.; Zhang, L.; Liu, Z.; Tu, Y. A solar optical reflection lighting system for threshold zone of short tunnels: Theory and practice. Tunn. Undergr. Space Technol. 2023, 131, 104839. [Google Scholar] [CrossRef] [Scilit]
- Zhang, Y.; Zhuo, X.; Guo, W.; Wang, X.; Zhao, Z. Lighting Environment Optimization of Highway Tunnel Entrance Based on Simulation Research. Int. J. Environ. Res. Public Health 2019, 16, 2195. [Google Scholar] [CrossRef] [Scilit]
- Yin, L.; Shi, L.; Liu, Z.; Zhang, L. Application of Tunnel Lighting Safety and Energy Saving Technology Based on Luminescent Reflective High Performance Coatings. Tunn. Constr. 2019, 39, 327–333. [Google Scholar]
- Feng, S.; Gao, W.; Wang, J. Experimental study on energy-storing self-illuminated multi-functional coating for auxiliary lighting in tunnels. Mod. Tunn. Technol. 2016, 53, 189–194. [Google Scholar] [CrossRef]
- Cai, X.; Weng, J.; Zhang, Q.; Du, F. The Research Summary on Wall Reflective Materials in Tunnel Lighting. Light Light. 2017, 41, 22–26. [Google Scholar]
- Yu, L.; Xia, P.; Wang, M.; Cui, P. Study on Tunnel Emergeney Lighting by Only Using Car Lighting Combined With Energy Storage Luminescent Coating. Modemn Tunn. Technol. 2019, 56, 184–188. [Google Scholar] [CrossRef]
- Chen, B.; Chen, T.; Mao, W.; Chen, Q.; Jin, W. Application analysis of the energystorage luminescent coatings in Changshiling tunnel. Shandong Jiaotong Keji 2020, 2, 110–111+114. [Google Scholar]
- Huang, Y.; Cai, B.; Zheng, G.; Cui, Y.; Sun, Y. Practice of Energy—Saving Reconstruction of Road Tunnel Lighting System Under the Background of Urbanization. China Light Light. 2020, 7, 10–15. [Google Scholar]
- Kang, C.; Du, Z.; Lin, G.; Zhang, C.; Huang, Z.; Wu, K. Luminance stepped decreasing ratio of the tunnel entrance enhanced lighting based on visual performance. Appl. Opt. 2022, 61, 6553–6560. [Google Scholar] [CrossRef] [Scilit]
- He, S.; Liang, B.; Tähkämö, L.; Maksimainen, M.; Halonen, L. The influences of tunnel lighting environment on drivers’ peripheral visual performance during transient adaptation. Displays 2020, 64, 101964. [Google Scholar] [CrossRef] [Scilit]
- Zhu, K.; Gong, B. Research on driver mental load in exit of super long tunnel. Technol. Econ. Areas Commun. 2017, 19, 4. [Google Scholar]
- Zhu, T.; Wu, L.; Hu, Y.; Liu, H.; Xu, B. Research on Characteristics of Drivers’Mental Workload in Extra-longTunnels Based on the Factor Modelwxpressway. China J. Highw. Transp. 2018, 31, 11. [Google Scholar]
- Guo, Y.; Guo, T.; Wu, J. Change regularity of drivers′ psychological load in urban tunnels based on factor analysis. Transp. Res. 2021, 7, 91–99. [Google Scholar] [CrossRef]
- Liang, B.; Qin, C.; Niu, J.A.; Xiao, J.; Wen, S. Psychological Load of Drivers in Entrance Zone of Road Tunnel Based on TOPSIS Improved Factor Analysis Method. Transp. Res. Rec. J. Transp. Res. Board 2023, 2678, 163–177. [Google Scholar] [CrossRef] [Scilit]
- Hu, Y.; Sun, L. Research on the quantitative model of psychological load for drivers in expressway tunnels. Agric. Equip. Veh. Eng. 2025, 63, 94–98. [Google Scholar]
- Saaty, T.L. Decision making with the analytic hierarchy process. Int. J. Serv. Sci. 2008, 1, 83–98. [Google Scholar] [CrossRef] [Scilit]
- Chuantao, W.; Xiaofei, C.; Baowen, L. Fuzzy comprehensive evaluation based on multi-attribute group decision making for business intelligence system. J. Intell. Fuzzy Syst. 2016, 31, 2203–2212. [Google Scholar] [CrossRef] [Scilit]
- Dai, Z.; Sun, C.; Zhao, L.; Li, Z. Assessment of Smart Learning Environments in Higher Educational Institutions: A Study Using AHP-FCE and GA-BP Methods. IEEE Access 2021, 9, 35487–35500. [Google Scholar] [CrossRef] [Scilit]
- Zheng, C.; Chen, B.; Li, W.; Zhang, Z. Research on Risk Assessment of Complex Mountain Tunnels Based on AHP-FCE. In Proceedings of the IOP Conference Series: Materials Science and Engineering; IPO Publishing: Bristol, UK, 2020. [Google Scholar]
- Tang, M.; Wang, Y.; Li, M.; Jiang, Y.; Liu, S. Dynamic Evaluation of Lighting Energy Consumption Level of Operating Highway Tunnels Based on AHP-FCE. Transp. Energy Conserv. Environ. Prot. 2023, 19, 205–211. [Google Scholar]
- Chen, Z. Research on safety evaluation of construction projects based on AHP-FCE. Shanxi Archit. 2013, 39, 3. [Google Scholar]
- Li, Q.; Wang, S.; Zhang, Z.; Qian, H.; Pei, J. AHP-FCE-based high-rise building construction risk assessment. IOP Conf. Ser. Mater. Sci. Eng. 2020, 780, 072035. [Google Scholar] [CrossRef] [Scilit]
- Huang, Z.; Gardoni, M. Concept evaluation based on fuzzy analytic hierarchy process. In Proceedings of the 2020 IEEE International Systems Conference (SysCon); IEEE: New York, NY, USA, 2020. [Google Scholar]
- Zhang, X.; Yang, J.; Zhao, X. Optimal study of the rural house space heating systems employing the AHP and FCE methods. Energy 2018, 150, 631–641. [Google Scholar] [CrossRef] [Scilit]
- Zhang, Y.; Cai, M. Mechanical Properties Evaluation for Pneumatic Actuator and Electric Actuator Based on AHP-FCE. In Proceedings of the 2010 WASE International Conference on Information Engineering, Beidai, China, 14–15 August 2010. [Google Scholar]
- Purnami, P.; Tama, I.P.; Sofi’i, Y.K.; Wardana, I.N. The analytic hierarchy process for the selection of water electrolysis electromagnetic ionization booster. Electrochim. Acta 2025, 512, 145499. [Google Scholar] [CrossRef] [Scilit]
- Goswami, S.; Kolte, R.; Kumar, A.; Pipralia, S. Prioritizing fire risk factors in historic urban cores of India: An analytic hierarchy process approach. Int. J. Disaster Resil. Built Environ. 2025, 16, 474–493. [Google Scholar] [CrossRef] [Scilit]
- Liu, F.; Dai, L.-T.; Cheng, F.-Y.; Zhang, W.-G. An axiom system of the analytic hierarchy process based on the completeness of preferences. Int. J. Approx. Reason. 2025, 183, 109449. [Google Scholar] [CrossRef] [Scilit]
- Tu, J.; Wu, Z. Analytic hierarchy process rank reversals: Causes and solutions. Ann. Oper. Res. 2025, 346, 1785–1809. [Google Scholar] [CrossRef] [Scilit]
- Li, M.; Yang, Z.; Wang, C.; Chen, Y.; Li, S.; Zhu, J.; Zhu, G. Evaluation of low-carbon treatment modes for domestic wastewater based onan entropy weight -fuzzy comprehensive evaluation model. Chin. J. Environ. Eng. 2025, 19, 1327–1338. [Google Scholar]
- Zhang, X.; Xu, Y.; Xu, Y.; Yan, Q. Mechanism of Environmental Impact on Operational Performance of Station-City Integrated Three-Dimensional Network Based on SEM-FCE. Railw. Transp. Econ. 2025, 47, 224–232. [Google Scholar] [CrossRef]
- Fang, J.; Xue, J. Tunnel Brightness Compensation With Spatial–Temporal Visual-Content Preservation. IEEE Trans. Ind. Electron. 2018, 65, 9005–9015. [Google Scholar] [CrossRef]
- Fotios, S.; Gibbons, R. Road lighting research for drivers and pedestrians: The basis of luminance and illuminance recommendations. Light. Res. Technol. 2018, 50, 154–186. [Google Scholar] [CrossRef] [Scilit]
- Zhigang, D.; Zheng, Z.; Zheng, M.; Ran, B.; Zhao, X. Drivers’ visual comfort at highway tunnel portals: A quantitative analysis based on visual oscillation. Transp. Res. Part D Transp. Environ. 2014, 31, 37–47. [Google Scholar] [CrossRef] [Scilit]
- Bogatova, R.I.; Salnitsky, V.P.; Gvozdev, S.M.; Agureev, A.N.; Beliaev, R.I.; Kutina, I.V.; Liventsova, A.A.; Sadovnikova, N.D. The effect of space—Frequency characteristics of the organ of vision on the human psychophysiological state and working capacity. Hum. Physiol. 2011, 37, 888–891. [Google Scholar] [CrossRef] [Scilit]
- Zhang, J.; Wang, M.; Wang, D.; Li, X.; Song, B.; Liu, P. Feasibility study on measurement of a physiological index value with an electrocardiogram tester to evaluate the pavement evenness and driving comfort. Measurement 2018, 117, 1–7. [Google Scholar] [CrossRef] [Scilit]
- Reimer, B.; Mehler, B. The impact of cognitive workload on physiological arousal in young adult drivers: A field study and simulation validation. Ergonomics 2011, 54, 932–942. [Google Scholar] [CrossRef] [Scilit]
- Eniyandunmo, D.; Shin, M.; Lee, C.; Anwar, A.; Kim, E.; Kim, K.; Kim, Y.H.; Lee, C. Utilising raw psycho-physiological data and functional data analysis for estimating mental workload in human drivers. Ergonomics 2025, 68, 602–618. [Google Scholar] [CrossRef] [Scilit]
- Kang, C.; Lin, G.; Ye, L.; Zhang, C.; Huang, Z.; Wu, K. Influence of luminance and luminance longitudinal uniformity of tunnel lighting on drivers’ comprehensive visual performance. Tunn. Undergr. Space Technol. 2023, 140, 105282. [Google Scholar] [CrossRef] [Scilit]
- Qin, C.; Liang, B.; Xiao, J.; Niu, J.a.; He, S. Physical characteristics of lighting environment and physiological change of drivers in tunnel. KSCE J. Civ. Eng. 2023, 27, 2170–2179. [Google Scholar] [CrossRef] [Scilit]
- Xu, M.; Yu, C.; Wang, K.; Liu, Y.; Yang, S.; Liu, G.; Wang, G.; Hou, Z. Coupling mechanism of nighttime lighting glare and driver cognitive load based on visual-physiological parameters. Traffic Inj. Prev. 2025, 1–10. [Google Scholar] [CrossRef] [Scilit]
- Yu, S.; Zhao, C.; Song, L.; Li, Y.; Du, Y. Understanding traffic bottlenecks of long freeway tunnels based on a novel location-dependent lighting-related car-following model. Tunn. Undergr. Space Technol. 2023, 136, 105098. [Google Scholar] [CrossRef] [Scilit]
- Wan, L.; Yan, Y.; Zhang, C.; Liu, C.; Mao, T.; Wang, W. Characteristics and identification of risky driving behaviors in expressway tunnels based on behavior spectrum. Int. J. Transp. Sci. Technol. 2024, 16, 5–17. [Google Scholar] [CrossRef] [Scilit]
- Mengmeng, D.; Peiyou, X.; Huiqing, J.; Xue, Y. Evaluation of the Impact of Light Environment on Drivers’ Visual Load in Dense Tunnel Section. In Proceedings of the 2024 IEEE 2nd International Conference on Image Processing and Computer Applications (ICIPCA); IEEE: New York, NY, USA, 2024. [Google Scholar]
- Niu, J.; Liang, B.; Wong, Y.; He, S.; Qin, C.; Wen, S. Dynamic traffic safety risk assessment in road tunnel entrance zone based on drivers’ psychophysiological perception states: Methodology and case-study insights. Tunn. Undergr. Space Technol. 2024, 147, 105677. [Google Scholar] [CrossRef] [Scilit]
- Peng, L.; Weng, J.; Yang, Y.; Wen, H. Impact of light environment on Driver’s physiology and psychology in interior zone of long tunnel. Front. Public Health 2022, 10, 842750. [Google Scholar] [CrossRef] [Scilit] [PubMed]
- Lu, H.; Shang, T.; Bao, J.; Liang, Y. Traffic Safety Optimization Strategy of Mountainous Highway Tunnel Based on GA-SVR Visual Load Model. J. Adv. Transp. 2022, 2022, 6768300. [Google Scholar] [CrossRef] [Scilit]

Disclaimer/Publisher’s Note: The statements, opinions and data contained in all publications are solely those of the individual author(s) and contributor(s) and not of MDPI and/or the editor(s). MDPI and/or the editor(s) disclaim responsibility for any injury to people or property resulting from any ideas, methods, instructions or products referred to in the content. |
© 2026 by the authors. Licensee MDPI, Basel, Switzerland. This article is an open access article distributed under the terms and conditions of the Creative Commons Attribution (CC BY) license.