


Abstract
Rapid assessment of existing reinforced concrete (RC) buildings is essential for effective seismic risk mitigation, particularly in highly active regions such as Bingol, Turkiye. This study evaluates the local performance of three Rapid Visual Screening (RVS) methods—RBTY-2019, FEMA-P154, and IITK-GSDMA—using verified post-earthquake damage data from the 2003 Bingol Earthquake (SERU-2003). To overcome the limitations of traditional RVS approaches, an Artificial Neural Network (ANN) model was developed and trained with the same dataset to predict building damage levels based on structural deficiency parameters. The ANN achieved a regression coefficient above 0.90 and 100% consistency in test predictions, demonstrating superior accuracy and adaptability to local construction characteristics. A Local Scaling Function (LSF) was also proposed to translate RBTY-2019 performance scores into empirical damage states, achieving 100% consistency with observed data. The findings highlight the reliability of locally trained AI models and the importance of adapting national screening regulations to regional seismic experiences. This integrated ANN–RVS framework provides a practical, data-driven tool for local authorities to prioritize urban building stock and strengthen disaster risk management strategies.
1. Introduction
Since 1987, the global population has increased by approximately 3 billion, surpassing 8 billion in 2022 [1,2]. This rapid growth, coupled with migration to urban areas, has led to an expansion of settlements in regions frequently affected by natural disasters. Consequently, despite significant advancements in disaster modeling and risk reduction, the loss of life and property due to natural hazards continues to rise [3,4,5,6,7,8,9].
A substantial portion of the global building stock remains vulnerable to seismic hazards, as many structures were constructed prior to the implementation of modern earthquake-resistant design codes. Major earthquakes such as the 1999 Kocaeli, 2003 Bingol, and the devastating 6 February 2023 Kahramanmaraş earthquakes, have resulted in severe casualties and billions of dollars in economic losses [10,11]. These experiences highlight that the seismic safety of existing buildings represents a more pressing challenge than the design of new structures.
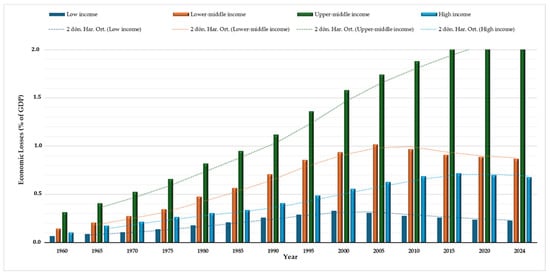
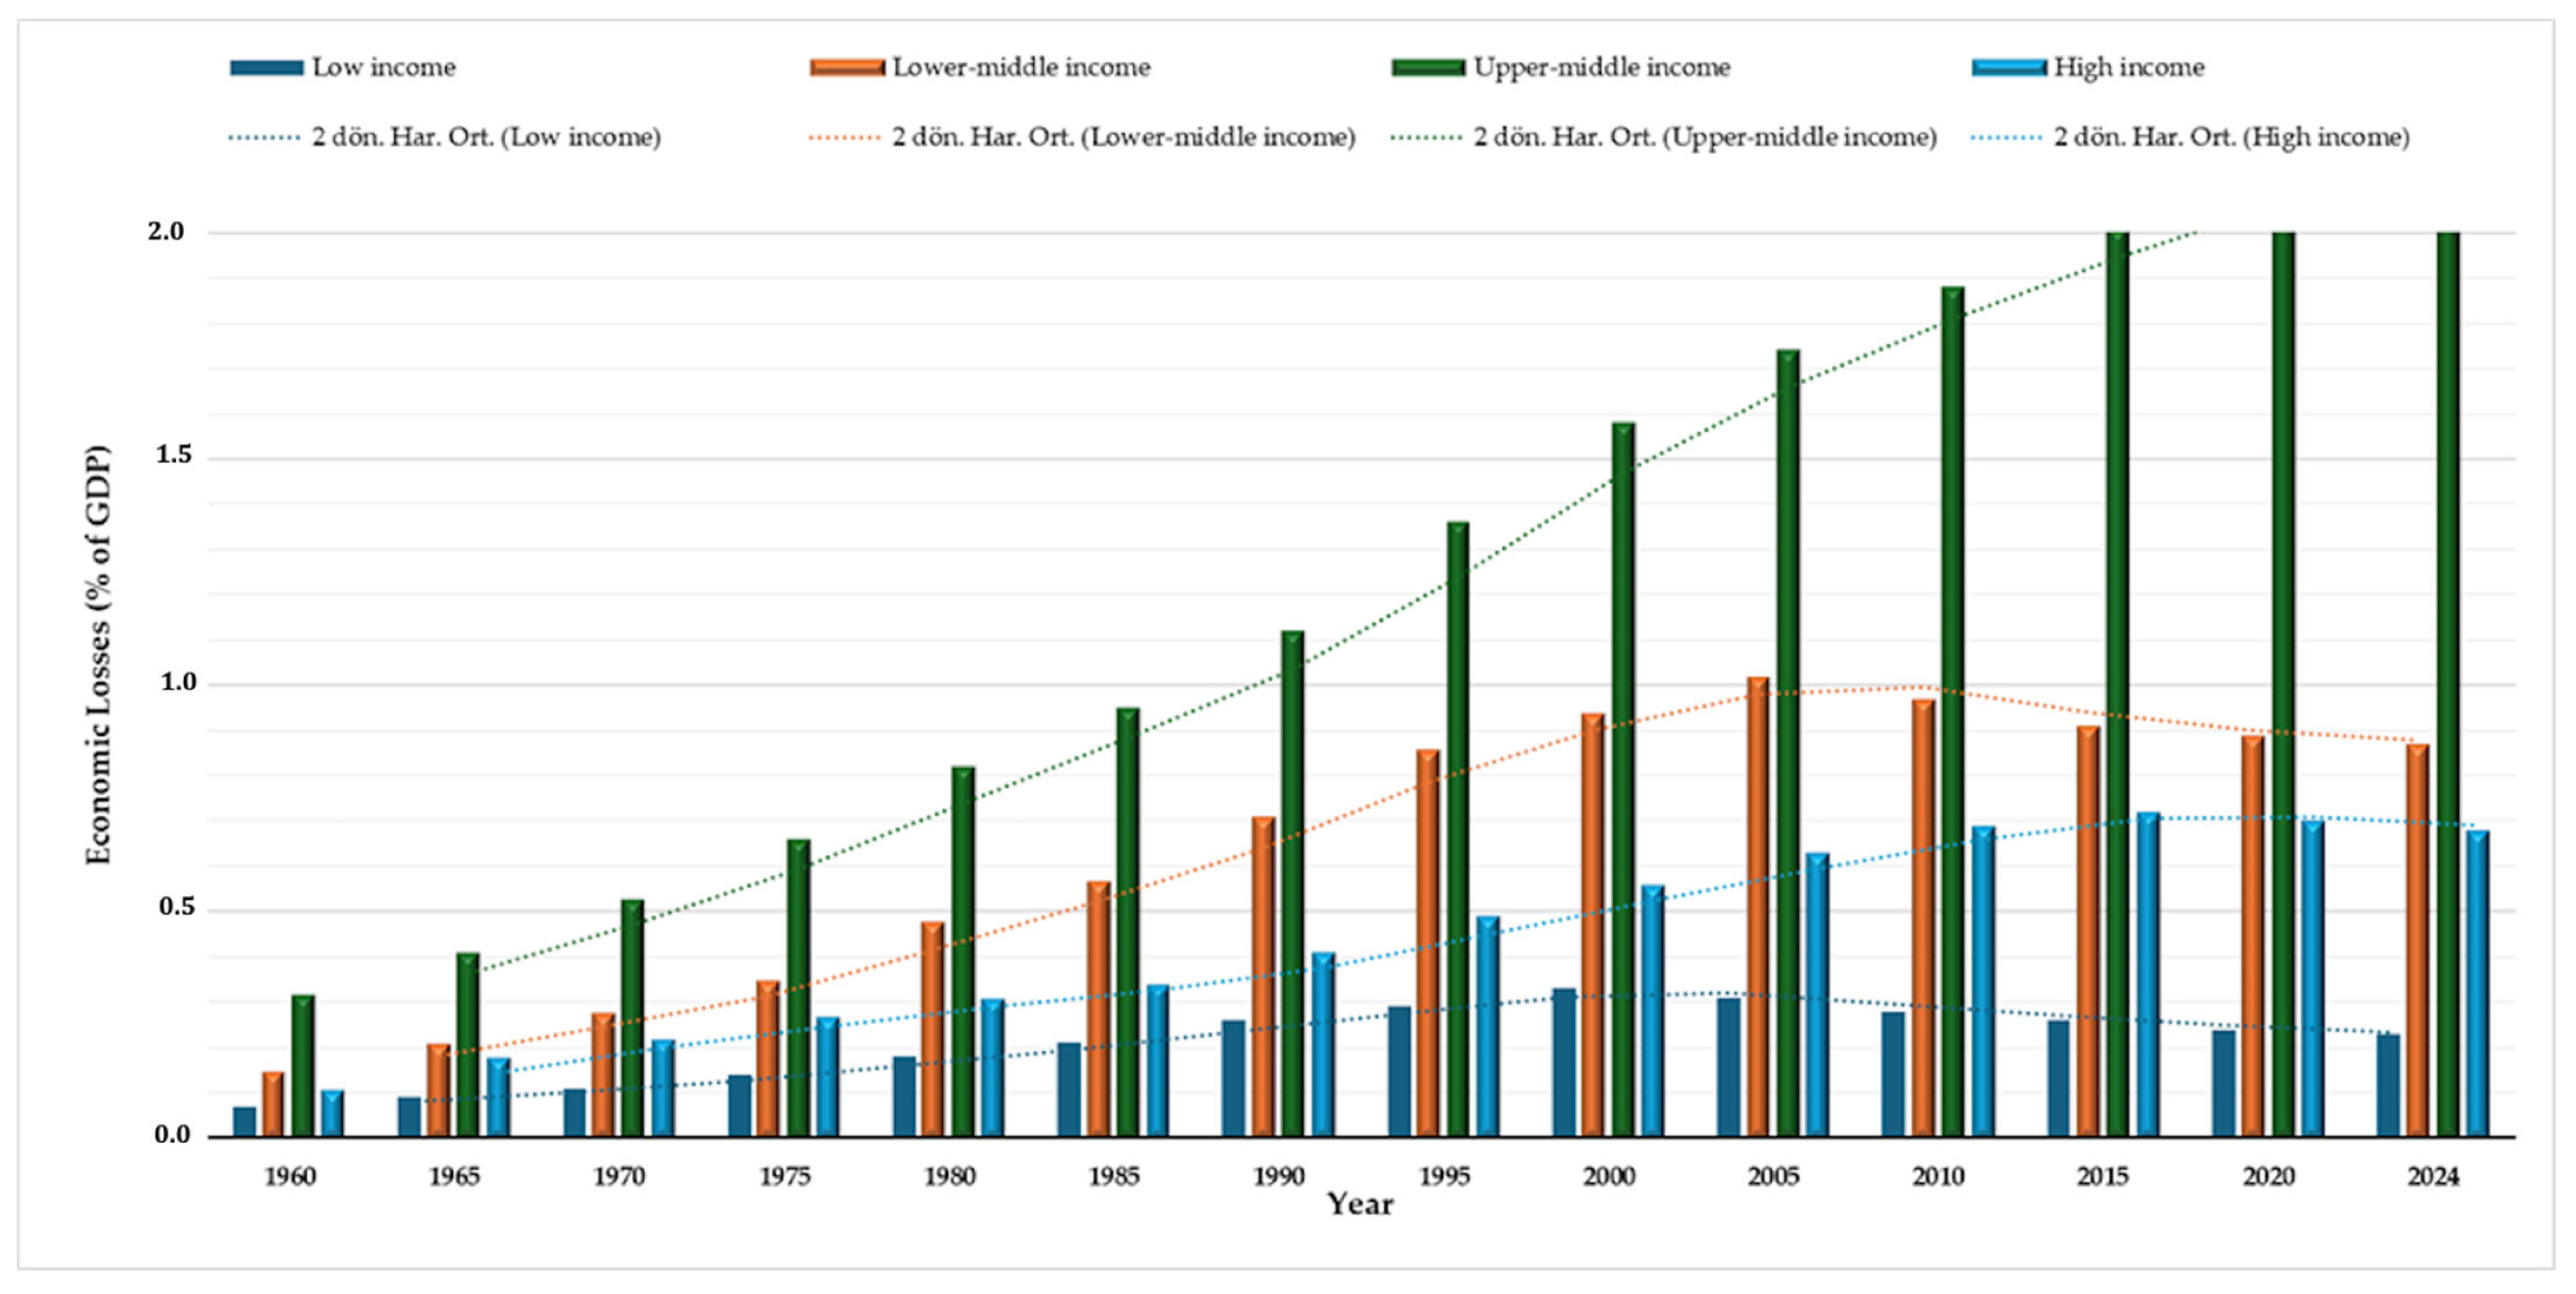
The economic consequences of natural disasters are strongly influenced by a country’s level of development and its capacity to manage risk. Long-term global data indicate that disaster-related economic losses, expressed as a share of gross domestic product (GDP), have exhibited a persistent upward trend since the 1960s, with substantially higher relative impacts observed in low- and middle-income economies (Figure 1) [12]. In particular, upper-middle-income countries display a pronounced increase in economic exposure, reflecting rapid urbanization, expanding building inventories, and limited capacity to retrofit existing structures compared to high-income nations.
Figure 1.
Annual Cost of Natural Disasters (as a percentage of GDP) [12]. Long-term trends in economic losses from natural disasters expressed as a percentage of GDP for different World Bank income groups between 1960 and 2024. Bars represent observed values at selected time intervals, while dotted lines indicate smooth long-term trends. The figure provides a global macroeconomic context for disaster vulnerability, highlighting the relatively higher economic exposure of upper-middle-income countries.
Such disparities in disaster-related losses are not solely governed by the physical magnitude of hazardous events. Rather, they reflect deeper structural and institutional factors, including limited pre-disaster investment, inadequate insurance penetration, and weak disaster financing mechanisms. Consequently, the economic destructiveness of natural disasters is strongly mediated by institutional capacity, infrastructure resilience, and the effectiveness of risk governance systems. This interpretation is consistent with the “resilient development” perspective emphasized in the Sendai Framework for Disaster Risk Reduction (2015–2030), which underscores the importance of proactive vulnerability assessment and risk-informed planning.
During the preparation of this article, the devastating earthquakes centered in Kahramanmaraş on 6 February 2023, which affected eleven provinces in Turkiye, tragically reaffirmed the seismic vulnerability of the existing building stock. These events have once again underscored the urgent need for rapid identification, prioritization, and transformation of deficient structures.
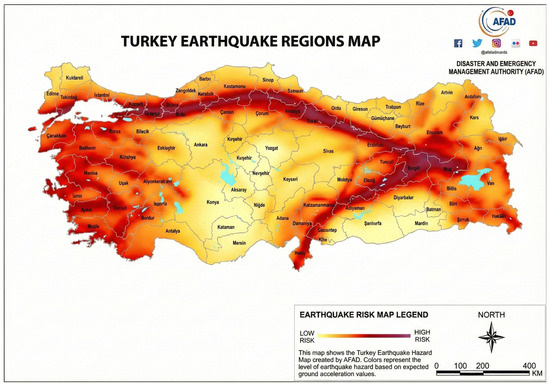
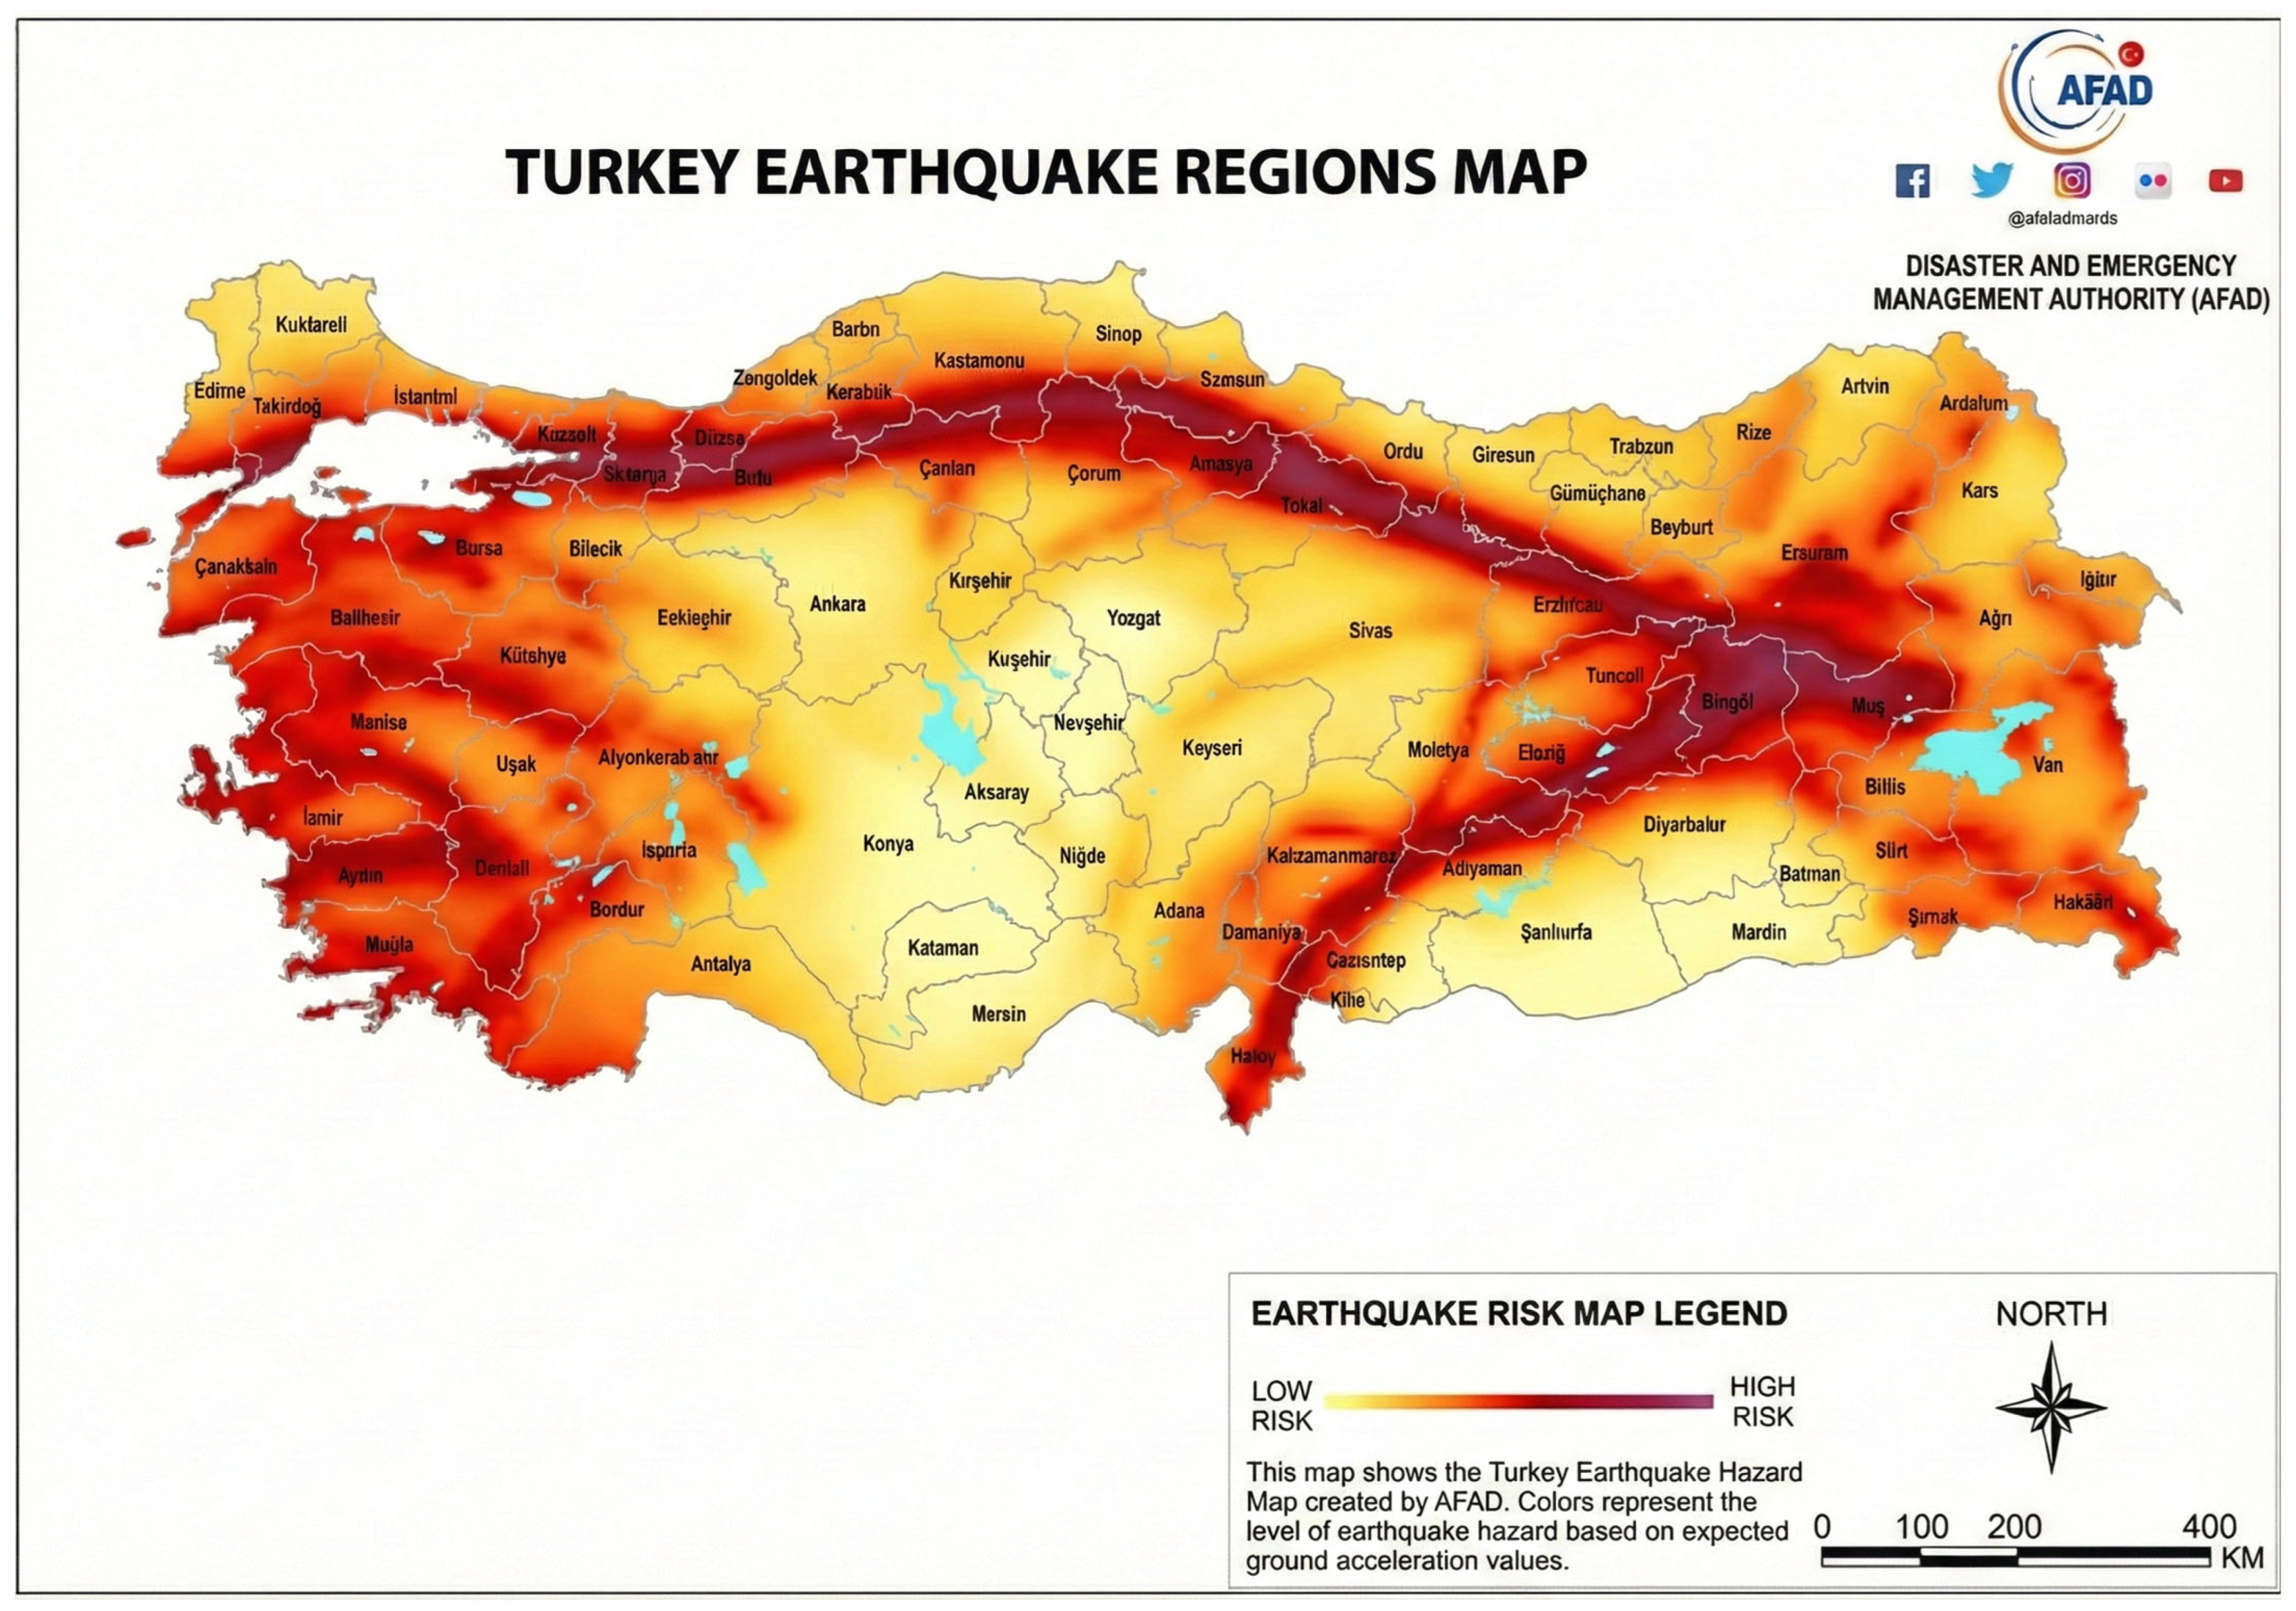
Türkiye, due to its tectonic setting, is in a highly seismically active region. Bingöl province, situated at the intersection of the East Anatolian Fault Zone (EAFZ) and the North Anatolian Fault Zone (NAFZ), is exposed to ground acceleration hazards exceeding 0.5 g (Figure 2) [13]. Figure 2 presents the national-scale seismic hazard context of Türkiye using the official AFAD “Türkiye Earthquake Hazard Map” and is provided solely to contextualize the Bingöl study area at the national scale. The building-level damage classification and ANN-based analyses presented in this study are grounded in site-specific post-earthquake observations (SERU-2003) rather than regional hazard zoning.
Figure 2.
Turkiye Earthquake Hazard Map [13]. The map is provided solely to contextualize the Bingöl study area at the national scale and does not represent building-level damage, fragility, or performance assessments.
The macroeconomic consequences of natural disasters have increased steadily over the last six decades, particularly for countries in the low- and middle-income groups. As illustrated in Figure 1, disaster-related economic losses as a share of GDP have shown a persistent upward trend since 1960, with the most pronounced increase observed in upper-middle-income countries. This income group, which includes Turkiye, exhibits a structurally higher vulnerability compared to high-income economies, despite significant improvements in engineering practices and regulatory frameworks. These global trends indicate that disaster risk is not solely governed by hazard intensity, but is strongly influenced by development level, urbanization patterns, and the capacity to assess and manage existing building stock. In this context, rapid, data-driven, and locally calibrated vulnerability assessment tools are essential for effective seismic risk mitigation.
Assessing the seismic vulnerability of existing buildings is critical for pre-disaster emergency planning and prioritizing urban transformation strategies. However, conducting detailed performance evaluations (DPEs) for the entire building stock is financially and logistically infeasible—even in highly developed countries. This limitation has motivated the development of Rapid Visual Screening (RVS) methods capable of quickly and consistently estimating potential seismic damage [14,15,16].
RVS methods (RBTY-2019, FEMA-P154, IITK-GSDMA) aim to predict seismic performance based on structural deficiency parameters (e.g., soft story, captive column, plan irregularity). Nevertheless, a common limitation of these approaches is their reduced sensitivity to local construction practices, geological conditions, and empirically observed earthquake damage.
To address these limitations, this study proposes an Artificial Neural Network (ANN)-based framework. Due to its ability to capture complex and nonlinear relationships, ANN models can be trained using verified post-earthquake damage data and employed as a robust tool for vulnerability classification of existing building stocks.
Using real field data from the 2003 Bingol Earthquake, this study aims to (i) demonstrate the performance of an ANN-based damage prediction model relative to traditional RVS methods, (ii) propose an empirically calibrated local scaling function for RBTY-2019, and (iii) evaluate the local applicability of international RVS approaches under Bingol-specific conditions.
Although previous studies have explored the use of ANNs in seismic damage assessment, there remains a lack of research directly comparing an ANN model trained on verified post-earthquake damage data with multiple field-applied RVS methods within the same regional context. This study addresses this gap by estimating the seismic vulnerability of existing reinforced concrete buildings in Bingol using SERU-2003 damage data and by providing a scientific basis for risk-based prioritization by local authorities.
The remainder of this paper introduces the dataset and RVS methods, details the development of the ANN model, and discusses the findings with scientific and practical implications.
1.1. Previous Studies
1.1.1. Rapid Visual Screening (RVS) Methods and Comparative Studies
Rapid Visual Screening (RVS) procedures play a critical role in the initial phase of seismic risk management, aiming to invent potentially hazardous buildings. First introduced in the United States in 1988, RVS methods have since evolved through technological advancements and lessons learned from past earthquakes. Comparative studies of different RVS methods emphasize the necessity of quickly and reliably assessing existing building stock [17]. For instance, Demirbaş et al. compared RVS, Canadian Seismic Screening, RBTY, and Sucuoğlu methods on 67 buildings following the 2020 Elazığ Earthquake, concluding that the Canadian method best reflected the actual damage conditions [18].
In Turkiye, the Risky Building Detection Regulation (RBTY) is used under Law No. 6306 to determine regional risk distribution. However, it is explicitly stated that RBTY is not suitable for individual building-level risk assessment [8]. This limitation highlights the need for local adaptability in the practical application of RBTY.
1.1.2. Structural Vulnerability Analysis and Classification
Structural vulnerability refers to the likelihood of a building sustaining damage due to seismic effects and holds particular importance in seismic risk reduction. Vulnerability assessments typically employ empirical methods or analytical approaches such as pushover analysis. However, analytical methods are often impractical for large building inventories due to their time and resource demands. Moreover, recent analyses by Altindal and Askan (2024) following the 2023 Kahramanmaraş earthquakes revealed that traditional hazard analyses might underestimate actual hazard levels [19].
Consequently, incorporating uncertainty into these assessments has become crucial. Ioannou et al. (2020) and Bodenmann et al. (2024) highlighted that integrating ground motion uncertainty into empirical fragility modeling significantly enhances prediction precision [20,21].
Erberik developed fragility curves for low- and mid-rise reinforced concrete frame systems in Turkiye, identifying them as the most critical group in terms of potential casualties [22].
Past earthquake experiences have shown that damage tends to concentrate around poor materials and workmanship, design flaws, soft/weak stories, short columns, and pounding effects [15,23,24,25]. Issues such as captive column formation are often overlooked due to commercial software failing to model infill walls, leading to inaccurate results.
Fikri and Ingham developed fragility curves to demonstrate the vulnerability of non-ductile mid-rise buildings designed under outdated codes, especially against aftershocks [24]. These studies underscore the importance of accurate prioritization following rapid screening and the need for damage classification, which forms the basis for the SERU reference damage matrix used in training the ANN model.
1.1.3. Applications of Artificial Neural Networks (ANNs) in Civil Engineering
Artificial Neural Networks (ANNs), a powerful subset of Artificial Intelligence (AI), are widely used for simulating, analyzing, visualizing, and controlling complex systems. In the construction sector, ANNs, particularly supervised learning algorithms, have demonstrated superior predictive accuracy compared to traditional statistical regression techniques [26]. This trend represents a broader paradigm shift in the field; Kubo et al. (2024) in seismology and Hu et al. (2025) in earthquake engineering recently reviewed how machine learning is redefining performance evaluation standards [27,28].
AI is increasingly employed as a decision-making tool for automating seismic fragility assessments. Chen and Zhang used an ensemble learning-based model to evaluate building fragility in Nepal [29]. Similarly, recent specialized applications have demonstrated AI’s versatility: Wang et al. (2023) utilized machine learning to predict ground motion site amplification [30], while Uyanık et al. (2023) applied Convolutional Neural Networks (CNNs) for earthquake precursor detection [31]. In structural applications, Ravichandran et al. (2025) successfully employed data-driven models for damage classification in complex unreinforced masonry buildings [32].
Harirchian and Lahmer proposed a fuzzy logic-based RVS method and tested its applicability using Bingol Earthquake data [33].
Yu Qian et al. utilized deep learning to identify soft-story buildings from street-view images [34]. These studies demonstrate how AI, when trained with real damage data or field observations, can become a powerful tool for seismic risk prediction.
These studies demonstrate how AI can become a powerful tool for seismic risk prediction. However, a recurring challenge in these applications is data scarcity. To address this, Safonova et al. (2023) proposed advanced deep learning techniques for small datasets [35], and Cheng et al. (2024) introduced spectrum-compatible data augmentation methods [36]. Validating such advanced models requires reliable ground truth, for which the regional damage inventory of the 2023 earthquakes provided by Yılmaz et al. (2024) serves as a critical benchmark [37].
1.1.4. Positioning of This Study in Literature
The existing literature provides only fragmented evidence regarding both the local calibration of Rapid Visual Screening (RVS) methods and the added value of Artificial Neural Networks (ANNs) for empirical damage classification. A key unresolved gap is the absence of a unified, quantitative framework that evaluates Türkiye’s national RVS regulation (RBTY) alongside widely used international procedures (FEMA-P154 and IITK-GSDMA) and a locally trained ANN model using the same dataset verified with observed post-earthquake damage. In response, the present study offers a direct, dataset-consistent comparison of these approaches under identical local conditions, thereby enabling an objective assessment of their relative predictive alignment with real damage states. Beyond methodological benchmarking, the study also provides a practical contribution to implementation by proposing an empirically calibrated Local Scaling Function (LSF) that translates RBTY performance scores into damage-state interpretations grounded in Bingöl’s documented earthquake experience. This calibration yields an actionable tool for risk-informed prioritization and supports the development of evidence-based screening practices within national seismic risk reduction policies.
2. Materials and Methods
2.1. Study Area and Real Damage Dataset (SERU-2003)
This study focuses on Bingol province, located in eastern Turkiye, which is highly exposed to seismic hazards due to its geological and topographical characteristics. Bingol lies at the intersection of the North Anatolian Fault Zone (NAFZ), East Anatolian Fault Zone (EAFZ), and Varto Fault Zone (VFZ), with its entire territory classified as a first-degree seismic zone.
The primary dataset is derived from field observations and statistical records of reinforced concrete buildings affected by the 1 May 2003, Bingol Earthquake, referred to as SERU-2003 [38]. A total of 35 reinforced concrete buildings were examined and classified into five damage levels: No Damage (1), Slight Damage (2), Moderate Damage (3), Severe Damage (4), and Collapse (5). This five-level damage scale served as the reference for training the ANN model and for comparing the performance of RVS methods.
2.2. Comparative Rapid Visual Screening (RVS) Methods
The objective of this study is to develop a predictive tool for assessing seismic vulnerability and to evaluate the effectiveness of existing RVS procedures. Accordingly, three rapid visual screening methods were applied to the SERU-2003 building set: (i) RBTY-2019, Türkiye’s regulation under Law No. 6306, which scores observable structural deficiency parameters and incorporates the DD-2 hazard level via the SDS value from the Turkish Earthquake Hazard Map; (ii) FEMA-P154, a two-phase U.S. procedure based on external (and when possible internal) visual inspection using standardized data collection forms; and (iii) IITK-GSDMA, an Indian adaptation of FEMA-P154 that mainly differs in the assigned base score by structural system type (2.5 instead of 1). Each method was applied to all buildings in the dataset, and the resulting performance scores (PP) were compared with the observed SERU-2003 damage classifications.
2.3. Artificial Neural Network (ANN) Model Development
To estimate damage levels, a machine learning approach based on Artificial Neural Networks (ANNs) was adopted.
- Dataset and Input Parameters: Of the 35 buildings, 30 were used for training the ANN model. This dataset represents the maximum number of reinforced concrete buildings for which observed post-earthquake damage could be reliably documented and matched with photo-based RVS indicators following the 1 May 2003 Bingol Earthquake. Input parameters were binary indicators (1 = present, 0 = absent) representing structural deficiencies identified in RBTY-2019, such as soft story, short column, and plan irregularity.
- Network Architecture: A 15-layer feed-forward backpropagation network was developed using MATLAB (R2022b, v9.13.0.2193358).
- Training procedure: The Levenberg–Marquardt algorithm was employed as a training algorithm for nonlinear least-squares problems using the “trainlm” function to update network weights and biases [39,40,41]. Gradient-based error minimization was applied during the training process. Hidden layers utilized the hyperbolic tangent sigmoid (tansig) transfer function. The ANN architecture was selected with consideration of the limited dataset size and the rapid visual screening context of the study. A multi-layer feed-forward backpropagation structure was adopted to capture nonlinear relationships between binary RVS indicators and observed damage states, while avoiding excessive architectural complexity that could lead to overfitting. The tansig activation function was employed due to its suitability for binary and normalized inputs, and the Levenberg–Marquardt algorithm was selected for its efficiency and stability in small-to-moderate datasets [41].
The model was designed to predict the final damage state of a building based on its structural deficiencies, with performance evaluated using regression analysis (R) and accuracy on test data. A concise summary of the ANN architecture and training parameters is provided in Appendix A.
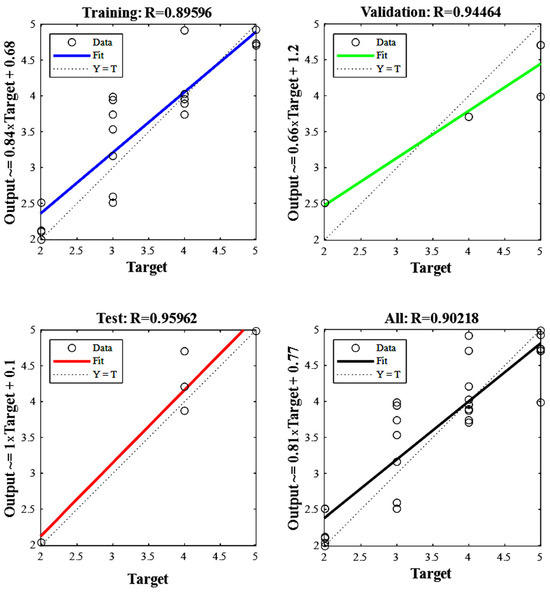
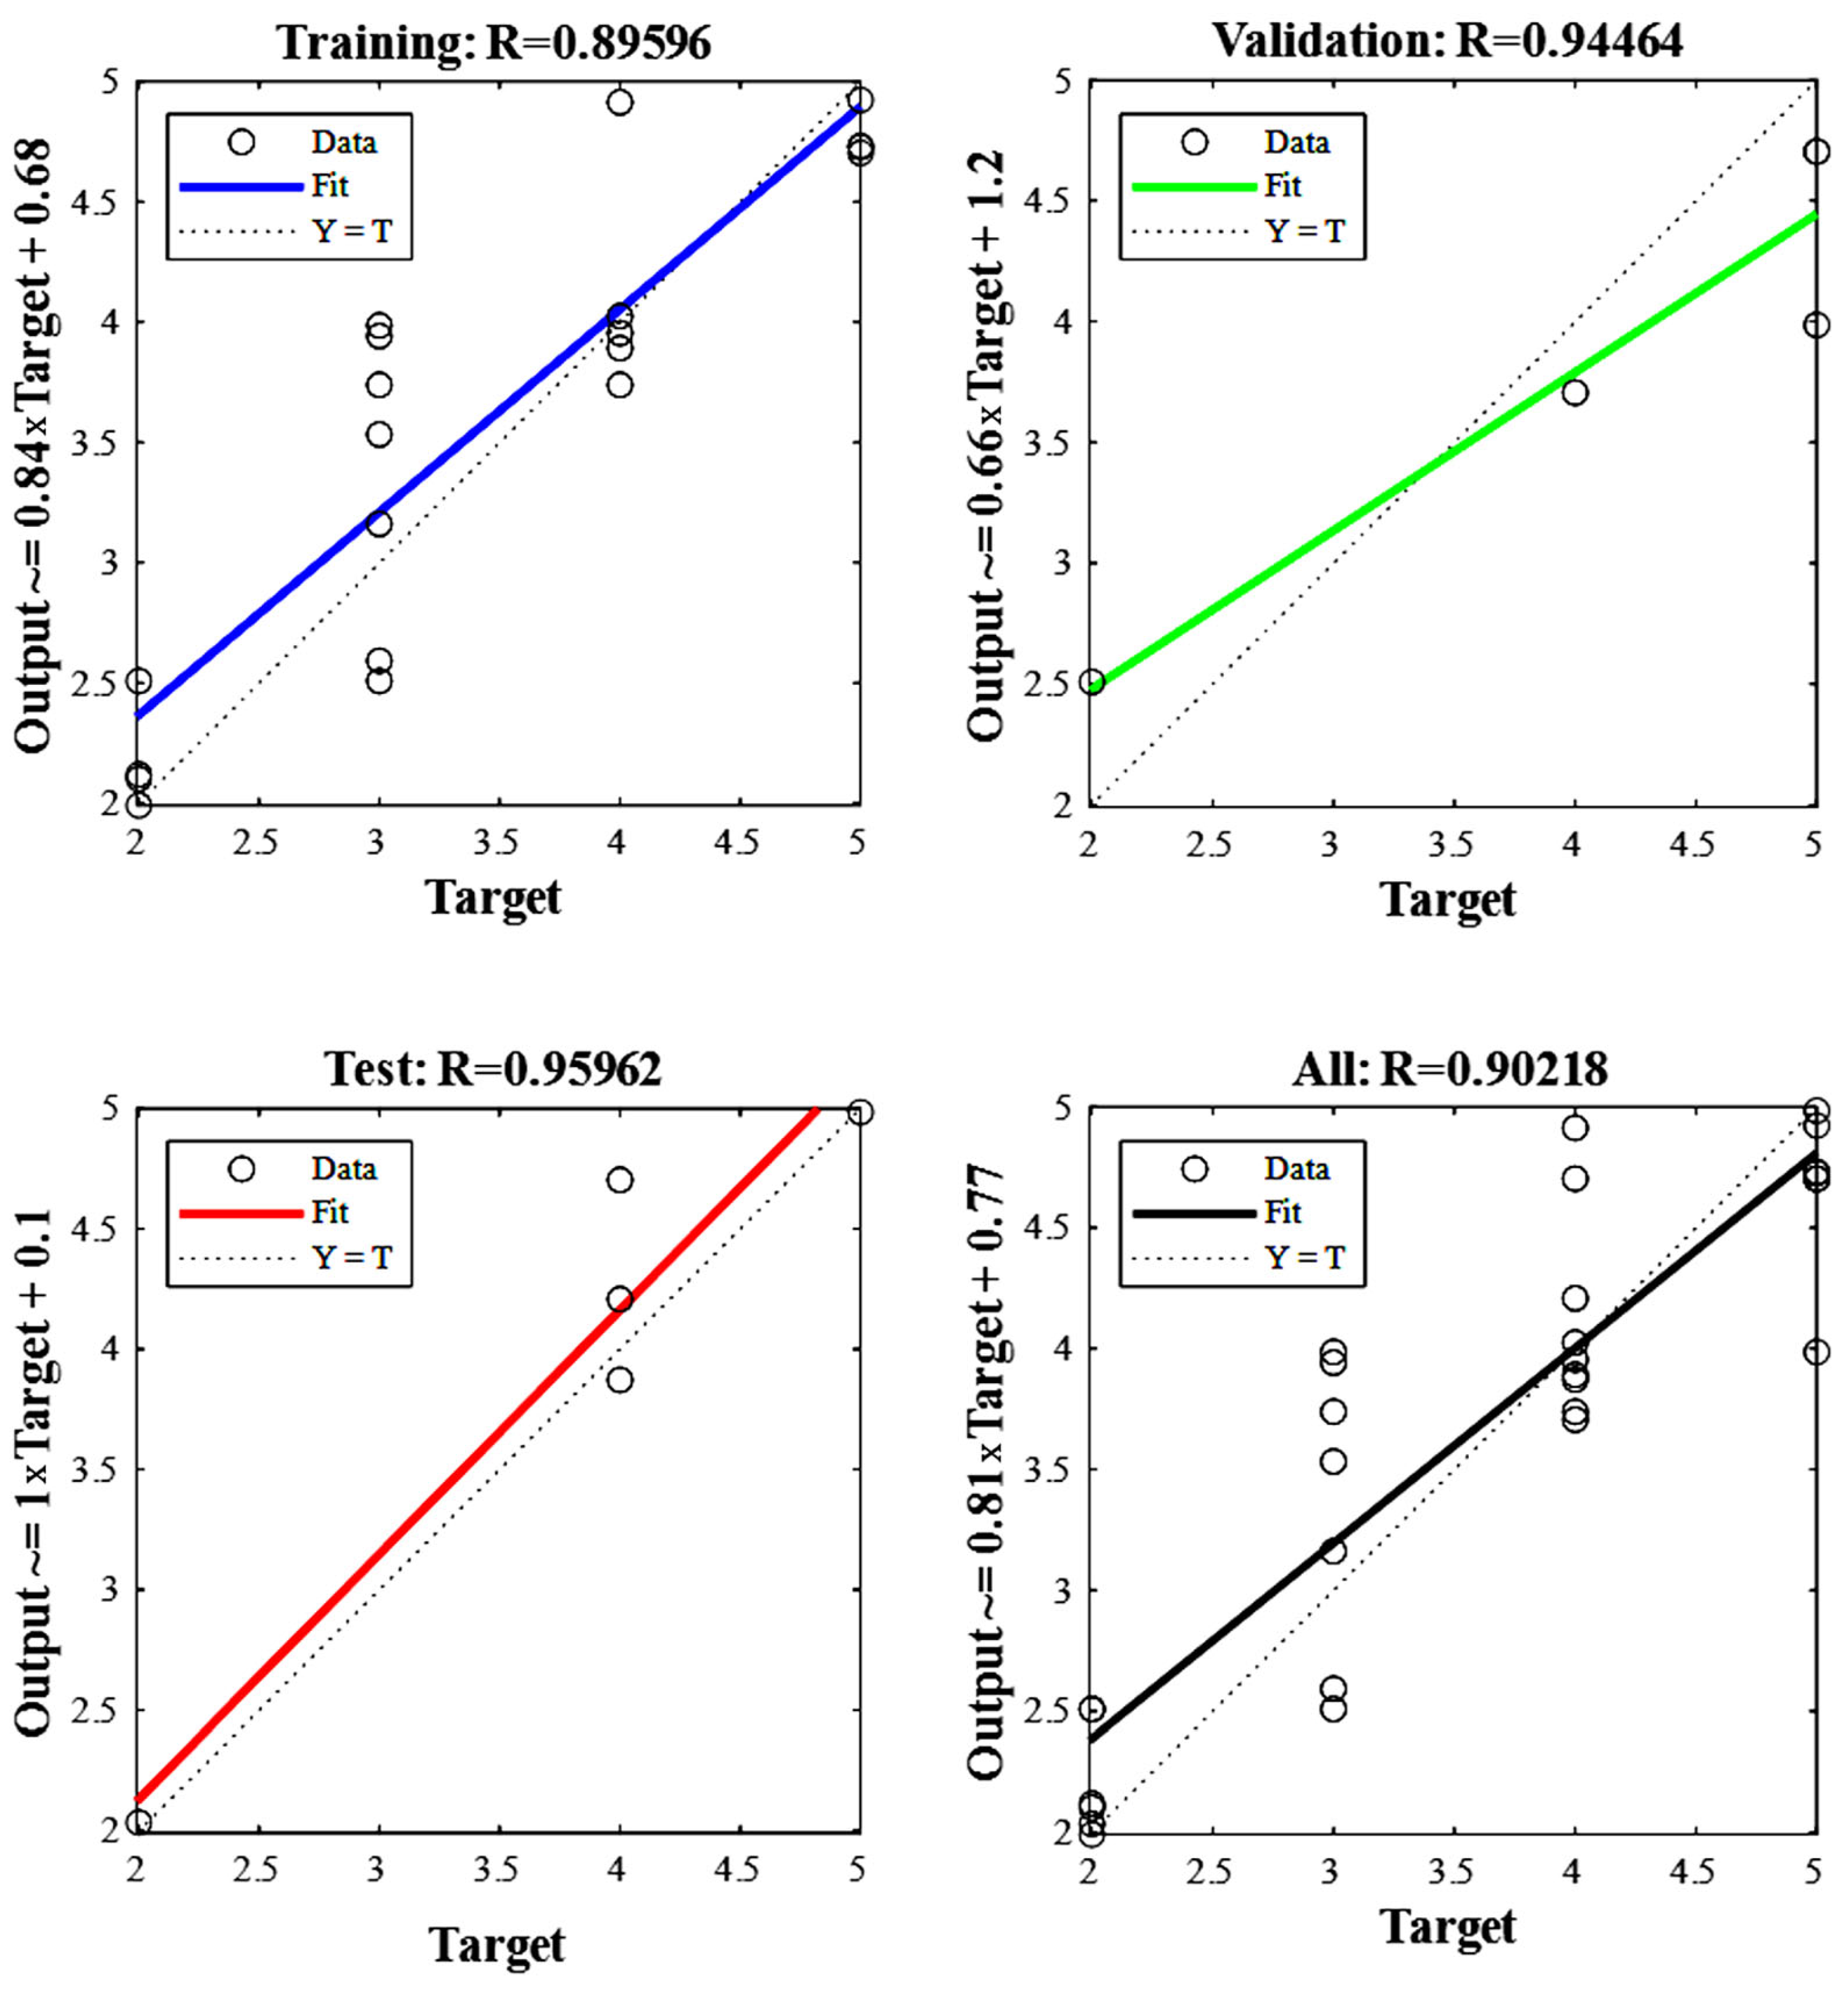
Figure 3 illustrates the training performance of the ANN model, highlighting the relationship between predicted and observed damage states for the training and validation datasets and reflecting the convergence behavior achieved through the selected training procedure. This figure is intended to document the regression behavior and convergence characteristics of the training process, complementing the overall performance indicators reported elsewhere in the manuscript (e.g., test-set consistency and regression coefficient).
Figure 3.
Training results of the ANN model.
3. Results
3.1. Evaluation of RVS Methods and ANN Model Using SERU-2003 Data
This section presents a comparative analysis of three RVS methods and the developed ANN model using real damage data from the 2003 Bingol Earthquake (SERU-2003). The 35 reinforced concrete buildings assessed were classified into five vulnerability levels by SERU-2003: Collapse (1), Severe Damage (2), Moderate Damage (3), Slight Damage (4), and No Damage (5). A significant portion of the assessed buildings were found to be either slightly damaged or undamaged, approximately 60% in total. However, 20% exhibited severe damage, and 3% were classified as collapsed. This distribution clearly emphasizes the necessity for rapid screening methods to accurately identify critically vulnerable structures, especially those at high risk of collapse or major damage.
3.2. Local Scaling Function for RBTY-2019
As an original contribution of this study, a local scaling function (LSF) was developed to convert RBTY-2019 performance scores (PP) into actual damage states based on Bingol-specific data and given in Table 1. Unlike analytical fragility models, RVS-based performance scores are not associated with predefined theoretical damage thresholds; therefore, an empirical calibration against observed post-earthquake damage is required to ensure physical relevance.
Table 1.
The proposed scaling function (LSF).
This function enables RBTY results to be interpreted in terms of real vulnerability levels, enhancing its practical applicability in local risk management. The distribution of soil classes and slope effects across the analyzed buildings is summarized in Supplementary Table S1.
Derivation and Validation of LSF Thresholds
The threshold values used in the Local Scaling Function (LSF) were derived through an empirical, data-driven calibration process based on the SERU-2003 post-earthquake damage dataset. The objective was to maximize consistency between the RBTY-2019 performance scores (PP) and the observed damage states recorded during field surveys, rather than relying on arbitrarily predefined limits.
First, the PP values of all 35 reinforced concrete buildings were ranked and directly matched with their observed SERU-2003 damage grades. An inspection of the PP distribution revealed natural clustering patterns corresponding to different damage severity levels. These clusters formed the basis for the initial identification of candidate threshold values.
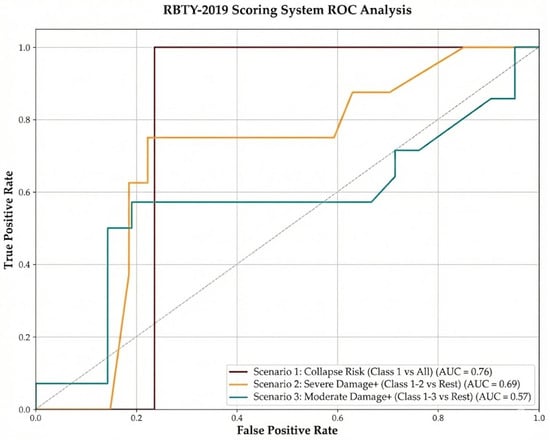
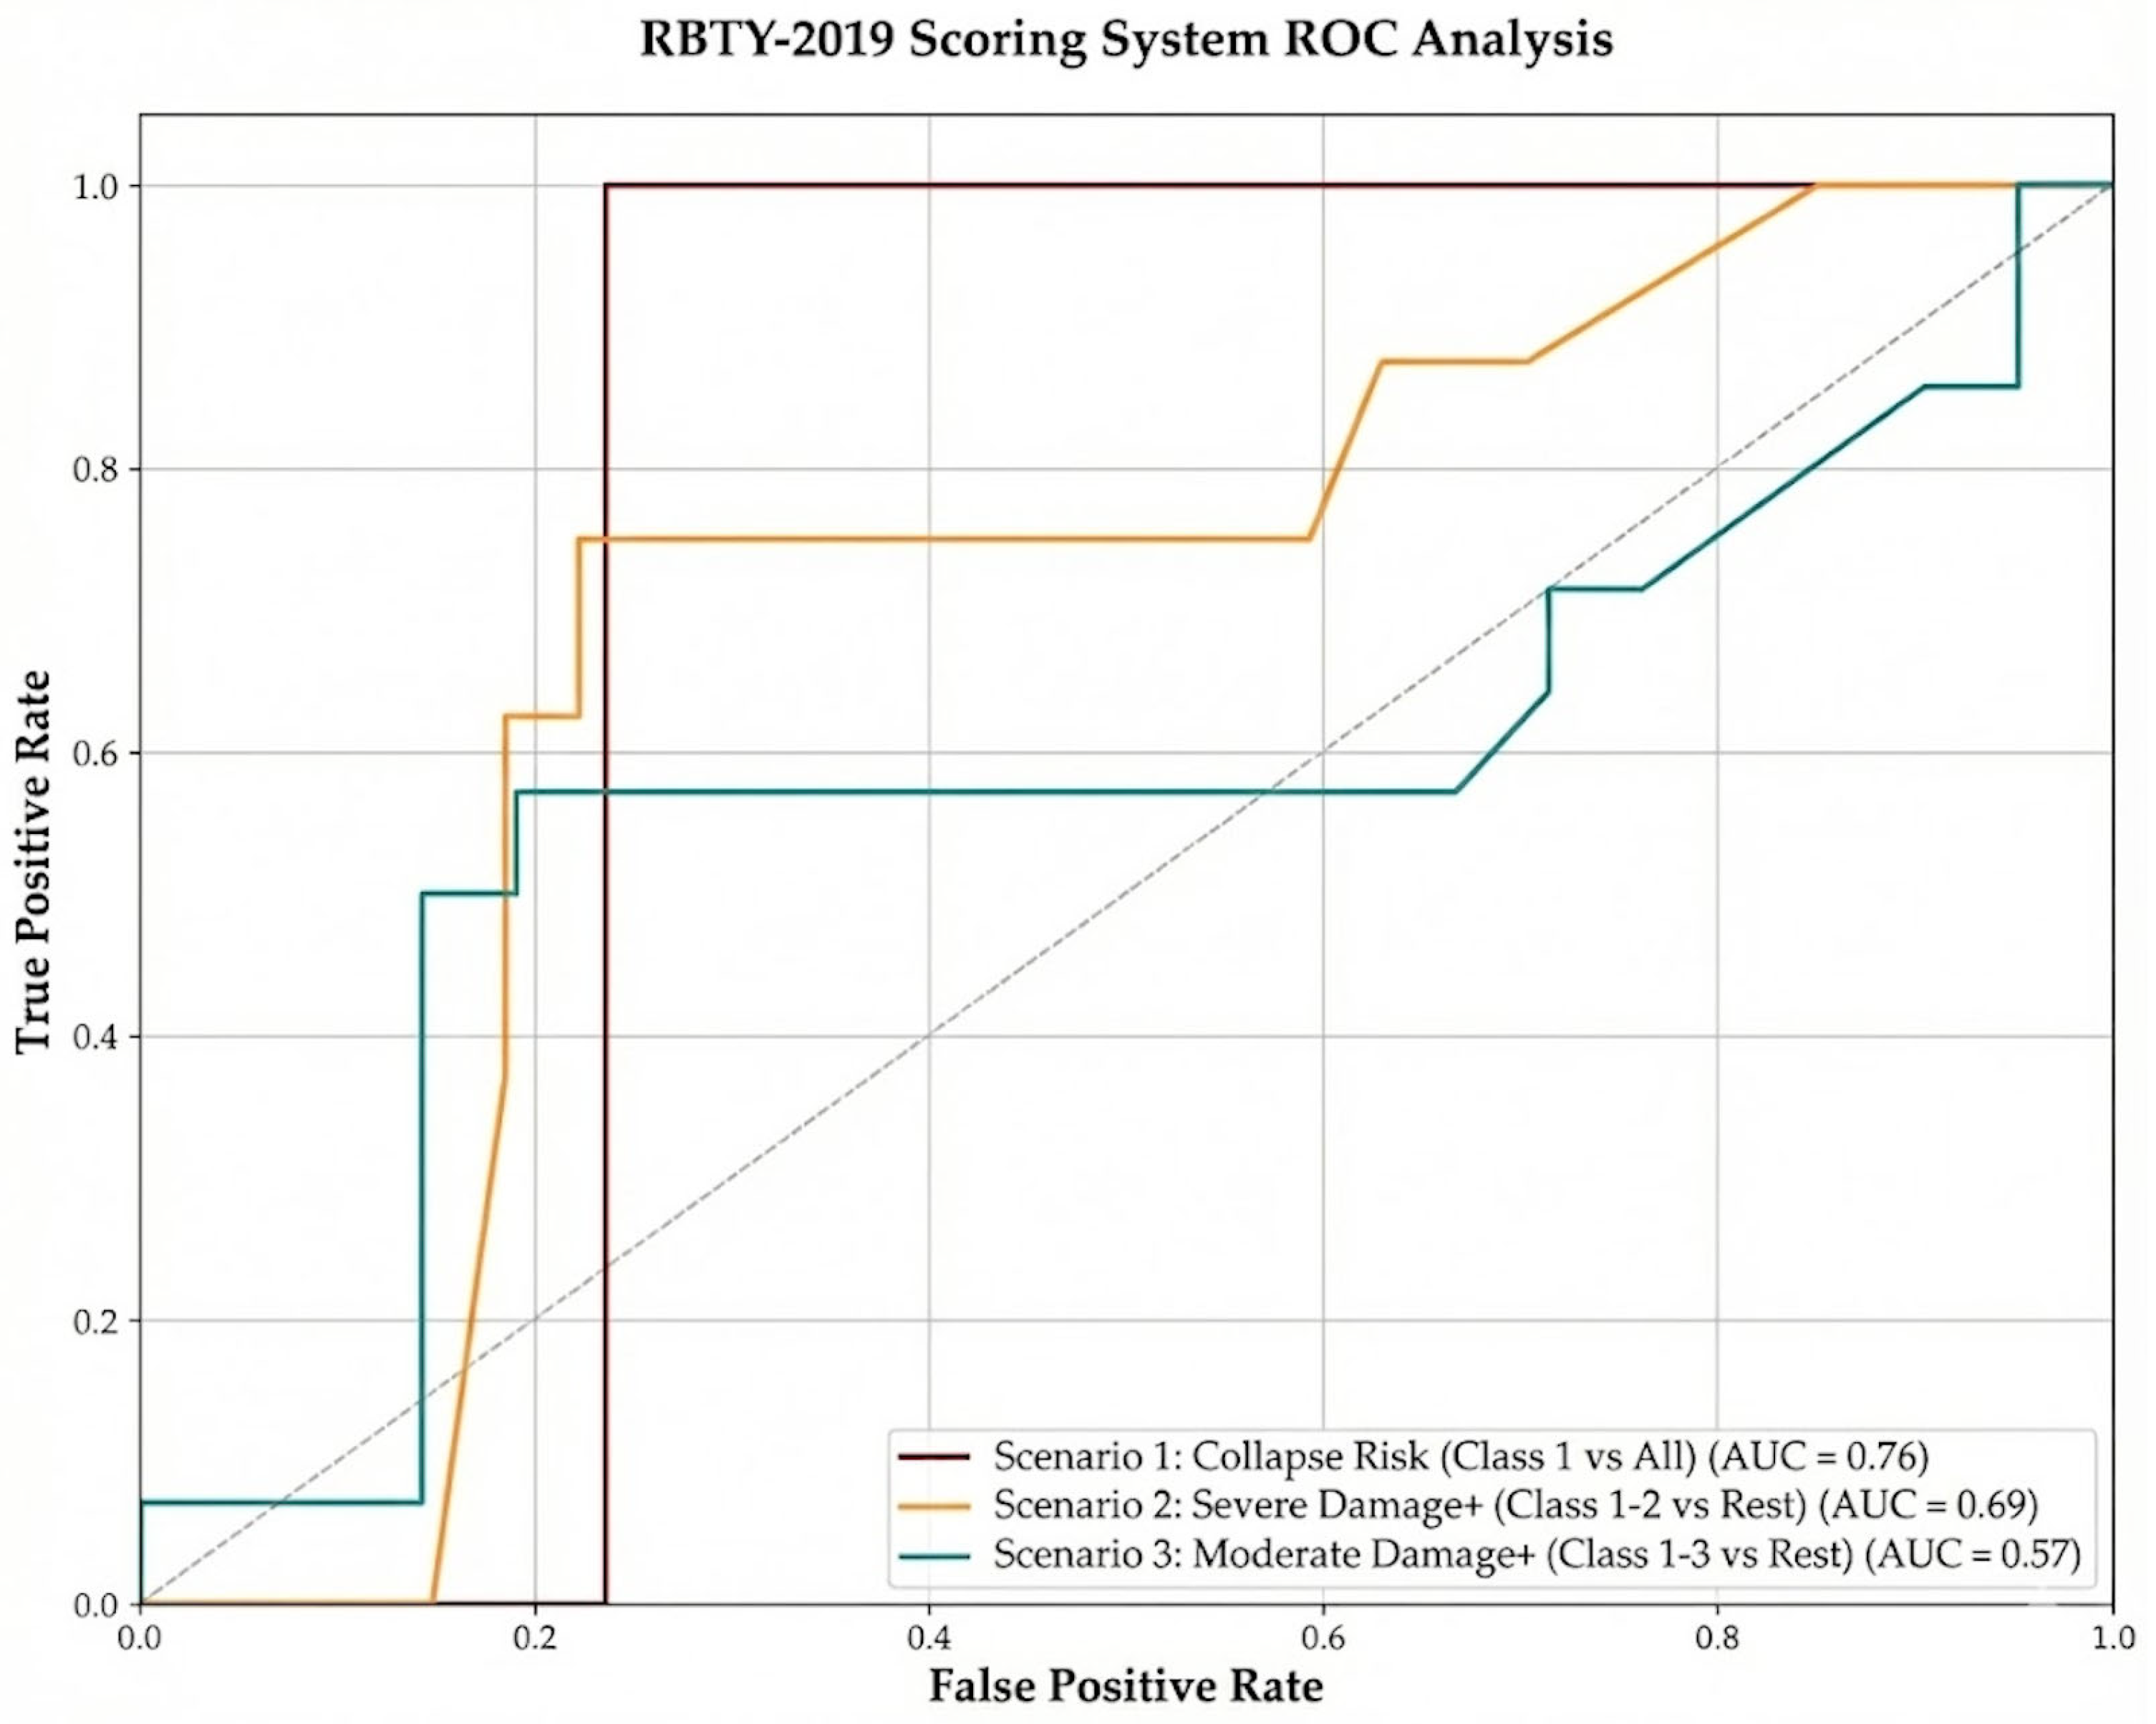
To evaluate the discriminative capability of the PP-based thresholds, receiver operating characteristic (ROC) analyses were conducted for multiple binary classification scenarios, including collapse versus non-collapse, severe damage or higher, and moderate damage or higher. The resulting ROC curves demonstrated meaningful discriminatory power, with area-under-the-curve (AUC) values reaching up to 0.76, indicating that PP provides statistically significant separation between damage states (see Figure 4).
Figure 4.
ROC curves used to evaluate the discriminative capability of LSF-derived PP thresholds for SERU-based binary damage scenarios (collapse vs. non-collapse, ≥severe damage, and ≥moderate damage); AUC values indicate the corresponding classification separability.
In these ROC tests, the LSF-derived PP thresholds are treated as the decision variable, while SERU-2003 damage classes are binarized to evaluate the discrimination of critical damage conditions (e.g., collapse vs. non-collapse, ≥severe damage, and ≥moderate damage). Accordingly, AUC values are interpreted as an indicator of how well the PP-based thresholds separate the corresponding SERU-defined binary outcomes.
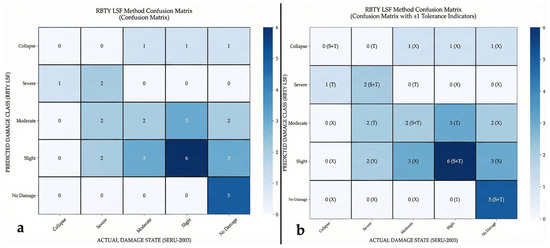
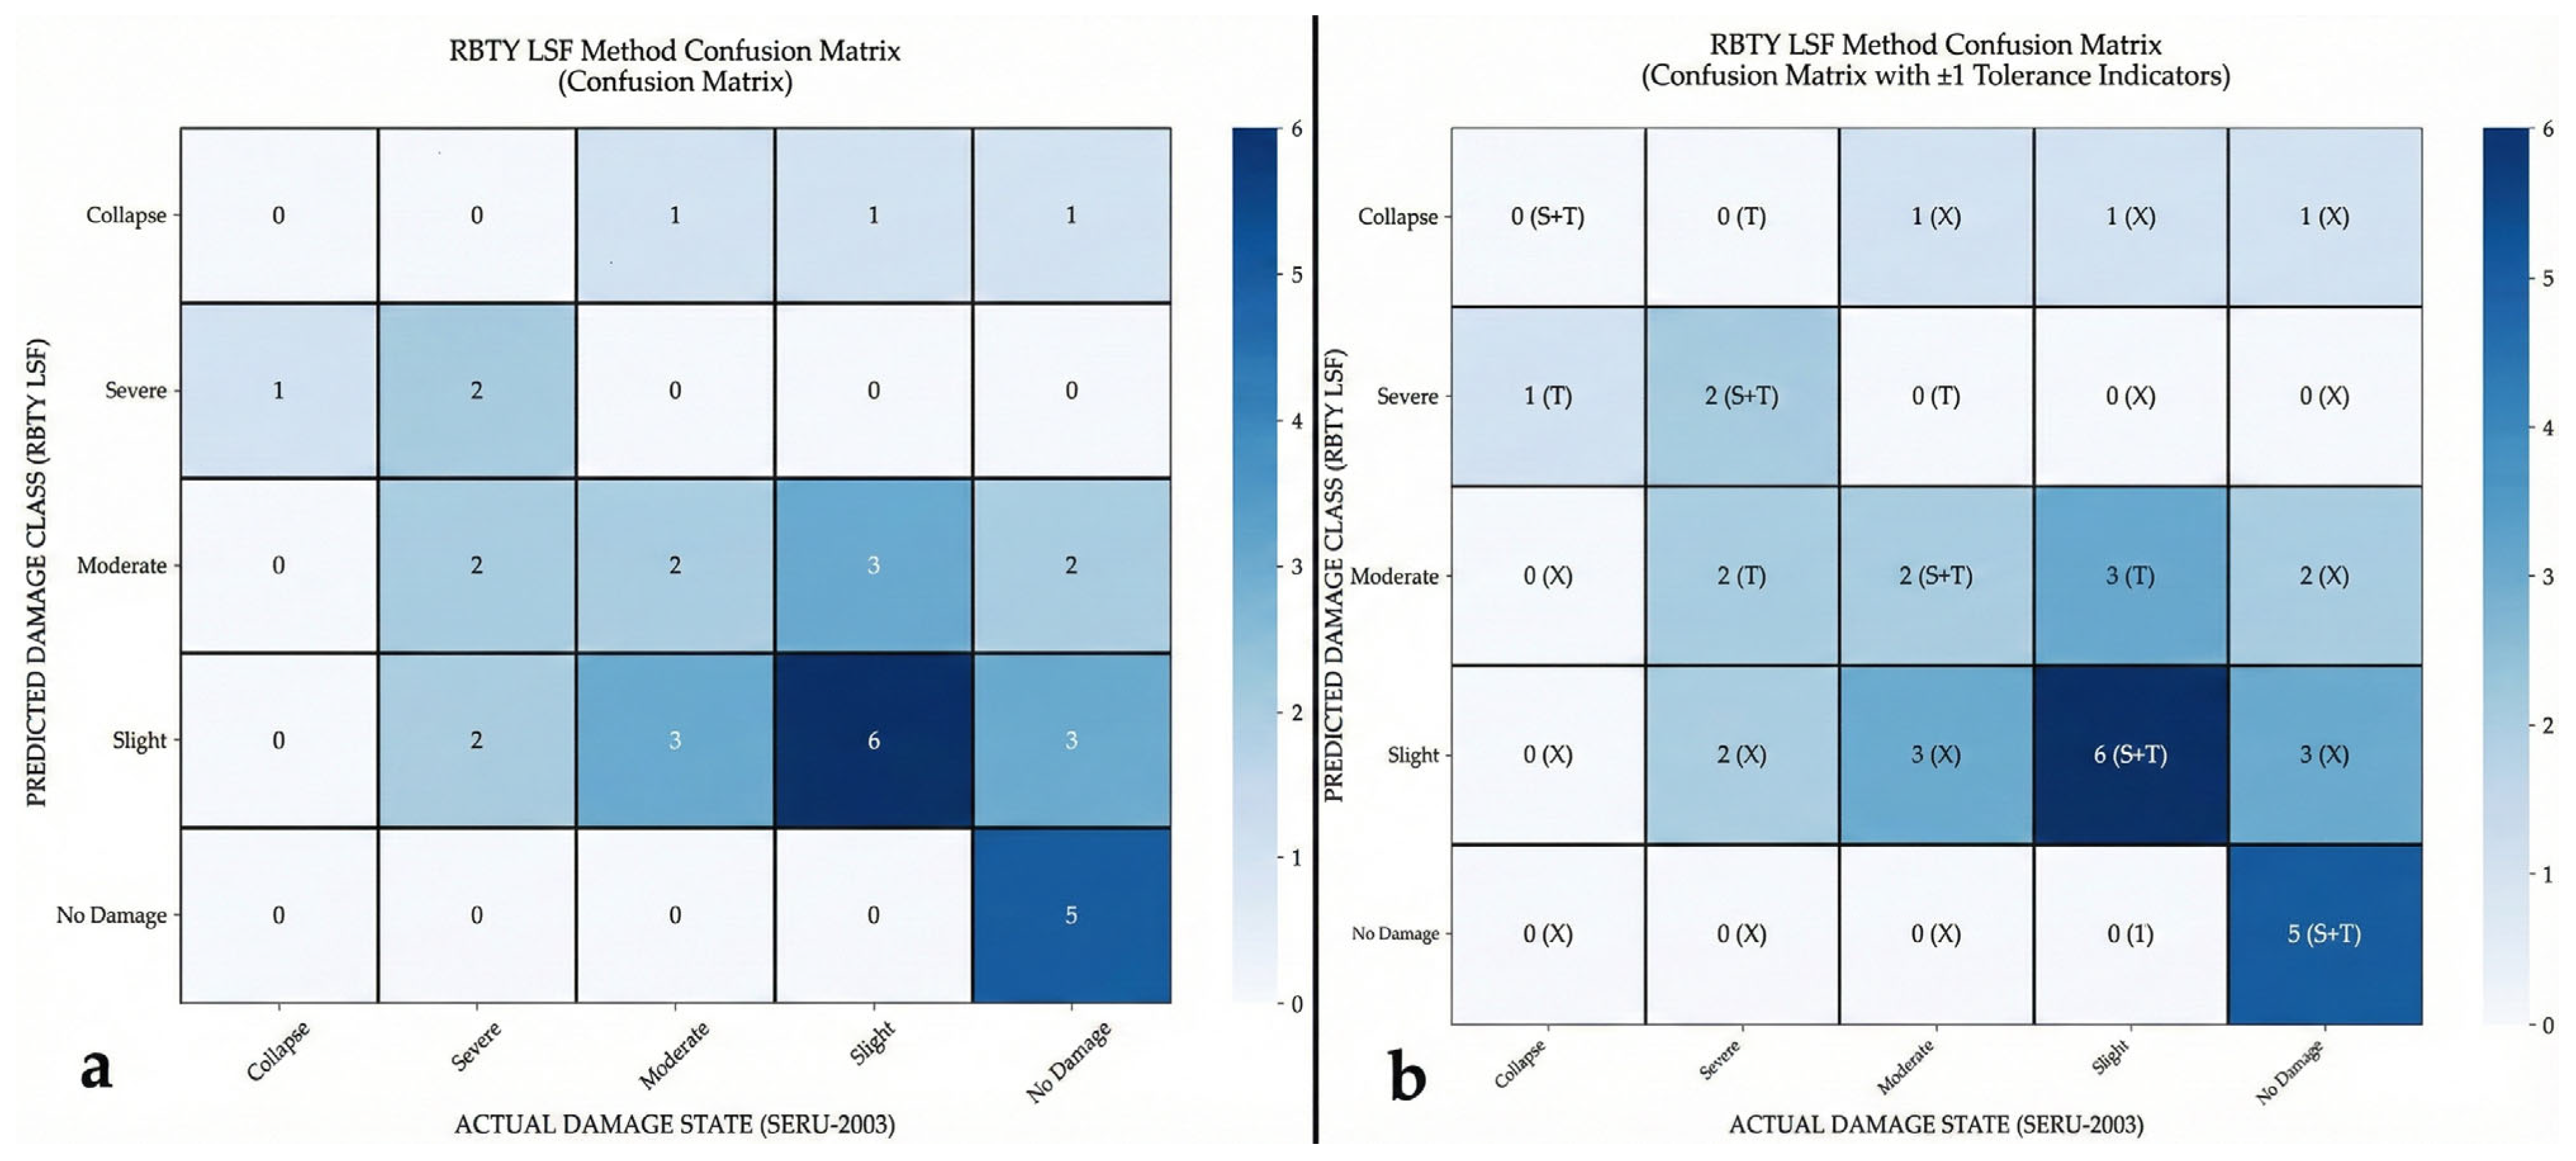
Classification performance was further assessed using confusion matrices comparing LSF-predicted damage classes with the observed SERU-2003 damage states. In addition to the standard confusion matrix, a ±1 damage-level tolerance analysis was performed to reflect the inherent uncertainty of rapid visual screening–based assessments. Under this tolerance framework, the LSF achieved an overall consistency of 71.4%, demonstrating strong agreement between the empirically derived thresholds and real post-earthquake observations.
Figure 5 visualizes the confusion-matrix comparison between LSF-predicted and observed SERU-2003 damage classes, including the ±1 damage-level tolerance adopted to reflect RVS-related uncertainty.
Figure 5.
(a) Confusion matrix, (b) confusion matrix with ±1 tolerance.
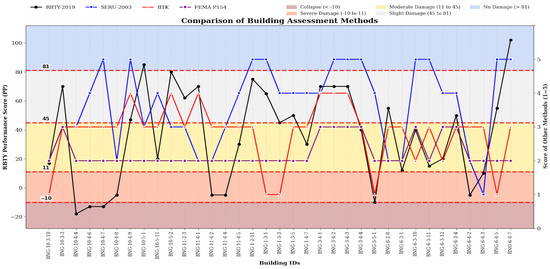
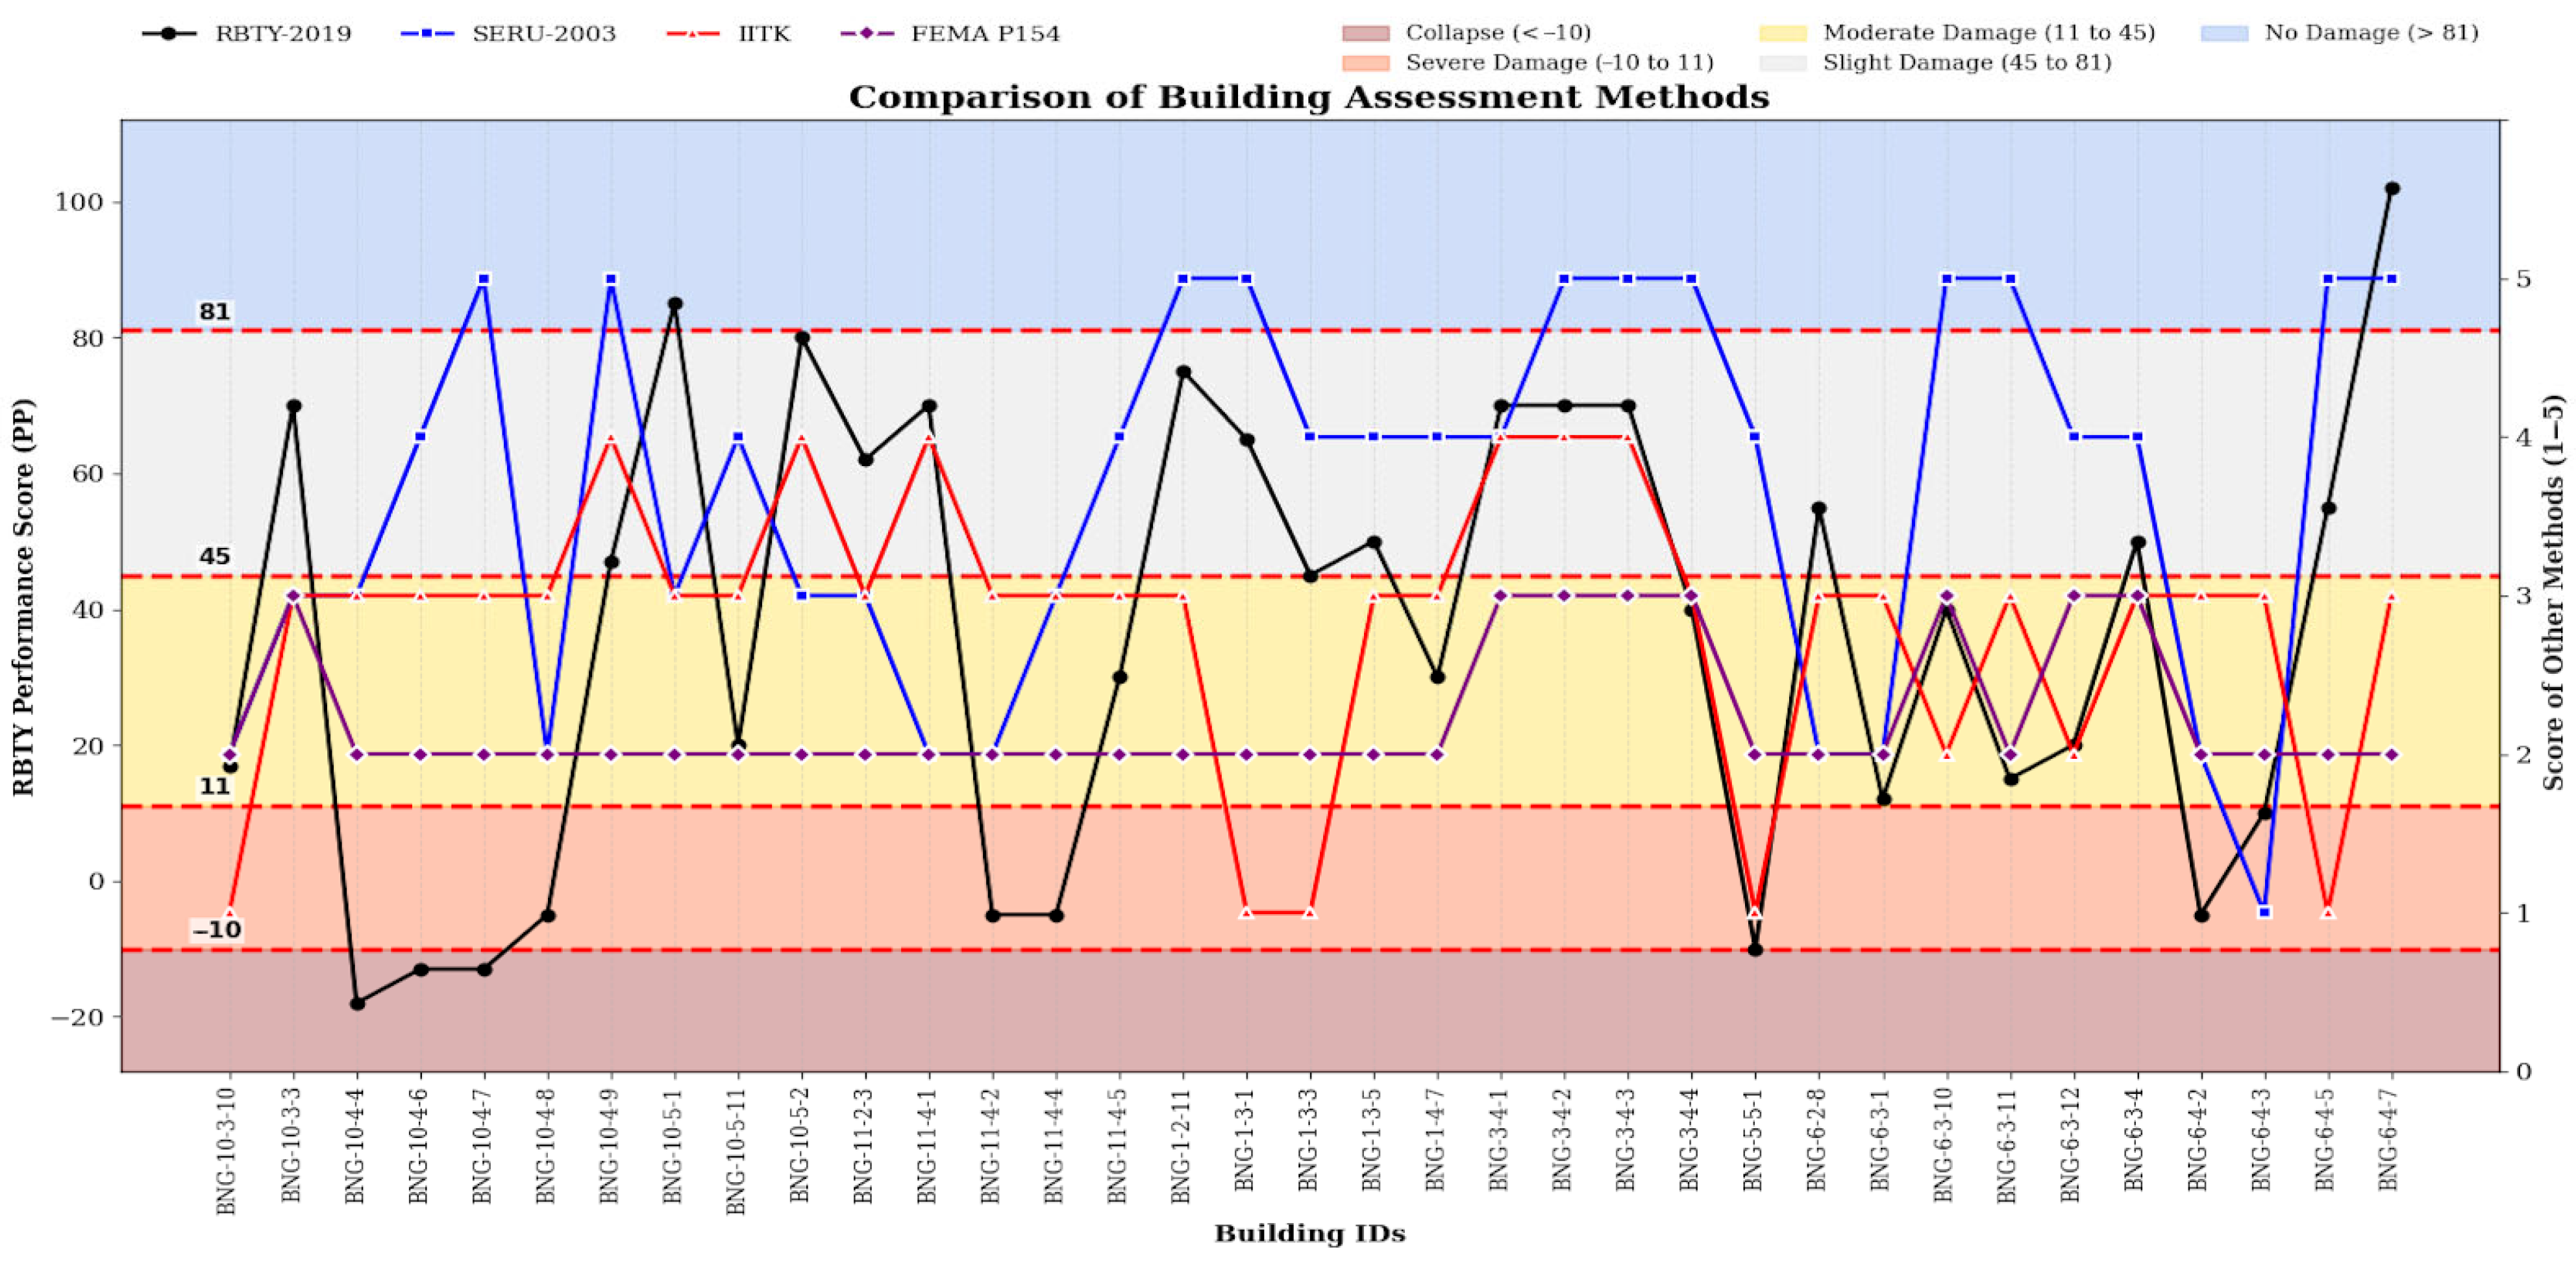
Based on this multi-step calibration and validation process, the final LSF threshold values of −10, 11, 45, and 81 were adopted and given in Figure 6. These thresholds therefore represent empirically optimized boundaries derived from observed damage data, rather than theoretically assumed or subjective limits.
Figure 6.
LSF thresholds for RVS methods.
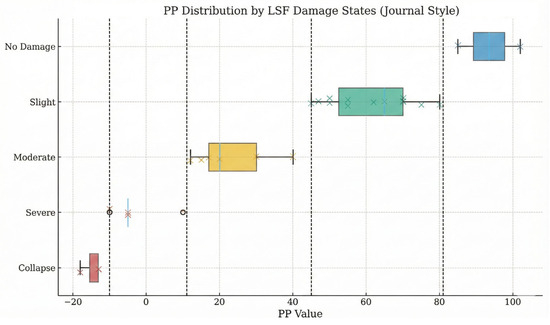
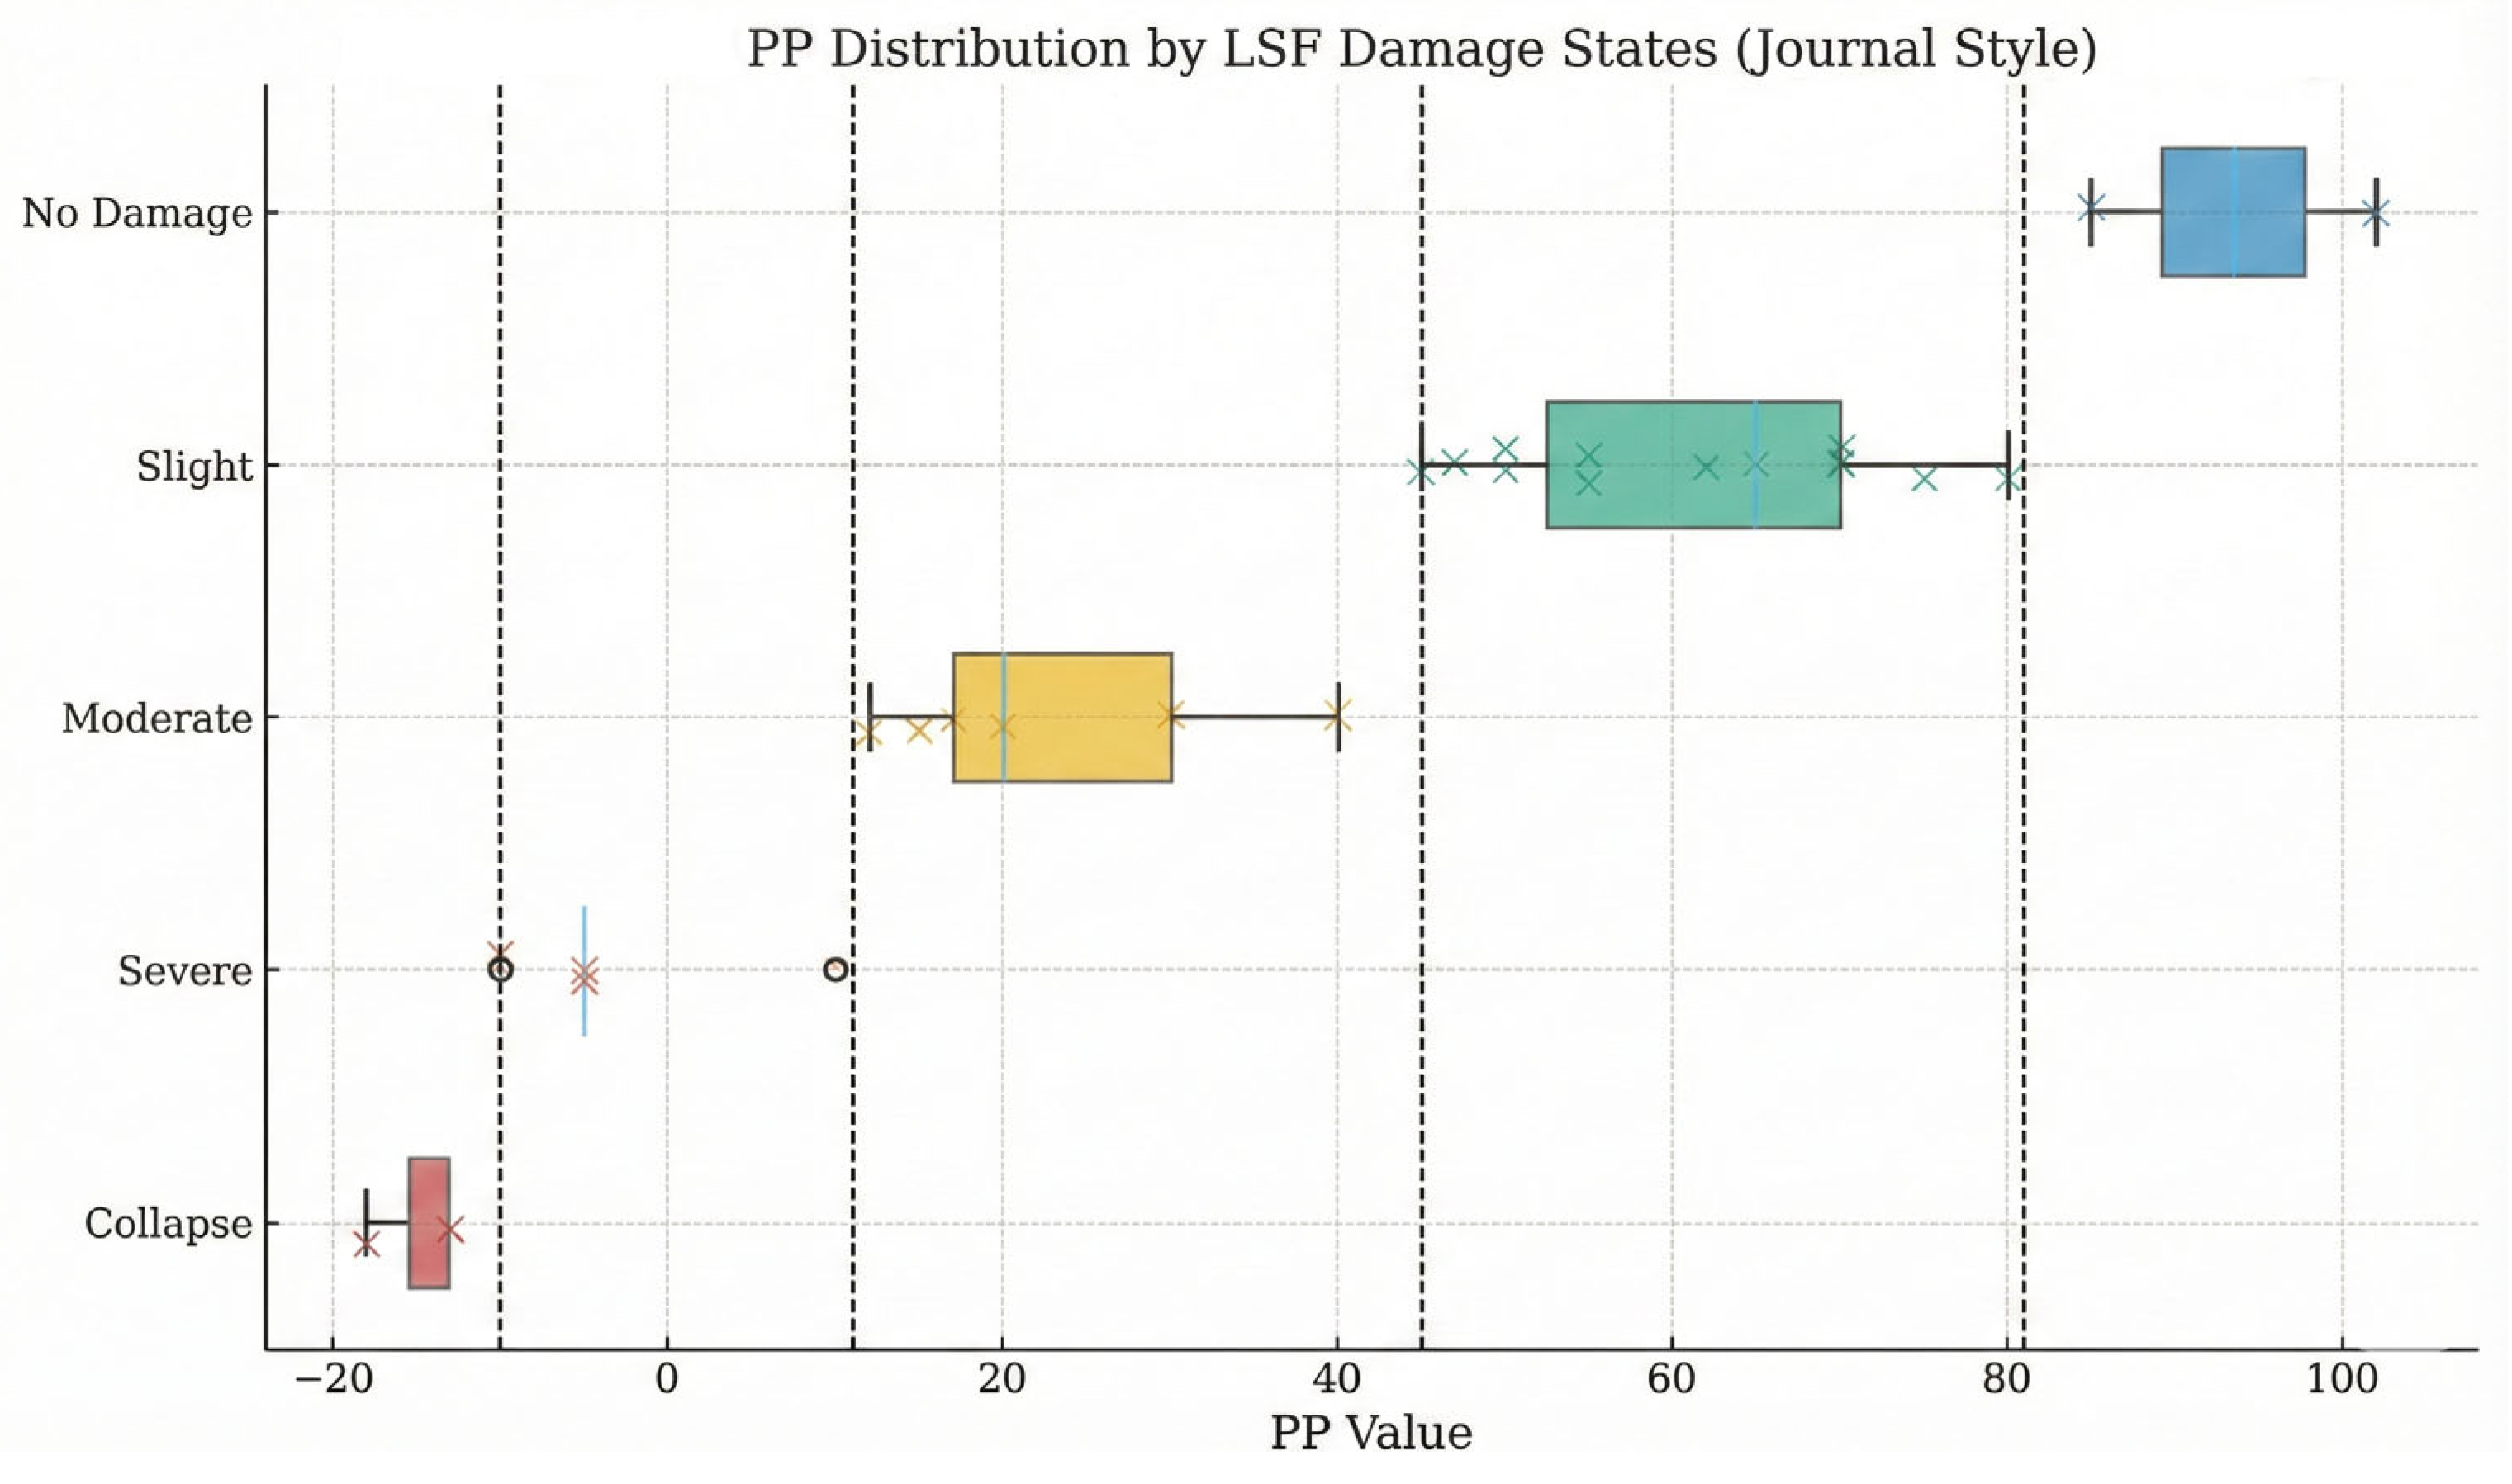
Building-level visualization of RBTY-2019 performance scores (PP) together with the calibrated Local Scaling Function (LSF) damage-state zones. The figure illustrates the empirical threshold boundaries (−10, 11, 45, and 81) and compares LSF-based damage classifications with observed SERU-2003 damage states, as well as with FEMA P-154 and IITK-GSDMA screening results. Figure 7 further examines the distribution of RBTY-2019 performance scores within each LSF damage state, demonstrating that the empirically defined thresholds produce distinct and well-separated PP ranges across damage classes.
Figure 7.
Distribution of RBTY-2019 performance scores (PP) across the Local Scaling Function (LSF) damage states.
3.3. Local Consistency Analysis of RVS Methods
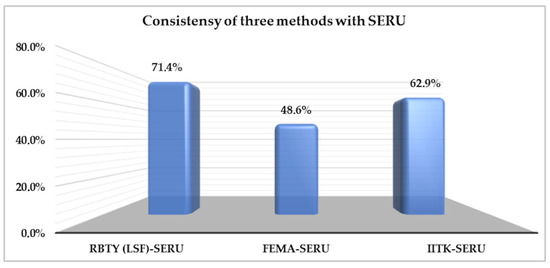
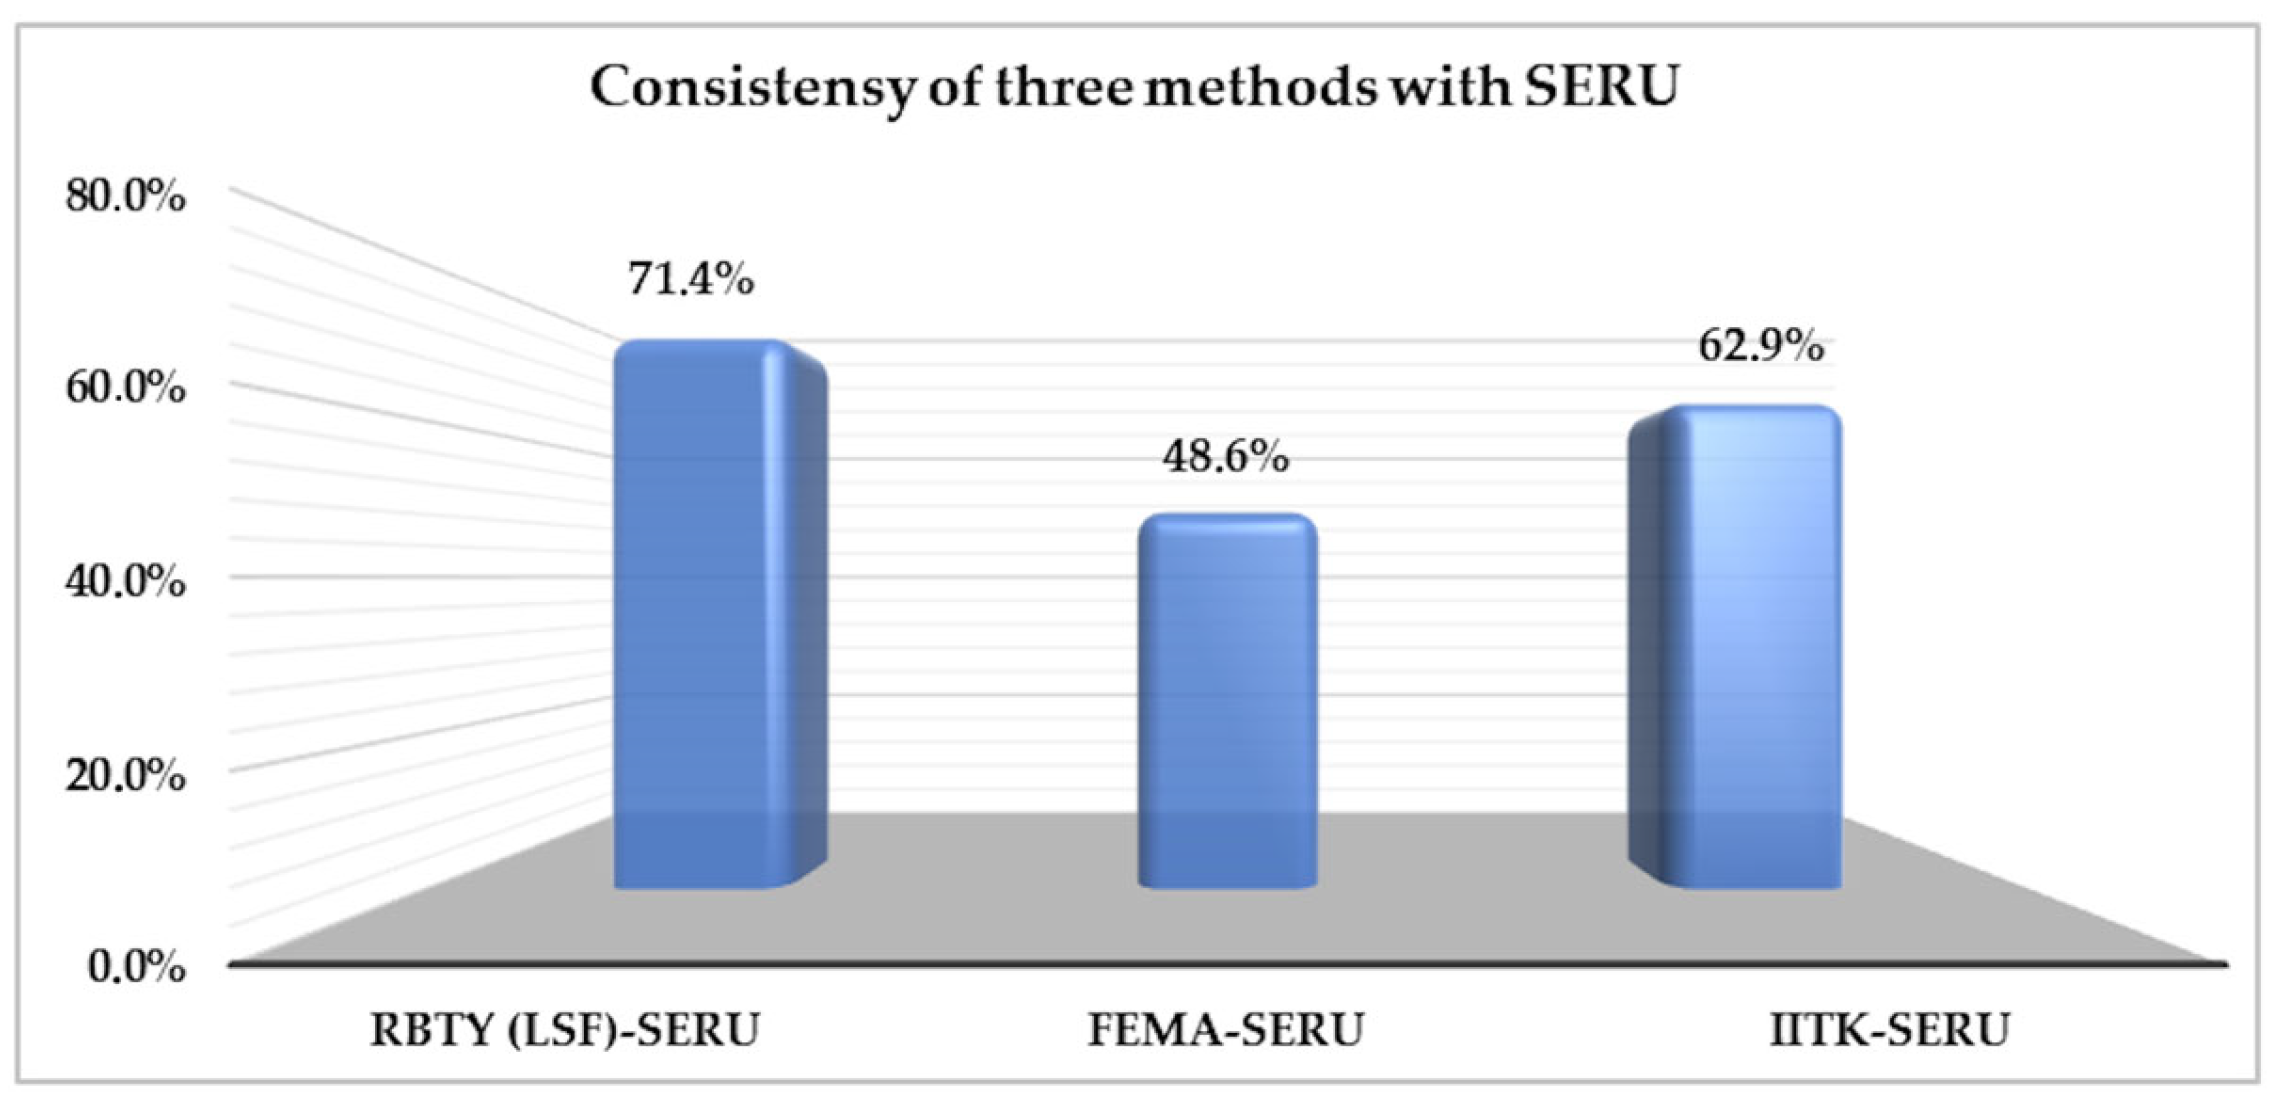
The consistency of RVS methods was evaluated by comparing their results with SERU reference classifications. Predictions within one damage level of the actual classification were considered accurate. The overall consistency rates are presented in Table 2 and Figure 8. The comparison is intentionally limited to RBTY-2019, FEMA P-154, and IITK-GSDMA, as these methods represent widely adopted and operational rapid visual screening frameworks applicable under post-earthquake conditions.
Table 2.
Consistency rates of RVS methods with SERU (within ±1 damage level).
Figure 8.
Consistency ratios of the applied methods with SERU.
The findings indicate that locally calibrated screening approaches can provide improved consistency with observed damage patterns under specific regional conditions, compared to the direct application of generic RVS methods without local adaptation.
3.4. Performance of the ANN Model
Model Accuracy
The ANN model’s predictions for these test buildings were 100% consistent with the SERU-2003 reference classifications, demonstrating its exceptional accuracy. This result confirms the model’s ability to generalize learned patterns from training data and apply them effectively to new cases (Table 3, Figure 9).
Table 3.
Consistency for test buildings.
Figure 9.
Consistency of RVS methods for test buildings.
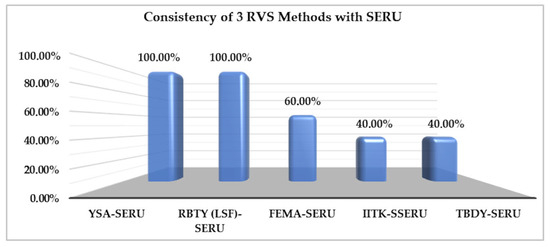
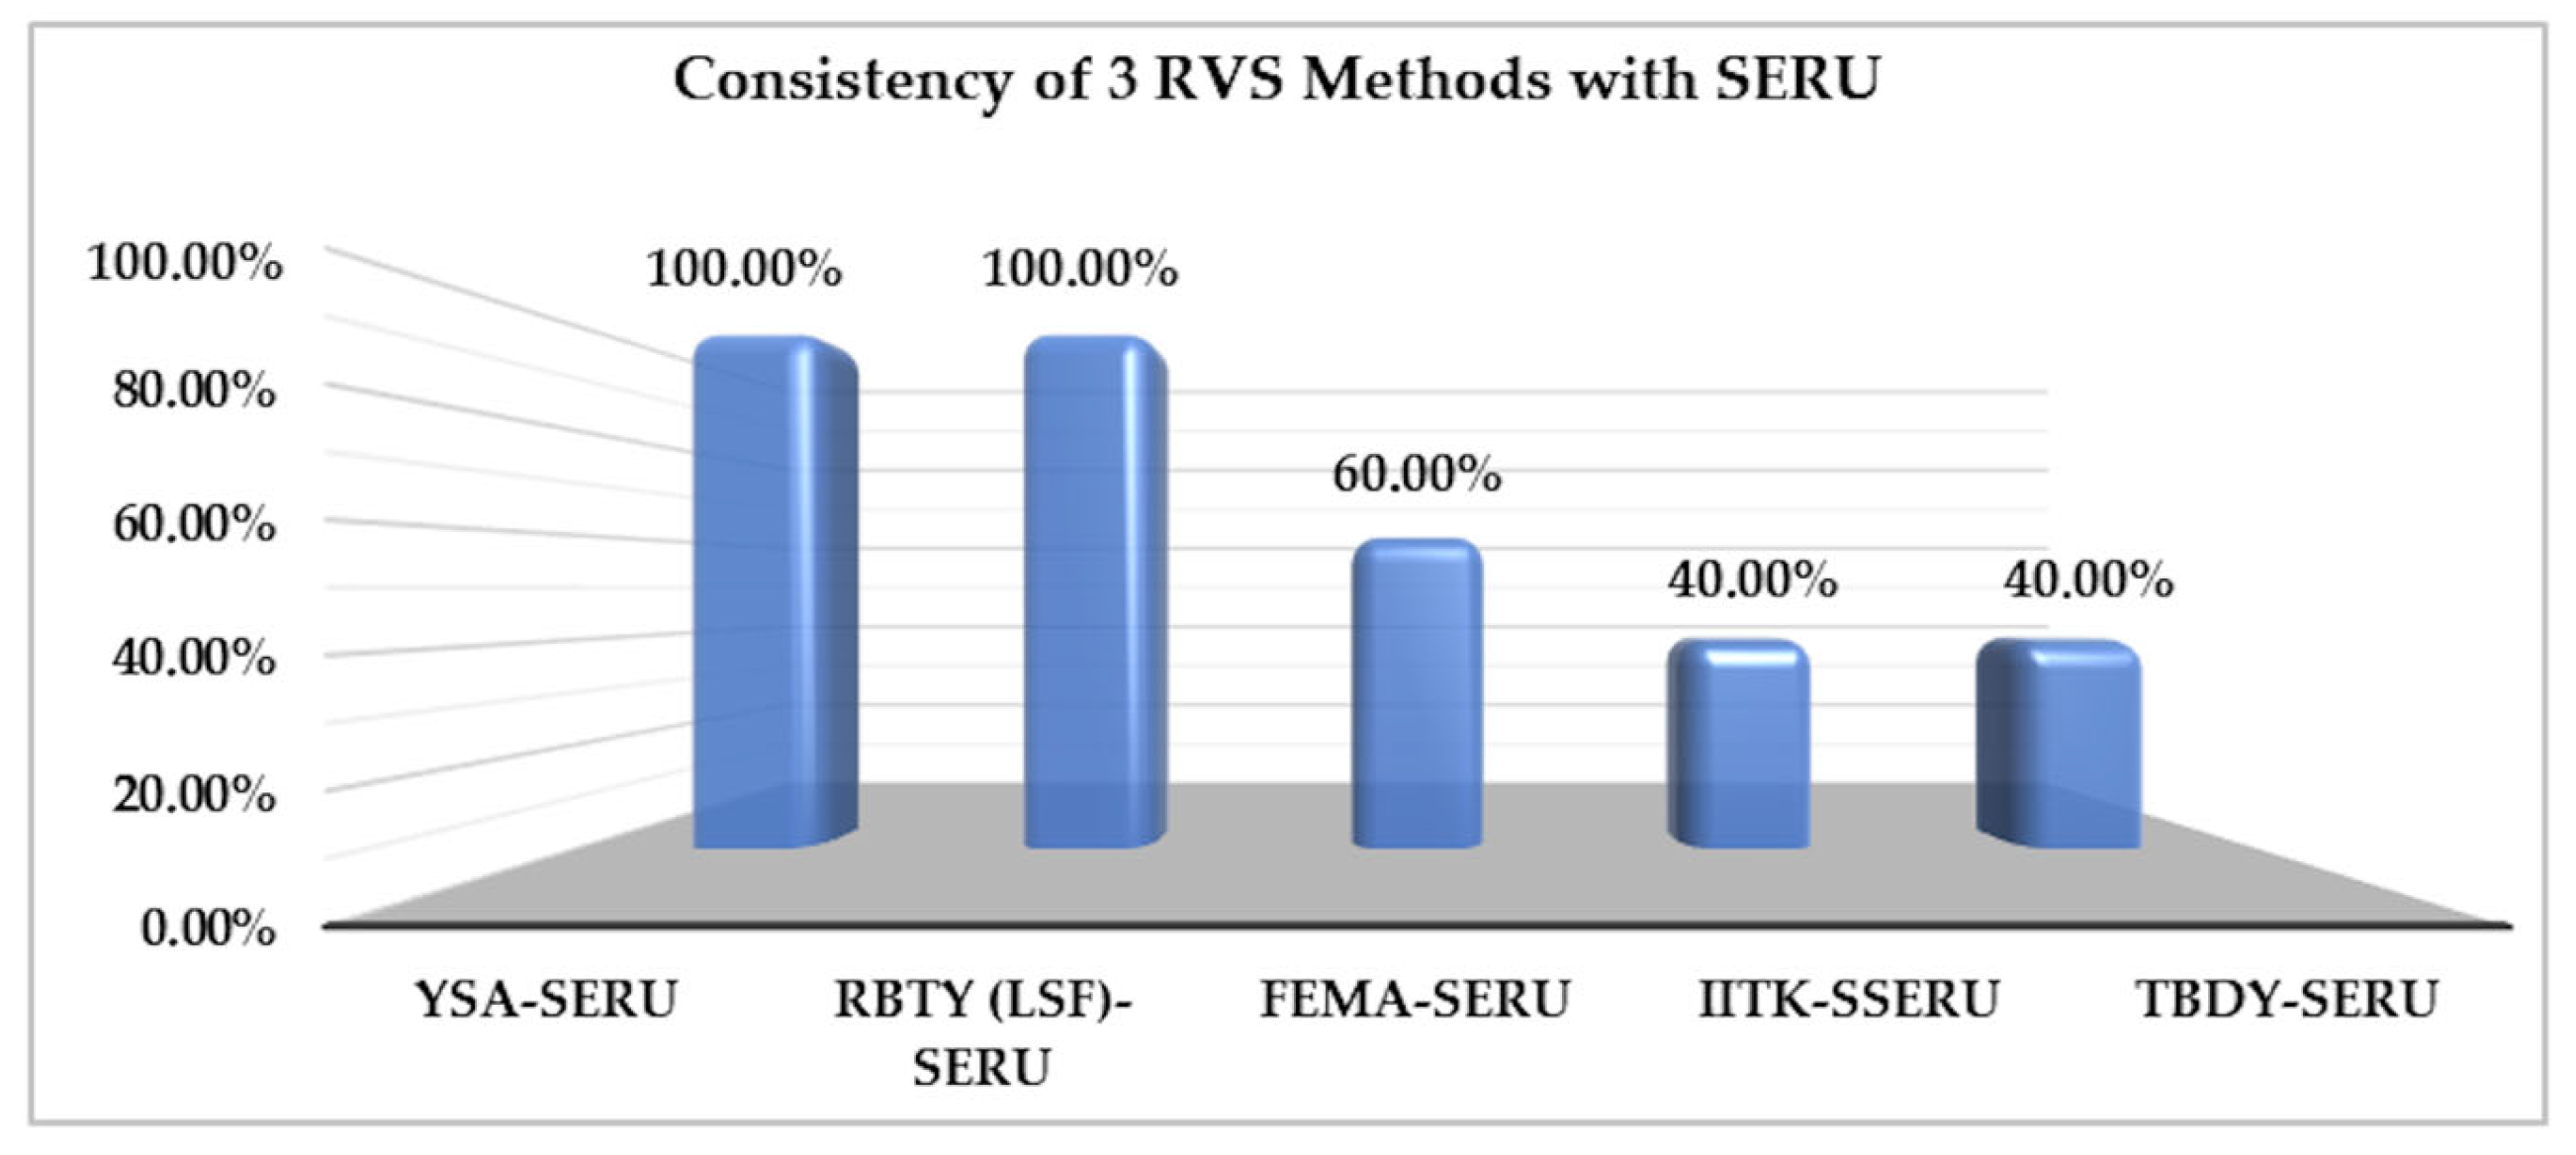
Figure 9 presents the consistency levels between selected Rapid Visual Screening (RVS) methods and the SERU reference classification. The results indicate that both YSA and RBTY-2019 (LSF) exhibit full consistency with SERU (100%), demonstrating a complete agreement in damage/risk classification across the evaluated building samples. FEMA shows a moderate consistency level (60%), while IITK- and TBDY-based approaches display considerably lower consistency ratios (40%). These findings suggest that methods developed through data-driven or locally calibrated frameworks align more closely with SERU-based field assessments, whereas generic or code-oriented screening approaches may be less effective in capturing the observed damage characteristics of the local building stock.
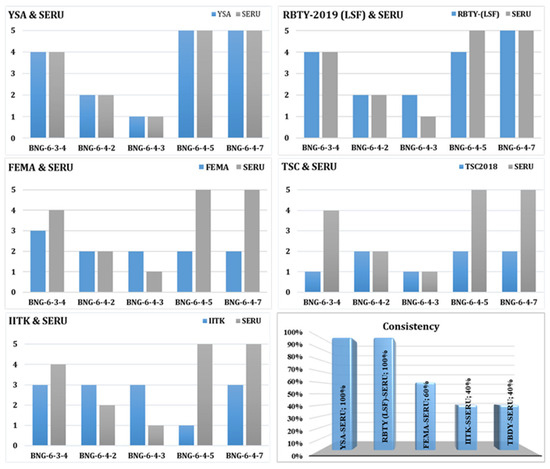
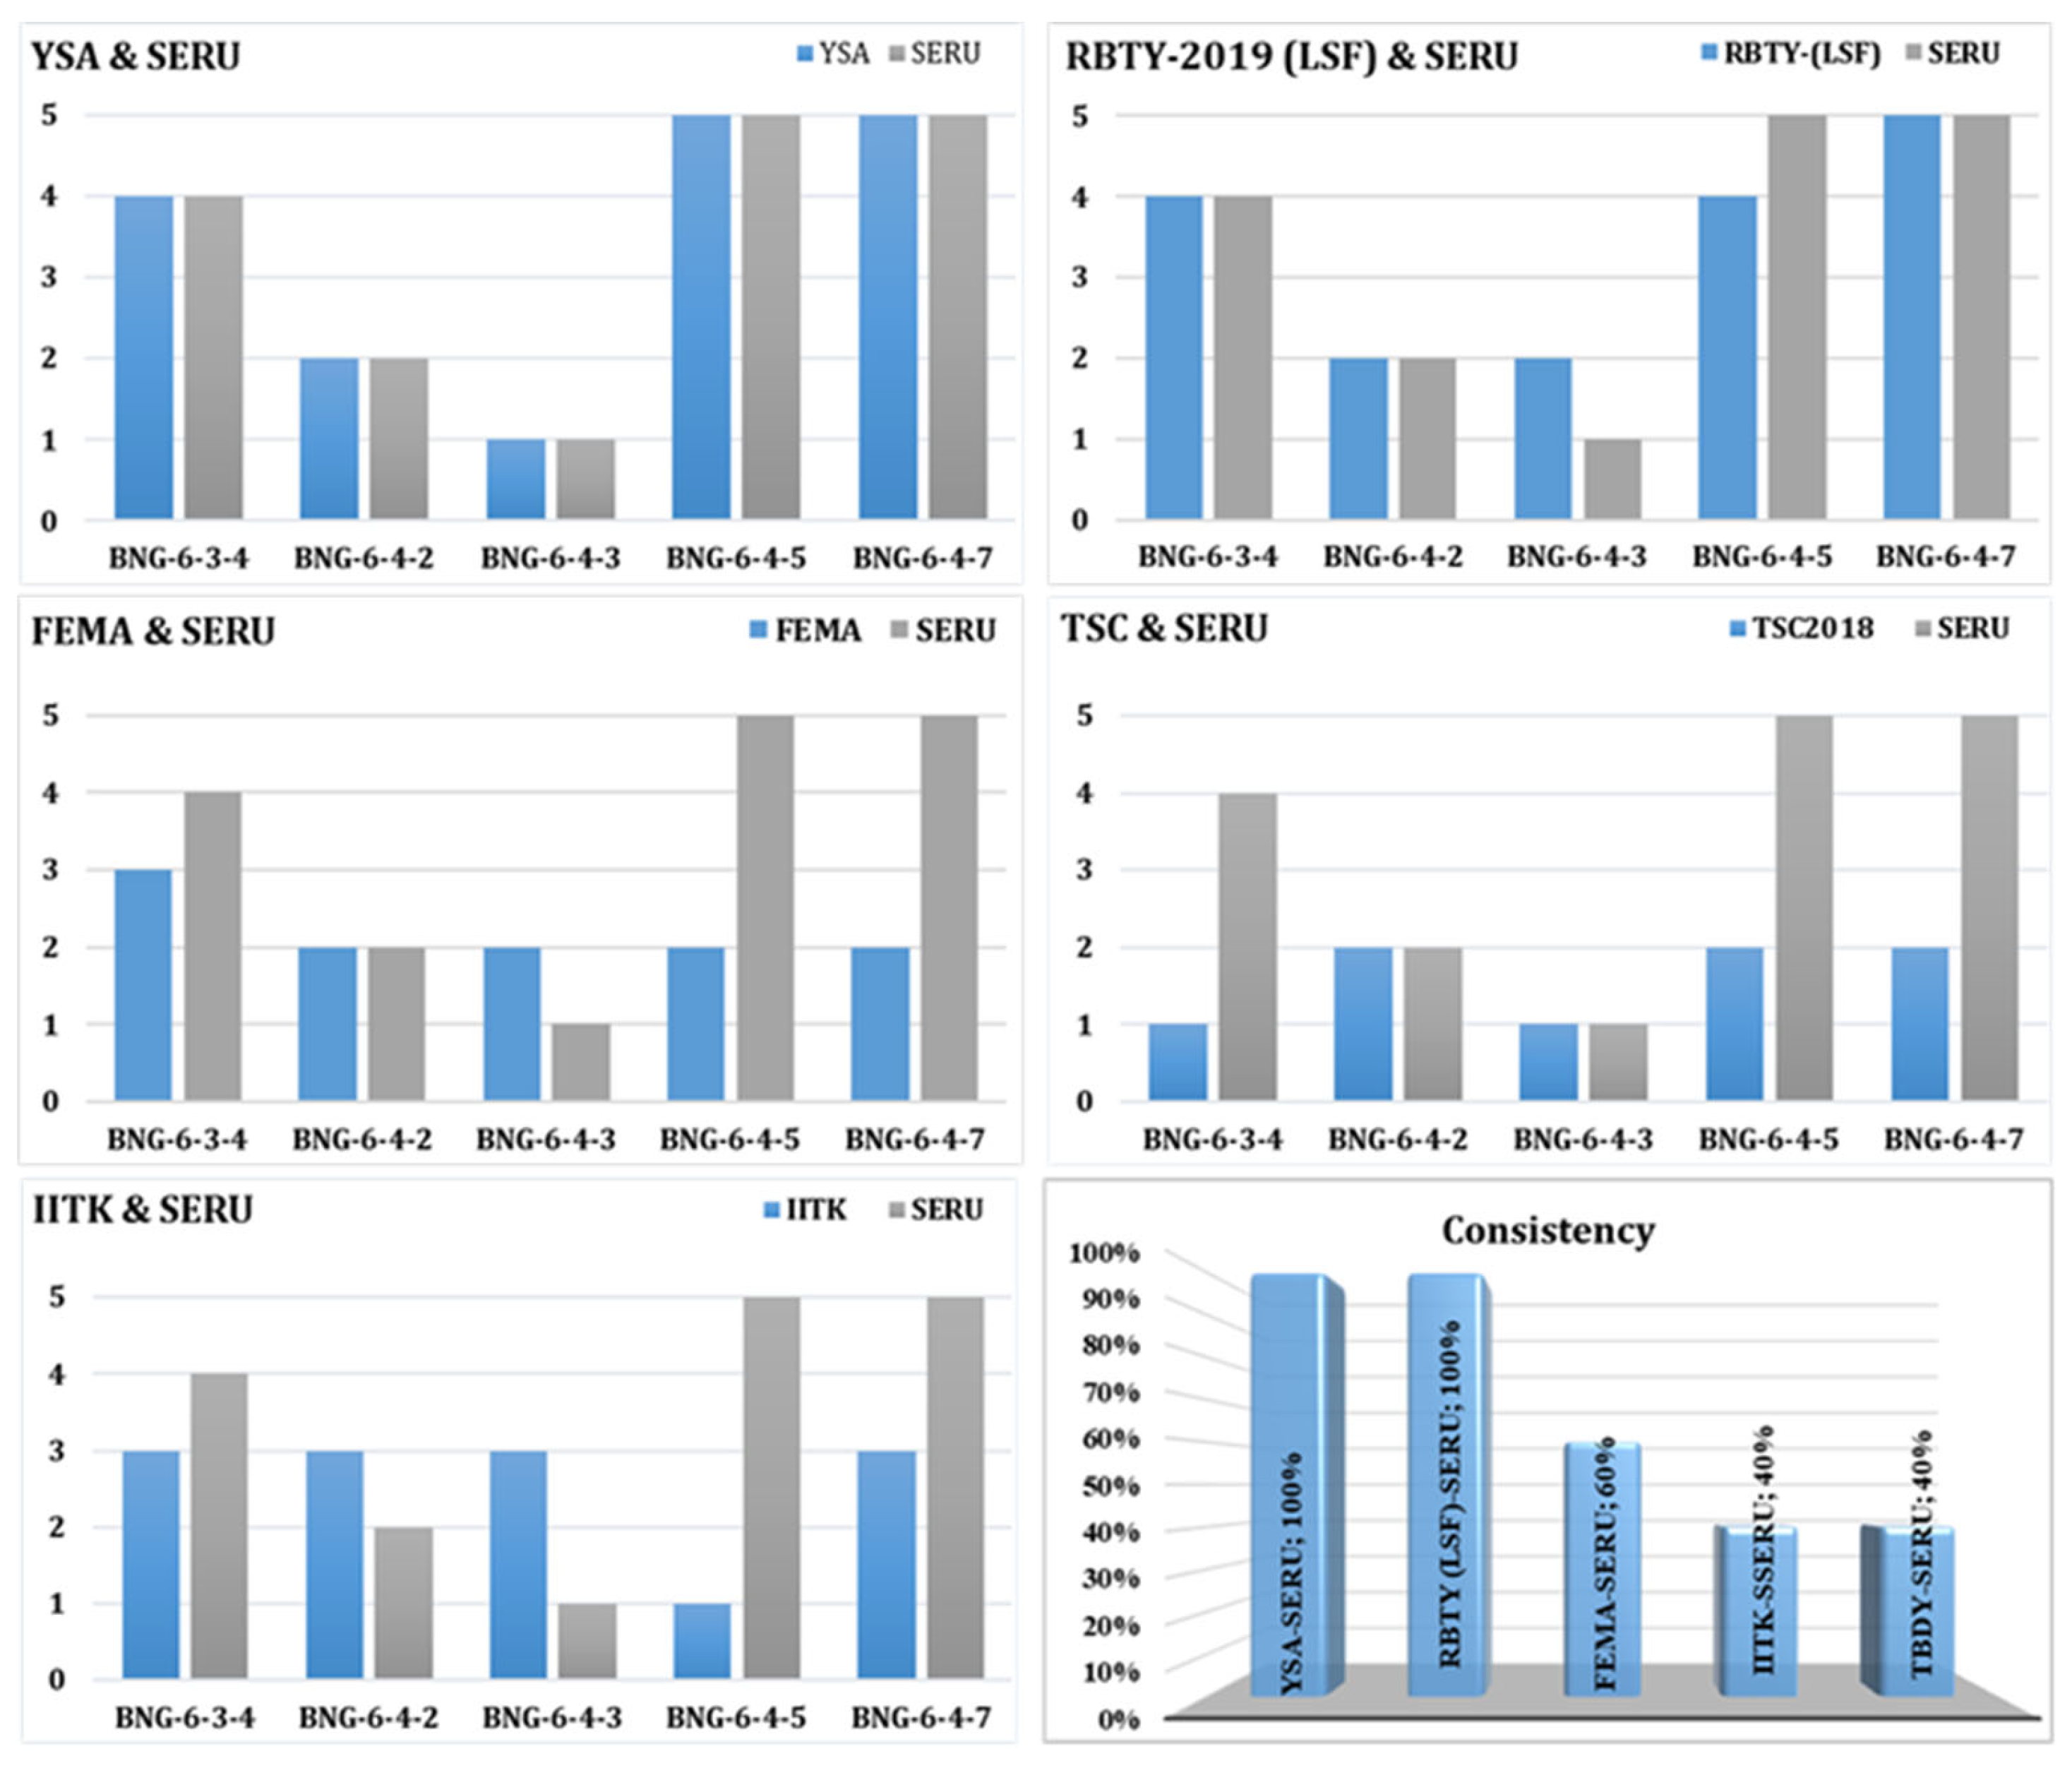
Figure 10 presents a comparative evaluation of different rapid assessment and scoring approaches—YSA, RBTY-2019 (LSF), FEMA, TSC-2018, and IITK—against the SERU reference classification for selected building samples in Bingol (BNG-6-3-4 to BNG-6-4-7). The bar charts illustrate how each method assigns damage or risk scores relative to SERU, revealing both convergences and systematic deviations. While YSA and RBTY-2019 (LSF) show a high level of agreement with SERU across most samples, FEMA, TSC-2018, and IITK exhibit larger discrepancies, particularly in buildings with intermediate damage levels. The consistency analysis summarized in the lower-right panel further quantifies these observations, indicating 100% consistency for YSA–SERU and RBTY-2019 (LSF)–SERU comparisons, whereas FEMA-, IITK-, and TBDY/TSC-based approaches display notably lower consistency ratios. These results suggest that data-driven or locally calibrated scoring systems provide a closer alignment with SERU-based field evaluations, highlighting the limitations of generic or code-oriented rapid screening methods when applied to region-specific building stocks.
Figure 10.
All results for test buildings.
Building on the comparative results presented in Figure 9 and Figure 10, the observed differences in consistency among the evaluated RVS and scoring methods underline important methodological implications. The higher agreement of YSA and RBTY-2019 (LSF) with the SERU reference suggests that approaches incorporating data-driven learning or local calibration are more capable of capturing actual post-earthquake damage characteristics. In contrast, the relatively lower consistency levels observed for FEMA-, IITK-, and TBDY-based methods point to potential limitations arising from the use of generalized scoring rules and code-oriented assumptions. These findings indicate that, while conventional RVS approaches provide a rapid and standardized framework, their direct application without regional adjustment may lead to misclassification of damage levels, particularly for buildings exhibiting intermediate or mixed damage states. Consequently, the following discussion focuses on the implications of local calibration, data integration, and methodological adaptability for improving the reliability of rapid post-earthquake damage assessment.
4. Discussion
This section discusses the implications of the results, their comparison with previous studies, and the originality of the proposed approach.
4.1. Performance of the Artificial Neural Network (ANN) in Local Damage Prediction
The developed ANN model demonstrated high predictive accuracy by achieving 100% consistency in estimating the damage states of the test buildings. This performance highlights the model’s ability to address a core challenge in seismic vulnerability estimation: capturing the complex and nonlinear relationship between structural deficiencies and observed damage outcomes.
While traditional RVS methods attempt to represent this relationship through simplified scoring systems and additive coefficients, the ANN leverages its learning-based architecture to model multi-layered nonlinear interactions. In this framework, the model not only accounts for the presence of individual vulnerability indicators (e.g., short columns, soft stories, torsional irregularities) but also learns their combined and interdependent effects on seismic damage [29,32,36].
When trained using real post-earthquake field data (SERU-2003), the ANN model effectively captures vulnerability patterns associated with local construction practices. Its predictive capability therefore reflects context-specific empirical relationships, rather than universally transferable structural behavior.
In light of recent large-scale earthquakes, such as the February 6, 2023, events, these findings suggest that machine learning-based tools like ANNs can play a valuable supporting role in pre-disaster risk screening and prioritization, particularly when applied within well-defined data and scope limitations. However, such models should be viewed as complementary decision-support tools rather than replacements for detailed structural analyses [32,35].
These observations are consistent with international studies reporting that data-driven models can outperform rule-based screening when trained on verified post-earthquake datasets, particularly in regions where construction practices and vulnerability indicators differ from the assumptions embedded in generic scoring schemes [29,32,36]. At the same time, prior work also emphasizes that such performance is highly dependent on data representativeness and should be interpreted as context-specific rather than universally transferable [32].
4.2. Reliability of RBTY (Local Scaling Function—LSF)
The fact that the RBTY method achieved 100% consistency on the test set clearly demonstrates the effectiveness of the proposed Local Scaling Function (LSF) in enhancing its reliability. This result highlights the significant impact that adapting national regulations to local empirical data can have on practical seismic risk management.
By transforming the performance scores (PP) into actual damage states based on Bingol-specific post-earthquake observations, the LSF enables more accurate and context-sensitive vulnerability classification. This adaptation not only improves the predictive power of RBTY but also makes it a more applicable and trustworthy tool for local authorities in prioritizing seismic risk mitigation efforts.
The observed improvement reflects a context-dependent advantage of local calibration rather than a claim of universal superiority across different seismic regions or building stocks [14,42].
4.3. Comparison with Traditional RVS Methods (FEMA-P154 and IITK-GSDMA)
FEMA-P154’s low performance is attributed to its inability to produce scores exceeding the threshold of 2 in high seismic hazard zones like Bingol, resulting in all buildings being flagged for Detailed Performance Evaluation (DPE), which is impractical for large inventories.
The high consistency of RBTY-2019 was achieved through the developed local LSF scaling function. The function’s ability to convert performance scores ranges into SERU’s five-level damage classification demonstrates that adapting the national code to local data creates a critical distinction in practical risk management.
IITK-GSDMA performed even worse than FEMA in collapse prediction, highlighting that international screening frameworks cannot be applied directly to regions with distinct seismic and construction characteristics. These findings indicate that local calibration and data-driven approaches can substantially enhance the reliability of rapid screening when applied to regions with distinct seismic and construction characteristics [33,43,44].
The empirical derivation of the LSF thresholds using real post-earthquake observations represents a key strength of the proposed framework. Unlike predefined scoring limits adopted directly from international RVS methods, the thresholds were calibrated and validated against field-observed damage using ROC analysis and confusion matrices. This data-driven calibration enhances the interpretability and reliability of RBTY-2019 results for local-scale seismic risk assessment, particularly in regions with limited but high-quality post-earthquake damage records.
Similar limitations of applying unmodified rapid screening procedures across different seismic and construction contexts have been reported in international RVS applications, where local calibration or region-specific modifiers were recommended to improve classification reliability [33,43,44]. In this respect, the empirically derived LSF proposed here aligns with the broader international emphasis on adapting screening thresholds to observed local damage evidence rather than relying solely on predefined limits [14,33,43,44].
4.4. Methodological Limitations and Generalizability
Although the proposed ANN–LSF framework demonstrates strong consistency with observed damage patterns, several methodological limitations should be acknowledged. First, the input parameters are intentionally limited to RBTY-2019 rapid visual screening (RVS) defect indicators. This choice reflects the primary objective of the study, which is to support rapid damage prioritization under data-constrained post-earthquake conditions, rather than to replace detailed analytical or mechanics-based structural assessments.
Ground motion parameters (e.g., PGA, spectral acceleration) were not included as ANN inputs due to both data availability and scale considerations. For the 1 May 2003 Bingol Earthquake, only a single seismic recording station was available in the city center, and building-specific ground motion records do not exist. Even under current monitoring conditions, site-specific ground motion data at the individual building level remain largely unavailable. Consequently, incorporating ground motion parameters would not provide meaningful discrimination at the building scale within an RVS-based framework.
Similarly, detailed structural attributes such as material strengths, reinforcement layouts, or member-level properties were not considered, as these parameters cannot be reliably obtained through rapid visual inspection or post-earthquake photographic documentation. The proposed approach is therefore not intended to model detailed damage mechanisms, but rather to capture dominant vulnerability patterns using observable indicators. Future studies based on expanded datasets and detailed structural information may allow the integration of ground motion parameters and advanced structural features to enhance model generalizability.
4.4.1. Scope and Size of the Dataset
The ANN was trained using a dataset of 35 reinforced concrete buildings affected by the 2003 Bingol Earthquake. This limitation does not stem from data selection preference but from the availability of observed, hand-verified, and damage-labeled (OHWD) post-earthquake records supported by sufficient photographic documentation required for the application of RVS-based indicators. Consequently, the model’s performance reflects the maximum achievable accuracy within this high-quality but necessarily limited dataset, and its predictive capability remains primarily representative of the local building stock.
A formal quantitative uncertainty or parametric sensitivity analysis was not conducted in this study due to the limited size of the empirical dataset (n = 35), as such analyses could lead to statistically unstable or misleading interpretations. Accordingly, the bar charts presented in the Section 3 represent empirical consistency ratios rather than probabilistic estimators, which is why classical error bars are not included. Nevertheless, qualitative evaluation of the results indicates that certain vulnerability indicators—particularly soft-story conditions, short columns, and slope-related site effects—exert a dominant influence on damage classification outcomes across both RVS-based and ANN-based assessments. Future studies based on larger and more diverse datasets may enable robust quantitative sensitivity and uncertainty analyses.
4.4.2. Geographical Constraint
The high performance of the model is closely linked to the geological and structural characteristics of the Bingol city center, where site conditions are relatively homogeneous and predominantly classified as ZC, with limited ZB zones. In addition, slope effects—one of the most critical site-related amplification mechanisms in the study area—are indirectly incorporated through the RBTY-2019 defect indicators. As a result, the direct transferability of the trained ANN to regions with significantly different soil conditions, structural typologies, or construction practices (e.g., Istanbul or Izmir) remains uncertain without retraining.
4.4.3. Ground Motion Data Availability
Explicit ground motion parameters (e.g., PGA or spectral accelerations) were not included as ANN inputs due to practical data constraints. During the 1 May 2003 Bingol Earthquake, only a single seismic recording station was operational in the city center, and building-specific ground motion records were not available. Even under current monitoring conditions, ground motion is not recorded at the individual building scale. Therefore, incorporating such parameters into the ANN would not provide meaningful differentiation between buildings and would contradict the operational logic of rapid visual screening-based assessments.
4.4.4. Generalizability of the ANN Framework
The predictive capability of ANN models is inherently dependent on the volume, diversity, and representativeness of the training data. While the present study demonstrates the feasibility of a localized, data-driven damage prediction framework, broader generalization would require retraining the model using expanded regional or national datasets that encompass a wider range of building typologies, seismic environments, and structural configurations. Until such datasets become available, the proposed framework should be interpreted as a localized rapid screening and prioritization tool, rather than a universally applicable damage prediction model.
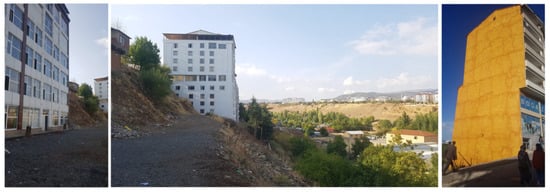
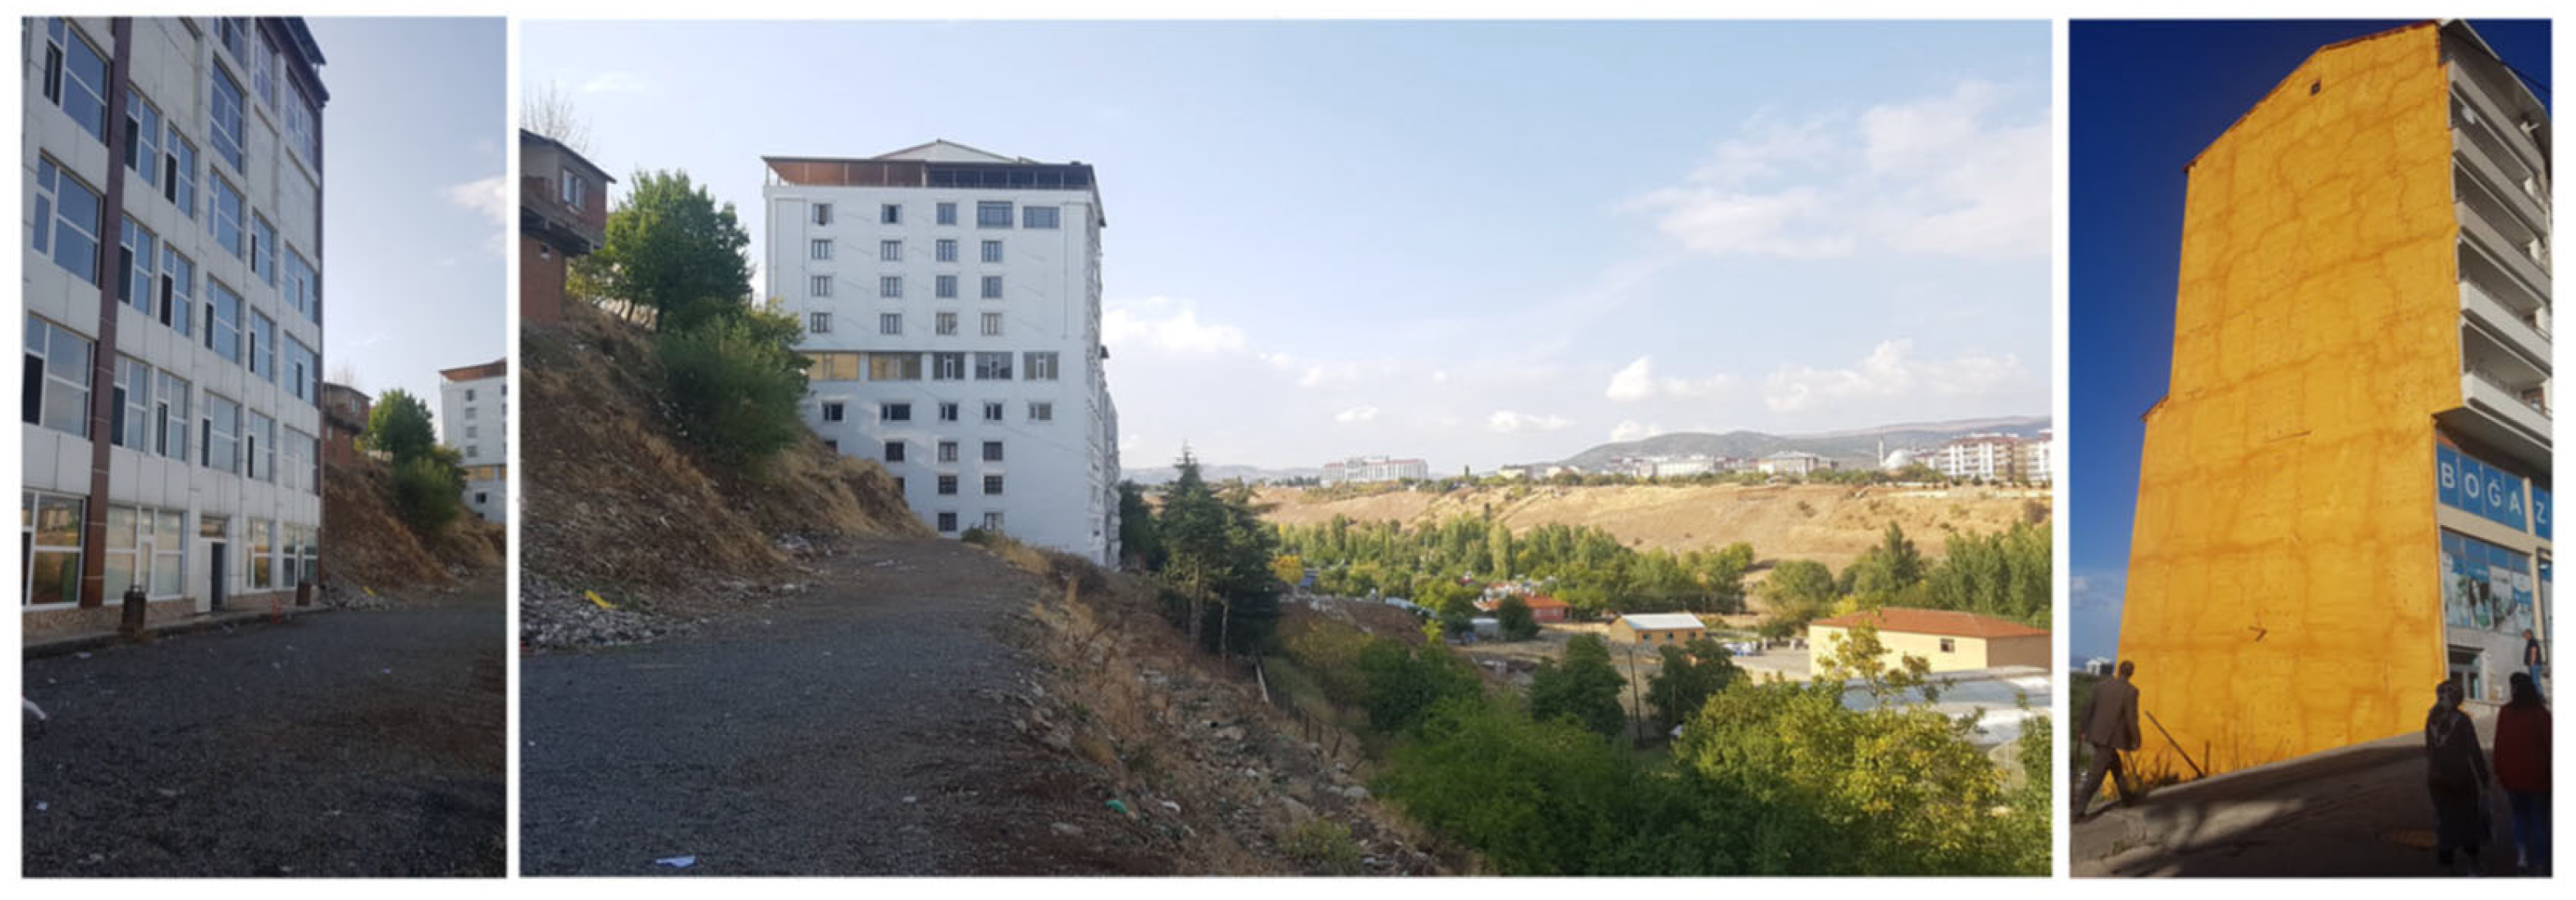
In addition to the method-based comparisons discussed above, field observations revealed that local topographic conditions play a critical role in shaping building damage patterns. In particular, slope-related effects, such as differential foundation support, localized soil instability, and increased vulnerability due to cut-and-fill practices, were identified as influential factors that are not explicitly captured by conventional RVS scoring frameworks. These observations indicate that damage severity cannot be adequately interpreted solely through standardized structural or code-based indicators. Instead, site-specific conditions, especially slope geometry and terrain-induced constraints, should be considered as complementary evaluation criteria within rapid damage assessment processes. To illustrate the influence of such slope effects on building performance and damage manifestation, representative field examples from the study area are presented in Figure 11.
Figure 11.
Buildings on the valley slopes of the Çapakçur and Gayt streams.
4.5. Implications for Future Research and Practice
Considering the findings and limitations, future work should prioritize expanding the ANN training dataset using additional earthquake case studies to improve representativeness and generalizability. In parallel, integrating geological and site effects (including slope-related conditions) into both RBTY-based screening and ANN-based prediction frameworks would strengthen context sensitivity where reliable data are available. Another promising direction is to enrich training data using outputs from detailed performance evaluations (DPEs) and advanced nonlinear analyses (e.g., pushover or incremental dynamic analysis), enabling hybrid pre-screening schemes that better allocate engineering resources. As larger datasets become accessible, alternative ANN and deep learning architectures can also be explored to improve robustness and reduce overfitting in larger-scale fragility modeling. Finally, embedding AI-supported rapid screening tools into national urban transformation and disaster preparedness programs may improve risk-informed prioritization and strengthen community-level resilience, provided these tools are implemented as decision-support instruments complementary to professional judgment and detailed assessment.
5. Conclusions
This study presents a comparative seismic vulnerability assessment of existing reinforced concrete buildings in Bingöl using three Rapid Visual Screening (RVS) methods—RBTY-2019, FEMA-P154, and IITK-GSDMA—together with a machine learning-based prediction model developed using Artificial Neural Networks (ANNs). Vulnerability levels were evaluated using verified post-earthquake damage data from the 2003 Bingöl Earthquake (SERU-2003) [38]. The results demonstrate that screening approaches incorporating empirical damage data and local calibration achieve substantially higher consistency with observed damage patterns than generic, unmodified screening frameworks.
A key contribution of the study is the empirically calibrated Local Scaling Function (LSF) developed for RBTY-2019. By converting performance score ranges into damage states calibrated against Bingöl-specific post-earthquake observations, the adapted RBTY framework demonstrated improved alignment with SERU reference classifications. Validation through ROC analysis and confusion matrices confirms that locally adapted, data-driven scaling functions substantially improve the reliability and interpretability of rapid seismic vulnerability assessments. These results also underscore the critical importance of regional calibration when applying national or international screening methodologies.
The ANN model achieved full consistency in predicting the damage states of the limited test dataset, indicating its strong potential for capturing nonlinear relationships between observed structural deficiencies and damage outcomes under local conditions. Rather than implying universal applicability, this result suggests that ANN-based approaches can serve as effective, context-dependent decision-support tools for rapid damage screening when trained with representative post-earthquake data. In this respect, machine learning-based models should be regarded as complementary tools that support, rather than replace, professional judgment and detailed structural assessment procedures.
The relatively low consistency observed for FEMA-P154 and IITK-GSDMA highlights the limitations of directly applying unmodified international RVS frameworks to regions with distinct seismic, geological, and construction characteristics. These methods tend to overgeneralize vulnerability or misclassify critical damage states when regional context is not adequately considered. Similarly, the performance-based evaluation of test buildings using TSC-2018 (DPE) resulted in lower consistency with observed damage data, suggesting that under certain conditions even detailed analytical procedures may yield conservative classifications, potentially leading to inefficient allocation of limited assessment resources. In this context, rapid screening and machine learning-based tools can play a complementary role by prioritizing buildings for detailed evaluation.
Although the findings demonstrate the effectiveness of locally calibrated and data-driven approaches, the study is subject to limitations related to dataset size and regional specificity. Future research should focus on expanding ANN training datasets using larger and more diverse post-earthquake damage records, integrating geological and site-specific risk factors such as slope instability, landslide potential, and liquefaction into both RBTY and ANN-based frameworks, and exploring the conditional incorporation of building-level seismic parameters where reliable data are available. Further investigations may also examine alternative machine learning architectures and the use of detailed analytical evaluation results, such as pushover or incremental dynamic analysis, as enriched training data. Overall, the proposed ANN–RVS framework provides a practical, scientifically grounded approach for supporting risk-informed prioritization and improving the efficiency of seismic risk management in seismically active regions.
Supplementary Materials
The following supporting information can be downloaded at: https://www.mdpi.com/article/10.3390/buildings16030683/s1.
Author Contributions
Conceptualization, S.V. and A.K.; methodology, S.V.; software, S.V.; validation, S.V. and A.K.; formal analysis, S.V.; investigation, S.V.; resources, S.V.; data curation, S.V.; writing—original draft preparation, S.V.; writing—review and editing, S.V. and A.K.; visualization, S.V.; supervision, A.K.; project administration, S.V.; funding acquisition. All authors have read and agreed to the published version of the manuscript.
Funding
This research received no external funding.
Data Availability Statement
The data supporting the reported results in this study are based on the damage assessment surveys conducted following the 1 May 2003 Bingol Earthquake. The analyzed data were sourced from a joint technical report prepared by engineering teams from Middle East Technical University (METU) and Purdue University, technically edited by Güney Özcebe and Julio A. Ramirez. The full content and detailed damage assessment data of this report are publicly available and can be downloaded/reviewed from online archives. (https://seru.metu.edu.tr/archives.html, accessed on 23 July 2023), and an alternative source of the same material is available at Anatolian Quake (http://www.anatolianquake.org, accessed on 23 July 2023). All data used in this study are openly available from these sources as referenced in the main text [38].
Acknowledgments
The authors gratefully acknowledge the valuable support provided by the Engineering teams of Middle East Technical University (METU) and Purdue University during the post-earthquake field survey of the 2003 Bingol Earthquake. Special thanks are extended to the Bingol University Center for Energy, Environment, and Natural Disasters for facilitating computational resources and technical support during ANN model development. During the preparation of this manuscript, the authors used ChatGPT (GPT-5, OpenAI) for linguistic editing, structural refinement, and reference formatting. The authors have carefully reviewed and edited the generated content and take full responsibility for the final version of the manuscript.
Conflicts of Interest
The authors declare no conflicts of interest.
Abbreviations
The following abbreviations are used in this manuscript:
| ANN | Artificial Neural Network |
| EAFZ | East Anatolian Fault Zone |
| DPE | Detailed Performance Evaluation |
| FEMA-P154 | U.S. Federal Emergency Management Agency P154 RVS Method |
| IITK-GSDMA | Indian Institute of Technology Kanpur—Gujarat State Disaster Management Authority RVS Method |
| LSF | Local Scaling Function |
| NAFZ | North Anatolian Fault Zone |
| PGA | Peak Ground Acceleration |
| PP | Performance Score |
| RC | Reinforced Concrete |
| RBTY-2019 | Risky Building Detection Regulation |
| RVS | Rapid Visual Screening |
| SERU-2003 | Seismic Engineering Report of the 2003 Bingol Earthquake |
| TSC-2018 | Turkiye Seismic Code-2018 |
| VFZ | Varto Fault Zone |
Appendix A
This appendix summarizes the key architectural and training parameters of the Artificial Neural Network (ANN) model used in this study. Detailed implementation code and reproducible scoring routines are provided separately in Supplementary Code S2.
- Network type: feed-forward backpropagation neural network.
- Training algorithm: Levenberg–Marquardt (trainlm).
- Activation function: hyperbolic tangent sigmoid (tansig).
- Hidden layers: 15.
- Dataset division: 85% training, 15% testing.
- Performance metric: regression coefficient (R).
This summary is provided to support methodological transparency while avoiding redundancy with the Supplementary Materials.
References
- Haub, C. 2010 World Population Data Sheet; Population Reference Bureau: Washington, DC, USA, 2010. [Google Scholar]
- Hegarty, S. The World Population Has Reached 8 Billion: What Are the 5th, 6th, and 7th Billionth Babies Doing Today? Available online: https://www.bbc.com/turkce/articles/c3g5xv3714wo (accessed on 25 November 2022).
- AFAD. Mitigation of Non-Structural Risks Against Earthquakes (Depreme Karşı Yapısal Olmayan Risklerin Azaltılması); Kadıoğlu, M., Ed.; Disaster and Emergency Management Presidency: Ankara, Türkiye, 2011. [Google Scholar]
- Regulation on Buildings in Earthquake Zones. Available online: https://www.resmigazete.gov.tr/eskiler/2007/03/20070306-3.htm (accessed on 3 March 2023).
- EMPI. Earthquake Master Plan for Istanbul (İstanbul İçin Deprem Master Plan); Istanbul Metropolitan Municipality, Department of Planning and Zoning, Directorate of Ground and Earthquake Investigation (İstanbul Büyükşehir Belediyesi Planlama ve İmar Dairesi Zemin ve Deprem İnceleme Müdürlüğü): Istanbul, Turkiye, 2003; Volume 7. [Google Scholar]
- Harirchian, E.; Lahmer, T. Improved rapid visual earthquake hazard safety evaluation of existing buildings using a type-2 fuzzy logic model. Appl. Sci. 2020, 10, 2375. [Google Scholar] [CrossRef] [Scilit]
- Kadıoğlu, M. Modern, bütünleşik afet yönetimin temel ilkeleri. Afet Zararlarını Azaltmanın Temel İlkeleri 2008, 1–34. [Google Scholar]
- Regulation on the Identification of Risky Buildings, 6306 (Riskli Bina Tespit Yönetmeliği, 6306). 2019. Available online: https://webdosya.csb.gov.tr/db/altyapi/icerikler/ek-2-ryteie-20190705155915.pdf (accessed on 3 March 2024).
- TBDY-2018; TSC-2018, Turkish Seismic Code. Ministry of Environment, Urbanisation and Climate Change: Ankara, Türkiye, 2018; p. 32.
- World Bank Group. Earthquake Damage in Türkiye Estimated to Exceed $34 Billion: World Bank Disaster Assessment Report. 2023. Available online: https://www.worldbank.org/en/news/press-release/2023/02/27/earthquake-damage-in-turkiye-estimated-to-exceed-34-billion-world-bank-disaster-assessment-report (accessed on 3 March 2024).
- UDSEP. Ulusal Deprem Stratejisi ve Eylem Planı; Afet ve Acil Durum Yönetimi Başkanlığı Deprem Dairesi Başkanlığı: Ankara, Türkiye, 2011. Available online: https://deprem.afad.gov.tr/icerik?id=10&menuId=100 (accessed on 10 November 2023).
- Cummins, J.D.; Mahul, O. Catastrophe Risk Financing in Developing Countries, Principles for Public Intervention; The World Bank: Washington, DC, USA, 2009; p. 299. [Google Scholar]
- TDTH. Türkiye Deprem Tehlike Haritası; AFAD: Ankara, Türkiye, 2018. [Google Scholar]
- Calvi, G.M.; Pinho, R.; Magenes, G.; Bommer, J.J.; Restrepo-Vélez, L.F.; Crowley, H. Development of seismic vulnerability assessment methodologies over the past 30 years. ISET J. Earthq. Technol. 2006, 43, 75–104. [Google Scholar] [CrossRef] [Scilit]
- Colombi, M.; Borzi, B.; Crowley, H.; Onida, M.; Meroni, F.; Pinho, R. Deriving vulnerability curves using Italian earthquake damage data. Bull. Earthq. Eng. 2008, 6, 485–504. [Google Scholar] [CrossRef] [Scilit]
- Lagomarsino, S.; Giovinazzi, S. Macroseismic and mechanical models for the vulnerability and damage assessment of current buildings. Bull. Earthq. Eng. 2006, 4, 415–443. [Google Scholar] [CrossRef] [Scilit]
- Kızılkaya, Ş. FEMA 154 Rapid Visual Screening: Comparative Evaluation and Application of Canadian Seismic Screening and Japanese Seismic Index Methods. Master’s Thesis, Istanbul Technical University, Istanbul, Türkiye, 2018. [Google Scholar]
- Demirbaş, N.; Şahin, H.; Durucan, C. Hızlı değerlendirme yöntemlerinin performanslarının depremde hasar görmüş binalar kullanılarak değerlendirilmesi Evaluating the performances of rapid assessment methods by using damaged buildings in earthquake. Pamukkale Üniversitesi Mühendislik Bilim. Derg. 2022, 28, 389–400. [Google Scholar] [CrossRef] [Scilit]
- Altindal, A.; Askan, A. Traditional seismic hazard analyses underestimate hazard levels when compared to observations from the 2023 Kahramanmaras earthquakes. Commun. Earth Environ. 2024, 5, 14. [Google Scholar] [CrossRef] [Scilit]
- Ioannou, I.; Chandler, R.E.; Rossetto, T. Empirical fragility curves: The effect of uncertainty in ground motion intensity. Soil Dyn. Earthq. Eng. 2020, 129, 105908. [Google Scholar] [CrossRef] [Scilit]
- Bodenmann, L.; Baker, J.W.; Stojadinović, B. Accounting for ground-motion uncertainty in empirical seismic fragility modeling. Earthq. Spectra 2024, 40, 2456–2474. [Google Scholar] [CrossRef] [Scilit]
- Erberik, A.M. Az Ve Orta Katlı Betonarme Yapıların Hasar Görebilirliğinin Incelenmesi. TUBITAK-PROJE NO: 104M565 Ankara. 2006. Available online: https://open.metu.edu.tr/bitstream/handle/11511/50526/T1RZME9Uaz0.pdf (accessed on 10 November 2022).
- Bal, İ.E. Deprem Etkisindeki Betonarme Binaların Göçme Riskinin Hızlı Değerlendirme Yöntemleri Ile Belirlenmesi. Master’s Thesis, Fen Bilimleri Enstitüsü, Ankara, Türkiye, 2005. [Google Scholar]
- Fikri, R.; Ingham, J. Seismic response and aftershock fragility curves for Non-ductile Mid-rise buildings comprised of reinforced concrete frame with masonry infill. Structures 2022, 45, 1688–1700. [Google Scholar] [CrossRef] [Scilit]
- Sucuoğlu, H. Kentsel yapı stoklarında deprem risklerinin sokaktan tarama yöntemi ile belirlenmesi. Altıncı Ulus. Deprem Mühendisliği Konf. İstanbul 2007, 267, 284. [Google Scholar]
- Golnaraghi, S.; Zangenehmadar, Z.; Moselhi, O.; Alkass, S. Application of artificial neural network(s) in predicting formwork labour productivity. Adv. Civ. Eng. 2019, 2019, 5972620. [Google Scholar] [CrossRef] [Scilit]
- Kubo, H.; Naoi, M.; Kano, M. Recent advances in earthquake seismology using machine learning. Earth Planets Space 2024, 76, 36. [Google Scholar] [CrossRef] [Scilit]
- Hu, S.; Guo, T.; Alam, M.S.; Koetaka, Y.; Ghafoori, E.; Karavasilis, T.L. Machine learning in earthquake engineering: A review on recent progress and future trends in seismic performance evaluation and design. Eng. Struct. 2025, 340, 120721. [Google Scholar] [CrossRef] [Scilit]
- Chen, W.; Zhang, L. Building vulnerability assessment in seismic areas using ensemble learning: A Nepal case study. J. Clean. Prod. 2022, 350, 131418. [Google Scholar] [CrossRef] [Scilit]
- Wang, X.; Wang, Z.; Wang, J.; Miao, P.; Dang, H.; Li, Z. Machine learning based ground motion site amplification prediction. Front. Earth Sci. 2023, 11, 1053085. [Google Scholar] [CrossRef] [Scilit]
- Uyanık, H.; Şentürk, E.; Akpınar, M.H.; Ozcelik, S.T.; Kokum, M.; Freeshah, M.; Sengur, A. A multi-input convolutional neural networks model for earthquake precursor detection based on ionospheric total electron content. Remote Sens. 2023, 15, 5690. [Google Scholar] [CrossRef] [Scilit]
- Ravichandran, N.; Bidorn, B.; Mercan, O.; Paneerselvam, B. Data-driven machine-learning-based seismic response prediction and damage classification for an unreinforced masonry building. Appl. Sci. 2025, 15, 1686. [Google Scholar] [CrossRef] [Scilit]
- Harirchian, E.; Jadhav, K.; Mohammad, K.; Aghakouchaki Hosseini, S.E.; Lahmer, T. A Comparative Study of MCDM Methods Integrated with Rapid Visual Seismic Vulnerability Assessment of Existing RC Structures. Appl. Sci. 2020, 10, 6411. [Google Scholar] [CrossRef] [Scilit]
- Yu, Q.; Wang, C.; McKenna, F.; Yu, S.X.; Taciroglu, E.; Cetiner, B.; Law, K.H. Rapid visual screening of soft-story buildings from street view images using deep learning classification. Earthq. Eng. Eng. Vib. 2020, 19, 827–838. [Google Scholar] [CrossRef] [Scilit]
- Safonova, A.; Ghazaryan, G.; Stiller, S.; Main-Knorn, M.; Nendel, C.; Ryo, M. Ten deep learning techniques to address small data problems with remote sensing. Int. J. Appl. Earth Obs. Geoinf. 2023, 125, 103569. [Google Scholar] [CrossRef] [Scilit]
- Cheng, Q.; Li, A.; Ren, H.; Chea, C.P.; Liao, W.; Xie, L. Rapid seismic-damage assessment method for buildings on a regional scale based on spectrum-compatible data augmentation and deep learning. Soil Dyn. Earthq. Eng. 2024, 178, 108504. [Google Scholar] [CrossRef] [Scilit]
- Yilmaz, Z.; Can Altunişik, A.; Taciroglu, E.; Günaydin, M.; Okur, F.Y.; Sunca, F.; Şişman, R.; Aslan, B.; Sezdirmez, T. Regional Building Damage Survey Data on the 2023 Kahramanmaraş, Türkiye, Earthquakes. ASCE OPEN Multidiscip. J. Civ. Eng. 2024, 2, 04024009. [Google Scholar] [CrossRef] [Scilit]
- SERU. Archival Material from Bingol Database Located at Website SERU; Middle East Technical University: Ankara, Türkiye, 2003; Available online: https://seru.metu.edu.tr/archives.html (accessed on 3 March 2022).
- Levenberg, K. A method for the solution of certain non-linear problems in least squares. Q. Appl. Math. 1944, 2, 164–168. [Google Scholar] [CrossRef] [Scilit]
- Marquardt, D.W. An Algorithm for Least-Squares Estimation of Nonlinear Parameters. J. Soc. Ind. Appl. Math. 1963, 11, 431–441. [Google Scholar] [CrossRef] [Scilit]
- Hagan, M.T.; Menhaj, M.B. Training feedforward networks with the Marquardt algorithm. IEEE Trans. Neural Netw. 1994, 5, 989–993. [Google Scholar] [CrossRef] [Scilit]
- Rapid Visual Screening of Buildings for Potential Seismic Hazards: Supporting Documentation; Government Printing Office: Ankara, Türkiye, 2015; Volume FEMA_P-155, p. 0160926750.
- Rapid Visual Screening of Buildings for Potential Seismic Hazards: A Handbook; Government Printing Office: Ankara, Türkiye, 2017; Volume FEMA P-154, p. 0160941504.
- Jain, S.K.; Mitra, K.; Kumar, M.; Shah, M. A proposed rapid visual screening procedure for seismic evaluation of RC-frame buildings in India. Earthq. Spectra 2010, 26, 709–729. [Google Scholar] [CrossRef] [Scilit]

Disclaimer/Publisher’s Note: The statements, opinions and data contained in all publications are solely those of the individual author(s) and contributor(s) and not of MDPI and/or the editor(s). MDPI and/or the editor(s) disclaim responsibility for any injury to people or property resulting from any ideas, methods, instructions or products referred to in the content. |
© 2026 by the authors. Licensee MDPI, Basel, Switzerland. This article is an open access article distributed under the terms and conditions of the Creative Commons Attribution (CC BY) license.