


Abstract
Against the backdrop of rapid urbanization and climate change, energy burden inequity arises between existing and new residential buildings due to generational differences in building envelopes. This study develops a demand-side energy burden equity assessment framework based on energy simulations of typical existing and new apartments in representative cities across China’s five major climate zones. The framework integrates multi-climate conditions, long-term evolution under different Shared Socioeconomic Pathways, and adaptable retrofit implications. Results indicate that demand-side energy burden inequity is widespread but structurally heterogeneous across climate zones, with the largest disparity observed in heating-dominated regions (up to 95.69 kWh/m2 in Harbin). Under future warming, three scaling pathways emerge: convergence in heating-dominated regions (up to −27%), divergence in cooling-dominated and mixed regions (up to +382%), and offsetting effects driven by heating–cooling structural shifts in cold regions (up to −5%). Retrofit analysis shows that combined envelope upgrades achieve substantial inequity reduction (88–152%), though with diminishing marginal returns, while single targeted measures already yield high benefits in cooling-dominated and mild regions (74% and 83%, respectively). The findings provide differentiated and forward-looking evidence to support equity-oriented interventions in urban residential retrofitting and policy design.
1. Introduction
Against the backdrop of the urban “dual-carbon” transition and rising climate risks [1], the global share of households equipped with residential air conditioning is nevertheless projected to increase from 27% to 41% [2]. Energy consumption during the operational phase of residential buildings is not only critical to the achievement of emission reduction targets, but also directly affects households’ ability to attain basic thermal comfort under heating and cooling conditions, as well as the associated cost burdens [3]. With ongoing warming trends and changes in the frequency and intensity of extreme heat and cold events, the seasonal structure and peak intensity of residential cooling and heating demand are likely to undergo sustained adjustments. As a result, systematic differences may emerge in the energy use and electricity demand required by different dwellings to maintain comparable indoor thermal environment targets [4,5]. Consequently, building operational energy use increasingly exhibits an intertwined “technology–livelihood–equity” dimension. When certain households are required to bear persistently higher energy demand because they reside in lower-performance dwellings, energy consumption can no longer be interpreted solely as the outcome of individual choice, but rather as a form of structural inequality jointly shaped by housing conditions and climate exposure.
Energy justice and related studies often approach the issue from the perspective of distributive justice, examining whether energy costs and risks are equitably distributed across different social groups [6]. Within this literature, “energy burden” is classically defined as the pressure of household energy expenditures relative to income (e.g., the share of energy spending in household income), and is frequently linked to issues such as energy poverty and vulnerability [7]. However, in the absence of micro-level data on household income and energy expenditures, directly assessing equity in the traditional sense of energy burden faces substantial practical constraints [8]. Moreover, while affordability metrics based on “expenditure-to-income” ratios carry clear economic relevance, they are, in practice, intertwined with income levels, energy prices, subsidy schemes, and behavioral adaptations. These interacting factors may either amplify or attenuate observed inequities in actual energy burdens, thereby complicating the interpretation of fairness outcomes [9].
Meanwhile, building energy demand is not determined solely by income and occupant behavior [10,11]. Under given thermal comfort targets and comparable usage requirements, physical attributes—including building envelope performance, infiltration and ventilation rates, and system efficiency—jointly determine the energy demand required for residential buildings to obtain equivalent energy services [12,13]. Yu et al. [14] measured the U-values of typical residential walls in northern China and found pronounced seasonal fluctuations that significantly affect indoor energy consumption. Using cities in southern China as case studies, Zhang et al. [15] demonstrated that window performance and infiltration rates are critical factors influencing building energy use. In addition, the role of local climatic conditions cannot be overlooked [16,17]. Chen et al. [18] compared the energy performance of apartment buildings across China’s five major climate zones and highlighted the importance of explicitly accounting for climatic factors. Wang et al. [19] showed that climate change exerts differentiated impacts on residential heating and cooling energy demand across five climate zones in Australia. Similarly, Zou et al. [20] projected the life-cycle energy performance of residential buildings in different climate zones in China, identifying three distinct trends in residential energy demand. These studies suggest that while energy burden inequity research grounded in economic perspectives is effective in identifying high-risk groups and spatial distributions, it is equally important to disentangle the respective contributions of building performance disparities and climate exposure to observed differences in energy burdens.
The stock of new and existing urban residential buildings provides a representative empirical setting for examining this issue. In China, due to the rapid pace of urbanization and the phased characteristics of housing system reforms, the coexistence of new and old residential communities across different climate zones is widespread [21]. Residential buildings constructed in different periods exhibit substantial differences in energy efficiency standards, material systems, and construction practices, which are primarily manifested as generational gaps in the thermal and airtightness performance of building envelopes, including external walls, roofs, and windows [22,23]. Early-generation residential buildings were typically characterized by poorly insulated envelopes, single-glazed windows, and low airtightness. With the progressive implementation of climate-zone-specific energy efficiency standards and retrofit policies, external wall and roof insulation, low-thermal-transmittance windows, and more efficient building systems have gradually become mainstream, leading to intergenerational improvements in envelope thermal properties and infiltration control. Han et al. [24] reviewed the evolution of energy efficiency codes for buildings in China. Deng et al. [25] demonstrated that, as a consequence of these disparities, households residing in older dwellings within the same city often require higher heating or cooling energy consumption to achieve comparable indoor thermal conditions when exposed to similar climatic conditions and comfort requirements.
The resulting demand-side inequity exhibits a distinctly structural nature: it is not merely attributable to individual preferences or short-term behavioral choices, but is primarily rooted in inherent disparities in the physical performance of residential buildings. Moreover, residents of older residential communities generally have lower income levels, more limited housing choice flexibility, and weaker adaptive capacity than the urban average. Consequently, they face heightened social vulnerability in terms of both energy expenditure pressures and exposure to climate-related risks [26]. Accordingly, the renewal and retrofit of aging residential communities has become a key policy instrument for improving living quality, reducing building energy consumption, and enhancing urban resilience [22]. Ma et al. [27] further emphasized that the benefits of retrofit strategies vary substantially across different climate zones, underscoring the need for climate-sensitive and differentiated retrofit approaches.
In summary, while substantial bodies of research have been developed in both the fields of “energy burden” and “building energy simulation,” important gaps remain in explaining and quantifying the evolution of energy burden inequity between new and existing urban residential buildings, as well as the effectiveness of potential interventions. There is a clear need for an analytical framework that centers on intra-urban comparisons between new and old housing stocks, while simultaneously accounting for heterogeneous climate-zone contexts and future scenarios. Such a framework is essential for generating more robust, mechanism-based evidence and for translating analytical insights into adaptable and climate-sensitive retrofit recommendations.
Therefore, from an engineering perspective, this study identifies a form of inequity with a clearly defined mechanistic basis—demand-side energy burden inequity. Specifically, it refers to the systematic differences in electricity demand required by different residential buildings to meet identical thermal comfort requirements under standardized usage patterns within the same climate zone. By focusing on energy service demand shaped by the intergenerational evolution of envelope construction practices and climatic characteristics, this concept provides interpretable and reproducible engineering evidence for understanding the formation mechanisms of energy burden inequity. At the same time, it establishes a technical foundation for designing equity-oriented intervention strategies that leverage building retrofitting as a primary policy instrument.
Building on the objectives outlined above, this study addresses the following research questions: (1) Under current climatic conditions, what demand-side energy burden inequities characterize existing and new apartment buildings within China’s different climate zones, with respect to cooling, heating, and combined thermal energy demand? (2) Under future socioeconomic development pathways, will such inequities be systematically amplified or attenuated over time? (3) How do different retrofit strategies for existing residential buildings across climate zones mediate the relationship between equity gains and energy-saving benefits?
To address these questions, this study selects representative cities within each of China’s five major climate zones. For each city, energy simulation models are developed for empirically grounded and comparable pairs of existing and newly constructed residential buildings.
The main contributions of this study are threefold:
- (1)
- It proposes and applies a demand-side energy burden inequity assessment framework that explicitly accounts for multi–climate-zone contexts.
- (2)
- It incorporates future climate scenarios to quantify the long-term evolution and scaling effects of energy burden inequity.
- (3)
- It evaluates retrofit strategies for existing apartment buildings across different climate zones from a dual perspective of energy savings and equity gains.
In addition, this study provides a replicable analytical framework for assessing energy burden inequity between new and existing urban residential buildings. It emphasizes that equity-oriented residential retrofitting should account for the structural shifts in the sources of inequity under future climate change, thereby offering differentiated and forward-looking evidence to support policy makers and stakeholders in the context of urban renewal.
2. Methods
The research framework is illustrated in Figure 1. Five representative cities across China’s five major climate zones are selected, with one existing and one newly constructed apartment building in each city, resulting in ten EnergyPlus simulation models. EnergyPlus (v24.2.0) is an open-source building energy simulation engine developed by the U.S. Department of Energy and is widely used for building energy assessment [28]. Envelope thermal parameters are defined based on field surveys and relevant building codes, while standardized occupancy and usage patterns are applied to isolate the effects of building physical performance and climate. Typical Meteorological Year (TMY) data, together with mid- and long-term future weather datasets under three socioeconomic development pathways, are used for forward-looking assessment. Electricity consumption for cooling, heating, and combined heating–cooling is calculated under both TMY and future climate scenarios, with the consumption difference between new and existing apartments (ΔE) serving as a quantitative indicator of demand-side energy burden inequity. Additional metrics are then constructed to characterize inequity scaling under future scenarios. Finally, three retrofit strategies for existing apartments are evaluated in terms of energy-saving potential and inequity reduction, from which climate-zone-specific insights for aging apartment retrofitting are derived.
Figure 1.
Methodology framework for this study.
2.1. TMY and Future Climate Data Acquisition
According to the national standard Code for Thermal Design of Civil Buildings (GB 50176–2016) [29], China is divided into five climate zones—Severe Cold (SC), Cold (C), Hot Summer and Cold Winter (HSCW), Hot Summer and Warm Winter (HSWW), and Mild (M)—to align regional climatic characteristics with building thermal design requirements. Based on climatic representativeness, one typical city is selected from each climate zone: Harbin, Beijing, Shanghai, Guangzhou, and Kunming (Figure 2).
Figure 2.
Thermal design climate zones of buildings in China and selected cities.
Using meteorological data generated within a unified temporal window and from a single data platform helps reduce systematic biases arising from differences in data sources and processing methods. Current climate data for the five selected cities are obtained from the open-access climate data platform Climate.onebuilding.org [30]. This platform provides harmonized weather datasets derived from multiple observational and reanalysis sources, including EnergyPlus-ready EPW files, and is widely used in building energy and thermal environment studies through products such as Typical Meteorological Year (TMY) datasets.
The TMY was generated by selecting representative months from the multi-year weather record to preserve typical climatic characteristics, including temperature variability and seasonal patterns. TMY weather data for five representative cities were downloaded, covering meteorological records from 2009 to 2023, providing a baseline for the generation of future climate scenarios and for characterizing recent cooling and heating demand across China’s different climate zones. Based on these datasets, we calculated the annual mean air temperature for each city together with the standard error of the mean (SEM). The resulting annual mean (±SEM) air temperatures are 5.32 ± 0.17 °C for Harbin, 13.22 ± 0.13 °C for Beijing, 17.79 ± 0.10 °C for Shanghai, 23.15 ± 0.07 °C for Guangzhou, and 15.98 ± 0.06 °C for Kunming, indicating clear climatic differentiation among the selected cities.
The World Climate Research Programmer (WCRP) Working Group on Coupled Modelling (WGCM) oversees the sixth phase of the Coupled Model Intercomparison Project (CMIP6) [31]. A total of 33 institutions worldwide have contributed more than 70 Global Climate Models (GCMs) to this project. The BCC-CSM2-MR model [32] is the medium-resolution (MR) version of the Climate System Model (CSM) developed by the Beijing Climate Center (BCC). Its simulations for the period 1850–2005 exhibit a correlation coefficient of 0.86 with observational data [33]. The model provides projected meteorological data for the period 2015–2100 on a global grid with a spatial resolution of 160 (latitude) × 320 (longitude).
To investigate climate impacts as well as mitigation and adaptation strategies, Shared Socioeconomic Pathways (SSPs) have been developed to integrate future climatic and societal changes [34]. These pathways serve as successors to the Representative Concentration Pathways (RCPs). SSPs are denoted as SSPx–y, where x represents the underlying socioeconomic development trajectory and y corresponds to the approximate level of radiative forcing (in W·m−2) reached by 2100 under that pathway [35]. In this study, experiments were conducted under SSP1-2.6 (low emissions), SSP2-4.5 (medium emissions), and SSP3-7.0 (high emissions) using the BCC-CSM2-MR model, building upon the TMY datasets described above [33]. These three scenarios were selected to represent low, intermediate, and high emission pathways, forming a coherent gradient of future climate conditions. Specifically, SSP1-2.6 reflects a strong mitigation and sustainable development trajectory consistent with China’s long-term climate targets, SSP2-4.5 represents a middle-of-the-road pathway aligned with the continuation of current policies, and SSP3-7.0 captures a relatively unfavorable but plausible future characterized by limited mitigation efforts. Together, they enable a systematic comparison of building cooling and heating demand across a policy-relevant range of future climate scenarios.
For each selected city and SSP scenario, climate data for 2050 and 2080 were extracted to represent mid-term and long-term future conditions, respectively, consistent with common practice in climate and building energy studies [36]. These two time horizons capture both intermediate impacts relevant to planning and longer-term effects driven by cumulative greenhouse gas emissions, while maintaining computational efficiency and clarity of interpretation. Future weather files were generated using the Future Weather Generator [37].
2.2. Case Studies
In China, due to the rapid pace of urbanization and the phased nature of housing system reforms, the coexistence of new and old residential communities across different climate zones is widespread [38]. A large share of early-constructed residential buildings is characterized by deteriorated envelopes, façade degradation, declining window performance, and insufficient airtightness, and thus constitutes a substantial component of the current urban residential building stock.
One of the primary objectives of this study is to quantify demand-side energy burden inequity between new and existing apartment buildings arising from differences in envelope parameters and climate change. Accordingly, the spatial variability between new and old dwellings needs to be controlled. However, relying on a single representative sample to characterize intergenerational differences may overlook real-world socioeconomic and residential contexts [36]. To balance experimental controllability and realism, the cases of new and existing apartments in the five selected cities are chosen from real and comparable apartments layouts.
Given that living rooms and bedrooms constitute the primary spaces for heating and cooling, comparable building forms, numbers of bedrooms, layout configurations of bedrooms and living rooms, and building orientations are used as screening criteria for both new and existing apartments. Specifically, residential buildings constructed prior to the 1990s are defined as existing (older) housing cases. For newly constructed buildings, the national standard GB 55015-2021 [39] has replaced multiple previous codes and provides detailed specifications for envelope thermal parameters across China’s climate zones; therefore, residential buildings constructed after 2021 are considered as new housing cases in this study. Figure 3 presents the ten apartment layout cases examined in this study. All models are developed in Rhino 7 (a commonly used architectural geometric modeling software [40]) based on real-world dimensions, with detailed parameters and descriptions provided in Appendix A.1.
Figure 3.
Floor plans of selected old and new apartment buildings in the five representative cities.
The thermal parameters of building envelopes for both existing and new apartment buildings are determined based on a synthesis of previous studies, field surveys, and relevant building codes. This study focuses on key parameters including the thermal transmittance of opaque walls (U_wall), the thermal transmittance of external windows (U_win), and the solar heat gain coefficient (SHGC), as these indicators directly affect residential energy demand under given thermal comfort targets.
It should be noted that in the General Code for Energy Efficiency and Renewable Energy Application in Buildings (GB 55015-2021), certain envelope performance limits vary with geometric characteristics such as the building shape factor (surface-to-volume ratio) and window-to-wall ratio. Accordingly, when defining the parameters of newly constructed apartments cases in each climate zone, the values of U_wall, U_win, and SHGC are determined by jointly considering the actual building geometry and the corresponding provisions of the code.
GB 55015-2021 does not specify SHGC limits for transparent envelope components in the severe cold zone. This is because building energy use in this zone is dominated by space heating, and winter solar heat gains are beneficial for energy savings; imposing mandatory SHGC limits could therefore undermine passive solar heating potential. Consequently, the SHGC value for new residential buildings in the severe cold zone is set to be consistent with that of the cold zone. Detailed parameter values and their data sources are provided in Table 1.
Table 1.
Thermal design parameters of existing and new apartments under different climate zones.
To attribute differences in energy demand required to maintain thermal comfort—and the associated potential energy burden—primarily to building physical characteristics, unified occupancy, usage patterns, and operational schedules are applied to both existing and new residential buildings [48]. According to GB 55015-2021, occupancy density, lighting power density, and design operation schedules for residential buildings are consistently specified across climate zones, as illustrated in Figure 4. The per-capita floor area is set to 25 m2/person, the lighting power density to 5 W/m2, and the equipment power density to 3.8 W/m2.
Figure 4.
Occupancy, lighting, and equipment operation schedules defined in accordance with the standard.
It should be noted that air-conditioning operation modes differ across climate zones. Specifically, the Severe cold I-B and Cold II-B zones share the same operation mode, while the Hot summer–cold winter III-A, Hot summer–warm winter IV-B, and Mild V-A zones adopt another common mode. The corresponding trigger conditions and schedules are summarized in Table 2. Cooling and heating setpoint temperatures are set to 26 °C and 18 °C, respectively.
Table 2.
Cooling and heating HVAC system activation schedules for different climate zones defined according to the standard.
In addition, the indoor ventilation rate is set to 0.5 h−1 in severe cold and cold regions, and to 1.0 h−1 in hot summer–cold winter, hot summer–warm winter, and mild regions. For air infiltration, considering the relatively poor airtightness of windows and doors in early-constructed residential buildings [49], the infiltration rate is set to 0.0006 m3/(s·m2) for existing apartments and 0.0003 m3/(s·m2) for newly constructed apartments. For existing apartments after envelope retrofitting, the infiltration rate is assumed to be identical to that of new buildings.
2.3. Energy Simulation Model Setup
EnergyPlus is an open-source building energy simulation engine developed by the U.S. Department of Energy and is widely used for building energy and indoor thermal environment assessment [28]. It simulates heating and cooling energy demand by solving heat and mass balance equations at hourly/sub-hourly time steps and by integrating envelope heat transfer, HVAC system operation, internal heat gains, and weather boundary conditions within a unified simulation framework. Rhinoceros, a commonly used architectural geometric modeling software, is adopted in this study for 1:1 geometric and parametric modeling of the apartment cases. Ladybug Tools is a plugin for the parametric modeling platform Grasshopper that can invoke EnergyPlus and provides a more user-friendly and visual workflow and interface for energy modeling.
As illustrated by the “Simulation” component in the study framework (Figure 1), indoor thermal environment simulations in this study are conducted using EnergyPlus (v24.2.0) via Ladybug Tools (v1.9.0) within the Grasshopper environment of Rhinoceros (v7). Building models are configured based on the parameters specified in Section 2.2, with geometric information modeled at a 1:1 scale according to real-world dimensions, and are simulated using the weather files described in Section 2.1. The most comprehensive solar radiation algorithm is used, accounting for direct and reflected solar gains and multiple indoor interreflections. This approach enables a realistic representation of indoor–outdoor radiative interactions. To represent typical mid-floor apartment units, both roof and floor are modeled as adiabatic surfaces. Space conditioning is simulated using an ideal air-conditioning system, and electricity consumption calculations are described in the following section. The simulation time step is set to 6.
In accordance with the research objectives, three groups of simulation models are established. The first group simulates existing and new apartment buildings in the five selected cities under current climatic conditions. The second group conducts prospective simulations for both existing and new apartment buildings under four socioeconomic development pathways. The third group simulates existing apartment buildings in the five cities after envelope retrofit interventions. Specifically, three retrofit modes are designed. The first mode involves external wall refurbishment and insulation upgrading, in which the internal and external wall parameters of existing buildings are adjusted to meet new-building standards. The second mode focuses on external window replacement and airtightness improvement, with window-related parameters of existing buildings set to new-building standards. The third mode considers the simultaneous implementation of both retrofit strategies.
In addition, to examine the comparability between the selected existing and new apartment cases across different climate zones and to verify that baseline-year energy-burden disparities are primarily driven by intergenerational differences in envelope thermal performance rather than case-selection heterogeneity, we conduct a comparative analysis of the full-year hourly heating and cooling electricity demand series. Under unified envelope thermal parameters and standardized usage schedules, the paired hourly demand values of existing and new apartments are compared. Consistency is assessed using Pearson’s correlation coefficient (r), together with the root mean square error (RMSE) and mean absolute error (MAE), as presented in Appendix A.2 (Figure A1). Specifically, Pearson’s r evaluates the linear co-variation of paired hourly demand values (i.e., the consistency of hourly demand patterns), whereas RMSE and MAE quantify discrepancies in load magnitude.
These findings support the adequacy of the selected cases in controlling spatial heterogeneity and indicate that the empirically grounded apartment samples provide a robust basis for subsequent analyses of envelope-performance-driven disparities and their implications for energy-burden equity.
2.4. Energy Burden Inequity Assessment Method
An assessment framework is developed to address the following key questions: (1) Under current climatic conditions, what demand-side energy burden inequities characterize existing and new apartment buildings within China’s different climate zones, with respect to cooling, heating, and combined thermal energy demand? (2) Under future socioeconomic development pathways, will such inequities be systematically amplified or attenuated over time? (3) How do different retrofit strategies for existing apartment buildings across climate zones mediate the relationship between equity gains and energy-saving benefits?
Heating Degree Days (HDD) and Cooling Degree Days (CDD) are used to characterize changes in outdoor air temperature under current and future climate conditions. Using Ladybug Tools, the positive temperature differences between the hourly outdoor air temperature and predefined base temperatures are accumulated over the full year (8760 h) to obtain heating degree hours and cooling degree hours, which are subsequently converted into degree-day values. As shown in Equations (1) and (2), denotes the total number of hours in a year (8760), represents the outdoor air temperature (°C) at hour , is the heating base temperature set to 18 °C, and is the cooling base temperature set to 26 °C.
The unit-area electricity consumption for space heating and cooling in apartments is used as a proxy indicator for demand-side energy burden and is calculated following the methodology specified in GB 55015-2021. Energy consumption outputs are generated directly from EnergyPlus simulations. It should be noted that, for residential buildings, heating energy consumption is accounted for over the entire year, whereas cooling energy consumption is only counted for periods when the daily mean outdoor air temperature exceeds 26 °C. In addition, the scope of energy consumption accounting varies across climate zones. Specifically, only heating energy consumption is included for the Severe cold zone, Cold zone A, and Mild zone A; both heating and cooling energy consumption are included for Cold zone B, the Hot summer–cold winter zone, and Hot summer–warm winter zone A; and only cooling energy consumption is included for Hot summer–warm winter zone B.
For the selected cities, the calculation of electricity consumption (kWh/m2) also varies across climate zones and is normalized on a unit floor area basis. The total electricity consumption, , is defined as the sum of cooling electricity consumption and heating electricity consumption . For Harbin and Beijing, where space heating dominates annual energy use, the annual heating electricity consumption is calculated as shown in Equation (3). Where denotes the cumulative annual heating energy consumption (kWh); A is the total building floor area (m2); represents the overall efficiency of the heating system with a coal-fired boiler as the heat source, set to 0.81; is the lower heating value of standard coal, taken as 8.14 kWh/kgce; and is the average coal consumption for power generation, set to 0.330 kgce/kWh.
For Shanghai and Kunming, the annual heating electricity consumption is calculated as shown in Equation (4). Where denotes the cumulative annual heating energy consumption (kWh); A represents the total building floor area (m2); and is the overall coefficient of performance of the heating system, set to 2.6.
The annual cooling electricity consumption is calculated as shown in Equation (5). Where denotes the cumulative annual cooling energy consumption (kWh); A represents the total building floor area (m2); and is the overall coefficient of performance of the cooling system, set to 3.6.
Demand-side energy burden inequity is quantified by the difference in electricity consumption between new and existing residential buildings, denoted as , as expressed in Equation (6).
The rate of change in energy burden inequity, denoted as , is used to assess the impact of climate change and future socioeconomic pathways, as expressed in Equation (7). Where represents the electricity consumption difference between new and existing buildings under future socioeconomic pathways, and represents the corresponding difference under current Typical Meteorological Year (TMY) conditions.
The effects of three retrofit strategies on energy burden inequity are also evaluated in this study. The inequity reduction rate, denoted as , is defined in Equation (8) to quantify the extent to which energy burden inequity is reduced through retrofitting. Where represents the electricity consumption difference after retrofit, and denotes the baseline difference under current conditions.
3. Results
3.1. HDD and CDD Under TMY and Future Scenarios
Clarifying the climatic background is essential for subsequent analyses of energy burden and its inequity. Table 3 presents the Heating Degree Days (HDD), Cooling Degree Days (CDD), and their relative changes for each city under current (TMY) and future climate scenarios. Under current climatic conditions, the five cities exhibit clear gradients associated with latitude and climate zone. Harbin shows the highest heating demand (HDD = 5171.7, CDD = 58.2), while Beijing remains heating-dominated (HDD = 2821.1, CDD = 208.0). Shanghai exhibits substantial demand for both heating and cooling, with cooling slightly prevailing (HDD = 1431.9, CDD = 261.1). Guangzhou is strongly cooling-dominated (HDD = 361.9, CDD = 479.2). Kunming shows a generally mild thermal demand profile, with very low cooling demand under current conditions (HDD = 1221.2, CDD = 14.0).
Table 3.
HDD and CDD for the five cities under baseline and future climate scenarios, and their percentage changes relative to TMY.
Under future climate scenarios (2050 and 2080), all five cities exhibit a consistent pattern of decreasing HDD and increasing CDD, indicating that climate warming will systematically weaken heating demand while intensifying cooling demand, with the trend becoming more pronounced toward the end of the century. The reduction in heating-related HDD ranges from approximately −8% to −51%. The most pronounced declines occur in Guangzhou and Shanghai, reaching −51.45% and −33.17%, respectively, under the SSP3-7.0 scenario in 2080. Beijing and Harbin show reductions of −30.07% and −27.02%, respectively, while Kunming experiences a decrease of −33.73%. Meanwhile, cooling demand increases across all cities. Due to its low baseline, Harbin exhibits a relative CDD increase of up to +348.95% under SSP3-7.0 in 2080. Beijing and Shanghai show increases of +181.62% and +140.31%, respectively, while Guangzhou continues to rise from an already high baseline, reaching approximately +112.58% under the same scenario. Kunming presents the largest relative increase in CDD, reaching +548.72% under the high-emission end-of-century scenario, primarily driven by its extremely low baseline cooling demand under current conditions.
3.2. Energy Burden Inequity Under TMY Conditions
Simulation results under current typical climatic conditions indicate that, given standardized indoor thermal comfort targets and usage patterns, existing apartment buildings in all five representative cities generally require higher electricity consumption to maintain equivalent levels of energy services (Figure 5). Differences between existing and new apartments are observed in unit-area heating, cooling, and total electricity consumption (Table 4), reflecting demand-side energy burden inequity arising from intergenerational disparities in envelope thermal performance and airtightness.
Figure 5.
Cooling, heating, and total energy burdens of existing and new buildings in the five cities under TMY conditions.
Table 4.
Inequity in cooling, heating, and total energy burdens of existing and new buildings in the five cities under TMY conditions.
Specifically, in the severe cold climate zone, demand-side inequity is concentrated in heating-related burdens. In Harbin, the total electricity consumption of existing apartments reaches 159.91 kWh/m2, compared with 64.22 kWh/m2 for new apartments, indicating that the energy burden of existing apartments is 2.49 times that of new ones. The total difference (ΔE) amounts to 95.69 kWh/m2, of which approximately 60% of the total electricity consumption in existing apartments can be attributed to additional heating demand arising from inferior building performance. This result indicates that under heating-dominated climatic conditions, disparities in envelope thermal performance are directly amplified into substantial energy burden inequity.
Beijing exhibits a similarly heating-dominated inequity structure. The total electricity consumption of existing apartments is 98.08 kWh/m2, compared with 37.36 kWh/m2 for new apartments, yielding a total difference of 60.72 kWh/m2. Heating accounts for the majority of this gap, with a difference of 55.29 kWh/m2, whereas the cooling-related difference is only 5.43 kWh/m2. Accordingly, the energy burden of existing apartments is 2.85 times that of new ones, and the relative disparity in heating burden (65%) is substantially higher than that for cooling (42%), confirming that inequity in cold regions is primarily driven by winter heating demand.
In the hot summer–cold winter climate zone, represented by Shanghai, the disparity between existing and new apartments exhibits a combined heating–cooling structure. Electricity consumption for heating and cooling in existing apartments is 16.62 and 20.08 kWh/m2, respectively, compared with 12.86 and 14.65 kWh/m2 in new apartments. The corresponding differences are 3.76 kWh/m2 for heating and 5.43 kWh/m2 for cooling, resulting in a total electricity consumption gap of 9.19 kWh/m2. The relative differences in heating and cooling burdens are 23% and 27%, respectively. This pattern indicates that in climates where both heating and cooling demands are significant, energy burden inequity is not concentrated in a single season but instead reflects a systematic gap in year-round energy service requirements.
For the hot summer–warm winter climate zone, the disparity between existing and new apartments in Guangzhou is entirely driven by cooling demand. The total electricity consumption of existing apartments is 37.13 kWh/m2, compared with 27.70 kWh/m2 for new apartments, yielding a total difference of 9.43 kWh/m2. No heating-related difference is observed, and the relative cooling burden disparity reaches 25%.
By contrast, the mild climate zone exhibits lower overall electricity consumption levels but still shows measurable inequity. In Kunming, the total electricity consumption of existing apartments is 8.84 kWh/m2, compared with 6.14 kWh/m2 for new apartments, resulting in a total difference of 2.70 kWh/m2. This disparity is entirely attributable to heating demand, with a relative heating burden difference of 31%.
These results indicate that energy burden inequity between new and existing apartments is both real and non-negligible. Moreover, when normalized on a unit-area basis, the composition of demand-side energy burden inequity exhibits clear climate-zone-specific patterns. In severe cold and cold climate zones, inequity is highly concentrated in heating demand, where disparities in envelope thermal performance and airtightness are directly translated into substantial additional winter energy requirements. In the hot summer–cold winter climate zone, inequity arises from the combined effects of heating and cooling, manifesting as a systematic performance gap at the annual scale. In the hot summer–warm winter climate zone, inequity is entirely driven by cooling demand. In contrast, in the mild climate zone, although overall energy demand levels are low, heating-related burden disparities induced by differences in building performance persist, representing inequity under low-demand conditions.
3.3. Evolution of Energy Burden Inequity Under Future Scenarios
To examine how energy burden inequity evolves under different socioeconomic development pathways, Figure 6 presents the changes in unit-area electricity consumption for cooling, heating, and total energy use of existing and new apartments in the five representative cities across future climate scenarios. The corresponding numerical values are provided in Appendix B.1.
Figure 6.
Cooling, heating, and total energy burdens of the five cities under future climate scenarios.
Across different Shared Socioeconomic Pathways, both existing and new apartments in the severe cold zone (Harbin) exhibit pronounced declines in heating demand. The total electricity consumption of existing apartments decreases from 159.91 kWh/m2 under TMY conditions to 113.60 kWh/m2, while that of new apartments declines from 64.22 to 43.94 kWh/m2, indicating that future climate change reduces overall energy burden primarily by lowering heating intensity. A similar pattern is observed in the mild zone (Kunming), where heating remains dominant and total energy demand decreases overall. The total electricity consumption of existing apartments declines from 8.84 to 5.51 kWh/m2, and that of new apartments decreases from 6.14 to 3.52 kWh/m2, suggesting that future warming mainly reduces weak heating demand in mild climates.
In the cold zone (Beijing), the heating–cooling structure undergoes a pronounced redistribution. For existing apartments, cooling electricity consumption increases from 12.90 to 40.79 kWh/m2, while heating consumption decreases from 85.18 to 56.09 kWh/m2, resulting in a nearly stable total demand (from 98.08 to 96.88 kWh/m2). New apartments exhibit a similar pattern, with rising cooling demand and declining heating demand, and a slight increase in total electricity consumption from 37.36 to 38.90 kWh/m2. These results indicate that in cold regions, future warming does not necessarily lead to a reduction in total energy burden, but instead drives a structural transition from heating-dominated demand toward a more balanced heating–cooling profile with an increasing contribution from cooling.
In the hot summer–cold winter zone (Shanghai), cooling growth plays a more dominant role. For existing apartments, cooling electricity consumption increases sharply from 20.08 to 79.62 kWh/m2, while heating consumption declines from 16.62 to 9.07 kWh/m2, leading to an increase in total electricity consumption from 36.69 to 88.70 kWh/m2. New apartments show a similar trend, with cooling demand rising from 14.65 to 49.58 kWh/m2 and heating demand decreasing from 12.86 to 7.09 kWh/m2, resulting in an increase in total consumption from 27.50 to 56.66 kWh/m2.
In the hot summer–warm winter zone (Guangzhou), total energy demand is entirely driven by cooling. The total electricity consumption of existing apartments increases from 37.13 to 119.83 kWh/m2, while that of new apartments rises from 27.70 to 74.38 kWh/m2, indicating a substantial escalation of cooling-related energy burden under high-emission, long-term future scenarios.
Overall, despite differences among Shared Socioeconomic Pathways, future warming induces directionally consistent but magnitude-varying adjustments in heating–cooling demand structures across climate zones. Heating-dominated regions experience declining heating demand and reduced total energy burden; cooling-dominated regions show increasing cooling demand and rising total energy burden; and regions with both heating and cooling demands undergo a rebalancing characterized by decreasing heating and increasing cooling, with total energy demand often driven upward by cooling growth. These patterns are consistent with the climatic background analysis presented in Section 3.1.
Table 5 further reveals the dynamic evolution of demand-side energy burden inequity under future scenarios by examining changes in the electricity consumption difference between existing and new apartments (ΔE). Taking the most illustrative case of SSP3-7.0 in 2080 as an example, the results show that the direction of ΔE change varies substantially across climate zones and is closely associated with the dominant type of energy service demand.
Table 5.
Inequity in cooling, heating, and total energy burdens in the five cities under future climate scenarios, and their percentage changes.
In heating-dominated regions, ΔE consistently declines under future scenarios, indicating a convergence of inequity. In Harbin, the total ΔE decreases from 95.69 kWh/m2 to 69.66 kWh/m2 (−27%), while in Kunming it decreases from 2.70 kWh/m2 to 1.99 kWh/m2 (−26%). In both cases, the change is entirely attributable to reductions in heating-related differences. These results suggest that under heating-dominated climatic conditions, climate warming compresses the additional demand amplified by envelope heat-loss disparities between new and existing buildings, thereby driving a convergence in demand-side inequity.
In contrast, in cooling-dominated or mixed heating–cooling climate zones, ΔE expands markedly, reflecting a divergence of inequity. In Guangzhou, the total ΔE increases from 9.43 kWh/m2 to 45.45 kWh/m2 (+382%), driven entirely by the growth in cooling-related differences. Similarly, in Shanghai, the total ΔE rises from 9.19 kWh/m2 to 32.03 kWh/m2 (+249%), where the increase in cooling-related differences far exceeds the reduction in heating-related differences. In these climates, cooling demand is more sensitive to high-temperature exposure and envelope performance disparities, and its rapid growth outweighs the mitigating effect of declining heating demand, thus becoming the dominant mechanism driving future inequity expansion.
Beijing exhibits a representative “offsetting” pathway of inequity evolution. With climate warming, the cooling-related difference between new and existing apartments increases from 5.43 kWh/m2 to 19.91 kWh/m2 (+267%), while the heating-related difference decreases from 55.29 kWh/m2 to 38.07 kWh/m2 (−31%). These opposing changes result in only a modest reduction in the total ΔE, from 60.72 kWh/m2 to 57.98 kWh/m2 (−5%). However, this apparent stability in total inequity does not imply an unchanged mechanism. Rather, it reflects a structural shift in the sources of inequity, with Beijing transitioning from heating-dominated disparities toward an increasing contribution from cooling-related differences. This finding indicates that even in cold climate zones, future interventions addressing demand-side inequity may need to move beyond a sole focus on heating and increasingly account for summer cooling loads through improvements in envelope insulation, window performance, and airtightness.
The results shown in Figure 6 and Table 5 demonstrate that demand-side energy burden inequity is not determined simply by the level of total energy consumption, but is strongly shaped by the interaction between climatic conditions and intergenerational differences in building performance. Future climate change does not uniformly amplify or reduce demand-side energy burden inequity across all climate zones. Instead, by reshaping the structure of heating and cooling demand, it gives rise to distinct evolutionary pathways, including convergence, divergence, and structural shift patterns. As the severity of climate change increases, these differentiated trends become increasingly pronounced.
3.4. Equity Benefits of Retrofit Measures
The results presented in the previous section further highlight the need for differentiated, equity-oriented intervention pathways across climate zones. Figure 7 summarizes the unit-area cooling, heating, and total energy burdens of existing apartments in the five selected cities under three retrofit strategies, along with the associated energy-saving rates. Detailed numerical results are provided in Appendix B.2.
Figure 7.
Cooling, heating, and total energy burdens of existing buildings in the five cities under three retrofit strategies. The horizontal axis shows maintaining the status quo and four transformation strategies.
In the severe cold zone (Harbin), wall insulation upgrades and window + airtightness improvements reduce the heating energy burden from 159.91 kWh/m2 to 119.35 and 116.22 kWh/m2, corresponding to energy-saving rates of 25% and 27%, respectively. The combined retrofit further lowers the burden to 75.50 kWh/m2, achieving an energy-saving rate of 53%. In the cold zone (Beijing), where both heating and cooling demands are present, the strongest energy-saving response is observed under the combined retrofit. The baseline total energy burden of existing apartments is 98.08 kWh/m2, which decreases to 68.28 and 72.42 kWh/m2 after wall upgrades and window + airtightness improvements, respectively (energy-saving rates of 30% and 26%). The combined retrofit further reduces the total burden to 42.66 kWh/m2, yielding a total energy-saving rate of 56%. The mild zone (Kunming) exhibits a similar pattern, where the combined retrofit reduces the total energy burden from 8.84 to 4.74 kWh/m2, corresponding to an energy-saving rate of 46%.
In the hot summer–cold winter zone (Shanghai), the baseline total energy burden is 36.69 kWh/m2. After wall upgrades, window + airtightness improvements, and the combined retrofit, the total burden decreases to 32.38, 30.84, and 26.93 kWh/m2, respectively, corresponding to energy-saving rates of 12%, 16%, and 27%. In this climate zone, window + airtightness improvements are more effective in reducing cooling demand, whereas wall upgrades have a more pronounced effect on heating demand. In the hot summer–warm winter zone (Guangzhou), where cooling dominates energy use, the baseline cooling (and total) energy burden is 37.13 kWh/m2. Wall upgrades lead to only a limited reduction (6%), while window + airtightness improvements and the combined retrofit reduce the burden to 30.17 and 28.07 kWh/m2, corresponding to energy-saving rates of 19% and 24%, respectively. This indicates that in cooling-dominated climates, improvements in window performance and airtightness constitute a key pathway for reducing cooling loads.
Overall, these results reveal clear patterns in retrofit energy-saving effectiveness. All three retrofit strategies reduce the energy burden of existing apartments, with the combined retrofit consistently achieving the largest or near-largest total energy-saving rates. However, the relative contributions of different measures vary markedly across climate zones. In heating-dominated regions, energy savings are primarily governed by envelope heat-transfer control, making wall insulation upgrades particularly effective. In cooling-dominated regions, energy demand is more sensitive to window performance and airtightness, while in mixed heating–cooling climates, both types of measures are effective but target different end uses. In addition, in absolute terms, heating-dominated regions exhibit greater energy-saving potential from retrofit interventions.
The equity outcomes exhibit trends that are broadly consistent with the energy-saving results discussed above. Table 6 evaluates the equity benefits of the three retrofit strategies from the perspective of the electricity consumption difference between new and existing apartments (ΔE), with the inequity reduction rate used to quantify the relative decrease in ΔE compared with baseline conditions. Overall, the combined retrofit achieves the highest inequity reduction rate in most cities, indicating that systematic envelope upgrades provide a general advantage in narrowing demand-side energy burden gaps between new and existing apartments buildings. However, the marginal equity gains of combined retrofits relative to single-measure interventions vary across climate zones.
Table 6.
Reduction in inequity of cooling, heating, and total energy burdens of existing buildings in the five cities under three retrofit strategies.
In heating-dominated regions, the combined retrofit delivers the most pronounced equity benefits. In the severe cold zone (Harbin), the baseline total ΔE is 95.69 kWh/m2. After wall upgrades and window + airtightness improvements, the inequity reduction rates reach 42% and 46%, respectively, while the combined retrofit further compresses the total difference to 11.28 kWh/m2, corresponding to an inequity reduction rate of 88%. In the cold zone (Beijing), the baseline total ΔE is 60.72 kWh/m2. Wall upgrades and window + airtightness improvements yield inequity reduction rates of 49% and 42%, respectively, whereas the combined retrofit reduces the total difference to 5.31 kWh/m2, achieving an inequity reduction rate of 91%. Results from both Harbin and Beijing demonstrate a clear additive effect of combined retrofits, conferring a substantial advantage in equity improvement, while single-measure interventions deliver relatively limited gains.
In regions with mixed heating and cooling demand, distinct patterns emerge. In Shanghai, window + airtightness improvements reduce the total ΔE from 9.19 to 3.33 kWh/m2, corresponding to an inequity reduction rate of 64%, already representing a relatively high equity gain, whereas wall upgrades achieve a reduction rate of 47%. The combined retrofit further compresses the difference and results in a reversal (−0.58 kWh/m2, inequity reduction rate of 106%), indicating continued equity improvement but with diminished relative gains.
Kunming also exhibits substantial equity improvement potential, albeit with a different structure. Wall upgrades alone achieve an inequity reduction rate of 83%, while window + airtightness improvements yield 71%. Under the combined retrofit, the total ΔE reverses to −1.40 kWh/m2, corresponding to an inequity reduction rate of 152%. This suggests that under low-demand conditions in the mild climate zone, single wall retrofits are sufficient to eliminate most of the inequity, whereas combined retrofits provide additional improvements with diminishing marginal equity returns.
Similarly, in the cooling-dominated zone (Guangzhou), equity improvement is entirely driven by reductions in cooling-related differences. Wall upgrades result in a relatively low inequity reduction rate of 22%, whereas window + airtightness improvements already achieve 74%. The combined retrofit further increases the inequity reduction rate to 96%. These results indicate that in cooling-dominated climates, improvements in window performance and airtightness represent the most effective pathway for equity enhancement. While combined retrofits deliver the largest overall equity gains, their marginal improvement over targeted window and airtightness upgrades is limited. This implies that under resource-constrained conditions, cooling-dominated regions may prioritize single-measure interventions focused on window replacement and airtightness enhancement.
The equity gains associated with the three retrofit strategies exhibit clear marginal-effect heterogeneity across climate zones. While combined retrofits generally achieve the largest reductions in energy burden inequity, their marginal benefits relative to single-measure interventions are limited in mild and hot summer–warm winter regions. In contrast, for inequity patterns observed in severe cold, cold, and hot summer–cold winter climates, systematic envelope upgrades are more likely to generate substantial additive equity effects.
Taken together with the preceding results, the overall trends in equity benefits align closely with those observed for energy-saving performance. This consistency suggests that developing differentiated and tiered retrofit prioritization strategies—tailored to climate-specific conditions and resource constraints—can simultaneously enhance the energy efficiency of existing apartments and reduce energy burden disparities between new and existing residential buildings.
4. Discussion
This study characterizes demand-side energy burden inequity using unit-area electricity consumption differences between new and existing residential buildings under identical thermal comfort targets and standardized usage patterns, thereby highlighting structural disparities jointly determined by housing physical performance and climate exposure. Existing residential buildings are effectively “locked into” higher energy service demands due to intergenerational gaps in envelope thermal performance, window quality, and air infiltration. The results indicate that in severe cold and cold climate zones (Harbin and Beijing), inequity is primarily driven by heating-related differences, whereas in hot summer–warm winter and hot summer–cold winter zones (Guangzhou and Shanghai), cooling-related differences dominate or increase rapidly. This implies that the energy performance disadvantages of existing housing are amplified into different seasons under different climatic contexts. Under future scenarios, these dynamics give rise to distinct long-term pathways—convergence in heating-dominated regions, divergence in cooling-dominated regions, and structural shifts in regions with mixed heating and cooling demand—as evidenced by the results presented in Table 4, Table 5 and Table 6.
In practice, such inequity rarely remains confined to engineering-level differences in energy demand. Instead, it tends to compound with the social vulnerability characteristics commonly observed in aging residential communities, including lower household income levels, higher proportions of elderly residents, limited housing choice flexibility, and reduced adaptive capacity to extreme heat and cold. When households are unable to sustain higher operational costs, the outcome is often not increased expenditure but reduced usage, which can translate into more latent yet more acute equity concerns, such as thermal comfort deprivation, elevated health risks, and declining quality of life.
Under future warming, these risks are likely to intensify. Beyond cities such as Guangzhou and Shanghai, where cooling demand is projected to increase substantially, relying solely on whether total energy consumption declines as an indicator of future equity risk may underestimate the expansion of cooling-driven inequity. It may also obscure warning signals in cities such as Beijing, where overall burdens appear relatively stable while the underlying sources of inequity shift structurally. Moreover, the divergence of inequity does not only imply higher household expenditure pressure, but may also translate into more pronounced peak electricity demand risks during heat events. When combined with mechanisms such as time-of-use electricity pricing, these dynamics can further and disproportionately transfer system-level risks and costs to residents living in lower-performance housing.
For policymakers engaged in urban renewal, our results indicate that across nearly all climate zones, combined retrofit packages generally deliver both larger energy-saving benefits and greater reductions in energy-burden inequity, albeit at the cost of higher upfront investment, greater construction disruption, and more complex coordination. More importantly, marginal benefits do not always increase in proportion to costs. Accordingly, practice should shift from pursuing “maximum building-level performance” to addressing the question of “how far retrofitting should go” to achieve appropriate equity improvements. In cities such as Guangzhou and Kunming, single-measure interventions have already demonstrated high effectiveness (e.g., prioritizing window upgrades in Guangzhou and wall insulation in Kunming), making them suitable first actions under constraints related to fiscal capacity, household affordability, or the need to rapidly cover large stocks of aging communities. In other regions, however, measures exhibit stronger additive effects, and combined retrofits may remain the preferable strategy. This analytical framework for rationally evaluating retrofit benefits is also extensible, for example to more granular retrofit options and additional combinations of strategies.
Building on this, a more policy-relevant pathway is to first identify retrofit measures with the highest marginal equity returns that can be deployed quickly, and to adopt a “single-measure first, followed by staged upgrades” approach. High cost-effectiveness measures can be prioritized to rapidly narrow the gap between new and existing housing and to reduce seasonal exposure risks in summer or winter, with subsequent deepening of retrofits contingent on funding availability and implementation conditions. Meanwhile, because energy-saving performance and equity improvements show a strong alignment in outcomes, the allocation of public subsidies, green finance, and public investment programs need not rely solely on energy savings as the single criterion; incorporating equity benefits into allocation rules can help curb the future divergence of inequity or accelerate its convergence.
Furthermore, the proposed framework can serve as a preliminary screening tool for “retrofit versus reconstruction/demolition and resettlement” decisions in urban renewal. By characterizing per-unit-area operational energy differences under standardized comfort targets and combining this information with dwelling/building floor area and local tariff structures (e.g., increasing block tariffs, time-of-use pricing, or peak–valley spreads), it becomes possible to rapidly estimate annual bill differences and longer-term operating-cost gaps over a planning horizon. This enables a coarse triage: identifying cases that should be prioritized for retrofit, versus cases that warrant a more comprehensive appraisal—incorporating the costs and benefits of demolition and resettlement, new housing provision, and major rehabilitation of the existing stock—before deciding whether to shift toward reconstruction or relocation. Notably, these differences are not constant under climate change: they may widen with warming in cooling-dominated regions but narrow in heating-dominated regions. Therefore, from a long-term perspective, reconstruction/resettlement is more likely to emerge as a key option for closer evaluation where cooling-driven gaps continue to expand; where gaps converge, the economic rationale for relocation may depend more on structural safety, functional improvements, or major maintenance needs than on operational-energy considerations alone.
This study develops an intra-urban comparative framework across multiple climate zones and future scenarios, providing mechanism-oriented evidence and transferable retrofit insights. Several limitations follow from the simplified but interpretable assumptions adopted for cross-case comparability. First, standardized occupancy schedules and an idealized air-conditioning operation are used to isolate physical drivers under consistent comfort targets; thus, the estimated operational energy gaps should be interpreted as engineering-based benchmarks rather than precise predictions, given that real households vary thermostat setpoints, operating patterns, ventilation behaviors, and equipment efficiencies. Future work will integrate field validation using smart-meter electricity data and indoor environmental monitoring, complemented by occupant surveys and (where possible) pre-/post-retrofit observations, to calibrate these assumptions. Second, demand-side inequity is quantified via electricity-consumption differences without explicitly accounting for tariff structures, subsidies, or income distributions; linking the engineering-based gaps with local pricing regimes and income scenarios would better capture economic burdens and health risks. Third, spatial heterogeneity is partially controlled by focusing on typical mid-floor units, whereas top-floor exposure, orientation, shading, and urban heat-island effects may amplify cooling inequities in real aging communities; expanding housing archetypes and urban microclimate scenarios would improve the targeting of equity-oriented interventions. Fourth, future work will incorporate more fine-grained passive and biophilic strategies (e.g., enhanced shading, green roofs, and vegetated shading elements), and will conduct tiered, combined evaluations in light of urban-renewal implementation conditions (such as climate-zone differences, building constraints, maintenance costs, and practical feasibility).
5. Conclusions
Against the backdrop of rapid urbanization and climate warming, this study develops EnergyPlus-based simulation models for paired existing and new apartment buildings in five representative Chinese cities across major climate zones (Harbin, Beijing, Shanghai, Guangzhou, and Kunming). Under current Typical Meteorological Year conditions (TMY: 2009–2023), demand-side energy burden inequity is characterized by the unit-area electricity consumption difference between new and existing apartments under standardized usage patterns. The long-term evolution of inequity is further assessed under Shared Socioeconomic Pathways (SSP1-2.6, SSP2-4.5, and SSP3-7.0) for the mid-term (2050) and long-term (2080) futures. In addition, the energy-saving and equity benefits of three retrofit strategies—wall upgrades, window + airtightness upgrades, and combined retrofits—are compared to derive adaptable, climate-sensitive retrofit recommendations.
Under current conditions, energy burden inequity is widespread within climate zones and exhibits pronounced structural heterogeneity. Heating-dominated regions show the largest inequity magnitudes: total ΔE reaches 95.69 and 60.72 kWh/m2 in Harbin and Beijing, respectively, and the burdens of existing apartments are 2.49 and 2.85 times those of new apartments. In Guangzhou, inequity is entirely cooling-driven (total ΔE = 9.43 kWh/m2; relative disparity = 25%); Shanghai exhibits a mixed heating–cooling structure (total ΔE = 9.19 kWh/m2; relative disparity = 25%); and Kunming has low overall demand but still shows heating-related inequity (total ΔE = 2.70 kWh/m2; relative disparity = 31%). These findings indicate that, under comparable comfort requirements, intergenerational gaps in envelope performance translate into seasonal additional electricity demand in climate-specific ways.
Future warming does not uniformly amplify or attenuate inequity across climate zones; instead, three long-term pathways emerge. (1) In heating-dominated regions, inequity converges as heating intensity declines: total ΔE decreases by ~27% in Harbin and ~26% in Kunming. (2) In cooling-dominated and mixed-demand regions, inequity diverges markedly: total ΔE increases by ~382% in Guangzhou and ~249% in Shanghai, primarily driven by rapid growth in cooling-related differences. (3) In cold regions, inequity follows a structural-shift pathway: total ΔE in Beijing changes only marginally (~5%), while the cooling-related difference increases by ~267%. Together, these results suggest that future equity risks may progressively shift from heating-driven disparities toward increasing exposure to cooling-driven inequity.
Retrofit assessments show that all three strategies reduce both the energy burden of existing apartments and demand-side inequity, but with clear differences in marginal returns. Combined retrofits are most effective in severe cold and cold regions, achieving inequity reduction rates of 88% and 91% in Harbin and Beijing (with energy savings of 53% and 56%, respectively). In contrast, in some cities, single-measure retrofits already offer high cost-effectiveness: wall upgrades alone reduce inequity by 83% in Kunming, while window + airtightness upgrades alone reduce inequity by 74% in Guangzhou. Accordingly, under resource-constrained urban renewal programs, it is recommended to prioritize high-marginal-benefit measures aligned with climate-dominant loads, and to adopt staged upgrades toward combined retrofits when feasible, so as to prevent further escalation of cooling-driven inequity under future warming.
Author Contributions
Conceptualization, Y.B. and J.Q.; methodology, Z.L. and H.L.; software, Z.L. and H.L.; validation, Y.B. and J.Q.; formal analysis, H.L.; investigation, Z.L.; resources, Y.B. and J.Q.; data curation, Z.L. and H.L.; writing—original draft preparation, H.L.; writing—review and editing, Z.L.; visualization, Z.L. and H.L.; supervision, Y.B. and J.Q.; project administration, Y.B. and J.Q.; funding acquisition, Y.B. and J.Q. All authors have read and agreed to the published version of the manuscript.
Funding
This research was funded by the National Natural Science Foundation of China, grant number 51708137.
Data Availability Statement
The original contributions presented in the study are included in the article, further inquiries can be directed to the corresponding author.
Conflicts of Interest
Authors Ying Bao and Jianfa Qiu were employed by the company Architectural Design and Research Institute Co., Ltd. The remaining authors declare that the research was conducted in the absence of any commercial or financial relationships that could be construed as a potential conflict of interest.
Abbreviations
The following abbreviations are used in this manuscript:
| WCRP | The World Climate Research Programmer |
| CMIP6 | The Coupled Model Intercomparison Project |
| TMY | Typical Meteorological Year |
| SSP | Shared Socioeconomic Pathways |
| SC | Severe Cold climate zones |
| C | Cold climate zones |
| HSCW | Hot Summer and Cold Winter climate zones |
| HSWW | Hot Summer and Warm Winter climate zones |
| W | Mild climate zones |
| SHGC | Solar heat gain coefficient |
| HDD | Heating Degree Days |
| CDD | Cooling Degree Days |
Appendix A
Appendix A.1
Table A1.
Specific information about the selected apartments.
Appendix A.2
To examine the comparability between the selected existing and new apartment cases under identical operating conditions, we compare the full-year hourly heating and cooling electricity demand series. Figure A1 presents scatter plots of paired hourly demand values (existing vs. new) for the five representative cities.
Consistency between the two housing types is quantified using Pearson’s correlation coefficient (r), together with RMSE and MAE. Pearson’s r is used to assess the linear co-variation of paired hourly demand values (i.e., the consistency of hourly demand patterns), while RMSE and MAE characterize discrepancies in load magnitude (RMSE emphasizing larger deviations and MAE reflecting the typical absolute hourly difference).
Figure A1.
Scatter distribution of full-year hourly heating and cooling electricity demand between existing and new apartments in the five representative cities. The dashed line denotes the 1:1 line indicating equal hourly energy demand between existing and new apartments.
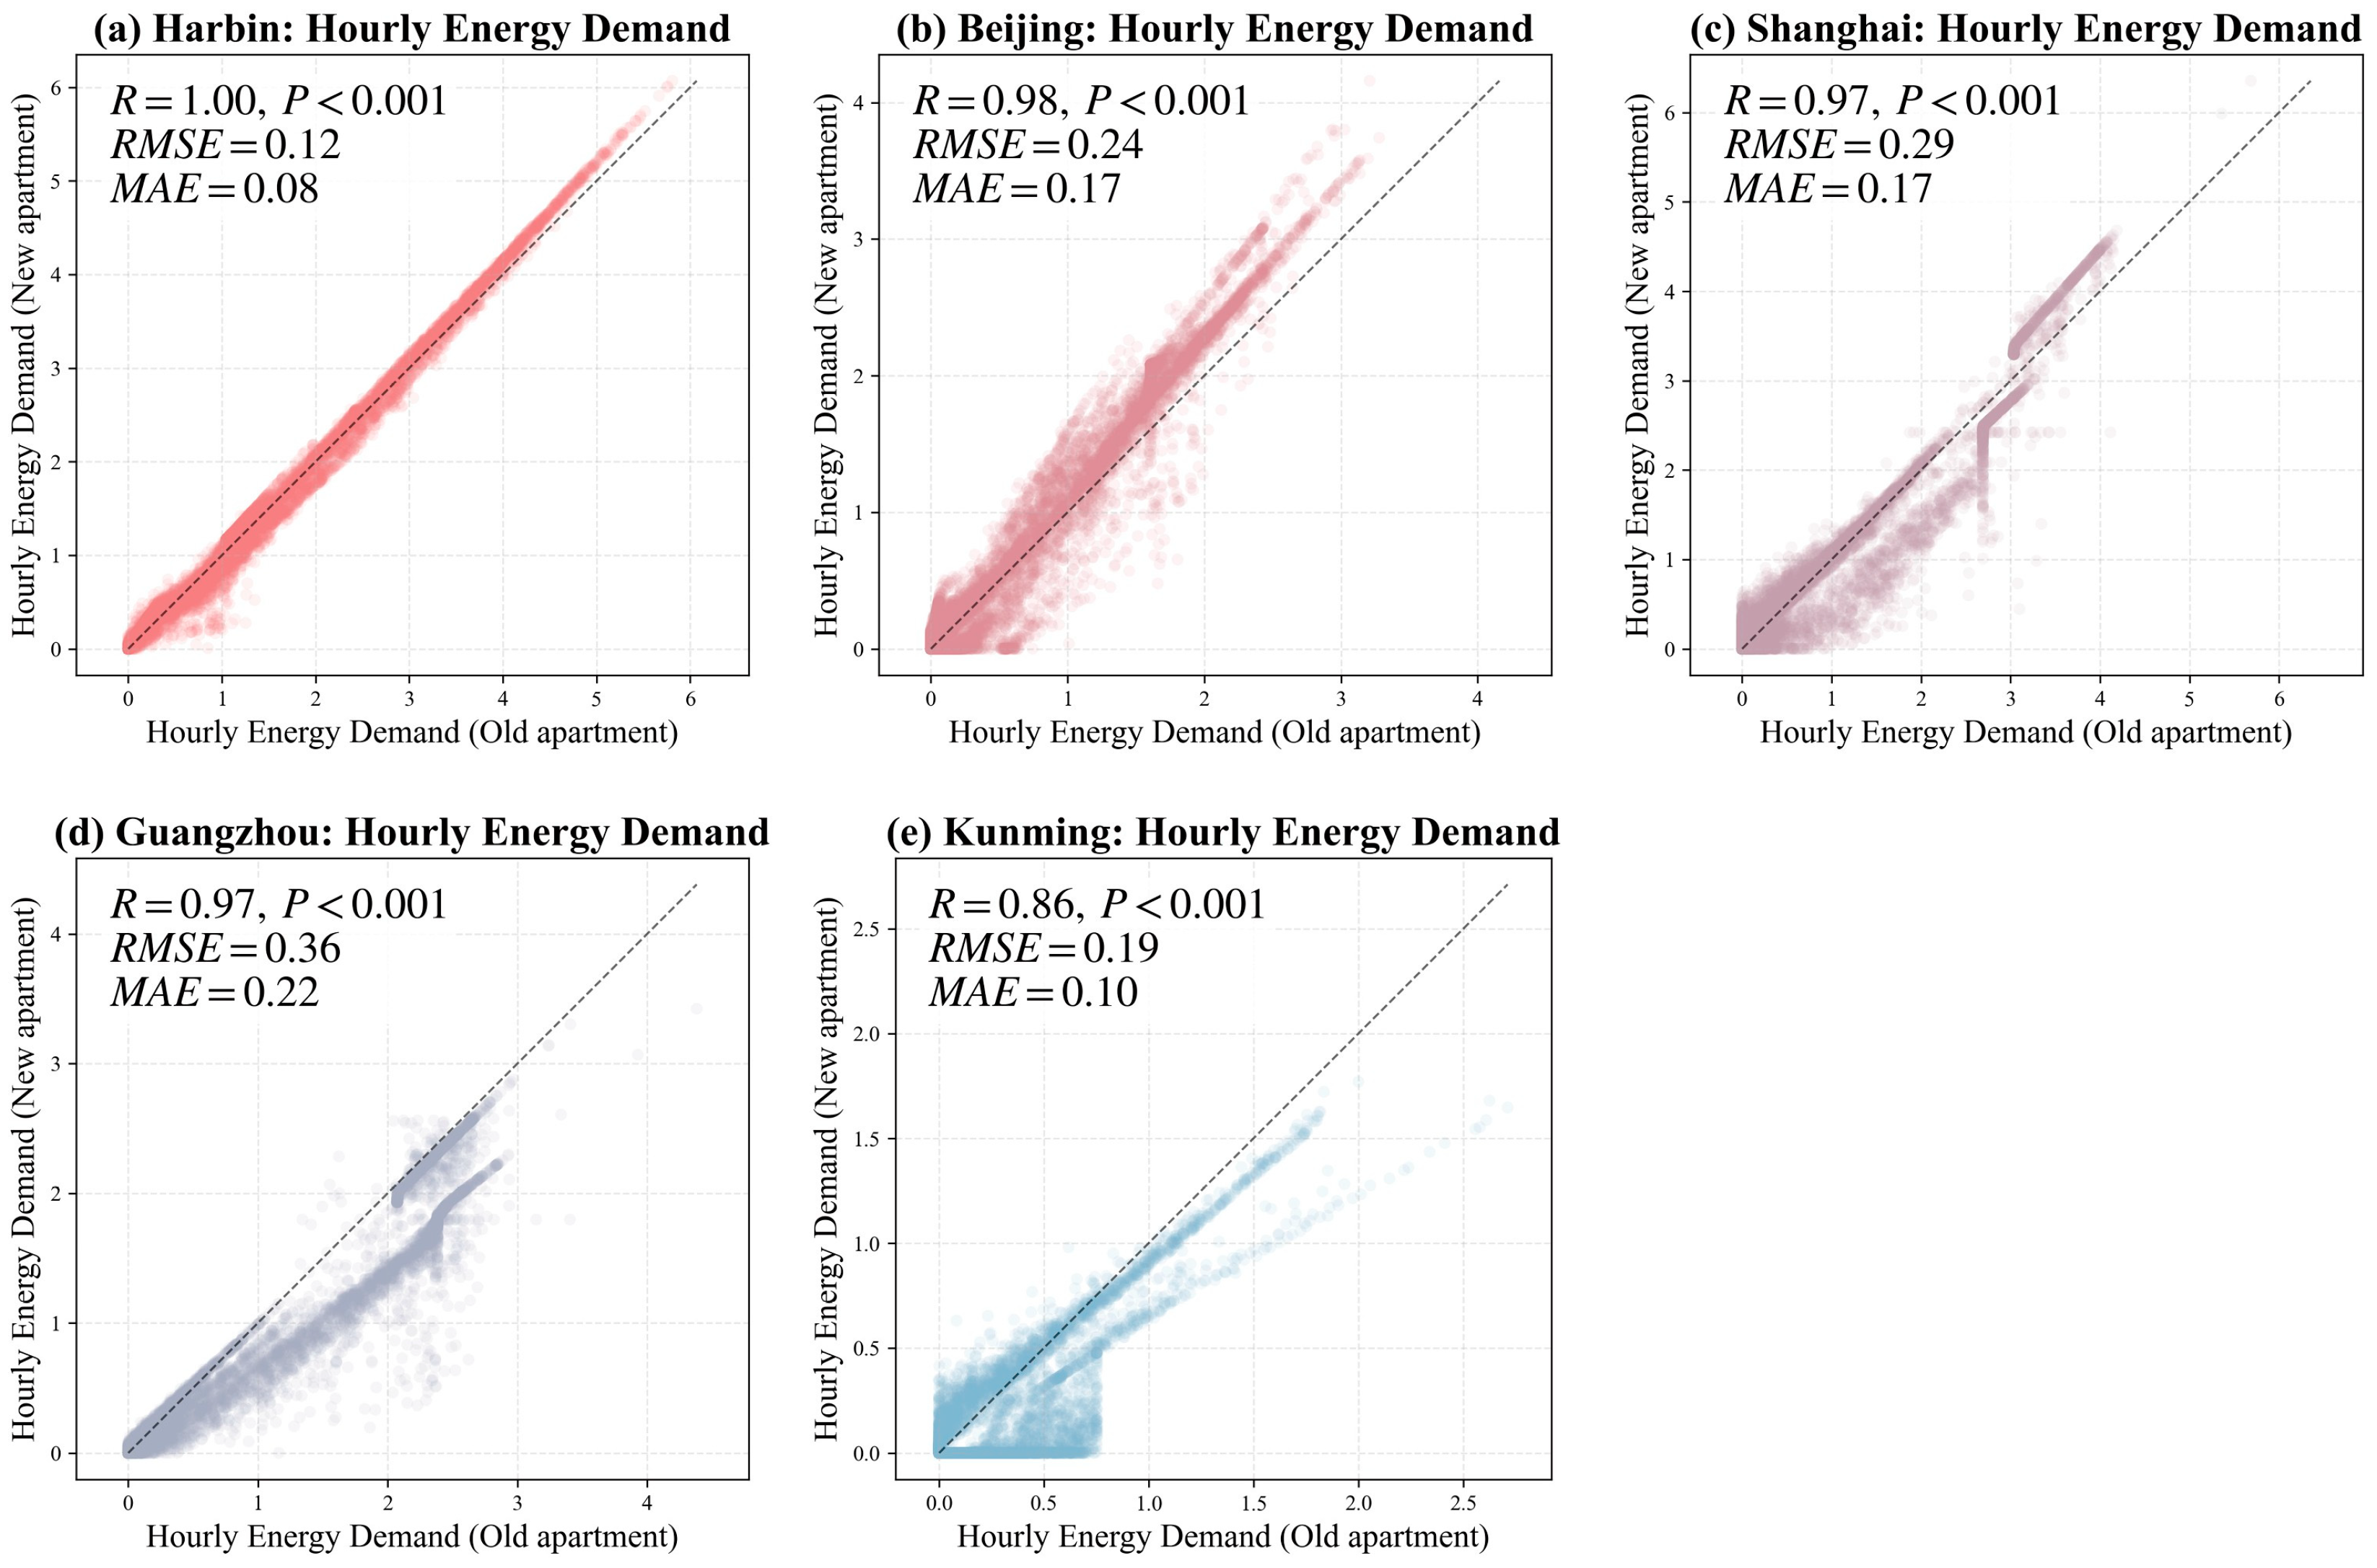
As illustrated in Figure A1, the paired hourly demand values exhibit an approximately linear association across the examined cities, indicating highly consistent hourly demand patterns under unified envelope thermal parameters and standardized usage schedules. The correlations are generally high (r ≥ 0.87, with most cities > 0.95), and RMSE/MAE remain at low levels relative to the overall demand range. These results support the adequacy of the selected cases for controlling spatial heterogeneity and provide a robust basis for subsequent analyses focusing on envelope-performance-driven disparities and energy-burden equity.
Appendix B
Appendix B.1
Table A2.
Cooling, heating, and total energy burdens of the five cities under future climate scenarios.
Appendix B.2
Table A3.
Cooling, heating, and total energy burdens of existing buildings in the five cities under three retrofit strategies.
References
- AR6 Climate Change 2022: Impacts, Adaptation and Vulnerability—IPCC. Available online: https://www.ipcc.ch/report/sixth-assessment-report-working-group-ii/ (accessed on 12 August 2025).
- Falchetta, G.; Cian, E.D.; Pavanello, F.; Wing, I.S. Inequalities in Global Residential Cooling Energy Use to 2050. Nat. Commun. 2024, 15, 7874. [Google Scholar] [CrossRef] [Scilit] [PubMed]
- Bienvenido-Huertas, D.; Sánchez-García, D.; Tejedor, B.; Rubio-Bellido, C. Energy Savings in Buildings Applying ASHRAE 55 and Regional Adaptive Thermal Comfort Models. Urban Clim. 2024, 55, 101892. [Google Scholar] [CrossRef] [Scilit]
- Zou, Y.; Wu, Z.; Li, B.; Jia, Y. Cooling Energy Challenges in Residential Buildings during Heat Waves: Urban Heat Island Impacts in a Hot-Humid City. Buildings 2024, 14, 4030. [Google Scholar] [CrossRef] [Scilit]
- Xiong, J.; Guo, S.; Wu, Y.; Yan, D.; Xiao, C.; Lu, X. Predicting the Response of Heating and Cooling Demands of Residential Buildings with Various Thermal Performances in China to Climate Change. Energy 2023, 269, 126789. [Google Scholar] [CrossRef] [Scilit]
- Ren, W.; Guan, Y.; Qiu, F.; Levin, T.; Heleno, M. Energy Justice and Equity: A Review of Definitions, Measures, and Practice in Policy, Planning, and Operations. Renew. Sustain. Energy Rev. 2025, 222, 115900. [Google Scholar] [CrossRef] [Scilit]
- Al Kez, D.; Foley, A.; Lowans, C.; Del Rio, D.F. Energy Poverty Assessment: Indicators and Implications for Developing and Developed Countries. Energy Convers. Manag. 2024, 307, 118324. [Google Scholar] [CrossRef] [Scilit]
- Briot-Arthur, S.; Fournier, V.; Lee, B. Quantifying Energy Poverty Vulnerability with Minimal Data—A Building Energy Simulation Approach. Energy Build. 2024, 309, 114062. [Google Scholar] [CrossRef] [Scilit]
- Emre, T. Hidden Subsidies and Behavioral Targeting: Insights from Türkiye’s Three-Pillar Energy Poverty Strategy (2019–2023). Util. Policy 2025, 97, 102043. [Google Scholar] [CrossRef] [Scilit]
- Osička, J.; Szulecki, K.; Jenkins, K.E.H. Energy Justice and Energy Democracy: Separated Twins, Rival Concepts or Just Buzzwords? Energy Res. Soc. Sci. 2023, 104, 103266. [Google Scholar] [CrossRef] [Scilit]
- Liu, X.; He, J.; Xiong, K.; Liu, S.; He, B.-J. Identification of Factors Affecting Public Willingness to Pay for Heat Mitigation and Adaptation: Evidence from Guangzhou, China. Urban Clim. 2023, 48, 101405. [Google Scholar] [CrossRef] [Scilit]
- Zeng, P.; Yin, J.; Huang, Y.; Zhong, J.; Lu, S. AI-Based Generation and Optimization of Energy-Efficient Residential Layouts Controlled by Contour and Room Number. Build. Simul. 2025, 18, 2777–2805. [Google Scholar] [CrossRef] [Scilit]
- Xia, D.; Zhong, Z.; Huang, Y.; Zou, Y.; Lou, S.; Zhan, Q.; Guo, J.; Yang, J.; Guo, T. Impact of Coupled Heat and Moisture Transfer on Indoor Comfort and Energy Demand for Residential Buildings in Hot-Humid Regions. Energy Build. 2023, 288, 113029. [Google Scholar] [CrossRef] [Scilit]
- Yu, J.; Chang, W.-S.; Zhang, R.; Dong, Y.; Huang, H.; Wang, T.-H. In-Situ U-Value Measurements of Typical Building Envelopes in a Severe Cold Region of China: U-Value Variations and Energy Implications. Energy Build. 2024, 324, 114947. [Google Scholar] [CrossRef] [Scilit]
- Hu, J.; Liu, Z.; Ma, G.; Zhang, G.; Ai, Z. Air Infiltration and Related Building Energy Consumption: A Case Study of Office Buildings in Changsha, China. J. Build. Eng. 2023, 74, 106859. [Google Scholar] [CrossRef] [Scilit]
- Zou, Y.; Ren, S.; Wu, Z.; Yao, L.; Lou, S.; Li, H.; Huang, Y.; Lin, J. Evaluating the Impact of Urban Climate on Building Energy: Discrepancies during the Hottest Period in a Subtropical City. Energy 2025, 341, 139431. [Google Scholar] [CrossRef] [Scilit]
- Liu, S.; Wang, Y.; Liu, X.; Yang, L.; Zhang, Y.; He, J. How Does Future Climatic Uncertainty Affect Multi-Objective Building Energy Retrofit Decisions? Evidence from Residential Buildings in Subtropical Hong Kong. Sustain. Cities Soc. 2023, 92, 104482. [Google Scholar] [CrossRef] [Scilit]
- Chen, X.; Xu, Z.; Qiu, Y.; Hu, H.; Wang, X. China’s Newest Design of Apartment Buildings with Modernized Façade: A Comparative Evaluation of Its Energy Performance in Five Major Climate Zones. Sustain. Cities Soc. 2024, 117, 105954. [Google Scholar] [CrossRef] [Scilit]
- Wang, X.; Chen, D.; Ren, Z. Assessment of Climate Change Impact on Residential Building Heating and Cooling Energy Requirement in Australia. Build. Environ. 2010, 45, 1663–1682. [Google Scholar] [CrossRef] [Scilit]
- Zou, Y.; Xiang, K.; Zhan, Q.; Li, Z. A Simulation-Based Method to Predict the Life Cycle Energy Performance of Residential Buildings in Different Climate Zones of China. Build. Environ. 2021, 193, 107663. [Google Scholar] [CrossRef] [Scilit]
- China Statistical Yearbook 2024. Available online: https://www.stats.gov.cn/sj/ndsj/2024/indexch.htm (accessed on 12 August 2025).
- Liang, Y.; Qian, Q.K.; Li, B.; An, Y.; Shi, L. A Critical Assessment on China’s Old Neighborhood Renovation: Barriers Analysis, Solutions and Future Research Prospects. Energy Build. 2025, 332, 115407. [Google Scholar] [CrossRef] [Scilit]
- Xia, D.; Wu, Z.; Zou, Y.; Chen, R.; Lou, S. Developing a Bottom-up Approach to Assess Energy Challenges in Urban Residential Buildings of China. Front. Archit. Res. 2025, 14, 1810–1833. [Google Scholar] [CrossRef] [Scilit]
- Han, S.; Yao, R.; Li, N. The Development of Energy Conservation Policy of Buildings in China: A Comprehensive Review and Analysis. J. Build. Eng. 2021, 38, 102229. [Google Scholar] [CrossRef] [Scilit]
- Deng, Y.; Zhou, Y.; Wang, H.; Xu, C.; Wang, W.; Zhou, T.; Liu, X.; Liang, H.; Yu, D. Simulation-Based Sensitivity Analysis of Energy Performance Applied to an Old Beijing Residential Neighbourhood for Retrofit Strategy Optimisation with Climate Change Prediction. Energy Build. 2023, 294, 113284. [Google Scholar] [CrossRef] [Scilit]
- Wang, X.; Delina, L.L.; Matus, K. Living with Energy Poverty: Uncovering Older People’s Fuel Choices in Urban China. Energy Res. Soc. Sci. 2023, 104, 103247. [Google Scholar] [CrossRef] [Scilit]
- Ma, D.; Li, Y.; Li, X. Does Climate Change Significantly Impact the Benefits of Existing Building Energy-Saving Retrofit? Evidence from a Parametric Study. Energy Build. 2025, 345, 116130. [Google Scholar] [CrossRef] [Scilit]
- Guo, J.; Xia, D.; Zhang, L.; Zou, Y.; Guo, G.; Chen, Z.; Xie, W. Assessing the Winter Indoor Environment with Different Comfort Metrics in Self-Built Houses of Hot-Humid Areas: Does Undercooling Matter for the Elderly? Build. Environ. 2024, 263, 111871. [Google Scholar] [CrossRef] [Scilit]
- GB 50176-2016; Thermal Design Code for Civil Buildings. Ministry of Housing and Urban-Rural Development of the People’s Republic of China: Beijing, China, 2016.
- Climate.OneBuilding.Org. Available online: https://climate.onebuilding.org/#gsc.tab=0 (accessed on 5 January 2026).
- Guo, J.; Xia, D.; Zhang, L.; Zou, Y.; Yang, X.; Xie, W.; Zhong, Z. Future Indoor Overheating Risk for Urban Village Housing in Subtropical Region of China under Long-Term Changing Climate. Build. Environ. 2023, 246, 110978. [Google Scholar] [CrossRef] [Scilit]
- Xin, X.; Zhang, J.; Zhang, F.; Wu, T.; Shi, X.; Li, J.; Chu, M.; Liu, Q.; Yan, J.; Ma, Q.; et al. BCC BCC-CSM2MR Model Output Prepared for CMIP6 CMIP; World Data Center for Climate: Hamburg, Germany, 2018. [Google Scholar]
- Xing, X.; Wu, T.; Zhang, J.; Zhang, F.; Li, W.; Zhang, Y.; Lu, Y.; Fang, Y.; Xie, W.; Zhang, L.; et al. Introduction of the BCC model and its CMIP6 experiments. Clim. Change Res. 2019, 15, 533–539. [Google Scholar]
- O’Neill, B.C.; Kriegler, E.; Riahi, K.; Ebi, K.L.; Hallegatte, S.; Carter, T.R.; Mathur, R.; van Vuuren, D.P. A New Scenario Framework for Climate Change Research: The Concept of Shared Socioeconomic Pathways. Clim. Change 2014, 122, 387–400. [Google Scholar] [CrossRef] [Scilit]
- Masson-Delmotte, V.; Zhai, P.; Pirani, A.; Connors, S.L.; Péan, C.; Berger, S.; Caud, N.; Chen, Y.; Goldfarb, L.; Gomis, M.; et al. (Eds.) Climate Change 2021: The Physical Science Basis. Contribution of Working Group I to the Sixth Assessment Report of the Intergovernmental Panel on Climate Change; Cambridge University Press: Cambridge, UK, 2021; Volume 2, p. 2391. [Google Scholar]
- Krelling, A.F.; Lamberts, R.; Malik, J.; Zhang, W.; Sun, K.; Hong, T. Defining Weather Scenarios for Simulation-Based Assessment of Thermal Resilience of Buildings under Current and Future Climates: A Case Study in Brazil. Sustain. Cities Soc. 2024, 107, 105460. [Google Scholar] [CrossRef] [Scilit]
- Rodrigues, E.; Fernandes, M.S.; Carvalho, D. Future Weather Generator for Building Performance Research: An Open-Source Morphing Tool and an Application. Build. Environ. 2023, 233, 110104. [Google Scholar] [CrossRef] [Scilit]
- China Population Census Yearbook 2020. Available online: https://www.stats.gov.cn/sj/pcsj/rkpc/7rp/zk/indexch.htm (accessed on 5 January 2026).
- GB 55015-2021; General Code for Energy Efficiency and Renewable Energy Application in Buildings. Ministry of Housing and Urban-Rural Development of the People’s Republic of China & State Administration for Market Regulation: Beijing, China, 2021.
- Peter, H.R.; Sargent, K.; Penney, J.; Schmitz, T. Path Programming in Rhino 7 for Wire Arc Additive Manufacturing. Manuf. Lett. 2025, 44, 973–979. [Google Scholar] [CrossRef] [Scilit]
- Wang, Q.; Wang, J.; Cheng, Z. (Eds.) Implementation Guide for Evaluation Standard of Green Retrofit of Existing Buildings; China Architecture & Building Press: Beijing, China, 2016; p. 203. [Google Scholar]
- Zhang, X.; Nie, S.; He, M.; Wang, J. Energy-Saving Renovation of Old Urban Buildings: A Case Study of Beijing. Case Stud. Therm. Eng. 2021, 28, 101632. [Google Scholar] [CrossRef] [Scilit]
- Zhao, W.; Gu, X.; Yang, J.; Zhang, J. Study on energy-saving retrofit of exterior windows in Jinyang Second Residential Quarter. Hous. Sci. 2010, 30, 50–54. [Google Scholar] [CrossRef]
- JGJ 75-2003; Design Standard for Energy Efficiency of Residential Buildings in Hot Summer and Warm Winter Zone. Ministry of Construction of the People’s Republic of China: Beijing, China, 2003.
- Wen, D. Energy-Efficient Design Research in the Renovation of Old Residential Communities in Kunming. Master’s Thesis, Kunming University of Science and Technology, Kunming, China, 2022. [Google Scholar]
- Ministry of Construction of the People’s Republic of China. National Civil Building Engineering Design Technical Measures: Energy Efficiency Volume; China Architecture & Building Press: Beijing, China, 2007.
- ISO 9050:2003; Glass in Building-Determination of Light Transmittance, Solar Direct Transmittance, Total Solar Energy Transmittance, Ultraviolet Transmittance and Related Glazing Factors. International Organization for Standardization: Geneva, Switzerland, 2003.
- Zou, Y.; Chen, Z.; Lou, S.; Huang, Y.; Xia, D.; Cao, Y.; Li, H.; Lun, I.Y.F. Accelerating Long-Term Building Energy Performance Simulation with a Reference Day Method. Build. Simul. 2024, 17, 2331–2353. [Google Scholar] [CrossRef] [Scilit]
- Peng, Y.; Wang, D.; Kong, L.; Wang, Y.; Liu, Z.; Shi, S. Air Infiltration Rate Distributions of Urban Residences in China. Build. Environ. 2025, 278, 112976. [Google Scholar] [CrossRef] [Scilit]
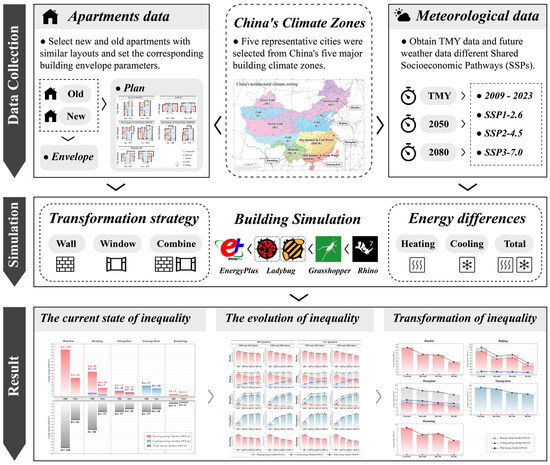
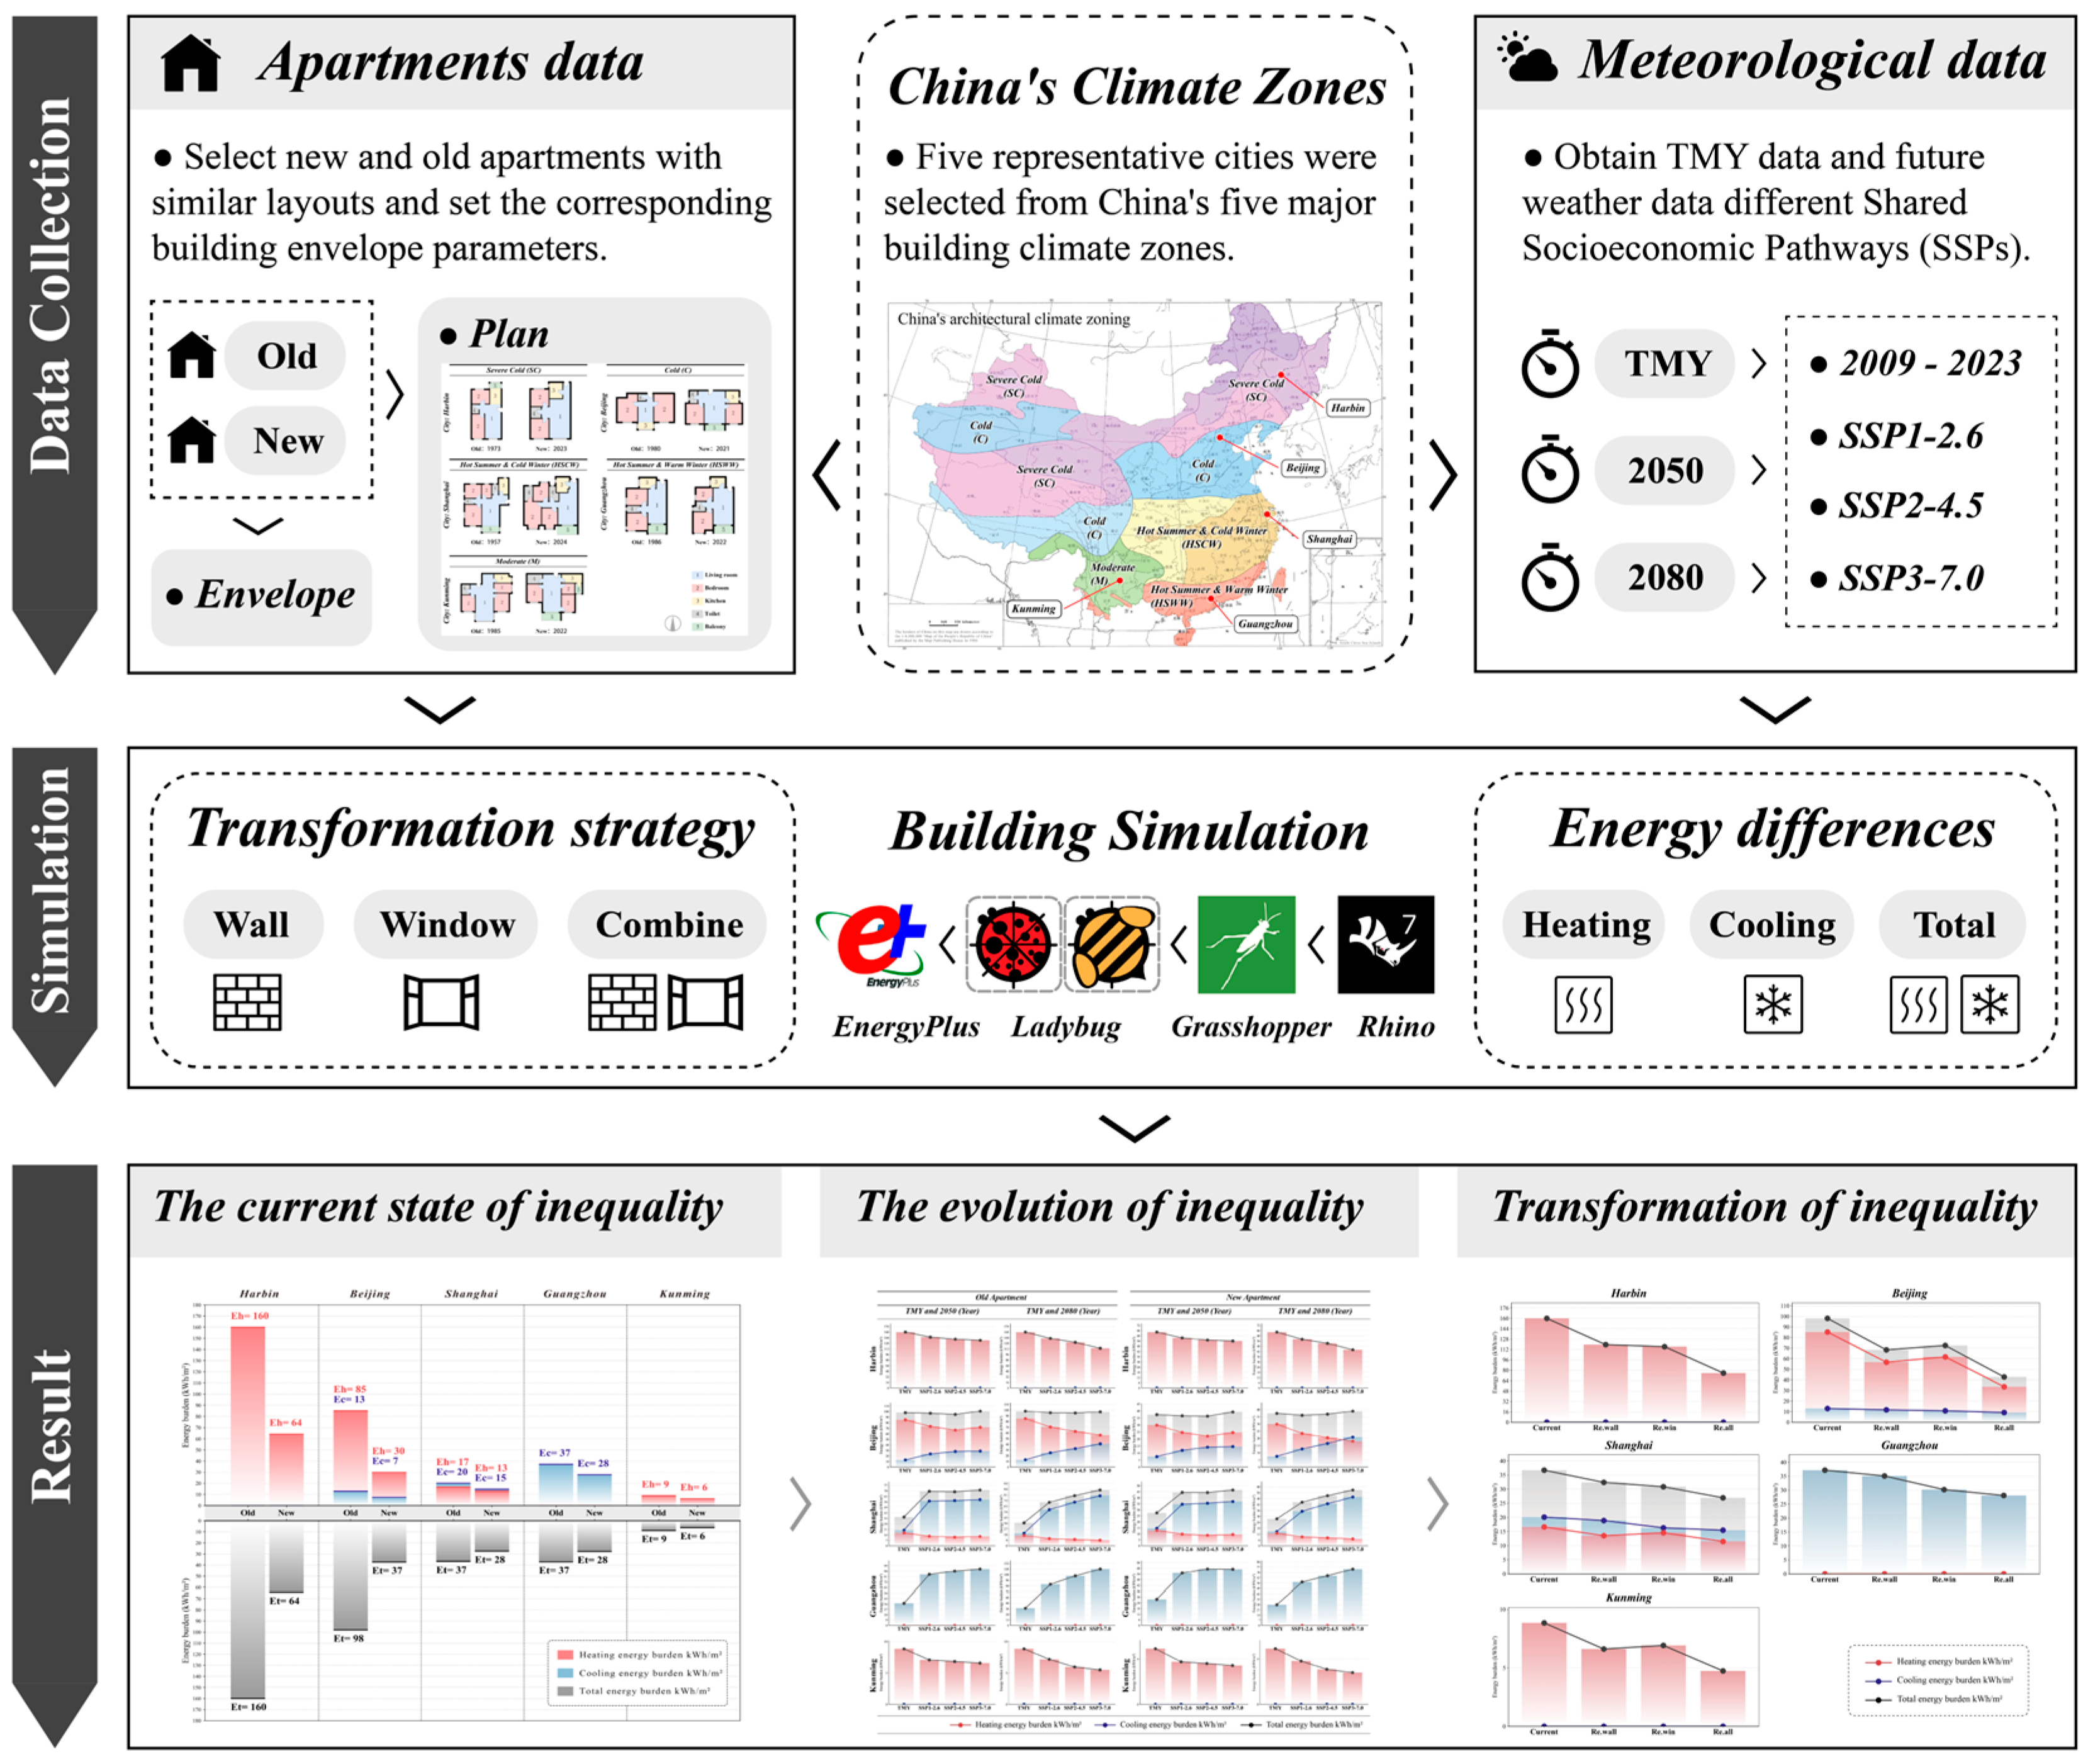
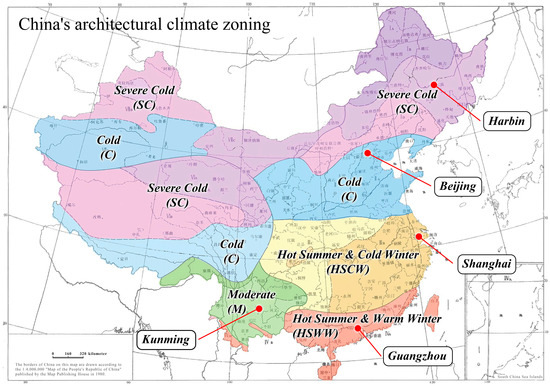
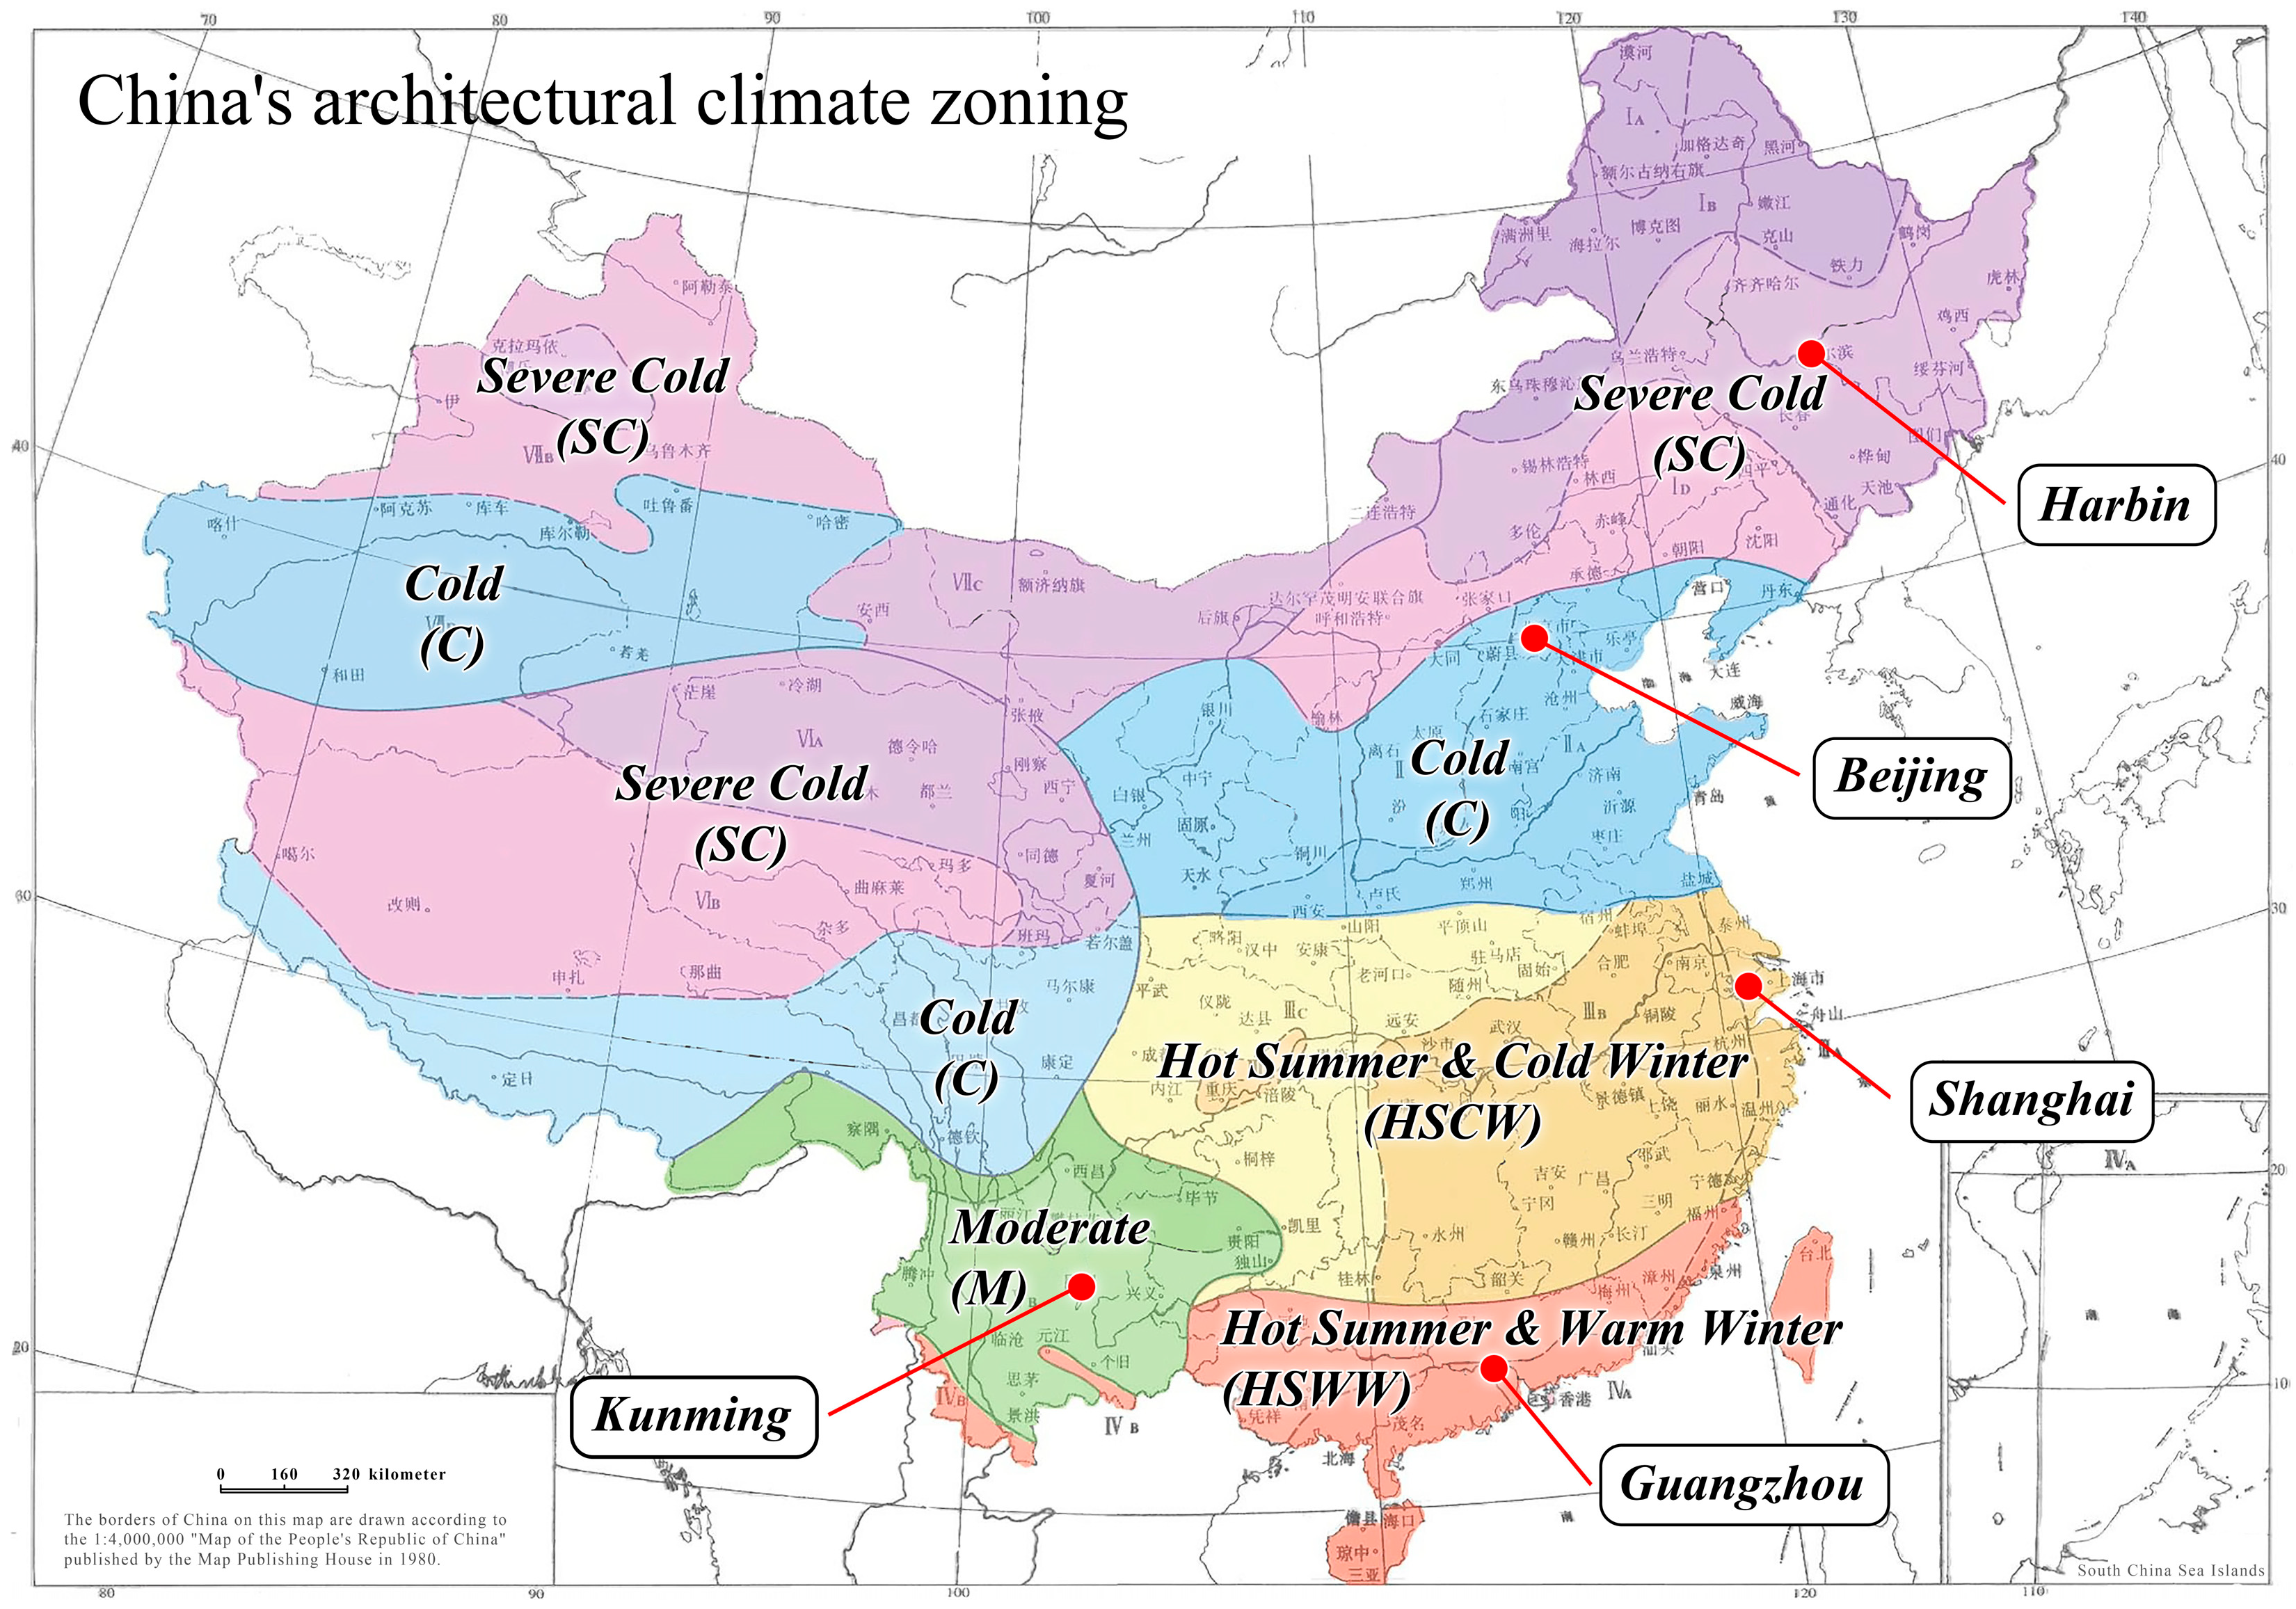
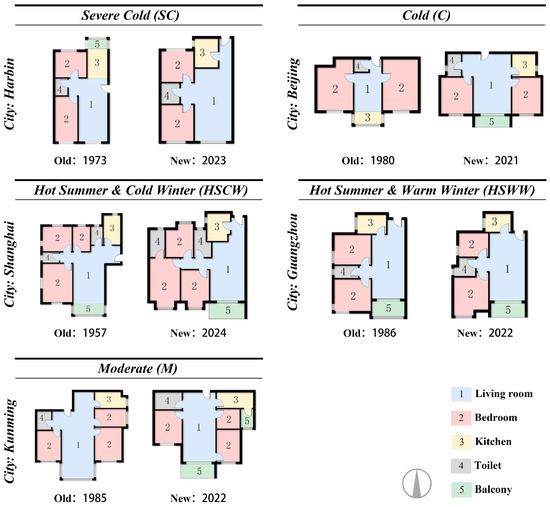
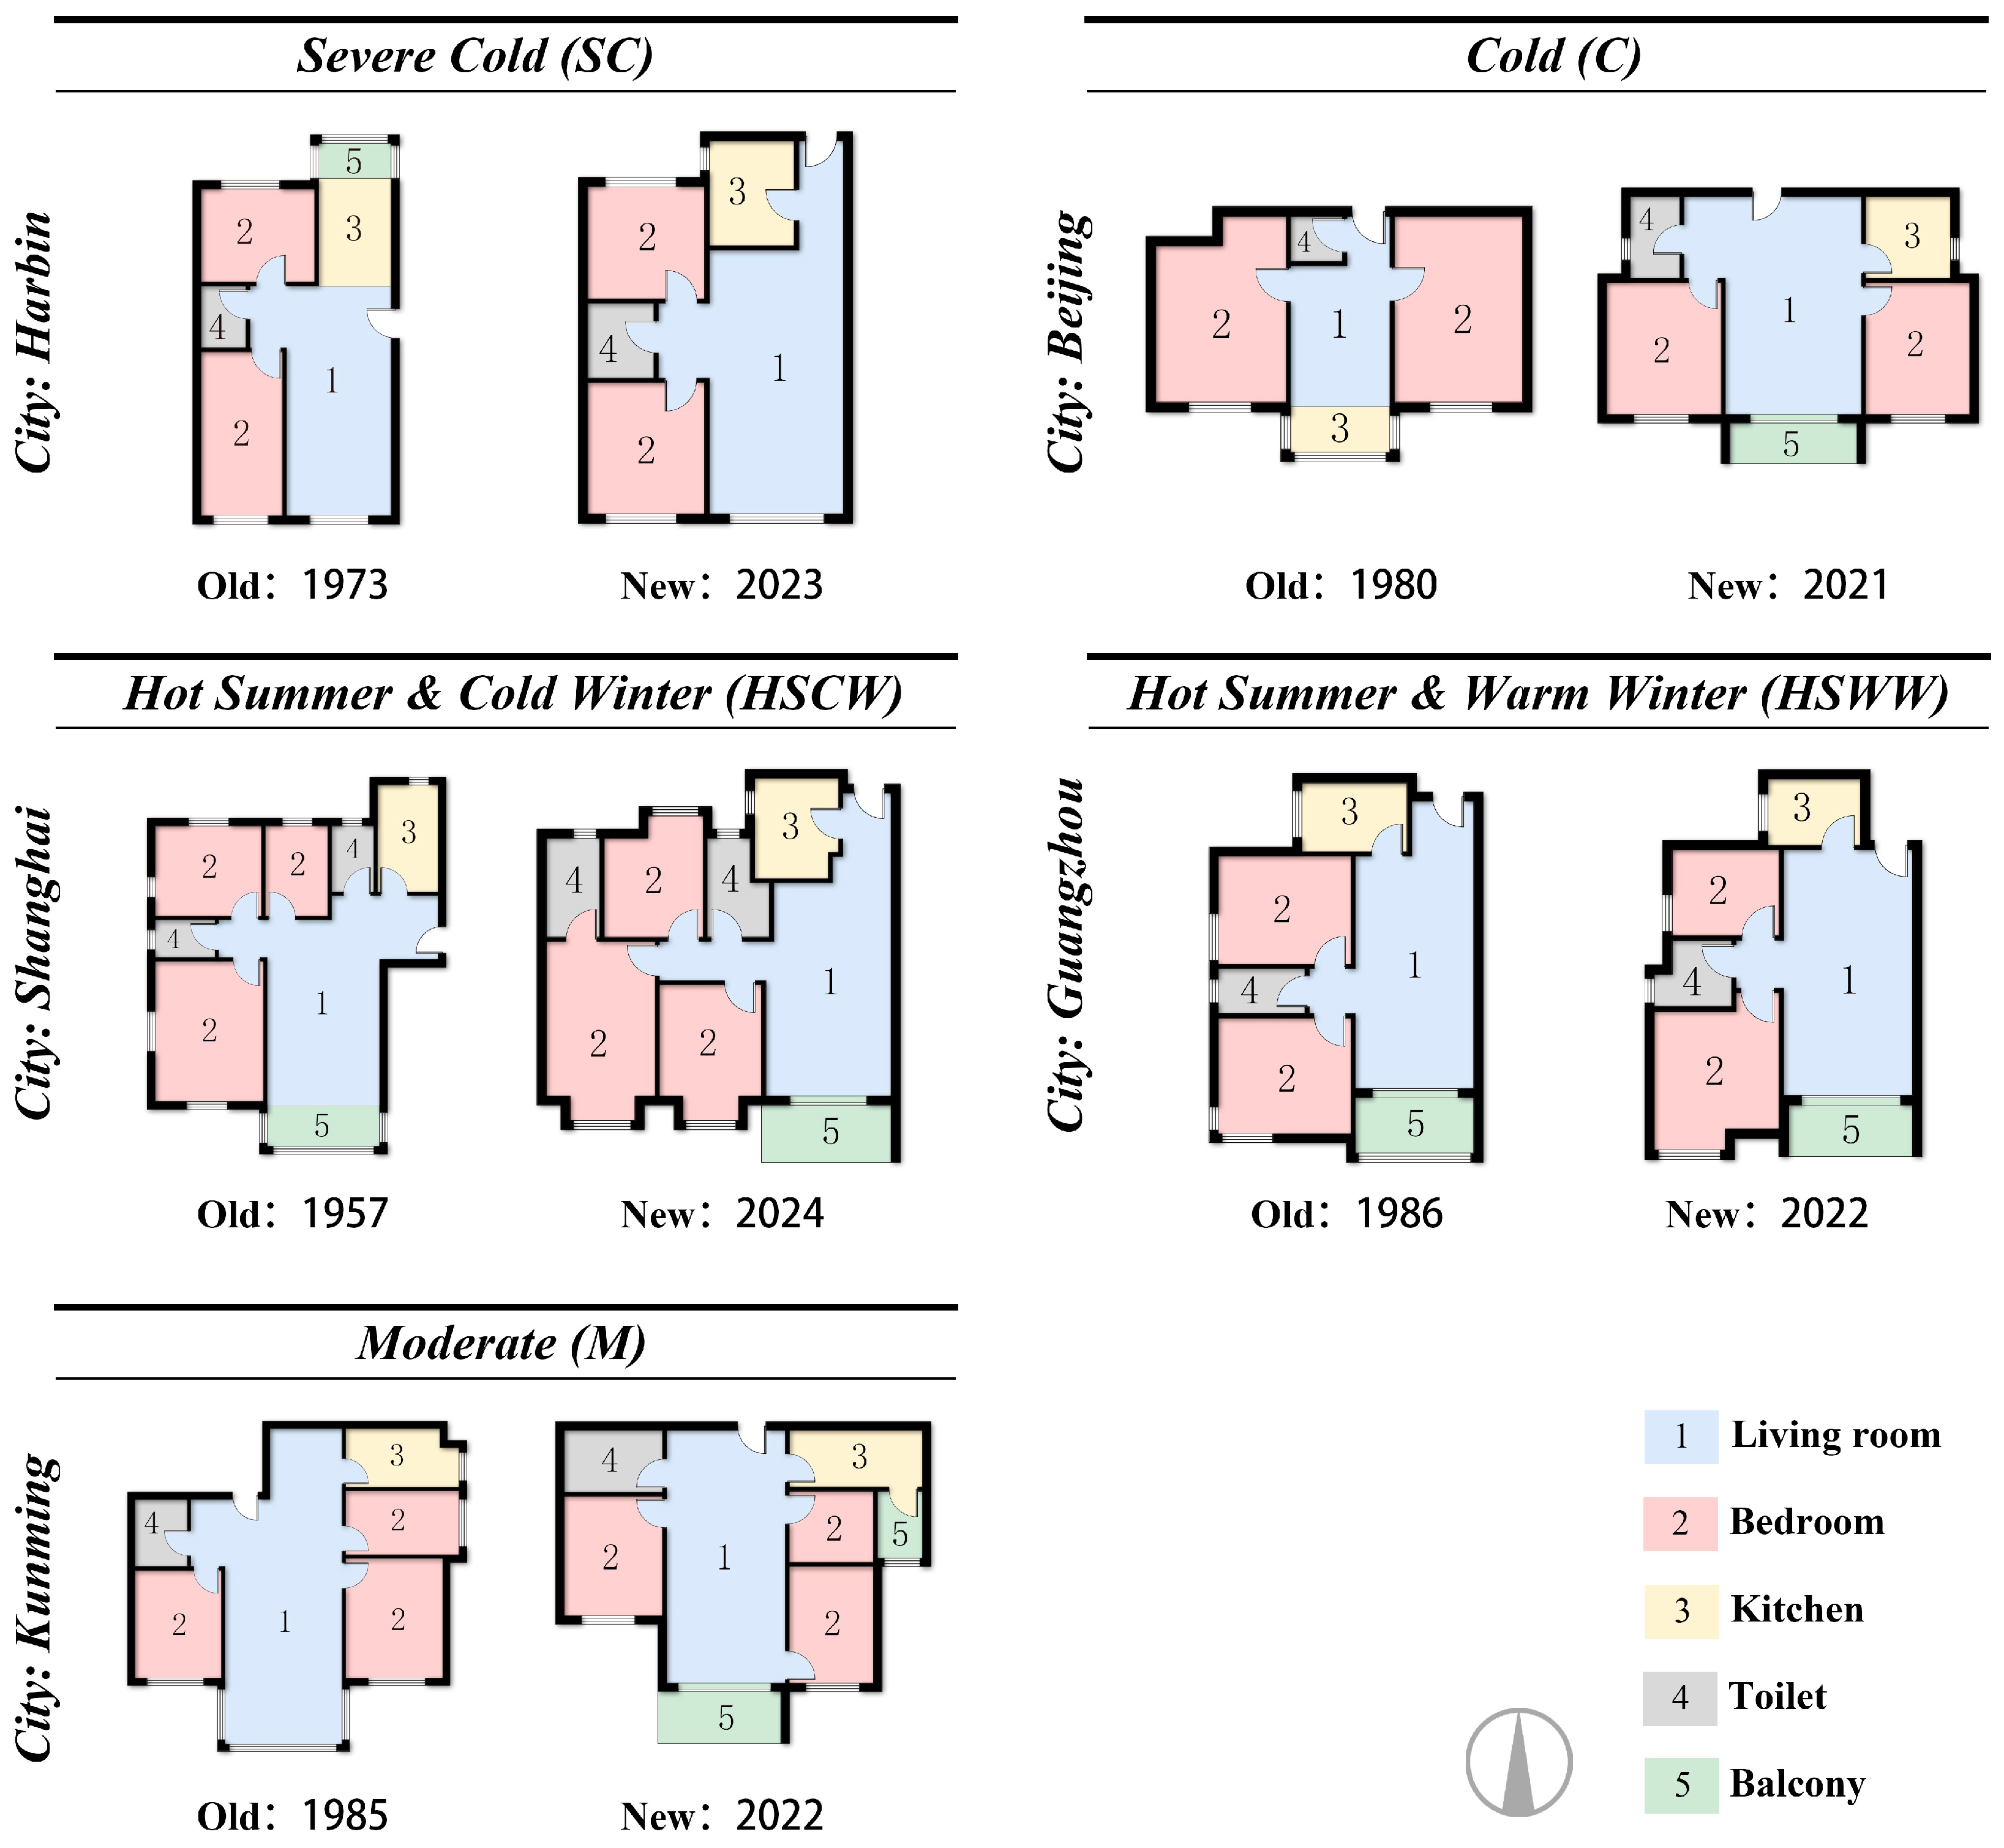
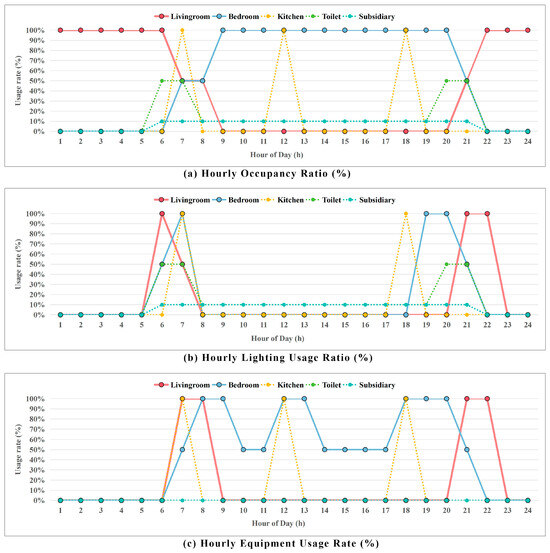
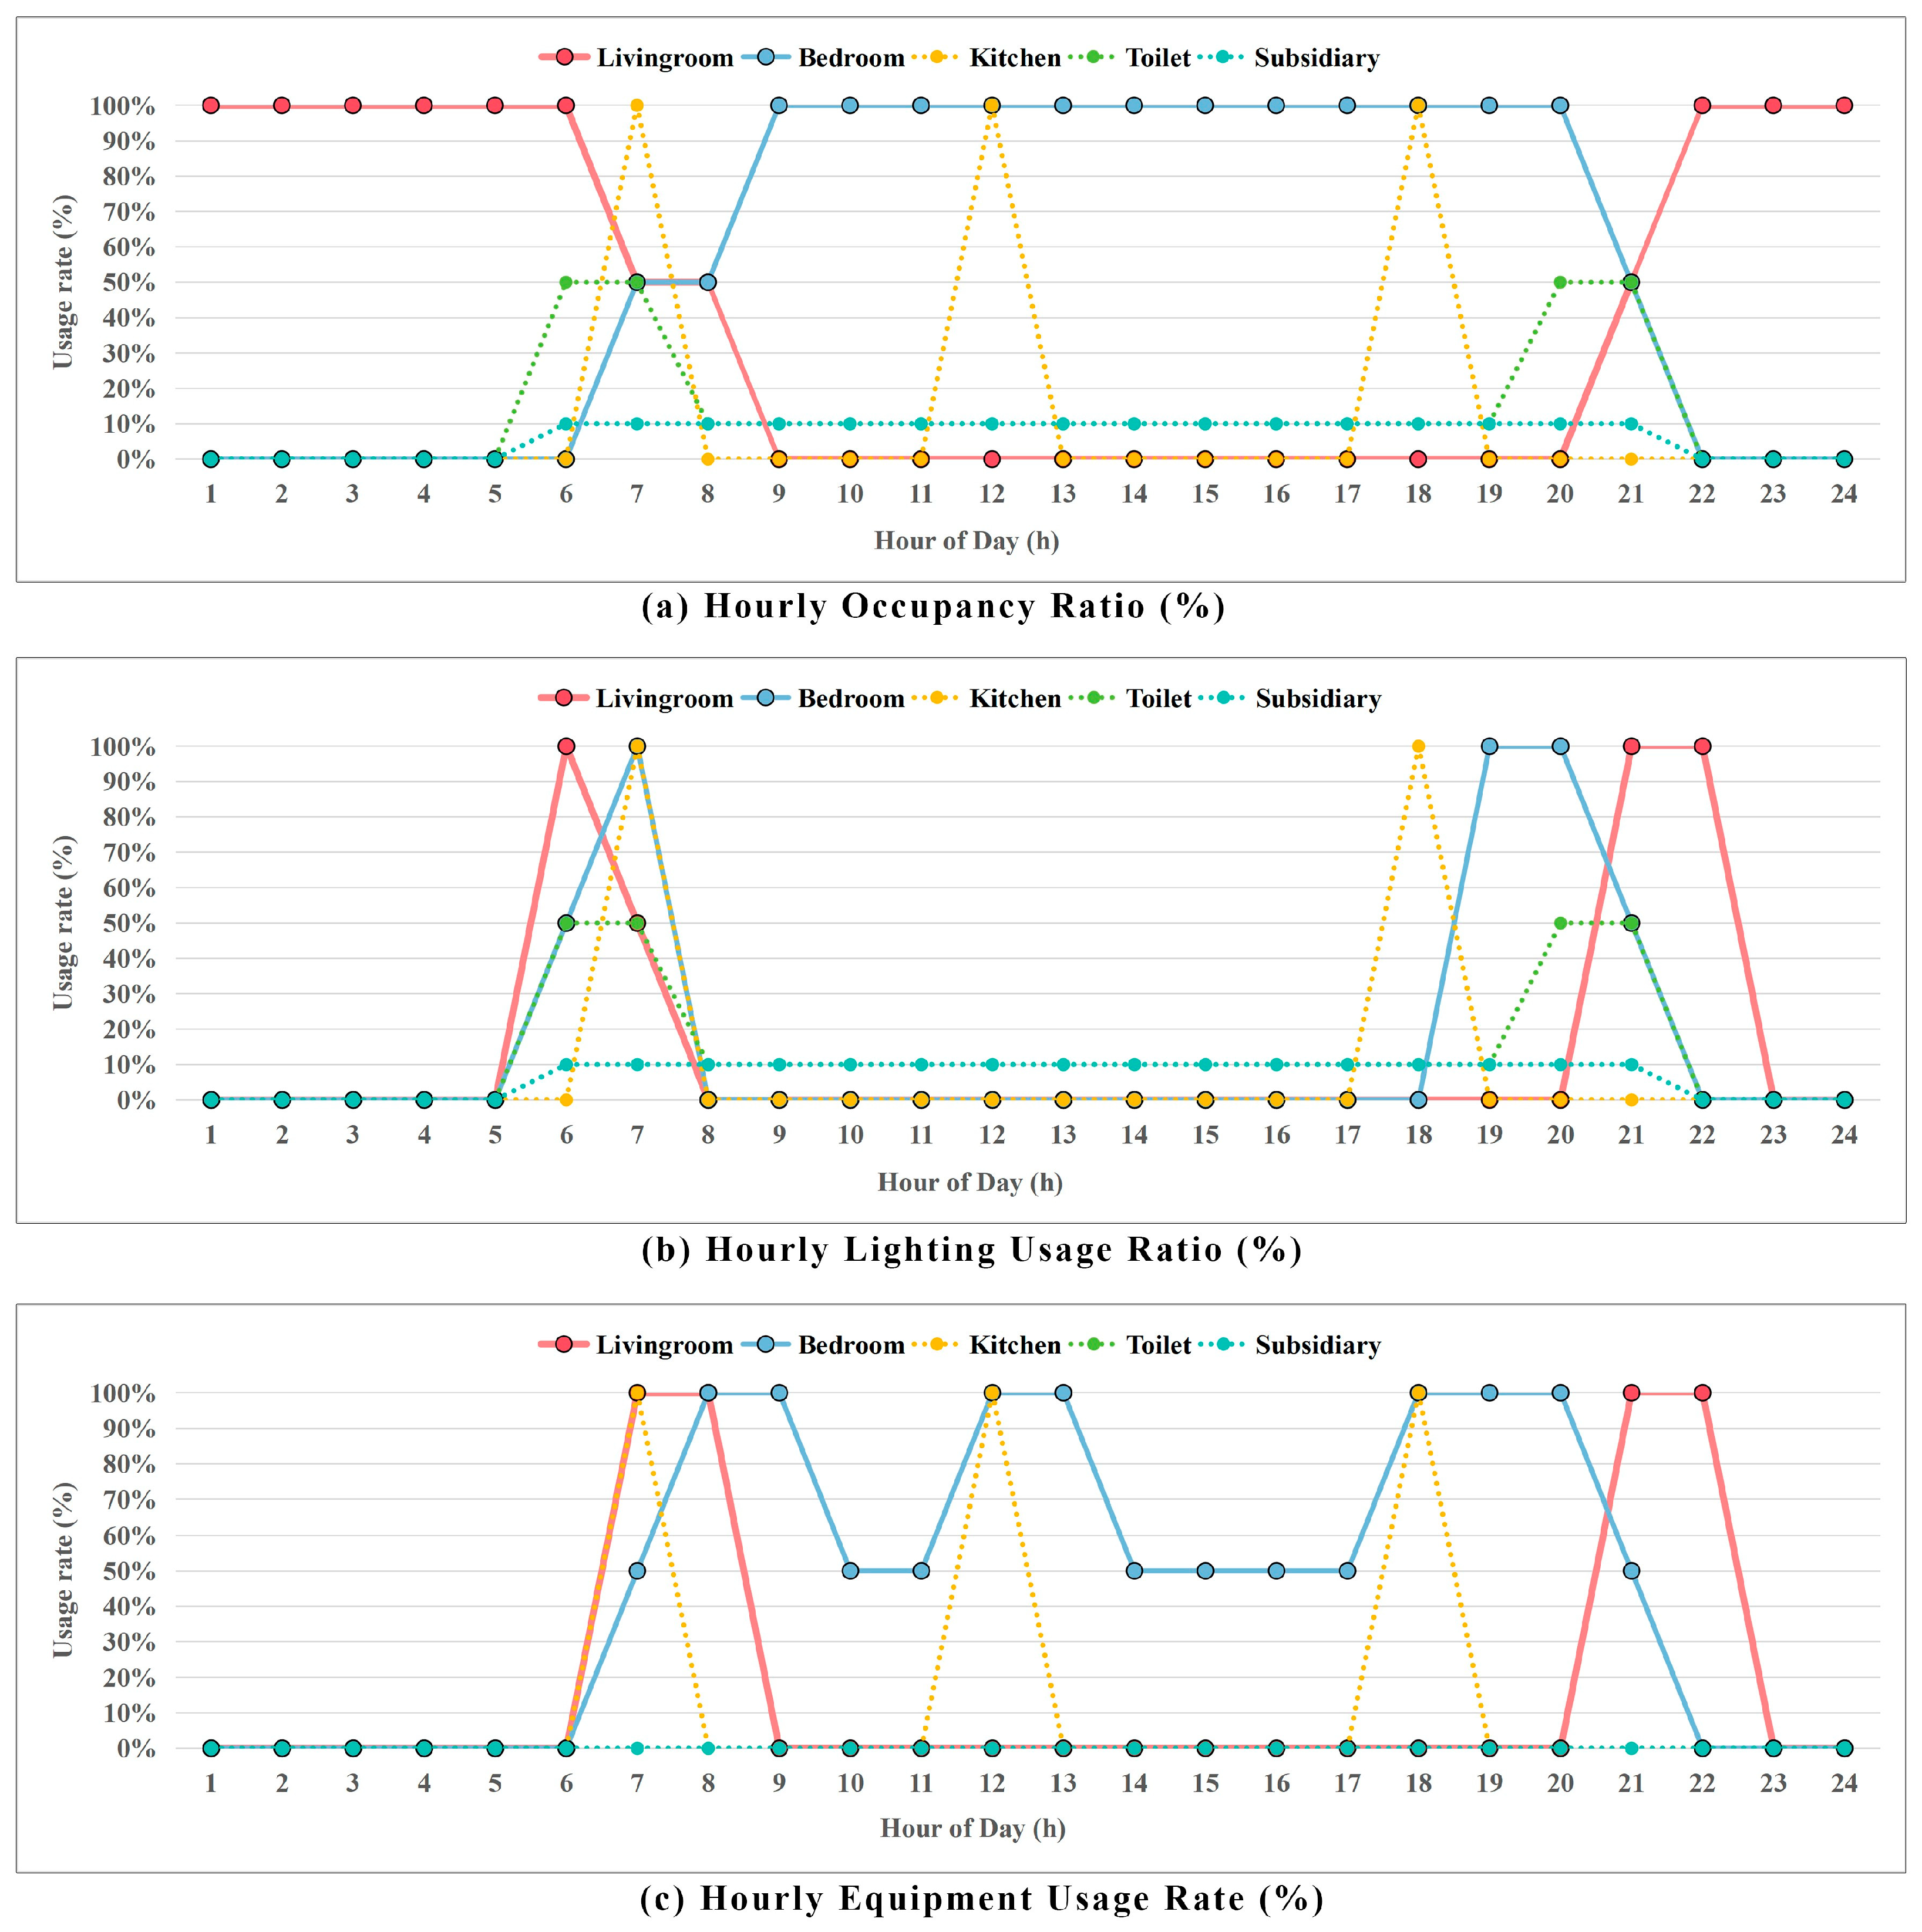
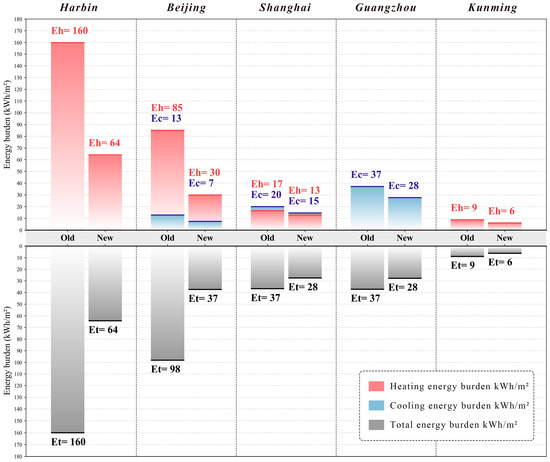
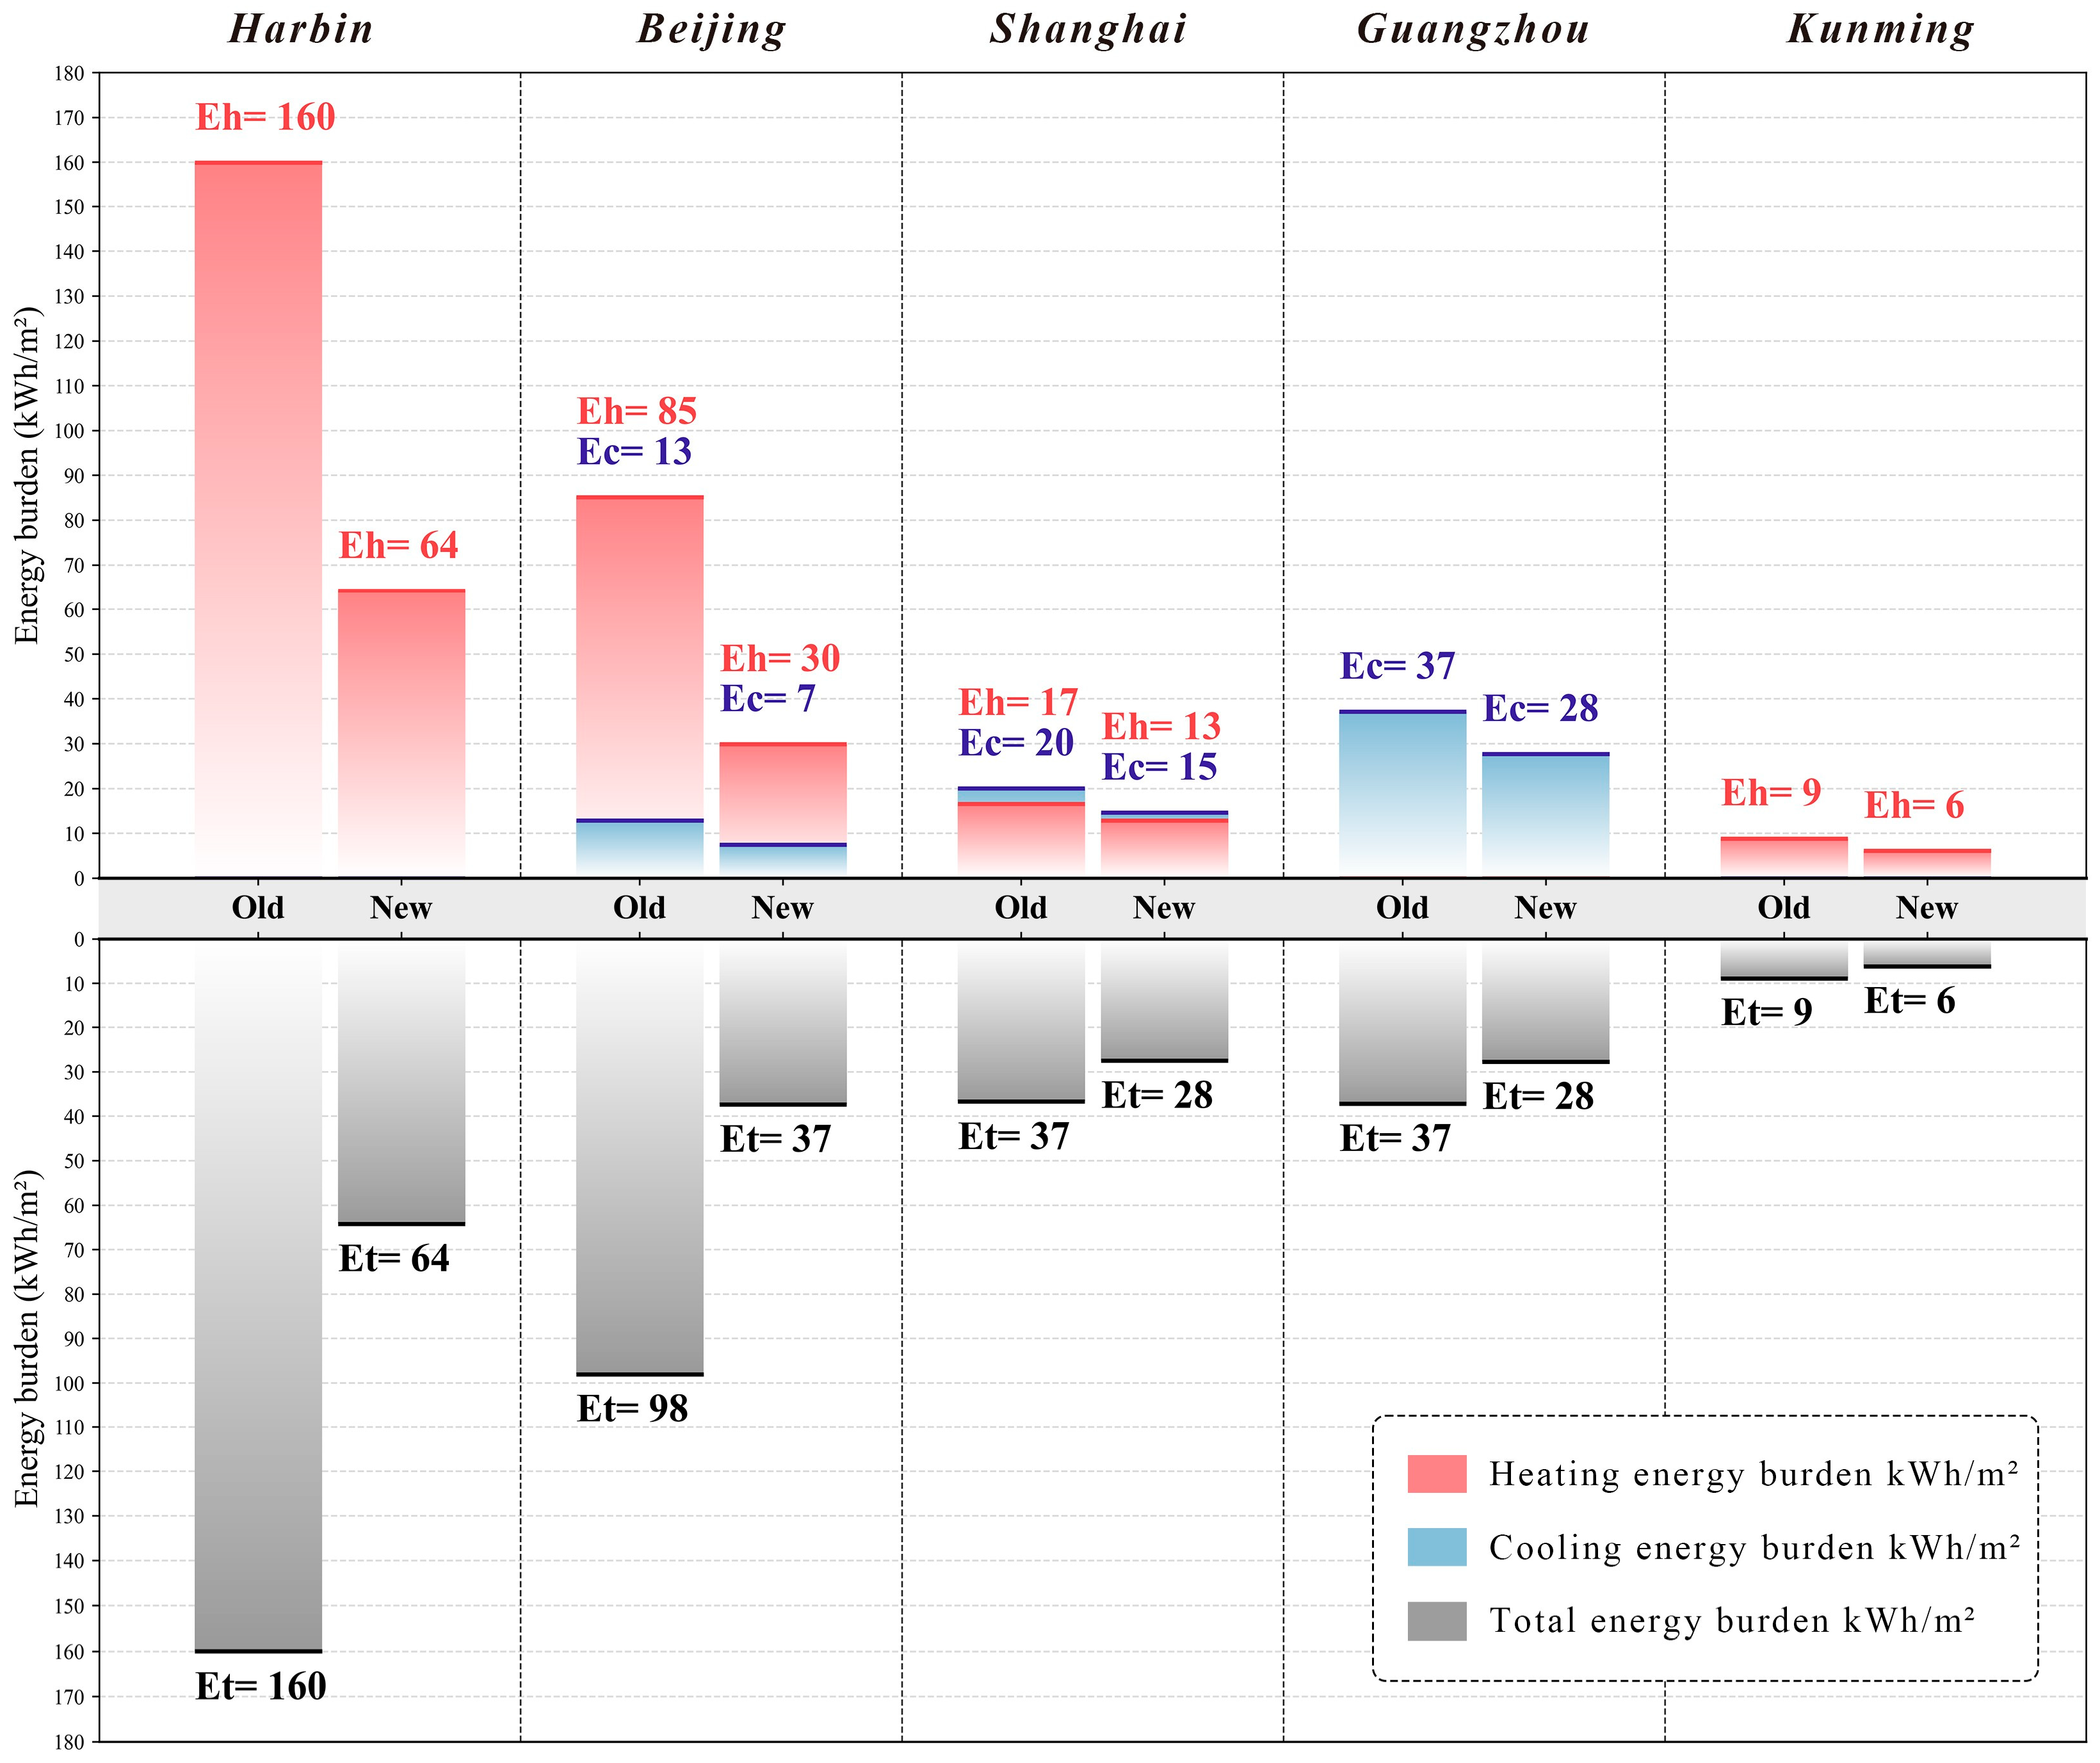
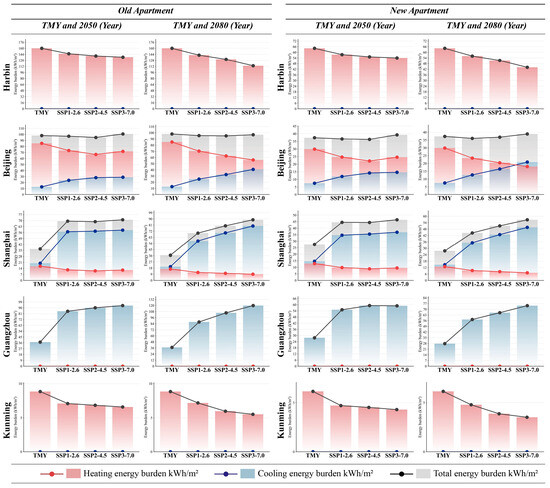
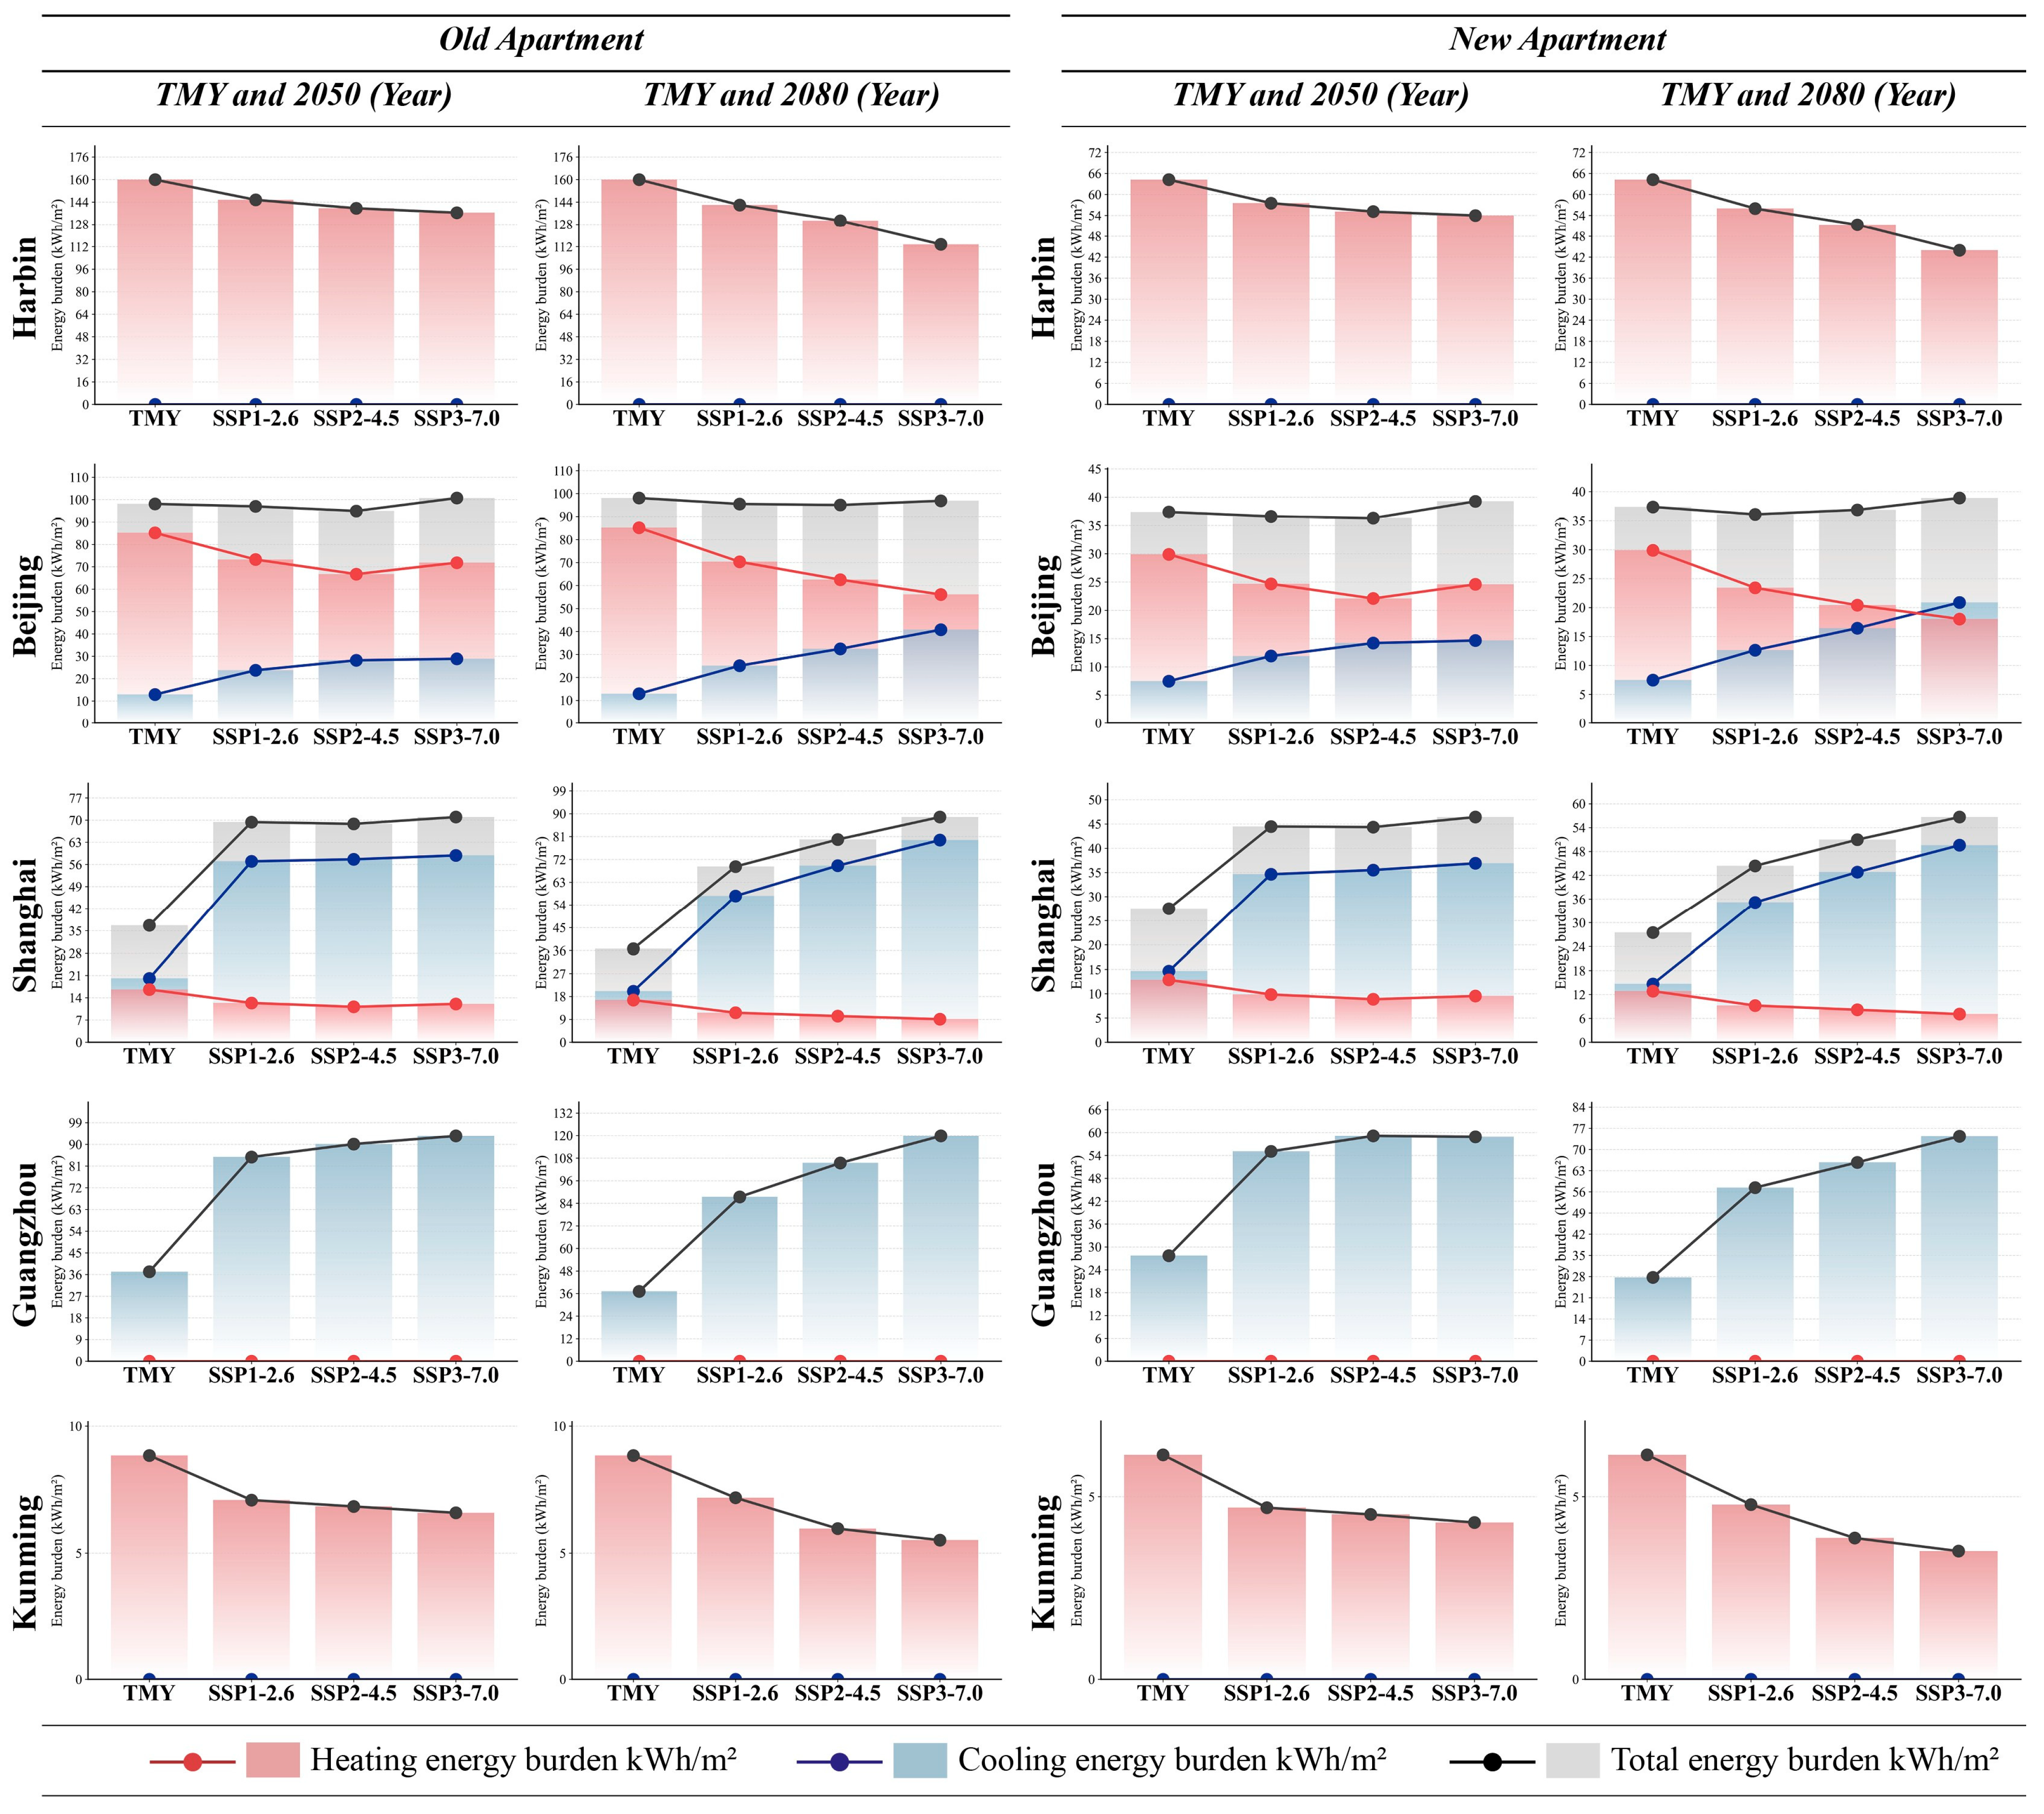
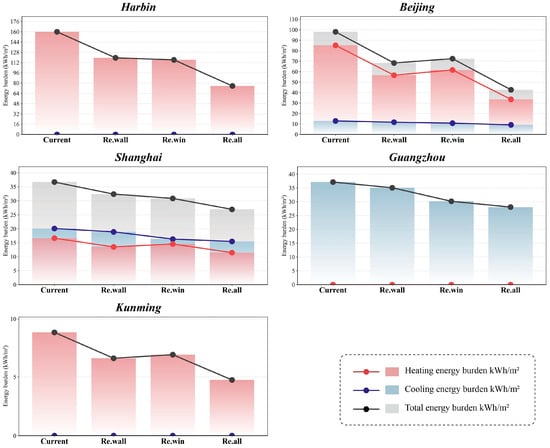
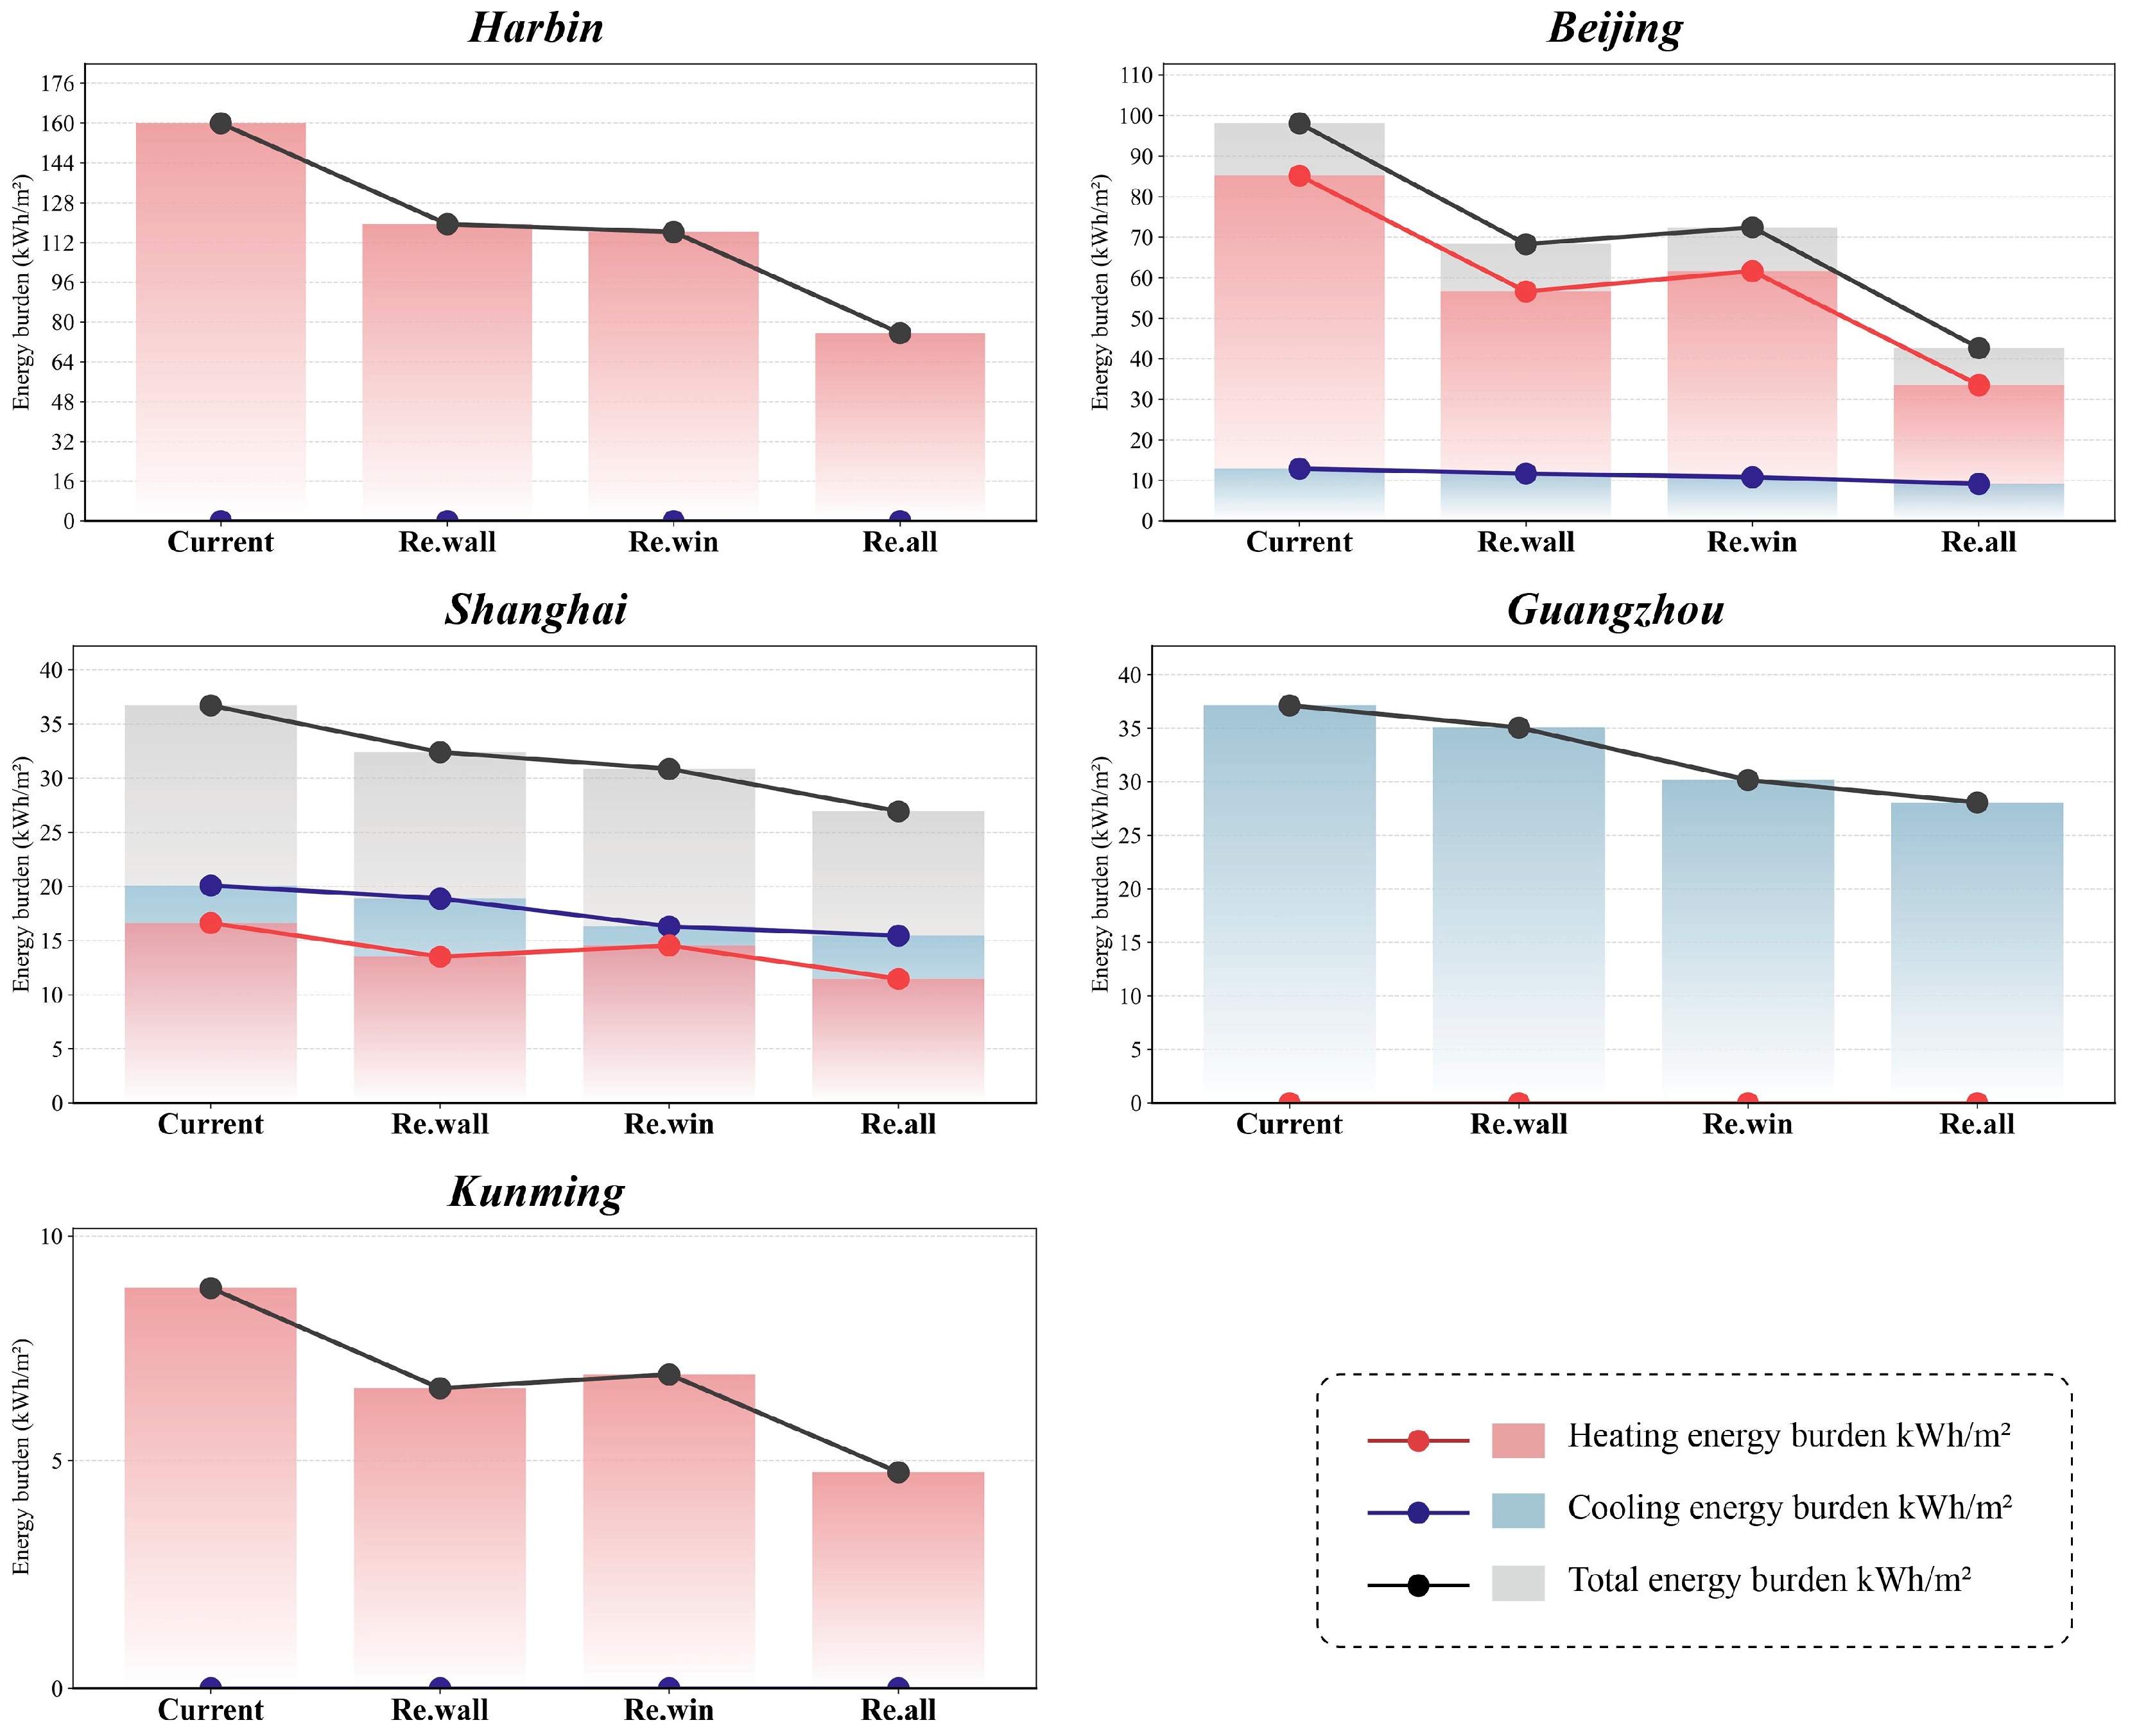

Disclaimer/Publisher’s Note: The statements, opinions and data contained in all publications are solely those of the individual author(s) and contributor(s) and not of MDPI and/or the editor(s). MDPI and/or the editor(s) disclaim responsibility for any injury to people or property resulting from any ideas, methods, instructions or products referred to in the content. |
© 2026 by the authors. Licensee MDPI, Basel, Switzerland. This article is an open access article distributed under the terms and conditions of the Creative Commons Attribution (CC BY) license.