


Abstract
Under extreme summer heat and humidity, the indoor thermal environment and occupants’ thermal adaptability in Lifen dwellings, a high-density residential typology in Wuhan, China, remain insufficiently documented. This study compares summer indoor thermal conditions and thermal comfort between traditional and newly built Lifen dwellings using combined field measurements and questionnaire surveys. Continuous monitoring was conducted in four representative dwellings from 16 to 21 July 2024, together with 192 valid questionnaires collected across the two Lifen communities. Results indicate clear differences in indoor thermal characteristics between the two dwelling types; old Lifen dwellings exhibited stronger perceived heat and more pronounced spatial thermal non-uniformity. Kitchens were identified as the most unfavorable spaces in dwellings. Regression analysis of thermal sensation reveals that residents in old dwellings had a higher neutral temperature than those in new dwellings (27.6 °C versus 26.0 °C) and demonstrated stronger overall thermal adaptability, with a relatively wider comfort range (0.8 °C). Combined evidence from field measurements and subjective voting suggests that long exposure, behavioral adjustment, and ventilation-driven cooling collectively enhance heat tolerance in old Lifen dwellings. These findings provide empirical support for thermal environment optimization and renovation strategies in naturally ventilated historic residential areas.
1. Introduction
1.1. Research Background
Hankou Lifen represents one of the most significant types of modern traditional dwellings in Wuhan, China [1]. Its emergence and development can be traced back to the late 19th and early 20th centuries [2], influenced by the commercialization of the real-estate market and the concession system. Its evolution occurred almost concurrently with comparable traditional residential forms such as Shanghai lilong and Tianjin lifestyle compounds [3]. Architecturally, its spatial layouts, structural forms, and building techniques exhibit a hybrid integration of Chinese and Western characteristics, reflecting the socio-historical context of Wuhan’s urban development while embodying local cultural identity and everyday life patterns.
In terms of morphological characteristics, Hankou Lifen comprises diverse residential types, including shikumen-style and garden-style forms [4]. Its urban fabric is generally characterized by high-density spatial layouts, where features such as courtyards and narrow ventilation alleys contribute to layered semi-open transitional spaces. Façade design often incorporates elements such as louvered windows, recessed openings, and shading eaves, which not only serve functional and esthetic purposes but also act as passive climate responsive strategies for Wuhan’s hot summer and cold winter conditions [5], contributing to improved natural ventilation and indoor thermal performance.
Recent scholarship has primarily focused on commercial revitalization, adaptive reuse [6,7], cultural value, historical inheritance [8,9], and decorative art features [3,10], resulting in systematic discussions on spatial morphology and cultural significance. However, empirical evidence regarding environmental performance, particularly indoor thermal conditions and thermal comfort in Hankou Lifen remains limited. Existing studies predominantly emphasize macro-level conservation strategies or qualitative analyses, whereas quantitative comparisons of thermal comfort among different construction periods, typologies, and user groups remain insufficiently explored.
Under the ongoing context of urban regeneration and historic district revitalization, many Hankou Lifen buildings have been converted into residential, commercial, or mixed-use spaces [11], where indoor thermal conditions directly affect occupants’ comfort and health. Accordingly, systematic investigation combining field-measured data and occupants’ subjective thermal perceptions is necessary to evaluate thermal performance and adaptive comfort characteristics. Such research provides scientific evidence for protective renewal and climate-responsive renovation strategies for historic buildings under contemporary climatic conditions and usage patterns.
1.2. Literature Review
Driven by global warming and rising living standards, research on thermal environments and thermal comfort in residential buildings has increased significantly [12]. This trend is particularly evident in traditional dwellings, where limited HVAC systems heighten the relevance of occupants’ thermal perception and adaptive responses [13,14]. Recent studies commonly combine field measurements with questionnaire surveys, and many summarize regional climate features using the Köppen–Geiger climate classification [15] in Table 1. Findings indicate that occupants demonstrate varying degrees of climate adaptation across extreme cold-arid [16], year-round humid [17], and tropical climates [18], reflecting the crucial role of building typology and climatic context in shaping thermal comfort. In China, diverse climatic regions have given rise to a wide variety of traditional dwellings, such as cave dwellings [19] and stilt houses [20]; yet, research focusing on near-modern brick–stone dwellings like Hankou Lifen remains insufficient.
Table 1.
Summary of existing research.
Existing studies primarily examine occupants’ thermal sensations, thermal-comfort votes, and neutral temperature characteristics [25], with adaptive thermal-comfort models introduced in some cases to interpret climate-based adaptation mechanisms [26]. However, most research is limited to a single building type or region, focusing mainly on climatic variation or overall population level characteristics [27]. Comparative analyses of thermal comfort among different near-modern dwelling types under the same climatic conditions remain lacking. Furthermore, few studies consider the combined effects of construction-period differences and user demographic factors, such as age, on thermal environment [28] and comfort outcomes [29,30]. Building upon the above research gaps, this study advances existing adaptive thermal-comfort research in hot summer and cold winter (HSCW) regions in several aspects.
- (1)
- Unlike previous studies that primarily focus on either vernacular or modern residential buildings, this study conducts a comparative empirical investigation of near-modern brick–stone dwellings Hankou Lifen constructed in different periods but located under the same climatic conditions, enabling the isolation of construction-period and typological effects on indoor thermal environments and comfort responses.
- (2)
- This study provides field-based thermal comfort evidence under persistently high temperature and high humidity conditions, characteristic of Wuhan’s hot–humid summers, with a particular focus on mixed-mode operation (natural ventilation, fans, and air conditioning), which remains underrepresented in existing adaptive comfort studies.
- (3)
- Beyond overall population level analysis, this study explicitly examines the combined effects of dwelling type and user demographic characteristics (e.g., age) on thermal perception, comfort evaluation, and adaptive behavior, offering more fine-grained empirical insights into occupant–environment interactions in traditional residential contexts.
1.3. Research Objectives
This study focuses on representative Hankou Lifen buildings in Wuhan, aiming to empirically investigate their indoor thermal performance and adaptive comfort characteristics in a HSCW climate. The specific objectives are as follows:
- (1)
- To obtain architectural characteristics, indoor thermal environmental parameters, and occupants’ thermal responses through combined field measurements and questionnaire surveys in both newly constructed and traditional Hankou Lifen buildings.
- (2)
- To analyze thermal performance and adaptive thermal-comfort responses across different dwelling types, determine neutral temperatures and comfort ranges, and investigate the influence of architectural morphological characteristics on thermal-comfort.
- (3)
- To compare thermal-comfort differences among distinct user groups using environmental indicators, neutral temperature values, and comfort votes, and to provide renovation and design recommendations for improving comfort conditions in Hankou Lifen buildings.
2. Methodology
2.1. Research Location
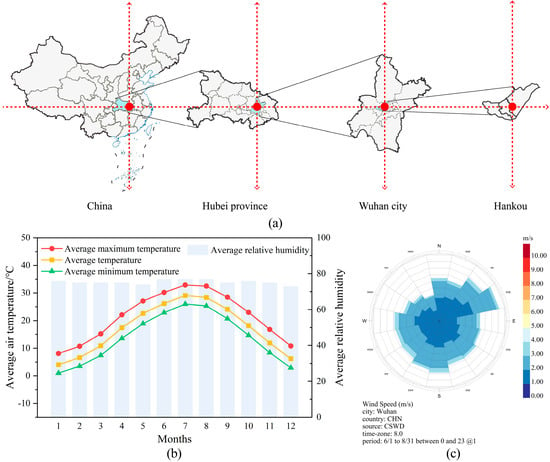
Wuhan is located in Hubei Province in central China, at the confluence of the Yangtze River and the Han River [31] (Figure 1a). During the early modern period, the opening of treaty ports shaped Wuhan into a regional commercial hub, establishing trade connections similar to those of Shanghai and Tianjin, and consequently fostering the emergence of Lifen type dwellings that integrate both Chinese and Western architectural features [32].
Figure 1.
Research location and climate. (a) Location of Hankou. (b) Average temperature and humidity of Wuhan in past 30 years. Data source: http://data.cma.cn. (c) Wuhan summer wind rose. Data source: http://www.cma.gov.cn.
Wuhan is characterized by a typical HSCW climate, with high annual humidity, where relative humidity typically exceeds 70% throughout the year [33]. Summer is notably hot, with mean air temperatures in July reaching up to 32.9 °C [34] (Figure 1b). Hankou, as the main urban area, experiences a pronounced urban heat island effect [35]. To illustrate the outdoor wind conditions during the study period, a summer wind rose diagram was generated, revealing low wind speeds but high frequency of wind occurrence, indicating continuous yet weak ventilation (Figure 1c).
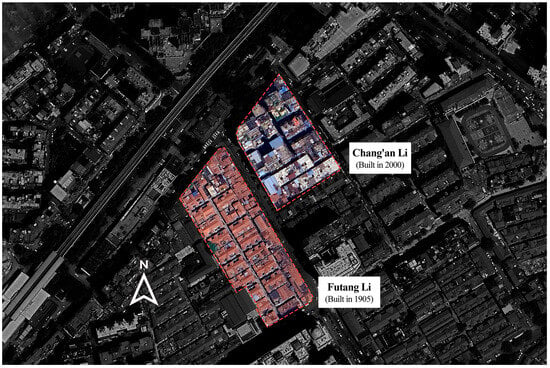
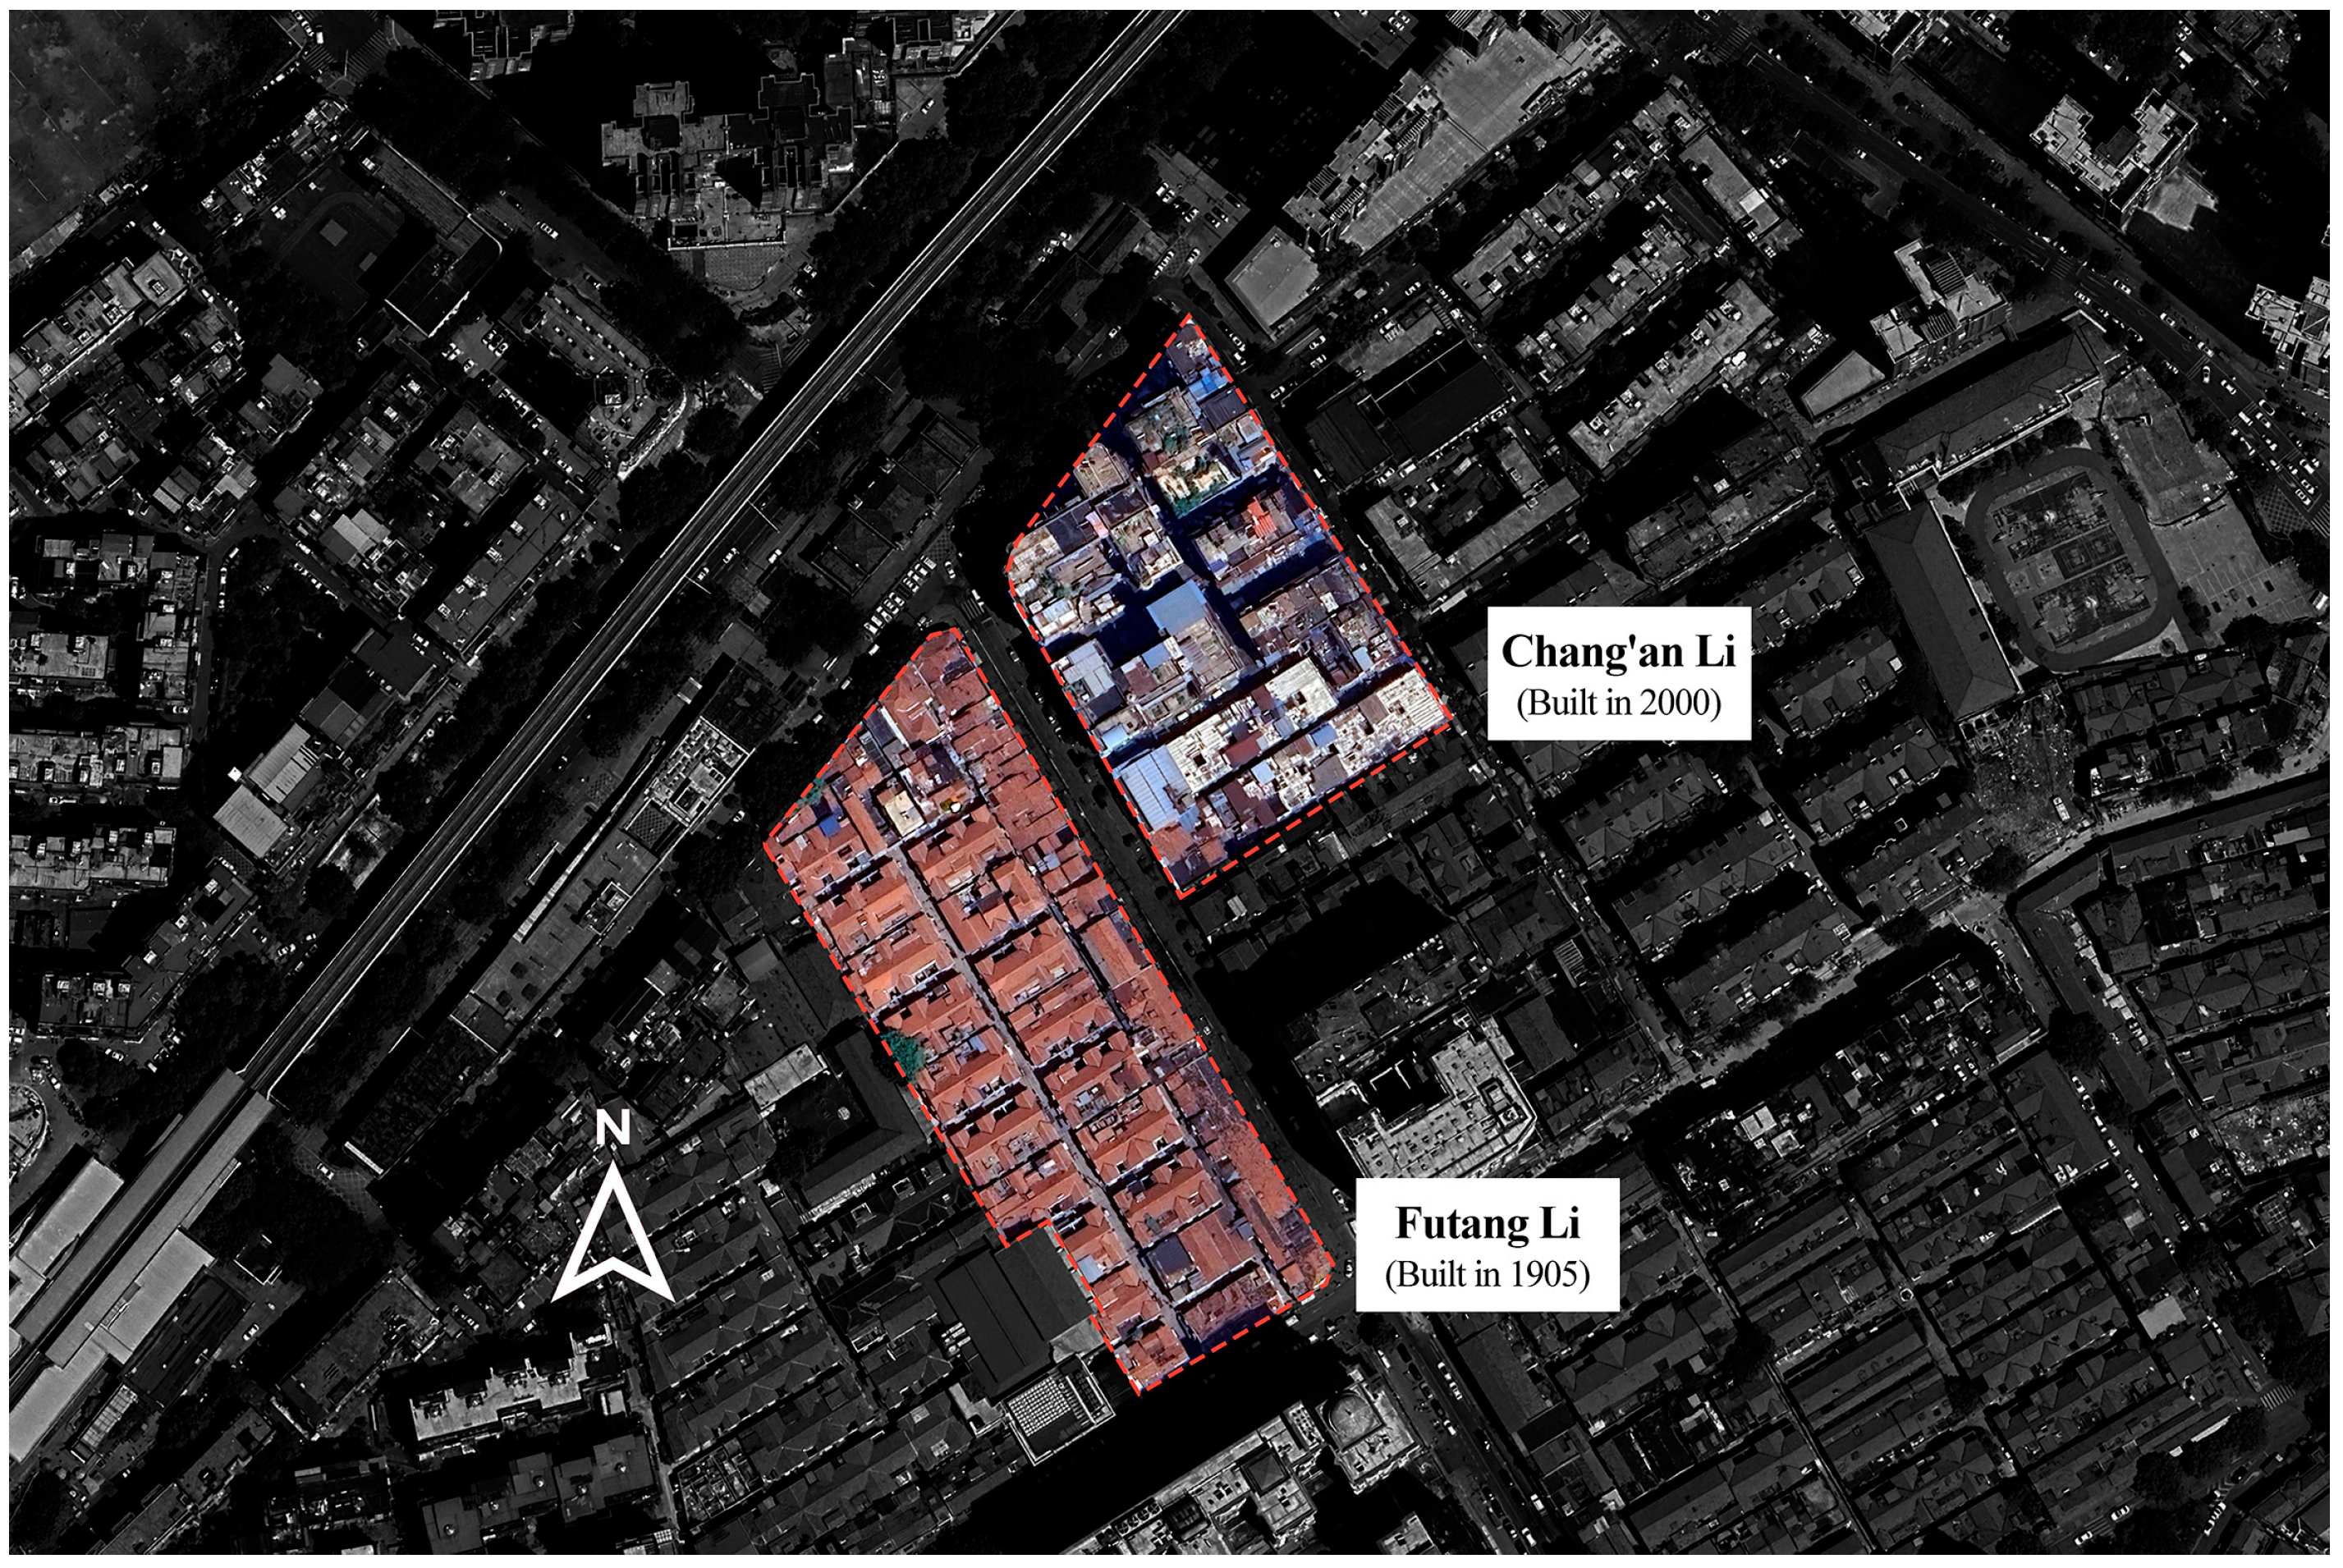
To compare thermal performance and thermal-comfort differences across construction eras, two representative Lifen communities located in Hankou, Wuhan, were selected as field-study sites: Chang’an Li and Futang Li (Figure 2). Chang’an Li, constructed in 2000, represents a modern Lifen style community, whereas Futang Li, dating back to 1905, is a typical near-modern brick–stone settlement that has largely retained its original spatial configuration and residential form, with only minor façade renovations in recent years, such as exterior wall repainting and window replacement.
Figure 2.
Details of the communities studied.
As shown in Figure 2, the internal alley network of Futang Li consists of narrow and elongated passages, including a main street and more confined side streets. Thermal imaging reveals pronounced summer heat accumulation and limited dissipation in these alley spaces. The enclosed and slender morphology of the alleys exerts a direct influence on the outdoor microclimate, contributing significantly to localized heat stress and reduced outdoor thermal comfort.
2.2. Field Measurement
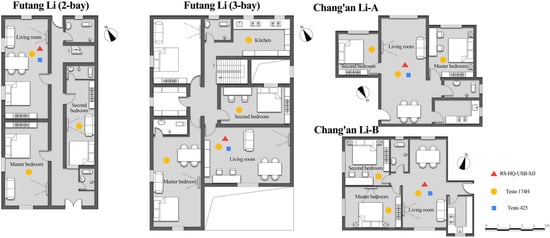
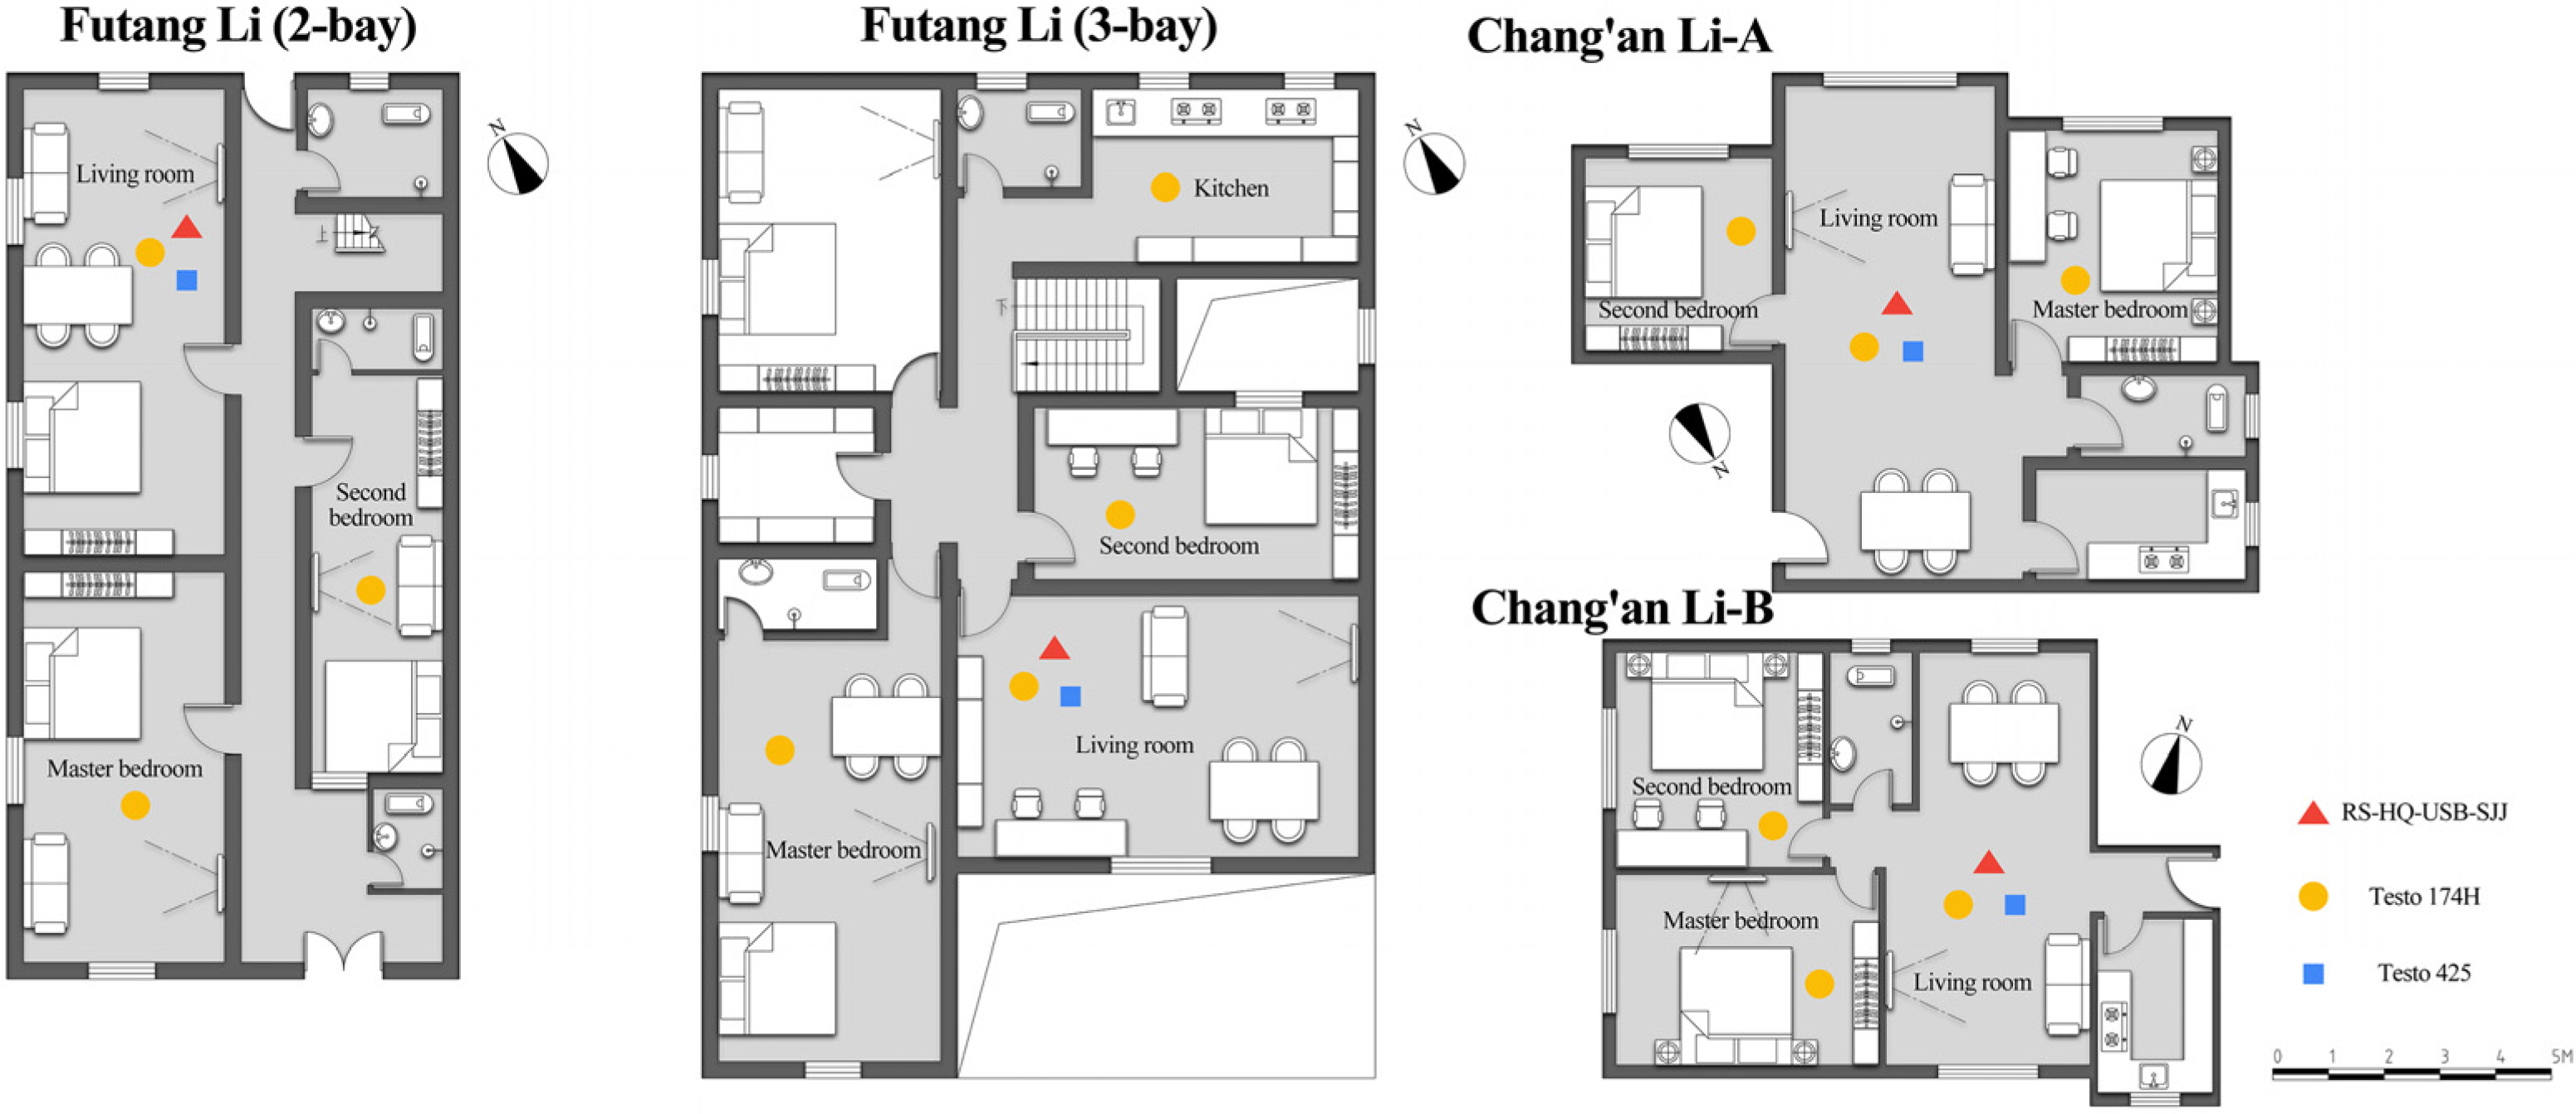
Two representative residential units were selected in each of the Chang’an Li and Futang Li communities to conduct continuous indoor thermal environment monitoring and occupant surveys. The measurement period spanned six days, from 16 to 21 July 2024, with the timing determined based on historical meteorological data and weather forecasts for Wuhan. Post-measurement, the 2024 summer climate data for Wuhan confirmed that the selected period was representative of typical summer conditions in the city. Measurement instruments and their accuracy are summarized in Table 2, while unit layouts and sensor placements are illustrated in Figure 3. The temperature and humidity data logger (Testo 174H) and the hot-wire anemometer (Testo 425) were manufactured by Testo SE & Co. KGaA (Lenzkirch, Germany) while the globe thermometer with tripod (RS-HQ-USB-SJJ) was produced by Jianda Renke Co., Ltd., Jinan, China. All instruments were newly purchased within the past 1–2 years and were calibrated prior to the field measurements.
Table 2.
Instrument parameters and accuracy.
Figure 3.
Plan view and sensor locations.
The on-site measurement included two types of parameters: (1) fixed parameters, measured using instruments placed at designated locations one afternoon prior to the official monitoring to ensure data continuity and accuracy, including globe temperature (Tg), air temperature (Ta), and relative humidity (RH), with a recording frequency set at once every 2 min due to instrument storage limitations; and (2) manually measured parameters for air velocity (Va), with each measurement conducted continuously for 3 min, and the maximum, minimum, and average values recorded using Testo Smart app. A single outdoor reference point was set up near the two communities under unobstructed conditions, using the same temperature–humidity data logger as for the indoor measurements. As the outdoor measurements were taken in an unobstructed environment, the results may differ from standard meteorological data. The arrangement of measurement points and the actual measurement procedures both comply with JGJ/T 347-2014 [36]. The size of the globe can affect the measurement accuracy of the globe thermometer [37,38]. In this study, a 50 mm diameter globe thermometer was used, which complies with the Chinese national standard GBZ/T 189.7-2007 [39]. Air temperature, relative humidity, and globe temperature were measured at a height of 1.1 m above the floor, while air velocity was measured at approximately 1.5 m above the floor.
Regarding sample selection, Chang’an Li included two unit types (Type A and Type B), whereas Futang Li included typical 2-bay and 3-bay traditional Lifen units. Sensor placement focused on spaces with prolonged occupant presence, covering the living room, master bedroom, and second bedroom. For the 3-bay units, as the kitchen is a shared space, an additional measurement point was installed to capture its thermal environment characteristics. Basic information and envelope assemblies of Futang Li and Chang’an Li are summarized in Table 3. The thermal transmittance (U-values) of the envelope components were estimated with reference to Chinese standards GB/T 50785-2012 [40] and GB 50176-2016 [41], as well as international standards ISO 6946 [42] and ISO 10077-1 [43].
Table 3.
Building envelope characteristics and basic information of the two residential types.
2.3. Questionnaire Survey
Questionnaire surveys were conducted concurrently with the field measurements and were limited to residents who had continuously lived in the study communities for at least one year. Prior to the survey, the research objectives and procedures were clearly explained, and informed consent was obtained from all participants. The surveys were administered by two investigators simultaneously: one conducted interview-based questioning and communication, while the other recorded both the on-site environmental parameters and respondents’ answers. A total of 192 valid questionnaire responses were collected, including 87 from Chang’an Li community and 105 from Futang Li community. Of the respondents, 53.6% were male and 46.4% were female; 31.8% were under 25 years old, 42.2% were aged 25–60, and 26.0% were over 60.
The questionnaire consisted of two main sections: (1) objective information of respondents, including gender, age, length of residence, household composition, clothing configuration, metabolic activity level and air-conditioning and ventilation usage patterns; and (2) subjective evaluations of the thermal environment, including thermal sensation, humidity sensation, air movement sensation, and overall thermal comfort votes.
The subjective voting scales were developed in accordance with ASHRAE Standard 55 (2023) [44] and GB/T 50785-2012 [40]. Thermal sensation, humidity sensation, and air movement sensation were assessed using seven-point Likert scales (−3 to +3) [45], while overall thermal comfort was evaluated using a four-point scale ranging from “comfortable” to “terrible.” In addition, respondents were asked to identify key factors influencing their thermal comfort and the behavioral strategies they adopted to alleviate thermal discomfort. Detailed voting scale definitions are provided in Table 4, and basic information of the four monitored residential units is summarized in Table 5.
Table 4.
Subjective sensation and comfort voting scales.
Table 5.
Profiles of the four typical residential units.
2.4. Thermal Comfort Indices
To quantitatively evaluate indoor thermal conditions and occupants’ thermal comfort, operative temperature (Top) [46,47] and the predicted mean vote (PMV) [48] were selected as the primary evaluation indices in this study. Operative temperature integrates the combined effects of air temperature and mean radiant temperature (Tmr) [49] on human heat exchange, and is particularly suitable for indoor environments characterized by low air velocity and significant radiant influences. PMV, derived from human heat balance theory, provides a quantitative prediction of group-mean thermal sensation by accounting for environmental parameters, metabolic rate, and clothing insulation. Accordingly, both indices are widely used in indoor thermal-comfort research and are adopted in standards such as ASHRAE Standard 55 [44].
The concept of operative temperature was initially introduced by Winslow et al. and later systematically developed within Fanger’s thermal-comfort framework. For indoor environments with low air velocity, Tmr can be derived from globe temperature measurements. According to ISO 7726 [50], this study calculated Tmr based on globe temperature and subsequently determined the operative temperature. Due to the narrow spacing between buildings in both residential communities, the measured indoor air velocity in all monitored spaces ranged from 0 to 0.187 m/s and remained below 0.2 m/s. Under such low air velocity conditions (Va ≤ 0.2 m/s), the operative temperature can be approximated as the arithmetic mean of the air temperature and the Tmr. Therefore, the operative temperature was calculated using Equation (1).
where Top is the operative temperature (°C). Tmr is the mean radiant temperature.
The PMV model used in this study was originally developed by Fanger based on steady state human heat balance theory and is widely accepted for predicting the mean thermal sensation of large groups under defined thermal environmental conditions. This model integrates key environmental variables (air temperature, mean radiant temperature, air velocity, and relative humidity) with personal factors (metabolic rate and clothing insulation) to estimate the predicted mean vote. The equation of PMV was shown in Equation (2).
where M is the metabolic rate (W/m2), L is the thermal load on the human body (W/m2).
This study utilized the CBE Thermal Comfort Tool [51], an online calculator developed by the Center for the Built Environment at the University of California, Berkeley, to compute PMV values. The tool provides a convenient and efficient means of PMV calculation by directly inputting the relevant environmental and personal parameters. It should be noted that, even under sedentary conditions with low metabolic rates, slight body movements can influence the relative air velocity around the human body. However, this effect is simplified and not explicitly accounted for in the CBE Thermal Comfort Tool, which assumes a uniform air velocity input. As a result, the calculated PMV values may involve a certain degree of uncertainty, particularly given the high sensitivity of PMV to air velocity and mean radiant temperature [52]. Nevertheless, the tool is widely adopted in thermal-comfort research and is designed to generate PMV results consistent with the calculation frameworks of ASHRAE Standard 55 and ISO 7730 [53].
3. Results and Discussion
Given the close coupling between field measurements and their interpretation, Section 3.1, Section 3.2, Section 3.3, Section 3.4 and Section 3.5 adopt a combined results and discussion structure.
3.1. Outdoor Environment
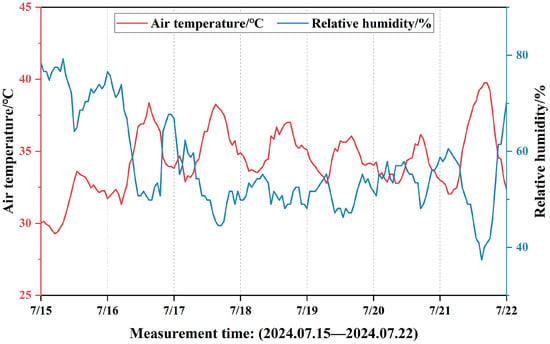
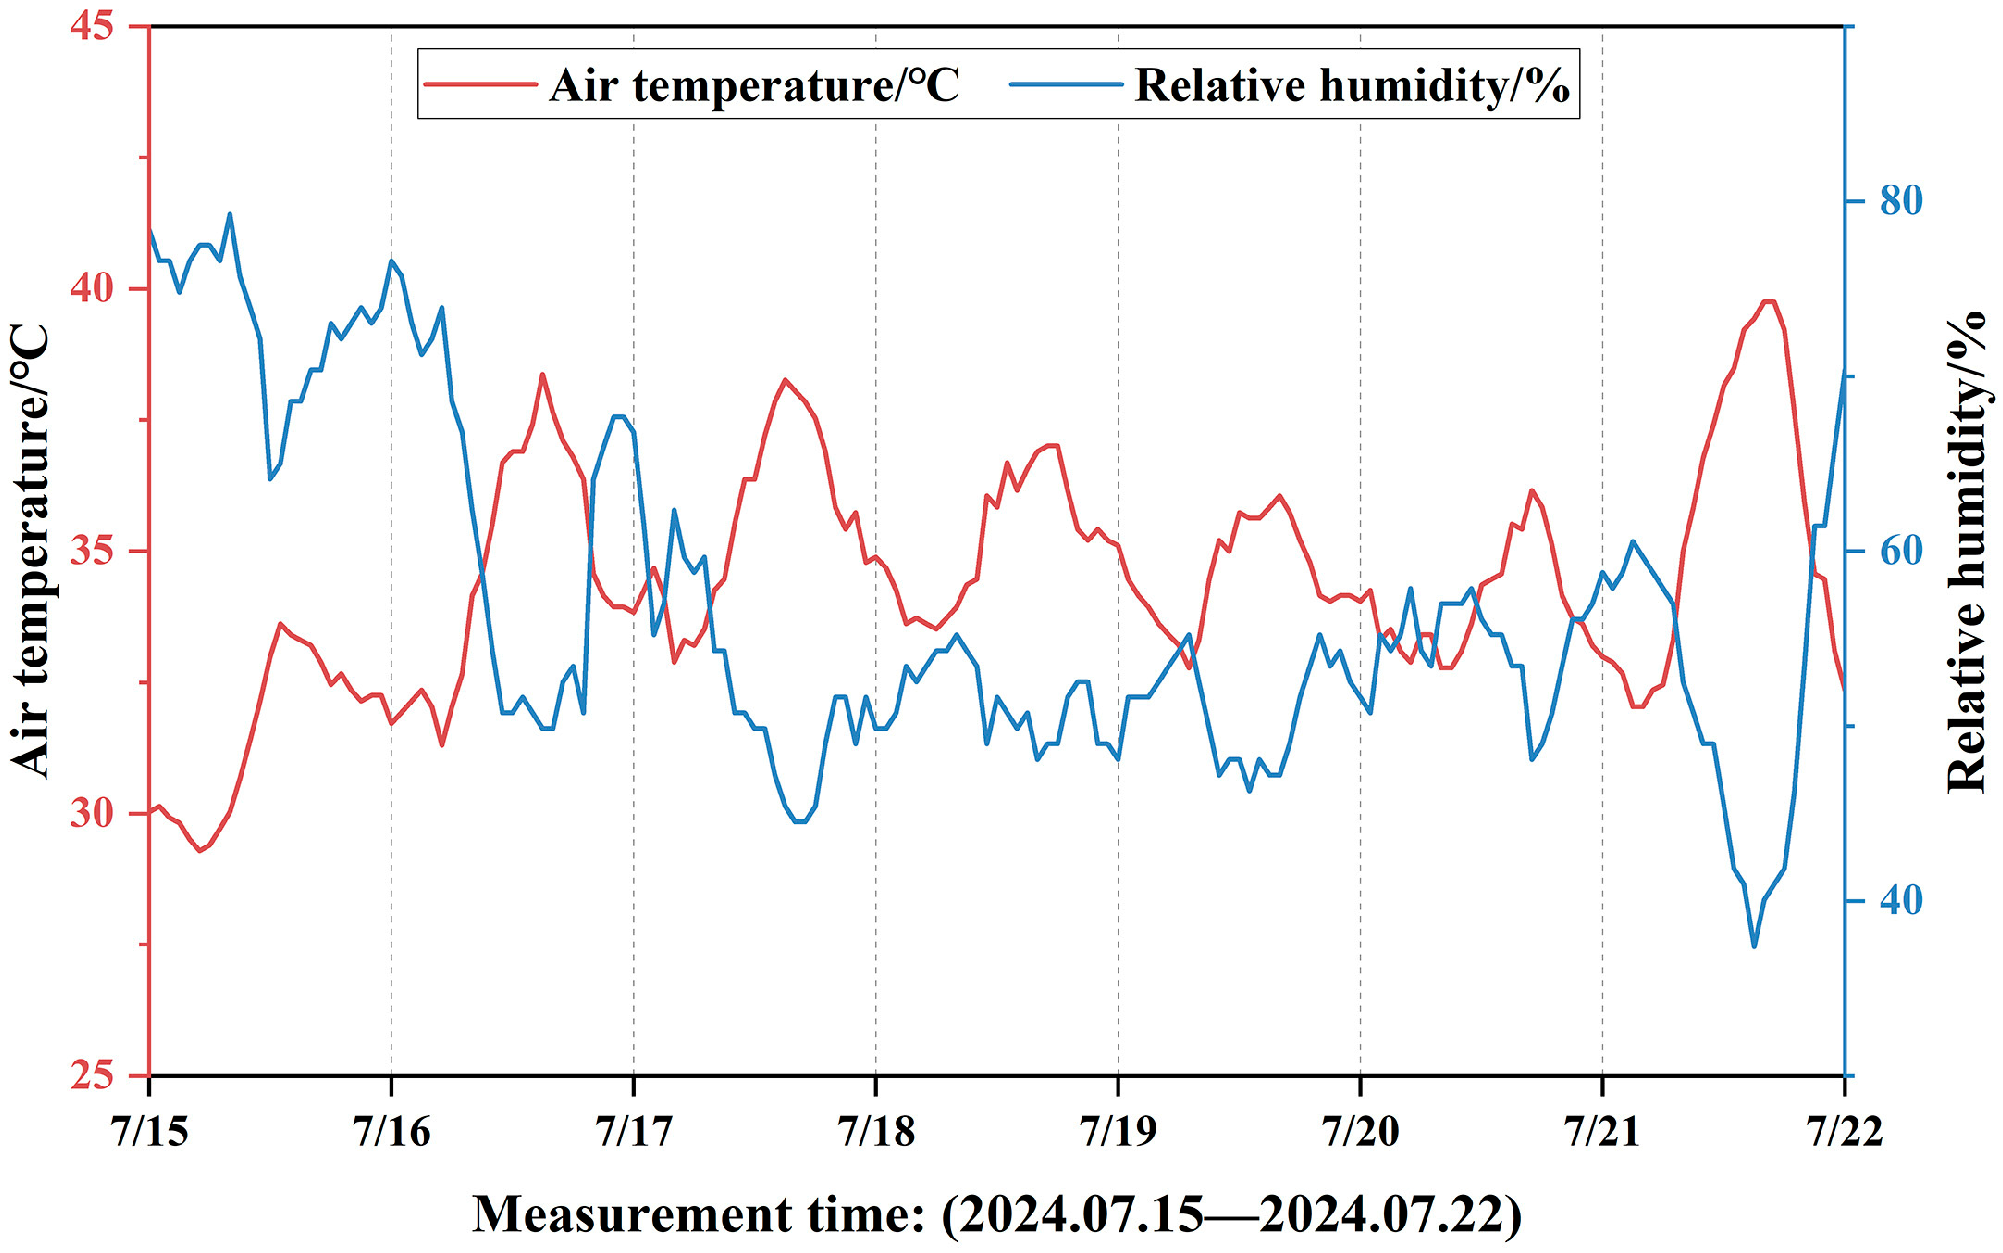
The outdoor meteorological parameters monitored during the measurement period (15–21 July 2024) are presented in Figure 4. The monitoring period coincided with the typical “Sanfu” [54,55] period in Wuhan, which is characterized by persistent high temperature and high humidity. As shown in Figure 4, the outdoor air temperature fluctuated between approximately 29 and 39 °C, with early-morning minima of about 29–31 °C and afternoon peaks reaching 36–38 °C, approaching 40 °C during certain periods, indicating an extremely severe summer thermal environment. Relative humidity exhibited an inverse diurnal pattern compared to air temperature, remaining at 70–80% during nighttime and early morning and decreasing to approximately 40–60% around midday.
Figure 4.
Outdoor environmental parameters.
The monitored conditions show strong consistency with the summer climate characteristics of the typical meteorological year (TMY) [56] for Wuhan, indicating that the selected week is representative of extreme hot weather conditions. Consequently, the monitored data reliably represents outdoor thermal exposure experienced by residents under typical summer heat stress conditions. Moreover, the combination of sustained high temperature and humidity with insufficient nocturnal cooling suggests a pronounced heat-accumulation effect in the urban outdoor environment, potentially increasing residents’ reliance on mechanical cooling systems such as air conditioning.
3.2. Indoor Environment
3.2.1. Old Dwelling Environment
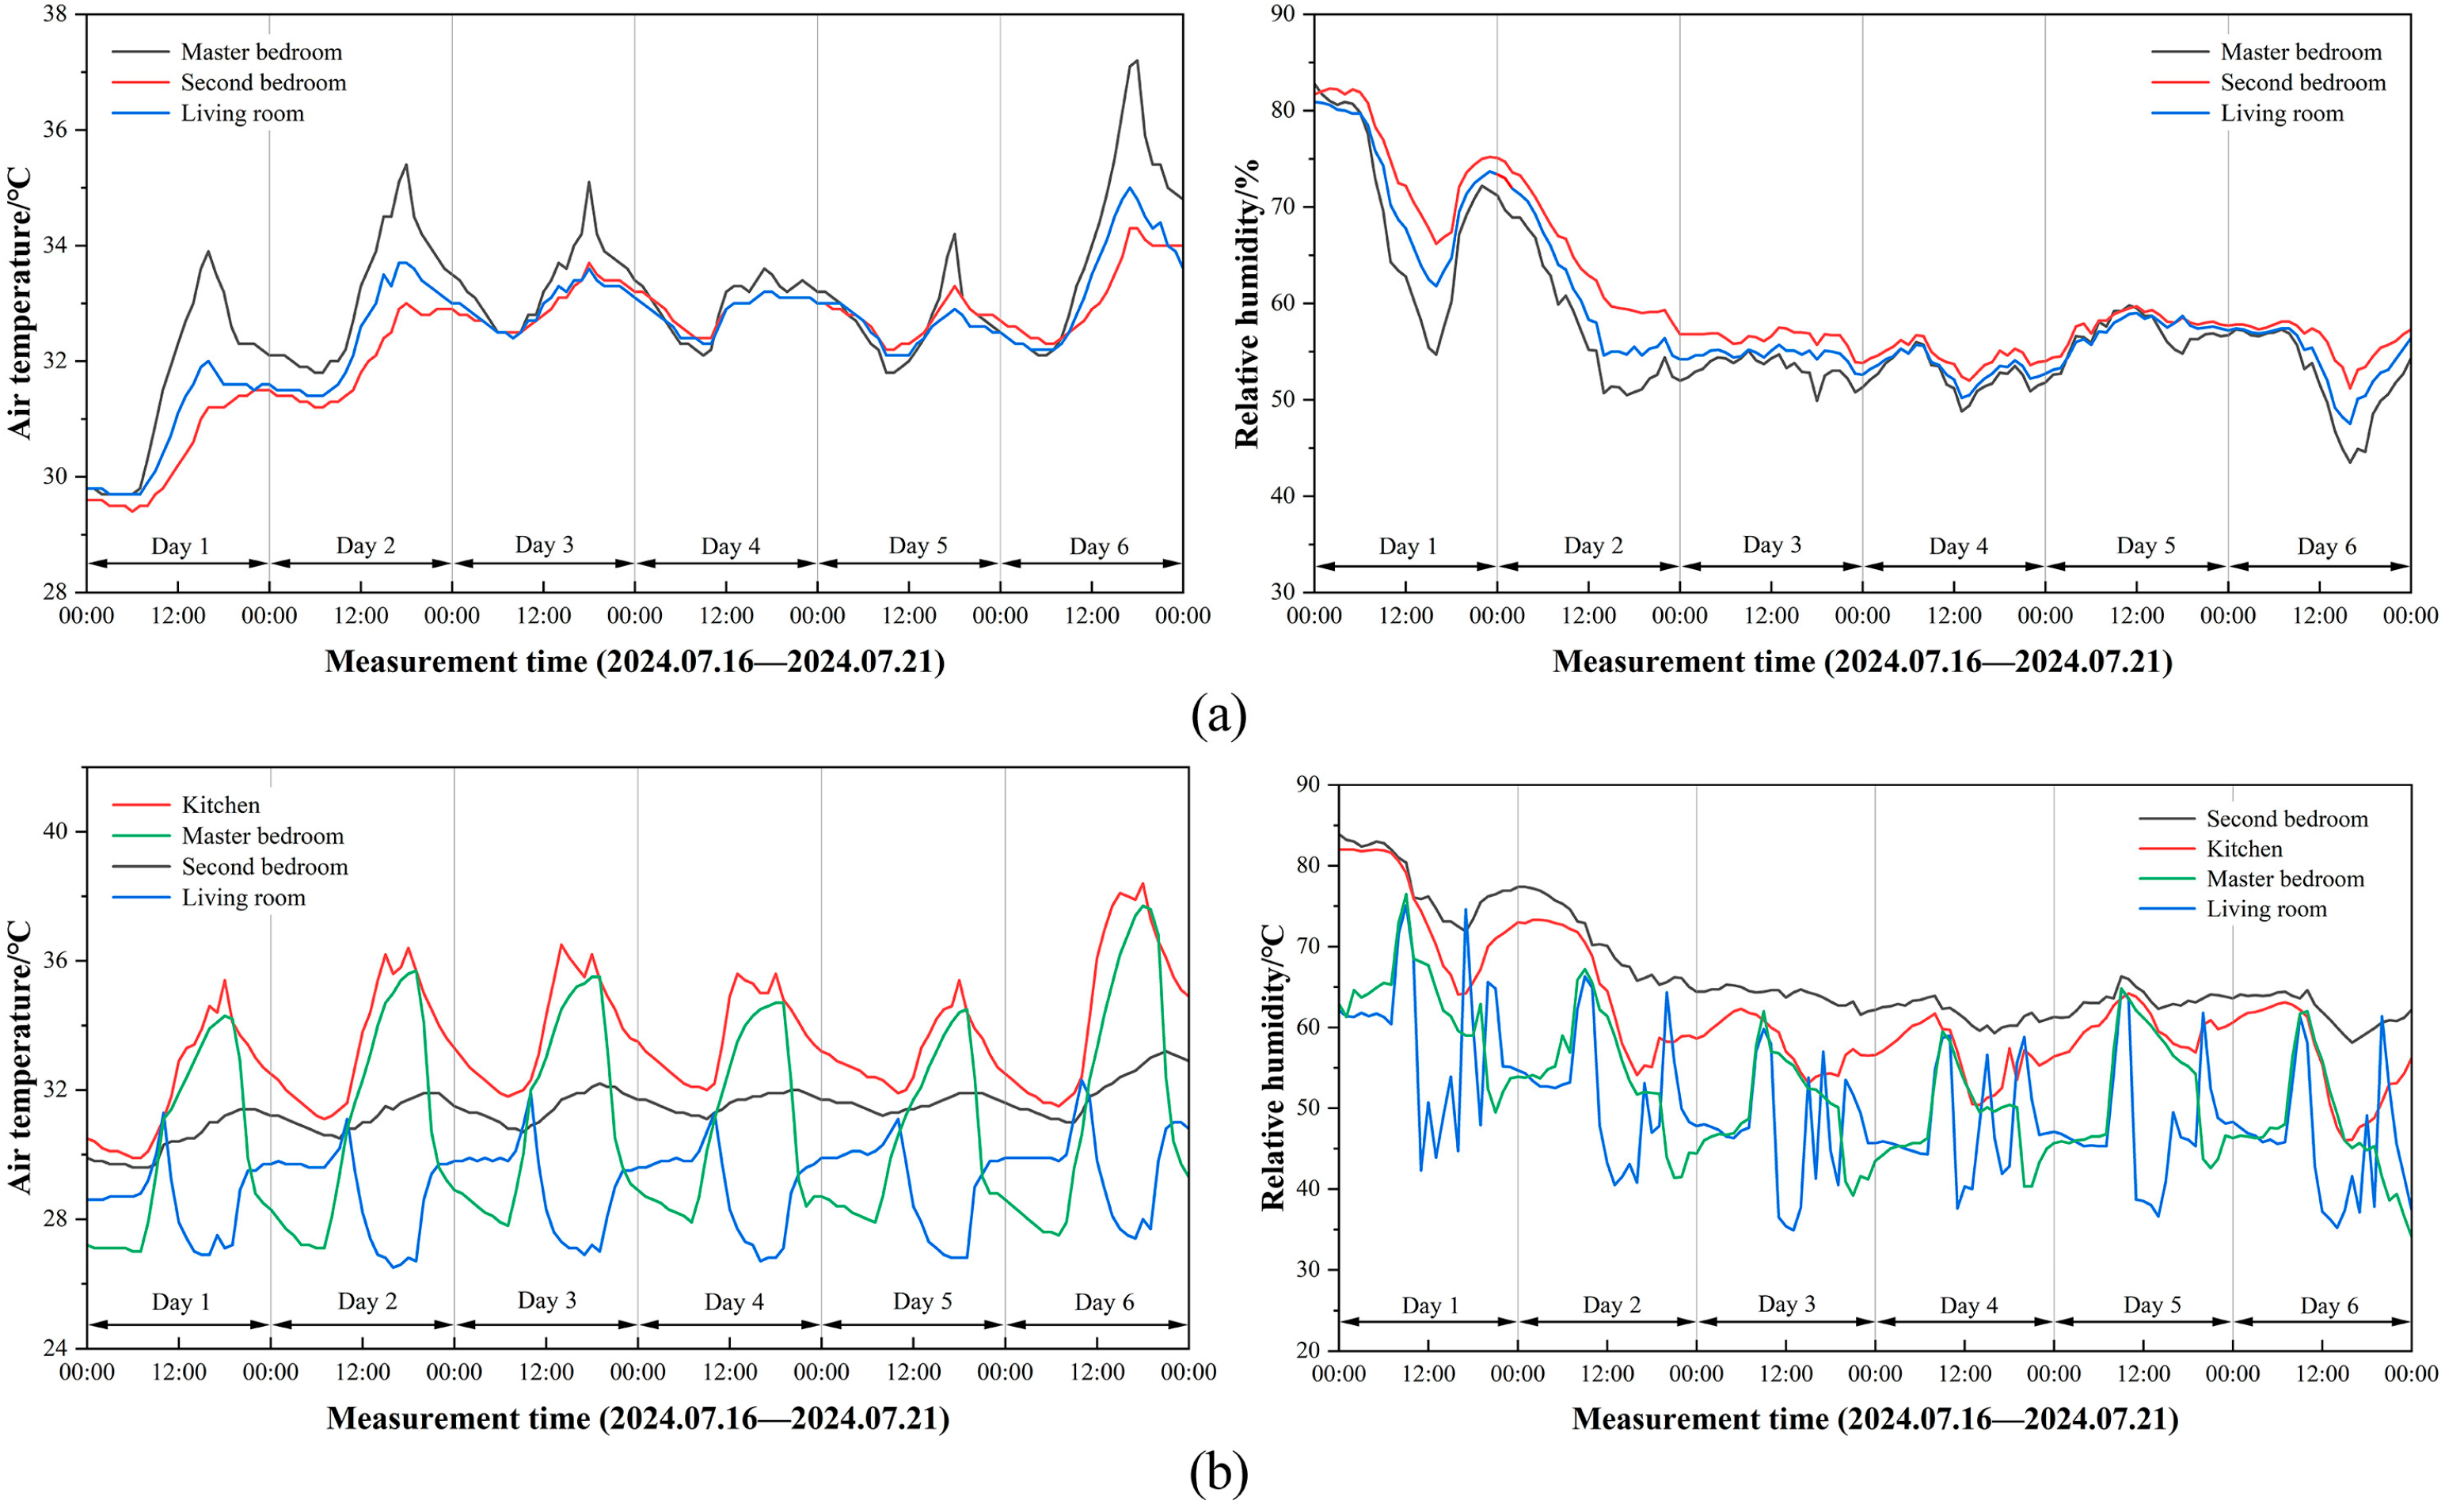
The indoor thermal monitoring results of the two old residential dwellings are illustrated in Figure 5, and the corresponding maximum, minimum, mean, and standard deviation values are summarized in Table 6. The results indicate pronounced differences in indoor thermal conditions between the two old dwellings during the summer period. In the 2-bay dwelling (Figure 5a), the mean indoor air temperature ranged from 32.1 to 33.0 °C, exhibiting relatively stable thermal conditions. By contrast, the 3-bay dwelling (Figure 5b) achieved a minimum mean indoor temperature of 29.0 °C under air-conditioning operation. Notably, the second bedroom in the 3-bay dwelling, which was also naturally ventilated, exhibited a lower mean temperature (31.4 °C) and reduced variability (SD = 0.72) compared with the fan assisted room in the 2-bay dwelling. This difference can be attributed to the east-facing orientation, which reduced afternoon solar radiation, as well as the heat transfer cooling effect through partition walls induced by air-conditioning operation in the adjacent living room [57].
Figure 5.
Indoor thermal environment in old dwelling. (a) Futang Li (2-bay). (b) Futang Li (3-bay).
Table 6.
Statistical summary of indoor thermal parameters in old dwellings.
The kitchen was identified as the most thermally adverse space, with a maximum temperature reaching 38.4 °C. Influenced by cooking activities, pronounced temperature peaks were observed around noon and approximately 18:00, indicating rapid heat accumulation within a short period. Given the limited time occupants spend in kitchens and the extreme environmental conditions observed, kitchen data were not included in the regression analysis. In terms of humidity, the 2-bay dwelling consistently maintained a humid condition of approximately 60%. In contrast, the living room of the 3-bay dwelling experienced substantial dehumidification due to air conditioning, with the minimum relative humidity dropping to 34.9%. Consequently, a pronounced temperature–humidity gradient and strong spatial non-uniformity were observed within the same dwelling, which is a typical characteristic of old residential buildings under localized mechanical cooling [58].
3.2.2. New Dwelling Environment
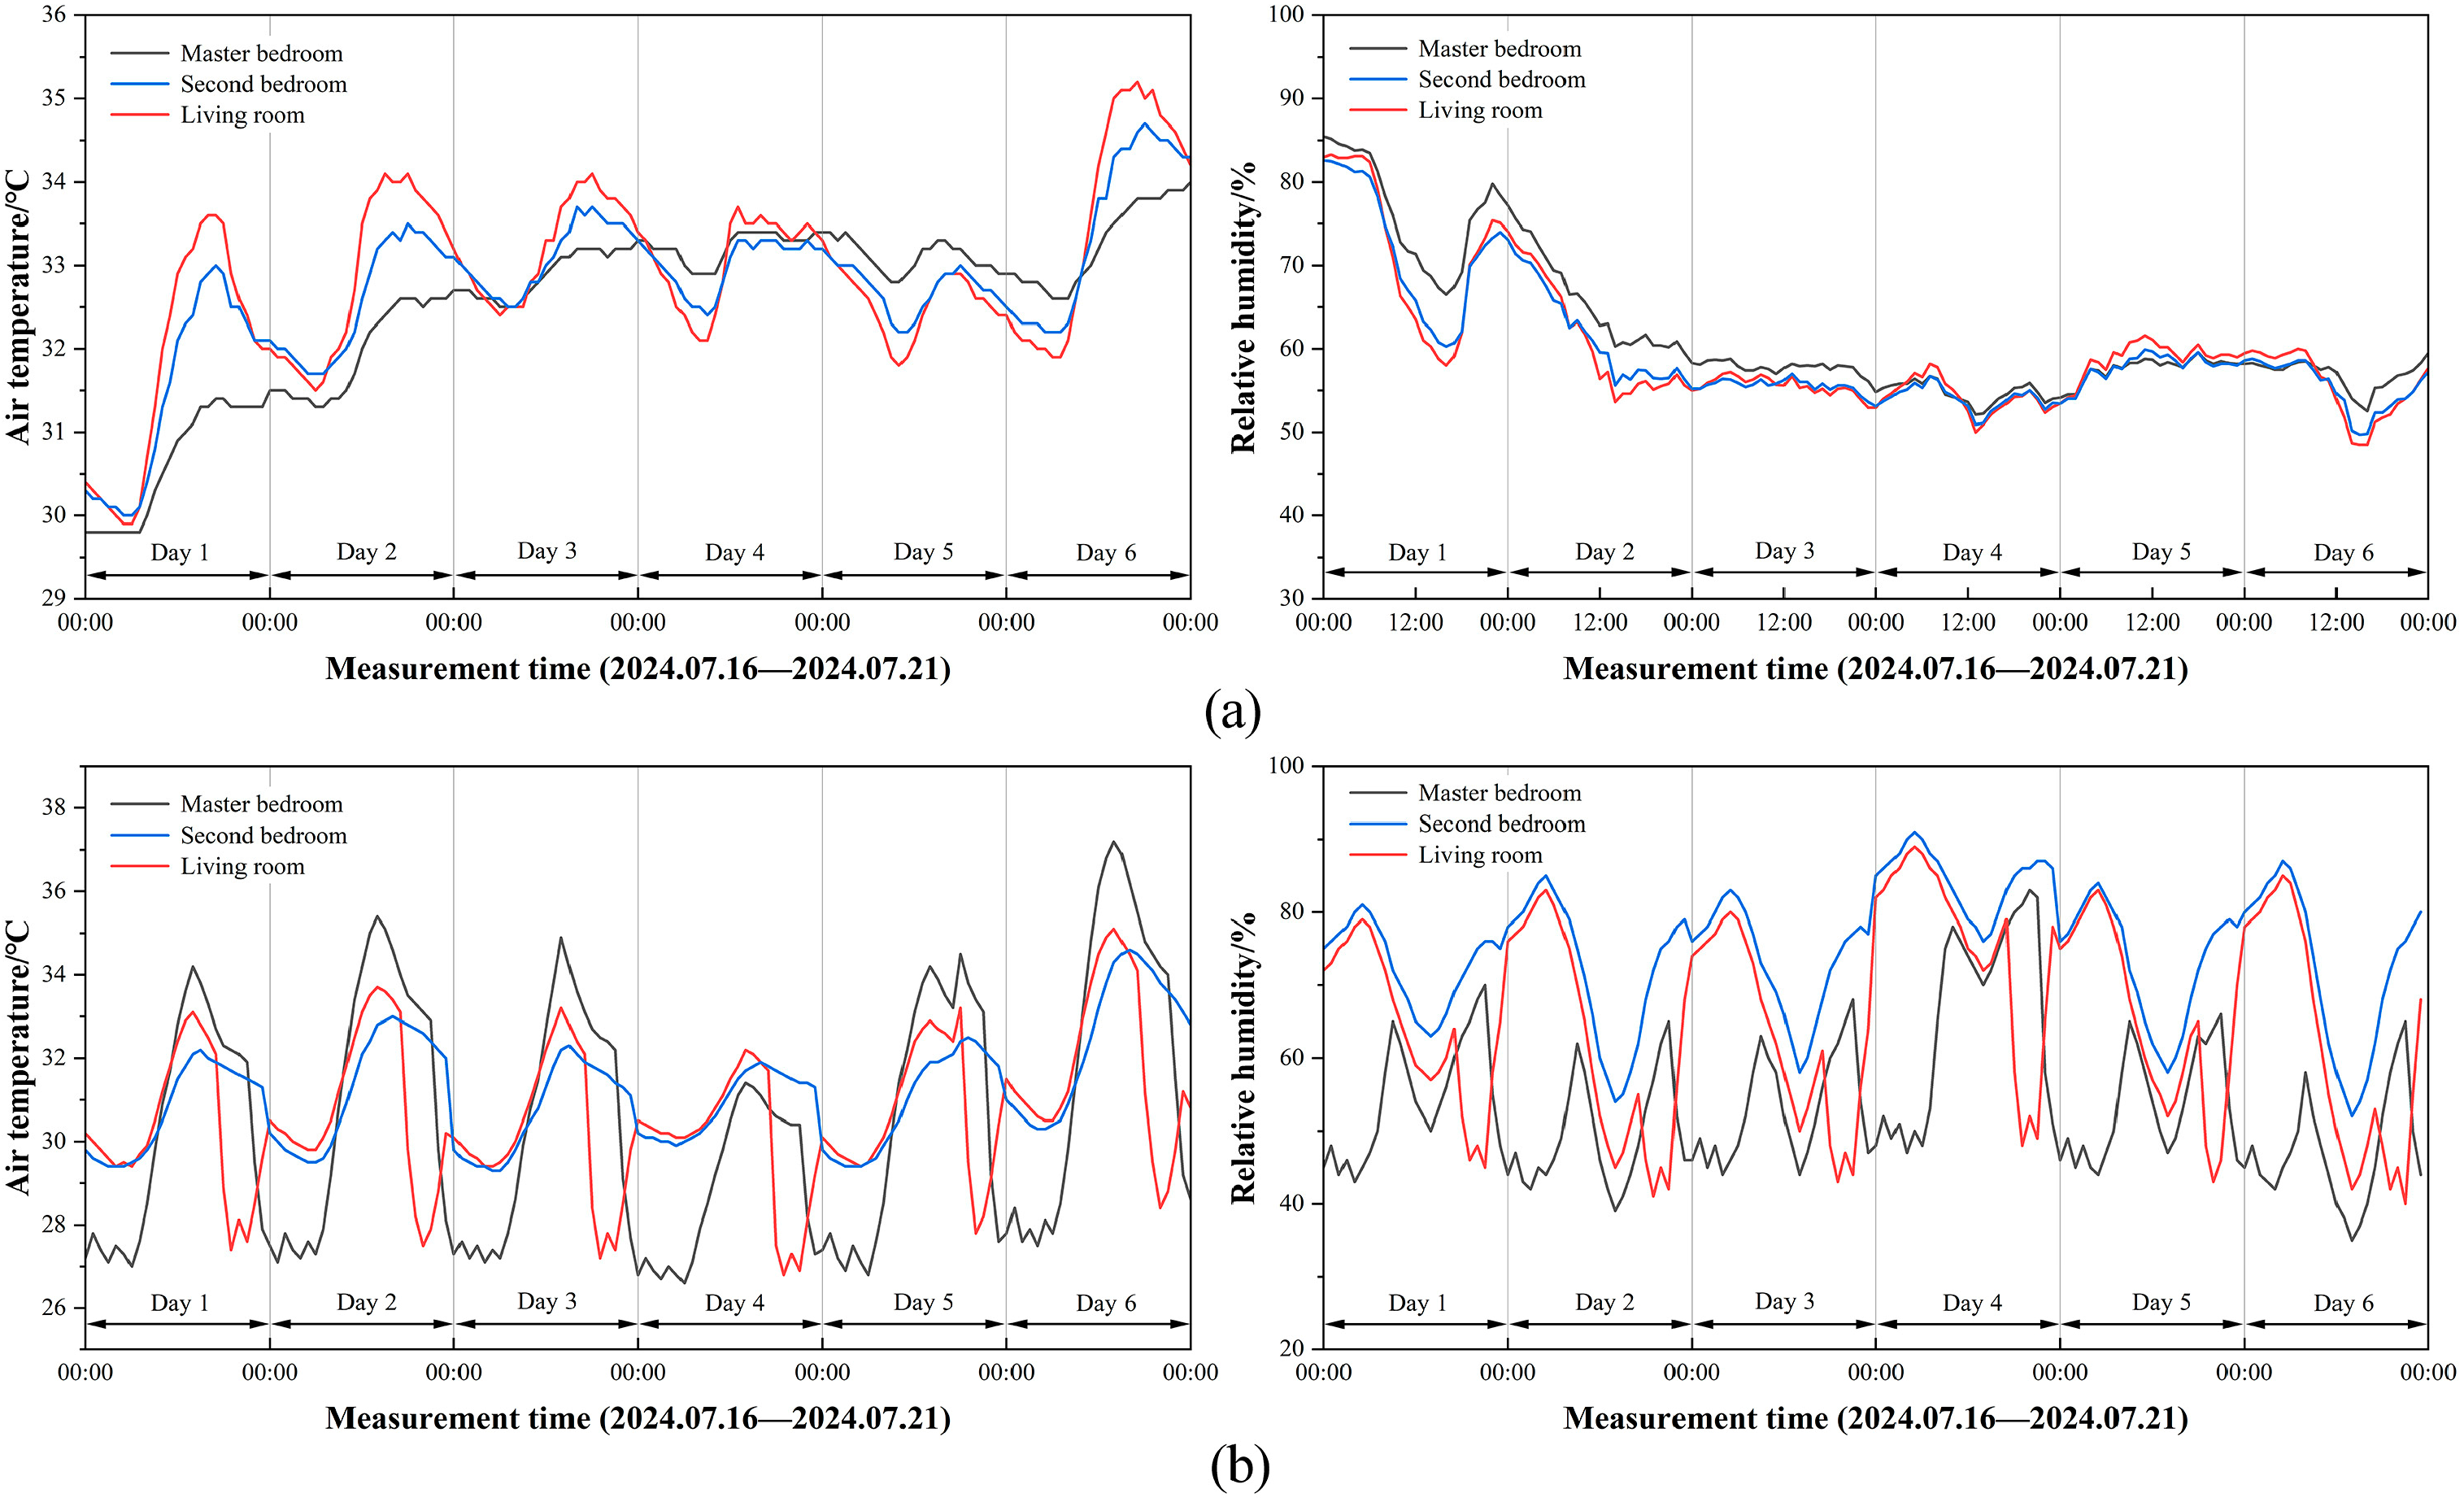
The measured indoor thermal conditions of the two new dwellings, Chang’an Li–A and Chang’an Li–B, are presented in Figure 6 and Table 7. In Building A, western solar exposure was effectively avoided, resulting in a relatively stable indoor thermal environment. The average indoor air temperature ranged from 32.0 to 32.9 °C, with standard deviations below 1.1 °C. Relative humidity remained at approximately 60%, indicating a stable warm and humid condition, under which occupants mainly relied on electric fans and individual thermal tolerance to maintain comfort. In Building B, air conditioning was operated only in the master bedroom and the living room, leading to lower daily average temperatures of 30.6 °C and 31.2 °C, respectively. Notably, although the second bedroom was not mechanically cooled, its mean temperature (31.2 °C) was still lower than that of the rooms in Building A, with a relatively small standard deviation of 1.34 °C. This phenomenon suggests a “passive cooling” effect induced by cooling energy transfer from the adjacent air-conditioned master bedroom and living room.
Figure 6.
Indoor thermal environment in new dwelling. (a) Chang’an Li–A. (b) Chang’an Li–B.
Table 7.
Statistical summary of indoor thermal parameters in new dwellings.
3.3. Thermal Sensation and Comfort Range Analysis
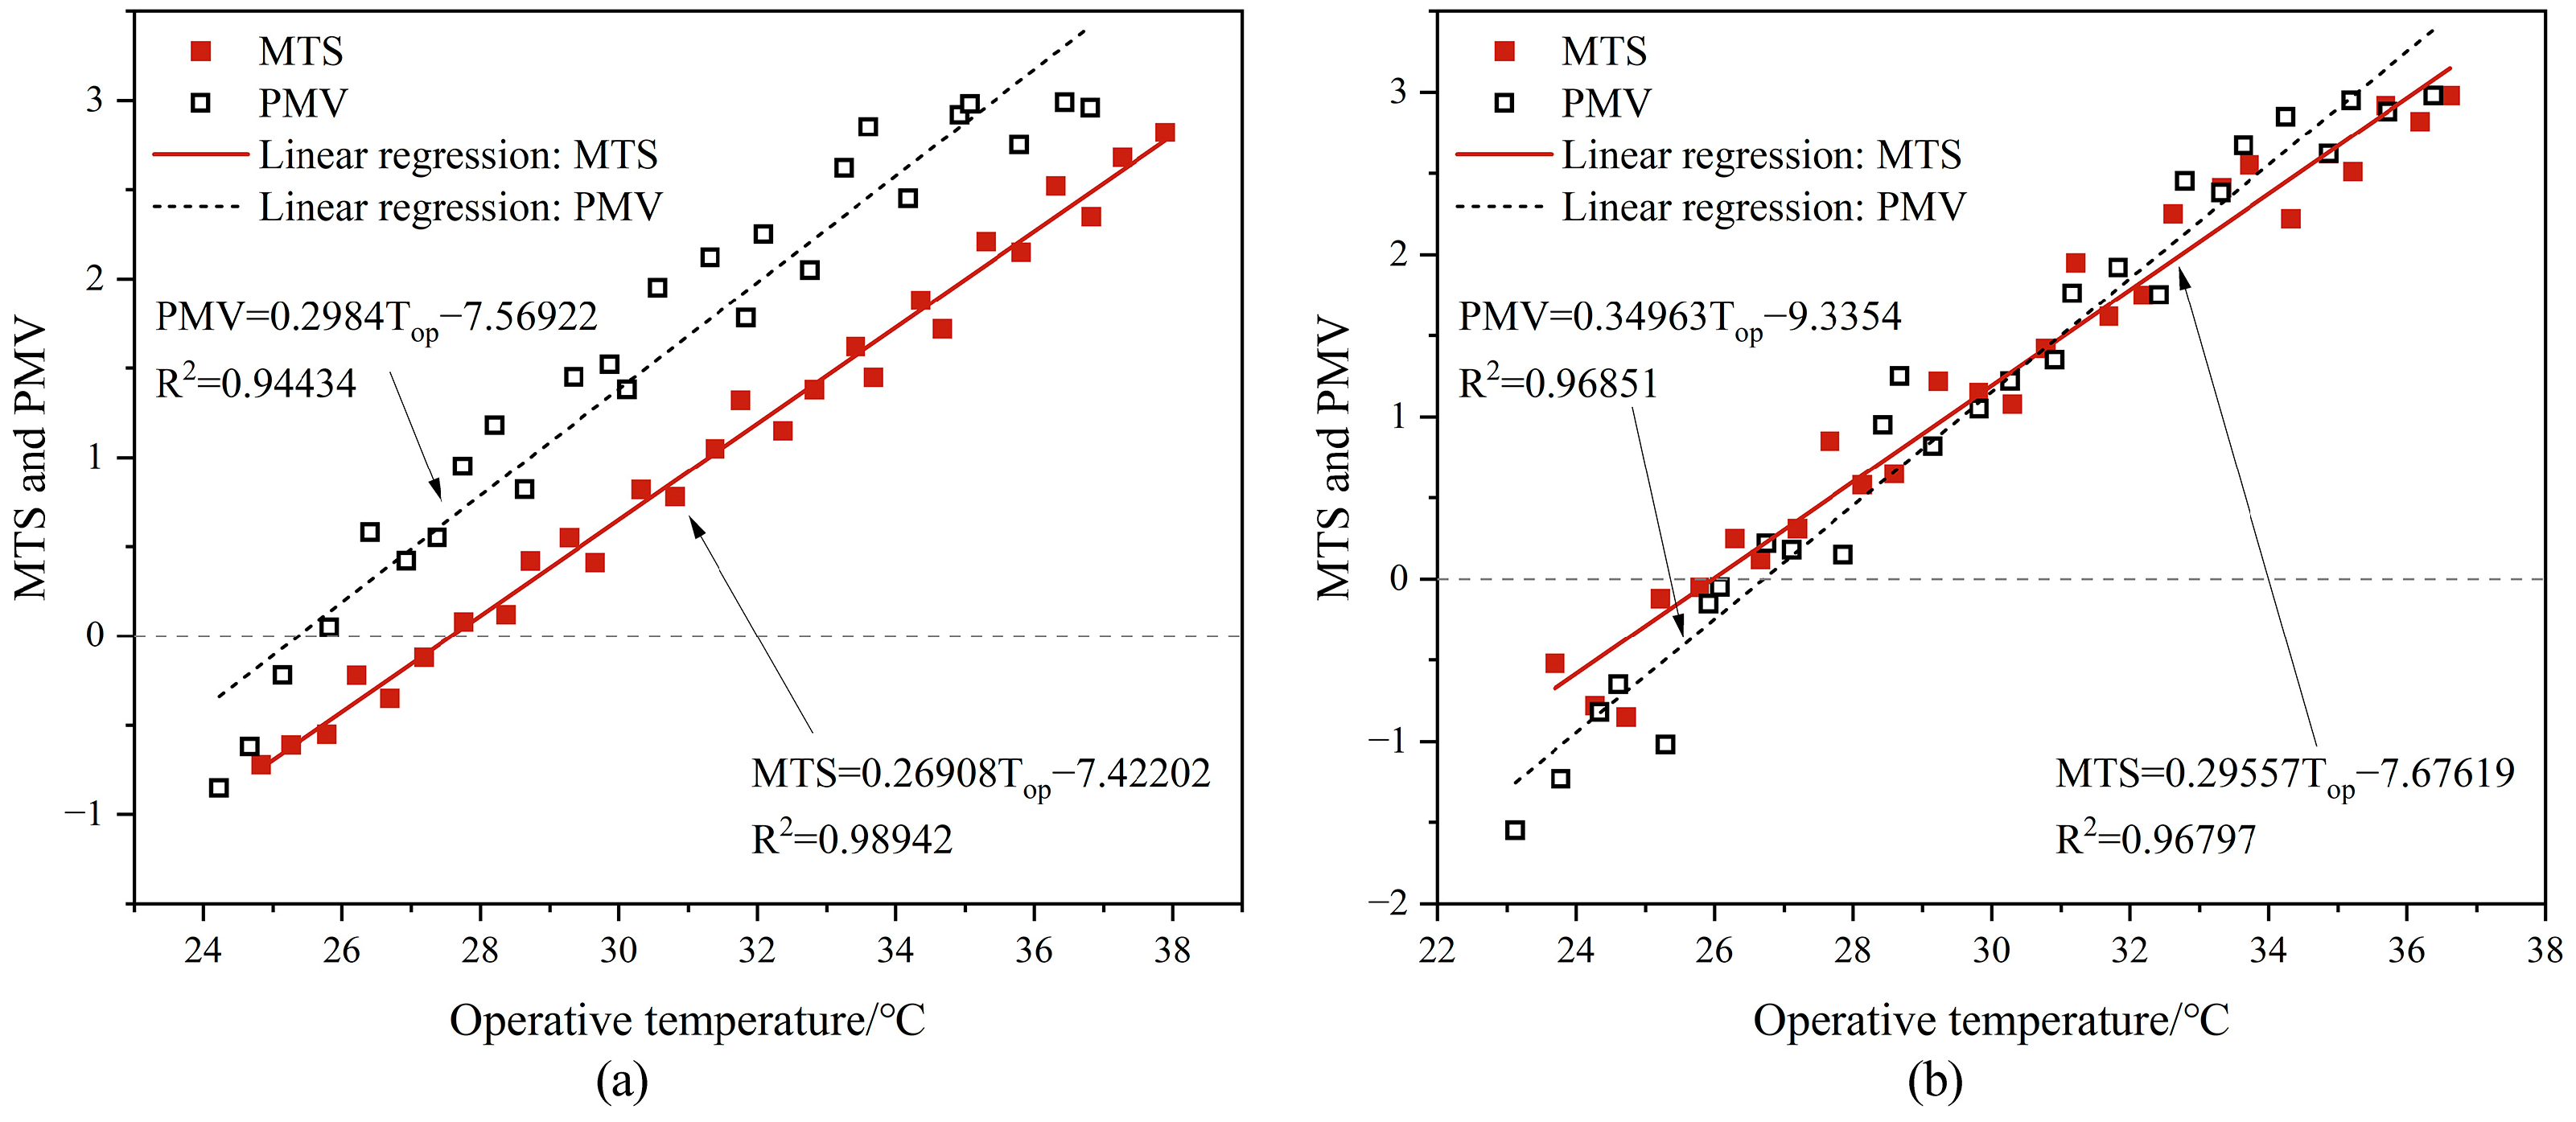
Based on Equation (1) in Section 2.4, the operative temperature corresponding to each questionnaire record was calculated. According to the questionnaire survey and on-site observations, occupants were mainly in relaxed, seated or standing postures during the monitoring period. Based on these observed activity levels and the thermal resistance values of typical adult male and female summer clothing in China specified in GB/T 50785-2012 [40], the metabolic rate and clothing insulation were determined as approximately 1.2 met and 0.4 clo, respectively. The operative temperature, metabolic rate, and clothing insulation were then input into the Berkeley thermal comfort tool [46] to calculate PMV values. According to ISO 7730 [53], the PMV model is valid only within specific ranges: air temperature (Ta) between 10 and 30 °C, and Tmr between 10 and 40 °C; however, some of the measured temperatures in this study exceeded these ranges. The temperature frequency method [59] was applied by grouping operative temperature at 0.5 °C intervals. Operative temperature was plotted on the x-axis, while mean thermal sensation (MTS) and calculated PMV were plotted on the y-axis to form the scatter plots shown in Figure 7.
Figure 7.
Comparison of fitted curves between operative temperature and MTS/PMV during summer in Lifen dwellings: (a) old dwellings, (b) new dwellings.
Separate linear regression analyses were conducted for MTS and PMV datasets for old and new dwellings, with the regression parameters summarized in Table 8. The slope of the fitted curve reflects occupants’ thermal sensitivity to changes in the operative environment and is commonly interpreted as an indicator of adaptive capacity rather than a direct measure of adaptation. A smaller slope suggests reduced sensitivity to changes in operative temperature and is therefore often associated with stronger adaptive capacity, the intercept of the regression curve corresponds to the neutral thermal state and is used to determine the neutral operative temperature [60]. The MTS slope for old dwellings (0.2691) is notably lower than that for new dwellings (0.2956), suggesting lower thermal sensitivity and, by common interpretation, stronger adaptive capacity among residents in old dwellings. A similar pattern is observed for PMV, with slopes of 0.2984 for old dwellings and 0.3496 for new dwellings, indicating a steeper predicted thermal response in new dwellings.
Table 8.
Thermal comfort model parameters for Lifen dwellings.
In terms of neutral temperature, the MTS-derived neutral operative temperature in old dwellings is 27.6 °C, which is 1.6 °C higher than that in new dwellings (26.0 °C), indicating that residents in old dwellings can tolerate higher indoor temperatures [61]. In contrast, PMV derived neutral temperatures show an opposite trend, with 25.4 °C for old dwellings and 26.7 °C for new dwellings, suggesting that PMV substantially underestimates heat tolerance in old dwellings, which may also be attributed to the inclusion of naturally ventilated spaces in both the questionnaire survey and field measurements, where PMV is known to exhibit larger deviations.
By substituting −1 and +1 into the regression equations, the thermal-comfort ranges for residents in new and old dwellings were determined. Further comparison of thermal comfort-ranges shows that the MTS comfort range in old dwellings spans 23.7–31.3 °C (7.6 °C), approximately 1 °C wider than that in new dwellings (22.6–29.4 °C, 6.8 °C). Although PMV also indicates a relatively wide comfort range for old dwellings (22.0–28.8 °C), the entire range is shifted toward lower temperatures, failing to capture occupants’ actual adaptive behavior. Overall, quantitative differences in slope, neutral temperature, and comfort range consistently demonstrate stronger thermal adaptability in old dwellings, while PMV tends to overestimate thermal sensation intensity in both dwelling types, particularly in old dwellings.
3.4. Resident Thermal Perception Differences
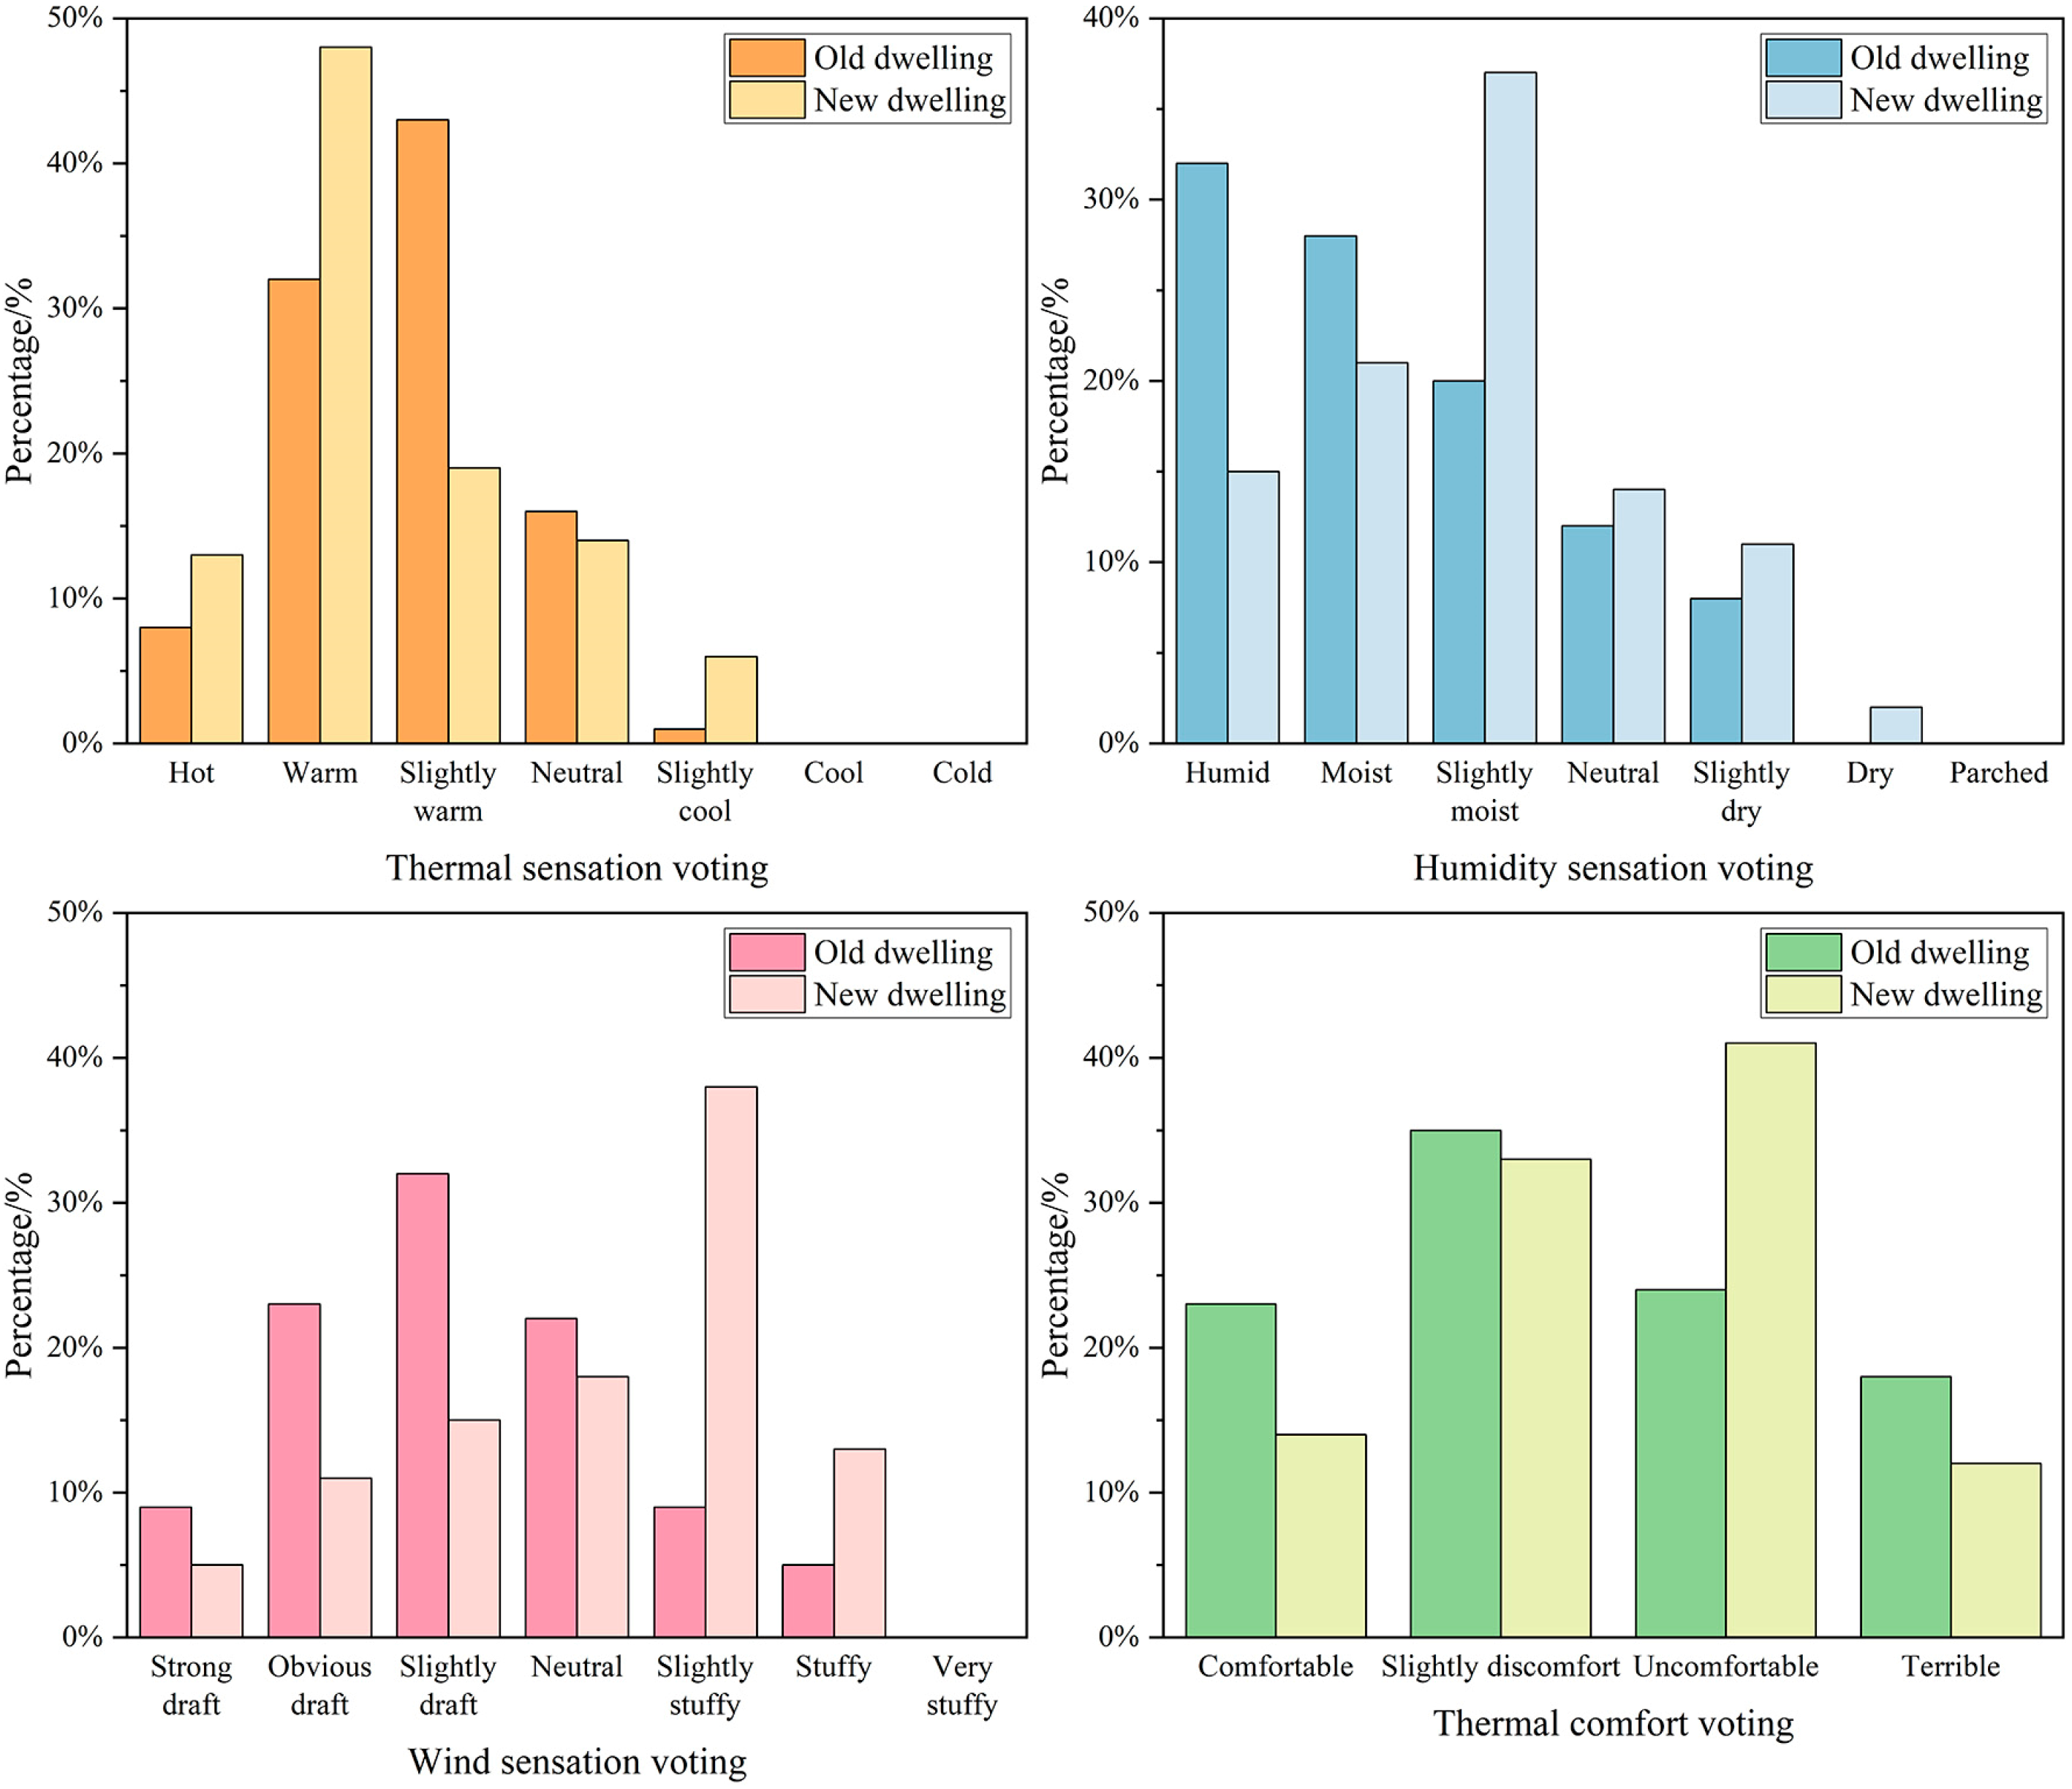
Analysis of the questionnaire survey results yielded the subjective thermal comfort evaluations for residents in new and old dwellings (Figure 8). Thermal sensation votes indicate that the proportions of “Hot” and “Warm” responses exceeded 60% in new dwellings, whereas they accounted for only 40.2% in old dwellings. In old dwellings, the highest proportion of responses was “Slightly warm” at 43.1%, suggesting that occupants perceived the environment as moderately warm yet still acceptable. Relative humidity perception votes show that the proportion of occupants perceiving the environment as “Humid” in old dwellings was twice that in new dwellings. In the range from “Slightly moist” to “Dry,” new dwelling occupants predominated, indicating poorer humidity conditions in old dwellings. Air movement perception votes indicate that from “Strong draft” to “Slightly draft,” 64.4% of old dwelling residents reported noticeable drafts, compared to 31.3% in new dwellings, approximately twice the proportion. This suggests that the design of courtyards and alleys in old dwellings significantly enhanced indoor ventilation. Thermal-comfort votes reveal a more uniform distribution among old dwelling residents, whereas in new dwellings, over 70% of occupants reported “Slightly discomfort” or “Uncomfortable.” Despite superior building conditions in new dwellings, residents’ subjective dissatisfaction was higher.
Figure 8.
Residents’ thermal perception vote.
Overall, compared with new dwellings, old dwellings provided better air movement but poorer humidity conditions, while occupants exhibited stronger heat tolerance. These findings indicate that in urban renewal or renovation of old districts, improvements in physical conditions should be accompanied by consideration of residents’ thermal behavior and adaptive strategies [62,63].
3.5. Influencing Factors and Adaptive Responses
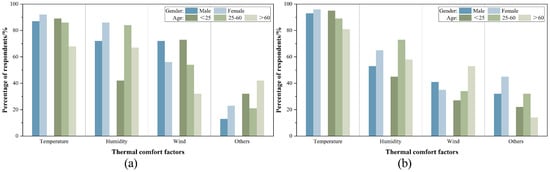
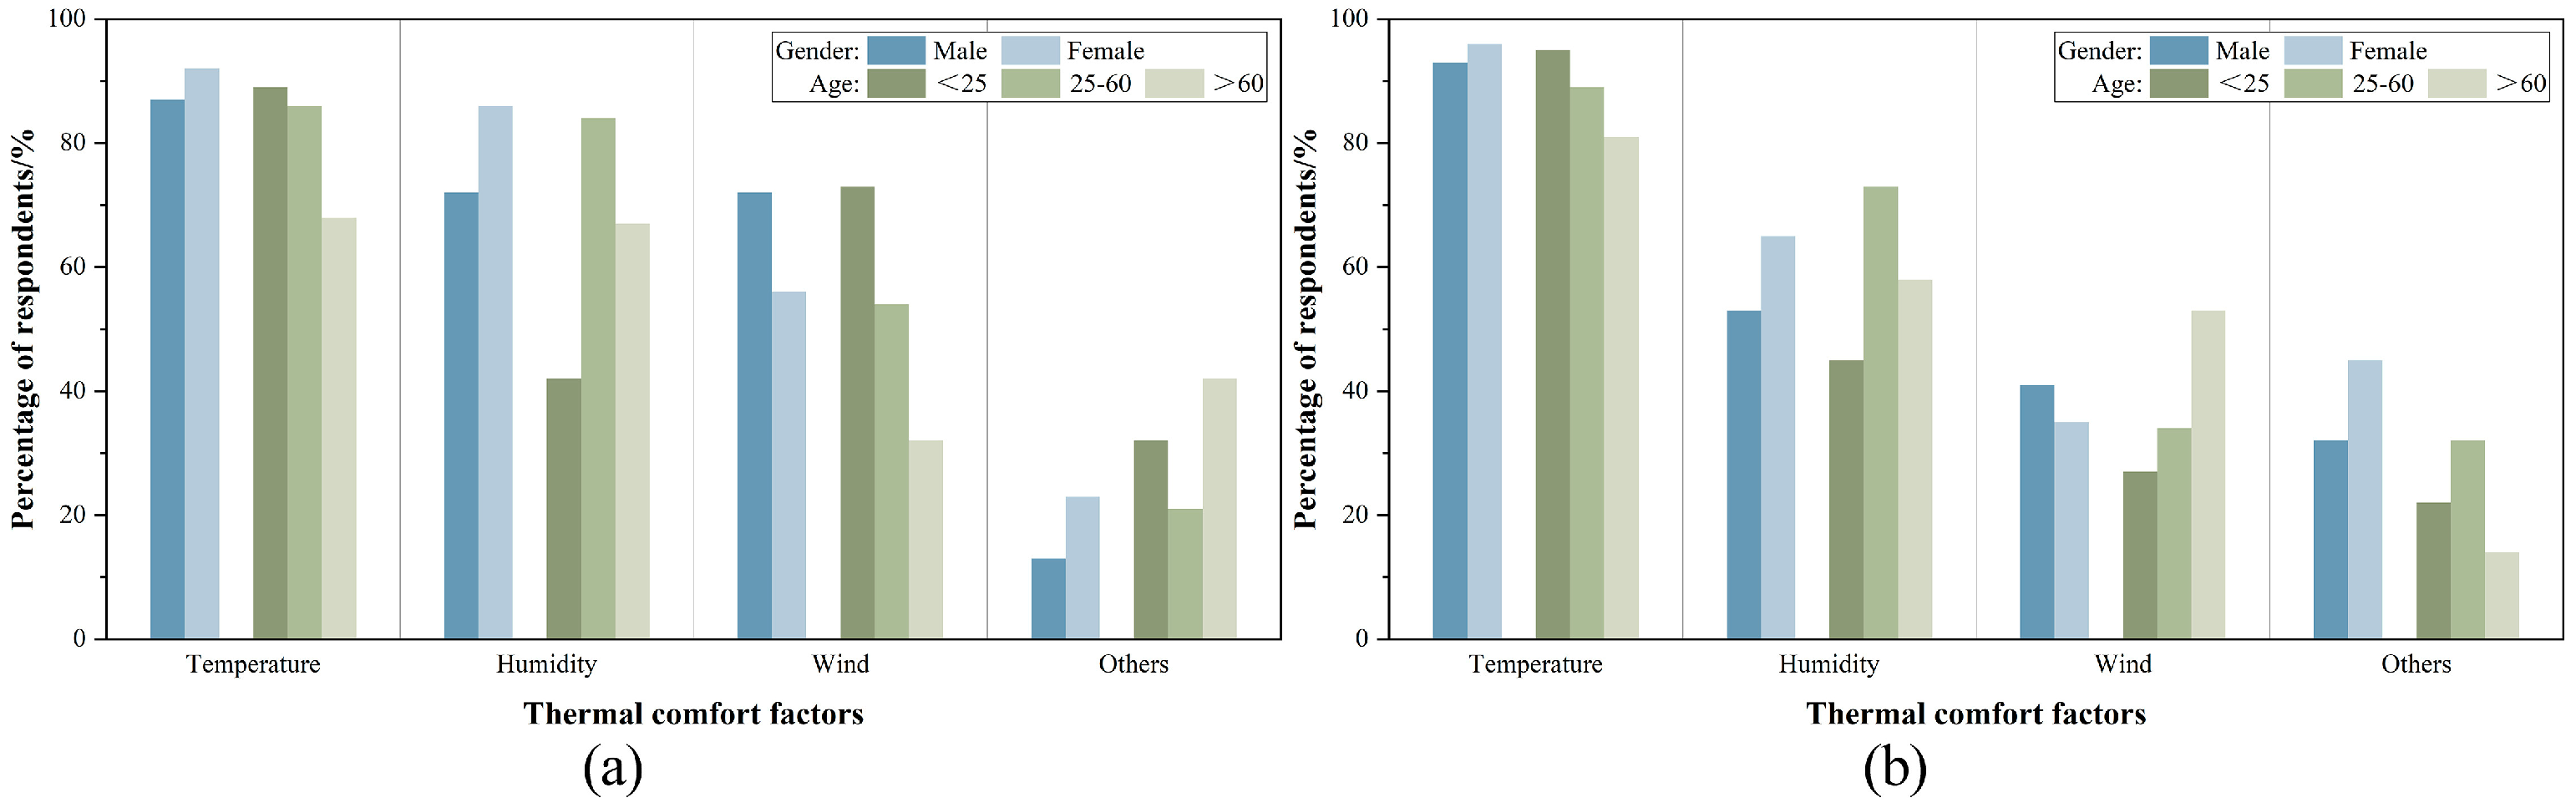
This section of the questionnaire allowed respondents to select multiple options and is primarily intended for descriptive and exploratory analysis, focusing on the distribution and prevalence of subjective perceptions and adaptive behaviors rather than hypothesis testing. Figure 9 illustrates residents’ votes on the key factors influencing thermal comfort in new and old dwellings. In both new and old dwellings, temperature was identified as the most important factor affecting thermal comfort, with selection rates exceeding 85%. Compared with residents in new dwellings, occupants in old dwellings showed significantly higher demand for humidity and air movement, with average selection rates exceeding 70%, notably higher than those in new dwellings (48.5%). Residents in new dwellings exhibited higher proportions in the “Other” category, indicating greater concern for integrated environmental factors such as air quality, daylighting, and noise.
Figure 9.
Perceived factors influencing thermal comfort in new and old dwellings. (a) Old dwellings, (b) New dwellings.
Gender-based analysis shows that female respondents were more sensitive to humidity, with selection rates approximately 10 percentage points higher than those of males. Male respondents demonstrated higher demand for air movement, particularly in old dwellings, where the proportion exceeded that of females by 16.3%. In new dwellings, female respondents showed higher proportions in the “Other” category, mainly related to skin dryness and daylighting conditions.
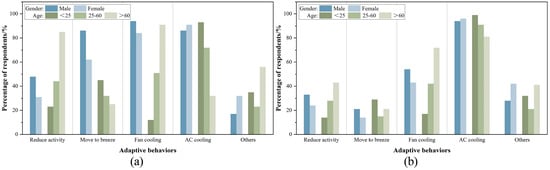
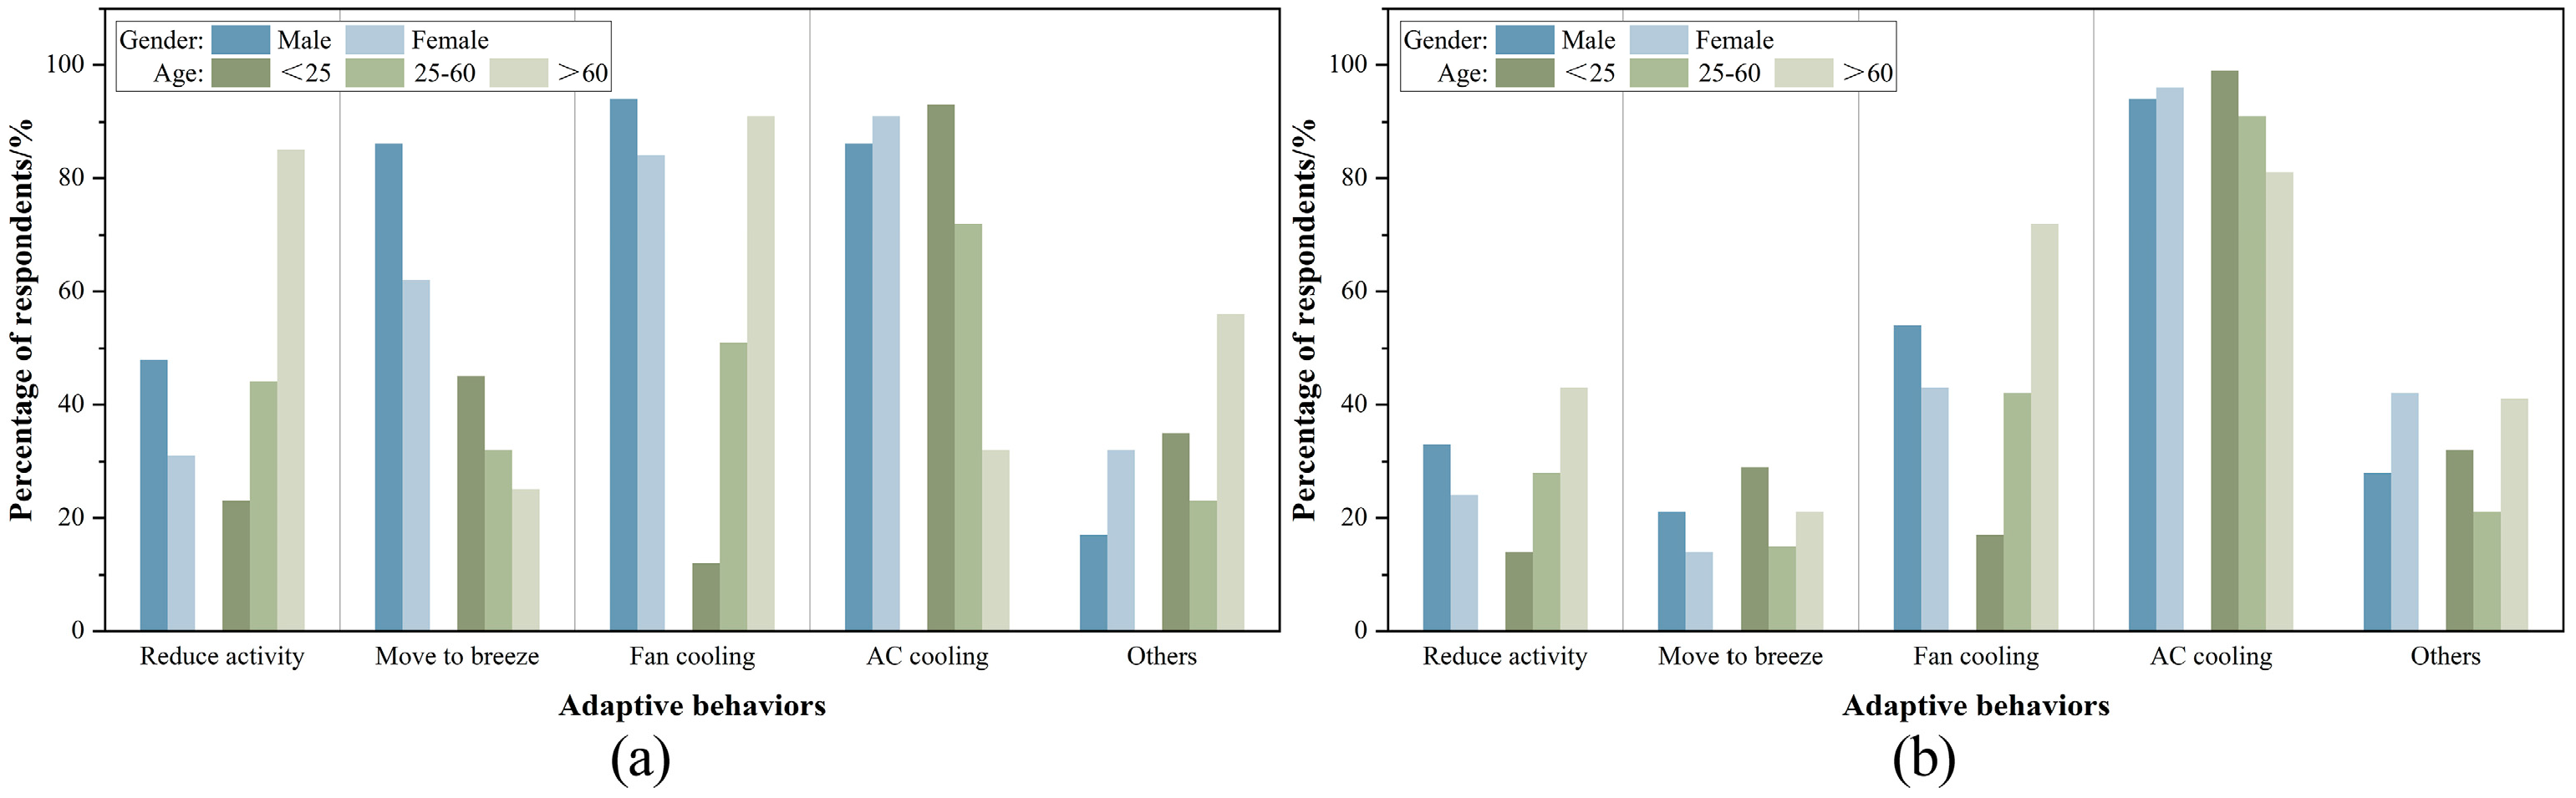
Figure 10 presents residents’ votes on adaptive actions adopted under thermal discomfort in new and old dwellings. In both new and old dwellings, air conditioning was the most preferred strategy for alleviating thermal discomfort. Overall, residents in old dwellings showed higher reliance on fan use and self-regulatory strategies.
Figure 10.
Adaptive behaviors adopted under thermal discomfort. (a) Old dwellings, (b) New dwellings.
From a gender perspective, male occupants exhibited higher proportions of fan use and self-regulation than females in both dwelling types. Female respondents reported higher proportions in the “Other” category, mainly involving clothing adjustment and enhanced internal shading measures. Age-based analysis indicates that elderly residents in old dwellings showed substantially higher proportions in “reducing activity” and “fan cooling” compared with other age groups. Meanwhile, elderly residents in old dwellings exhibited air-conditioning usage intentions amounting to only 39.5% of those observed among elderly residents in new dwellings. In both dwelling types, elderly occupants reported higher proportions in the “Other” category, mainly including cooling diets and the use of traditional handheld fans.
4. Conclusions and Limitations
4.1. Conclusions
Based on field measurements of typical Lifen residential buildings in Wuhan and questionnaire surveys of residents, the following conclusions were drawn:
- (1)
- Field measurements indicate pronounced differences in indoor thermal environments between old and new Lifen dwellings during summer. In old dwellings, mean indoor air temperatures ranged from 29.0 to 33.5 °C, with relative humidity typically between 50% and 67% and peak values exceeding 80%, reflecting persistently humid conditions and strong spatial non-uniformity. New dwellings exhibited more stable thermal conditions, with most rooms maintaining mean temperatures of 32.0–32.9 °C and temperature standard deviations generally below 1.1 °C. Kitchens consistently showed as the most adverse environments, with maximum air temperatures reaching 38.4 °C and sustained high humidity, representing critical hotspots of indoor heat stress.
- (2)
- Regression analysis between operative temperature and MTS quantitatively demonstrates differences in thermal adaptability. The MTS slope in old dwellings (0.2691) is lower than that in new dwellings (0.2956), indicating reduced sensitivity to temperature changes. The neutral operative temperature in old dwellings reaches 27.6 °C, which is 1.6 °C higher than that in new dwellings. Moreover, the thermal comfort range in old dwellings (23.7–31.3 °C) spans approximately 7.6 °C, about 1 °C wider than that observed in new dwellings, confirming stronger heat tolerance and adaptability.
- (3)
- In old dwellings, the PMV-derived neutral temperature for old dwellings is only 25.4 °C, substantially lower than the MTS-based value, and PMV consistently overestimates thermal sensation across the operative temperature range. Subjective voting results further confirm differences in thermal perception and adaptive behavior. Although new dwellings provide better overall building conditions, more than 70% of residents still reported slight discomfort or discomfort, whereas responses in old dwellings were more evenly distributed. Residents in old dwellings showed higher sensitivity to humidity and air movement (both exceeding 70%) and relied more on fans and behavioral adjustments to alleviate thermal discomfort, while residents in new dwellings depended more heavily on air conditioning.
- (4)
- Overall, field measurements, thermal comfort modeling, and subjective surveys consistently indicate that long-term exposure, behavioral adaptation, and ventilation-driven cooling significantly enhance thermal adaptability in old Lifen dwellings, leading to higher heat tolerance despite poorer hygrothermal conditions. In contrast, residents in new dwellings show stronger reliance on air conditioning, for which increased photovoltaic integration may be considered as a potential strategy in future studies to partially offset the associated energy demand. Whereas for old Lifen dwellings, preserving architectural character and improving natural ventilation are more appropriate and sufficient to meet most occupants’ thermal comfort needs. These results highlight the need for differentiated context-specific optimization strategies rather than uniform PMV-based approaches.
4.2. Limitations
Despite the above contributions, several limitations should be acknowledged. First, the PMV index, as a non-adaptive indicator, may have limited applicability under high-temperature, high-humidity, and naturally ventilated conditions. Second, the accuracy of the air temperature sensors is slightly below the level specified for Class C measurements in the latest ISO 7726:2025 [50], which may introduce some additional uncertainty in comfort assessment. Third, due to constraints in monitoring duration, sample size, and dwelling typologies, the findings may not fully represent other seasons or broader residential contexts. Fourth, occupant behaviors and individual differences were not fully quantified, which may affect the precision of comfort analysis. Finally, this study mainly focused on the thermal environment, while other indoor environmental factors were not systematically considered. Future studies will address these issues by adopting adaptive comfort indicators, expanding samples and monitoring periods, incorporating behavioral measurements, and considering multi-environmental interactions.
Author Contributions
Conceptualization, K.R., M.Y. and C.Z.; methodology, K.R., M.Y. and C.Z.; software, M.Y. and C.Z.; validation, M.Y., C.Z. and Y.H.; formal analysis, Y.H., S.Y. and C.T.; investigation, C.Z. and Y.H.; resources, K.R., M.Y. and C.Z.; data curation, M.Y., S.Y. and C.T.; writing—original draft preparation, K.R., M.Y. and C.Z.; writing—review and editing, Y.H., S.Y. and C.T.; visualization, M.Y. and Y.H.; supervision, K.R. and C.Z.; project administration, K.R. and M.Y.; funding acquisition, K.R. All authors have read and agreed to the published version of the manuscript.
Funding
This research was funded by the 2024 Independent Innovation Fund Project in the Huazhong University of Science & Technology (No. 5003413011) and Project of Humanities and Social Sciences Foundation of the Ministry of Education (No. 22YJA760067).
Institutional Review Board Statement
Ethical review and approval were waived for this study, as it involved non-invasive field measurements and anonymous questionnaire surveys, without collecting any identifiable, sensitive personal data, medical information, or human biological samples. The study posed no foreseeable risk to participants and complied with relevant ethical guidelines.
Informed Consent Statement
Informed verbal consent was obtained from all participants involved in the study prior to data collection.
Data Availability Statement
The original contributions presented in this study are included in the article. Further inquiries can be directed to the corresponding author.
Acknowledgments
The authors also extend special thanks to the anonymous reviewers and editor for their valuable comments and recommendations for publishing this paper.
Conflicts of Interest
The authors declare no conflicts of interest.
Nomenclature
| HVAC | heating, ventilation, and air conditioning |
| BSk | cold semi-arid climate |
| Dwa | monsoon-influenced hot-summer humid continental climate |
| Cfa | humid subtropical climate |
| Csa | mediterranean hot-summer climate |
| Cfb | temperate oceanic climate |
| Aw | tropical savanna climate with dry winter |
| HSCW | hot summer and cold winter |
| Tg | globe temperature, °C |
| Ta | air temperature, °C |
| RH | relative humidity, % |
| Va | air velocity, m/s |
| Top | operative temperature, °C |
| PMV | predicted mean vote |
| Tmr | mean radiant temperature |
| M | metabolic rate, W/m2 |
| L | thermal load on the human body, W/m2 |
| CBE | Center for the Built Environment |
| ASHRAE | American Society of Heating, Refrigerating and Air-Conditioning Engineers |
| ISO | International Organization for Standardization |
| TMY | typical meteorological year |
| MB | master bedroom |
| SB | second bedroom |
| LR | living room |
| KT | kitchen |
| (2b) | Futang Li (2-bay) |
| (3b) | Futang Li (3-bay) |
| (A) | Chang’an Li–A |
| (B) | Chang’an Li–B |
| MTS | mean thermal sensation vote |
References
- Zhu, J.; Wei, C.; Hua, L. (Eds.) Routledge Handbook of Chinese Architecture: Social Production of Buildings and Spaces in History, 1st ed.; Routledge: London, UK, 2022. [Google Scholar] [CrossRef] [Scilit]
- Zou, H.; Chen, C.; Xiao, W.; Shi, L. Spatial-Temporal Evolution Relationship between Water Systems and Historical Settlement Sites Based on Quantitative Analysis: A Case Study of Hankou in Wuhan, China (1635–1949). Sustainability 2022, 14, 14614. [Google Scholar] [CrossRef] [Scilit]
- Liu, X.; Yang, J.; Tong, Q. The forerunner of modern collective residence in Hankou: The study on Panoffs’ Mansion. J. Asian Archit. Build. Eng. 2023, 22, 2460–2489. [Google Scholar] [CrossRef] [Scilit]
- Courtney, C. The Tinderbox City: The industrialisation of fire disasters in Hankou, China, 1849–1944. Int. Rev. Environ. Hist. 2018, 4, 69–91. [Google Scholar] [CrossRef] [Scilit]
- Wei, X.; Si, Z. Fully Exploring Traditional Chinese Culture and Promoting Organic Development of Green City. Procedia Eng. 2017, 180, 1531–1540. [Google Scholar] [CrossRef] [Scilit]
- Li, X. Cultural heritage and modernization: The evolution of Lifen neighborhoods in Wuhan. Urban Plan. Transp. Res. 2024, 12, 2409683. [Google Scholar] [CrossRef] [Scilit]
- Rowe, W.T. Hankow: Conflict and Community in a Chinese City, 1796–1895; Stanford University Press: Stanford, CA, USA, 1989. [Google Scholar]
- Maglioccola, F. The Chinese house inside the ex-foreign concession in Hankou: Description of Lifen. In Architecture Heritage and Design-2; Gangemi Editore: Rome, Italy, 2018; Volume 2, pp. 187–196. Available online: https://hdl.handle.net/11367/68955 (accessed on 3 January 2025).
- Guo, B. Ricerca e Analisi sulla Protezione e il Rinnovamento degli Edifici Storici di Hankou, Wuhan = Research and Analysis on the Protection and Renewal of the Historical Buildings in Hankou, Wuhan. Master’s Thesis, Politecnico di Torino, Torino, Italy, 2022. Available online: https://webthesis.biblio.polito.it/23979/ (accessed on 3 January 2025).
- Wei, Y. Research and reflection on the protection of historical and cultural blocks in China and Europe: Taking Jianghan Road in Hankou and Marais District in Paris as examples. In Proceedings of the 4th International Conference on Art Studies: Science, Experience, Education (ICASSEE 2020), Moscow, Russia, 27–28 August 2020; Atlantis Press: Paris, France, 2020; pp. 362–368. [Google Scholar] [CrossRef] [Scilit]
- Tan, C.; Ke, Y. Old Houses in Hankou Concession: Collective Memory and Nostalgic Space Consumption in the Context of Modernization. Herança 2024, 7, 174–185. [Google Scholar] [CrossRef] [Scilit]
- Sun, Y.; Zhang, C.; Zhao, Y.; Li, J.; Ma, Y.; Zhu, C. A systematic review on thermal environment and thermal comfort studies in Chinese residential buildings. Energy Build. 2023, 291, 113134. [Google Scholar] [CrossRef] [Scilit]
- Jain, H. Critical insights into thermal comfort optimization and heat resilience in indoor spaces. City Built Environ. 2024, 2, 14. [Google Scholar] [CrossRef] [Scilit]
- Hakim, F.F.; Ikaputra, I. The shifting of indoor thermal comfort factors: A review. J. Umm Al-Qura Univ. Eng. Archit. 2025. [Google Scholar] [CrossRef] [Scilit]
- Peel, M.C.; Finlayson, B.L.; McMahon, T.A. Updated world map of the Köppen-Geiger climate classification. Hydrol. Earth Syst. Sci. 2007, 11, 1633–1644. [Google Scholar] [CrossRef] [Scilit]
- Wang, Y.; Dong, Q.; Guo, H.; Yin, L.; Gao, W.; Yao, W.; Sun, L. Indoor thermal comfort evaluation of traditional dwellings in cold region of China: A case study in Guangfu Ancient City. Energy Build. 2023, 288, 113028. [Google Scholar] [CrossRef] [Scilit]
- Wei, D.; Zhao, G.; Liu, S.; Yang, L. Indoor thermal comfort in a rural dwelling in southwest China. Front. Public Health 2022, 10, 1029390. [Google Scholar] [CrossRef] [Scilit]
- Shastry, V.; Mani, M.; Tenorio, R. Evaluating thermal comfort and building climatic response in warm-humid climates for vernacular dwellings in Suggenhalli (India). Archit. Sci. Rev. 2016, 59, 12–26. [Google Scholar] [CrossRef] [Scilit]
- Cheng, X.; Jing, S.; Yang, Y.; Xu, W.; Wang, Z.; Lan, Z. Study on the indoor thermal comfort of cave dwellings in cold areas of China. J. Build. Eng. 2024, 86, 108949. [Google Scholar] [CrossRef] [Scilit]
- Jin, Y.; Zhang, N. Comprehensive Assessment of Thermal Comfort and Indoor Environment of Traditional Historic Stilt House, a Case of Dong Minority Dwelling, China. Sustainability 2021, 13, 9966. [Google Scholar] [CrossRef] [Scilit]
- Costa-Carrapiço, I.; González, J.N.; Raslan, R.; Sánchez-Guevara, C.; Redondas Marrero, M.D. Understanding thermal comfort in vernacular dwellings in Alentejo, Portugal: A mixed-methods adaptive comfort approach. Build. Environ. 2022, 217, 109084. [Google Scholar] [CrossRef] [Scilit]
- Rijal, H.B.; Humphreys, M.A.; Nicol, J.F. Adaptive model and the adaptive mechanisms for thermal comfort in Japanese dwellings. Energy Build. 2019, 202, 109371. [Google Scholar] [CrossRef] [Scilit]
- Ioannou, A.; Itard, L.; Agarwal, T. In-situ real time measurements of thermal comfort and comparison with the adaptive comfort theory in Dutch residential dwellings. Energy Build. 2018, 170, 229–241. [Google Scholar] [CrossRef] [Scilit]
- Xu, C.; Li, S.; Zhang, X.; Shao, S. Thermal comfort and thermal adaptive behaviours in traditional dwellings: A case study in Nanjing, China. Build. Environ. 2018, 142, 153–170. [Google Scholar] [CrossRef] [Scilit]
- Lin, Y.; Chen, P.; Yang, W.; Hu, X.; Tian, L. A Systematic Review on the Studies of Thermal Comfort in Urban Residential Buildings in China. Energies 2024, 17, 991. [Google Scholar] [CrossRef] [Scilit]
- Abdollahzadeh, S.M.; Heidari, S.; Einifar, A. Evaluating thermal comfort and neutral temperature in residential apartments in hot and dry climate: A case study in Shiraz, Iran. J. Build. Eng. 2023, 76, 107161. [Google Scholar] [CrossRef] [Scilit]
- Zhang, J.; Lu, J.; Deng, W.; Beccarelli, P.; Lun, I.Y.F. Thermal comfort investigation of rural houses in China: A review. Build. Environ. 2023, 235, 110208. [Google Scholar] [CrossRef] [Scilit]
- Tang, Y.; Yu, H.; Mao, H.; Zhang, K.; Wang, M. Indoor thermal comfort and ageing: A systematic review. J. Build. Eng. 2025, 100, 111714. [Google Scholar] [CrossRef] [Scilit]
- Wang, Z.; de Dear, R.; Luo, M.; Lin, B.; He, Y.; Ghahramani, A.; Zhu, Y. Individual difference in thermal comfort: A literature review. Build. Environ. 2018, 138, 181–193. [Google Scholar] [CrossRef] [Scilit]
- Psomas, T.; Teli, D.; Donovan, A.O.; Kolias, P.; Langer, S. Association of Perceived Thermal Comfort and Air Quality with Building- and Occupant-Related Characteristics and Environmental Parameters in Sweden. Energies 2024, 17, 1471. [Google Scholar] [CrossRef] [Scilit]
- Wuhan Municipal Government. Geography of Wuhan. 2021. Available online: https://english.wuhan.gov.cn/overview4of4wuhan/geography/202110/t20211026_1819195.shtml (accessed on 2 January 2026).
- Wuhan Video. Hankow Concession, Wuhan: Historic Treaty Port District. Available online: https://www.wuhan.video/hankowconcession (accessed on 2 January 2026).
- Xu, S.; Liu, S.; Zhang, C.; Shao, S.; Li, H.; Chen, X.; Wang, M. Synergistic effects of spatial morphology and thermal comfort on pedestrian activities in residential areas: A field-based study in Wuhan, China. Build. Environ. 2026, 287, 113782. [Google Scholar] [CrossRef] [Scilit]
- China Meteorological Administration. Monthly Climate Normals Dataset from China’s Surface International Exchange Stations (1971–2000) [Data Set]; China Meteorological Administration: Beijing, China, 2005. Available online: http://data.cma.cn (accessed on 28 December 2025).
- Wang, M.; Dong, Y.; Liao, W.; Pan, B.; Li, S.; Duan, J.; Xu, S. Impact of residential morphology on outdoor thermal comfort and building energy consumption in winter and summer: A case study. Urban Clim. 2025, 61, 102479. [Google Scholar] [CrossRef] [Scilit]
- JGJ/T 347-2014; Standard of Test Methods for Thermal Environment of Building. China Architecture & Building Press: Beijing, China, 2014.
- Cooper, E.; Grundstein, A.; Rosen, A.; Miles, J.; Ko, J.; Curry, P. An Evaluation of Portable Wet Bulb Globe Temperature Monitor Accuracy. J. Athl. Train. 2017, 52, 1161–1167. [Google Scholar] [CrossRef] [Scilit]
- d’Ambrosio Alfano, F.R.; Dell’Isola, M.; Ficco, G.; Palella, B.I.; Riccio, G. Small globes and pocket heat stress meters for WBGT and PHS evaluations. A critical analysis under controlled conditions. Build. Environ. 2022, 226, 109781. [Google Scholar] [CrossRef] [Scilit]
- GBZ/T 189.7-2007; Measurement of Heat Stress in the Workplace. Standards Press of China: Beijing, China, 2007.
- GB/T 50785-2012; Evaluation Standard for Indoor Thermal Environment in Civil Buildings. China Architecture & Building Press: Beijing, China, 2012.
- GB 50176-2016; Code for Thermal Design of Civil Building. China Architecture & Building Press: Beijing, China, 2016.
- ISO 6946:2017; Building Components and Building Elements—Thermal Resistance and Thermal Transmittance—Calculation Methods (3rd ed.). International Organization for Standardization: Geneva, Switzerland, 2017.
- ISO 10077-1:2017; Thermal Performance of Windows, Doors and Shutters—Calculation of Thermal Transmittance—Part 1: General. International Organization for Standardization: Geneva, Switzerland, 2017.
- ASHRAE 55-2023; Thermal Environmental Conditions for Human Occupancy. American Society of Heating, Refrigerating and Air-Conditioning Engineers: Atlanta, GA, USA, 2023.
- Cheng, C.; Lay, K.-L.; Hsu, Y.-F.; Tsai, Y.-M. Can Likert scales predict choices? Testing the congruence between using Likert scale and comparative judgment on measuring attribution. Methods Psychol. 2021, 5, 100081. [Google Scholar] [CrossRef] [Scilit]
- Broday, E.E.; Ruivo, C.R.; Gameiro da Silva, M. The use of Monte Carlo method to assess the uncertainty of thermal comfort indices PMV and PPD: Benefits of using a measuring set with an operative temperature probe. J. Build. Eng. 2021, 35, 101961. [Google Scholar] [CrossRef] [Scilit]
- d’Ambrosio Alfano, F.R.; Olesen, B.W.; Palella, B.I.; Riccio, G. Thermal comfort: Design and assessment for energy saving. Energy Build. 2014, 81, 326–336. [Google Scholar] [CrossRef] [Scilit]
- Fanger, P.O. Thermal Comfort: Analysis and Applications in Environmental Engineering; Danish Technical Press: Copenhagen, Denmark, 1970. [Google Scholar]
- Lee, D.-S.; Jo, J.-H. Measuring and implementing mean radiant temperature in buildings: Technical review. Renew. Sustain. Energy Rev. 2025, 207, 114908. [Google Scholar] [CrossRef] [Scilit]
- ISO 7726:2025; Ergonomics of the Thermal Environment—Instruments for Measuring and Monitoring Physical Quantities. International Organization for Standardization: Geneva, Switzerland, 2025.
- Tartarini, F.; Schiavon, S.; Cheung, T.; Hoyt, T. CBE Thermal Comfort Tool: Online tool for thermal comfort calculations and visualizations. SoftwareX 2020, 12, 100563. [Google Scholar] [CrossRef] [Scilit]
- d’Ambrosio Alfano, F.R.; Olesen, B.W.; Palella, B.I.; Pepe, D.; Riccio, G. Fifty Years of PMV Model: Reliability, Implementation and Design of Software for Its Calculation. Atmosphere 2020, 11, 49. [Google Scholar] [CrossRef] [Scilit]
- ISO 7730:2025; Ergonomics of the Thermal Environment—Analytical Determination and Interpretation of Thermal Comfort Using Calculation of the PMV and PPD Indices and Local Thermal Comfort Criteria. International Organization for Standardization: Geneva, Switzerland, 2025.
- Wang, M.; Zhang, C.; Lin, B.; Kang, J.; Qin, Y.; Xu, S. Optimal urban morphology design to enhance summer outdoor thermal comfort and reduce cooling energy use: Synergistic impact analysis of multiple parameters. Sustain. Cities Soc. 2025, 135, 106996. [Google Scholar] [CrossRef] [Scilit]
- Xu, H.; Guo, S.; Shi, X.; Wu, Y.; Pan, J.; Gao, H.; Tang, Y.; Han, A. Machine learning-based analysis and prediction of meteorological factors and urban heatstroke diseases. Front. Public Health 2024, 12, 1420608. [Google Scholar] [CrossRef] [Scilit] [PubMed]
- Li, H.; Yang, Y.; Lv, K.; Liu, J.; Yang, L. Compare several methods of select typical meteorological year for building energy simulation in China. Energy 2020, 209, 118465. [Google Scholar] [CrossRef] [Scilit]
- Wang, J.; Gao, W.; Meng, X. Influence of adjacent heating on indoor air temperature in non-central heating building. Case Stud. Therm. Eng. 2025, 74, 106796. [Google Scholar] [CrossRef] [Scilit]
- Ahn, J. Spatial distribution and transient responses of the thermal environment in an office space equipped with a standing-type air conditioner. Int. J. Air-Cond. Refrig. 2024, 32, 5. [Google Scholar] [CrossRef] [Scilit]
- Wang, J.; Yu, S.; Yang, G.; Kang, J.; Yang, S. Study on head and neck local cooling for thermal comfort in high-temperature mining environments. Case Stud. Therm. Eng. 2025, 75, 107029. [Google Scholar] [CrossRef] [Scilit]
- Zhang, C.; Xu, S.; Qi, C.; Dai, R.; Mendis, T.; Wang, M. Comparison of Thermal Comfort in Different Subway Spaces in China’s Hot Summer and Cold Winter Region: A Field Investigation Based on Subway Station Transition. Buildings 2025, 15, 786. [Google Scholar] [CrossRef] [Scilit]
- Wang, M.; Zhang, C.; Wang, S.; Wang, H.; Chen, Q.; Xu, S.; He, B. Sensitivity of Human Thermal Comfort Benchmarks to Background Temperature and Individual Factors: An Empirical Study in Wuhan, China. Buildings 2025, 15, 3037. [Google Scholar] [CrossRef] [Scilit]
- Lee, Y.; Ng, E. Enhancing thermal performance of subtropical low-income housing through passive and behaviour-guided adaptive design. Build. Environ. 2025, 285, 113542. [Google Scholar] [CrossRef] [Scilit]
- Gou, Z.; Gamage, W.; Lau, S.S.-Y.; Lau, S.S.-Y. An Investigation of Thermal Comfort and Adaptive Behaviors in Naturally Ventilated Residential Buildings in Tropical Climates: A Pilot Study. Buildings 2018, 8, 5. [Google Scholar] [CrossRef] [Scilit]



Disclaimer/Publisher’s Note: The statements, opinions and data contained in all publications are solely those of the individual author(s) and contributor(s) and not of MDPI and/or the editor(s). MDPI and/or the editor(s) disclaim responsibility for any injury to people or property resulting from any ideas, methods, instructions or products referred to in the content. |
© 2026 by the authors. Licensee MDPI, Basel, Switzerland. This article is an open access article distributed under the terms and conditions of the Creative Commons Attribution (CC BY) license.