


Abstract
The rapid deterioration of building facades presents substantial safety hazards in urban environments, necessitating advanced, automated inspection solutions. While computer vision (CV) and deep learning (DL) techniques have shown promise for defect analysis, critical gaps remain in achieving real-time, quantitative, and generalizable damage assessment suitable for robotic deployment. Current methods often lack precise metric quantification, struggle with diverse material appearances, and are computationally intensive for on-site processing. To address these limitations, this paper introduces a fully automated, end-to-end inspection framework integrating a wall-climbing robot, a real-time vision-based analysis system, and a digital twin management platform. The primary contributions are threefold: (1) a novel, fully integrated robotic framework for autonomous navigation, multi-sensor data collection, and real-time analysis; (2) a lightweight, synthetic data-augmented DL model for real-time defect segmentation and metric quantification, achieving a mean Average Precision (mAP) of 0.775 for segmentation, an average defect length error of 1.140 cm, and an average center position error of 0.826 cm; (3) a cloud-based digital twin platform enabling quantitative defect visualization, spatiotemporal traceability, and data-driven project management, with the on-site inspection cycle demonstrating a responsive latency of 2.8–4.8 s. Validated through laboratory tests and real building projects, the framework demonstrates significant improvements in inspection efficiency, quantitative accuracy, and decision support over conventional methods.
1. Introduction
Regular and effective inspection of building facades is a significant procedure in building health monitoring. Traditional wall inspection techniques rely mostly on working at heights. Construction workers are suspended from the roof and wall elements are inspected using human eyes or handheld equipment. In recent years, the Architectural, Engineering, Construction, and Facility Management (AEC/FM) industry has seen a growing trend of automation with robotics. Various robot vehicles have been investigated for monitoring and inspection tasks in as-built facilities, such as Unmanned Aerial Vehicles (UAVs) [1,2,3], wheeled robots [4,5], quadruped robots [6,7], etc. They are usually equipped with cameras or laser scanners to collect images [8,9] or point cloud data [10,11] for post-processing.
UAVs are widely utilized in building facade inspection. However, they are not applicable under weak Global Navigation Satellite System (GNSS) signals (e.g., close high-rise buildings) or in no-fly zones (e.g., around airports or military zones). In addition, UAVs are not suitable for carrying contact-based sensors as they need to maintain a safe distance from walls. Suspended platforms are alternative solutions that can carry human workers or automation equipment such as robot arms [12]. However, suspended platforms require pre-installation of heavy block-and-tackle systems, and they are not flexible in horizontal movement. As a result, a wall-climbing robot, which directly moves on vertical surfaces in any desired orientation and enables inspection sensors with multiple modalities, is proposed as the robot platform for automated wall inspection.
The purpose of wall inspection is to recognize, measure, and locate defects of exterior walls, including cracks, spalling, etc. Traditional inspection techniques rely on human workers for decision making, which is subjective and inefficient. In recent years, the development of deep learning models such as Convolutional Neural Network (CNN) [13] has made it possible to automatically detect and segment wall defects from images. In addition, computer vision algorithms such as Structure-from-Motion (SfM) can accurately determine the camera’s motion and locate defect features. However, current defect detection techniques suffer from limitations in both spatial and temporal accuracy. Spatially, conventional techniques fail to provide precise quantitative data, such as the exact size, location, and shape description of defects. They also lack the generalization ability to diverse surface materials. Temporally, the inspection results of a building are not updated regularly to reflect subsequent maintenance or renovations in a timely manner. To address these shortcomings, a customized defect segmentation technique and an intelligent project management system are required. The proposed solution can accurately analyze the data collected by a wall-climbing robot in real time and verify an up-to-date digital twin model of the building.
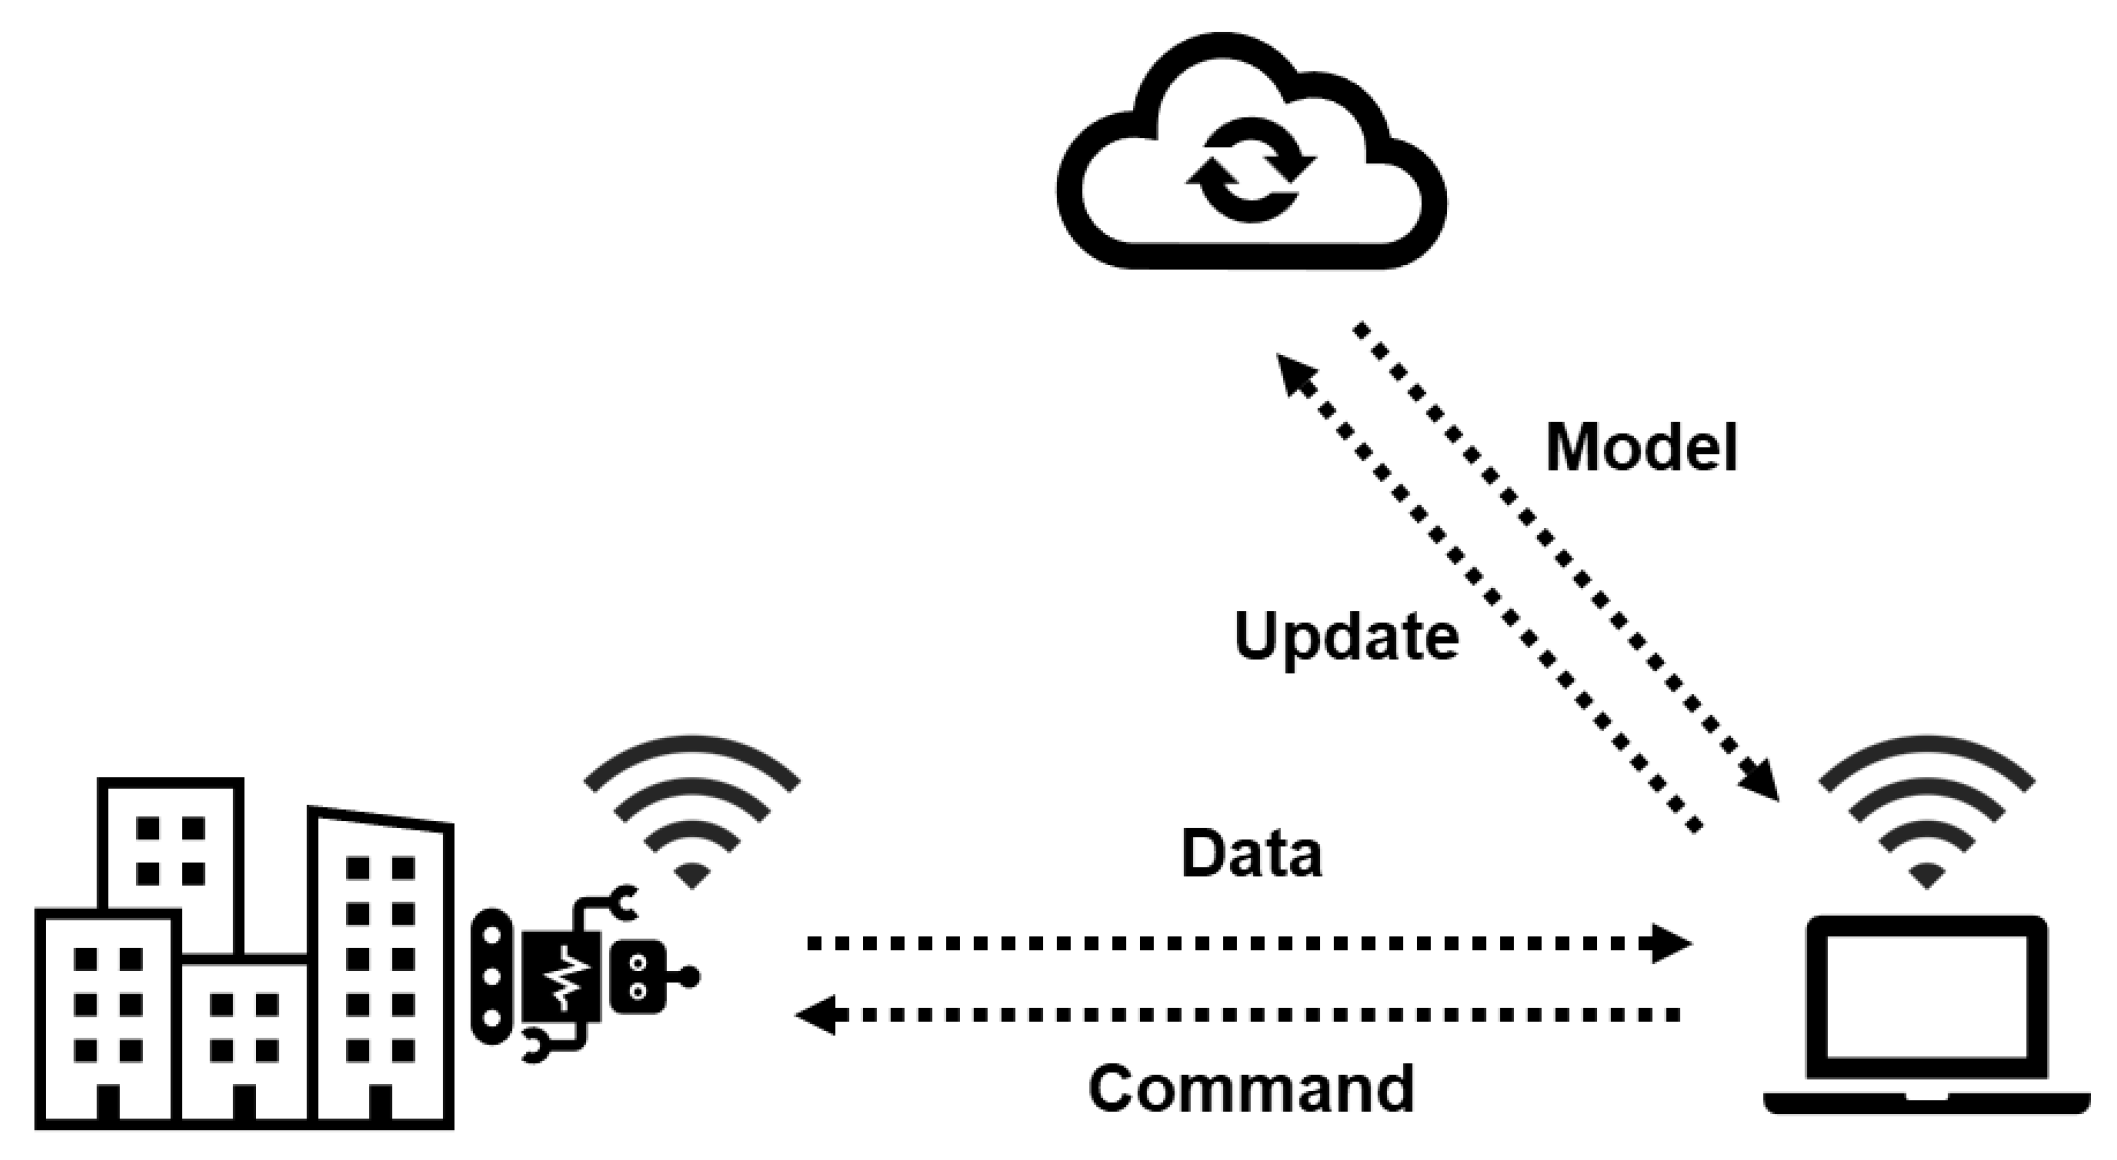
To address these challenges, this study introduces an automated inspection framework for building exterior walls. As illustrated in Figure 1, the proposed framework comprises three key components: (1) a wall-climbing robot employing negative pressure adhesion technology, equipped with visual and penetrating sensors; (2) a ground station that facilitates multi-sensor data processing through deep learning-based defect detection algorithms and quantitative analysis; and (3) a cloud platform that leverages digital twin representations to enable quantitative defect condition assessment and inspection project management.
Figure 1.
Illustration of the proposed framework.
The major contributions of this study are summarized as follows:
- (1)
- A fully automated, end-to-end facade inspection framework that integrates climbing-robot navigation, multimodal data collection, real-time analysis, and as-is model updating.
- (2)
- A lightweight deep learning model for real-time defect segmentation and metric quantification, supported by a novel, generative-augmented open dataset designed for wall defect detection.
- (3)
- A digital twin-based project management platform that unifies data integration, visualization, and user interaction, significantly improving inspection efficiency, traceability, and decision support over traditional methods.
2. Literature Review
This section provides a literature review on different inspection vehicles, detection algorithms, and digital twin techniques, as presented in Section 2.1, Section 2.2 and Section 2.3, respectively.
2.1. Wall Inspection Vehicles
There have been growing attempts in the AEC/FM industry to conduct exterior wall inspection using automated vehicles. UAV is a popular choice in inspection of high-rise buildings, bridges, and various infrastructure. For example, Bolourian et al. [14] proposed a UAV path planning framework for aerial laser scanning and bridge inspection. Tan et al. [15] proposed a UAV-based framework to collect images of building surfaces. Their work was further extended to achieve mapping and modeling of defect data [16]. However, the presence of no-fly zones and payload restrictions are two major disadvantages of UAVs. Therefore, some researchers focused on wall-climbing robots as an alternative solution, due to their flexibility, durability, and payload capacity.
Wall-climbing robots are typically categorized into four types based on their adhesion mechanisms [17]: magnetic, negative pressure, electrostatic, and bio-inspired adhesion. Negative pressure adhesion is the preferred method for wall inspection robots, as it offers high payload capacity and is effective on a wide range of common building surface materials [18]. The core principle of negative pressure adhesion involves generating a pressure difference between the sealed chambers under the robot and the external environment. This creates a suction force that enables the robot to remain firmly attached while moving.
Recent research has demonstrated the effectiveness of wall-climbing robots in building inspection applications. For example, Yang et al. [19] proposed a wall-climbing robot for concrete inspection and utilized an RGB-D camera for 3D point cloud reconstruction. Hu et al. [20] proposed a coverage-oriented path planning technique for wall-climbing robots to improve the efficiency of inspection tasks. However, these methods did not realize quantitative analysis of defect types, shapes, and locations. This study aims to develop an integrated robotic platform capable of precise localization, autonomous navigation on vertical surfaces, and automated wall defect inspection.
2.2. Defect Detection Algorithms
Developments in deep learning and computer vision have pioneered automated defect detection using image data. CNN-based models were first investigated for classification, bounding box detection, and pixel-level segmentation tasks. For example, He et al. proposed Mask R-CNN [21], which improved over bounding box detection models [22] by adding a segmentation head and became a benchmark for instance segmentation tasks. Redmon et al. proposed YOLO (You Only Look Once) [23], which innovatively combined the region proposal and classification steps into one network structure. It significantly improved inference speed and became the dominant model for real-time object detection. These CNN-based models have been verified in crack detection tasks for buildings [24] and infrastructure [25].
Since the introduction of Transformer [26], models based on a self-attention structure have become popular in deep learning. Transformer-based models such as Vision Transformer (ViT) [27], RT-DETR [28], and Grounding-DINO [29] were soon introduced into visual tasks and achieved impressive accuracy and generalization ability. Chu et al. [30] proposed a Transformer-based model to improve the accuracy of crack segmentation for bridges. Zim et al. [31] proposed to combine CNN and Transformer into one hybrid model and applied it for crack segmentation tasks. Although these studies demonstrated improved performance, Transformer architecture usually requires extensive training datasets and substantially greater computational resources for both training and inference compared to convolutional models. This is not favored for on-site applications, where the best available computational device could be a laptop. Therefore, this study proposes to train lightweight models such as YOLO on domain-specific datasets, aiming to achieve sufficient accuracy and real-time processing on low computational resources.
2.3. Digital Twin Applications
Digital twin technology transforms traditional facility management by creating a dynamic, virtual replica of a physical asset. It shifts management from a reactive, experience-based approach to a proactive, data-driven system. Foundational construction representations like Building Information Modeling (BIM) and Geographic Information Systems (GIS) [32] often serve as the geometric and semantic backbone for these digital twins. The application of this technology spans several domains. In robotics, for instance, Chen et al. [33,34] incorporated physics engines to simulate and optimize coverage path planning for wheeled inspection robots, improving both accuracy and efficiency. Wang et al. [35,36] proposed a hardware-in-the-loop simulation environment for mobile laser scanning using Unreal Engine. Another significant area of development is human–machine interaction. Liu et al. [37] combined UAV-captured images with augmented reality to conduct building inspection. Alizadehsalehi et al. [38] proposed a progress monitoring framework adopting digital twin and extended reality. For example, Tan et al. [39] introduced a mixed-reality platform that enhances user engagement through intuitive interactive operations.
However, many existing systems exhibit limited interoperability with robotic operational data, including positional coordinates, control commands, and raw sensor streams. To address this gap, this study proposes a digital twin-based system for wall inspection and structural health monitoring. The framework enables not only qualitative assessment but also delivers quantitative metrics, such as defect dimensions and precise location data within a fixed coordinate system.
3. Methodology
This section describes the proposed methodology in four parts: hardware and software systems, image-based inspection, and project management. They are detailed in Section 3.1, Section 3.2 and Section 3.3, respectively.
3.1. System Architecture
The wall-climbing robot in this study utilizes negative pressure adhesion for surface attachment. Its locomotion system consists of two impellers that generate vacuum pressure and four wheels enabling lateral movement (Figure 2). The platform houses an Ultra-wideband (UWB) radar on one side and features a mounting base supporting an extended rod with a camera sensor. The robot is directly powered with cables to ensure long durability. The sub-modules of the robot system are described as follows:
- (1)
- Sensing subsystem
The robotic platform is equipped with a multi-modal sensor set combining contact and non-contact technologies for comprehensive building inspection. An RGB and infrared (IR) camera simultaneously captures both visible light and infrared radiation, enabling concurrent detection of surface defects such as cracks and spalling through visual analysis, and subsurface defects such as hollowing through thermal variations. The UWB radar complements this by penetrating building materials to reveal hidden voids and delamination within deeper construction layers. This strategic sensor fusion provides cross-validation capabilities across different physical modalities, significantly enhancing inspection reliability and defect characterization accuracy. The current study focuses specifically on RGB image data acquisition and processing pipeline development.
- (2)
- Localization subsystem
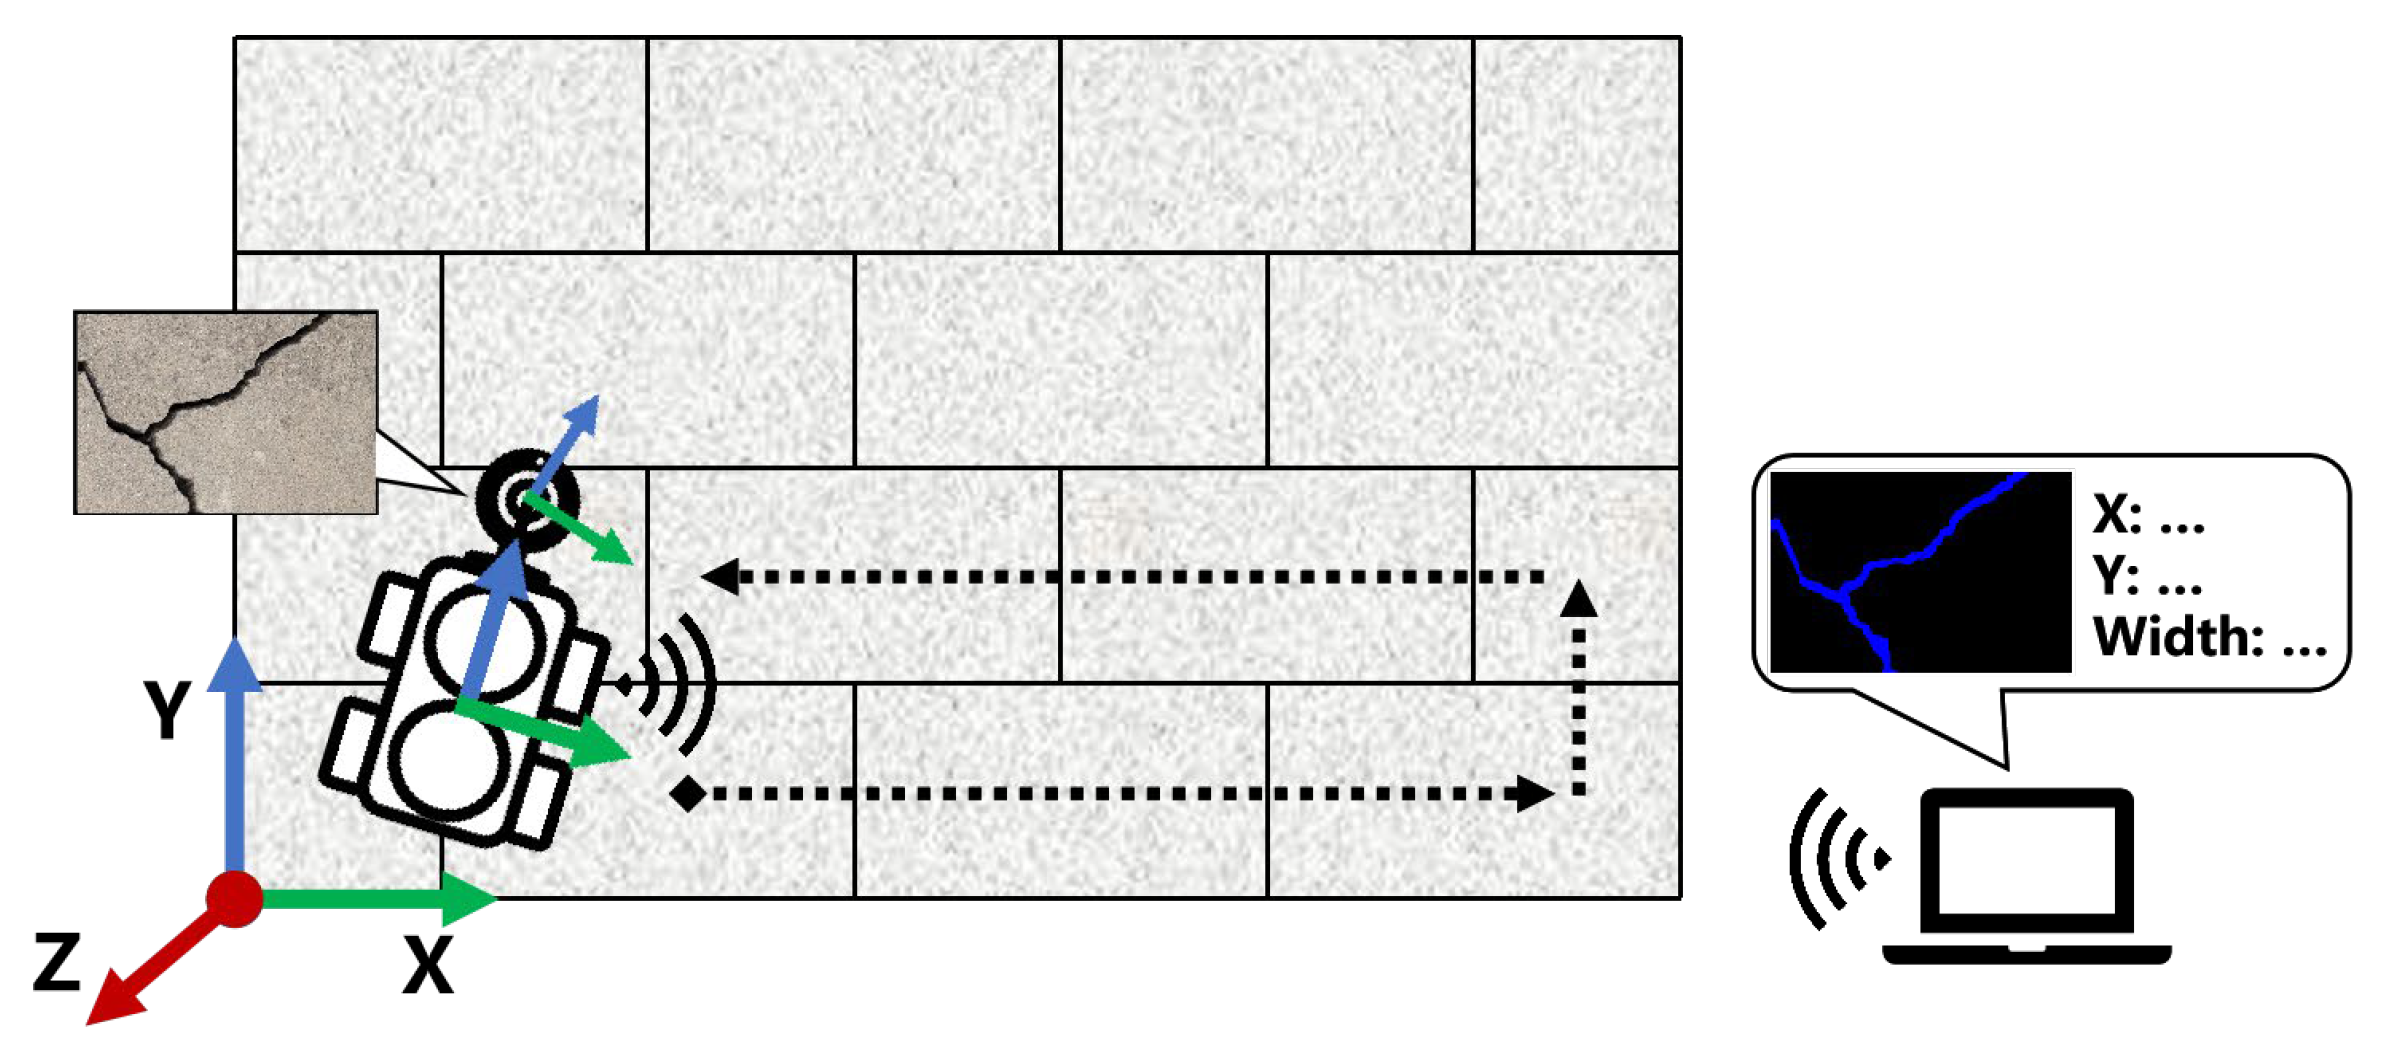
Accurate localization is a fundamental prerequisite for path planning and scene reconstruction, as a robot must precisely determine its position to execute navigation commands effectively. For wall-climbing robots operating in outdoor environments, GNSS positioning (e.g., Global Positioning System (GPS), BeiDou, etc.) provides a viable localization framework. However, typical GNSS solutions offer only meter-level accuracy, which is insufficient for detailed inspection tasks on building exteriors. Therefore, this study employs Real-Time Kinematic (RTK) technology to enhance GNSS positioning precision. The RTK method establishes a fixed base station at a known, precisely surveyed location (i.e., a geodetic marker). This base station calculates real-time error corrections for satellite signals and broadcasts them to the robot’s GNSS receiver, enabling centimeter-level positional accuracy in real-time. Furthermore, a coordinate calibration was performed prior to each inspection task to transform the global geodetic coordinates (longitude, latitude, altitude) into a local building reference frame (x-y-z, as illustrated in Figure 3), with its origin defined at the bottom-left corner of the target wall.
To complement the positional data and determine the robot’s orientation, an Inertial Measurement Unit (IMU) was installed at the robot’s center. By measuring the direction of gravity, the IMU provides the robot’s body orientation. This information, combined with the RTK position, allows for the precise derivation of the onboard camera’s location at each timestamp relative to the robot’s center. This integrated sensor calibration ensures that every image captured during inspection can be accurately geotagged within the building’s coordinate system.
- (3)
- Planning subsystem
The robot’s inspection path was generated using a coverage-oriented planning technique, modified from our previous work [34]. This approach involved segmenting the vertical wall surface into candidate regions and performing a global optimization to guarantee complete coverage while minimizing the total path length, resulting in a zig-zag trajectory. The path planning module also incorporates an emergency stop mechanism, which is triggered upon encountering non-traversable regions (e.g., windows) to ensure operational safety.
- (4)
- Ground station
The ground station, operating on a gaming laptop with a graphics card, handles data visualization, deep-learning inference, and human–machine interaction. Inspection technicians can either teleoperate the robot to inspect specific areas or activate autonomous mode to execute coverage path planning, collecting multi-source data at predetermined intervals. Concurrently, a specially trained image segmentation model processes visual data in real-time to identify wall defects. The resulting pixel-level segmentation masks are combined with camera parameters to calculate accurate metric dimensions for each defect. Through timestamp synchronization, these defects are precisely mapped to wall coordinates using robot localization data and visualized within a digital twin system.
- (5)
- Cloud platform
The ground station maintains regular synchronization with a cloud-based facility management platform, enabling dynamic updates of inspection results to the digital twin model. This integrated platform supports comprehensive project management capabilities, including task allocation, personnel coordination, and equipment monitoring, thereby facilitating full digital transformation throughout the building lifecycle management process.
Figure 2.
The proposed wall-climbing robot with onboard sensors.
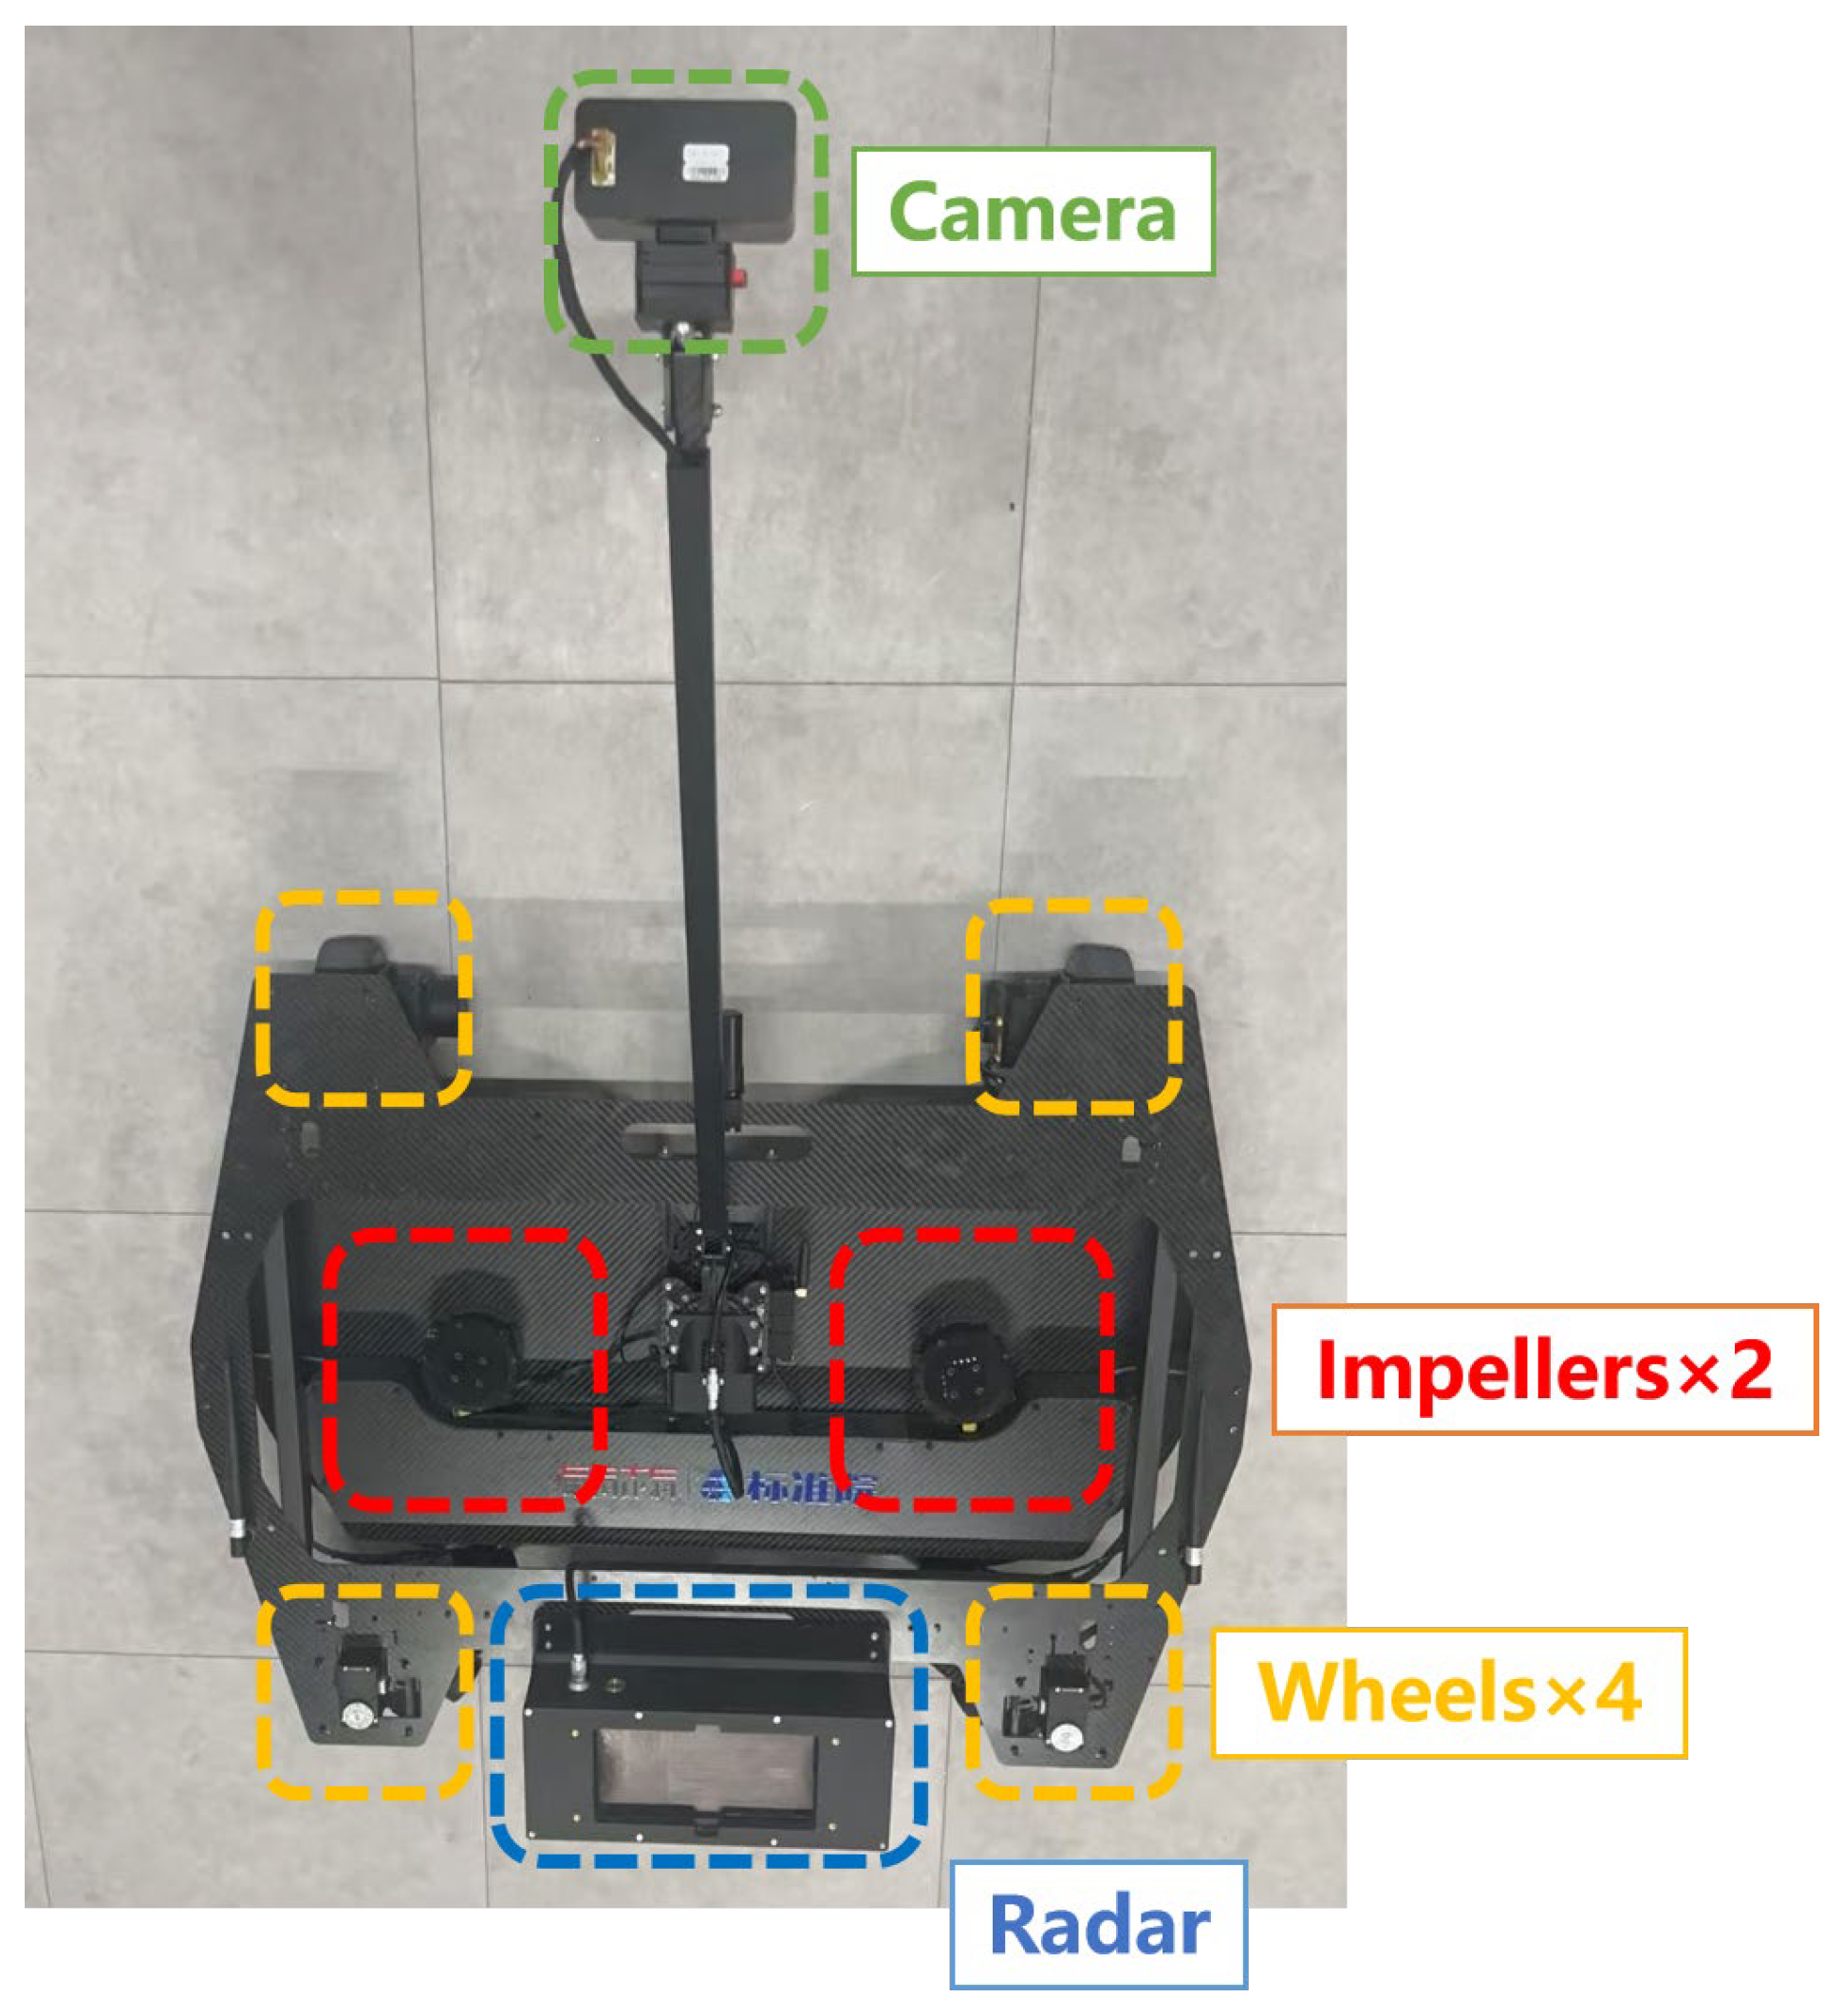
Figure 3.
Localization and path planning modules.
3.2. Image-Based Defect Inspection
This section describes a three-step inspection process: defect extraction from images (Section 3.2.1), defect size quantification (Section 3.2.2), and localization on walls (Section 3.2.3).
3.2.1. Deep-Learning Defect Segmentation
This study employs visual inspection, as imagery most closely aligns with human perception. In addition, camera sensors offer a compact, cost-effective, and practical solution for integration into wall-climbing robots. Recent advances in visual deep learning have shown substantial advances in classification, detection, and segmentation tasks. Specifically, the wall inspection task is formulated as an instance segmentation problem, requiring the model to predict a class label, a bounding box, and a pixel-wise mask for each defect present in an image.
In this study, two types of critical wall defects are considered: cracks and spalling. Cracks usually arise from material shrinkage, uneven structural settlement, or repeated thermal-humidity cycles. They may create pathways for water infiltration, accelerate material degradation, and undermine the wall’s waterproofing capacity. Structurally, unaddressed cracks can propagate under stress, reducing the wall’s load-bearing efficiency and compromising overall structural stability. Spalling, on the other hand, involves the detachment of surface layers (e.g., plaster, concrete cover) from the substrate, typically caused by bond failure between layers, water expansion in pores, or corrosion-induced expansion of embedded steel. For facades, spalling causes direct surface damage and exposes the underlying structure to environmental aggressors (e.g., moisture, pollutants). Structurally, it weakens the protective layer of load-bearing components, accelerates reinforcement corrosion, and induces progressive structural deterioration, posing long-term safety risks to the building [40].
However, the existing datasets for defect segmentation are not well suited for climbing-robot inspection due to several critical gaps: (1) they lack tight-shot, close-range wall images that match the constrained field of view of an onboard robotic camera; (2) they exhibit a highly unbalanced class distribution, with cracks much more frequently found than spalling instances; (3) their limited material diversity hinders model generalization (e.g., spalling in public datasets often exposes concrete aggregates, whereas real-world facade spalling may reveal underlying insulation or other materials).
To address these limitations, this study constructs a tailored dataset [41] by merging multiple public benchmarks with self-collected images captured via handheld devices and drones. Further, emphasis is placed on balancing class representation and enhancing the diversity of spalling defects. The dataset is further augmented using geometric transformations and generative models such as Stable Diffusion to improve robustness and generalization [42].
This study employed typical instance segmentation models to automatically detect, classify, and segment crack and spalling defects from monocular images. Given the constrained computational resources typically available in construction environments, our implementation prioritizes lightweight architectures capable of real-time inference on portable devices. The YOLO series, recognized as the industry standard for real-time object detection, was selected for its exceptional computational efficiency. Unlike conventional two-stage detectors that perform region proposal and classification sequentially, YOLO utilizes a unified neural network that simultaneously predicts bounding boxes and class probabilities in a single forward pass. Specifically, we adopted YOLO12 as our base architecture due to its innovative attention-centric design that replaces standard convolutional layers with more efficient gated attention mechanisms. This architectural advancement achieves state-of-the-art detection and segmentation accuracy while maintaining computational efficiency comparable to previous versions such as YOLO11. The detailed dataset information and training strategies are examined in the Validation section.
3.2.2. Real-World Metric Quantification
- (1)
- Size quantification
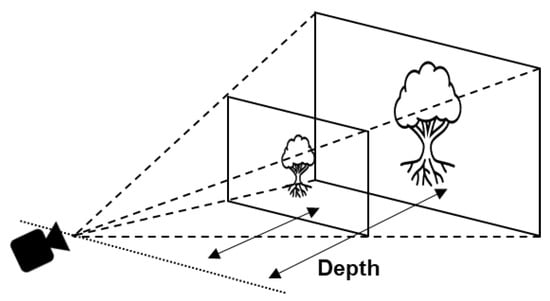
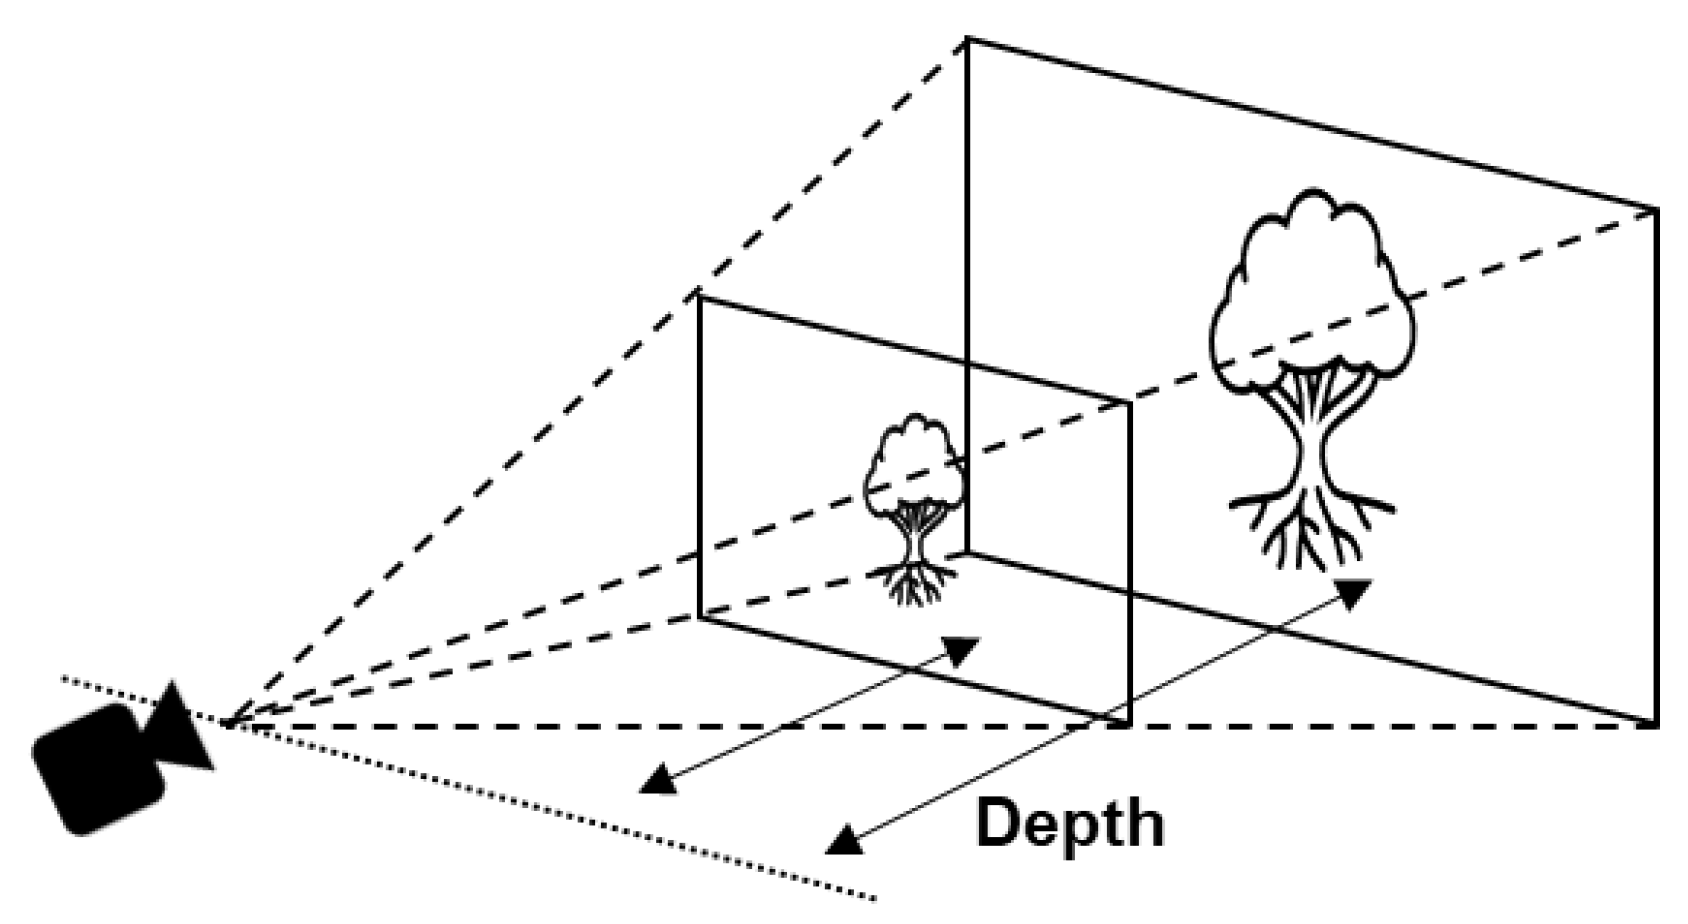
Following defect segmentation, the subsequent task is to determine the precise dimensions and spatial position of each defect instance. Our methodology adopts the pinhole camera model, which mathematically describes how 3D scenes are projected onto a 2D image plane through a perspective transformation. However, monocular imagery introduces a fundamental limitation: a single image cannot resolve the metric scale of individual pixels without depth information, as different objects occupying the same view frustum produce identical 2D projections (Figure 4). This scale ambiguity presents a significant challenge for quantitative structural assessment.
Figure 4.
Objects with unknown depths appear identical in the camera’s view.
Fortunately, our inspection scenario incorporates two key constraints that resolve this inherent limitation. First, all target defects are essentially two-dimensional features co-planar on the wall surface. Second, the robot’s mechanical design maintains a fixed perpendicular orientation between the camera axis and the wall plane throughout operation. This engineered configuration enables us to treat the depth parameter as a known constant, i.e., the perpendicular distance from the camera lens to the wall surface. This effectively eliminates the need for additional depth sensors.
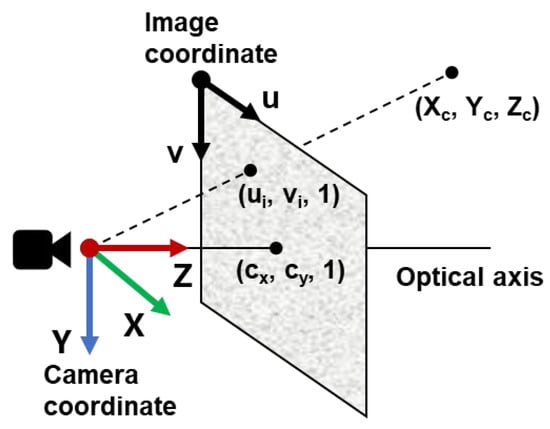
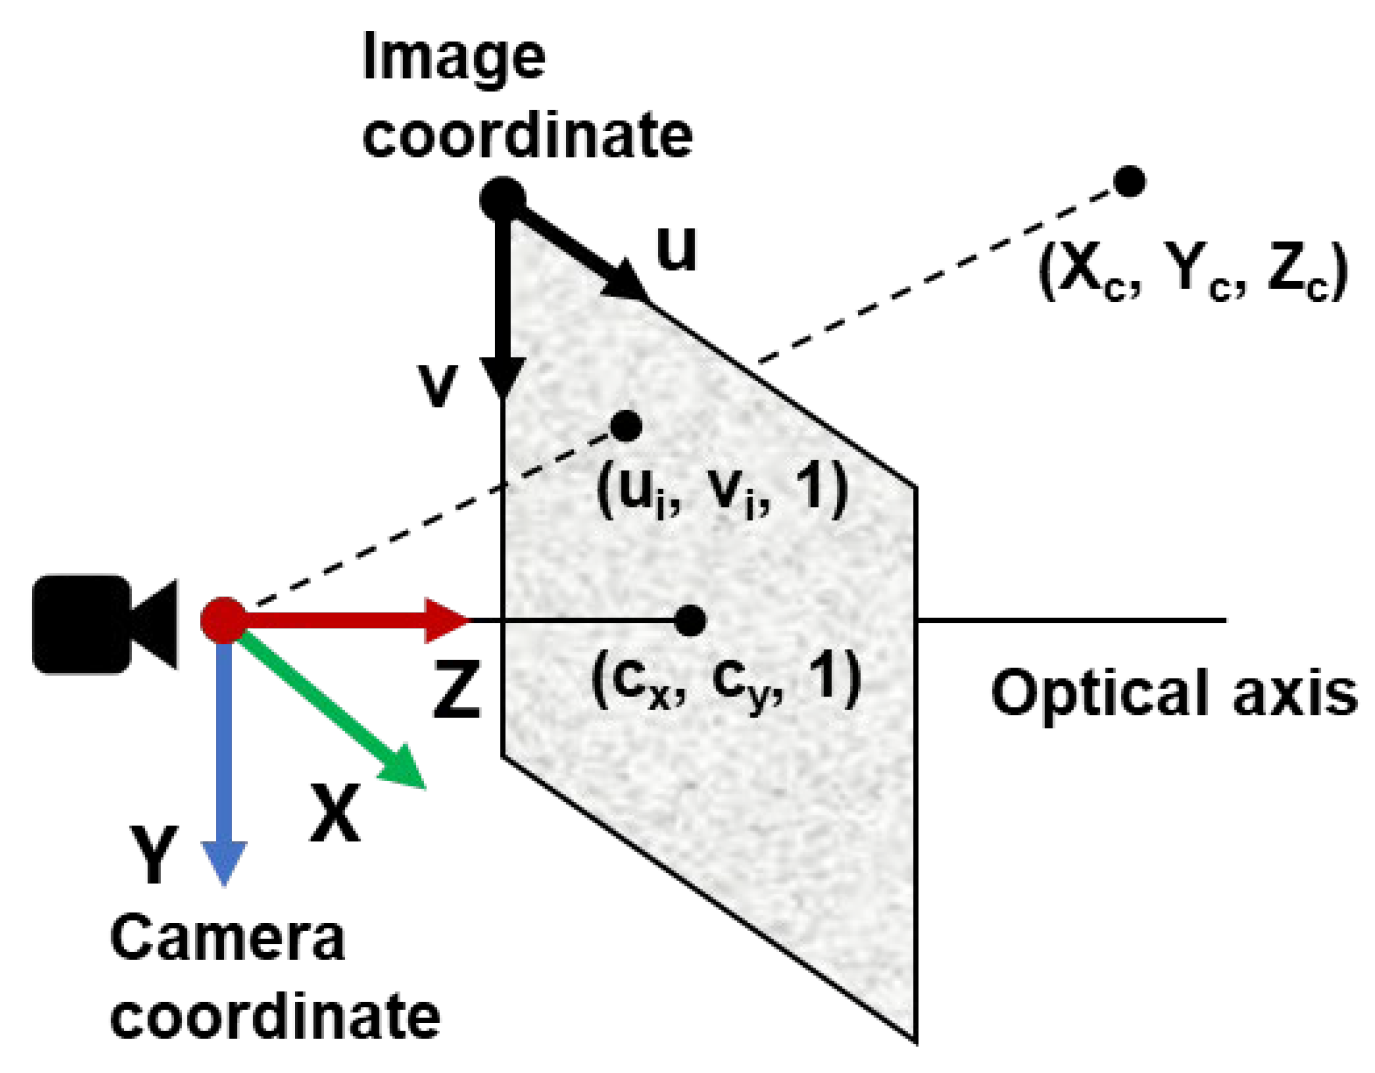
As illustrated in Figure 5, this setup establishes a direct geometric relationship where each feature point in the 3D camera coordinate system (Xc, Yc, Zc) corresponds to a pixel location (ui, vi) on the 2D image plane through projective geometry. Using Equation (1), where Zc represents the fixed camera-to-wall distance, λ denotes a scale factor, and fx, fy, cx, cy are the pre-calibrated camera intrinsic parameters, we can solve for the actual physical dimensions Xc and Yc. This approach effectively establishes the metric scale of each pixel, enabling accurate quantification of defect sizes and positions in real-world units rather than pixel counts, thereby providing structurally meaningful measurements for engineering assessment.
Figure 5.
Pinhole camera projection from the camera’s coordinate to the image plane.
- (2)
- Shape description
After quantification of pixel dimensions, a targeted geometric approach is applied on each defect to extract shape descriptions. This study employs classical machine learning algorithms to derive key representative parameters due to their high efficiency. Although deep learning algorithms such as autoencoders [43] are capable of non-linear dimensionality reduction and automated geometry description, they introduce additional GPU overhead. Given that the system already supports a computationally intensive instance segmentation model, the use of lightweight classical algorithms provides an effective balance between accuracy and processing efficiency.
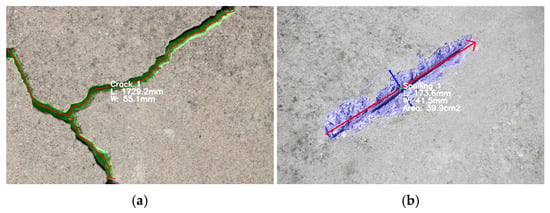
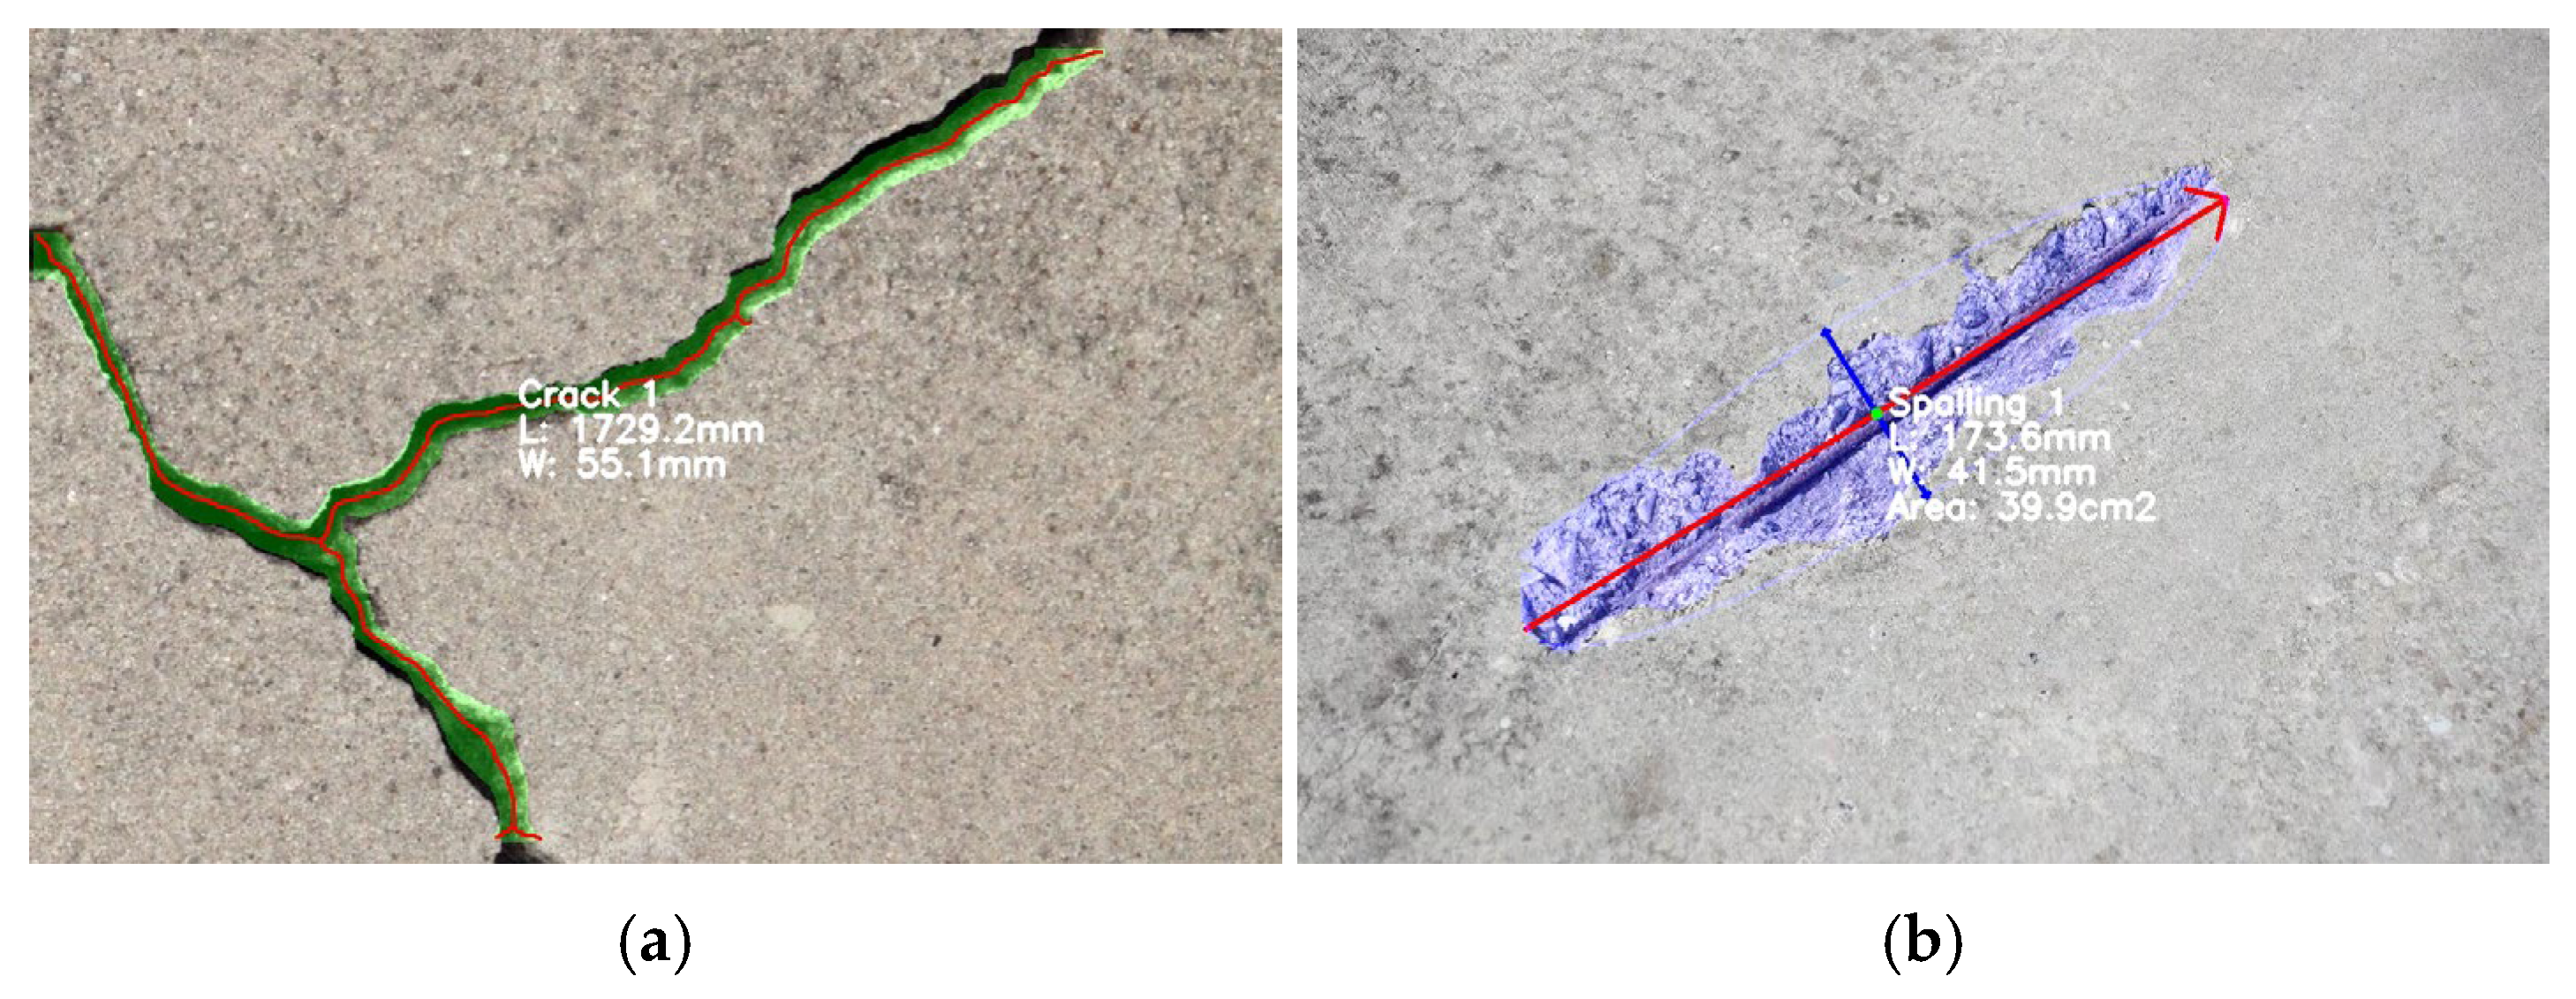
For linear, irregular defects such as cracks, it is essential to first define their length and width. A skeletonization method is employed, which extracts the morphological skeleton from the defect contour. The skeleton is a 1-pixel-wide centerline that preserves the topology of the original shape. It can be obtained through an iterative thinning process. This process peels away boundary pixels until only the medial axis remains, and connectivity is preserved throughout this operation. The total crack length is determined by summing the lengths of all connected skeletal segments. For complex, networked patterns like alligator cracks, the longest continuous span is used as the representative length. The local width at each skeleton point is found by measuring the distance to the contour along the normal direction. These local widths are then averaged to represent the overall crack width.
For regional defects such as spalling, the Principal Component Analysis (PCA) algorithm is applied on segmented pixels to determine the major and minor axes from the 2D pixel distribution. PCA works by identifying orthogonal directions of maximum variance in the data through eigenvector decomposition of the covariance matrix. The first principal component (the largest eigenvector) represents the length direction as it captures the direction along which the spalling pixels exhibit the greatest spatial spread. Then, the orthogonal axis (the second eigen vector) defines the width direction. Further, spalling defects are evaluated using their area, calculated as the total count of segmented pixels. The metric quantification for crack and spalling defects is illustrated in Figure 6.
Figure 6.
Size quantification for crack (a) and spalling (b) using skeleton extraction and PCA algorithm, respectively.
3.2.3. Robot and Defect Localization
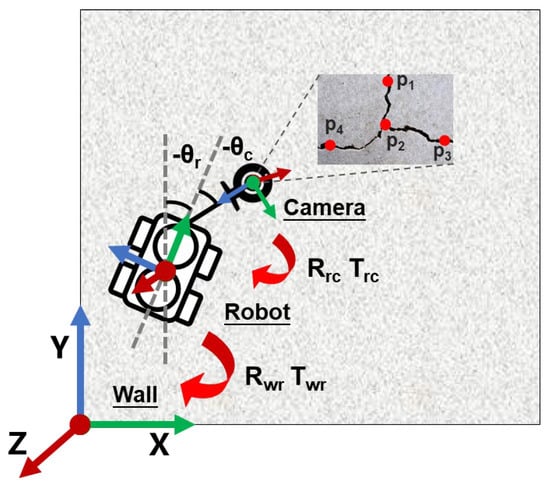
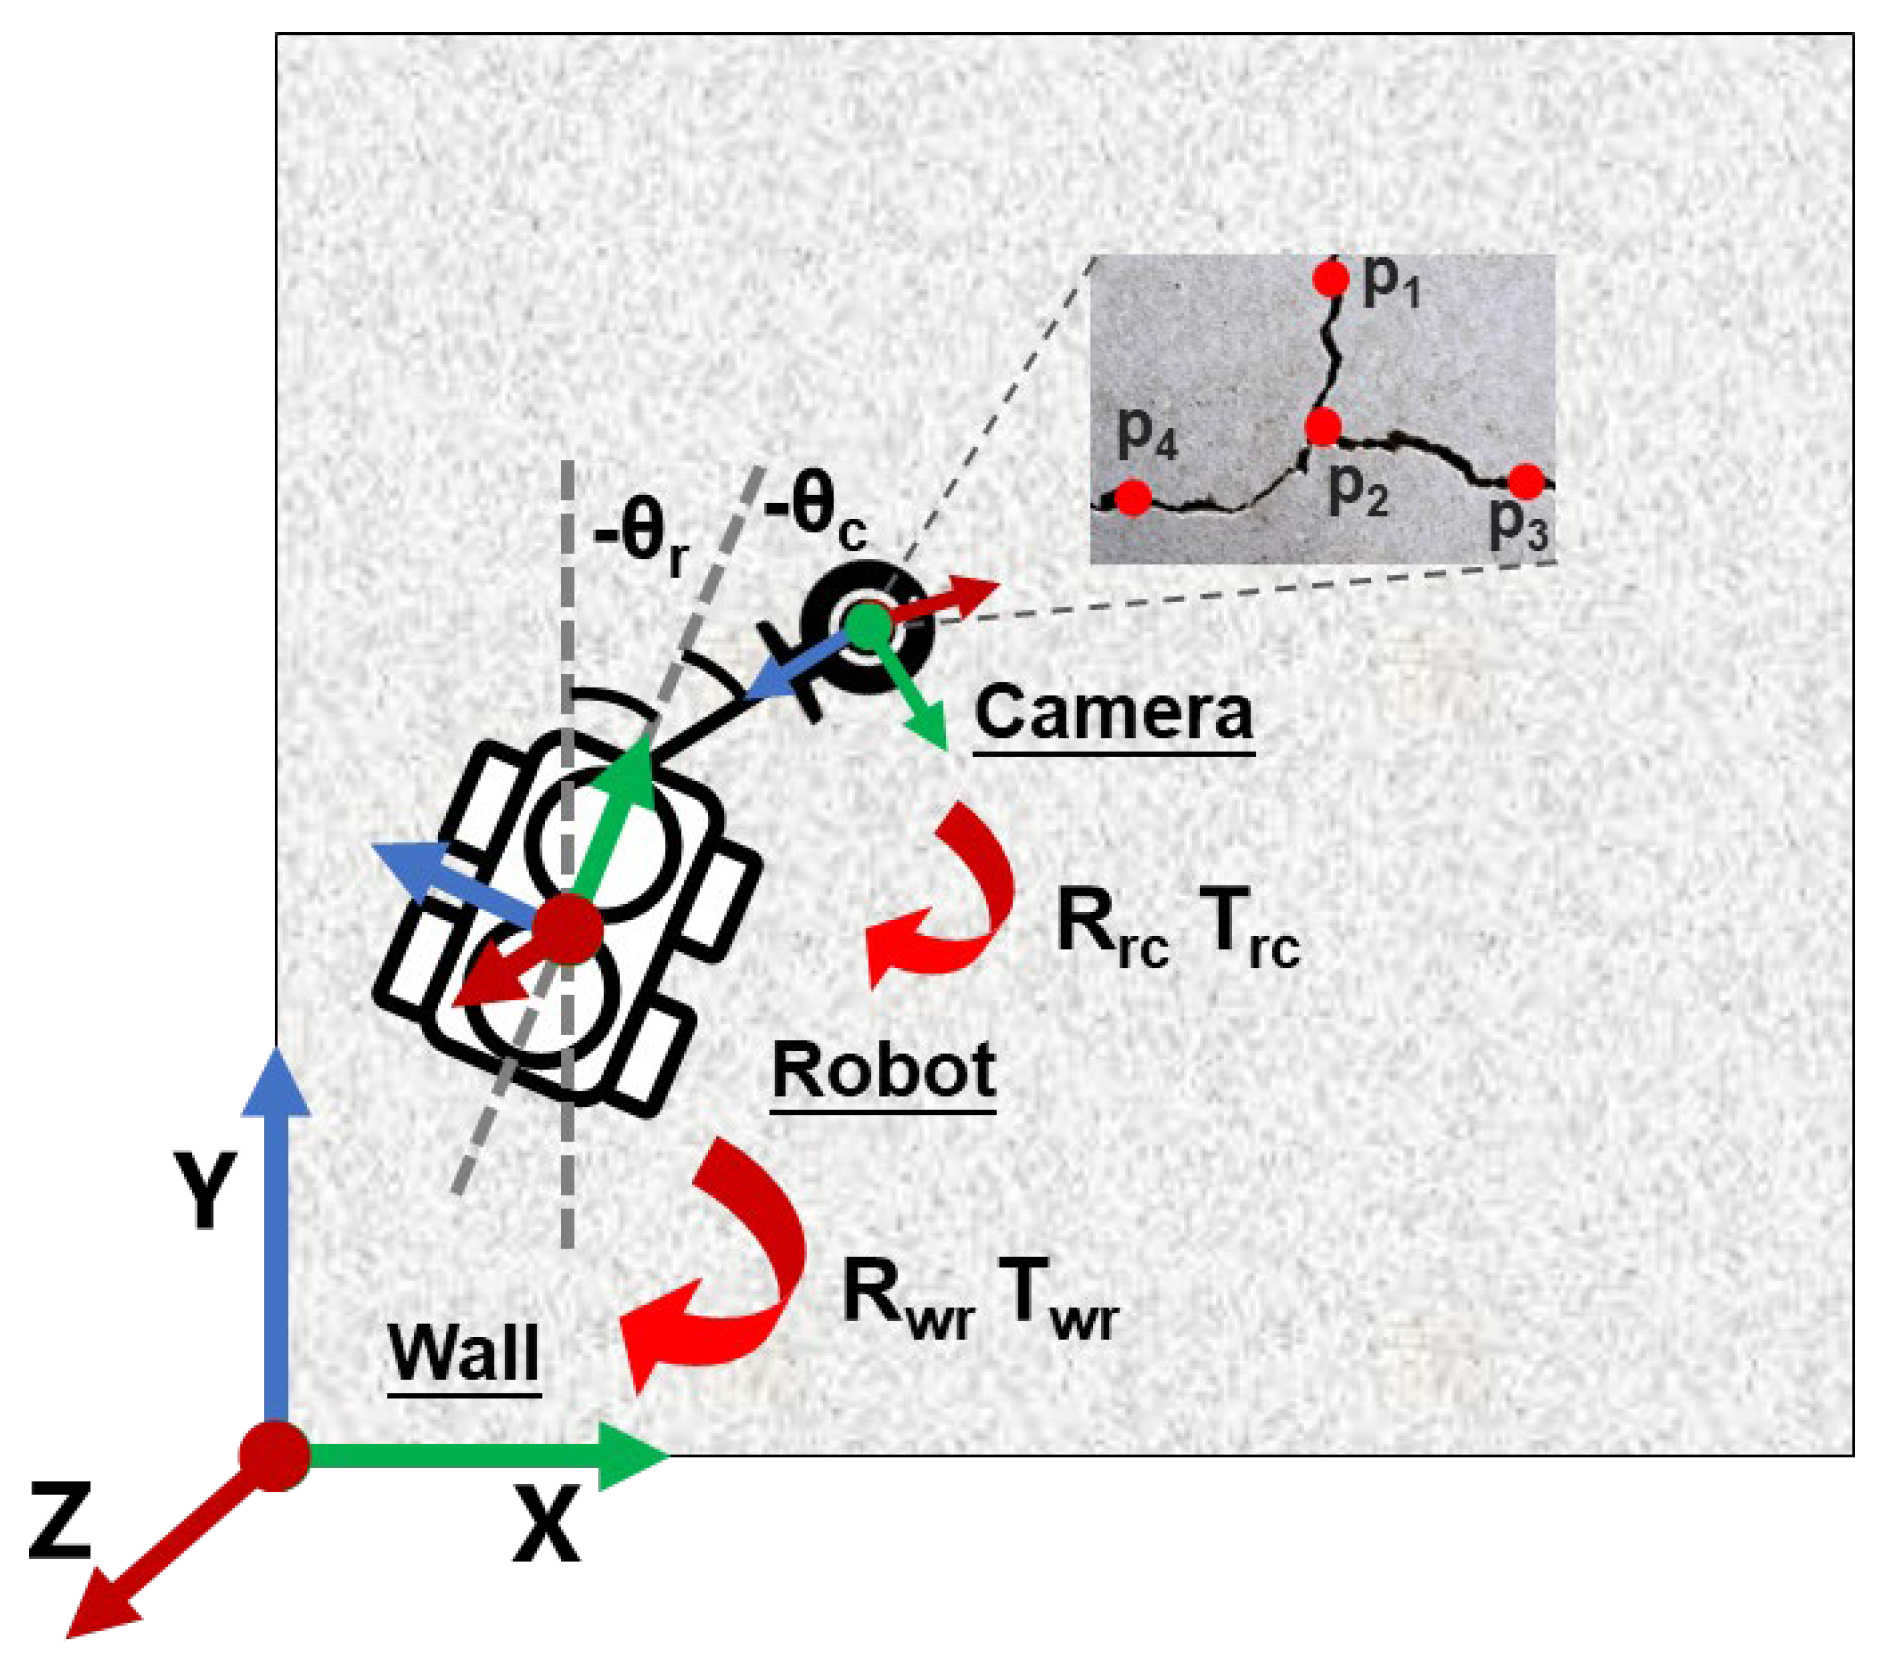
Defect positions are determined through a sequential coordinate transformation process that establishes precise spatial relationships across multiple reference frames. Each defect’s location, initially identified by the bounding box center in the camera coordinate system, undergoes a geometric transformation to ultimately reach the building coordinate system. The process begins with the transformation to the robot’s body frame using the known geometric configuration of the mounting rod, characterized by translation vector Trc and rotation matrix Rrc. This intermediate step aligns defect positions with the robot’s structural framework.
Subsequently, the position is transformed to the global building coordinate system using the robot’s pose relative to the wall, defined by transformation parameters Twr and Rwr, as illustrated in Figure 7. The camera-to-robot rotation matrix Rrc is derived from the known mechanical inclination angle θc, while the translation vector Trc is determined from physical design configurations. Similarly, the robot-to-wall rotation Rwr is calculated from the inclination angle θr measured by the IMU relative to gravity, and the translation Twr is provided by the high-precision RTK positioning system, calibrated to the wall’s bottom-left corner as the coordinate origin.
Figure 7.
Camera-to-wall coordinate transformation.
Equation (2) demonstrates the comprehensive homogeneous coordinate transformation from camera coordinates (Xc, Yc, Zc) to wall coordinates (Xw, Yw, Zw). The rotation matrices are rigorously derived using the Z-Y-X Euler angle formulation Rot (yaw, pitch, roll), with detailed mathematical expressions provided in Equations (3) and (4). This multi-stage transformation chain enables precise defect localization within the architectural context, facilitating accurate documentation and subsequent maintenance planning.
3.3. Digital Twin Project Management
The project management platform serves as a dynamically synchronized, interoperable data center within the proposed framework. It is designed to support the automated analysis of exterior wall defects across complex scenarios such as multiple buildings, diverse equipment, and concurrent tasks. A central component of this platform is the up-to-date digital twin model, which provides immersive 3D visualization and unified data integration. This model loads high-precision as-designed building models (e.g., from SketchUp or Revit) and spatially maps the processed defect inspection results, including precise locations and diagnostic information, onto the corresponding facades. This integration enables users to interactively explore the building’s health status from any viewpoint and drill down into specific defects. Detailed diagnosis is supported by quantitative evidence, such as the original inspection imagery and algorithmically generated annotations. This cohesive integration of data management and immersive visualization facilitates comprehensive assessment and informed maintenance decision-making.
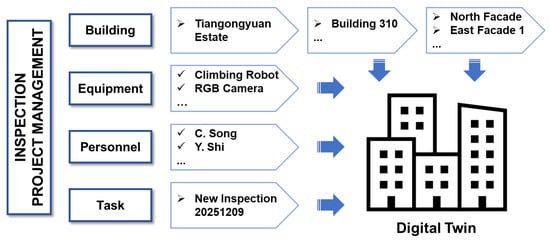
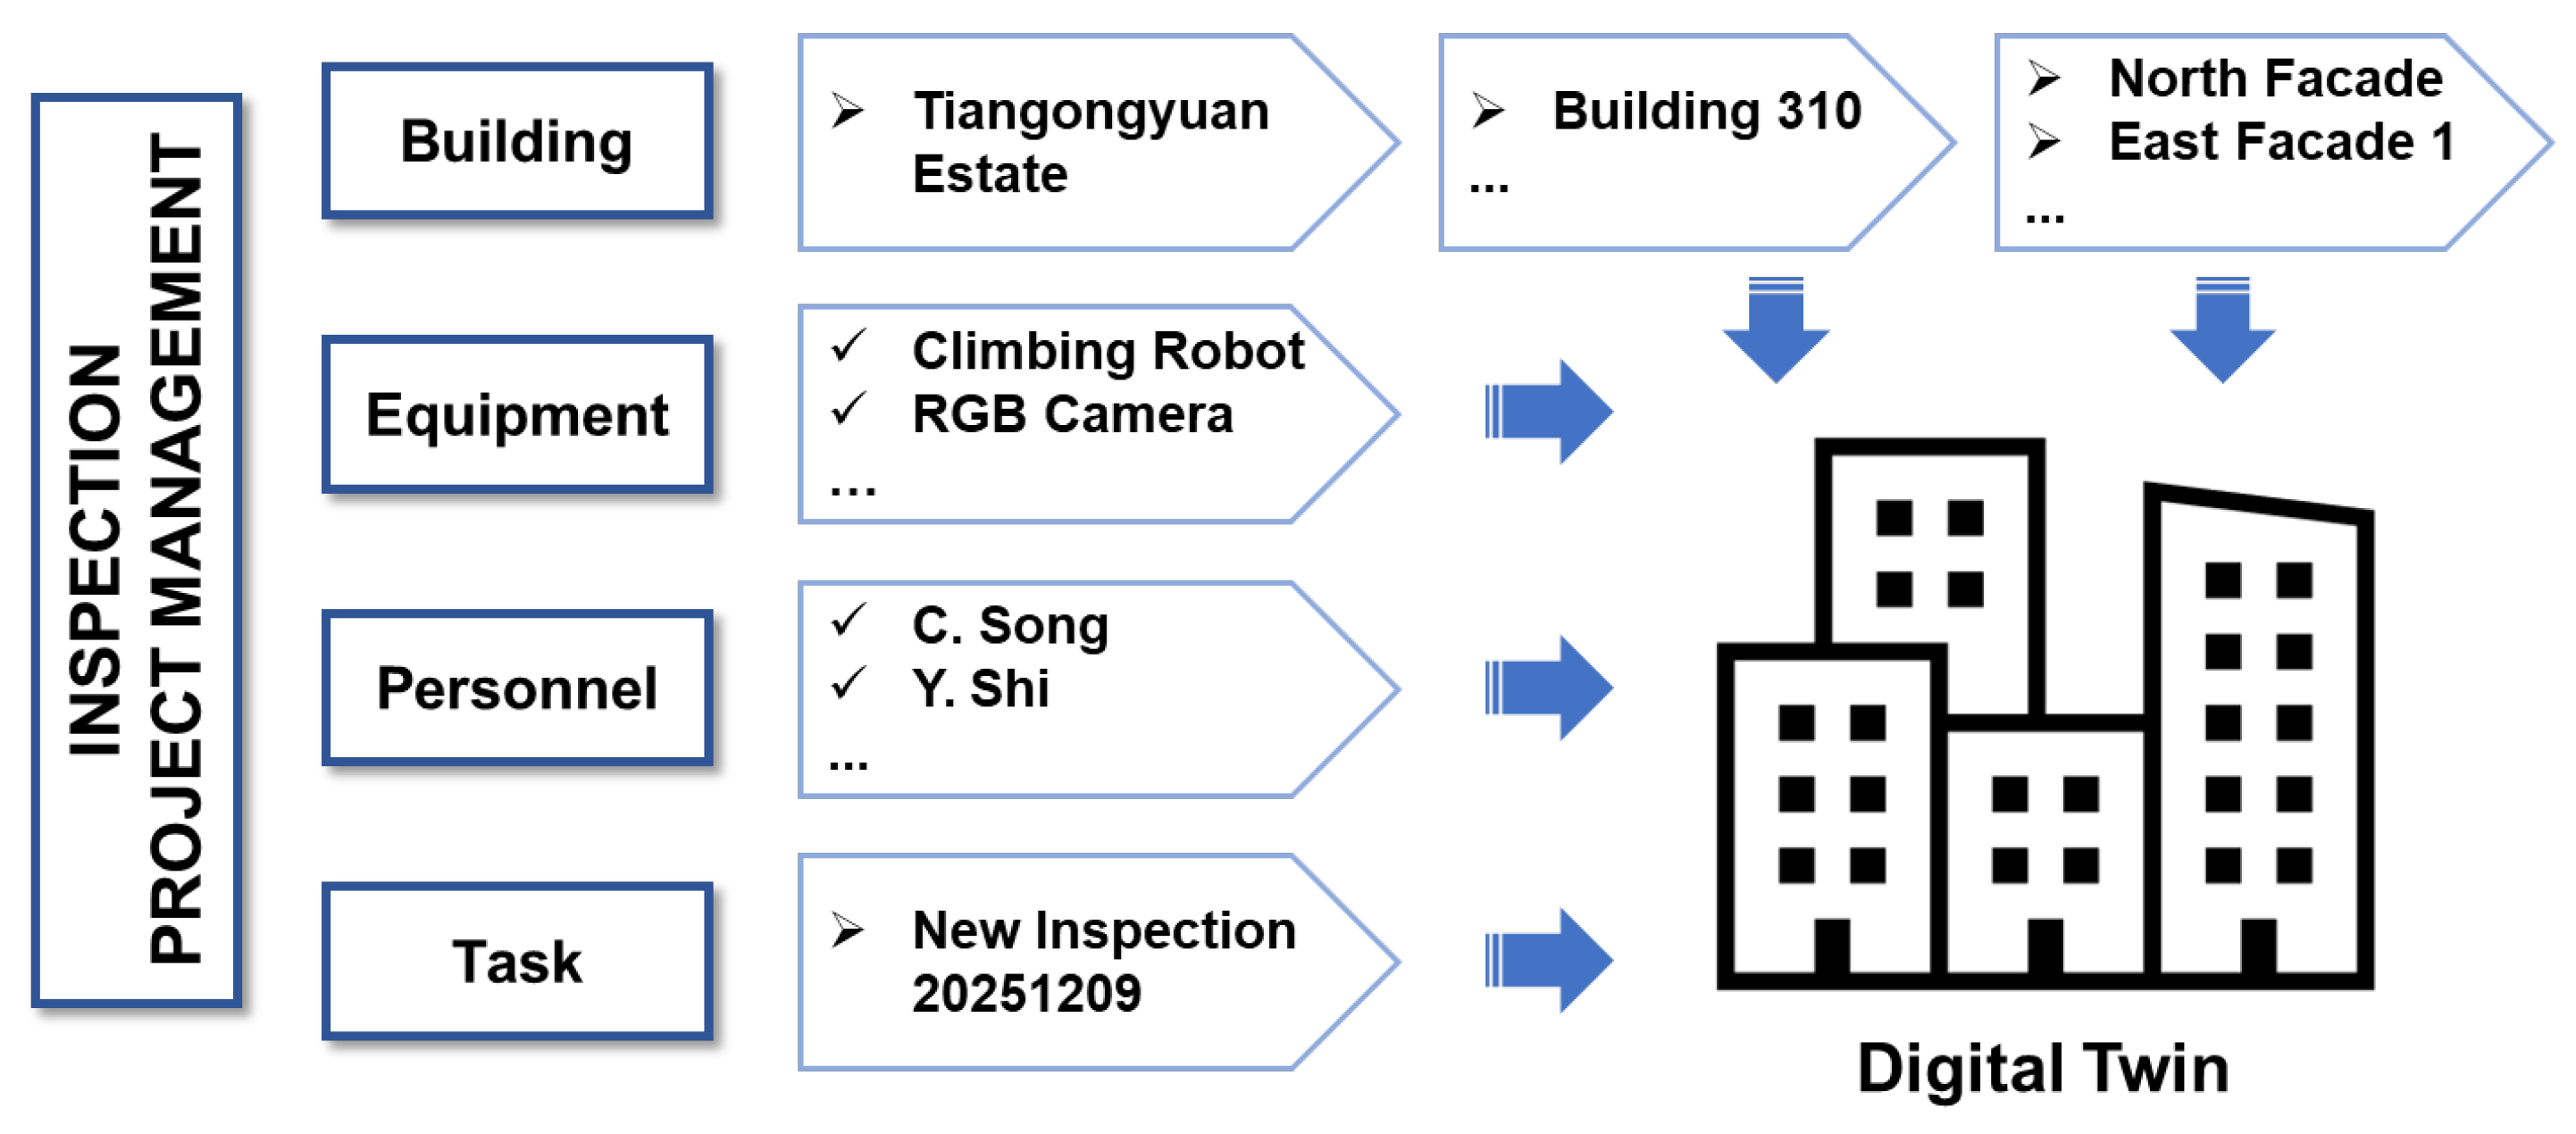
The proposed platform has a modular architecture consisting of four core components (Figure 8):
Figure 8.
Functional modules of the project management platform.
- Building Management: This module maintains a hierarchical structure of building assets: from building complexes, individual buildings, to specific wall facades. Users can dynamically create and configure relationships between different data objects, supporting multi-facade and multi-round inspections.
- Equipment Management: This module registers and tracks the status of inspection devices, including basic information (e.g., serial numbers) and algorithmic parameters (e.g., camera parameters), to ensure proper allocation and algorithm compatibility of equipment.
- Personnel Management: This module utilizes role-based access control to define user permissions and data visibility, enabling secure multi-team, multi-level collaborative scenarios.
- Task Management: This module is the core component that manages the end-to-end inspection workflow from task creation to result presentation. It automatically links relevant building attributes and seamlessly integrates raw sensor data, detection results, and quantitative measurements into a structured data presentation. Based on industry standards and historical records, the platform supports informed decision-making and maintenance scheduling.
The platform is built on a client-server architecture that separates the frontend and backend components, enhancing both maintainability and scalability. The frontend User Interface (UI) is developed with the Vue framework using a layered design, while the backend employs a Spring Boot-based microservices architecture to provide secure and robust Application Programming Interface (API) services. Its core technical components and their interactions are outlined in in Table 1. This structure ensures a high-performance, secure, and modular platform capable of supporting complex, multi-step inspection workflows.
Table 1.
Software architecture of the platform.
4. Validation
This section presents the experiment setups and results in Section 4.1 and Section 4.2, respectively.
4.1. Experiment Setup
4.1.1. Site Information
The proposed framework is validated in both laboratory tests and a building facade inspection project. The experimental validation was performed in a construction laboratory located in Daxing, Beijing, where several prefabricated wall elements with precisely introduced crack and spalling defects of varying severity were selected as test specimens. To establish reliable ground truth measurements for quantitative performance evaluation, the actual dimensions of these artificial defects were manually measured using high-precision laser range finders.
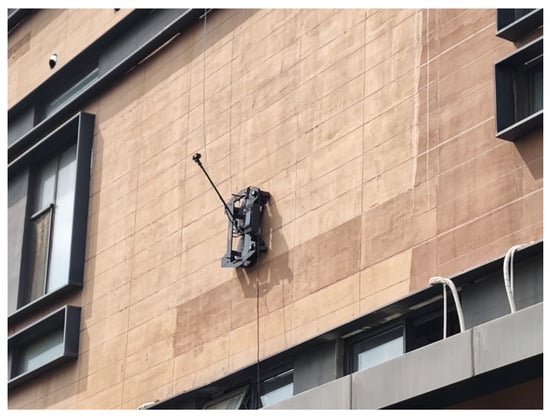
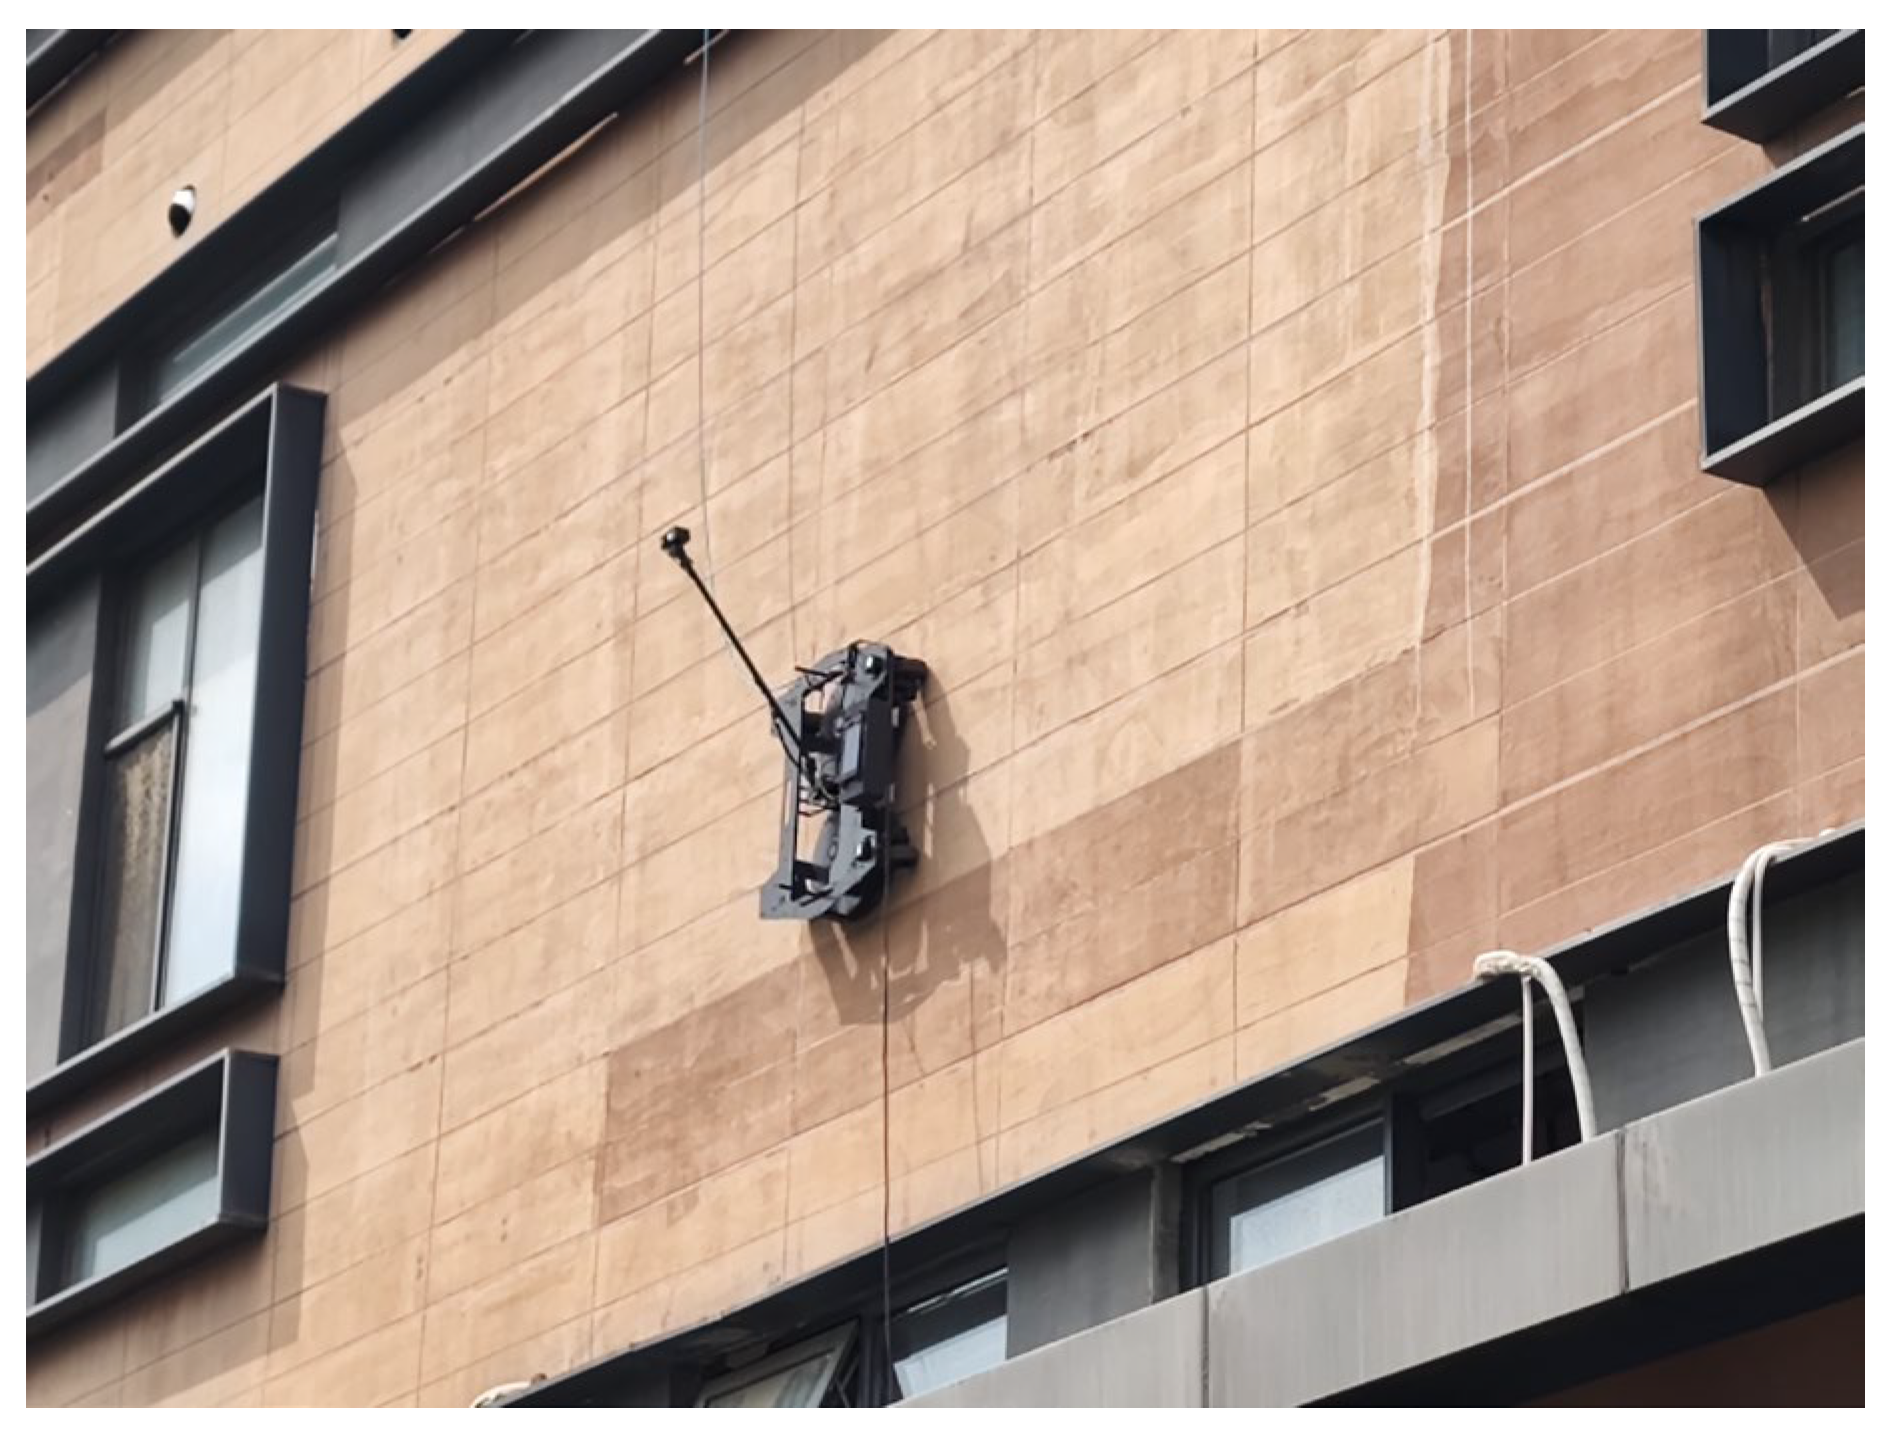
The field validation was conducted on a residential building in Tongzhou, Beijing. The building exhibits typical facade defects, including minor cracks and spalling. The original SketchUp architectural design drawings of the building were obtained prior to the experiment. They were converted into a digital twin model to support facility management operations and provide spatial context for localization. For the experiment, the north façade (Figure 9) was selected for robotic inspection due to its uniform exposure to environmental factors and accessibility. The wall-climbing robot commenced operations from the bottom-left corner of the designated wall area, executing a pre-programmed zig-zag coverage path that systematically traversed the entire vertical surface. During navigation, onboard sensors collected synchronized multi-modal data streams: the camera captured monocular RGB images at fixed time intervals, while the UWB radar simultaneously emitted and recorded penetrating signals to detect subsurface area. All data streams, including images, positioning information, and radar returns, were temporally synchronized using standardized timestamps, enabling correlated multi-sensor analysis during post-processing and ensuring accurate spatiotemporal registration of all detected defects within the digital twin representation.
Figure 9.
Building exterior inspection using the wall-climbing robot.
4.1.2. Hardware Settings
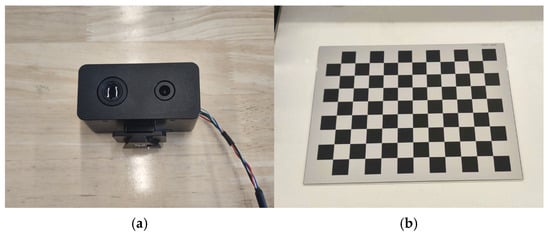
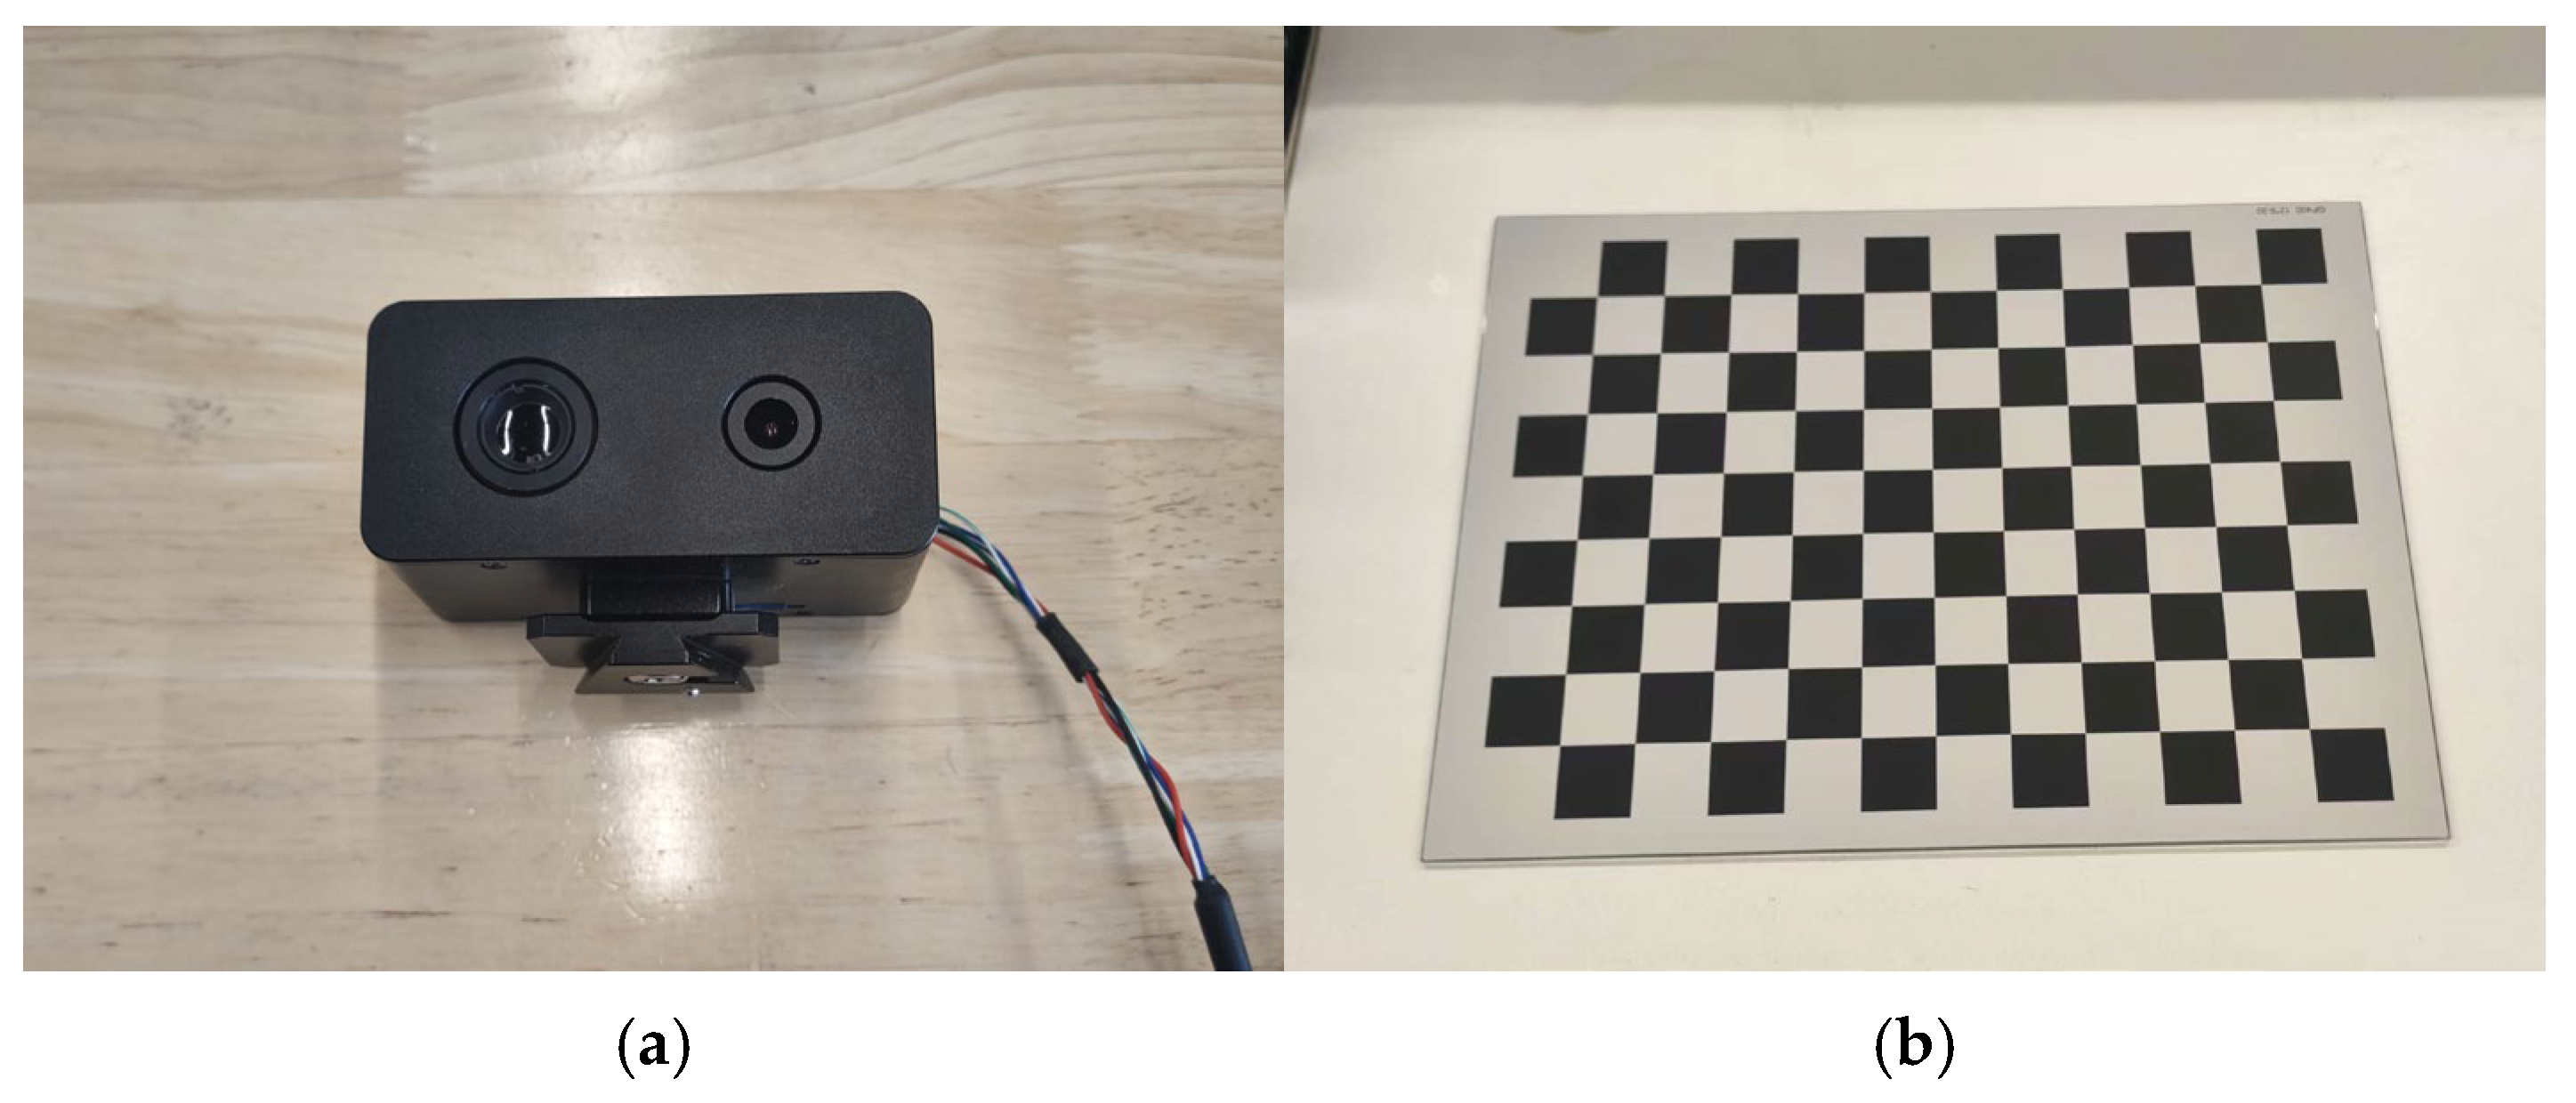
The hardware configuration of the proposed framework comprises three integrated components: the wall-climbing robot, the multi-modal sensor suite, and the ground station device. The mechanical specifications of the wall-climbing robot are detailed in Table 2. The RGB camera was mounted through an extended rod, maintaining a fixed perpendicular distance of 60 cm from the wall surface to optimize the field of view for vertical surface inspection. This specific mounting configuration ensures optimal focus range while minimizing perspective distortion across the inspection surface. Prior to deployment, the camera’s intrinsic parameters (including focal length, principal point coordinates, and lens distortion coefficients) were precisely calibrated in laboratory conditions using the OpenCV 4.12.0 calibration toolbox [44] with a standardized calibration chessboard (Figure 10). The technical specifications of the camera are shown in Table 3. This sensor combination enables complementary data acquisition spanning surface visual characteristics and subsurface structural integrity.
Table 2.
Specifications of wall-climbing robot.
Figure 10.
The RGB-IR camera (a) and the calibration board (b) (12 × 9, square size = 0.03 m).
Table 3.
Specifications of the RGB-IR camera.
The ground station of the system is selected as a lightweight laptop running Windows 11, equipped with an i7-11800H CPU (2.3 G Hz) and an RTX 3060 GPU (6 GB VRAM). This ground station serves dual purposes: firstly, it executes real-time deep learning inferences for immediate defect detection and segmentation; secondly, it manages the temporal synchronization and secure data transmission between the robotic platform and the cloud-based digital twin platform. This hardware configuration ensures sufficient computational throughput for both immediate processing requirements and seamless integration with the broader inspection ecosystem.
4.1.3. Model Training
We constructed a comprehensive wall defect dataset through multiple sources to ensure diversity. The dataset incorporates publicly available datasets such as crack-seg [45], HRCDS [46], S2DS [47], and CRSPEE [48], supplemented with images collected from real-world building inspection projects. To address domain gaps and enhance dataset robustness, we conducted an extensive augmentation pipeline, combining traditional augmentation techniques (e.g., geometric transformations and color space adjustments) with modern generative data synthesis using Stable Diffusion. All collected and generated images were annotated using Labelme 5.2.1 [49]. The proposed dataset is publicly available at [41].
The final dataset comprises 16,000 annotated images with ground truth segmentation masks categorizing two critical damage types: cracks and spalling. The dataset was partitioned into training (80%), validation (10%), and testing (10%) subsets to facilitate rigorous model development and unbiased evaluation.
For the detection architecture, we selected YOLO12s as our baseline model, leveraging its optimal balance between computational efficiency and detection accuracy for real-time applications. This choice specifically addresses the practical constraint of deployment on resource-constrained devices at construction sites. The model was initialized with pre-trained weights to benefit from transfer learning. Augmentation strategies, including linear transformations, mosaic composition, and color space adjustments, were implemented with the specifications provided in Table 4. These techniques significantly improve model robustness to lighting variations, scale changes, and occlusion scenarios commonly encountered in real inspection environments.
Table 4.
Hyperparameters for data augmentation.
All training experiments were conducted on a workstation running Ubuntu 22.04, equipped with an RTX 4080 GPU (16 GB VRAM). The complete hyperparameter configuration is detailed in Table 5. This hardware setup ensured efficient batch processing and rapid iteration during the model development cycle while accommodating the computational demands of the augmented dataset.
Table 5.
Hyperparameters for model training.
4.2. Result Demonstration
4.2.1. Defect Segmentation
- (1)
- Evaluation metrics
The performance of the defect segmentation model was evaluated using standard computer vision metrics. The evaluation is based on classifying predictions against ground truth labels into four categories: True Positives (TPs), False Positives (FPs), False Negatives (FNs), and True Negatives (TNs). The criterion for classifying a prediction as a TP is based on Intersection over Union (IoU) (Equation (5)), which quantifies the overlap between a predicted segmentation mask and its corresponding ground truth.
The core evaluation metric, mean Average Precision (mAP), is derived by computing the average precision (Equation (6)) for each class individually, then taking the mean across all classes. The mAP is calculated at IoU thresholds of 0.5 (mAP@0.5) and 0.75 (mAP@0.75), providing insights into performance under varying strictness criteria. To provide a counterbalancing measure, recall (Equation (7)) is calculated to evaluate the model’s completeness in identifying all actual defects. The harmonic mean of precision and recall, known as the F1-Score (Equation (8)), offers a balanced metric for overall detection performance. Additionally, the mean IoU is reported to capture the model’s pixel-level segmentation accuracy across all categories.
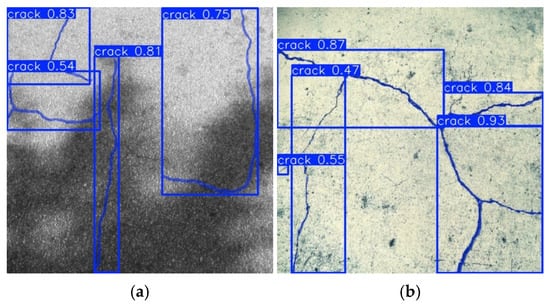
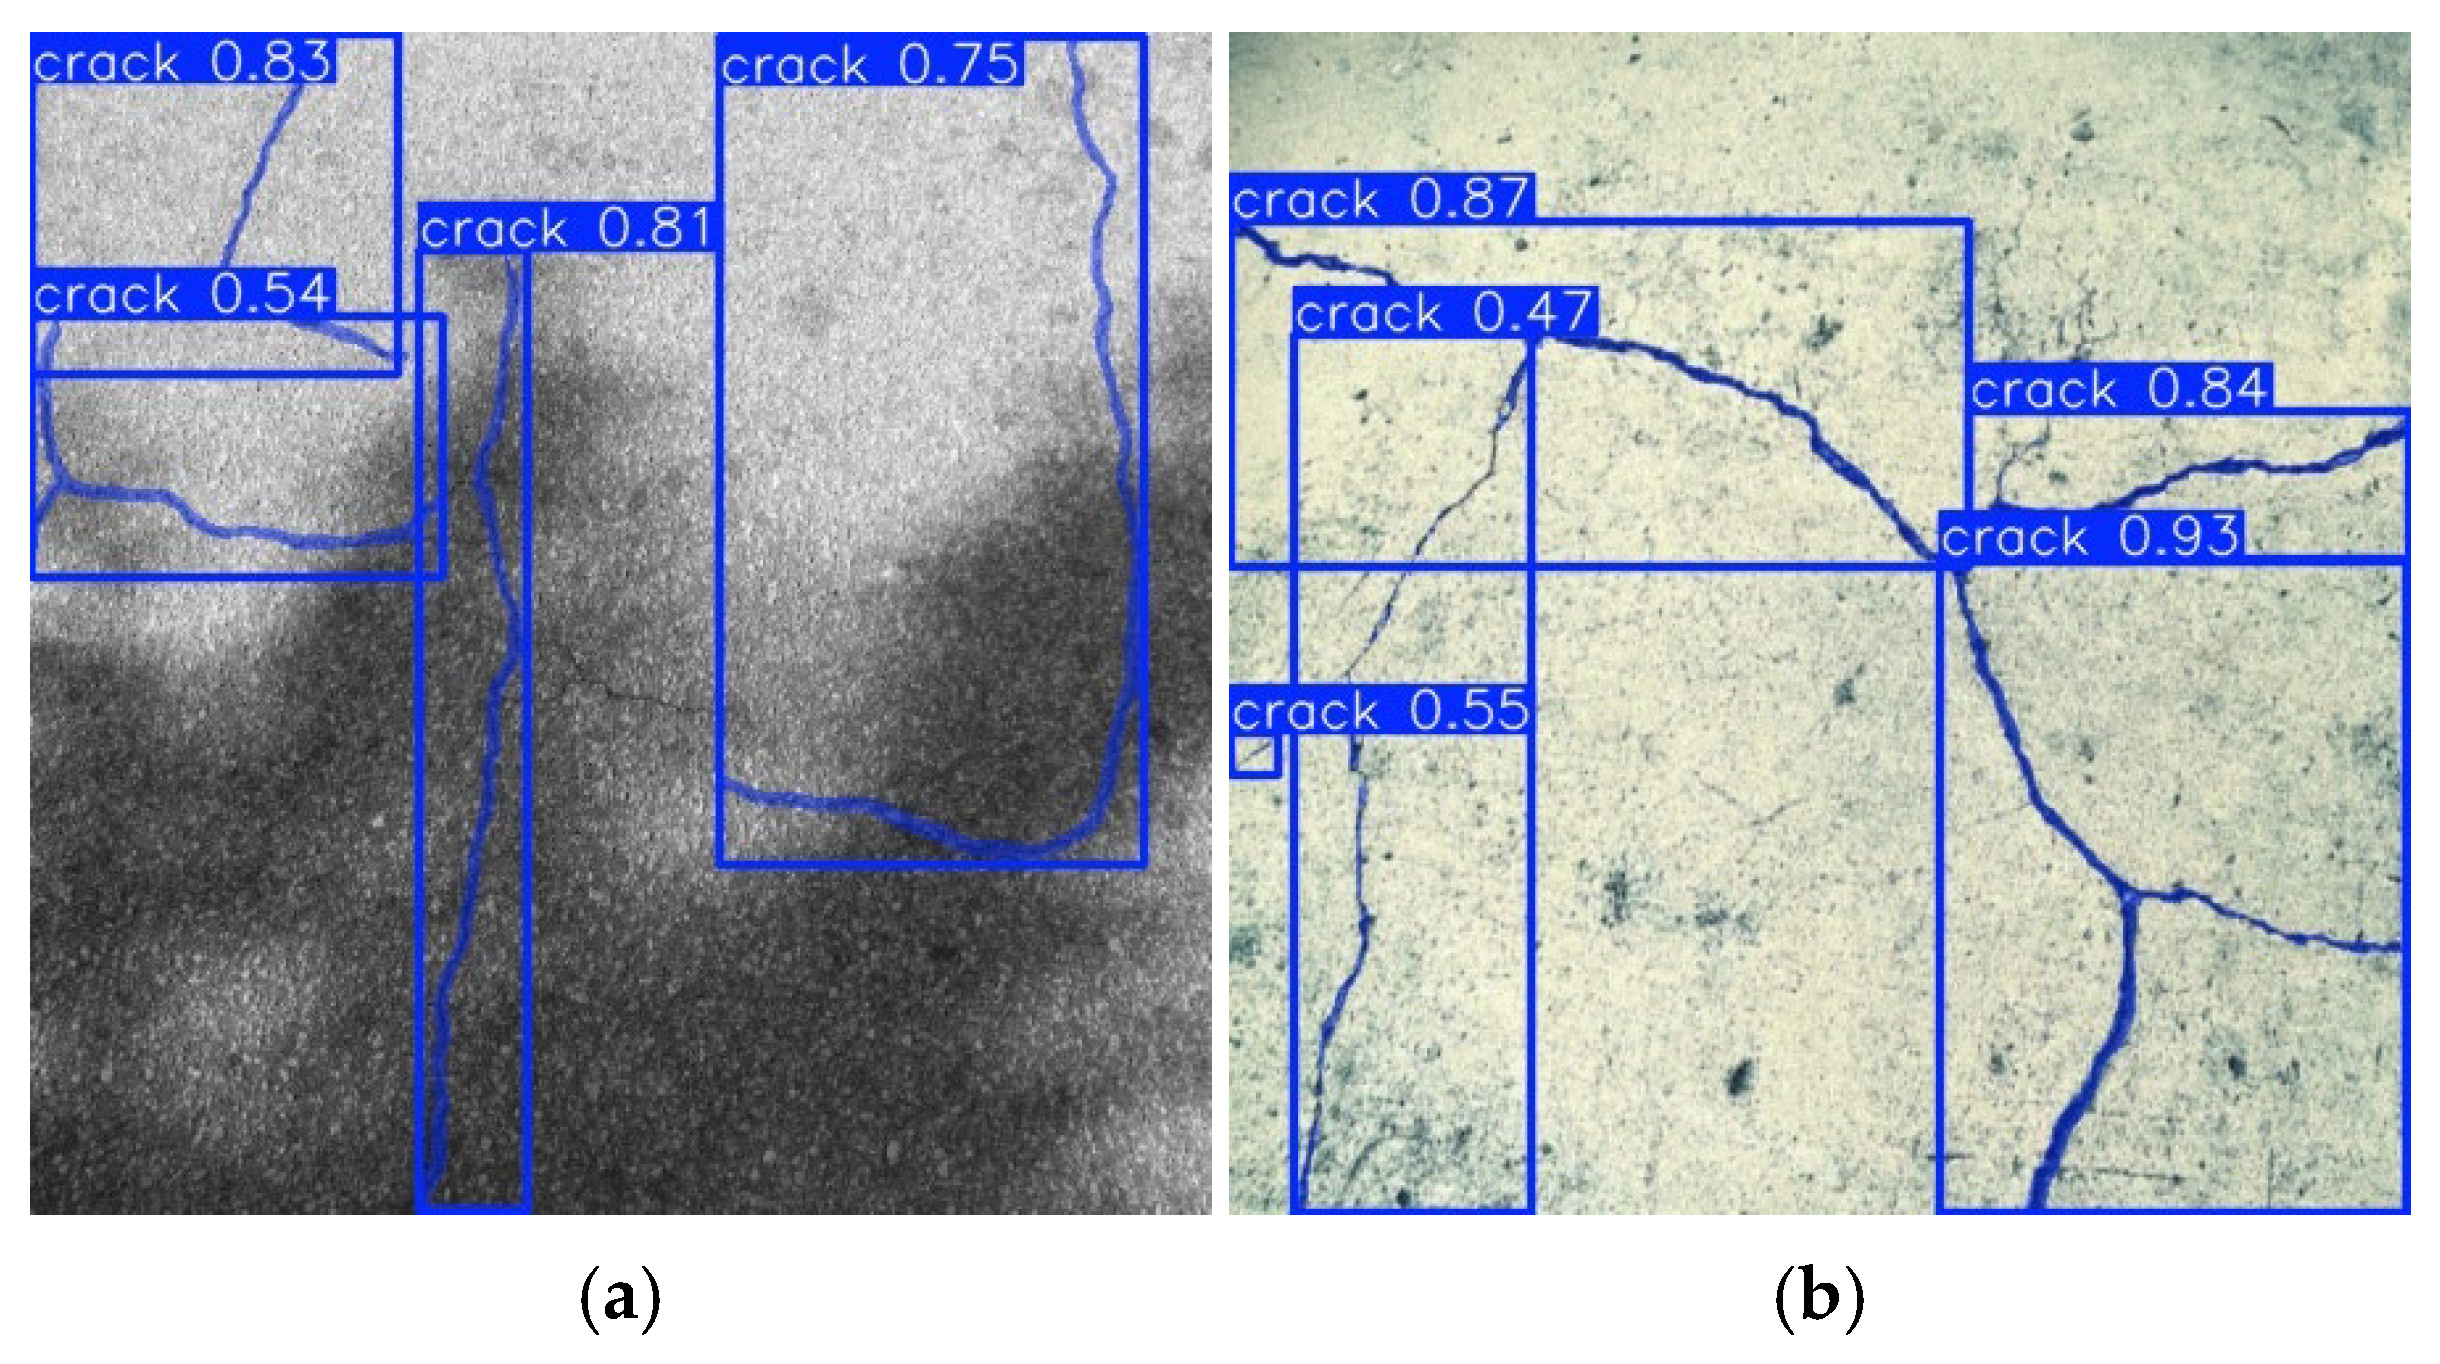
The performance of the proposed defect segmentation model is summarized in Table 6. At an IoU threshold of 0.5, the model achieved 0.823 mAP for bounding box detection and 0.775 mAP for instance mask segmentation across all defect types. At the strict IoU threshold of 0.75, the model achieved 0.708 mAP and 0.398 mAP for bounding box detection and mask segmentation, respectively. This notable difference reflects the challenge of achieving high pixel-alignment accuracy, particularly for irregular and fine-structured defects such as alligator cracks (Figure 11).
Table 6.
Evaluation metrics of the defect segmentation model.
Figure 11.
Challenging cases (a,b): alligator cracks segmented as several cracks.
The F1-score, which balances precision and recall, reached 0.807 for bounding box detection and 0.756 for mask segmentation, indicating a robust trade-off between false positives and false negatives in defect identification. The mean IoU of 0.610 for mask segmentation further quantifies the overall pixel-level alignment between predictions and ground truth, suggesting satisfactory segmentation consistency.
A class-wise breakdown of results is provided in Table 7. Spalling defects were consistently detected and segmented with higher accuracy than cracks. For instance, at IoU = 0.5, spalling attained a precision of 0.837 and an F1-score of 0.803, compared to 0.713 and 0.708 for cracks. This performance gap comes from the inherent complexity of crack morphology: cracks often exhibit thin, discontinuous, and irregular shapes that are difficult to segment precisely, and their visibility is highly sensitive to image resolution and contrast. In contrast, spalling regions generally present more defined boundaries and homogeneous textures, making them more amenable to both detection and pixel-wise segmentation.
Table 7.
Class-wise distribution of the defect segmentation model.
- (2)
- Comparative study with benchmarks
For comparative benchmarking, we implemented a classical instance segmentation architecture, Mask R-CNN [21], trained and evaluated on the same dataset. Additionally, we assessed the zero-shot capability of large transformer-based models such as Grounded-SAM [50], which is a combination of the object detection model Grounding-DINO and the semantic segmentation model SAM2. This is to compare the performance of traditional lightweight architectures against large vision models.
The proposed model and benchmark models were evaluated on three hardware configurations: a high-performance workstation, a laptop with GPU acceleration, and a laptop running on CPU only. This setup reflects a realistic inspection scenario, where model inference is performed on a ground station laptop, since the wall-climbing robot’s onboard microcontroller (STM32) is dedicated solely to motion control.
As summarized in Table 8, the proposed model outperformed Mask R-CNN in both precision and speed, achieving higher mAP for both bounding box (0.823) and mask segmentation (0.775). While Grounded-SAM attained a slightly higher mask precision (0.794), it incurred significantly greater computational latency and was not applicable for laptop deployment under real-time constraints. Consequently, the proposed model offers an optimal balance between accuracy and efficiency, making it well-suited for real-time, resource-limited applications such as on-site robotic inspection.
Table 8.
Comparison with benchmarks.
- (3)
- Ablation study about synthetic data
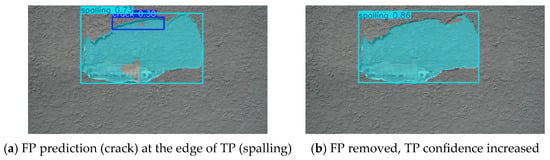
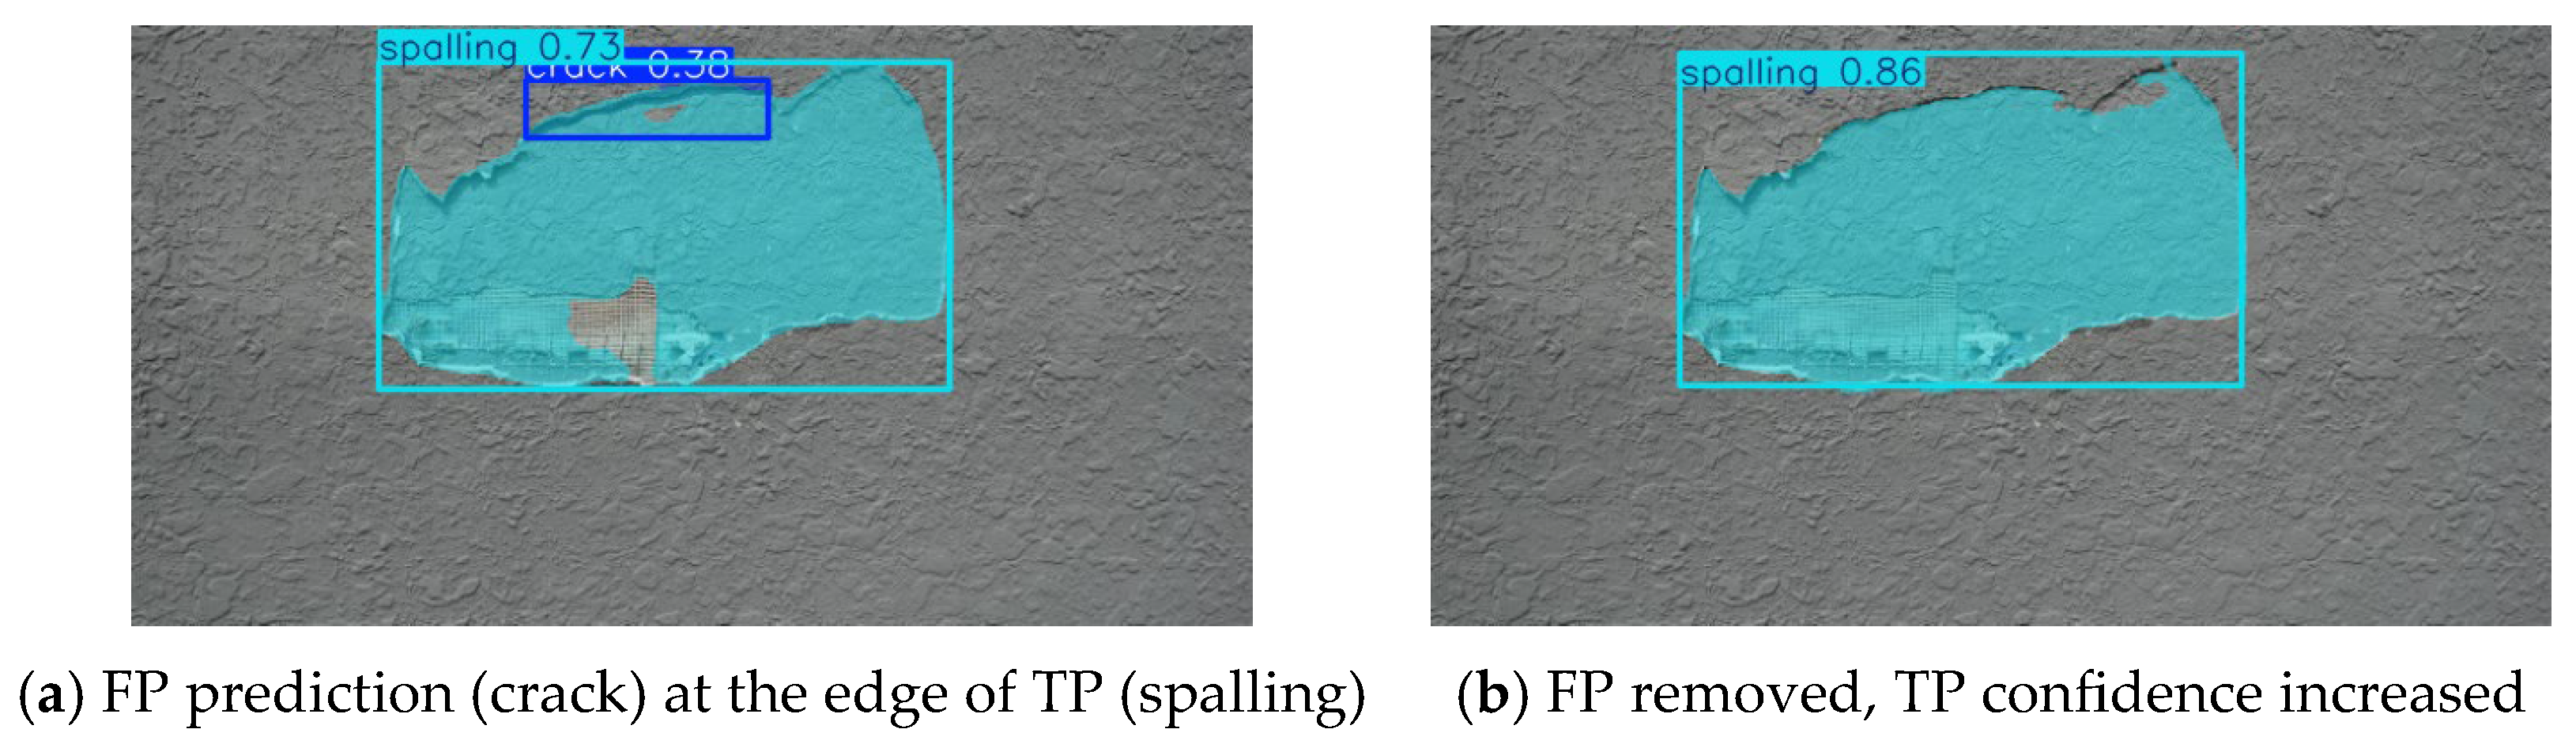
To evaluate the impact of synthetic data on model performance, an ablation study was conducted to compare training outcomes with and without generative AI-augmented images. The study trained two model variants: one using only the original and traditionally augmented dataset, and another enhanced with synthetic defect imagery generated by Stable Diffusion. As summarized in Table 9, the inclusion of synthetic data resulted in a significant improvement in key accuracy metrics, including precision, F1-score, and mean IoU. The enhanced model also demonstrated better generalization ability to unfamiliar test scenarios (Figure 12), indicating that synthetic data effectively mitigates class imbalance and expands feature diversity, thereby strengthening the robustness and reliability of the defect segmentation system.
Table 9.
The performance with/without synthetic data.
Figure 12.
Challenging case: spalling areas exposing insulation layers, which are not present in training set. Before (a) and after (b) training with synthetic data.
4.2.2. Size Quantification and Localization
The performance of defect size quantification was evaluated through controlled laboratory experiments. This evaluation aimed to validate the accuracy and reliability of converting pixel-based segmentation results into precise, real-world dimensional measurements. A set of wall specimens with known, pre-measured crack and spalling defects was imaged under controlled lighting conditions. These images were processed through the complete inspection pipeline: first, the trained segmentation model isolated each defect, and then the quantification algorithms (e.g., skeletonization for cracks, PCA for spalling) calculated their key parameters.
To establish a clear and consistent benchmark, the evaluation focused on the center position and the maximum horizontal and vertical spans of each defect. These values are directly derivable from bounding box parameters and can be rigorously verified in site. The algorithm results were compared against ground truth measurements in terms of mean absolute error (MAE) and mean absolute percentage error (MPAE) (Equations (9) and (10)), which reflects the average difference between predicted and actual evaluation targets (length, width, or center) in metric units.
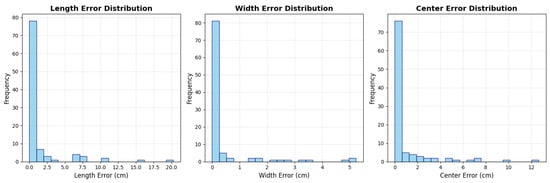
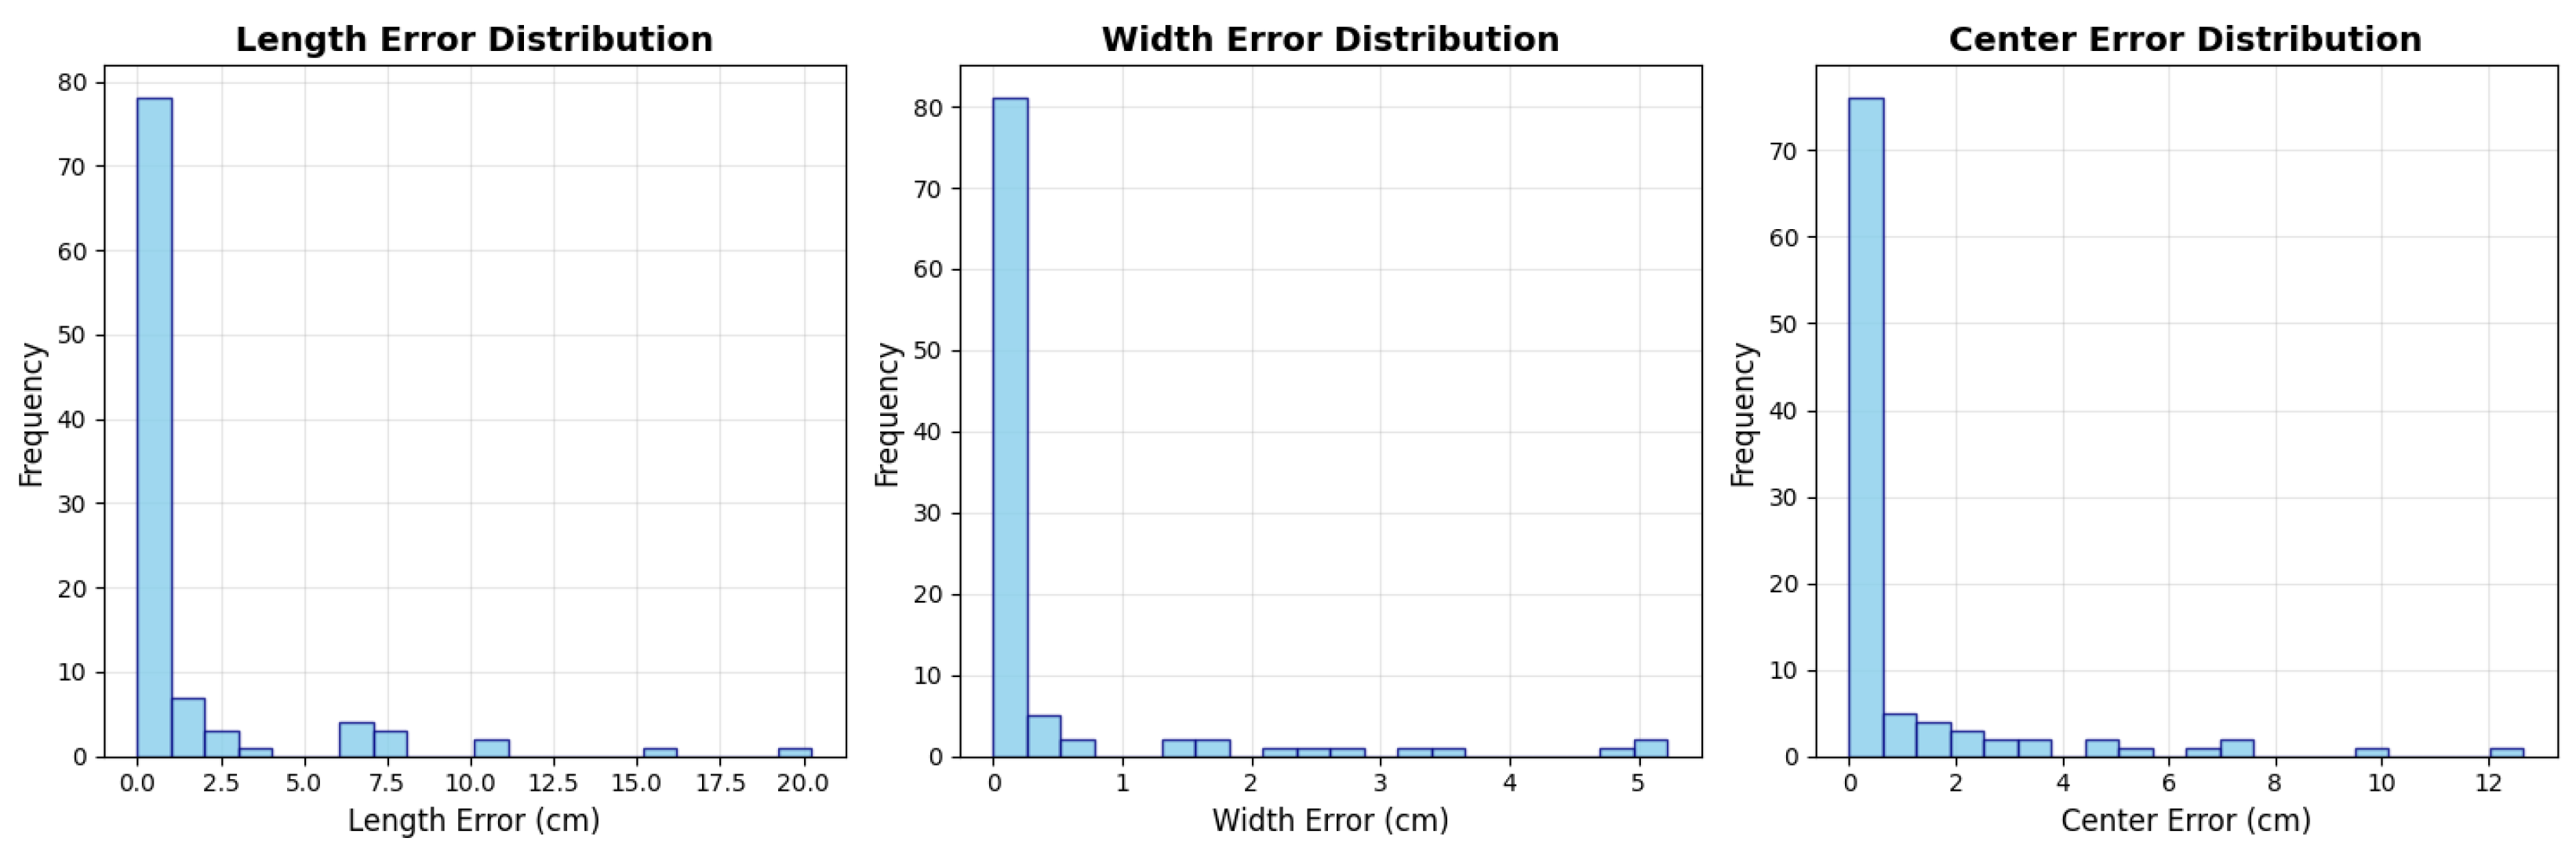
During laboratory testing, a total of 119 defect instances were successfully detected and segmented. These results are summarized in Table 10. The proposed quantification method achieved MAEs of 1.140 cm, 0.417 cm, and 0.826 cm in length, width, and center, respectively. The corresponding MPAEs were 5.56%, 13.86%, and 4.92%, indicating that dimensional measurement errors generally fell around 10%. The standard deviation values reflect moderate variability in measurement consistency, which is influenced by factors such as defect irregularity and image resolution.
Table 10.
Accuracy of defect size quantification.
The error distribution (illustrated in Figure 13) shows that the majority of dimensional estimates are concentrated near zero error, with sparse instances exhibiting large deviations. This pattern suggests that while most defects are measured with high precision, certain challenging cases (e.g., highly irregular crack branching, faint spalling boundaries) contribute to broader error dispersion. These results demonstrate the module’s effectiveness in translating pixel-based visual data into metrically accurate, structurally meaningful measurements suitable for engineering assessment.
Figure 13.
Error distribution histograms.
4.2.3. Project Management Platform
The project management platform was validated in a building inspection project. The platform was initialized with all relevant project metadata based on user configuration inputs, including time, location, deployed equipment, and participating personnel. As the wall-climbing robot started an inspection task, multi-sensor data were transmitted in real time to the ground station via a wireless local area network (WLAN). The image data stream was processed through the defect segmentation and quantification pipeline. The results were then fused with the robot’s positioning data using synchronized timestamps, enabling accurate registration of each defect within a global coordinate system. The processed data is then mapped onto a high-fidelity digital twin model, creating a comprehensive and interactive representation of the building’s facade condition.
The real-time performance of the proposed platform on the ground station laptop is summarized in Table 11. The complete inspection workflow, from startup to feedback, demonstrates smooth and efficient on-site operations. After an initial model loading (max. 4.5 s), the system executes its core operational loop, involving motion commanding (0.1 s), image collection and transmission (2.0 s), position synchronization (0.5 s), and image analysis (0.2 s). Subsequently, data preview adds 1.0–2.0 s, depending on the user input. Under typical conditions, the system takes an average response time of approximately 2.8–4.8 s for a full cycle. The precise temporal alignment between image frames and localization data guarantees reliable traceability back to the moment of collection. These features confirm the platform’s capability to support real-time robotic inspection and decision-making in field environments.
Table 11.
Time performance of the platform (on the ground station laptop).
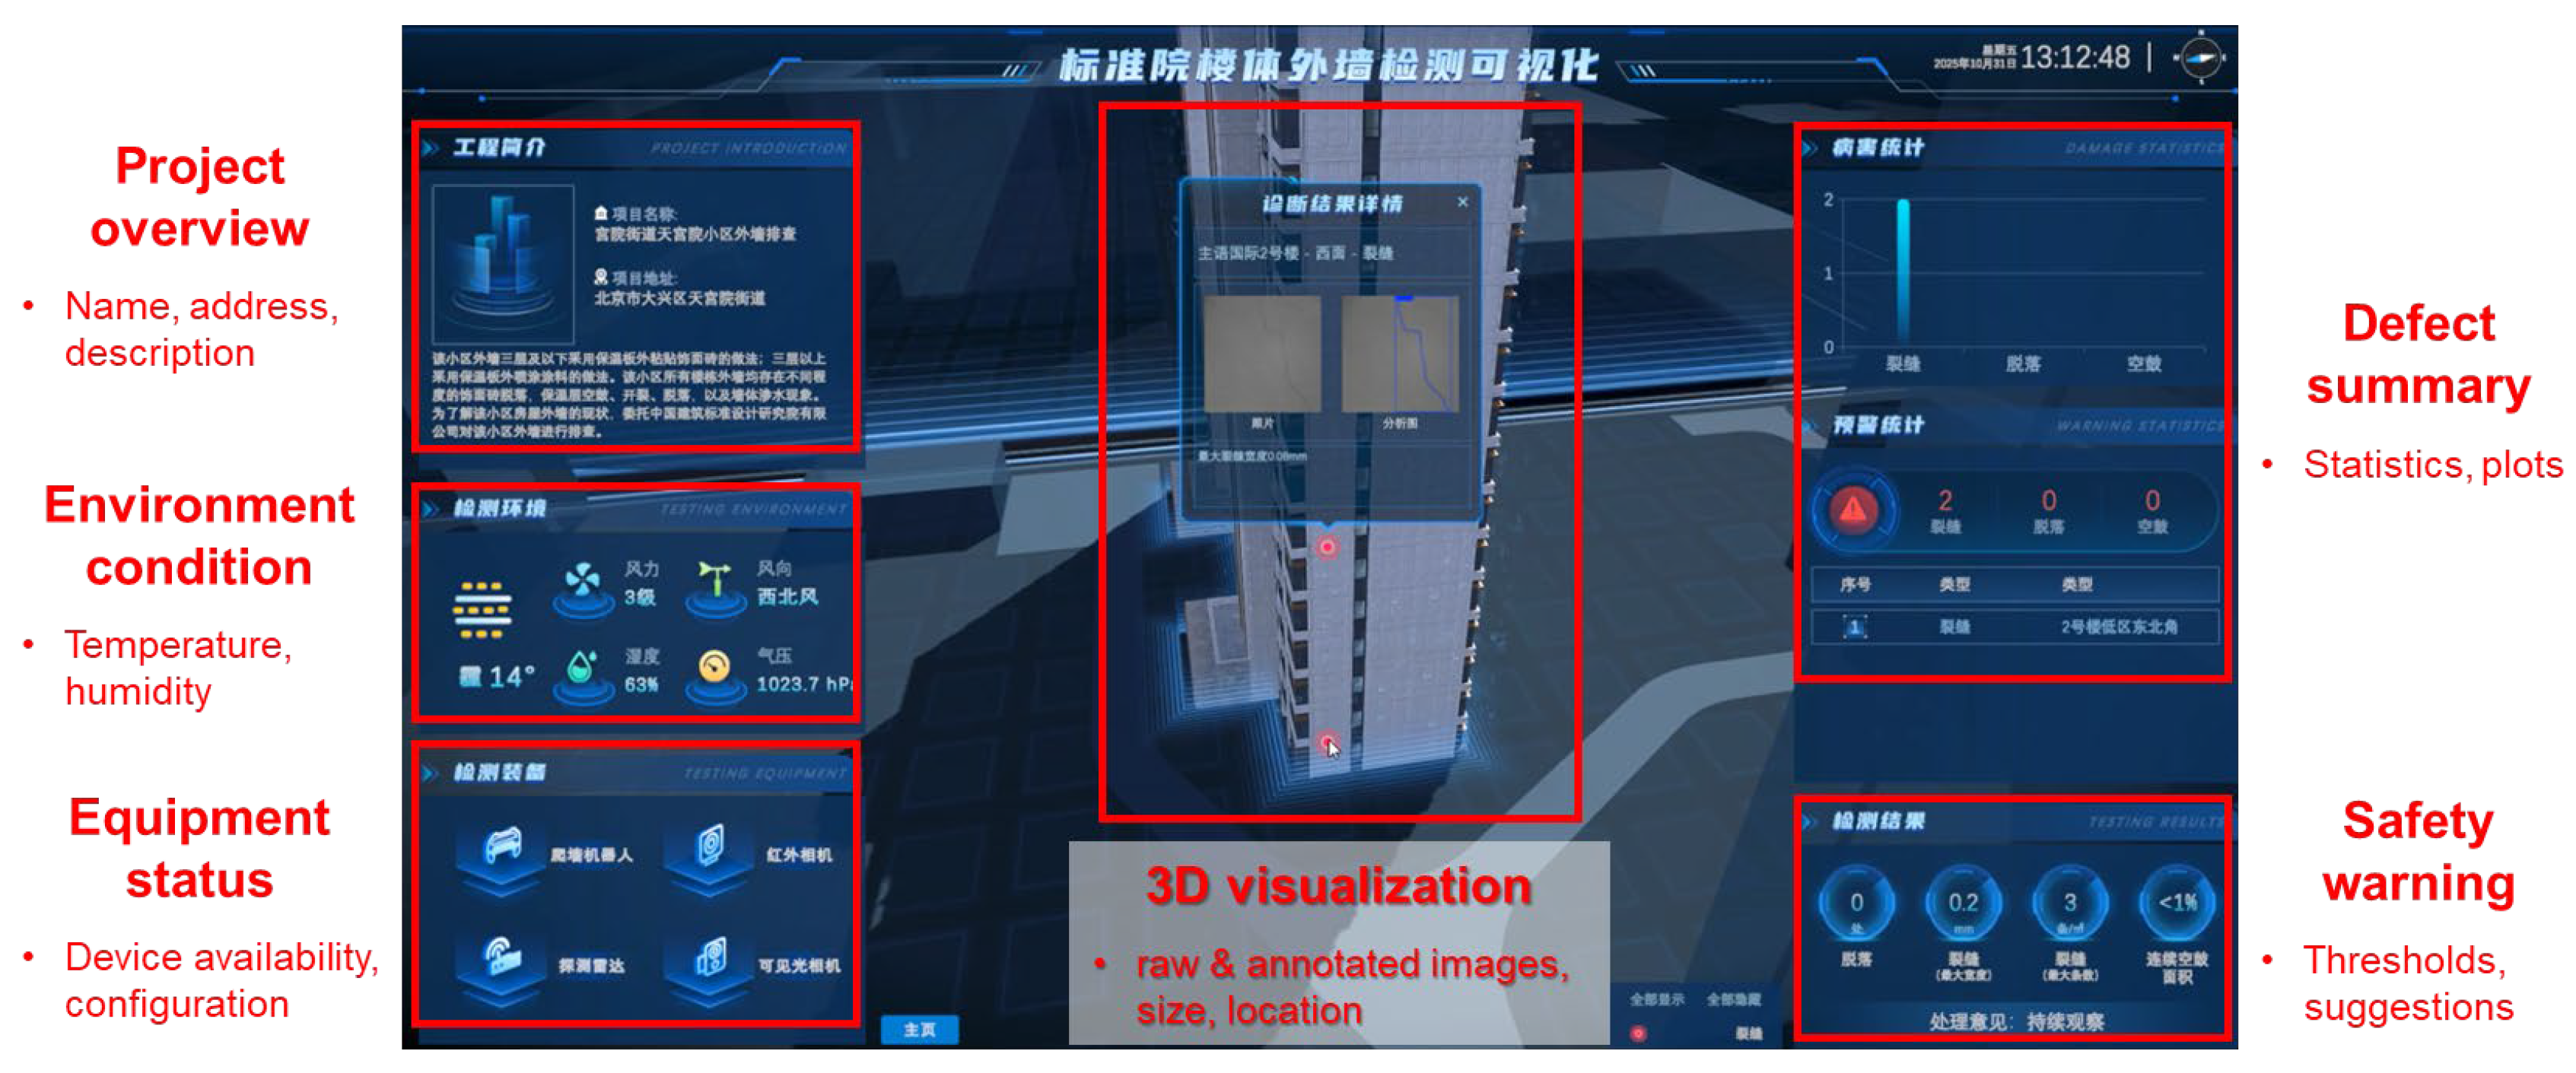
The digital twin interface is presented in Figure 14. The left-hand side provides operational context through three dashboards: (1) the Project Overview which details identifiers such as project name, site location, and description; (2) the Environment Condition which shows real-time parameters (e.g., temperature, humidity) recorded during inspection; (3) the Equipment Status which shows live counts and operational states of all deployed sensors, linked to the Equipment module of the platform.
Figure 14.
Digital twin of a target building for 3D visualization.
The right-hand side presents the inspection outcomes and analytical insights. It includes: (1) the Defect Summary with interactive charts for multi-dimensional visualization of defect types, quantities, and spatial distributions; (2) the Safety Warning that highlights locations on the 3D model where defect metrics (e.g., crack width, spalling area) exceed predefined safety thresholds, accompanied by maintenance recommendations for proactive risk management. Further, an inspection summary can be automatically generated based on large language models (DeepSeek-R1 [51]) and a knowledge base of industry standards in building inspection.
The proposed digital twin platform advances conventional inspection data management in three aspects. (1) First, it significantly improves inspection efficiency: while traditional building assessments could take several days with daily updated visualizations [52], the current climbing robot covers facades of a building within a few hours and supports real-time data analysis with near-instant online visualization for remote users, effectively shortening the project timeline. (2) Second, it enhances defect traceability quantitatively, moving from vague positional descriptions or grid-based references (e.g., cracks at B2 region) to precise coordinate-based localization, enabling consistent tracking and comparison across multiple inspections for true digital twin facility management. (3) Third, the platform transforms maintenance decision-making by replacing qualitative judgments with quantifiable, standards-based metrics, allowing for objective, threshold-driven prioritization of repair and renovation actions.
5. Conclusions
This paper presented an end-to-end framework for automated facade inspection, including a wall-climbing robot, deep-learning defect analysis, and a digital twin platform. The wall-climbing robot, utilizing negative pressure adhesion, demonstrated reliable navigation on vertical surfaces while carrying a suite of sensors, including an RGB camera and penetrating sensors. A customized lightweight model was trained for real-time, instance segmentation of cracking and spalling defects at a precision of 0.775 mAP, followed by metric quantification with an average length error at 1.140 cm and center position error at 0.826 cm. The RTK-based positioning module enabled precise robot localization, facilitating accurate mapping within a building coordinate system. Furthermore, a cloud-based digital twin platform was developed to visualize inspection results, manage facility data, and support proactive maintenance through quantitative defect assessment and spatial localization. The proposed framework has been validated through multiple building inspection projects. It significantly improves upon traditional workflows by enhancing operational safety, inspection efficiency, data traceability, and decision-making support.
Though promising results have been demonstrated, this study still has some limitations. First, the robot’s adhesion mechanism may not be applicable to highly rough surfaces, limiting its applicability. Second, the current study focused on surface-level defects, without a detailed investigation of subsurface conditions such as delamination or internal voids.
Therefore, future works will focus on two directions: (1) enhancing the robot’s hardware for improved adaptability to complex wall geometries and surface textures; (2) analyzing data from UWB radar and infrared sensors to enable non-destructive subsurface characterization. These multi-modal data streams will also be used for cross-validation to improve the robustness and accuracy of defect assessment across both visible and hidden structural flaws.
Author Contributions
Conceptualization, C.S.; Methodology, C.S.; Software, C.L. and Y.S.; Validation, C.S.; Writing—original draft, C.S. and C.L.; Writing—review and editing, C.S., C.L., Y.S. and J.L.; Supervision, A.H. and J.L.; Funding acquisition, A.H. and Z.M. All authors have read and agreed to the published version of the manuscript.
Funding
This research was funded by National Key Research and Development Program of China, grant number 2024YFF0619303.
Data Availability Statement
The original contributions presented in the study are included in the article, further inquiries can be directed to the corresponding authors.
Acknowledgments
During the preparation of this manuscript, the authors used DeepSeek-V3 for the purposes of grammar checking. The authors have reviewed and edited the output and take full responsibility for the content of this publication.
Conflicts of Interest
Changhao Song, Chang Lu, Yilong Shi, and Aili He are employees of China Institute of Building Standard Design and Research Co., Ltd. The remaining authors declare that the research was conducted in the absence of any commercial or financial relationships that could be construed as a potential conflict of interest.
References
- Ibrahim, A.; Golparvar-Fard, M.; El-Rayes, K. Multiobjective Optimization of Reality Capture Plans for Computer Vision–Driven Construction Monitoring with Camera-Equipped UAVs. J. Comput. Civ. Eng. 2022, 36, 04022018. [Google Scholar] [CrossRef] [Scilit]
- Sun, J.; Peng, B.; Wang, C.C.; Chen, K.; Zhong, B.; Wu, J. Building Displacement Measurement and Analysis Based on UAV Images. Autom. Constr. 2022, 140, 104367. [Google Scholar] [CrossRef] [Scilit]
- Song, C.; Chen, Z.; Wang, K.; Luo, H.; Cheng, J.C.P. BIM-Supported Scan and Flight Planning for Fully Autonomous LiDAR-Carrying UAVs. Autom. Constr. 2022, 142, 104533. [Google Scholar] [CrossRef] [Scilit]
- Kim, P.; Park, J.; Cho, Y.K.; Kang, J. UAV-Assisted Autonomous Mobile Robot Navigation for as-Is 3D Data Collection and Registration in Cluttered Environments. Autom. Constr. 2019, 106, 102918. [Google Scholar] [CrossRef] [Scilit]
- Kim, P.; Chen, J.; Cho, Y.K. SLAM-Driven Robotic Mapping and Registration of 3D Point Clouds. Autom. Constr. 2018, 89, 38–48. [Google Scholar] [CrossRef] [Scilit]
- Gehring, C.; Fankhauser, P.; Isler, L.; Diethelm, R.; Bachmann, S.; Potz, M.; Gerstenberg, L.; Hutter, M. ANYmal in the Field: Solving Industrial Inspection of an Offshore HVDC Platform with a Quadrupedal Robot. In Field and Service Robotics; Springer Proceedings in Advanced Robotics; Springer: Berlin/Heidelberg, Germany, 2021; Volume 16, pp. 247–260. [Google Scholar] [CrossRef] [Scilit]
- Chen, Z.; Song, C.; Wang, B.; Tao, X.; Zhang, X.; Lin, F.; Cheng, J.C.P. Automated Reality Capture for Indoor Inspection Using BIM and a Multi-Sensor Quadruped Robot. Autom. Constr. 2025, 170, 105930. [Google Scholar] [CrossRef] [Scilit]
- Chen, Z.; Lai, Z.; Song, C.; Zhang, X.; Cheng, J.C.P. Smart Camera Placement for Building Surveillance Using OpenBIM and an Efficient Bi-Level Optimization Approach. J. Build. Eng. 2023, 77, 107257. [Google Scholar] [CrossRef] [Scilit]
- Cheng, J.C.P.; Song, C.; Zhang, X.; Chen, Z. Pose Graph Relocalization with Deep Object Detection and BIM-Supported Object Landmark Dictionary. J. Comput. Civ. Eng. 2023, 37, 04023020. [Google Scholar] [CrossRef] [Scilit]
- Hu, D.; Gan, V.J.L.; Yin, C. Robot-Assisted Mobile Scanning for Automated 3D Reconstruction and Point Cloud Semantic Segmentation of Building Interiors. Autom. Constr. 2023, 152, 104949. [Google Scholar] [CrossRef] [Scilit]
- Wang, B.; Wang, Q.; Cheng, J.C.P.; Song, C.; Yin, C. Vision-Assisted BIM Reconstruction from 3D LiDAR Point Clouds for MEP Scenes. Autom. Constr. 2022, 133, 103997. [Google Scholar] [CrossRef] [Scilit]
- Chen, X.; Huang, H.; Liu, Y.; Li, J.; Liu, M. Robot for Automatic Waste Sorting on Construction Sites. Autom. Constr. 2022, 141, 104387. [Google Scholar] [CrossRef] [Scilit]
- Krizhevsky, A.; Sutskever, I.; Hinton, G.E. ImageNet Classification with Deep Convolutional Neural Networks. Commun. ACM 2017, 60, 84–90. [Google Scholar] [CrossRef] [Scilit]
- Bolourian, N.; Hammad, A. LiDAR-Equipped UAV Path Planning Considering Potential Locations of Defects for Bridge Inspection. Autom. Constr. 2020, 117, 103250. [Google Scholar] [CrossRef] [Scilit]
- Tan, Y.; Li, S.; Liu, H.; Chen, P.; Zhou, Z. Automatic Inspection Data Collection of Building Surface Based on BIM and UAV. Autom. Constr. 2021, 131, 103881. [Google Scholar] [CrossRef] [Scilit]
- Tan, Y.; Li, G.; Cai, R.; Ma, J.; Wang, M. Mapping and Modelling Defect Data from UAV Captured Images to BIM for Building External Wall Inspection. Autom. Constr. 2022, 139, 104284. [Google Scholar] [CrossRef] [Scilit]
- Zhu, J.; Zhu, Y.; Zhang, P. Review of Advancements in Wall Climbing Robot Techniques. Frankl. Open 2024, 8, 100148. [Google Scholar] [CrossRef] [Scilit]
- Ma, Y.; Li, F.; Gao, X.; Bo, W. Design of a Negative Pressure Absorption Wall-Climbing Robot with the MuCOS-II System. In Proceedings of the 6th International Symposium on Computational Intelligence and Design, ISCID, Hangzhou, China, 28–29 October 2013; Volume 2, pp. 281–284. [Google Scholar] [CrossRef] [Scilit]
- Yang, L.; Li, B.; Feng, J.; Yang, G.; Chang, Y.; Jiang, B.; Xiao, J. Automated Wall-Climbing Robot for Concrete Construction Inspection. J. Field Robot. 2023, 40, 110–129. [Google Scholar] [CrossRef] [Scilit]
- Hu, D.; Qu, Y.; Chen, P.; Guo, J.; Shan, L. Improved Complete Coverage Path Planning Algorithm for Wall Climbing Robot. In Proceedings of the 2025 4th Conference on Fully Actuated System Theory and Applications (FASTA), Nanjing, China, 4–6 July 2025; pp. 2367–2372. [Google Scholar] [CrossRef] [Scilit]
- He, K.; Gkioxari, G.; Dollar, P.; Girshick, R. Mask R-CNN. IEEE Trans. Pattern Anal. Mach. Intell. 2020, 42, 386–397. [Google Scholar] [CrossRef] [Scilit]
- Ren, S.; He, K.; Girshick, R.; Sun, J. Faster R-CNN: Towards Real-Time Object Detection with Region Proposal Networks. In Proceedings of the Advances in Neural Information Processing Systems 28 (NIPS 2015), Montreal, QC, Canada, 7–12 December 2015; Curran Associates: New York, NY, USA, 2015. [Google Scholar]
- Redmon, J.; Divvala, S.; Girshick, R.; Farhadi, A. You Only Look Once: Unified, Real-Time Object Detection. In Proceedings of the IEEE Computer Society Conference on Computer Vision and Pattern Recognition (CVPR), Las Vegas, NV, USA, 27–30 June 2016; IEEE: New York, NY, USA, 2016; pp. 779–788. [Google Scholar]
- Benz, C.; Rodehorst, V. Omni-Crack30k: A Benchmark for Crack Segmentation and the Reasonable Effectiveness of Transfer Learning. In Proceedings of the IEEE Computer Society Conference on Computer Vision and Pattern Recognition Workshops, Seattle, WA, USA, 16–22 June 2024; pp. 3876–3886. [Google Scholar] [CrossRef] [Scilit]
- Yang, F.; Zhang, L.; Yu, S.; Prokhorov, D.; Mei, X.; Ling, H. Feature Pyramid and Hierarchical Boosting Network for Pavement Crack Detection. IEEE Trans. Intell. Transp. Syst. 2020, 21, 1525–1535. [Google Scholar] [CrossRef] [Scilit]
- Vaswani, A.; Brain, G.; Shazeer, N.; Parmar, N.; Uszkoreit, J.; Jones, L.; Gomez, A.N.; Kaiser, Ł.; Polosukhin, I. Attention Is All You Need. arXiv 2017, arXiv:1706.03762. [Google Scholar]
- Dosovitskiy, A.; Beyer, L.; Kolesnikov, A.; Weissenborn, D.; Zhai, X.; Unterthiner, T.; Dehghani, M.; Minderer, M.; Heigold, G.; Gelly, S.; et al. An Image Is Worth 16x16 Words: Transformers for Image Recognition at Scale. In Proceedings of the ICLR 2021—9th International Conference on Learning Representations, Vienna, Austria, 3–7 May 2021. [Google Scholar]
- Zhao, Y.; Lv, W.; Xu, S.; Wei, J.; Wang, G.; Dang, Q.; Liu, Y.; Chen, J. DETRs Beat YOLOs on Real-Time Object Detection. In Proceedings of the IEEE Computer Society Conference on Computer Vision and Pattern Recognition, Seattle, WA, USA, 16–22 June 2024; pp. 16965–16974. [Google Scholar] [CrossRef] [Scilit]
- Liu, S.; Zeng, Z.; Ren, T.; Li, F.; Zhang, H.; Yang, J.; Jiang, Q.; Li, C.; Yang, J.; Su, H.; et al. Grounding DINO: Marrying DINO with Grounded Pre-Training for Open-Set Object Detection. In Proceedings of the Computer Vision—ECCV 2024, Milan, Italy, 29 September–4 October 2024; Leonardis, A., Ricci, E., Roth, S., Russakovsky, O., Sattler, T., Varol, G., Eds.; Springer Nature: Cham, Switzerland, 2025; pp. 38–55. [Google Scholar]
- Chu, H.; Gai, J.; Chen, W.; Ma, J. CBRFormer: Rendering Technology-Based Transformer for Refinement Segmentation of Bridge Crack Images. Adv. Eng. Inform. 2026, 69, 103868. [Google Scholar] [CrossRef] [Scilit]
- Zim, A.H.; Iqbal, A.; Al-Huda, Z.; Malik, A.; Kuribayash, M. EfficientCrackNet: A Lightweight Model for Crack Segmentation. In Proceedings of the 2025 IEEE/CVF Winter Conference on Applications of Computer Vision (WACV), Tucson, AZ, USA, 26 February–6 March 2025. [Google Scholar]
- Deng, Y.; Cheng, J.C.P.; Anumba, C. Mapping between BIM and 3D GIS in Different Levels of Detail Using Schema Mediation and Instance Comparison. Autom. Constr. 2016, 67, 1–21. [Google Scholar] [CrossRef] [Scilit]
- Chen, Z.; Chen, K.; Song, C.; Zhang, X.; Cheng, J.C.P.; Li, D. Global Path Planning Based on BIM and Physics Engine for UGVs in Indoor Environments. Autom. Constr. 2022, 139, 104263. [Google Scholar] [CrossRef] [Scilit]
- Chen, Z.; Wang, H.; Chen, K.; Song, C.; Zhang, X.; Wang, B.; Cheng, J.C.P. Improved Coverage Path Planning for Indoor Robots Based on BIM and Robotic Configurations. Autom. Constr. 2024, 158, 105160. [Google Scholar] [CrossRef] [Scilit]
- Wang, K.; Cheng, J.C.P. Integrating Hardware-In-the-Loop Simulation and BIM for Planning UAV-Based as-Built MEP Inspection with Deep Learning Techniques. In Proceedings of the 36th International Symposium on Automation and Robotics in Construction, ISARC, Banff, AB, Canada, 21–24 May 2019; pp. 310–316. [Google Scholar]
- Song, C.; Wang, K.; Cheng, J.C.P. BIM-Aided Scanning Path Planning for Autonomous Surveillance UAVs with LiDAR. In Proceedings of the 37th International Symposium on Automation and Robotics in Construction, ISARC, Kitakyushu, Japan, 27–28 October 2020; IAARC: Edinburgh, UK, 2020; pp. 1195–1202. [Google Scholar]
- Liu, D.; Xia, X.; Chen, J.; Li, S. Integrating Building Information Model and Augmented Reality for Drone-Based Building Inspection. J. Comput. Civ. Eng. 2021, 35, 04020073. [Google Scholar] [CrossRef] [Scilit]
- Alizadehsalehi, S.; Yitmen, I. Digital Twin-Based Progress Monitoring Management Model through Reality Capture to Extended Reality Technologies (DRX). Smart Sustain. Built Environ. 2023, 12, 200–236. [Google Scholar] [CrossRef] [Scilit]
- Tan, Y.; Zheng, Y.; Yi, W.; Li, S.; Chen, P.; Cai, R.; Song, D. Intelligent Inspection of Building Exterior Walls Using UAV and Mixed Reality Based on Man-Machine-Environment System Engineering. Autom. Constr. 2025, 177, 106344. [Google Scholar] [CrossRef] [Scilit]
- Di Mucci, V.M.; Cardellicchio, A.; Ruggieri, S.; Nettis, A.; Renò, V.; Uva, G. Computer Vision-Based Seismic Assessment of RC Simply Supported Bridges Characterized by Corroded Circular Piers. Bull. Earthq. Eng. 2025, 23, 6771–6800. [Google Scholar] [CrossRef] [Scilit]
- Song, C. Crack Spalling Segmentation Dataset. Available online: https://github.com/csongae/Crack-Spalling-Segmentation.git (accessed on 20 January 2026).
- Rombach, R.; Blattmann, A.; Lorenz, D.; Esser, P.; Ommer, B. High-Resolution Image Synthesis with Latent Diffusion Models. In Proceedings of the IEEE Computer Society Conference on Computer Vision and Pattern Recognition, New Orleans, LA, USA, 18–24 June 2022; pp. 10674–10685. [Google Scholar] [CrossRef] [Scilit]
- Rumelhart, D.E.; Hinton, G.E.; Williams, R.J. Learning Representations by Back-Propagating Errors. Nature 1986, 323, 533–536. [Google Scholar] [CrossRef] [Scilit]
- OpenCV: Camera Calibration. Available online: https://docs.opencv.org/4.x/dc/dbb/tutorial_py_calibration.html (accessed on 26 November 2025).
- University Crack Dataset. Available online: https://universe.roboflow.com/university-bswxt/crack-bphdr (accessed on 14 October 2025).
- Guo, P.; Bao, Y. HRCDS: A Benchmark Dataset for High-Resolution Concrete Damage Segmentation. Available online: https://data.mendeley.com/datasets/6x4dzzrs2h/1 (accessed on 14 October 2025).
- Benz, C.; Rodehorst, V. Image-Based Detection of Structural Defects Using Hierarchical Multi-Scale Attention. Available online: https://ben-z-original.github.io/2022_Benz_DetectionStructuralDefects.pdf (accessed on 14 October 2025).
- Bai, Y.; Sezen, H.; Yilmaz, A. Detecting Cracks and Spalling Automatically in Extreme Events by end-to-end Deep Learning Frameworks. ISPRS Ann. Photogramm. Remote Sens. Spat. Inf. Sci. 2021, 2, 161–168. [Google Scholar] [CrossRef] [Scilit]
- Wada, K. Labelme—The Offline Image Annotation for Vision AI. Available online: https://labelme.io/ (accessed on 15 January 2026).
- Kirillov, A.; Mintun, E.; Ravi, N.; Mao, H.; Rolland, C.; Gustafson, L.; Xiao, T.; Whitehead, S.; Berg, A.C.; Lo, W.-Y.; et al. Segment Anything. In Proceedings of the 2023 IEEE/CVF International Conference on Computer Vision (ICCV), Vancouver, BC, Canada, 17–24 June 2023; IEEE: New York, NY, USA, 2023; pp. 3992–4003. [Google Scholar]
- Guo, D.; Yang, D.; Zhang, H.; Song, J.; Wang, P.; Zhu, Q.; Xu, R.; Zhang, R.; Ma, S.; Bi, X.; et al. DeepSeek-R1 Incentivizes Reasoning in LLMs through Reinforcement Learning. Nature 2025, 645, 633–638. [Google Scholar] [CrossRef] [Scilit] [PubMed]
- Shariq, M.H.; Hughes, B.R. Revolutionising Building Inspection Techniques to Meet Large-Scale Energy Demands: A Review of the State-of-the-Art. Renew. Sustain. Energy Rev. 2020, 130, 109979. [Google Scholar] [CrossRef] [Scilit]

Disclaimer/Publisher’s Note: The statements, opinions and data contained in all publications are solely those of the individual author(s) and contributor(s) and not of MDPI and/or the editor(s). MDPI and/or the editor(s) disclaim responsibility for any injury to people or property resulting from any ideas, methods, instructions or products referred to in the content. |
© 2026 by the authors. Licensee MDPI, Basel, Switzerland. This article is an open access article distributed under the terms and conditions of the Creative Commons Attribution (CC BY) license.