Article

Risk Identification for Digital Transformation in Construction Enterprises: A Hybrid Topic Modeling and Inductive Coding Framework


1
School of Economics and Management, Tongji University, Shanghai 200092, China
2
Laboratory of High Quality Urban Development and Strategic Decision, Tongji University, Shanghai 200092, China
3
Institute for Manufacturing, Department of Engineering, University of Cambridge, Cambridge CB3 0FS, UK
*
Author to whom correspondence should be addressed.
Buildings 2026, 16(3), 647; https://doi.org/10.3390/buildings16030647
Submission received: 11 January 2026 / Revised: 30 January 2026 / Accepted: 2 February 2026 / Published: 4 February 2026
(This article belongs to the Section Construction Management, and Computers & Digitization)

Abstract

Digital transformation in construction enterprises is frequently constrained by risks that are heterogeneous, context-dependent, and described with inconsistent terminology across studies and practice. Prior research has predominantly relied on expert judgment or narrative reviews to summarize such risks, which limits reproducibility and makes it difficult to iteratively expand the indicator set when new evidence becomes available. To address these challenges, this study develops a hybrid risk identification framework that integrates unsupervised topic modeling with structured inductive coding. Latent Dirichlet Allocation (LDA) is employed to extract latent semantic patterns from a systematically screened body of literature on construction digital transformation, consolidating dispersed risk expressions into coherent thematic units. The Gioia methodology is then applied to inductively structure these themes into a hierarchical risk indicator system, ensuring traceability from textual evidence to conceptual indicators and enhancing interpretability for construction management applications. Rather than enumerating isolated risk events, the proposed framework conceptualizes digital transformation risk in construction enterprises as a set of interacting structural conditions that shape risk exposure across project stages and organizational boundaries. By shifting risk identification from event-based listings to a structural and condition-oriented representation, this study provides a transferable foundation for subsequent causal modeling and multi-criteria risk evaluation in construction digital transformation.

1. Introduction

Digital transformation has become a central pathway for enterprises seeking to improve operational efficiency, organizational flexibility, and long-term competitiveness. In the construction sector, this transformation is widely viewed as a response to persistent challenges, including low productivity growth, fragmented project delivery, rising cost pressures, and increasing requirements related to safety and sustainability. Technologies such as Building Information Modeling [1], the Internet of Things (IoT), big data analytics, and artificial intelligence have created new opportunities to reshape construction practices and management routines. Despite these developments, empirical evidence suggests that construction remains one of the least digitally mature industries [2] and that many digital transformation initiatives fail to deliver their expected benefits.
A key characteristic of digital transformation in construction enterprises is its strong project-based nature. Unlike process-oriented industries, where digitalization is often embedded in relatively stable organizational routines, construction enterprises usually advance digital transformation through discrete projects [3]. These projects commonly involve system development, organizational adjustment, and managerial coordination at the same time. They are typically long in duration, involve multiple stakeholders, and operate under highly heterogeneous conditions [1]. As a result, digital transformation in construction enterprises is exposed to a wide range of risks that may emerge at different stages and interact across organizational boundaries. This makes systematic risk identification particularly challenging in construction settings.
Risk identification represents a critical foundation for subsequent risk analysis, assessment, and decision-making. If risks are not clearly identified and conceptually structured, more advanced analytical models cannot be reliably applied. Existing studies have contributed to the understanding of digital transformation risks in construction through expert interviews, case analyses, and qualitative literature reviews [4].
However, despite these contributions, several limitations remain insufficiently addressed in recent empirical studies. First, existing digital transformation risk studies often fail to provide a traceable and systematic indicator construction pipeline that transparently links heterogeneous textual evidence from the literature to structured and reproducible risk indicators [5]. As a result, risk identification processes are frequently opaque, highly dependent on subjective expert interpretation, and difficult to replicate or extend [6]. Second, many existing frameworks implicitly treat risk indicator systems as static [7], offering limited methodological support for updating or refining indicator structures as digital transformation practices, technologies, and organizational arrangements evolve over time [8]. This static treatment constrains the applicability of risk identification results in project-based and long-term transformation contexts. In addition, prior research frequently focuses on specific technologies or isolated project stages, rather than explicitly examining how risks emerge as interacting structural conditions across organizational, technological, and project contexts [9,10,11].
In response to these limitations, data-driven methods such as topic modeling have been introduced to support risk identification by extracting latent patterns from large volumes of textual data [12]. These methods help reduce individual bias and improve coverage of dispersed information. However, topic modeling outputs alone usually consist of keywords or themes that lack clear conceptual interpretation. Hierarchical relationships between risks are rarely explicit. By contrast, inductive qualitative approaches in management research emphasize semantic clarity and traceability, but they are often constrained by small samples and high analytical effort. As a result, an effective integration of semantic extraction and conceptual structuring remains limited in the context of construction digital transformation.
To address these challenges, this study focuses on how digital transformation risks in construction enterprises can be systematically identified and conceptually structured under conditions of semantic fragmentation and heterogeneous information sources. Rather than treating risks as isolated technical failures or managerial issues, this research conceptualizes digital transformation risk as a configuration of interacting structural conditions that shape how vulnerabilities emerge, accumulate, and propagate across project-based transformation processes. To operationalize this perspective, a hybrid framework integrating topic modeling and inductive coding is developed. In this framework, prior literature is treated as an empirical textual data source rather than as the object of descriptive review. Latent Dirichlet Allocation (LDA) is employed to extract latent risk-related semantic patterns from a systematically screened body of peer-reviewed literature, while the Gioia methodology is used to translate these patterns into a hierarchical and theoretically interpretable risk indicator system. Through this approach, dispersed and inconsistently described risk information is transformed into a coherent, condition-oriented representation, providing a transparent and replicable foundation for subsequent risk interaction analysis and evaluation in construction digital transformation.

2. Literature Review

2.1. Digital Transformation Risks in Construction

Existing studies generally agree that construction digital transformation involves not only the adoption of digital technologies, but also significant changes in organizational structures, management practices, and inter-organizational relationships [13]. Compared with manufacturing or service industries, construction enterprises operate in a project-based environment characterized by temporary organizations, fragmented supply chains, and high uncertainty [2]. These characteristics shape both the nature and the sources of digital transformation risks.
Prior research has identified a wide range of risks associated with construction digital transformation. At the technological level, risks often relate to system compatibility, data integration, cybersecurity, and the reliability of digital platforms [14,15]. Organizational risks frequently involve resistance to change [16,17], insufficient digital skills [16,18], unclear responsibilities [17], and misalignment between digital initiatives and existing management routines [18,19]. External risks have also been emphasized, including regulatory uncertainty [20,21], market volatility [21,22], and coordination challenges across the construction supply chain [20,22,23]. While these studies provide valuable insights, risk factors are typically discussed in isolation or grouped loosely, resulting in fragmented representations of the overall risk landscape.
Another limitation lies in the way risks are described and categorized. Similar risk issues are often labeled using different terms across studies, while conceptually distinct risks may be grouped under broad and ambiguous categories [9,24]. This semantic inconsistency makes it difficult to compare findings across studies or to synthesize existing knowledge into a coherent structure. As a result, construction enterprises may struggle to obtain a clear and actionable overview of digital transformation risks when relying on the existing literature.

2.2. Challenges in Risk Identification

Risk identification has long been recognized as a critical step in construction risk management. Traditional approaches commonly rely on expert judgment, interviews, workshops, and checklist-based methods to elicit potential risks. These approaches are effective in capturing context-specific knowledge and practical experience. They are also widely applied in studies focusing on construction projects [25,26], safety management [27,28], and organizational change [29,30].
However, expert-driven risk identification methods are inherently dependent on the background, experience, and cognitive preferences of participants. The resulting risk lists may vary substantially across studies or case contexts [31,32,33]. Moreover, the logic underlying risk categorization is often implicit, which limits transparency and makes it difficult to replicate or extend existing classifications [34]. In the context of digital transformation, where risks are multifaceted and evolve alongside technological and organizational changes, these limitations become more pronounced [35].
In response to the limitations of expert-driven approaches, some studies have adopted structured analytical techniques to organize and analyze identified risks, such as hierarchical decomposition [36], causal mapping [37], and network-based representations [38]. These techniques contribute to clarifying interrelationships among risks and improving analytical rigor at later stages of risk analysis. However, they generally presuppose that the initial set of risks has already been comprehensively identified. As a result, the effectiveness of these methods remains highly sensitive to the completeness and consistency of the initial risk identification stage. This reliance underscores a persistent gap in existing research: the lack of systematic approaches capable of supporting early-stage risk identification when risk boundaries are ambiguous and evolving, as is often the case in construction digital transformation.

2.3. Topic Modeling and Inductive Coding

The growing availability of digital textual data has led to increasing interest in computational approaches for organizing risk-related knowledge in management and engineering research. Among these approaches, topic modeling has been widely adopted to explore latent semantic patterns across large document collections without relying on predefined analytical categories. LDA is frequently used to identify recurring themes by estimating probabilistic relationships between words and documents [39]. Its application allows dispersed risk-related information to be consolidated and compared across studies. In research on innovation management, project governance [40], and construction-related risks [41], LDA has been used to map dominant themes and reveal patterns that are difficult to capture through manual review alone.
However, topic modeling outputs are typically expressed as sets of keywords representing latent themes. While these results capture semantic regularities, they do not directly yield conceptually structured risk constructs [42]. The relationships among themes remain implicit, and hierarchical distinctions are rarely specified. As a consequence, substantial interpretive work is required before topic modeling results can be translated into structured risk indicators suitable for management analysis [43,44].
In contrast, inductive coding approaches in qualitative management research emphasize the systematic development of concepts through iterative abstraction. The Gioia methodology provides a well-established framework for linking empirical observations to first-order concepts, second-order themes, and aggregate dimensions [45]. This process supports conceptual clarity and has been widely used in organizational and management studies to synthesize qualitative evidence. Despite these strengths, inductive coding is usually applied to relatively small datasets and relies heavily on manual interpretation. Its scalability is therefore limited when large and heterogeneous textual sources are involved [46]. Existing studies tend to apply topic modeling and inductive coding as separate analytical strategies, each addressing different aspects of the risk identification task. The limited integration of semantic extraction and inductive structuring methods leaves an unresolved gap in the systematic identification and organization of digital transformation risks in construction enterprises.
A systematic review of the literature on digital transformation and risk management reveals that, although substantial progress has been made in advancing theoretical and methodological understandings of digital transformation risks in the construction industry, a number of critical limitations remain. Existing studies have yet to establish an analytical pathway capable of achieving systematic risk identification from a full lifecycle perspective, nor have they developed approaches that simultaneously ensure semantic consistency, structural interpretability, and dynamic adaptability. This gap suggests that research on digital transformation risks in construction enterprises urgently requires more integrated and system-oriented methodological frameworks at both the level of method selection and model construction. Such frameworks are essential to address the practical realities of digital transformation, in which risks become continuously salient, undergo structural reconfiguration, and evolve in response to changing governance demands.

3. Research Design and Framework

Building on the gaps identified in existing studies, this research develops a methodological framework for the structured identification of digital transformation risks in construction enterprises. The framework integrates topic modeling and inductive coding to organize dispersed risk-related evidence from the literature into a coherent analytical structure. By combining semantic pattern extraction with inductive concept development, the framework supports the construction of a hierarchical risk indicator system that provides a systematic foundation for subsequent analysis and decision support.

3.1. Research Framework

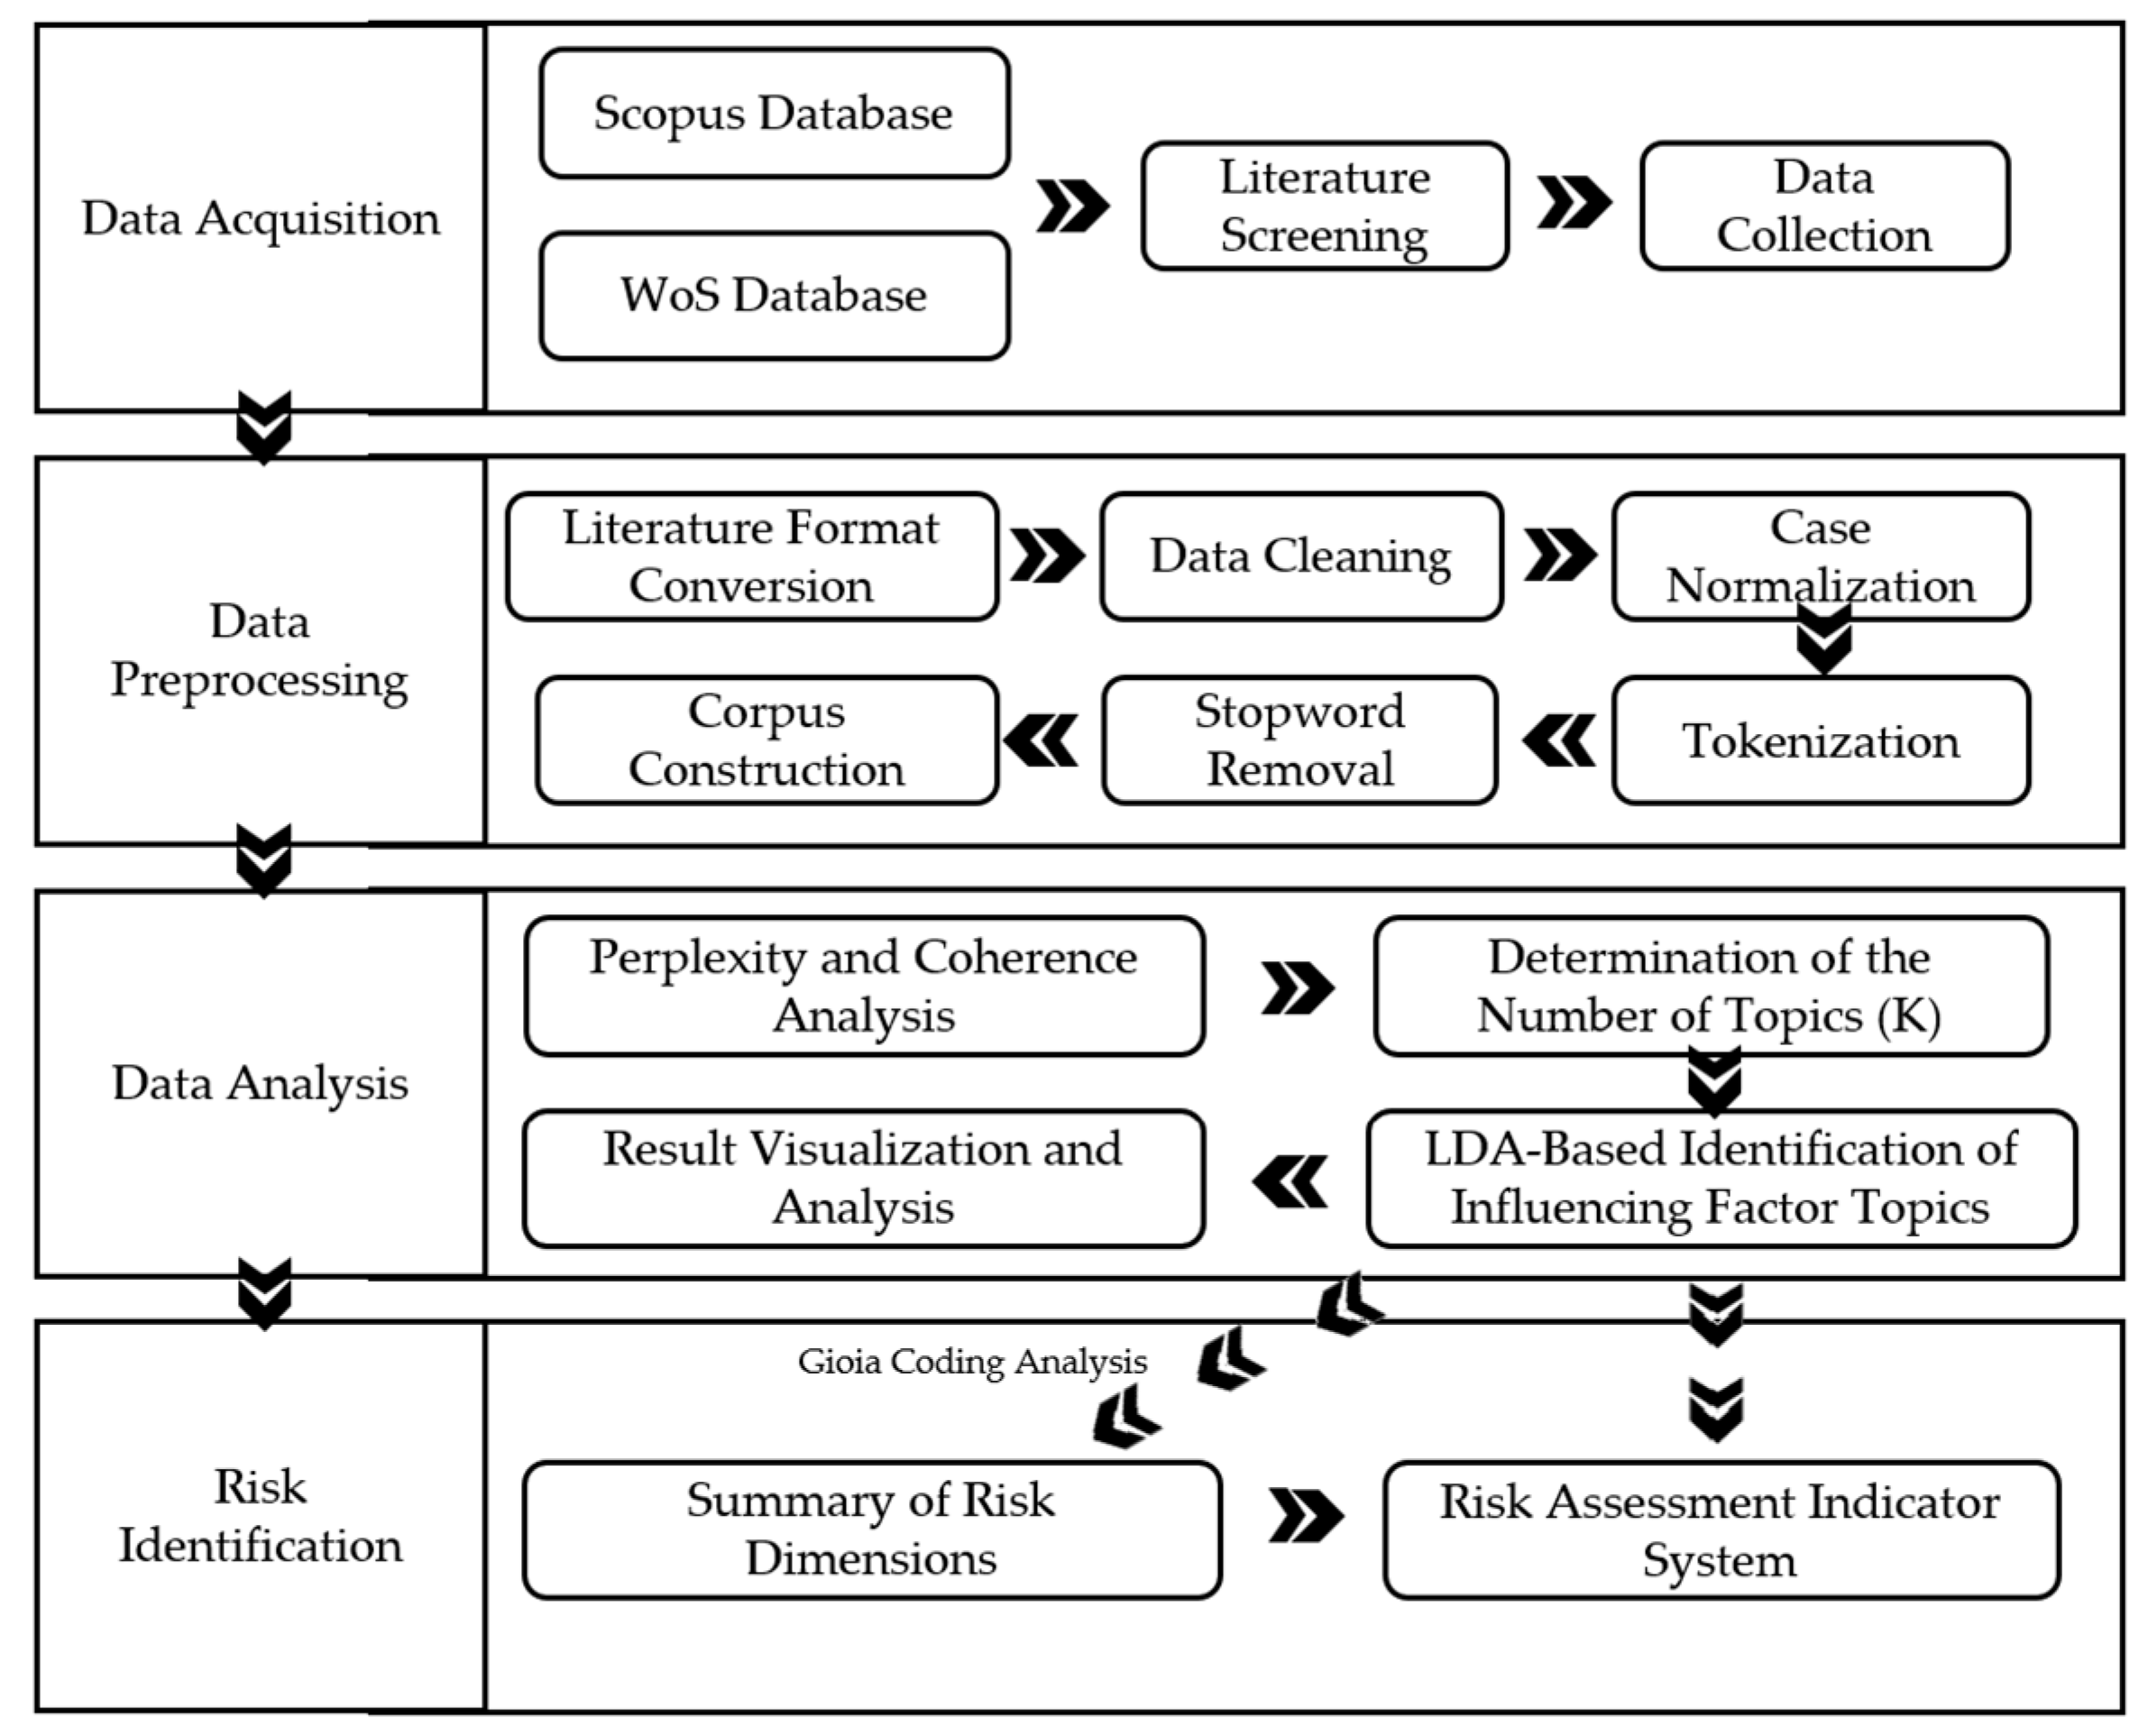
The overall research framework is designed to support the structured identification of digital transformation risks in construction enterprises. As illustrated in Figure 1, the study follows a sequential four-stage process consisting of data acquisition, data preprocessing, data analysis, and risk identification.
The research begins with data acquisition, in which academic literature related to digital transformation in the construction context is collected and systematically screened. The selected texts form the primary data source for subsequent analysis. This is followed by data preprocessing, where unstructured textual materials are prepared to ensure consistency and analytical reliability.
Based on the processed corpus, topic modeling is applied to identify latent risk-related themes embedded in the literature. LDA is employed to capture recurring semantic patterns and to organize dispersed risk-related information at the thematic level. The resulting themes are then examined through inductive coding. Drawing on the Gioia methodology, keyword-based topics are iteratively interpreted and abstracted into conceptually meaningful risk indicators, progressing from first-order concepts to second-order themes and aggregate dimensions.
Finally, risk identification is achieved by integrating semantic extraction with inductive structuring. The refined risk elements are synthesized into a hierarchical risk indicator system for digital transformation in construction enterprises. This system provides a coherent analytical foundation and supports a systematic understanding of the risk landscape associated with digital transformation initiatives.

3.2. Framework Implementation

3.2.1. Data Acquisition

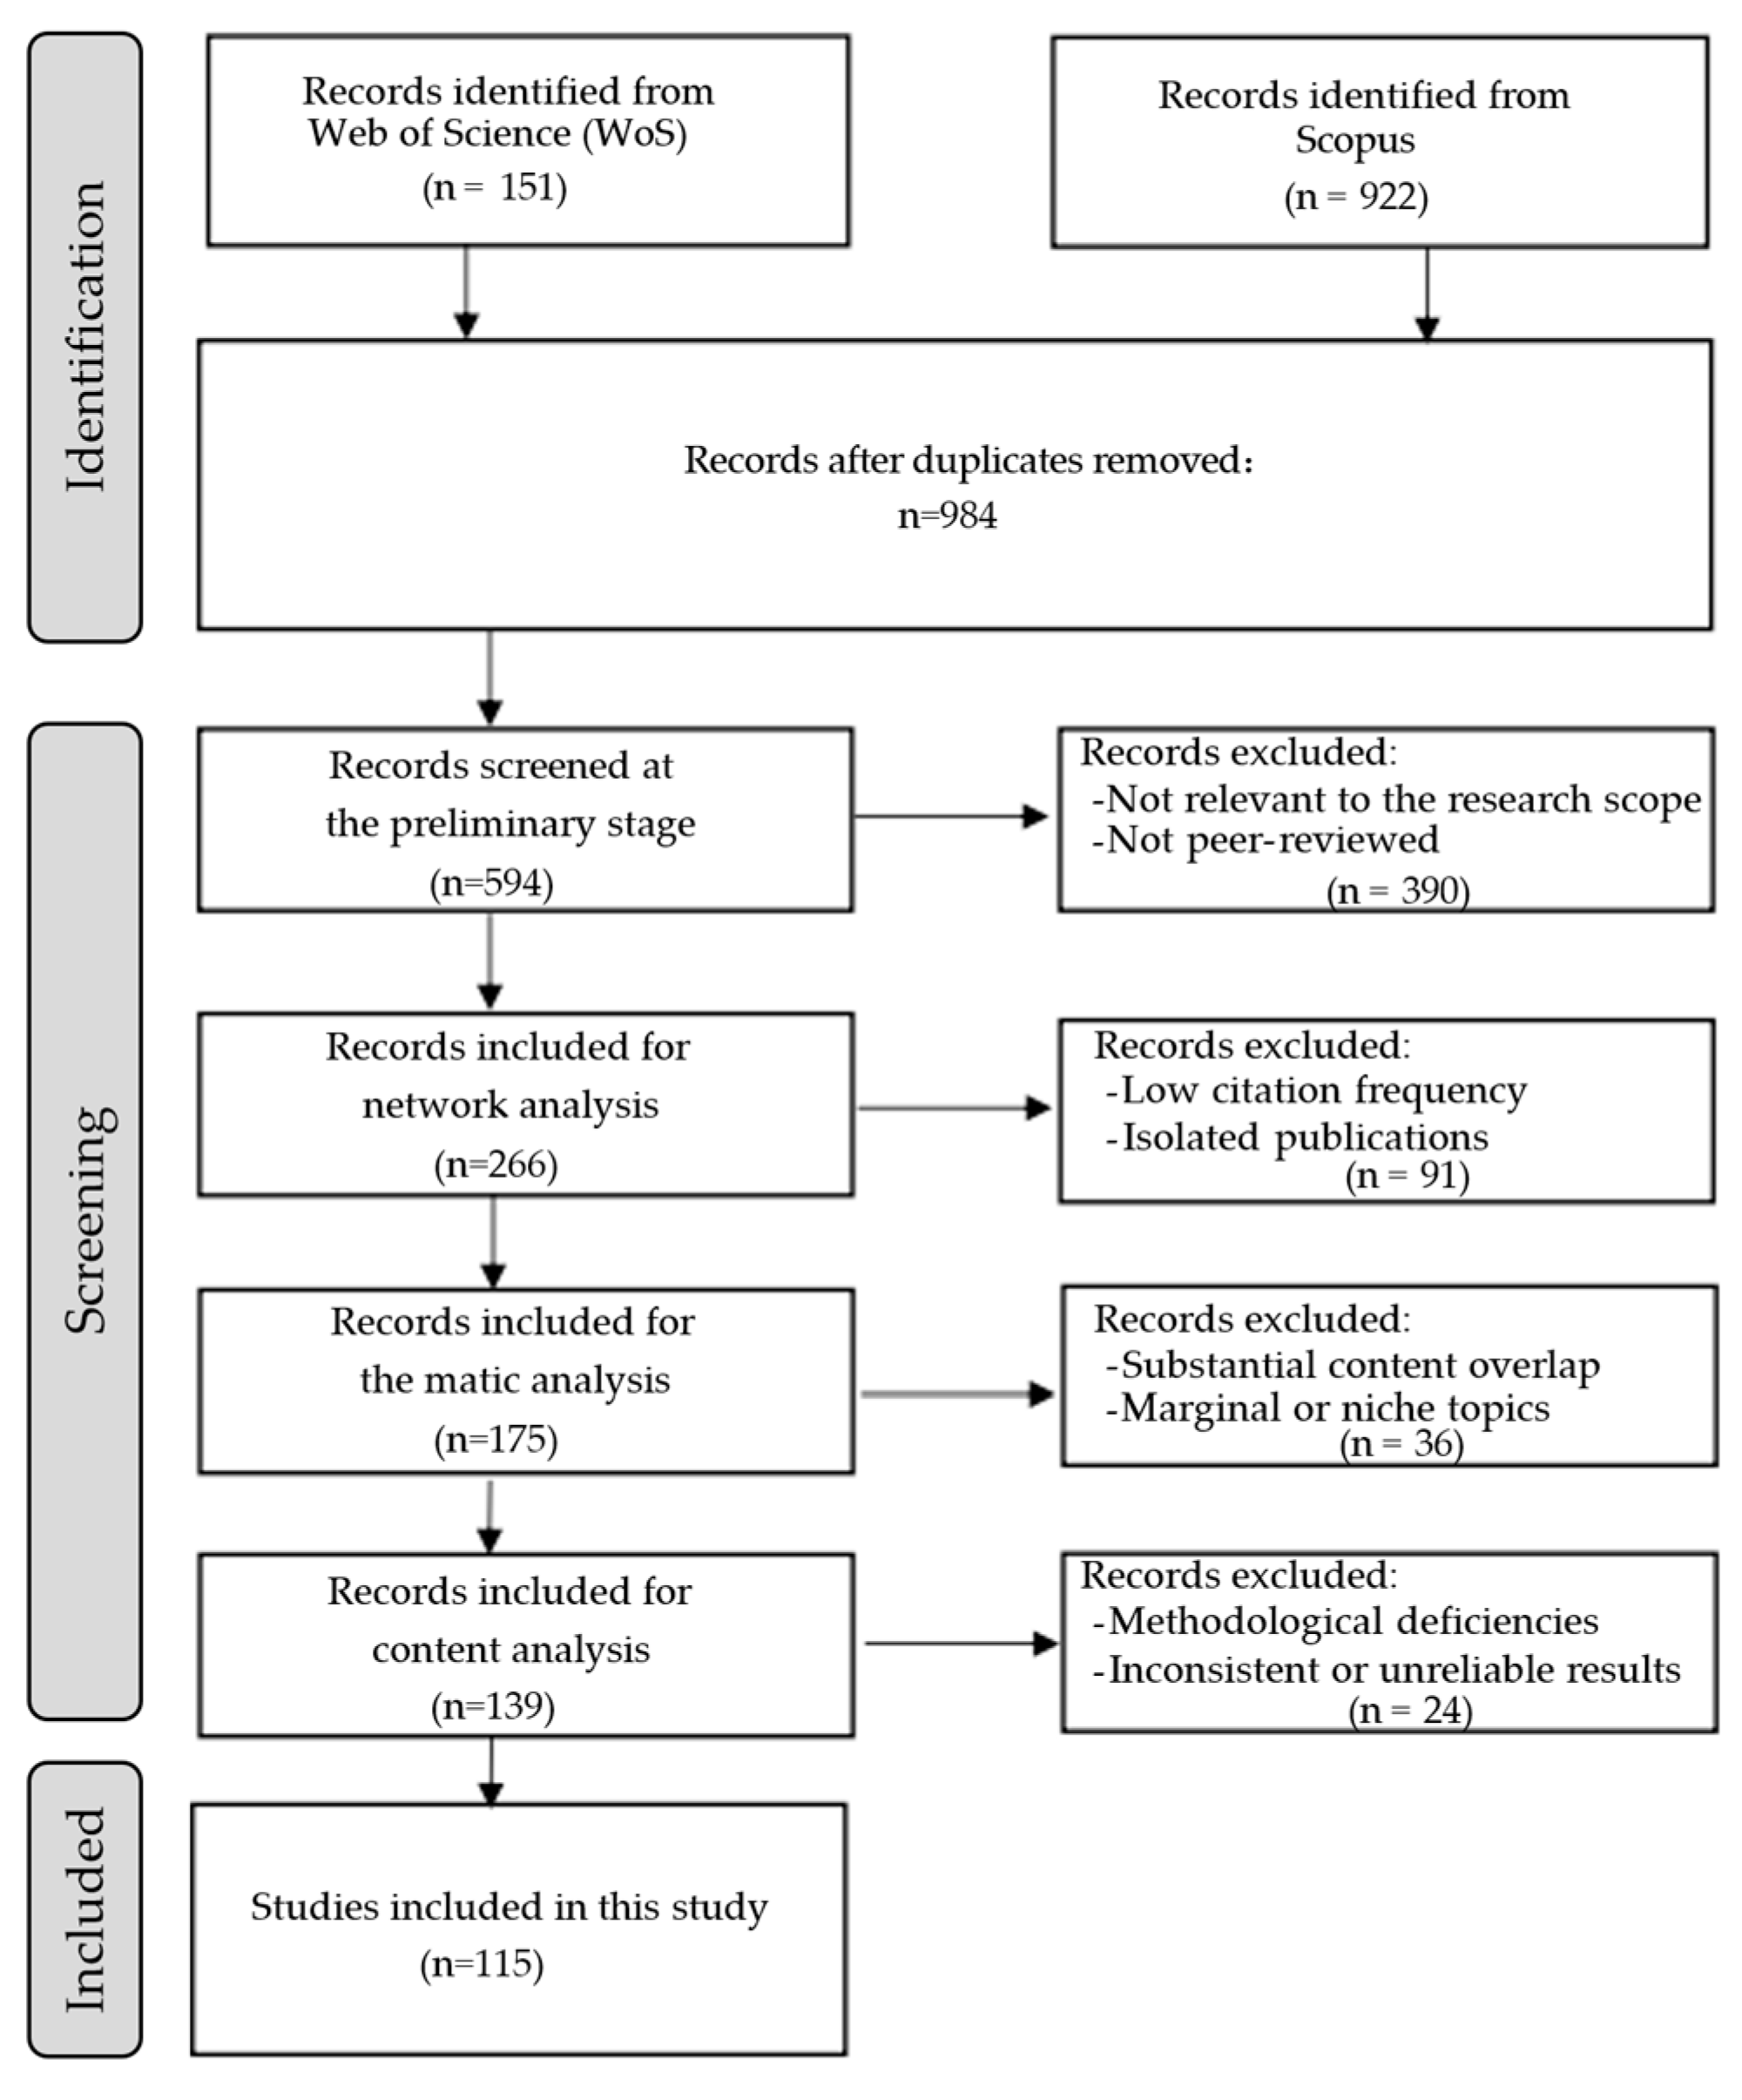
Literature related to digital transformation risks in construction enterprises was retrieved from the Web of Science Core Collection and Scopus databases for the period 2019–2024, using the keyword search strategies summarized in Table 1. After removing duplicate records, the initial dataset comprised 984 publications.
A structured literature screening procedure was conducted following the Preferred Reporting Items for Systematic Reviews and Meta-Analyses (PRISMA) guidelines. It should be noted that PRISMA was adopted here as a transparent and systematic data collection protocol to construct a high-quality textual dataset, rather than to conduct a descriptive or evaluative review of prior studies.
In the preliminary screening stage, irrelevant studies, non-original research, and non-peer-reviewed publications were excluded. Citation patterns and thematic relevance were then examined to further remove low-citation, isolated, or low-quality studies. In the final stage, content analysis was applied to identify publications with methodological deficiencies or logical inconsistencies. After assessing the relevance of each remaining article, 115 publications were retained as the foundational dataset for analysis, as illustrated in Figure 2.
The purpose of data preprocessing is to prepare heterogeneous textual data for subsequent topic modeling analysis. To ensure consistency and reduce analytical noise, the collected literature texts were standardized and cleaned prior to analysis. Specifically, the downloaded records were converted into a unified text format, and non-informative elements such as punctuation, numerals, and formatting symbols were removed. All textual content was normalized to lowercase to ensure consistent term recognition.
The cleaned texts were then tokenized and filtered to retain terms with substantive semantic relevance to digital transformation risks in construction enterprises. Common stopwords were removed using a customized stopword list adapted from standard linguistic resources. The resulting corpus formed the basis for constructing the document–term matrix used in the topic modeling stage.

3.2.2. Topic Modeling for Risk Semantic Extraction

To systematically extract latent risk-related semantics from the preprocessed literature corpus, this study employs LDA as the core topic modeling technique. LDA assumes that each document is composed of a mixture of latent topics, and that each topic is characterized by a probabilistic distribution over words. Through this probabilistic generative framework, dispersed textual discussions of digital transformation risks can be consolidated into a finite set of semantically coherent topics. Formally, the conditional probability of a word w occurring in a document d can be expressed as the weighted combination of topic–word and document–topic distributions [39]:
P w d = T P ( w | t ) × P ( t | d ) ,
where P ( w | t ) represents the probability of word w under topic t , and P ( t | d ) denotes the probability of topic t appearing in document d . In this formulation, the document–topic and topic–word distributions are treated as latent variables governed by Dirichlet priors.
A critical modeling decision in LDA is the specification of the number of topics K . In this study, K was determined through an iterative evaluation process that jointly considered statistical adequacy and semantic interpretability. Model fit was assessed using perplexity, which evaluates the predictive performance of the model on the corpus and is defined as [39]:
P e r p l e x i t y D = e x p ( d = 1 D l o g p w d d = 1 D N d ) ,
where D denotes the document corpus, w d represents the sequence of words in document d , and N d represents the number of words in document d , and p ( w d ) indicates the probability of the word sequence in the document. By calculating perplexity for different values of K , the relative change in model fit across topic numbers can be examined. In practice, perplexity typically decreases monotonically as K increases and therefore cannot be used alone to determine an optimal topic number. Accordingly, the selection of K in this study is based on a joint consideration of decreasing perplexity, topic coherence, and semantic interpretability.
To ensure semantic coherence and interpretability of the extracted topics, topic coherence was additionally examined. Coherence evaluates the degree of semantic relatedness among high-probability words within a topic and is commonly calculated based on word co-occurrence statistics. A representative formulation is given by [39]:
C o h e r e n c e w = ( w i , w j ) V s c o r e ( w i w j , ε ) ,
w i w j , ε = log p w i , w j + ε p w i p w j ,
where w i and w j are words within a topic, p ( w i , w j ) denotes the probability of w i and w j co-occurring, p ( w i ) and p ( w j ) represent the probabilities of w i and w j occurring individually, and ε is a small smoothing term introduced to prevent zero values.
In this article, LDA was implemented in Python (version 3.11.7) using the Gensim library (version 4.3.0). Text preprocessing was conducted using Natural Language Toolkit (version 3.8.1) and included lowercasing, tokenisation, part-of-speech (POS) tagging, and stopword removal. To emphasize domain-relevant semantic units and reduce noise, only noun tokens (POS tags beginning with “NN”) were retained, and tokens shorter than two characters and common stopwords were removed. Notably, lemmatization or stemming was not performed to preserve the integrity of professional construction and digital technology terminology. The final dictionary size after preprocessing consisted of 12,555 unique tokens. No additional minimum or maximum document-frequency filtering was applied beyond the POS tagging and length filtering to avoid losing niche but critical risk terms. The Dirichlet priors α and β were set to “auto”, allowing the model to learn asymmetric distributions directly from the corpus to better adapt to heterogeneous data. The model was trained with 15 passes over the corpus to enhance the stability of the estimated latent topic structure. Furthermore, a fixed random seed was specified during the initialization and training process to ensure the reproducibility of the probabilistic topic generation. Due to the use of variational inference, concepts such as “burn-in” associated with Gibbs sampling are not applicable in this implementation.
The final topic configuration was selected by balancing low perplexity values with high topic coherence, ensuring both statistical robustness and semantic interpretability. The resulting topic–keyword distributions represent latent semantic patterns associated with digital transformation risks in construction enterprises. These outputs serve as inputs for subsequent inductive coding and conceptual structuring, rather than constituting final analytical results.

3.2.3. Inductive Coding and Indicator Structuring

While topic modeling provides a statistical representation of latent semantic patterns, the resulting topics are primarily expressed through sets of keywords and lack explicit conceptual structure. To translate these topic outputs into analytically meaningful and interpretable risk elements, this study adopts an inductive coding approach based on the Gioia methodology.
In the first coding stage, keyword expressions and corresponding text excerpts were translated into first-order concepts that closely reflected the language used in the original studies. These first-order concepts were then compared across topics and iteratively refined to identify similarities, overlaps, and conceptual relationships. In the second stage, related first-order concepts were grouped into second-order themes that captured more abstract and theoretically meaningful dimensions of digital transformation risk. This process was guided by constant comparison and repeated reference to the underlying literature to maintain conceptual consistency.
In the final stage of abstraction, second-order themes were further consolidated into aggregate dimensions representing higher-level risk domains. Through this multi-level inductive process, dispersed and fragmented risk-related discussions across the literature were systematically organized into a coherent hierarchical structure. The resulting structure consists of first-order risk indicators, second-order thematic categories, and aggregate risk dimensions, forming a comprehensive risk indicator system for digital transformation in construction enterprises.
By integrating topic modeling with inductive coding, the proposed framework combines data-driven semantic extraction with theory-informed conceptual structuring. This integration ensures that the identified risk indicators are grounded in both large-scale empirical evidence and interpretive analytical rigor, providing a transparent and replicable foundation for subsequent analysis.

4. Results and Analysis

4.1. Topic Modeling Results

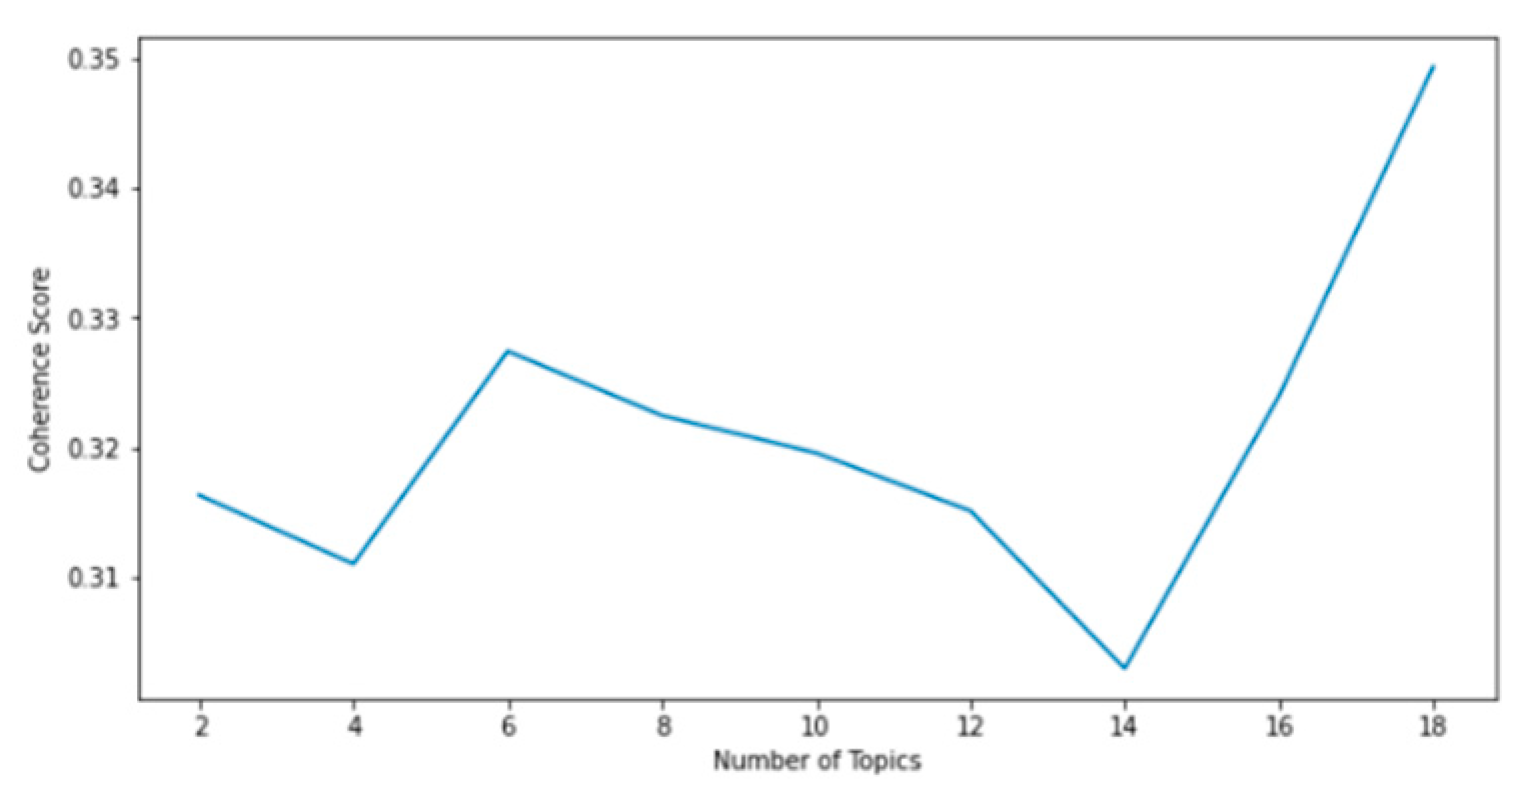
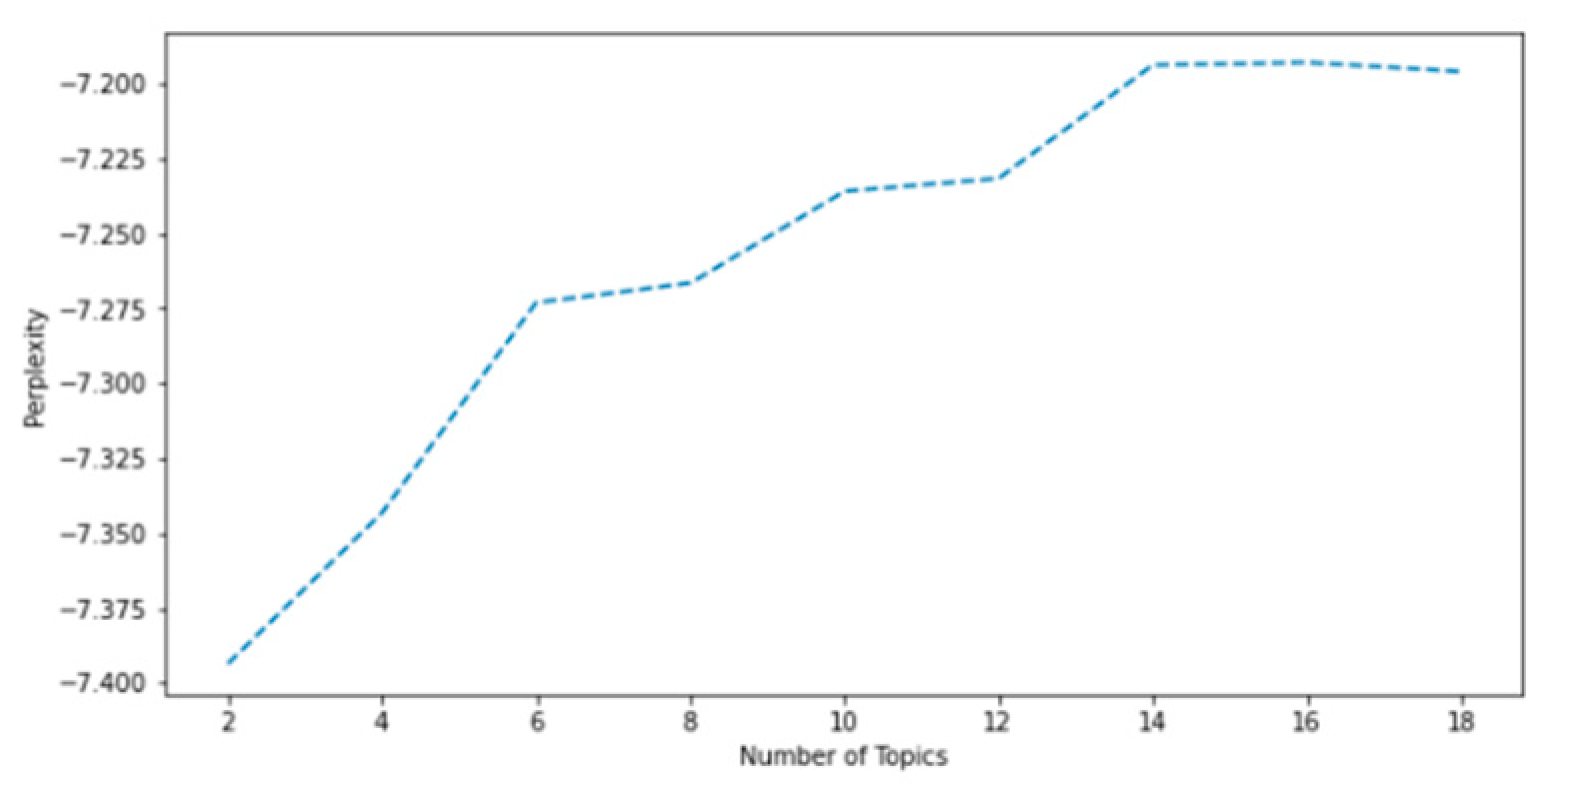
Figure 3 and Figure 4 present the evaluation results of model perplexity and topic coherence under different topic numbers, computed according to Equations (2)–(4). In both figures, the x-axis represents the number of topics, while the y-axis corresponds to perplexity and coherence scores. As the number of topics increases, perplexity gradually decreases and stabilizes, whereas coherence exhibits noticeable fluctuations. This pattern indicates that increasing the topic number improves statistical fit but does not necessarily lead to clearer semantic interpretability.
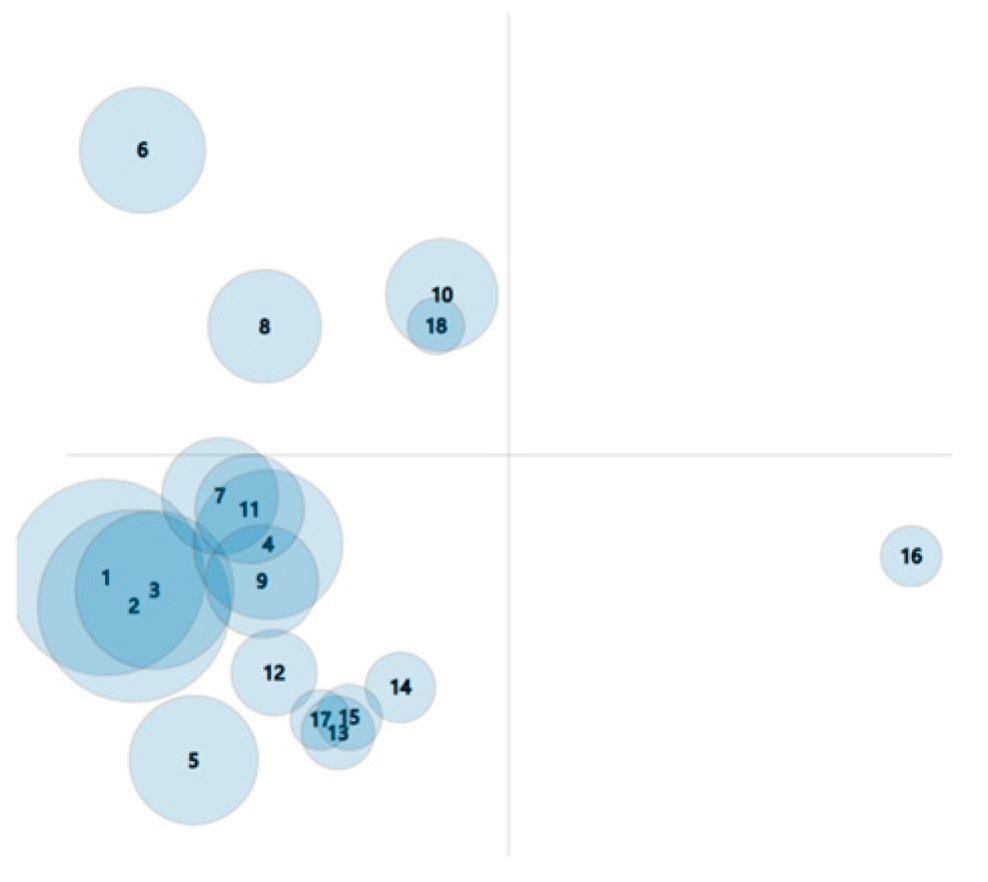
Based on the combined evaluation of perplexity and coherence, an initial configuration with K = 18 topics was identified as statistically acceptable, characterized by relatively low perplexity and comparatively high coherence. At this resolution, the LDA model captures fine-grained semantic diversity in the literature, allowing dispersed risk-related expressions to be represented with sufficient detail. Table 2 presents the LDA-derived topics for the K = 18 solution, summarized by representative keywords and example references. The keywords are selected based on the highest-probability terms in the topic–word distributions P ( w | t ) defined in Equation (1) and generated by the trained LDA model. These topics reflect latent semantic patterns identified from the literature corpus rather than pre-defined or manually interpreted risk categories. For completeness and transparency, the keyword distributions and corresponding weight values for all 18 topics are provided in Appendix A.
It should be emphasized that the topics reported in Table 2 are not treated as final risk categories. Instead, the LDA-derived topic terms are directly treated as first-order concepts and serve as the semantic basis for subsequent inductive coding and structural refinement, through which higher-level risk themes and aggregate dimensions are developed.
To examine whether these topics could be directly used for higher-level risk structuring, an inter-topic distance visualisation was generated using Multidimensional Scaling (MDS). The inter-topic distances were computed based on the topic–word distributions P ( w | t ) defined in Equation (1), and the resulting distance matrix was projected into a two-dimensional space, as shown in Figure 5. Although the K = 18 solution satisfies the quantitative evaluation criteria, the visualization reveals substantial overlap among several topics. This overlap suggests limited discriminative clarity at higher levels of abstraction and reduces the interpretability of individual topics when used directly to define overarching risk domains. Importantly, this analysis does not imply that the K = 18 solution is methodologically inappropriate, but rather that topic modeling results alone are not intended to serve as final structural categories in this study.
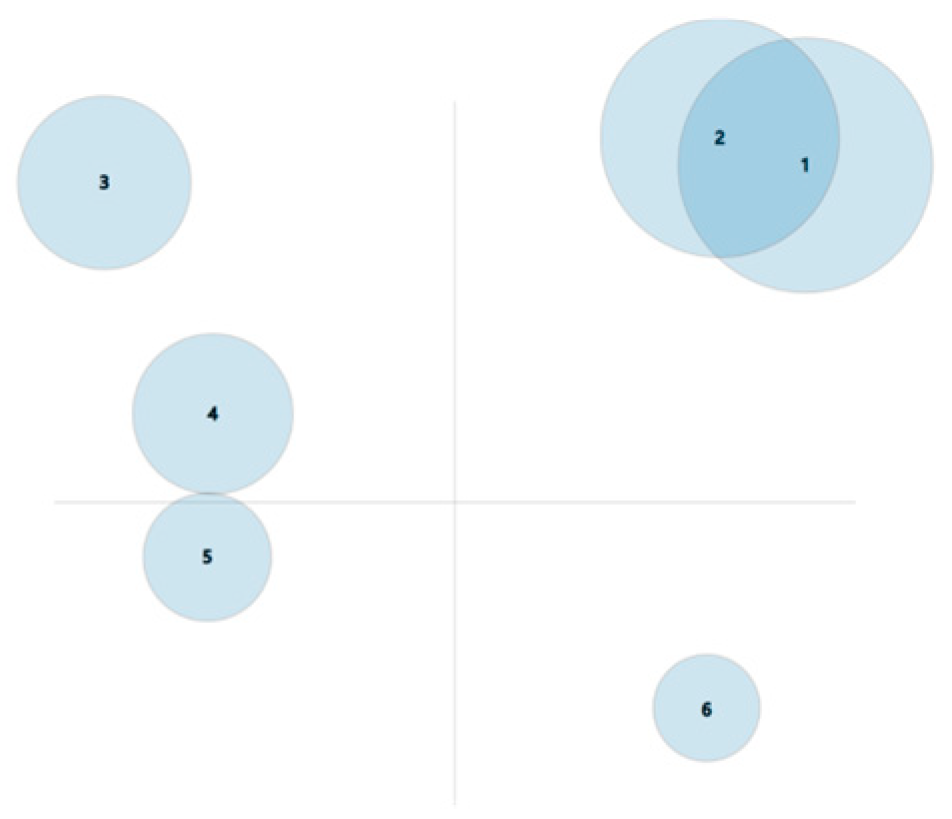
To enhance topic independence and support higher-level conceptual structuring, the topic number was further reduced and re-evaluated. Based on the consistency of perplexity and coherence trends observed in Figure 3 and Figure 4, a statistically acceptable intermediate configuration with K = 6 was examined, and the corresponding inter-topic distance visualization is presented in Figure 6. While topic overlap was partially alleviated at this resolution, residual similarity among certain topics remained evident, indicating that further abstraction was required.
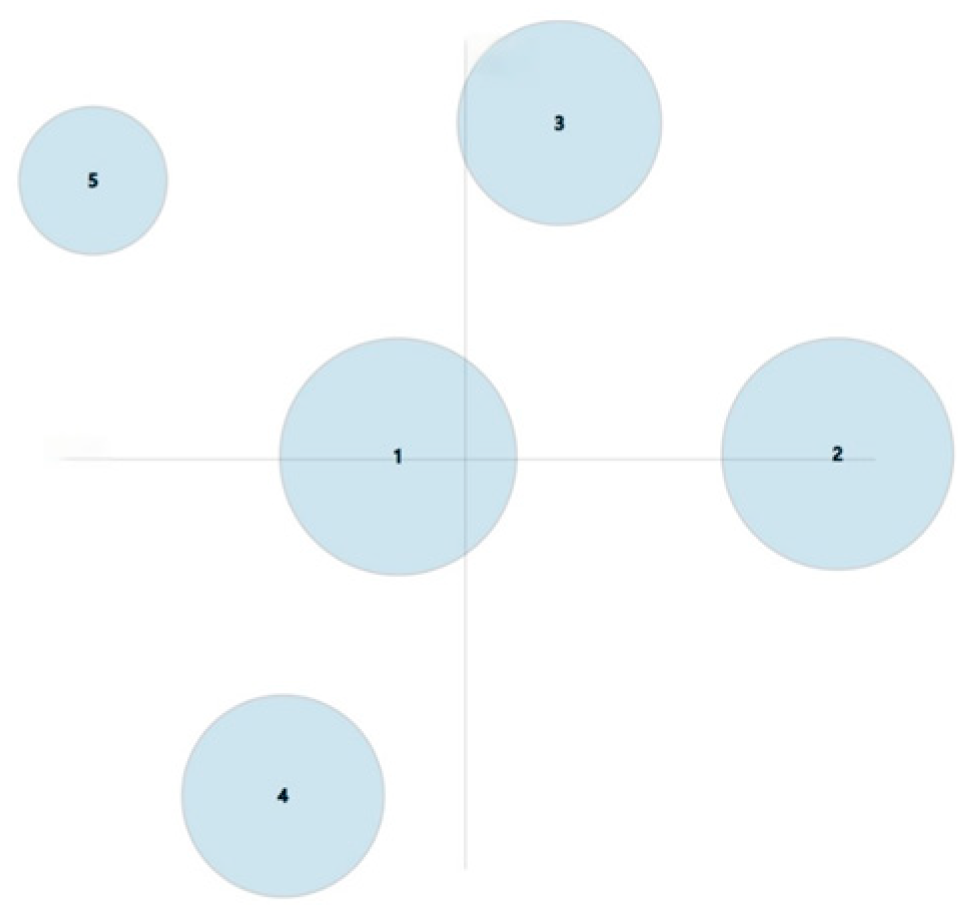
As illustrated in Figure 7, the K = 5 configuration exhibits clearer spatial separation in the inter-topic distance visualization, reflecting improved topic independence and conceptual coherence. Although some feature terms appear across multiple topics, this reflects the inherent polysemy of natural language and the broad thematic scope of digital transformation research rather than insufficient topic separation. Importantly, the MDS-based visualization considers overall term distributions rather than individual word overlap, allowing meaningful differentiation among topics despite shared vocabulary.
Based on the above analysis, the K = 5 configuration is adopted as the primary analytical basis for defining first-level risk categories in the subsequent structuring process, while the finer-grained K = 18 configuration is retained as a semantic reference for identifying second- and third-level risk indicators. This multi-resolution use of topic modeling results supports both conceptual clarity at the structural level and semantic completeness at lower levels, thereby facilitating the construction of a hierarchical risk indicator system.

4.2. Inductive Coding Results

Building on the topic modeling results, inductive coding was conducted to structurally synthesize the latent risk semantic units identified through LDA. This process aimed to translate dispersed keyword-based topics into a hierarchical and theoretically interpretable risk structure. The resulting coding framework provides a structured foundation for the construction of the digital transformation risk indicator system.
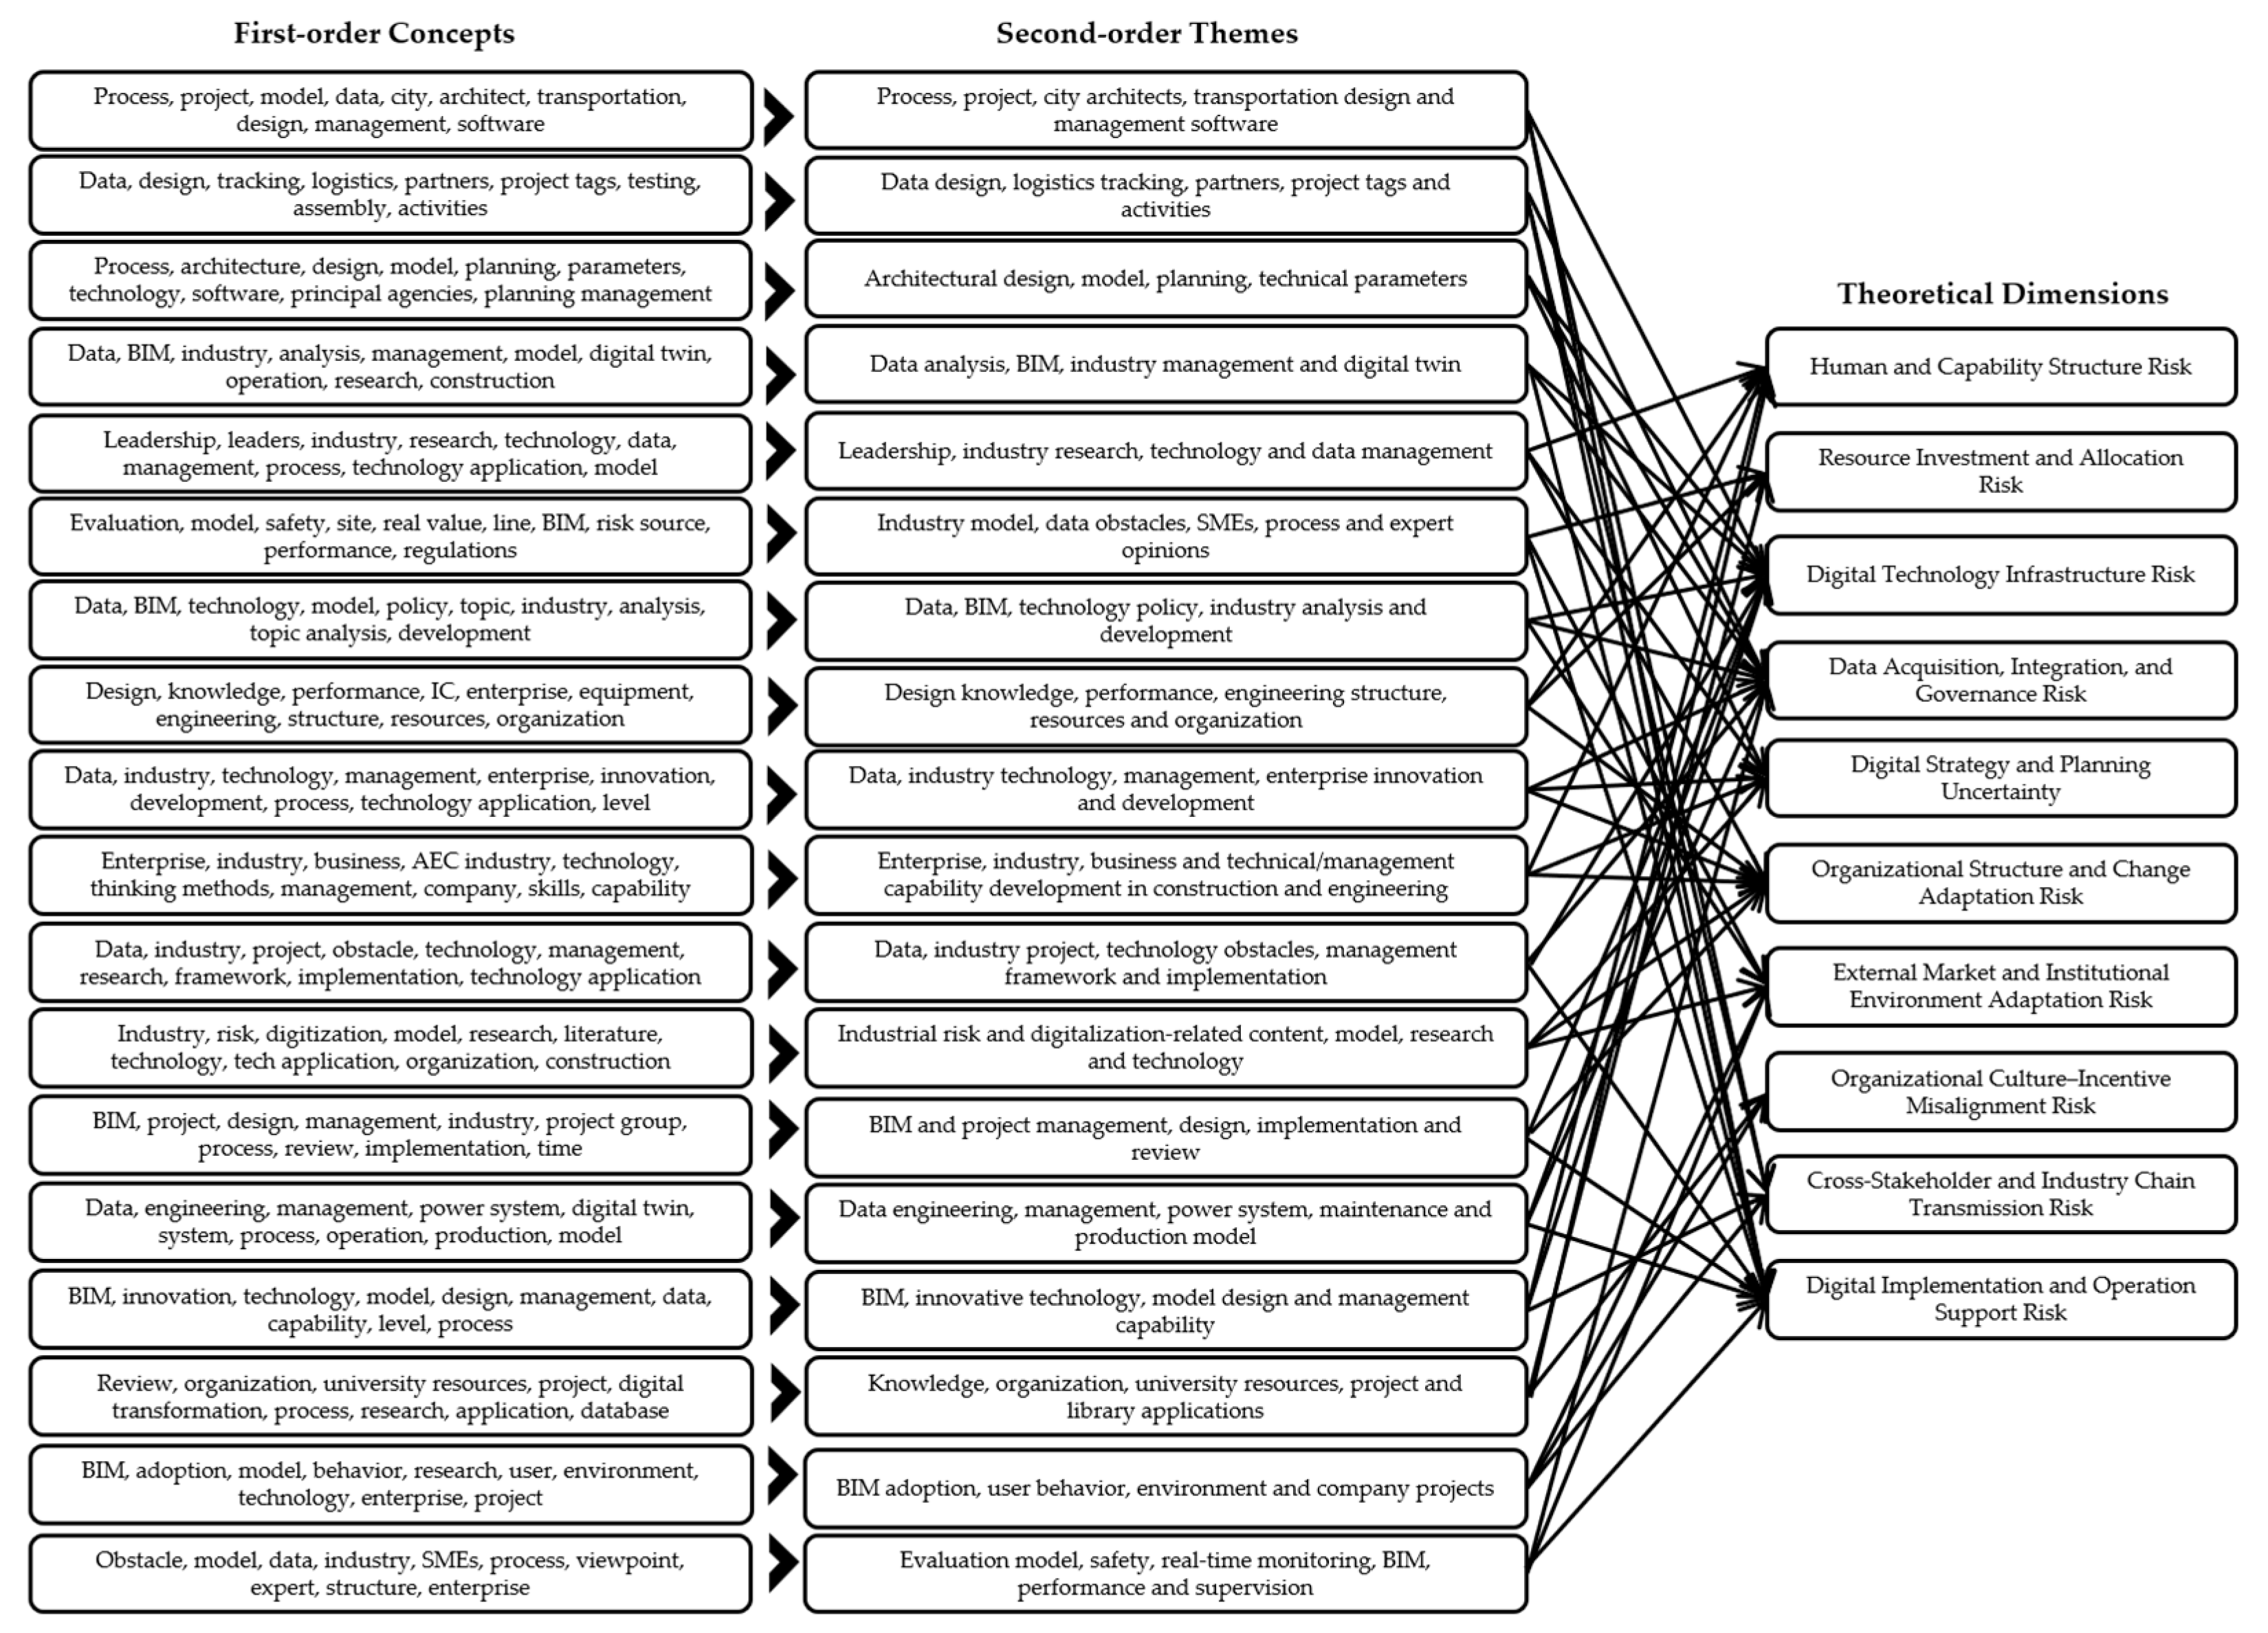
Following the Gioia methodology, a three-tier coding structure was developed through multiple rounds of inductive abstraction and refinement. First-order concepts correspond directly to the LDA-identified topic terms, with representative textual excerpts used to support semantic traceability to the original literature. These concepts were then compared and consolidated into second-order themes based on shared risk mechanisms, causal logic, and contextual characteristics. Finally, the second-order themes were further abstracted into aggregate dimensions that reflect broader structural domains of digital transformation risk, rather than isolated or event-specific risk factors.
To illustrate the inductive coding process following topic modelling, Topic 1 is used as an example. Topic 1 was characterized by high-probability terms including process (0.022), project (0.021), model (0.015), data (0.014), city (0.009), architects (0.008), transportation (0.007), design (0.006), management (0.006), and software (0.006). In this study, these LDA-derived terms were directly treated as first-order concepts, consistent with the modelling outputs.
Inductive coding was therefore focused on abstracting higher-level structures from these first-order concepts. In particular, first-order concepts emerging from Topic 1 were examined together with semantically related first-order concepts from other topics to identify recurring patterns and functional similarities. Through this cross-topic comparison, first-order concepts referring to digital workflows, project execution, and modelling practices were consolidated into a second-order theme labelled processes and projects based on shared functional roles in digital transformation projects and consistent semantic patterns observed across topics. Similarly, first-order concepts associated with professional roles and domain-specific design contexts were abstracted into themes such as urban architects and transportation design, while concepts related to management and software were consolidated into the theme management software.
These second-order themes were subsequently interpreted in relation to their roles within construction digital transformation and aggregated into broader structural dimensions. In this example, themes associated with software, data, and digital tools informed the aggregate dimension of digital technology infrastructure risk, themes reflecting cross-professional and cross-project coordination contributed to cross-stakeholder and industry chain transmission risk, and themes related to digital process execution and project support were incorporated into digital implementation and operation support risk. This procedure illustrates how inductive coding operated on LDA-derived first-order concepts to generate a structured, multi-level risk indicator system.
Consistent with the Gioia methodology, the inductive coding process necessarily involves researcher judgement in interpreting and abstracting meanings from textual sources. The methodological emphasis therefore lies in ensuring transparency, traceability, and systematic validation of these judgements. In this study, inductive interpretation was explicitly constrained by LDA-derived semantic groupings and subsequently reviewed through expert validation, thereby mitigating individual bias and enhancing analytical credibility.
To enhance the reliability and interpretability of the coding results, an expert validation process was incorporated. Three experts with experience in digital transformation and risk governance in construction enterprises participated in two rounds of review. The reviews focused on the consistency of first-order concept assignment, the logic of theme aggregation, and the delineation of aggregate dimensions. Based on expert feedback, ambiguities in term boundaries and overlaps between dimensions were refined, and the labeling logic was standardized.
As shown in Figure 8, the final coding structure consists of 18 s-order themes and 10 aggregate dimensions. The aggregate dimensions capture key organizational, technological, and environmental structures underlying digital transformation risks in construction enterprises. These dimensions emphasize structural conditions, capability constraints, and governance challenges, rather than focusing solely on individual technologies or operational incidents.
In addition, supplementary literature was introduced to test the semantic sufficiency and stability of the coding structure [82]. All newly introduced risk statements could be accommodated within the existing themes and dimensions without generating additional categories. This result indicates that the final coding framework demonstrates good semantic coverage and structural stability. The complete inductive coding results are summarized in Figure 8.

4.3. Hierarchical Risk Indicator System

Building on the LDA modeling and Gioia coding results, this study further translates the identified risk semantic structures into a hierarchical risk indicator system. Rather than representing a catalog of isolated risk events or operational issues, the constructed indicators capture key structural conditions that shape the emergence, amplification, and transmission of digital transformation risks in construction enterprises. The indicator system therefore reflects underlying risk mechanisms at different levels of abstraction, providing a structured basis for subsequent risk evaluation.

4.3.1. Construction of First-Level Indicators

The first step in constructing the hierarchical risk indicator system is the identification of first-level indicators, which define the fundamental structural domains of digital transformation risks in construction enterprises. Based on the topic stability and semantic separation observed in the LDA results at K = 5 , and considering the operational feasibility of subsequent risk evaluation, five first-level indicators were established. This choice reflects a balance between semantic representativeness and analytical tractability, rather than a direct one-to-one mapping between LDA topics and indicator categories.
The results of the Gioia-based coding analysis indicate that digital transformation risks in construction enterprises are predominantly concentrated within five overarching structural domains. These domains correspond to conditions related to resource allocation, technological and data foundations, organizational change capability, internal and external environmental constraints, and cross-stakeholder coordination mechanisms. Together, they capture the major structural contexts in which digital transformation risks are generated and transmitted.
Accordingly, the five first-level indicators were defined as Resources, Technology, Organization, Environment, and Industry Chain. These indicators represent relatively stable and system-level risk domains that extend across projects and stages of digital transformation, rather than isolated technical or managerial issues.
From a theoretical perspective, the configuration of the first-level indicators aligns with the Technology–Organization–Environment (TOE) framework [83]. On this basis, “Resources” and “Industry Chain” emerged as independent domains to better reflect the specific characteristics of digital transformation in the construction industry. Resource input and allocation constraints exert a foundational influence on digital initiatives across multiple projects, while effective industry chain collaboration is critical given the fragmented and multi-actor nature of construction activities. Risks arising at the industry chain level can directly undermine the functionality and integration of digital systems, justifying its treatment as a distinct first-level indicator.

4.3.2. Construction of Second-Level Indicators

The second-level indicators further articulate the internal structure of each first-level domain by capturing relatively stable risk formation mechanisms. While first-level indicators reflect broad structural contexts, second-level indicators differentiate how risks arise and accumulate within each domain, thereby enhancing the explanatory power and analytical resolution of the indicator system. The identification of second-level indicators was primarily grounded in the aggregate dimensions derived from the Gioia coding results. These dimensions reveal recurring patterns in risk causation and constraint mechanisms across the literature. Relevant theoretical perspectives were subsequently employed to standardize conceptual boundaries and ensure internal consistency, rather than to introduce additional categories.
Under the Resources domain, risk semantics are mainly associated with investment capacity, capability endowment, and resource deployment modes. The coding results indicate a clear distinction between material input conditions and capability-related constraints. Accordingly, second-level indicators were defined as Tangible Resources and Intangible Resources, consistent with the basic distinction proposed in the Resource-Based View (RBV) [84]. Tangible resources reflect risks related to the scale, stability, and allocation of financial and physical inputs required to sustain digital transformation initiatives. Intangible resources capture risks associated with managerial cognition, workforce competence, and the accumulation of organizational knowledge.
Within the Technology domain, risk semantics concentrate on system reliability, interoperability, and data governance conditions. Two second-level indicators were identified: Technological Infrastructure and Data Management. This distinction aligns with established information systems research and the Technology Acceptance Model (TAM), which differentiates between system-level support conditions and data-related governance capabilities [85,86]. Technological infrastructure represents the foundational support capacity of digital systems, including hardware, software platforms, and system compatibility. Data management reflects risks related to data standardization, integration, quality, and value realization.
For the Organization domain, the Gioia coding results highlight risks arising from goal formulation, coordination mechanisms, and capability development processes. These risk semantics were synthesized into Strategic Planning and Organizational Development, corresponding to core concerns emphasized in organizational change and learning theories. Strategic planning focuses on the clarity and coherence of digital transformation objectives, as well as cross-functional coordination and process design. Organizational development captures risks related to skill upgrading, performance evaluation, and alignment between individual behavior and organizational transformation goals.
Under the Organization first-level indicator, risk semantics mainly involve strategic goal setting, organizational coordination mechanisms, and capability development. Drawing on Organization Development Theory (ODT), Change Management Theory (CMT), and Organizational Learning Theory [87,88,89,90], second-level indicators are categorized as Strategic Planning and Organizational Development. Strategic planning emphasizes the establishment of digital transformation objectives, cross-departmental coordination mechanisms, and process design. Organizational development focuses on personnel capability enhancement, performance evaluation mechanisms, and goal alignment.
Under the Environment first-level indicator, risk semantics primarily reflect the constraints imposed by external uncertainty and internal institutional conditions on digital transformation. Based on Environmental Adaptation Theory (EAT) and Dynamic Capabilities Theory (DCT) [91,92], the second-level indicators are defined as Market Environment and Enterprise Environment. Market environment reflects external factors such as industry competition, policy changes, and market demand fluctuations. Enterprise environment focuses on organizational culture, innovation climate, and internal institutional conditions.
Under the Industry Chain first-level indicator, risk semantics are highly concentrated on cross-stakeholder collaboration and external support conditions. Drawing on Supply Chain Integration Theory (SCIT) [93], the second-level indicators are defined as Industry Chain Collaboration and Service Support. Industry chain collaboration reflects the degree of information sharing and coordination among owners, design firms, contractors, suppliers, and operations entities. Service support encompasses external professional services, including consulting and technical assistance.

4.3.3. Construction of Third-Level Indicators

The third-level indicators further operationalize the abstract structural conditions represented by the first- and second-level indicators, transforming them into measurable and comparable evaluation units. Unlike the higher-level indicators, which emphasize structural domains and risk formation mechanisms, third-level indicators focus on capturing the typical manifestations and intensity characteristics of digital transformation risks in construction enterprises.
It should be emphasized that the third-level indicators developed in this study are not intended to provide an exhaustive list of specific risk events or operational problems. Instead, they represent conceptually concise expressions of key risk exposure conditions under each structural domain. This design choice ensures that the indicator system remains analytically tractable while retaining sufficient sensitivity to reflect variations in digital transformation risk levels across enterprises and projects.
The identification of third-level indicators was primarily based on the fine-grained semantic information extracted from the LDA model under higher topic resolutions, complemented by the first-order concepts generated during the Gioia coding process. These semantic units capture recurrent risk expressions in the literature related to funding continuity, capability sufficiency, system reliability, data governance, organizational alignment, environmental adaptability, and cross-stakeholder coordination. On this basis, candidate indicators were screened and refined to ensure logical consistency with their corresponding second-level indicators.
To enhance contextual relevance, particular attention was given to aligning third-level indicators with the practical characteristics of digital transformation in construction enterprises. Rather than adopting overly generic or technology-neutral expressions, the indicators were formulated to reflect common risk exposure patterns observed in construction-specific digital transformation initiatives, such as fragmented project organization, multi-actor collaboration, and long lifecycle dependency. At the same time, overly detailed descriptions tied to specific technologies or organizational practices were deliberately avoided to preserve conceptual abstraction and cross-case comparability.
The refinement process further incorporated a comparative review against commonly used risk representation indicators in the existing literature, with the aim of standardizing terminology while maintaining domain specificity. Subsequently, expert review was conducted to assess the clarity, redundancy, and hierarchical appropriateness of the proposed third-level indicators. Based on expert feedback, several indicators were merged or rephrased to avoid conceptual overlap and to ensure that each indicator represents a distinct aspect of risk exposure under its corresponding structural condition.
The finalized third-level indicators are presented in Table 3, forming the lowest level of the hierarchical risk indicator system. Together with the first- and second-level indicators, they constitute a coherent and multi-layered framework that supports subsequent quantitative risk assessment and comparative analysis of digital transformation risks in construction enterprises.

5. Discussion and Conclusions

5.1. Discussion

Digital transformation risks in construction enterprises are conceptualized in this study as a structural and systemic phenomenon rather than as a collection of isolated technical failures or managerial deficiencies. The results show that risk exposure emerges from the interaction of multiple conditions spanning resources, technology, organization, environment, and industry chain coordination. This perspective is particularly appropriate for construction settings, where digital transformation rarely unfolds as a single, bounded initiative and instead progresses across multiple projects, actors, and lifecycle stages. As a consequence, risks tend to accumulate through cross-domain coupling rather than originating from discrete, independently manageable events.
A key implication of the proposed framework is that digital transformation risks in construction enterprises are not reducible to any single dominant dimension. While existing studies often emphasize technology readiness, organizational resistance, or digital capability maturity, such approaches implicitly treat other conditions as background variables. The results of this study suggest that such partial perspectives may underestimate the systemic nature of risk accumulation in construction digital transformation. In practice, weaknesses in one domain—such as insufficient resource allocation or fragmented industry chain coordination—can amplify vulnerabilities in others, even when technological or organizational conditions appear relatively mature. This interdependence highlights the limitations of single-dimension or checklist-based risk identification approaches in complex, project-based environments.
The differentiation of risk mechanisms across domains further reveals how construction-specific characteristics condition digital transformation outcomes. Resource-related risks are shown to arise less from absolute shortages than from misalignment among financial inputs, human capabilities, and project-level deployment patterns. Given the project-based nature of construction enterprises, investments in digital systems are often distributed unevenly across projects, leading to discontinuities in capability accumulation and utilization. Technological risks extend beyond system functionality to include data fragmentation and governance challenges associated with heterogeneous platforms and decentralized project organizations. These issues constrain the continuity of digital information across design, construction, and operation stages, limiting the effectiveness of digital systems even when individual technologies perform adequately.
Organizational risks are closely associated with the challenge of embedding enterprise-level digital strategies within temporary and decentralized project structures. Unlike process-oriented industries, construction enterprises rely heavily on short-term project teams and localized decision-making, which can impede organizational learning and the diffusion of digital practices. As a result, strategic intentions related to digital transformation may fail to translate into consistent execution at the project level. This finding helps explain why construction enterprises with formal digital strategies and governance structures may still experience persistent implementation risks.
Environmental and industry chain-related risks underscore the extent to which construction digital transformation depends on conditions beyond the focal enterprise. Regulatory uncertainty, market volatility, and shifting client requirements influence both the timing and direction of digital investments. At the same time, the effectiveness of digital systems is highly contingent on collaboration among owners, designers, contractors, suppliers, and service providers. Failures in industry chain coordination can undermine system interoperability and data continuity, even when individual enterprises demonstrate strong internal capabilities. This observation suggests that digital transformation risks cannot be fully managed within organizational boundaries alone and require attention to inter-organizational governance and coordination mechanisms.
An additional contribution of this study lies in the abstraction strategy used to express risk indicators. Rather than enumerating specific risk events or scenarios, the third-level indicators capture structural conditions that shape risk exposure. This abstraction reflects the cumulative and dynamic nature of digital transformation risks in construction enterprises, where adverse outcomes often emerge through gradual misalignment and interaction rather than through sudden failures. By focusing on structural conditions, the proposed indicator system supports cross-project comparison and longitudinal assessment, while avoiding excessive dependence on context-specific or technology-specific descriptions.
From a practical perspective, the proposed indicator system is intended to support structured risk identification rather than to function as a standalone evaluation or decision-making tool. In empirical settings, the hierarchical indicators can be used to guide expert workshops, internal risk reviews, or project-stage diagnostics by ensuring that technological, organizational, and industry chain-related conditions are considered in an integrated manner. The indicator system may also serve as an input layer for subsequent quantitative risk assessment or decision-support methods, such as multi-criteria evaluation or structural modelling approaches, by providing a transparent and theoretically grounded representation of underlying risk conditions.
For policymakers and regulators, the framework offers a system-oriented reference structure for understanding digital transformation risks in the construction sector without prescribing specific technologies or implementation pathways. By emphasizing structural conditions and interaction mechanisms, the indicator system can support comparative analysis across projects or organizations and inform the design of adaptive governance or regulatory instruments, while remaining flexible to different institutional and regulatory contexts.
The results indicate that event-based or single-dimension analyses are unlikely to adequately capture how digital transformation risks accumulate in construction enterprises. The hierarchical indicator system developed in this study provides a theoretically grounded and empirically informed representation of the structural conditions under which such risks emerge and propagate. As such, the framework offers a coherent foundation for subsequent quantitative assessment, causal modeling, and decision-support applications, and clarifies the mechanisms through which digital transformation risks are more likely to intensify in construction contexts.

5.2. Conclusions

This study addresses the challenge of systematically identifying digital transformation risks in construction enterprises by developing a structured, literature-driven framework. By integrating topic modeling with inductive coding, dispersed and heterogeneous risk-related evidence is translated into a coherent hierarchical indicator system, providing a transparent and replicable basis for organizing digital transformation risks in construction contexts.
Rather than treating risks as isolated events or technology-specific issues, the study reframes digital transformation risk in construction enterprises as a configuration of interacting structural conditions. The resulting indicator system captures how risk exposure emerges and accumulates across resources, technology, organization, environment, and industry chain coordination, reflecting the project-based and multi-actor characteristics of the construction industry. This perspective helps explain why digital transformation risks in construction often persist across projects and stages, even when individual initiatives appear well managed.
However, several limitations warrant consideration. Methodologically, while LDA effectively extracts latent themes, its reliance on probabilistic word co-occurrence suggests that alternative text-mining approaches could further complement the current framework. Specifically, incorporating Graph Neural Networks for structural text classification or exploring other advanced text-mining techniques, such as machine learning or generative models, could complement the current framework by improving risk mapping precision and capturing complex relationships [112,113]. Furthermore, as the analysis is grounded in peer-reviewed academic publications, the findings should be validated against empirical project-level data to better account for emerging industry practices and heterogeneous firm-specific risk perceptions. Future research may leverage this structural foundation to support causal modeling or comparative assessments across different project stages and organizational contexts, potentially extending the framework’s applicability to other infrastructure-intensive sectors.

Author Contributions

Conceptualization, J.Y. and T.L.; methodology, J.Y. and T.L.; software, T.L.; validation, T.L. and S.L.; formal analysis, J.Y., T.L. and S.L.; investigation, T.L.; resources, J.Y. and T.L.; data curation, T.L.; writing—original draft preparation, T.L. and S.L.; writing—review and editing, T.L. and S.L.; visualization, T.L.; supervision, J.Y., T.L. and S.L.; project administration, T.L. All authors have read and agreed to the published version of the manuscript.

Funding

This research was funded by China Scholarship Council (202406260179).

Data Availability Statement

The implementation of the proposed LDA model is publicly available at https://github.com/Litag/LDA-for-DT-in-Construction.git, accessed on 26 January 2026. This repository ensures transparency and facilitates reproducibility for further research and practical applications.

Conflicts of Interest

The authors declare no conflicts of interest.

Appendix A

Table A1. LDA Topic Analysis Results (K = 18).
TopicTop 10 Feature Terms and Their Weights
10.022*”process”+ 0.021”project”+ 0.015”model”+ 0.014”data”+ 0.009”city”+ 0.008”architects”+ 0.007”transportation”+ 0.006”design”+ 0.006”management”+ 0.006”software”
20.020”data”+ 0.015”design”+ 0.012”tracking”+ 0.010”logistics”+ 0.010”partner”+ 0.008”project”+ 0.008”tags”+ 0.007”tests”+ 0.007”assembly”+ 0.006”activities”
30.022”process”+ 0.021”building”+ 0.015”design”+ 0.014”model”+ 0.009”plan”+ 0.008”parameters”+ 0.007”technology”+ 0.006”software”+ 0.006”authority”+ 0.006”planning”
40.020”data”+ 0.015”bim”+ 0.012”industry”+ 0.010”analysis”+ 0.010”management”+ 0.008”model”+ 0.008”twin”+ 0.007”operation”+ 0.007”study”+ 0.006”building”
50.025”leadership”+ 0.020”leaders”+ 0.016”industry”+ 0.014”study”+ 0.013”technology”+ 0.009”data”+ 0.009”management”+ 0.009”process”+ 0.008”technologies”+ 0.008”model”
60.025”assessment”+ 0.021”model”+ 0.021”safety”+ 0.018”ground”+ 0.017”truth”+ 0.012”lines”+ 0.011”bim”+ 0.011”hazards”+ 0.010”performance”+ 0.009”regulation”
70.029”data”+ 0.022”bim”+ 0.016”technology”+ 0.014”model”+ 0.013”policy”+ 0.012”topic”+ 0.010”industry”+ 0.010”analysis”+ 0.010”topics”+ 0.009”development”
80.029”design”+ 0.022”knowledge”+ 0.016”performance”+ 0.014”ic”+ 0.013”firms”+ 0.012”equipment”+ 0.010”engineering”+ 0.010”structure”+ 0.010”resources” +0.009”organisation”
90.030”data”+ 0.025”industry”+ 0.022”technology” +0.011”management”+ 0.009”enterprises”+ 0.008”innovation”+ 0.008”development”+ 0.008”process”+ 0.007”technologies”+ 0.007”level”
100.026”firms”+ 0.022”industry”+ 0.019”business”+ 0.015”aec”+ 0.014”technology”+ 0.013”thinking”+ 0.010”management”+ 0.009”firm”+ 0.008”skills”+ 0.007”capabilities”
110.030”data”+ 0.025”industry”+ 0.022”project”+ 0.011”barriers”+ 0.009”technologies”+ 0.008”management”+ 0.008”study”+ 0.008”framework”+ 0.007”implementation”+ 0.007”technology”
120.023”industry”+ 0.020”risk”+ 0.017”digitalisation”+ 0.012”model”+ 0.010”study”+ 0.010”articles”+ 0.009”technologies”+ 0.009”technology”+ 0.007”organisations”+ 0.007”building”
130.026”bim”+ 0.022”project”+ 0.019”design”+ 0.015”management”+ 0.014”industry”+ 0.013”projects”+ 0.010”process”+ 0.009”review”+ 0.008”implementation”+ 0.007”time”
140.041”data”+ 0.023”engineering”+ 0.021”management”+ 0.016”power”+ 0.015”twin”+ 0.014”systems”+ 0.010”process”+ 0.010”maintenance”+ 0.009”production”+ 0.009”model”
150.017”bim”+ 0.015”innovation”+ 0.012”technology”+ 0.012”model”+ 0.011”design”+ 0.010”management”+ 0.010”data”+ 0.009”capability”+ 0.009”level”+ 0.008”processes”
160.017”reading”+ 0.015”organizations”+ 0.012”college”+ 0.012”resources”+ 0.011”project”+ 0.010”dp”+ 0.010”process”+ 0.009”study”+ 0.009”application”+ 0.008”libraries”
170.055”bim”+ 0.035”adoption”+ 0.017”model”+ 0.011”behavior”+ 0.011”study”+ 0.011”users”+ 0.009”environment”+ 0.008”technology”+ 0.007”companies”+ 0.007”project”
180.030”barriers”+ 0.015”model”+ 0.013”data”+ 0.012”industry”+ 0.011”smces”+ 0.011”process”+ 0.009”opinions”+ 0.009”experts”+ 0.009”structure”+ 0.009”enterprises”
Table A2. LDA Topic Analysis Results (K = 6).
TopicTop 10 Feature Terms and Their Weights
10.014”barriers”+ 0.009”process”+ 0.009”smces”+ 0.008”performance”+ 0.008”industry”+ 0.008”opinions”+ 0.007”document”+ 0.007”review”+ 0.007”model”+ 0.006”ic”
20.026”bim”+ 0.017”data”+ 0.013”industry”+ 0.012”project”+ 0.010”management”+ 0.009”design”+ 0.009”barriers”+ 0.008”level”+ 0.008”technologies”+ 0.007”adoption”
30.029”data”+ 0.015”process”+ 0.011”model”+ 0.008”time”+ 0.006”platform”+ 0.005”twin”+ 0.005”maintenance”+ 0.005”models”+ 0.005”communication”+ 0.005”paper”
40.024”data”+ 0.017”model”+ 0.016”design”+ 0.008”study”+ 0.008”process”+ 0.006”technology”+ 0.005”analysis”+ 0.005”assessment”+ 0.005”models”+ 0.004”knowledge”
50.022”industry”+ 0.016”technology”+ 0.014”innovation”+ 0.014”project”+ 0.013”management”+ 0.012”data”+ 0.009”technologies”+ 0.008”development”+ 0.008”process”+ 0.008”study”
60.025”data”+ 0.016”technology”+ 0.016”model”+ 0.014”management”+ 0.013”industry”+ 0.012”bim”+ 0.012”building”+ 0.011”twin”+ 0.011”process”+ 0.010”development”
Table A3. LDA Topic Analysis Results (K = 5).
TopicTop 10 Feature Terms and Their Weights
10.039”data”+ 0.013”management”+ 0.012”industry”+ 0.012”model”+ 0.010”project”+ 0.010”process”+ 0.006”study”+ 0.006”technology”+ 0.005”time”+ 0.005”leadership”
20.018”innovation”+ 0.009”management”+ 0.009”industry+ 0.009”model”+ 0.009”technology”+ 0.009”development”+ 0.009”business”+ 0.008”process”+ 0.008”enterprises”+ 0.008”data”
30.017”technology”+ 0.016”design”+ 0.014”project”+ 0.014”industry”+ 0.012”data”+ 0.012”bim”+ 0.011”development”+ 0.009”model”+ 0.008”management”+ 0.007”environment”
40.012”data”+ 0.011”technologies”+ 0.011”technology”+ 0.010”industry”+ 0.010”design”+ 0.010”management”+ 0.008”process”+ 0.007”power”+ 0.007”analysis”+ 0.007”study”
50.027”bim”+ 0.018”industry”+ 0.014”barriers”+ 0.011”data”+ 0.010”model”+ 0.010”technology”+ 0.010”process”+ 0.009”adoption”+ 0.009”project”+ 0.008”study”

References

  1. Cruzara, G.; Sandri, E.C.; Cherobim, A.P.M.S.; Frega, J.R. The Value at The Industry 4.0 and the Digital Transformation Process: Evidence from Brazilian Small Enterprises. Rev. Gest. Tecnol. 2021, 21, 117–141. [Google Scholar] [CrossRef]
  2. Samuelson, O.; Stehn, L. Digital Transformation in Construction—A Review. J. Inf. Technol. Constr. 2023, 28, 385–404. [Google Scholar] [CrossRef]
  3. Rinchen, S.; Banihashemi, S.; Alkilani, S. Driving digital transformation in construction: Strategic insights into building information modelling adoption in developing countries. Proj. Leadersh. Soc. 2024, 5, 100138. [Google Scholar] [CrossRef]
  4. Han, Y.H.; Du, H.Y.; Zhao, C.Y. Development of a digital transformation maturity model for the construction industry. Eng. Constr. Archit. Manag. 2025, 32, 4384–4412. [Google Scholar] [CrossRef]
  5. Chen, M.Y.; Martins, T.S.; Zhang, L.H.; Dong, H. Digital Transformation in Project Management: A Systematic Review and Research Agenda. Systems 2025, 13, 625. [Google Scholar] [CrossRef]
  6. Albasyouni, W.; Kamara, J.; Heidrich, O. Key Challenges and Opportunities to Improve Risk Assessments in the Construction Industry. Buildings 2025, 15, 1832. [Google Scholar] [CrossRef]
  7. Zhu, H.W.; Wang, L.; Li, C.; Philbin, S.P.; Li, H.J.; Li, H.; Skitmore, M. Building a Digital Transformation Maturity Evaluation Model for Construction Enterprises Based on the Analytic Hierarchy Process and Decision-Making Trial and Evaluation Laboratory Method. Buildings 2024, 14, 91. [Google Scholar] [CrossRef]
  8. Li, T.Z.H.; You, J.X.; Aktas, E.; Dong, Y.X.; Yang, M.Y. Risk assessment for digital transformation projects in construction Enterprises: An enhanced FMEA model. Expert Syst. Appl. 2025, 274, 126991. [Google Scholar] [CrossRef]
  9. Naji, K.K.; Gunduz, M.; Alhenzab, F.; Al-Hababi, H.; Al-Qahtani, A. Assessing the Digital Transformation Readiness of the Construction Industry Utilizing the Delphi Method. Buildings 2024, 14, 601. [Google Scholar] [CrossRef]
  10. Liu, H.H.; Yu, H.; Zhou, H.M.; Zhang, X.T. Research on the Influencing Factors of Construction Enterprises’ Digital Transformation Based on DEMATEL-TAISM. Sustainability 2023, 15, 9251. [Google Scholar] [CrossRef]
  11. Naji, K.K.; Gunduz, M.; Alhenzab, F.H.; Al-Hababi, H.; Al-Qahtani, A.H. A Systematic Review of the Digital Transformation of the Building Construction Industry. IEEE Access 2024, 12, 31461–31487. [Google Scholar] [CrossRef]
  12. Zhang, Y.G.; Wang, W.S.; Mi, L.Y.; Liu, Y.; Qiao, L.J.; Ni, G.D.; Wang, X.Y. Deconstructing the organizational resilience of construction firms in major emergencies: A text mining analysis of listed construction companies in China. Int. J. Disaster Risk Reduct. 2024, 106, 104473. [Google Scholar] [CrossRef]
  13. Honghong, S.; Gang, Y.; Haijiang, L.; Tian, Z.; Annan, J. Digital twin enhanced BIM to shape full life cycle digital transformation for bridge engineering. Autom. Constr. 2023, 147, 104736. [Google Scholar] [CrossRef]
  14. Matos, B.C.; Cruz, C.O.; Branco, F.B. Digitalization and Procurement in Construction Projects: An Integrated Bim-Based Approach. J. Inf. Technol. Constr. 2024, 29, 400–423. [Google Scholar] [CrossRef]
  15. Yao, D.C.; de Soto, B.G. Assessing cyber risks in construction projects: A machine learning-centric approach. Dev. Built Environ. 2024, 20, 100570. [Google Scholar] [CrossRef]
  16. Zhang, N.; Ye, J.L.; Zhong, Y.; Chen, Z.Q. Digital Transformation in the Chinese Construction Industry: Status, Barriers, and Impact. Buildings 2023, 13, 1092. [Google Scholar] [CrossRef]
  17. Maria Gabriella Teixeira, L.; Thaís de Melo, C.; Luis Felipe, C.; José de Paula, B.N. Digital Transformation in the Construction Industry: Lessons and Challenges from the Journey of Brazilian Construction Companies. Sustainability 2026, 18, 407. [Google Scholar]
  18. Nyqvist, R.; Peltokorpi, A.; Lavikka, R.; Ainamo, A. Building the digital age: Management of digital transformation in the construction industry. Constr. Manag. Econ. 2025, 43, 262–283. [Google Scholar] [CrossRef]
  19. Daniel, E.I.; Oshodi, O.S.; Nwankwo, N.; Emuze, F.A.; Chinyio, E. Barriers to the Application of Digital Technologies in Construction Health and Safety: A Systematic Review. Buildings 2024, 14, 2386. [Google Scholar] [CrossRef]
  20. Alquraish, M. Digital Transformation, Supply Chain Resilience, and Sustainability: A Comprehensive Review with Implications for Saudi Arabian Manufacturing. Sustainability 2025, 17, 4495. [Google Scholar] [CrossRef]
  21. Han, Z.H.; Wang, Z.T. Digitalization and supply chain finance risk: Evidence from listed firms in the construction industry. Financ. Res. Lett. 2025, 74, 106726. [Google Scholar] [CrossRef]
  22. Li, J.T.; Yuan, P.Z.; Liang, L.L.; Cao, J.F. Enhancing Supply Chain Resilience in Prefabricated Buildings: The Role of Blockchain Technology in Volatile, Uncertain, Complex, and Ambiguous Environments. Buildings 2024, 14, 3006. [Google Scholar] [CrossRef]
  23. Qadir, S.; Alawag, A.M.; Baarimah, A.O.; Zia, N.; Alajmi, M.; Almujibah, H.R.; Alyami, H. The role of digital technologies in enhancing construction project management. Sci. Rep. 2025, 16, 1486. [Google Scholar] [CrossRef]
  24. Thirumal, S.; Udawatta, N.; Karunasena, G.; Al-Ameri, R. Barriers to Adopting Digital Technologies to Implement Circular Economy Practices in the Construction Industry: A Systematic Literature Review. Sustainability 2024, 16, 3185. [Google Scholar] [CrossRef]
  25. Vansteen, J.F.J. A Perspective on Structured Expert Judgment. J. Hazard. Mater. 1992, 29, 365–385. [Google Scholar] [CrossRef]
  26. Kiral, I.A. Contextual Evaluation of Risk Identification Techniques for Construction Projects: Comparative Insights and a Decision-Support Model. Buildings 2025, 15, 3806. [Google Scholar] [CrossRef]
  27. Rae, A.; Alexander, R. Forecasts or fortune-telling: When are expert judgements of safety risk valid? Saf. Sci. 2017, 99, 156–165. [Google Scholar] [CrossRef]
  28. Kwon, K.; Kang, M.; Shin, Y.J.; Ahn, B.; Choi, H. An interpretable framework for risk management in TBM excavation using expert elicitation integrated with fuzzy set theory. Sci. Rep. 2025, 15, 23030. [Google Scholar] [CrossRef] [PubMed]
  29. Colson, A.R.; Cooke, R.M. Expert Elicitation: Using the Classical Model to Validate Experts’ Judgments. Rev. Environ. Econ. Policy 2018, 12, 113–132. [Google Scholar] [CrossRef]
  30. Hubbart, J.A. Organizational Change: Considering Truth and Buy-In. Adm. Sci. 2023, 13, 3. [Google Scholar] [CrossRef]
  31. Stander, H.M.; Cohen, B.; Harrison, S.T.L.; Broadhurst, J.L. Validity of using expert judgements to inform multiple criteria decision analysis: Selecting technologies for sulfide-enriched fine coal waste reuse. J. Clean. Prod. 2023, 415, 137671. [Google Scholar] [CrossRef]
  32. Sentia, P.D.; Shukor, S.A.; Wahab, A.N.A.; Mukhtar, M. Risk identification in humanitarian food logistics using a hybrid literature search strategy and expert judgment. Ann. Oper. Res. 2025, 352, 217–250. [Google Scholar] [CrossRef]
  33. Harris, W.; Sadok, M. How do professionals assess security risks in practice? An exploratory study. Secur. J. 2024, 37, 671–685. [Google Scholar] [CrossRef]
  34. Xu, Y.Y.; Reniers, G.; Yang, M. A Multidisciplinary Review into the Evolution of Risk Concepts and Their Assessment Methods. Processes 2024, 12, 2449. [Google Scholar] [CrossRef]
  35. Aven, T.; Renn, O. Risk Characterization and Evaluation; Springer: Berlin/Heidelberg, Germany, 2010. [Google Scholar]
  36. Kountur, R.; Sari, M.R. Risk identification approaches and the number of risks identified: The use of work breakdown structure and business process. Hum. Soc. Sci. Commun. 2023, 10, 588. [Google Scholar] [CrossRef]
  37. Pregnolato, M.; West, C.; Evans, B.; Lam, M.Y.; Chen, A.; Ahmadian, R.; Djordjevic, S. Using multi-stakeholder causal mapping to explore priorities for infrastructure resilience to flooding. Int. J. Disaster Risk Reduct. 2024, 101, 104189. [Google Scholar] [CrossRef]
  38. Qu, X.T.; Wang, C.B.; Zhao, R.J.; Fang, M.X.; Xie, X.L. Multi-source data-driven Bayesian network for risk analysis of maritime accidents in the high sea. Front. Mar. Sci. 2025, 12, 1631650. [Google Scholar] [CrossRef]
  39. Blei, D.M.; Ng, A.Y.; Jordan, M.I. Latent Dirichlet Allocation. J. Mach. Learn. Res. 2003, 3, 993–1022. [Google Scholar]
  40. Zhou, C.; Li, N.; Zhang, C.; Yang, X. Evaluation of Text Semantic Features using Latent Dirichlet Allocation Model. IEEE Access 2018, 16, 45742–45749. [Google Scholar]
  41. Choi, H.S.; Lee, W.S.; Sohn, S.Y. Analyzing research trends in personal information privacy using topic modeling. Comput. Secur. 2017, 67, 244–253. [Google Scholar] [CrossRef]
  42. Tang, G.; Müller, M.; Gonzales, A.R.; Sennrich, R. Why Self-Attention? A Targeted Evaluation of Neural Machine Translation Architectures. In Proceedings of the 2018 Conference on Empirical Methods in Natural Language Processing, Brussels, Belgium, 31 October–4 November 2018; pp. 4263–4272. [Google Scholar]
  43. Dumais, S. Data-driven approaches to information access. Commun. ACM 2010, 53, 72–82. [Google Scholar]
  44. Li, J.; Yang, M.; Liu, C.; Li, A.; Guo, B. Listen to the Companies: Exploring BIM Job Competency Requirements by Text Mining of Recruitment Information in China. J. Constr. Eng. Manag. 2023, 149, 04023076. [Google Scholar] [CrossRef]
  45. Gioia, D.A.; Corley, K.G.; Hamilton, A.L. Seeking qualitative rigor in inductive research: Notes on the Gioia methodology. Organ. Res. Methods 2013, 16, 15–31. [Google Scholar] [CrossRef]
  46. Magnani, G.; Gioia, D. Using the Gioia Methodology in international business and entrepreneurship research. Int. Bus. Rev. 2023, 32, 102097. [Google Scholar] [CrossRef]
  47. Wang, T.G.; Chen, H.M. Integration of building information modeling and project management in construction project life cycle. Autom. Constr. 2023, 150, 104832. [Google Scholar] [CrossRef]
  48. Zhang, S.; Tang, Y.C.; Zou, Y.Q.; Yang, H.; Chen, Y.F.; Liang, J. Optimization of architectural design and construction with integrated BIM and PLM methodologies. Sci. Rep. 2024, 14, 26153. [Google Scholar] [CrossRef] [PubMed]
  49. Alsehaimi, A.; Waqar, A.; Alrasheed, K.A.; Bageis, A.S.; Almujibah, H.; Benjeddou, O.; Khan, A.M. Building a sustainable future: BIM’s role in construction, logistics, and supply chain management. Ain Shams Eng. J. 2024, 15, 103103. [Google Scholar] [CrossRef]
  50. Radman, K.; Jelodar, M.B.; Lovreglio, R.; Ghazizadeh, E.; Wilkinson, S. Real-Time tracking and analysis in construction projects: A RealCONs framework. Adv. Eng. Inform. 2025, 67, 103511. [Google Scholar] [CrossRef]
  51. Revolti, A.; Gualtieri, L.; Pauwels, P.; Dallasega, P. From building information modeling to construction digital twin: A conceptual framework. Prod. Manuf. Res. 2024, 12, 2387679. [Google Scholar] [CrossRef]
  52. Tita, E.E.; Watanabe, G.; Shao, P.L.; Arii, K. Development and Application of Digital Twin-BIM Technology for Bridge Management. Appl. Sci. 2023, 13, 7435. [Google Scholar] [CrossRef]
  53. Tuhaise, V.V.; Tah, J.H.M.; Abanda, F.H. Technologies for digital twin applications in construction. Autom. Constr. 2023, 152, 104931. [Google Scholar] [CrossRef]
  54. Saif, W.; Razavialavi, S.; Kassem, M. Construction digital twin: A taxonomy and analysis of the application-technology-data triad. Autom. Constr. 2024, 167, 105715. [Google Scholar] [CrossRef]
  55. Gledson, B.; Zulu, S.L.; Saad, A.M.; Ponton, H. Digital leadership framework to support firm-level digital transformations for Construction 4.0. Constr. Innov. 2024, 24, 341–364. [Google Scholar] [CrossRef]
  56. Chen, Z.S.; Lu, J.Y.; Wang, X.J.; Pedrycz, W. Identifying Digital Transformation Barriers in Small and Medium-Sized Construction Enterprises: A Multi-criteria Perspective. J. Knowl. Econ. 2024, 37, 15959–15995. [Google Scholar] [CrossRef]
  57. Omotayo, T.; Tanyer, A.M.; Deng, J.M.; Kaima, A.; Akponeware, A.; Pekericli, M.K.; Shikder, S.; Ogunnusi, M. Advancing AI-Powered BIM for Circularity in Construction in the UK and Turkiye: State-of-the-Art Review and Capability Maturity Modelling. Buildings 2025, 15, 1224. [Google Scholar] [CrossRef]
  58. Yang, Y.M.; Zhang, S.J.; Hua, Y.Y.; Wang, H. Mapping the digital transformation of AEC industry: Content analysis of digital public policy in China. Dev. Built Environ. 2025, 21, 100621. [Google Scholar] [CrossRef]
  59. Shojaei, R.S.; Burgess, G. Non-technical inhibitors: Exploring the adoption of digital innovation in the UK construction industry. Technol. Forecast. Soc. Change 2022, 185, 122036. [Google Scholar] [CrossRef]
  60. Biswas, H.K.; Sim, T.Y.; Lau, S.L. Impact of Building Information Modelling and Advanced Technologies in the AEC Industry: A Contemporary Review and Future Directions. J. Build. Eng. 2024, 82, 108165. [Google Scholar] [CrossRef]
  61. Sompolgrunk, A.; Banihashemi, S.; Golzad, H.; Nguyen, K.L. Strategic alignment of BIM and big data through systematic analysis and model development. Autom. Constr. 2024, 168, 105801. [Google Scholar] [CrossRef]
  62. Zhang, B.B.; Mei, Y.; Xiong, Y.X.; Liu, Y. Can Digital Transformation Promote Service Innovation Performance of Construction Enterprises? The Mediating Role of Dual Innovation. Sustainability 2024, 16, 1176. [Google Scholar] [CrossRef]
  63. Zhu, Z.H.; Ning, S.Y. Corporate digital transformation and strategic investments of construction industry in China. Heliyon 2023, 9, e17879. [Google Scholar] [CrossRef]
  64. Jiang, Y.S.; Su, S.M.; Zhao, S.X.; Zhong, R.Y.; Qiu, W.S.; Skibniewski, M.J.; Brilakis, I.; Huang, G.Q. Digital twin-enabled synchronized construction management: A roadmap from construction 4.0 towards future prospect. Dev. Built Environ. 2024, 19, 100512. [Google Scholar] [CrossRef]
  65. Li, L.; Yi, Z.W.; Jiang, F.Z.; Zhang, S.X.; Zhou, J. Exploring the mechanism of digital transformation empowering green innovation in construction enterprises. Dev. Built Environ. 2023, 15, 100199. [Google Scholar] [CrossRef]
  66. Dauda, J.A.; Chavan, N.N.; Saka, A.B.; Ajayi, S.O.; Oyegoke, A.S. An appraisal of barriers to digitalisation of construction industry in developing countries: Perspective from India. Int. J. Constr. Manag. 2025, 25, 770–782. [Google Scholar] [CrossRef]
  67. Ershadi, M.; Lijauco, F. A framework for digitalizing construction businesses: Drivers, barriers and outcomes. Smart Sustain. Built Environ. 2024, 36, 120–155. [Google Scholar] [CrossRef]
  68. Osorio-Gómez, C.C.; Herrera, R.F.; Prieto-Osorio, J.M.; Pellicer, E. Conceptual model for implementation of digital transformation and organizational structure in the construction sector. Ain Shams Eng. J. 2024, 15, 102749. [Google Scholar] [CrossRef]
  69. Wang, K.Y.; Guo, F.Y.; Zhang, C.; Schaefer, D. From Industry 4.0 to Construction 4.0: Barriers to the digital transformation of engineering and construction sectors. Eng. Constr. Archit. Manag. 2024, 31, 136–158. [Google Scholar] [CrossRef]
  70. Sajjad, M.; Hu, A.F.; Radu, D.; Waqar, A.; Almujibah, H.R.; Mateen, A. BIM implementation in project management practices for sustainable development: Partial Least square approach. Ain Shams Eng. J. 2024, 15, 103048. [Google Scholar] [CrossRef]
  71. Zhou, D.; Pei, B.D.; Li, X.Q.; Jiang, D.; Wen, L. Innovative BIM technology application in the construction management of highway. Sci. Rep. 2024, 14, 15298. [Google Scholar] [CrossRef] [PubMed]
  72. Ghaffarianhoseini, A.; Tookey, J.; Ghaffarianhoseini, A.; Naismith, N.; Azhar, S.; Efimova, O.; Raahemifar, K. Building Information Modelling (BIM) uptake: Clear benefits, understanding its implementation, risks and challenges. Renew. Sustain. Energy Rev. 2017, 75, 1046–1053. [Google Scholar] [CrossRef]
  73. Asare, K.A.B.; Liu, R.; Anumba, C.J.; Issa, R.R.A. Real-world prototyping and evaluation of digital twins for predictive facility maintenance. J. Build. Eng. 2024, 97, 110890. [Google Scholar] [CrossRef]
  74. Yilmaz, G.; Akcamete, A.; Demirors, O. BIM-CAREM: Assessing the BIM capabilities of design, construction and facilities management processes in the construction industry. Comput. Ind. 2023, 147, 103861. [Google Scholar] [CrossRef]
  75. Rangasamy, V.; Yang, J.B. The convergence of BIM, AI and IoT: Reshaping the future of prefabricated construction. J. Build. Eng. 2024, 84, 108606. [Google Scholar] [CrossRef]
  76. Ulhaq, I.; Maqsood, T.; Khalfan, M.; Le, T.D.; Rauf, A. Investigating Stakeholder Perspectives on the Knowledge Management of Construction Projects: A Case Study of the Vietnamese Construction Industry. Buildings 2023, 13, 2745. [Google Scholar] [CrossRef]
  77. Alnajjar, O.; Atencio, E.; Turmo, J. A Systematic Review of Lean Construction, BIM and Emerging Technologies Integration: Identifying Key Tools. Buildings 2025, 15, 2884. [Google Scholar] [CrossRef]
  78. Wang, J.P.; Li, C.Y.; Wu, J.Y.; Zhou, G.X. Research on the Adoption Behavior Mechanism of BIM from the Perspective of Owners: An Integrated Model of TPB and TAM. Buildings 2023, 13, 1745. [Google Scholar] [CrossRef]
  79. Tran, T.V.; Tran, H.V.V.; Nguyen, T.A. A Review of Challenges and Opportunities in BIM Adoption for Construction Project Management. Eng. J. 2024, 28, 79–98. [Google Scholar] [CrossRef]
  80. Haji, M.D.; Behnam, B.; Sebt, M.H.; Ardeshir, A.; Katooziani, A. BIM-Based Safety Leading Indicators Measurement Tool for Construction Sites. Int. J. Civ. Eng. 2023, 21, 265–282. [Google Scholar] [CrossRef]
  81. Hu, X.; Assaad, R.H. A BIM-enabled digital twin framework for real-time indoor environment monitoring and visualization by integrating autonomous robotics, LiDAR-based 3D mobile mapping, IoT sensing, and indoor positioning technologies. J. Build. Eng. 2024, 86, 108901. [Google Scholar] [CrossRef]
  82. Li, H.; Han, Z.J.; Zhang, J.X.; Philbin, S.P.; Liu, D.; Ke, Y.J. Systematic Identification of the Influencing Factors for the Digital Transformation of the Construction Industry Based on LDA-DEMATEL-ANP. Buildings 2022, 12, 1409. [Google Scholar] [CrossRef]
  83. Drazin, R. The processes of technological innovation. Strateg. Manag. J. 1981, 16, 45–46. [Google Scholar] [CrossRef]
  84. Barney, J. Firm resources and sustained competitive advantage. J. Manag. 1991, 17, 99–120. [Google Scholar] [CrossRef]
  85. Davis, F.D. Perceived Usefulness, Perceived Ease of Use and User Acceptance of Information Technology. MIS Q. 1989, 13, 319–340. [Google Scholar] [CrossRef]
  86. Venkatesh, V.; Bala, H. Technology acceptance model 3 and a research agenda on interventions. Decis. Sci. 2008, 39, 273–315. [Google Scholar] [CrossRef]
  87. Scholten, K.; Stevenson, M.; van Donk, D.P. Dealing with the unpredictable: Supply chain resilience. Int. J. Oper. Prod. Manag. 2020, 40, 1–10. [Google Scholar] [CrossRef]
  88. Argyris, C.; Schön, D.A. Organizational Learning: A Theory of Action Perspective; Addison-Wesley: Reading, MA, USA, 1997. [Google Scholar]
  89. Kotter, J.P. Leading Change; Harvard Business School Press: Boston, MA, USA, 1996. [Google Scholar]
  90. Schein, E.H. Organizational Culture and Leadership: A Dynamic View; Jossey-Bass: San Francisco, CA, USA, 1985. [Google Scholar]
  91. Eisenhardt, K.M.; Martin, J.A. Dynamic capabilities: What are they? Strateg. Manag. J. 2000, 21, 1105–1121. [Google Scholar] [CrossRef]
  92. Teece, D.J.; Pisano, G.; Shuen, A. Dynamic capabilities and strategic management. Strateg. Manag. J. 1997, 18, 509–533. [Google Scholar] [CrossRef]
  93. Flynn, B.B.; Huo, B.; Zhao, X. The impact of supply chain integration on performance: A contingency and configuration approach. J. Oper. Manag. 2010, 28, 58–71. [Google Scholar]
  94. Myers, S.C.; Majluf, N.S. Corporate financing and investment decisions when firms have information that investors do not have. J. Financ. Econ. 1984, 13, 187–221. [Google Scholar] [CrossRef]
  95. Jensen, M.C.; Meckling, W.H. Theory of the firm: Managerial behavior, agency costs and ownership structure. J. Financ. Econ. 1976, 3, 305–360. [Google Scholar] [CrossRef]
  96. Becker, G.S. Human Capital: A Theoretical and Empirical Analysis with Special Reference to Education, 3rd ed.; University of Chicago Press: Chicago, IL, USA, 1994. [Google Scholar]
  97. Wright, P.M.; McMahan, G.C. Exploring human capital: Putting ‘human’ back into strategic human resource management. Hum. Resour. Manag. J. 2011, 21, 93–104. [Google Scholar] [CrossRef]
  98. Nelson, R.R.; Winter, S.G. An Evolutionary Theory of Economic Change; Harvard University Press: Cambridge, MA, USA, 1982. [Google Scholar]
  99. Li, Y.C.; Zhao, Q.; Yang, M.S.; Ma, Z.X.; Hei, X.H. Advancements and Applications of Industry Foundation Classes Standards in Engineering: A Comprehensive Review. Buildings 2025, 15, 2927. [Google Scholar] [CrossRef]
  100. Sodeman, W.A. The Rise and Fall of Strategic Planning (Book Review). Acad. Manag. Rev. 1995, 20, 215–218. [Google Scholar]
  101. Galbraith, J.R. Designing Complex Organizations; Addison-Wesley: Reading, MA, USA, 1973. [Google Scholar]
  102. Hammer, M.A.; Champy, J. Reengineering the Corporation: A Manifesto for Business Revolution; Harper Business: New York, NY, USA, 1993. [Google Scholar]
  103. Kolb, D.A. Experiential Learning: Experience as the Source of Learning and Development; Prentice Hall: Englewood Cliffs, NJ, USA, 1983. [Google Scholar]
  104. Kaplan, R.S.; Norton, P.D. The Balanced Scorecard-Measures that Drive Performance. Harv. Bus. Rev. 1992, 70, 71–79. [Google Scholar]
  105. Locke, E.A.; Latham, G.P. Building a practically useful theory of goal setting and task motivation. A 35-year odyssey. Am. Psychol. 2002, 57, 705–717. [Google Scholar] [CrossRef] [PubMed]
  106. Miles, R.E.; Snow, C.C.; Meyer, A.D. Organizational Strategy, Structure, and Process; McGraw-Hill: New York, NY, USA, 1978. [Google Scholar]
  107. Weick, K.E. Sensemaking in Organizations; Sage Publications: Thousand Oaks, CA, USA, 1998. [Google Scholar]
  108. Bailin, S. Creativity in context. In On the Subject of Drama; Routledge: London, UK, 2002; pp. 36–50. [Google Scholar]
  109. Daft, R.L.; Lengel, R.H. Organizational Information Requirements, Media Richness and Structural Design. Manag. Sci. 1986, 32, 554–571. [Google Scholar] [CrossRef]
  110. Lusch, R.F.; Vargo, S.L. Service-dominant logic: Reactions, reflections and refinements. Mark. Theory 2006, 6, 281–288. [Google Scholar] [CrossRef]
  111. Porter, M.E.; Heppelmann, J.E. How Smart, Connected Products Are Transforming Competition. Harv. Bus. Rev. 2014, 92, 64–88. [Google Scholar]
  112. Wang, S. Graph neural network-driven text classification for fire-door defect inspection in pre-completion construction. Sci. Rep. 2025, 15, 44382. [Google Scholar] [CrossRef]
  113. Wang, S.; Moon, S.; Eum, I.; Hwang, D.; Kim, J. A text dataset of fire door defects for pre-delivery inspections of apartments during the construction stage. Data Brief 2025, 60, 111536. [Google Scholar] [CrossRef]
Figure 1. Framework of the LDA–Gioia hybrid model for risk identification and system construction. The framework outlines a four-stage process comprising data acquisition, data preprocessing, topic modelling, and inductive coding. LDA is employed to extract latent semantic patterns from the literature, while the Gioia methodology is used to inductively structure these patterns into a hierarchical risk indicator system.
Buildings 16 00647 g001
Figure 2. Literature Screening Flowchart Based on the PRISMA Method. The flowchart summarizes the systematic literature identification, screening, and eligibility assessment process used to construct the final corpus for topic modelling and inductive analysis.
Buildings 16 00647 g002
Figure 3. Perplexity evaluation of LDA models under different topic numbers. The figure shows how model perplexity varies with the number of topics. Perplexity is used as a quantitative reference to assess model fit.
Buildings 16 00647 g003
Figure 4. Coherence evaluation of LDA models under different topic numbers. The figure presents coherence scores for different topic configurations, reflecting the semantic interpretability and internal consistency of topics.
Buildings 16 00647 g004
Figure 5. LDA inter-topic distance visualization based on multidimensional scaling (K = 18). Each circle represents a topic identified by the LDA model, with circle size indicating the relative topic weight. The distances between circles reflect semantic similarity between topics based on overall term distributions rather than individual word overlap. The visualization is used to assess topic separation and to support the selection of an appropriate topic configuration for subsequent inductive analysis.
Buildings 16 00647 g005
Figure 6. LDA inter-topic distance visualization based on multidimensional scaling (K = 6). Each circle represents a topic identified by the LDA model, with circle size indicating the relative topic weight. The distances between circles reflect semantic similarity between topics based on overall term distributions rather than individual word overlap. The visualization is used to assess topic separation and to support the selection of an appropriate topic configuration for subsequent inductive analysis.
Buildings 16 00647 g006
Figure 7. LDA inter-topic distance visualization based on multidimensional scaling (K = 5). Each circle represents a topic identified by the LDA model, with circle size indicating the relative topic weight. The distances between circles reflect semantic similarity between topics based on overall term distributions rather than individual word overlap. The visualization is used to assess topic separation and to support the selection of an appropriate topic configuration for subsequent inductive analysis.
Buildings 16 00647 g007
Figure 8. Inductive coding results based on the hybrid LDA–Gioia framework. The figure illustrates the three-tier coding structure, in which LDA-derived topic terms are treated as first-order concepts and are inductively abstracted into second-order themes and aggregate dimensions. The resulting structure captures key structural domains of digital transformation risk and forms the basis of the proposed hierarchical risk indicator system.
Buildings 16 00647 g008
Table 1. Search Strategies in Different Literature Databases.
DatabasesSearch Strategy CodesNumber of
Publications
Scopus(TITLE-ABS-KEY (“construction” OR “architecture” OR “building”) AND TITLE-ABS-KEY (“digital transformation” OR “digitalisation”) AND TITLE-ABS-KEY (“risk”)) AND (LIMIT-TO (DOCTYPE, “ar”) OR LIMIT-TO (DOCTYPE, “cp”) OR LIMIT-TO (DOCTYPE, “re”) OR LIMIT-TO (DOCTYPE, “cr”))922
WOS(TS = (“construction” OR “architecture” OR “building”) AND TS = (“digital transfor-mation” OR “digitalisation”) AND TS = (“risk”))151
The table summarises the keyword combinations and search logic used in each database to construct the literature corpus for topic modelling and inductive analysis.
Table 2. LDA-derived topics with representative keywords and example references.
TopicRepresentative Keywords (Top Terms)Example
References
Topic 1process, project, model, data, city, architects, transportation, design, management, software[3,47,48]
Topic 2data design, logistics tracking, partners, project tags, activities[49,50]
Topic 3architectural design, models, planning, technical parameters[51,52]
Topic 4data analysis, BIM, industry management, digital twins[53,54]
Topic 5leadership, industry research, technology, data management[23,55]
Topic 6industry models, data barriers, SMEs, processes, expert opinions[56,57]
Topic 7data, BIM, technology policies, industry analysis, development[58,59]
Topic 8design knowledge, performance, engineering structures, resources, organisation[60,61]
Topic 9data, industry technologies, management, enterprise innovation, development[62,63]
Topic 10enterprises, industries, business, technology development, management capabilities[64,65]
Topic 11data, industry projects, technological barriers, management frameworks, implementation[66,67]
Topic 12industrial risks, digitalisation, models, research, technology[68,69]
Topic 13BIM, project management, design, implementation, evaluation[70,71]
Topic 14data engineering, management, power systems, maintenance, production models[72,73]
Topic 15BIM, innovative technologies, model design, management capabilities[74,75]
Topic 16knowledge, organisation, academic resources, projects, library applications[76,77]
Topic 17BIM adoption, user behaviour, environment, corporate projects[78,79]
Topic 18evaluation models, safety, real-time monitoring, BIM, performance, regulation[80,81]
The table presents the primary semantic outputs of the LDA model. Each topic is characterised by high-probability keywords and representative publications, and is not interpreted as a final risk category. These LDA-derived topics serve as first-order semantic inputs for subsequent inductive coding and hierarchical risk structuring.
Table 3. Hierarchical Risk Indicator System for Digital Transformation in Construction Enterprises.
First-Level IndicatorsSecond-Level IndicatorsThird-Level IndicatorsThird-Level Indicators Explanation
ResourcesTangible ResourcesInternal Funding [84]Internal funding capacity for digital infrastructure and platform integration
External Funding [94]External funding dependence under project-based investment cycles
Capital Allocation Method [95]Capital allocation mechanism across multi-project digital initiatives
Intangible ResourcesManagerial Human
Resources [96]
Managerial digital competence in construction enterprises
Employee Human
Resources [97]
Workforce digital capability across project teams
TechnologyTechnological InfrastructureTechnical Compatibility [83]Technical compatibility among heterogeneous construction digital systems
Technology Maturity [98]Maturity of construction-oriented digital technologies
Data
Management
Data Standardization [99]Data standardization across design–construction–operation stages
Degree of Data Assetization [92]Degree of data assetization for project lifecycle management
OrganizationStrategic PlanningStrategic Planning [100]Enterprise-level digital transformation strategy alignment
Coordination Mechanisms [101]Cross-departmental coordination under project-based organizational structures
Process Design [102]Digital process design across fragmented construction functions
Organizational DevelopmentSpecialized Skills Training [103]Targeted digital skills training for construction personnel
Targeted Performance Evaluation [104]Performance evaluation mechanisms supporting digital transformation
Goal Alignment [105]Alignment between digital objectives and project execution goals
EnvironmentMarket EnvironmentMarket Adaptability [106]Market adaptability under industry competition and policy dynamics
Environmental Awareness [107]Sensitivity to external environmental and regulatory changes
Enterprise EnvironmentCorporate Culture [90]Organizational culture supporting digital adoption
Innovation Climate [108]Innovation climate within construction enterprises
Industry ChainIndustry Chain CollaborationIndustry Collaboration [93]Digital collaboration among owners, designers, contractors, and operators
Business Communication [109]Inter-organizational communication via multi-stakeholder digital platforms
Service SupportConsulting Services [110]Availability of specialized digital consulting services
Technical Services [111]Reliability of external technical support for construction digital systems
The table summarizes the hierarchical organization of risk indicators derived from the LDA theme numbers and inductive coding results, reflecting structural risk domains and underlying formation mechanisms.
Disclaimer/Publisher’s Note: The statements, opinions and data contained in all publications are solely those of the individual author(s) and contributor(s) and not of MDPI and/or the editor(s). MDPI and/or the editor(s) disclaim responsibility for any injury to people or property resulting from any ideas, methods, instructions or products referred to in the content.