


Abstract
To address complex connections in prefabricated concrete structures, a novel joint connecting a prefabricated concrete-filled steel tubular column and a composite beam is proposed. Pseudo-static tests on six scaled specimens and ABAQUS finite element analyses were conducted to investigate seismic mechanisms, focusing on slab effects and beam-bottom configurations. Experimental results show the joints exhibit plump hysteretic curves. The composite beams displayed distinct shear-dominated failure, while the stiffened column remained intact. With an average ductility coefficient of 2.84 and an ultimate equivalent viscous damping coefficient of 0.207, the specimens demonstrated excellent deformation and energy dissipation capabilities. The slab’s flange effect significantly enhanced negative bearing capacity, causing mechanical asymmetry. Comparatively, the steel plate beam bottom configuration offered superior stiffness and stability over the reinforcement beam bottom configuration. Sensitivity analysis revealed that bearing capacity is highly sensitive to beam parameters (e.g., longitudinal rebar strength, connector length) but less sensitive to column parameters. Notably, the bearing capacity of the beam bottom configuration using reinforcement increases significantly with concrete strength and reinforcement ratio, whereas the beam bottom configuration using a steel plate shows marked insensitivity to these factors. These findings clarify the load transfer mechanism and support the seismic design of prefabricated structures.
1. Introduction
As a critical pathway to achieving the “dual carbon” goals, prefabricated buildings are profoundly reshaping the construction mode of modern civil engineering due to their significant reduction in construction periods, ability to mitigate environmental loads, and high-precision control in component production [1]. However, in practical engineering applications, single-material systems exhibit inherent limitations in meeting the complex mechanical demands and functional adaptability of modern architecture. Traditional prefabricated concrete (PC) structures often face challenges regarding integrity in high-intensity seismic zones [2,3], while pure steel structures are burdened by high maintenance costs [4,5]. To integrate the advantages of both, the concrete-filled steel tubular (CFST) structure has emerged. By utilizing the external steel tube to provide a confinement effect on the internal core concrete, CFST columns significantly enhance bearing capacity and ductility while possessing excellent fire resistance [6]. With the development of high-strength materials, hybrid frame systems composed of CFST columns and reinforced concrete (RC) beams have demonstrated broad application prospects in strong earthquake fortification zones due to their superior seismic performance [7,8].
For hybrid frames consisting of CFST columns and RC beams, joint connection technology remains a critical bottleneck constraining seismic safety and construction efficiency. An ideal joint should simplify construction while ensuring efficient force transfer. However, as noted by Gao et al. [8], existing hybrid joints generally face a conflict between “mechanical performance” and “construction convenience.” Current connection forms can be primarily categorized into the following three types, each with distinct limitations.
The first category includes joints with stiffening rings and extended corbels. As early classic connection forms, these joints transmit the moment at the beam end primarily through internal/external stiffening rings or welded corbels, offering a clear load transfer path. However, inherent structural defects limit their further application. Research by Parra-Montesinos et al. [9] and Dong et al. [10] points out that external stiffening rings are often bulky, severely encroaching on architectural clearance and interfering with MEP (mechanical, electrical, and plumbing) layouts. Conversely, although internal stiffening rings provide a neat appearance, they require complex welding inside the steel tube, which can easily obstruct the pouring and vibration of the concrete, leading to void defects in the core area. Furthermore, extended corbel joints rely heavily on on-site full-penetration welding, introducing risks of residual stress and brittleness in the heat-affected zone [11,12], while the exposed steel increases costs for subsequent fire and corrosion protection.
To avoid exposed members and improve joint integrity, the second category, through-beam/diaphragm joints, emerged. The through-reinforcement joint proposed by Tang et al. [13] is a representative of this type, achieving continuous force flow by passing rebars or steel plates directly through the steel tubular column. Although this solution resolves architectural clearance issues, it introduces new structural hazards: realizing the penetration requires cutting numerous holes in the column wall, significantly weakening the steel tube section and its effective confinement of the core concrete. A more severe challenge is “rebar congestion.” As emphasized by Gao et al. [8] and Yu et al. [14], the interlacing and collision of bi-directional beam reinforcement within the limited column core not only complicate assembly but also create a dense rebar mesh that severely hinders the flow of coarse aggregates. This is prone to causing invisible quality defects such as honeycombing in the core area, ultimately leading to the degradation of joint shear performance.
Distinct from the aforementioned wet connections, the third category, mechanical connections, aims for extreme construction efficiency. These joints primarily utilize blind bolts [15,16] or end-plate bolts to achieve fully prefabricated connections, gaining attention for their dry operation and rapid installation. However, the reliability of their mechanical performance remains controversial. Numerous tests indicate that such joints typically exhibit semi-rigid behavior; under strong cyclic loading, sliding at the seams often results in insufficient energy dissipation capacity. Moreover, this technology demands extremely high precision in component fabrication, and the risk of performance degradation of high-strength bolts under high temperatures in fires limits their widespread application at the bottom of high-rise buildings.
In summary, despite extensive exploration, existing hybrid joint solutions still face challenges in balancing “structural reliability” and “construction convenience.” More importantly, a critical review of existing literature reveals two key knowledge gaps limiting the precise evaluation and promotion of current technologies. First, existing research on the seismic performance of hybrid joints is generally based on the assumption of planar frames, ignoring the synergistic effect of cast-in-place slabs. Most experimental studies (e.g., Tang et al. [13] and Gao et al. [8]) employed simplified cruciform bare frame specimens without slabs for loading. However, in actual monolithic prefabricated frames, the longitudinal reinforcement in the slab acts as an effective flange for the beam under negative moments, significantly increasing bearing capacity. Artificially ignoring this effect leads to an underestimation of the actual beam capacity, potentially triggering a brittle “strong-beam weak-column” failure under strong earthquakes. Second, there is a lack of in-depth mechanism research on effective mitigation measures for the aforementioned rebar congestion in the core area. Although replacing dense reinforcement with embedded steel profile connectors is considered a highly promising solution, the introduction of steel profiles alters the joint’s stiffness distribution. Currently, there is a lack of systematic quantitative evaluation and comparative analysis regarding the damage evolution laws of such configurations under complex cyclic loads, particularly concerning performance differences and shear transfer mechanisms between different beam bottom details (i.e., comparing reinforcement connections vs. steel plate connections).
Addressing the contradiction between structural reliability and construction convenience in existing technologies, this study proposes a novel prefabricated square CFST column-composite beam connection joint based on an embedded I-beam connector. This configuration utilizes the embedded connector in conjunction with optimized beam bottom connection forms (using either reinforcement or a steel plate), aiming to eliminate rebar collision hazards and enhance assembly efficiency. Distinct from previous studies that ignored slab effects, this paper designed and completed low-cycle reciprocating loading tests on six full-scale specimens. The study focuses on quantifying the impact of the synergistic effect of the cast-in-place slab on the joint yield mechanism and seismic performance, correcting the evaluation bias of traditional bare frame models. Simultaneously, combined with refined finite element analysis (FEA), the damage evolution laws and shear transfer mechanisms in the core area under complex stress states for different beam bottom configurations are deeply revealed.
The remainder of this paper is organized as follows: Section 2 details the novel joint construction, the specimen design scheme (covering variables of different beam bottom forms and the presence/absence of slabs), the experimental loading protocol, and the numerical model construction method. Section 3 analyzes failure modes and hysteretic characteristics based on experimental data, compares the performance differences between the two beam bottom configurations, and dissects the failure characteristics of the composite beam. Section 4 utilizes the validated finite element model to conduct a multi-parameter sensitivity analysis, including axial compression ratio, steel connector length, and reinforcement ratio, to reveal the influence of key design variables on joint bearing capacity and ductility. Section 5 summarizes the conclusions of the full text.
2. Methodology
2.1. Model Experiment
To systematically evaluate the performance of the prefabricated stiffened column and composite beam frame structure, this study designed six groups of scaled joint specimens with different configurations. Quasi-static tests were conducted to simulate their mechanical response under horizontal reversed cyclic loading, aiming to reveal their failure mechanisms and seismic performance characteristics.
2.1.1. Specimen Design
This study takes the intermediate story exterior joint of an actual prefabricated building as the research object to investigate its connection performance, as shown in Figure 1. This type of joint is a critical component for transferring and balancing bending moments and shear forces within the overall frame; its bearing capacity, deformation characteristics, and failure mode directly determine the overall mechanical performance and safety redundancy of the structural system. To deeply reveal its working mechanism under controllable conditions, the experiment adopts a local scaled model. A typical structural region containing the beam and column inflection points and the adjacent slab is intercepted as the specimen to accurately simulate its real response under complex stress states.
Figure 1.
Details of the novel prefabricated system and specimens: (a) Structural schematic and engineering application; (b) Geometric boundary dimensions of the bare frame (top) and the composite frame with slab (bottom); (c) Fabrication details of key components (highlighting the embedded steel connector and the two beam bottom connection forms: reinforcement vs. steel plate); (d) Beam details of specimens JD1–JD6; (e) Column details of specimens. Numbers in Figure (b): Represent dimension data (measurements for height and length). Numbers in Figure (d) (1–6): Represent specimen IDs (identifying different beam test pieces like JD 1 to JD 6). Blue Dashed Boxes: Indicate the beam region (highlighting the beam structure).
Based on a unified basic structural configuration, a total of six specimens were designed to systematically investigate three key variables: the presence or absence of slab participation, the beam bottom configuration (using reinforcement or a steel plate), and the beam concrete strength grade (C30 and C40). For convenience of discussion, the beam bottom configuration using reinforcement is denoted as Type A, and the configuration using a steel plate is denoted as Type B. All specimens feature similar structural configurations, as shown in Figure 1. The CFST column adopts a square cross-section of 200 mm × 200 mm made of Q345B steel, with a wall thickness of 20 mm. The tube is filled with C50 concrete, and the column height is either 2.2 m or 2.9 m. The composite beam has a cross-section of 200 mm × 400 mm. The top longitudinal reinforcement is uniformly configured as 2Φ20 HRB400, and the stirrups are Φ8 HRB400 with a spacing of 100 mm. The beam bottom part consists of 2Φ20 HRB400 reinforcement (Type A) or a steel plate with a width of 130 mm and a thickness of 15 mm (Type B). For specimens containing slabs, the effective width of the slab was determined to be 350 mm according to current relevant design codes, with a thickness of 130 mm. Specific design parameters are summarized in Table 1.
Table 1.
Specimen design parameters.
Specimen fabrication strictly adhered to the standardized prefabricated construction process. First, the prefabrication of square steel tube columns with embedded I-section steel connectors was completed in the factory, where reliable connections between column bodies were achieved using plug-in connections combined with groove welding. Subsequently, the assembly of the beam reinforcement cage or the positioning of the bottom steel plate was completed on-site, and they were integrated with the I-section steel connectors embedded in the column via welding. Finally, formwork was installed, and the beam and slab concrete were poured monolithically to form the complete prefabricated stiffened column and composite beam frame structure specimen.
To ensure the accuracy and reliability of material properties, standardized tests were conducted on all key structural materials in this study. Concrete and steel were sourced from the same production batch. Two strength grades, C30 and C40, were adopted for the beam concrete, with average compressive strengths of and , respectively, obtained from tests on standard cubic specimens. The mechanical properties of the steel were obtained through standard tensile tests, covering the three main types used in the structure: thick Q345B steel plate, HRB400 reinforcement, and HRB400 reinforcement. The mechanical test results are presented in Table 2.
Table 2.
Mechanical properties of structural steels.
2.1.2. Loading Setup and Protocol
A pseudo-static loading method was employed. The loading scheme combined cyclic loading applied to the end of the composite beam with constant axial compression on the column top, aiming to simulate the actual stress state of the frame joint and facilitate observation of the failure process. The test setup is illustrated in Figure 2. The loading system consisted of a reaction wall, hydraulic actuators, load sensors, and specialized hinge supports. The column specimen was installed vertically; its lower end was connected to the rigid base of the strong floor via a spherical hinge support to simulate a pinned column base. The upper end was connected to the reaction wall through a horizontal support system, which restricted horizontal displacement but allowed free vertical movement. A hydraulic jack was connected to the column top via a pressure sensor to apply and maintain the axial load. The beam specimen was arranged as a horizontal cantilever. Its free end was connected to a electro-hydraulic servo actuator via a vertical bidirectional hinge support. The other end of the actuator was anchored to the reaction wall to apply vertical low-cycle reversed loading. All actuators, sensors, and measuring equipment were calibrated before testing to ensure accurate and reliable data.
Figure 2.
Test setup and loading protocol: (a) Schematic of the test rig (showing boundary conditions and actuator arrangement); (b) Load–displacement hybrid control strategy used for cyclic loading (where Δy represents the yield displacement).
The strength grade of the column concrete was C50. The design axial compression ratio was calculated according to the following equation:
where is the design axial force at the column top; and are the cross-sectional areas of the steel tube and core concrete, respectively; and and are the design values of the compressive strength of the steel and concrete, respectively.
The design axial compression ratios for each specimen are shown in Table 3. Considering that the axial compression ratio has a minor influence on ductility for CFST columns under high shear-compression ratios, the actual axial compression ratio in the test was controlled within 0.5 to meet seismic performance requirements.
Table 3.
Design axial compression ratio of specimens.
The test was conducted strictly in accordance with the Chinese standard Specification for Seismic Test of Buildings (JGJ/T 101-2015), adopting a load–displacement hybrid control loading protocol [17]. The loading process was sequentially divided into four stages. First, preloading was performed by applying an axial force of 20–40 kN to the column top and completing one loading-unloading cycle to eliminate initial slack in the setup. Subsequently, the design axial force was applied to the column top in stages and maintained constant.
At the initial stage of the experiment, a force-controlled mode was adopted for the loading end of the composite beam (hereinafter referred to as the beam end). Loading commenced from zero displacement at a rate of 1 kN/s. The displacement increment was set to 2 mm per level, with one cycle per level, until the specimen yielded. When a distinct inflection point appeared on the load–displacement curve or the strain in key reinforcement reached the yield value, the specimen was determined to have yielded. The beam-end yield displacement was recorded, and the test transitioned to the displacement control stage. Thereafter, the displacement amplitude was increased incrementally in integer multiples of , with three cycles per level and a loading rate of approximately , to fully reveal the hysteretic and degradation characteristics of the specimen. The termination criteria for the experiment were: the beam-end load dropping below 85% of the peak load, severe concrete crushing or steel plate buckling occurring in the joint area or beam end, or overall instability of the specimen. After each loading level, the load was held for 2–3 min to systematically observe and record crack development and failure modes. The detailed loading schematic for the beam end is shown in Figure 2.
2.1.3. Measurement Content and Methods
To systematically evaluate the seismic performance of the joint under low-cycle reversed loading, the experiment focused on key response parameters such as load, displacement, deformation, and crack development. The measurement content primarily included beam-end load and displacement, column-top axial force, rotation of the plastic hinge zone, and the crack propagation process.
Beam-end load and displacement data were acquired through the tension-compression jack installed at the beam end and the load sensor connected in parallel. Simultaneously, displacement meters arranged at the free end of the beam (as shown in Figure 2) were used to monitor the displacement of the loading point in real time. Load and displacement signals were synchronously recorded by a 3816 static strain measurement system. The sampling frequency involved continuous collection throughout the process, with stable readings taken during the holding period of each load level. Load–displacement hysteresis curves were plotted for subsequent skeleton curve extraction and ductility analysis.
The axial force at the column top was monitored by a strain-type pressure sensor placed between the hydraulic jack and the steel hinge support. During the test, the variation in axial force was continuously monitored using a static resistance strain gauge, and the oil pressure was adjusted to ensure the axial force remained constant within the design range.
To quantify the rotational capacity of the plastic hinge zone of the composite beam, measurements were based on the principle of average curvature. Curvature is defined as the rotation angle per unit length of the beam axis, which effectively characterizes the bending deformation and plastic development of the cross-section under loading. As shown in Figure 2, displacement meters ① and ②, with a height of , were arranged at the top and bottom of the beam section within a range of 1 to 2 times the beam height from the column face (taken as in the mid-span of the beam in this test). By measuring the compressive deformation at the upper edge and the tensile deformation at the lower edge of the beam during loading, the average curvature of this section can be calculated according to the following equation:
where l is the horizontal distance from the fixed point of the displacement meter to the column face, taken as ; and is the effective height of the beam section plus the installation height of the displacement meters. Specifically, the beam section height was taken as for specimens without slabs and for specimens with slabs. The installation height for each displacement meter was , resulting in a total installation height of .
Crack development was monitored using a combination of visual inspection and instrumental measurement. Loading was paused at the peak point of each loading cycle to record and mark the position, width, and orientation of cracks in the beam, slab, and joint regions using a crack observation instrument. The entire process was tracked via digital photography to qualitatively describe the damage evolution and final failure mode of the components.
The measurement scheme adopted in this experiment aimed to comprehensively capture the mechanical behavior of the joint under reversed loading. All sensors and acquisition equipment were calibrated prior to testing to ensure data accuracy and reliability.
2.1.4. Performance Evaluation Methods
To quantitatively evaluate the bearing capacity, ductility, and energy dissipation performance of the joints under low-cycle reversed loading, this study obtains the hysteresis curves and corresponding skeleton curves based on beam-end load–displacement measurements. Subsequently, the yield point, peak point, and ultimate point are determined to calculate the displacement ductility coefficient and the equivalent viscous damping coefficient and secant stiffness, which serve as the primary evaluation metrics for the subsequent performance analysis.
The yield point, peak point, and ultimate point on the beam-end load–displacement skeleton curve are determined according to the method shown in Figure 3a. For specimens without a distinct yield inflection point, a tangent is drawn from the origin on the skeleton curve to intersect with the horizontal line passing through the peak load point. The displacement corresponding to the intersection is recorded as the yield displacement , identifying this point as the yield point with the corresponding yield load . The point where the load reaches the maximum (or minimum) value on the skeleton curve is the peak point, with the corresponding peak load and peak displacement . When the bearing capacity drops from the peak value to , the corresponding load is defined as the ultimate load , and its displacement is recorded as the ultimate displacement , serving as the effective ultimate deformation of the joint.
Figure 3.
Definition of key performance indicators based on load–displacement behavior: (a) determination of yield, peak, and ultimate points on the skeleton curve; (b) calculation method for equivalent viscous damping and energy dissipation from the hysteresis loop.
Stiffness degradation reflects the reduction in a component’s ability to resist deformation due to accumulated damage under cyclic loading. Given the displacement-controlled loading protocol adopted in this test, the variation in secant stiffness () at each displacement amplitude level was selected to quantitatively evaluate the stiffness degradation behavior of the joints. It is defined as follows:
where is the secant stiffness (kN/m); is the peak load of the -th loading cycle at the -th displacement level; is the peak displacement of the -th loading cycle at the -th displacement level; and is the number of cycles.
Joint ductility () is characterized by the displacement ductility coefficient, defined as the ratio of the ultimate displacement to the yield displacement. This coefficient comprehensively reflects the plastic deformation capacity of different joint structural forms from the yielding stage to the failure stage and is used to evaluate the potential of the connection to develop ductility under strong earthquakes.
The energy dissipation performance of the joint is evaluated by the equivalent viscous damping coefficient . Taking the outer envelope loop of the hysteresis curve as the representative cycle, the total energy dissipation of the cycle (i.e., the actual area enclosed by the complete hysteresis loop, indicated by the red dashed area in Figure 3b) and the elastic energy at the same displacement amplitude (the area of the triangles enclosed by the ascending and descending linear segments of the skeleton curve, indicated by the blue dashed area in Figure 3b) are first calculated. The ratio of the two is defined as the energy dissipation coefficient :
On this basis, the equivalent viscous damping coefficient is calculated according to the following equation:
The equivalent viscous damping coefficient converts the actual energy dissipation of the specimen in one loading cycle into an equivalent viscous damping level, facilitating the comparison and evaluation of the energy dissipation capacity of different joint structural systems.
2.2. Numerical Experiment
To further reveal the performance of the prefabricated stiffened column-composite beam frame joints under different design and loading parameters, and to overcome the limitations of physical experiments regarding the number of test cases and parameter ranges, three-dimensional finite element models corresponding to the specimens were established based on ABAQUS [18]. Numerical simulations were conducted on typical joints to systematically investigate the influence laws of key parameters, including axial compression ratio, reinforcement ratio, material strength, and component dimensions, on the seismic performance of the joints.
2.2.1. Material Constitutive Models
This study employed widely validated constitutive relationships to simulate the mechanical behavior of steel and concrete. For all steel components (Q345B steel tubes and HRB400 reinforcement), an ideal elastic-plastic constitutive model considering a linear hardening stage was adopted. This model simplifies the steel response into two stages: the elastic stage follows Hooke’s Law, and the plastic stage adopts a gentle linear hardening after initial yielding. The elastic modulus of the steel was taken as , the hardening modulus was taken as 1% of the initial value, and Poisson’s ratio was 0.3.
The concrete material utilized the Concrete Damaged Plasticity (CDP) model in ABAQUS 6.14. By introducing independent uniaxial tensile and compressive stress–strain relationships and combining them with continuous damage mechanics variables, the CDP model effectively simulates the key behaviors of concrete under low-cycle reversed loading, including crack initiation and closure, stiffness degradation, and irreversible plastic deformation [19].
For the concrete in the beams and slabs, the uniaxial stress–strain relationships were determined by combining actual material test results. According to the standard cubic specimen compression tests, the average compressive strengths of C30 and C40 concrete were and , respectively. Based on these measured compressive strengths and referring to empirical relationships in the code, the axial tensile strengths of C30 and C40 concrete were taken as and , respectively. The ascending branch of the tensile constitutive model was considered linear elastic, while the descending branch adopted the strain-softening model suggested by the code to reasonably simulate the mechanical behavior of concrete after tensile cracking.
For the core concrete in the CFST columns, the confinement effect of the steel tube significantly enhances its compressive strength and ultimate deformation capacity. To accurately simulate this effect, the uniaxial compressive stress–strain curve of the core concrete adopted a modified model considering confinement, where the peak stress and corresponding strain were enhanced based on the confining stress of the steel tube [20]. The uniaxial tensile behavior of the core concrete was treated as unconfined concrete.
To fully define the CDP model, in addition to the uniaxial constitutive relationships, key parameters controlling plastic flow and the yield surface shape—such as dilation angle, eccentricity, strength ratio, and stress invariant ratio—must be set. The relevant parameters for this model were set based on common recommended values for ordinary and confined concrete found in existing literature [21].
2.2.2. Element Selection and Modeling
To simplify the model and focus on the mechanical behavior of the joint core zone and the beam–column connection, the finite element model in this study did not consider the participation of the slab. Instead, it primarily focused on two distinct structural forms characterized by reinforcement or a steel plate at the bottom of the beam. This is primarily because the influence of the slab on the stress mechanism of the joint core zone is relatively indirect under low-cycle reversed loading. Moreover, existing research and preliminary tests (such as specimens JD1, JD3, and JD5 without slabs) indicate that omitting the slab can more clearly reveal the failure characteristics and load transfer paths at the beam–column interface. This simplification significantly reduces modeling complexity and computational costs, facilitating systematic parametric analysis.
Regarding element selection, considering the substantial wall thickness (20 mm) of the column steel tube, the 8-node linear reduced integration solid element (C3D8R) was employed to discretize both the steel tube and the internal core concrete. This element type is resistant to shear locking under bending and torsion and is insensitive to mesh distortion, making it suitable for simulating elastoplastic large deformation problems. The longitudinal reinforcement, steel plate, and concrete in the composite beam were also modeled using C3D8R solid elements to facilitate the definition of contact relationships at interfaces for simulating bond-slip effects. The hooping in the beam was modeled using 3D truss elements (T3D2) and coupled with the beam concrete via the embedded region constraint (“Embed”). High-strength bolts were modeled using C3D8R solid elements to accurately capture their shear and bearing behavior.
Figure 4 illustrates the finite element models and meshing schemes for the two typical beam–column connection forms established in this study. The left model corresponds to the joint connection configuration with reinforcement at the beam bottom (Type A), while the right model corresponds to the configuration with a steel plate (Type B). The figure displays the overall appearance, internal skeleton structure, and corresponding mesh discretization state of the models, respectively. A structured adaptive meshing method was adopted, with local refinement performed in the joint core area and near the beam longitudinal bars to ensure stress solution accuracy in these critical regions. After global meshing, mesh quality was verified, and necessary refinements were made to ensure computational convergence and result reliability.
Figure 4.
Details of finite element model construction: (a) Boundary conditions and loading schematic of the global model; (b) Perspective view of the internal steel skeleton; (c) Modeling details of the reinforcement specimen (Type A); (d) Modeling details of the steel plate specimen (Type B) (Note: Concrete and steel components are simulated using C3D8R solid elements, and hooping is simulated using T3D2 truss elements).
The boundary conditions were set to be consistent with the experimental setup. A fully fixed constraint (, ) was applied to the column base. The column top was constrained in horizontal displacement and rotation (, ), but the vertical displacement degree of freedom () was released to facilitate the application of axial compression.
Regarding contact settings, “Surface-to-surface contact” was adopted between the steel tube and the core concrete, as well as between the bolts and the steel beam. The normal behavior was defined as “Hard Contact” to prevent penetration, while the tangential behavior employed the Coulomb friction model with a friction coefficient of 0.25. A “Tie” constraint was used for the contact between the beam concrete and the outer wall of the column. The segment of the beam longitudinal reinforcement within the column was embedded using the “Embed” method, while friction contact was defined between the remaining segments and the surrounding concrete to account for potential bond-slip behavior.
For loads and boundary conditions, rigid plates (elastic modulus of ) were set at the column top and beam end, with constraints and loads applied through reference points. The column base was constrained against horizontal displacement and rotation, the column top was restricted from horizontal displacement, and the beam end was constrained against out-of-plane displacement. The loading process consisted of three steps: first, a constant axial force was applied to the column top; subsequently, vertical loads were applied to the beam end in stages under force control until yielding; finally, the process switched to displacement control, with reversed loading applied in increments of 0.5 times the yield displacement until component failure. This setup is consistent with the experimental loading protocol and can effectively simulate the mechanical response of the joint under low-cycle reversed loading.
2.2.3. Numerical Experimental Scheme
To systematically evaluate the performance of prefabricated stiffened column and composite beam frame joints under different design and loading parameters, a systematic parametric analysis was conducted based on the validated finite element model. The analysis focused on two types of joint forms (Type A: with reinforcement at the beam bottom; Type B: with a steel plate at the beam bottom) and investigated the influence of the following seven key parameters: axial compression ratio at the column top, longitudinal reinforcement ratio of the beam, length of the steel connector, beam concrete strength, strength of beam longitudinal reinforcement, wall thickness of the square steel tube column, and thickness of the beam web. The analysis levels for each parameter were set based on the common range in practical engineering and existing experimental foundations. The specific design is shown in Table 4.
Table 4.
Parameter design of the numerical simulation scheme.
The output results of the numerical simulation included load–displacement hysteresis curves, skeleton curves, stress–strain distributions in critical regions, and the damage evolution process. By comparing the bearing capacity, stiffness, ductility, and energy dissipation capacity of joints under different parameter combinations, the influence laws of various design parameters on the seismic performance of the joints were systematically revealed, providing a quantitative basis for subsequent theoretical analysis and the proposal of design methods.
3. Experimental Results
3.1. Experimental Phenomena and Failure Characteristics
Under constant axial force and low-cycle reversed loading, all joint specimens underwent a typical seismic response process, progressing from the elastic stage to the crack development stage, followed by concentrated plastic deformation, and finally failure. Taking specimen JD1 as an example (the loading and failure evolution processes of other specimens were largely similar), the load–displacement relationship was essentially linear during the initial loading phase. No visible cracks were observed on the concrete surfaces of the beam, column, or joint region. Residual displacement after unloading was negligible, indicating that the overall component remained in an elastic state. With increasing load, vertical flexural cracks first appeared in the tension zone of the beam near the column (Figure 5a). Subsequently, diagonal cracks emerged near the end of the embedded steel connector, specifically in the region where the beam bottom contained longitudinal reinforcement or the steel plate. Conversely, no significant diagonal cracks were observed within the range covered by the steel connector due to its high stiffness (Figure 5b). With the cracking of concrete and the loss of tensile contribution from the tension zone, strains in the longitudinal reinforcement and hooping increased rapidly. Consequently, damage concentrated in the beam section between the end of the steel connector and the loading end (hereinafter referred to as the “damage concentration zone”), forming a flexure-shear interaction zone. Under continuous loading, diagonal cracks in this region propagated densely and widened significantly, eventually penetrating the beam depth to form intersecting cracks (Figure 5c). Finally, penetrating “X”-shaped main cracks formed within the damage concentration zone, and the specimen exhibited a shear-dominated failure mode (Figure 5d).
Figure 5.
Typical failure evolution process of the composite beam: (a) Stage I: Initiation of initial cracks at the beam–column interface; (b) Stage II: Propagation of diagonal shear cracks in the damage concentration zone (2Δy); (c) Stage III: Concrete crushing and spalling under peak load (2.5Δy); (d) Stage IV: Final shear-dominated failure mode (Note: Red and black lines represent cracks generated by positive and negative loading, respectively).
Figure 6 illustrates the final failure morphologies of specimens JD1–JD6. As observed, with the exception of JD2, which exhibited primarily flexural failure characterized by a vertical main crack at the column face, all other specimens ultimately developed distinct shear failure characteristics in the beam section between the steel connector end and the loading end. Following the penetration of the main diagonal cracks on both sides of the beam, the concrete cover near the loading end spalled along the inclined section. Concrete in the shear-compression zone was crushed and fell off extensively. The hooping was exposed and partially buckled. In some specimens, the concrete at the beam bottom and sides bulged or even detached, while the bottom longitudinal reinforcement or steel plate was exposed and showed obvious bending deformation. During the shear failure process, as the displacement amplitude increased, the main diagonal cracks expanded rapidly. The aggregate interlock mechanism at the crack interface and the vertical tensile resistance of the hooping degraded gradually, leading to a significant reduction in the shear bearing capacity of the inclined section. This ultimately resulted in a shear failure zone characterized by extensive internal concrete crushing and spalling within the damage concentration zone.
Figure 6.
Final failure modes and damage concentration zones: (a) JD1 (Significant intersecting diagonal cracks and concrete crushing, shear-dominated); (b) JD2 (Vertical main crack at the beam root, flexure-dominated); (c–f) JD3–JD6 (All exhibiting shear-dominated failure). The red boxes indicate the damage concentration zone.
Significant differences in failure modes were observed among different structural configurations. As indicated in Table 5 and Table 6, under identical beam–column cross-sectional dimensions and reinforcement configurations, the joints with slabs (JD2, JD4, JD6) exhibited significantly higher positive cracking loads and yield loads compared to their counterparts without slabs (JD1, JD3, JD5).
Table 5.
Cracking load, yielding load and failure displacement of different specimens.
Table 6.
Percentage increase in cracking and yielding loads between specimen groups.
Specifically, compared to JD1, the positive cracking load of JD2 increased from 65 kN to 130 kN, representing an increase of 100.0%; the positive yield load increased from 180 kN to 260 kN, an increase of 44.4%. Similarly, compared to JD3, the positive cracking load of JD4 increased from 70 kN to 140 kN (a 100.0% increase), and the positive yield load increased from 170 kN to 240 kN (a 41.1% increase). Furthermore, compared to JD5, the positive cracking load of JD6 increased from 70 kN to 170 kN (a 142.9% increase), and the positive yield load increased from 145 kN to 260 kN (a 79.3% increase).
The specimens without slabs (JD1, JD3, JD5) all ultimately failed in shear, with the failure zone primarily concentrated between the end of the steel connector and the loading end. The corresponding crack propagation patterns are shown in Figure 6a,c,e. For the specimens with slabs (JD2, JD4, JD6), under positive loading, cracks in the upper part of the beam extended into the slab. During large displacement cycles, penetrating horizontal cracks appeared at the beam–slab interface, indicating that the reinforcement within the slab parallel to the beam participated in tension. Under reverse loading, the slab was in compression, which also enhanced the bearing capacity of the joint in the positive moment direction. The participation of slab reinforcement in both tension and compression stages significantly improved both the positive cracking load and yield load of the joints with slabs.
It is worth noting that JD2 ultimately exhibited a ductile failure mode dominated by flexural failure at the normal section near the column face (Figure 6b). Its positive yield load reached . Upon failure, the flexural cracks at the beam–column interface penetrated through the section, indicating that the failure of this joint was primarily controlled by the bending moment. Considering the specimen configuration, under the condition where the slab participates in load bearing and the axial compression ratio is relatively low, the flexural capacity of the beam–column interface section may become the governing factor before the shear capacity. In contrast, although JD4 and JD6 were also joints with slabs, they still ultimately failed primarily due to inclined section shear in the damage concentration zone (Figure 6d,f) under the influence of higher axial force or higher beam bottom reinforcement ratios (including the use of steel plates).
The form and ratio of reinforcement at the bottom of the beam also significantly influenced the stress level and failure mode. As shown in Table 5, under similar conditions, compared with JD3 and JD4, which used ordinary reinforcement as bottom longitudinal bars, JD5 and JD6, which used steel plates to replace bottom longitudinal bars, showed significant improvements in yield load and peak bearing capacity. The reverse yield load of JD5 was , which is close to the of JD3; however, the positive failure displacement of JD5 reached 3.5 times the yield displacement, whereas that of JD3 was 3 times. The reverse yield load of JD6 was , significantly higher than the of JD4. Comparing the two, the positive yield load of JD6 was 260 kN, which was 8.3% higher than the 240 kN of JD4; the reverse yield load of JD6 was 300 kN, representing a 15.4% increase over the 260 kN of JD4.
Regarding failure displacement, the failure displacements of most joints ranged between 2.5 and 4.0 times the yield displacement. Specifically, the failure displacements of JD3 and JD4 were approximately 3.0 and 4.0 times the yield displacement, respectively, indicating relatively better ductility. The failure displacements of JD1 and JD2 were relatively small, approximately 2.5 times the yield displacement. Considering the specimen configuration, the column height of JD1 and JD2 was , resulting in a larger slenderness ratio. Consequently, eccentricity was more likely to occur during axial loading of the column, and their stability was inferior to the other four joints. This is the primary reason for their relatively smaller failure displacements and slightly poorer ductility.
Overall, all specimens exhibited a failure mechanism where the composite beam yielded first while the column showed no significant damage characteristics, reflecting the design philosophy of “strong column-weak beam”. Except for JD2, which underwent flexural failure at the column face, the other joints were dominated by shear failure at the beam-end diagonal section. After reaching the peak load, the bearing capacity of each specimen decreased relatively slowly, maintaining a certain load-bearing level and demonstrating strong overall deformation capacity.
3.2. Hysteresis and Skeleton Curves
The hysteresis and skeleton curves obtained from the tests are shown in Figure 7. The characteristics of the hysteresis curves indicate that all specimens were in the elastic stage during the initial loading phase, characterized by narrow hysteresis loops and negligible residual deformation. Upon entering the elasto-plastic stage, the area of the hysteresis loops gradually increased, and both plastic deformation and energy dissipation capacity continued to develop.
Figure 7.
Hysteretic performance of different prefabricated CFST column-composite beam frame joints: (a,b) Hysteresis curves of specimens JD1/3/5 and JD2/4/6, respectively; (c,d) Corresponding skeleton curves.
The hysteresis curves of the specimens with slabs exhibited significant asymmetry—the stiffness and bearing capacity under positive loading (corresponding to tension at the beam bottom) were notably higher than those under reverse loading. This phenomenon is primarily attributed to the “flange action” induced by the cast-in-place slab and the resulting asymmetric load transfer mechanism. Under positive loading, the slab concrete is located in the compression zone and acts as an effective flange for the beam (similar to a T-beam), significantly enhancing the flexural stiffness and strength of the cross-section. Conversely, under reverse loading (where the composite beam is subjected to negative moment), the slab concrete in the tension zone cracks rapidly and becomes ineffective, relying solely on the reinforcement within the slab to provide tensile contribution. Consequently, the stiffness enhancement effect in this state is weaker than that in the compression state. In contrast, the hysteresis curves of the specimens without slabs were basically symmetrical.
Regarding the shape of the hysteresis loops, specimen JD2, which underwent flexural failure at the column face, exhibited relatively plump spindle-shaped loops, demonstrating good ductility. The remaining specimens, which underwent shear failure, showed varying degrees of “pinching” or horizontal slipping segments, with JD4 being particularly significant. This pinching effect, caused by the bond-slip of longitudinal reinforcement and the repeated opening and closing of diagonal cracks, reduces energy dissipation efficiency. Notably, specimens utilizing steel plates as the load-bearing component at the beam bottom (JD5, JD6) possessed more stable and plump hysteresis loops compared to their corresponding reinforced counterparts (JD3, JD4), indicating that the steel plate configuration contributes to enhancing the hysteretic performance and energy dissipation stability of the joints.
Analysis of the macroscopic mechanical response from the skeleton curves reveals that all specimens underwent a typical ductile development process consisting of elastic ascent, plastic hardening, and a slow decline after the peak. The positive skeleton curves of the group of specimens with slabs were significantly higher than those of the group without slabs in terms of initial stiffness and peak bearing capacity, verifying the composite enhancement effect of the slab. For JD5 and JD6 with steel plates at the beam bottom, the majority of their skeleton curves lay above those of the corresponding reinforced specimens, indicating that the steel plate effectively improves the flexural and shear bearing capacity of the joints.
Therefore, the participation of the slab introduced the flange action and altered the effective stiffness of the section, leading to asymmetry in the mechanical response under positive and reverse directions. The use of steel plates as load-bearing components at the beam bottom effectively improved the bearing capacity and hysteretic stability of the joints. Different failure modes directly affected the plumpness of the hysteresis loops and energy dissipation efficiency. All prefabricated joints exhibited a “strong column-weak beam” failure mechanism and good overall ductility.
Based on the hysteresis and skeleton curves obtained from the tests, the overall performance of different joint structures can be further quantitatively evaluated in terms of yield and ultimate bearing capacities, ductility, and energy dissipation capacity. According to the method shown in Figure 5a, the yield point, peak point, and ultimate point of the skeleton curves for each joint were determined, and the relevant results are summarized in Table 7. The results indicate significant asymmetry in ultimate displacement. Taking specimen JD4 as an example, its positive ultimate displacement reached 27.0 mm, while the reverse ultimate displacement was only 14.0 mm, with the former being approximately 1.93 times the latter. Similarly, the positive ultimate displacement of specimen JD6 (30.3 mm) was 35.3% higher than the reverse one (22.4 mm). This is related to cumulative damage and the direction of concrete spalling during the late stage of loading.
Table 7.
Characteristic points and displacement ductility factors of specimens.
The composite effect of the slab significantly enhanced the bearing capacity of the joints. Compared with the slab-less specimen JD1, the positive peak load of specimen JD2 with a slab increased from 231 kN to 336 kN, representing an increase of 45.5%. Similarly, the peak load of JD4 increased by 76.1% compared to JD3 (from 184 kN to 324 kN), verifying the significant contribution of the slab to the bearing capacity. Furthermore, strengthening the tensile components at the beam bottom yielded significant effects. Under otherwise identical conditions, specimen JD5, with increased reinforcement at the beam bottom, achieved a peak load of 305 kN, which was 65.8% higher than that of the base specimen JD3 (184 kN). Moreover, specimen JD6, strengthened with a steel plate, reached a peak load of 414 kN, representing a 27.8% increase compared to the reinforced specimen JD4 (324 kN) under equivalent conditions. This indicates that using steel plates is an effective method to improve the ultimate bearing capacity of the joints.
3.3. Connection Joint Performance Analysis
Figure 8 illustrates the degradation curves of secant stiffness with respect to displacement levels. Attributable to the flange action of the slab, the specimens with slabs (JD4, JD6) reached peak stiffnesses of 31.1 kN/m and 31.9 kN/m, respectively. Compared to the corresponding slab-less specimens with identical reinforcement (JD3, JD5), which had peak stiffnesses of 18.5 kN/m and 23.1 kN/m, these values represent increases of 68.1% and 38.1%, respectively. However, the degradation rate was more pronounced in specimens with higher initial stiffness. The stiffness of JD6 at 3Δy decreased by approximately 81.5% from its peak, whereas the corresponding reduction for the slab-less JD5 was only 58.2%. Additionally, the structural configuration resulted in differences in degradation characteristics: slab-less joints exhibited basically symmetrical positive and reverse stiffness (difference < 5%), while joints with slabs showed significant asymmetry due to the tensile participation of slab reinforcement (e.g., the stiffness difference for JD6 at ±1Δy reached 30%). Notably, the high-column specimens (JD1, JD2), influenced by eccentric axial compression, exhibited lower overall stiffness levels, with their average peak stiffness (12.1 kN/m) being approximately 50% of that of the other short-column joints.
Figure 8.
Degradation curves of stiffness Kj versus displacement level for different prefabricated stiffened column and composite beam frame structures.
The displacement ductility coefficients (), calculated based on Equation (4), are detailed in Table 8. The average value for all specimens was 2.84 (ranging from 2.15 to 4.26), indicating that all specimens satisfied the seismic design requirement of . From an engineering application perspective, the ductility coefficients of all specimens exceeded 2.0, meeting the basic seismic design requirements for “limited ductility” or “medium ductility” components specified in the Chinese standard Seismic Design of Buildings (GB/T50011-2010) [22]. This implies that the prefabricated joints possess the necessary plastic deformation capacity to prevent collapse under design earthquakes.
Table 8.
Statistical results of energy dissipation coefficients and equivalent viscous damping ratios for each specimen.
Comparative analysis in Table 9 indicates that the cast-in-place slab generally restricts the deformation capacity of the joints. Specifically, for specimens with conventional reinforcement, the ductility of JD4 (with slab) was 29.8% lower than that of JD3 (without slab); for high-column specimens, JD2 was 24.3% lower than JD1. However, in specimens utilizing a steel plate at the beam bottom, the composite action of the slab conversely enhanced ductility by 19.2% (JD5 vs. JD6). Furthermore, the structural configuration significantly influenced ductility. Compared to the conventional reinforced joint (JD3), the joint with a steel plate (JD5), despite its higher bearing capacity, exhibited a 48.6% reduction in ductility coefficient. Therefore, in practical design, when employing steel plates to strengthen connections, caution must be exercised regarding ductility reduction although the bearing capacity is effectively improved. It is recommended to adopt additional ductility-enhancing measures (such as densifying hooping) for such strengthened joints to achieve a balance between strength and ductility, ensuring that deformation demands under strong earthquakes are met.
Table 9.
Variation in seismic performance indicators between specimen groups (%).
A quantitative comparison of the energy dissipation performance of the joints is presented in Table 8 and Table 9. JD3 and JD4 exhibited the most superior energy dissipation capabilities, with an average equivalent viscous damping coefficient () reaching 0.380. This represents an increase of nearly 2.8 times compared to ordinary cast-in-place reinforced concrete joints (typically around 0.10) and even exceeds the design values for typical steel-reinforced concrete joints (approximately 0.30). This suggests that this novel prefabricated joint can act as an extremely efficient “energy dissipator” under strong earthquakes, effectively mitigating the dynamic response and cumulative damage of the main structure by significantly consuming seismic input energy.
Data from the comparison groups reveal that the influence of the slab effect on energy dissipation varied. Under standard column height conditions, the of the joint with a slab (JD4) increased by 7.4% compared to the slab-less joint (JD3). However, under high column conditions (JD1 vs. JD2), the presence of the slab caused a substantial reduction of 53.1% in . Although JD2 had the lowest energy dissipation index (), the proposed prefabricated joints generally demonstrated excellent energy dissipation capabilities, verifying their reliable seismic performance under earthquake action. In summary, this joint system not only meets conventional seismic code requirements but is also particularly suitable for regions with high seismic fortification intensity due to its superior damping characteristics, validating its feasibility as a high-performance seismic connection solution.
The measured load-curvature curves are shown in Figure 9. Analysis indicates that prior to section cracking, both the concrete and reinforcement in the tension zone were in an approximately elastic state. The entire section participated in load bearing, resulting in high flexural stiffness and slow curvature growth. When the concrete at the edge of the tension zone reached its ultimate tensile strain, cracks emerged, and the tensile force was transferred to the reinforcement. This caused a sudden increase in reinforcement stress and a significant reduction in section stiffness. As the bending moment continued to increase, the basic mechanical mode—where tension is borne by the reinforcement and compression by the concrete—remained unchanged. However, the strains and stresses in both the reinforcement and concrete continued to increase. Simultaneously, the plastic development of the concrete in the compression zone and the gradual degradation of the bond between the concrete and reinforcement in the tension zone caused the section stiffness to decrease progressively with increasing bending moment. After the tensile reinforcement yielded, a small increase in bending moment induced a sharp rise in reinforcement strain, leading to a substantial drop in section stiffness. However, due to the more complete stress distribution in the compression zone and a slight increase in the internal lever arm, the resisting moment of the section continued to rise slowly with increasing curvature. After reaching the maximum flexural bearing capacity, as the curvature increased further, the concrete in the compression zone was gradually crushed, and the bearing capacity of the section began to decline until ultimate failure. Synthesizing the failure characteristics, all test joints exhibited under-reinforced failure characteristics; that is, the longitudinal tensile reinforcement (or steel plate) yielded first, followed by the crushing of the concrete in the compression zone. The joints possessed good overall ductility, with the ductility performance of JD4 under positive loading being particularly notable.
Figure 9.
Load-curvature curves of different prefabricated stiffened column and composite beam frame structures: (a) Specimens JD1, JD3, and JD5; (b) Specimens JD2, JD4, and JD6.
4. Numerical Simulation Results
4.1. Finite Element Model Verification
Premised on the general agreement of the overall shape of hysteresis curves, the skeleton curves of the beams were extracted for comparative analysis to validate the accuracy of the numerical model. Figure 10 illustrates the comparison between the finite element simulated load–displacement skeleton curves and the experimental skeleton curves for specimens JD1, JD3, and JD5.
Figure 10.
Verification of the finite element model: Comparison of experimental (Exp) and simulated (Sim) skeleton curves for specimens JD1, JD3, and JD5.
As observed in the figure, the numerical results are consistent with the experimental results in terms of the overall trend. In the elastic stage, the initial slopes of the simulated and experimental curves largely coincide, indicating that the finite element model accurately captures the initial stiffness of the components. In the elasto-plastic stage, following specimen yielding with increasing load, the simulated stiffness degradation trend agrees well with the experimental measurements. Although the experimental peak loads for certain specimens (e.g., JD5) were slightly higher than the simulated values, and the descending branch of the calculated curves post-peak was gentler due to the idealized constitutive models failing to fully capture the sudden load drop caused by concrete crushing and spalling, there were no significant differences in magnitude between the two.
Overall, the calculated results show a high degree of agreement with the measured data regarding key mechanical performance indices, including initial stiffness, yield load, peak load, and corresponding displacements. Consequently, the finite element model possesses high reliability and can serve as a basis for subsequent analyses of failure mechanisms and parametric studies for this type of component.
4.2. Failure Mechanism Analysis
The failure modes observed in the numerical simulations were highly consistent with the experimental results, as shown in Figure 11. Due to the significant stiffness and abrupt change between the beam section with the embedded steel connector and the RC beam section containing reinforcement or steel plates, flexural-shear deformation was primarily concentrated within the latter. The beam section with the steel connector behaved approximately as a rigid body with minimal deformation. Consequently, the plastic hinge and the ensuing damage were effectively shifted to the RC beam section adjacent to the end interface of the steel connector. This validates the design intent of protecting the core joint and the stiffened transition zone.
Figure 11.
Numerical validation and mechanical analysis of shear-compression failure behavior: (a,b) Finite element model validation for Type A and Type B joints, respectively, showing the comparison between simulated deformation/Von Mises stress distribution and the experimentally observed shear failure morphology; (c) Schematic revealing the “Arch Effect” within the joint, illustrating the path of load transfer through the Main Arch Rib and Diagonal Struts; (d) Schematic of a typical shear-compression failure zone, characterized by the formation of critical diagonal cracks and the crushing of concrete struts.
The Von Mises stress distribution of the internal steel skeleton reveals the microscopic sequence of damage evolution. For both Type A and Type B joints, yielding initiated at the longitudinal reinforcement located at the interface between the beam section with the embedded steel connector and the ordinary reinforced concrete beam section. In contrast, the main body of the profiled steel within the steel connector beam section remained largely elastic, exhibiting only local stress concentrations at the connection. This indicates that the failure was primarily controlled by the yielding of connecting reinforcement at the interface of stiffness and abrupt change, rather than the failure of the internal steel skeleton. Furthermore, the high tensile stress observed in the upper flange region at the root of the steel connector beam section, where it connects to the column, correlated with the micro-cracks observed in the experiments. This was caused by the concentration of negative moments; however, constrained by the strong confinement between the profiled steel and concrete, these cracks did not propagate into dominant cracks.
Combining experimental phenomena with finite element analysis (Figure 11a,b), the shear failure of the joints followed a typical “Arch-Rib Model.” The specific force transmission path and the critical failure sequence are illustrated in Figure 11c. Under loading, a distinct compressive stress “Main Arch Rib” formed within the beam, transferring shear force from the loading point to the rigid joint interface via concrete “Diagonal Struts.” In this load transfer system, the hooping acted as tension ties, maintaining the stability of the arch rib by constraining the propagation of diagonal cracks. However, the transmission of shear force along the beam length had a cumulative effect. As diagonal cracks extended towards the rigid joint, the hooping near the rigid interface was located in the region of highest stress concentration (as indicated by the red markings in Figure 11c).
The failure evolution exhibited distinct sequential characteristics: when the load reached a critical value, the critical hooping and upper longitudinal reinforcement near the rigid connector reached their yield strength first, as shown by the red dashed line in Figure 11c. The synergistic yielding of reinforcement at this critical section caused a sudden drop in the confinement of the core concrete. Consequently, diagonal cracks widened rapidly, directly leading to the failure of “Aggregate Interlock,” forcing the shear force to redistribute to the concrete in the shear-compression zone. Subsequently, under the cumulative damage caused by cyclic loading, the abrasion of intersecting cracks further weakened the dowel action of the longitudinal reinforcement. This ultimately resulted in the crushing of concrete at the weak point of the main arch rib under combined compression-shear action (Figure 11d). This mechanism confirms that, with the exception of specimen JD2, all other nodes followed a typical mechanism where yielding of reinforcement (hooping and longitudinal bars) at the critical section triggers the failure of the load path, subsequently leading to shear-compression failure of the concrete.
4.3. Analysis of Performance Influence Parameters
To further investigate the influence of different design parameters on the seismic performance of prefabricated joints with steel connectors, a parametric sensitivity analysis was conducted using specimens A0 (Type A reference) and B0 (Type B reference) listed in Table 4 as reference models. Seven key parameters were examined: axial compression on the column top, length of the steel connector, longitudinal reinforcement ratio of the beam, concrete strength of the beam, strength of the beam longitudinal reinforcement, wall thickness of the column steel tube, and thickness of the beam web.
First, the effects of external loads and geometric dimensions were analyzed. As shown in Figure 12a,b, as the axial pressure increased from to , the initial stiffness of both Type A and Type B joints increased slightly due to enhanced confinement in the core zone. However, the yield and ultimate loads decreased marginally. This indicates that within the conventional axial compression ratio range, the seismic performance is primarily governed by beam-end flexural failure. In contrast, variations in the steel connector length had a more pronounced impact on bearing capacity. As shown in Figure 12c,d, extending the steel connector length from to resulted in an upward trend for both yield and peak loads. This is attributed to the fact that the limit moment of the RC beam section is the primary cause of component failure. Under a constant vertical load, increasing the length of the steel shape segment reduces the effective length of the RC beam segment, thereby decreasing the maximum bending moment acting on the RC section and enhancing the overall ultimate bearing capacity.
Figure 12.
Parametric analysis: Influence of key design variables (material properties, geometric dimensions, and axial compression level) on the skeleton curves of Type A and Type B joints. (a) Type A: Different column axial compression, (b) Type B: Different column axial compression, (c) Type A: Different steel connector lengths, (d) Type B: Different steel connector lengths, (e) Type A: Different beam rebar ratios, (f) Type B: Different beam rebar ratios, (g) Type A: Different rebar grade, (h) Type B: Different rebar grade, (i) Type A: Different beam concrete grade, (j) Type B: Different beam concrete grade, (k) Type A: Different column steel thicknesses, (l) Type B: Different column steel thicknesses, (m) Type A: Different beam web thicknesses, (n) Type B: Different beam web thicknesses.
Next, the influence of beam parameters was examined. As illustrated in Figure 12e,f, changes in the beam longitudinal reinforcement ratio revealed significant differences between the two joint types. Type A joints showed high sensitivity, with yield load, peak load, and initial stiffness increasing significantly with the reinforcement ratio. Conversely, Type B joints exhibited concentrated skeleton curves; increasing the reinforcement ratio had a limited effect on bearing capacity and negligible impact on initial stiffness, indicating low sensitivity. Regarding longitudinal reinforcement strength (Figure 12g,h), the trend was consistent: as the yield strength increased from HRB335 to HRB500, the bearing capacity indices of both joint types showed a stable increasing trend. Furthermore, variations in beam concrete strength (Figure 12i,j) demonstrated similar disparities. As strength increased from C30 to C60, Type A joints showed clear and continuous enhancement in bearing capacity and initial stiffness, highlighting the contribution of the compressive zone concrete. However, the response of Type B joints was sluggish; the skeleton curves almost overlapped between C30 and C50, with only a minor increase in ultimate capacity at C60. In summary, while improving beam parameters generally enhances seismic performance, the flexural mechanism of Type A joints relies heavily on material properties. In contrast, Type B joints, influenced by their integral structural constraints, show distinct insensitivity to changes in reinforcement ratio and concrete strength, except for reinforcement strength.
Finally, the influence of column body and detailed construction parameters was analyzed. Simulations showed that as the column square steel tube wall thickness increased from to (Figure 12k,l), and the web (stiffener) thickness of the beam steel connector varied from to (Figure 12m,n), the skeleton curves for both joint types nearly coincided, with negligible increase in bearing capacity. This suggests that under the beam hinge failure mode, the square steel tube column and the steel connector possess sufficient strength reserves, remaining largely in an elastic or locally yielding state. Therefore, purely increasing their wall thickness is an inefficient measure for improving overall joint performance.
The comprehensive parametric sensitivity analysis indicates a shared characteristic between Type A and Type B joints: both strictly adhere to the “strong column-weak beam” design criterion. Since their seismic performance is dominated by the failure of the composite beam, they are most sensitive to the strength of the beam longitudinal reinforcement. Conversely, both joint types exhibit high robustness regarding the axial load level on the column top, the column wall thickness, and the web thickness of the steel connector. Increasing the steel connector length effectively enhances the ultimate bearing capacity of both by altering the shear span ratio. The primary difference lies in their response to beam construction parameters. Type A joints are highly dependent on material properties, where increases in reinforcement ratio and concrete strength translate directly into capacity and stiffness gains. Type B joints, due to stronger integral structural constraints, exhibit marked insensitivity to these changes. Therefore, in engineering design, it is recommended to prioritize high-strength reinforcement to enhance joint capacity and keep column wall and web thicknesses within construction requirement limits for cost efficiency. For Type A joints, performance can be optimized by appropriately increasing the reinforcement ratio or concrete grade. For Type B joints, excessive reinforcement should be avoided to prevent material waste, with a focus instead on optimizing construction convenience.
5. Conclusions
This paper systematically investigated the seismic performance and mechanical mechanism of a novel connection joint for a prefabricated concrete stiffened column and composite beam frame structure. This was achieved through low-cycle reversed loading pseudo-static tests on six scaled specimens, combined with parametric analysis using an ABAQUS finite element model. The main conclusions are as follows:
Experimental and simulation results indicate that failure was primarily concentrated in the transition section between the embedded steel connector and the loading end of the beam, exhibiting distinct characteristics of combined flexural-shear failure. The failure process is typically initiated with concrete cracking. As the load increased, the hooping near the steel connector yielded gradually, ultimately leading to the crushing of concrete in the core zone or the yielding of tensile components at the beam bottom. Most specimens successfully achieved the seismic design objective of “strong column-weak beam,” validating the rationality of the proposed joint configuration. The joints exhibited plump hysteresis curves, demonstrating good ductility and energy dissipation capacity. The average ductility coefficient of the specimens was 2.84, indicating reliable plastic deformation capability. Furthermore, the equivalent viscous damping coefficient of the joints increased gradually with increasing displacement, reaching an average value of 0.207 at failure, which demonstrates excellent seismic energy dissipation capacity.
The cooperative action of the floor slab significantly influenced the mechanical performance of the joints. The presence of the slab caused distinct asymmetry in the mechanical response under positive and negative bending moments. Under negative bending moments, the slab reinforcement acted as a flange, effectively participating in tension and significantly improving the negative bearing capacity and stiffness of the joint, whereas the contribution of the slab to bearing capacity under positive bending moments was relatively limited. Additionally, the study compared Type A joints, which utilized reinforcement at the beam bottom, with Type B joints, which utilized steel plates. The analysis revealed that Type B joints outperformed Type A joints in terms of bearing capacity, stiffness, and hysteretic stability. Consequently, the configuration with a steel plate at the beam bottom is more suitable for regions with high seismic fortification intensity.
Parametric sensitivity analysis based on the validated finite element model indicated that the seismic performance of both joint types was primarily controlled by the composite beam. They were found to be most sensitive to the strength of the beam longitudinal reinforcement and the length of the embedded steel connector. Conversely, changing the column wall thickness, beam web thickness, and column top axial compression ratio had negligible effects on the joint bearing capacity. The response of the two joint types to beam construction parameters differed significantly: the bearing capacity of Type A joints increased significantly with increases in reinforcement ratio and concrete strength, while Type B joints exhibited a distinct insensitivity to these changes, with limited performance improvement. Therefore, it is recommended to prioritize the use of high-strength reinforcement in design while keeping the column wall and web thicknesses within construction requirement limits to save costs. For Type A joints, performance can be optimized by adjusting the reinforcement ratio and concrete grade, whereas, for Type B joints, excessive reinforcement should be avoided to prevent material waste.
Author Contributions
Conceptualization, Y.G.; Methodology, Y.G., L.C. and S.C.; Software, Y.G. and Z.Y.; Validation, Z.Z.; Formal analysis, Y.G. and Z.Y.; Writing—original draft, Y.G., Z.Y. and L.C.; Project administration, L.C. All authors have read and agreed to the published version of the manuscript.
Funding
This research was funded by 13th Five-Year National Key R&D Program of China (2016YFC0701700) and 13th Five-Year National Key R&D Program of China (2017YFC0703900).
Data Availability Statement
Data will be made available upon request.
Conflicts of Interest
Authors Yufen Gao, Lu Chen, Zhongshan Zhang and Shengzhao Cheng were employed by the company China Construction Seventh Engineering Division Corp., Ltd. The remaining author declares that the research was conducted in the absence of any commercial or financial relationships that could be construed as a potential conflict of interest.
References
- Cao, X.; Li, X.; Zhu, Y.; Zhang, Z. A comparative study of environmental performance between prefabricated and traditional residential buildings in China. J. Clean. Prod. 2015, 109, 131–143. [Google Scholar] [CrossRef] [Scilit]
- Park, R. Seismic Design of Precast Concrete Building Structures: State-of-the-Art Report; FIB Fédération Internationale du Béton: Lausanne, Switzerland, 2003; Volume 27. [Google Scholar]
- Negro, P.; Toniolo, G. Design Guidelines for Connections of Precast Structures Under Seismic Actions; Publications Office of the European Union: Luxembourg, 2012. [Google Scholar]
- Chen, W.; Ye, J.; Bai, Y.; Zhao, X.-L. Improved fire resistant performance of load bearing cold-formed steel interior and exterior wall systems. Thin-Walled Struct. 2013, 73, 145–157. [Google Scholar] [CrossRef] [Scilit]
- Yasir, M.; Ahmad, F.; Yusoff, P.S.M.M.; Ullah, S.; Jimenez, M. Latest trends for structural steel protection by using intumescent fire protective coatings: A review. Surf. Eng. 2020, 36, 334–363. [Google Scholar] [CrossRef] [Scilit]
- Han, L.-H.; Li, W.; Bjorhovde, R. Developments and advanced applications of concrete-filled steel tubular (CFST) structures: Members. J. Constr. Steel Res. 2014, 100, 211–228. [Google Scholar] [CrossRef] [Scilit]
- Ding, F.-x.; Yin, G.-a.; Wang, L.-p.; Hu, D.; Chen, G.-q. Seismic performance of a non-through-core concrete between concrete-filled steel tubular columns and reinforced concrete beams. Thin-Walled Struct. 2017, 110, 14–26. [Google Scholar] [CrossRef] [Scilit]
- Gao, B.; Xu, L.; Huang, L.; Chi, Y.; Yu, M.; Wen, S. Seismic performance of a novel concrete-filled steel tube column to continuous reinforced concrete beam joint with multiple openings in the core region. Eng. Struct. 2024, 319, 118775. [Google Scholar] [CrossRef] [Scilit]
- Parra-Montesinos, G.; Liang, X.; Wight, J. Towards deformation-based capacity design of RCS beam–column connections. Eng. Struct. 2003, 25, 681–690. [Google Scholar] [CrossRef] [Scilit]
- Dong, B.; Pan, J.; Xu, L. Numerical simulation and theoretical analysis on RECC ring beam joints for RECC-encased CFST composite columns. Eng. Struct. 2023, 294, 116706. [Google Scholar] [CrossRef] [Scilit]
- Liang, G.; Lu, Z.; Guo, H.; Liu, Y.; Yang, D.; Li, S.; Pan, X. Experimental and numerical investigation on seismic performance of extended stiffened end-plate joints with reduced beam section using high strength steel. Thin-Walled Struct. 2021, 169, 108434. [Google Scholar] [CrossRef] [Scilit]
- Gracia, J.; Bayo, E.; Ferrario, F.; Bursi, O.; Braconi, A.; Salvatore, W. The seismic performance of a semi-rigid composite joint with a double-sided extended end-plate. Part I: Experimental research. Eng. Struct. 2010, 32, 385–396. [Google Scholar] [CrossRef] [Scilit]
- Tang, X.-L.; Cai, J.; Chen, Q.-J.; Liu, X.; He, A. Seismic behaviour of through-beam connection between square CFST columns and RC beams. J. Constr. Steel Res. 2016, 122, 151–166. [Google Scholar] [CrossRef] [Scilit]
- Yu, F.; Fang, Y.; Feng, C.; Tan, S.; Wang, Y. Shear capacity of PVC-CFRP confined concrete column-RC beam interior joint strengthened with core steel tube. Thin-Walled Struct. 2023, 193, 111213. [Google Scholar] [CrossRef] [Scilit]
- Zhou, X.; Wang, X.; Gu, C.; Chung, K.-F.; Liu, J.; Liao, Y.; Chen, X. Seismic behavior of a novel prefabricated thin-walled CFST double-column pier system for simple on-site assembly. Thin-Walled Struct. 2023, 183, 110388. [Google Scholar] [CrossRef] [Scilit]
- Chen, Z.; Niu, X.; Liu, J.; Khan, K.; Liu, Y. Seismic study on an innovative fully-bolted beam-column joint in prefabricated modular steel buildings. Eng. Struct. 2021, 234, 111875. [Google Scholar] [CrossRef] [Scilit]
- JGJ/T 101-2015; Specification for Seismic Test of Buildings. China Architecture & Building Press: Beijing, China, 2015.
- Dassault Systèmes Simulia Corp. Abaqus Analysis User’s Guide Version 6.14; Dassault Systèmes Simulia Corp.: Providence, RI, USA, 2014. [Google Scholar]
- Lee, J.; Fenves, G.L. Plastic-damage model for cyclic loading of concrete structures. J. Eng. Mech. 1998, 124, 892–900. [Google Scholar] [CrossRef] [Scilit]
- Hu, H.-T.; Huang, C.-S.; Wu, M.-H.; Wu, Y.-M. Nonlinear analysis of axially loaded concrete-filled tube columns with confinement effect. J. Struct. Eng. 2003, 129, 1322–1329. [Google Scholar] [CrossRef] [Scilit]
- Genikomsou, A.S.; Polak, M.A. Finite element analysis of punching shear of concrete slabs using damaged plasticity model in ABAQUS. Eng. Struct. 2015, 98, 38–48. [Google Scholar] [CrossRef] [Scilit]
- GB/T50011-2010; Code for Seismic Design of Buildings. China Architecture & Building Press: Beijing, China, 2010.
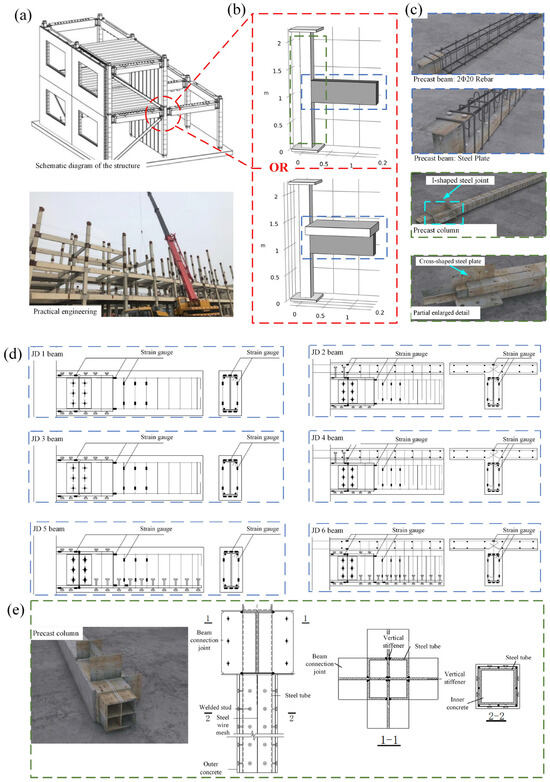
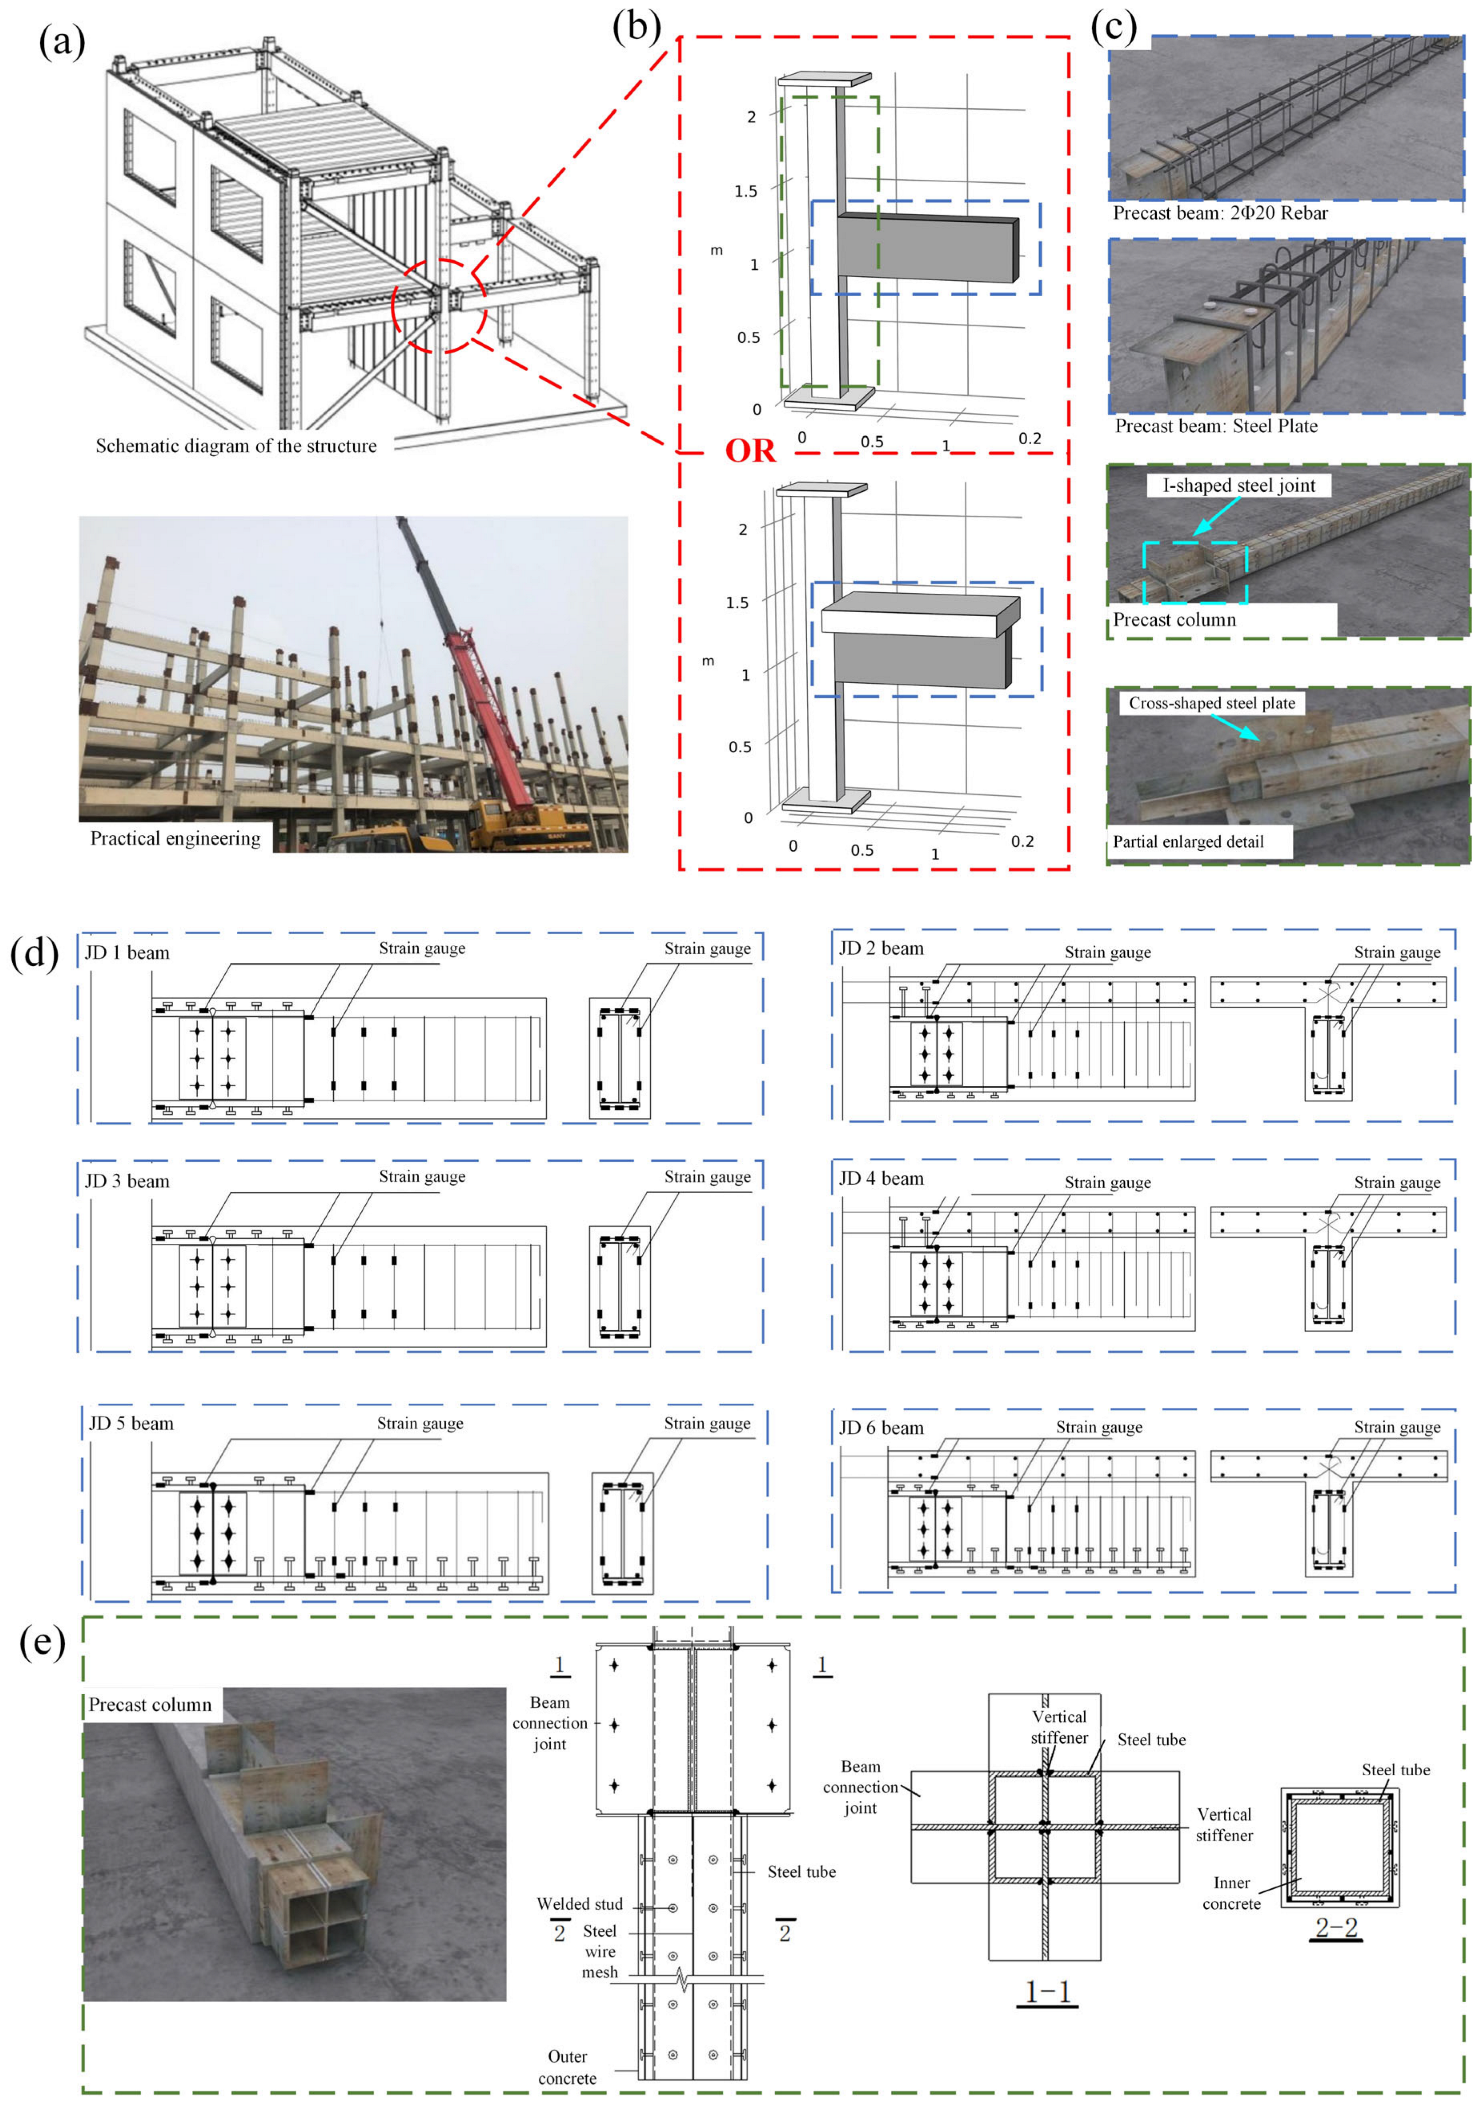
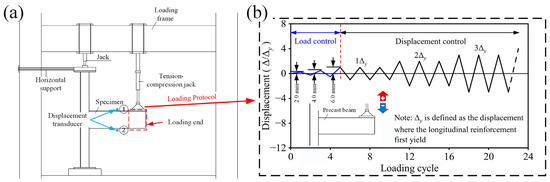
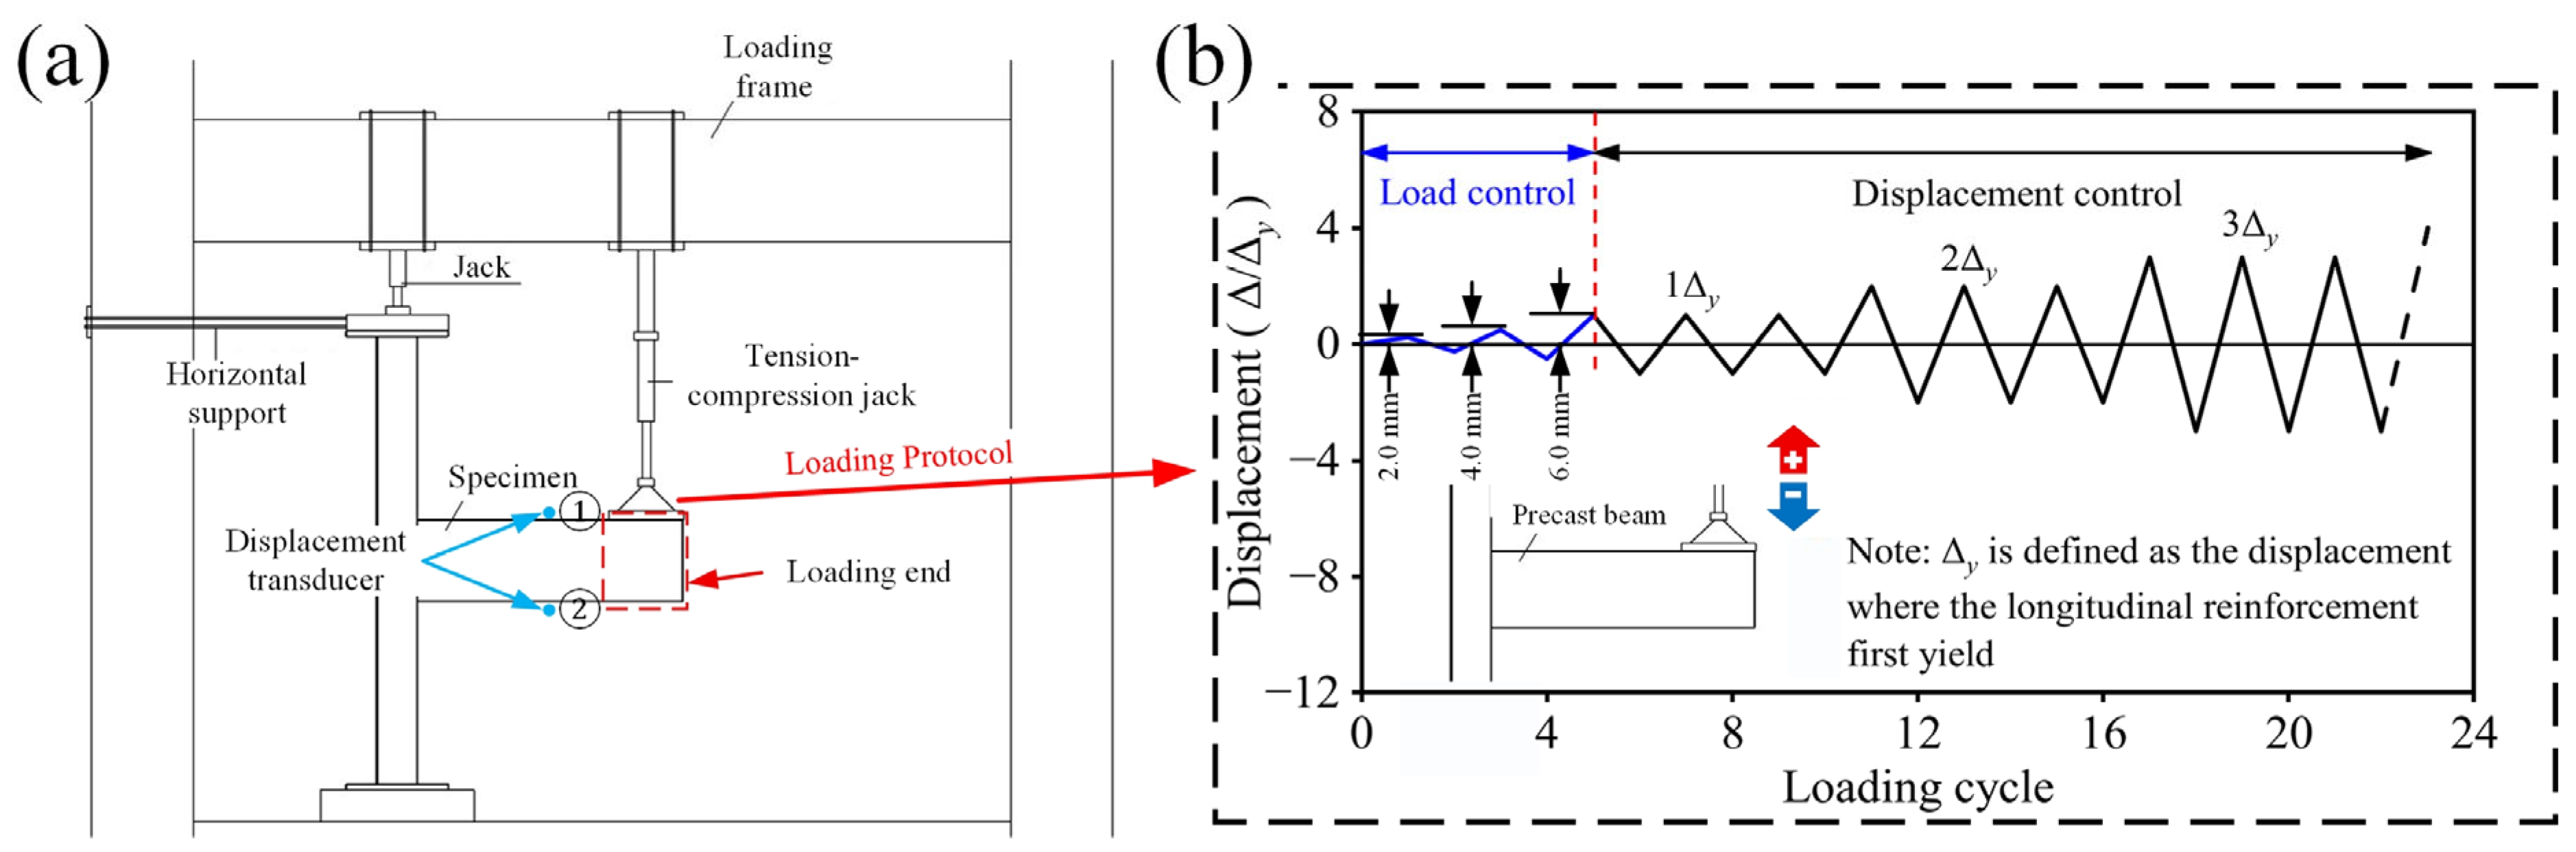
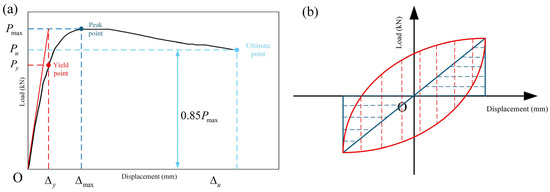
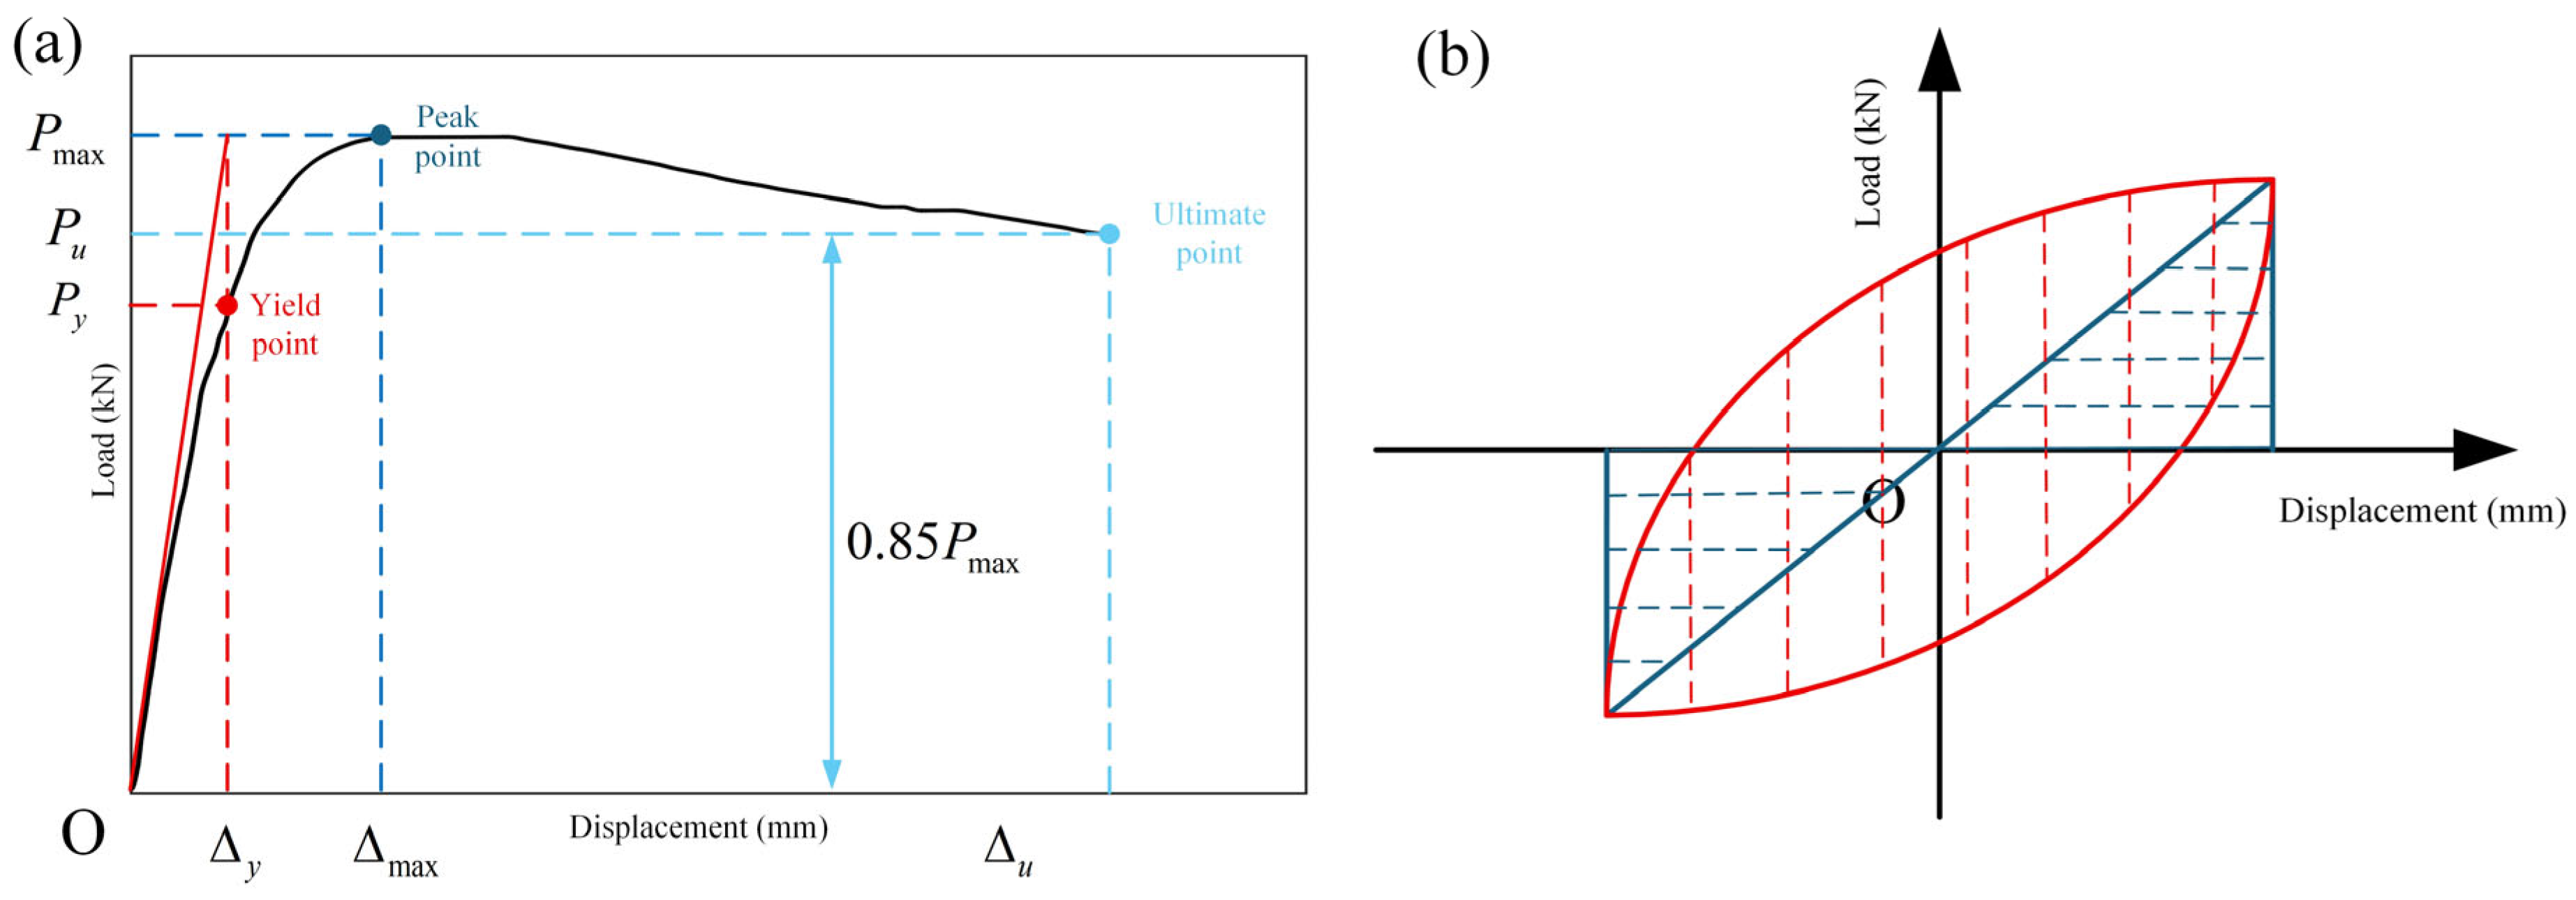
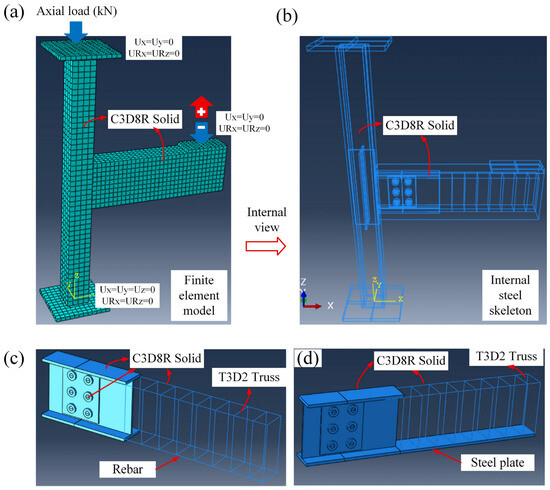
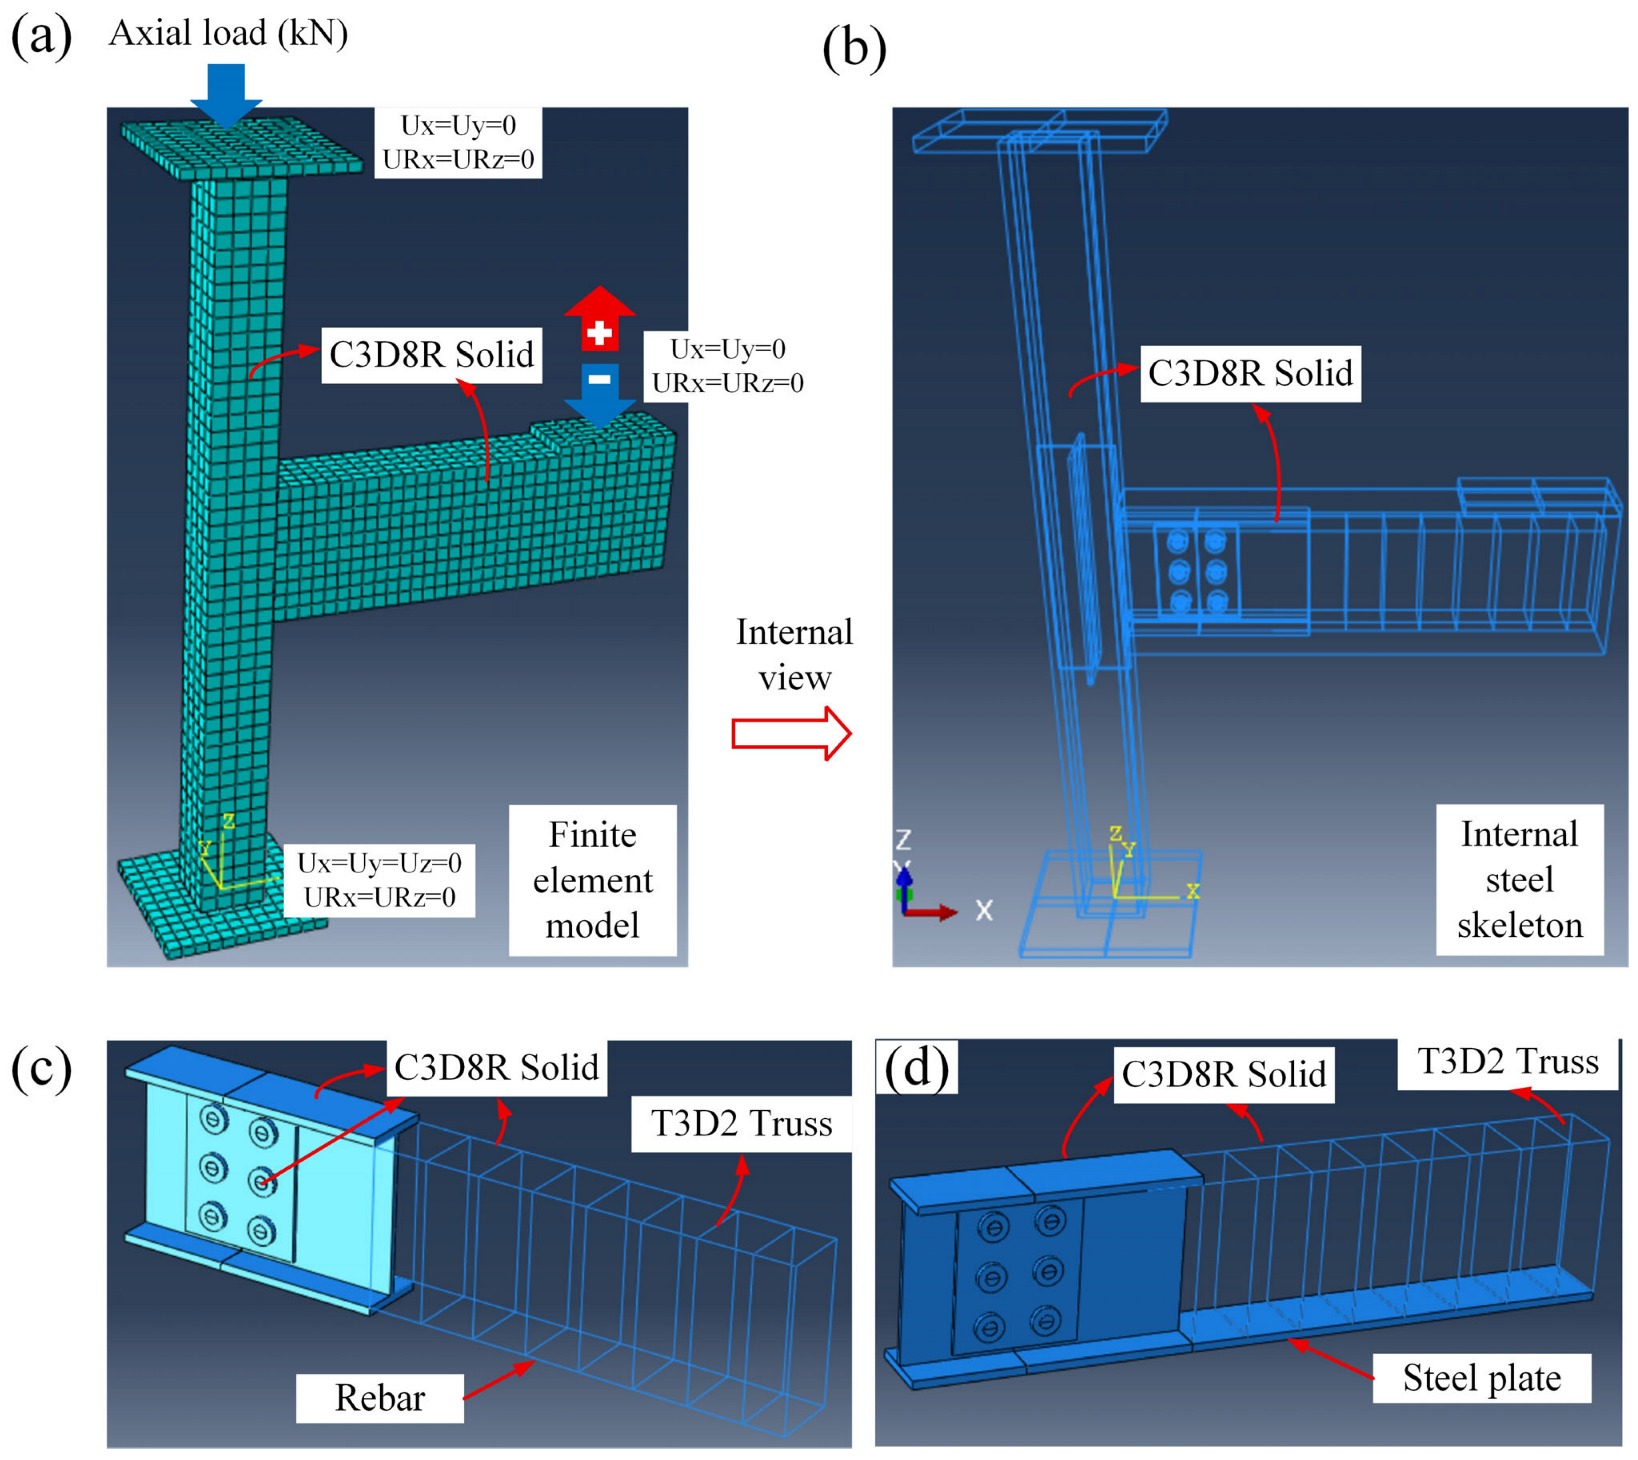
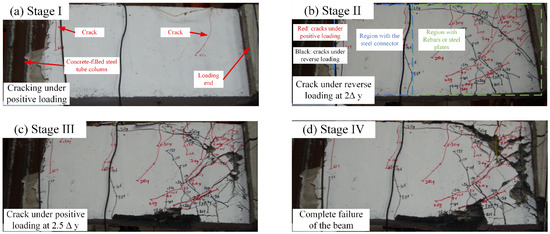
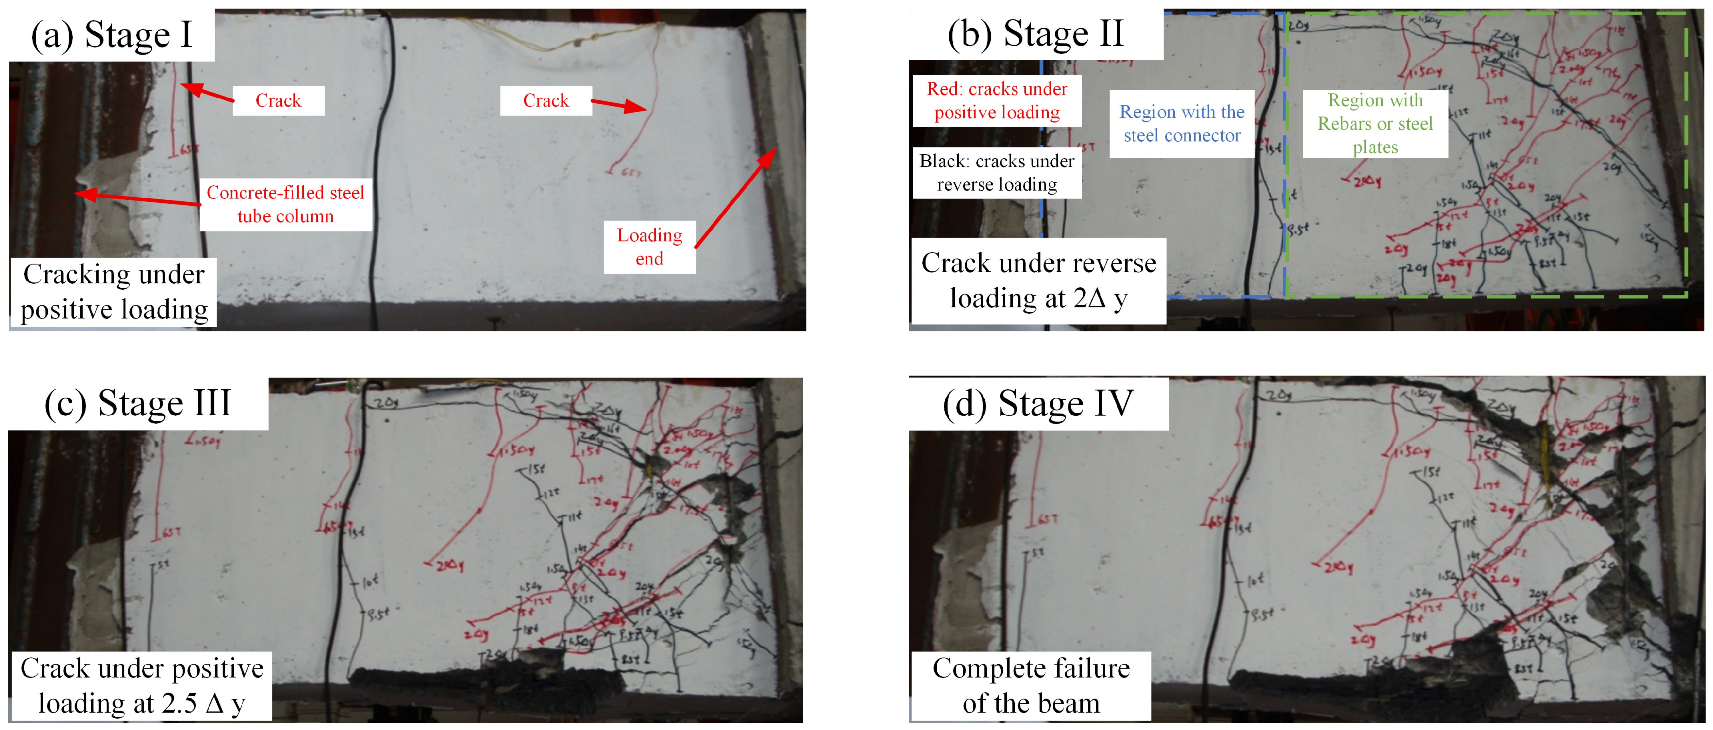
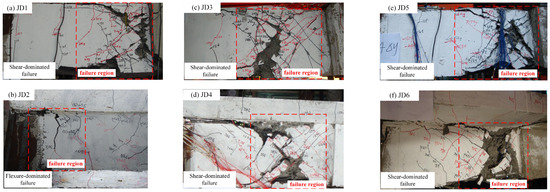
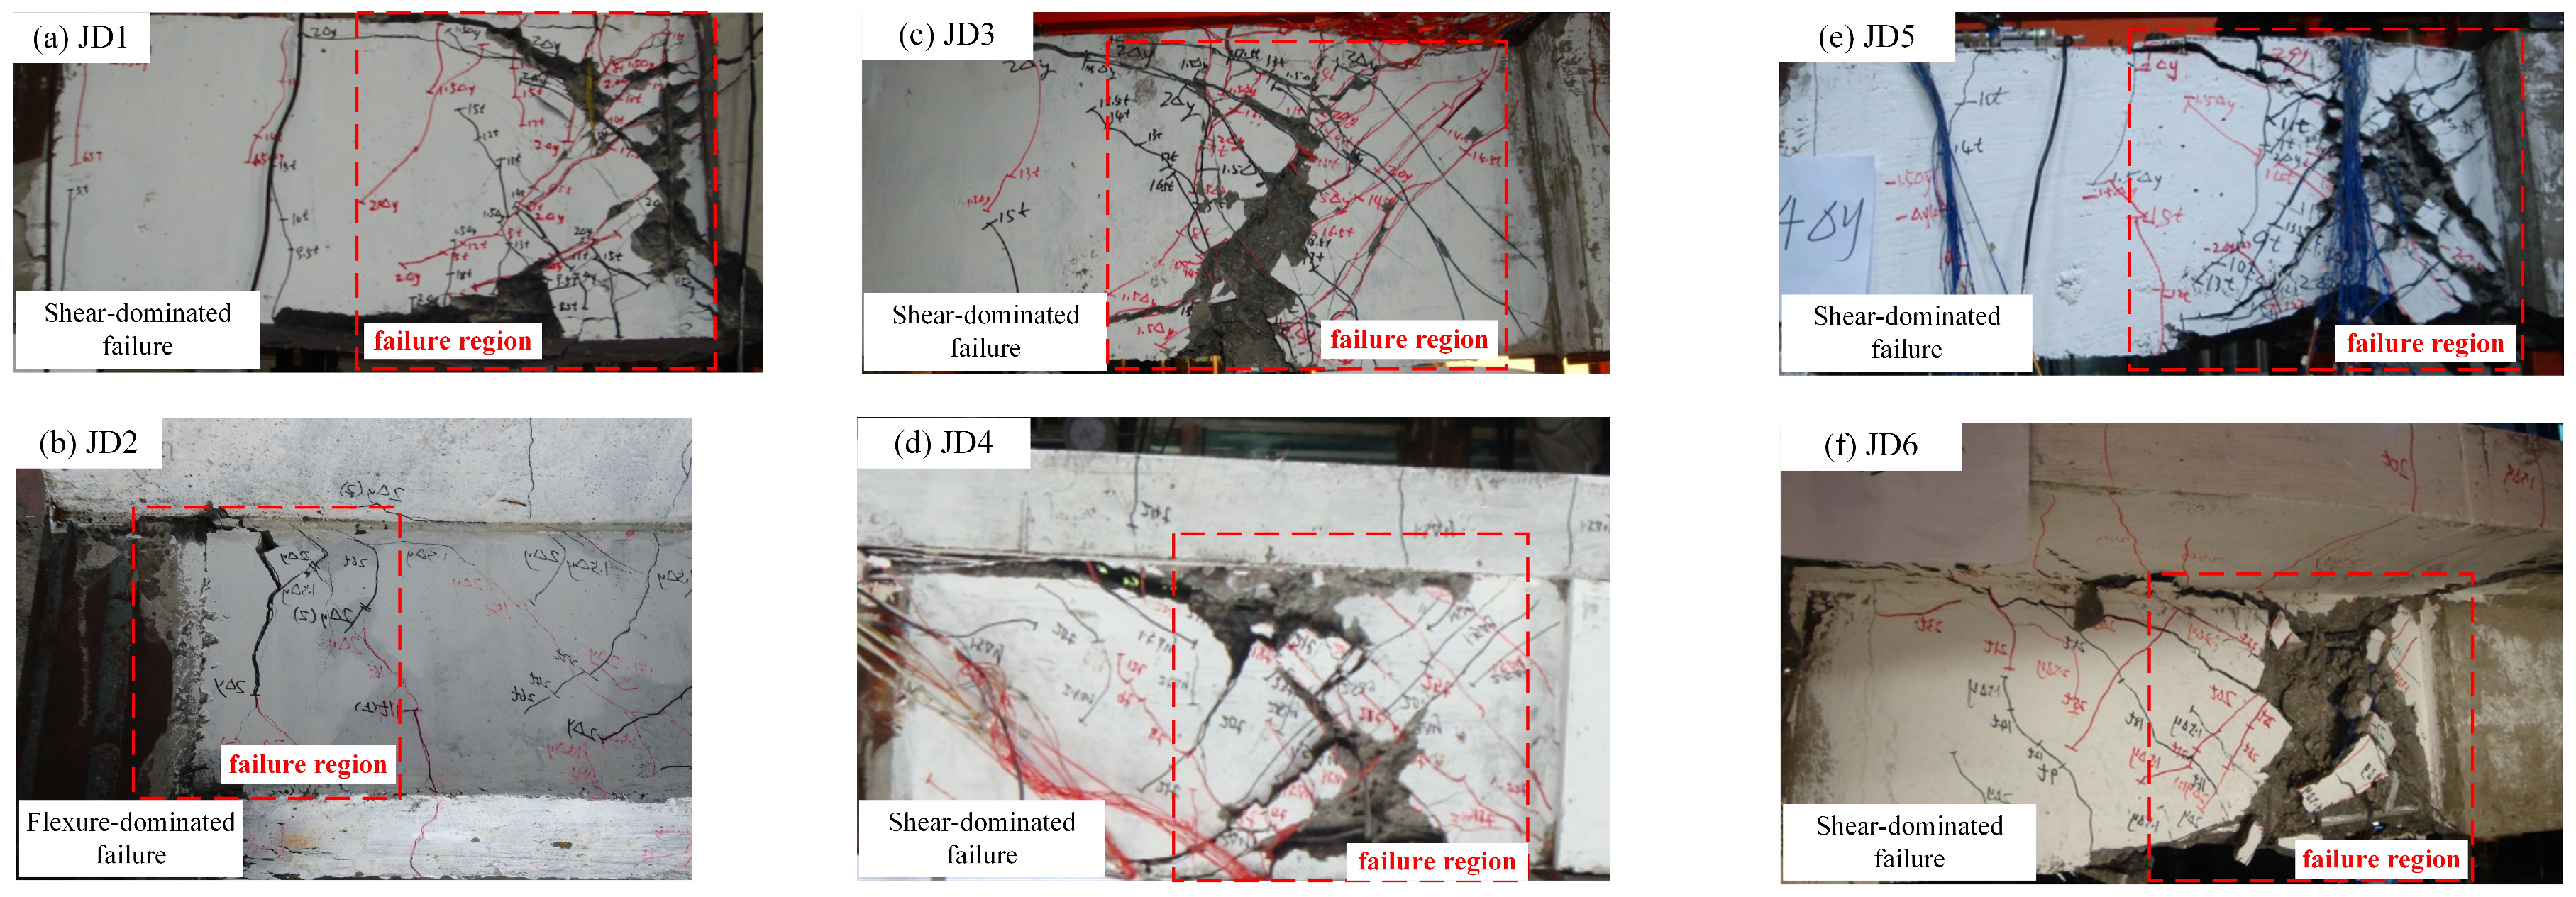
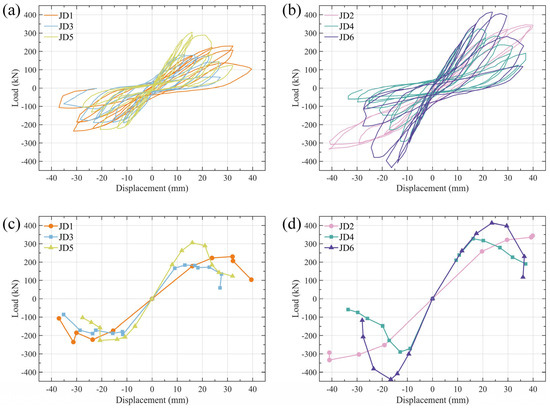
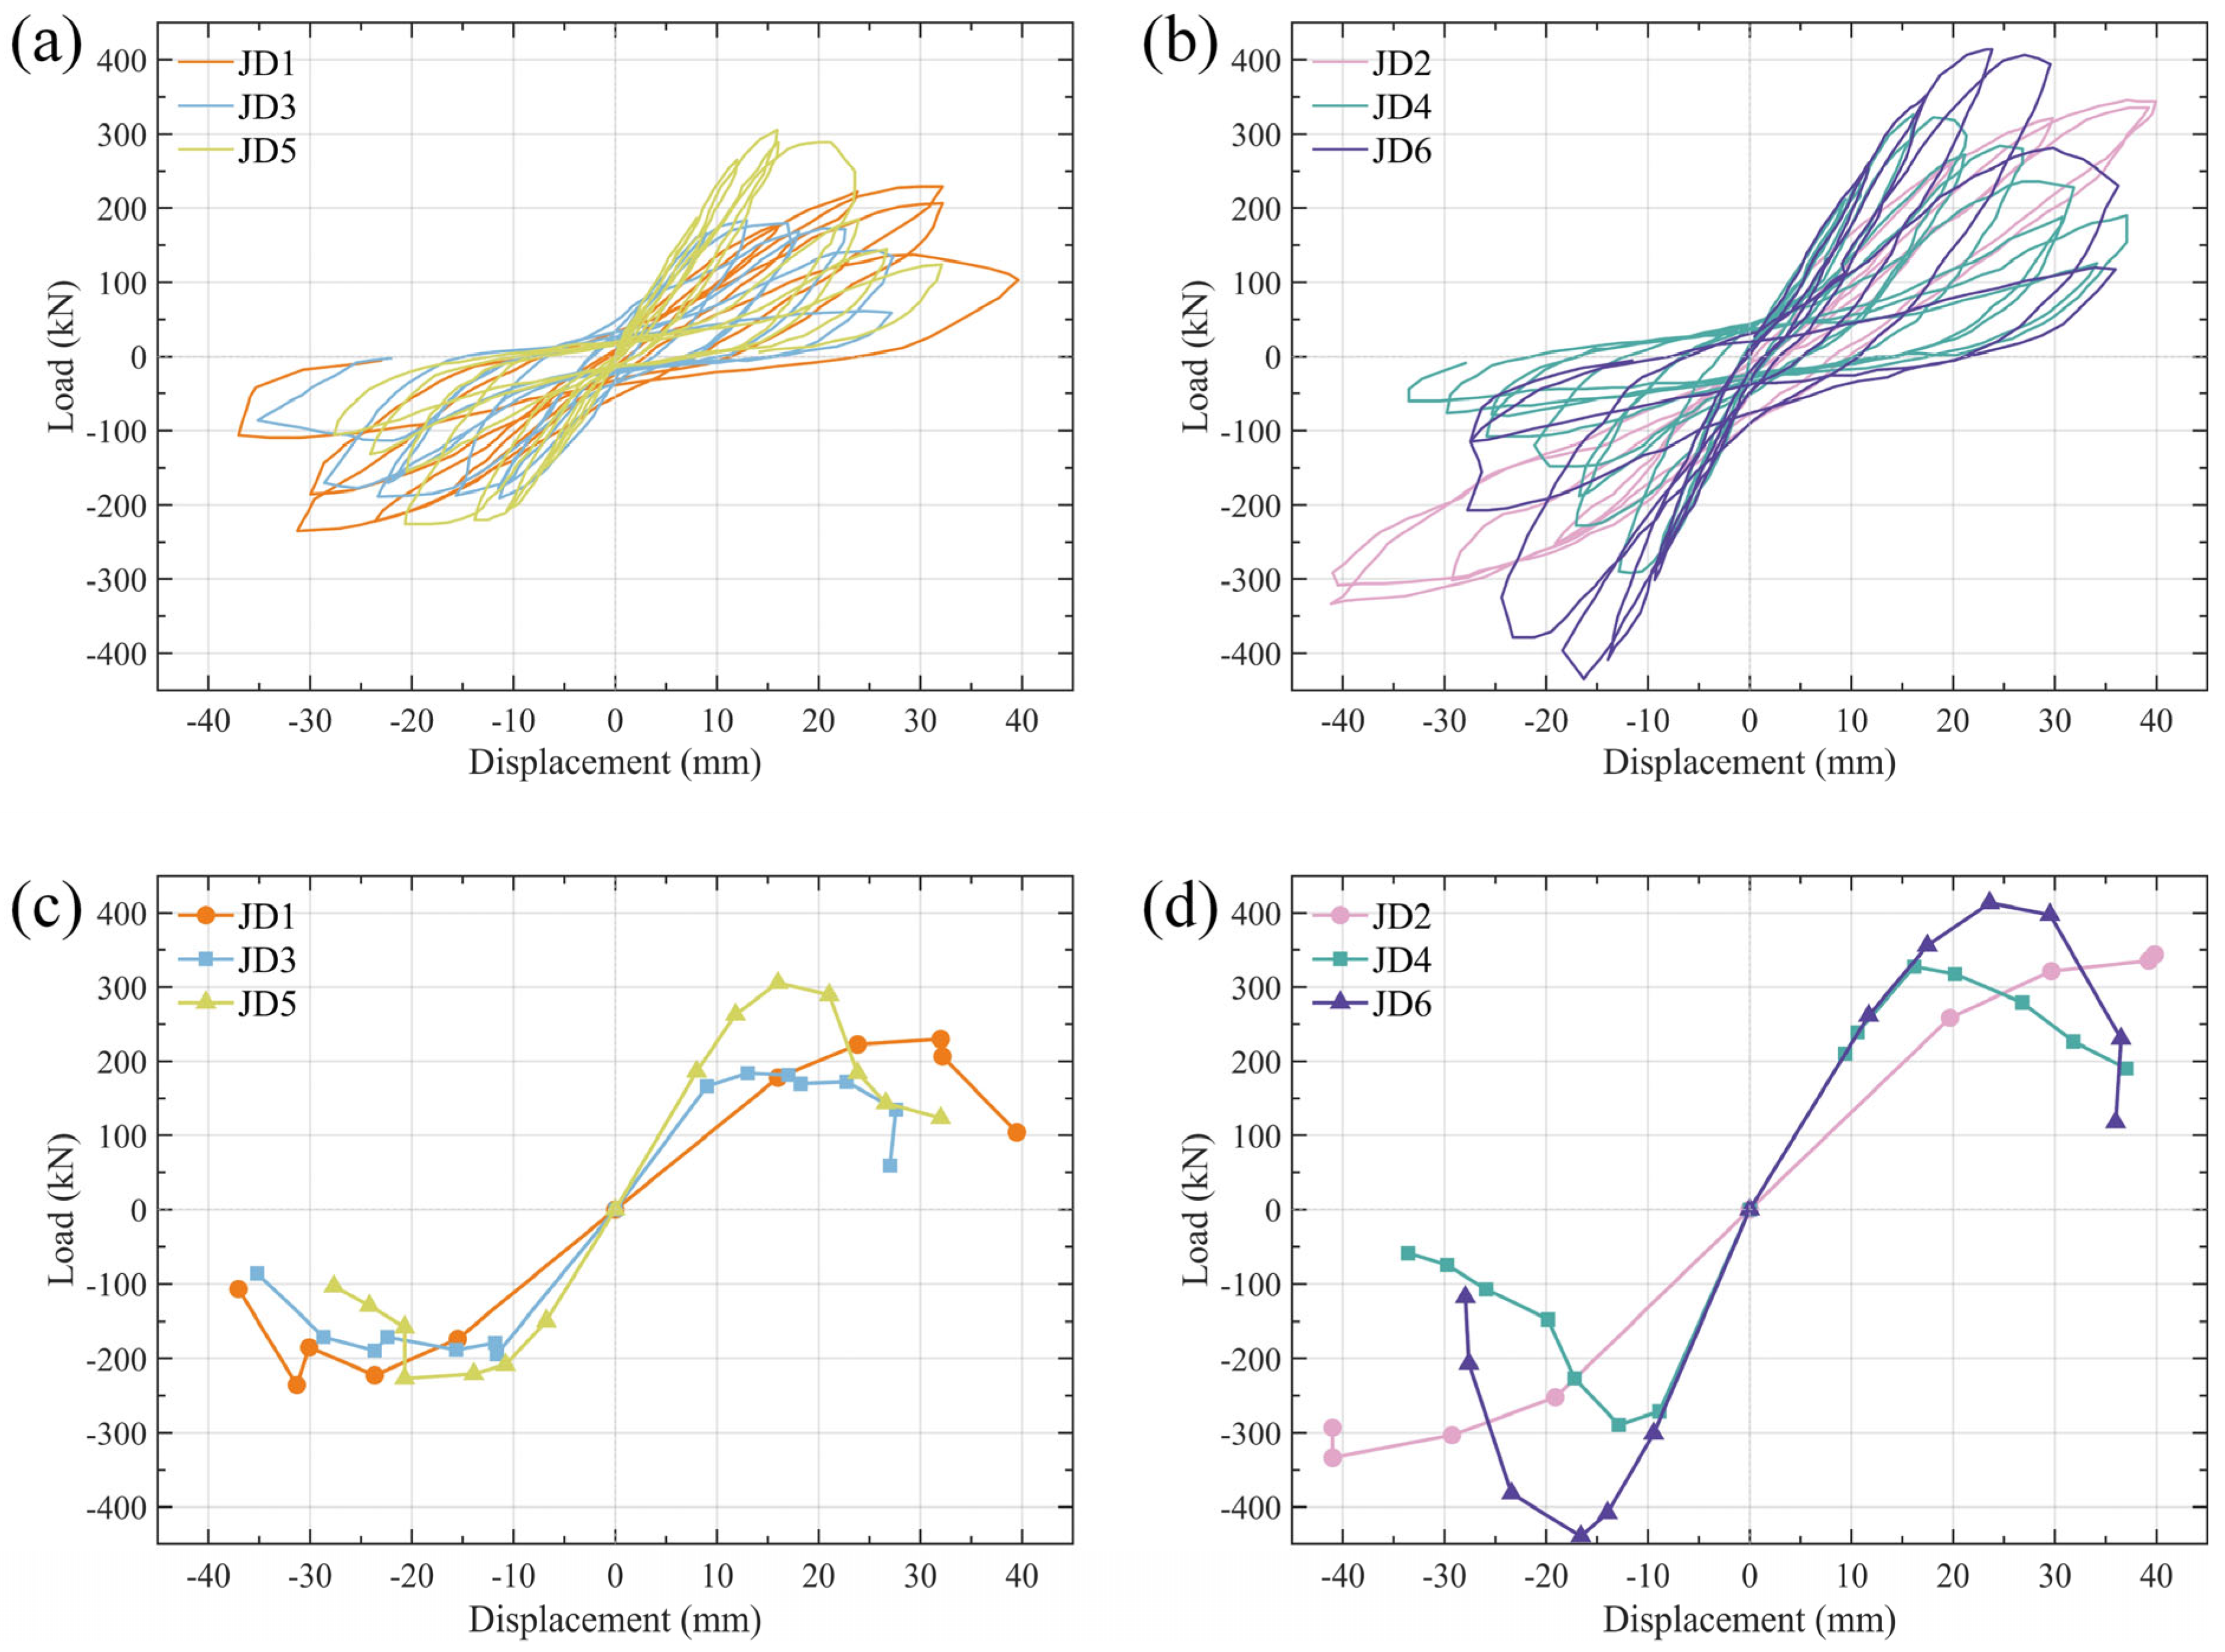
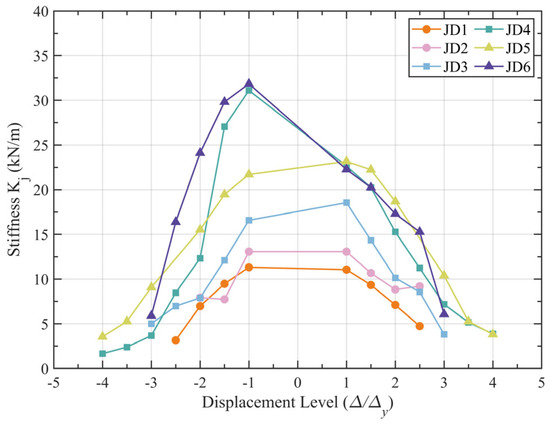
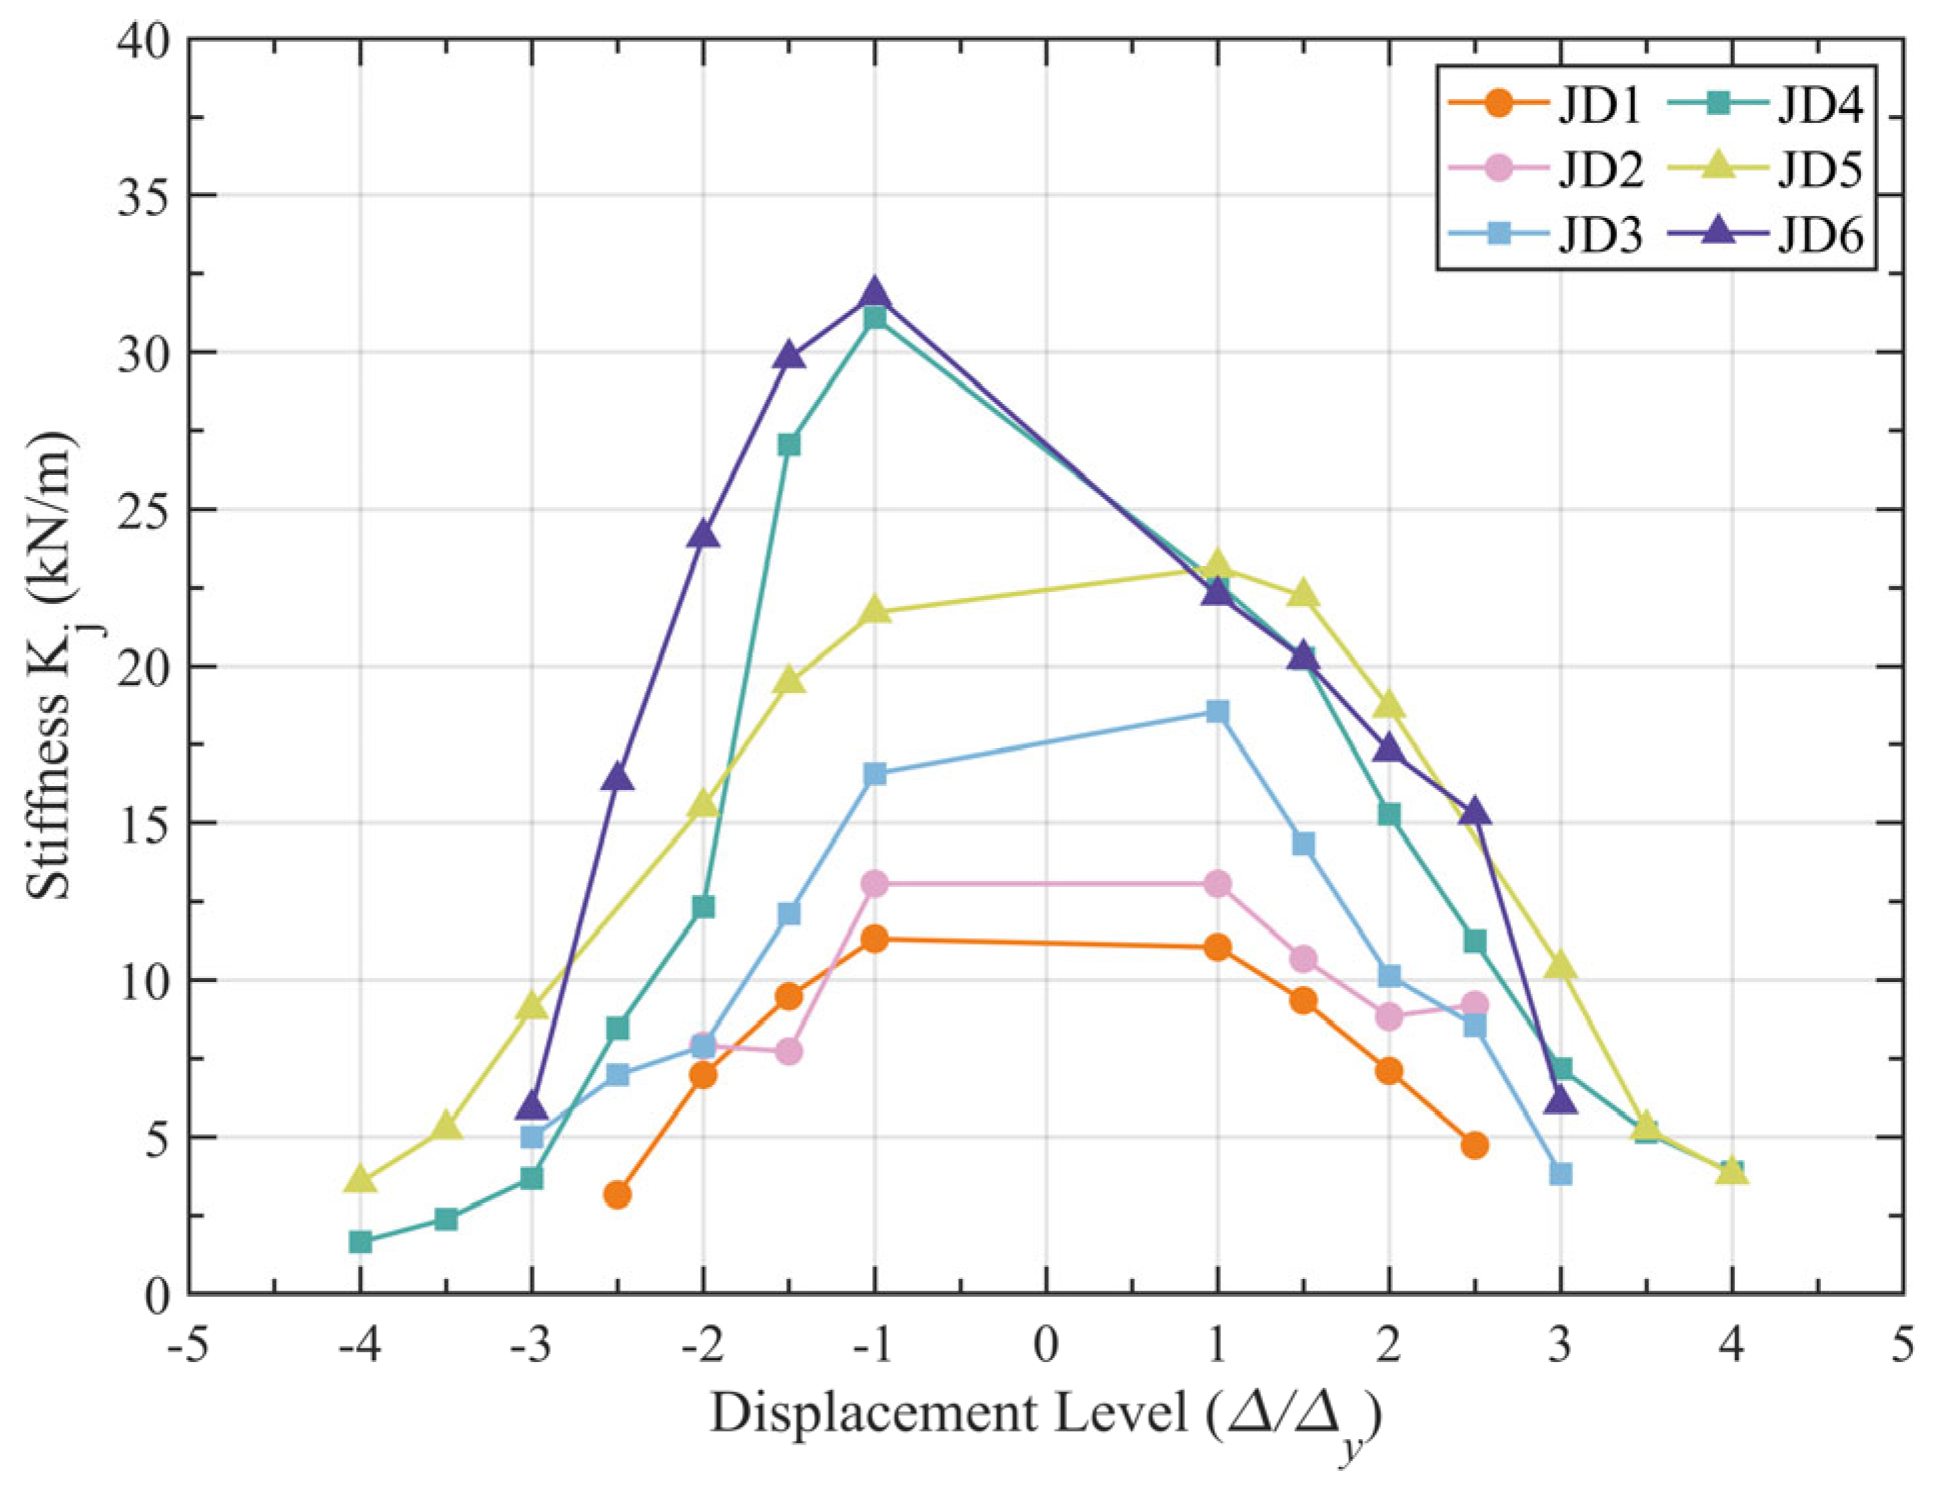
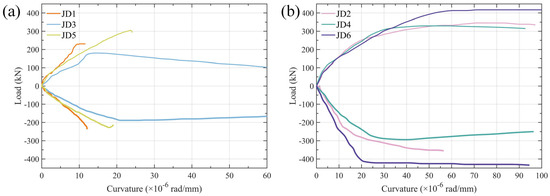
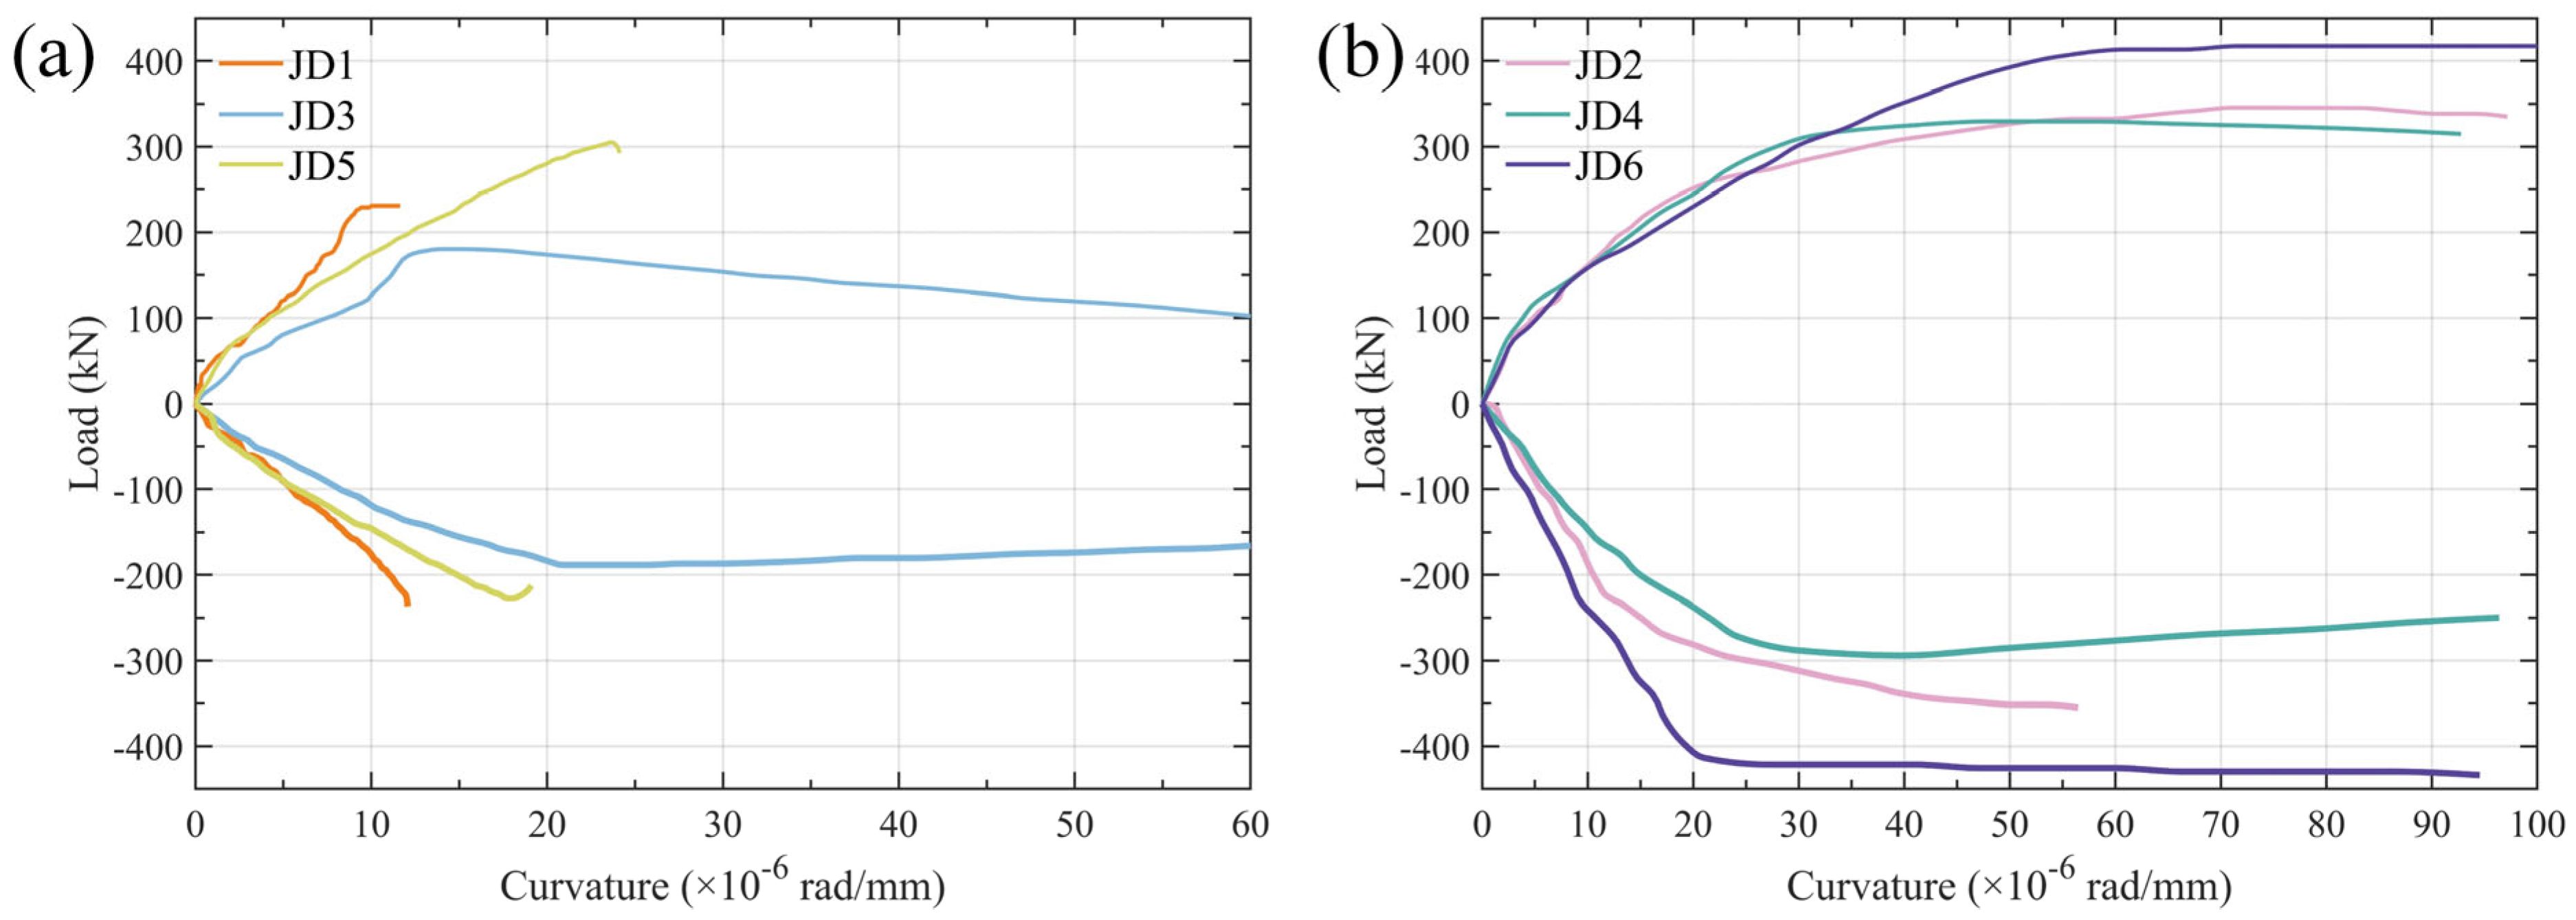
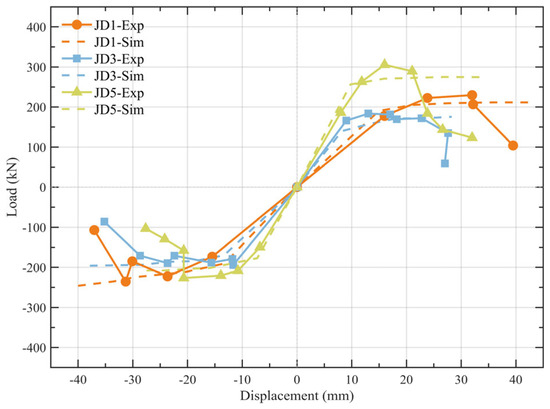
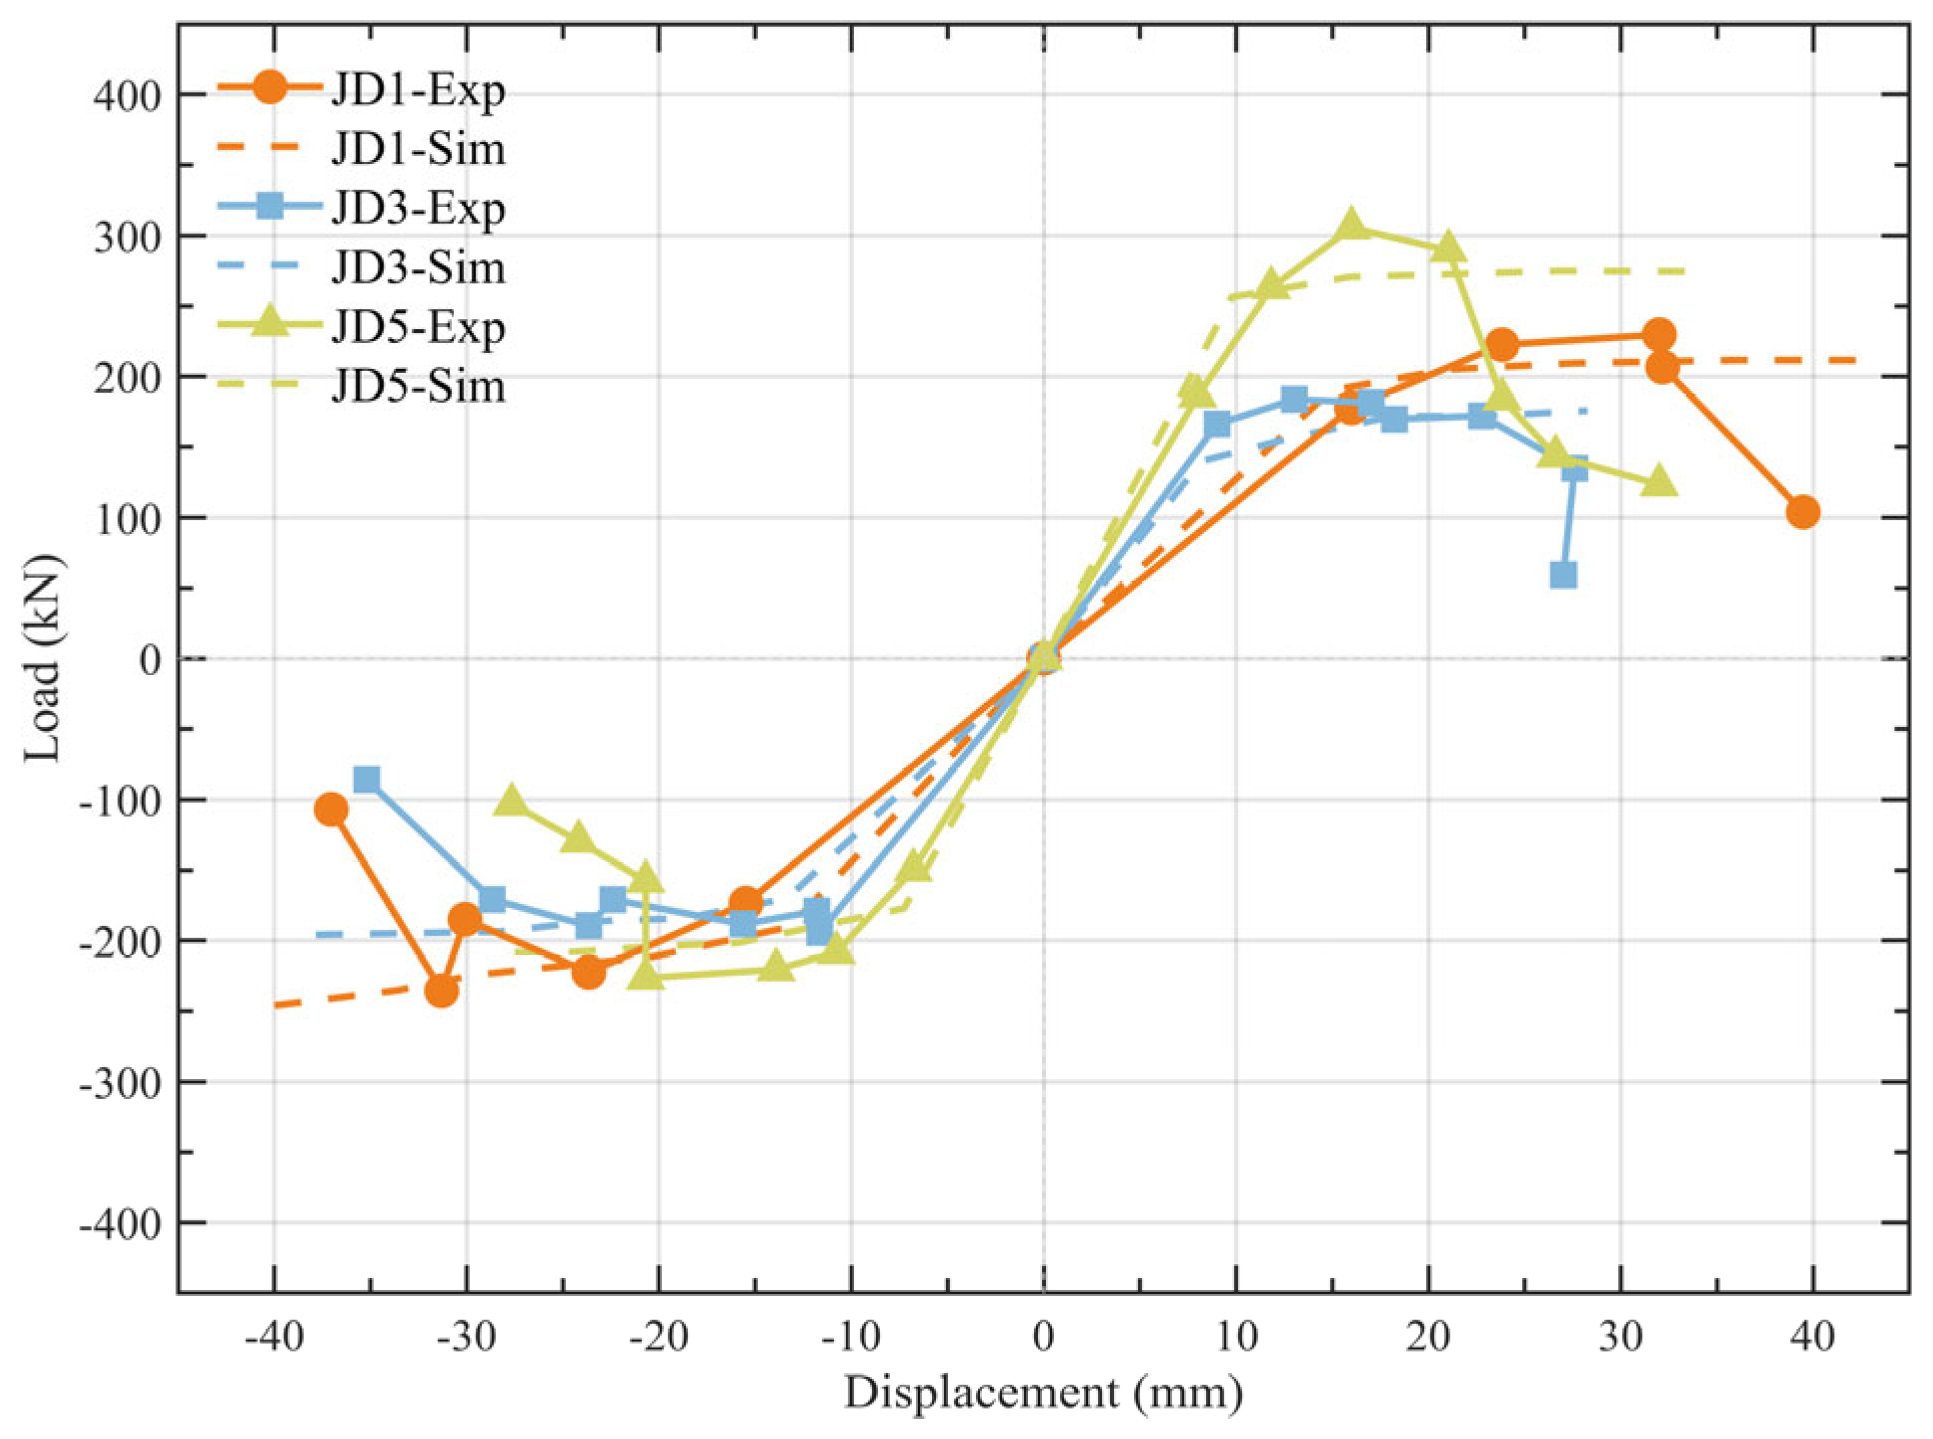
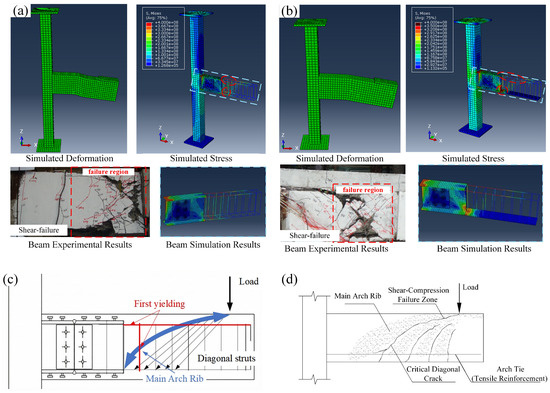
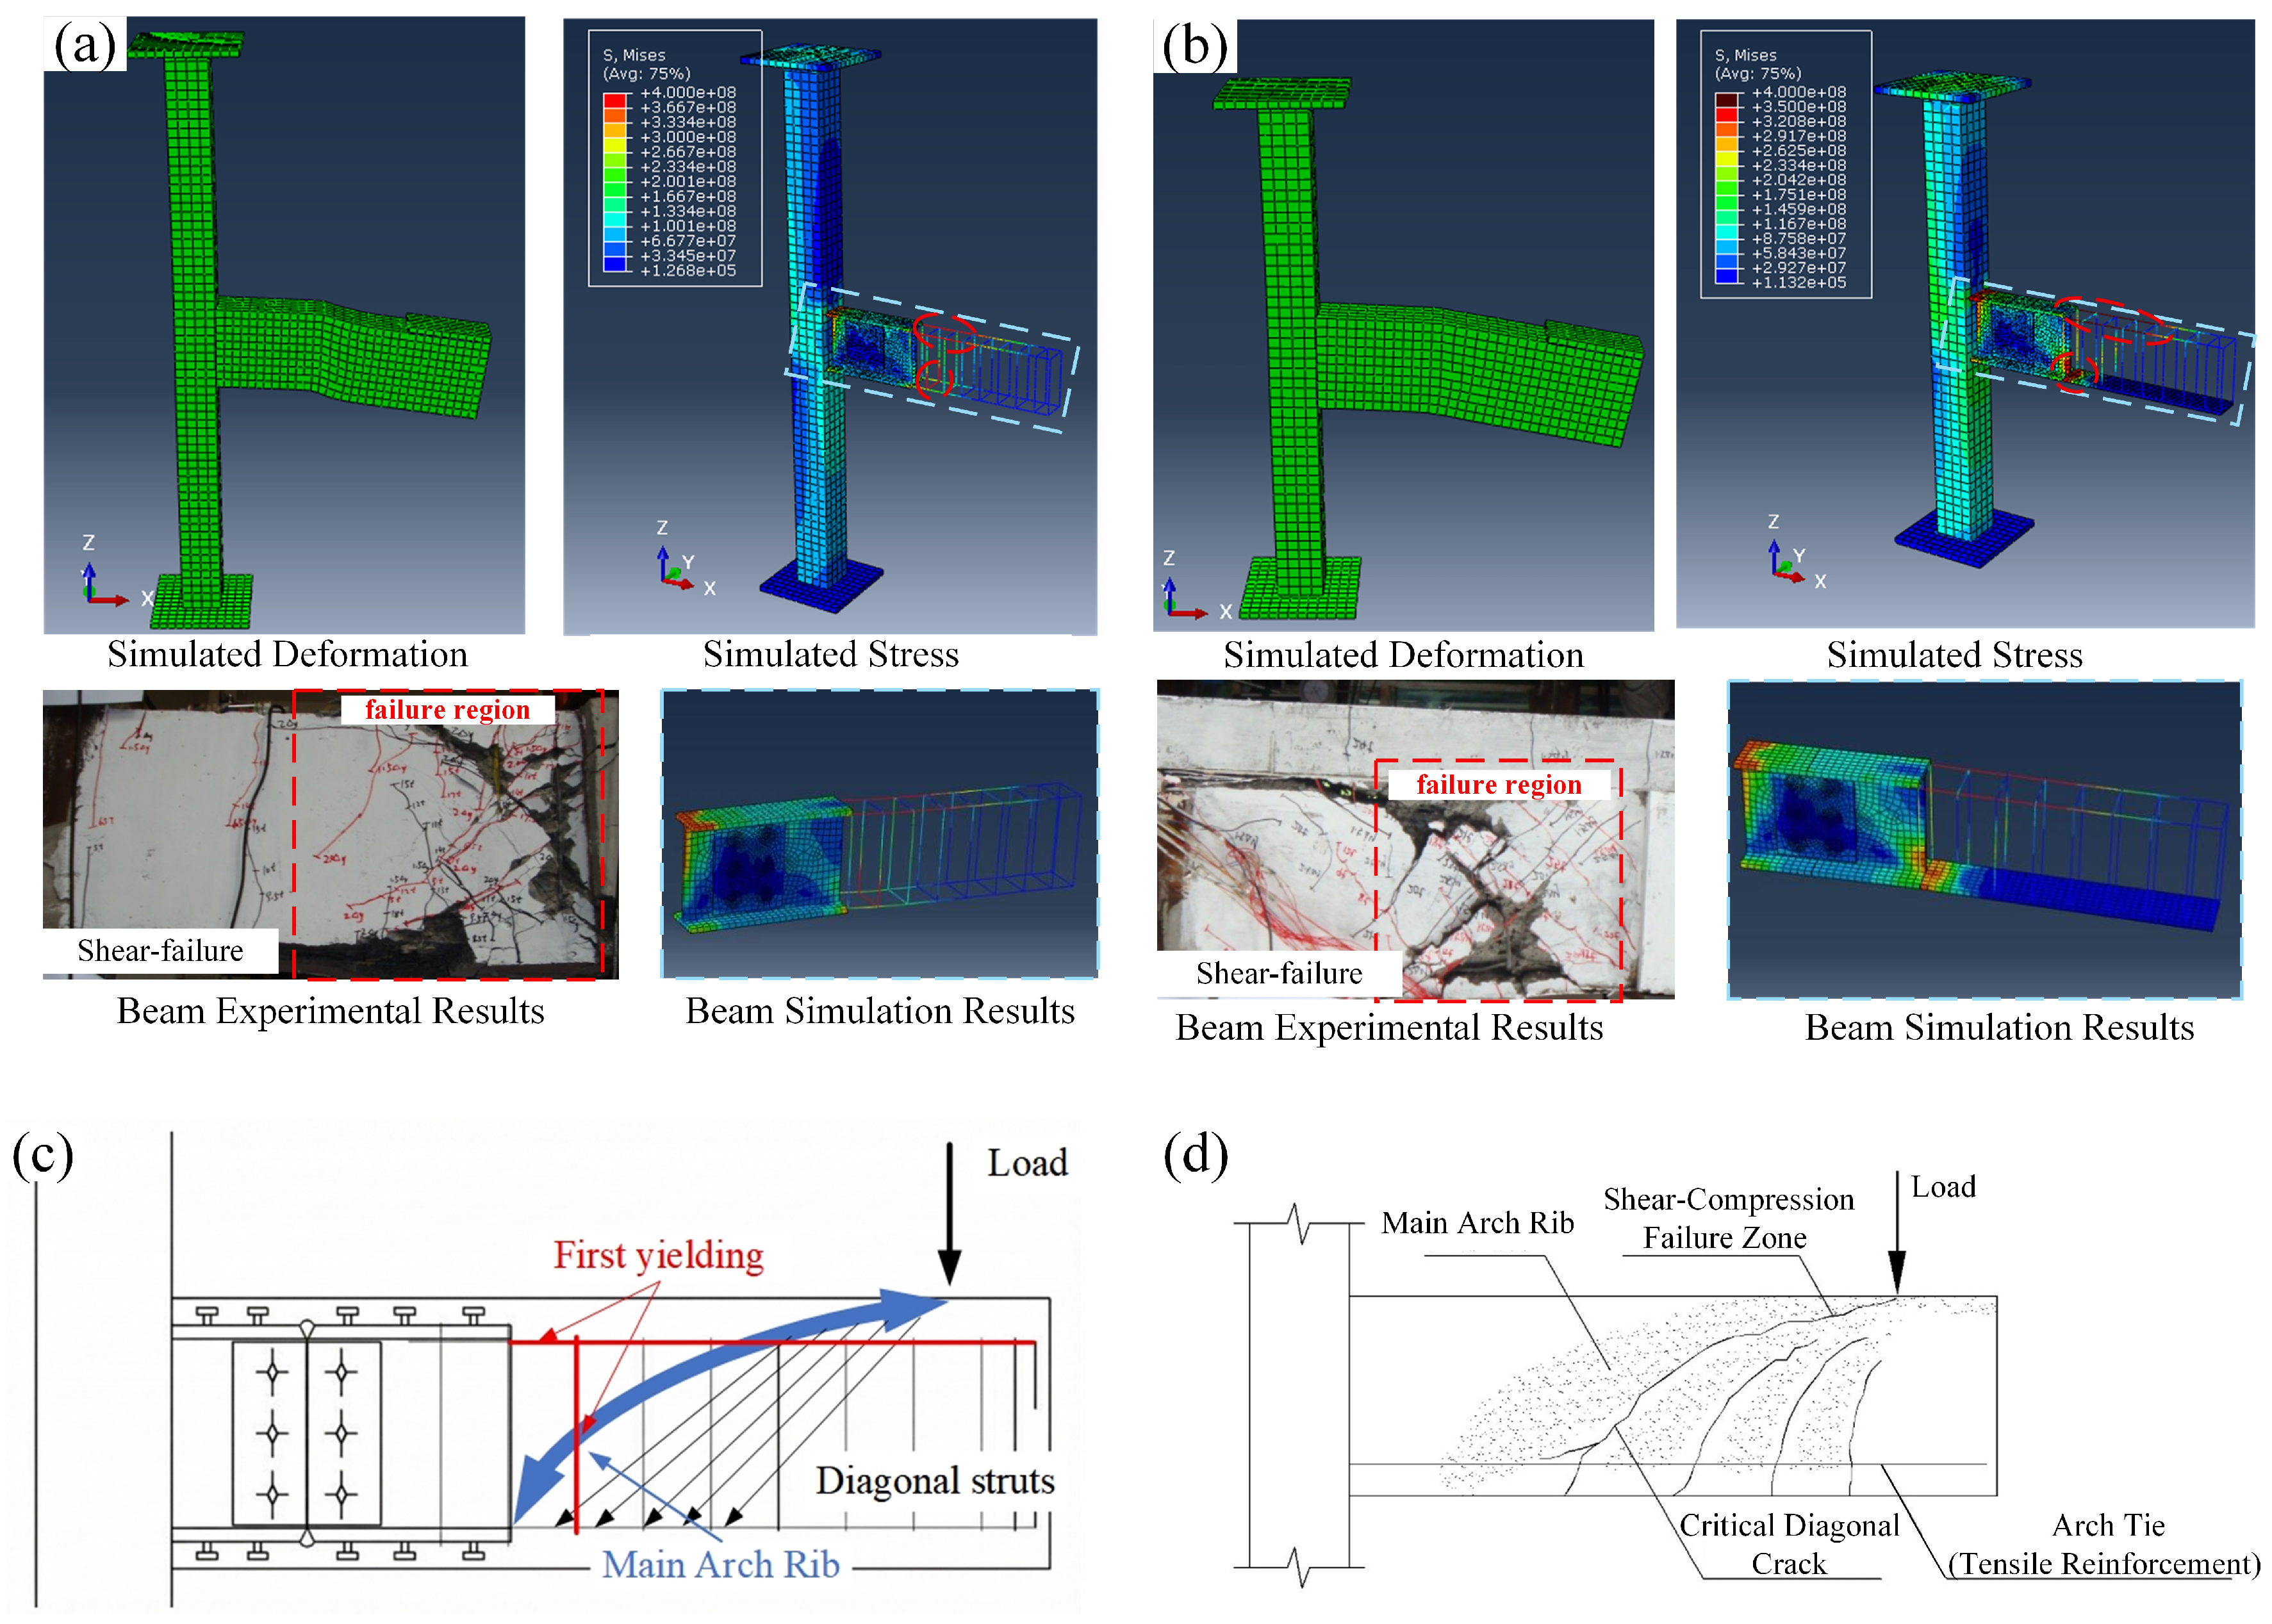
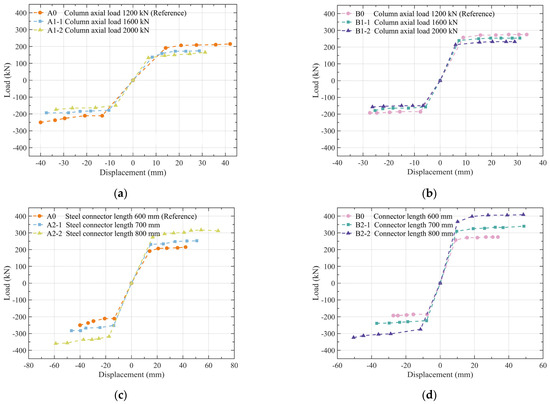
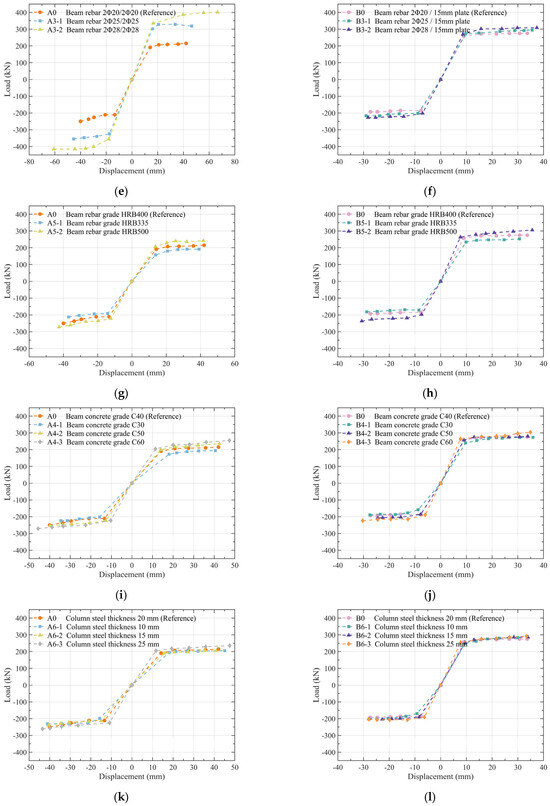
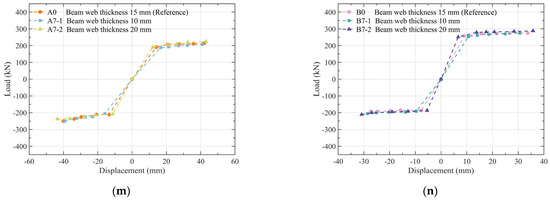
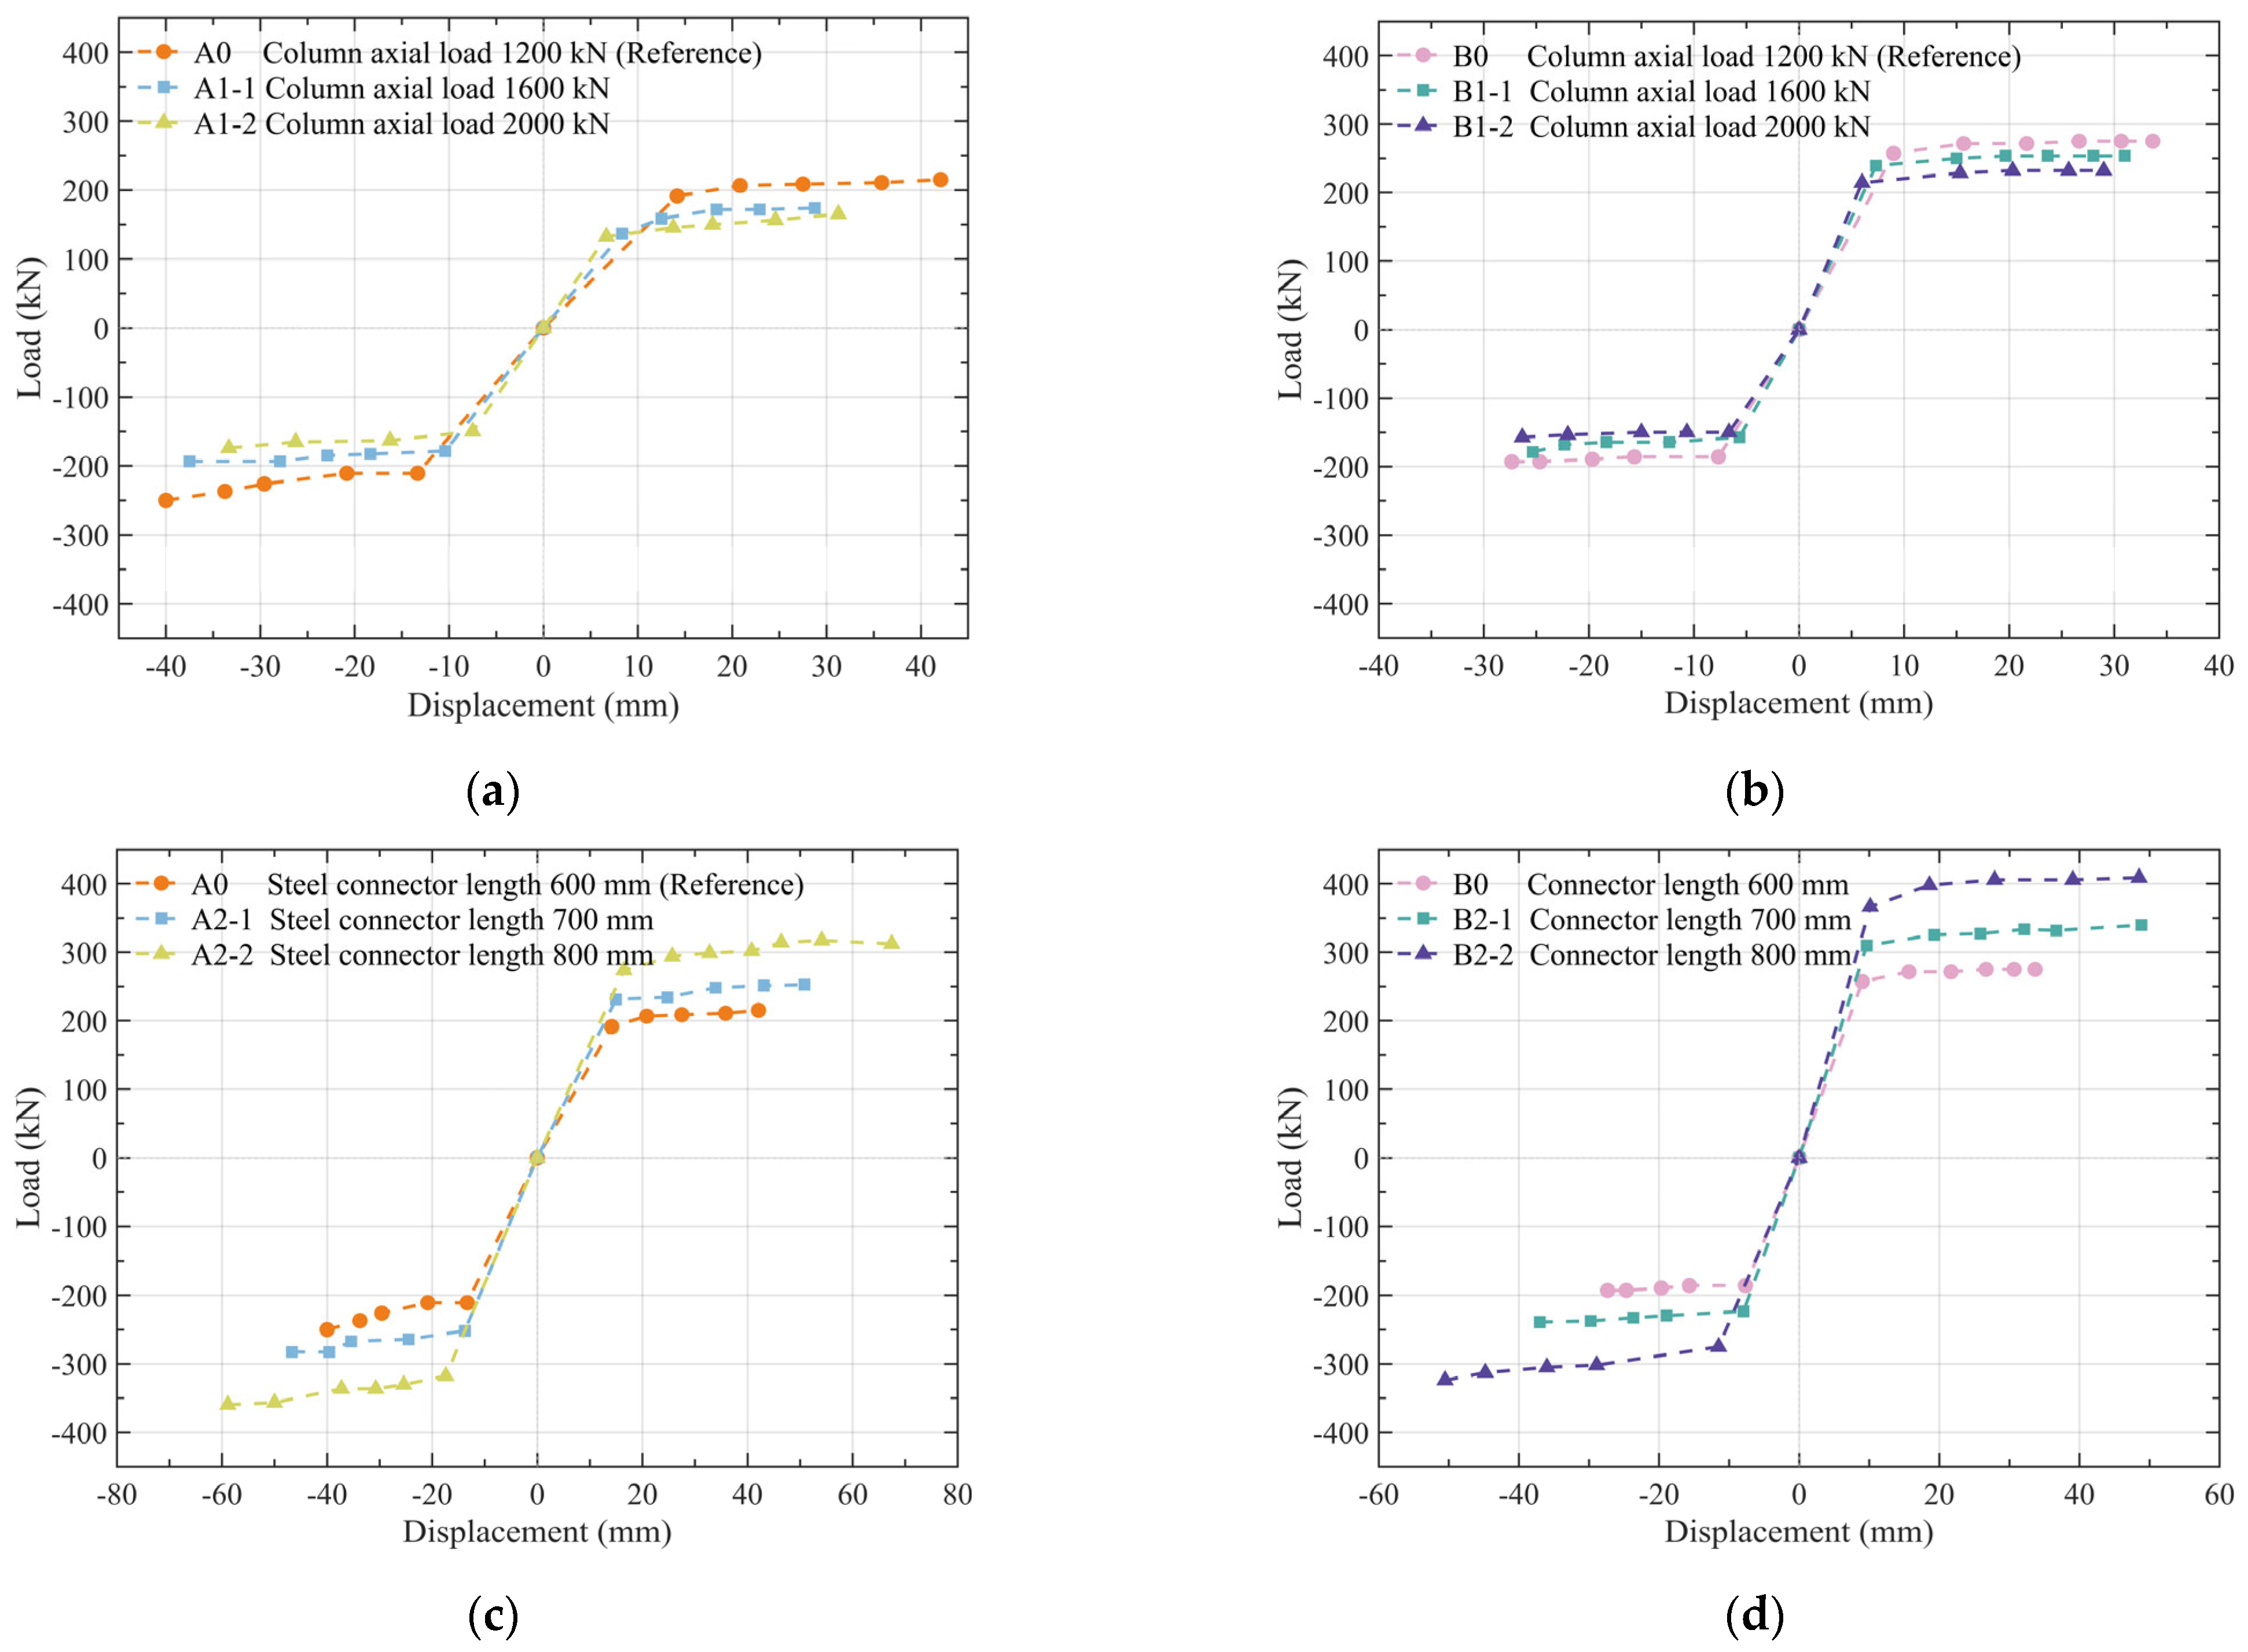
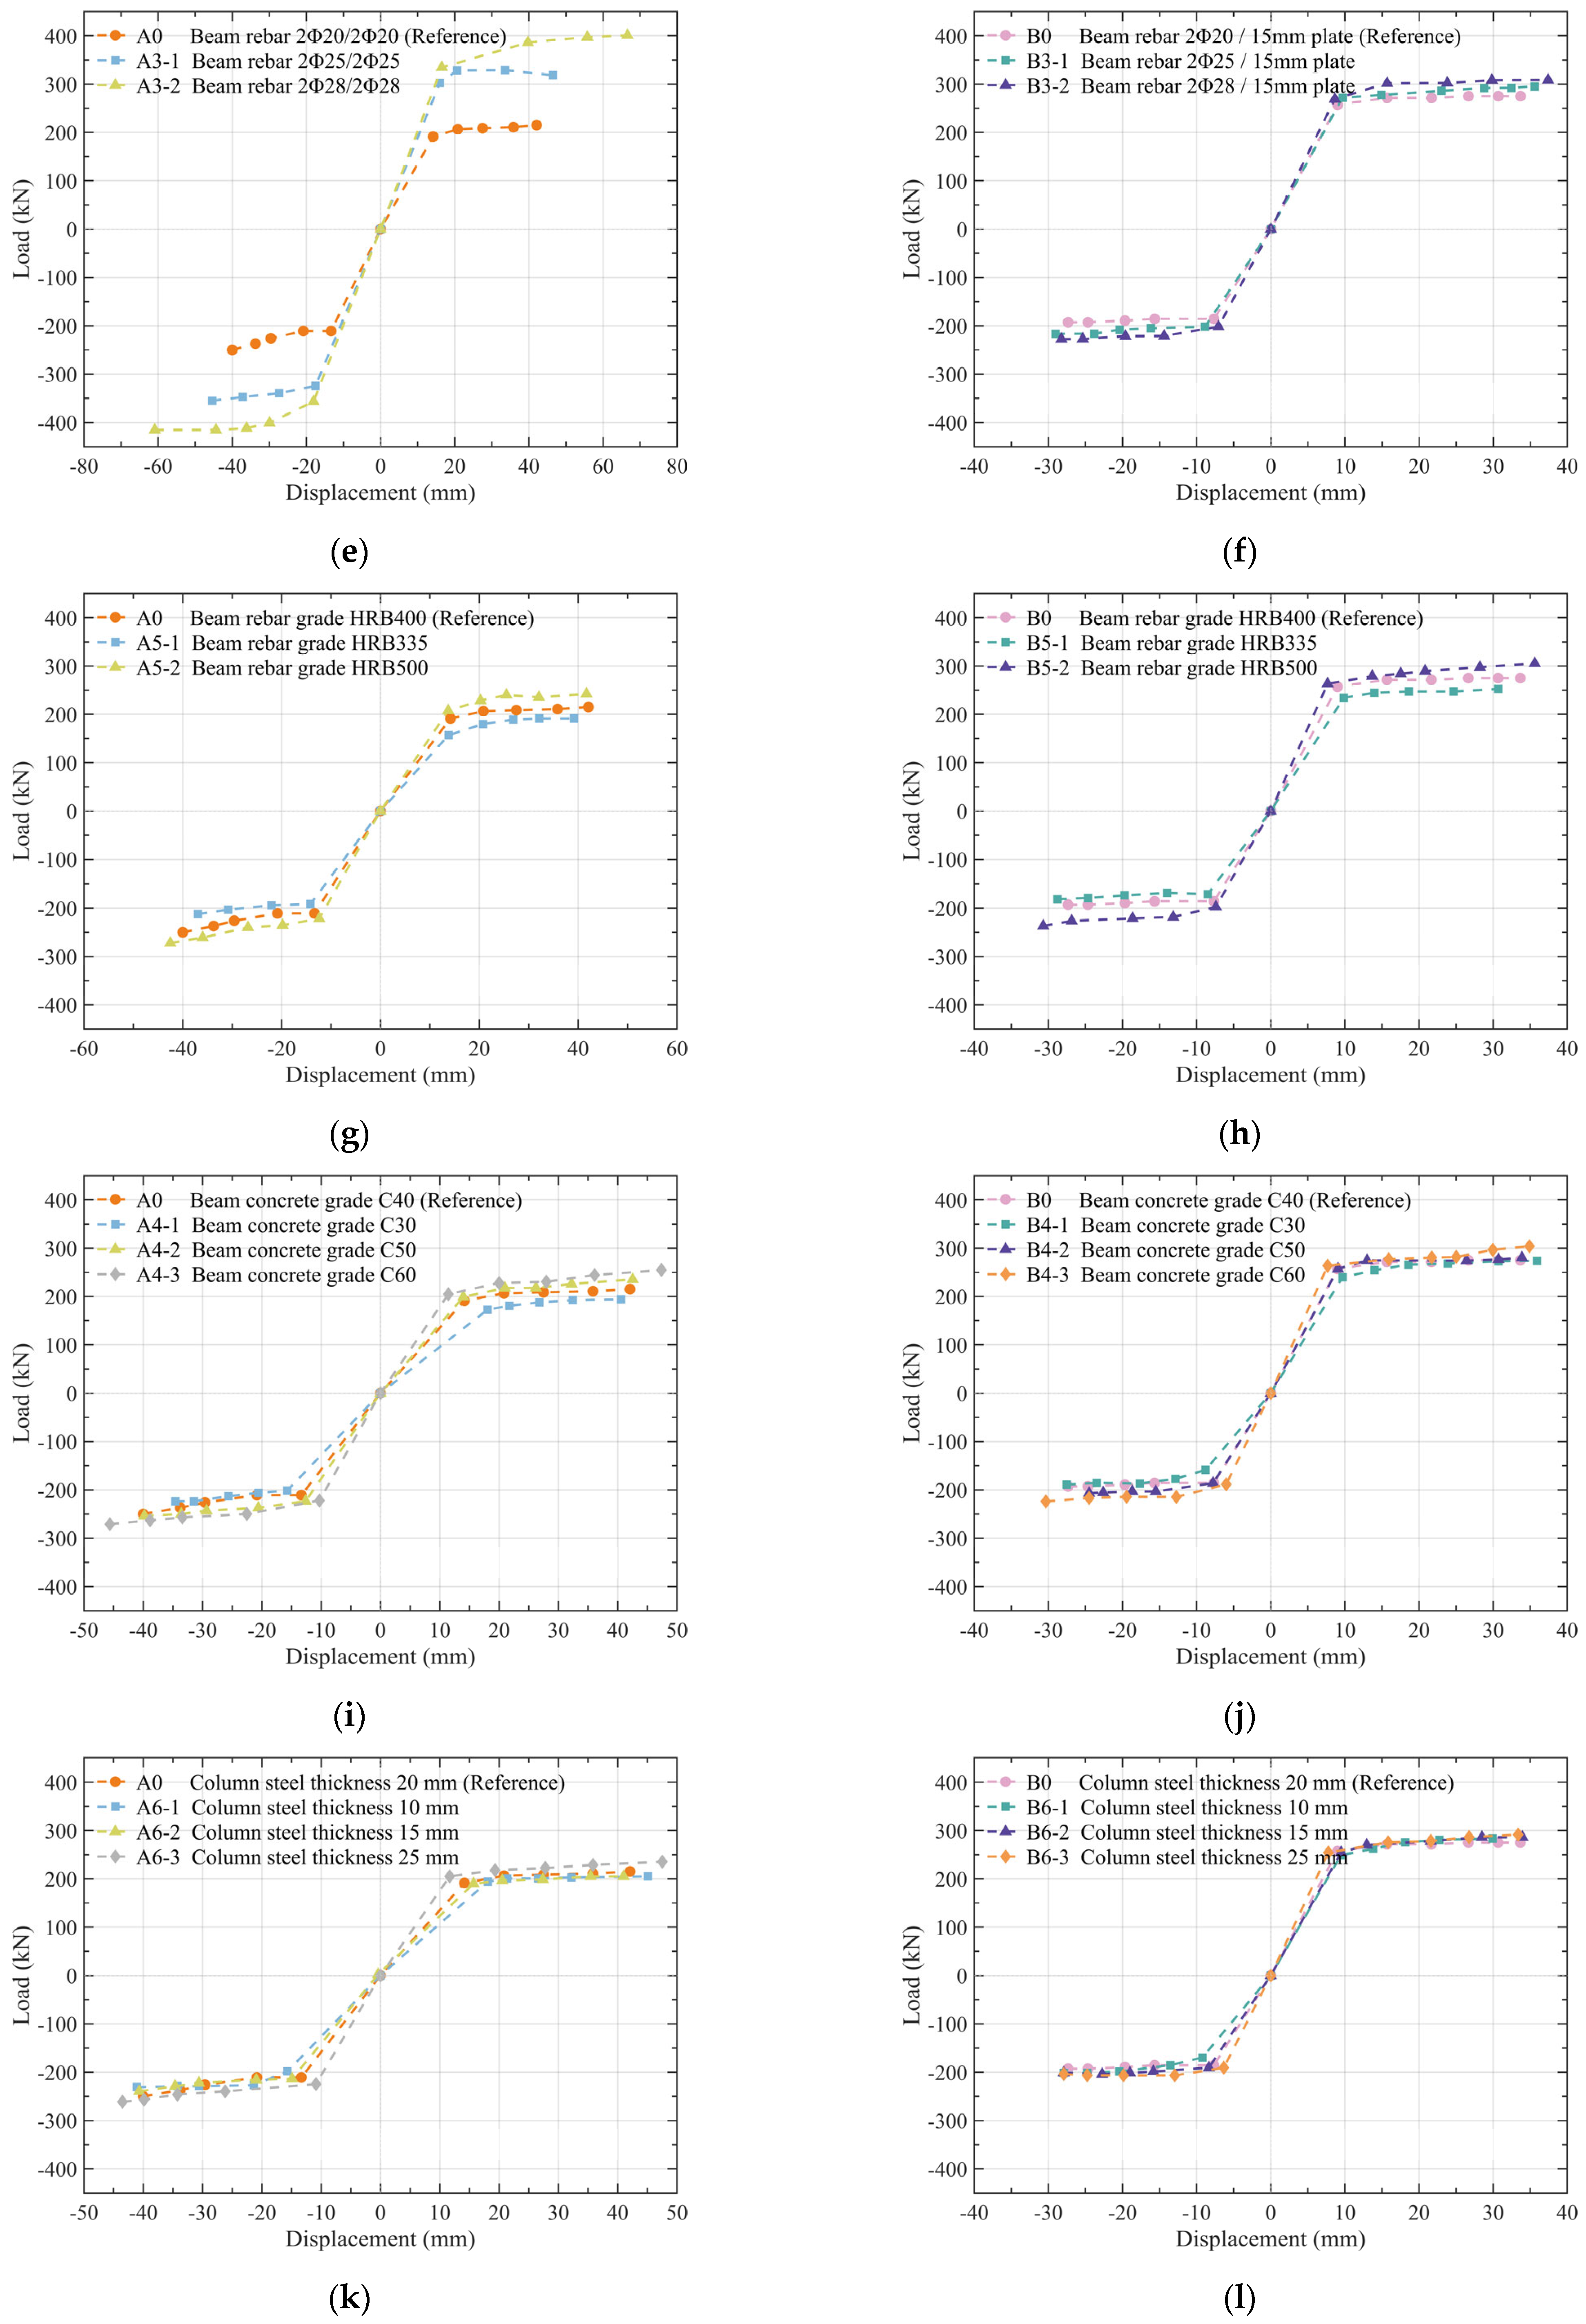
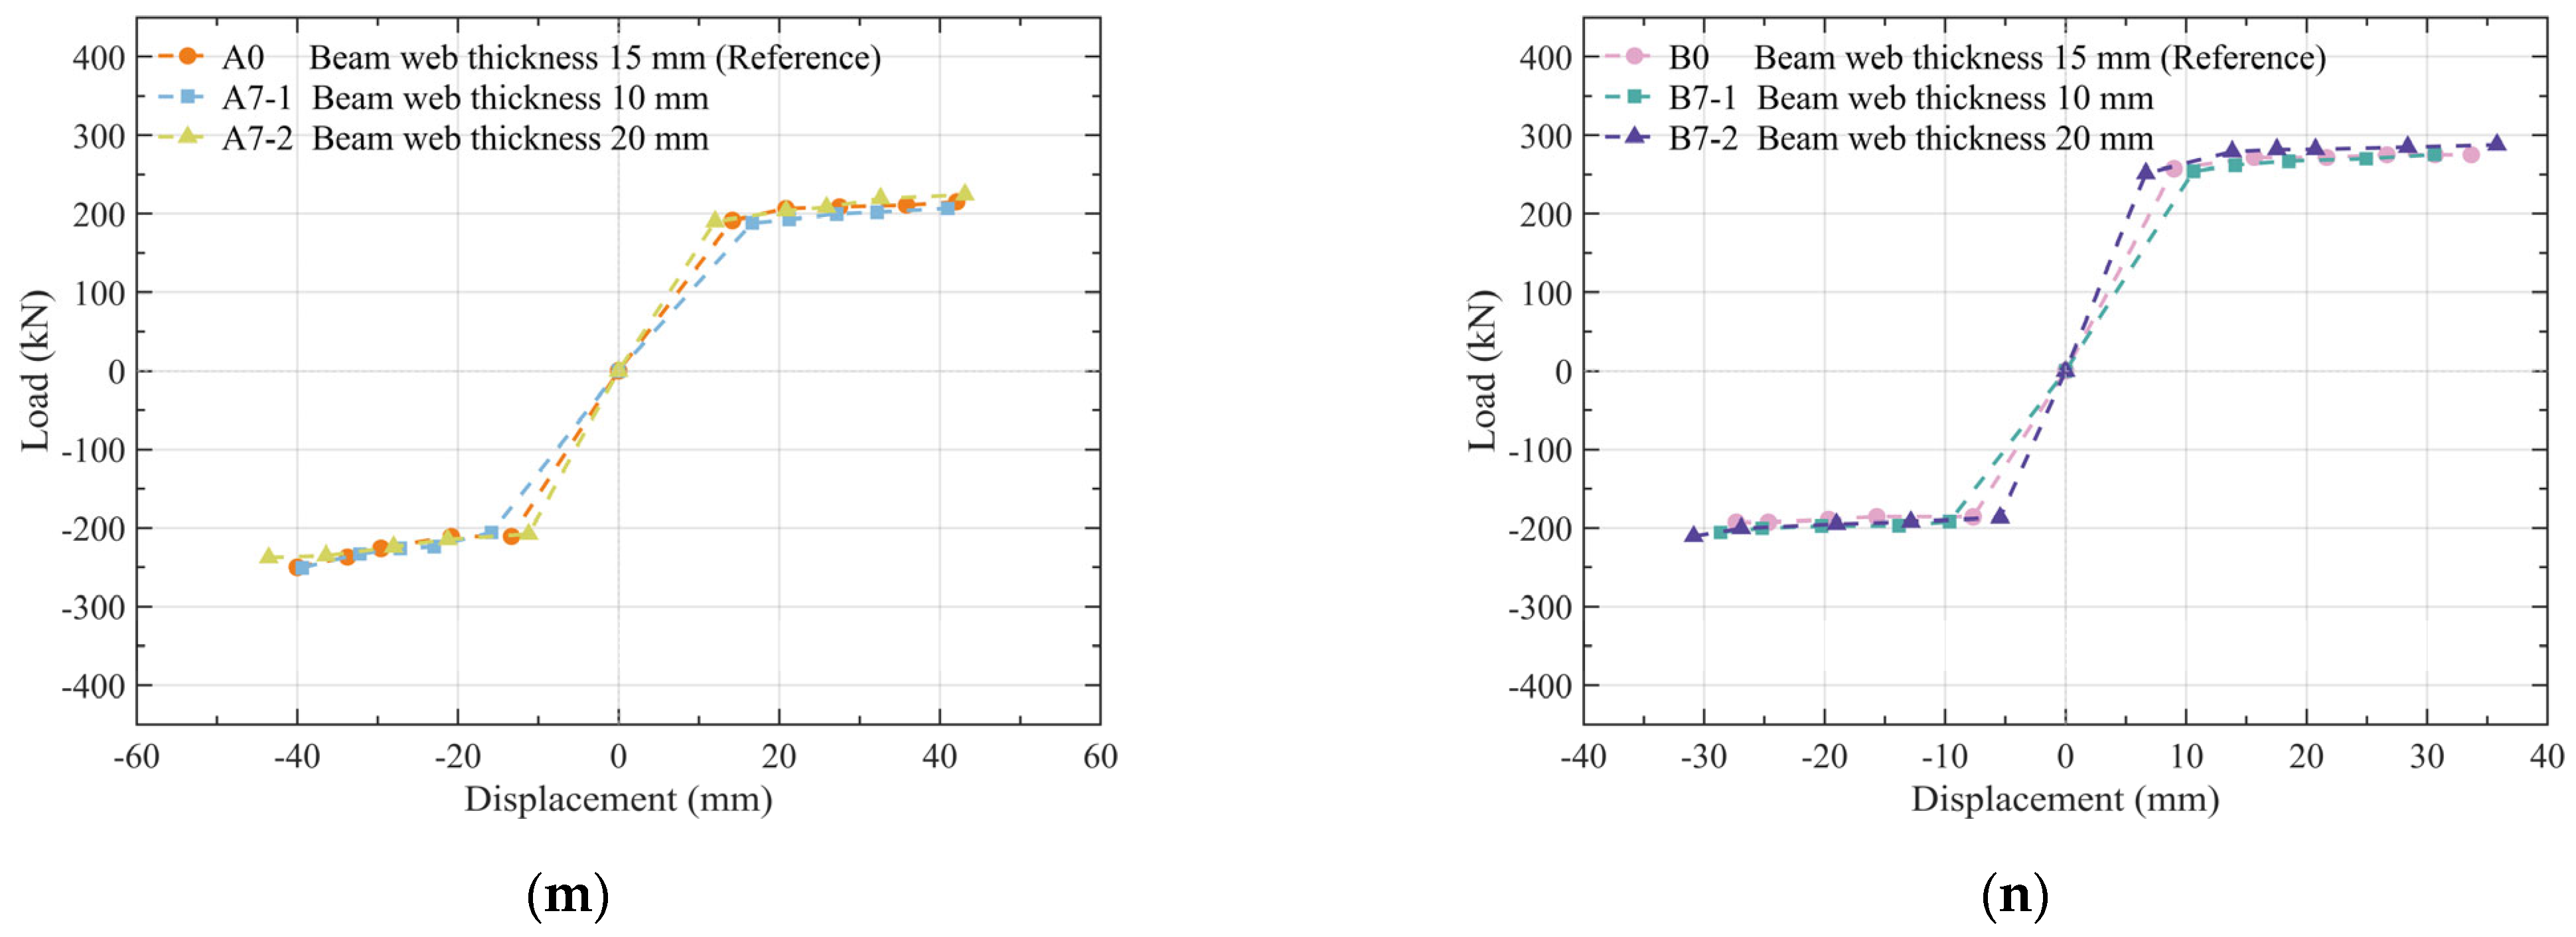

Disclaimer/Publisher’s Note: The statements, opinions and data contained in all publications are solely those of the individual author(s) and contributor(s) and not of MDPI and/or the editor(s). MDPI and/or the editor(s) disclaim responsibility for any injury to people or property resulting from any ideas, methods, instructions or products referred to in the content. |
© 2026 by the authors. Licensee MDPI, Basel, Switzerland. This article is an open access article distributed under the terms and conditions of the Creative Commons Attribution (CC BY) license.