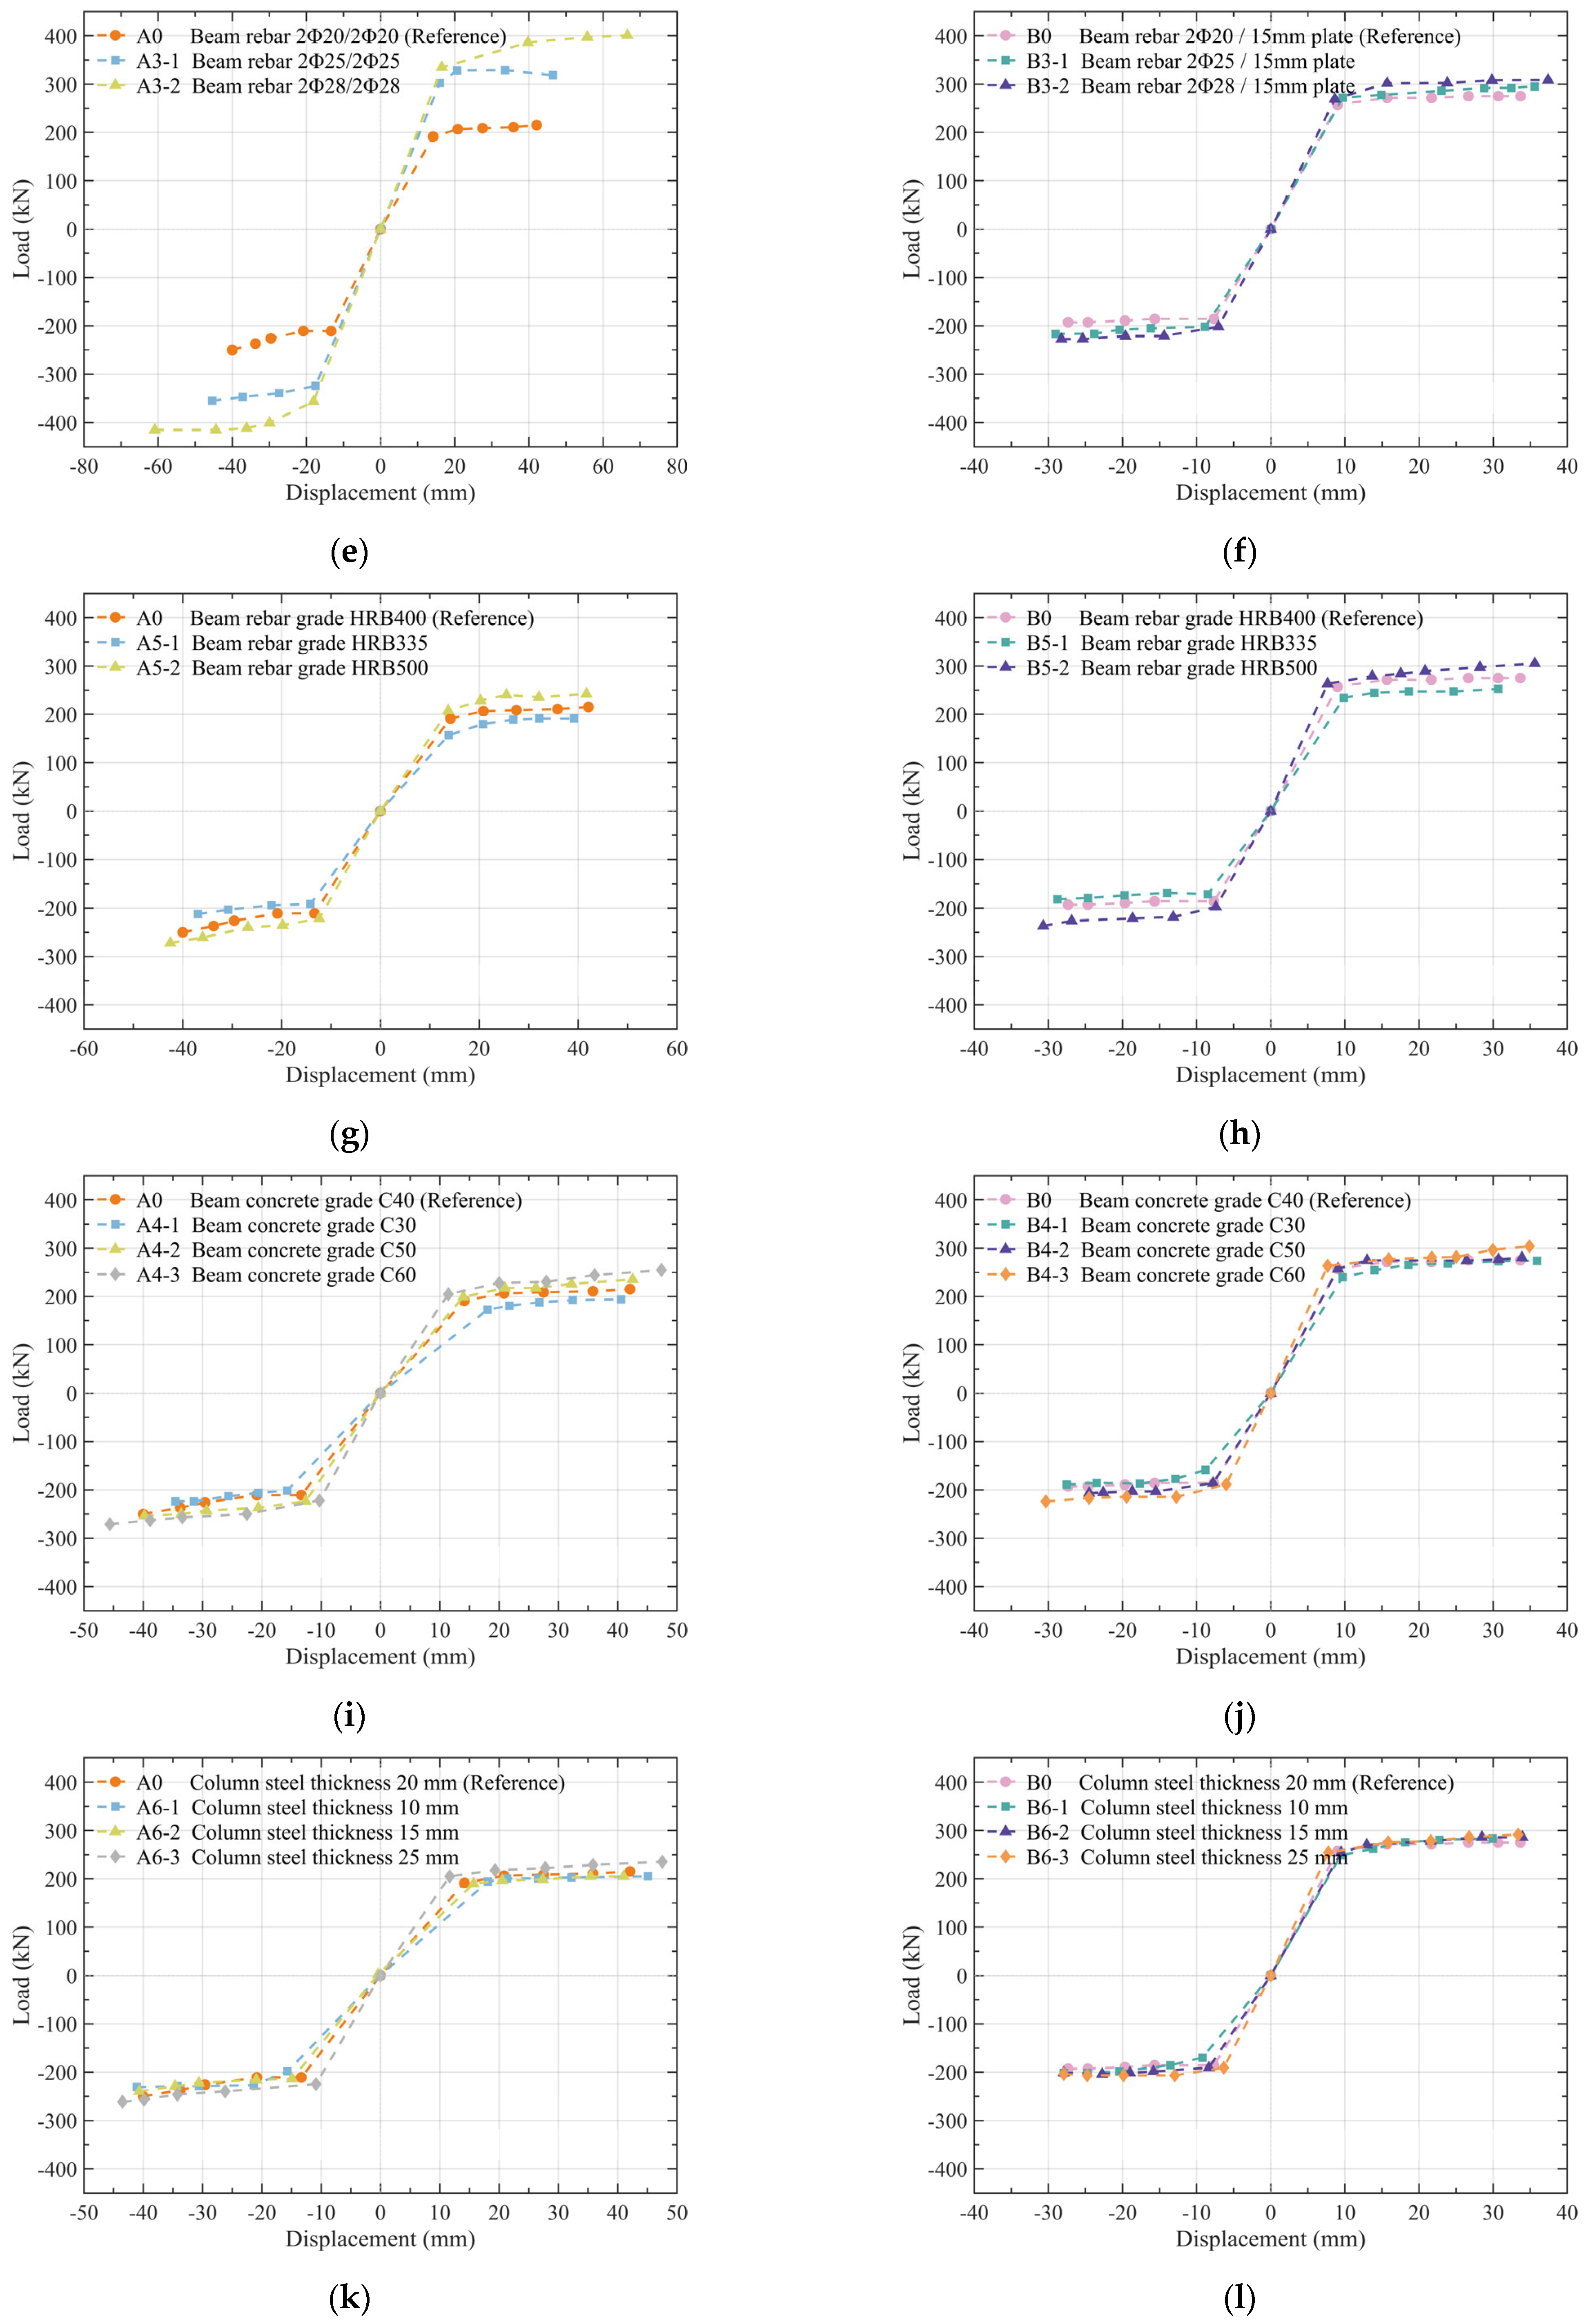
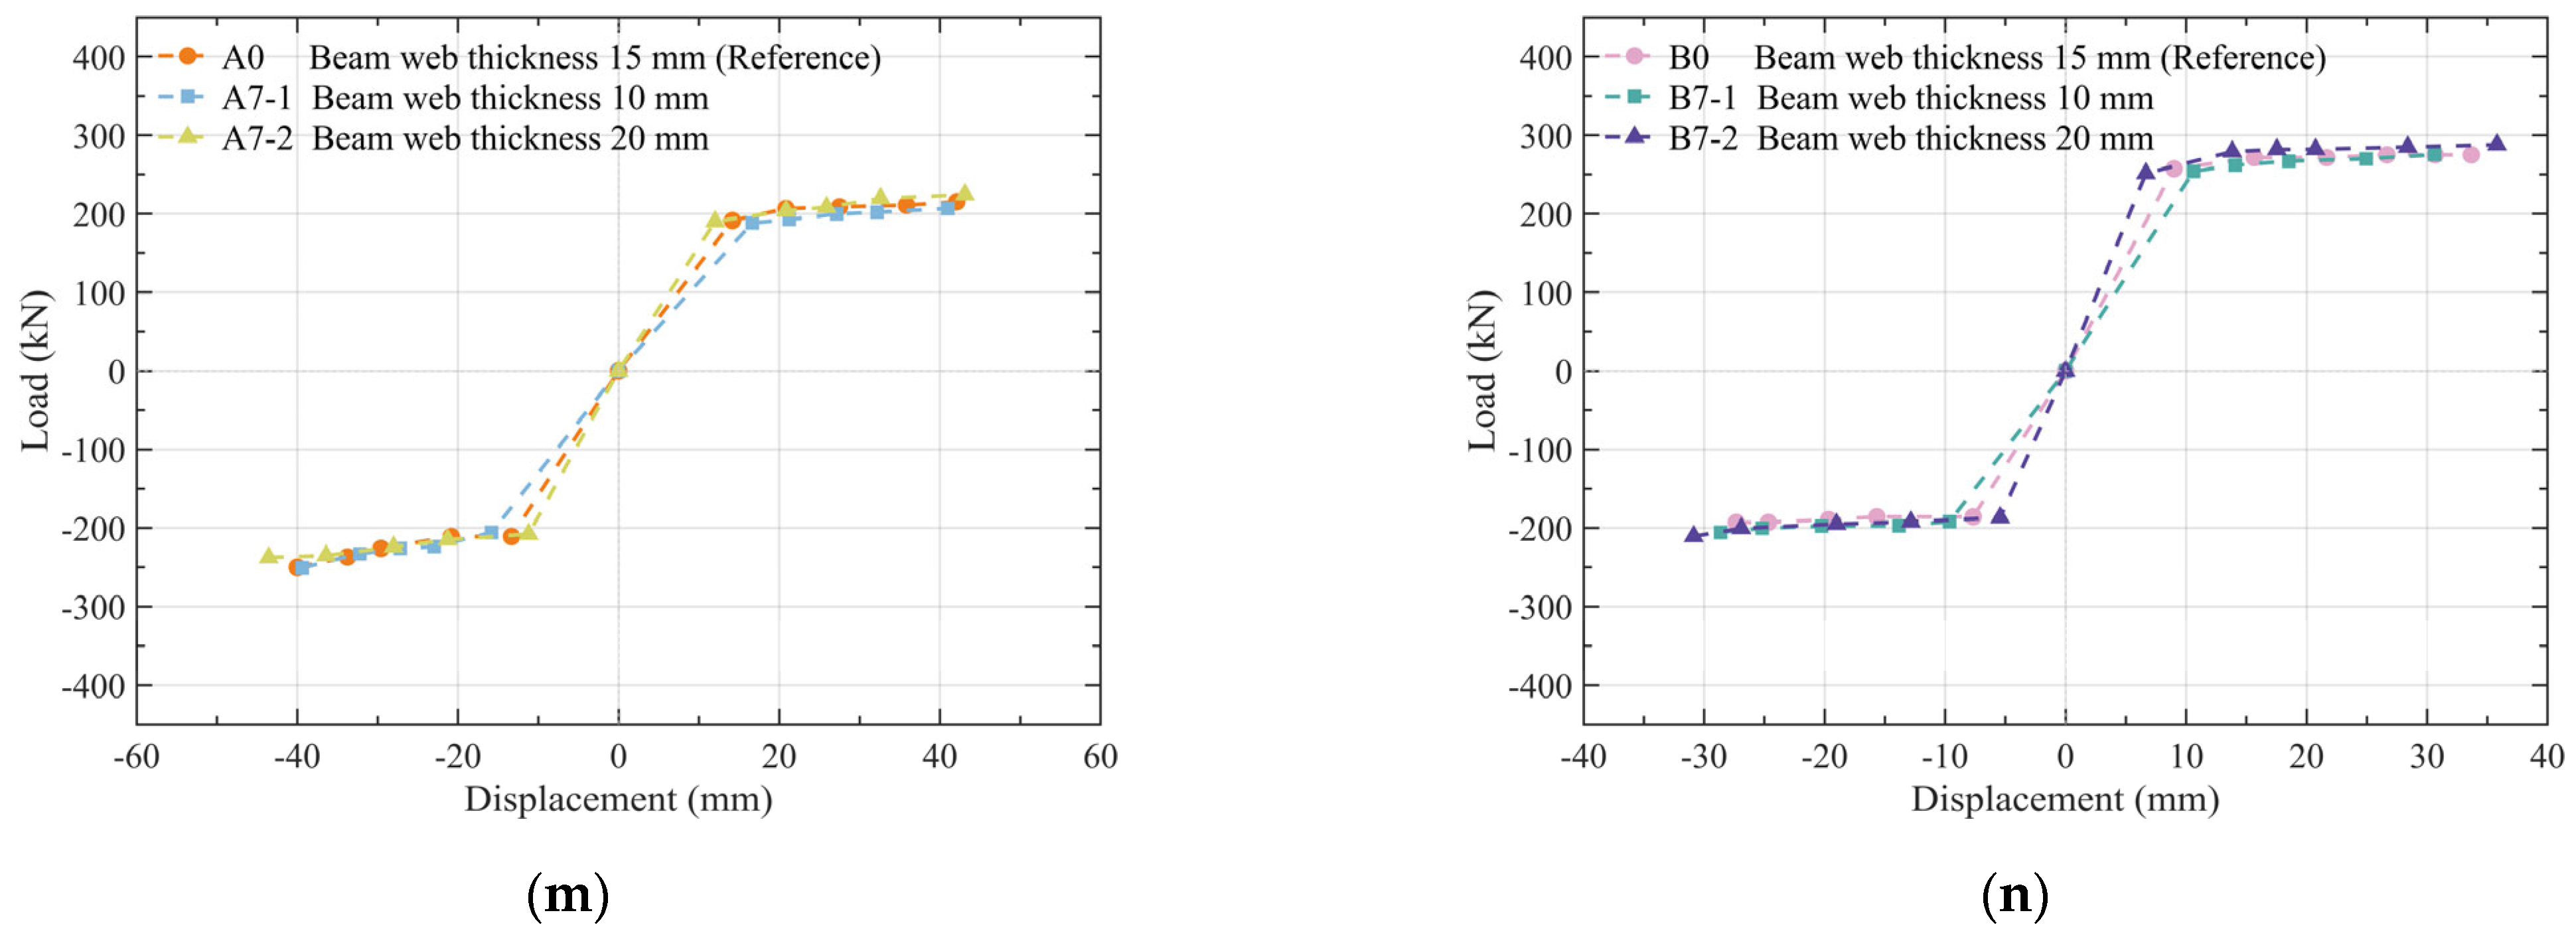
3.1. Experimental Phenomena and Failure Characteristics
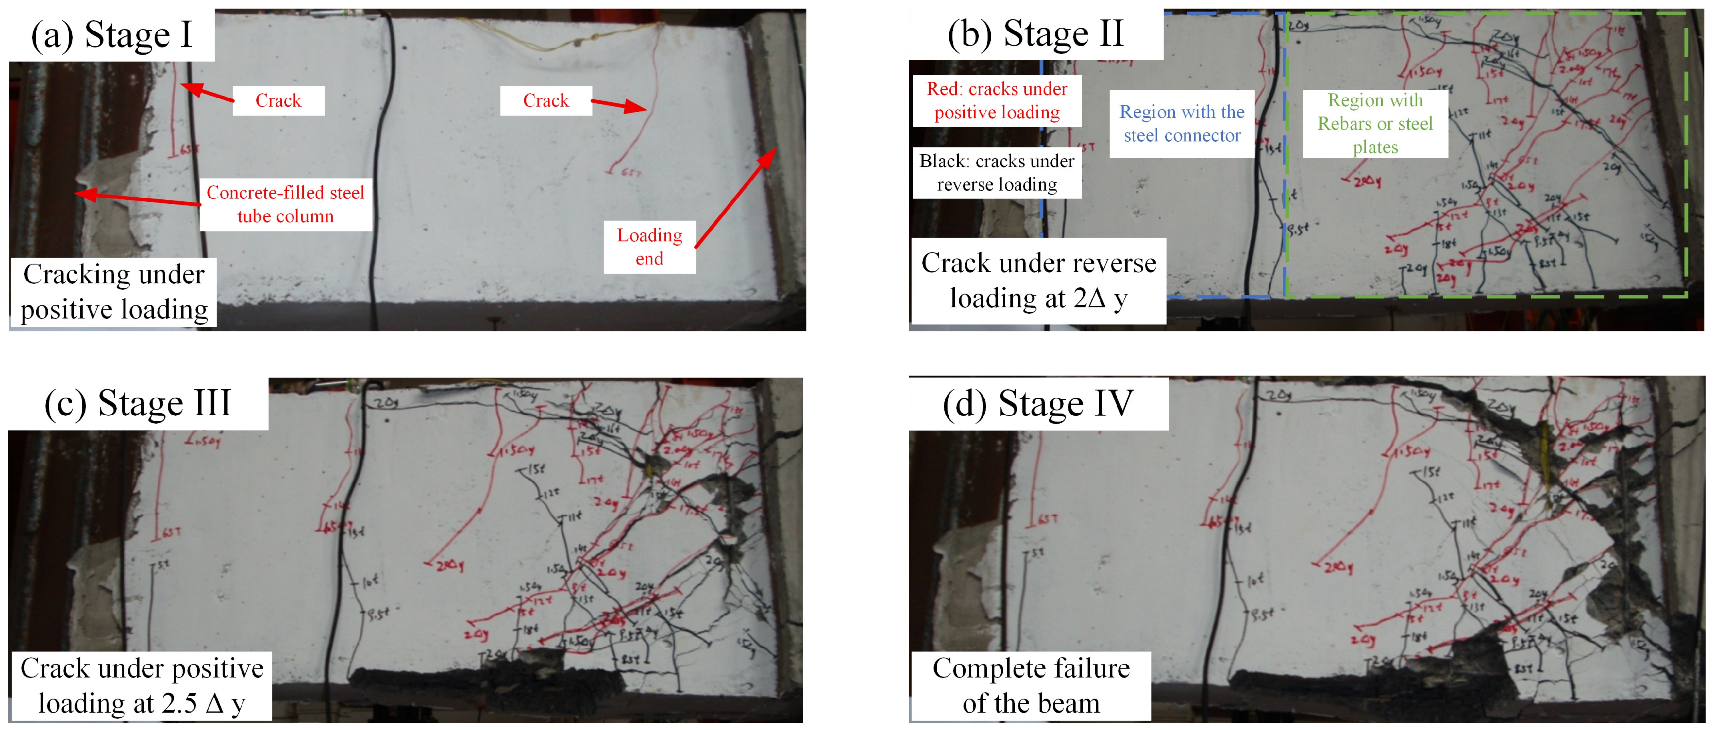
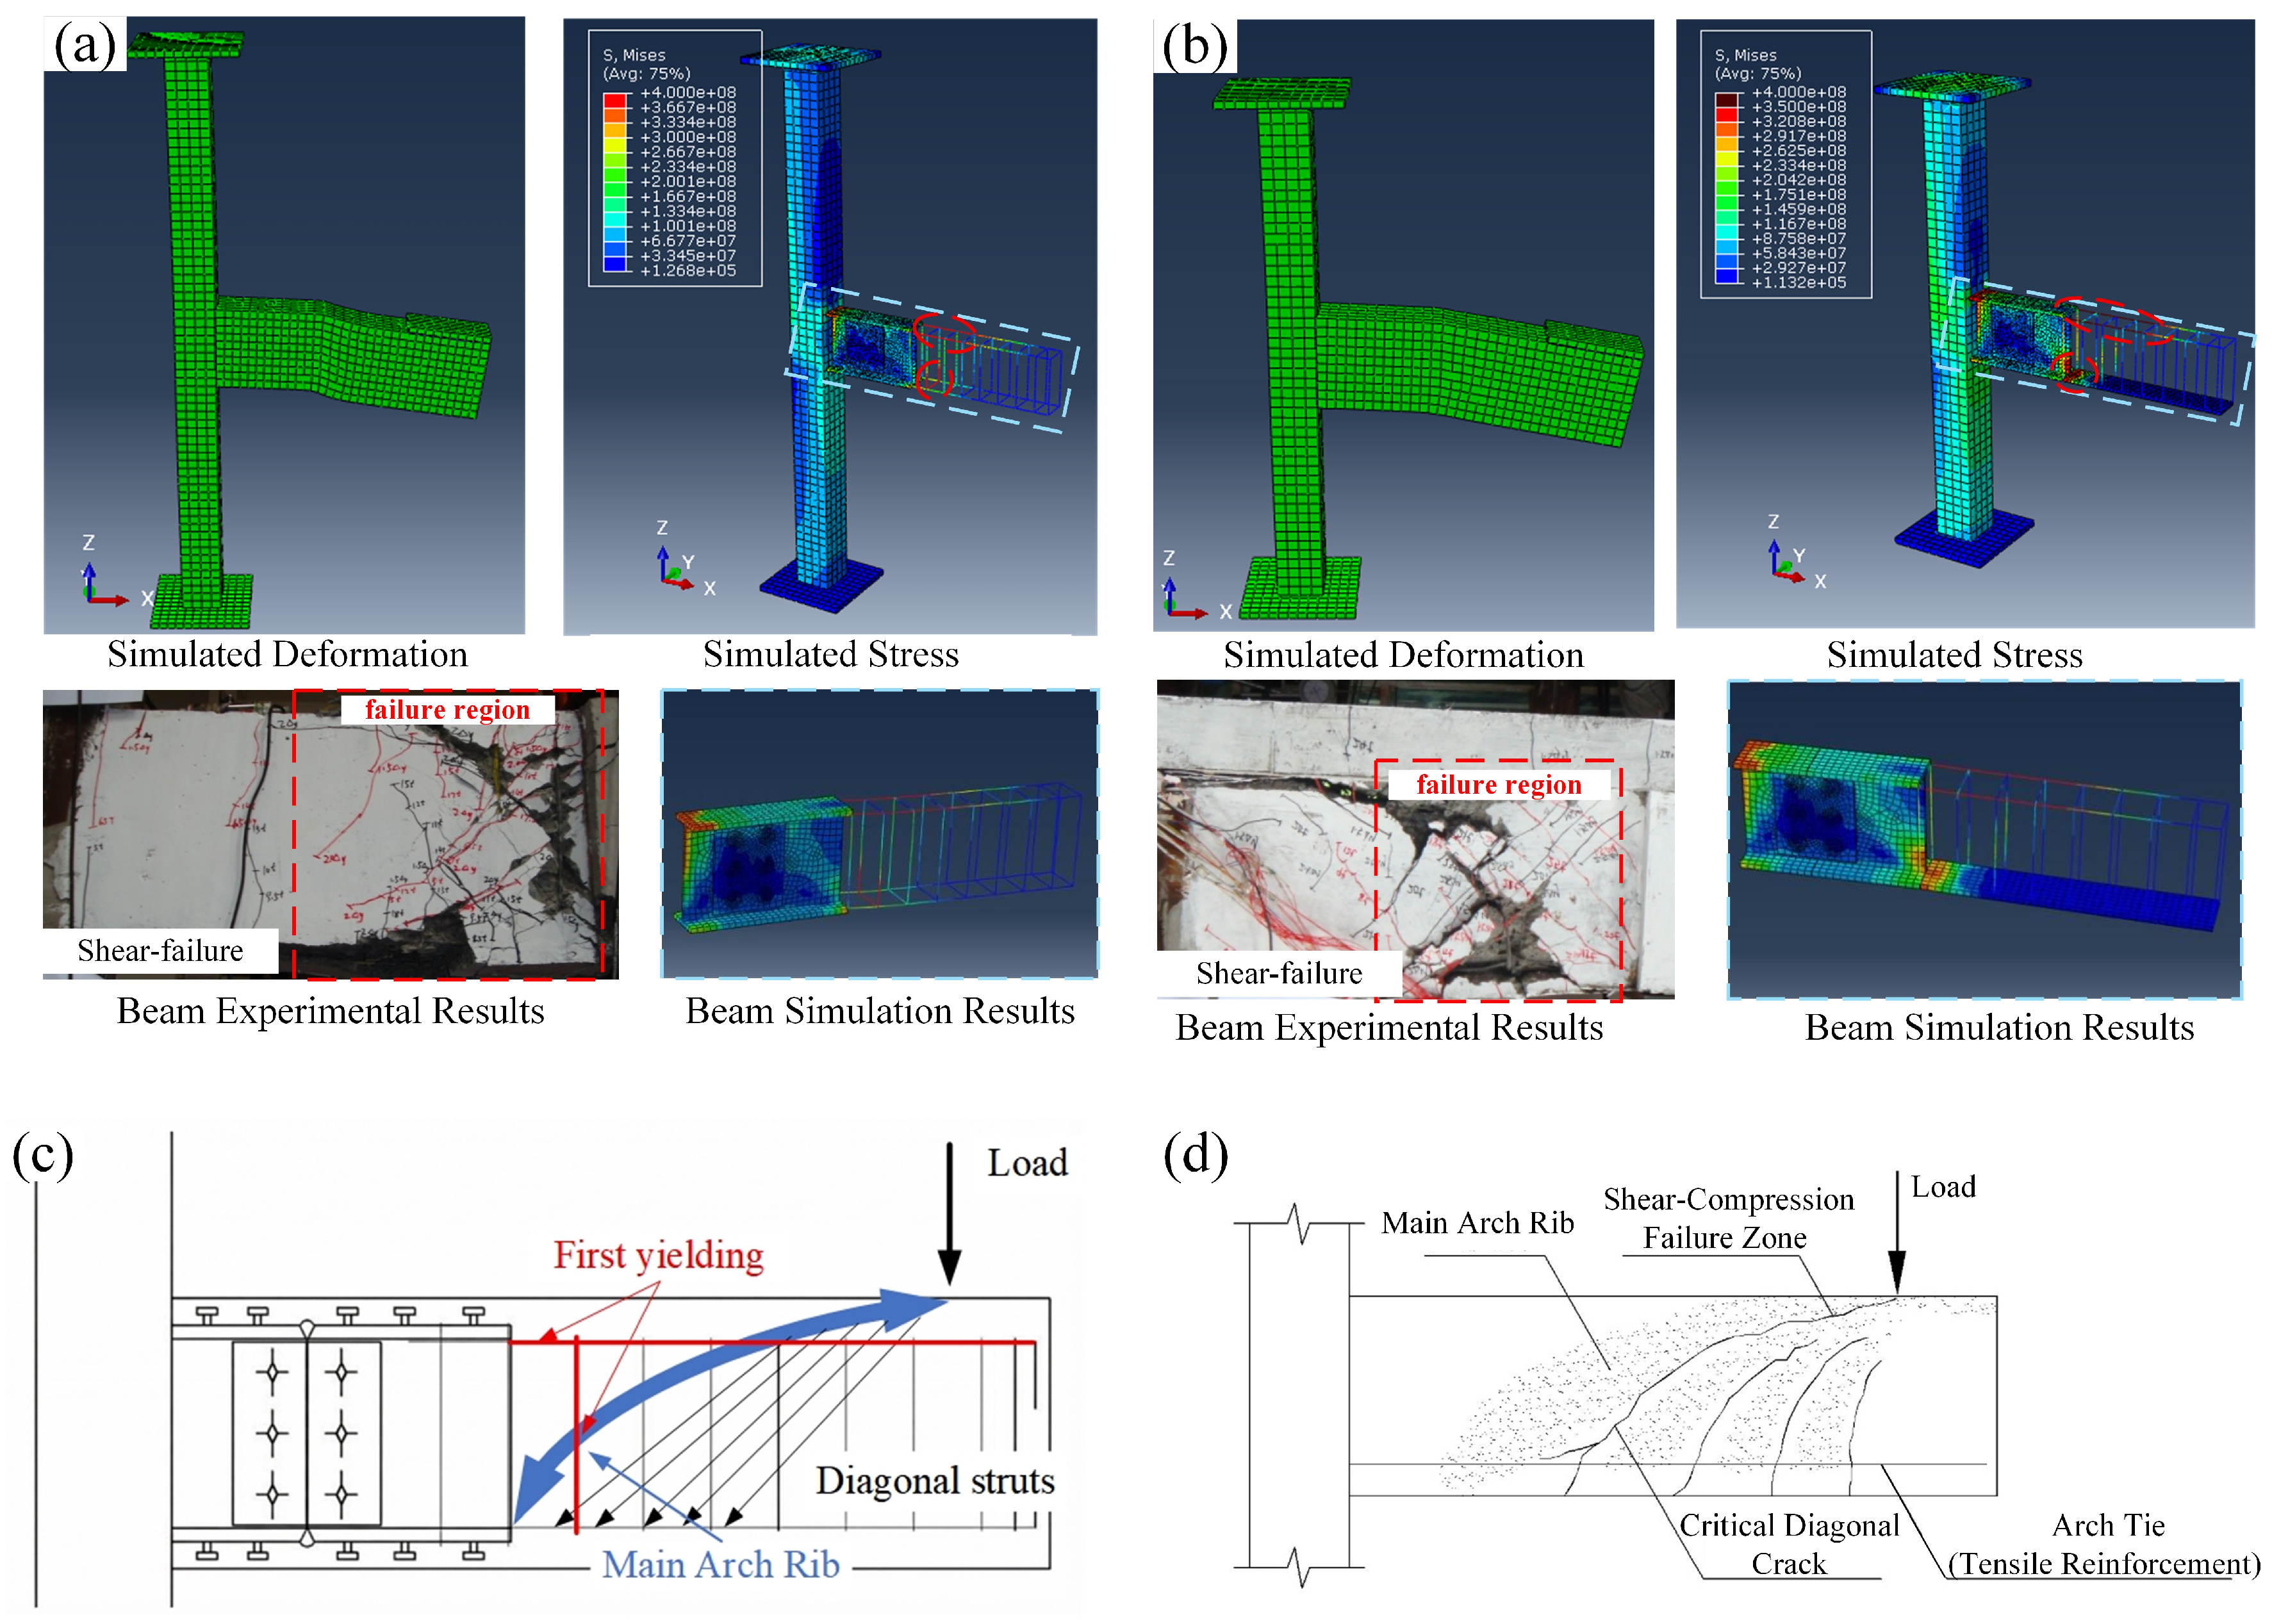
Under constant axial force and low-cycle reversed loading, all joint specimens underwent a typical seismic response process, progressing from the elastic stage to the crack development stage, followed by concentrated plastic deformation, and finally failure. Taking specimen JD1 as an example (the loading and failure evolution processes of other specimens were largely similar), the load–displacement relationship was essentially linear during the initial loading phase. No visible cracks were observed on the concrete surfaces of the beam, column, or joint region. Residual displacement after unloading was negligible, indicating that the overall component remained in an elastic state. With increasing load, vertical flexural cracks first appeared in the tension zone of the beam near the column (
Figure 5a). Subsequently, diagonal cracks emerged near the end of the embedded steel connector, specifically in the region where the beam bottom contained longitudinal reinforcement or the steel plate. Conversely, no significant diagonal cracks were observed within the range covered by the steel connector due to its high stiffness (
Figure 5b). With the cracking of concrete and the loss of tensile contribution from the tension zone, strains in the longitudinal reinforcement and hooping increased rapidly. Consequently, damage concentrated in the beam section between the end of the steel connector and the loading end (hereinafter referred to as the “damage concentration zone”), forming a flexure-shear interaction zone. Under continuous loading, diagonal cracks in this region propagated densely and widened significantly, eventually penetrating the beam depth to form intersecting cracks (
Figure 5c). Finally, penetrating “X”-shaped main cracks formed within the damage concentration zone, and the specimen exhibited a shear-dominated failure mode (
Figure 5d).
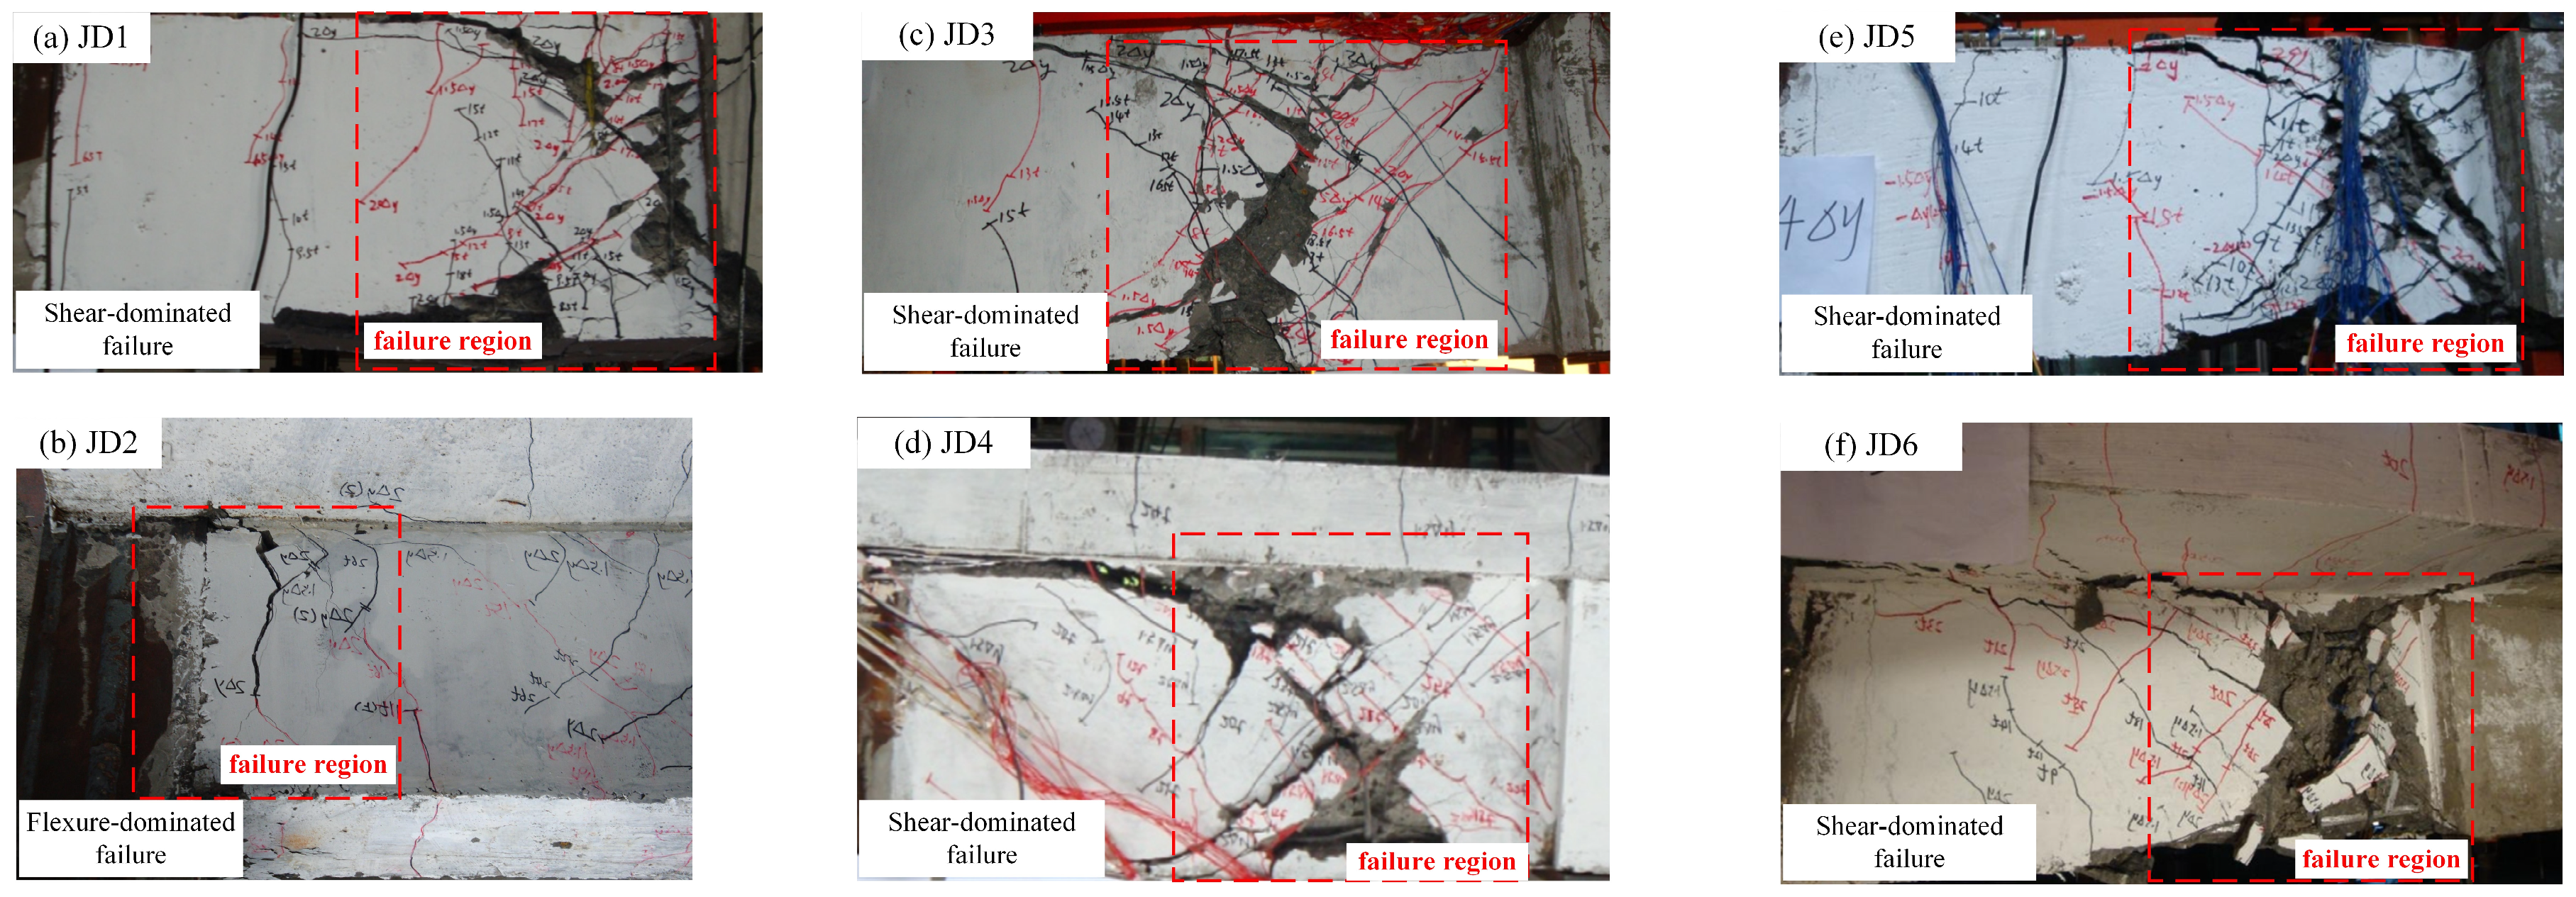
Figure 6 illustrates the final failure morphologies of specimens JD1–JD6. As observed, with the exception of JD2, which exhibited primarily flexural failure characterized by a vertical main crack at the column face, all other specimens ultimately developed distinct shear failure characteristics in the beam section between the steel connector end and the loading end. Following the penetration of the main diagonal cracks on both sides of the beam, the concrete cover near the loading end spalled along the inclined section. Concrete in the shear-compression zone was crushed and fell off extensively. The hooping was exposed and partially buckled. In some specimens, the concrete at the beam bottom and sides bulged or even detached, while the bottom longitudinal reinforcement or steel plate was exposed and showed obvious bending deformation. During the shear failure process, as the displacement amplitude increased, the main diagonal cracks expanded rapidly. The aggregate interlock mechanism at the crack interface and the vertical tensile resistance of the hooping degraded gradually, leading to a significant reduction in the shear bearing capacity of the inclined section. This ultimately resulted in a shear failure zone characterized by extensive internal concrete crushing and spalling within the damage concentration zone.
Significant differences in failure modes were observed among different structural configurations. As indicated in
Table 5 and
Table 6, under identical beam–column cross-sectional dimensions and reinforcement configurations, the joints with slabs (JD2, JD4, JD6) exhibited significantly higher positive cracking loads and yield loads compared to their counterparts without slabs (JD1, JD3, JD5).
Specifically, compared to JD1, the positive cracking load of JD2 increased from 65 kN to 130 kN, representing an increase of 100.0%; the positive yield load increased from 180 kN to 260 kN, an increase of 44.4%. Similarly, compared to JD3, the positive cracking load of JD4 increased from 70 kN to 140 kN (a 100.0% increase), and the positive yield load increased from 170 kN to 240 kN (a 41.1% increase). Furthermore, compared to JD5, the positive cracking load of JD6 increased from 70 kN to 170 kN (a 142.9% increase), and the positive yield load increased from 145 kN to 260 kN (a 79.3% increase).
The specimens without slabs (JD1, JD3, JD5) all ultimately failed in shear, with the failure zone primarily concentrated between the end of the steel connector and the loading end. The corresponding crack propagation patterns are shown in
Figure 6a,c,e. For the specimens with slabs (JD2, JD4, JD6), under positive loading, cracks in the upper part of the beam extended into the slab. During large displacement cycles, penetrating horizontal cracks appeared at the beam–slab interface, indicating that the reinforcement within the slab parallel to the beam participated in tension. Under reverse loading, the slab was in compression, which also enhanced the bearing capacity of the joint in the positive moment direction. The participation of slab reinforcement in both tension and compression stages significantly improved both the positive cracking load and yield load of the joints with slabs.
It is worth noting that JD2 ultimately exhibited a ductile failure mode dominated by flexural failure at the normal section near the column face (
Figure 6b). Its positive yield load reached
. Upon failure, the flexural cracks at the beam–column interface penetrated through the section, indicating that the failure of this joint was primarily controlled by the bending moment. Considering the specimen configuration, under the condition where the slab participates in load bearing and the axial compression ratio is relatively low, the flexural capacity of the beam–column interface section may become the governing factor before the shear capacity. In contrast, although JD4 and JD6 were also joints with slabs, they still ultimately failed primarily due to inclined section shear in the damage concentration zone (
Figure 6d,f) under the influence of higher axial force or higher beam bottom reinforcement ratios (including the use of steel plates).
The form and ratio of reinforcement at the bottom of the beam also significantly influenced the stress level and failure mode. As shown in
Table 5, under similar conditions, compared with JD3 and JD4, which used ordinary reinforcement as bottom longitudinal bars, JD5 and JD6, which used steel plates to replace bottom longitudinal bars, showed significant improvements in yield load and peak bearing capacity. The reverse yield load of JD5 was
, which is close to the
of JD3; however, the positive failure displacement of JD5 reached 3.5 times the yield displacement, whereas that of JD3 was 3 times. The reverse yield load of JD6 was
, significantly higher than the
of JD4. Comparing the two, the positive yield load of JD6 was 260 kN, which was 8.3% higher than the 240 kN of JD4; the reverse yield load of JD6 was 300 kN, representing a 15.4% increase over the 260 kN of JD4.
Regarding failure displacement, the failure displacements of most joints ranged between 2.5 and 4.0 times the yield displacement. Specifically, the failure displacements of JD3 and JD4 were approximately 3.0 and 4.0 times the yield displacement, respectively, indicating relatively better ductility. The failure displacements of JD1 and JD2 were relatively small, approximately 2.5 times the yield displacement. Considering the specimen configuration, the column height of JD1 and JD2 was , resulting in a larger slenderness ratio. Consequently, eccentricity was more likely to occur during axial loading of the column, and their stability was inferior to the other four joints. This is the primary reason for their relatively smaller failure displacements and slightly poorer ductility.
Overall, all specimens exhibited a failure mechanism where the composite beam yielded first while the column showed no significant damage characteristics, reflecting the design philosophy of “strong column-weak beam”. Except for JD2, which underwent flexural failure at the column face, the other joints were dominated by shear failure at the beam-end diagonal section. After reaching the peak load, the bearing capacity of each specimen decreased relatively slowly, maintaining a certain load-bearing level and demonstrating strong overall deformation capacity.
3.2. Hysteresis and Skeleton Curves
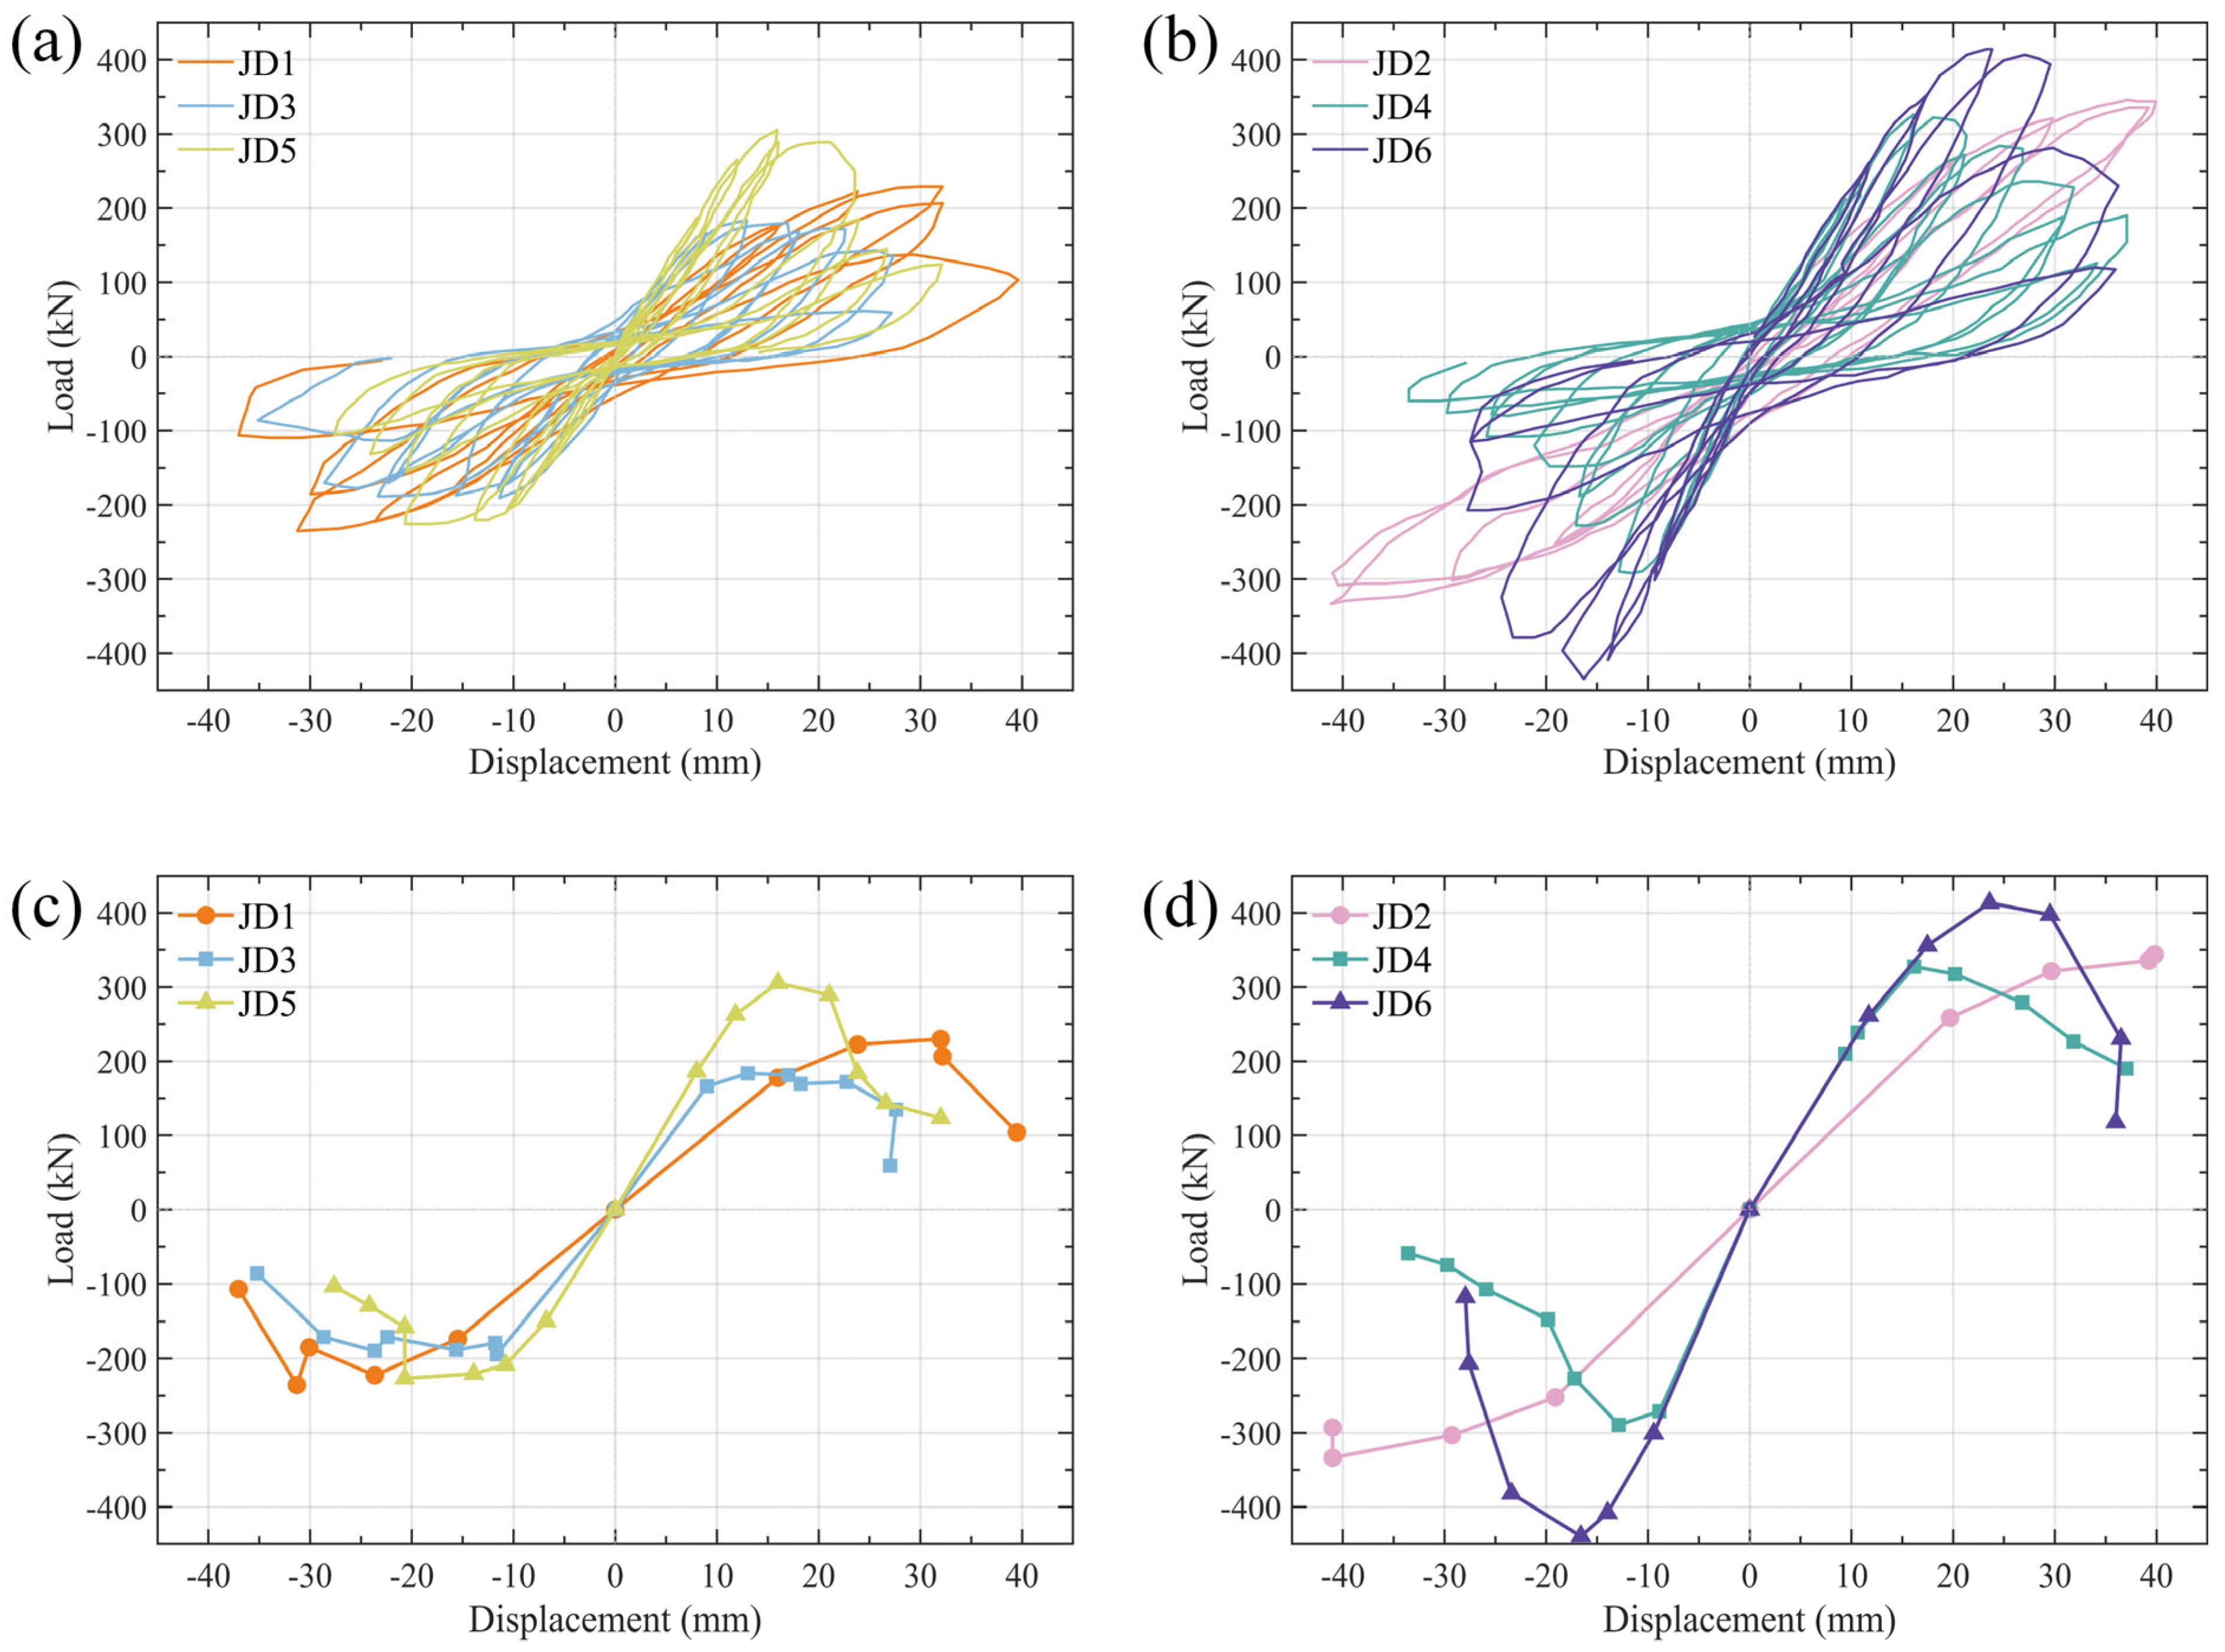
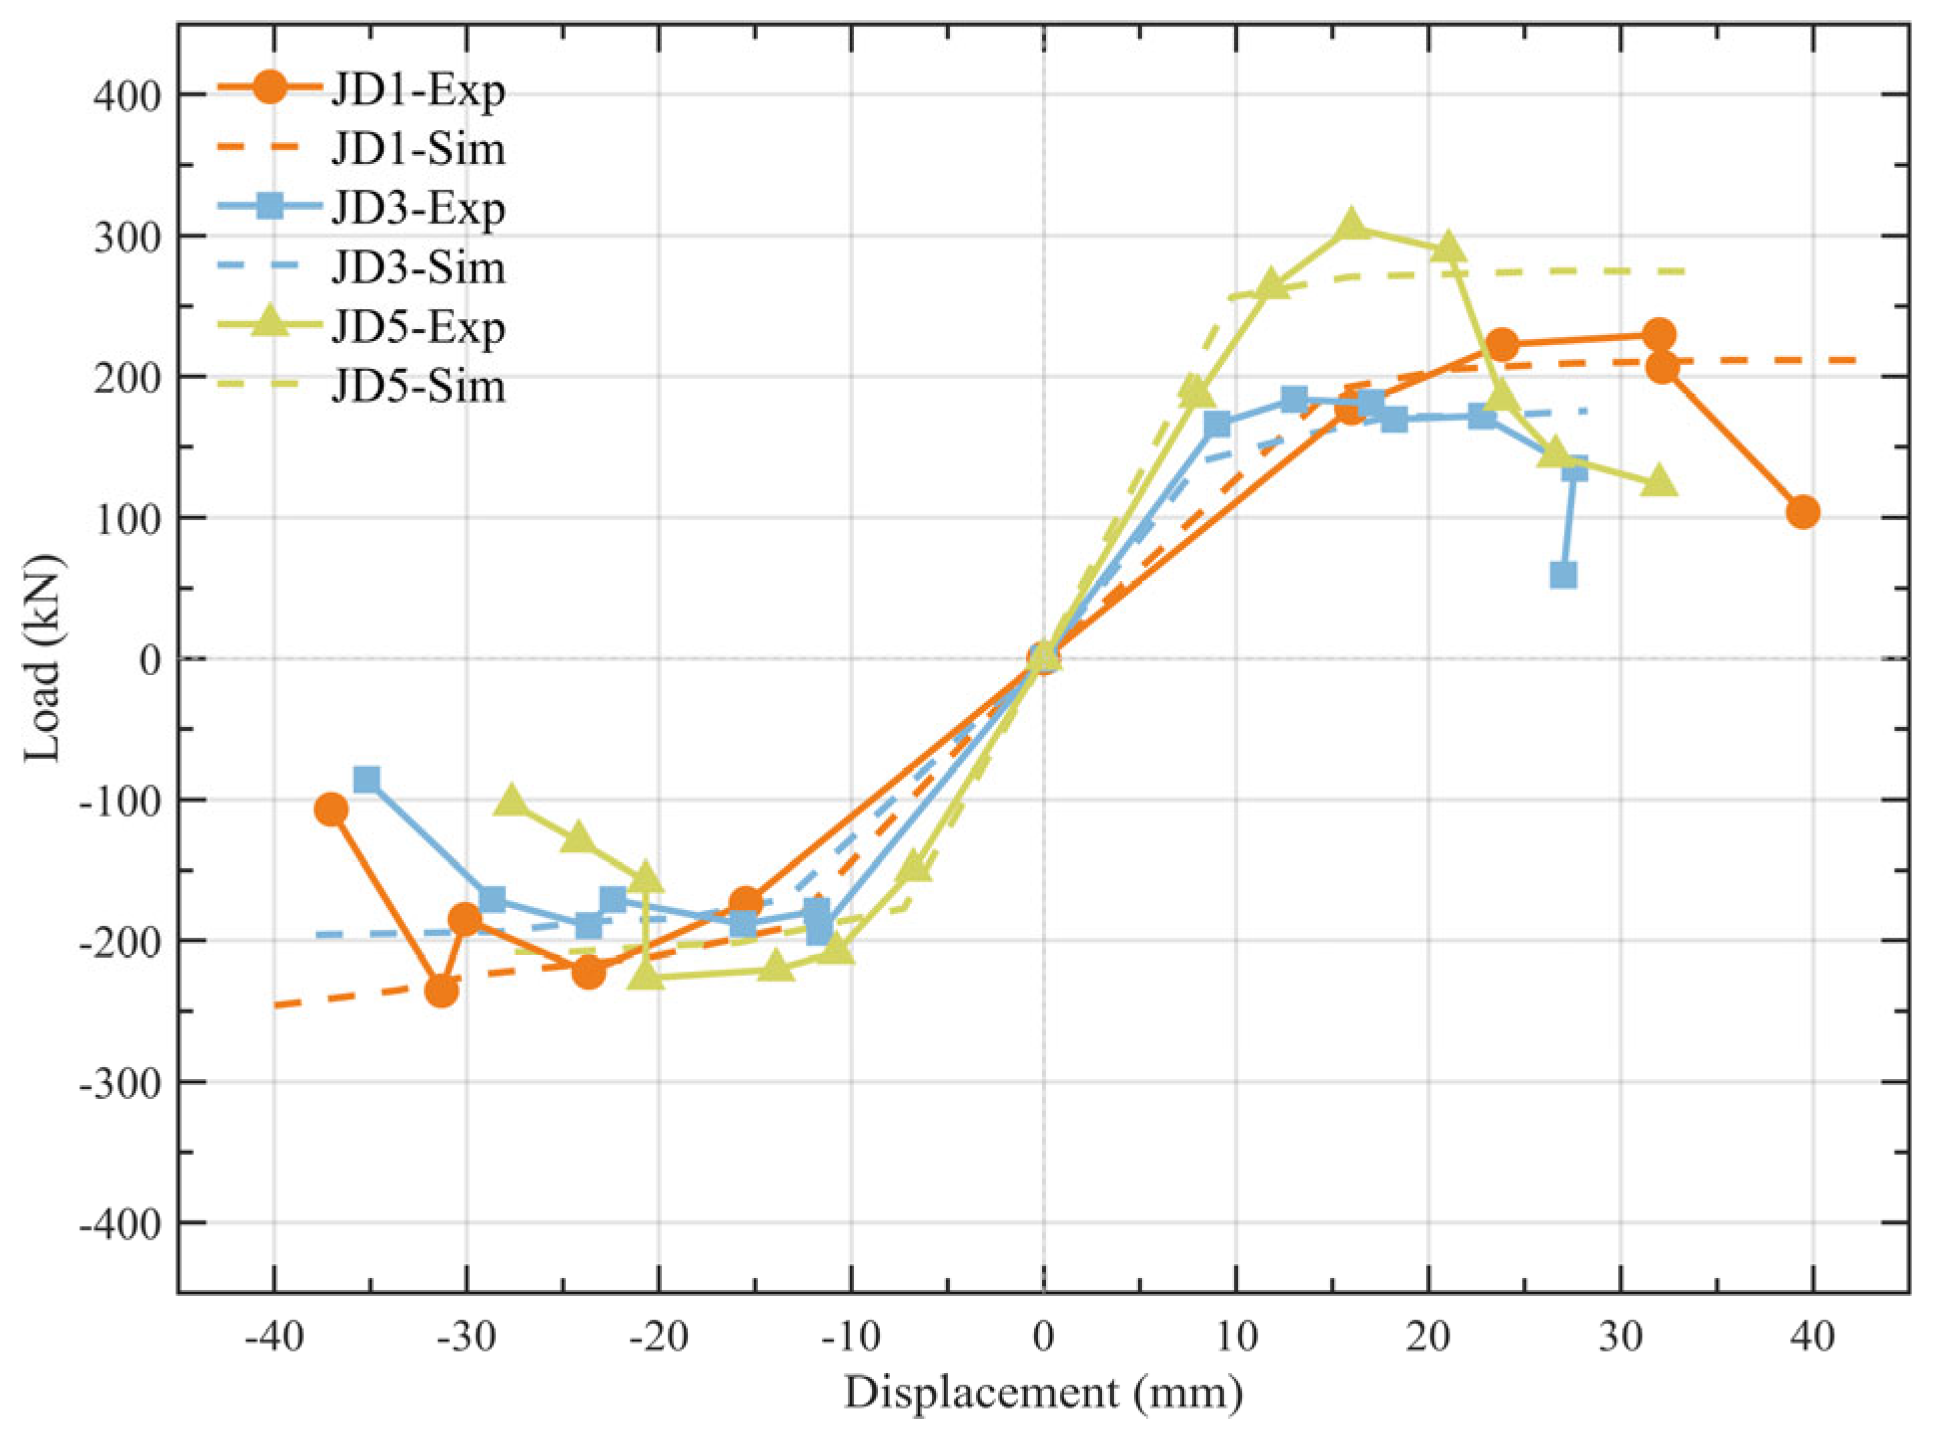
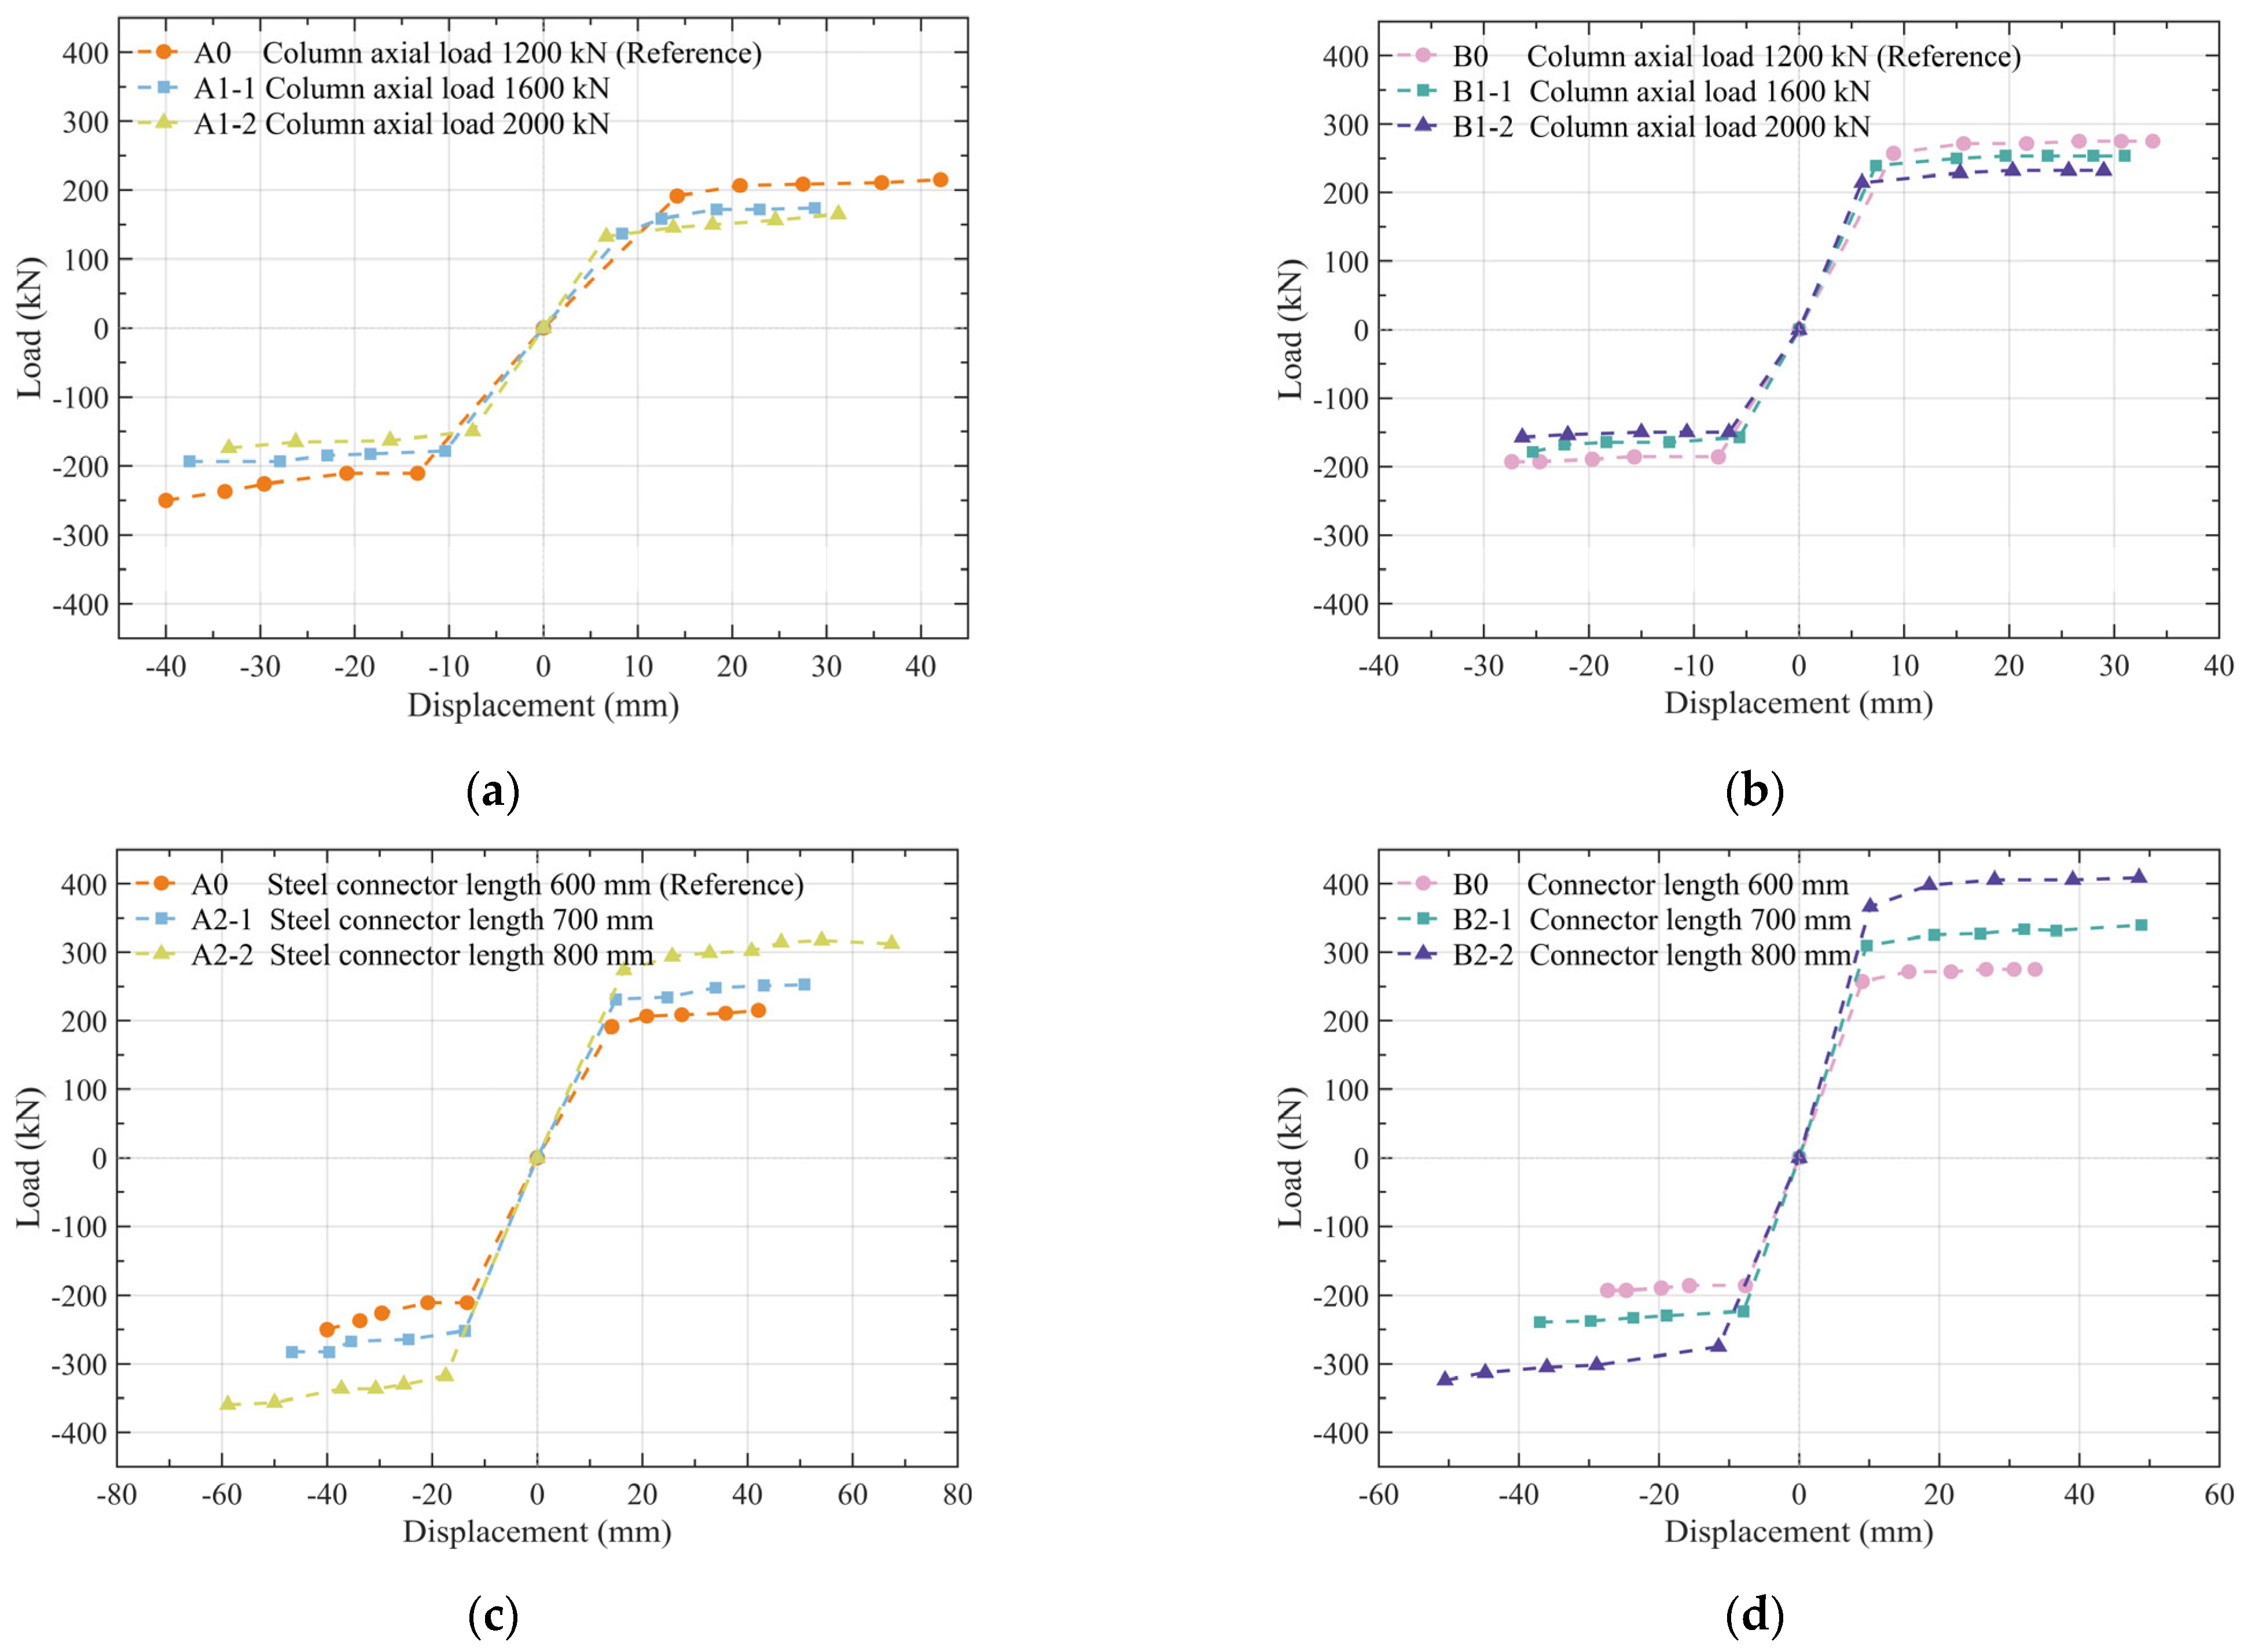
The hysteresis and skeleton curves obtained from the tests are shown in
Figure 7. The characteristics of the hysteresis curves indicate that all specimens were in the elastic stage during the initial loading phase, characterized by narrow hysteresis loops and negligible residual deformation. Upon entering the elasto-plastic stage, the area of the hysteresis loops gradually increased, and both plastic deformation and energy dissipation capacity continued to develop.
The hysteresis curves of the specimens with slabs exhibited significant asymmetry—the stiffness and bearing capacity under positive loading (corresponding to tension at the beam bottom) were notably higher than those under reverse loading. This phenomenon is primarily attributed to the “flange action” induced by the cast-in-place slab and the resulting asymmetric load transfer mechanism. Under positive loading, the slab concrete is located in the compression zone and acts as an effective flange for the beam (similar to a T-beam), significantly enhancing the flexural stiffness and strength of the cross-section. Conversely, under reverse loading (where the composite beam is subjected to negative moment), the slab concrete in the tension zone cracks rapidly and becomes ineffective, relying solely on the reinforcement within the slab to provide tensile contribution. Consequently, the stiffness enhancement effect in this state is weaker than that in the compression state. In contrast, the hysteresis curves of the specimens without slabs were basically symmetrical.
Regarding the shape of the hysteresis loops, specimen JD2, which underwent flexural failure at the column face, exhibited relatively plump spindle-shaped loops, demonstrating good ductility. The remaining specimens, which underwent shear failure, showed varying degrees of “pinching” or horizontal slipping segments, with JD4 being particularly significant. This pinching effect, caused by the bond-slip of longitudinal reinforcement and the repeated opening and closing of diagonal cracks, reduces energy dissipation efficiency. Notably, specimens utilizing steel plates as the load-bearing component at the beam bottom (JD5, JD6) possessed more stable and plump hysteresis loops compared to their corresponding reinforced counterparts (JD3, JD4), indicating that the steel plate configuration contributes to enhancing the hysteretic performance and energy dissipation stability of the joints.
Analysis of the macroscopic mechanical response from the skeleton curves reveals that all specimens underwent a typical ductile development process consisting of elastic ascent, plastic hardening, and a slow decline after the peak. The positive skeleton curves of the group of specimens with slabs were significantly higher than those of the group without slabs in terms of initial stiffness and peak bearing capacity, verifying the composite enhancement effect of the slab. For JD5 and JD6 with steel plates at the beam bottom, the majority of their skeleton curves lay above those of the corresponding reinforced specimens, indicating that the steel plate effectively improves the flexural and shear bearing capacity of the joints.
Therefore, the participation of the slab introduced the flange action and altered the effective stiffness of the section, leading to asymmetry in the mechanical response under positive and reverse directions. The use of steel plates as load-bearing components at the beam bottom effectively improved the bearing capacity and hysteretic stability of the joints. Different failure modes directly affected the plumpness of the hysteresis loops and energy dissipation efficiency. All prefabricated joints exhibited a “strong column-weak beam” failure mechanism and good overall ductility.
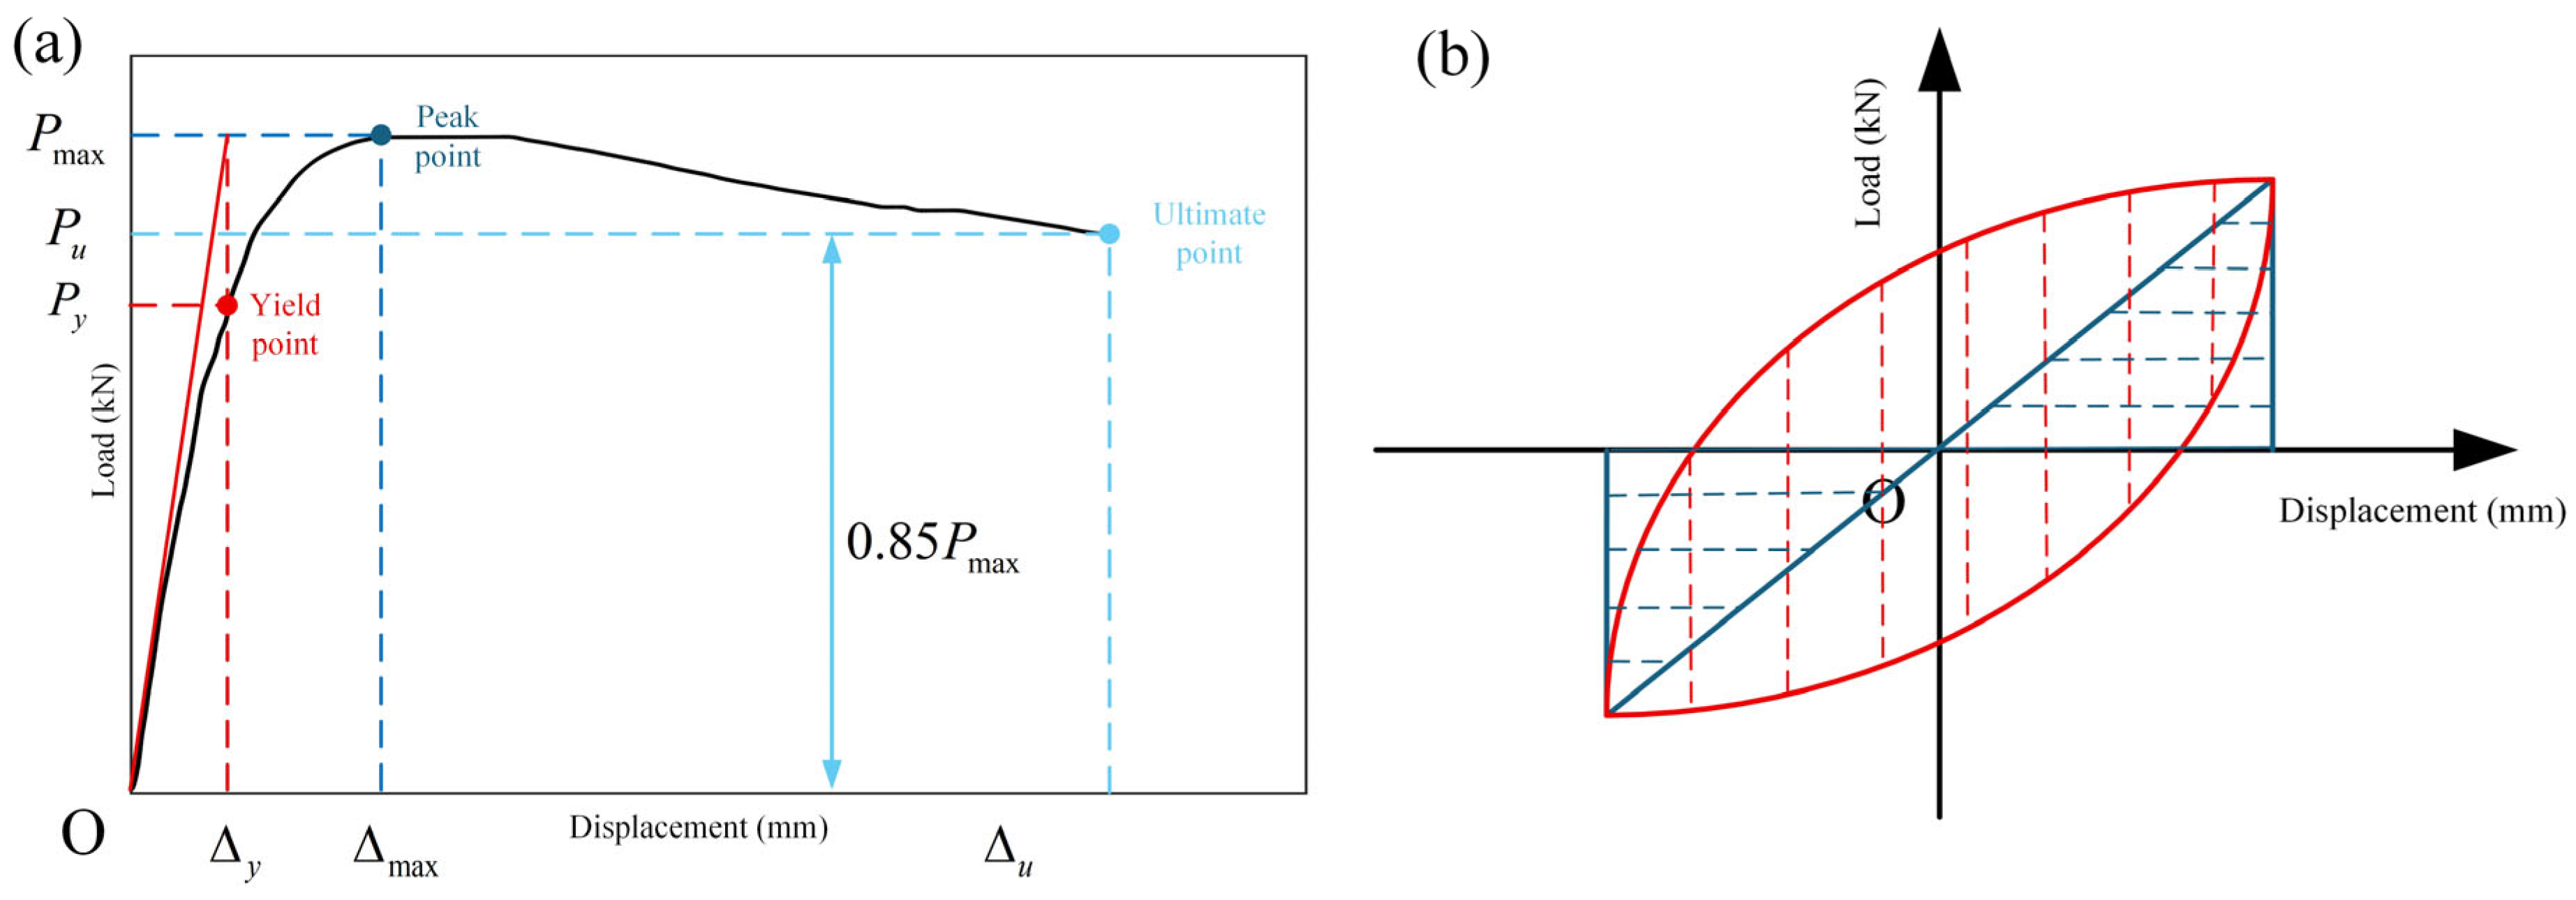
Based on the hysteresis and skeleton curves obtained from the tests, the overall performance of different joint structures can be further quantitatively evaluated in terms of yield and ultimate bearing capacities, ductility, and energy dissipation capacity. According to the method shown in
Figure 5a, the yield point, peak point, and ultimate point of the skeleton curves for each joint were determined, and the relevant results are summarized in
Table 7. The results indicate significant asymmetry in ultimate displacement. Taking specimen JD4 as an example, its positive ultimate displacement reached 27.0 mm, while the reverse ultimate displacement was only 14.0 mm, with the former being approximately 1.93 times the latter. Similarly, the positive ultimate displacement of specimen JD6 (30.3 mm) was 35.3% higher than the reverse one (22.4 mm). This is related to cumulative damage and the direction of concrete spalling during the late stage of loading.
The composite effect of the slab significantly enhanced the bearing capacity of the joints. Compared with the slab-less specimen JD1, the positive peak load of specimen JD2 with a slab increased from 231 kN to 336 kN, representing an increase of 45.5%. Similarly, the peak load of JD4 increased by 76.1% compared to JD3 (from 184 kN to 324 kN), verifying the significant contribution of the slab to the bearing capacity. Furthermore, strengthening the tensile components at the beam bottom yielded significant effects. Under otherwise identical conditions, specimen JD5, with increased reinforcement at the beam bottom, achieved a peak load of 305 kN, which was 65.8% higher than that of the base specimen JD3 (184 kN). Moreover, specimen JD6, strengthened with a steel plate, reached a peak load of 414 kN, representing a 27.8% increase compared to the reinforced specimen JD4 (324 kN) under equivalent conditions. This indicates that using steel plates is an effective method to improve the ultimate bearing capacity of the joints.
3.3. Connection Joint Performance Analysis
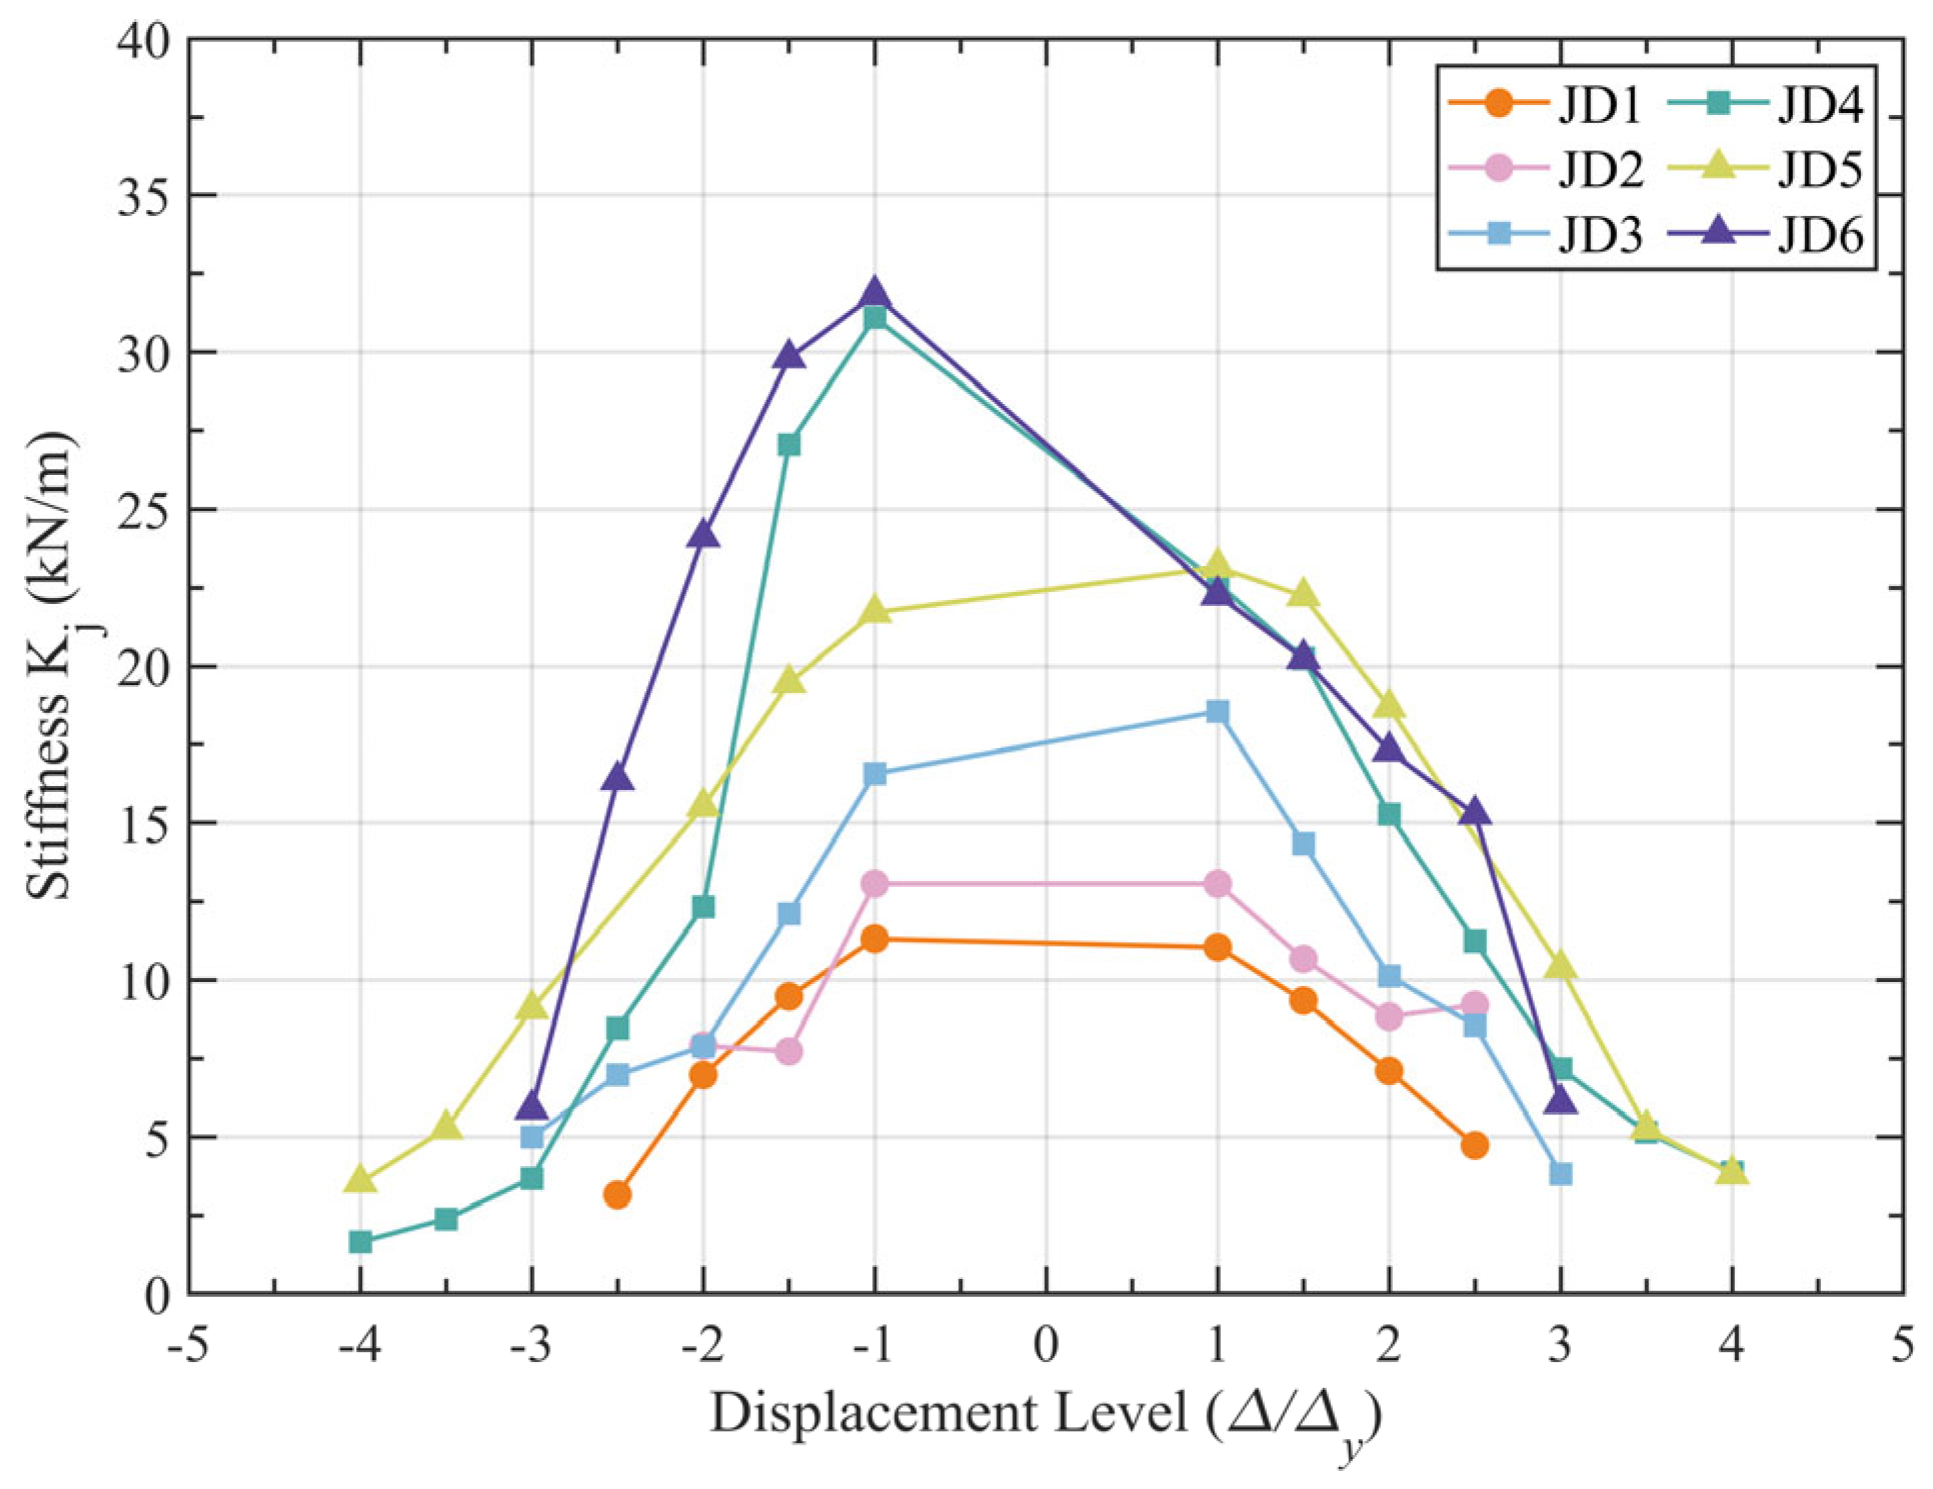
Figure 8 illustrates the degradation curves of secant stiffness with respect to displacement levels. Attributable to the flange action of the slab, the specimens with slabs (JD4, JD6) reached peak stiffnesses of 31.1 kN/m and 31.9 kN/m, respectively. Compared to the corresponding slab-less specimens with identical reinforcement (JD3, JD5), which had peak stiffnesses of 18.5 kN/m and 23.1 kN/m, these values represent increases of 68.1% and 38.1%, respectively. However, the degradation rate was more pronounced in specimens with higher initial stiffness. The stiffness of JD6 at 3Δ
y decreased by approximately 81.5% from its peak, whereas the corresponding reduction for the slab-less JD5 was only 58.2%. Additionally, the structural configuration resulted in differences in degradation characteristics: slab-less joints exhibited basically symmetrical positive and reverse stiffness (difference < 5%), while joints with slabs showed significant asymmetry due to the tensile participation of slab reinforcement (e.g., the stiffness difference for JD6 at ±1Δ
y reached 30%). Notably, the high-column specimens (JD1, JD2), influenced by eccentric axial compression, exhibited lower overall stiffness levels, with their average peak stiffness (12.1 kN/m) being approximately 50% of that of the other short-column joints.
The displacement ductility coefficients (
), calculated based on Equation (4), are detailed in
Table 8. The average
value for all specimens was 2.84 (ranging from 2.15 to 4.26), indicating that all specimens satisfied the seismic design requirement of
. From an engineering application perspective, the ductility coefficients of all specimens exceeded 2.0, meeting the basic seismic design requirements for “limited ductility” or “medium ductility” components specified in the Chinese standard Seismic Design of Buildings (GB/T50011-2010) [
22]. This implies that the prefabricated joints possess the necessary plastic deformation capacity to prevent collapse under design earthquakes.
Comparative analysis in
Table 9 indicates that the cast-in-place slab generally restricts the deformation capacity of the joints. Specifically, for specimens with conventional reinforcement, the ductility of JD4 (with slab) was 29.8% lower than that of JD3 (without slab); for high-column specimens, JD2 was 24.3% lower than JD1. However, in specimens utilizing a steel plate at the beam bottom, the composite action of the slab conversely enhanced ductility by 19.2% (JD5 vs. JD6). Furthermore, the structural configuration significantly influenced ductility. Compared to the conventional reinforced joint (JD3), the joint with a steel plate (JD5), despite its higher bearing capacity, exhibited a 48.6% reduction in ductility coefficient. Therefore, in practical design, when employing steel plates to strengthen connections, caution must be exercised regarding ductility reduction although the bearing capacity is effectively improved. It is recommended to adopt additional ductility-enhancing measures (such as densifying hooping) for such strengthened joints to achieve a balance between strength and ductility, ensuring that deformation demands under strong earthquakes are met.
A quantitative comparison of the energy dissipation performance of the joints is presented in
Table 8 and
Table 9. JD3 and JD4 exhibited the most superior energy dissipation capabilities, with an average equivalent viscous damping coefficient (
) reaching 0.380. This represents an increase of nearly 2.8 times compared to ordinary cast-in-place reinforced concrete joints (typically around 0.10) and even exceeds the design values for typical steel-reinforced concrete joints (approximately 0.30). This suggests that this novel prefabricated joint can act as an extremely efficient “energy dissipator” under strong earthquakes, effectively mitigating the dynamic response and cumulative damage of the main structure by significantly consuming seismic input energy.
Data from the comparison groups reveal that the influence of the slab effect on energy dissipation varied. Under standard column height conditions, the of the joint with a slab (JD4) increased by 7.4% compared to the slab-less joint (JD3). However, under high column conditions (JD1 vs. JD2), the presence of the slab caused a substantial reduction of 53.1% in . Although JD2 had the lowest energy dissipation index (), the proposed prefabricated joints generally demonstrated excellent energy dissipation capabilities, verifying their reliable seismic performance under earthquake action. In summary, this joint system not only meets conventional seismic code requirements but is also particularly suitable for regions with high seismic fortification intensity due to its superior damping characteristics, validating its feasibility as a high-performance seismic connection solution.
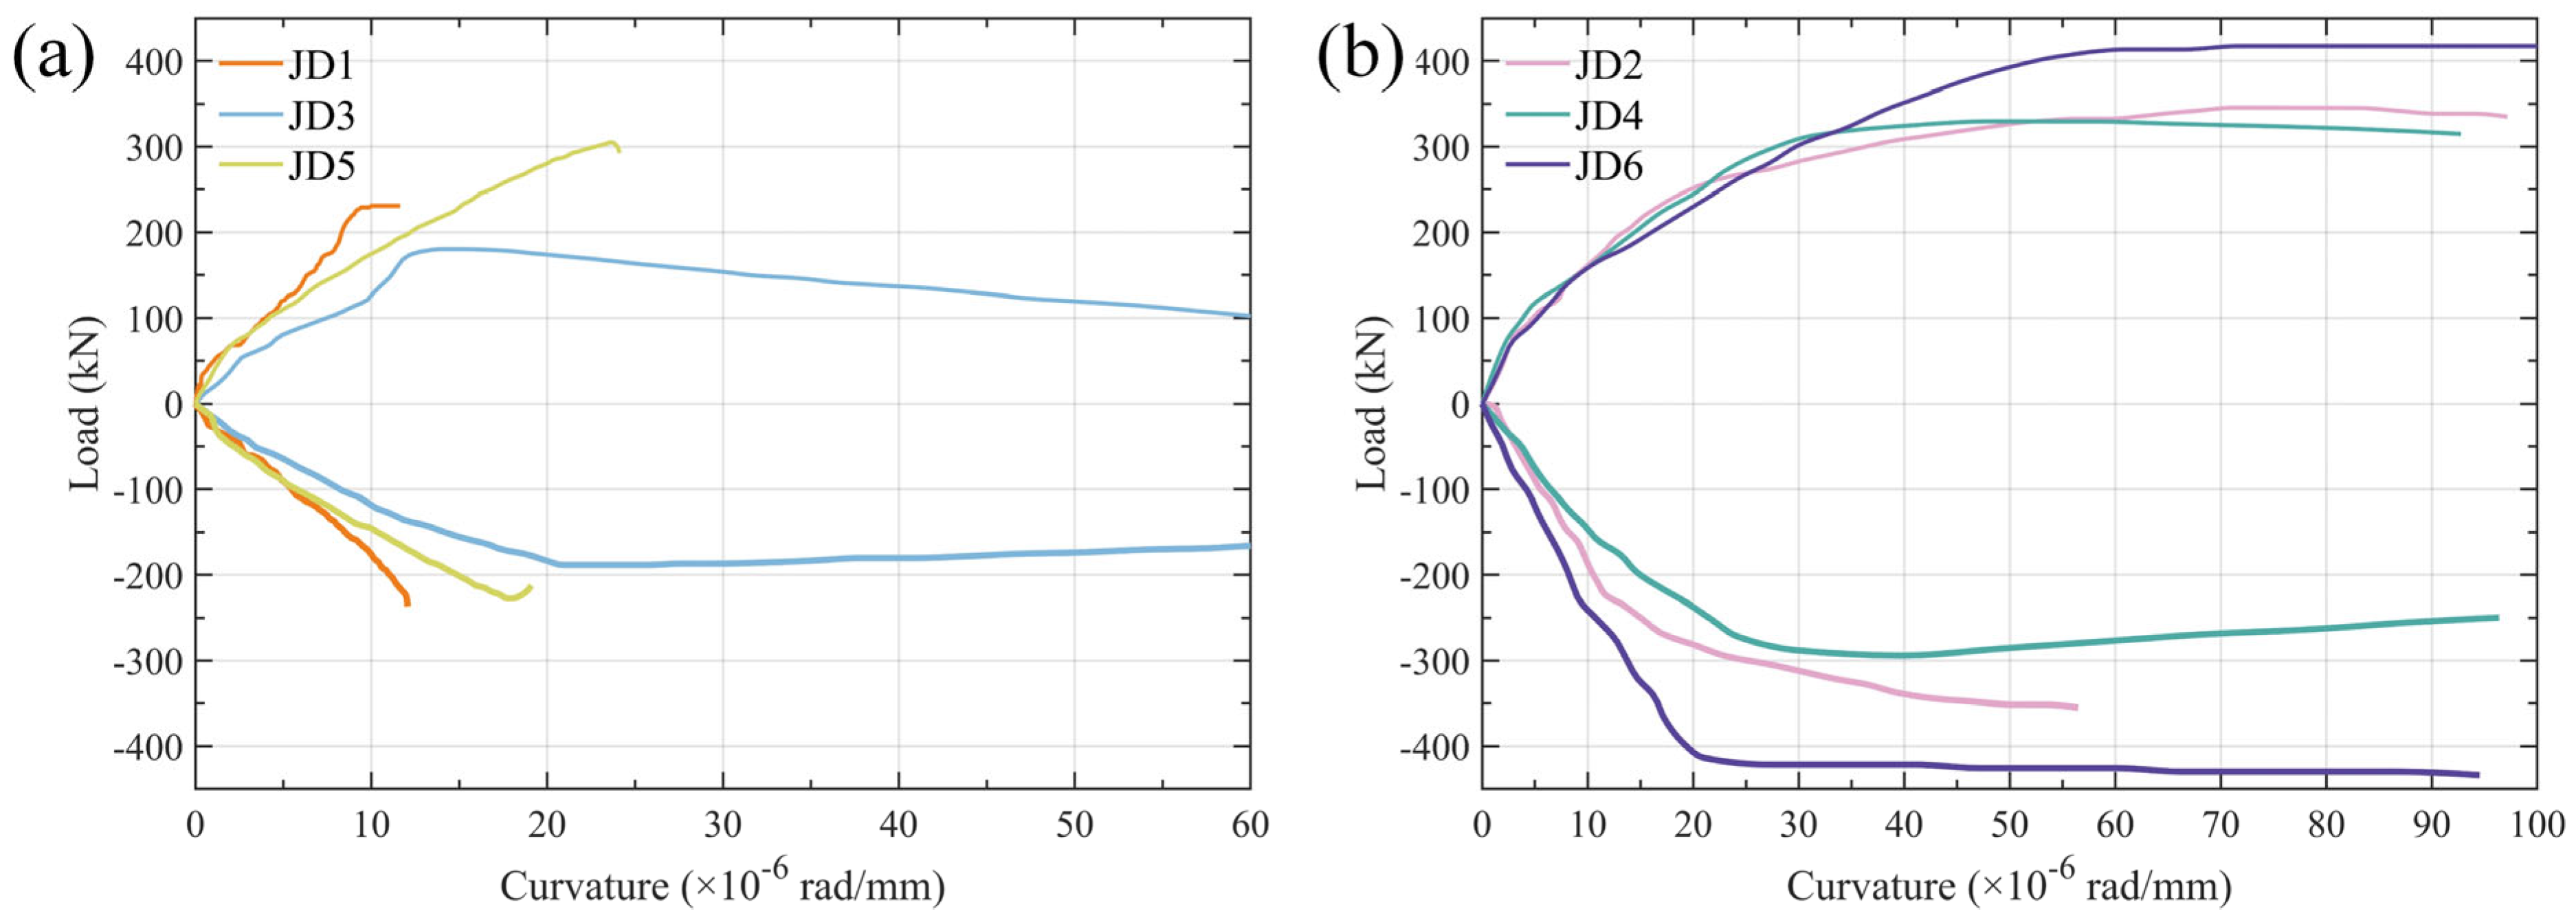
The measured load-curvature curves are shown in
Figure 9. Analysis indicates that prior to section cracking, both the concrete and reinforcement in the tension zone were in an approximately elastic state. The entire section participated in load bearing, resulting in high flexural stiffness and slow curvature growth. When the concrete at the edge of the tension zone reached its ultimate tensile strain, cracks emerged, and the tensile force was transferred to the reinforcement. This caused a sudden increase in reinforcement stress and a significant reduction in section stiffness. As the bending moment continued to increase, the basic mechanical mode—where tension is borne by the reinforcement and compression by the concrete—remained unchanged. However, the strains and stresses in both the reinforcement and concrete continued to increase. Simultaneously, the plastic development of the concrete in the compression zone and the gradual degradation of the bond between the concrete and reinforcement in the tension zone caused the section stiffness to decrease progressively with increasing bending moment. After the tensile reinforcement yielded, a small increase in bending moment induced a sharp rise in reinforcement strain, leading to a substantial drop in section stiffness. However, due to the more complete stress distribution in the compression zone and a slight increase in the internal lever arm, the resisting moment of the section continued to rise slowly with increasing curvature. After reaching the maximum flexural bearing capacity, as the curvature increased further, the concrete in the compression zone was gradually crushed, and the bearing capacity of the section began to decline until ultimate failure. Synthesizing the failure characteristics, all test joints exhibited under-reinforced failure characteristics; that is, the longitudinal tensile reinforcement (or steel plate) yielded first, followed by the crushing of the concrete in the compression zone. The joints possessed good overall ductility, with the ductility performance of JD4 under positive loading being particularly notable.