


Abstract
Urban vitality is a crucial indicator of a city’s sustainable development and the quality of life of its residents. Investigating the spatiotemporal patterns and influencing mechanisms of urban vitality is essential for optimizing the built-environment and improving governance. Using the central urban area of Guiyang, China, as a case study, this research integrates multi-source urban sensing data to investigate the spatiotemporal patterns of urban vitality and their driving factors. Geographically weighted regression (GWR) and machine learning combined with SHapley Additive exPlanations (SHAP) are applied to capture spatial heterogeneity, nonlinear relationships, and threshold effects among influencing variables. Results show that urban vitality exhibits a Y-shaped, single-core, multi-center, and clustered spatial configuration, with slightly higher intensity on weekdays and similar diurnal rhythms across weekdays and weekends. The effects of influencing factors display strong spatial non-stationarity, characterized by a concentric gradient radiating outward from the historic Laocheng core. Building density (BD), residential point density (RED), normalized difference vegetation index (NDVI), and road density (RD) emerge as the dominant contributors to urban vitality, while topographic conditions play a relatively minor role. The relationships between key landscape and built-environment variables and urban vitality are highly nonlinear, with distinct threshold effects. By integrating spatial econometric modeling and explainable machine learning, this study advances methodological approaches for urban vitality research and provides practical insights for landscape-oriented urban planning and human-centered spatial design.
1. Introduction
China has experienced the largest and most rapid urbanization process in human history, transitioning from post-recovery exploration and market-oriented expansion to a phase of high-quality and sustainable urban transformation. By 2024, the national urbanization rate had reached 66.2% [1]. While this unprecedented growth has generated substantial socioeconomic benefits, it has also produced profound challenges, including inefficient land use, declining residential quality, environmental degradation, and uneven spatial development. Against this backdrop, urban vitality has emerged as a critical lens through which to evaluate the health, performance, and sustainability of urban systems, particularly in the context of spatial planning and landscape design. Simultaneously, extensive research has been conducted on urban mobility and urban rhythms. Unlike studies on urban vitality, urban mobility focuses on the efficiency and accessibility of movement for both residents and goods [2]; urban rhythms concentrate on exploring cyclical temporal patterns and the shifting functions of cities across different time periods [3]. Urban vitality emphasizes the efficiency and attractiveness of urban space utilization. The concept of “vitality” originated in biology, referring to ecosystem productivity and material circulation [4], and was later introduced into urban studies to describe the dynamic functioning of cities as complex socio-spatial systems. Jane Jacobs’ seminal work The Death and Life of Great American Cities first articulated urban vitality as a city’s capacity to support diverse activities, social interaction, and economic innovation through fine-grained spatial organization [5]. Subsequently, Kevin Lynch incorporated vitality into his normative framework for evaluating urban form in “Good City Form”, emphasizing it as the most fundamental dimension of urban performance [6]. Building on these foundations, contemporary scholars have conceptualized urban vitality as a multidimensional construct encompassing social, economic, and cultural dynamics, mediated by the built and natural environments [7].
From a planning and landscape perspective, urban vitality is shaped by the interaction between two core components: the built environment and human activity. The built environment includes urban morphology, land use patterns, transportation networks, and green infrastructure [8,9,10], while human activity reflects social interaction, economic behavior, and cultural expression. Although earlier studies tended to conceptualize vitality through aggregated socioeconomic indicators, recent research increasingly recognizes urban residents as the primary agents of vitality, emphasizing activity intensity, mobility patterns, and spatial interaction as direct manifestations of urban life [11,12,13,14]. This shift toward a human-centered perspective aligns closely with contemporary planning paradigms that prioritize livability, inclusivity, and experiential quality.
Methodologically, early studies of urban vitality relied on surveys, activity diaries, field observations, and expert assessments [15,16,17,18]. While valuable, these approaches were constrained by limited spatial coverage, small sample sizes, and low temporal resolution [19]. Advances in geospatial technologies and urban sensing have fundamentally transformed vitality research by enabling the use of large-scale, high-resolution spatiotemporal data. Emerging data sources, such as points of interest (POI), nighttime light imagery, mobile phone signaling data, social media records, Baidu heatmaps, and street-view images, have facilitated more objective, continuous, and fine-grained measurements of urban vitality [20,21,22,23,24,25]. Increasingly, multi-source data fusion approaches are adopted to capture the complexity of urban systems and reduce biases associated with single data sources [26,27].
Alongside data innovation, analytical approaches to urban vitality have evolved substantially. Early research was largely limited to static, large-scale spatial analyses at single time points, often using administrative units or coarse grids [28,29,30]. However, urban vitality is inherently dynamic, shaped by daily rhythms, work–leisure cycles, and socio-cultural practices. Recent studies have therefore emphasized fine-scale spatiotemporal analysis, comparing weekday and weekend patterns and exploring hourly variations in activity intensity [31,32]. Ding analyzed the spatiotemporal differentiation characteristics of multidimensional vitality (physical, virtual, weekday, weekend) in Shenzhen industrial parks [33]. Wang utilized 24 h location-based service data as a time series to investigate the intraday shift patterns of urban vitality in Nanjing from the perspectives of distribution and clustering [34]. These studies reveal that vitality patterns are closely linked to urban spatial structure, functional zoning, and accessibility, underscoring the need for temporally explicit and spatially sensitive analytical frameworks.
To uncover the mechanisms driving urban vitality, researchers have employed spatial statistics, econometric models, and, more recently, machine learning techniques. Spatial econometric models, such as spatial lag and Geographically Weighted Regression (GWR), account for spatial dependence and heterogeneity, making them well suited for analyzing place-specific effects in urban landscapes [35,36,37]. However, these models are limited in their ability to capture complex nonlinear relationships [38]. Machine learning methods, including Random Forest (RF), eXtreme Gradient Boosting (XGBoost), Light Gradient Boosting Machine (LightGBM), and Gradient Boosting Decision Trees (GBDTs), offer strong predictive performance and flexibility in modeling nonlinear interactions [39,40,41,42], yet their “black-box” nature poses challenges for interpretation and planning application [43]. The introduction of SHapley Additive exPlanations (SHAP) has significantly improved the interpretability of machine learning models by quantifying the marginal contribution of each variable, thereby enhancing their transparency and policy relevance [44,45,46]. In recent years, explainable machine learning has been widely adopted in the engineering field. Lazaridis rapidly predicted the shear capacity of unreinforced masonry walls reinforced with TRM using machine learning and explainability techniques, analyzing its key influencing factors [47]. Matin employed SHAP to interpret machine learning models, identifying key features of post-earthquake building damage and resolving the black-box issue in structural damage detection [48].
Despite substantial progress, several research gaps remain. First, studies focusing on mountainous cities, where topography strongly constrains urban form, accessibility, and landscape structure, are still limited. Second, comparative analyses of urban vitality across multiple temporal dimensions (weekday–weekend and hourly scales) remain insufficient. Third, few studies integrate spatial econometric models and explainable machine learning to simultaneously capture spatial heterogeneity and nonlinear effects in a unified framework.
To address these gaps, this study takes the central urban area of Guiyang, a representative mountainous city in southwestern China, as a case study. Utilizing Baidu population heatmap data to characterize urban vitality, it systematically analyzes the spatiotemporal patterns of urban vitality across weekdays, weekends, and hourly intervals. Using Baidu population heatmap data to characterize urban vitality, this dataset reflects the activity intensity of city residents through large-scale location-based services (LBS) data. By statistically analyzing Baidu population heatmap data within hexagonal geographic grids across weekdays, weekends, and hourly intervals, it examines the spatiotemporal patterns of urban vitality. By integrating multi-source urban data and employing Geographically Weighted Regression (GWR) and GBDT-SHAP models, this research reveals both the spatial heterogeneity and nonlinear mechanisms underlying urban vitality. The findings aim to inform landscape-oriented urban planning, support people-centered design strategies, and contribute to sustainable urban development in complex topographic contexts.
2. Materials and Methods
2.1. Study Area and Datasets
2.1.1. Study Area
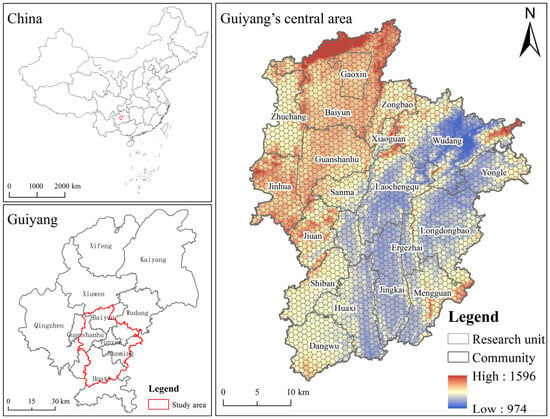
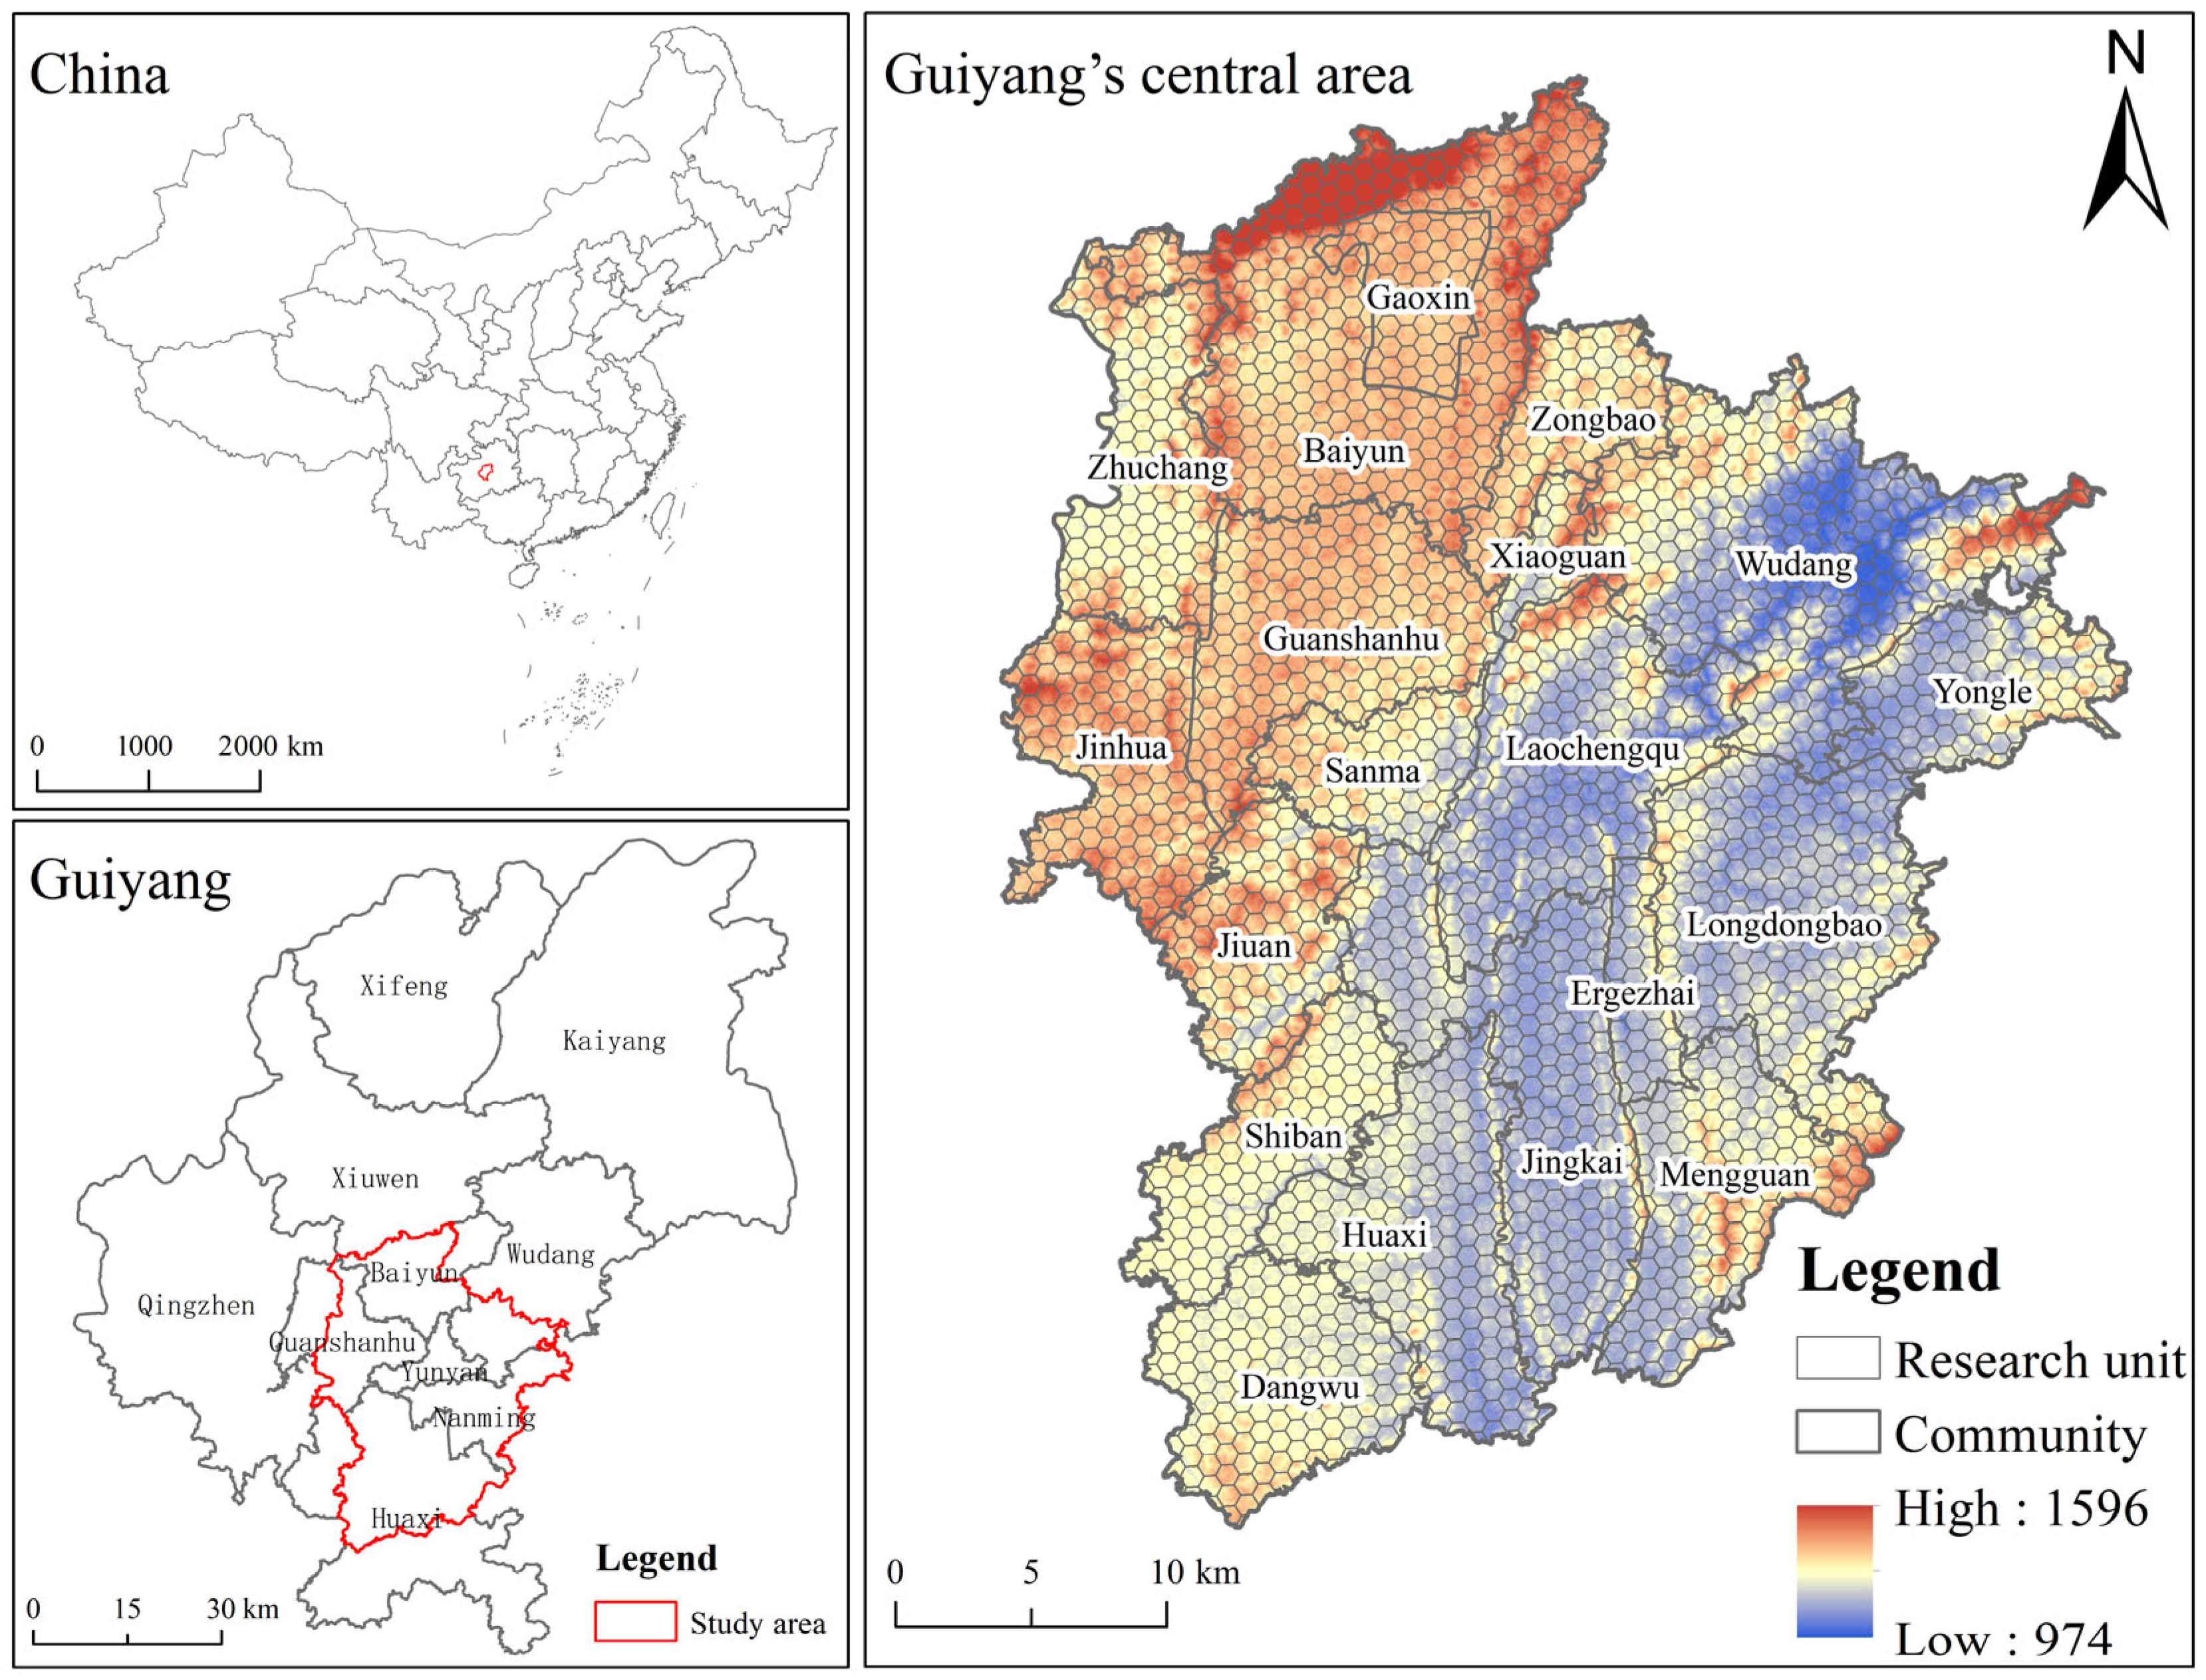
Guiyang is located in southwestern China and serves as the capital of Guizhou Province. Situated within the hilly basin of central Guizhou, the city is characterized by a predominantly mountainous terrain, with mountains and hills accounting for approximately 84.6% of its total area. As a typical karst mountainous city, Guiyang’s urban form has developed in close adaptation to topographic constraints, resulting in a compact and clustered spatial structure. This study focuses on the central urban area as delineated in the Guiyang City Master Plan, which covers approximately 1230 km2 and accommodates a population of about 3.2 million. According to the Guiyang Central Urban Area Control Detailed Plan, the study area is organized into 19 functional clusters that concentrate major residential, commercial, and public-service activities, making it an appropriate spatial unit for analyzing urban vitality. To ensure spatial comparability and reduce boundary effects, the study area was subdivided into regular hexagonal grid cells, following established practice in urban spatial analysis [49]. A total of 2700 hexagonal units, each with an area of 0.5 km2, were generated to serve as the basic analytical units (Figure 1). This grid-based approach enhances spatial uniformity and supports robust analysis of fine-scale spatiotemporal variations in urban vitality.
Figure 1.
Study area.
2.1.2. Datasets
Urban vitality was quantified using Baidu population heatmap data obtained from the Huiyan Service Platform of Baidu Maps, which reflect spatiotemporal patterns of human activity based on large-scale location-based service (LBS) data. The dataset provides hourly population intensity information at an approximate spatial resolution of 200 m and covers seven consecutive days (13–19 April 2024), including both weekends and weekdays, enabling analysis of temporal variability.
To examine the mechanisms driving urban vitality, multi-source datasets representing the built, natural, and socioeconomic environment were integrated. Land use data (30 m, 2023) and digital elevation data (30 m) were obtained from the Resource and Environmental Science Data Platform of the Chinese Academy of Sciences. Point of interest (POI) data were sourced from the Gaode Open Platform (2024) and classified into five functional categories to capture urban functional diversity. Vegetation conditions were represented by NDVI data (30 m, 2022) from the National Qinghai–Tibet Plateau Science and Technology Centre, while economic activity was proxied using Luojia-1 nighttime light data (130 m, 2022). Road networks and building footprints were derived from OpenStreetMap (OSM), representing urban connectivity and built density.
Following the 5D framework of Ewing and Cervero [50] and related studies [51], 17 indicators were constructed and grouped into five dimensions: functional diversity, density, design, transport accessibility, and topography (Table 1). All datasets were spatially processed and aggregated to the hexagonal analytical units to ensure consistency with subsequent modeling.
Table 1.
Indicator system construction explanation.
2.2. Methods
2.2.1. Research Framework
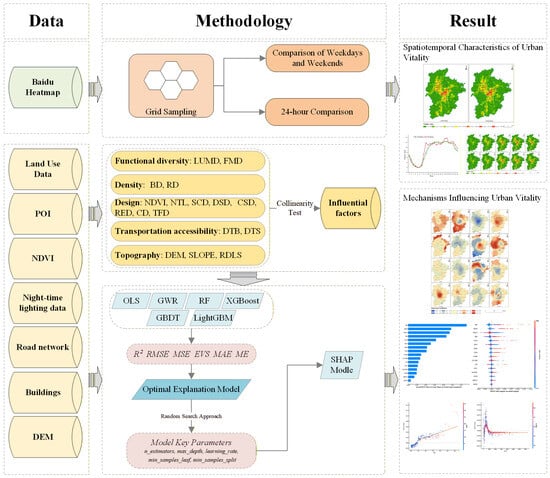
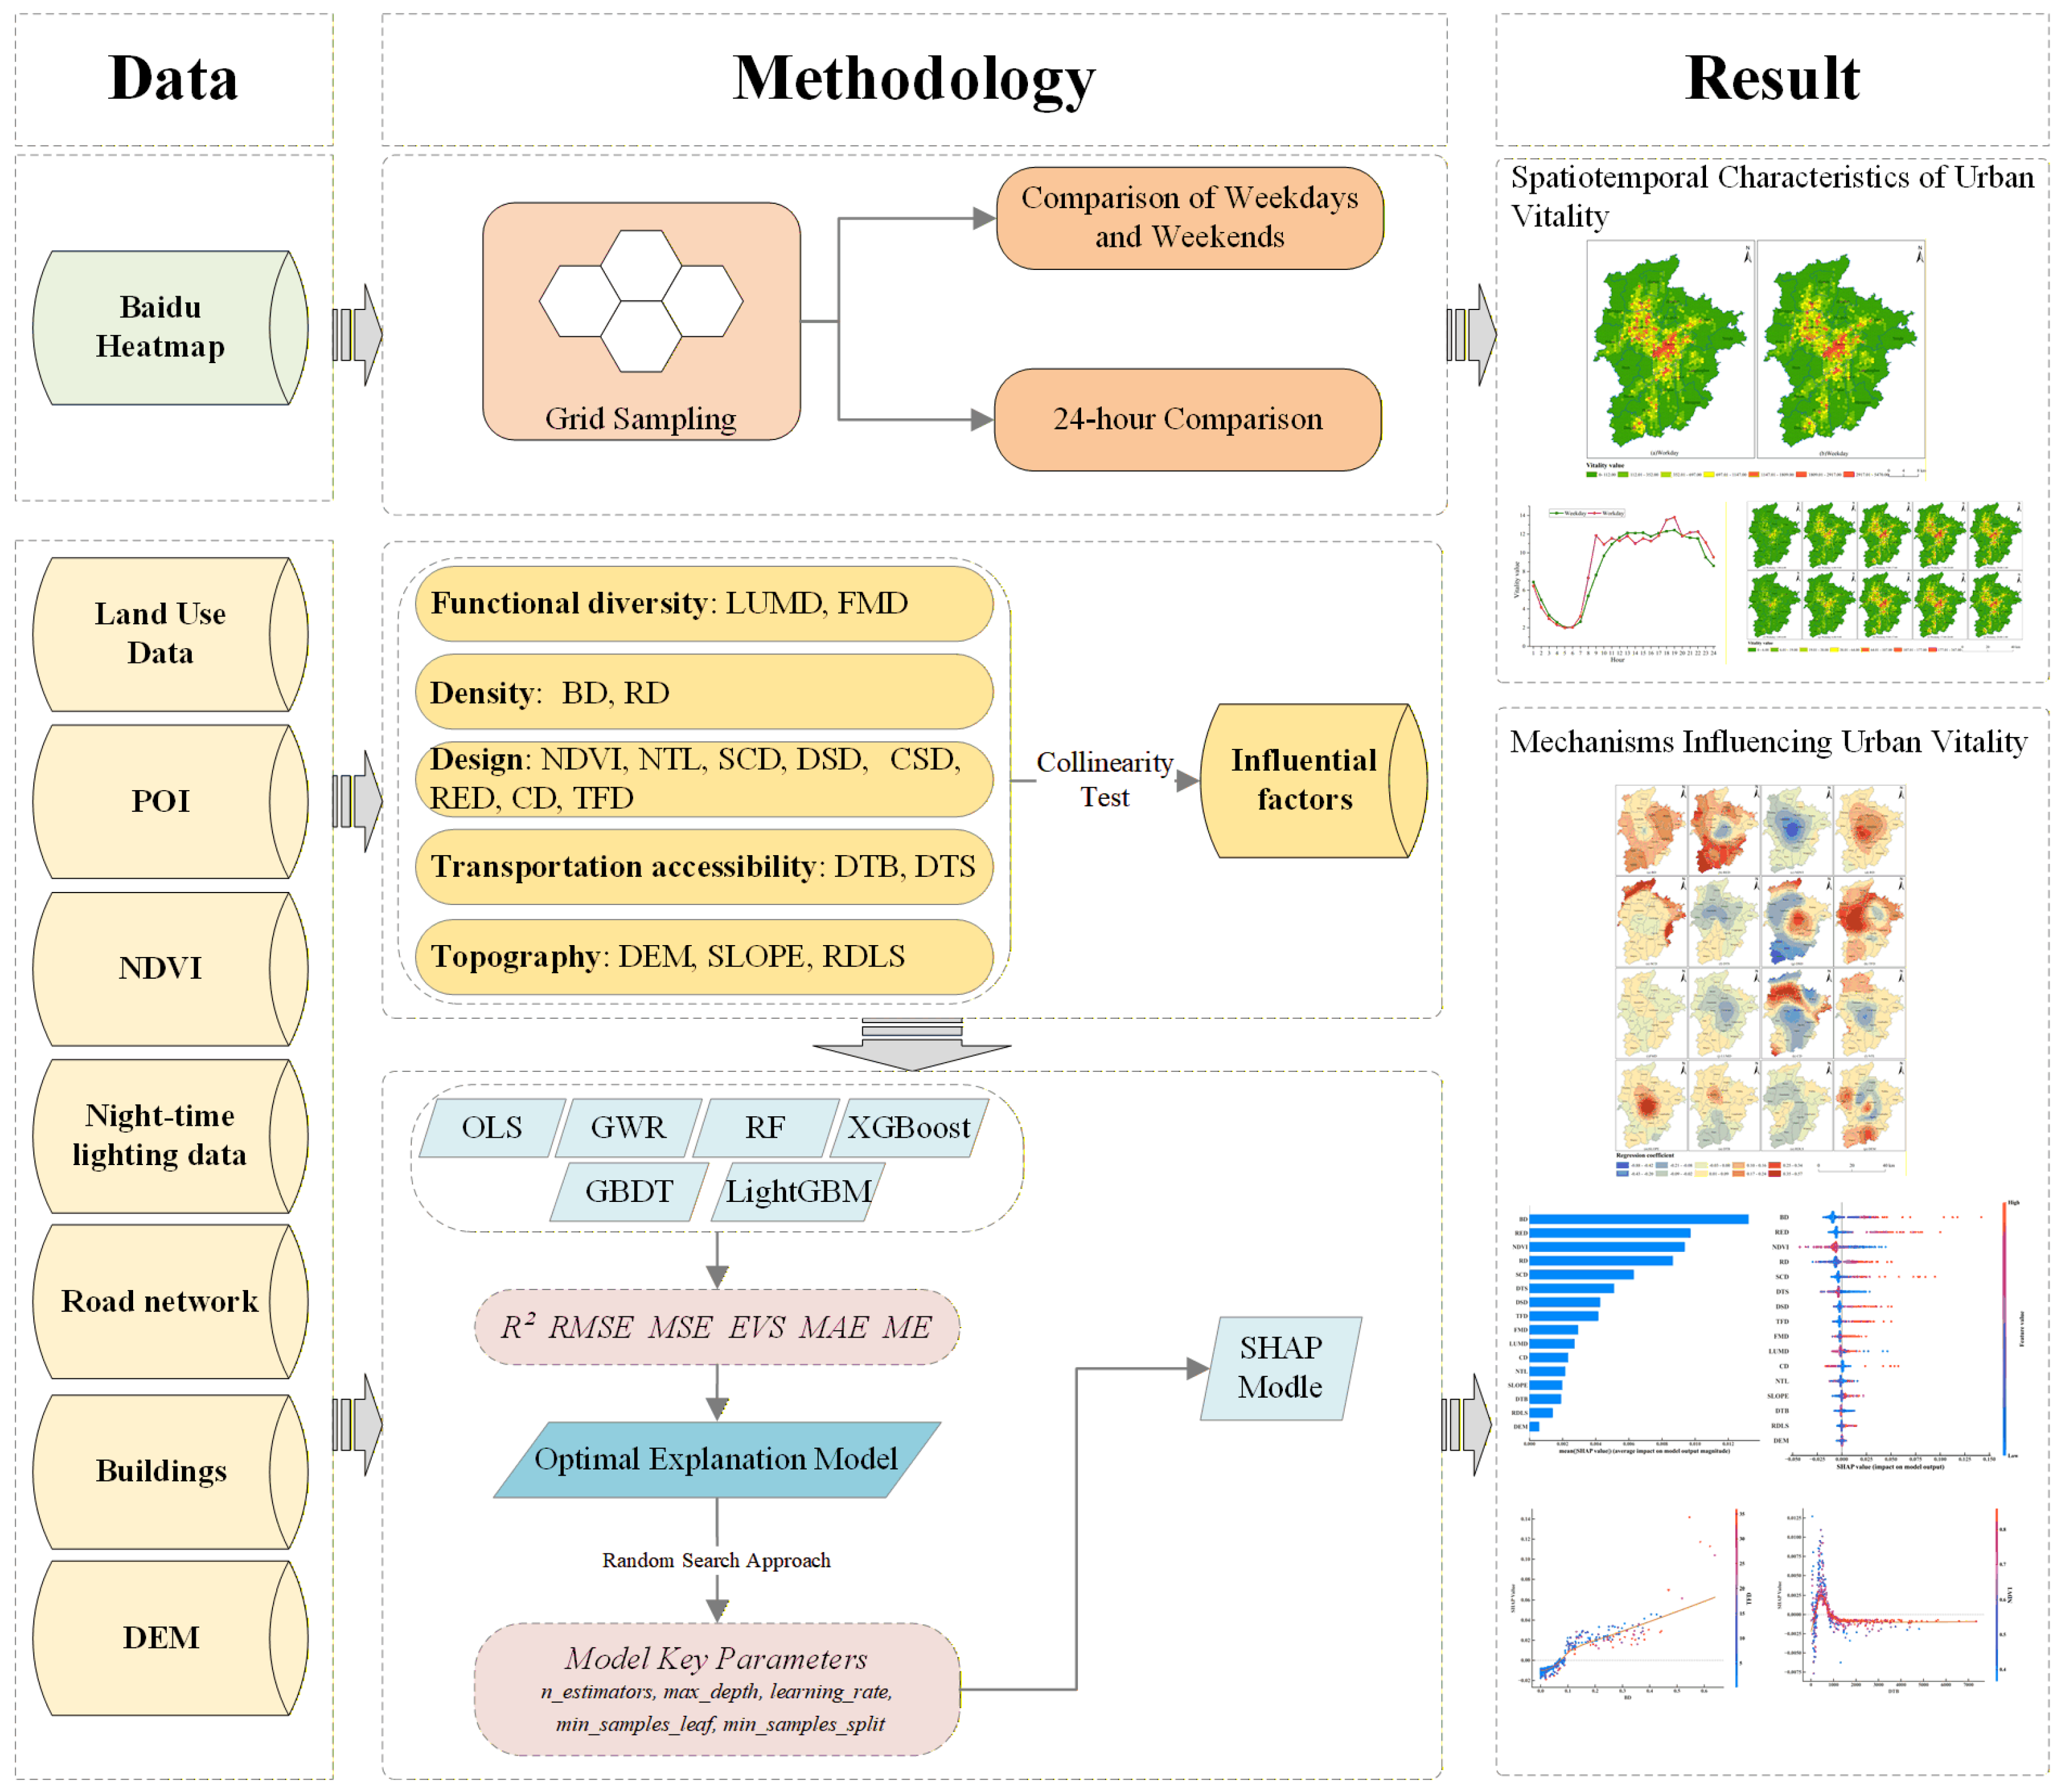
Figure 2 illustrates the overall research framework of this study, comprising four sequential stages: (1) urban vitality measurement, using Baidu population heatmap data to capture 24 h spatiotemporal patterns on weekdays and weekends; (2) influencing factor construction, developing a multi-dimensional indicator system covering functional diversity, density, design, transport accessibility, and topography; (3) model comparison and selection, applying Ordinary Least Squares (OLS), Geographically Weighted Regression (GWR), Random Forest (RF), eXtreme Gradient Boosting (XGBoost), Gradient Boosting Decision Trees (GBDTs), and Light Gradient Boosting Machine (LightGBM) to identify the optimal predictive approach; and (4) model interpretation, employing SHapley Additive exPlanations (SHAP) to reveal the relative contributions, spatial heterogeneity, and nonlinear effects of influencing factors.
Figure 2.
Research framework.
This framework advances methodological innovation by integrating spatial econometric models with interpretable machine learning, enabling simultaneous assessment of spatial non-stationarity and nonlinear interactions. By providing an explicit, data-driven linkage between urban form, human activity, and environmental context, it supports evidence-based urban planning and the design of targeted interventions to enhance urban vitality in complex topographic settings.
2.2.2. OLS and GWR
Ordinary Least Squares (OLS) is a classical statistical method used to estimate linear relationships between a dependent variable and one or more independent variables [52]. The OLS model is formulated as
where β0 denotes the constant term, βk represents the regression coefficient, and εi signifies the random error; yi denotes the dependent variable, namely the urban vitality value for each research unit, while xik denotes the independent variable, representing the characteristic value of each influencing factor for each research unit.
The spatial correlation of phenomena is proportional to distance. Variables observed within geographical spatial units vary according to their spatial location, and the relational structure between variables also changes accordingly. This phenomenon is known as spatial non-stationarity. To investigate spatial non-stationarity in spatial data, Fotheringham proposed the Geographically Weighted Regression (GWR) model, which is based on a synthesis of local regression analyses [53]. This model incorporates the spatial positional information of observational data into regression parameters by employing locally weighted least squares for point-by-point parameter estimation. The weights correspond to the geographical location of the regression points and are defined as distance functions between the location of the regression point and all other observation points. This approach enables highly intuitive detection of spatial relationship non-stationarity. The calculation formula is given in Equation (2).
where β0 is the intercept coefficient; (ui, vi) denotes the geographical location information of the i-th research unit; m-th is the number of influencing factors for urban vitality; βik is the spatial regression coefficient for the k-th influencing factor at the i-th research unit; xik is the value of the k-th influencing factor at the i-th research unit; εi is the error term for the i-th research unit; yi represents the urban vitality value for each research unit.
2.2.3. Comparison of Machine Learning Models
To capture the nonlinear relationships between influencing factors and urban vitality, the dataset was randomly split into an 80% training set and a 20% testing set. Six modeling approaches, OLS, GWR, RF, XGBoost, GBDT, and LightGBM, were trained on the training data. The models were then applied to the testing set to predict urban vitality, enabling an evaluation of predictive performance.
To scientifically and rationally select the optimal model for investigating the mechanisms influencing urban vitality, model accuracy was assessed using the coefficient of determination (R2), root mean square error (RMSE), mean squared error (MSE), explained variance score (EVS), mean absolute error (MAE), and mean error (ME). As shown in Equations (3)–(5), the R2 value ranges from 0 to 1, with higher values indicating a better fit. MSE measures the average of the squared errors, and RMSE is the square root of MSE. Smaller values of RMSE and MSE indicate less deviation, representing better model performance. As shown in Equation (6), EVS indicates the proportion of variance explained by the model, with values closer to 1 signifying superior explanatory power. As shown in Equation (7), MAE calculates the average absolute differences between predicted and actual values, providing a straightforward metric of prediction accuracy. As shown in Equation (8), ME represents the average of the prediction errors and is useful for identifying any systematic bias in the model.
where is the predicted values of research unit i-th after regression, yi is the observed values of research unit i-th, is the mean values of research unit, n is the number of research unit, and var is the variance operator.
2.2.4. SHAP Model
SHapley Additive exPlanations (SHAP) is an interpretable machine learning approach inspired by cooperative game theory, designed to quantify the marginal contribution of each feature to model predictions [54]. The additive attribution framework calculates SHAP values for each feature, indicating their influence on the predicted outcome, as presented below in Equations (9) and (10). Positive SHAP values imply a favorable effect on urban vitality, while negative values indicate an inhibitory effect.
The SHAP framework ensures that the contributions of all features sum to the difference between the model prediction for a given sample and the expected prediction across the dataset, thus providing consistent and locally accurate explanations. In this study, SHAP was applied to the optimal machine learning model (identified in Section 2.2.3) to quantify the direction, magnitude, and nonlinear interactions of influencing factors on urban vitality. By combining predictive performance with interpretability, SHAP addresses the black-box limitation of machine learning, offering insights that are directly relevant for evidence-based urban planning and spatial design.
where SHAPj denotes the SHAP value for feature j in any given sample; s represents the subset of features utilized in the model; vp denotes the feature set within the model; p signifies the number of features; fx(s) indicates the model’s prediction outcome for the feature subset; yi denotes the prediction outcome for sample i; ybase signifies the average of prediction values for other samples; SHAP(xij) denotes the SHAP value for sample i at feature j; and k denotes the number of features.
3. Results
3.1. Spatial–Temporal Characteristics of Urban Vitality
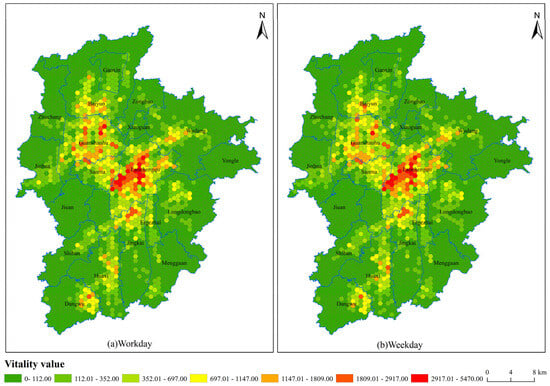
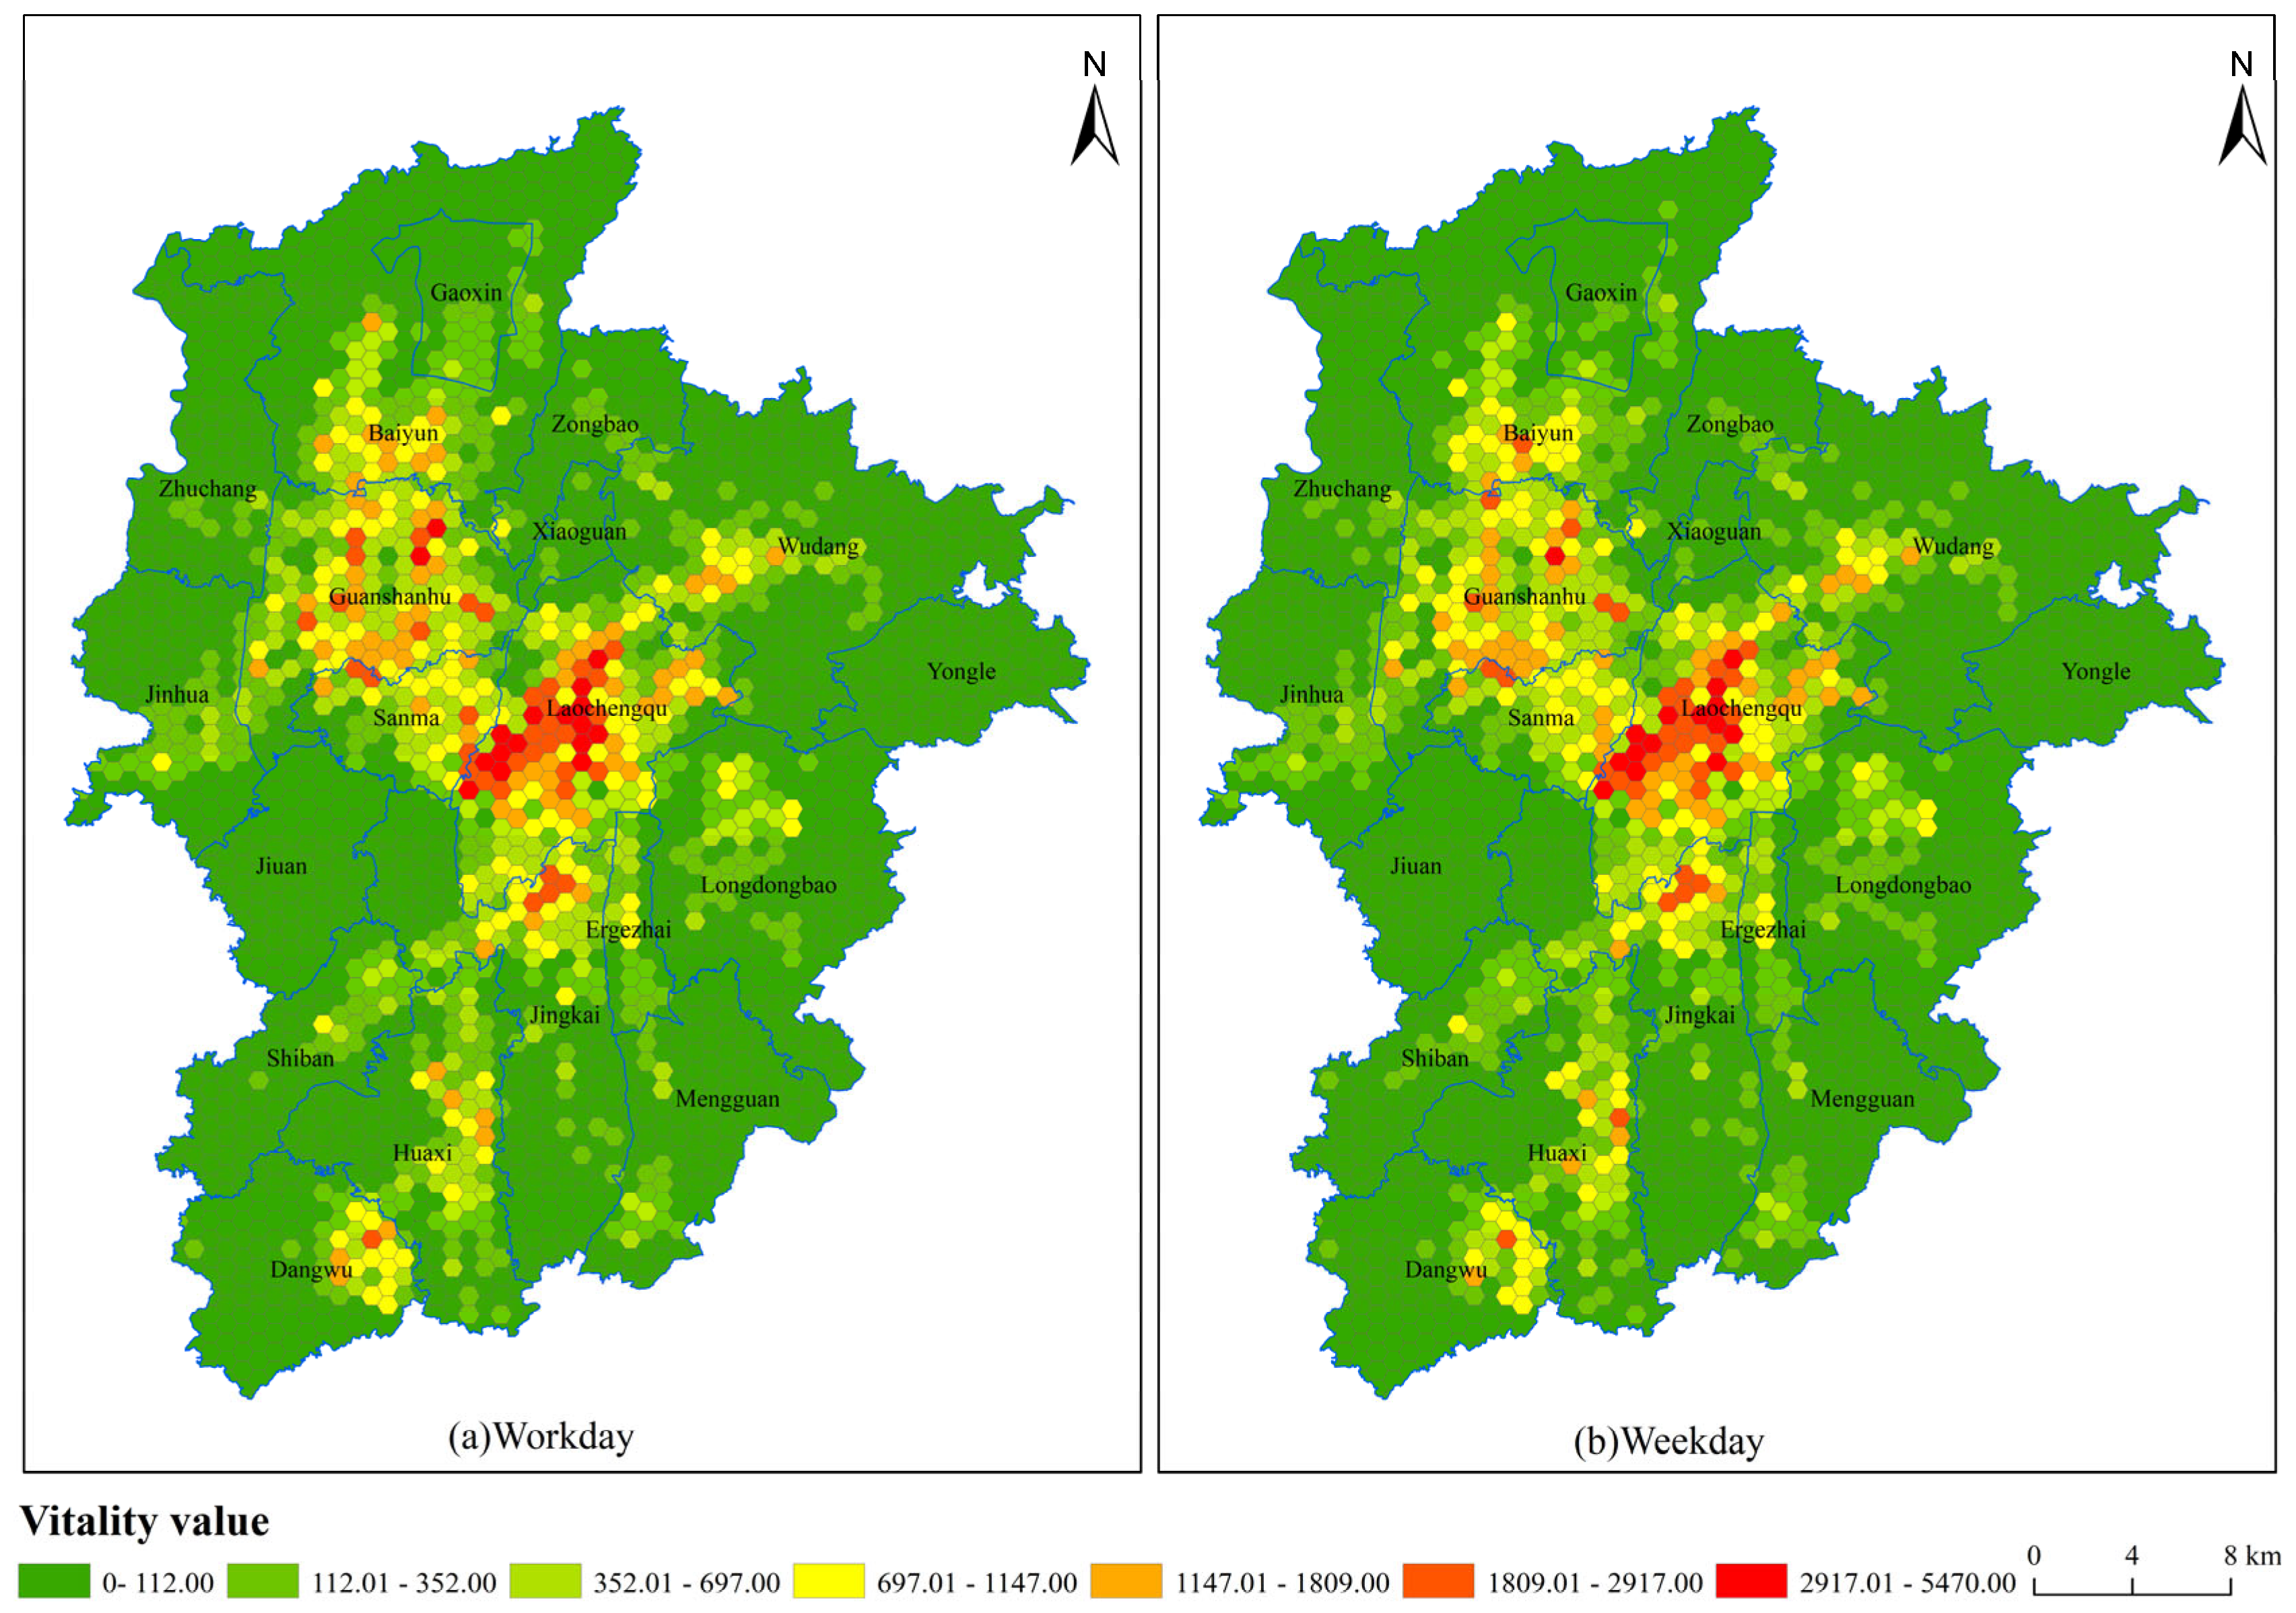
Using Baidu population heatmap data, urban vitality in Guiyang’s central area was analyzed for weekdays and weekends through grid-based averaging (Figure 3). The spatial distribution exhibits a single-core, multi-center, and clustered structure, with the historic Laocheng center as the primary high-value core. Secondary clusters, Baiyun, Guanshanhu, and Sanma in the northwest, and Wudang in the northeast, converge toward the historic core. Southward, vitality extends to Jingkai, Huaxi, and Dangwu clusters, forming a characteristic Y-shaped spatial pattern. The overall vitality index is slightly higher on workdays (217.66) than weekends (207.90), reflecting increased work, study, and routine activities, while spatial patterns remain largely consistent, with minor variations in the Sanma and Huaxi clusters.
Figure 3.
Characteristics of urban vitality spaces on weekdays and weekdays.
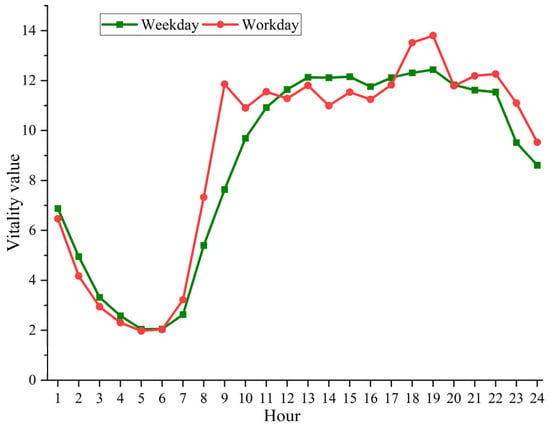
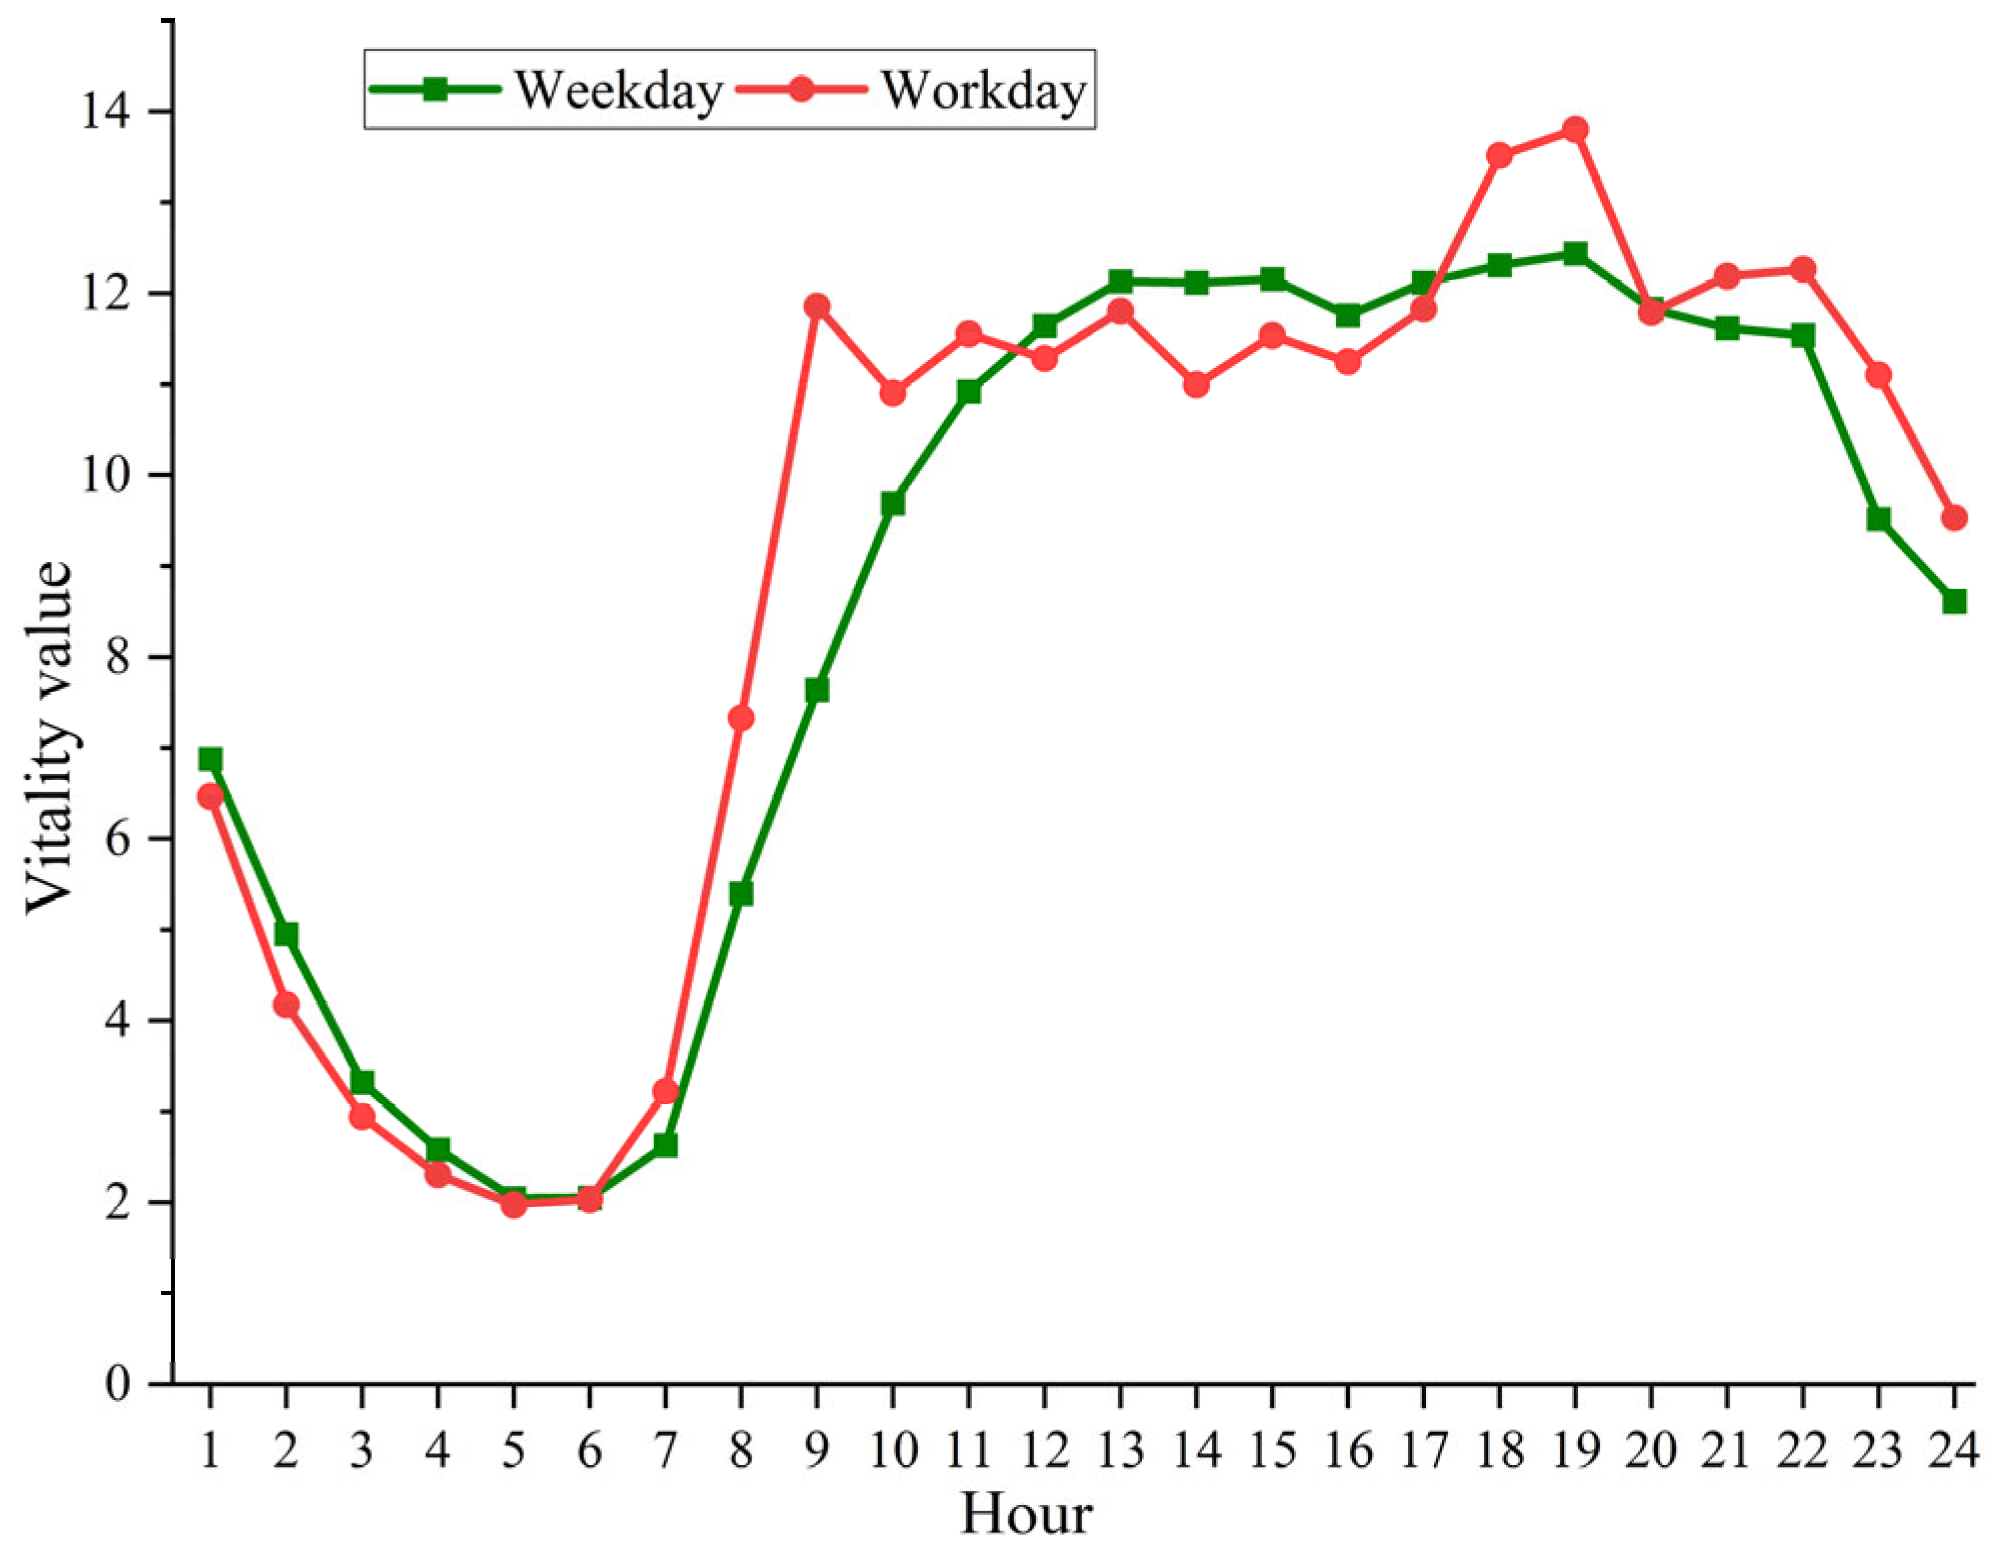
Hourly analysis (Figure 4) reveals consistent temporal trends across weekdays and weekends. Activity declines between 23:00 and 05:00, rises sharply from 06:00 to 11:00, stabilizes at elevated levels, and peaks at 19:00. Weekdays show more pronounced fluctuations, with distinct peaks at 09:00 and 19:00, reflecting commuting and work-related activity. Weekend patterns are smoother, with weekday activity surpassing weekend levels mainly during morning (07:00–11:00) and evening (18:00–24:00) periods, indicating reduced weekday leisure activity and more balanced weekend engagement. These findings highlight the interplay between spatial structure and daily human activity rhythms, providing insights for urban planning and management of vitality hotspots.
Figure 4.
Average hourly urban vitality on weekdays and weekdays.
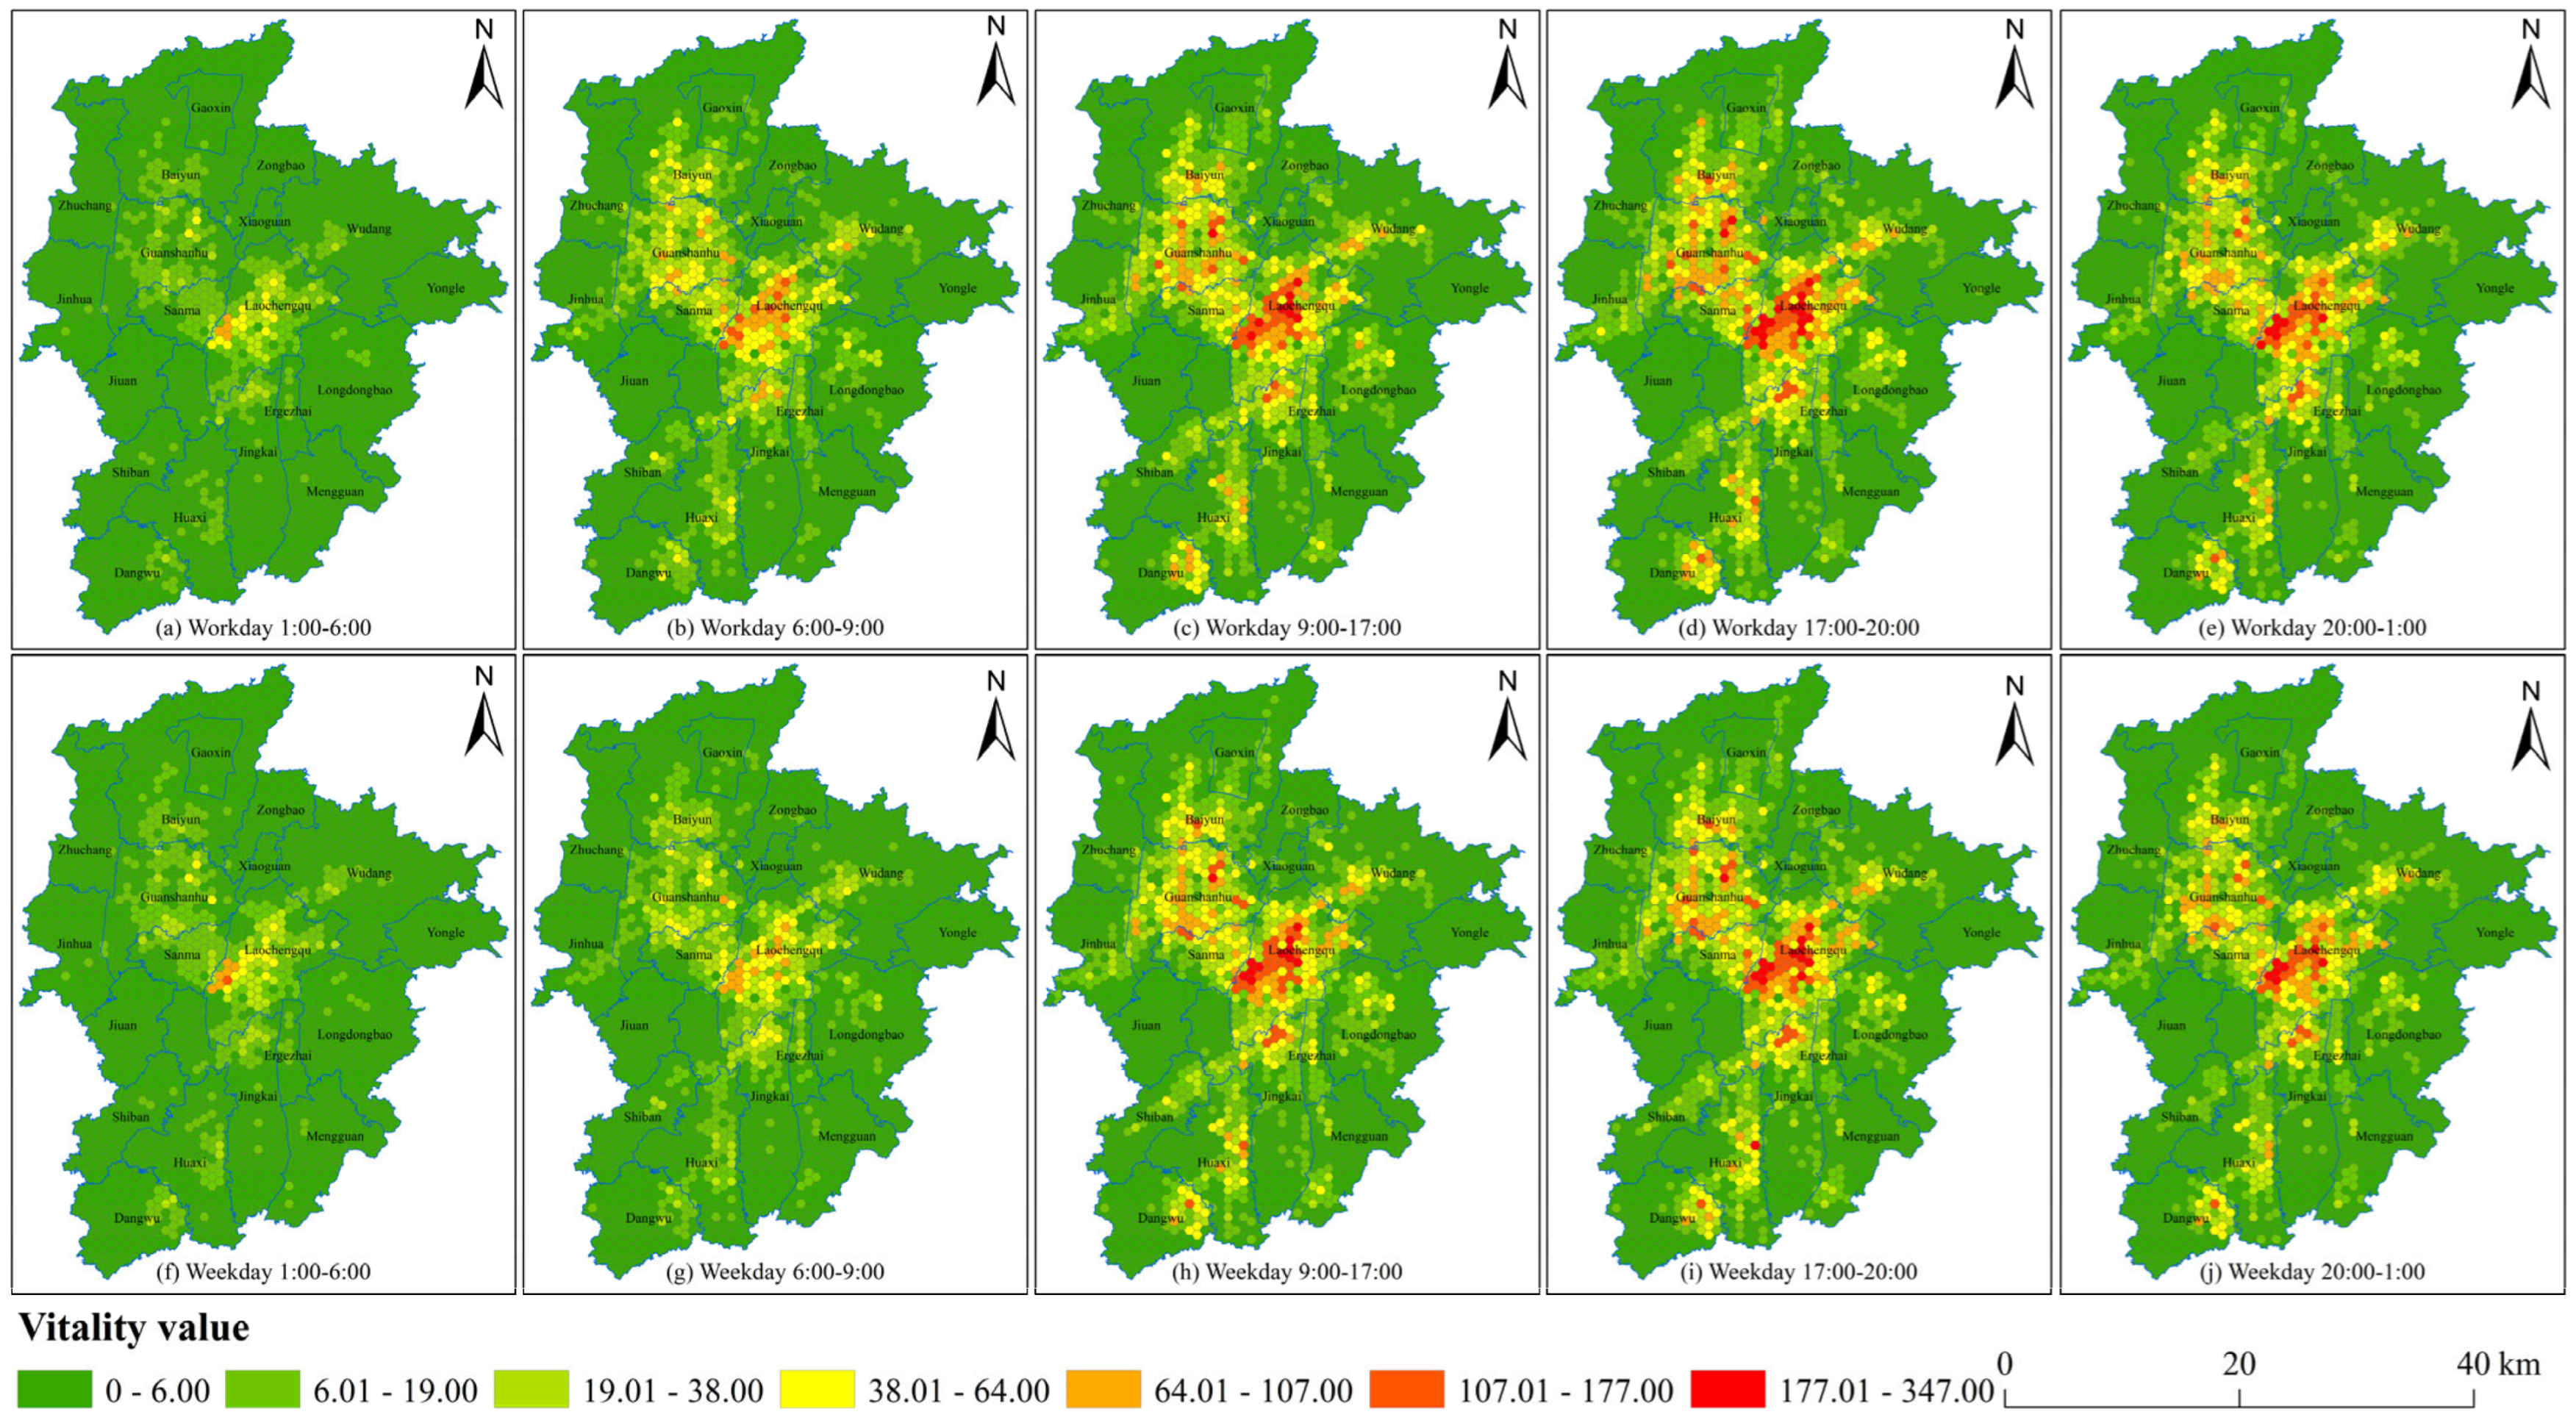
Based on hourly urban vitality patterns (Figure 4), the day was divided into five periods: 1:00–6:00, 6:00–9:00, 9:00–17:00, 17:00–20:00, and 20:00–1:00 (Figure 5). Overall, the spatiotemporal evolution of urban vitality exhibits similar patterns on weekdays and weekends. Activity generally radiates from the historic Laocheng cluster, extending northwest toward the Sanma, Guanshanhu, and Baiyun clusters; northeast toward Wudang; and southward to the Jingkai, Huaxi, and Dangwu clusters.
Figure 5.
Spatial characteristics of urban vitality by time slot on weekdays and weekdays.
During 1:00–6:00, high-activity zones are concentrated in the western Laocheng district, with weekend activity slightly exceeding weekday levels. From 6:00 to 9:00, a marked increase in activity is observed in Laocheng and Guanshanhu on weekdays, corresponding to commuter-driven residential activity. In the subsequent periods, spatial patterns are largely consistent between weekdays and weekends, indicating stable urban vitality distribution during daytime, evening, and late-night hours. These results highlight the interaction between urban structure and daily human activity rhythms, providing a spatiotemporally nuanced basis for planning interventions in vitality hotspots.
3.2. Performance of Machine Learning Models
Multicollinearity among explanatory variables can compromise model stability and inference in urban vitality studies. Therefore, variance inflation factor (VIF) and tolerance diagnostics were applied prior to model construction [55]. Tolerance values below 0.10 and VIF values exceeding 7.5 indicate severe multicollinearity and variable redundancy. As shown in Table 2, the POI density of surrounding convenient services (CSD) exhibited a tolerance of 0.0975 and a VIF of 10.2525, exceeding accepted thresholds, and was therefore excluded. The remaining 16 indicators satisfied multicollinearity criteria and were retained for subsequent analysis.
Table 2.
Multicollinearity diagnostics of explanatory variables used in urban vitality modeling, based on tolerance and variance inflation factor (VIF) criteria.
In terms of model design and implementation, all model parameters were initially set to their default values. Using an 80/20 training–testing split, six models, OLS, GWR, RF, XGBoost, LightGBM, and GBDT, were evaluated using R2, MSE, RMSE, MAE, EVS, and ME (Table 3). Among them, the GBDT model demonstrated the strongest overall performance, achieving the highest explanatory power (R2 = 0.8027; EVS = 0.8045) and the lowest prediction errors (RMSE = 0.0354; MAE = 0.0172). These results indicate superior nonlinear fitting capability, robust generalization, and stable predictive performance relative to both linear and alternative ensemble models. Accordingly, GBDT was selected as the core analytical model for investigating urban vitality mechanisms.
Table 3.
Comparative performance of linear, spatial, and machine learning models in predicting urban vitality, evaluated using goodness-of-fit and error-based metrics.
To enhance the generalization capability and prediction accuracy of the machine learning model, optimization adjustments to the initial GBDT model’s hyperparameters were necessary. Based on existing research, 5-fold cross-validation and random search approach were employed to determine the optimal hyperparameters, including n_estimators, max_depth, learning_rate, min_samples_leaf, and min_samples_split [56]. The final experimental results identified the following hyperparameters as optimal for the GBDT model in this study: n_estimators = 148, max_depth = 9, learning_rate = 0.0391, min_samples_leaf = 8, and min_samples_split = 6. Training the GBDT model with these optimized hyperparameters yielded the following performance metrics: R2 = 0.8206, MSE = 0.0011, RMSE = 0.0337, MAE = 0.0158, EVS = 0.8209, and ME = 0.2365. These results represent significant improvements over the initial model, with R2 and EVS increasing by 2.23% and 2.04%, respectively, while MSE, RMSE, MAE, and ME decreased by 15.38%, 4.80%, 8.14%, and 7.65%, respectively. These improvements confirm that the optimized GBDT model provides a reliable and robust foundation for subsequent SHAP-based interpretation of nonlinear and spatially heterogeneous effects on urban vitality.
3.3. Mechanisms Influencing Urban Vitality
3.3.1. Spatial Heterogeneity of Influencing Factors
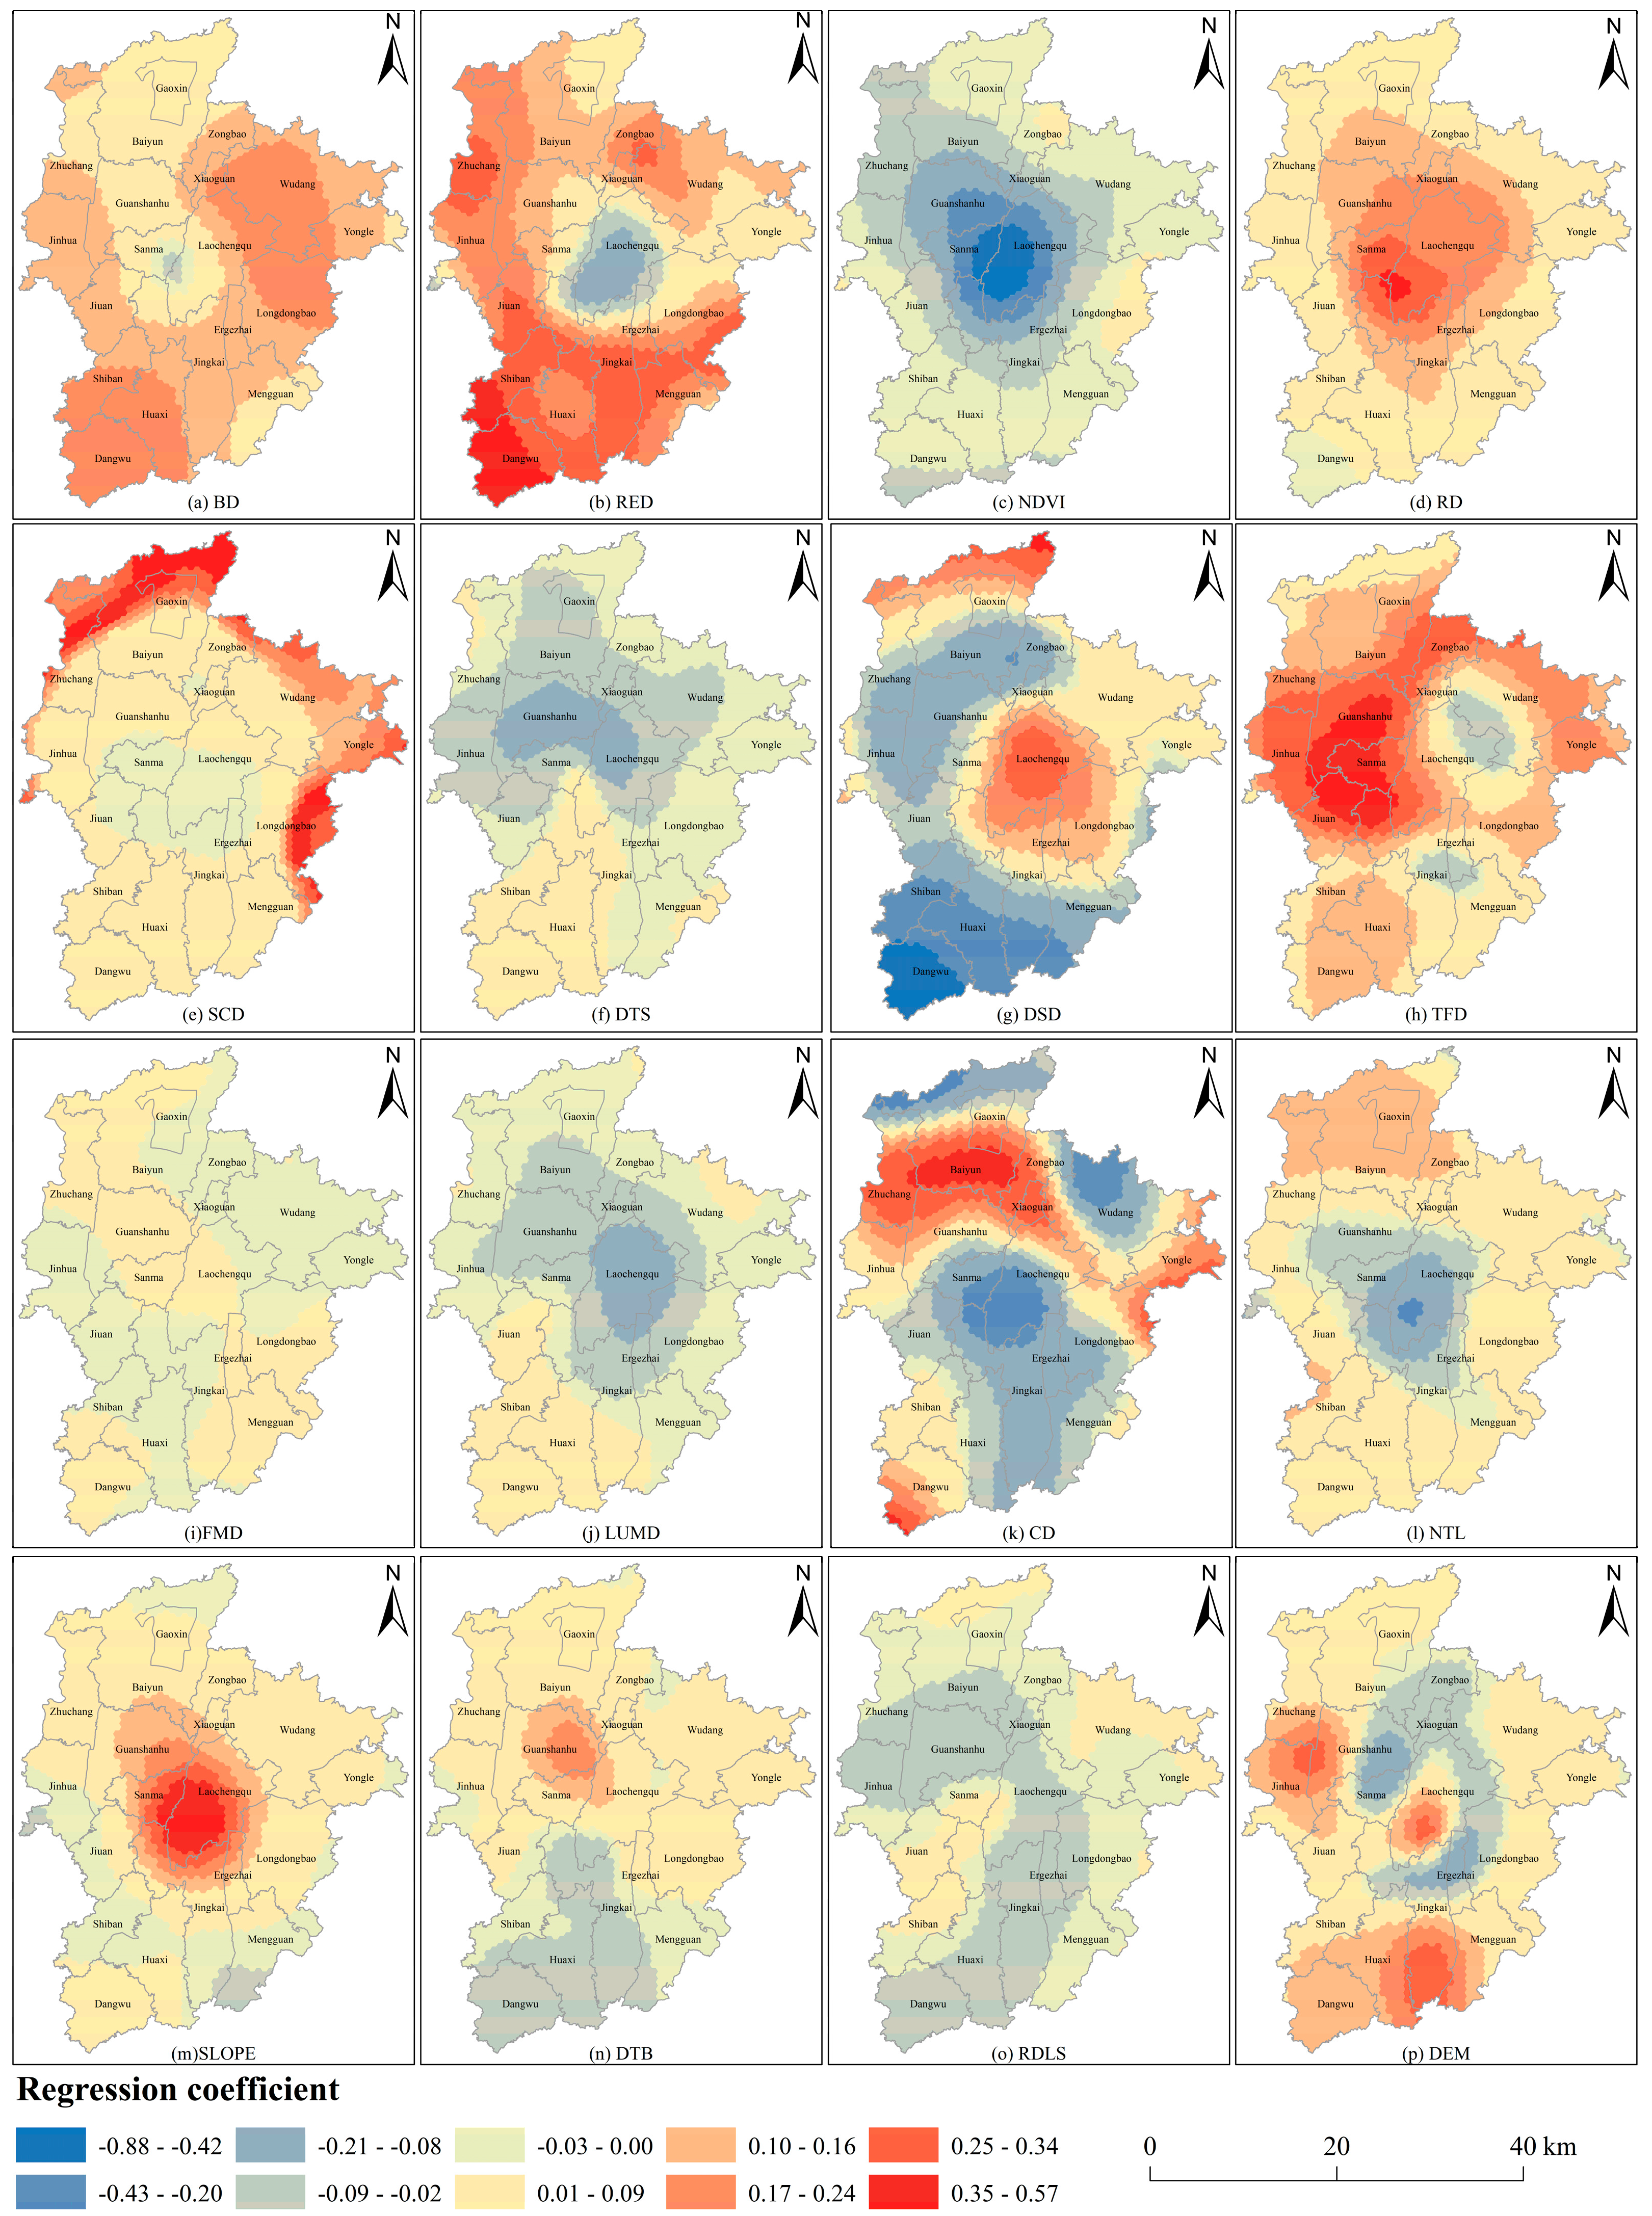
Figure 6 presents the spatial distribution of GWR coefficients for factors influencing urban vitality. Building density (BD), residential point density (RED), normalized difference vegetation index (NDVI), POI density of science, education, and culture (SCD), distance to subway station (DTS), land use mix degree (LUMD), and nighttime light (NTL) (Figure 6a–c,e,f,j,l) exhibit zonation patterns, with their effects transitioning from negative in peripheral areas to positive in the Laocheng cluster. Conversely, road density (RD), slope (SLOPE), POI density of dining and shopping (DSD), and distance to bus station (DTB) (Figure 6d,g,m,n) show a decreasing positive influence from the urban core to the periphery, with negative effects in some outlying zones.
Figure 6.
Spatial distribution of the regression coefficients of the respective variables of the GWR model.
High building density and concentrated land use in the Laocheng cluster create a dense urban environment that can inhibit vitality, while urban green spaces display spatial exclusivity, leading to negative NDVI effects in the Guanshanhu, Laocheng, and Sanma clusters. Road density promotes vitality most strongly in the urban core, diminishing toward peripheral areas. Educational and cultural facilities exert pronounced stimulatory effects in the northern Zhuchang and Baiyun clusters and eastern Longdongbao, with relatively minor spatial variation elsewhere. Retail and catering establishments similarly enhance vitality, with intensity decreasing from Laocheng to the periphery, reflecting the centrality of leisure venues. Corporate activities positively influence vitality in Guanshanhu, Baiyun, Zongbao, and Dangwu clusters, while transport infrastructure, including metro and bus stations, demonstrates complementary spatial effects in supporting resident mobility.
Topographical factors modulate vitality through elevation and slope. Areas with complex mountainous terrain show pronounced topographical influence, whereas established clusters such as Laocheng, Sanma, and Guanshanhu, characterized by low elevation variation, exhibit strong promotional effects on vitality due to favorable slope conditions. Collectively, these patterns highlight the spatial heterogeneity of urban vitality drivers and underscore the importance of cluster-specific planning strategies in Guiyang’s multi-centered urban structure.
3.3.2. Nonlinear and Heterogeneous Effects of Influencing Factors
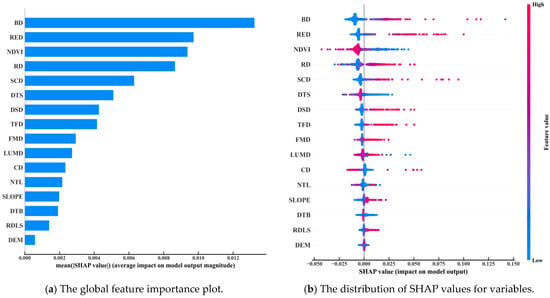
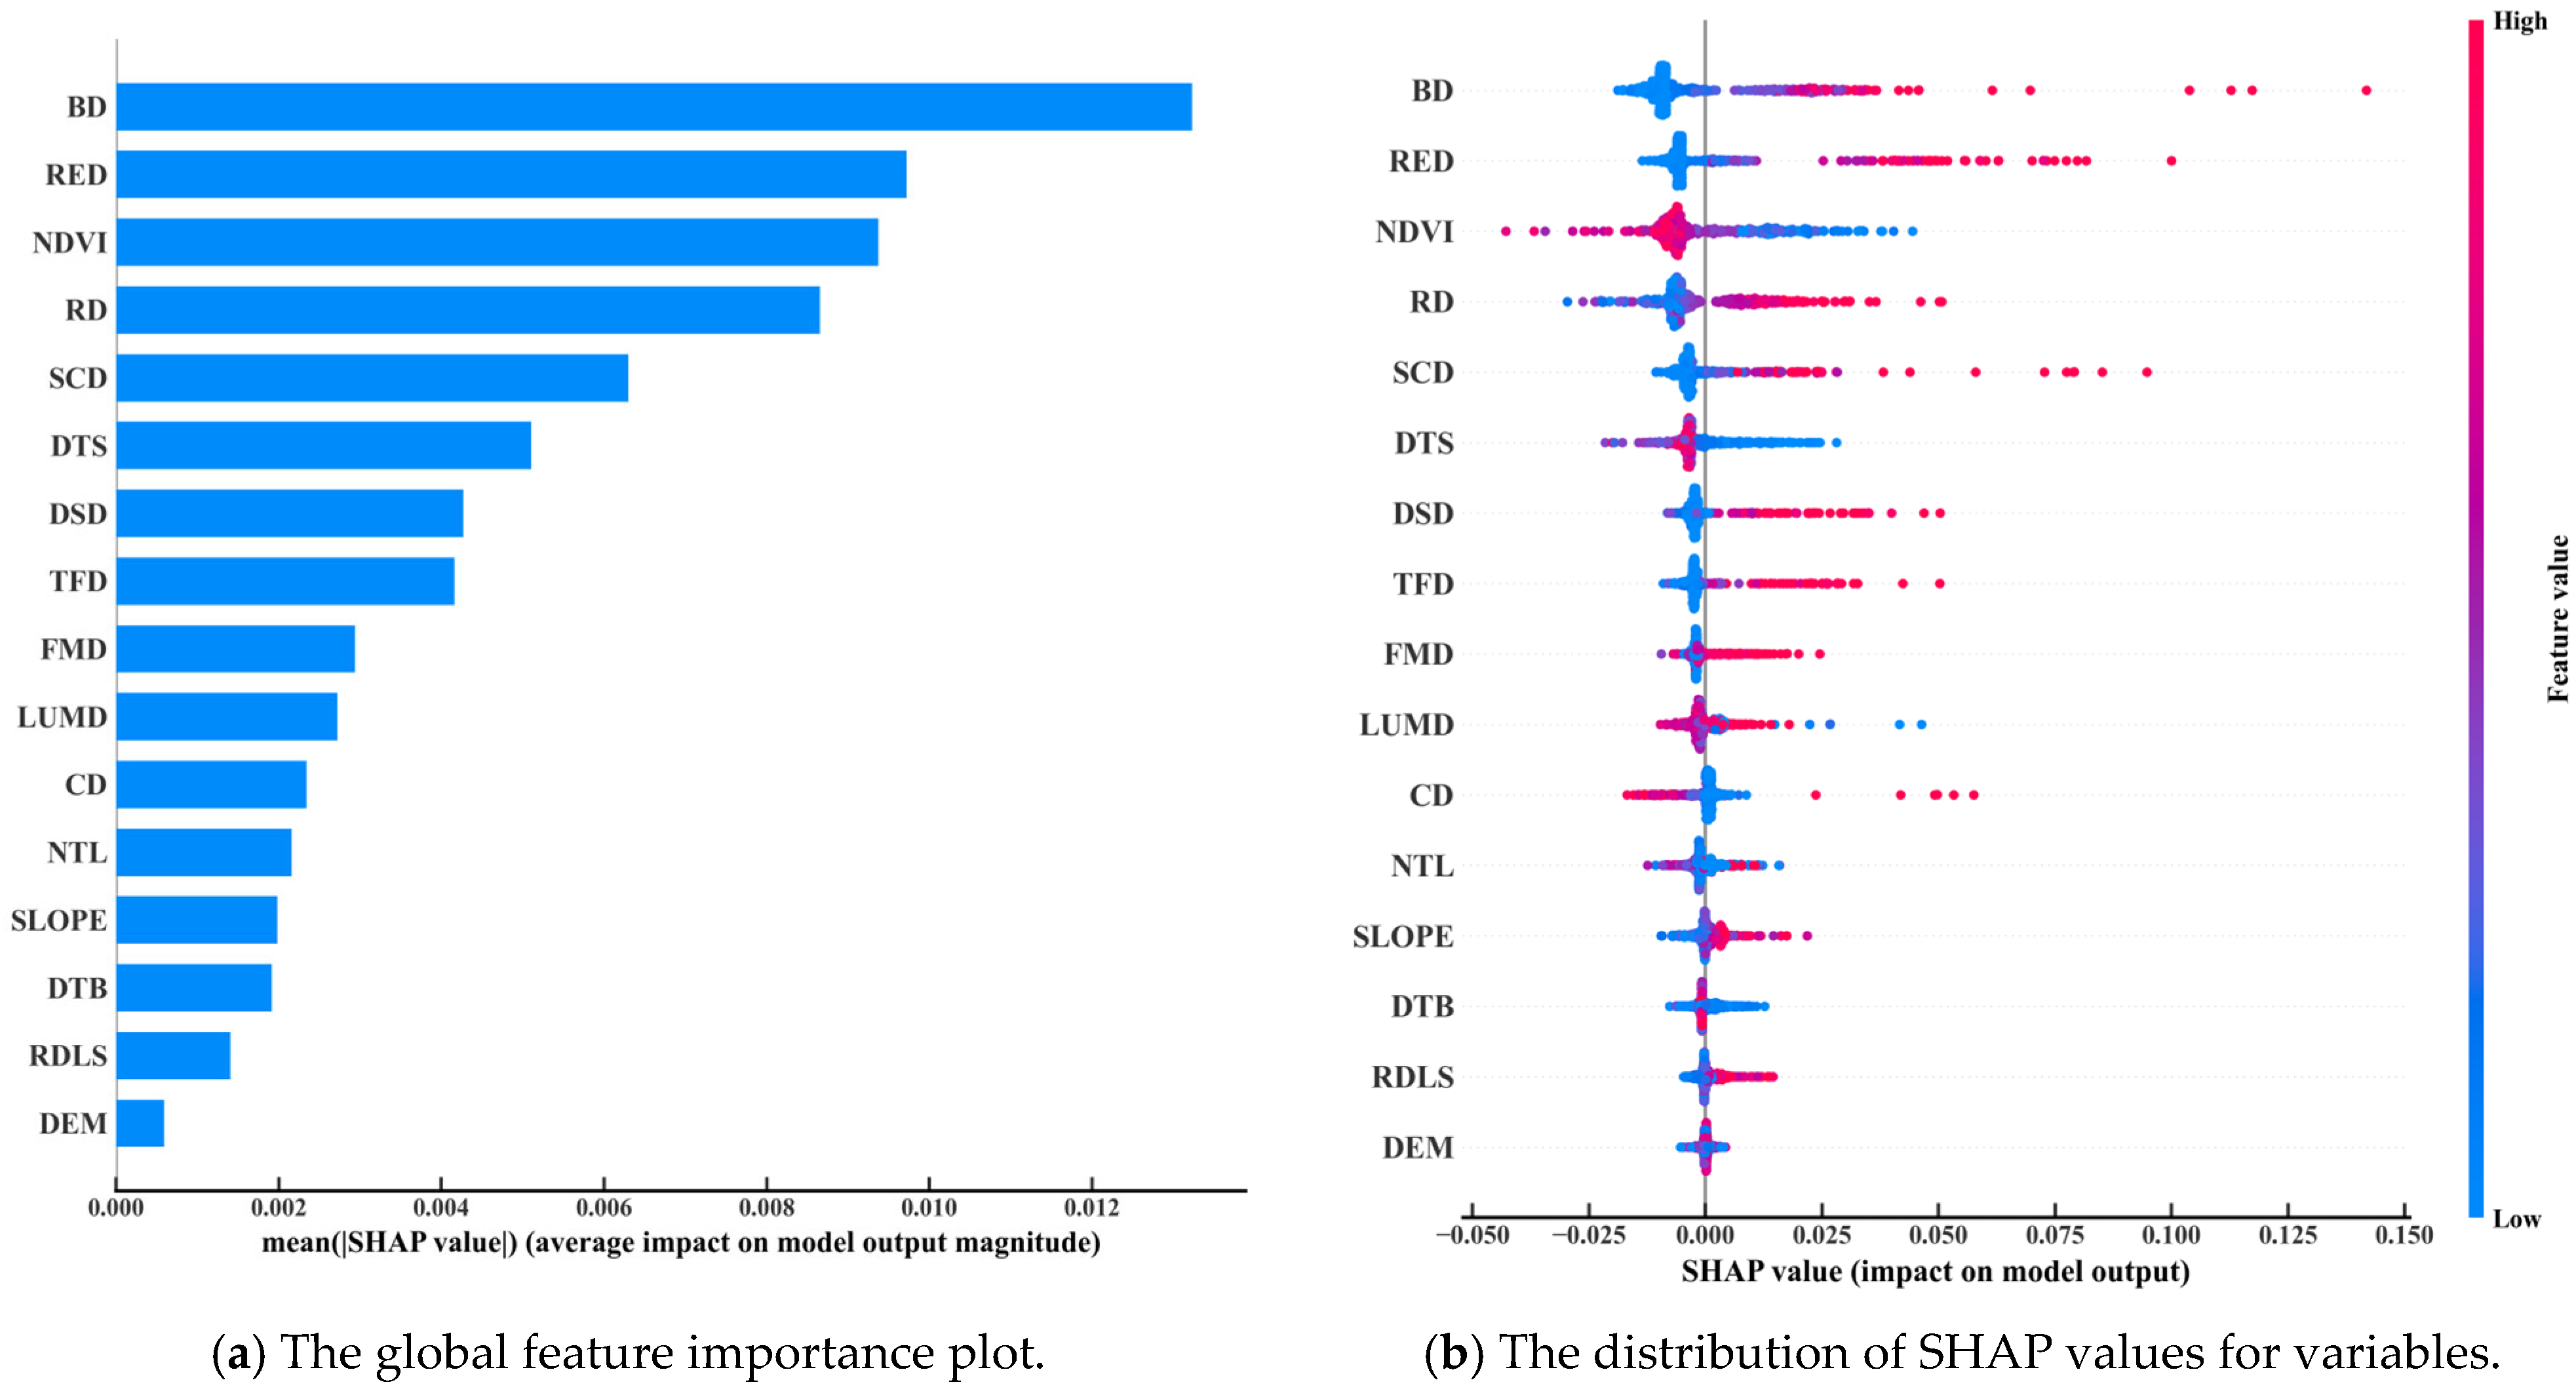
Based on the analysis results of the GBDT-SHAP algorithm (Figure 7), the global feature importance map (Figure 7a) presents the influencing factors in descending order of importance from top to bottom. The Y-axis represents the influencing factors, while the X-axis denotes the mean SHAP value of each factor across all samples. The XY axes of the honeycomb scatter plot (Figure 7b) share the same interpretation as the global feature importance map. Color indicates the magnitude of each factor’s feature value, with overlapping sample points jittered along the Y-axis for visual clarity.
Figure 7.
The importance of variables on urban vitality.
Figure 7a identifies the top four most influential factors as BD, RED, NDVI, and RD, whereas relief of the terrain (RDLS) and DEM have the least impact. Figure 7b shows that BD, RED, RD, SCD, DSD, and POI density of surrounding transportation facilities (TFD) exhibit positive correlations with urban vitality, while the NDVI, DTS, and DTB display negative correlations. This suggests that areas with high building density and dense road networks significantly enhance urban vitality. The concentration of residential, educational, cultural, dining, shopping, and transport facilities also constitutes a crucial determinant of urban vitality levels. Areas with higher vegetation coverage provide green landscapes and recreational spaces but simultaneously create functionally monotonous urban environments that negatively affect vitality. Distance from the nearest metro or bus station correlates negatively with urban vitality. The influence mechanisms of POI functional mix degree (FMD), LUMD, POI density of surrounding company (CD), and NTL on urban vitality are complex. Higher levels of urban facility diversity and land use diversity exert both stimulating and inhibiting effects on vitality; poorly planned, high-density urban spaces do not enhance vitality. Regarding topography, the influence patterns of DEM, RDLS, and SLOPE exhibit weak regularity with low intensity of both positive and negative effects. This indicates that natural geographical conditions are not the dominant force shaping urban vitality patterns at the current stage of mountainous city development; rather, socioeconomic factors and planning construction are the key determinants
3.3.3. Nonlinear and Threshold Effects of Influencing Factors
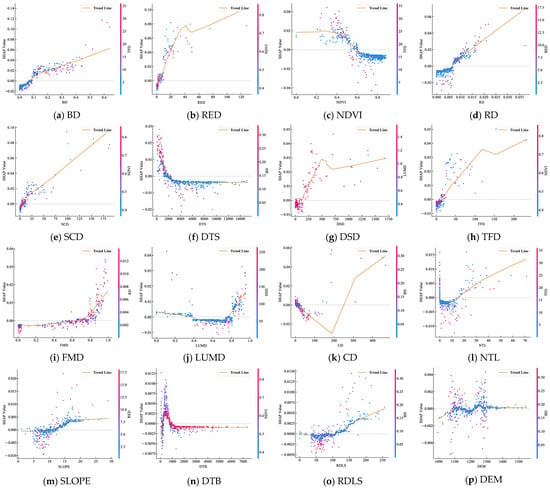
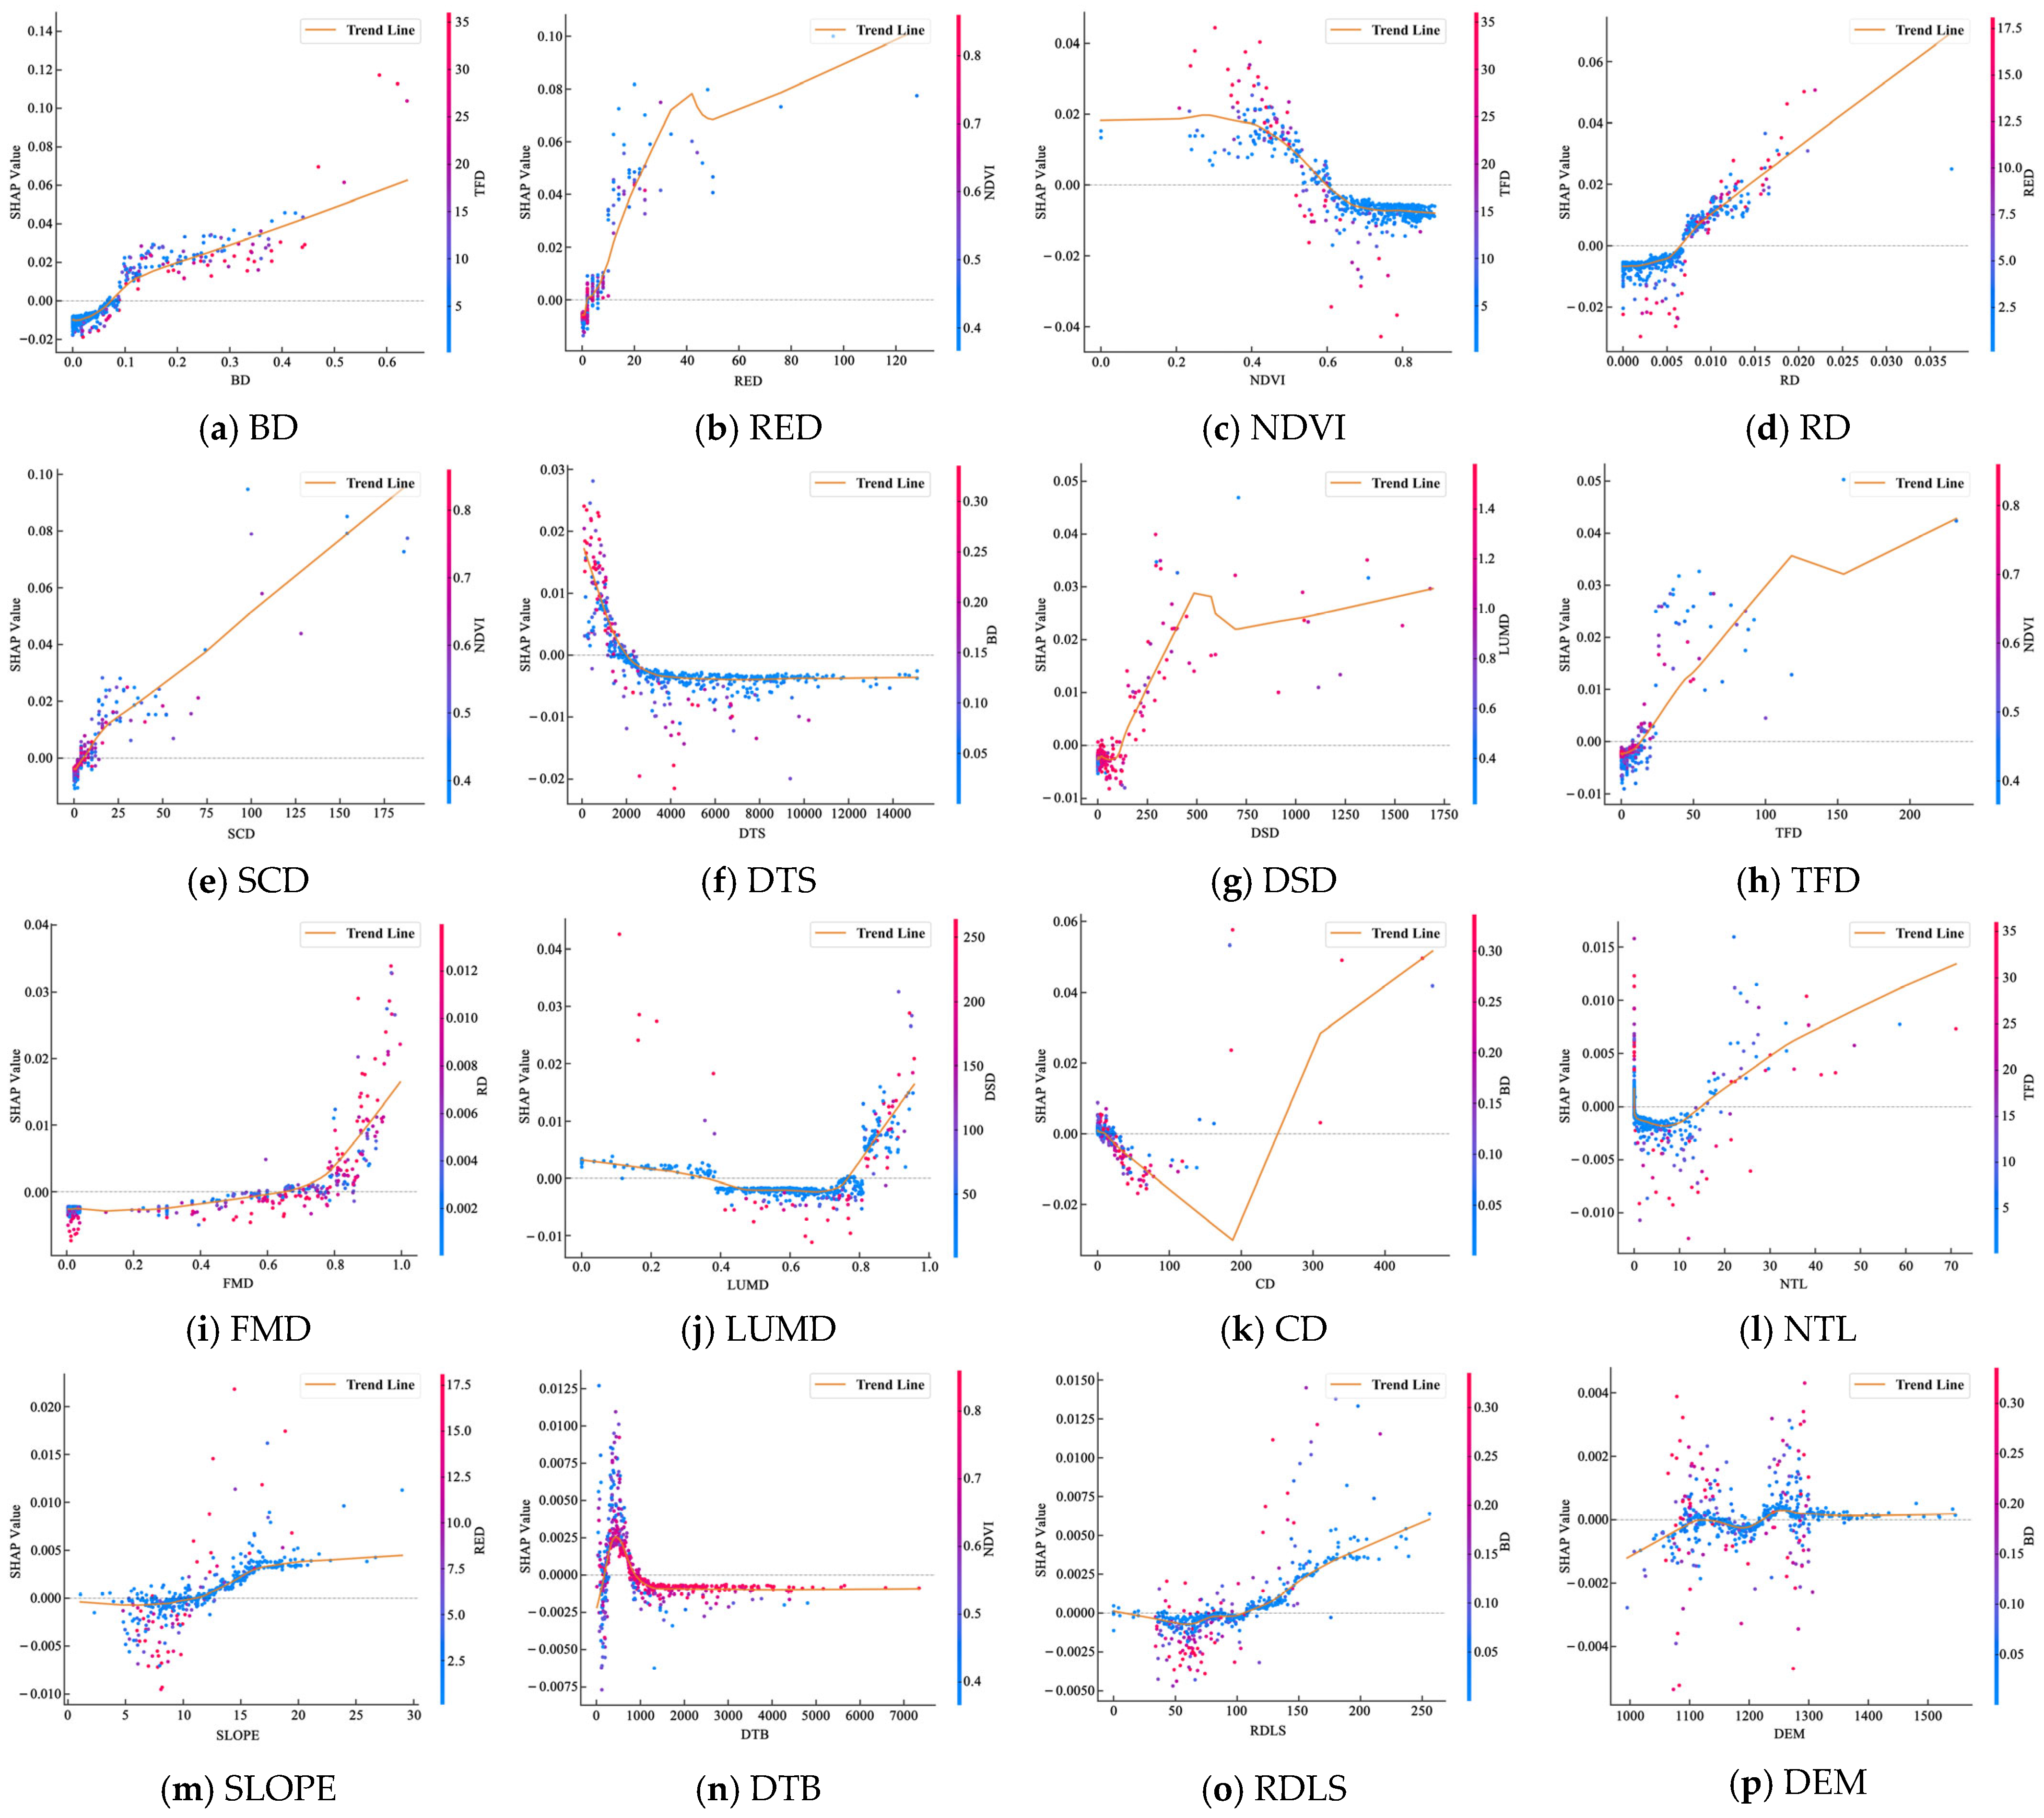
The SHAP dependence plot illustrates the nonlinear relationships and threshold effects of factors influencing the GBDT model results. Figure 8 presents the SHAP dependence plot, where the X-axis represents the feature variable of the influencing factor, and the Y-axis displays its corresponding SHAP value. The SHAP dependence plot automatically identifies other variables exhibiting the strongest interaction effects with the current variable, with color changes indicating the magnitude of these interactions. Specifically, color variations reflect the feature values of the most strongly interacting variable across each evaluation unit. Additionally, a fitted smoothing curve is overlaid on the scatter plot within the figure to highlight trends.
Figure 8.
The nonlinear relationships between urban vitality and various variables.
Overall, the impact of various factors on urban vitality follows a dual-stage pattern of “inhibition–promotion” accompanied by threshold effects. Regarding urban functional diversity, Figure 8i shows that FMD initially exerts an inhibitory effect before becoming positive; when its mixness exceeds 0.65, it positively stimulates vitality. Figure 8j illustrates that LUMD exhibits a three-stage pattern: diminishing promotion, followed by inhibition, and then a return to promotion. This reflects the specific attraction of single-purpose functional spaces to populations, with inhibition occurring between diversity levels of 0.35 and 0.75, and a sharp increase in vitality promotion beyond 0.75.
Within the density dimension, BD and RD exhibit an overall positive correlation (Figure 8a,d). When BD falls below 0.75 m2/m2, localized negative impacts occur. RD below 0.0055 m/m2 exerts a detrimental effect on vitality. As density increases, the influence shifts to promotion, indicating that excessively low road and building densities impede resident aggregation.
Figure 8c indicates that as the NDVI increases beyond 0.6, its promotional effect gradually diminishes. When the NDVI exceeds 0.75, its inhibitory effect stabilizes, reflecting how excessive greening may lead to functional weakening and spatial underutilization. NTL intensity exhibits an irregular U-shaped pattern, with SHAP values beginning to increase positively when intensity exceeds 7, suggesting that high nighttime light levels effectively promote vitality. Figure 8b,e,g,h demonstrate that RED, SCD, DTS, and TFD all exhibit an overall positive correlation and upward trend. Their SHAP positive and negative threshold values are 2, 6, 125, and 15 units per square kilometer, respectively, whereas the CD shows a negatively increasing trend (Figure 8k). Infrastructure planning within urban spaces primarily serves residents’ daily work and living needs, while the spatial clustering of these facilities also influences the intensity of resident activities.
Regarding transport accessibility, proximity to the nearest underground station exhibits a pattern of an initially steep decline followed by a plateau effect (Figure 8f). Local effects turn negative beyond 2000 m, with the negative impact on vitality stabilizing at approximately 4000 m. The DTB exhibits a sharp increase to a peak followed by a rapid decline, ultimately stabilizing in a steady inverted U-shaped pattern (Figure 8n). Distances below 250 m inhibit vitality, while distances between 250 and 1000 m promote it, with the strongest positive effect occurring around 500 m. Beyond approximately 1500 m, the negative impact on vitality remains stable.
The threshold characteristics of elevation, slope, and relief on urban vitality exhibit complexity (Figure 8m,o,p). This mirrors the results from their scatter plots (Figure 7b), indicating that topographical features can serve both as the natural foundation for distinctive urban landscapes and as physical barriers hindering urban development.
4. Discussion
This study contributes to urban vitality research through theoretical, practical, and methodological innovations. Theoretically, it adopts a people-centered approach, characterizing urban vitality by the dynamic aggregation of resident activities and emphasizing the interaction between human behavior and urban space, overcoming the limitations of static, physical-pattern-based analyses. Practically, the study examines Guiyang, a representative mountainous city, analyzing spatiotemporal vitality patterns across weekdays, weekends, and 24 h cycles. An indicator system encompassing five dimensions, functional diversity, density, design, transport accessibility, and topography, was developed to reflect the unique characteristics of mountainous urban environments. Methodologically, spatial heterogeneity was quantified using GWR, while nonlinear relationships and threshold effects were uncovered through machine learning models (RF, XGBoost, LightGBM, GBDT) integrated with SHAP analysis, enhancing interpretability of causal mechanisms.
The research findings reveal the spatiotemporal characteristics and influencing mechanisms of urban vitality within Guiyang’s central urban area. The following recommendations are proposed to enhance urban vitality. Firstly, the spatial configuration of Guiyang’s central urban area—characterized by a single core, multiple centers, and clustered development—aligns with the planning objectives for mountainous cities. However, clusters in peripheral areas such as Yongle, Jiu’an, Mengguan, and Zhuchang exhibit overall weaker vitality. For these low-vitality clusters, investment should be increased in public service elements such as education, healthcare, leisure and entertainment, and transportation. This would attract more residents through spillover effects from the city center while alleviating overcrowding pressures there, thereby achieving a multi-centered, clustered development pattern. Secondly, the urban functional mix exhibits complex threshold effects: it enhances vitality only when the POI mix exceeds 0.65 and the land use mix surpasses 0.75. The POI mix reflects granular functional diversity at the neighborhood level, while the land use mix indicates larger-scale functional integration. Therefore, urban planning must go beyond mere land use zoning to incorporate diverse commercial formats within neighborhoods and small-scale plots, ensuring the quality of functional integration. Simultaneously, areas with low mixed-use levels that inhibit vitality should be revitalized through urban renewal projects introducing core functional nodes to activate entire districts [46]. Building density and road density exert a negative influence on urban vitality below thresholds of 0.75 m2/m2 and 0.0055 m/m2, respectively. This finding supports Jane Jacobs’ assertion that is the source of vitality [5]. Consequently, both metrics should be treated as mandatory control indicators in urban planning or regeneration projects, ensuring they exceed the minimum thresholds required to stimulate urban vitality [57]. Vegetation coverage does not always correlate positively with urban vitality. Excessive green space coverage may lead to functional homogeneity, creating space planning should promote patchy, mosaic-like green areas integrated with commercial facilities and pedestrian and cycling networks. Regarding public transport service coverage, underground stations serve a wider area than bus stops, with both effects diminishing with distance—a conclusion supported by existing research [45]. Urban development should thus focus on underground stations to build transit-oriented development (TOD) complexes, activating larger areas while optimizing pedestrian environments and street functions around bus stops to create pleasant, compact neighborhoods. In terms of facility distribution, residential, educational, commercial, and transport facilities all demonstrate clear positive effects, whereas the number of corporate entities shows a negative correlation. Purely office-based functions may create outside working hours. Therefore, corporate zones should consciously incorporate catering, residential, and leisure facilities to prevent tidal-like depopulation, fostering balanced work–life integration and creating multifaceted urban spaces.
This study has some limitations. Data quality and limitations, although these datasets provide high spatial and temporal coverage, uncertainties may arise from user bias in LBS data, temporal inconsistencies across data sources, and classification errors in volunteered geographic information. Additionally, threshold characteristics identified in Guiyang may not generalize to other mountainous cities. In future research, integrating spatiotemporal big data such as street-view imagery, drone surveying, and wearable device data to enrich the sources of data for urban vitality assessment. By fully incorporating natural, economic, and social factors, an indicator system for urban vitality determinants can be constructed. Comparative studies across cities at different stages of urbanization and under varying governance models should be conducted to validate the universality and variability of research conclusions.
5. Conclusions
This study investigates the spatiotemporal characteristics and influencing mechanisms of urban vitality in Guiyang’s central urban area using multi-source data and explainable machine learning. Urban vitality exhibits a multi-centered, clustered structure centered on the Laocheng districts, extending northwest, northeast, and southward in a Y-shaped pattern. Weekday vitality slightly exceeds weekend levels, with morning and evening commuting peaks driving temporal fluctuations. High-value zones generally radiate from Laocheng toward peripheral clusters, though weekend early-morning activity can surpass weekdays.
Spatial heterogeneity analysis shows that BD and vegetation coverage exert concentric effects, while RD and catering facilities promote activity centrally and decline outward. Educational, corporate, and transport facilities display multi-centered influences, supporting Guiyang’s multi-cluster development strategy. Topography has limited nonlinear impact on vitality. Global importance and SHAP analyses identify BD, RED, NDVI, and RD as core determinants, with threshold effects: FMD > 0.65 and LUMD > 0.75, BD > 0.75 m2/m2, and RD > 0.0055 m/m2 enhance vitality, while excessive vegetation can inhibit it. Subway and bus accessibility exhibit optimal service ranges, with diminishing effects beyond 2000 m for metro stations and an inverted U-shaped effect for bus stops (250–1000 m).
These findings highlight that urban vitality in mountainous cities is primarily shaped by socioeconomic infrastructure and detailed planning rather than topography, providing a scientific reference for optimizing urban design, functional integration, and transport-oriented development to enhance urban vibrancy.
Author Contributions
Conceptualization, T.T. and P.R.; methodology, T.T. and Y.W.; software, W.Z.; validation, Z.F. and Y.D.; formal analysis, T.T.; investigation, Z.F.; resources, J.R.; data curation, W.Z.; writing—original draft preparation, T.T.; writing—review and editing, Y.W.; visualization, Y.D.; supervision, W.Z.; project administration, J.R.; funding acquisition, P.R. All authors have read and agreed to the published version of the manuscript.
Funding
This research was funded by Guizhou Provincial Department of Education 2024 Natural Science Research Project (Young Scientific and Technological Talent Development Program): Research on Urban Vitality Characteristics and Optimization Strategies in Bijie Using Multi-Source Spatiotemporal Big Data, grant number: Qianjiaoji [2024] No. 252; Bijie Scientist Workstation Project: Bijie City Scientist Workstation for Mountain Resources, Environment, and Disaster Research, grant number: BKHPT [2025] No. 2; Bijie City Talent Team Project: Karst Plateau Resources and Environmental Remote Sensing Talent Team, grant number: BWRLT (2023) No. 14; Bijie Municipal Science and Technology Bureau Joint Project: Intelligent Geographic Spatial Information Application Engineering Center, grant number: BKLH (2023) No. 08.
Data Availability Statement
The data that support the findings of this study are available from the corresponding author, Ping Rao, upon reasonable request.
Conflicts of Interest
The authors declare no conflicts of interest.
Abbreviations
The following abbreviations are used in this manuscript:
| GWR | Geographically Weighted Regression |
| OLS | Ordinary Least Squares |
| SHAP | SHapley Additive exPlanations |
| RF | Random Forest |
| XGboost | eXtreme Gradient Boosting |
| GBDT | Gradient Boosting Decision Tree |
| LightGBM | Light Gradient Boosting Machine |
| LUMD | Land Use Mix Degree |
| FMD | POI Functional Mix Degree |
| BD | Building Density |
| RD | Road Density |
| NDVI | Normalized Difference Vegetation Index |
| NTL | Nighttime Light Value |
| SCD | POI Density of Surrounding Science, Education and Culture |
| DSD | POI Density of Surrounding Dining and Shopping |
| CSD | POI Density of Surrounding Convenient Services |
| RED | POI Density of Surrounding Residence |
| CD | POI Density of Surrounding Company |
| TFD | POI Density of Surrounding Transportation Facilities |
| DTB | Distance to Bus Station |
| DTS | Distance to Subway Station |
| RDLS | Relief of the Terrain |
References
- Shangguan, Z. Population Urbanization and Urban Water Security in China: Challenges for Sustainable Development Under SDGS Framework. Land Degrad. Dev. 2025, 36, 4458–4473. [Google Scholar] [CrossRef] [Scilit]
- Costa, P.B.; Neto, G.C.M.; Bertolde, A.I. Urban Mobility Indexes: A Brief Review of the Literature. Transp. Res. Procedia 2017, 25, 3645–3655. [Google Scholar] [CrossRef] [Scilit]
- Mulíček, O.; Osman, R.; Seidenglanz, D. Urban Rhythms: A Chronotopic Approach to Urban Timespace. Time Soc. 2015, 24, 304–325. [Google Scholar] [CrossRef] [Scilit]
- Rapport, D.J. Sustainability Science: An Ecohealth Perspective. Sustain. Sci. 2007, 2, 77–84. [Google Scholar] [CrossRef] [Scilit] [PubMed]
- Jacobs, J. The Death and Life of Great American Cities; Random House: New York, NY, USA, 1961. [Google Scholar]
- Lynch, K. Good City Form; Design: Beijing, China, 1984. [Google Scholar]
- Jiang, D. The Theory of City Form Vitality; East China University of Science and Technology Press: Nanjing, China, 2007. [Google Scholar]
- Montgomery, J. Making a City: Urbanity, Vitality and Urban Design. J. Urban Des. 1998, 3, 93–116. [Google Scholar] [CrossRef] [Scilit]
- Li, X.; Li, Y.; Jia, T.; Zhou, L.; Hijazi, I.H. The Six Dimensions of Built Environment on Urban Vitality: Fusion Evidence from Multi-Source Data. Cities 2022, 121, 103482. [Google Scholar] [CrossRef] [Scilit]
- Fan, Z.; Duan, J.; Luo, M.; Zhan, H.; Liu, M.; Peng, W. How Did Built Environment Affect Urban Vitality in Urban Waterfronts? A Case Study in Nanjing Reach of Yangtze River. ISPRS Int. J. Geo-Inf. 2021, 10, 611. [Google Scholar] [CrossRef] [Scilit]
- Liu, D.; Shi, Y. The Influence Mechanism of Urban Spatial Structure on Urban Vitality Based on Geographic Big Data: A Case Study in Downtown Shanghai. Buildings 2022, 12, 569. [Google Scholar] [CrossRef] [Scilit]
- Zhang, F.; Zhou, B.; Liu, L.; Liu, Y.; Fung, H.H.; Lin, H.; Ratti, C. Measuring Human Perceptions of a Large-Scale Urban Region Using Machine Learning. Landsc. Urban Plan. 2018, 180, 148–160. [Google Scholar] [CrossRef] [Scilit]
- Sung, H.-G.; Go, D.-H.; Choi, C.G. Evidence of Jacobs’s Street Life in the Great Seoul City: Identifying the Association of Physical Environment with Walking Activity on Streets. Cities 2013, 35, 164–173. [Google Scholar] [CrossRef] [Scilit]
- Wu, C.; Ye, Y.; Gao, F.; Ye, X. Using Street View Images to Examine the Association between Human Perceptions of Locale and Urban Vitality in Shenzhen, China. Sustain. Cities Soc. 2023, 88, 104291. [Google Scholar] [CrossRef] [Scilit]
- Sung, H.; Lee, S. Residential Built Environment and Walking Activity: Empirical Evidence of Jane Jacobs’ Urban Vitality. Transp. Res. Part D Transp. Environ. 2015, 41, 318–329. [Google Scholar] [CrossRef] [Scilit]
- Paköz, M.Z.; Işık, M. Rethinking Urban Density, Vitality and Healthy Environment in the Post-Pandemic City: The Case of Istanbul. Cities 2022, 124, 103598. [Google Scholar] [CrossRef] [Scilit]
- Mouratidis, K.; Poortinga, W. Built Environment, Urban Vitality and Social Cohesion: Do Vibrant Neighborhoods Foster Strong Communities? Landsc. Urban Plan. 2020, 204, 103951. [Google Scholar] [CrossRef] [Scilit]
- Mehta, V. Lively Streets: Determining Environmental Characteristics to Support Social Behavior. J. Plan. Educ. Res. 2007, 27, 165–187. [Google Scholar] [CrossRef] [Scilit]
- Liu, Y.; Liu, X.; Gao, S.; Gong, L.; Kang, C.; Zhi, Y.; Chi, G.; Shi, L. Social Sensing: A New Approach to Understanding Our Socioeconomic Environments. Ann. Am. Assoc. Geogr. 2015, 105, 512–530. [Google Scholar] [CrossRef] [Scilit]
- Wang, M.; Zhao, J.; Zhang, D.; Xiong, Z.; Sun, C.; Zhang, M.; Fan, C. Assessing Urban Vitality in High-Density Cities: A Spatial Accessibility Approach Using POI Reviews and Residential Data. Hum. Soc. Sci. Commun. 2025, 12, 1119. [Google Scholar] [CrossRef] [Scilit]
- Pan, H.; Yang, C.; Quan, L.; Liao, L. A New Insight into Understanding Urban Vitality: A Case Study in the Chengdu-Chongqing Area Twin-City Economic Circle, China. Sustainability 2021, 13, 10068. [Google Scholar] [CrossRef] [Scilit]
- He, S.; Zhang, Z.; Yu, S.; Xia, C.; Tung, C.-L. Investigating the Effects of Urban Morphology on Vitality of Community Life Circles Using Machine Learning and Geospatial Approaches. Appl. Geogr. 2024, 167, 103287. [Google Scholar] [CrossRef] [Scilit]
- Chen, L.; Zhao, L.; Xiao, Y.; Lu, Y. Investigating the Spatiotemporal Pattern between the Built Environment and Urban Vibrancy Using Big Data in Shenzhen, China. Comput. Environ. Urban 2022, 95, 101827. [Google Scholar] [CrossRef] [Scilit]
- Pan, C.; Zhou, J.; Huang, X. Impact of Check-In Data on Urban Vitality in the Macao Peninsula. Sci. Program-Neth. 2021, 2021, 7179965. [Google Scholar] [CrossRef] [Scilit]
- Yin, J.; Chen, R.; Zhang, R.; Li, X.; Fang, Y. The Scale Effect of Street View Images and Urban Vitality Is Consistent with a Gaussian Function Distribution. Land 2025, 14, 415. [Google Scholar] [CrossRef] [Scilit]
- Ma, Z. Deep Exploration of Street View Features for Identifying Urban Vitality: A Case Study of Qingdao City. Int. J. Appl. Earth Obs. 2023, 123, 103476. [Google Scholar] [CrossRef] [Scilit]
- Long, Y.; Jiao, S.; Yu, Y.; Xiao, K. An Analysis of Spatial Vitality Distribution and Formation Mechanisms in Historical Urban Areas Based on Multi-Source Big Data: A Case Study of Changsha. Front. Archit Res. 2025, 14, 1727–1749. [Google Scholar] [CrossRef] [Scilit]
- Jin, X.; Long, Y.; Sun, W.; Lu, Y.; Yang, X.; Tang, J. Evaluating Cities’ Vitality and Identifying Ghost Cities in China with Emerging Geographical Data. Cities 2017, 63, 98–109. [Google Scholar] [CrossRef] [Scilit]
- Liu, S.; Zhang, L.; Long, Y. Urban Vitality Area Identification and Pattern Analysis from the Perspective of Time and Space Fusion. Sustainability 2019, 11, 4032. [Google Scholar] [CrossRef] [Scilit]
- Jiang, Y.; Sun, Z.; Wei, D.; Zhao, P.; Yang, L.; Lu, Y. Revealing the Spatiotemporal Pattern of Urban Vibrancy at the Urban Agglomeration Scale: Evidence from the Pearl River Delta, China. Appl. Geogr. 2025, 181, 103694. [Google Scholar] [CrossRef] [Scilit]
- Li, X.; Qian, Y.; Zeng, J.; Wei, X.; Guang, X. The Influence of Strip-City Street Network Structure on Spatial Vitality: Case Studies in Lanzhou, China. Land 2021, 10, 1107. [Google Scholar] [CrossRef] [Scilit]
- Shen, Q.; Li, X.; Tan, X.; Ma, Z.; Wei, Y. Spatial and Temporal Pattern Characteristics and Influence Mechanisms of Urban Vitality: A Qualitative Empirical Study of Changchun City, China. J. Urban Plan Dev. 2025, 151, 05025019. [Google Scholar] [CrossRef] [Scilit]
- Ding, X.; Zheng, F.; Lyu, G.; Feng, B. An Exploration of the Spatial and Temporal Factors Influencing Industrial Park Vitality Using Multi-Source Geospatial Data. Sci. Rep. 2025, 15, 29584. [Google Scholar] [CrossRef] [Scilit]
- Wang, Z.; Xu, W.; Liu, Y.; Liu, B.; Zhu, L. Urban Vitality Transfer: Analysis of 50 Factors Based on 24-h Weekday Activity in Nanjing. Front. Archit Res. 2025, 14, 1249–1273. [Google Scholar] [CrossRef] [Scilit]
- Liu, S.; Zhang, L.; Long, Y.; Long, Y.; Xu, M. A New Urban Vitality Analysis and Evaluation Framework Based on Human Activity Modeling Using Multi-Source Big Data. ISPRS Int. J. Geo-Inf. 2020, 9, 617. [Google Scholar] [CrossRef] [Scilit]
- Lee, L.; Yu, J. Some Recent Developments in Spatial Panel Data Models. Reg. Sci. Urban Eco. 2010, 40, 255–271. [Google Scholar] [CrossRef] [Scilit]
- Fingleton, B.; Le Gallo, J. Estimating Spatial Models with Endogenous Variables, a Spatial Lag and Spatially Dependent Disturbances: Finite Sample Properties. Pap. Reg. Sci. 2008, 87, 319–340. [Google Scholar] [CrossRef] [Scilit]
- Wang, J.; Biljecki, F. Unsupervised Machine Learning in Urban Studies: A Systematic Review of Applications. Cities 2022, 129, 103925. [Google Scholar] [CrossRef] [Scilit]
- Zhang, Y.; Li, C.; Li, J.; Gao, Z.; Su, T.; Wang, C.; Zhang, H.; Ma, T.; Liu, Y.; Xiong, W.; et al. Understanding Street-Level Urban Vibrancy via Spatial-Temporal Wi-Fi Data Analytics: Case LivingLine Shanghai. Environ. Plan B-Urban. 2024, 51, 803–822. [Google Scholar] [CrossRef] [Scilit]
- Lian, H.; Li, X.; Zhou, W.; Zhang, J.; Li, H. Pedestrian Vitality Characteristics in Pedestrianized Commercial Streets-Considering Temporal, Spatial, and Built Environment Factors. Front. Archit Res. 2025, 14, 630–653. [Google Scholar] [CrossRef] [Scilit]
- Liang, P.; Cui, X.; Ma, J.; Song, W.; Xu, Y. Exploring the Determinants of Spatial Vitality in High-Speed Rail Station Areas in China: A Multi-Source Data Analysis Using LightGBM. Land 2025, 14, 1262. [Google Scholar] [CrossRef] [Scilit]
- Peng, J.; Hu, Y.; Liang, C.; Wan, Q.; Dai, Q.; Yang, H. Understanding Nonlinear and Synergistic Effects of the Built Environment on Urban Vibrancy in Metro Station Areas. J. Eng. Appl. Sci. 2023, 70, 18. [Google Scholar] [CrossRef] [Scilit]
- Chen, C.; Wang, J.; Li, D.; Sun, X.; Zhang, J.; Yang, C.; Zhang, B. Unraveling Nonlinear Effects of Environment Features on Green View Index Using Multiple Data Sources and Explainable Machine Learning. Sci. Rep. 2024, 14, 30189. [Google Scholar] [CrossRef] [Scilit]
- Aas, K.; Jullum, M.; Løland, A. Explaining Individual Predictions When Features Are Dependent: More Accurate Approximations to Shapley Values. Artif. Intell. 2021, 298, 103502. [Google Scholar] [CrossRef] [Scilit]
- Sheng, J.; He, Y.; Lu, T.; Wang, F.; Huang, Y.; Leng, B.; Zhang, X.; Chen, Y. Unveiling Urban Vitality and Its Interactions in Mountainous Cities: A Human Behaviour Perspective on Community-Level Dynamics. Cities 2025, 159, 105780. [Google Scholar] [CrossRef] [Scilit]
- Wu, Y.; Xie, C.; Zhang, A.; Zhao, T.; Cao, J. Spatiotemporal Analysis of Urban Vitality and Its Drivers from a Human Mobility Perspective. ISPRS Int. J. Geo-Inf. 2025, 14, 167. [Google Scholar] [CrossRef] [Scilit]
- Lazaridis, P.; Thomoglou, A. Rapid Shear Capacity Prediction of TRM-Strengthened Unreinforced Masonry Walls through Interpretable Machine Learning Deployed in a Web App. J. Build. Eng. 2024, 98, 110912. [Google Scholar] [CrossRef] [Scilit]
- Matin, S.S.; Pradhan, B. Earthquake-Induced Building-Damage Mapping Using Explainable AI (XAI). Sensors 2021, 21, 4489. [Google Scholar] [CrossRef] [Scilit] [PubMed]
- Sahr, K. Hexagonal Discrete Global Grid Systems for Geospatial Computing. Arch. Fotogram. Kartogr. I Teledetekcji 2011, 22, 363–376. [Google Scholar]
- Ewing, R.; Cervero, R. Travel and the Built Environment: A Meta-Analysis. J. Am. Plan Assoc. 2010, 76, 265–294. [Google Scholar] [CrossRef] [Scilit]
- Ye, Y.; Li, D.; Liu, X. How Block Density and Typology Affect Urban Vitality: An Exploratory Analysis in Shenzhen, China. Urban Geogr. 2018, 39, 631–652. [Google Scholar] [CrossRef] [Scilit]
- Kalita, M.; Khataniar, R. Predicting Market Capitalization of Large Multinational Enterprises Using OLS, Feedforward and Bayesian Neural Network Models. J. Glob. Econ. Bus. Financ. 2025, 7, 64–78. [Google Scholar] [CrossRef] [Scilit]
- Brunsdon, C.; Fotheringham, A.S.; Charlton, M.E. Geographically Weighted Regression: A Method for Exploring Spatial Nonstationarity. Geogr. Anal. 1996, 28, 281–298. [Google Scholar] [CrossRef] [Scilit]
- Lundberg, S.M.; Lee, S.-I. A Unified Approach to Interpreting Model Predictions. In Proceedings of the 31st International Conference on Neural Information Processing Systems (NIPS’17), Long Beach, CA, USA, 4–9 December 2017; pp. 4768–4777. [Google Scholar]
- Liu, J.; Li, Y.; Xu, Y.; Zhuang, C.C.; Hu, Y.; Yu, Y. Impacts of Built Environment on Urban Vitality in Cultural Districts: A Case Study of Haikou and Suzhou. Land 2024, 13, 840. [Google Scholar] [CrossRef] [Scilit]
- Bergstra, J.; Bengio, Y. Random Search for Hyper-Parameter Optimization. J. Mach. Learn. Res. 2012, 13, 281–305. [Google Scholar] [CrossRef]
- Liu, W.; Yang, Z.; Gui, C.; Li, G.; Xu, H. Investigating the Nonlinear Relationship Between the Built Environment and Urban Vitality Based on Multi-Source Data and Interpretable Machine Learning. Buildings 2025, 15, 1414. [Google Scholar] [CrossRef] [Scilit]

Disclaimer/Publisher’s Note: The statements, opinions and data contained in all publications are solely those of the individual author(s) and contributor(s) and not of MDPI and/or the editor(s). MDPI and/or the editor(s) disclaim responsibility for any injury to people or property resulting from any ideas, methods, instructions or products referred to in the content. |
© 2026 by the authors. Licensee MDPI, Basel, Switzerland. This article is an open access article distributed under the terms and conditions of the Creative Commons Attribution (CC BY) license.