


Abstract
A dew-point evaporative air cooler incorporating a novel segmented heat exchange design, demarcated according to the humidity state of moist air, is proposed. The system employs a porous fibrous material to create a wetted evaporative surface, which is continuously maintained in a moistened condition through a self-wicking water supply mechanism to enhance latent heat transfer. Circular fins are installed on the heat exchanger’s partition surface once the moist air reaches saturation, thereby improving sensible heat exchange between the dry and wet channels. The performance of a prototype was evaluated under controlled conditions in a standard enthalpy chamber. Experimental results indicate that, under typical summer conditions (inlet dry-bulb and wet-bulb temperatures of 33.8 °C and 25.4 °C, respectively), with an air mass flow ratio of 0.7 and an air velocity of 1.5 m/s, the wet-bulb effectiveness reaches 114.4% and the dew-point effectiveness achieves 84.8%. The maximum temperature reduction occurs in the sensible heat exchange section, reaching up to 6.1 °C, demonstrating its substantial sensible heat recovery capability. The device exhibits an energy efficiency ratio (EER) ranging from 9.1 to 31.8. The proposed compact configuration not only enhances energy efficiency but also reduces material costs by approximately 15.4%, providing a valuable reference for the future development of dew-point evaporative cooling systems in residential buildings.
1. Introduction
Heating, ventilation, and air-conditioning (HVAC) systems represent a significant portion of total building energy consumption, accounting for approximately 32% of building electricity use [1]. Traditional vapor compression refrigeration systems face challenges of high energy consumption and significant environmental impact due to their heavy reliance on compressors and non-environmentally friendly refrigerants [2]. The development of high-efficiency, low-consumption air-conditioning systems has become a current research focus.
Evaporative cooling technology utilizes the heat absorbed during water evaporation to achieve cooling, representing a promising low-energy-consumption refrigeration solution [3]. The dew-point evaporative cooler (DPEC) represents a key advancement over traditional indirect evaporative coolers: it diverts a portion of the already-cooled air from the dry channel back into the wet channel to serve as secondary air. This pre-cooled air enhances the overall cooling capacity, enabling the product air to surpass the wet-bulb temperature limit and approach the dew point. This system can maintain indoor thermal comfort while reducing CO2 emissions [4].
The performance improvement of the DPEC system depends on structural design and the optimization of surface wettability [5]. Liu et al. [6] investigated an efficient DPEC system through numerical and experimental studies, utilizing corrugated plates to expand the heat transfer area and eliminating the supporting structure to reduce pressure drop. The results show that its wet-bulb effectiveness is 10% higher than that of the flat-plate DPEC. Chen, Z et al. [7] developed a two-stage DPEC to address the high air mass ratio issue associated with traditional DPEC systems. The system distributes the cooling load over two consecutive stages. Under practical operating conditions, its energy efficiency ratio (EER) ranges from 15 to 17, significantly outperforming conventional air-conditioning systems. Xuliang, L et al. [8] proposed a novel perforated dew-point evaporative cooler, in which the perforated design improves the performance of the system when the total supply air ratio is below 0.5. The single-hole design achieves optimal performance. Sulaiman, Mohammed A et al. [9] constructed a shell-and-tube dew-point evaporative cooler using ultra-low-cost materials. In the experiments, the prototype was able to reduce the ambient temperature by up to 34.1 °C (from 53 °C to 18.9 °C), with a dew-point effectiveness of 99.6% and a wet-bulb effectiveness of 135%. Castillo-González et al. [10] developed an innovative DPEC system using emerging additive manufacturing technology, achieving dew-point effectiveness of up to 90%. Additive manufacturing technology demonstrates potential applicability in the development of DPEC systems. Jiang et al. [11] proposed a double counter-flow dew-point indirect evaporative cooler that employs a high-performance wet-channel material. Experimental results showed that, under typical summer conditions, wet-bulb and dew-point effectiveness reached 104% and 79%, respectively, achieving a reduction in the size of the dew-point core.
The extent of the water film coverage on the heat exchanger surface directly affects the heat and mass transfer between air and water, thereby influencing the heat exchange efficiency. Xu et al. [12] conducted moisture diffusion and evaporation tests to evaluate various potential wet-surface materials and found that Bamboo Charcoal® Coolmax active fabric and Coopass® bird eye mesh fabric were the most suitable for DPEC applications in terms of moisture transfer and mechanical properties. Duan et al. [13] studied the performance of a cellulose/PET fiber wet fabric roof based on an empirical model. The results show that this moisture-conducting fiber arrangement can reduce the indoor temperature by approximately 5.3 °C compared to traditional roofs. Subsequent field measurements conducted in Beijing demonstrated that, compared to sprinkler-cooled metal roofs [14], wet-fiber roofs can reduce the outer surface temperature by 15 °C, exhibiting significant heat dissipation capabilities ranging from 12.7 to 914.5 W/m2. Chen et al. [15] significantly enhanced moisture retention by coating polypropylene (PP) with a TiO2/SiO2 nanolayer. Under experimental conditions, wet-bulb effectiveness increased from 74.4% to 81.4%, and the plate temperature decreased by 1.1 °C compared to the uncoated surface. The development of new wet-surface materials that can enhance diffusion and achieve uniform water distribution is essential. However, due to the challenges and costs associated with surface materials, researchers have gradually shifted their focus to the implementation of moisture distribution and spraying systems [16,17]. Sun et al. [18] conducted experimental studies on various intermittent spraying schemes and recommended that the optimal spraying time for porous ceramic IEC be 10–12 s, with an ideal intermittent time of 1 min. Shahzad et al. [19] proposed a novel DPEC system without hydrophilic surfaces, in which the humidification process of the working air is performed before entering the wet channel. At an outdoor temperature of 45 °C, the coefficient of performance is 45 and the cooling effectiveness is 80%.
Due to their limited volumetric cooling capacity, evaporative air conditioners often require a large footprint to meet cooling demands. Furthermore, the wet channel typically employs a direct spraying mode, which makes it difficult to precisely control the spray water volume. Excessive spray density thickens the liquid film, thereby increasing thermal resistance, whereas insufficient spray density results in inadequate wetting, reducing evaporative cooling effectiveness. To achieve high efficiency, compactness, and pumpless operation in DPEC units, this study proposes a dew-point evaporative cooling structure based on segmented heat exchange at the saturation point of moist air. In the region after the saturation point, hydrophilic materials are removed to reduce thermal resistance, and fins are added to convert low-efficiency heat exchange areas into efficient air-to-air sensible heat exchange sections. Additionally, passive water supply is achieved through the capillary action of a porous fibrous membrane, enabling pumpless operation. The impact of operating parameters on the cooling performance of the device was investigated in an enthalpy chamber, providing a basis for the practical implementation of this technology.
2. Design of Segmented Dew-Point Evaporative Cooler
2.1. Theoretical Analysis of Heat and Moisture Transfer Process
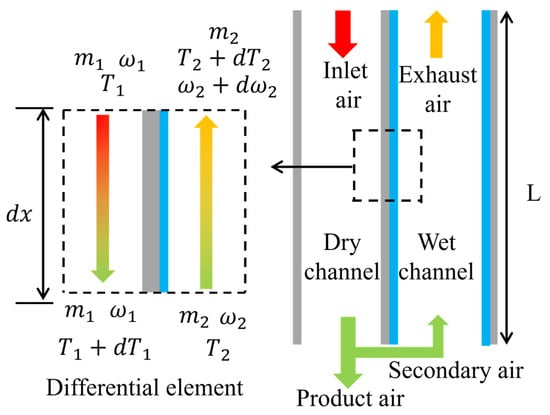
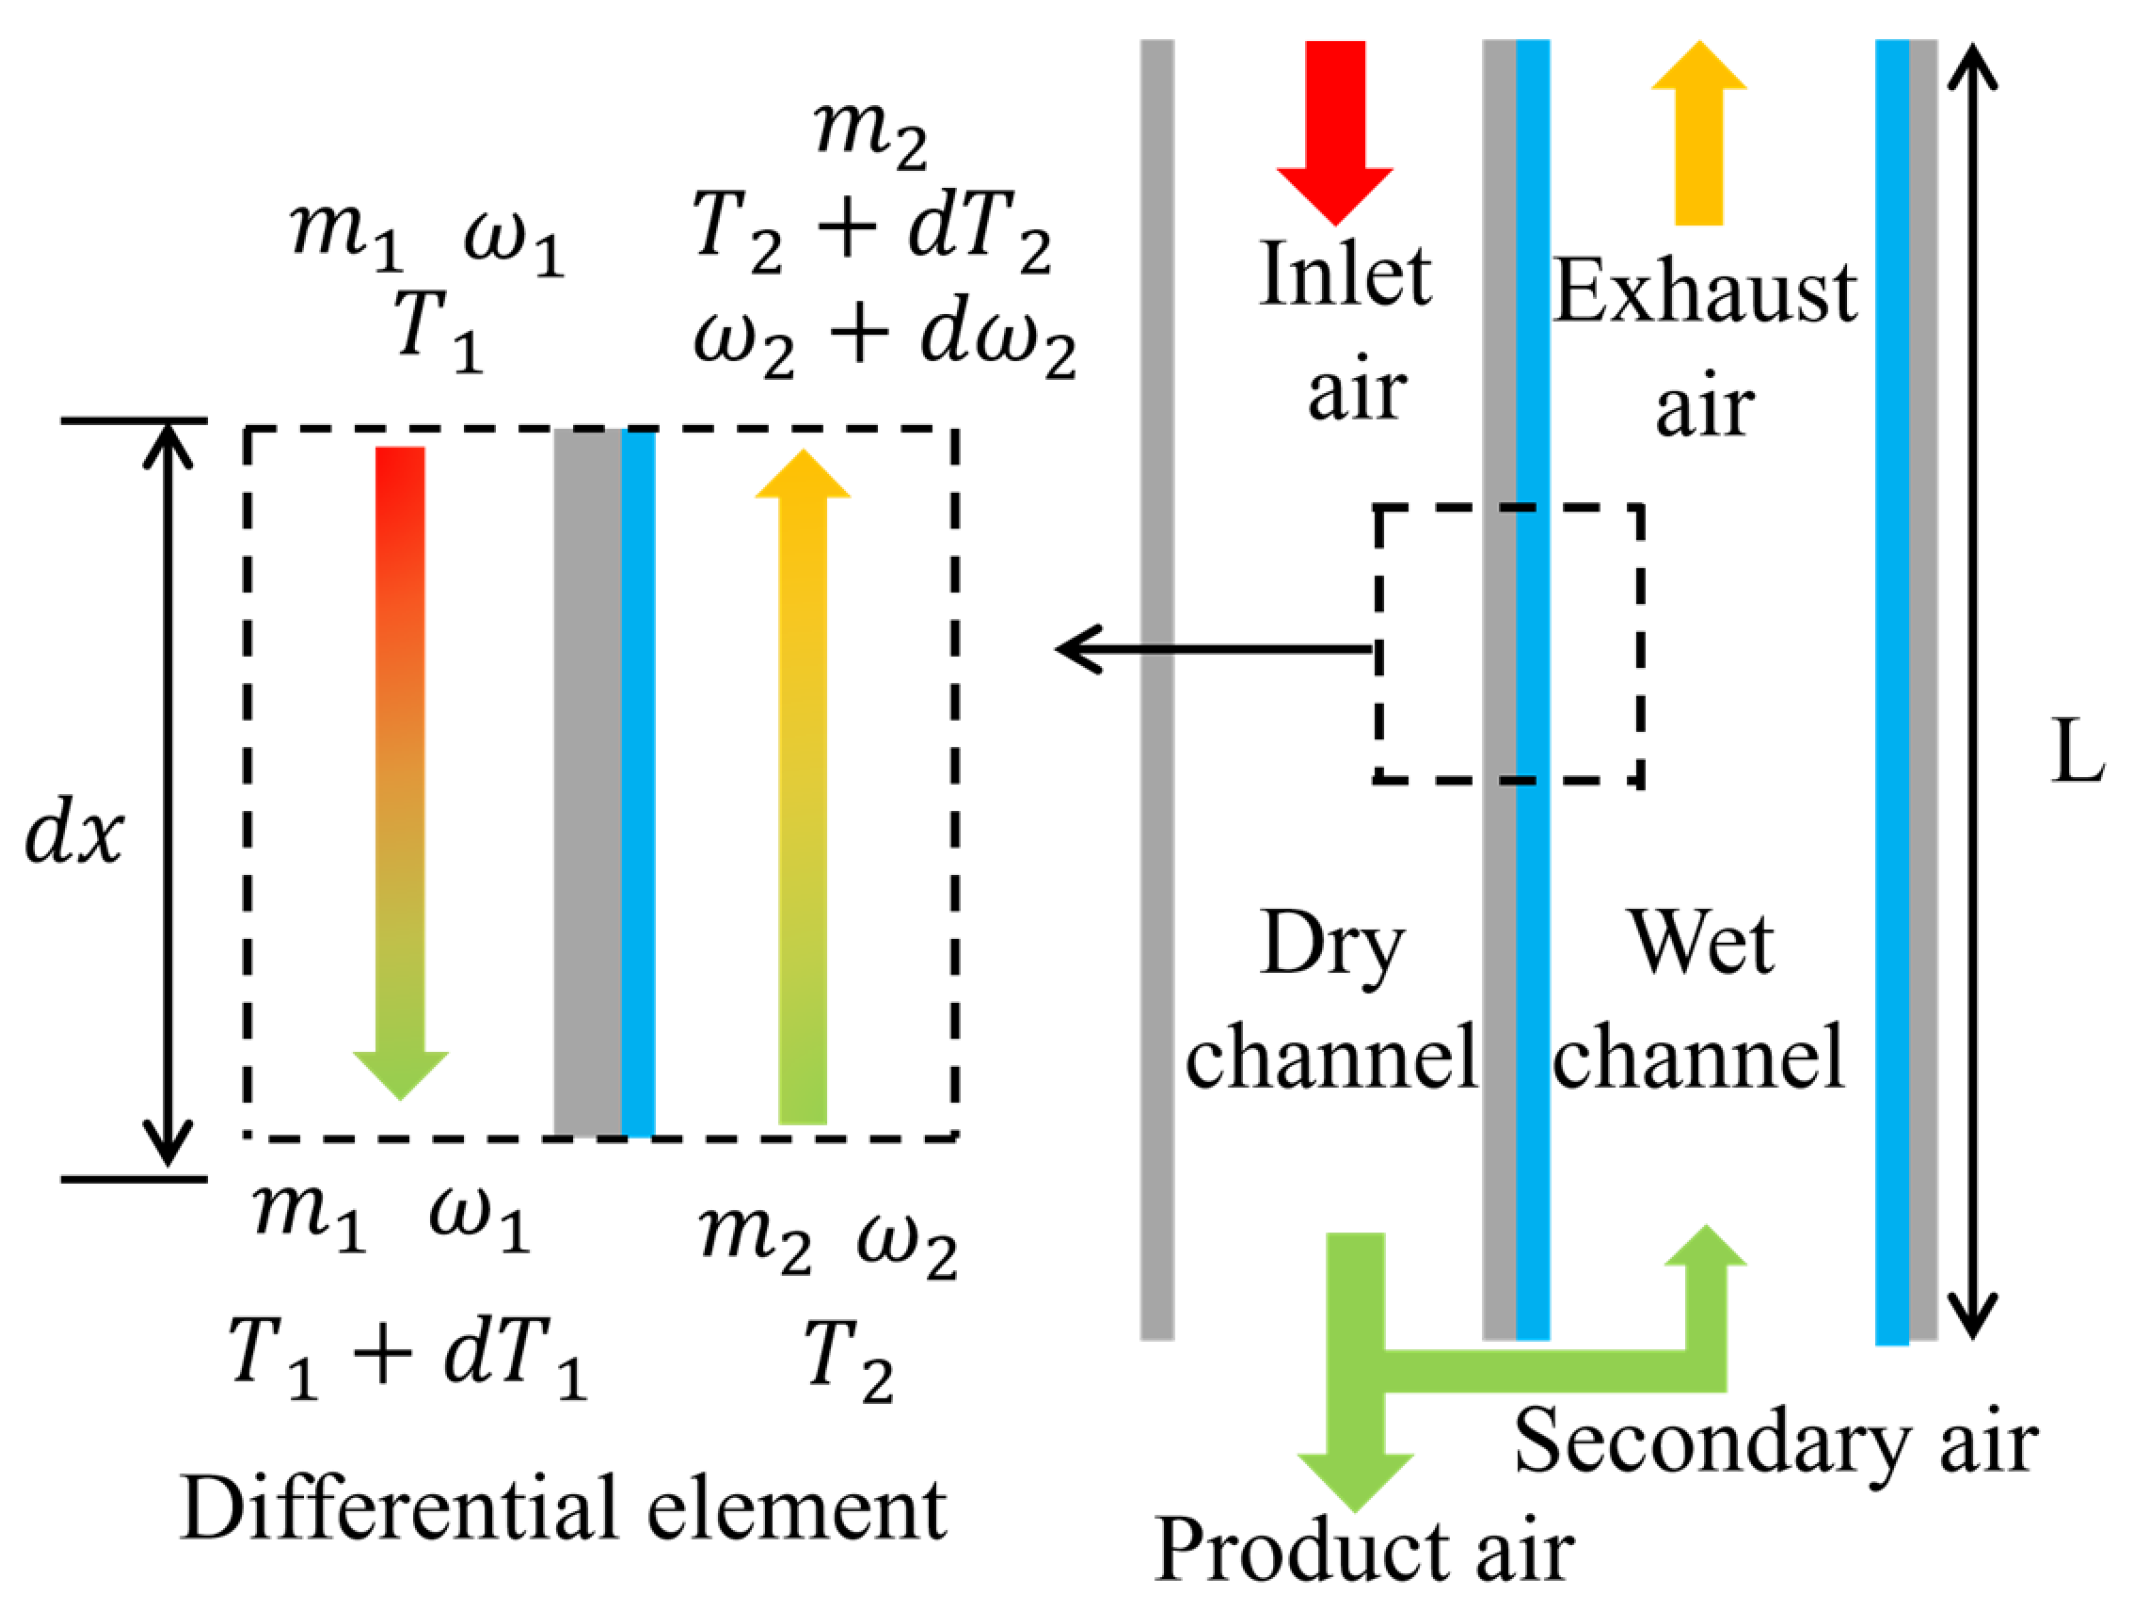
Dew-point evaporative cooling involves the coupling of multiple physical fields, including fluid flow, heat transfer, and mass transfer [20]. To understand the internal heat and mass transfer mechanisms, a control model for a one-dimensional dew-point evaporative cooler was established, as shown in Figure 1. The control model consists of dry and wet channels of unit length, along with a composite heat exchange plate. The wet channel side is covered with a water film, while the dry channel side is waterproof.
Figure 1.
Schematic diagram of the dew-point evaporative cooling principle.
- (1)
- In the dry channel, only sensible heat transfer occurs. According to the first law of thermodynamics, the heat transfer equation is as follows:
- (2)
- In the wet channel, the increase in the humidity of the secondary air should be equal to the mass transfer rate between the secondary air and the water film. The mass conservation equation is as follows:
- (3)
- The energy balance in the wet channel consists of sensible heat exchange and latent heat transfer. Therefore, the energy balance equation in the wet channel is as follows:
- (4)
- The heat released by the infinitesimal element in the dry channel is equal to the heat absorbed by the secondary air and the water film. The energy conservation equation is established as follows:
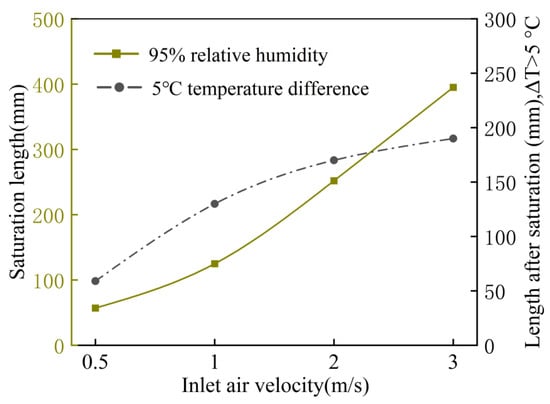
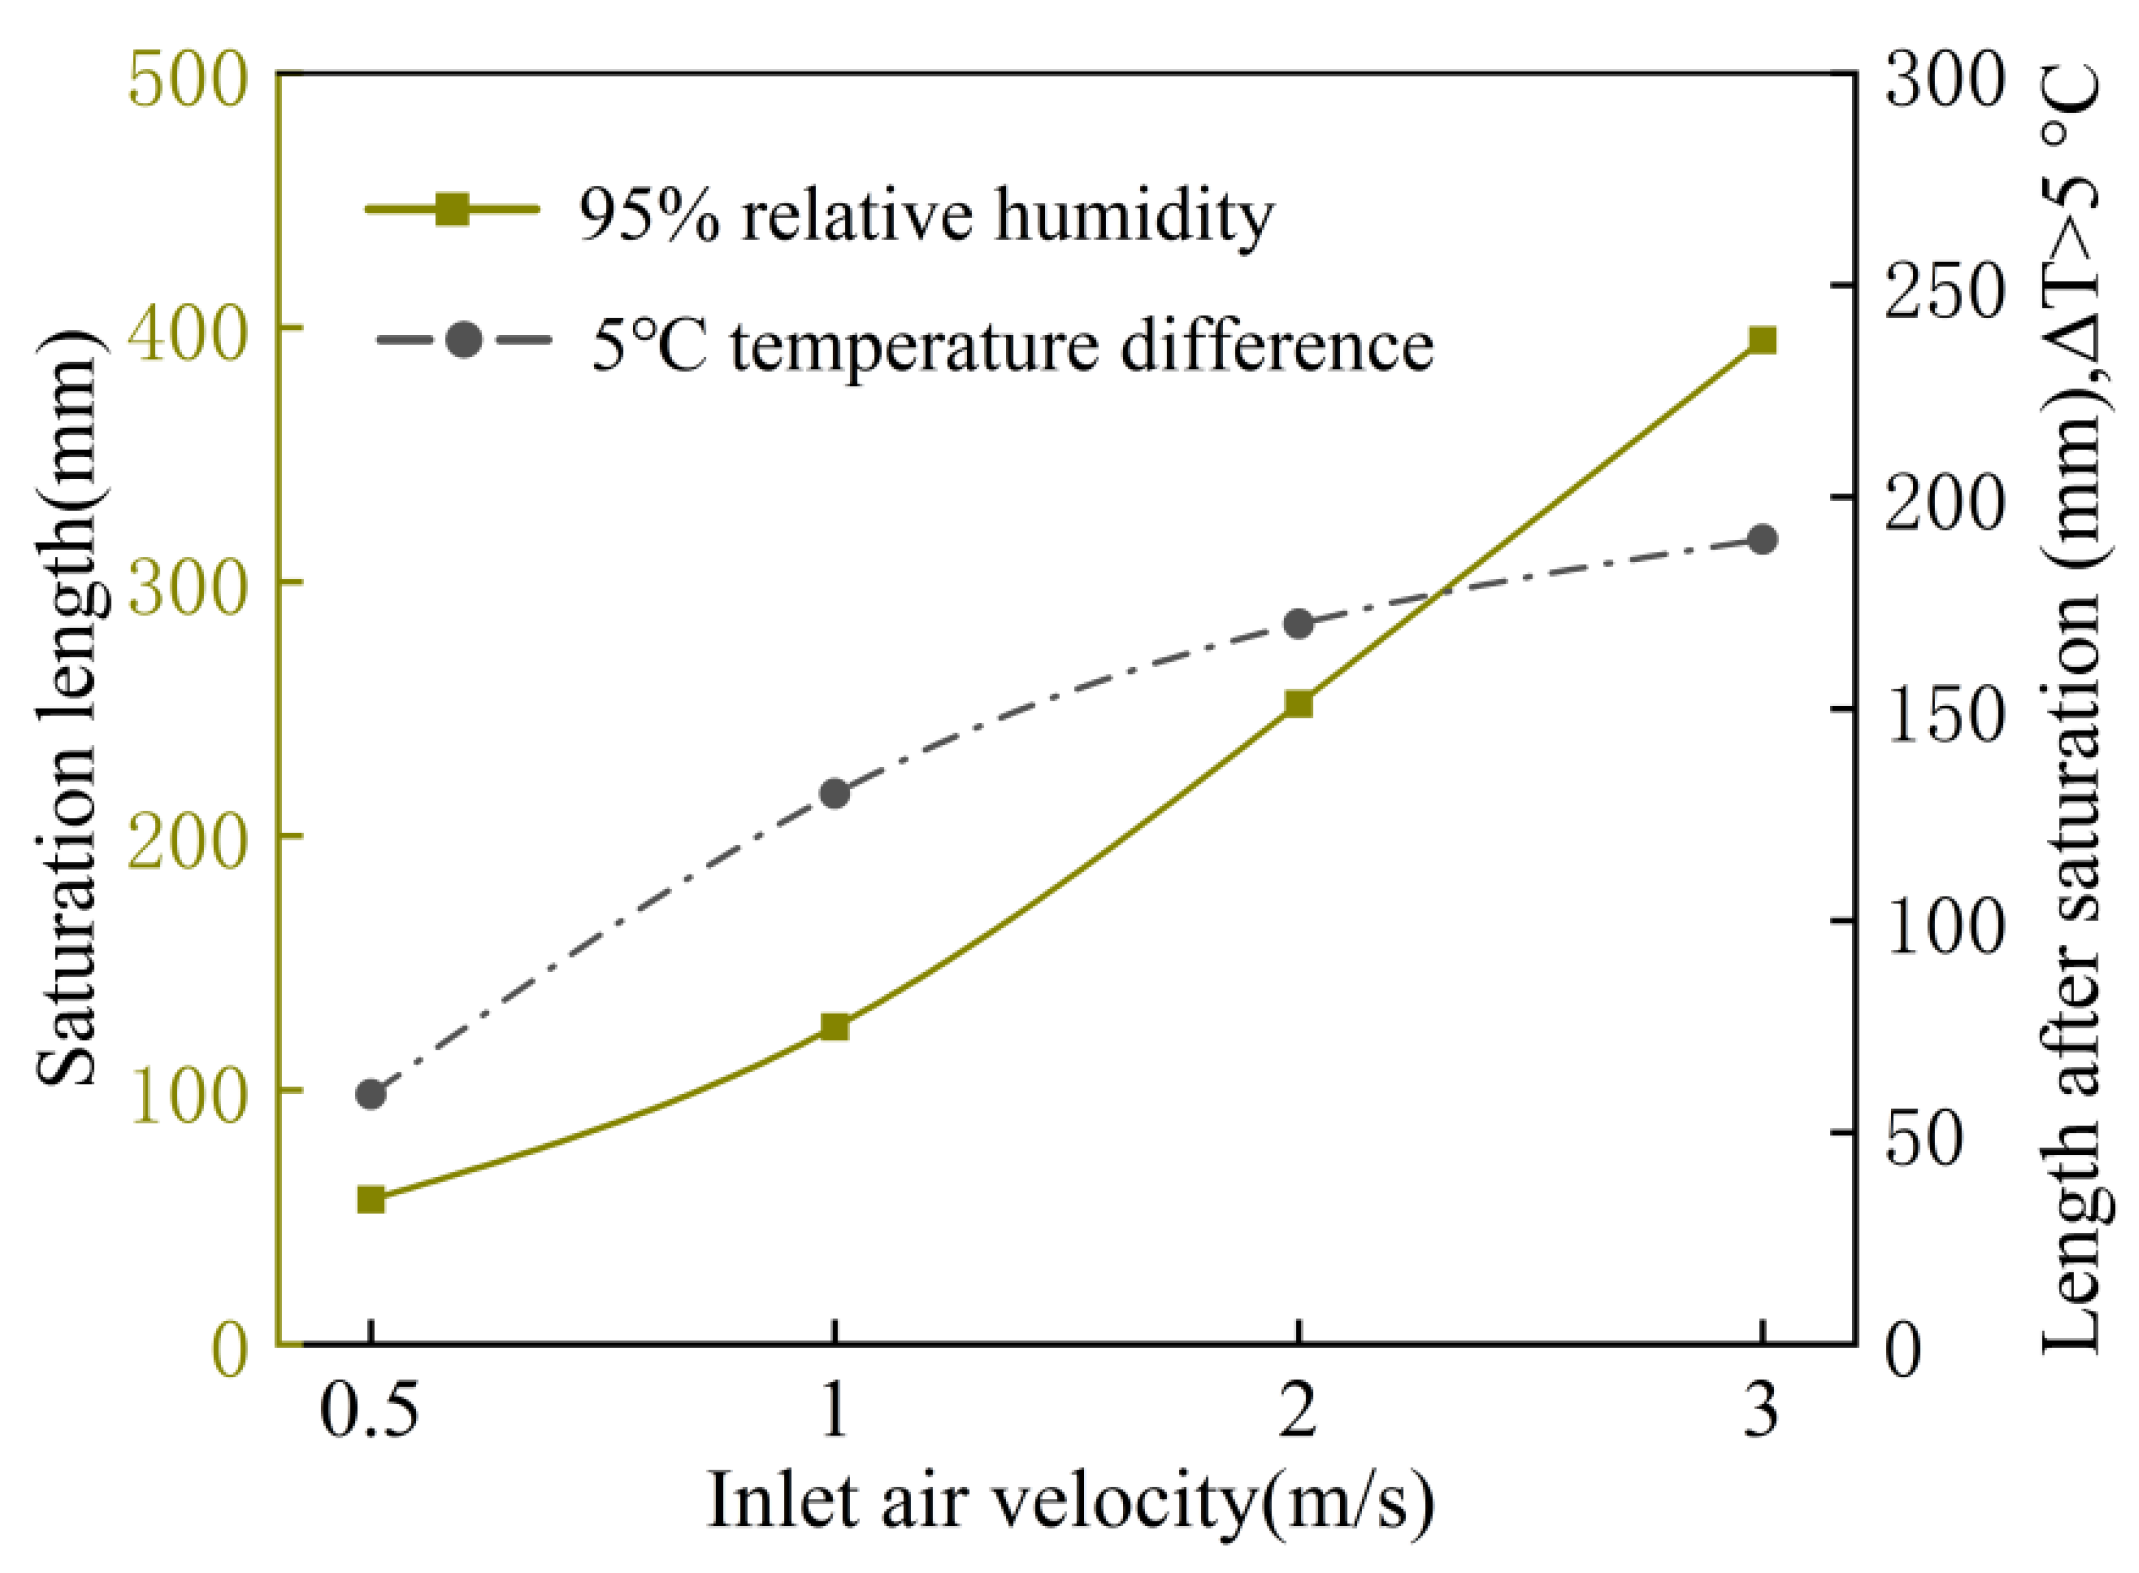
To clarify the optimization direction, the mathematical model of the dew-point evaporative cooler was solved under standard test conditions (dry-bulb temperature of 37.8 °C, relative humidity of 21.5%, and working-to-inlet air mass ratio of 0.44). The moist air saturation length and the length after the saturation point where the dry–wet-channel temperature difference exceeds 5 °C are shown in Figure 2. ΔT > 5 °C is the minimum economic temperature difference for sensible heat recovery. For a 600 mm long heat exchanger, a 400 mm evaporation path is sufficient for moist air to reach 95% relative humidity, and evaporation beyond the saturation point will be restricted. However, after the saturation point, a 60–200 mm segment remains where the dry–wet-channel temperature difference exceeds 5 °C. This phenomenon is consistent with previous experimental study [21]. The greater the temperature difference between the passages, the more effective the sensible heat transfer. Therefore, using the moist air saturation point as a boundary transforms the conventional single-stage heat exchange in wet channels into a two-stage process. Before the saturation point, heat transfer is dominated by latent heat exchange, whereas beyond it, the process transforms to pure sensible heat exchange. This can provide a novel pathway for enhancing the heat transfer performance of DPEC.
Figure 2.
Saturation length and length after saturation, ΔT > 5 °C.
2.2. Structural Design
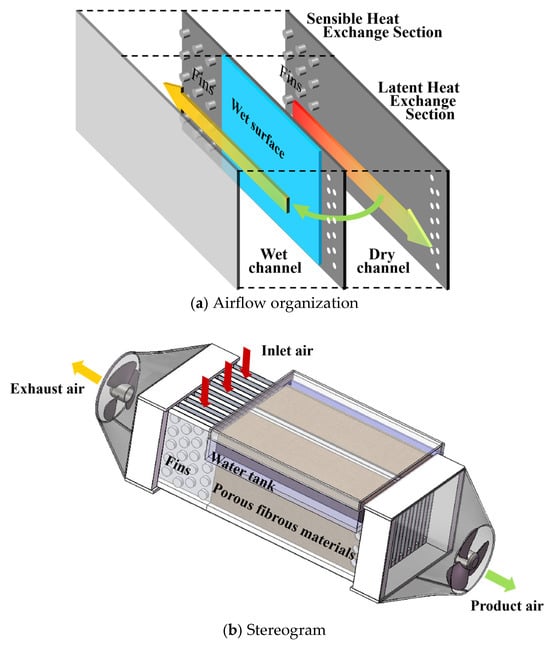
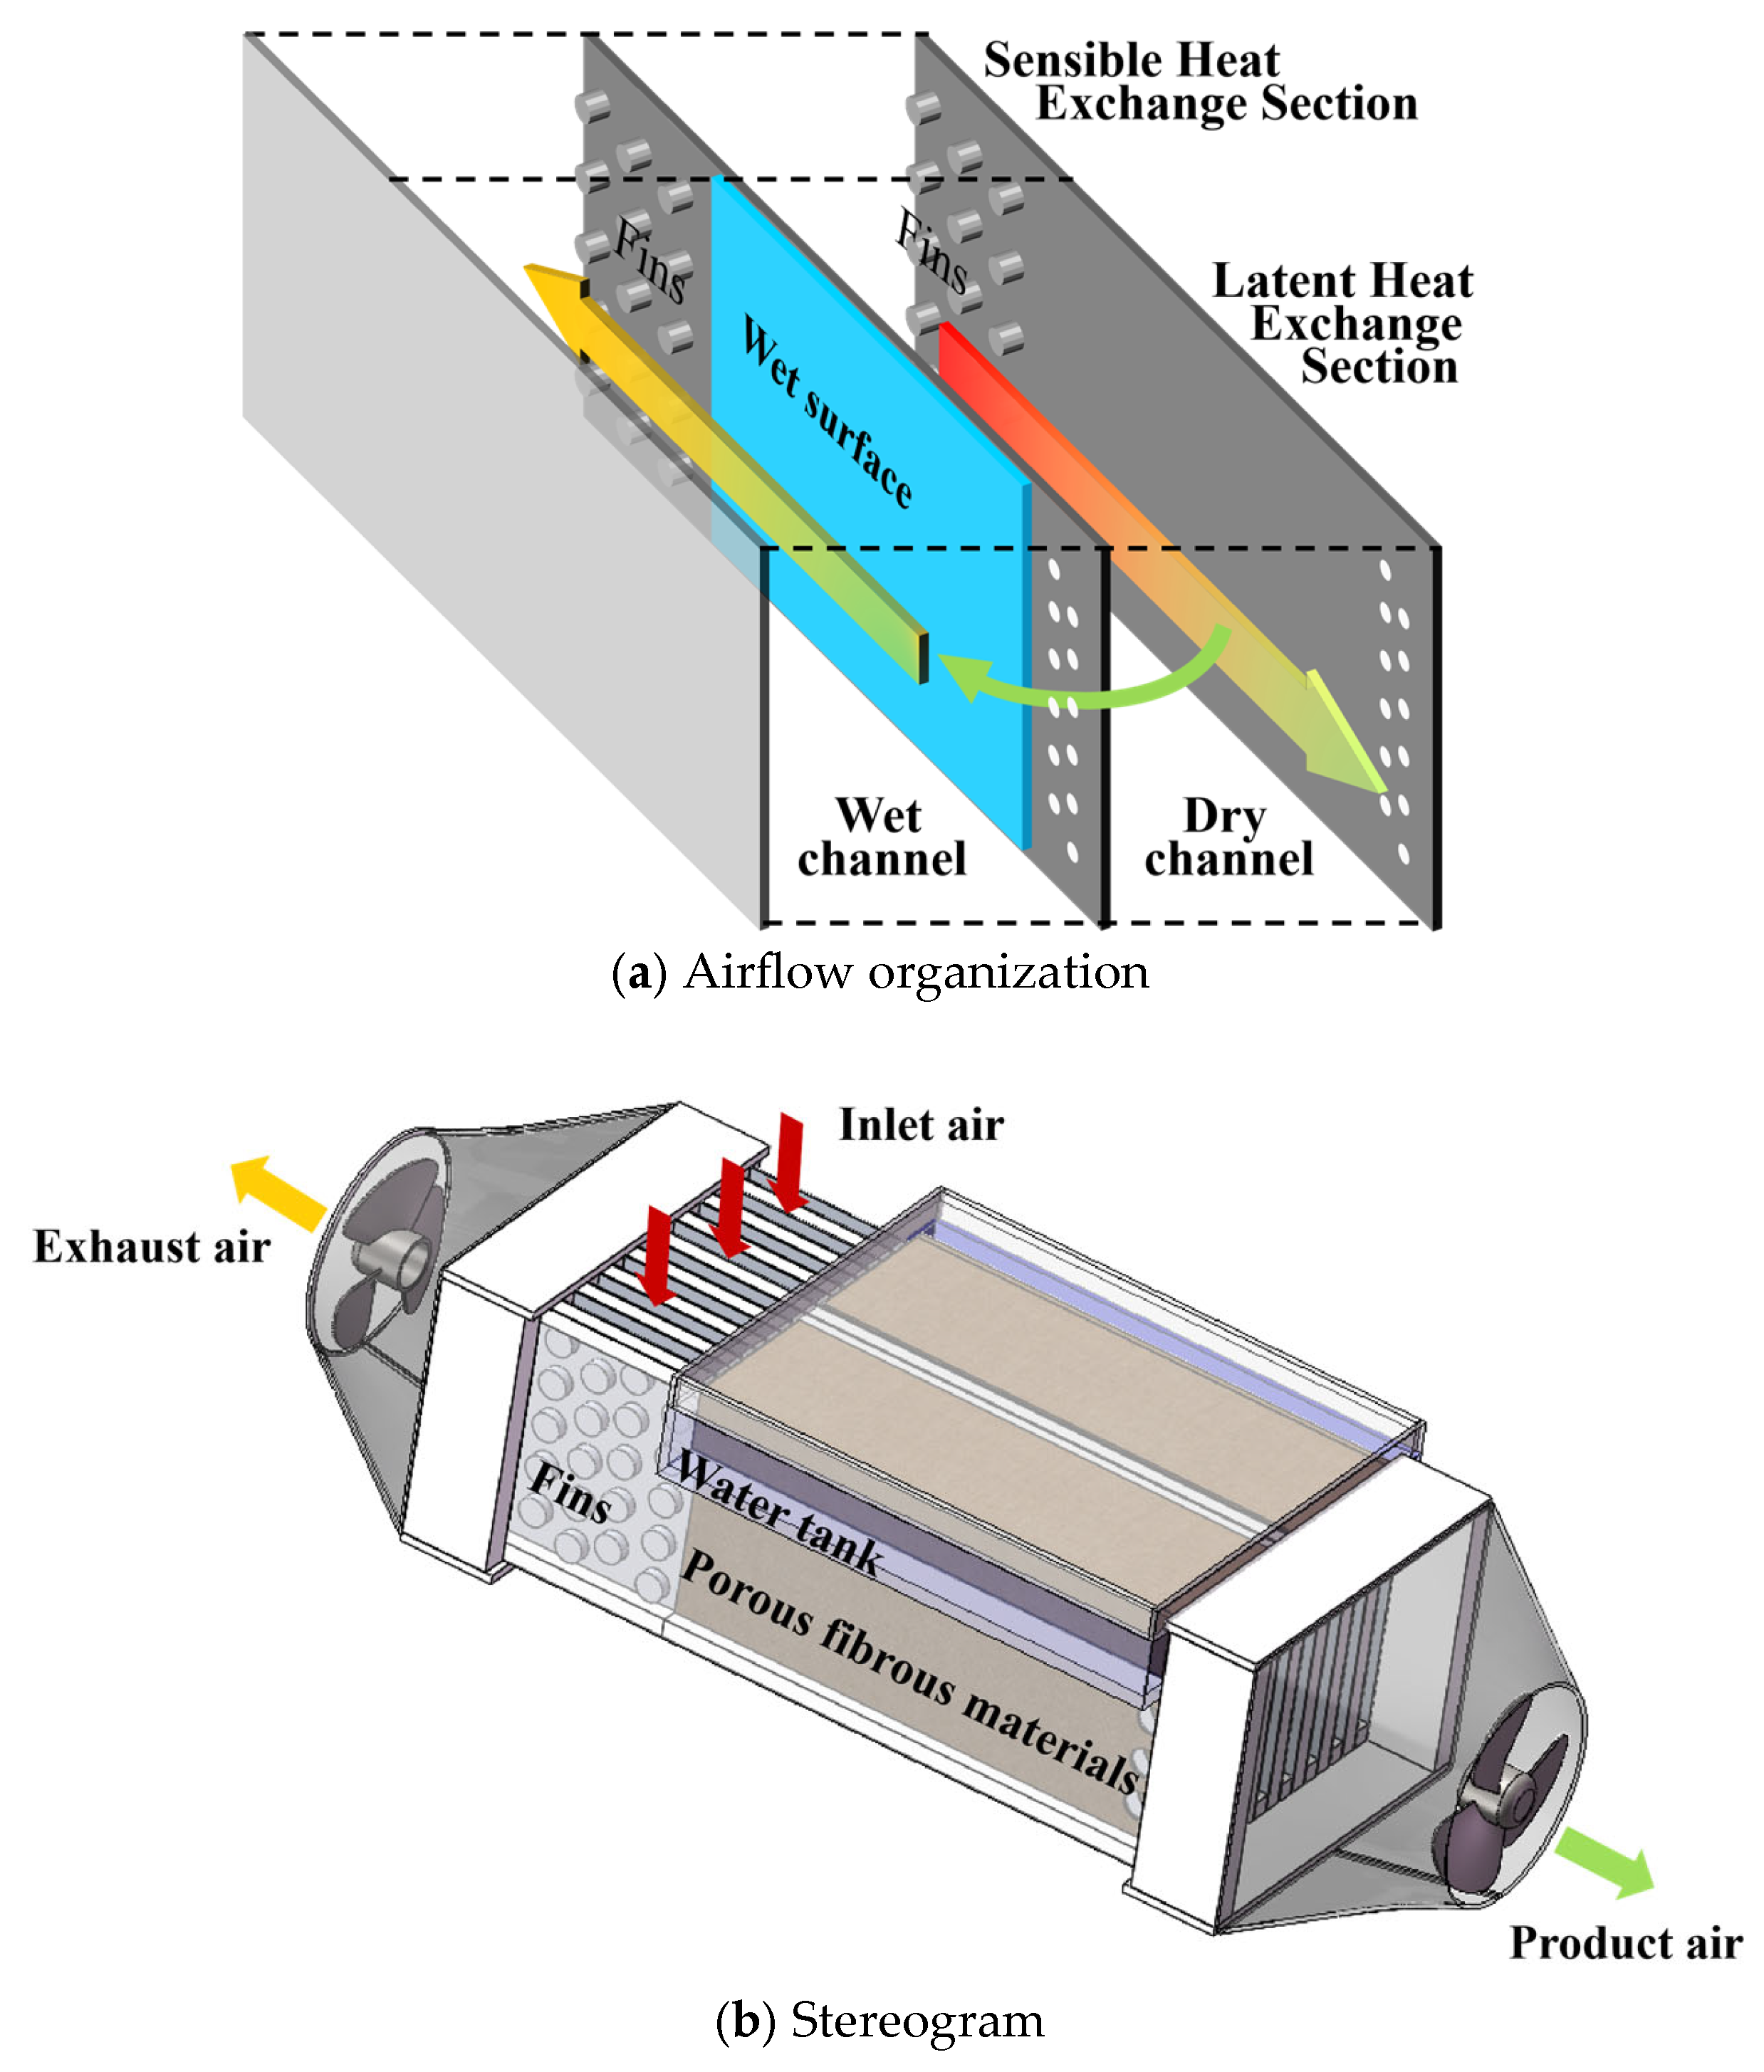
To ensure that the heat exchanger operates consistently within a high-efficiency heat transfer range, a segmented heat exchange dew-point cooler was designed based on the above analysis of channel temperature and humidity characteristics. Its structural schematic is shown in Figure 3. Unlike conventional single wet-channel DPEC designs [21], this approach segments the wet channel at the saturation point of moist air, making the downstream region operate as an air-to-air sensible heat recovery section while adding fins to the partition wall. This method reduces thermal resistance and enhances convective heat transfer. Additionally, in terms of water supply, a pumpless self-wicking system based on porous fiber materials is adopted. Compared to traditional spray systems, this approach holds promise for reducing auxiliary energy consumption, water usage, and maintenance requirements. The specific design involves installing a 400 mm long porous fiber material between the wet-channel inlet and the point of humidity saturation. And a self-wicking water supply system is employed instead of mechanical spraying to enhance latent heat exchange, with this stage primarily focusing on latent heat transfer. After reaching saturation, the hydrophilic material and the low temperature difference zone are removed. Only the high temperature difference zone that lies approximately 100 mm before the wet-channel outlet is left. In this zone, the temperature difference between the primary and secondary air is significant, offering sensible heat recovery potential. Furthermore, fins are arranged on the partition wall to further enhance sensible heat exchange, with this stage primarily involving pure air-to-air sensible heat transfer. The specific parameters of the heat and moisture exchanger are listed in Table 1. The total channel length is 500 mm, representing a 15.4% reduction in plate material compared with the previous equipment, which had a plate length of around 650 mm [21].
Figure 3.
Schematic diagram of the structure. (a) Airflow organization. (b) Stereogram.
Table 1.
Parameters of Heat and Moisture Exchanger.
3. Feasibility Verification of Self-Wicking Water
Automatic capillary wicking water supply utilizes the capillary action of porous materials to spontaneously draw in moisture, thereby wetting surfaces. Compared to spray irrigation, this method consumes less energy, uses fewer water resources, requires minimal maintenance, and avoids forming visible water films. This allows the wet surface to remain fully exposed, creating a broader evaporation area. However, the stability of long-term continuous wetting still requires experimental validation.
3.1. Specifications of the Tested Fibers
Fibers feature high porosity and low cost, making them the most commonly used porous material in indirect evaporative cooling (IEC) applications today [22]. Several studies [12,23,24] have compared the performance of different fiber types in capillary water absorption properties, indicating that Coolmax® and Coolpass® exhibit excellent moisture-wicking and quick-drying performance, believing them suitable for evaporative cooling systems. Industrial wiping cloths and cotton-like microfiber maintain excellent moisture absorption and quick-drying properties while also offering superior elasticity and shape retention. The specifications for testing fibers are shown in Table 2. Table 2 lists the cost, weight, and polyester content for each fiber (each sample has a sample number for reference in other sections of this document). It is generally accepted that higher grammage and higher polyester content correlate with better mechanical durability. Although the material specifications indicate that the four samples differ little in cost, Sample 1 exhibits superior mechanical durability.
Table 2.
Specifications of the fibers.
3.2. Water Absorption Capacity Test
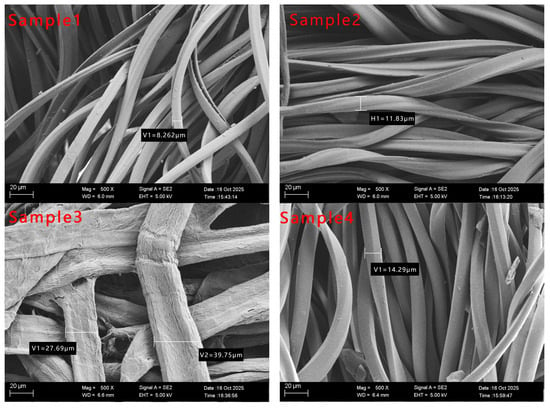
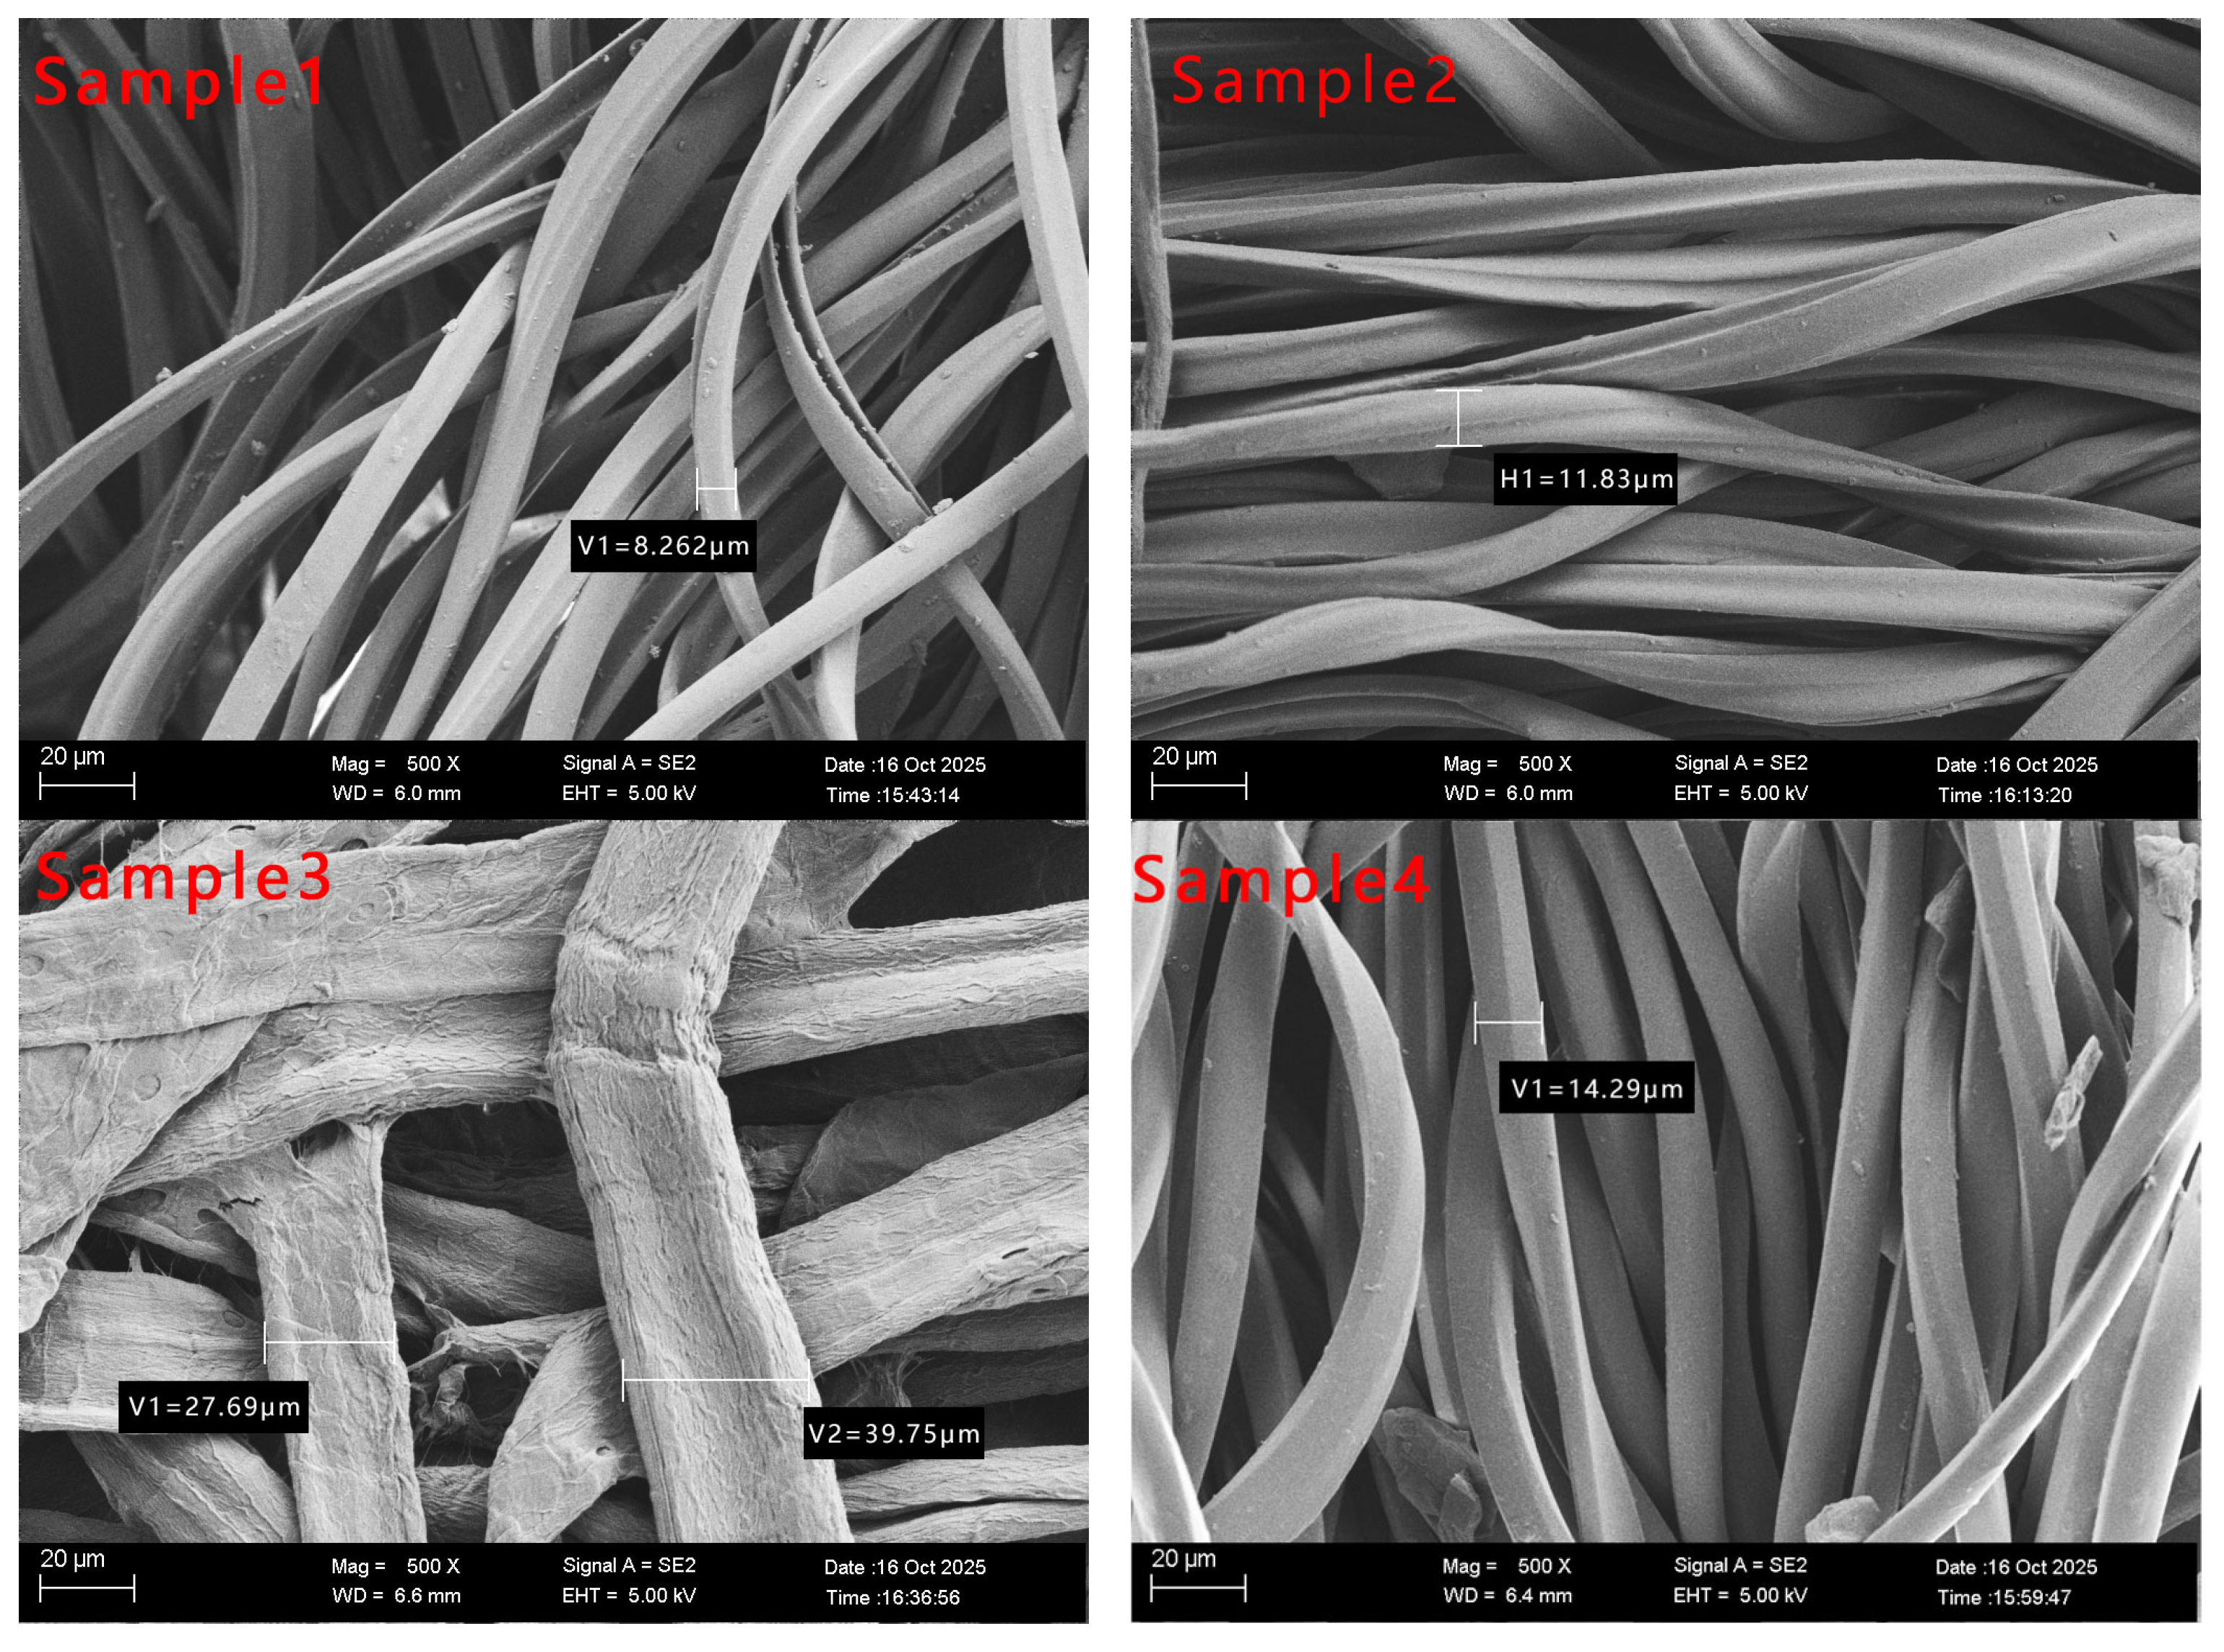
To preliminarily evaluate the water absorption capacity of the fibers, four fiber samples were examined using SEM (Merlin Compact, ZEISS, Oberkochen, Germany) at a magnification of 500×. Their microstructures are shown in Figure 4. The results indicate that the studied samples contain a large number of high-aspect-ratio filamentary structures internally, with diameters primarily ranging from 8.2 to 40 μm. More importantly, the fine filaments interweave to form numerous interconnected microporous structures. These microporous structures provide capillary forces that promote the flow of liquids.
Figure 4.
Microstructure images magnified 500 times by SEM.
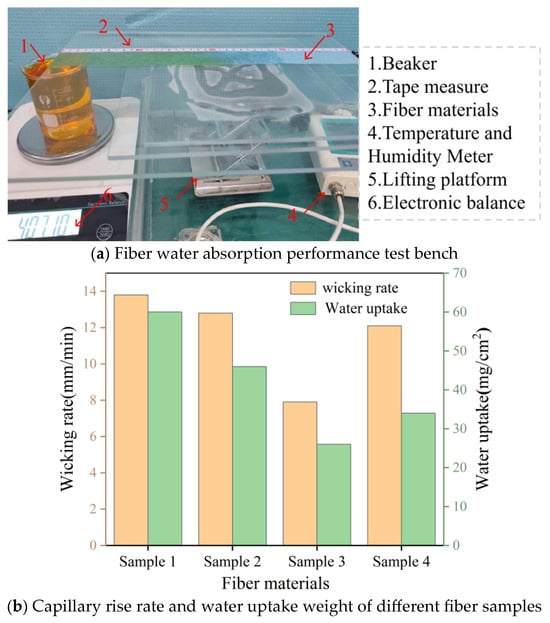
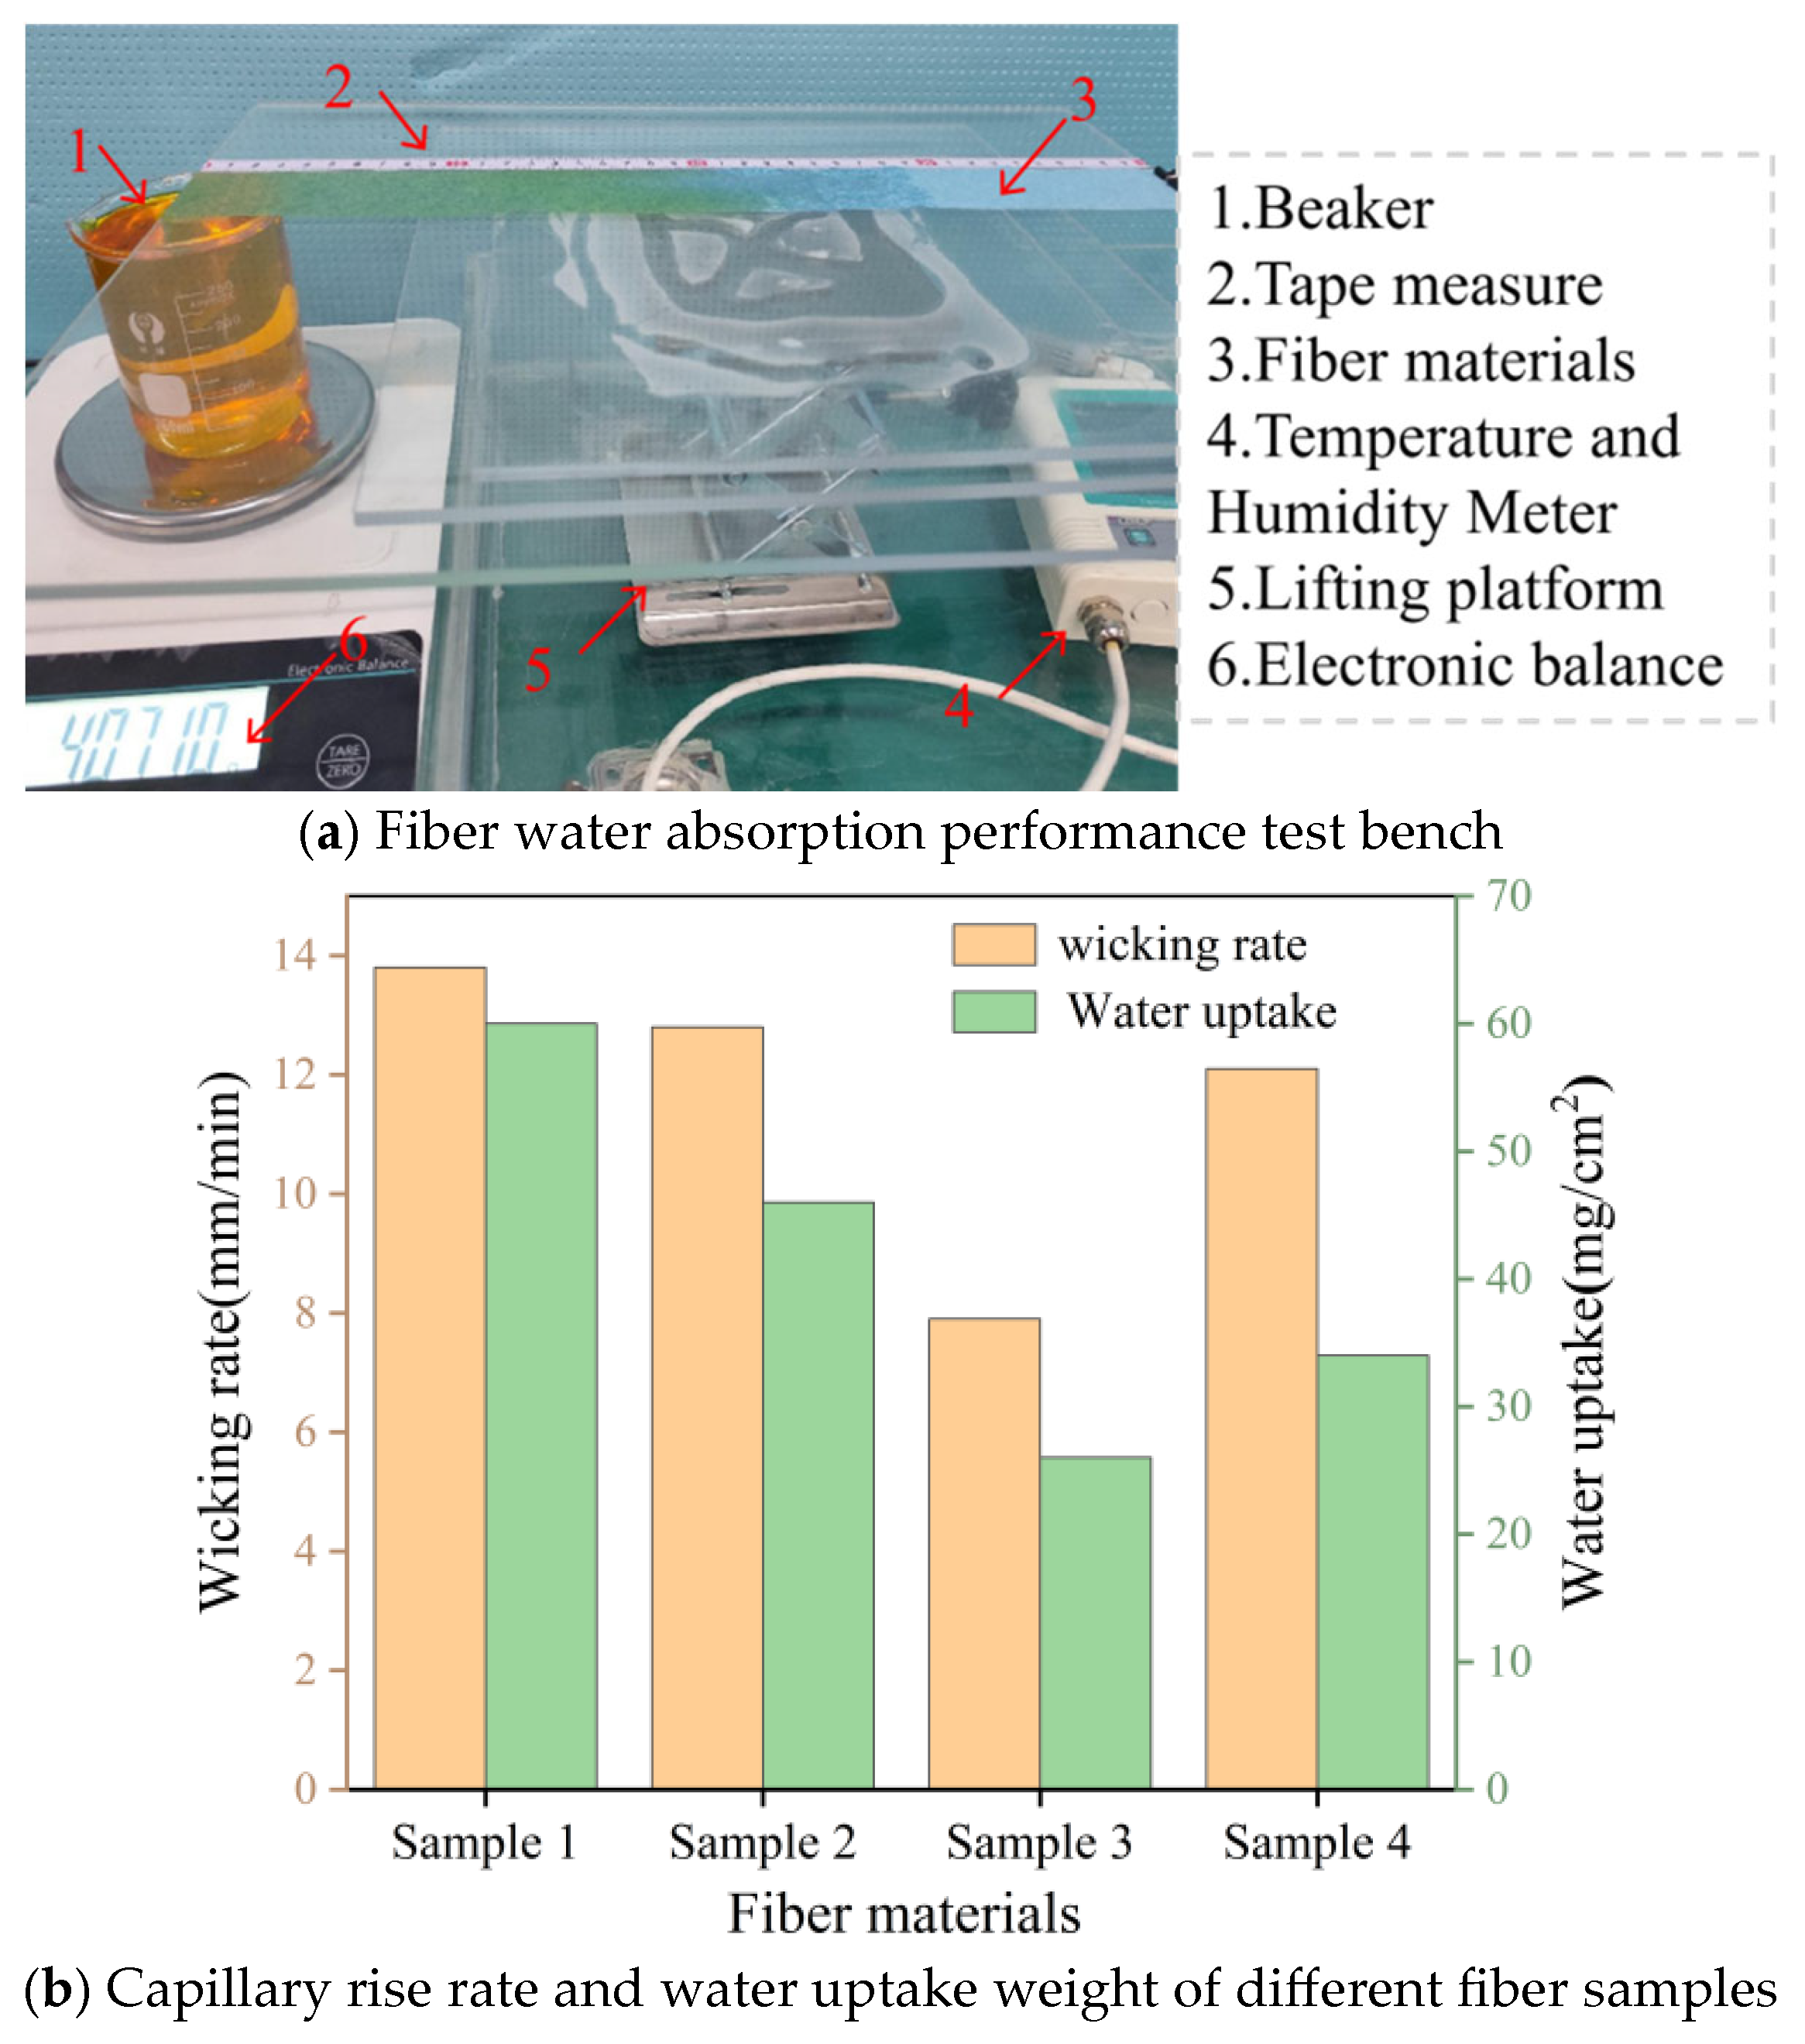
To further quantitatively analyze the water absorption properties of the four fibers, a water supply rate test apparatus was constructed as shown in Figure 5a. The apparatus consists of a lifting platform, an electronic balance, fiber material, a tape measure, a beaker, and a temperature–humidity meter. Considering that minor fluctuations in environmental conditions have a negligible impact on wicking performance [12], and that the effect of evaporation loss on the wicking weight is insignificant [23], the samples were tested at an ambient temperature of 25.5 °C and a relative humidity of 50.3%. The strip-shaped moisture-wicking fibers are secured horizontally on the lifting platform to ensure the capillary absorption process remains unaffected by gravity. The fiber base is immersed in a beaker containing dye to observe water migration. Using a ruler and electronic balance, the capillary rise distance and water absorption are simultaneously measured at different time points. The experiment duration is set to 30 min to ensure the material absorbs sufficient water. The comparative analysis of different materials shown in Figure 5b indicates that Coolmax® bird eye mesh fabric exhibits the best water delivery performance among the four materials. Within 30 min, the total wicking distance reached 412 mm, with an average wicking rate of 137 mm/min. The water absorption capacity reached 60 mg/cm2, demonstrating outstanding moisture transport performance. Based on the microscopic structure diagram of the fibers, Coolmax® bird eye mesh fabrics have the smallest diameter, measuring just 8.26 μm. It can be seen that the smaller the fiber diameter, the greater the porosity and the stronger the resulting capillary forces. Therefore, porous materials with smaller fiber diameters should be prioritized.
Figure 5.
(a) Fiber water absorption performance test bench. (b) Capillary rise rate and water uptake weight of different fiber samples.
3.3. Wetting Stability Test
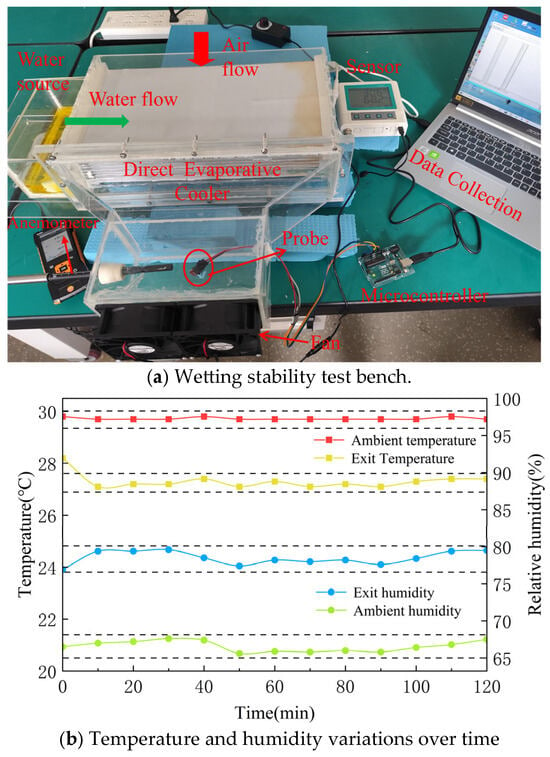
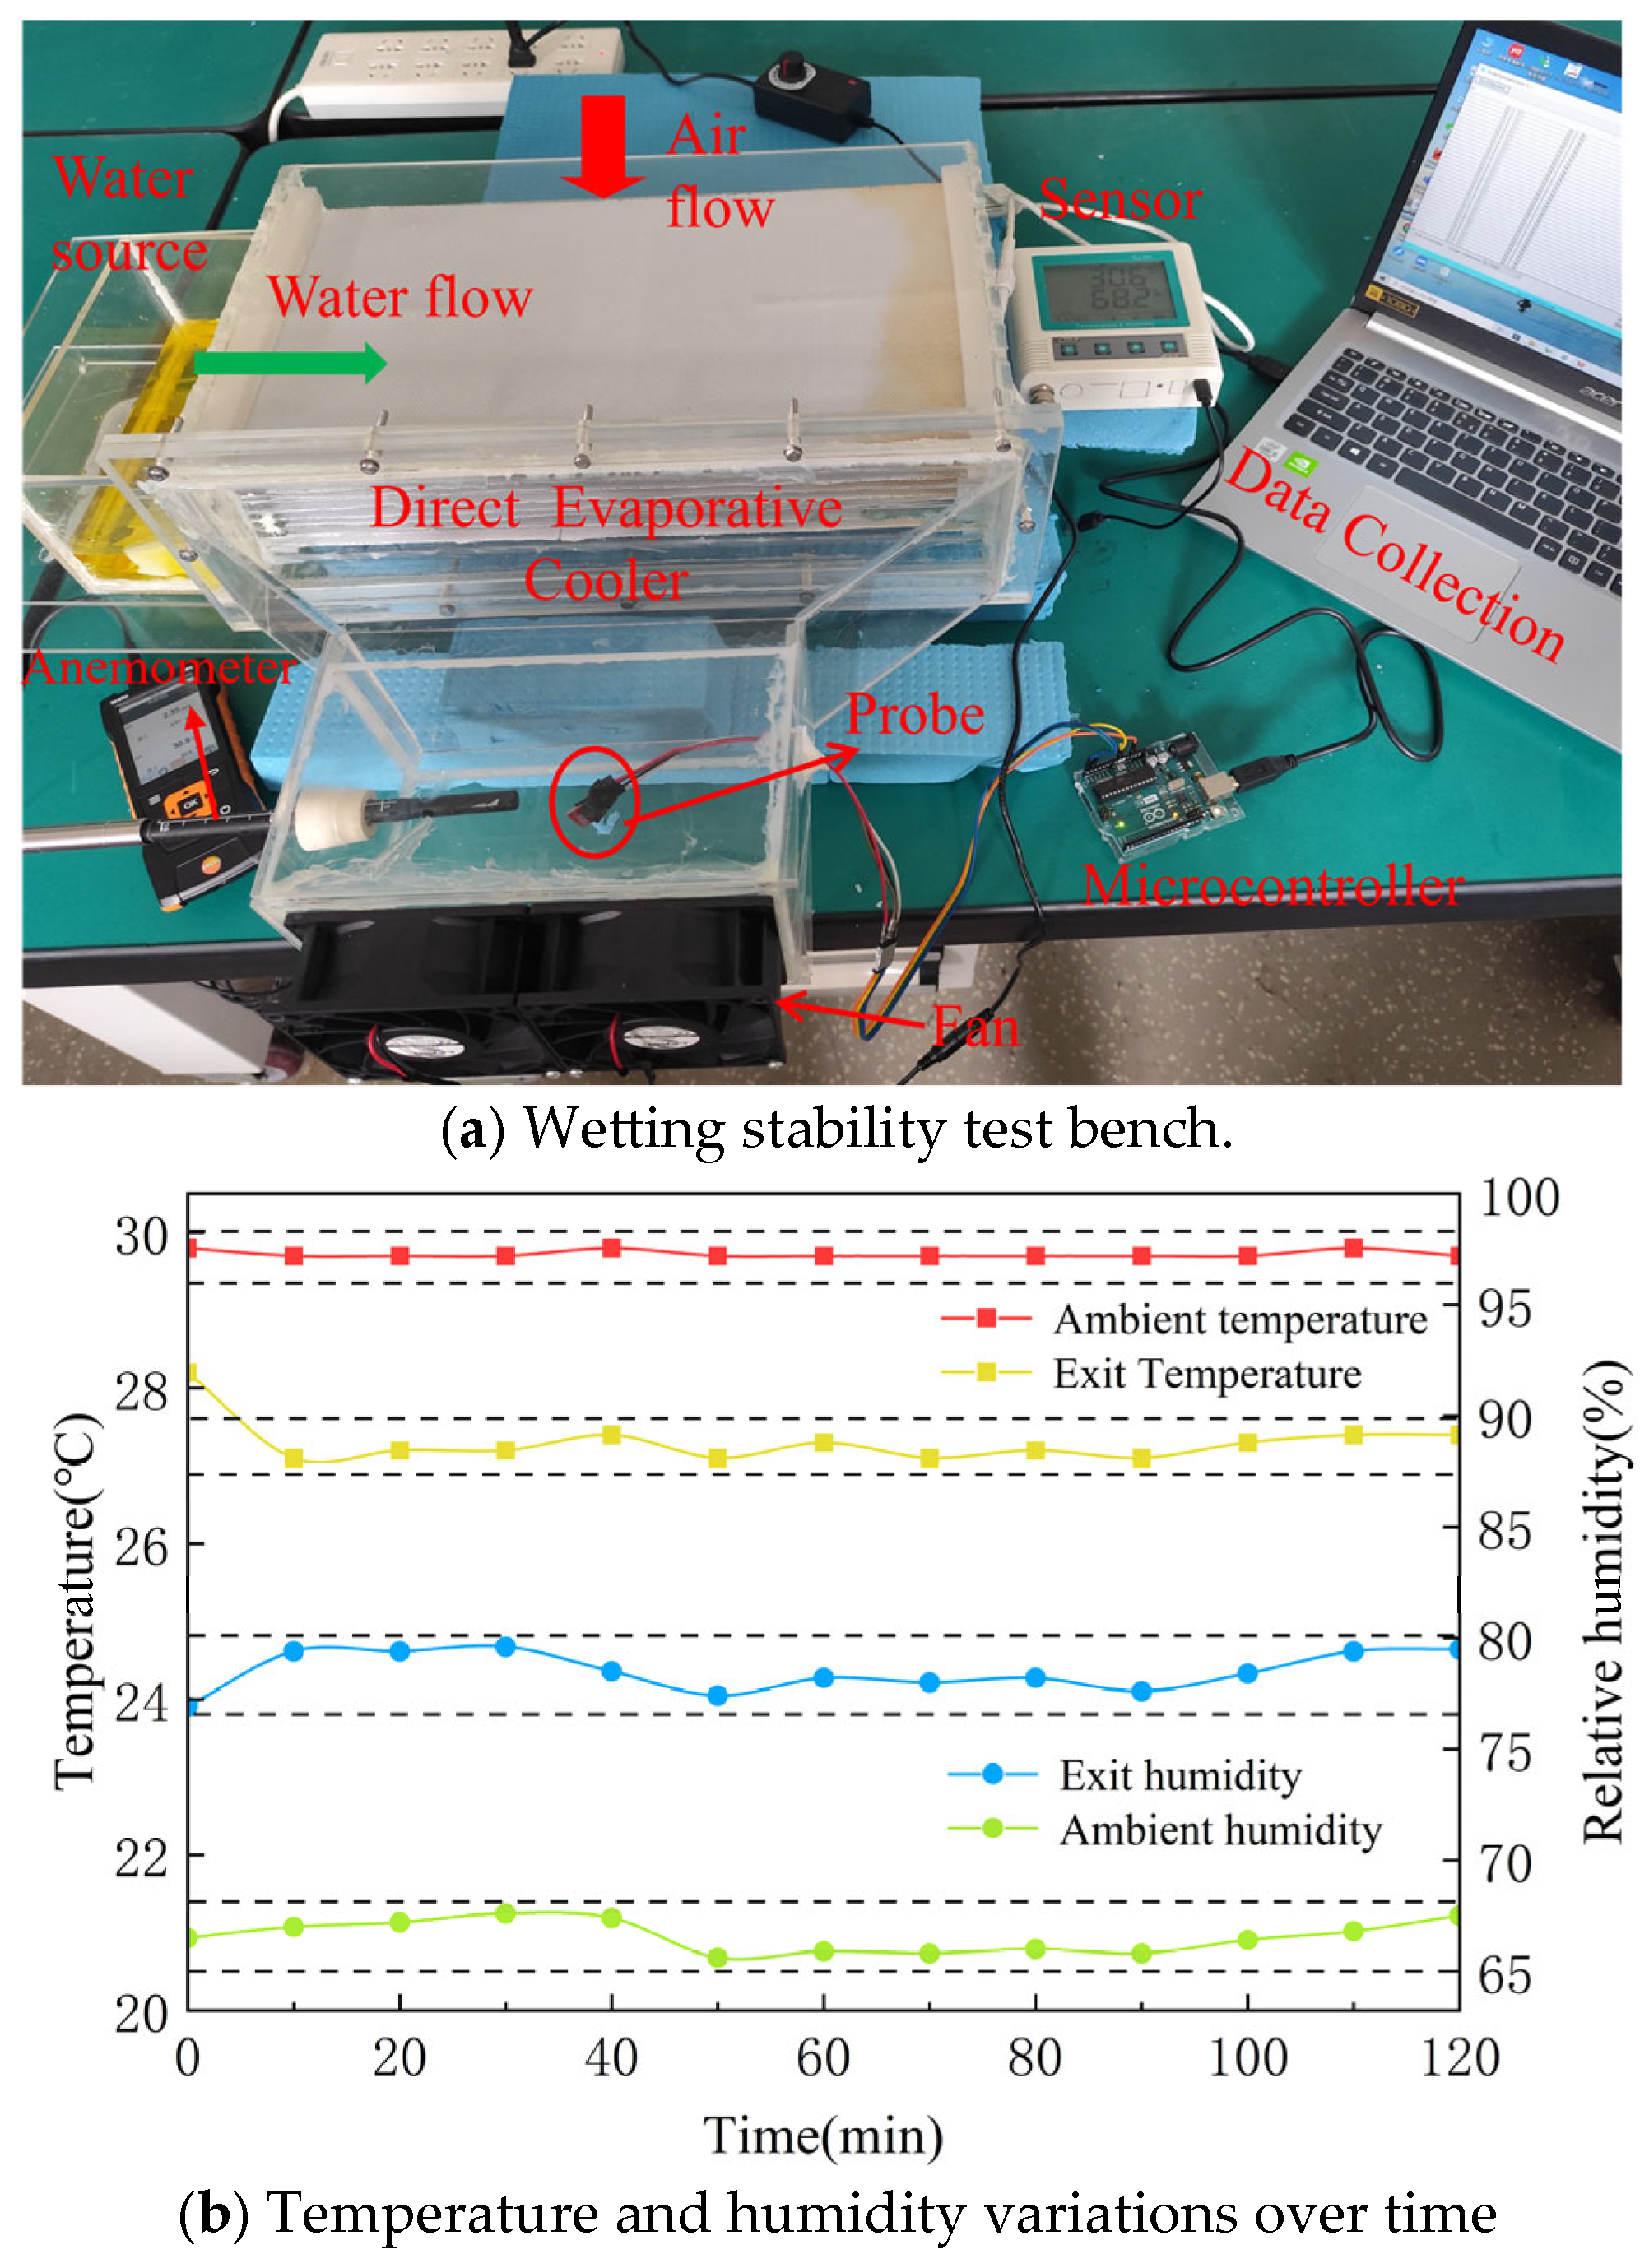
Under conditions of self-wicking water and air flow, water within porous materials simultaneously undergoes capillary rise (water uptake) and evaporation (water loss). To quantitatively evaluate the wetting stability of porous materials absorbing water through capillary forces under dynamic conditions, Coolmax® bird eye mesh fabric was selected as the test material based on its optimal performance. A self-wicking water direct evaporation test platform was constructed, as shown in Figure 6a. The test platform contains 10 sets of airflow channels, with the gap of each channel controlled at 5 mm [25]. Based on the investigation of the material’s capillary performance, the evaporation surface was designed with dimensions of 400 mm × 200 mm. The testing was conducted under actual indoor conditions during summer, with specific parameters of dry-bulb temperature of 29.7 °C and relative humidity of 66.9%.
Figure 6.
(a) Wetting stability test bench. (b) Temperature and humidity variations over time.
Before testing, fabric samples were washed and dried to remove residual manufacturing oils or impurities affecting surface energy. During testing, one end of the material was immersed in the aqueous solution. To prevent impurities in the water from affecting capillary action, deionized water was used as the evaporation medium, and a trace amount of food colorant (McCormick, Hunt Valley, MD, USA) was added to facilitate the observation of surface wetting. To eliminate edge effects, the lateral edges were sealed with silicone strips, and a protective shield was installed over the sealed area to isolate it from ambient airflow. The fan draws in ambient air at a velocity of 1 m/s, directing it to flow over the wet material and come into direct contact with it. Temperature and humidity at the air inlet and outlet were continuously monitored and the data were collected using a temperature and humidity sensor. The operational duration was 2 h. The changes in inlet and outlet temperature and humidity are shown in Figure 6b.
The test results show that the outlet air temperature decreased by 2.5 °C compared with the initial ambient temperature and stabilized at 27.2 °C, with a fluctuation range of only 0.3 °C. The relative humidity of the outlet air increased by 11.4%, stabilizing at 78.3%, with a fluctuation range of only 1.3%. Meanwhile, observations through the acrylic panel revealed that the material surface remained consistently wetted, with no dry regions observed. This indicates that the self-wicking capability of Coolmax® bird eye mesh fabric can compensate for the water loss caused by evaporation, thereby enabling the material to maintain stable evaporative performance during long-term operation. Therefore, selecting Coolmax® bird eye mesh fabric as the wet-surface material in the wet channel and supplying water through its capillary wicking action is a promising approach.
4. Experimental Study of the Cooler
4.1. Prototype
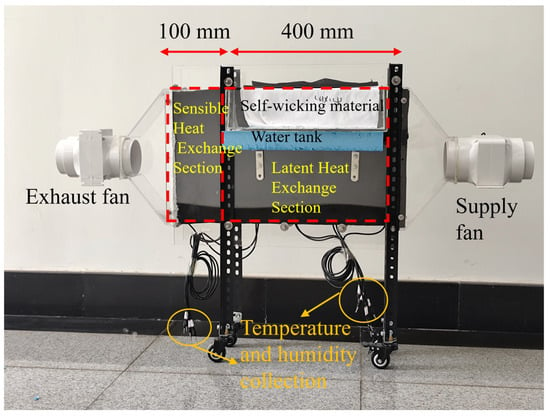
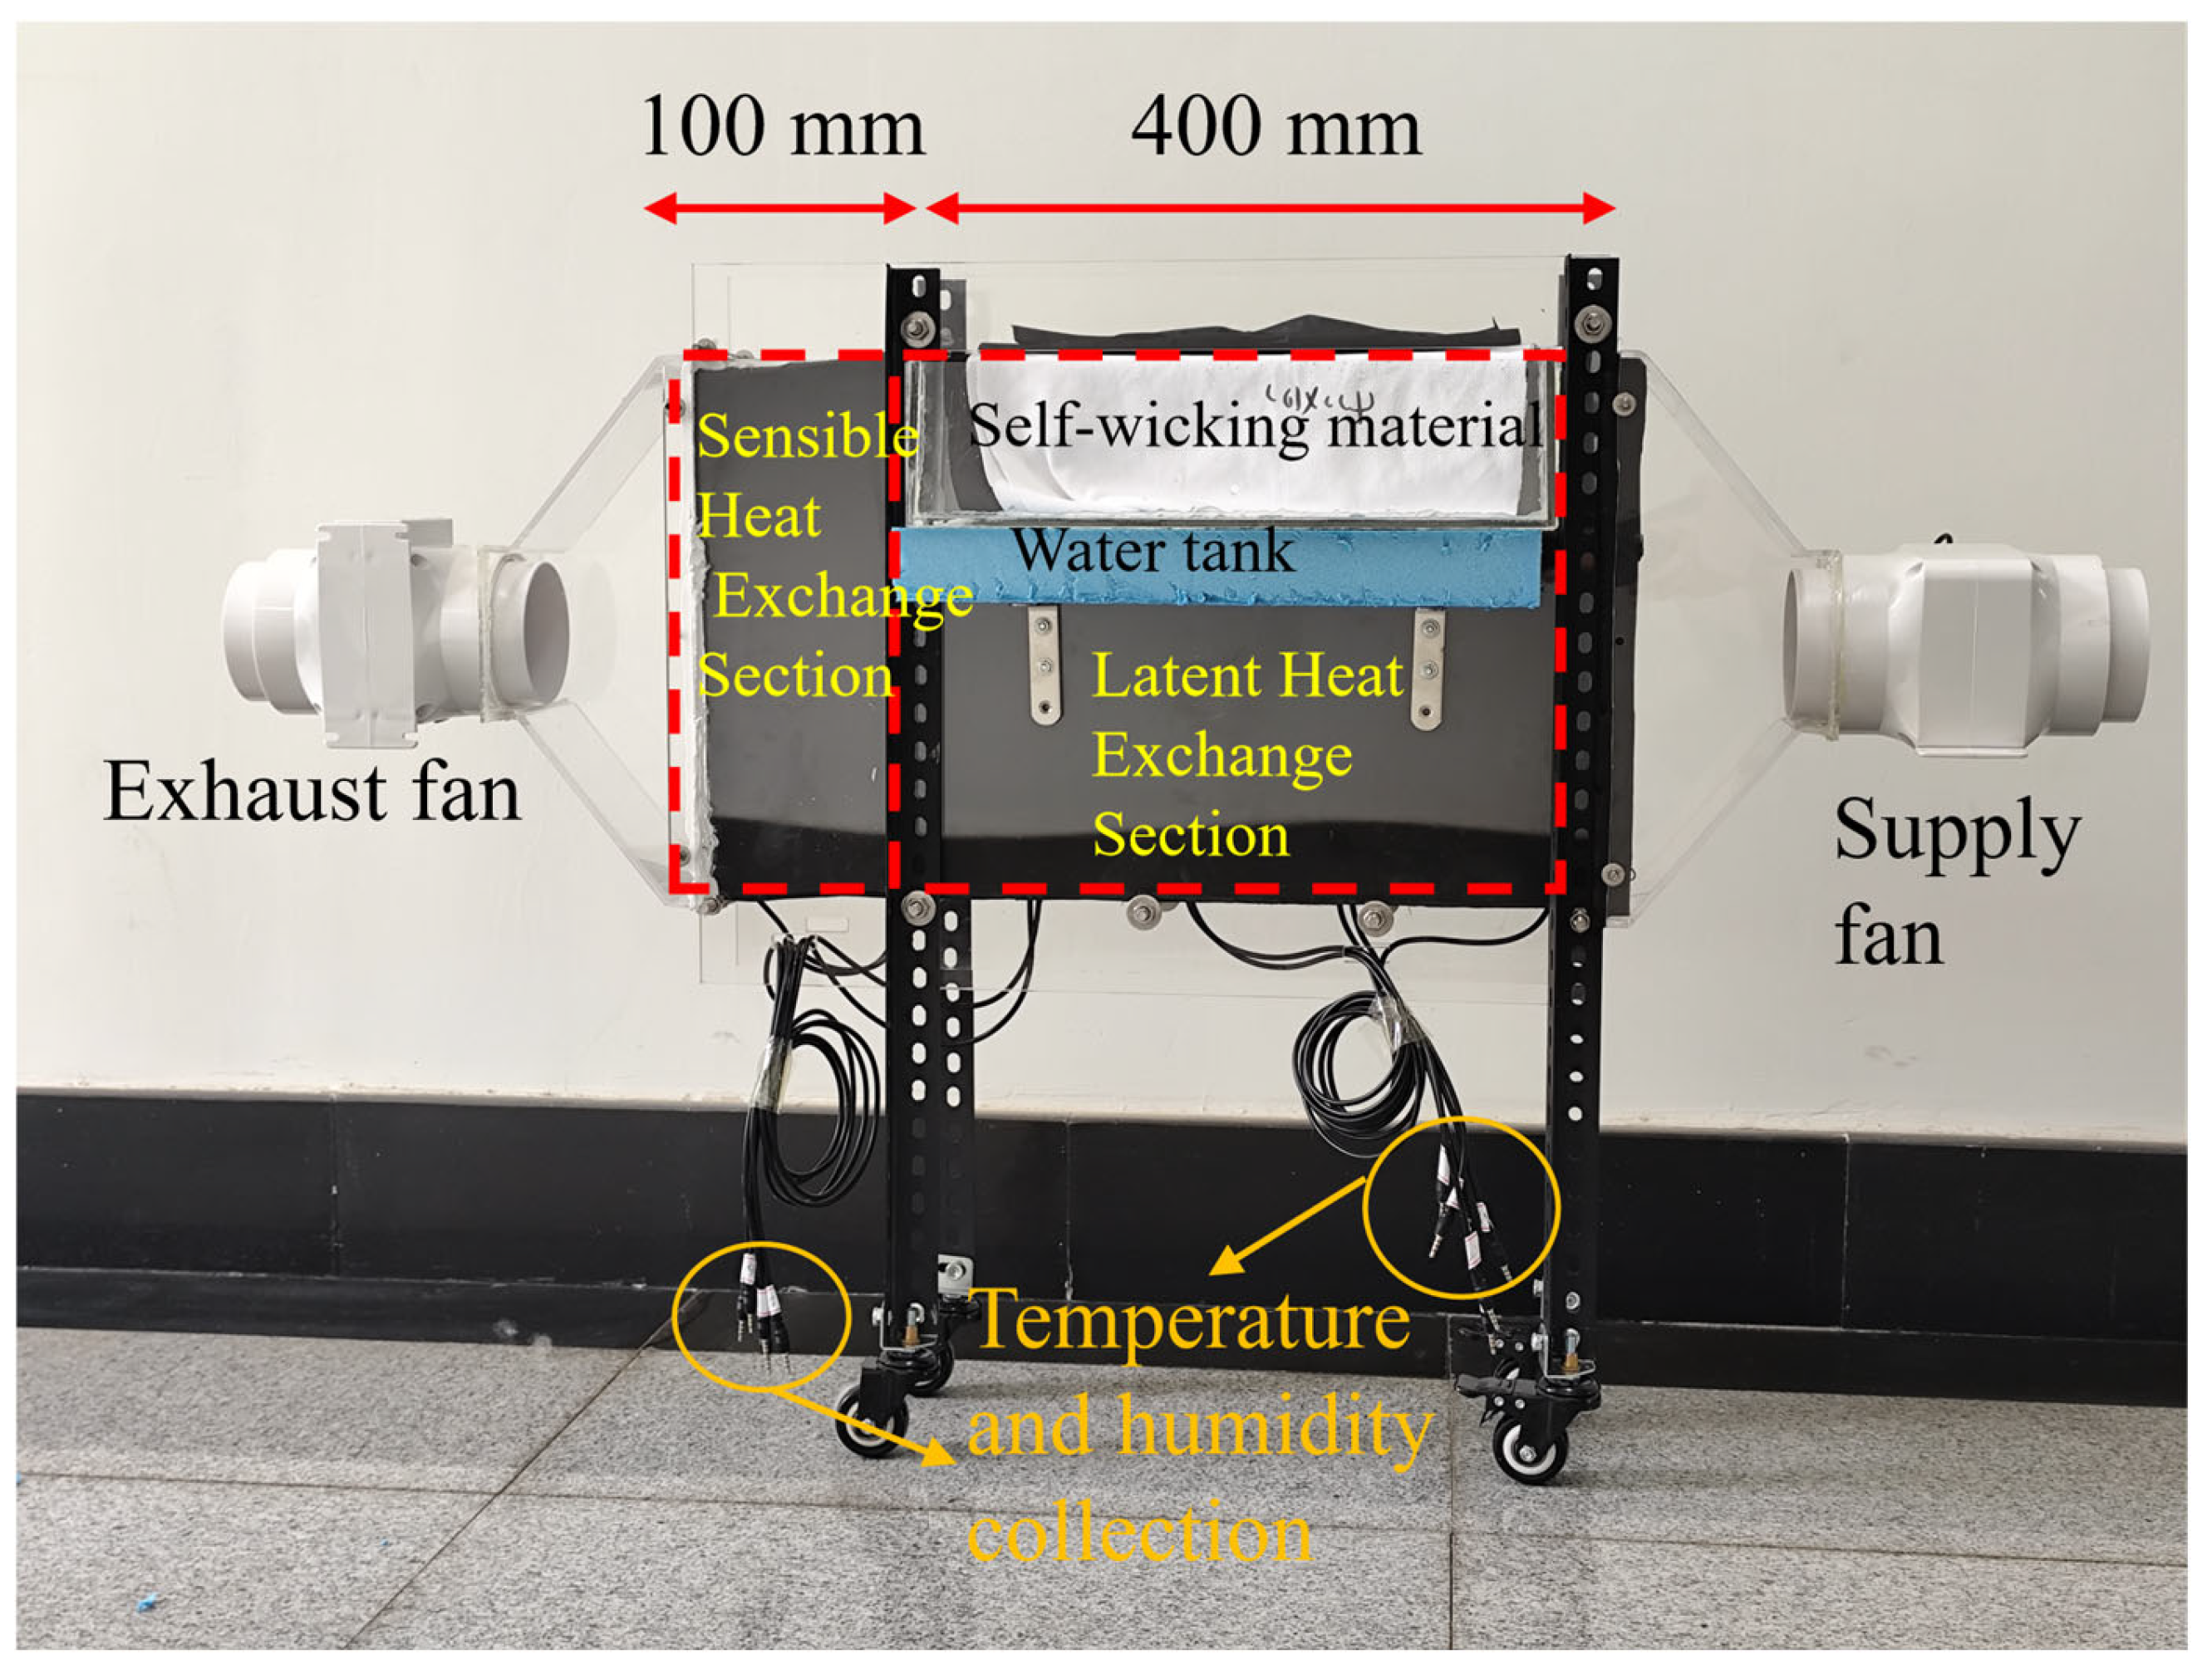
Coolmax® bird eye mesh fabric was selected as the wet-surface material for the latent heat exchange section. The membrane was bonded to the surface of a high-thermal-conductivity aluminum plate using a hot-melt adhesion method [26], with extended sections reserved to form a composite heat exchange plate possessing self-wicking water supply capability. The heat exchange plates were stacked with sealing strips serving as spacing pillars, forming 6 staggered groups of dry and wet channels with a channel spacing of 5 mm. The overall system is illustrated in Figure 7. A 12 V axial fan, whose rotational speed was precisely controlled by a 220 V adjustable power supply, was employed. The unit’s casing, air duct, and water tank were all fabricated from acrylic plates to facilitate observation and maintenance. To ensure continuous water supply to the wet surface during operation, the fiber membrane was extended 100 mm from the upper end of the heat exchange plate and immersed in an elevated water reservoir. By combining the capillary action of the porous structure with the gravitational potential of the elevated water reservoir, efficient self-wicking water supply was achieved, ensuring stable evaporative cooling performance of the wet surface in the heat exchanger.
Figure 7.
Actual segmented heat exchange dew-point evaporative cooler.
4.2. Experimental Methods and Conditions
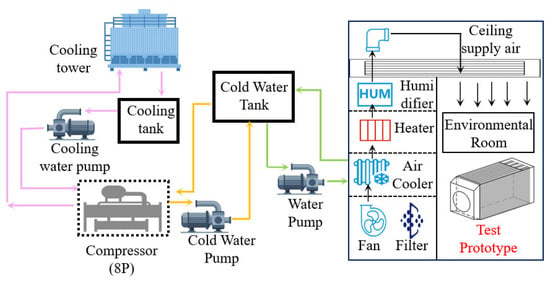
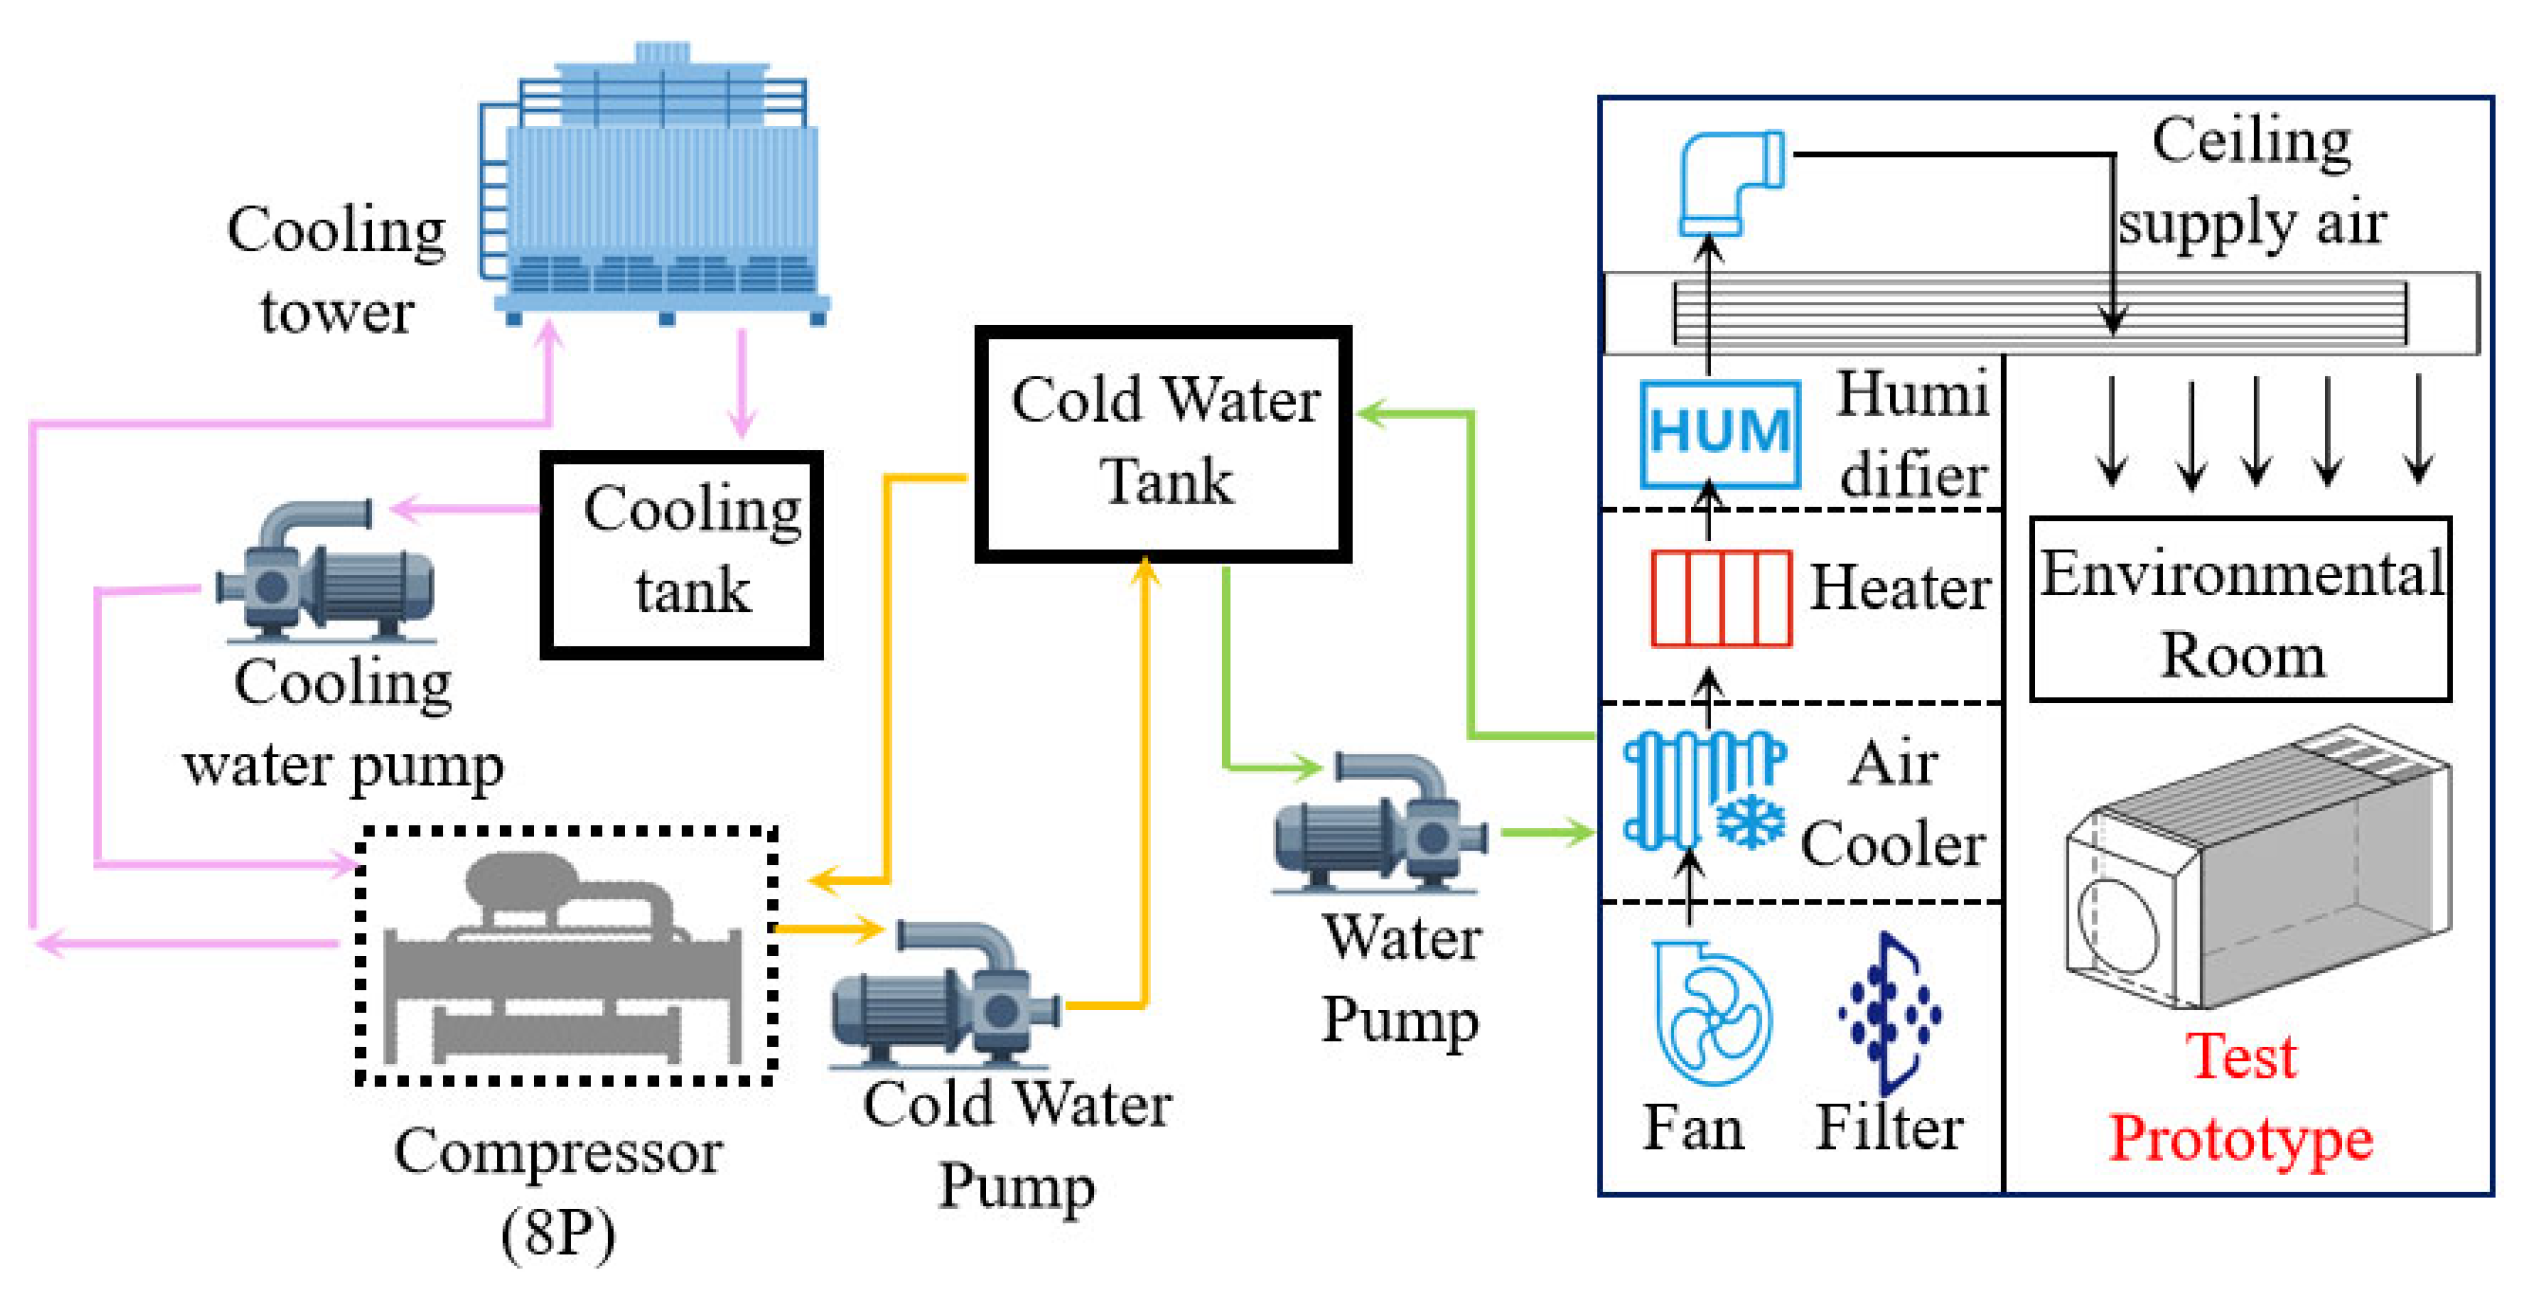
The experiments were conducted in a standard enthalpy chamber to ensure accurate and reliable data. The test environment was set to represent actual summer conditions in regions of moderate humidity (dry-bulb temperature: 33.8 °C; relative humidity: 51.7%). The impact of key operating parameters on system performance was analyzed using a controlled variable method. Test conditions are detailed in Table 3, and the test system is illustrated in Figure 8. Before testing, the refrigeration system, supply fan, electric heater, and humidifier were activated in sequence. Environmental parameters were configured via the host computer, and the system was operated for 20 min to ensure that the enthalpy chamber attained the required steady state.
Table 3.
Experimental test conditions.
Figure 8.
Schematic of the test system.
After the enthalpy chamber environment stabilized, the prototype was activated and adjusted to the target air velocity and air mass flow ratio. A Testo-425 hot-wire anemometer was used to measure the velocity of the intake and exhaust air, and the fans’ power consumption was recorded with an electrical power meter. The wind speed readings stabilize within tens of seconds. The effective heat exchange length of the prototype air flow channel is 500 mm. DL11B-MC-S1 high-precision temperature and humidity sensors were installed every 100 mm along the length of both the dry and wet channels. The sensor sampling frequency is 10 s per measurement. When the inlet and outlet air temperature fluctuations are less than ±0.2 °C and the relative humidity fluctuations are less than ±2%, the system is deemed to have reached a steady state. After the unit stabilizes during operation, data acquisition commences. Instrument parameters are detailed in Table 4, all having undergone calibration by the manufacturer.
Table 4.
Measurement instrument accuracy.
4.3. Performance Evaluation of the Unit
To comprehensively evaluate the performance of the dew-point evaporative cooler, the temperature drop, wet-bulb effectiveness, dew-point effectiveness, and energy efficiency ratio were selected for analysis [27].
Dry-channel inlet–outlet temperature difference [28]:
where is the dry-bulb temperature of air in the inlet of the dry channel, °C; is the dry-bulb temperature of the air exiting the dry channel, °C. The inlet and outlet temperatures can be obtained from the temperature and humidity sensors.
Calculation formulas for wet-bulb effectiveness and dew-point effectiveness:
where and are the wet-bulb effectiveness and the dew-point effectiveness of the cooler, respectively; is the wet-bulb temperature of the air entering the dry channel, °C; is the dew-point temperature of the air entering the dry channel, °C. They can be obtained from the psychrometric chart.
Cooling capacity:
where is the specific heat capacity at constant pressure, J/(kg·K); is the dry air density, kg/m3; is the product air flow rate, m3/s. Wind speed can be obtained using a hot-wire anemometer.
Energy efficiency ratio (EER) is defined as the ratio of sensible cooling capacity to total power consumption. In this study, the system power is supplied by two fans. The power consumption of auxiliary components such as the data-acquisition unit is negligible compared with that of the fans and is therefore excluded from the EER evaluation.
The power consumed by the fans can be obtained from the power monitoring instrument.
4.4. Uncertainty Analysis
In the experiments, the temperature and humidity measurements were affected by the inherent errors of the instruments, causing indirectly derived values to deviate from the true values [29] and thus not fully reflect the actual conditions. Therefore, it is necessary to perform an uncertainty analysis for the instruments and the derived parameters. The calculation formula for experimental uncertainty [30] is as follows:
In this equation, and denote the absolute and relative uncertainties of the dependent variable, respectively, where represents the indirectly measured value (obtained by calculation); is the functional relationship of several independent variables
; signifies the uncertainty of the directly measured (independent) variable.
The uncertainties of the directly measured values are listed in Table 4. The uncertainty of indirectly measured values (wet-bulb effectiveness, dew-point effectiveness, etc.) is calculated according to Formula (12).
Under the enthalpy chamber conditions of a dry-bulb temperature of 33.8 °C, relative humidity of 51.7%, inlet air velocity of 2 m/s, and air mass ratio of 0.44, the uncertainties of the evaluation indices are summarized in Table 5. The derivation process is as follows:
Table 5.
Uncertainty analysis of evaluation indices.
Uncertainty of wet-bulb effectiveness:
Uncertainty of dew-point effectiveness:
Uncertainty of cooling capacity:
Uncertainty of EER:
5. Results
5.1. Effect of Inlet Air Velocity
5.1.1. Thermal–Moisture Distribution in the Channels Under Different Inlet Air Velocities
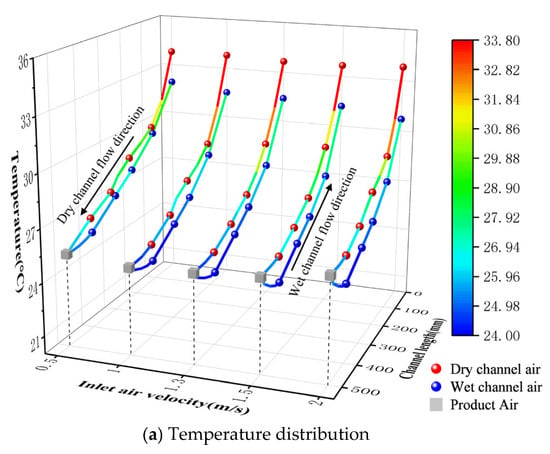
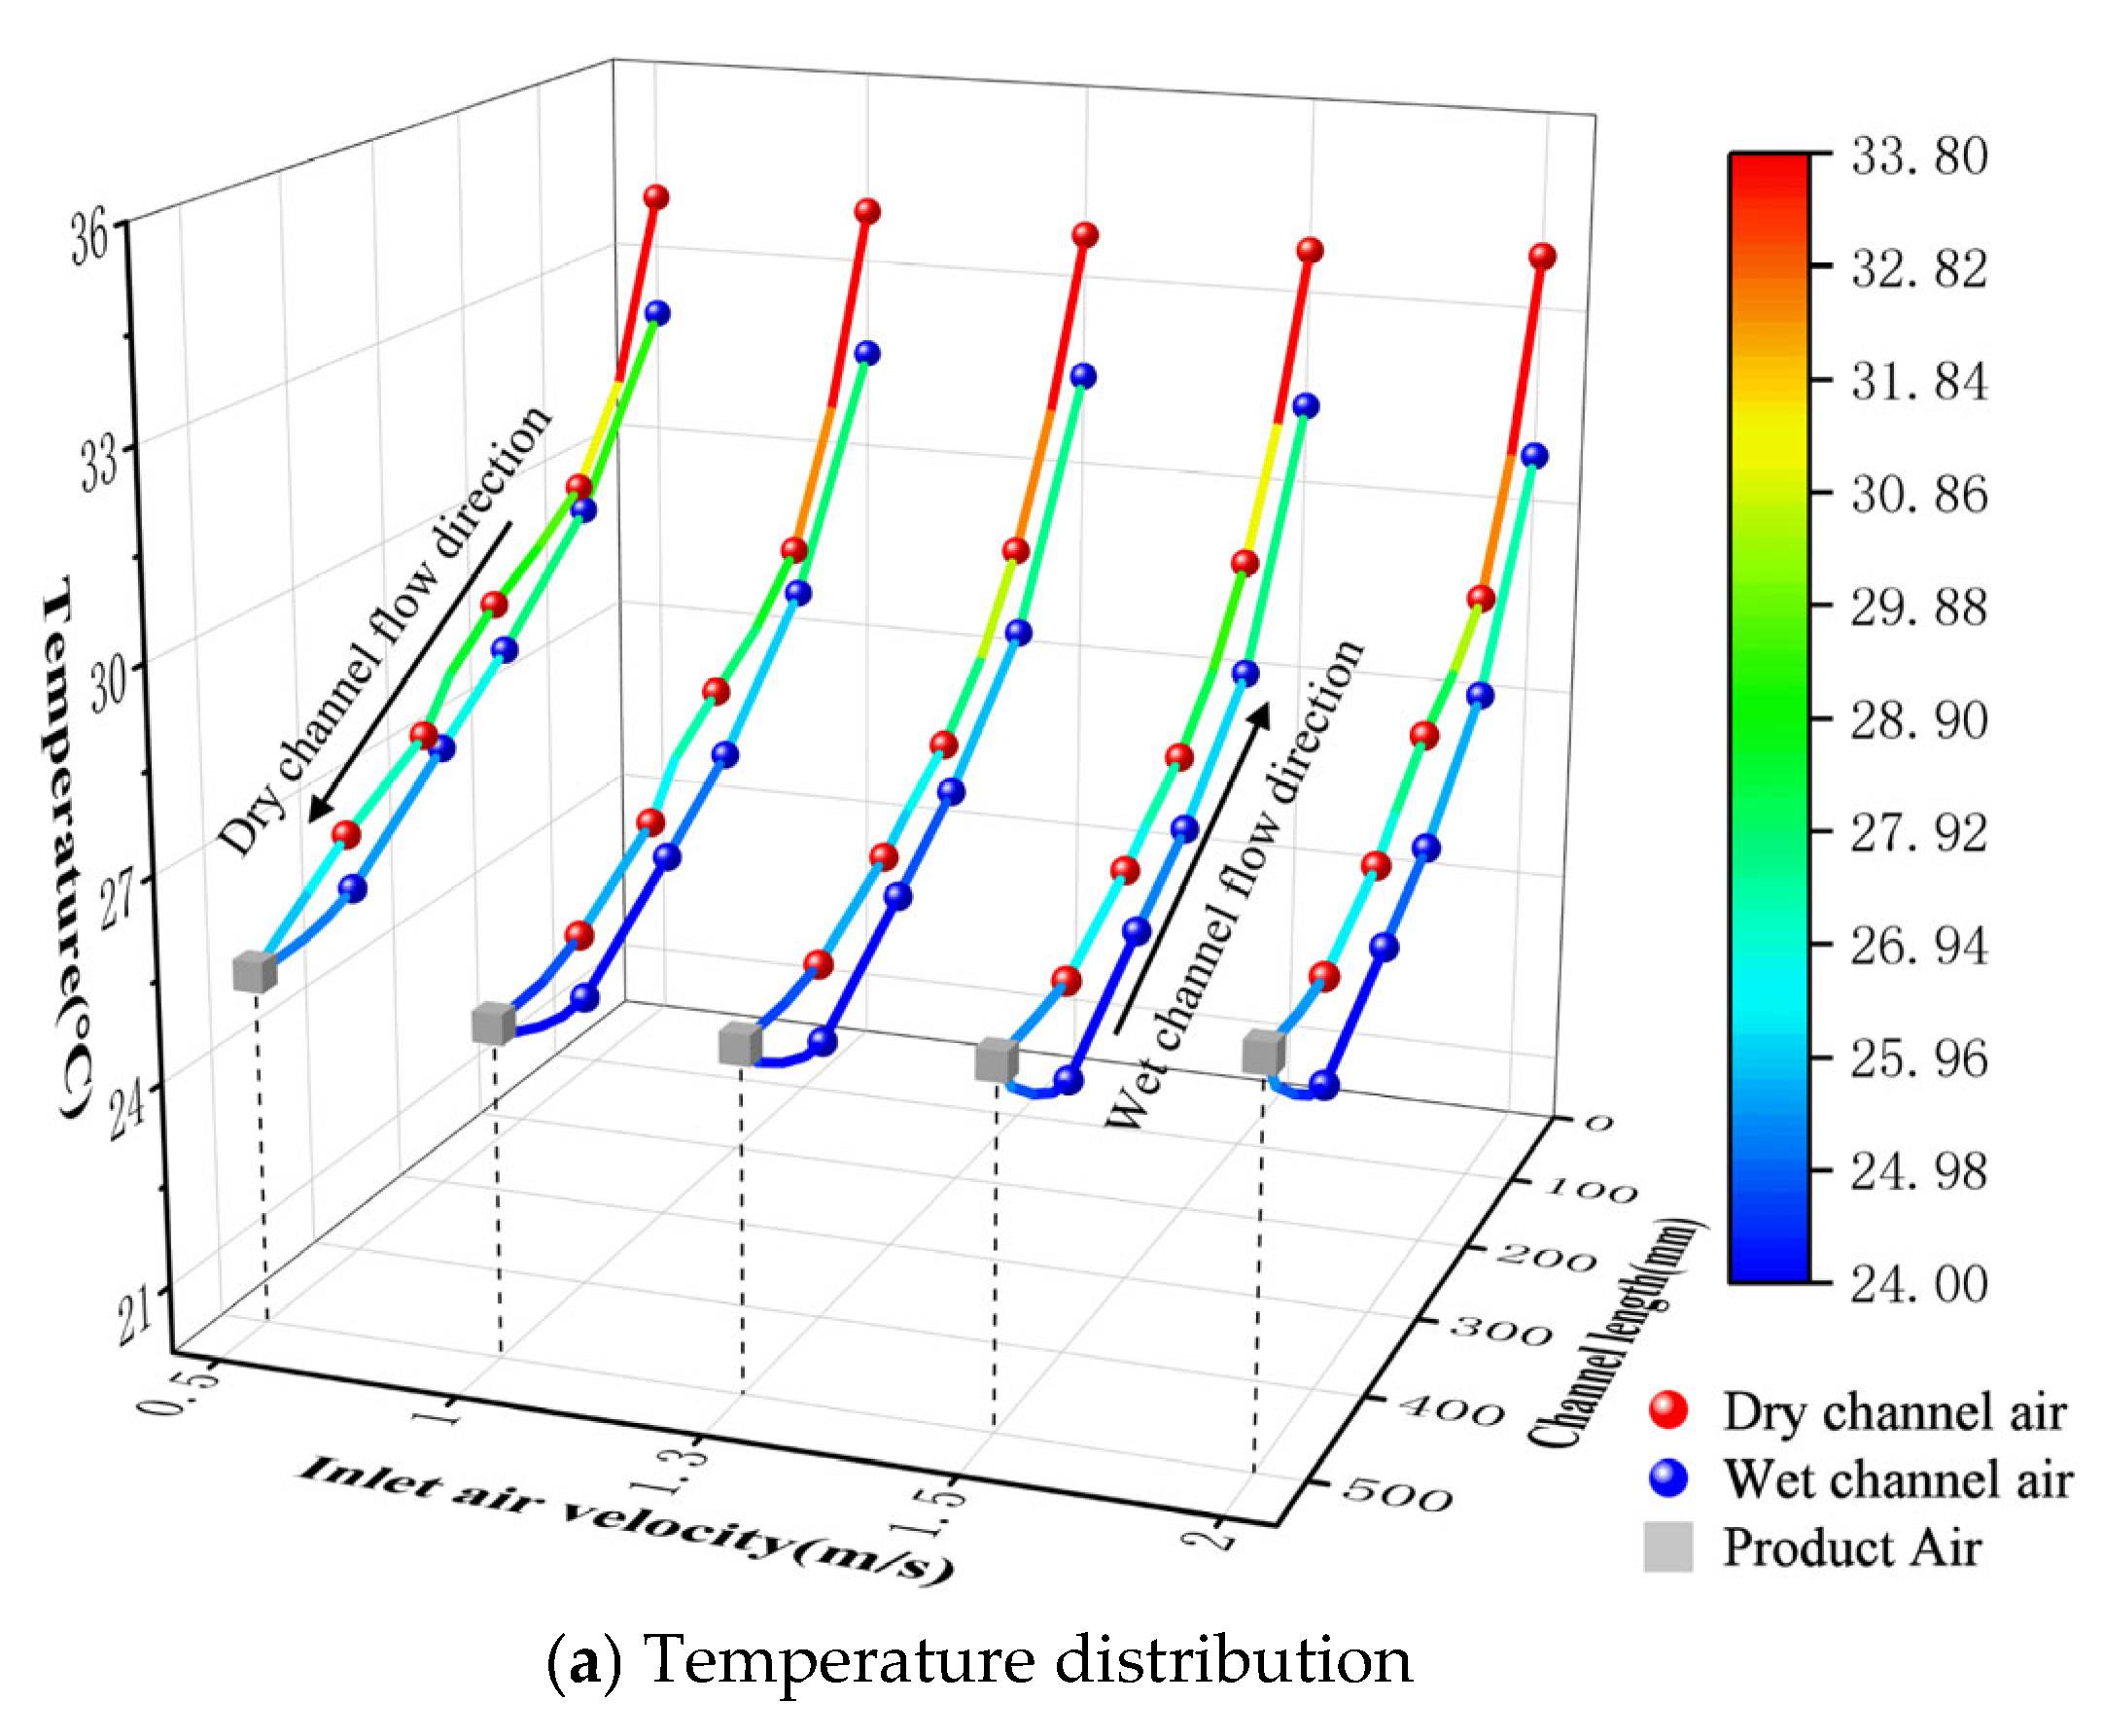
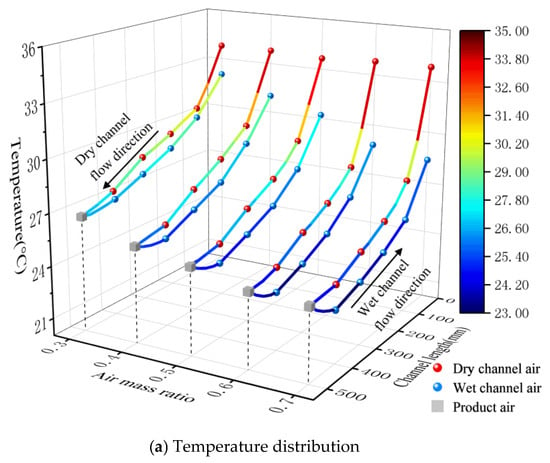
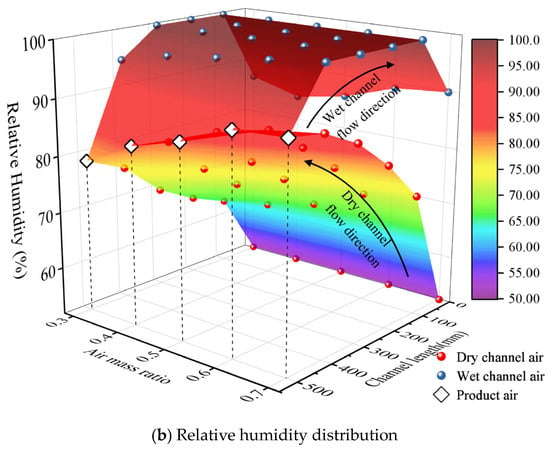
Figure 9 illustrates the temperature and humidity distributions in the dry and wet channels under different inlet air velocities. As the air velocity increases from 0.5 m/s to 2.0 m/s, the temperature along the dry channel decreases, while the relative humidity increases correspondingly. As shown in Figure 9a, the sensible heat recovery within the 0–100 mm region is pronounced. This segment maintains a stable temperature drop of 3.9–4.5 °C, contributing more than 45.8% to the total temperature reduction. This is driven by enhanced convective heat transfer, resulting from the large temperature difference between dry and wet channels, the addition of fins, and the removal of hydrophilic material thermal resistance. The temperature drop in the latent heat exchange section (100–500 mm) monotonically decreases with increasing wind velocity, falling by 23.8% from 4.6 °C at 0.5 m/s to 3.5 °C at 2.0 m/s. The terminal section (400–500 mm) serves as the depletion zone for heat exchange potential energy. The increased air velocity shortens the residence time, further limiting heat exchange. The terminal temperature drop decreases from 1.1 °C at 0.5 m/s to 0.2 °C at 2.0 m/s.
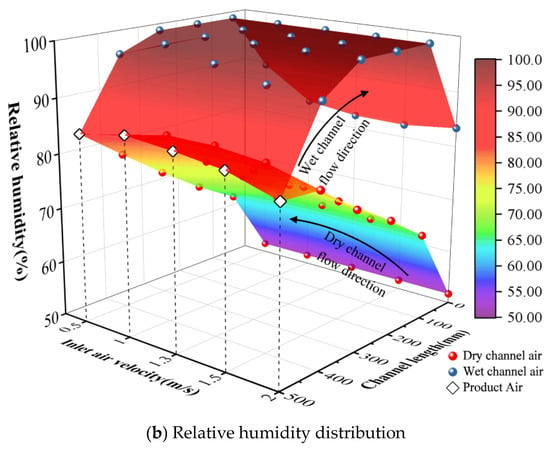
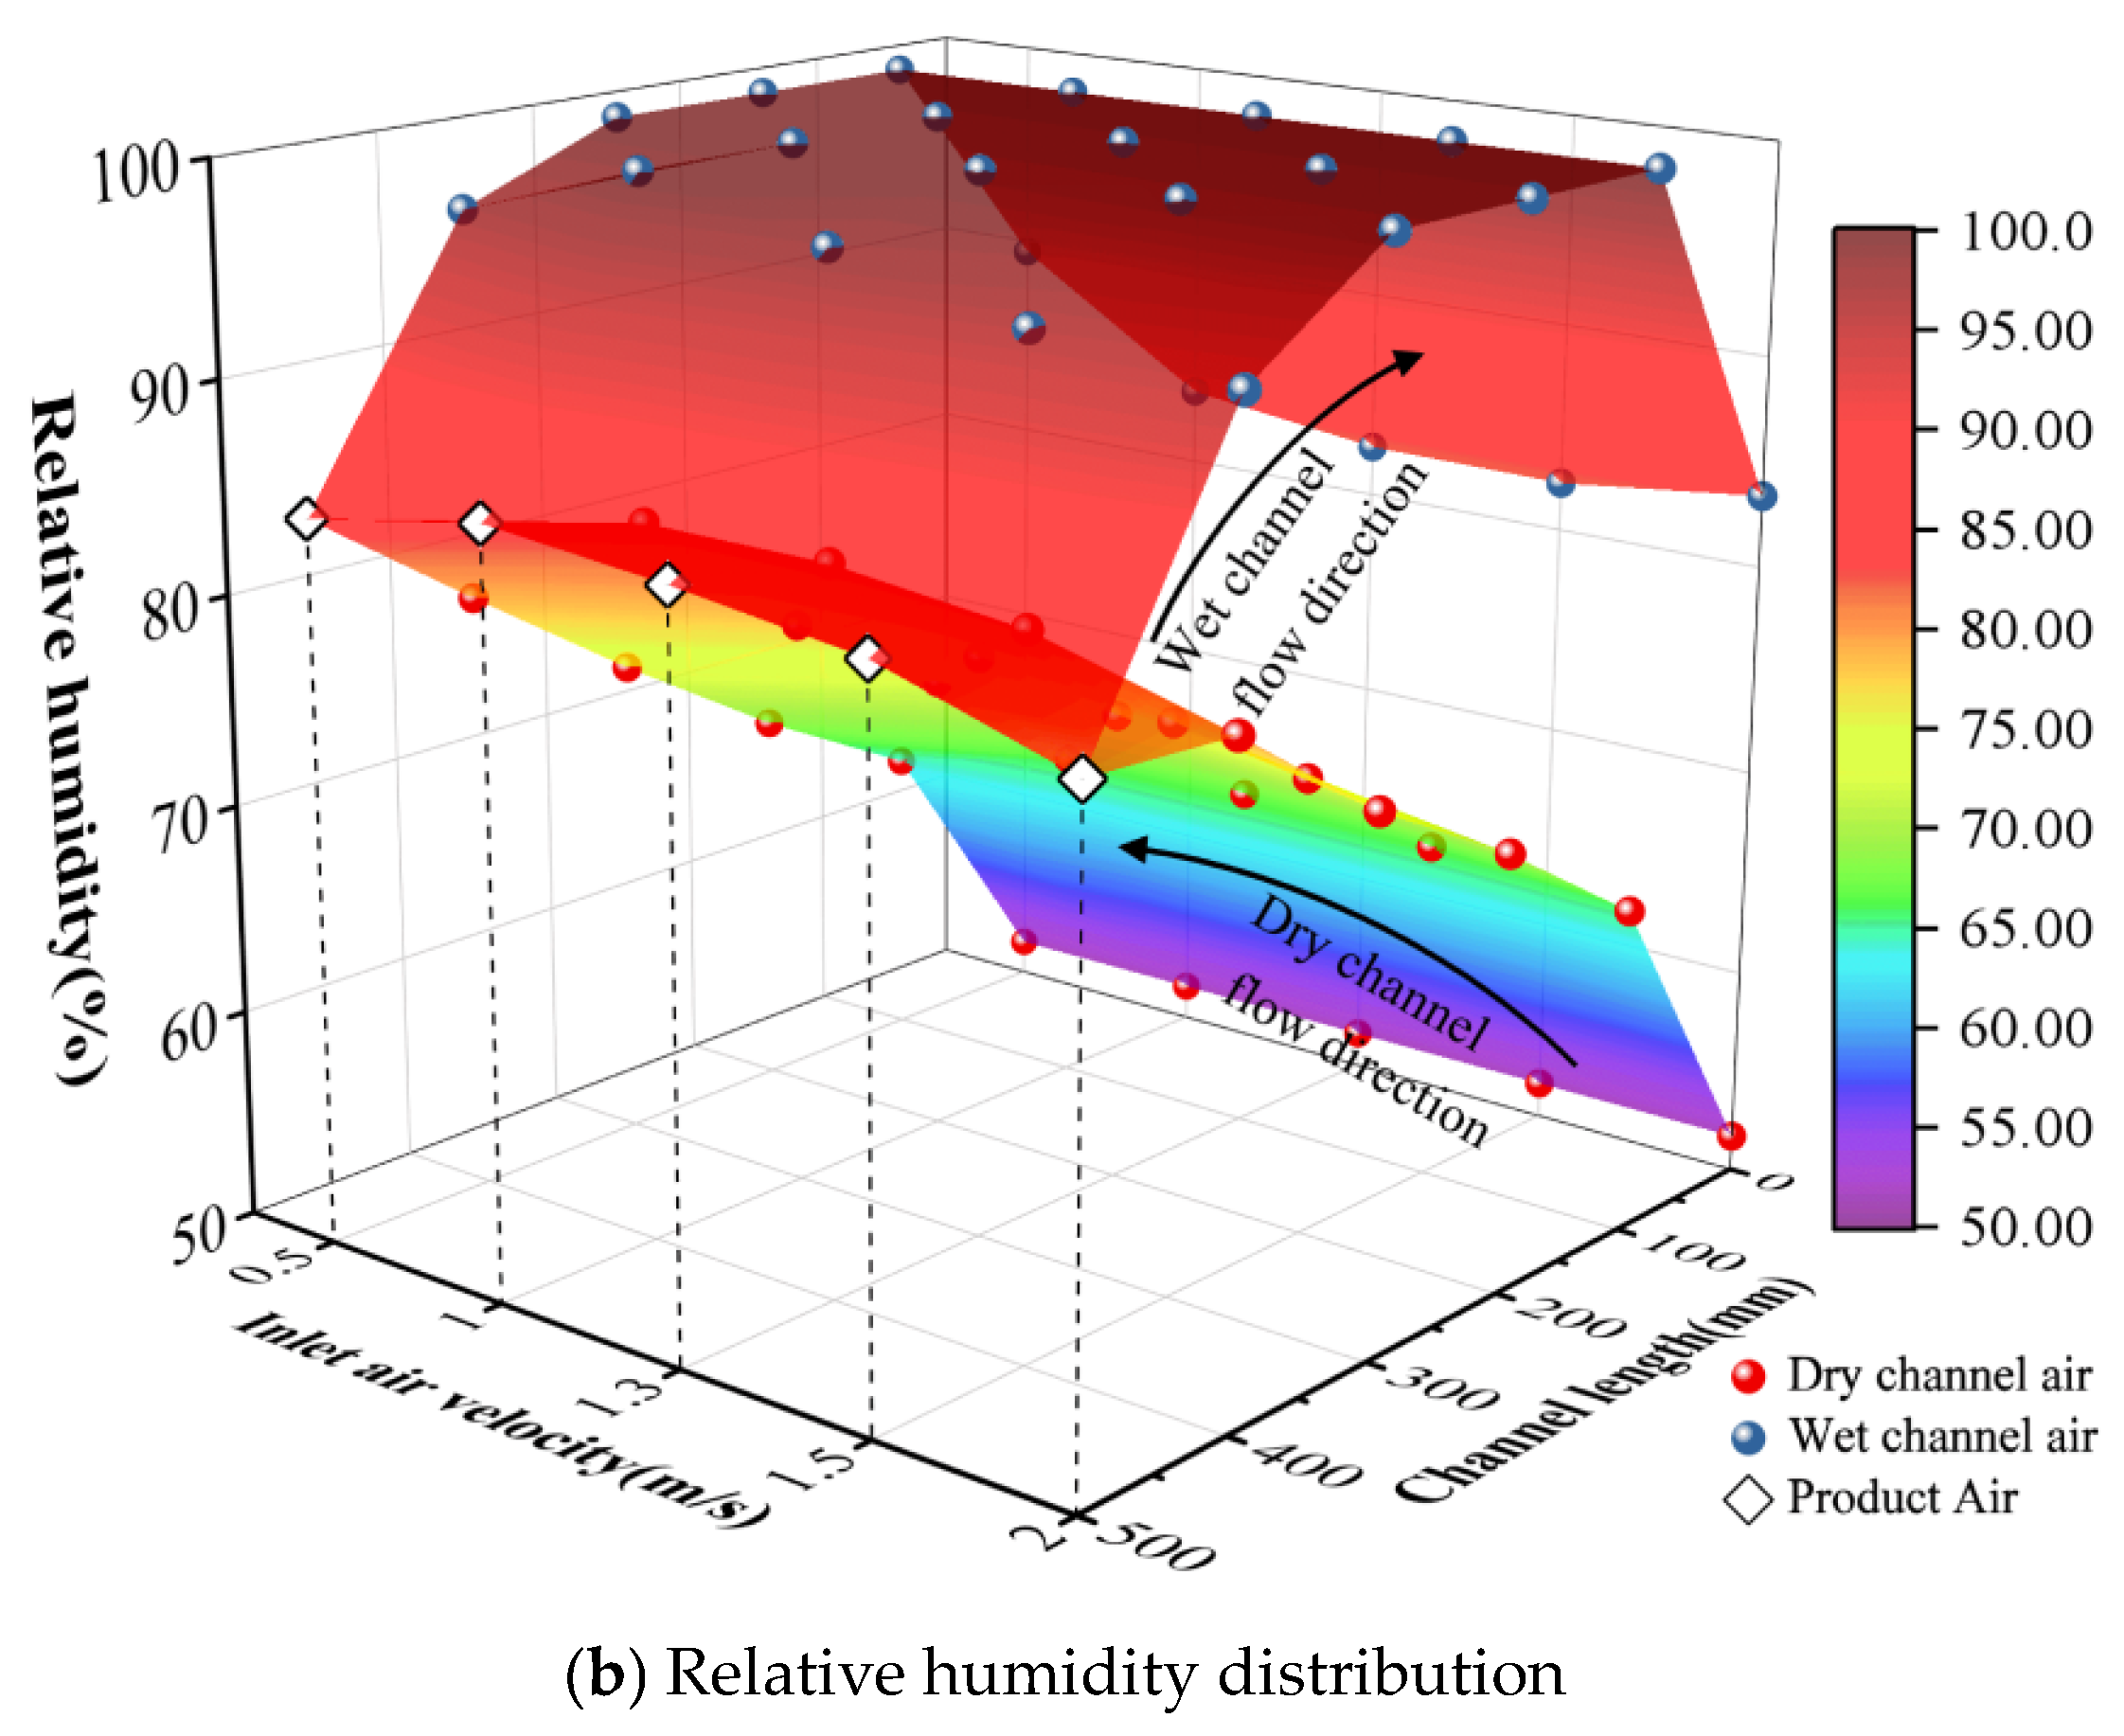
Figure 9.
Temperature distribution (a) and relative humidity distribution (b) with the different inlet air velocities.
The relative humidity within the wet channel increases rapidly, as shown in Figure 9b. Moist air can reach saturation within 100 mm and subsequently maintain a dynamic saturated state within the 400–100 mm range. This indicates that Coolmax® bird eye mesh fabric exhibits highly efficient evaporation performance and stable capillary water supply. The sensible heat exchange section, being a pure air-to-air sensible heat exchange section without moisture replenishment, causes a slight decrease in relative humidity. Additionally, the temperature along the wet duct gradually increases. At an air velocity of 0.5 m/s, the secondary air temperature rises from 25.3 °C at the cold end to 31.9 °C. Moreover, the temperature rise gradient exhibits an increasing trend. In the wet channel, the closer to the outlet, the higher the temperature of the primary air in the counterflow, thereby enhancing the driving force. The heat exchange process is governed by residence time. Increasing the air velocity to 2 m/s shortens the residence time, reducing the secondary air outlet temperature by 3.7% to 30.7 °C.
5.1.2. Performance Parameters Under Different Inlet Air Velocities
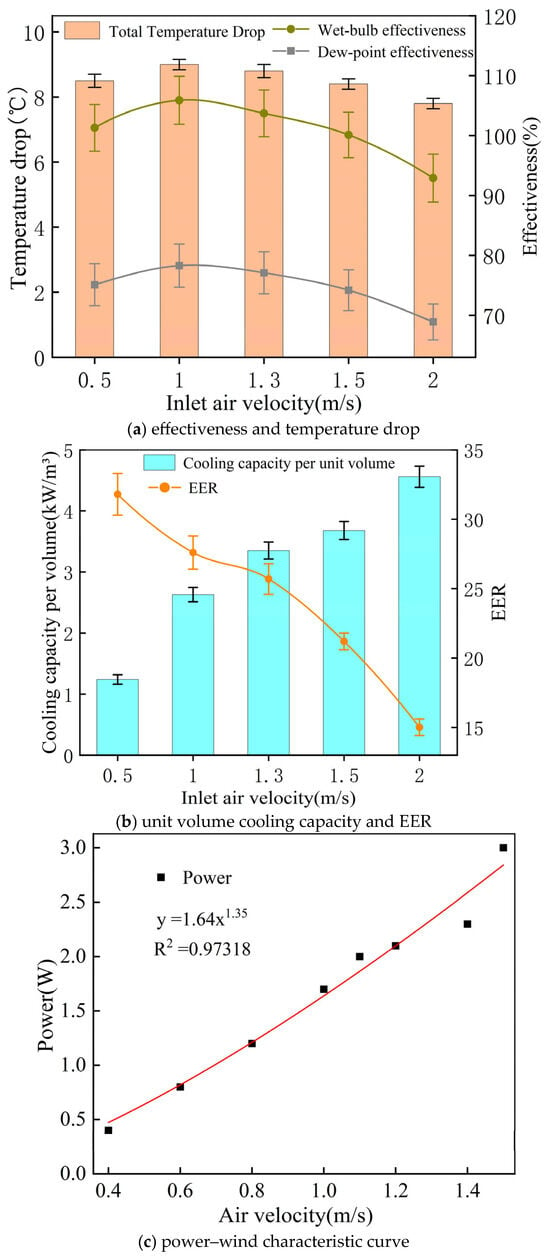
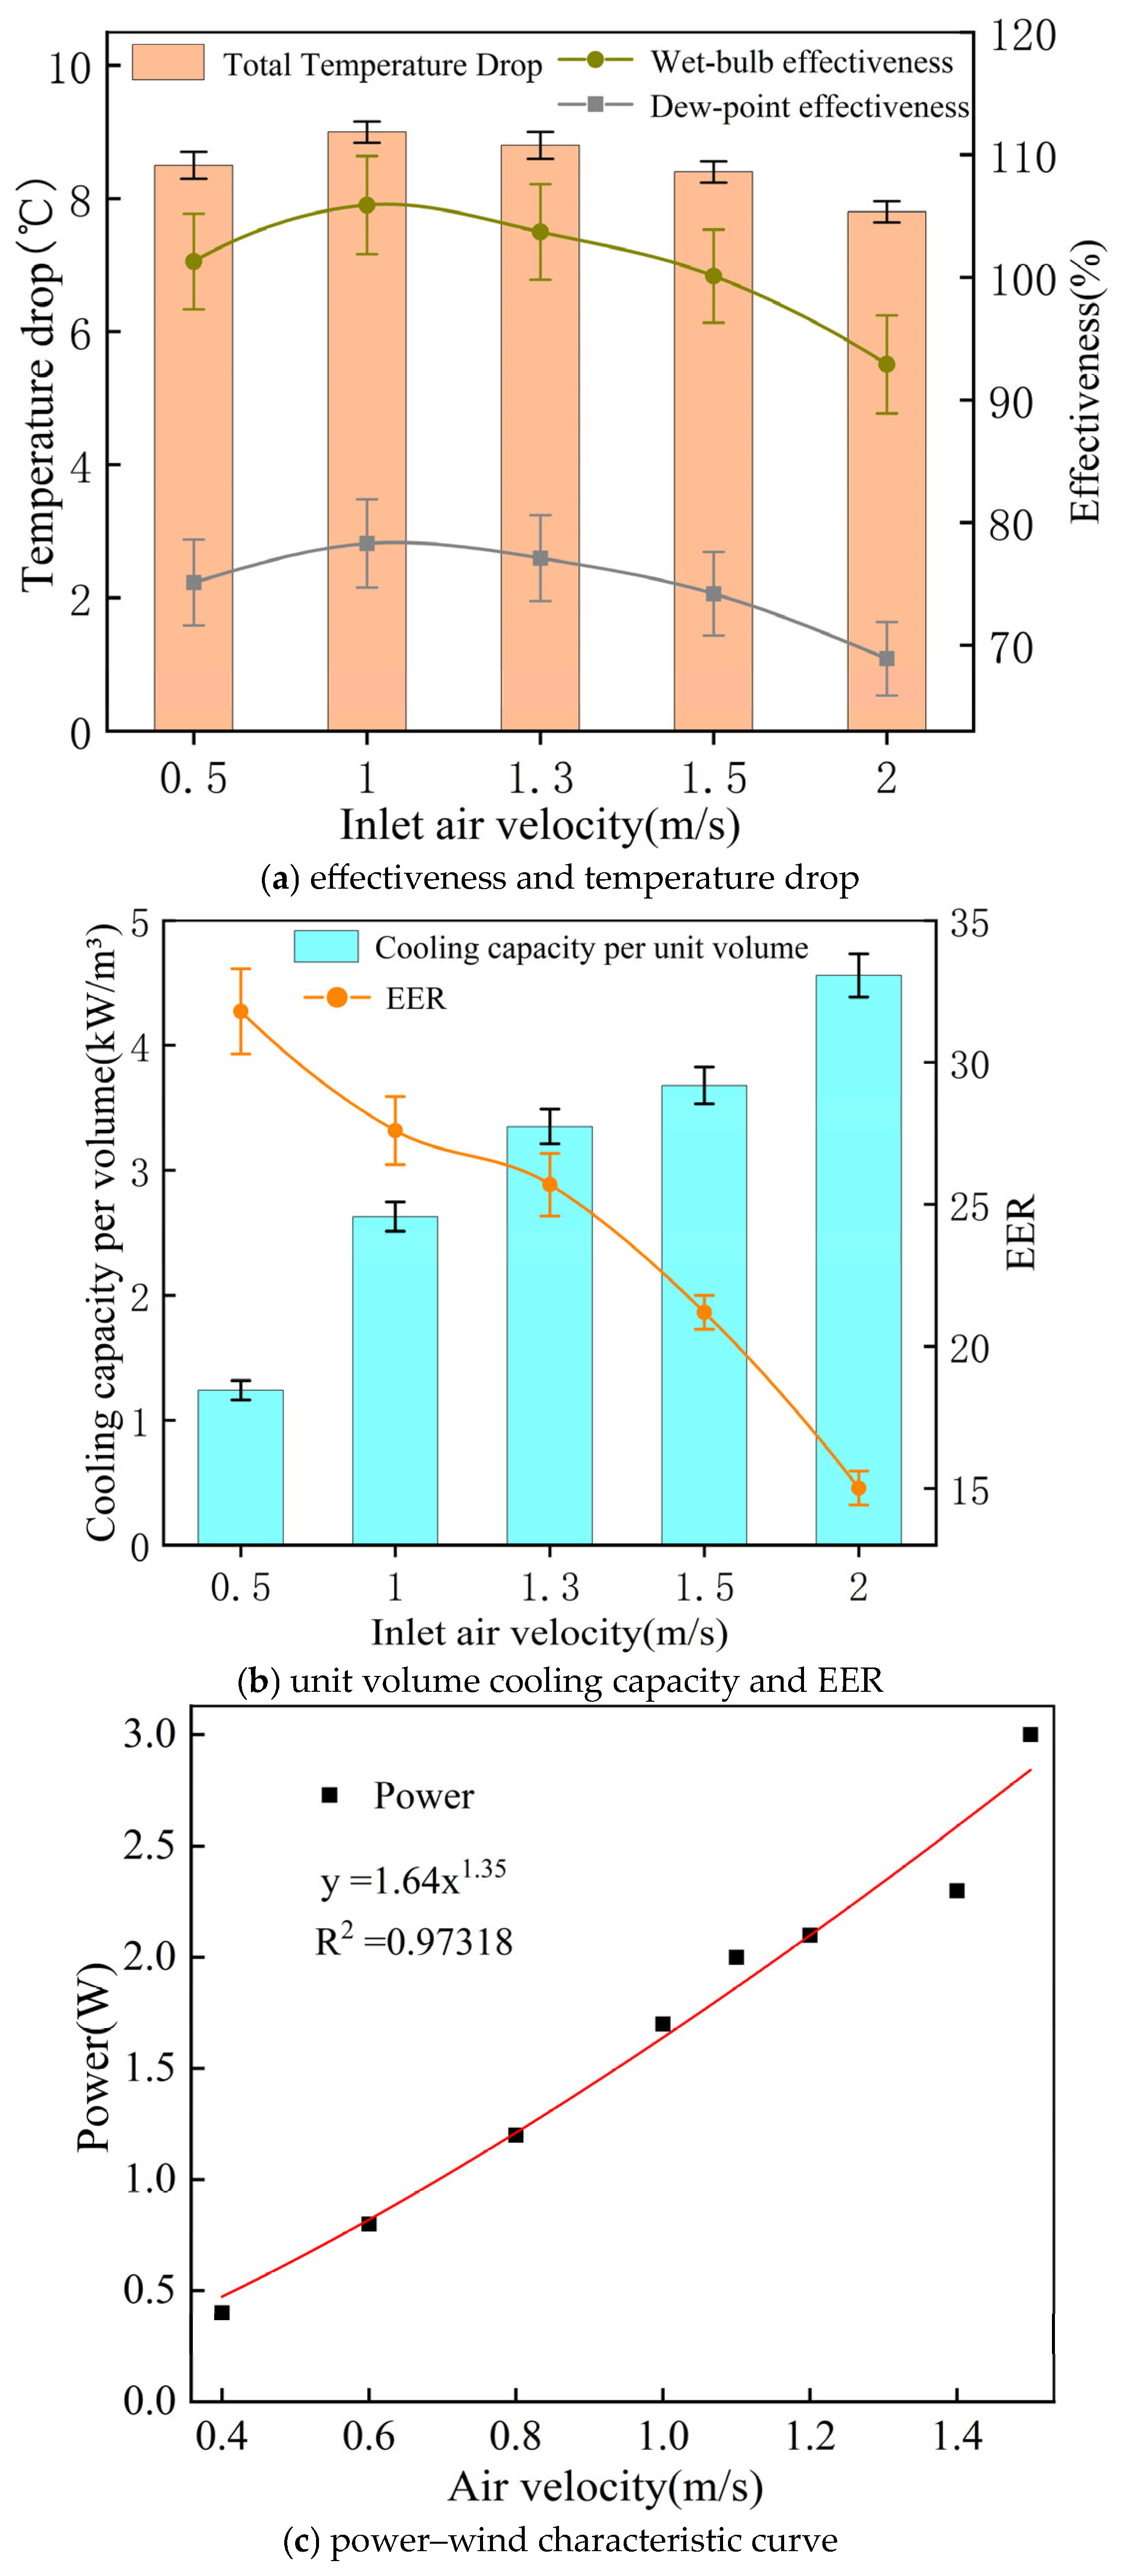
Figure 10 illustrates the effectiveness, cooling capacity per unit volume, and EER of the cooler under different inlet air velocities. The overall temperature drop is influenced by the synergistic effects of residence time and convective heat transfer coefficient. As shown in Figure 10a, when the air velocity increases from 0.5 m/s to 1.0 m/s, the unit’s total temperature drop rises slightly from 8.5 °C to a peak of 8.9 °C before gradually decreasing. When the air velocity is 2.0 m/s, the total temperature drop falls to 7.8 °C, representing a 12.3% decrease. Wet-bulb effectiveness and dew-point effectiveness also exhibit a trend of first increasing and then decreasing, with the optimal air velocity range being 1.0–1.5 m/s, reaching peak values of 105.9% and 78.3%, respectively. Figure 10b illustrates the effects of inlet air velocity on the cooling capacity per unit volume and the energy efficiency ratio (EER). When air velocity increases from 0.5 m/s to 2.0 m/s, the cooling capacity per unit volume rises significantly from 1.25 kW/m3 to 4.56 kW/m3. The linear increase in mass flow rate exceeds the decrease in total temperature drop at high air velocities, resulting in enhanced cooling capacity. However, the power consumption of axial fans is proportional to the 1.35th power of air velocity, with energy consumption rising more rapidly as air velocity increases, as shown in Figure 10c. This causes the system’s EER to decrease from 31.8 to 15.1.
Figure 10.
Performance of prototype versus inlet air velocity: (a) effectiveness and temperature drop; (b) unit volume cooling capacity and EER; (c) power–wind characteristic curve.
Research indicates that, within segmented dew-point evaporative cooling systems, air velocity ranging from 1.0 to 1.5 m/s can achieve the optimal balance between performance and economic efficiency. Within this range, the equipment not only maintains wet-bulb operation with effectiveness >100% but also controls the energy efficiency ratio within a highly efficient and economical range (EER 21–27). Therefore, to balance cooling performance and energy consumption, the air velocity within the channel must be maintained within a specific range. While the unit exhibits high cooling effectiveness within this range, its cooling capacity remains relatively limited. To address this limitation in practical applications, a modular design approach can be adopted. By increasing the number of parallel modules, a linear increase in total cooling capacity can be achieved while ensuring the high efficiency and energy savings of each individual module.
5.2. Effect of Working-to-Intake Air Mass Ratio
5.2.1. Thermal–Moisture Distribution in the Channels Under Different Air Mass Ratios
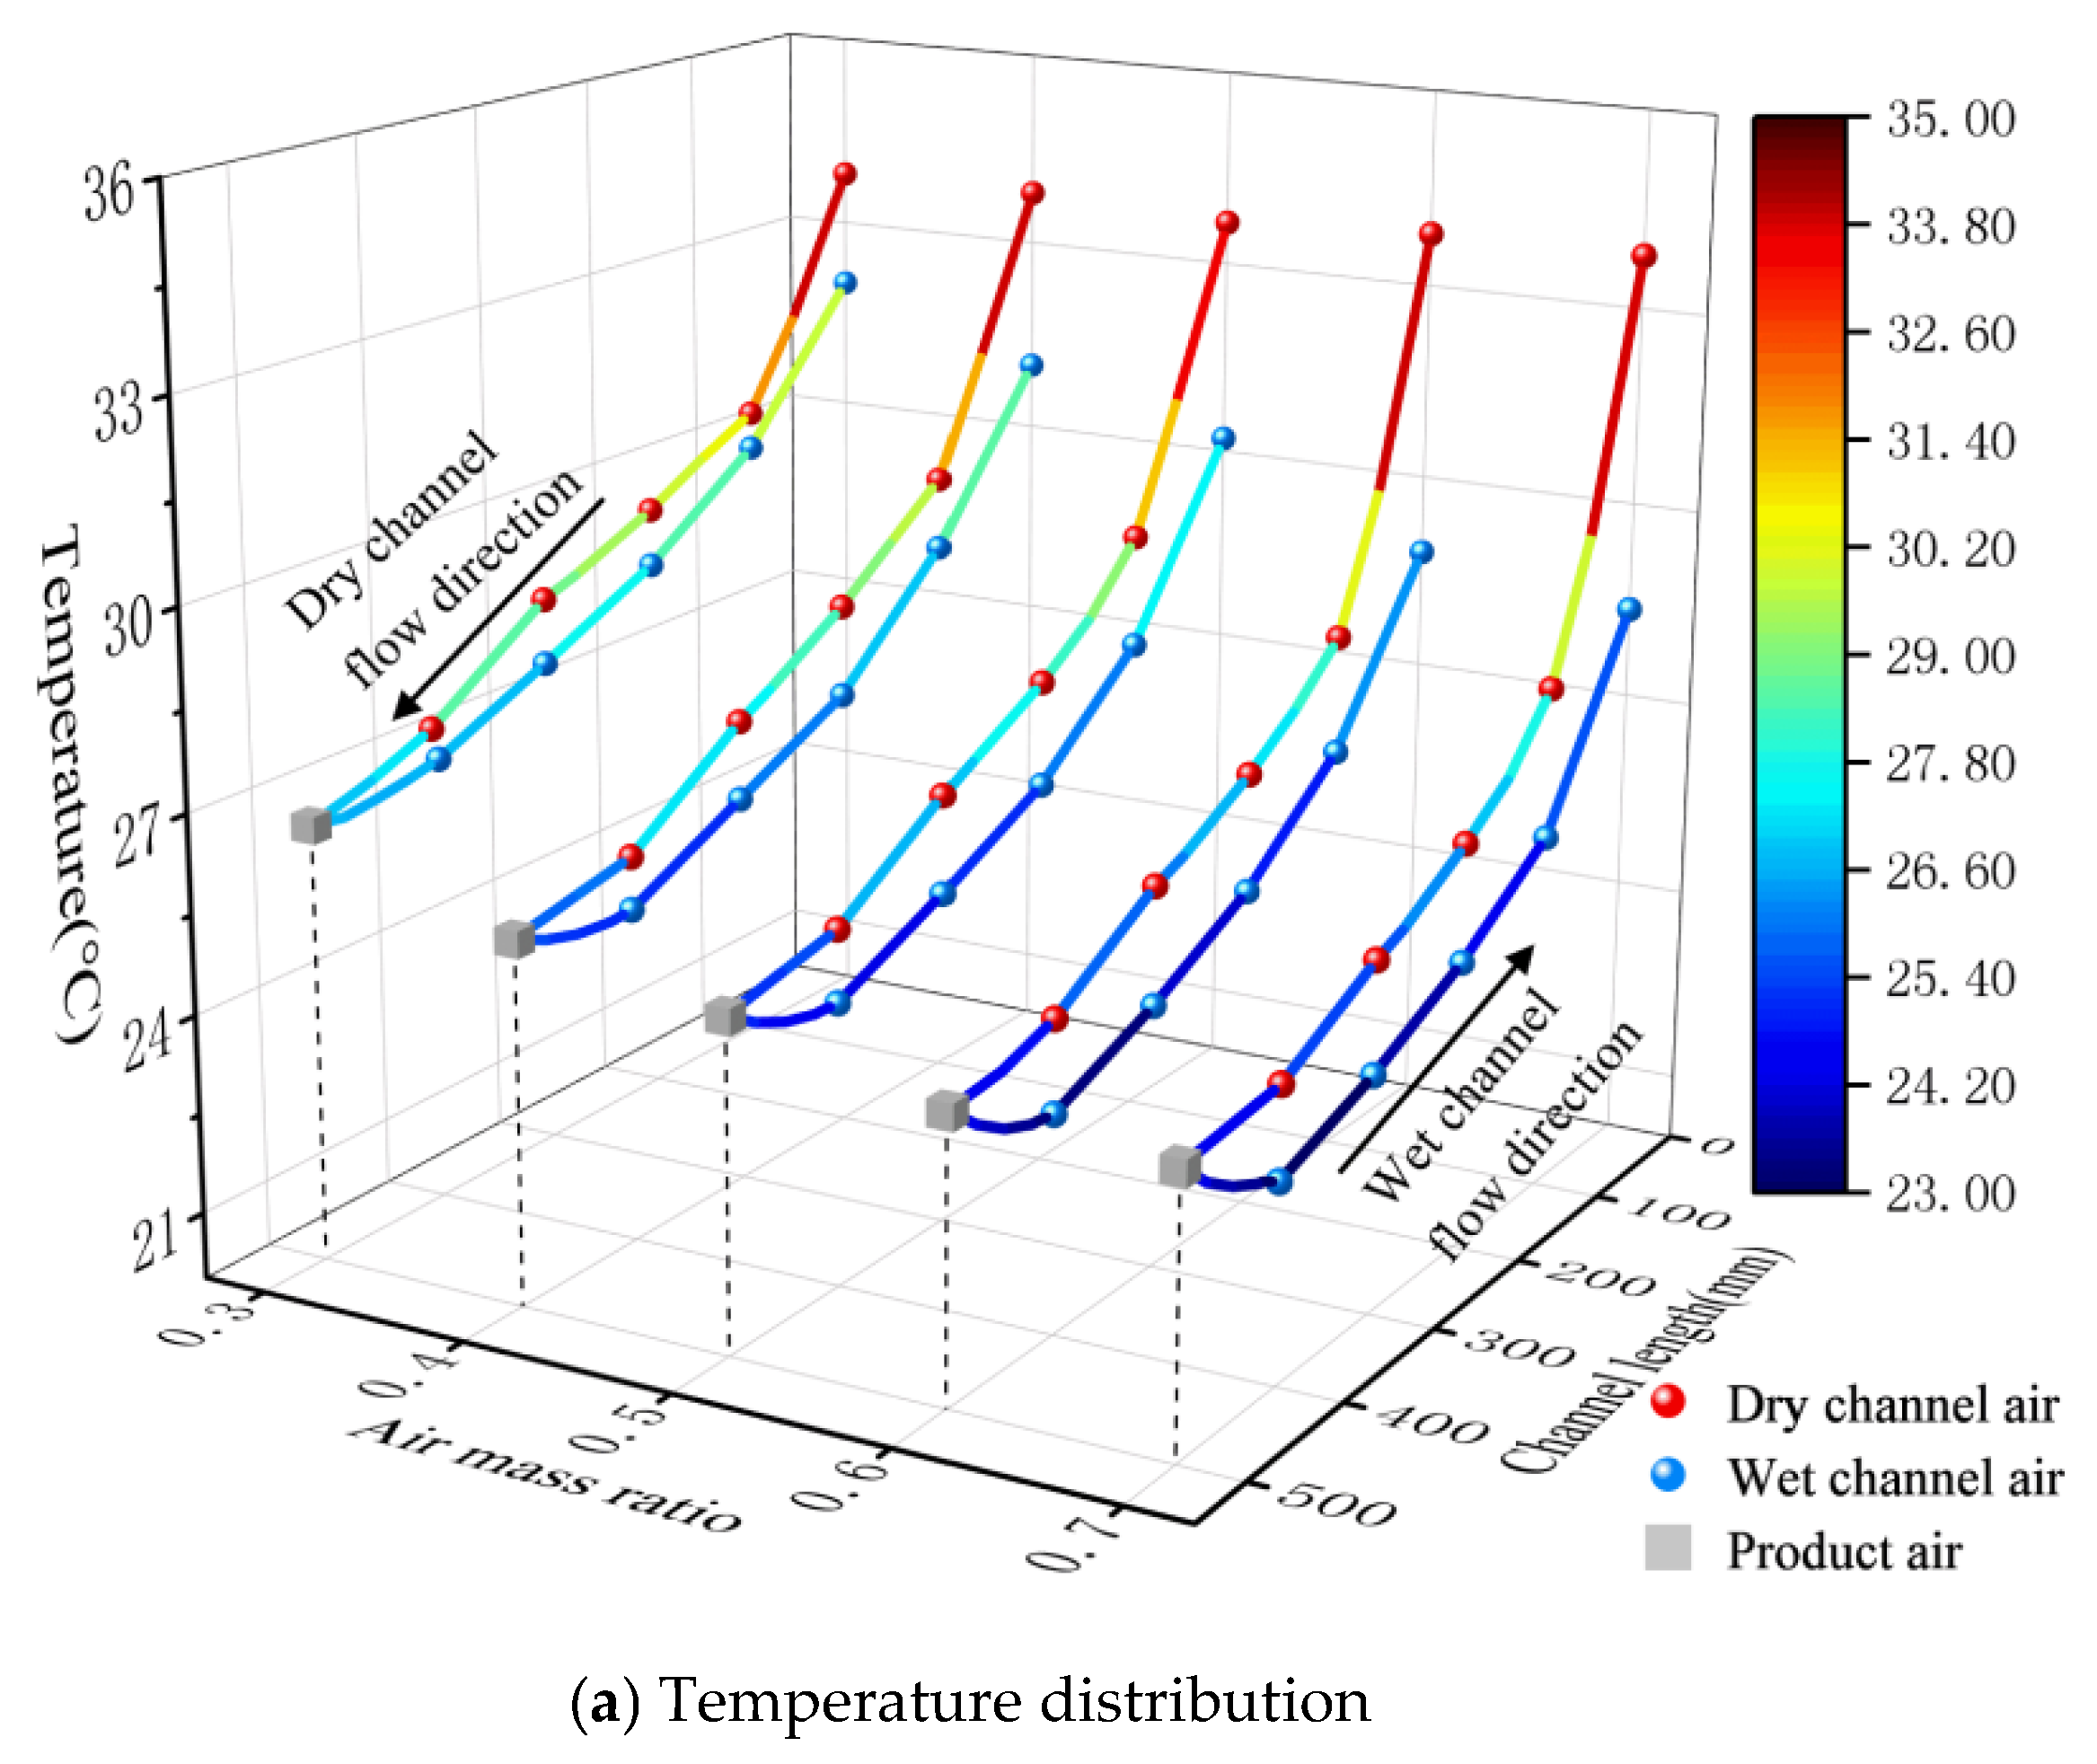
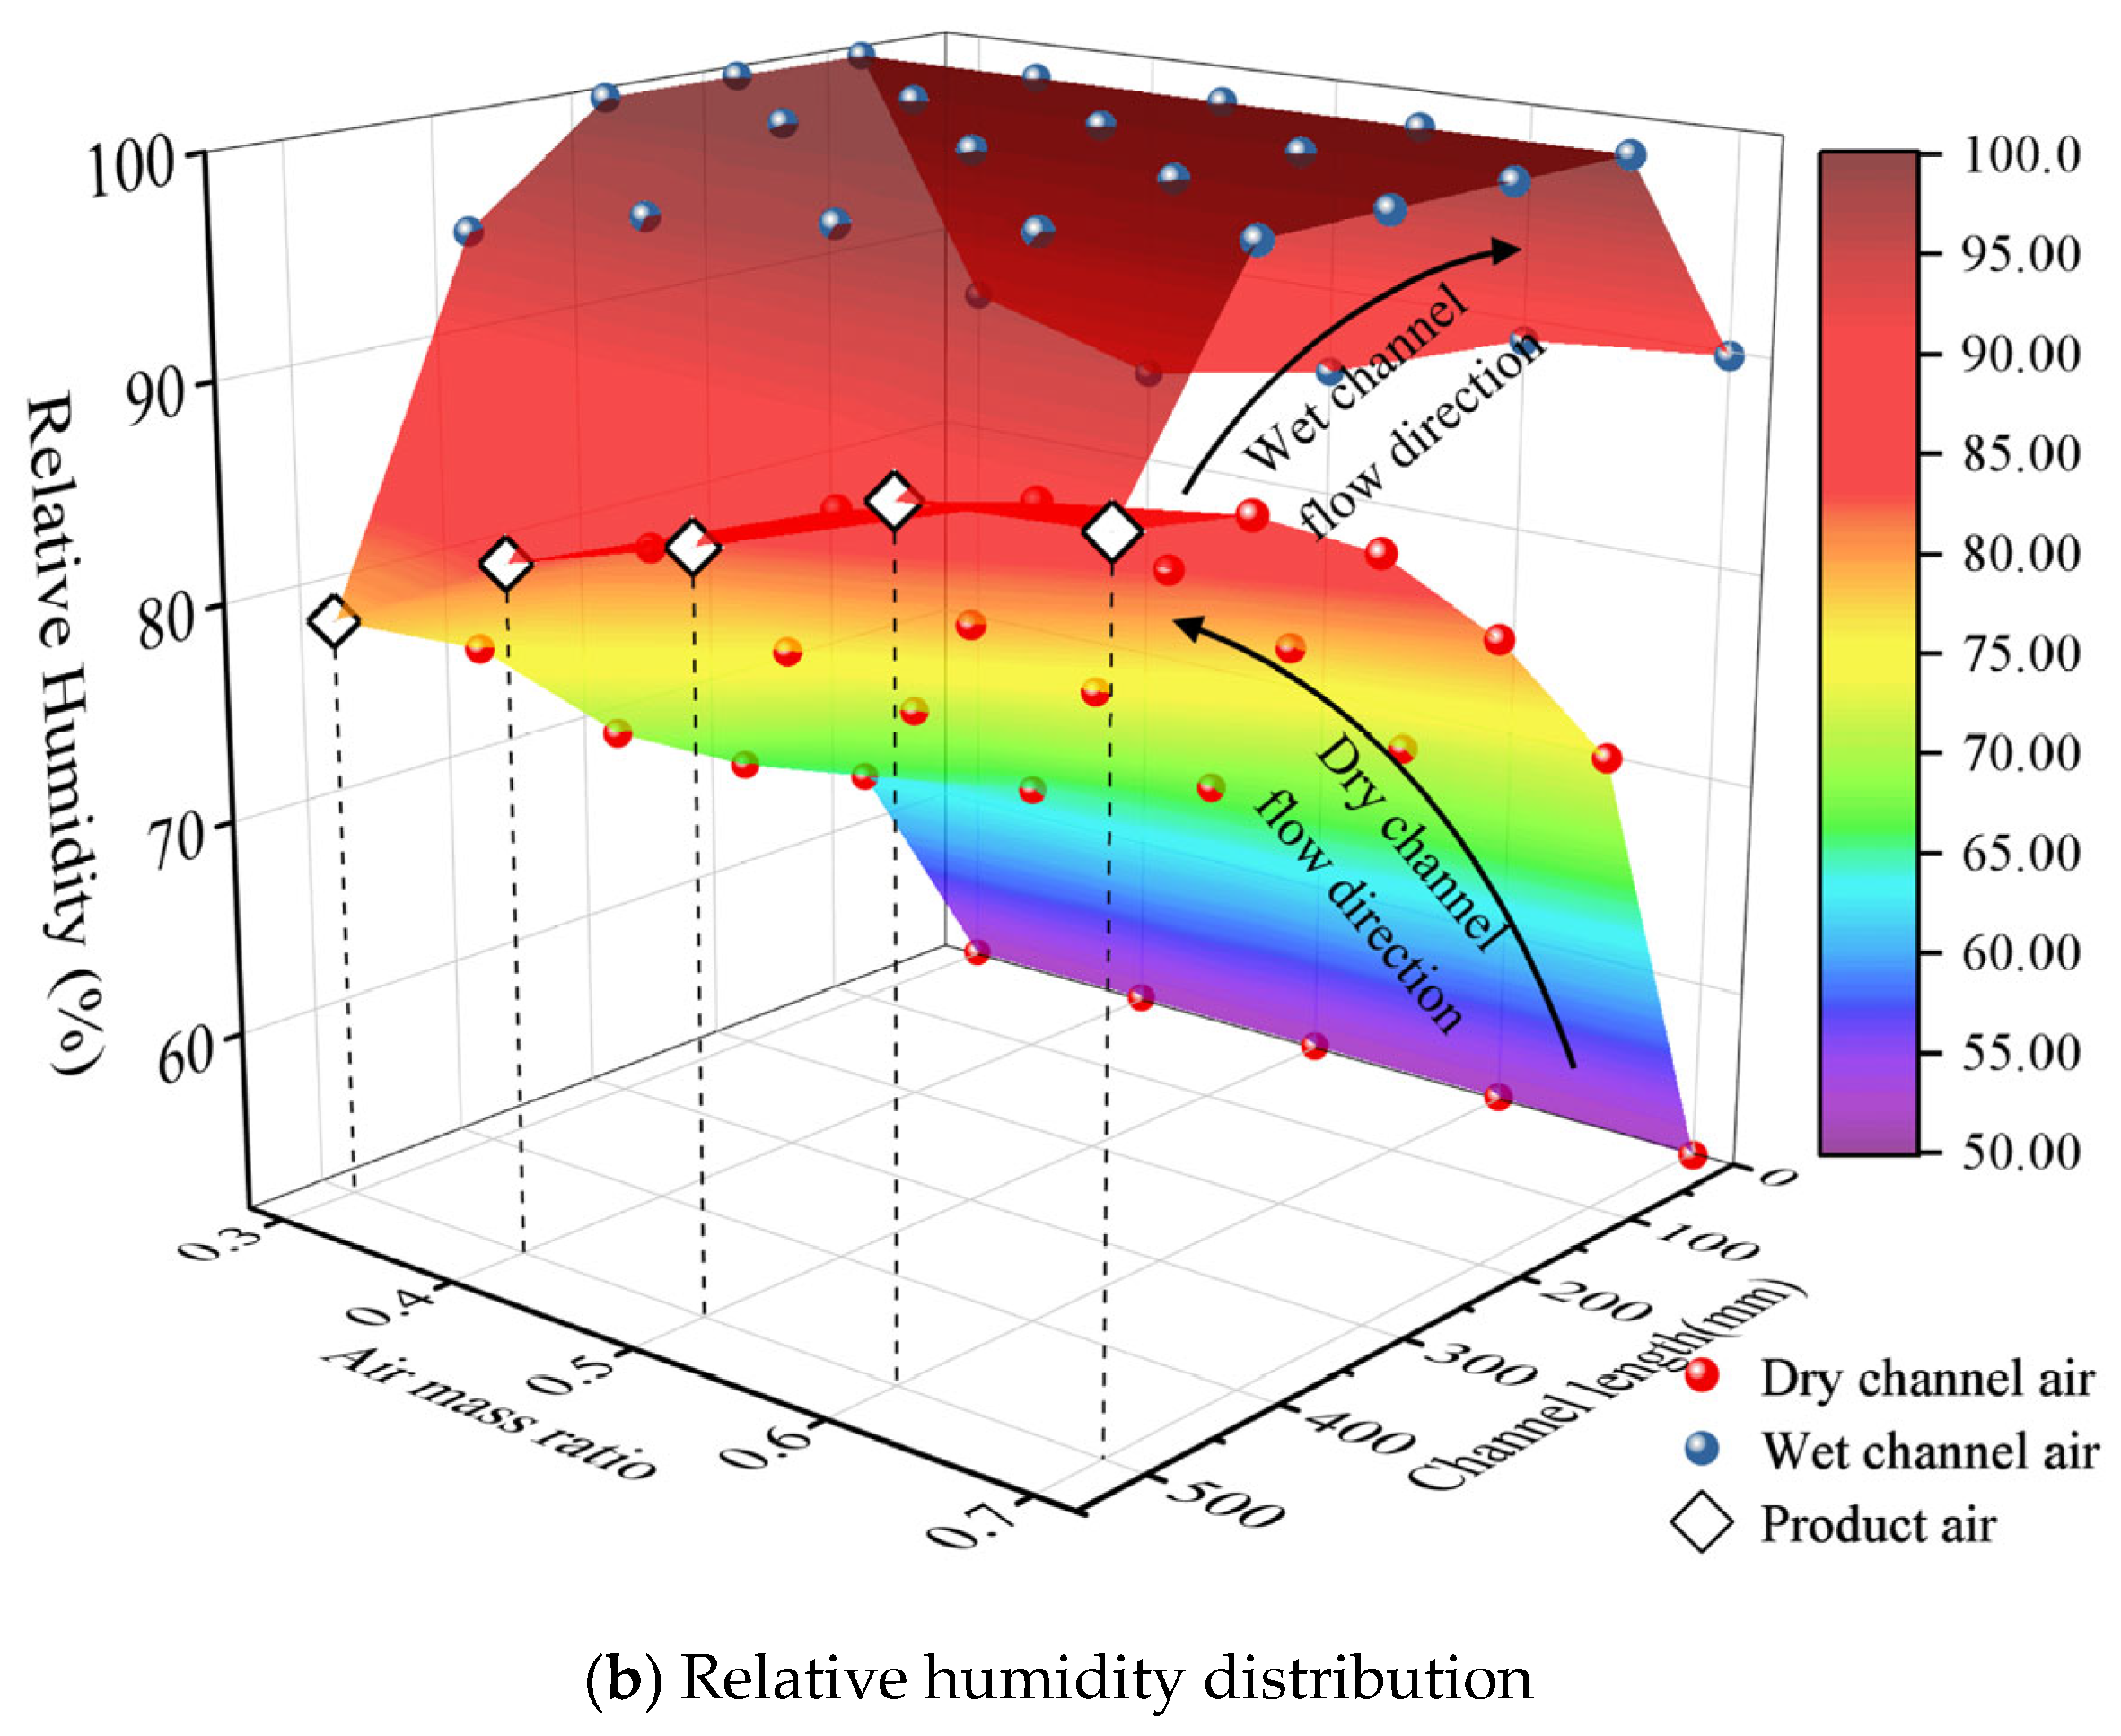
Figure 11 illustrates the fitted distribution of temperature and humidity under different air mass ratios. The working-to-intake air mass ratio (AMR) does not alter the primary air velocity, so it does not significantly alter the trend of temperature and humidity changes along the dry channel. However, increasing the AMR enhances the sensible heat recovery effect in the sensible heat exchange section (0–100 mm). As shown in Figure 11a, the temperature drop in the sensible heat section increases from 3.7 °C to 6.1 °C, representing a 64.8% improvement. This is attributed to the fact that a higher AMR increases the heat capacity of the secondary air while simultaneously enhancing the fin-induced disturbance in the secondary airflow, thereby increasing the logarithmic mean temperature difference and improving heat transfer efficiency. Comprehensive analysis of the temperature distribution shows that the sensible heat section’s contribution to the total temperature drop is primarily concentrated between 49.4% and 55.1%, highlighting the advantage of the segmented design in recovering sensible heat at the wet-channel outlet.
Figure 11.
(a) Temperature distribution and (b) Relative humidity distribution with the different air mass ratios.
Temperatures at various measurement points within the wet channel generally show a downward trend, as shown in Figure 11b. As the AMR increased from 0.3 to 0.7, the temperature at the 500 mm point of the wet channel decreased from 26.6 °C to 24.2 °C, while at the 0 mm point, it drops from 32.1 °C to 28.4 °C, representing an average reduction of approximately 2–4 °C. The increase in AMR enhances evaporation and heat capacity, improves heat transfer efficiency, and results in a downward shift of the temperature curve for the wet channel. The impact of AMR on relative humidity is primarily observed at the boundary. Specifically, increased AMR enhances the cooling effect in the dry channel, causing the relative humidity at the wet-channel inlet (500 mm position) to rise from 78.7% to 90%. When secondary air flows through the sensible heat recovery section (100–0 mm) at the outlet of the wet channel, desaturation generally occurs due to continuous heat absorption while the absolute humidity remains constant.
5.2.2. Performance Parameters Under Different Air Mass Ratios
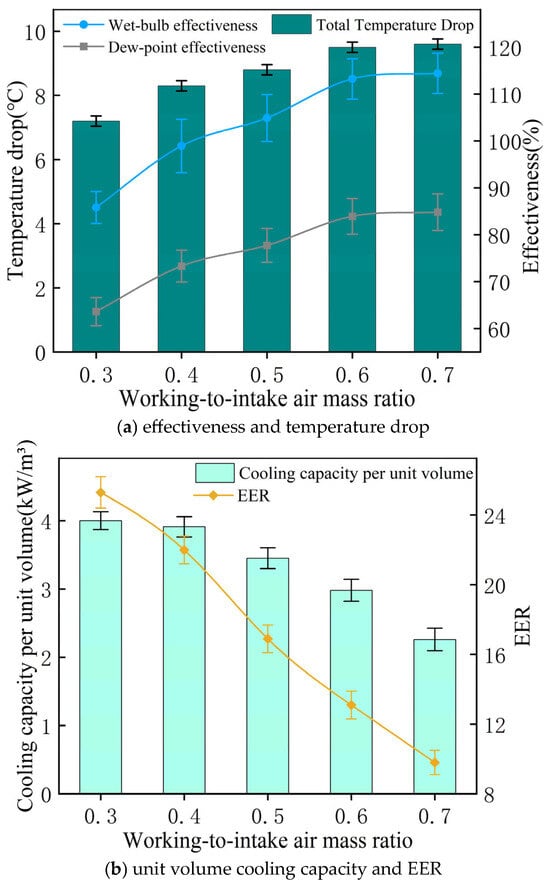
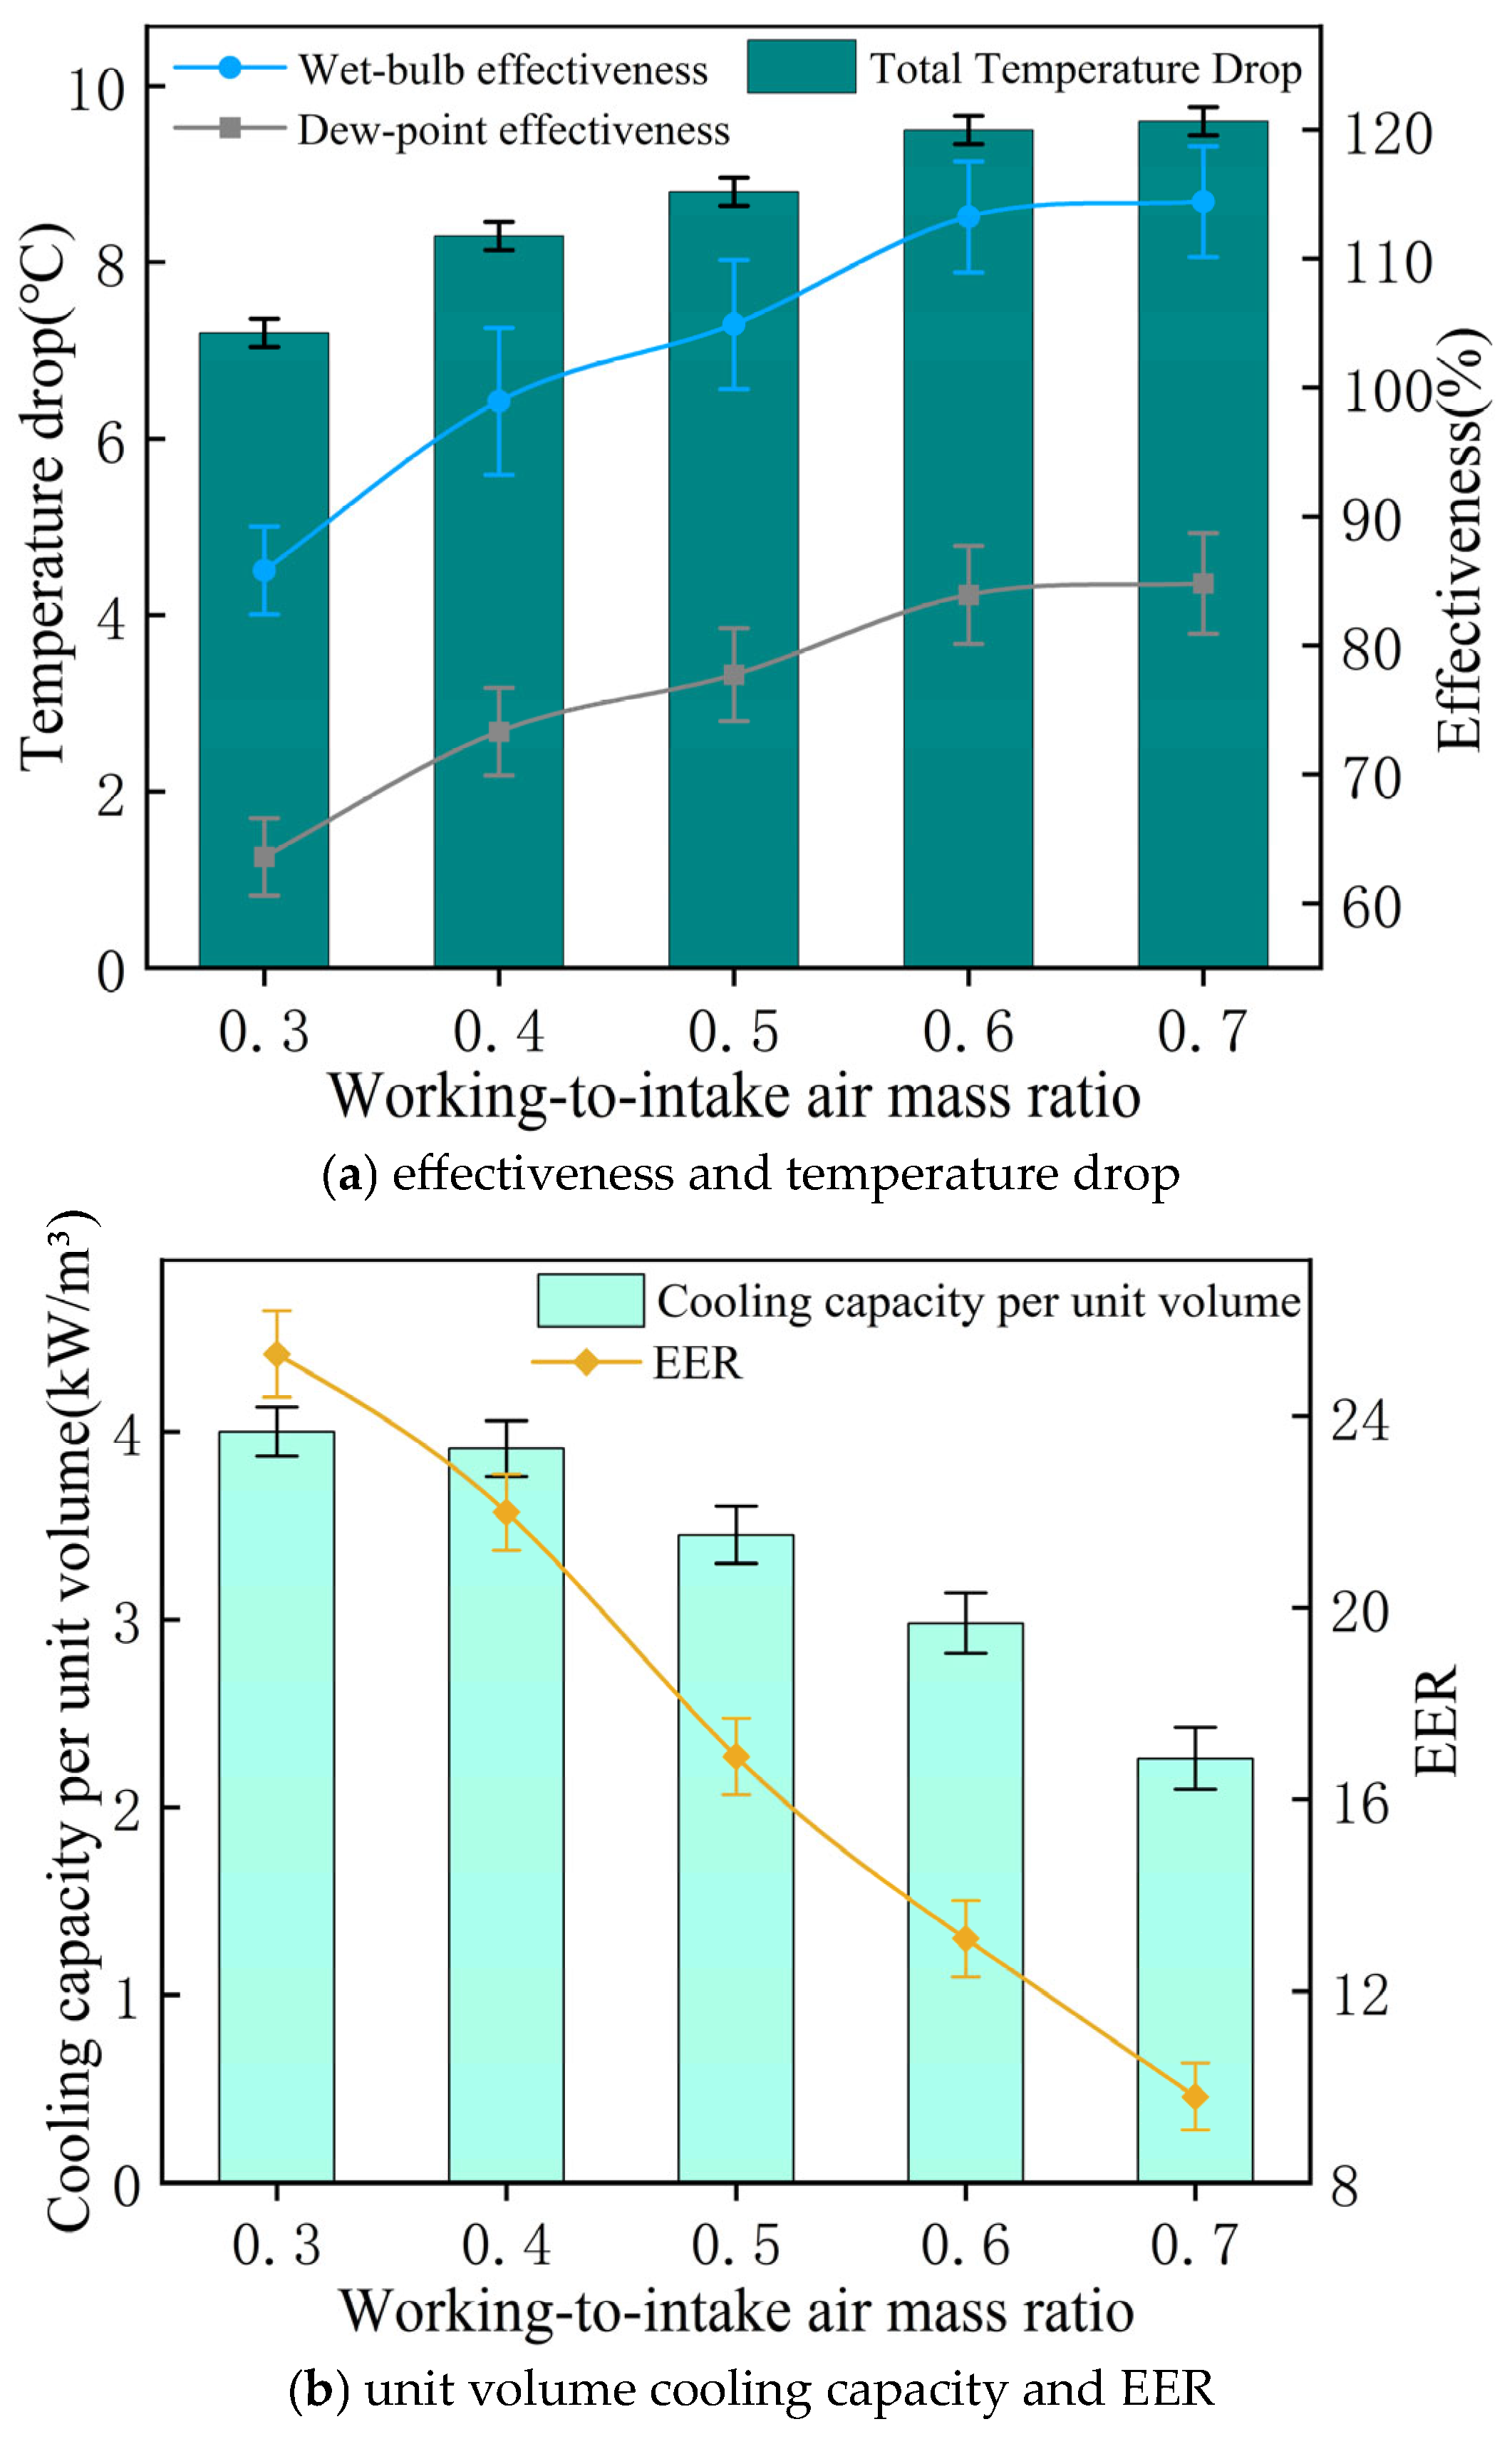
The temperature drops and effectiveness of the unit increase monotonically with the air mass ratio (AMR). As shown in Figure 12a, when the AMR increases from 0.3 to 0.7, the total temperature drop of the primary air rises from 7.2 °C to 9.6 °C, corresponding to a 33.3% enhancement. The wet-bulb effectiveness increases from 85.8% to 114.4%, and the dew-point effectiveness rises from 63.6% to 84.8%. However, the growth rate of effectiveness has slowed down with increasing AMR. When the AMR increases from 0.6 to 0.7, the wet-bulb effectiveness only marginally rises from 113.2% to 114.4%. The high air mass ratio achieves deep cooling but also drives the secondary air inlet humidity close to saturation, weakening the mass transfer driving force and causing the performance gain to exhibit diminishing marginal returns that ultimately approach the limit under these operating conditions.
Figure 12.
Performance of prototype versus working-to-intake air mass ratio: (a) effectiveness and temperature drop; (b) unit volume cooling capacity and EER.
As shown in Figure 12b, both the cooling capacity per unit volume and the EER decrease as the AMR increases. The cooling capacity per unit volume decreases from 3.95 kW/m3 to 2.26 kW/m3, representing a reduction of 42.8%. EER dropped from 25.3 to 9.8, resulting in an effectiveness loss of nearly 61.2%. The increase in AMR causes the reduction in product air mass flow to outweigh the increase in enthalpy drop, resulting in reduced cooling capacity. The decrease in EER is caused by the dual negative effects of diminished cooling capacity and elevated fan power consumption. While increasing the AMR enables deeper cooling and higher effectiveness, it comes at the expense of cooling capacity and EER. It is recommended to operate the AMR within the range of 0.4 to 0.5 to achieve both superior wet-bulb cooling performance and high operational efficiency.
5.3. Effect of Inlet Air Wet-Bulb Depression
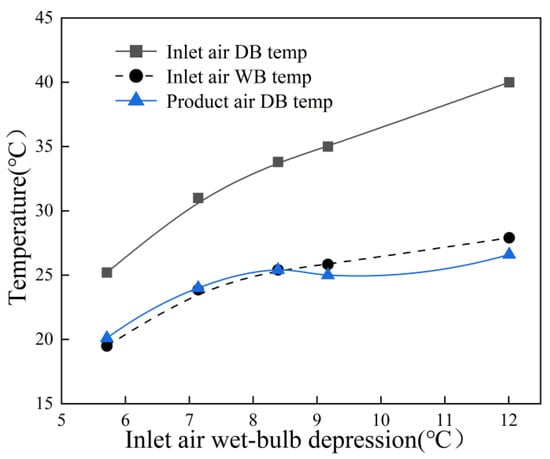
Keeping the inlet air velocity at 1.5 m/s and the air mass ratio at 0.44, the input power to the electric heater is increased to enlarge the inlet wet-bulb depression, defined as the temperature difference between the dry bulb and wet bulb [31]. Consequently, the inlet dry-bulb and wet-bulb temperatures increase from 25.2 to 40 °C and 19.5 to 27.9 °C, respectively. Figure 13 presents five experimental sets of intake air and product air temperatures measured as the inlet dry–wet-bulb temperatures increased, with the inlet air velocity fixed at 1.5 m/s and the working-to-inlet air mass ratio at 0.44. The product air dry-bulb temperature rises by 32.3% from 20.1 to 26.6 °C as the inlet wet-bulb depression expands from approximately 5.6 to 12.1 °C.
Figure 13.
Product and inlet air temperature variations with increasing inlet wet-bulb depression.
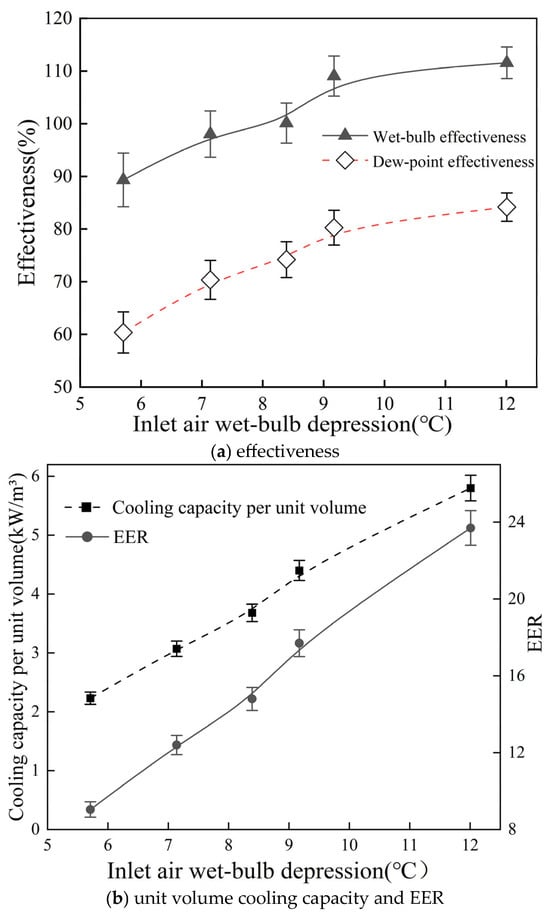
As shown in Figure 14a, the cooler effectiveness increases progressively with increasing inlet air wet-bulb depression. When the temperature difference increases from 5.6 °C to 12.1 °C, the wet-bulb effectiveness rises from 89.3% to 111.5% and the dew-point effectiveness increases from 60.4% to 84.2%, corresponding to increases of 19.9% and 28.2%, respectively. Primarily due to the increased difference between dry-bulb and wet-bulb temperatures, the inlet air tends to become drier, leading to an increase in the saturated vapor pressure gradient between the air and the water film surface. This increase effectively enhances the heat and mass transfer process, thereby improving cooling efficiency. As shown in Figure 14b, the unit’s cooling capacity and EER increase with rising dry–wet-bulb temperature difference of the inlet air. The cooling capacity per unit volume rises from 2.2 kW/m3 to 5.8 kW/m3, while the EER increases from 9.1 to 23.7. This is because, with the inlet air velocity and working-to-intake air mass ratio held constant, the mass flow rate of the product air remains constant and the fan power consumption changes only marginally. It is worth noting that when the wet-bulb depression exceeds 9.2 °C, the improvement in cooling effectiveness becomes less pronounced. This is mainly because the product air temperature approaches the thermodynamic limit imposed by the inlet air dew-point temperature. Thus, further increasing the inlet wet-bulb depression yields only a marginal additional decrease in the outlet temperature. Overall, the cooler exhibits superior performance with a large wet-bulb depression, i.e., under hot and dry climates.
Figure 14.
Performance of prototype versus inlet wet-bulb depression: (a) effectiveness, (b) unit volume cooling capacity and EER.
5.4. Comparison with Previous Studies
The parameters and performance of the dew-point cooler developed in this study were compared with previous similar studies [21,31,32], as shown in Table 6. All four studies employed experimental methods with similar intake parameters. However, differences exist in terms of channel length, channel structure, and water supply methods. Xu [21], Duan [31], and Xu [32] all employed longer single-channel designs with spray water supply systems, whereas this study utilizes shorter segmented channels combined with a pump-free self-wicking water supply system. Compared to Xu’s work [21], the cooler proposed in this study exhibits similar product air temperature and slightly higher dew-point efficiency. Compared with the study of Duan [31], the present system achieves higher wet-bulb effectiveness and EER, mainly due to the pumpless design, which eliminates the power consumption of the water pump and auxiliary equipment, and the short-channel configuration, which reduces pressure drop and fan power demand. In comparison, Xu et al. [32] removed the channel support baffles and adopted a corrugated heat transfer surface with an intermittent water supply, achieving higher cooling efficiency and EER, but with a longer channel length. Although differences in test conditions may exist among the studies, the comparison still indicates the considerable potential of the segmented design in terms of achieving high efficiency, compactness, and energy savings.
Table 6.
Comparative analysis with previous studies.
6. Discussion
This study proposes and experimentally validates, for the first time, the feasibility of a novel segmented heat-exchanging dew-point cooler. The experimental results not only confirm the technical viability of the pumpless design but also demonstrate the unit’s superior cooling performance. Although these preliminary findings are promising, several limitations warrant further discussion:
(1) For broader applicability, the 400 + 100 mm segmentation should be adapted to local climate conditions—specifically, the segmentation point should be advanced in humid regions and extended in drier environments to account for variations in air saturation characteristics. To quantify this behavior, future work will develop design correlations that express the lengths required for saturation and sensible heat recovery as functions of inlet conditions, channel geometry, and material properties.
(2) The long-term capillary performance of the porous fibers may degrade due to dust accumulation, biological contamination, and mineral scaling. To enhance system durability, future designs should integrate air filtration, antimicrobial treatments, and water softening mechanisms. Moreover, quantifying water consumption per kWh during sustained operation is essential to refine the overall performance evaluation framework.
(3) Future research will establish a segmented ε-NTU model and conduct sensitivity analyses. Subsequent outdoor testing under diverse climatic conditions will be conducted to construct a climate applicability map, thereby facilitating cross-regional deployment of the technology.
7. Conclusions
A dew-point evaporative air cooler with segmented heat exchange is proposed. The wet channel is divided into two distinct heat exchange stages, and the capillary water-wicking capability of porous materials is utilized to replace conventional mechanically sprayed water supply systems. First, the long-term wetting stability of the moisture-conducting fibers under self-wicking conditions is experimentally evaluated. Subsequently, the effects of various operating parameters on the heat and moisture distributions within the unit channels and on the overall cooling performance are systematically investigated. The main experimental results are as follows:
(1) Under capillary-driven (self-wicking) water supply, the horizontally placed porous fibers remained uniformly wetted during 2 h of dynamic evaporation, with no dry patches observed. The maximum fluctuation in the outlet air temperature was only 0.3 °C, indicating stable and reliable operation.
(2) Within the tested parameter range, a prototype device achieved a maximum wet-bulb effectiveness of 114.4% and a maximum dew-point effectiveness of 84.8%, with an energy efficiency ratio (EER) ranging from 9.1 to 31.8.
(3) The air-to-air sensible heat transfer in the sensible heat exchange section achieves a maximum temperature drop of 0.6 °C/cm attributed to the combined effects of fin disturbance and reduced thermal resistance from hydrophilic materials. This demonstrates significant sensible heat recovery capacity and provides guidance for optimizing the channel length.
(4) The segmented heat exchange enhancement design creates a synergistic mechanism of “rapid cooling followed by sustained heat exchange.” Under moderate humidity conditions, it achieves a maximum temperature drop of 9.6 °C while reducing plate material usage by approximately 15.4%, offering a compact and energy-efficient cooling solution for future residential buildings.
Future research will focus on the long-term durability of porous fibers and address key issues such as specific water consumption (L/kWh), development of ε-NTU models, and construction of climate applicability maps to support broader implementation in practical applications.
Author Contributions
Conceptualization, P.X.; methodology, P.X. and J.S.; writing—original draft preparation, J.S.; writing—review and editing, P.X.; experimenting, J.S. All authors have read and agreed to the published version of the manuscript.
Funding
This research received no external funding.
Data Availability Statement
The original contributions presented in this study are included in the article. Further inquiries can be directed to the corresponding author.
Acknowledgments
The authors would like to express gratitude to Beijing University of Civil Engineering and Architecture for providing the research site and facilities support.
Conflicts of Interest
The authors declare no conflicts of interest.
Abbreviations
The following abbreviations are used in this manuscript:
| DB | dry bulb, °C |
| DP | dew point, °C |
| WB | wet bulb, °C |
| EER | energy efficiency ratio |
| DPEC | dew-point evaporative cooling |
| AMR | air mass ratio |
| RH | relative humidity, % |
| IEC | indirect evaporative cooling |
| cooling capacity, W | |
| wet-bulb effectiveness, % | |
| dew-point effectiveness, % |
References
- She, X.; Cong, L.; Nie, B.; Leng, G.; Peng, H.; Chen, Y.; Zhang, X.; Wen, T.; Yang, H.; Luo, Y. Energy-efficient and-economic technologies for air conditioning vapor compression refrigeration: A comprehensive with review. Appl. Energy 2018, 232, 157–186. [Google Scholar] [CrossRef] [Scilit]
- Baakeem, S.S.; Orfi, J.; Mohamad, A.A. Investigations of geometrical and operational aspects of a dew-point air-cooling system (M-cycle). J. Build. Eng. 2021, 36, 102117. [Google Scholar] [CrossRef] [Scilit]
- Chen, Y.; Huang, X.; Sun, T.; Chu, J. Experimental study of plant fiber-polymer composite for indirect evaporative cooler application. Appl. Therm. Eng. 2021, 199, 117543. [Google Scholar] [CrossRef] [Scilit]
- Lai, L.; Wang, X.; Kefayati, G.; Hu, E. Analysis of a novel solid desiccant evaporative cooling system integrated with a humidification-dehumidification desalination unit. Desalination 2023, 550, 116394. [Google Scholar] [CrossRef] [Scilit]
- Xiao, X.; Liu, J. A state-of-art review of dew point evaporative cooling technology and integrated applications. Renew. Sustain. Energy Rev. 2024, 191, 114142. [Google Scholar] [CrossRef] [Scilit]
- Liu, Y.; Akhlaghi, Y.G.; Zhao, X.; Li, J. Experimental and numerical investigation of a high-efficiency dew-point evaporative cooler. Energy Build. 2019, 197, 120–130. [Google Scholar] [CrossRef] [Scilit]
- Chen, Z.; Zhao, W.; Wang, B.; Huang, L.; Ding, J.; Cheng, G.; Bui, D. A first-of-its-kind two-stage dew-point evaporative cooler with high energy efficiency and compact design. Energy Convers. Manag. 2025, 341, 120090. [Google Scholar] [CrossRef] [Scilit]
- Liu, X.; Jing, C.; Li, Y.; Lu, S. Study on performance of perforated dew point indirect evaporative coolers. Sci. Rep. 2025, 15, 939. [Google Scholar] [CrossRef] [Scilit]
- Sulaiman, M.A.; Saber, H.A.; Hasan, H.F.; Benim, A.C. Experimental and numerical investigation of novel dew-point evaporative cooler with shell and tube design. Energy 2025, 317, 134686. [Google Scholar] [CrossRef] [Scilit]
- Castillo-González, J.; Comino, F.; Navas-Martos, F.J.; de Adana, M.R. Manufacturing and experimental analysis of a dew-point indirect evaporative cooler using fused deposition modelling 3D printing and polymeric materials. Appl. Therm. Eng. 2023, 230, 120683. [Google Scholar] [CrossRef] [Scilit]
- Jiang, S.; Huang, X.; Chu, J.; Dai, C.; Liang, K.; Zhao, Y. Experimental study on the performance of a double countercurrent dew-point indirect evaporative cooler. Fluid Mach. 2024, 52, 8–15. (In Chinese) [Google Scholar]
- Xu, P.; Ma, X.; Zhao, X.; Fancey, K.S. Experimental investigation on performance of fabrics for indirect evaporative cooling applications. Build. Environ. 2016, 110, 104–114. [Google Scholar] [CrossRef] [Scilit]
- Duan, Z.; Kang, J.; Li, J.; Zhao, X. Simulation for the thermal performance of super-hydrophilic fabric evaporative cooling roof based on experimental results. J. Build. Eng. 2022, 52, 104377. [Google Scholar] [CrossRef] [Scilit]
- Duan, Z.; Shan, K.; Li, Y.; Kang, J. Field and theoretical evaluation of the thermal performance of evaporative cooling porous fibre roofs. Build. Environ. 2025, 270, 112551. [Google Scholar] [CrossRef] [Scilit]
- Chen, Y.; Liu, L.; Yan, H.; Tao, Q.; Fan, Y. Study of a nano-coated hydrophilic polymer for indirect evaporative cooler from wetting, thermal and corrosion resistance performance. Appl. Therm. Eng. 2024, 257, 124180. [Google Scholar] [CrossRef] [Scilit]
- De Antonellis, S.; Joppolo, C.M.; Liberati, P. Performance measurement of a cross-flow indirect evaporative cooler: Effect of water nozzles and airflows arrangement. Energy Build. 2019, 184, 114–121. [Google Scholar] [CrossRef] [Scilit]
- Ma, X.; Zeng, C.; Zhu, Z.; Zhao, X.; Xiao, X.; Akhlaghi, Y.G.; Shittu, S. Real life test of a novel super performance dew point cooling system in operational live data centre. Appl. Energy 2023, 348, 121483. [Google Scholar] [CrossRef] [Scilit]
- Sun, T.; Huang, X.; Chen, Y.; Zhang, H. Experimental investigation of water spraying in an indirect evaporative cooler from nozzle type and spray strategy perspectives. Energy Build. 2020, 214, 109871. [Google Scholar] [CrossRef] [Scilit]
- Shahzad, M.W.; Lin, J.; Bin Xu, B.; Dala, L.; Chen, Q.; Burhan, M.; Sultan, M.; Worek, W.; Ng, K.C. A spatiotemporal indirect evaporative cooler enabled by transiently interceding water mist. Energy 2021, 217, 119352. [Google Scholar] [CrossRef] [Scilit]
- Wang, B.C.; Chen, Z.; You, G.; Ding, J.; Cheng, G.; Bui, T. Performance assessment of a high-efficiency indirect dew-point evaporative cooler through three-dimensional modeling. Energy 2024, 312, 133422. [Google Scholar] [CrossRef] [Scilit]
- Xu, P.; Mu, X.; Chen, H.; Ma, X.; Zhao, X. Experimental and numerical investigation of the temperature and humidity distribution inside the channels for a regenerative indirect evaporative cooler. Appl. Therm. Eng. 2024, 236, 121586. [Google Scholar] [CrossRef] [Scilit]
- Lv, J.; Xu, H.; Zhu, M.; Dai, Y.; Liu, H.; Li, Z. The performance and model of porous materials in the indirect evaporative cooling system: A review. J. Build. Eng. 2021, 41, 102741. [Google Scholar] [CrossRef] [Scilit]
- Duan, Z.; Wang, M.; Dong, X.; Liu, J.; Zhao, X. Experimental and numerical investigation of wicking and evaporation performance of fibrous materials for evaporative cooling. Energy Build. 2022, 255, 111675. [Google Scholar] [CrossRef] [Scilit]
- Yang, C.; Yan, W.; Zhang, Y.; Liu, Y.; Chen, Q.; Cui, X.; Zhang, L. Study on the performance of heat and mass transfer of moisture-conducting fibers for evaporative cooling. Int. J. Heat Mass Transf. 2024, 231, 125862. [Google Scholar] [CrossRef] [Scilit]
- Li, W.-Y.; Li, Y.-C.; Zeng, L.-Y.; Lu, J. Comparative study of vertical and horizontal indirect evaporative cooling heat recovery exchangers. Int. J. Heat Mass Transf. 2018, 124, 1245–1261. [Google Scholar] [CrossRef] [Scilit]
- Xu, P.; Ma, X.; Wang, B.; Zhao, X. A Hot-Pressing Composite Method of Heat Exchange Plate. China CN 110421947 B, 11 January 2022. [Google Scholar]
- Liu, Q.; Guo, C.; Ma, X.; You, Y.; Li, Y. Experimental study on total heat transfer efficiency evaluation of an indirect evaporative cooler. Appl. Therm. Eng. 2020, 174, 115287. [Google Scholar] [CrossRef] [Scilit]
- Lv, J.; Huang, J.; Xu, H.; Xu, T. Research on Performance Evaluation Index of Dew Point Evaporative. J. Refrig. 2021, 42, 126–133. (In Chinese) [Google Scholar]
- Willink, R. An enhanced method for the evaluation of measurement uncertainty. Meas. Sens. 2022, 24, 100373. [Google Scholar] [CrossRef] [Scilit]
- Lv, J.; Xu, H.; Xu, T.; Liu, H.; Qin, J. Study on the performance of a unit dew-point evaporative cooler with fibrous membrane and its application in typical regions. Case Stud. Therm. Eng. 2021, 24, 100881. [Google Scholar] [CrossRef] [Scilit]
- Duan, Z.; Zhan, C.; Zhao, X.; Dong, X. Experimental study of a counter-flow regenerative evaporative cooler. Build. Environ. 2016, 104, 47–58. [Google Scholar] [CrossRef] [Scilit]
- Xu, P.; Ma, X.; Zhao, X.; Fancey, K. Experimental investigation of a super performance dew point air cooler. Appl. Energy 2017, 203, 761–777. [Google Scholar] [CrossRef] [Scilit]

Disclaimer/Publisher’s Note: The statements, opinions and data contained in all publications are solely those of the individual author(s) and contributor(s) and not of MDPI and/or the editor(s). MDPI and/or the editor(s) disclaim responsibility for any injury to people or property resulting from any ideas, methods, instructions or products referred to in the content. |
© 2026 by the authors. Licensee MDPI, Basel, Switzerland. This article is an open access article distributed under the terms and conditions of the Creative Commons Attribution (CC BY) license.