


Abstract
Reducing the cement content of two-component tunnel boring machine (TBM) backfill grouts is constrained by the need for rapid gelation and early strength. This study evaluated pumice as a 10–30 wt.% cement replacement and pumice-based nanosilica (PBNS; 154 m2/g) synthesized from the same pumice; a 2 × 2 factorial design (20 wt.% pumice,1 wt.% PBNS) quantified their interaction. Fresh properties and the 1-, 7- and 28-day uniaxial compressive strength (UCS) were measured, and selected grouts were examined by XRD, FTIR and SEM–EDS. All grouts gelled within 8.1–10.6 s, and pumice reduced bleeding. Pumice caused no detectable 1-day strength loss and, at 20 wt.%, no detectable 28-day loss, but reduced the 7-day strength by 43–49%; PBNS increased the 1-day UCS of the cement-only grout by 40% (1.02 to 1.43 MPa). The pumice × PBNS interaction depended on curing age (p = 0.002): it was antagonistic at day 1 and positive but not significant after multiplicity adjustment at 28 days. The hybrid had the highest mean 28-day UCS (3.15 vs. 2.55 MPa for the control; difference not significant, n = 3). Pumice is thus a promising cement replacement, whereas the effect of PBNS in its presence is age-dependent.
1. Introduction
Tunnel boring machines (TBMs) are widely used to build metro lines, utility tunnels and transport corridors in urban areas. In shield tunneling, the annular gap between the excavated ground and the precast segmental lining must be filled promptly to stabilize the ground, limit surface settlement and groundwater ingress, transfer loads between the ground and the lining, and secure the long-term integrity of the tunnel [1,2,3,4,5,6,7,8].
Backfill grouting is therefore a critical part of TBM operation. During transport and injection, the grout must remain fluid and pumpable while resisting segregation and bleeding; after placement, it must stiffen and gain strength quickly enough to stabilize the lining and remain durable under groundwater and aggressive exposure conditions [9,10,11]. Gelation that is too rapid can obstruct injection, whereas gelation that is too slow can allow grout migration and washout [12,13]. Balancing workability, rapid setting and later-age performance therefore remains the central design problem for backfill materials.
Two-component grouting systems address these competing requirements. Component A is a stable cementitious suspension of water, Portland cement, bentonite, a retarding/stabilizing admixture and, optionally, supplementary cementitious materials (SCMs); it remains pumpable for hours. Component B, usually a sodium silicate solution, is added at the injection point, where the reaction between calcium released by the binder and soluble silicate forms a calcium silicate hydrate-type gel within seconds and provides early support behind the shield tail [9,10,14,15,16].
Cement-rich two-component grouts carry the embodied impacts of Portland cement production, and lowering their cement content without losing early-age performance is an important objective [17]. Fly ash and ground granulated blast furnace slag can improve later-age performance, but their regional and future availability is limited by changes in coal-fired power generation and steel production [10,17]. Particle packing, binder replacement and accelerator chemistry can also be tailored to improve injectability and strength development [14,18].
Natural pumice is a porous volcanic aluminosilicate with a largely amorphous fraction and established pozzolanic reactivity [19,20,21,22]. Its main limitation in applications that require rapid support is slow early-age reactivity, particularly at coarse particle sizes or high replacement levels [21,22,23]. Türkiye holds large pumice reserves [24], which gives local relevance to value-added uses of this mineral.
Nanosilica can offset slow early reactivity: its high specific surface provides nucleation sites for hydration products, contributes a filler effect and supplies reactive amorphous silica that combines with portlandite to form calcium silicate hydrate [25,26,27,28,29]. Additions of about 1–3 wt.% have been reported to shorten setting and increase early strength, including in binders with high SCM contents [23,30,31], whereas higher dosages may increase water demand, agglomeration and workability loss [32,33,34]. Nanosilica has also been used in grouting materials, from colloidal nanosilica for permeation grouting of soils [35,36] to cement-based and cement–sodium silicate grouts [37,38,39].
The individual elements of this approach are established. Nanosilica has been synthesized from pumice by alkaline dissolution and acid precipitation [40,41,42,43]; nanosilica has been combined with pumice in cement pastes, in which 0.5–2 wt.% nanosilica increased the strength of pastes containing 15–20 wt.% pumice [44], in pumice–cement composites reinforced with nanosilica-grafted carbon nanotubes [45] and with other natural pozzolans in mortars [23]; and nanosilica has been used to modify cement-based and cement–sodium silicate grouts [37,38,39]. In a previous conference study, we screened pumice as a partial cement replacement in a two-component backfill grout accelerated with a different commercial accelerator [46]. What has not been examined is how pumice and nanosilica interact in an accelerated two-component grout, in which the sodium silicate of Component B reacts with the calcium released by the binder within seconds, the water-to-binder ratio is about ten times higher than in the pastes studied previously, and early strength is required within hours to days. In particular, it is unclear whether the early-age benefit of nanosilica persists when part of the clinker is replaced by pumice, and whether the interaction between the two additions changes with curing age.
This study addresses this question with a 2 × 2 factorial design (pumice 0 or 20 wt.%, PBNS 0 or 1 wt.%) tested at 1, 7 and 28 days, using a pumice-based nanosilica (PBNS) synthesized from the same pumice, so that a single mineral source supplies both a micro-scale pozzolan and a nano-scale silica additive. We hypothesized that PBNS would compensate for the early-age dilution caused by replacing cement with pumice, whereas pumice would contribute to strength at later ages. Pumice replacement levels of 10, 20 and 30 wt.% were first screened, and the 20 wt.% level was used in the factorial design fresh state properties, compressive strength and deformation behavior were measured and XRD, FTIR and SEM–EDS were used to examine qualitatively whether the mechanical trends were accompanied by changes in phase assemblage, silicate bonding or microstructure. The interaction is quantified as a statistical contrast at each age, and calcium competition between the sodium silicate accelerator and nanosilica is examined as a proposed explanation of the early-age behavior.
2. Materials and Methods
2.1. Materials
Component A consisted of CEM I 42.5 Portland cement (Akçansa, Istanbul, Türkiye), natural pumice powder with a supplier-reported particle size of 35 µm (Omsan Madencilik, Izmir, Türkiye), API-grade bentonite containing approximately 90% montmorillonite (Imerys, Paris, France), laboratory water and a naphthalene-based stabilizing admixture (Eucon NP205). Component B was a sodium silicate solution (Egenat 3203) with a SiO2/Na2O molar ratio (silica modulus) of 3.0, containing 28.3 wt.% SiO2 and 9.7 wt.% Na2O (38 wt.% solids). The specific gravities of the cement, pumice, bentonite, stabilizer, sodium silicate solution and water were 3.10, 2.40, 2.50, 1.08, 1.40 and 1.00, respectively.
The oxide compositions of the cement and pumice determined by X-ray fluorescence (XRF) are given in Table 1. The pumice is dominated by SiO2 (74.82%) and Al2O3 (11.76%); its SiO2 + Al2O3 + Fe2O3 content (88.0%) exceeds the 70% chemical requirement for natural pozzolans in ASTM C618 [47], and its loss on ignition is low (2.8%).
Table 1.
Oxide composition of the cement and natural pumice determined by XRF (wt.%).
2.2. Synthesis and Characterization of PBNS
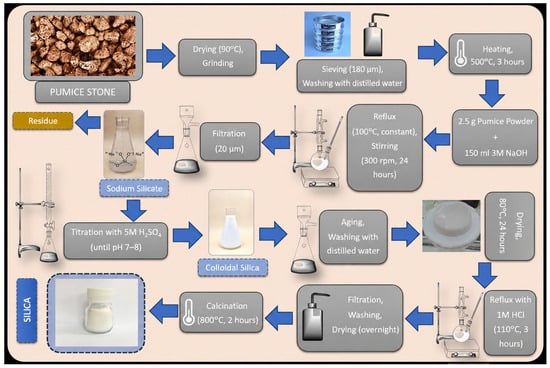
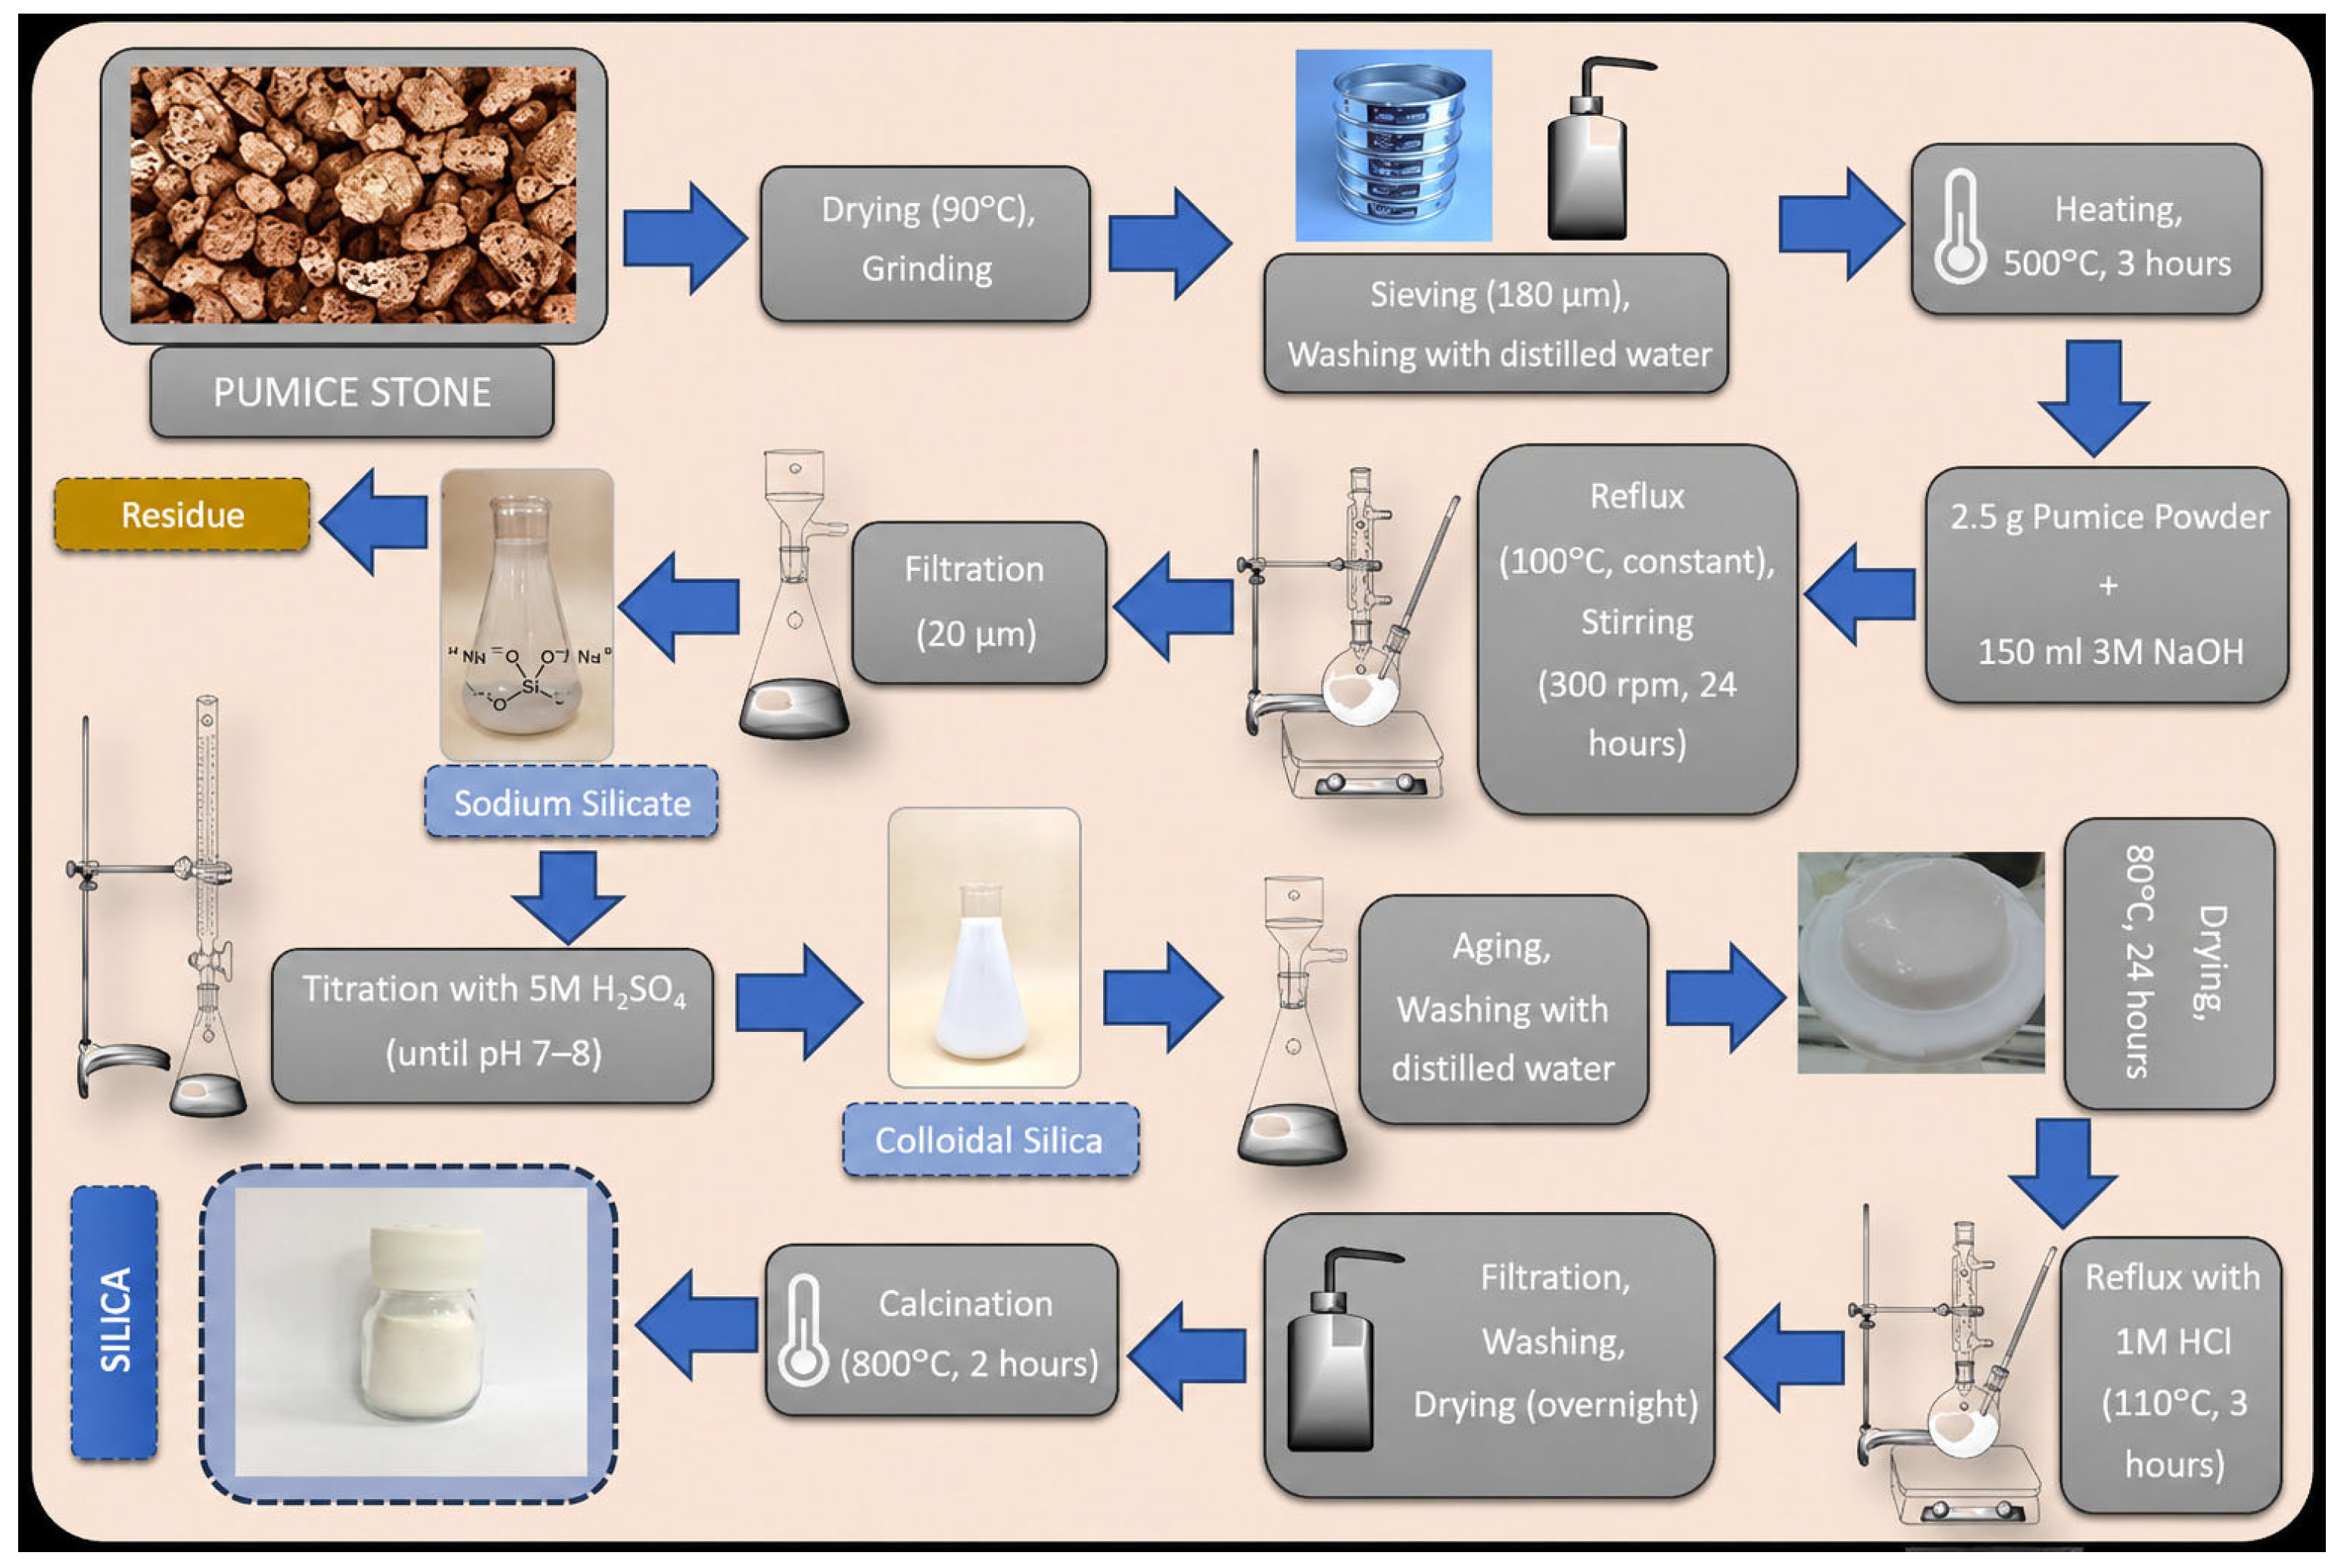
PBNS was produced from the same pumice by alkaline extraction, acid precipitation, acid leaching and calcination (Figure 1), following procedures adapted from [42,43]. Sodium hydroxide pellets (99%), sulfuric acid (98%) and hydrochloric acid (37%) were of analytical grade. The pumice was washed with distilled water, dried at 90 °C overnight, ground, passed through a 180 µm sieve, washed again and thermally activated at 500 °C for 3 h. For extraction, 2.5 g of the activated powder was refluxed with 150 mL of 3 M NaOH in a three-neck flask at 100 °C under stirring at 300 rpm for 24 h to dissolve the silica as sodium silicate. The slurry was filtered through 20 µm filter paper, and the filtrate was acidified with 5 M H2SO4 to pH 7–8 to precipitate silica gel, which was filtered, washed with distilled water to remove sulfate and other soluble by-products, and dried at 80 °C for 24 h. To remove residual metal ions (Al, Ca, Fe and Mg), the dried solid was refluxed in 1 M HCl at 110 °C for 3 h, filtered, washed repeatedly with distilled water, dried at 110 °C overnight and calcined at 800 °C for 2 h. Calcination changed the color of the powder from light grey to white. The yield of the synthesis was not determined in this study; mass yields of 94% [42] and, after optimization, 95.8% [43] have been reported for this route.
Figure 1.
Synthesis route of pumice-based nanosilica (PBNS) from natural pumice.
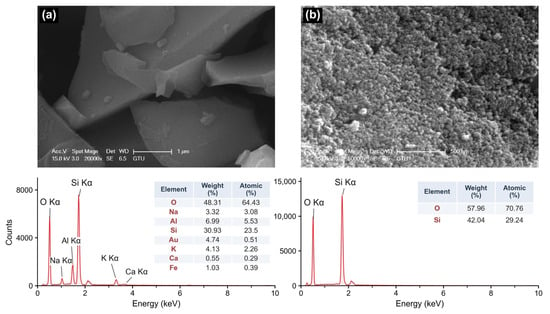
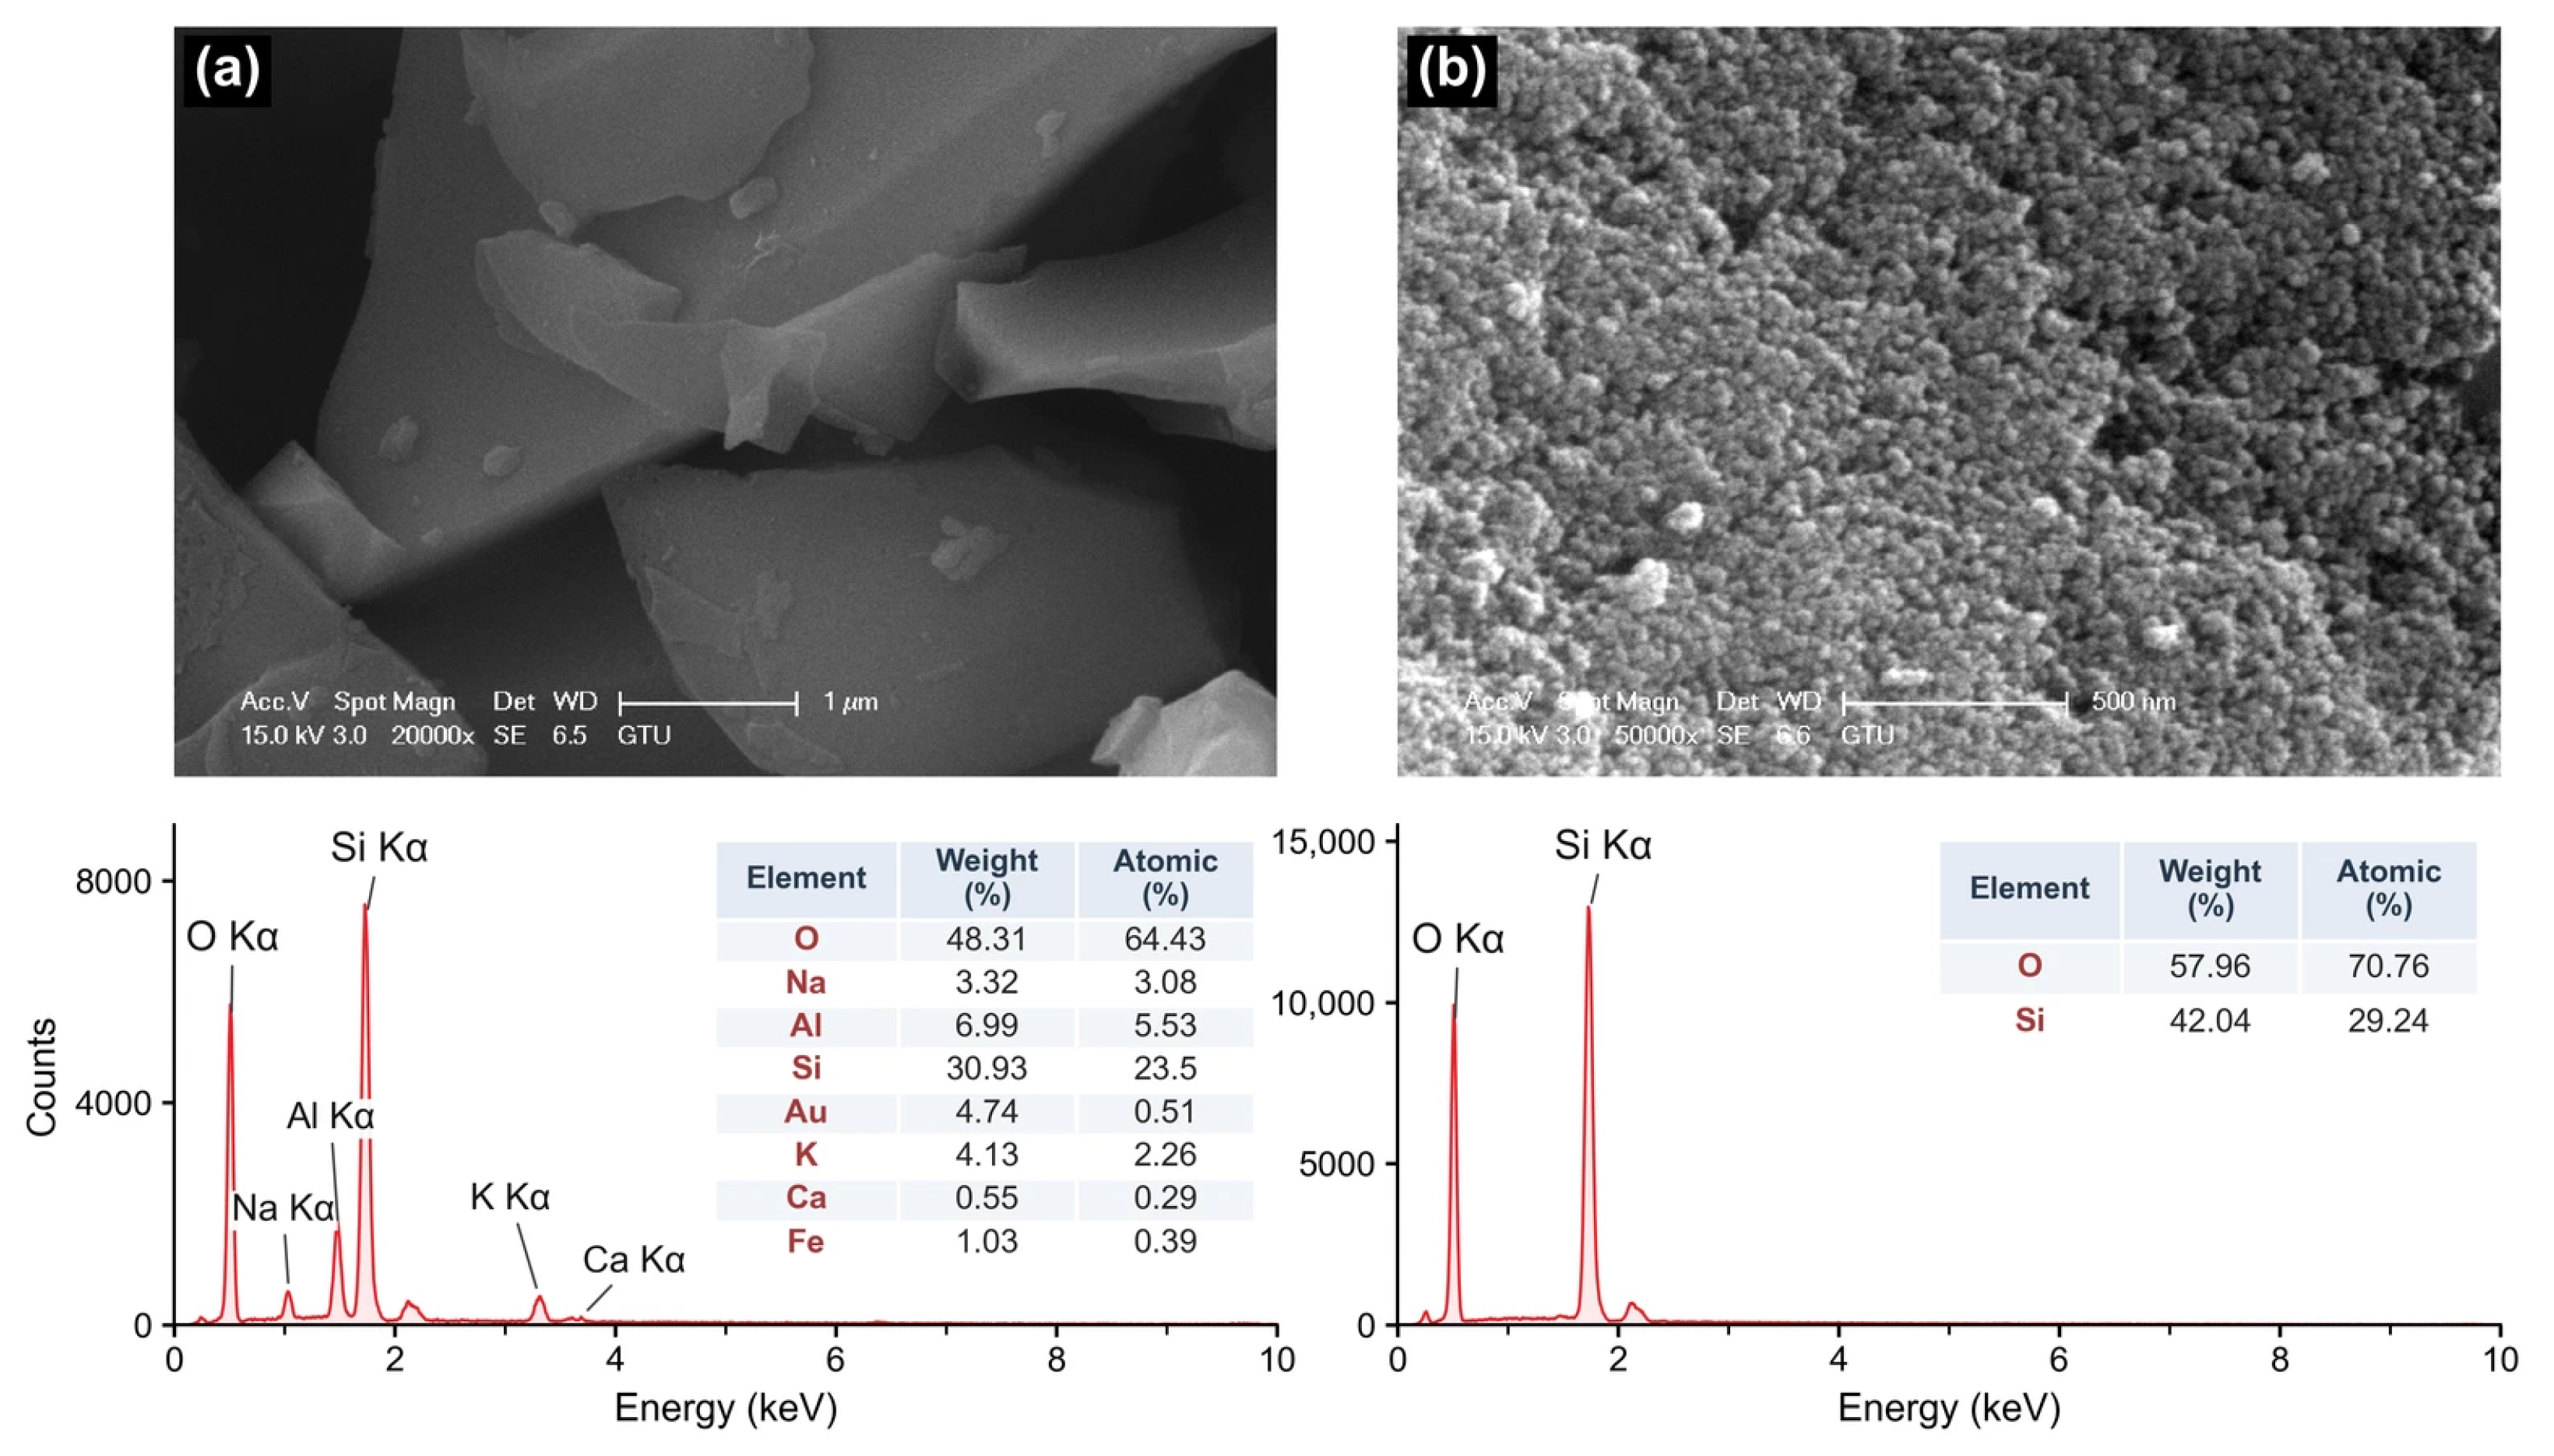
The morphology and local elemental composition of the pumice precursor and the synthesized product were examined by SEM–EDS (Figure 2). The pumice powder consisted of angular compact grains, whereas the product consisted of agglomerates of near-spherical primary particles with apparent diameters below approximately 50 nm. Nitrogen adsorption (BET method) gave specific surface areas of 3.64 m2/g for the as-received natural pumice powder (before thermal activation) and 154.04 m2/g for PBNS, a 42-fold increase. Assuming non-porous spherical particles with a density of 2.2 g/cm3, the BET surface area corresponds to an equivalent diameter of approximately 18 nm. This value is a calculated surface equivalent size and not a measured particle size distribution; it is consistent with the primary particle size observed by SEM (below approximately 50 nm). EDS of the pumice detected O (64.43 at.%) and Si (23.50 at.%) together with Al (5.53 at.%), Na (3.08 at.%), K (2.26 at.%), Fe (0.39 at.%) and Ca (0.29 at.%). Only O (70.76 at.%) and Si (29.24 at.%) were detected in the product, indicating that Al, the alkalis, Fe and Ca were reduced below the EDS detection limit in the analyzed field. The O/Si atomic ratio of 2.42, which is higher than the stoichiometric value of 2.0 for SiO2, is attributed to surface hydroxyl groups and adsorbed water and to the limited accuracy of EDS for light elements. EDS analyses describe the local composition of the analyzed fields and not the bulk composition of PBNS. The XRD pattern of PBNS showed only a broad amorphous halo centered at about 22° 2θ, without crystalline reflections (Figure S1a). Dispersed in water, PBNS had a zeta potential of −29.0 ± 1.6 mV (25 °C; mean ± SD of three measurements; Figure S1b), close to the magnitude of about 30 mV commonly associated with electrostatically stable colloidal dispersions. Dynamic light scattering of the same dispersion indicated micrometer-sized agglomerates with a polydispersity index of about 0.8, which is too high for a reliable size distribution; a particle size distribution of PBNS is therefore not reported.
Figure 2.
SEM images and EDS spectra of (a) the natural pumice powder and (b) the synthesized PBNS. EDS compositions refer to the analyzed fields.
2.3. Mixture Design and Grout Preparation
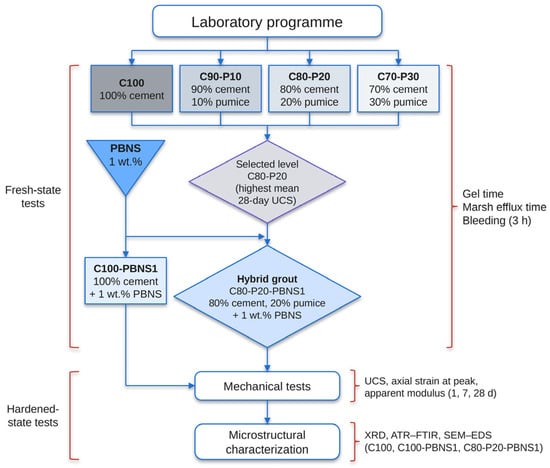
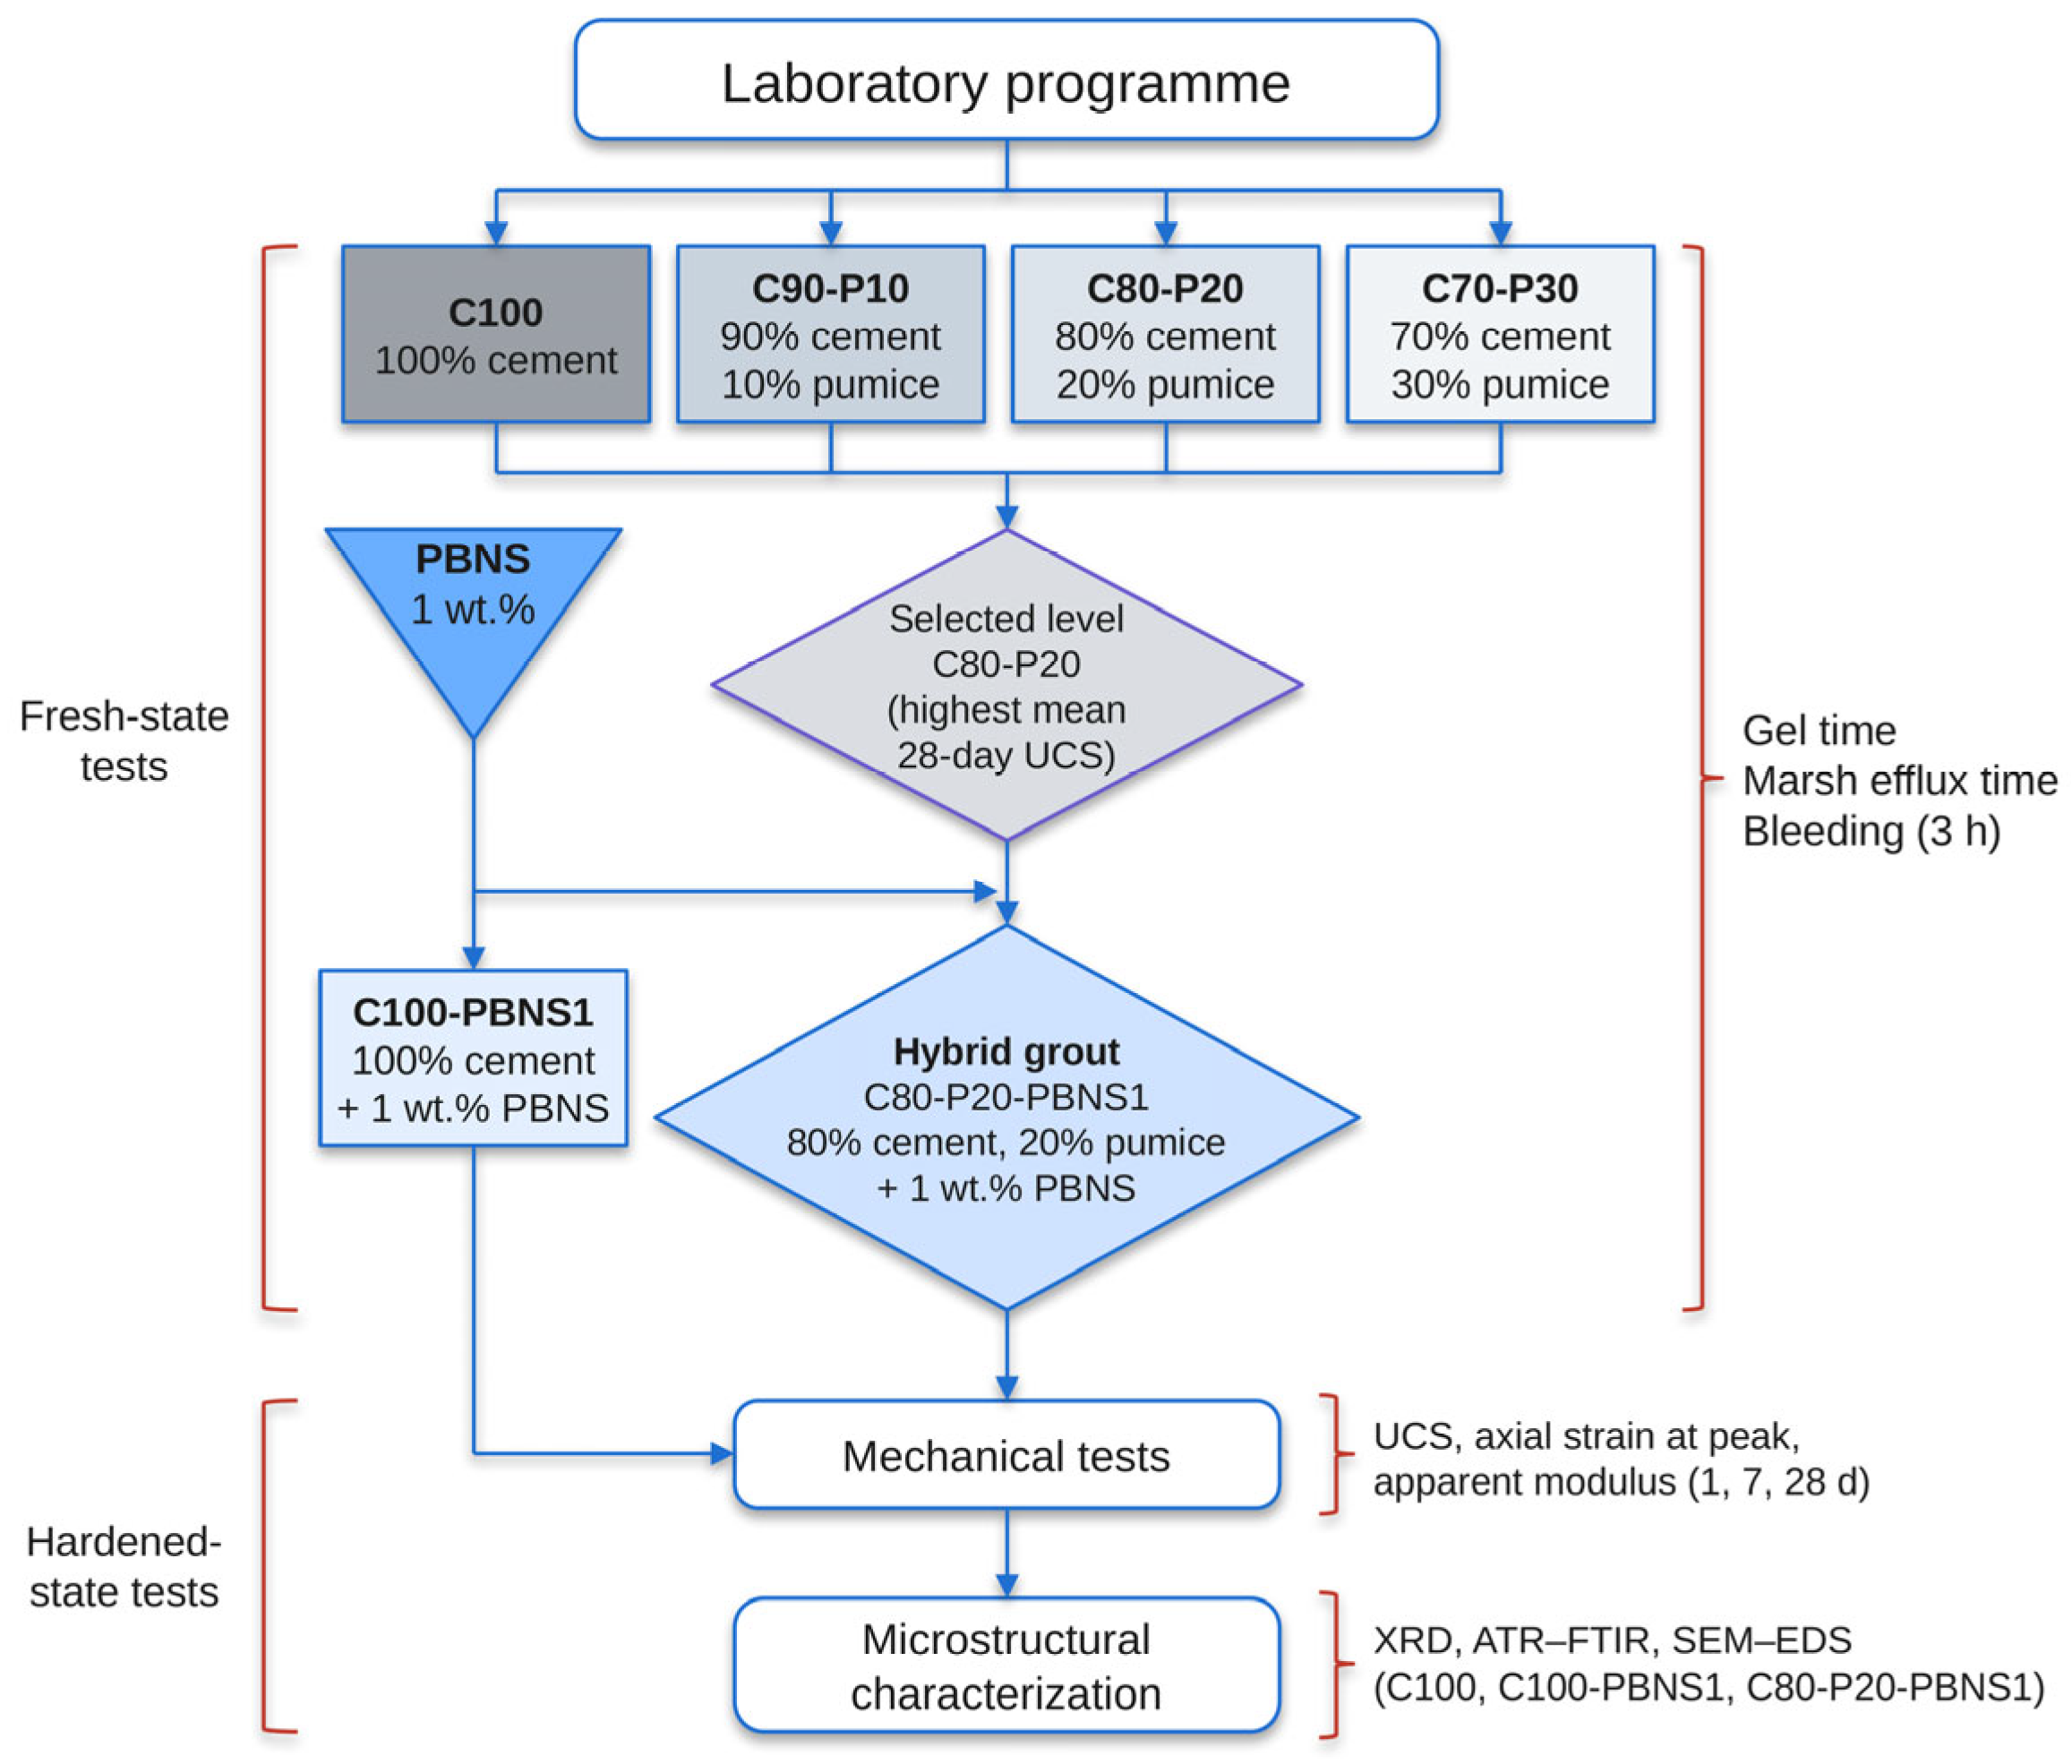
Component A was designed from a reference field formulation of 320 kg cement, 30 kg bentonite, 3.1 kg stabilizer and 830 kg water per m3 of grout, scaled by 1:500 to laboratory batches containing 640 g of binder (Table 2), each yielding a nominal 2 dm3 of two-component grout after the addition of Component B. Calculated from the specific gravities (Section 2.1), the constituents of Component A occupy 1.90 dm3 per batch (C100), and the 150 g of Component B added to each batch contributes 0.11 dm3, so that one batch yields 2.00–2.02 dm3 of two-component grout, depending on the mixture; the cement contents per m3 therefore refer to the final A+B grout (320 kg for C100 and 254 kg for C80-P20). In the screening stage, pumice replaced 10, 20 and 30 wt.% of the cement (C90-P10, C80-P20 and C70-P30). Preliminary tests of these replacement levels with a different commercial accelerator were reported in a previous conference paper [46]; the data presented here were obtained in a separate test campaign. PBNS was added at 1 wt.% of the binder mass (6.4 g, in addition to the 640 g of binder) to the cement-only binder (C100-PBNS1). This dosage lies at the lower end of the 1–3 wt.% range in which nanosilica has been reported to accelerate setting and early strength [23,30,31] and was chosen to limit the increase in water demand and agglomeration associated with higher contents [32,33,34], which would impair the pumpability of Component A; in pumice-blended cement pastes, 1 wt.% nanosilica gave the highest relative strength, whereas 2 wt.% reduced it because of agglomeration [44]. C80-P20 was selected for the hybrid formulation because it gave the highest mean 28-day UCS among the pumice-only mixtures (Section 3.2), and 1 wt.% PBNS was added to it (C80-P20-PBNS1). The water, bentonite and stabilizer contents were the same in all mixtures. Together, C100, C80-P20, C100-PBNS1 and C80-P20-PBNS1 form a 2 × 2 factorial design (pumice 0 or 20 wt.%; PBNS 0 or 1 wt.%) that allows the separate and combined effects of pumice and PBNS to be compared (Figure 3).
Table 2.
Laboratory mixture proportions of Component A (g per batch; one batch yields a nominal 2 dm3 of two-component grout).
Figure 3.
Experimental program. All six mixtures were subjected to the fresh state tests and to the mechanical tests at 1, 7 and 28 days; the microstructural analyses were performed on C100, C100-PBNS1 and C80-P20-PBNS1.
Bentonite (60 g) was first hydrated in 1660 g of water in a high-shear mixer for 300 s. Pumice and cement were then added in sequence, each followed by 60 s of mixing, and the stabilizer (6.2 g) was added last and mixed for a further 60 s. In the PBNS-containing mixtures, PBNS was first dispersed in the mixing water by ultrasonication for 10 min (HYD-800, 25 kHz, 800 W) before the bentonite was added; the remaining sequence was unchanged. For all tests on the two-component grout, 150 g of sodium silicate solution (Component B) was mixed with each batch of Component A, corresponding to 6.3% of the mass of Component A; the same ratio was used for all mixtures. Because preliminary tests had shown that the grout begins to gel within a few seconds, Component A and Component B were placed in two separate 2.5 dm3 containers and mixed by pouring the material from one container into the other three times within about 5 s, and the grout was cast into the molds immediately afterwards, before the onset of gelation. The preparation and testing sequence are illustrated in Figure S2.
2.4. Fresh State Tests
The flowability of Component A was measured as the efflux time of 1000 mL of freshly prepared suspension through a Marsh-type funnel. Marsh efflux time is an empirical flow index and not a direct measure of yield stress or plastic viscosity [48,49]. Static stability was assessed by filling a 1000 mL graduated cylinder with Component A and recording the volume of separated water after 3 h, expressed as a percentage of the initial volume. Gel time was measured immediately after Component B was added, using a cup-inversion method, as the time from mixing until the grout ceased to flow and became self-supporting. Because gelation is temperature-sensitive, the laboratory and constituent temperatures were maintained at 20 °C during the fresh state tests. The fresh state properties are reported as single values per mixture without replicate statistics and are therefore used as comparative screening indices.
2.5. Compressive Strength and Deformation
Uniaxial compressive strength (UCS) was measured on 50 mm × 50 mm × 50 mm cubes after 1, 7 and 28 days of curing, using three specimens per mixture and age (n = 3; 54 specimens in total). Component A and the two-component grout were prepared afresh for each specimen by the same operator, using the same lots of raw materials, so the three specimens of each mixture and age came from independently prepared batches, and the reported SD includes batch-to-batch variability. The molds were coated with a release agent and filled following ASTM C942 [50]; the overflowing material was struck off with a trowel to obtain a flat top surface, and the molds were lightly vibrated to release entrapped air. The specimens were demolded 24 h after casting; the 1-day specimens were tested directly after demolding, and the others were cured in a water tank in a curing room at 25 °C until testing. The specimens were tested in uniaxial compression using a procedure adapted from ASTM C109 [51], with the load applied to two opposite faces that had been cast against the mold. After a seating load of 200 N had been applied at 0.5 mm/min, the specimens were loaded under displacement control at 0.03 mm/s (1.8 mm/min) until failure, with a break detection threshold of 1.5 kN; displacement control was used instead of the load rate specified in ASTM C109 so that the axial shortening could be recorded up to the peak load. The axial shortening of the specimens was recorded during loading with a linear variable differential transformer (LVDT; Figure S2), and the axial strain was calculated as the shortening divided by the initial specimen length. The axial strain at peak stress (εp) is reported as a measure of deformability, and an apparent modulus was calculated as Eapp = UCS/εp. Because the measured shortening includes seating and compliance effects, Eapp is used only to compare the mixtures and is not equivalent to a standard static modulus.
2.6. Microstructural Characterization
XRD, FTIR and SEM–EDS analyses were performed on C100, C100-PBNS1 and C80-P20-PBNS1 after 1, 7 and 28 days of curing. At each age, fragments of the tested specimens were dried at 70 °C for 1 h to remove free water and stored in closed bags until analysis. This treatment was applied identically to all samples; because drying at this temperature may partly dehydrate ettringite and C–S–H, the analyses were used only for a qualitative comparison of the mixtures. XRD patterns were recorded with Cu Kα radiation, and phases were identified with reference to standard crystallographic data. ATR–FTIR spectra were collected between 4000 and 400 cm−1 with a Nicolet 380 spectrometer (Thermo Nicolet, Madison, WI, USA) equipped with a diamond ATR crystal, at a resolution of 4 cm−1 with 32 scans; band positions were taken as the transmittance minima, with an estimated uncertainty of ±3 cm−1. For SEM–EDS, the dried fragments were gold-coated and examined with a secondary electron detector at an accelerating voltage of 15 kV; EDS was used for semi-quantitative analysis for each sample, three fields were analyzed, and their mean composition is reported.
2.7. Statistical Analysis
UCS and Eapp are reported as the mean ± sample standard deviation (SD) of three specimens, and εp is reported descriptively. Because each specimen was cast from a separately prepared batch (Section 2.5), the specimens were treated as independent replicates, and batch-to-batch variability was contained in the residual variance. Differences between the mixtures were tested separately at each curing age by one-way analysis of variance (ANOVA) followed by Tukey’s honestly significant difference (HSD) test (α = 0.05), and mixtures sharing a Tukey letter are not significantly different. The combined effect of pumice and PBNS was analyzed in the 2 × 2 factorial subset C100, C80-P20, C100-PBNS1 and C80-P20-PBNS1. At each age, the interaction was expressed as the contrast I = (μC80-P20-PBNS1 − μC80-P20) − (μC100-PBNS1 − μC100), i.e., the effect of PBNS in the presence of 20 wt.% pumice minus its effect in the cement-only grout, so that I < 0 denotes antagonism and I > 0 synergy. I is reported with its 95% confidence interval based on the pooled within-age variance, and the three age-specific interaction tests were Holm-adjusted. A three-way ANOVA (pumice × PBNS × age) was used to test whether the interaction changed with curing age, and, because the variance increased with age, the planned contrast between the 28-day and 1-day interactions (I28 − I1) was also evaluated with Welch’s correction. Effect sizes are expressed as partial η2. With n = 3 and the pooled 28-day SD of 0.28 MPa, the minimum difference between two mixtures that can be detected with 80% power (two-sided α = 0.05) is about 0.70 MPa; non-significant differences are therefore not interpreted as equivalence. The supporting analyses (two-way ANOVA of mixture × age, Welch’s ANOVA for unequal variances, all pairwise comparisons and the two- and three-way ANOVAs of the factorial subset) are given in Tables S1–S5. All analyses were performed in Python 3.12 with SciPy 1.18 [52].
3. Results
3.1. Fresh State Properties
The control (C100) had a Marsh efflux time of 34.2 s, a gel time of 9.7 s and 2.0% bleeding (Table 3). Increasing the pumice content increased the efflux time to 40.7, 42.2 and 43.8 s for C90-P10, C80-P20 and C70-P30 and reduced bleeding to 0.5%, 0% and 0%, respectively. Pumice therefore improved the static stability of Component A at the cost of a slower flow, which is consistent with the water uptake by its porous particles and more interparticle contacts in the suspension. PBNS alone had a smaller effect (36.4 s; 2.0% bleeding), whereas the hybrid had the longest efflux time (43.8 s, equal to C70-P30) and low bleeding (0.5%), in line with the higher water demand of finely divided silica [32,33]. Gel times ranged from 8.1 to 10.6 s, so all tested grouts gelled within seconds after the addition of Component B; because the repeatability of the test was not determined, differences of about 1 s are not interpreted. Gel time indicates the onset of gelation but not the load-bearing capacity of the grout [53]. Because acceptance limits for two-component backfill grouts are project-specific and no standardized requirements exist [53,54], these indices are used to compare the mixtures rather than to certify field performance.
Table 3.
Fresh state properties of Component A (Marsh efflux time and 3 h bleeding) and of the two-component grout (gel time).
3.2. Compressive Strength Development
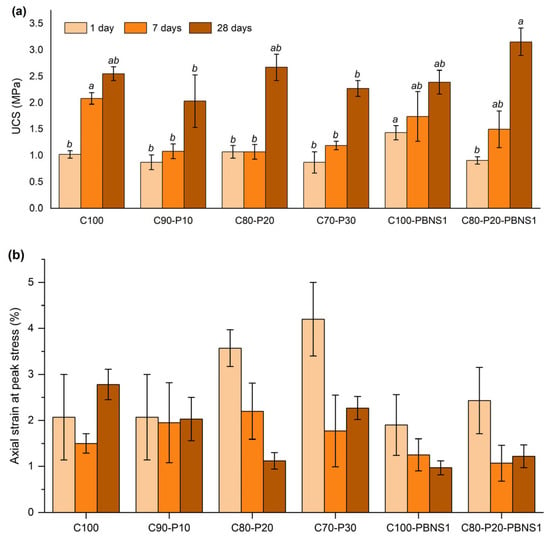
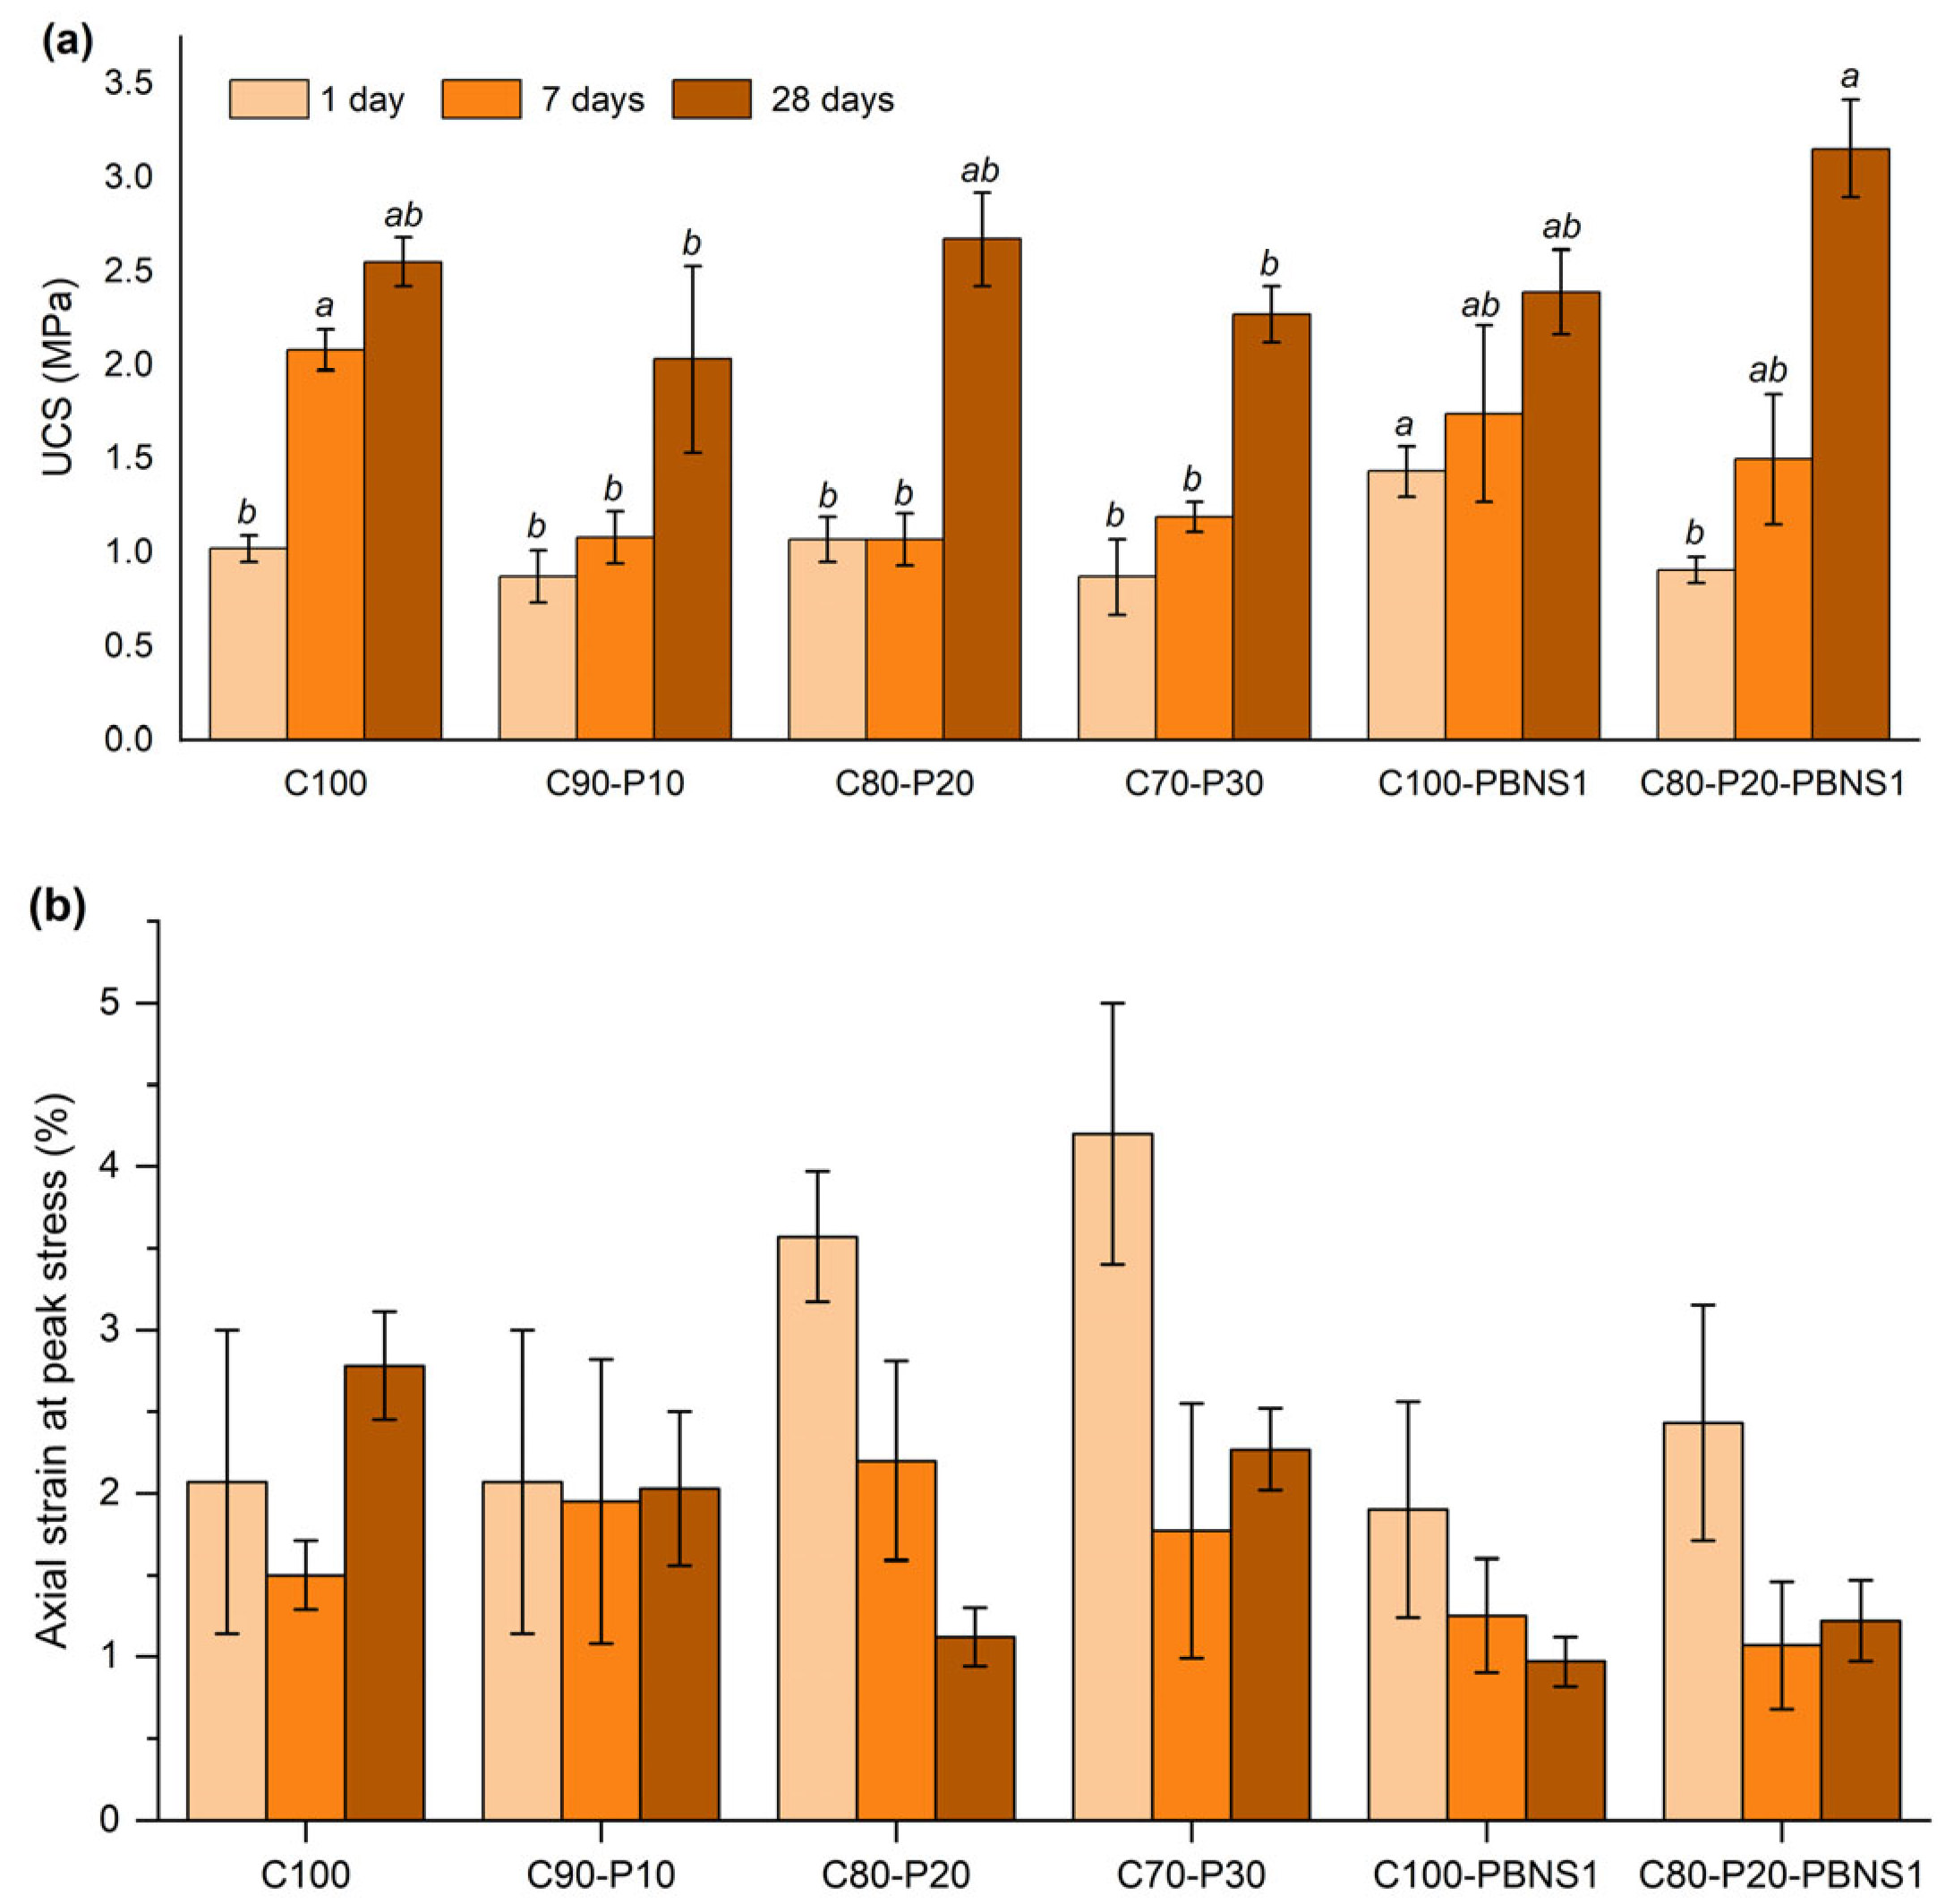
Strength increased with curing age for every mixture, but the ranking of the mixtures changed with age (Figure 4a; Table 4), as confirmed by a significant mixture × age interaction (p < 0.001; Table S1). The mixtures are therefore compared at each age.
Figure 4.
(a) Uniaxial compressive strength (UCS) and (b) axial strain at peak stress of the six mixtures after 1, 7 and 28 days of curing (mean ± SD, n = 3). In (a), bars of the same curing age sharing a letter are not significantly different (Tukey’s HSD, α = 0.05).
Table 4.
Uniaxial compressive strength (UCS) and apparent modulus (Eapp) at 1, 7 and 28 days (mean ± SD, n = 3).
At 1 day, C100-PBNS1 was the strongest grout (1.43 ± 0.13 MPa), 40% stronger than the control (1.02 ± 0.07 MPa; p = 0.021), and it was the only mixture in a separate Tukey group. The pumice-only mixtures (0.87–1.07 MPa) and the hybrid (0.91 ± 0.07 MPa) did not differ significantly from the control (p ≥ 0.71). Up to 30 wt.% pumice thus caused no detectable 1-day strength loss, consistent with early strength being governed mainly by the accelerated cement–silicate reaction.
At 7 days, the dilution effect of pumice became evident. The control reached 2.08 ± 0.11 MPa, whereas the pumice-only mixtures remained at 1.07–1.19 MPa, i.e., 43–49% lower (p ≤ 0.011), with little strength gain after day 1. The two PBNS-containing mixtures (1.50–1.74 MPa) did not differ significantly from either the control or the pumice-only mixtures.
At 28 days, the ranking changed again. The hybrid had the highest mean UCS (3.15 ± 0.26 MPa), which was 24% above the control (2.55 ± 0.13 MPa), 18% above C80-P20 (2.67 ± 0.25 MPa) and 32% above C100-PBNS1 (2.39 ± 0.24 MPa). With three specimens per group, these pairwise differences were not significant (control, p = 0.16; C80-P20, p = 0.34; C100-PBNS1, p = 0.054), and Welch’s ANOVA, which does not assume equal variances, was marginal at this age (p = 0.064; Table S2); the hybrid was, however, significantly stronger than C90-P10 (p = 0.004) and C70-P30 (p = 0.022). C80-P20 showed no detectable 28-day strength loss relative to the control (p = 0.99; equivalence was not tested), and this level was therefore used in the hybrid. The non-monotonic order of the pumice levels (P20 > P30 > P10) was not statistically resolved and is not interpreted further.
3.3. Combined Effect of Pumice and PBNS
Comparing C100, C80-P20, C100-PBNS1 and C80-P20-PBNS1 isolates the combined effect of the two additions (Table 5; Figure S3; Tables S4 and S5). At day 1, PBNS increased the strength by 0.41 MPa in the cement-only grout but decreased it by 0.16 MPa in the presence of 20 wt.% pumice, giving I = −0.57 MPa (95% CI −0.84 to −0.30 MPa; Holm-adjusted p = 0.004). At 28 days, the sign was reversed: PBNS changed the strength by −0.16 MPa without pumice and by +0.49 MPa with pumice, giving I = +0.64 MPa (95% CI 0.04 to 1.25 MPa; p = 0.039), but this interaction was not significant after Holm adjustment (p = 0.079). At 7 days, the interaction was not significant (p = 0.060). The change of the interaction with age was significant (pumice × PBNS × age, F(2,24) = 7.97, p = 0.002; Table S5; I28 − I1 = +1.21 MPa, 95% CI 0.57–1.86 MPa, Welch p = 0.002). The two additions were therefore clearly antagonistic at day 1, whereas the positive interaction at 28 days is suggestive and requires confirmation with larger replicate sets.
Table 5.
Pumice × PBNS interaction contrast I for UCS at each curing age.
3.4. Deformation Behavior
The axial strain at peak stress (Figure 4b) and Eapp (Table 4) describe the deformability of the grouts. At day 1, all grouts failed at large strains (approximately 1.9–4.2%), with the highest values for the pumice-rich mixtures C80-P20 and C70-P30, and Eapp did not differ significantly between the mixtures (p = 0.092). At 7 days, the mixture effect on Eapp was not significant in the one-way ANOVA (p = 0.065) but was significant in Welch’s ANOVA (p = 0.045); because this result depends on the variance assumption, the 7-day Eapp values are not compared further. With curing, εp of C80-P20, C100-PBNS1 and the hybrid decreased to approximately 1.0–1.2% at 28 days, whereas the control, C90-P10 and C70-P30 still failed at 2.0–2.8%. Accordingly, these three mixtures formed the stiffest group at 28 days, with 2.6–2.9 times the Eapp of the control (0.24–0.27 vs. 0.09 GPa; p ≤ 0.008 against the other mixtures). The hybrid was not stiffer than C80-P20 or C100-PBNS1 (p ≥ 0.94), so the positive 28-day interaction found for strength did not extend to stiffness. The larger 28-day than 7-day strain of the control illustrates the scatter of displacement-based measurements on soft grouts; εp and Eapp are therefore used only to compare the mixtures.
3.5. Phase Assemblage (XRD)
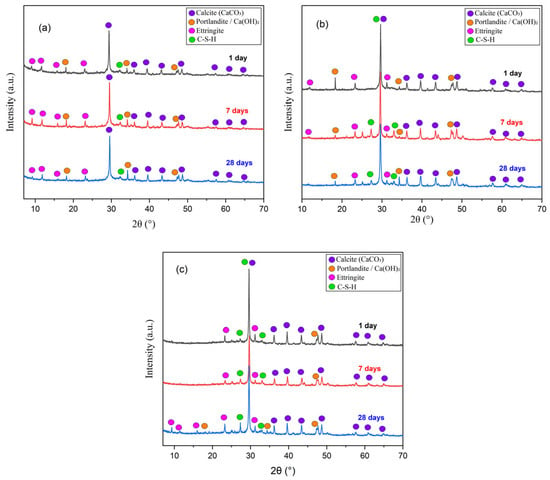
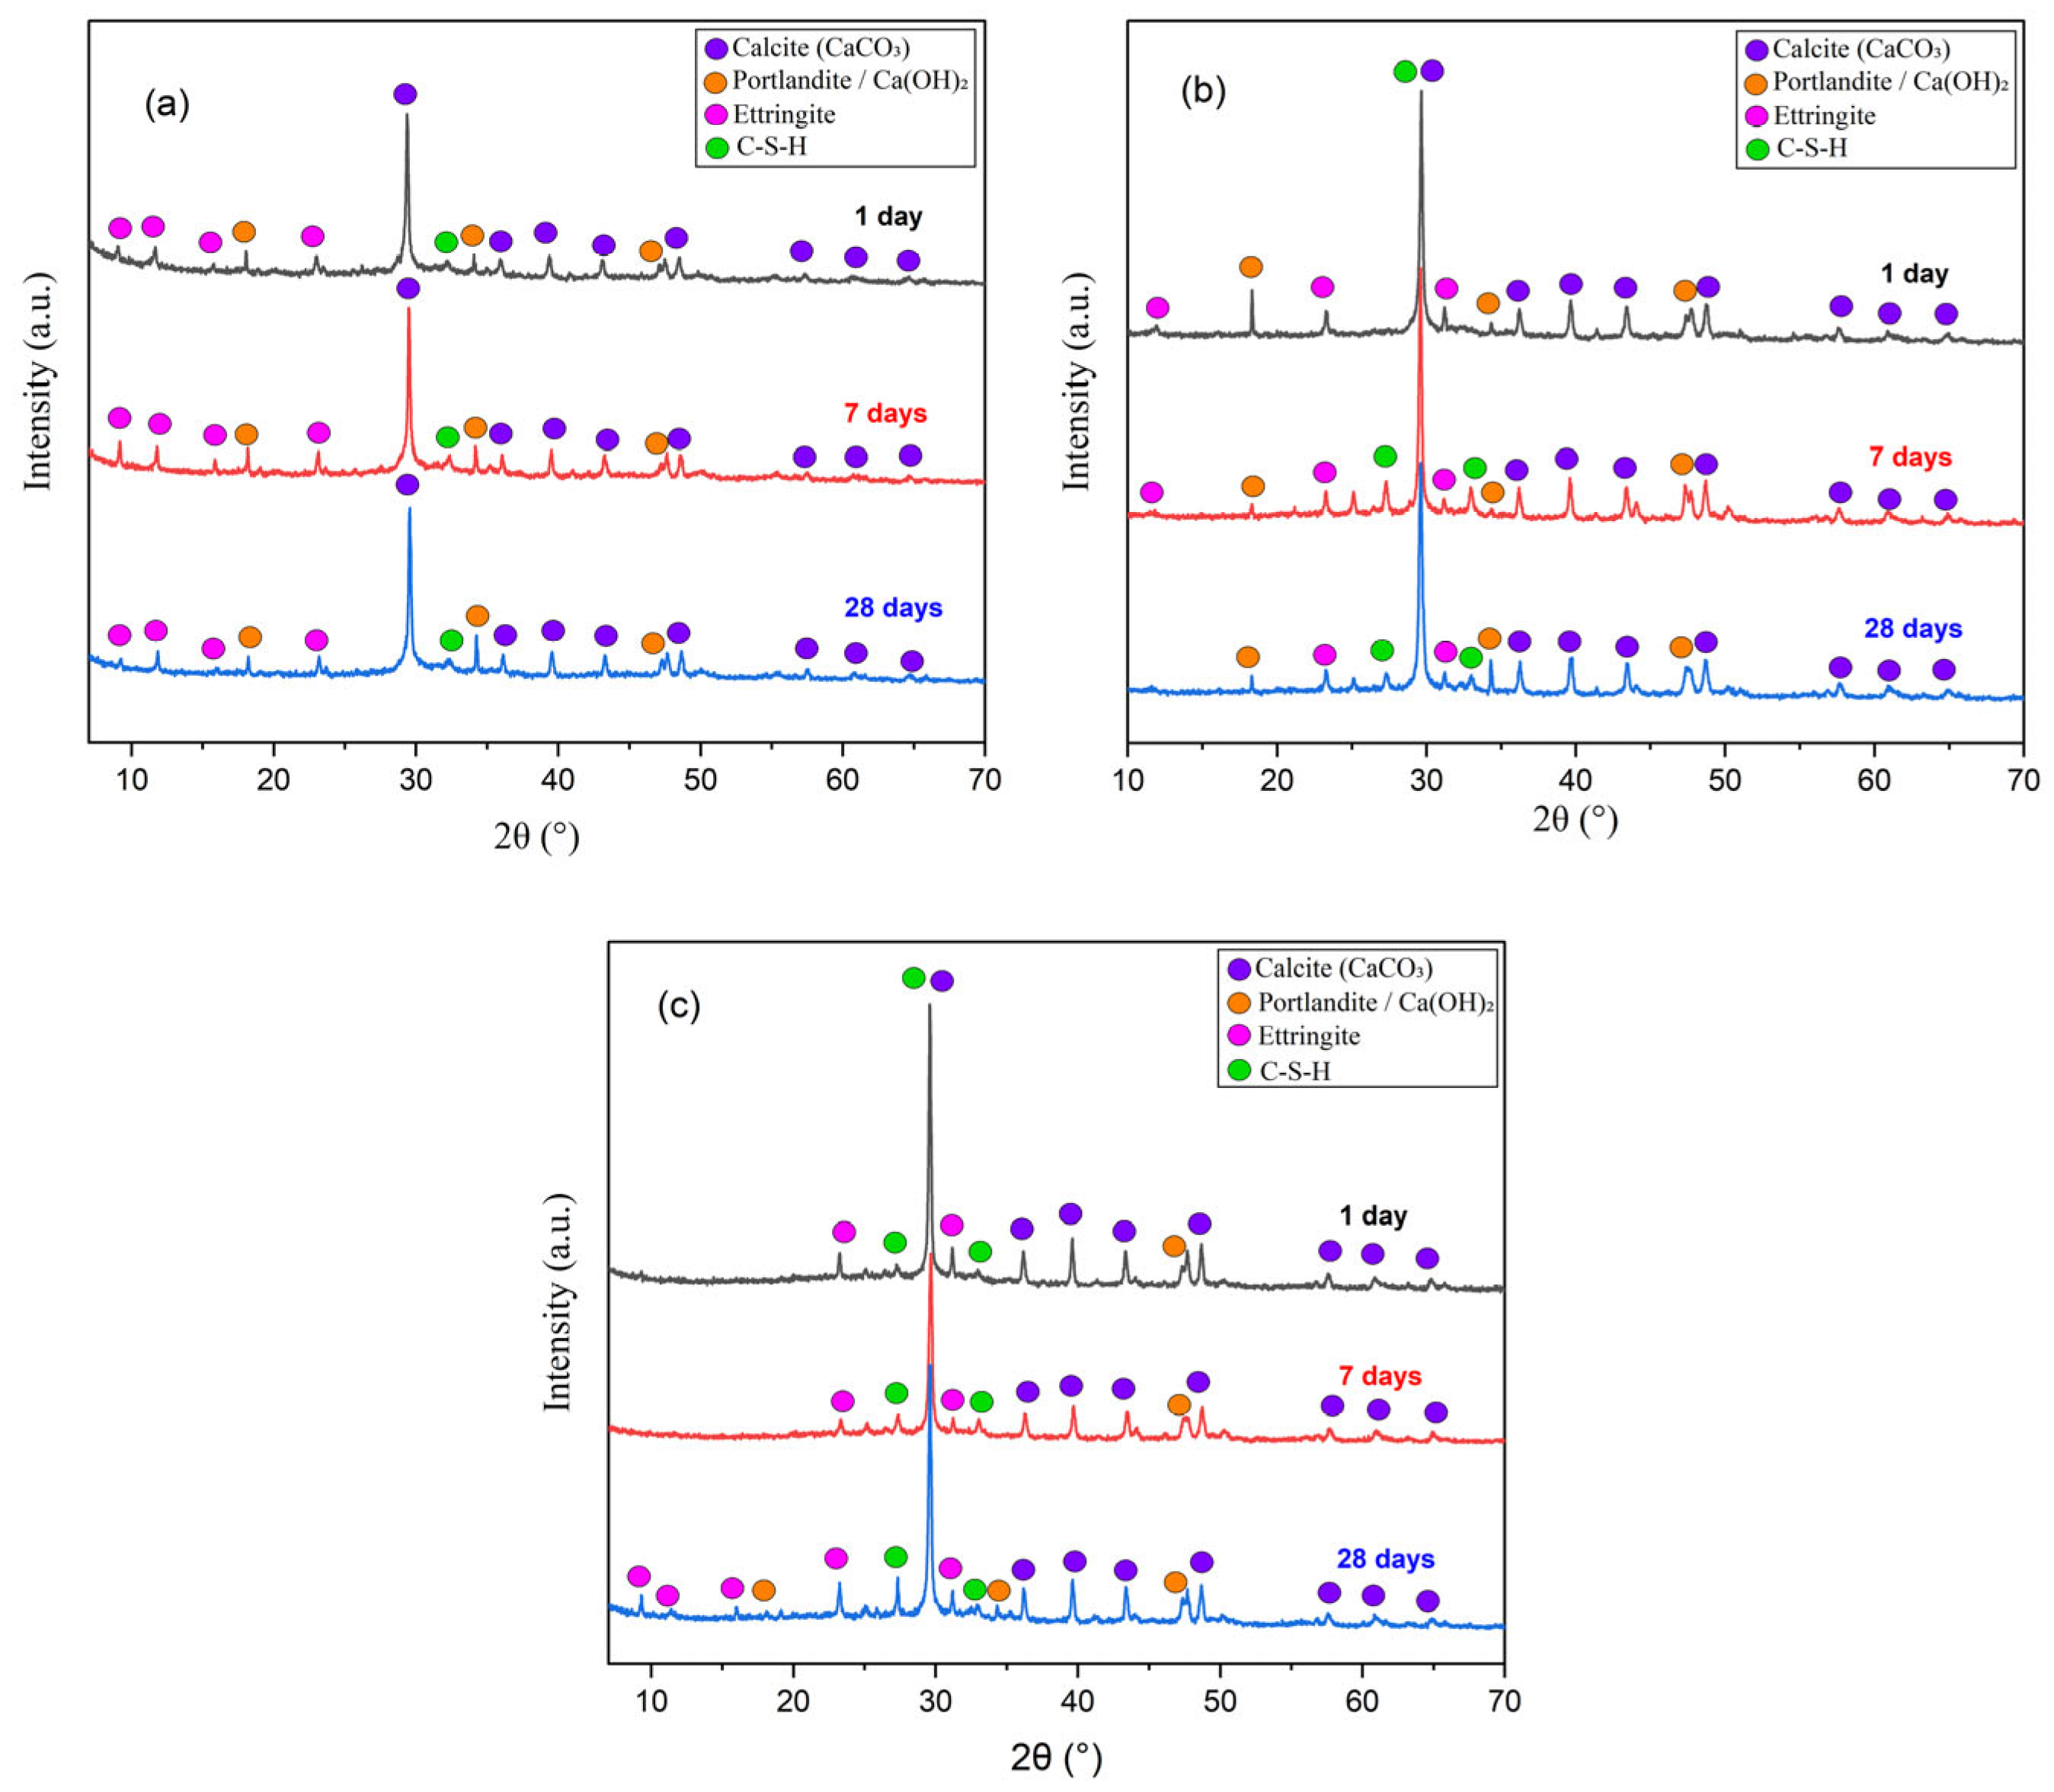
Figure 5 shows the XRD patterns of C100, C100-PBNS1 and C80-P20-PBNS1 after 1, 7 and 28 days. All three systems contained calcite, portlandite and ettringite throughout curing, and no additional crystalline phase was detected in the grouts containing PBNS or pumice. The most intense reflection, near 2θ ≈ 29–30°, was assigned mainly to calcite, indicating carbonation of calcium-bearing phases during curing and sample handling. Portlandite represents the calcium hydroxide produced by cement hydration, i.e., the reactant for the pozzolanic reactions of PBNS and pumice, whereas ettringite is associated with the rapid aluminate–sulfate reactions of the accelerated system. C–(A)–S–H is poorly crystalline: the reflections marked as C–S–H in Figure 5 overlap those of calcite, and its main contribution is a broad background. The patterns were therefore interpreted qualitatively; because no internal standard had been added, phase fractions (e.g., by Rietveld analysis) and portlandite consumption were not quantified.
Figure 5.
XRD patterns of (a) C100, (b) C100-PBNS1 and (c) C80-P20-PBNS1 after 1, 7 and 28 days of curing. Markers identify calcite, portlandite, ettringite and C–S–H; patterns are vertically offset for clarity.
3.6. Silicate Bonding (FTIR)
The FTIR spectra (Figure 6) and band assignments (Table 6) are consistent with the XRD observations. Broad O–H stretching (3378–3392 cm−1) and H–O–H bending (1637–1643 cm−1) bands reflect water in the hydrated matrix [55,56]. Carbonate bands at 1403–1411 and 871–873 cm−1 were present in all systems, consistent with the calcite detected by XRD [56]. The sulfate band at 1108–1112 cm−1, which is attributed mainly to ettringite [56,57], and the band at 657–663 cm−1, where S–O bending of sulfate overlaps Si–O–(Si,Al) bending, evolved with curing, in agreement with the transformation of early sulfate-bearing products. The principal Si–O–T (T = Si or Al) asymmetric stretching band, to which C–(A)–S–H contributes [55,58], was located at 950–965 cm−1 in all three grouts (Table 7). At 1 and 7 days, the positions in the PBNS-containing grouts differed from those of the control by −2 to +7 cm−1, i.e., by less than twice the spectral resolution, whereas at 28 days the band was 10 and 15 cm−1 higher in C100-PBNS1 and the hybrid, respectively. The band in this region combines overlapping contributions (C–(A)–S–H, the silicate gel formed from Component B and unreacted silica of the additions), so its position is not used as an index of silicate polymerization; and because the pumice-only grout C80-P20 was not included in the microstructural analyses, the 28-day band positions of the hybrid are not attributed to the pumice–PBNS combination. Because the spectra are vertically offset, band positions and shapes rather than absolute intensities were compared.
Figure 6.
ATR–FTIR spectra of (a) C100, (b) C100-PBNS1 and (c) C80-P20-PBNS1 after 1, 7 and 28 days of curing. Labels identify band assignments; the positions of the principal Si–O–T band at each age are listed in Table 7. Spectra are vertically offset for clarity. Grey shaded areas highlight selected FTIR band regions.
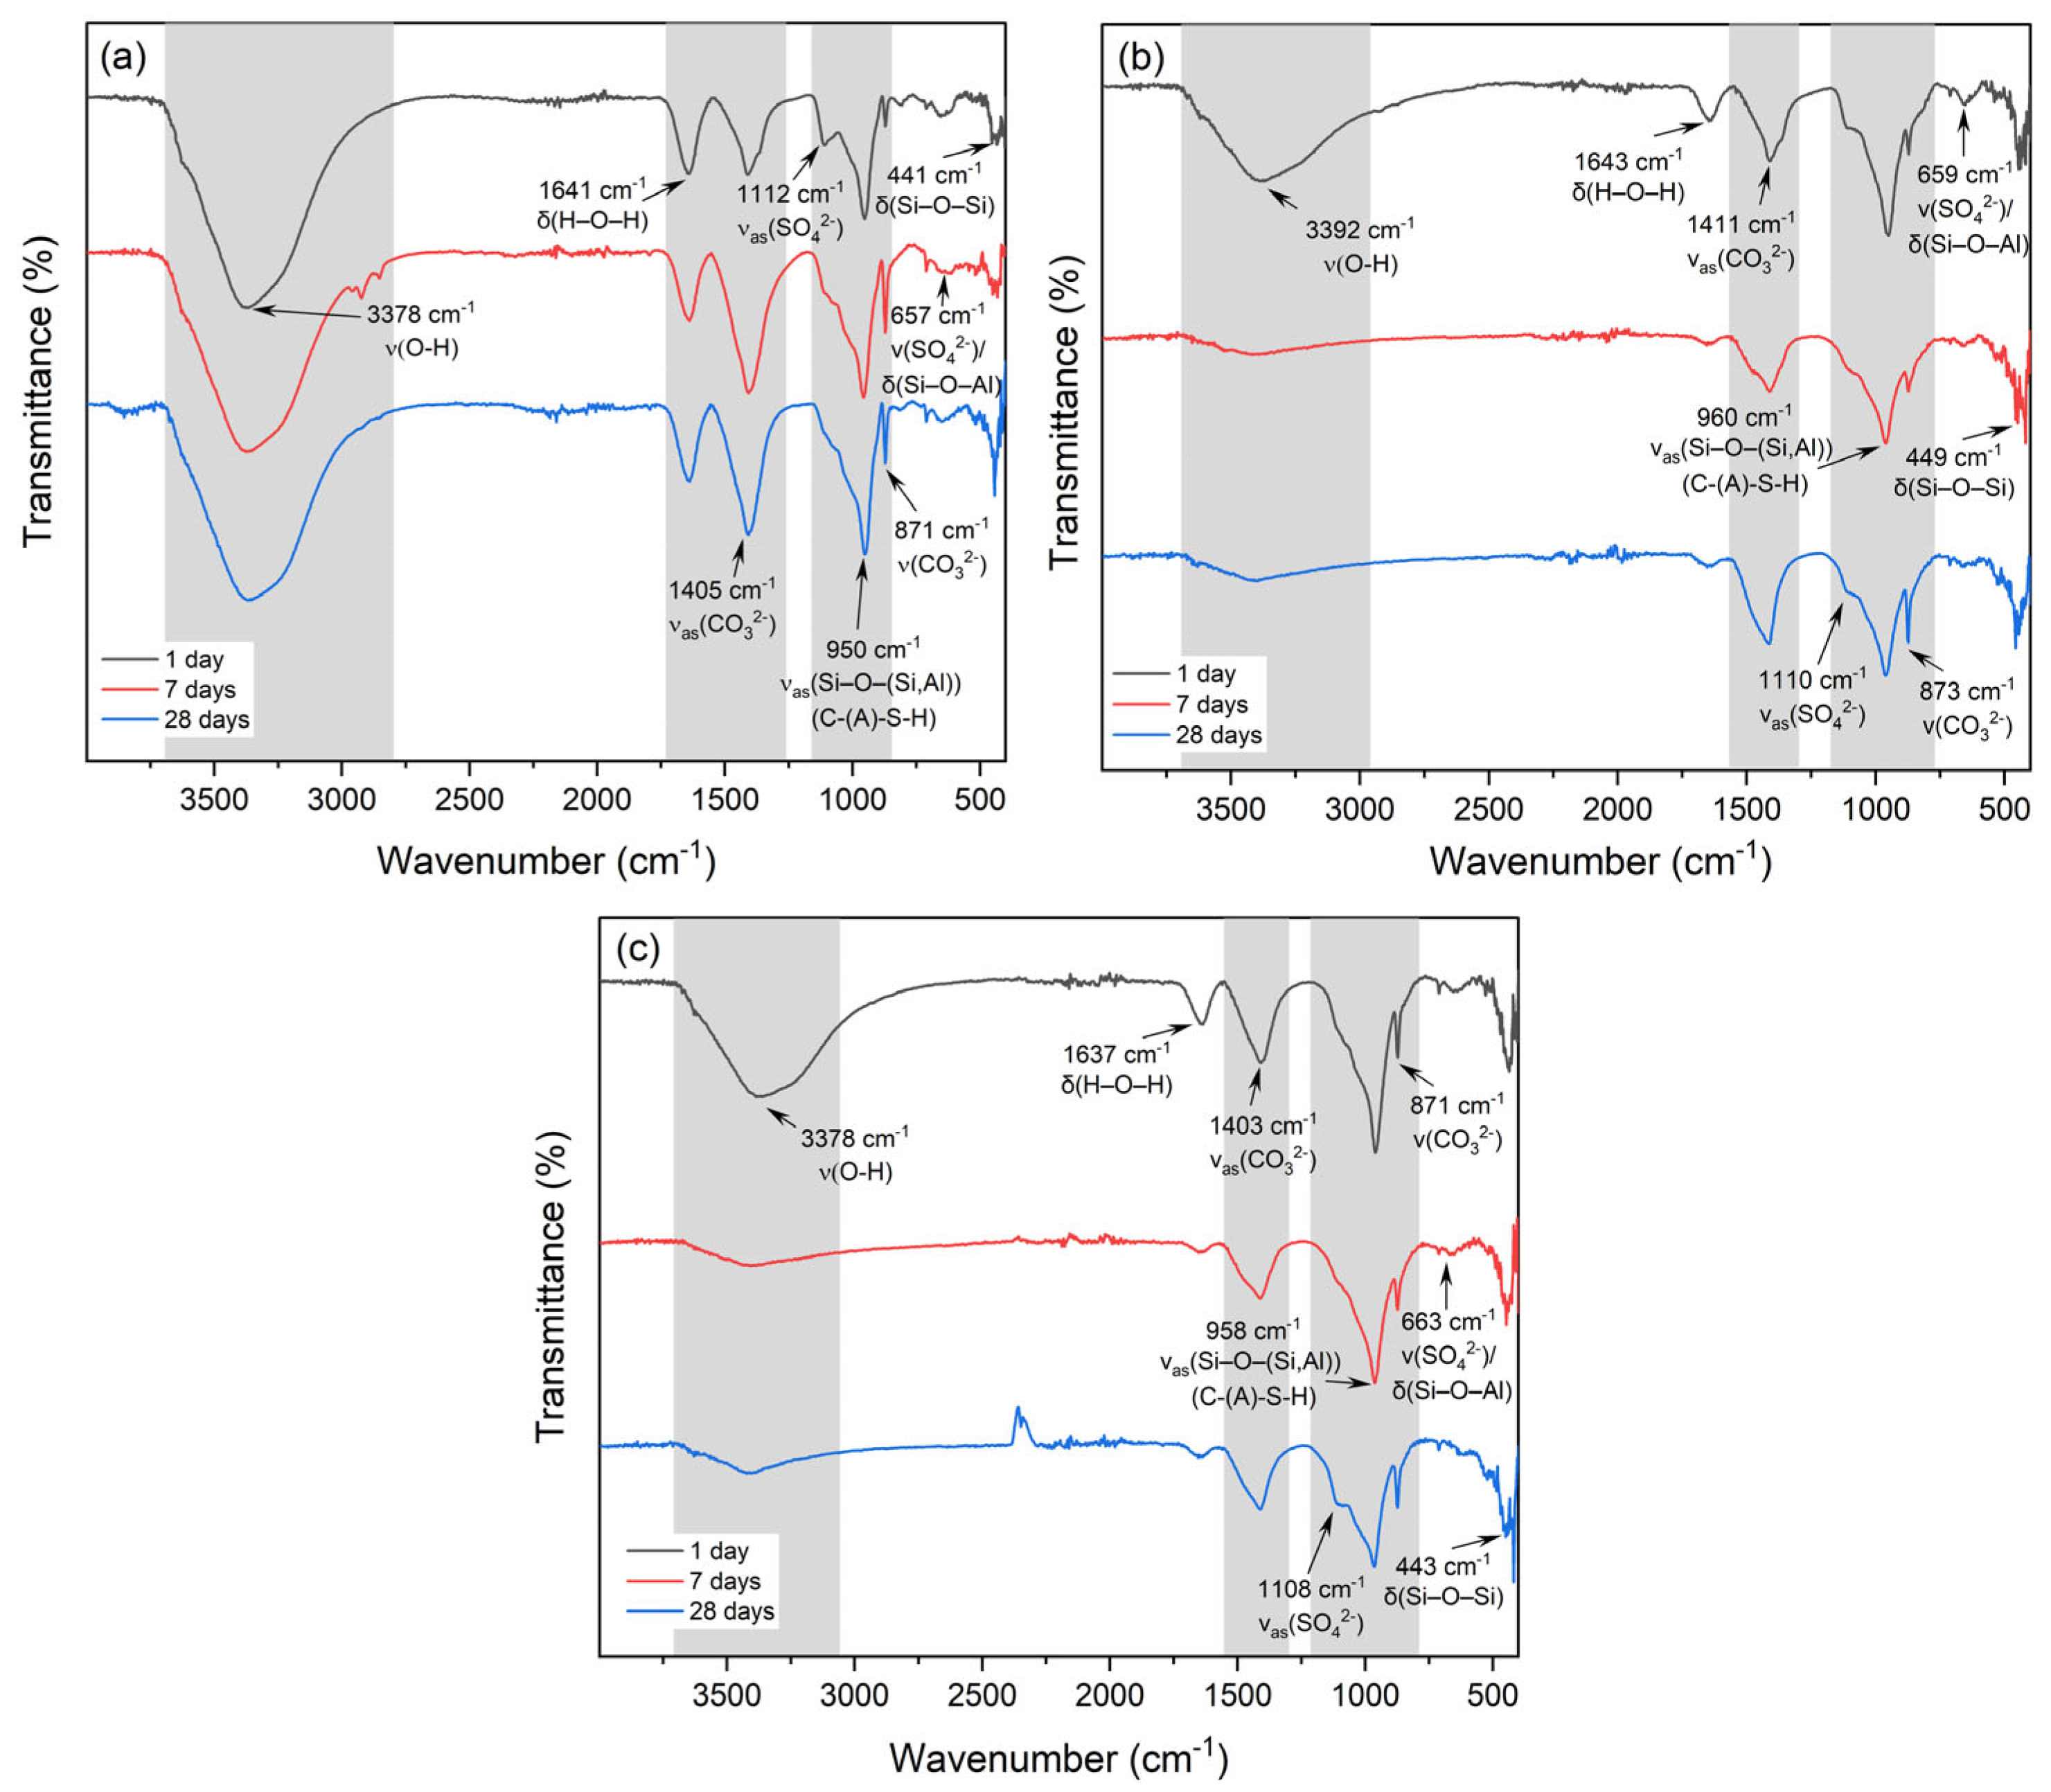
Table 6.
Principal ATR–FTIR bands of the hardened grouts and their assignments.
Table 7.
Position of the principal Si–O–T stretching band (cm−1) at each curing age; differences from C100 at the same age in parentheses.
3.7. Microstructure (SEM–EDS)
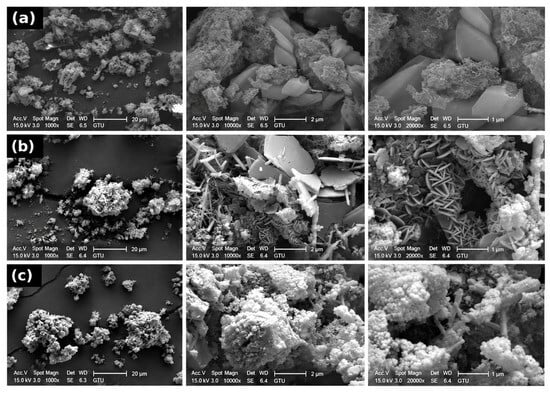
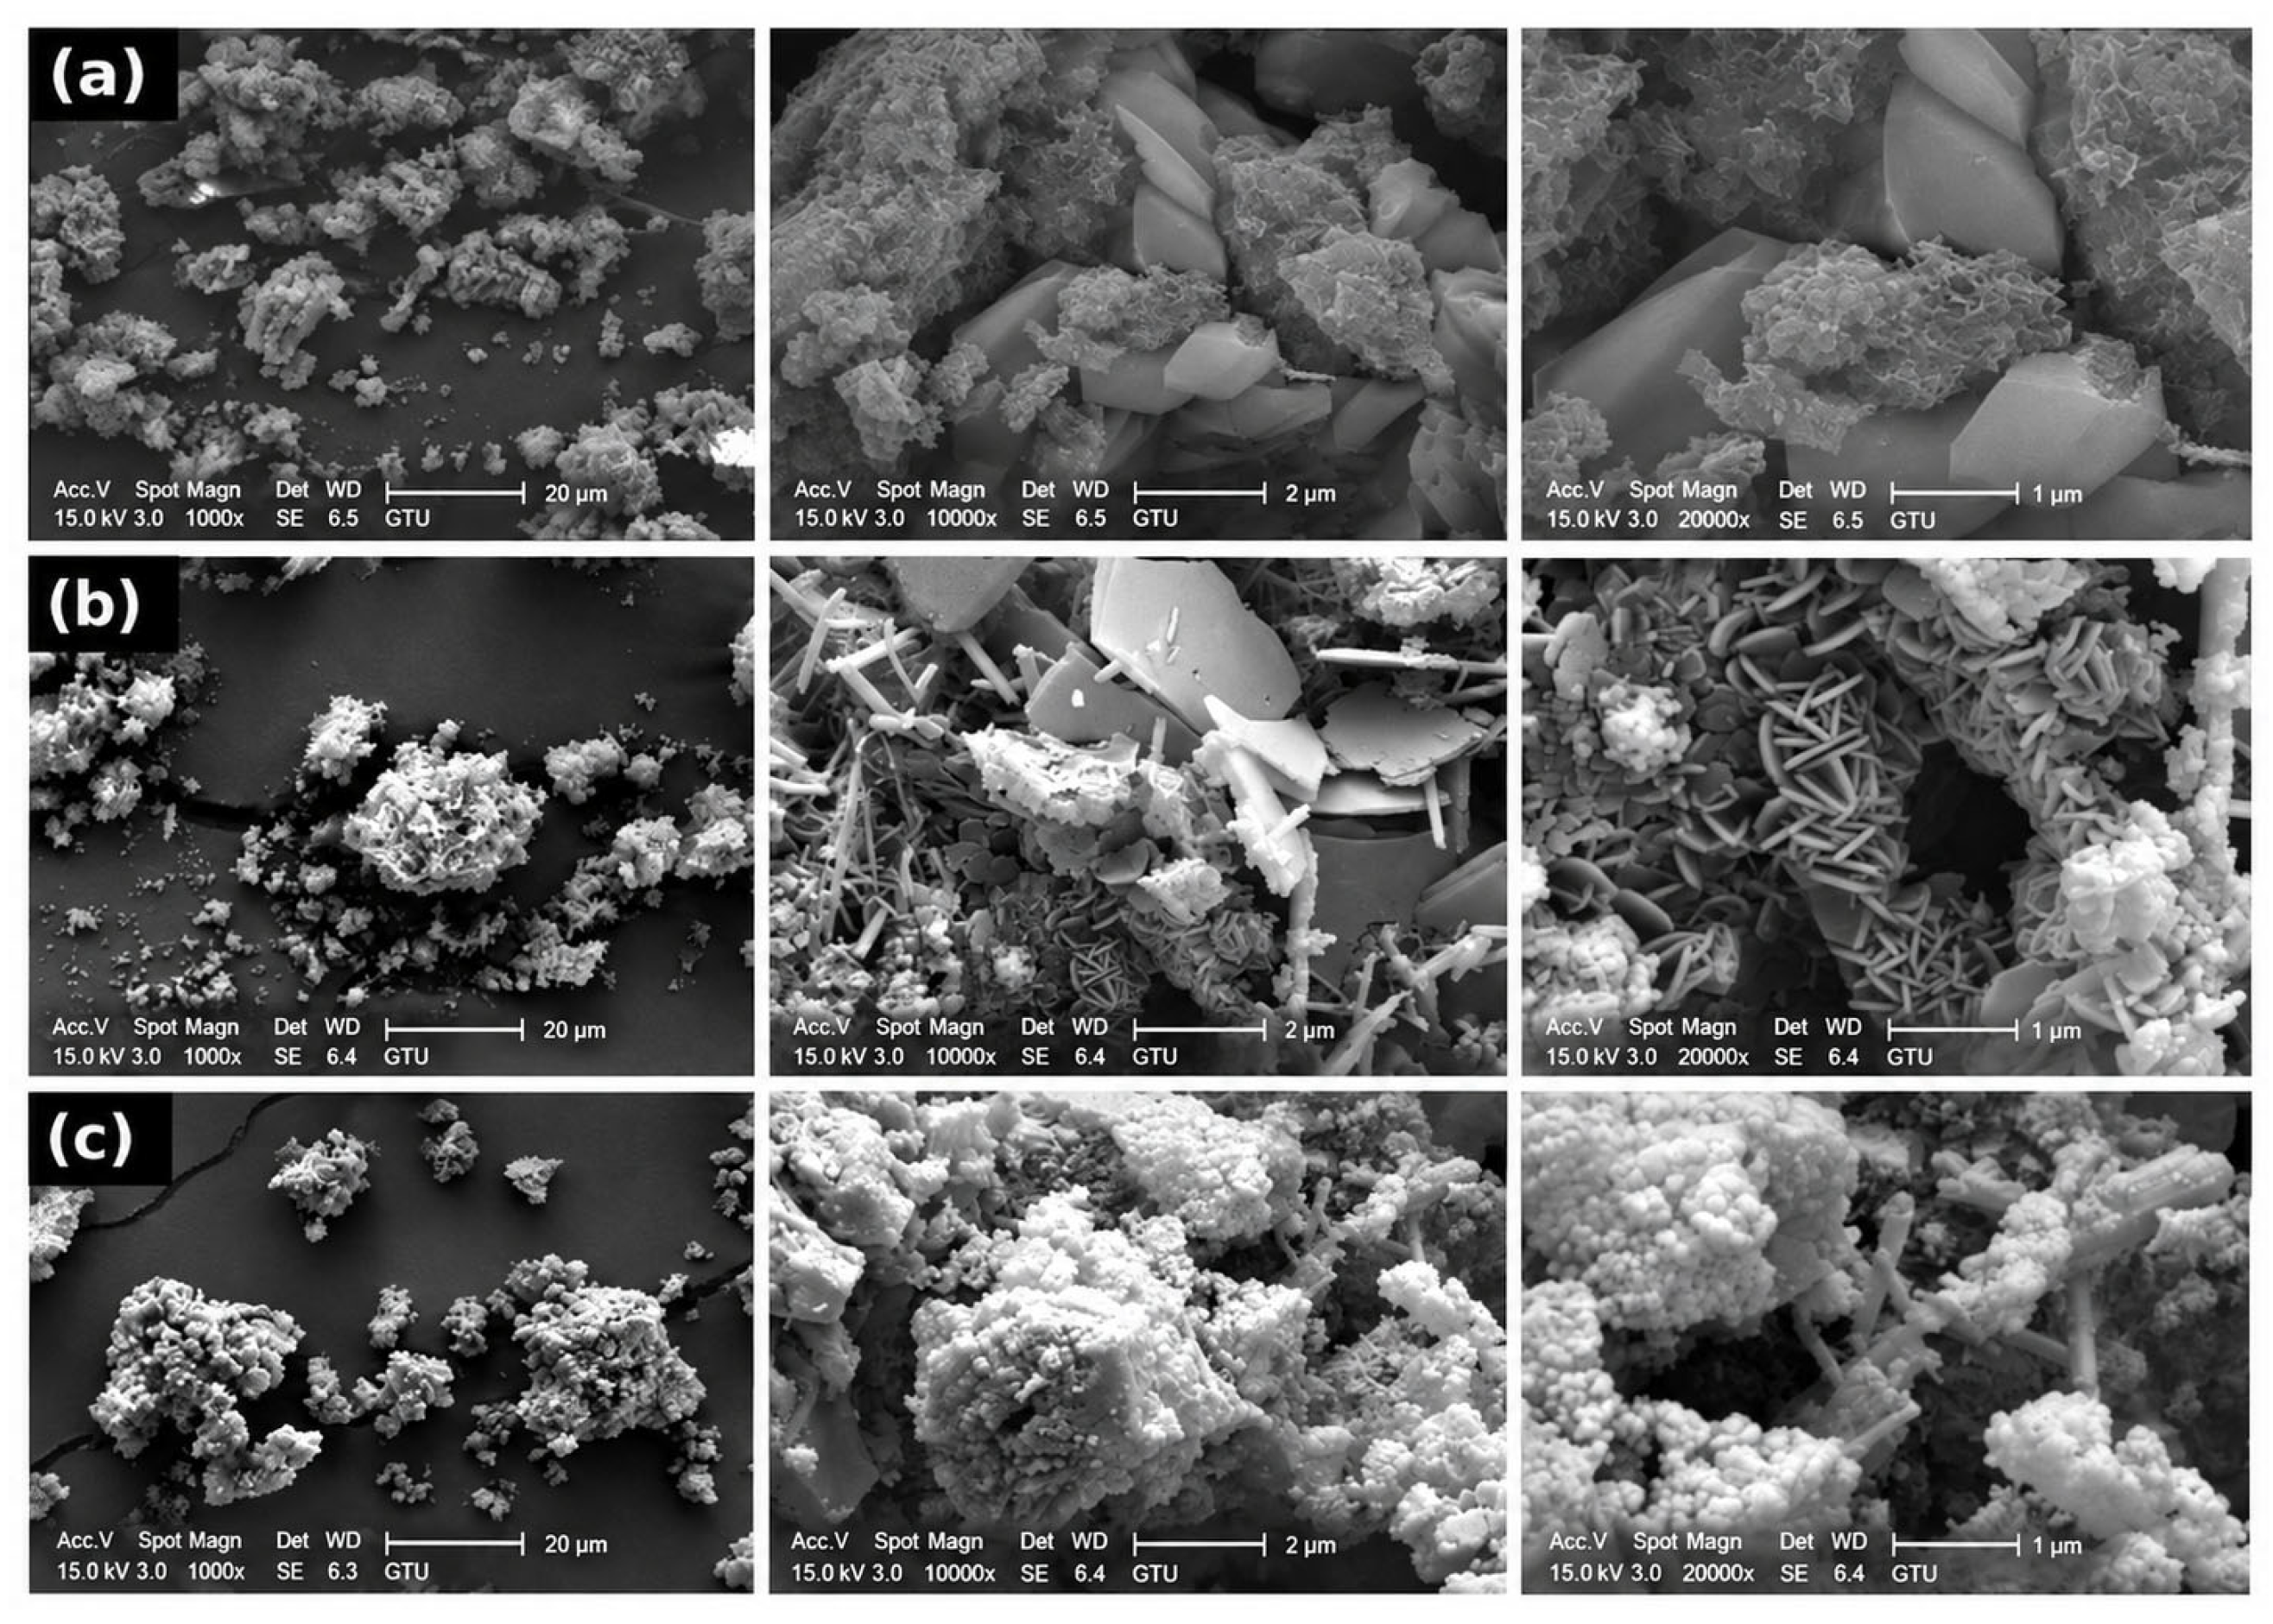
Figure 7 compares the 28-day microstructures of the control, C100-PBNS1 and the hybrid; the complete image sets at 1, 7 and 28 days are provided in Figures S4 and S5. The control showed clusters of fibrillar hydrates together with large, smooth plate-shaped crystals that are morphologically consistent with portlandite. C100-PBNS1 contained plates, needle-like crystals consistent with ettringite and rosette-like aggregates of platelets. The hybrid matrix was dominated by fine-grained granular hydrate clusters with fewer large plates, although needle-like crystals and voids were still present. Because C80-P20 was not imaged at the same magnifications, these differences cannot be attributed to the pumice–PBNS combination, and because only selected fields were imaged, they were not used to quantify porosity or phase contents. Local EDS analyses (Figure S6; Table S6) gave mean gave Ca/Si mass ratios between 1.3 and 4.1 without a consistent trend among the mixtures. In the 28-day C100-PBNS1 and hybrid samples, the Ca/Si ratios of the three analyzed fields ranged from 2.57 to 3.43 and from 1.51 to 2.43, respectively (Figure S6), indicating considerable local heterogeneity; the EDS data are therefore not used as mechanistic evidence.
Figure 7.
SEM micrographs of (a) C100, (b) C100-PBNS1 and (c) C80-P20-PBNS1 after 28 days of curing. From left to right, the original magnifications are 1000×, 10,000× and 20,000× (scale bars: 20, 2 and 1 µm).
4. Discussion
4.1. Age-Dependent Roles of PBNS and Pumice
The results only partly support the hypothesis. PBNS increased the 1-day strength of the cement-only binder by 40%, but the predicted early-strength compensation by PBNS was not observed in the pumice-containing grout: at day 1, PBNS lowered the mean strength of C80-P20 (0.91 vs. 1.07 MPa), although pumice alone had caused no detectable 1-day strength loss. The early-age deficit that PBNS was expected to offset appeared only at 7 days, when pumice reduced the strength by 43–49%. The early effect of PBNS in the cement-only binder is consistent with the nucleation and filler effects and the high pozzolanic reactivity of finely divided amorphous silica [26,29,30] and with the specific surface area of PBNS, 42 times that of the parent pumice (Section 2.2); it shows that a nanosilica derived from local pumice can act as an early-strength additive in an accelerated two-component system.
When 20 wt.% of the cement was replaced by pumice, PBNS no longer increased the 1-day strength. This antagonism was the most robust pumice × PBNS interaction in this study (I = −0.57 MPa, 95% CI −0.84 to −0.30 MPa; partial η2 = 0.75; Table 5) and remained significant after Holm adjustment (p = 0.004) and when unequal variances were allowed for (p = 0.003; Table S4). It did not reflect a strength deficit of the pumice grout: at day 1, C80-P20 did not differ significantly from the control (1.07 vs. 1.02 MPa), so pumice alone and PBNS alone were each neutral or beneficial, and only their combination lowered the mean strength. This contrasts with conventional binders, in which nanosilica has increased early strength even when large fractions of the cement are replaced by fly ash, slag or natural pozzolans [23,30], and with pumice-blended cement pastes without an accelerator, in which 0.5–2 wt.% nanosilica increases strength at almost all ages from 1 to 28 days [44]. Those pastes had a water-to-binder ratio of 0.26, whereas Component A of the present grout had a ratio of 2.59 (2.74 including the water of Component B) and an accelerator that consumed calcium within seconds. We propose that the antagonism arises from the accelerator chemistry of the two-component system. The sodium silicate of Component B reacts within seconds with the calcium released by the binder [9,10,14,15,16], and the nucleation and pozzolanic contributions of nanosilica draw on the same calcium and hydroxide ions [25,26,27,28,29]. Because the accelerator dosage was identical in all mixtures (Section 2.3) and PBNS was added in a fixed amount (Table 2), PBNS may have acted at day 1 as an additional calcium sink in a binder whose calcium supply had already been reduced: each unit of cement in the hybrid had to supply calcium to 25% more sodium silicate and 25% more PBNS than in C100-PBNS1, whereas C80-P20 carried only the additional silicate demand. This stoichiometric argument shows that the demand on the calcium supplied by the cement increases in the hybrid, but it does not demonstrate calcium limitation. A second, not mutually exclusive, explanation is related to water and dispersion: at constant water and binder contents, the water-to-cement ratio of Component A increased from 2.59 to 3.24 (from 2.74 to 3.42 including the water of Component B) when 20 wt.% of the cement was replaced, and the porous pumice and the high-surface PBNS both take up mixing water, which may promote PBNS agglomeration [32,33]. Particle packing, altered reaction kinetics and carbonation may also contribute. Isothermal calorimetry, pore solution analysis and time-resolved portlandite measurements would be required to distinguish between these explanations.
As cement hydration proceeds and portlandite accumulates, this calcium limitation, if present, should be relieved. By 7 days, when pumice dilution had produced the largest strength deficit (43–49% below the control), the sign of the interaction had already reversed: PBNS raised the mean strength of the pumice grout by 40% (1.50 vs. 1.07 MPa), although neither this difference nor the interaction (p = 0.060) was significant. At 28 days, the interaction was positive (I = +0.64 MPa, 95% CI 0.04–1.25 MPa; p = 0.039) but not significant after Holm adjustment (p = 0.079), and the hybrid reached the highest mean strength of all mixtures without differing significantly from the control or C80-P20; the change of the interaction between 1 and 28 days, however, was significant (p = 0.002). A possible explanation of the later positive interaction is the continued pozzolanic reaction of pumice [21,22] in a matrix whose early hydrates were seeded by PBNS, as reported for nanosilica combined with natural pozzolans and other SCMs [23,30]. The present microstructural data do not test this explanation, because the pumice-only grout C80-P20 was not included in the microstructural analyses (Section 2.6), and the XRD, FTIR and SEM–EDS analyses were qualitative and cannot separate the pozzolanic reaction from filler, dilution, carbonation or accelerator effects. Quantifying portlandite consumption and bound water (e.g., by thermogravimetry) and pore structure (e.g., by mercury intrusion porosimetry) would be required to confirm the mechanism.
The deformation data did not show the same positive interaction. Both 20 wt.% pumice and 1 wt.% PBNS reduced the 28-day strain at peak stress and raised Eapp to a similar level, and their combination gave no further stiffening. The 28-day strength gain of the hybrid is therefore not simply a consequence of higher stiffness and may involve improved resistance to crack growth at failure, which cannot be resolved with displacement-based measurements.
4.2. Implications for TBM Backfill and Limitations
From a practical perspective, the 20% cement reduction (64 kg/m3 in the reference formulation) was achieved by pumice alone: C80-P20 reduced bleeding, gelled within 9.2 s, and did not differ significantly from the control at 1 or 28 days, although it was 49% weaker at 7 days and equivalence was not tested. Adding PBNS to this grout lowered the mean 1-day strength (0.91 vs. 1.07 MPa) and raised the mean 28-day strength to the highest value of all mixtures (3.15 vs. 2.67 MPa), but neither difference was significant with three specimens, so a practical advantage of PBNS in the pumice grout remains to be established. The clearest benefit of PBNS was the 40% increase in the 1-day strength of the cement-only grout, and the interaction shows that this benefit is not transferred directly when part of the cement is replaced by pumice. At laboratory scale, PBNS synthesis is also reagent-intensive: the extraction step alone uses 18.0 g of NaOH per 2.5 g of activated pumice, i.e., about 10 g of NaOH per gram of PBNS at the silica recovery of 94% reported for this route [42], in addition to mineral acids and heat treatments at 500 and 800 °C. Economic and environmental advantages of adding PBNS are therefore not claimed; they would require a scaled, optimized process with reagent recovery and a life-cycle assessment.
The conclusions apply to the tested formulation window and to curing ages of 1–28 days. PBNS was used at a single dosage (1 wt.%; Section 2.3) and the hybrid at the pumice level selected in the screening stage, so that the individual and combined effects of the two additions could be isolated; the data therefore do not identify an optimal dosage, and a PBNS dose–response series (e.g., 0.5–3 wt.%) combined with several pumice levels, with 5–6 specimens per group from independent batches, is required. With three specimens per condition, the minimum detectable difference is about 0.70 MPa (Section 2.7), and the 28-day interaction is suggestive rather than established. Strength within the first hours after injection, which governs early support behind the shield, was not measured; gel time indicates the onset of gelation but not the load-bearing capacity of the grout, and short-term strength (e.g., by penetrometer tests [53]) should be determined. The fresh state indices were reported without replicate statistics and should be determined in replicate in further work; rheometric (yield stress, plastic viscosity and thixotropy) analysis, pot life and the effect of shear history were not determined.
The microstructural analyses were qualitative and did not include the pumice-only grout C80-P20. Testing the proposed mechanisms requires isothermal calorimetry, pore solution analysis, thermogravimetric quantification of portlandite and bound water, Rietveld analysis with an internal standard and pore structure measurements. Finally, the laboratory study did not address pumping over long lines, washout under groundwater flow, permeability, shrinkage and volume stability, bond to and interaction with the segmental lining, behavior under cyclic loading, or long-term durability (e.g., sulfate exposure and wet–dry cycles) [9,11,54]. Because the grouts contain the alkalis of Component B and the reactive silica of pumice and PBNS, long-term volume stability is a relevant test even in the absence of aggregate. These properties, together with field-scale pumping trials and a performance–cost comparison with established formulations (e.g., fly ash- or silica fume-modified grouts), should be evaluated before the formulation is used in the field.
5. Conclusions
This study evaluated natural pumice and pumice-based nanosilica (PBNS) synthesized from the same pumice and their combination in two-component TBM backfill grouts. With a specific surface area of 154 m2/g, 42 times that of the as-received pumice, PBNS provided a nano-scale silica additive from the same mineral source as the micro-scale pozzolan. Within the tested formulation window (1 wt.% PBNS, 20 wt.% pumice in the factorial design, 1–28 days, n = 3), the main conclusions are as follows:
- (1)
- Replacing 10–30 wt.% of the cement with pumice increased the Marsh efflux time from 34.2 s to 40.7–43.8 s and reduced bleeding from 2.0% to 0–0.5%; all tested grouts gelled within 8.1–10.6 s.
- (2)
- Pumice caused no detectable strength loss at day 1 but reduced the 7-day strength by 43–49%. At 28 days, C80-P20 did not differ significantly from the control (2.67 vs. 2.55 MPa; equivalence was not tested), and 20 wt.% was selected as the replacement level.
- (3)
- In the cement-only binder, 1 wt.% PBNS increased the 1-day UCS by 40% (1.43 vs. 1.02 MPa).
- (4)
- The pumice × PBNS interaction changed with curing age (p = 0.002). It was antagonistic at day 1: the early-strength benefit of PBNS in the cement-only grout was not retained in the pumice grout. At 28 days, the interaction was positive but not significant after multiplicity adjustment, and the higher mean UCS of the hybrid (3.15 MPa) did not differ significantly from that of the control (p = 0.16) or of C80-P20 (p = 0.34).
- (5)
- At 28 days, C80-P20, C100-PBNS1 and the hybrid failed at the lowest strains (approximately 1%) and formed the stiffest group. The XRD, FTIR and SEM EDS observations were qualitative; calcium competition between the accelerator and PBNS is proposed as the cause of the early-age antagonism, and this mechanism and that of the 28-day behavior require quantitative confirmation.
Overall, 20 wt.% pumice reduced the cement content of the two-component grout without a detectable 1- or 28-day strength loss. PBNS was most effective in the cement-only grout at day 1, whereas in the pumice grout its effect changed from antagonistic at day 1 to positive at 28 days, when the hybrid reached the highest mean strength. Nanosilica dosing in pumice-blended two-component grouts should therefore account for this age-dependent interaction. Short-term strength, rheology, durability, field-scale pumping trials and a life-cycle assessment are required before practical application.
Supplementary Materials
The following supporting information can be downloaded at: https://www.mdpi.com/article/10.3390/buildings16224595/s1, Figure S1. Characterization of PBNS: (a) XRD pattern, showing a broad amorphous halo centred at about 22° 2θ and no crystalline reflections; (b) zeta potential distribution of PBNS dispersed in water at 25 °C (mean −29.0 ± 1.6 mV, three measurements); Figure S2. Preparation and testing sequence of the grouts: weighing of the raw materials, ultrasonic dispersion of nanosilica, high-shear mixing of Component A, fresh-state tests (Marsh funnel, bleeding and gel time), specimen casting and curing, and uniaxial compression testing with axial deformation measurement (LVDT); Figure S3. Interaction plots of UCS for C100, C80-P20, C100-PBNS1 and C80-P20-PBNS1 at (a) 1, (b) 7 and (c) 28 days (mean ± SD, n = 3). Non-parallel lines indicate that the effect of PBNS depends on the presence of pumice; the interaction tests are given in Tables S4 and S5. Each panel gives the unadjusted F test of the interaction and the Holm-adjusted p value (adjusted across the three ages); after adjustment, only the 1-day interaction is significant; Figure S4. SEM micrographs of C100-PBNS1 after (a) 1, (b) 7 and (c) 28 days and of C80-P20-PBNS1 after (d) 1, (e) 7 and (f) 28 days. From left to right, the original magnifications are 500×, 2000× and 5000× in (a), 500×, 1000× and 2000× in (d), and 1000×, 10,000× and 20,000× in (b), (c), (e) and (f); Figure S5. SEM micrographs of the control C100 after (a) 1, (b) 7 and (c) 28 days. From left to right, the original magnifications are 1000×, 10,000× and 20,000×;Figure S6. SEM–EDS spectra (left) and SEM images of the analysed regions (right) of (a) C100-PBNS1 and (b) C80-P20-PBNS1 after 28 days of curing. EDS was performed on the three marked fields (Selected Areas 1–3, red rectangles); the compositions shown are the means of the three fields (Table S6), and the spectrum is representative. The Ca/Si mass ratios of Selected Areas 1, 2 and 3 were 2.57, 3.43 and 2.93 in (a) and 2.08, 2.43 and 1.51 in (b); Table S1. Two-way ANOVA (mixture × curing age) of UCS and apparent modulus (Eapp); 6 mixtures × 3 ages, n = 3 per cell (54 specimens); Table S2. One-way ANOVA of the mixture effect at each curing age (F(5,12)) and Welch’s ANOVA as a check against unequal variances; Table S3. Tukey HSD adjusted p values for pairwise comparisons of UCS at each age and of Eapp at 28 days; Table S4. Two-way ANOVA of UCS for the pumice × PBNS subset (C100, C80-P20, C100-PBNS1 and C80-P20-PBNS1; pumice 0/20 wt.% × PBNS 0/1 wt.%) at each curing age; Table S5. Three-way ANOVA (pumice × PBNS × curing age) of UCS for the factorial subset C100, C80-P20, C100-PBNS1 and C80-P20-PBNS1 (pumice 0/20 wt.%, PBNS 0/1 wt.%; 1, 7 and 28 days; n = 3 per cell, 36 specimens); Table S6. Local SEM–EDS elemental compositions (wt.%; mean of three analysed fields per sample) and Ca/Si mass ratios.
Author Contributions
Conceptualization, U.C.Ç. and S.B.; methodology, U.C.Ç. and S.B.; validation, U.C.Ç. and S.B.; formal analysis, U.C.Ç. and S.B.; investigation, U.C.Ç., Ş.E.Z., D.Z., M.E.A. and B.Z.; resources, H.E. and S.B.; data curation, U.C.Ç. and S.B.; writing—original draft preparation, U.C.Ç. and S.B.; writing—review and editing, U.C.Ç. and S.B.; visualization, U.C.Ç., Ş.E.Z. and S.B.; supervision, H.E. and S.B.; project administration, H.E. and S.B.; funding acquisition, H.E. and S.B. All authors have read and agreed to the published version of the manuscript.
Funding
This research was funded by the Scientific Research Projects Coordination Unit of Istanbul Technical University (ITU BAP), under the General Research Project (GAP) scheme, grant number MGA-2023-44663.
Data Availability Statement
The data presented in this study are available on request from the corresponding author.
Conflicts of Interest
The authors declare no conflicts of interest. The funders had no role in the design of the study; in the collection, analyses, or interpretation of data; in the writing of the manuscript; or in the decision to publish the results.
References
- Jiang, X.; Zhu, H.; Yan, Z.; Zhang, F.; Ye, F.; Li, P.; Zhang, X.; Dai, Z.; Bai, Y.; Huang, B. A state-of-art review on development and progress of backfill grouting materials for shield tunneling. Dev. Built Environ. 2023, 16, 100250. [Google Scholar] [CrossRef] [Scilit]
- Ma, Q.; Zhang, X.; Shu, H. Innovative Grouting Reinforcement Techniques for Shield Tunnels: A Case Study on Surface Settlement Mitigation. Appl. Sci. 2025, 15, 4623. [Google Scholar] [CrossRef] [Scilit]
- Zhu, C.; Fu, J.; Wang, H.; Xia, Y.; Yang, J.; Wang, S. A Review of Grout Diffusion Mechanisms and Quality Assessment Techniques for Backfill Grouting in Shield Tunnels. Buildings 2026, 16, 97. [Google Scholar] [CrossRef] [Scilit]
- Liang, J.; Liu, W.; Yin, X.; Li, W.; Yang, Z.; Yang, J. Experimental study on the performance of shield tunnel tail grout in ground. Undergr. Space 2025, 20, 277–292. [Google Scholar] [CrossRef] [Scilit]
- Liu, W.; Liang, J.; Xu, T. Tunnelling-induced ground deformation subjected to the behavior of tail grouting materials. Tunn. Undergr. Space Technol. 2023, 140, 105253. [Google Scholar] [CrossRef] [Scilit]
- Jin-Long, L.; Hamza, O.; Davies-Vollum, K.S.; Jie-Qun, L. Repairing a shield tunnel damaged by secondary grouting. Tunn. Undergr. Space Technol. 2018, 80, 313–321. [Google Scholar] [CrossRef] [Scilit]
- Ding, W.; Duan, C.; Zhu, Y.; Zhao, T.; Huang, D.; Li, P. The behavior of synchronous grouting in a quasi-rectangular shield tunnel based on a large visualized model test. Tunn. Undergr. Space Technol. 2019, 83, 409–424. [Google Scholar] [CrossRef] [Scilit]
- Sharghi, M.; Chakeri, H.; Ozcelik, Y. Investigation into the effects of two component grout properties on surface settlements. Tunn. Undergr. Space Technol. 2017, 63, 205–216. [Google Scholar] [CrossRef] [Scilit]
- Kim, T.-Y.; Ryu, G.U.; Ryu, H.-H.; Jang, J.-H.; Kwon, T.-H.; An, J.-B.; Chong, S.-H. Rheological performance and strength on two component backfilling grout in shield TBM. Sci. Rep. 2026, 16, 1831. [Google Scholar] [CrossRef] [Scilit] [PubMed]
- Mohammadzamani, D.; Alimardani Lavasan, A.; Wichtmann, T. On Design and Assessment of Tail Void Grouting Material in Mechanized Tunneling: A Review. Geotech. Geol. Eng. 2023, 41, 4233–4255. [Google Scholar] [CrossRef] [Scilit]
- Todaro, C.; Carigi, A.; Peila, D. Durability of Two-Component Grout in Tunneling Applications: A Laboratory Test Campaign. Geosciences 2024, 14, 302. [Google Scholar] [CrossRef] [Scilit]
- Wang, D.; Li, Z.; Qi, Y.; Wei, D.; Zhao, X.; Zhang, J.; Min, F. Study on the Performance Evolution Law and Microscopic Mechanism of Cement–Sodium Silicate Grout Prepared by Seawater. Materials 2026, 19, 971. [Google Scholar] [CrossRef] [Scilit] [PubMed]
- Bezuijen, A.; Talmon, A.M.; Kaalberg, F.J.; Plugge, R. Field Measurements of Grout Pressures During Tunnelling of the Sophia Rail Tunnel. Soils Found. 2004, 44, 39–48. [Google Scholar] [CrossRef] [Scilit]
- Wang, S.; He, C.; Nie, L.; Zhang, G. Study on the long-term performance of cement-sodium silicate grout and its impact on segment lining structure in synchronous backfill grouting of shield tunnels. Tunn. Undergr. Space Technol. 2019, 92, 103015. [Google Scholar] [CrossRef] [Scilit]
- Di Giulio, A.; Di Felice, M.; Valiante, N.; De Carli, G. Single and two-component grout as high-performance backfilling materials. In Expanding Underground—Knowledge and Passion to Make a Positive Impact on the World; CRC Press: London, UK, 2023; pp. 1241–1248. [Google Scholar] [CrossRef] [Scilit]
- Peila, D.; Borio, L.; Pelizza, S. The behaviour of a two-component back-filling grout used in a tunnel-boring machine. Acta Geotech. Slov. 2011, 8, 5–15. [Google Scholar]
- Liu, C.; Li, Z.; Bezuijen, A.; Chen, L.; Cachim, P. Optimizing the shield tunnel backfilling grouts with supplementary cementitious materials by response surface methodology. Constr. Build. Mater. 2024, 421, 135575. [Google Scholar] [CrossRef] [Scilit]
- Mao, J.-H.; Yuan, D.-J.; Jin, D.-L.; Zeng, J.-F. Optimization and application of backfill grouting material for submarine tunnel. Constr. Build. Mater. 2020, 265, 120281. [Google Scholar] [CrossRef] [Scilit]
- Hossain, K.M.A. Volcanic ash and pumice as cement additives: Pozzolanic, alkali-silica reaction and autoclave expansion characteristics. Cem. Concr. Res. 2005, 35, 1141–1144. [Google Scholar] [CrossRef] [Scilit]
- Madani, H.; Norouzifar, M.N.; Rostami, J. The synergistic effect of pumice and silica fume on the durability and mechanical characteristics of eco-friendly concrete. Constr. Build. Mater. 2018, 174, 356–368. [Google Scholar] [CrossRef] [Scilit]
- Seraj, S.; Cano, R.; Ferron, R.D.; Juenger, M.C.G. The role of particle size on the performance of pumice as a supplementary cementitious material. Cem. Concr. Compos. 2017, 80, 135–142. [Google Scholar] [CrossRef] [Scilit]
- Moolchandani, K. Advancements in pumice-based concrete: A comprehensive review. Next Mater. 2025, 8, 100646. [Google Scholar] [CrossRef] [Scilit]
- Ramezanianpour, A.A.; Mortezaei, M.; Mirvalad, S. Synergic effect of nano-silica and natural pozzolans on transport and mechanical properties of blended cement mortars. J. Build. Eng. 2021, 44, 102667. [Google Scholar] [CrossRef] [Scilit]
- Gündüz, L.; Şapçı, N.; Davraz, M. The pumice mining industry and its importance for Türkiye. In Proceedings of the 19th International Mining Congress and Fair of Turkey (IMCET 2005), İzmir, Türkiye; Chamber of Mining Engineers of Turkey: Ankara, Türkiye, 2005; pp. 397–407. (In Turkish) [Google Scholar]
- Aggarwal, P.; Singh, R.P.; Aggarwal, Y. Use of nano-silica in cement based materials—A review. Cogent Eng. 2015, 2, 1078018. [Google Scholar] [CrossRef] [Scilit]
- Singh, L.P.; Karade, S.R.; Bhattacharyya, S.K.; Yousuf, M.M.; Ahalawat, S. Beneficial role of nanosilica in cement based materials—A review. Constr. Build. Mater. 2013, 47, 1069–1077. [Google Scholar] [CrossRef] [Scilit]
- Yang, H.; Monasterio, M.; Zheng, D.; Cui, H.; Tang, W.; Bao, X.; Chen, X. Effects of nano silica on the properties of cement-based materials: A comprehensive review. Constr. Build. Mater. 2021, 282, 122715. [Google Scholar] [CrossRef] [Scilit]
- Khan, K.; Ahmad, W.; Amin, M.N.; Nazar, S. Nano-Silica-Modified Concrete: A Bibliographic Analysis and Comprehensive Review of Material Properties. Nanomaterials 2022, 12, 1989. [Google Scholar] [CrossRef] [Scilit] [PubMed]
- Li, H.; Xiao, H.-G.; Yuan, J.; Ou, J. Microstructure of cement mortar with nano-particles. Compos. Part B Eng. 2004, 35, 185–189. [Google Scholar] [CrossRef] [Scilit]
- Zhang, M.-H.; Islam, J. Use of nano-silica to reduce setting time and increase early strength of concretes with high volumes of fly ash or slag. Constr. Build. Mater. 2012, 29, 573–580. [Google Scholar] [CrossRef] [Scilit]
- Ibrahim, M.; Megat Johari, M.A.; Rahman, M.K.; Maslehuddin, M.; Mohamed, H.D. Enhancing the engineering properties and microstructure of room temperature cured alkali activated natural pozzolan based concrete utilizing nanosilica. Constr. Build. Mater. 2018, 189, 352–365. [Google Scholar] [CrossRef] [Scilit]
- Quercia, G.; Hüsken, G.; Brouwers, H.J.H. Water demand of amorphous nano silica and its impact on the workability of cement paste. Cem. Concr. Res. 2012, 42, 344–357. [Google Scholar] [CrossRef] [Scilit]
- Senff, L.; Labrincha, J.A.; Ferreira, V.M.; Hotza, D.; Repette, W.L. Effect of nano-silica on rheology and fresh properties of cement pastes and mortars. Constr. Build. Mater. 2009, 23, 2487–2491. [Google Scholar] [CrossRef] [Scilit]
- Reches, Y.; Thomson, K.; Helbing, M.; Kosson, D.S.; Sanchez, F. Agglomeration and reactivity of nanoparticles of SiO2, TiO2, Al2O3, Fe2O3, and clays in cement pastes and effects on compressive strength at ambient and elevated temperatures. Constr. Build. Mater. 2018, 167, 860–873. [Google Scholar] [CrossRef] [Scilit]
- Todaro, C. Grouting of cohesionless soils by means of colloidal nanosilica. Case Stud. Constr. Mater. 2021, 15, e00577. [Google Scholar] [CrossRef] [Scilit]
- Boschi, K.; di Prisco, C.G.; Grassi, D.; Modoni, G.; Salvatore, E. Nanosilica Grout Permeation in Sand: Experimental Investigation and Modeling. J. Geotech. Geoenviron. Eng. 2024, 150, 04023129. [Google Scholar] [CrossRef] [Scilit]
- Zhang, H.; Wang, L.; Chen, J.; Chen, H.; Wu, W.; Li, J.; Lu, H.; Hu, D.; Huang, H. Study on the Influence and Performance of Nano SiO2 on Solid Waste Grouting Material. Materials 2025, 18, 4110. [Google Scholar] [CrossRef] [Scilit] [PubMed]
- Zhao, J.; Song, W.; Zha, F.; Kang, B.; Wang, Q.; Yu, L. The role of nano-silica in modifying cement-sodium silicate two-component grouts: Unraveling performance and mechanism. Mater. Today Commun. 2026, 52, 114957. [Google Scholar] [CrossRef] [Scilit]
- Zhang, C.; Du, C.; Wang, L.; Yi, F.; Sun, Q.; Shi, K. Performance and mechanism of cement-based grouting materials modified by permeable crystalline materials and nano-SiO2. Mater. Struct. 2026, 59, 89. [Google Scholar] [CrossRef] [Scilit]
- Manurung, P.; Ginting, E.S.; Ginting, E. Suprihatin Synthesis and Characterisation of Nano-silica Based on Pumice Using NaOH. J. Phys. Sci. 2022, 33, 17–28. [Google Scholar] [CrossRef] [Scilit]
- Muhammud, A.M.; Edossa, G.D.; Sabir, F.K. Optimizing the synthesis of nanostructured SiO2 from Ethiopian pumice for use in rubber reinforcement. Sci. Rep. 2025, 15, 19948. [Google Scholar] [CrossRef] [Scilit] [PubMed]
- Mourhly, A.; Khachani, M.; Hamidi, A.E.; Kacimi, M.; Halim, M.; Arsalane, S. The Synthesis and Characterization of Low-Cost Mesoporous Silica SiO2 from Local Pumice Rock. Nanomater. Nanotechnol. 2015, 5, 35. [Google Scholar] [CrossRef] [Scilit] [PubMed]
- Mourhly, A.; Jhilal, F.; El Hamidi, A.; Halim, M.; Arsalane, S. Highly efficient production of mesoporous nano-silica from unconventional resource: Process optimization using a Central Composite Design. Microchem. J. 2019, 145, 139–145. [Google Scholar] [CrossRef] [Scilit]
- Bayoumi, A.A.; El-Gamal, S.M.A.; Khedr, M.H.; El Rouby, W.M.A.; Mohamed, O.A. Effect of nano-silica on the thermal resistance and mechanical properties of pumice-blended cement pastes. Beni-Suef Univ. J. Basic Appl. Sci. 2026, 15, 53. [Google Scholar] [CrossRef] [Scilit]
- Bayoumi, A.A.; El-Gamal, S.M.A.; Khedr, M.H.; El Rouby, W.M.A.; Mohamed, O.A. Promoting the mechanical features and thermal endurance of OPC–Pumice composites using functionalized multi-walled carbon nanotubes grafted with nano-silica. Innov. Infrastruct. Solut. 2025, 10, 550. [Google Scholar] [CrossRef] [Scilit]
- Çalışkan, U.C.; Beyhan, S.; Ergin, H. Pumice mineral using as a backfill grout injection in TBM excavations. In Tunnelling for a Better Life, Proceedings of the ITA-AITES World Tunnel Congress (WTC 2024), Shenzhen, China, 19–25 April 2024; Yan, J., Celestino, T., Thewes, M., Eberhardt, E., Eds.; CRC Press: London, UK, 2024; pp. 1663–1668. [Google Scholar]
- ASTM C618-19; Standard Specification for Coal Fly Ash and Raw or Calcined Natural Pozzolan for Use in Concrete. ASTM International: West Conshohocken, PA, USA, 2019.
- Roussel, N.; Le Roy, R. The Marsh cone: A test or a rheological apparatus? Cem. Concr. Res. 2005, 35, 823–830. [Google Scholar] [CrossRef] [Scilit]
- Nguyen, V.-H.; Remond, S.; Gallias, J.-L. Influence of cement grouts composition on the rheological behaviour. Cem. Concr. Res. 2011, 41, 292–300. [Google Scholar] [CrossRef] [Scilit]
- ASTM C942/C942M-21; Standard Test Method for Compressive Strength of Grouts for Preplaced-Aggregate Concrete in the Laboratory. ASTM International: West Conshohocken, PA, USA, 2021.
- ASTM C109/C109M-23; Standard Test Method for Compressive Strength of Hydraulic Cement Mortars (Using 2-in. or [50 mm] Cube Specimens). ASTM International: West Conshohocken, PA, USA, 2023.
- Virtanen, P.; Gommers, R.; Oliphant, T.E.; Haberland, M.; Reddy, T.; Cournapeau, D.; Burovski, E.; Peterson, P.; Weckesser, W.; Bright, J.; et al. SciPy 1.0: Fundamental algorithms for scientific computing in Python. Nat. Methods 2020, 17, 261–272. [Google Scholar] [CrossRef] [Scilit] [PubMed]
- Todaro, C.; Bongiorno, M.; Carigi, A.; Martinelli, D. Short term strength behavior of two-component backfilling in shield tunneling: Comparison between standard penetrometer test results and UCS. Geoing. Ambient. Min. 2020, 159, 33–40. [Google Scholar]
- Peila, D.; Chieregato, A.; Martinelli, D.; Oñate Salazar, C.; Shah, R.; Boscaro, A.; Dal Negro, E.; Picchio, A. Long term behavior of two component back-fill grout mix used in full face mechanized tunneling. Geoing. Ambient. Min. 2015, 144, 57–63. [Google Scholar]
- Yu, P.; Kirkpatrick, R.J.; Poe, B.; McMillan, P.F.; Cong, X. Structure of calcium silicate hydrate (C-S-H): Near-, mid-, and far-infrared spectroscopy. J. Am. Ceram. Soc. 1999, 82, 742–748. [Google Scholar] [CrossRef] [Scilit]
- Ylmén, R.; Jäglid, U.; Steenari, B.-M.; Panas, I. Early hydration and setting of Portland cement monitored by IR, SEM and Vicat techniques. Cem. Concr. Res. 2009, 39, 433–439. [Google Scholar] [CrossRef] [Scilit]
- Trezza, M.A.; Lavat, A.E. Analysis of the system 3CaO·Al2O3–CaSO4·2H2O–CaCO3–H2O by FT-IR spectroscopy. Cem. Concr. Res. 2001, 31, 869–872. [Google Scholar] [CrossRef] [Scilit]
- García-Lodeiro, I.; Fernández-Jiménez, A.; Blanco, M.T.; Palomo, A. FTIR study of the sol–gel synthesis of cementitious gels: C–S–H and N–A–S–H. J. Sol.-Gel Sci. Technol. 2008, 45, 63–72. [Google Scholar] [CrossRef] [Scilit]

Disclaimer/Publisher’s Note: The statements, opinions and data contained in all publications are solely those of the individual author(s) and contributor(s) and not of MDPI and/or the editor(s). MDPI and/or the editor(s) disclaim responsibility for any injury to people or property resulting from any ideas, methods, instructions or products referred to in the content. |
© 2026 by the authors. Licensee MDPI, Basel, Switzerland. This article is an open access article distributed under the terms and conditions of the Creative Commons Attribution (CC BY) license.