


Abstract
Following the 6 February 2023 Kahramanmaraş earthquakes, wide-span public buildings were used for temporary collective shelter despite limited evidence concerning their spatial suitability and supporting infrastructure. This study evaluates the plan-based spatial performance of 39 public buildings across three provinces, including 33 used for collective shelter, through a criterion-based Building Performance Evaluation approach. Architectural plans, field data, and retrospectively reported peak user loads were used to assess functional spatial composition, existing and convertible shelter area, sanitation provision, and quantitative accessibility. Descriptive analyses, humanitarian reference comparisons, hierarchical clustering, and sensitivity and robustness assessments were conducted. Among buildings with reported user-load data, 30.3% met the 3.5 m2/person reference based on Net Shelter Area, increasing to 48.5% when convertible areas were included. However, sanitation provision was the governing capacity constraint, individually or jointly, in 22 of the 39 buildings under existing spatial capacity and 35 when convertible areas were considered. Three exploratory spatial profiles were identified, although area-to-user ratios did not differ significantly among clusters and cluster stability was limited. Because user loads were retrospectively estimated, demand-based indicators represent screening measures rather than verified overnight occupancy conditions. The findings suggest that pre-disaster shelter planning should distinguish existing shelter area, convertible spatial reserves, and infrastructure-supported capacity rather than relying on total floor area or a single theoretical capacity estimate.
1. Introduction
On 6 February 2023, two major earthquakes of magnitudes Mw 7.7 and Mw 7.6, as reported by AFAD, affected eleven provinces in southeastern Türkiye, causing more than 50,000 fatalities and widespread damage to the building stock [1,2,3,4,5]. As millions of people faced an urgent need for shelter, sports halls, youth centers, exhibition halls, and other wide-span public buildings were used for temporary collective shelter (Figure 1a–c). The use of existing public buildings for post-disaster shelter is also envisaged in Türkiye’s disaster management regulations, which require suitable buildings to be identified in advance and registered in the disaster management system together with their capacities [6]. However, the 6 February earthquakes required these buildings to be rapidly adapted for collective shelter, a function different from their original uses, making the spatial adequacy of the existing building stock for this purpose an important issue for evaluation.
Figure 1.
Interior views of a wide-span public building used for temporary collective shelter following the 2023 Kahramanmaraş earthquakes: (a–c) different views of the same building (source: photograph archive of the first author).
Post-disaster shelter is regarded as a dynamic process comprising successive stages [7,8], with temporary collective shelter centers constituting an important intermediate stage in the transition from emergency shelter to more permanent solutions [9,10,11]. Although the use of existing public buildings for this purpose can rapidly provide shelter capacity, their original spatial programs were not designed to accommodate continuous shelter needs. The adaptation of existing building stock to new functions has been extensively addressed in the architectural literature within the context of adaptive reuse [12,13,14]; however, these studies predominantly focus on planned and permanent transformations, while sudden and temporary changes in use under disaster conditions have received comparatively limited attention.
The post-disaster shelter literature has predominantly focused on the design and performance of temporary shelter units and settlements, as well as shelter site selection, capacity planning, and accessibility [15,16,17,18,19]. Studies addressing existing public buildings likewise tend to examine location, accessibility, and general suitability criteria, while interior spatial organization, functional area distribution, and their relationship with shelter capacity have received more limited attention [20]. Thus, although the literature provides a substantial body of knowledge regarding which buildings can be used for shelter and where they should be located, the extent to which the interior spaces of existing buildings can support the collective shelter function remains insufficiently understood.
This gap is particularly important because international humanitarian standards directly relate collective shelter performance to spatial indicators. Criteria such as minimum living space per person, sanitation capacity per user, and the provision of accessible facilities are among the fundamental performance requirements for collective shelter [10,11,21]. However, because the interior spatial organization of wide-span public buildings such as sports halls, youth centers, and exhibition facilities is shaped by their original programs of use, total building area alone does not indicate shelter capacity. Assessing the suitability of these buildings for post-disaster shelter therefore requires the joint consideration of total area, the areas allocated to shelter, circulation, sanitation, and support functions, as well as existing facility capacity.
This need is also relevant to pre-disaster capacity planning in Türkiye. National disaster response and risk reduction plans address advance planning for post-disaster shelter and the identification of potentially usable spaces as components of institutional disaster management [22,23]. Nevertheless, there is no standardized evaluation procedure specifying the interior spatial variables and calculation methods through which the collective shelter capacity of existing wide-span public buildings should be assessed. This highlights the need for a replicable and measurable spatial performance approach for evaluating existing public buildings as a pre-disaster shelter reserve.
To address this gap, this study evaluates the spatial performance of 39 wide-span public buildings examined in Province A, Province B, and Province C following the 6 February 2023 earthquakes, using a plan-based approach within the framework of Building Performance Evaluation (BPE) [24,25]. Of the buildings examined, 33 were used for temporary collective shelter following the earthquakes, whereas six were included in the investigated building stock but were not put into use for this purpose. The functional area distributions and spatial performance indicators of the buildings were determined from architectural plans and field data; relevant indicators were compared with international reference values, and similar spatial performance profiles were examined through hierarchical cluster analysis.
The study makes two main contributions. First, it advances building-scale performance assessment in post-disaster shelter research by examining how the functional spatial composition of existing wide-span public buildings affects their capacity to accommodate temporary collective shelter. Second, it distinguishes between existing shelter capacity and convertible spatial reserve and evaluates these spatial resources in conjunction with sanitation capacity and accessibility. In doing so, the study provides an empirical, plan-based framework for identifying performance trade-offs that may remain obscured when shelter suitability is assessed primarily through total floor area or nominal capacity. The framework is intended to support the pre-disaster evaluation and capacity planning of existing public buildings that may undergo rapid functional transition to collective shelter use.
Accordingly, the study addresses the following research questions:
RQ1. How can the spatial performance of wide-span public buildings for collective shelter be defined and compared using plan-based spatial variables?
RQ2. What patterns emerge in the user-load-based performance of buildings used for collective shelter and the plan-based capacity of the examined building stock when assessed against international post-disaster shelter reference values?
RQ3. Can groups of buildings with similar spatial performance indicators be identified, and what common spatial performance characteristics define these groups?
2. Literature Review/Conceptual Framework
2.1. Temporary Collective Shelter Centers and the Post-Disaster Use of Wide-Span Public Buildings
Post-disaster temporary collective shelter centers are facilities in which existing public buildings or buildings intended for collective use are used to temporarily accommodate displaced populations [10]. These centers are not limited to providing physical shelter but are also regarded as components of disaster response that support health, safety, access to essential services, and the continuity of community life [9,16,26].
In the classification proposed by Corsellis and Vitale [9], post-disaster settlements are divided into dispersed and grouped settlements. This study focuses on collective centers within grouped settlements, where existing buildings are converted for temporary shelter use (Figure 2).
Figure 2.
Typology of temporary settlements for post-disaster displaced populations (source: redrawn by the authors based on Corsellis and Vitale [9]).
The establishment of collective shelter centers in existing buildings enables existing spatial and technical infrastructure to be rapidly utilized for shelter purposes [9,10]. International guidelines identify schools, sports halls, community centers, and similar existing buildings among the building types that may be used for collective shelter [10]. In Türkiye, existing public and publicly used buildings, including sports halls, youth centers, and fair centers, were used for temporary shelter following the 6 February 2023 earthquakes [27,28]. The youth centers examined in this study were included in the research scope because they contain wide-span sports spaces. The fair and congress center included in the sample was similarly considered within this scope because of its wide-span enclosed exhibition space and its actual use for shelter following the earthquakes. However, converting these buildings, which were not designed for continuous living, into collective shelters may require various spatial adaptations in the organization of shelter, circulation, sanitation, and support functions [10,15,16].
2.2. International Standards, Guidelines, and Spatial Performance Criteria for Post-Disaster Temporary Collective Shelter
2.2.1. The Role of International Standards in Post-Disaster Shelter
The performance of post-disaster shelter cannot be characterized by capacity alone, as shelter solutions involve multiple and potentially competing requirements. Recent research has similarly emphasized integrated performance assessment across environmental, techno-economic, and resilience dimensions in post-disaster shelter solutions [29]. Previous comparative research has therefore evaluated post-disaster shelter designs across multiple performance dimensions; for example, Zea Escamilla and Habert [30] compared twenty shelter designs in terms of environmental, economic, and technical performance. For temporary collective shelter centers in existing buildings, performance similarly extends beyond accommodating a given number of users and includes spatial and functional requirements associated with living conditions and essential services. In this context, standards and technical guidelines developed by international humanitarian organizations provide a common reference framework for the planning, implementation, and evaluation of post-disaster shelter [10,11,31].
Within this framework, the Sphere Handbook defines minimum humanitarian standards and threshold values for fundamental requirements such as living space per person and sanitation [11], while the UNHCR Handbook for Emergencies and the Collective Centre Guidelines address planning and operational principles for the conversion of existing public buildings into collective shelters [10,31]. The IFRC’s All Under One Roof guideline specifically emphasizes accessibility and inclusive design principles, addressing access to shelter services for different user groups [21]. Considered together, these sources demonstrate that collective shelter extends beyond the provision of sufficient enclosed space and encompasses interrelated spatial requirements, including living space, sanitation, functional organization, and accessibility. Accordingly, this study focuses on those dimensions of this framework that can be measured using architectural plans and field data.
2.2.2. Key Spatial Performance Criteria for Temporary Collective Shelter Buildings
The spatial performance of temporary collective shelter buildings is addressed through interrelated components, including the provision of adequate living space, sanitation capacity sufficient to accommodate user density, the spatial organization of essential functions, and access to these services for different user groups [10,11,21,32]. In accordance with the requirements defined in international humanitarian standards and technical guidelines, this study identifies living space, sanitation capacity, functional spatial organization, and accessibility as four key dimensions of spatial performance. Table 1 summarizes how these dimensions were operationalized as measurable indicators derived from architectural plans and field data, together with the reference criteria used for evaluation.
Table 1.
Spatial performance indicators, references, and evaluation criteria used in this study.
Living space is one of the fundamental spatial requirements for enabling users to maintain shelter and basic daily activities. The Sphere Handbook specifies a minimum of 3.5 m2 of covered living space per person for planning purposes and notes that this requirement may vary depending on climatic conditions, duration of use, and user profile [11]. UNHCR [31] also emphasizes the importance of adequate living space in addressing users’ physical and psychosocial needs, particularly under prolonged collective shelter conditions. Within this framework, in addition to net shelter area per person based on existing shelter space, potential usable area was considered as a separate indicator to assess the effect of spatial reserves that could be converted to shelter use on potential capacity. The 3.5 m2/person value was adopted as a common baseline for plan-based comparison across the examined building stock. However, Sphere guidance [11] also identifies a higher range of 4.5–5.5 m2/person for cold climates or settings in which additional domestic functions are accommodated within the living space. Accordingly, the selected baseline should not be interpreted as a universally sufficient living-space requirement under all climatic and operational conditions. Its application in this study was intended to provide a consistent screening reference, while recognizing that context-specific planning may require higher spatial allowances.
Sanitation capacity is directly related to the demand placed on existing facilities during collective shelter use. However, humanitarian reference values vary according to the phase and anticipated duration of the emergency response. The Sphere Handbook [11] distinguishes between short-term communal sanitation provision, for which a reference of 50 persons per toilet is indicated, and medium- to long-term provision, for which a more demanding reference of 20 persons per toilet is specified. Comparable short-term and longer-term planning ratios are also provided for communal bathing facilities. UNHCR emergency guidance [31] similarly identifies 50 persons per communal toilet or shower as an indicative emergency-phase planning reference. In this study, the threshold of 20 persons per WC or shower was adopted as the primary benchmark for evaluating the suitability of existing buildings for sustained collective shelter use. The less demanding emergency-phase reference of 50 persons per facility was additionally considered to contextualize the findings under immediate response conditions. These thresholds were treated as phase-dependent planning references rather than universal measures of sanitation adequacy.
Functional spatial organization represents another dimension of spatial performance that influences the adaptability of existing buildings for collective shelter. International guidelines emphasize the importance of organizing spaces to support user needs and essential services [10,31,32]. The architectural programming approach also enables building performance to be evaluated not only in terms of total area but also through the distribution and spatial allocation of areas assigned to different functions [33,34]. Accordingly, the proportions of net shelter, circulation, wet-function, operational support, and technical support areas within the total net area were used as indicators defining the functional spatial composition of the buildings.
Accessibility is a fundamental requirement for ensuring that collective shelter services can be used by different user groups. International guidelines particularly emphasize that sanitation facilities should be accessible to persons with disabilities and individuals with mobility limitations [10,21]. Studies on post-disaster shelter have also shown that inadequate accessible sanitation facilities can restrict access to shelter services for persons with disabilities [35,36]. In this study, in accordance with the available data, accessibility was evaluated based on the proportion of accessible WCs within the total number of WCs.
Table 1 presents the indicators used for these four performance dimensions together with the evaluation criteria for indicators for which external reference values are available. Living space, sanitation, and accessibility indicators were compared with reference values defined in international standards and guidelines [11,21], whereas no normative threshold was defined for functional spatial organization; this dimension was therefore included in the comparative evaluation across buildings [33,34]. Because the systematic and comparative evaluation of these indicators at the building scale requires an appropriate performance evaluation approach, the following section introduces the Building Performance Evaluation (BPE) approach, which constitutes the theoretical evaluation framework of this study.
2.3. Building Performance Evaluation (BPE)
2.3.1. Concept and Development of Building Performance Evaluation
Building Performance Evaluation (BPE) is a comprehensive approach that systematically evaluates building performance in terms of user requirements, functional objectives, and the extent to which predefined performance criteria are met [24,25,37]. Rather than limiting evaluation to outcomes associated with a particular period of use, BPE considers building performance as a continuous learning process in which data obtained at different stages of the building life cycle are fed back into design and planning processes [24,25].
Early applications of systematic building performance assessment largely developed within the framework of Post-Occupancy Evaluation (POE). POE focuses on evaluating buildings after a defined period of use in terms of dimensions such as user satisfaction, indoor environmental/spatial quality, functional adequacy, and operational performance. However, as the scope of evaluation expanded to encompass the entire building life cycle, including planning, design, construction, and operation, the BPE approach emerged [24,38]. This expansion enables performance to be evaluated not only through user perceptions but also against predefined requirements and measurable performance criteria.
BPE provides a flexible evaluation framework that allows performance dimensions to be defined according to the research objective and building type [24,25]. Within this framework, evaluation may focus on specific performance dimensions and measurable indicators representing them, depending on the research problem. The comprehensive review of POE studies conducted by Li et al. [39] similarly demonstrates that the objectives, methods, and performance dimensions addressed in building evaluations vary across studies. In this study, the BPE framework was structured to evaluate the spatial performance of wide-span public buildings for temporary collective shelter. Living space, sanitation capacity, and accessibility indicators were evaluated against external reference criteria, whereas functional spatial organization indicators were assessed comparatively across buildings.
2.3.2. Criterion-Based Spatial Performance Evaluation of Temporary Collective Shelter Buildings
In this study, the architectural programming approach and international humanitarian standards were considered complementary sources for developing the spatial performance indicators. In the architectural programming literature, the functional requirements of buildings are defined through different spatial components, and user requirements are related to spatial organization [33,34]. Accordingly, the functional spatial organization of wide-span public buildings was classified into net shelter area (NSA), circulation space area (CSA), wet-function area (WFA), operational support space area (SSA-O), and technical support space area (SSA-T).
International humanitarian standards and technical guidelines were used to evaluate these spatial components in the context of collective shelter. The Sphere Handbook provides reference values for living space per person and sanitation capacity [11], while UNHCR guidelines establish planning principles for spatial organization and essential services when converting existing public buildings into collective shelters [10,31], and the IFRC emphasizes accessibility and inclusive design requirements [21]. Thus, the architectural programming approach provided the basis for the spatial structuring of the performance indicators, while international standards and guidelines provided the basis for interpreting relevant indicators against reference criteria.
Within this framework, the study adopts a criterion-based BPE approach based on predefined spatial indicators derived from architectural plans and field data and, where available, external reference criteria, rather than subjective evaluations based on user perceptions [24,25]. The performance indicators were not combined into a single composite index; instead, living space, functional spatial organization, sanitation capacity, and accessibility were evaluated separately. This approach prevents a high value in one performance dimension from numerically compensating for a deficiency in another, thereby enabling the buildings to be evaluated independently and comparatively across different performance dimensions [40].
2.4. Existing Research on Temporary Collective Shelter Buildings and the Research Gap
Existing research on temporary collective shelter has primarily focused on three areas: shelter site selection, evacuation and accessibility planning, and the assessment of existing buildings for post-disaster shelter suitability [15,16,19,20,41].
Studies on site selection jointly evaluate multiple criteria, including geological suitability, transportation, infrastructure, topography, and environmental risks, using GIS, AHP, and multi-criteria decision-making methods to identify temporary shelter sites for post-disaster use [42,43]. Although these studies make important contributions to pre-disaster preparedness and decision-making processes, their assessments are predominantly conducted at the site and settlement scales [19,20]. Similarly, evacuation and accessibility studies focus on access to shelter sites, user allocation, capacity, and the optimization of transportation networks, employing network analyses and various optimization models [18,44]. Because the primary level of assessment in these studies concerns the settlement and accessibility organization of the shelter system, the interior spatial organization and functional area distribution of buildings considered for shelter use generally remain outside the scope of analysis [19,20].
Studies have also evaluated temporary shelter solutions against minimum standards. Research on post-disaster temporary accommodation has also addressed the performance and optimization of interior spatial configurations. Hosseini et al. [45] developed a multi-objective interior design optimization method for post-disaster temporary housing units, demonstrating how alternative interior layouts can be systematically evaluated against multiple performance objectives. However, such research has primarily addressed purpose-designed temporary accommodation units rather than the spatial adaptation and performance of existing public buildings converted to collective shelter use. In the context of the 6 February 2023 Kahramanmaraş earthquakes, Aslan et al. [46] evaluated temporary shelter units against the national Directive on the Establishment, Management and Operation of Temporary Sheltering Centers and the international minimum standards established by the Sphere Project. In contrast to studies conducted predominantly at the site and settlement scales, research focusing on the post-disaster reuse of existing buildings shifts the assessment toward the building scale. Idemen et al. [47] developed a conceptual model for assessing Adaptive Re-use Potential (ARP) to support the reuse of existing buildings in disaster management, while Tsioulou et al. [20] evaluated the suitability of school buildings as evacuation centers and temporary shelters in terms of structural safety, accessibility, living conditions, and logistical facilities. Among studies focusing on the spatial organization of buildings, Kim et al. [48] examined wide-span mega-shelter buildings in terms of visibility and spatial connectivity, while Xin et al. [49] investigated the dual use of university campuses during emergencies with regard to spatial layout and accessibility. More recently, Zhi et al. [50] developed a multi-parameter seismic resilience assessment framework specifically for large-span spatial structure emergency shelters, integrating functionality loss, repair time, and casualty rates to evaluate post-earthquake shelter resilience and activation. Although these studies address different dimensions of the post-disaster use and performance of buildings, ranging from spatial configuration and accessibility to structural resilience and functional recovery, an integrated building-scale evaluation of functional spatial composition together with humanitarian performance indicators such as living space, sanitation capacity, and accessibility remains limited.
Therefore, there is a need for studies that evaluate the interior spatial performance of existing wide-span public buildings in the context of temporary collective shelter by linking indicators derived from architectural plans and field data with international humanitarian standards. This study addresses this gap by jointly evaluating functional spatial composition, living space per person, sanitation capacity, and accessibility within a plan-based and criterion-based BPE framework.
3. Methodology
3.1. Research Design
This study was designed as a quantitative investigation to comparatively evaluate the spatial performance of wide-span public buildings examined for temporary collective shelter following the 6 February 2023 Kahramanmaraş earthquakes. The focus of the study is not to evaluate the original architectural qualities of the buildings, but to examine their spatial capacity and functional suitability for collective shelter through measurable and comparable indicators.
The research was structured as a criterion-based comparative evaluation within the Building Performance Evaluation (BPE) framework described in Section 2.3 [24,25,51]. Performance criteria derived from international humanitarian standards and the relevant literature were evaluated in conjunction with spatial data obtained from architectural plans, field verification, and estimated user numbers obtained through retrospective interviews with building managers.
Following a methodological approach that integrates systematic data collection, analysis, and evaluation stages in architectural research, the research process was structured in four stages [52] (Figure 3). In the first stage, the performance evaluation framework and spatial variables were defined based on international standards and the relevant literature. In the second stage, architectural plans were analyzed using a standardized functional coding system and verified against field data. In the third stage, spatial performance indicators were calculated from plan and user data. In the fourth stage, the indicators were analyzed through descriptive and threshold-based evaluations, hierarchical clustering, and cluster comparisons; the effect of uncertainty in estimated user numbers on threshold-based results was examined through sensitivity analysis.
Figure 3.
Research process for performance evaluation, data collection, indicator calculation, and analysis (source: created by the authors).
The performance indicators were not combined into a single composite index; instead, each indicator was evaluated separately in relation to the performance dimension it represented, and indicators with external reference values were compared against the relevant thresholds. This approach avoided additional assumptions associated with weighting and aggregating indicators, thereby maintaining transparency in the evaluation process [40].
3.2. Determination of Performance Criteria and Spatial Variables
The performance criteria used in this study were determined based on international standards and technical guidelines for post-disaster collective shelter [10,11,21,31,32,53]. Within this framework, living space, sanitation capacity, functional spatial organization, and accessibility were defined as the main performance dimensions of the study.
To enable the quantitative evaluation of these dimensions at the building scale, functional space classifications from the architectural programming and facility planning literature were utilized [33,34,54,55]. Spatial organization was classified into Net Shelter Area (NSA), Circulation Space Area (CSA), Wet-Function Area (WFA), Operational Support Space Area (SSA-O), and Technical Support Space Area (SSA-T). To reduce the influence of building size and ensure comparability across buildings, the proportions of these areas within the Total Net Area (TNA) were calculated.
Shelter capacity was evaluated based on area per person; sanitation capacity based on the number of users per WC and per shower; and accessibility based on the proportion of accessible WCs within the total number of WCs. Indicators with external reference values were compared against the relevant thresholds, whereas area-distribution indicators without normative thresholds were evaluated based on relative patterns within the sample. A reference level of ≥10% accessible sanitation facilities was adopted based on IFRC disability-inclusive shelter guidance [21]. In the present study, this criterion was operationalized through the Accessible WC Ratio (EWC), calculated as the proportion of accessible WCs within the total number of WCs. Accessible showers were also documented where present; however, they were not operationalized as a separate ratio-based accessibility indicator. Unlike WCs, shower facilities were not available in all buildings in the sample; consequently, an accessible-shower ratio would be undefined for buildings without shower facilities and would permit comparison only among the subset of buildings in which showers were present. Accordingly, EWC was retained as the standardized quantitative accessibility indicator applicable across the full sample, while accessible-shower provision was treated as supplementary descriptive information.
3.3. Research Sample, Data Sources, and Data Preparation Process
3.3.1. Determination of the Research Sample
The research sample comprises 39 wide-span public buildings located in Province A, Province B, and Province C that were examined within the scope of a research project conducted following the 6 February 2023 Kahramanmaraş earthquakes. Of these buildings, 33 were put into use for temporary collective shelter following the earthquakes, while six were included in the examined building stock but were not used for this purpose. Accordingly, analyses based on architectural plans and building characteristics were conducted for all 39 buildings, whereas analyses of area per person and user load based on the reported peak user load (No) were conducted for the 33 buildings that were used. As one of these buildings had no shower facilities, the number of valid observations for the user load per shower (RSH) analysis was 32.
The buildings were selected using purposive sampling [56]. The inclusion criteria were defined as follows: (i) being among the wide-span public buildings examined for post-disaster temporary collective shelter within the research project; (ii) availability of architectural plans; (iii) availability of sufficient architectural and technical documentation to enable functional spatial analysis; and (iv) documentation through the Building Identification Forms developed within the research project.
The resulting sample consists predominantly of sports halls and youth centers, together with one fair and congress center. The research sample is not intended to represent all wide-span public buildings in Türkiye; rather, it comprises the building stock within the defined study area that met the specified selection criteria. The architectural plan matrices of the buildings included in the study are presented separately for Province A, Province B, and Province C in Figure 4, Figure 5 and Figure 6.
Figure 4.
Architectural plan matrix of the examined buildings in Province A. Note. Double-height halls may be represented on multiple floor plans; these representations do not indicate repeated floor-area calculations.
Figure 5.
(a) Architectural plan matrix of the examined buildings in Province B (B01-B08). (b) Architectural plan matrix of the examined buildings in Province B (B09-B16).
Figure 6.
(a) Architectural plan matrix of the examined buildings in Province C (C01-C08). (b) Architectural plan matrix of the examined buildings in Province C (C09-C15).
The six buildings that were not used for collective shelter were retained in the plan-based analyses because the study also aimed to examine potential spatial resources within the existing public building stock. Their non-use reflected different circumstances, including damage-related restrictions, allocation to logistical or aid-storage functions, and retention as reserve shelter facilities that could be activated if needed. Therefore, non-use was not treated as evidence of spatial unsuitability. The study did not establish a systematic causal assessment of the decisions governing shelter activation for these buildings.
3.3.2. Data Sources and Data Preparation Process
Data for each building were obtained from architectural construction documents (floor plans, sections, and site plans), institutional information regarding building use, and standardized Building Identification Forms developed within the research project, and were verified by cross-checking the different data sources. The Building Identification Form is an inventory form in which data concerning building identification, architectural and spatial characteristics, technical infrastructure, sanitation, and accessibility are recorded in standardized fields (Appendix S1). Information on post-disaster use and the reported peak user load (No) was obtained through retrospective interviews with building managers conducted during the fieldwork and recorded in these forms.
The reported number of users (No) refers to the estimated peak daily user load during the most intensive period of each building’s operation as a temporary collective shelter, as retrospectively reported by building managers. These figures do not represent cumulative use over the entire sheltering period. Given the multifunctional operation of the facilities, the reported numbers may include both overnight occupants and individuals using the buildings temporarily during the day. Because systematic records distinguishing these user categories were unavailable, the figures were treated as approximate operational estimates rather than verified simultaneous overnight occupancy counts.
Field investigations also indicated that emergency accommodation was not necessarily restricted to the main halls. Other physically and functionally suitable interior spaces were used for shelter where possible, whereas technical rooms, workshops containing fixed equipment, and spaces unsuitable for overnight accommodation were not used for this purpose. However, the spatial extent of actual overnight accommodation could not be reconstructed precisely for every building. Consequently, the plan-based area classifications and reported peak user load should be interpreted as related but not necessarily identical representations of actual shelter use.
The architectural plans were analyzed in AutoCAD 2022, and area measurements were obtained from the drawing geometry. Measurements were based on the inner faces of the walls enclosing each space; areas occupied by walls, columns, shafts, and similar structural elements were excluded from the calculations. Total Net Area (TNA) was defined as the sum of Net Shelter Area (NSA), Circulation Space Area (CSA), Wet-Function Area (WFA), Operational Support Space Area (SSA-O), and Technical Support Space Area (SSA-T), and the same measurement approach was applied to all buildings.
The number, existing condition, and accessibility characteristics of sanitation facilities that could not be reliably determined from the architectural plans were verified on site during the fieldwork. Where discrepancies existed between plan and field data, verified field data were used in the calculation of the indicators.
3.3.3. Functional Coding of Architectural Plans
All architectural plans were analyzed according to a standardized coding protocol, and each enclosed space was assigned to one of the five functional categories defined in Section 3.2: Net Shelter Area (NSA), Circulation Space Area (CSA), Wet-Function Area (WFA), Operational Support Space Area (SSA-O), and Technical Support Space Area (SSA-T). In addition to the room names indicated on the plans, the physical characteristics, level of furnishing and equipment, and potential for reuse for collective shelter were considered in classifying the spaces. For spaces serving more than one function, the predominant use was taken as the basis for classification, and the same coding rules were applied to all buildings (Table 2).
Table 2.
Classification rules used for the functional coding of architectural plans.
Spaces primarily dedicated to building services and technical infrastructure were classified as SSA-T, whereas operational and support functions not constituting technical infrastructure were classified as SSA-O. The presence of fixed equipment within an SSA-O space did not alter its functional classification but was considered separately in determining its convertibility for shelter use. The convertibility of spaces classified as SSA-O for shelter use was assessed separately. This assessment considered the physical characteristics of the space, the nature of its furnishings and equipment, and the presence of fixed equipment. Spaces that could not be rapidly converted because of fixed technical infrastructure or permanent equipment were excluded from potential shelter capacity, whereas spaces with movable furnishings that could be converted to shelter use through limited modifications were included in the calculation of Potential Usable Area (PUA). The classification and convertibility rules applied are presented in Table 2.
Following coding, the sum of NSA, CSA, WFA, SSA-O, and SSA-T for each building was compared with the Total Net Area (TNA) to verify coding completeness, and any identified discrepancies were re-examined before being entered into the dataset. TNA represents the sum of these five functional categories and serves as the reference area for the subsequent performance calculations.
The functional classification and convertibility assessments were undertaken collaboratively by the three researchers involved in the study. Decisions concerning the inclusion of operational support spaces in PUA were reached through joint examination of architectural plans, furnishings, fixed equipment, and available field observations. Because the procedure involved collaborative assessment rather than independent coding, an inter-rater agreement coefficient was not calculated. This should be considered when interpreting the reproducibility of the convertibility classifications.
In multi-level buildings, double-height sports halls may appear on more than one floor plan because the same interior volume extends across multiple levels. These representations do not correspond to additional floor areas. Each hall was included in the NSA calculation only once, based on its actual floor area. Building A04 contains two distinct sports halls, including the main sports hall.
3.4. Calculation of Spatial Variables
Following the measurement and coding process described in Section 3.3, spatial performance variables were calculated for each building using the Total Net Area (TNA) and functional area categories. TNA was defined using the following equation:
Based on TNA, two groups of variables were calculated: (i) area ratios describing functional area distribution and (ii) indicators evaluating shelter capacity and user load. All variables were calculated for each building using the same calculation procedure and transferred to the database for statistical analysis.
3.4.1. Functional Area Ratios
Area distribution ratios express the proportion of each functional area category within the Total Net Area (TNA) as a percentage (%). Net Shelter Area Ratio (NSA (%)), Circulation Space Area Ratio (CSA (%)), Wet-Function Area Ratio (WFA (%)), Operational Support Space Area Ratio (SSA-O (%)), and Technical Support Space Area Ratio (SSA-T (%)) were calculated using the following equations:
The sum of the five area ratios was required to equal 100% for each building and was used as a calculation check. Area values were expressed in m2 and area ratios as percentages (%).
3.4.2. Reported Peak User Load and Theoretical Shelter Capacity
Two different user bases were used in the capacity analyses. The reported peak user load (No) represents the approximate highest daily number of users reported by building managers during the most intensive period of post-earthquake shelter use. These values were obtained retrospectively through field interviews and reflect operational estimates rather than systematically recorded occupancy counts.
The highest reported user load was selected to represent the period of greatest demand during the initial emergency shelter phase, when the spatial and sanitation capacities of the buildings were most heavily challenged. Although the reported figures primarily reflected overnight shelter users, some individuals may have accessed the facilities for food, sanitation, or relief services without remaining overnight. Since reliable separate counts of these user groups were unavailable, the reported peak user load was adopted as a consistent screening assumption across the examined buildings. Accordingly, the resulting area-per-person and sanitation-load indicators characterize performance under reported peak demand rather than verified simultaneous overnight occupancy.
During the emergency response, the buildings accommodated different patterns of use, including overnight shelter, daytime refuge, temporary resting, and access to humanitarian assistance. Consequently, the reported peak user load may include individuals who did not remain inside the building overnight. Where approximate values or ranges were reported for different periods, the highest reported daily peak was adopted as the reference value for the corresponding building.
Accordingly, No was used as a common indicator of reported peak demand for comparative spatial and infrastructure assessments. It should not be interpreted as a verified count of simultaneous overnight occupants. The resulting indicators therefore represent estimated spatial and service provision relative to reported peak demand rather than directly observed individual sleeping-space allocation.
In contrast, theoretical shelter capacity was derived from the physical area of the building and calculated using the minimum covered living space criterion of 3.5 m2 per person specified in the Sphere Handbook [11]. Existing theoretical shelter capacity based solely on Net Shelter Area (Ns) and potential theoretical shelter capacity based on Potential Usable Area (Np) were calculated using the following equations:
Existing theoretical shelter capacity:
Potential theoretical shelter capacity:
Here, No represents a retrospective estimate of actual use, whereas Ns and Np represent theoretical values based on existing and convertible spatial capacity, respectively.
3.4.3. Shelter Area per Person
Shelter area per person was calculated using two indicators representing existing and potential spatial capacity. Net shelter area per person (An) was calculated by dividing Net Shelter Area (NSA) by the reported peak user load (No):
Potential usable area per person (Ap) was calculated by dividing Potential Usable Area (PUA) by the same number of users:
Both indicators were expressed in m2/person. An represents the existing net shelter area under the reported maximum user load, whereas Ap represents the potential area per person if convertible spaces were brought into shelter use while maintaining the same number of users.
The theoretical capacity values Ns and Np were not used in these calculations because both are derived from the 3.5 m2/person criterion; using them as denominators would, by definition, yield an area-per-person value of 3.5 m2/person. Ns and Np were therefore treated solely as separate variables representing existing and potential theoretical shelter capacity.
Because No represents the reported peak user load rather than verified simultaneous overnight occupancy, An and Ap were interpreted as area-to-peak-demand indicators. These ratios were used to compare the spatial resources available in relation to the reported intensity of facility use. They should not be interpreted as direct measurements of the sleeping area physically occupied by each overnight resident.
The 3.5 m2/person reference was therefore applied as a screening benchmark to identify potential spatial pressure under the reported peak-demand assumption, rather than as definitive evidence of compliance or non-compliance with minimum overnight accommodation requirements.
3.4.4. Sanitation Capacity
Sanitation capacity was calculated separately based on No, Ns, and Np to evaluate reported occupancy intensity and sanitation loads under existing and potential theoretical shelter capacities. WC and shower indicators based on the reported maximum user load were calculated using the following equations:
Sanitation indicators based on existing theoretical shelter capacity were calculated as:
Sanitation indicators based on potential theoretical shelter capacity were calculated as:
Here, TWC and TSH denote the total numbers of WCs and showers, respectively. Facility counts were determined from architectural plans and verified through fieldwork. All indicators were expressed as persons/unit, with higher values indicating a higher user load per facility. RWC and RSH based on No represent the reported occupancy intensity, whereas indicators based on Ns and Np represent sanitation loads under existing and potential theoretical capacities, respectively.
The sanitation inventory used in the calculations included only WCs and showers forming part of the buildings’ existing internal facilities, as verified through architectural documentation and fieldwork. Temporary or mobile sanitation units were excluded because sufficiently reliable and comparable records of their numbers and availability during post-disaster operation were not available. WC and shower fixtures were pooled across user groups to obtain building-level capacity indicators; sex-specific sanitation loads could not be calculated because corresponding user-demand data were unavailable. Consequently, these indicators represent the existing internal sanitation provision rather than the total facilities that may have been available during emergency operations.
Two sanitation reference scenarios were considered in the threshold-based assessment. The primary scenario adopted a reference of ≤20 persons per WC or shower to examine infrastructure provision against sustained-use planning requirements. An additional emergency-phase comparison adopted a reference of ≤50 persons per WC or shower. For both scenarios, threshold attainment was determined using the reported peak user load (No) and the corresponding number of existing sanitation fixtures. The comparison was intended to examine how the interpretation of sanitation provision changes with the selected emergency-response phase, without assuming that the reference thresholds directly establish actual operational adequacy.
To identify the governing capacity constraint for each building, three theoretical limits were calculated: spatial capacity (NSA/3.5 or PUA/3.5), WC-supported capacity (20 × TWC), and shower-supported capacity (20 × TSH). The governing capacity was defined as the minimum of these three limits, and the corresponding limiting component was identified for each building. Where WC and shower capacities were equal, both were recorded as jointly limiting components. This assessment was conducted for all 39 buildings independently of reported post-earthquake user loads. The calculations represent conditional planning capacities under the selected reference criteria rather than verified operational occupancy limits.
3.4.5. Accessible WC Ratio
The accessible WC ratio (EWC) was calculated as the percentage of accessible WCs within the total number of WCs:
Here, TEWC denotes the number of WCs verified as accessible during fieldwork, while TWC denotes the total number of WCs. EWC was reported as a percentage (%), and a reference level of ≥10% accessible sanitation facilities, derived from IFRC disability-inclusive shelter guidance [21], was used for the quantitative assessment of accessible sanitation capacity.
EWC represents only the quantitative proportion of accessible WCs within the total number of WCs; the dimensional characteristics of the WCs, fixture layout, access routes, and accessibility in actual use were not evaluated within the scope of this indicator.
Accessible WC counts were determined through cross-checking the facilities designated as accessible in architectural plans with the corresponding records from field investigations. However, a comprehensive dimensional accessibility audit, including verification of maneuvering clearances, door dimensions, fixture arrangements, and continuous accessible routes, was not conducted. Accordingly, EWC represents the proportion of WCs identified as accessible through documentation and field verification rather than independently certified compliance with all accessibility standards.
Accessible showers identified during fieldwork were recorded separately but were not operationalized as an additional ratio-based accessibility indicator. Because shower facilities were not present in all buildings, an accessible-shower ratio would be undefined for buildings without showers and would allow comparison only within the subset of buildings providing shower facilities. EWC was therefore retained as the standardized quantitative accessibility indicator applicable across the full sample.
3.5. Statistical Analysis
The spatial performance variables calculated in Section 3.4 were transferred to IBM SPSS Statistics (Version 29), with each building treated as one unit of observation. Statistical analyses were organized into five stages: (i) descriptive statistics and threshold-based performance evaluation, (ii) hierarchical cluster analysis and assessment of cluster robustness, (iii) comparison of the resulting clusters using performance indicators not included in the clustering model, (iv) examination of the association between cluster membership and province and building type, and (v) sensitivity analysis of the estimated number of users. The variables used in the analysis, calculation methods, reference sources, and threshold values are summarized in Table 3.
Table 3.
Spatial performance variables, calculation methods, and reference threshold values.
3.5.1. Descriptive Statistics and Threshold-Based Evaluation
For each spatial performance variable, the mean, standard deviation, median, minimum, maximum, and interquartile range (IQR) were calculated. Skewness coefficients were examined to assess the shape of the distributions. Given the sample size and the presence of outliers in some indicators, both the mean and median were considered as measures of central tendency, while the median and IQR were prioritized when interpreting markedly skewed distributions. Descriptive and inferential analyses were conducted using the available observations for each indicator, without excluding observations solely because another indicator was missing.
To examine the influence of extreme observations on the descriptive and threshold-based results, an additional outlier screening and robustness assessment was conducted for the buildings with reported peak user-load data. Potential distributional outliers were identified using Tukey’s 1.5 × interquartile range (IQR) rule. This procedure was applied to the reported peak user load (No), the area-to-user ratios (An and Ap), and the sanitation load indicators (RWC and RSH). Observations identified as potential outliers were retained in the primary analyses because the values originated from field-reported data and were not considered erroneous solely on statistical grounds.
As a robustness check, key descriptive statistics and threshold-based classifications were recalculated after temporarily excluding the two buildings identified as upper outliers in the distribution of No. Additional sensitivity comparisons examined the influence of the lowest and highest area-to-user ratios. These supplementary analyses were used to assess the dependence of the findings on extreme observations, rather than to redefine the study sample or modify the reported user numbers.
Indicators with external reference values were additionally classified according to the relevant performance thresholds. For area-per-person indicators, the reference value of ≥3.5 m2/person was applied to An; the same threshold was also applied to Ap to evaluate the potential scenario in which convertible spaces were brought into use. Thresholds of ≤20 persons/WC for WC user load (RWC), ≤20 persons/shower for shower user load (RSH), and ≥10% for the accessible WC ratio (EWC) were applied. An additional emergency-phase comparison was conducted using the reference of ≤50 persons per WC or shower to examine the sensitivity of sanitation threshold classifications to the anticipated phase of shelter use. For each indicator, the numbers and percentages of buildings meeting and not meeting the reference value were calculated.
3.5.2. Hierarchical Cluster Analysis
Hierarchical cluster analysis was performed to identify groups of buildings with similar spatial performance profiles. Four indicators representing different dimensions of spatial performance were included in the clustering model: the proportion of Net Shelter Area within Total Net Area (NSA (%)), Wet-Function Area Ratio (WFA (%)), Technical Support Space Area Ratio (SSA-T (%)), and Accessible WC Ratio (EWC (%)).
Because the functional area ratios sum to 100% by definition, not all area ratios were simultaneously included in the model, thereby reducing the repeated representation of interdependent spatial components. NSA (%), WFA (%), and SSA-T (%) were selected to represent distinct functional components, while EWC (%) was included as an accessibility-related indicator. CSA (%) and SSA-O (%) were excluded from the final clustering model. Pairwise associations among the four selected indicators were subsequently examined using Spearman’s rank correlation coefficients to assess the extent of intercorrelation.
Area-per-person indicators (An and Ap), user-load-based sanitation indicators (RWC and RSH), and their capacity-based derivatives were excluded from the clustering model to avoid allowing the estimated number of users and outcome-type performance measures to drive cluster formation. These indicators were instead used in subsequent analyses to evaluate performance characteristics not included in the clustering model.
To limit scale-related differences in the distance calculations, the four clustering indicators were standardized as Z-scores. Hierarchical clustering was performed using Ward’s linkage method and squared Euclidean distance [57,58]. Two-, three-, and four-cluster solutions were evaluated by considering the agglomeration schedule, dendrogram, average silhouette coefficients, cluster sizes, and substantive interpretability. The three-cluster solution was retained for subsequent comparative analyses, while its separation and robustness were examined through supplementary assessments.
Two additional clustering analyses were conducted to assess the sensitivity of the three-cluster solution. First, the clustering procedure was repeated after excluding EWC (%) to examine the influence of the accessibility-related indicator on cluster formation. Second, several buildings were identified as having similar standardized architectural designs, although differences existed in their implemented interior layouts and functional area distributions. As the study evaluated individual physical buildings rather than unique architectural designs, all buildings were retained in the primary analysis. To examine the potential influence of closely related designs, B05, B07, and B08 were excluded, while B04 was retained as a representative case. B01 was also retained because its spatial composition differed from that of the closely related buildings. The clustering procedure was repeated for the remaining 36 buildings using the same four indicators. In both analyses, variables were re-standardized, and agreement with the corresponding memberships in the original solution was quantified using the Adjusted Rand Index (ARI). This was treated as a partial sensitivity assessment rather than a complete elimination of design-related dependence.
A leave-one-out analysis was also conducted to evaluate observation-level stability. In each of 39 iterations, one building was removed, the remaining observations were re-standardized, and the three-cluster solution was reconstructed using Ward’s method and squared Euclidean distance. Agreement with the corresponding subset of the full-data partition was assessed using ARI.
Bootstrap resampling was additionally performed to evaluate the stability of individual clusters. A total of 2000 bootstrap samples, each containing 39 observations sampled with replacement, were generated using a fixed random seed. Within each replicate, the four indicators were re-standardized and hierarchical clustering was repeated using Ward’s method, retaining three clusters. For each original cluster, stability was quantified using the maximum Jaccard similarity with the reconstructed clusters, comparing memberships at the level of resampled observations. The mean Jaccard similarity across bootstrap replicates was calculated separately for each cluster. These analyses were conducted using Python 3.11 (NumPy, SciPy, and scikit-learn), complementing the SPSS-based analyses. Bootstrap results were interpreted as indicators of cluster recovery under resampling rather than evidence of externally validated or invariant building typologies.
3.5.3. Comparison of Cluster Profiles
To examine whether the spatial profiles identified through hierarchical clustering were associated with differences in user-load-based performance, the three clusters were compared using net shelter area per person (An), potential usable area per person (Ap), reported peak user load per WC (RWC), and reported peak user load per shower (RSH). These indicators were calculated using the retrospectively reported peak user load (No) and were not included as input variables in the clustering procedure. Nevertheless, these indicators are not mathematically independent of the clustering variables. An and Ap share spatial components with NSA (%), while RWC shares the total WC count with EWC (%). Consequently, between-cluster differences in these indicators were interpreted descriptively and exploratorily, rather than as independent validation of the clustering solution.
Given the skewed distributions, the presence of extreme observations, and the relatively small sample sizes in some clusters, the non-parametric Kruskal–Wallis H test was applied. Where the omnibus test was statistically significant, pairwise comparisons were performed with Bonferroni adjustment. Statistical significance was set at α = 0.05. Analyses were based on the available observations for each indicator, comprising 33 buildings for An, Ap, and RWC, and 32 buildings for RSH.
Sanitation loads derived from theoretical shelter capacities [RWC(NSA), RWC(PUA), RSH(NSA), and RSH(PUA)] were distinguished from the No-based indicators. Because theoretical capacities are calculated directly from NSA and PUA, these derived sanitation indicators share mathematical components with the spatial variables used to construct the clusters. Consequently, their differences across clusters cannot be interpreted as independent evidence of sanitation performance. They were therefore retained for theoretical capacity scenario assessment but excluded from the inferential comparisons used to characterize user-load-based differences between clusters.
Spearman’s rank correlation analysis was additionally used to explore the relationship between Wet-Function Area Ratio (WFA (%)) and the No-based sanitation indicators (RWC and RSH). These analyses were interpreted as exploratory associations rather than causal relationships or independent validation of the clustering solution.
3.5.4. Association of Cluster Membership with Province and Building Type
To evaluate the association of cluster membership with geographical location and building type, cluster × province and cluster × building type contingency tables were constructed and Pearson’s chi-square test was applied. Because expected frequencies were low in some cells, Monte Carlo significance estimates based on 10,000 samples were used instead of relying solely on asymptotic significance values. The magnitude of the association was evaluated using Cramér’s V. Statistical significance was set at α = 0.05.
3.5.5. Sensitivity Analysis
Because the reported peak user load (No) represents approximate values obtained through retrospective interviews with building managers, sensitivity analysis was conducted to evaluate the effect of uncertainty in the estimated number of users on threshold-based results [59]. No was varied by ±10% and ±20%, and the corresponding indicators and threshold attainment status were recalculated.
For each scenario, user-dependent indicators were recalculated, and the numbers and percentages of buildings meeting the thresholds of ≥3.5 m2/person for An and Ap, ≤20 persons/WC for RWC, and ≤20 persons/shower for RSH were redetermined. The scenario ranges do not represent empirically established error bounds for No; rather, they were used as hypothetical sensitivity conditions to examine the robustness of threshold-based results to plausible variations in the user-number assumption.
4. Results
4.1. Functional Spatial Composition
The functional spatial composition of the 39 buildings varied substantially (Table 4; Figure 7). Net Shelter Area (NSA) constituted the largest component of Total Net Area (mean = 49.65%). The greatest variation was observed in NSA and Operational Support Space Area (SSA-O), whereas Wet-Function Area (WFA) exhibited comparatively limited variation.
Table 4.
Descriptive statistics for the functional spatial composition of the examined buildings (n = 39).
Figure 7.
Functional spatial composition of the examined buildings, showing the proportional distribution of NSA, CSA, WFA, SSA-O, and SSA-T within the Total Net Area (TNA) (n = 39). Note. Buildings are grouped by anonymized province codes (A–C). SS = sports hall; GM = youth center; KM = fair and congress center.
4.2. Shelter Capacity and Area-per-Person Performance
The median theoretical shelter capacities based on NSA (Ns) and Potential Usable Area (Np) were 393.46 and 404.03 persons, respectively (Table 5). Both distributions were positively skewed, supporting the use of medians and interquartile ranges in their interpretation.
Table 5.
Descriptive statistics of shelter capacity and area-per-person indicators.
For the 33 buildings with reported peak user-load data (No), median net shelter area per person (An) was 2.33 m2/person, compared with 3.36 m2/person when convertible space was included (Ap). The proportions meeting the 3.5 m2/person reference were 30.3% (10/33) and 48.5% (16/33), respectively. These values represent area relative to reported peak demand rather than verified space per simultaneous overnight occupant.
Outlier screening using Tukey’s 1.5 × IQR criterion identified two upper outliers in No (7000 and 10,000 users) and upper outliers in the area-to-user distributions. In contrast, the exceptionally low An and Ap values (0.20 and 0.46 m2/person) were not statistical outliers. Because No may include both overnight occupants and daytime users, these ratios cannot be interpreted as literal sleeping-space allocations. All observations were retained, and their influence was examined in Section 4.7.
4.3. Wet-Function Capacity and Sanitation Facility Load
The median reported-demand sanitation loads were 27.78 persons/WC and 27.05 persons/shower. Under NSA-based theoretical capacity, the corresponding values were 19.12 and 20.92 persons/facility, increasing to 29.91 and 31.49 under the PUA-based scenario (Figure 8).
Figure 8.
Median WC and shower facility loads under reported, existing theoretical, and potential theoretical shelter-capacity scenarios. Note. Reported facility loads were calculated using the reported peak user load (No). NSA-based and PUA-based loads were calculated using the existing theoretical shelter capacity (Ns) and potential theoretical shelter capacity (Np), respectively. The dashed line indicates the reference threshold of ≤20 persons/facility.
Using the sustained-use reference of ≤20 persons/facility, 39.4% (13/33) of buildings met the WC criterion and 31.3% (10/32) met the shower criterion. Under the less demanding emergency-phase reference of ≤50 persons/facility, these proportions increased to 66.7% (22/33) and 68.8% (22/32), respectively. Thus, threshold attainment depended substantially on the selected planning scenario.
The governing-capacity analysis revealed that spatial area alone limited theoretical capacity in 17 of the 39 buildings under the NSA-based scenario, compared with four under the PUA-based scenario. Sanitation provision was the governing constraint, individually or jointly, in the remaining 22 and 35 buildings, respectively (Table 6). In 13 buildings, the governing constraint shifted from spatial area to sanitation infrastructure when convertible space was considered. One building had no shower facilities and therefore required additional shower provision under the combined planning criteria. These results represent theoretical capacity constraints rather than observed operational limits.
Table 6.
Governing capacity constraints under existing and potential spatial capacity scenarios (n = 39).
4.4. Accessible WC Performance
The median Accessible WC Ratio (EWC) was 11.11%, ranging from 0.00% to 66.67% (Table 7). Under the IFRC short-term emergency reference of ≥10% [21], 21 of the 39 buildings (53.8%) met the numerical benchmark, compared with 13 buildings (33.3%) under the more demanding longer-term reference of ≥20% [21] (Supplementary Table S1; Figure 9). These comparisons reflect the proportion of WCs identified as accessible through architectural documentation and field verification, rather than verified compliance with all dimensional and functional accessibility requirements.
Table 7.
Descriptive statistics of the Accessible WC Ratio.
Figure 9.
Threshold-based performance of the examined buildings across shelter area, sanitation, and accessibility indicators. Note. Percentages are based on valid observations for each indicator; corresponding sample sizes are shown in parentheses. An and Ap were evaluated against the reference value of ≥3.5 m2/person, RWC and RSH against ≤20 persons/facility, and EWC against the ≥10% accessible WC benchmark.
4.5. Cluster Analysis of Spatial Performance Profiles
Spearman’s rank correlations among the four clustering indicators are reported in Supplementary Table S2. The strongest observed association was between WFA (%) and EWC (%) (ρ = −0.421, p = 0.008), while the other pairwise correlations were weaker in magnitude. These associations were interpreted descriptively and did not eliminate the need to examine the sensitivity of clustering to the inclusion of EWC.
Ward hierarchical clustering identified three exploratory profiles comprising 25, 5, and 9 buildings. The agglomeration coefficients were 86.952, 113.131, and 152.000 at the three-, two-, and one-cluster stages, respectively. Average silhouette coefficients for k = 2, 3, and 4 were 0.271, 0.305, and 0.286. Although k = 3 yielded the highest silhouette value among the alternatives, the low absolute values indicated limited cluster separation.
The leave-one-out analysis yielded a mean ARI of 0.757 (median = 0.906), with complete agreement in 13 of 39 iterations. Excluding three repeated-plan buildings resulted in an ARI of 0.590, while excluding EWC substantially altered cluster membership (ARI = 0.182).
Bootstrap analysis using 2000 resamples produced mean Jaccard similarities of 0.673, 0.526, and 0.685 for Clusters 1, 2, and 3, respectively (Supplementary Table S3). Jaccard similarity fell below 0.50 in 18.9%, 55.3%, and 20.5% of resamples, indicating particularly limited stability for Cluster 2. Together, these findings support interpreting the solution as an exploratory classification rather than a stable building typology.
4.5.1. Spatial Profiles of the Three-Cluster Solution
The clusters differed in functional spatial composition and accessible WC provision (Table 8 and Figure 10). Cluster 1 (n = 25) exhibited a moderate NSA proportion (44.27%) and the highest WFA proportion (8.76%). Cluster 2 (n = 5) had the lowest NSA proportion (27.76%) and the highest SSA-T (6.52%) and EWC (38.83%) ratios. Cluster 3 (n = 9) had the highest NSA proportion (76.75%) and the lowest WFA (5.60%) and SSA-T (3.16%) ratios. These profiles do not constitute an overall ranking of shelter suitability.
Table 8.
Profiles of clustering indicators in the three-cluster solution.
Figure 10.
Standardized profiles of the three clusters based on the four variables used in the hierarchical cluster analysis. Note. Values represent cluster means of z-standardized indicators. NSA = Net Shelter Area; WFA = Wet-Function Area; SSA-T = Technical Support Space Area; EWC = Accessible WC Ratio. Cluster sizes are shown in the legend.
4.5.2. Shelter and Sanitation Performance of the Clusters
The clusters were compared using area-to-user and sanitation-load indicators derived from reported peak demand (Table 9). Neither An [H(2) = 0.719, p = 0.698] nor Ap [H(2) = 1.475, p = 0.478] differed significantly across clusters.
Table 9.
Comparison of area-to-user ratios and reported peak-demand sanitation loads across the three clusters.
WC load differed significantly [H(2) = 7.804, p = 0.020], with a Bonferroni-adjusted difference between Clusters 1 and 3 (p = 0.016). The corresponding shower-load comparison was not significant [H(2) = 4.160, p = 0.125].
Spearman’s analysis identified a negative association between WFA and reported-demand WC load (ρ = −0.402, p = 0.020; n = 33), whereas the association with shower load was not significant (ρ = −0.247, p = 0.174; n = 32). These exploratory comparisons do not establish causality or independently validate the clustering solution, particularly because some performance indicators share mathematical components with the variables used to construct the clusters.
4.5.3. Distribution of Cluster Profiles by Province and Building Type
Cluster membership was not significantly associated with province [χ2(4) = 2.639, Monte Carlo p = 0.650; Cramér’s V = 0.184], but was associated with building type [χ2(4) = 25.876, Monte Carlo p < 0.001; Cramér’s V = 0.576] (Figure 11). All five Cluster 2 buildings were youth centers; Clusters 1 and 3 were predominantly sports halls, with the sole fair and congress center belonging to Cluster 3. Monte Carlo estimates were based on 10,000 sampled tables because of low expected cell frequencies. These associations should not be interpreted causally.
Figure 11.
Distribution of thethree-cluster solution by (a) anonymized province and (b) building type. Note. Values represent the number of buildings in each category within the three clusters. Province labels (A–C) are anonymized.
4.6. Sensitivity Analysis of User-Number Estimates
Hypothetical variations of ±10% and ±20% in reported peak user load (No) were examined to assess the sensitivity of threshold-based classifications (Figure 12). These scenarios were not intended to represent empirically established error bounds.
Figure 12.
Sensitivity of threshold-based performance classifications to ±10% and ±20% variations in the reported peak user load (No). Note. The reported No represents the baseline scenario. Scenario percentages represent hypothetical sensitivity conditions and should not be interpreted as empirically determined error bounds for No.
Across the examined scenarios, threshold-attainment proportions ranged from 30.3% to 45.5% for An, 42.4% to 60.6% for Ap, 27.3% to 45.5% for RWC, and 21.9% to 46.9% for RSH. The corresponding percentage-point ranges were 15.2, 18.2, 18.2, and 25.0, respectively.
A building-level analysis additionally calculated the critical change in No required to reach each reference threshold (Supplementary Table S4). Across the −20% to +20% scenarios, classifications changed for five buildings for An, six for Ap, six for RWC, and eight for RSH. Although most buildings remained below the An reference and above the sanitation-load thresholds throughout the scenarios, individual classifications were sensitive to proximity to the selected thresholds.
4.7. Robustness Assessment of Extreme Observations
Robustness analyses assessed the influence of extreme observations among the 33 buildings with reported user-load data. Two exclusion scenarios were examined: removal of the two highest No observations (7000 and 10,000 users) and removal of the two upper outliers common to the An and Ap distributions. Each scenario retained 31 buildings; all observations remained in the primary analyses.
Excluding the No outliers produced limited changes in An and sanitation-load medians, while the Ap median increased from 3.36 to 3.82 m2/person and its threshold-attainment rate from 48.5% to 51.6%. Excluding the upper area-to-user outliers reduced the An and Ap attainment rates to 25.8% and 45.2%, respectively, while median WC and shower loads increased (Table 10).
Table 10.
Robustness of descriptive and threshold-based results under alternative outlier-exclusion scenarios.
Overall, the primary descriptive patterns were not exclusively determined by extreme observations, although some estimates and classifications were sensitive to sample composition. The findings therefore remain conditional assessments of spatial and sanitation provision relative to reported peak demand.
5. Discussion
The findings indicate that the spatial performance of wide-span public buildings used for temporary collective shelter cannot be characterized by building size or shelter-designated area alone. Functional spatial composition, area-to-user ratios, sanitation loads, and accessible WC provision revealed different performance patterns, while the exploratory clusters did not establish a consistent ranking of overall shelter suitability. These findings support the Building Performance Evaluation (BPE) principle that performance should be assessed against multiple use-related requirements rather than a single spatial attribute [24].
5.1. Spatial Composition, Original Building Program, and Shelter Performance
The distinction between spatial composition and user-dependent performance is evident in the cluster results. Although Cluster 3 exhibited the highest mean Net Shelter Area (NSA) ratio (76.75%), its median An and Ap values were 1.74 and 1.77 m2/person, compared with 2.83 and 3.82 m2/person in Cluster 1. However, neither indicator differed significantly across clusters. Thus, a higher shelter-area proportion cannot independently establish more favorable area-to-user performance without considering reported user demand.
The No-based comparisons identified a significant difference in WC load between Clusters 1 and 3 (Bonferroni-adjusted p = 0.016), whereas shower loads did not differ significantly. Wet-Function Area Ratio was negatively associated with reported-demand WC load (ρ = −0.402, p = 0.020), but not significantly associated with shower load (ρ = −0.247, p = 0.174). These exploratory associations indicate that the relationship between spatial allocation and sanitation provision varies across indicators and should not be interpreted causally.
The original architectural program provides a potential explanation for these differences. Architectural programming relates spatial organization to intended activities, user requirements, and functional relationships [33,34]. Consequently, sports halls, youth centers, and exhibition buildings may retain different spatial and infrastructural characteristics even when assigned the same post-disaster shelter function. This interpretation is consistent with Idemen et al. [47], who emphasize that the adaptive reuse of existing buildings requires systematic evaluation of technical and functional suitability rather than reliance on building availability alone.
Building type was significantly associated with cluster membership (Cramér’s V = 0.576, Monte Carlo p < 0.001), whereas province was not (Cramér’s V = 0.184, p = 0.650). Nevertheless, the unequal representation of building types, the presence of only one fair and congress center, and the limited stability of the cluster solution prevent these associations from supporting causal interpretations or generalized building-type classifications.
5.2. Distinguishing Between Existing and Potential Shelter Capacity
The proportion of buildings meeting the 3.5 m2/person reference increased from 30.3% under Net Shelter Area to 48.5% when Potential Usable Area (PUA) was included. This demonstrates the relevance of convertible spatial reserves, although approximately half of the buildings remained below the reference even under the potential-use scenario. Moreover, these results describe spatial provision relative to retrospectively reported peak demand, not verified simultaneous overnight accommodation conditions.
PUA should therefore be understood as a convertible spatial reserve rather than immediately available shelter capacity. Consistent with adaptive reuse assessment [47], its activation depends on the suitability of existing spaces and the modifications required for an alternative function. Research on post-disaster temporary housing also demonstrates that spatial performance depends on how available space is organized among competing functional requirements [45]. In existing public buildings, additional shelter-designated area may similarly increase theoretical spatial capacity without increasing the supporting infrastructure.
The governing-capacity assessment illustrates this limitation. Under the NSA-based scenario, spatial area alone limited theoretical capacity in 17 of the 39 buildings, whereas sanitation provision was limiting, individually or jointly, in 22. When PUA was included, only four buildings remained area-governed, while sanitation became limiting in 35. These results are conditional on the selected references of 3.5 m2/person and 20 persons per sanitation facility, but demonstrate why convertible floor area should not be treated as an equivalent increase in infrastructure-supported capacity.
The user-number sensitivity analysis further showed that threshold attainment varied with assumed demand. Across the ±20% scenarios, the attainment range was 15.2 percentage points for An and 18.2 for Ap, compared with 18.2 for WC load and 25.0 for shower load. Thus, Ap was not uniquely the most sensitive indicator. For pre-disaster planning, existing shelter area, convertible spatial reserve, and infrastructure-supported capacity should be reported separately to identify the adaptations needed before potential capacity can be activated.
5.3. Sanitation as a Limiting Component of Shelter Capacity
Based on reported peak user loads, 39.4% of the assessed buildings met the ≤20 persons/WC reference, while 31.3% met the corresponding shower reference. Under the less demanding emergency-phase reference of ≤50 persons/facility, approximately two-thirds met the respective thresholds. These differences demonstrate the importance of distinguishing immediate emergency provision from sustained shelter operation, rather than assigning buildings a single sanitation capacity independent of the intended duration of use.
Comparable infrastructure limitations have been documented in other disaster contexts. Following Typhoon Haiyan, only four of 20 examined evacuation centers met the recommended WC/user ratio, and none of the large centers provided even half the recommended toilet provision [60]. The mismatch between facilities designed for intermittent public use and the continuous requirements of collective shelter is particularly relevant to existing buildings. Although sports facilities may incorporate showers as part of their original program, their presence does not establish adequate provision for sustained accommodation.
Sanitation also has implications beyond numerical compliance. Following the 2011 Great East Japan Earthquake, Akaishi et al. [61] reported associations between improvements in water supply and toilet hygiene and reduced gastrointestinal infections across evacuation centers. Although the present study did not assess health outcomes, these findings reinforce the importance of sanitation infrastructure in collective shelter evaluation. Similarly, research following the Lombok earthquake identified inadequate WASH provision, privacy problems, and limited facilities for vulnerable users [17].
The governing-capacity assessment provides a building-specific interpretation of these concerns. In 13 buildings, the limiting component shifted from spatial area to sanitation provision when convertible space was included. This indicates that expanding usable shelter space may provide limited additional infrastructure-supported capacity without corresponding WC and shower improvements. Furthermore, the majority of buildings did not meet the sustained-use sanitation references across the tested ±20% user-load scenarios. Accordingly, WC and shower capacity should be assessed separately, with infrastructure upgrades prioritized according to the governing constraint identified for each building.
5.4. Distinction Between the Quantitative Accessibility Indicator and Functional Accessibility
The Accessible WC Ratio (EWC) showed substantial variation across buildings. Using the selected 10% reference derived from IFRC disability-inclusive shelter guidance [21], 53.8% of the buildings met the numerical benchmark, whereas 46.2% did not. However, EWC measures only the proportion of WCs recorded as accessible and cannot establish overall physical or functional accessibility.
Because EWC is derived from integer facility counts, relatively small changes in the number of accessible or total WCs can considerably affect the percentage, particularly in buildings with few facilities. Interpretation should therefore consider the underlying fixture counts alongside the ratio. Moreover, IFRC guidance emphasizes that accessibility depends on effective use of facilities, not numerical provision alone [21]. Access routes, circulation, dimensions, fixture arrangements, and usability under emergency conditions were not comprehensively evaluated by the present indicator.
Consequently, meeting the EWC benchmark should be interpreted as numerical threshold attainment rather than confirmation of accessible shelter conditions. Future assessments should combine facility counts with systematic evaluations of physical and functional accessibility.
5.5. Implications for Pre-Disaster Collective Shelter Assessment
The findings suggest that pre-disaster evaluation should consider at least three interrelated components: (i) existing and convertible spatial capacity, (ii) sanitation and supporting infrastructure relative to anticipated user demand, and (iii) accessible use. Reporting these dimensions separately provides a more transparent basis for identifying building-specific constraints than a single aggregate suitability score, which could allow favorable performance in one dimension to conceal limitations in another.
This approach extends adaptive reuse assessment beyond a binary usable/not usable decision [47]. Rather than identifying buildings solely by nominal capacity, pre-disaster screening should establish the conditions under which their spatial resources could be activated and the infrastructure adaptations required. Nevertheless, plan-based screening must be complemented by structural and non-structural safety assessments, evacuation requirements, and operational readiness before buildings are designated for shelter use.
Although building type was associated with the exploratory spatial profiles, the findings do not justify assigning fixed suitability categories to sports halls, youth centers, or other building types. Original building program may inform preliminary screening, but decisions should ultimately depend on building-specific conditions and measurements.
5.6. Sensitivity Analysis and Study Limitations
The principal limitation concerns the retrospective estimation of peak user load (No), available for 33 buildings used for collective shelter. The figures were obtained from building managers and represent approximate peak daily demand rather than systematically recorded simultaneous overnight occupancy. Because buildings also supported daytime refuge, temporary resting, and humanitarian assistance, the reported user loads may reflect different patterns of emergency use. Consequently, An, Ap, RWC, and RSH represent provision relative to reported demand rather than verified overnight accommodation conditions.
This distinction is particularly important for exceptionally low area-to-user ratios. Seven buildings had An values below 1 m2/person, including a minimum of 0.20 m2/person. These values may indicate substantial spatial pressure but cannot be interpreted as literal sleeping-space allocations to individual overnight residents. The spatial distribution of overnight occupants could not be consistently reconstructed, and the absence of statistical outlier status does not establish physical adequacy.
The selected humanitarian reference values also have context-dependent limitations. The 3.5 m2/person reference provides a consistent baseline, although higher allowances may be necessary depending on climate and included domestic functions. Similarly, sanitation requirements vary with the emergency phase and duration of use. The thresholds were therefore applied as planning benchmarks rather than definitive measures of operational adequacy.
Sensitivity analyses using hypothetical ±10% and ±20% changes in No demonstrated that some classifications depended on proximity to the selected thresholds. Across the ±20% scenario range, classifications changed for five buildings for An, six for Ap, six for RWC, and eight for RSH. These ranges were not empirically established error bounds. Additional exclusion scenarios indicated that extreme observations influenced some medians and threshold-attainment rates without exclusively determining the main descriptive patterns. Neither analysis resolves the uncertainty surrounding actual overnight occupancy.
A further limitation concerns the selected performance dimensions. Although architectural plans and field verification supported quantitative assessment of space, sanitation, and accessible WC provision, the indicators did not comprehensively measure privacy, hygiene quality, environmental comfort, ventilation, user experience, or functional accessibility. Temporary sanitation provision and changes in facility conditions over time were also not comprehensively represented. The framework should therefore be regarded as one component of broader building performance evaluation rather than a complete assessment of shelter quality.
The cluster analysis also requires caution. The three-cluster solution showed limited separation (silhouette = 0.305), while leave-one-out analysis yielded a mean ARI of 0.757. Bootstrap stability was moderate to limited, particularly for Cluster 2 (mean Jaccard similarity = 0.526). Excluding EWC produced low agreement with the original partition (ARI = 0.182), and excluding three repeated-plan buildings yielded an ARI of 0.590. These findings indicate that the spatial profiles are exploratory and sensitive to variable selection and sample composition rather than stable building typologies. Moreover, purposive sampling, unequal building-type representation, and the inclusion of only one fair and congress center limit generalizability.
Finally, spatial screening did not constitute a comprehensive assessment of post-earthquake structural safety, non-structural hazards, or operational readiness. The findings should therefore inform pre-disaster planning and identify potential adaptation requirements, not independently establish whether a building would be safe or suitable for occupation following a future disaster.
Despite these limitations, the study provides a systematic, plan-based approach for distinguishing spatial resources, convertible areas, and infrastructure constraints. Its principal contribution is the identification of building-specific capacity trade-offs that should be considered in preparing existing wide-span public buildings for potential collective shelter use.
6. Conclusions
This study evaluated the plan-based spatial performance of 39 wide-span public buildings examined following the 6 February 2023 Kahramanmaraş earthquakes, including 33 buildings used for temporary collective shelter. The findings indicate that shelter suitability cannot be assessed solely through building size or shelter-designated area, but requires the joint consideration of spatial composition, user demand, sanitation provision, and accessibility.
Among buildings with reported peak user-load data, 30.3% met the 3.5 m2/person reference based on Net Shelter Area, increasing to 48.5% when Potential Usable Area was considered. However, the governing-capacity analysis showed that sanitation provision was limiting, either individually or jointly, in 22 of the 39 buildings under the existing spatial capacity scenario and 35 buildings when convertible spatial reserves were included. Thus, additional potentially usable space does not necessarily translate into greater infrastructure-supported shelter capacity.
The exploratory cluster analysis identified three profiles with different functional spatial compositions and accessible WC ratios. Area-to-user indicators did not differ significantly across clusters, whereas reported-demand WC load differed significantly between Clusters 1 and 3. However, the limited stability of the cluster solution prevents these profiles from being interpreted as definitive classifications of shelter suitability. Furthermore, only 53.8% of the buildings met the selected quantitative accessible WC reference, which does not establish functional accessibility.
Sensitivity and robustness analyses demonstrated that some threshold-based classifications depended on assumptions regarding user numbers and sample composition. Because reported peak user loads were obtained retrospectively and did not distinguish simultaneous overnight occupancy from other forms of emergency use, the area-to-user and sanitation indicators should be interpreted as screening measures relative to reported demand rather than verified accommodation conditions.
The principal contribution of the proposed Building Performance Evaluation approach is the distinction between existing shelter area, convertible spatial reserves, sanitation capacity, and quantitative accessibility provision as interrelated but non-interchangeable performance components. This framework may support pre-disaster planning by identifying building-specific capacity constraints and adaptation requirements. Nevertheless, plan-based screening should be complemented by structural and non-structural safety assessments and operational evaluations. Future research should test the proposed evaluation framework across larger and more diverse samples of buildings and different disaster contexts, while incorporating environmental performance, user experience, privacy, and functional accessibility. In particular, the exploratory cluster profiles should be re-examined using independent building samples to assess their reproducibility, stability, and potential applicability beyond the present study context.
Supplementary Materials
The following supporting information can be downloaded at: https://www.mdpi.com/article/10.3390/buildings16224596/s1, Appendix S1: Building Identification Form; Table S1: Building-Level Accessible WC Provision and Compliance with Numerical Reference Thresholds; Table S2: Spearman Correlations among Clustering Variables; Table S3: Bootstrap Stability of the Three-Cluster Solution; Table S4: Building-Level Critical Changes in Reported Peak User Load for Threshold Attainment.
Author Contributions
Conceptualization, T.C. and M.B.B.; methodology, T.C. and M.B.B.; formal analysis, M.B.B.; investigation, T.C., M.B.B. and Y.T.; data curation, M.B.B. and Y.T.; validation, M.B.B.; visualization, M.B.B. and Y.T.; writing—original draft preparation, M.B.B.; writing—review and editing, T.C. and M.B.B.; supervision, T.C.; project administration, T.C.; funding acquisition, T.C. All authors have read and agreed to the published version of the manuscript.
Funding
This research was conducted within the scope of the project entitled “A User Experience–Oriented Identification of Parameters to Increase the Spatial Efficiency of Large-Span Temporary Emergency Collective Shelters to Be Used After Earthquakes and a Guideline Proposal for Inclusion in the Türkiye Disaster Response Plan” (Project No. 124K004), supported by the Scientific and Technological Research Council of Türkiye (TÜBİTAK) under the TÜBİTAK 1001 Program.
Institutional Review Board Statement
The study was reviewed and approved by the Çukurova University Social and Human Sciences Scientific Research and Publication Ethics Committee on 25 June 2024 (Decision No. 5; reference letter dated 30 May 2024, No. E.1019334).
Informed Consent Statement
Verbal informed consent was obtained from all facility managers prior to the interviews.
Data Availability Statement
The data supporting the findings of this study were generated within the scope of an ongoing research project. The underlying architectural documentation and field data are not publicly available at this stage but may be available from the corresponding author upon reasonable request, subject to project and institutional restrictions.
Acknowledgments
The authors would like to thank the TÜBİTAK project research team for their contributions. During the preparation of this manuscript, the authors used ChatGPT-6 (OpenAI) to assist with language refinement, structural organization, and checks of formatting and reference consistency. All AI-assisted content was critically reviewed and revised by the authors. The authors made and verified all scientific decisions, data analyses, interpretations, and conclusions and take full responsibility for the final content of the manuscript.
Conflicts of Interest
The authors declare no conflicts of interest. The funder had no role in the design of the study; in the collection, analyses, or interpretation of data; in the writing of the manuscript; or in the decision to publish the results.
References
- Disaster and Emergency Management Authority (AFAD). 06 Şubat 2023 Pazarcık-Elbistan (Kahramanmaraş) Mw 7.7–Mw 7.6 Depremleri Raporu [Report on the 6 February 2023 Pazarcık-Elbistan (Kahramanmaraş) Mw 7.7–Mw 7.6 Earthquakes]; Deprem ve Risk Azaltma Genel Müdürlüğü, Deprem Dairesi Başkanlığı: Ankara, Türkiye, 2023. [Google Scholar]
- Yilmaz, Z.; Altunişik, A.C.; Taciroglu, E.; Günaydin, M.; Okur, F.Y.; Sunca, F.; Şişman, R.; Aslan, B.; Sezdirmez, T. Regional building damage survey data on the 2023 Kahramanmaraş, Türkiye, earthquakes. ASCE OPEN Multidiscip. J. Civ. Eng. 2024, 2, 04024009. [Google Scholar] [CrossRef] [Scilit]
- Presidency of Strategy and Budget. Kahramanmaraş ve Hatay Depremleri Yeniden İmar ve Gelişme Raporu [Kahramanmaraş and Hatay Earthquakes Reconstruction and Development Report]; Presidency of Strategy and Budget: Ankara, Türkiye, 2025. [Google Scholar]
- Galasso, C.; Opabola, E.A. The 2023 Kahramanmaraş earthquake sequence: Finding a path to a more resilient, sustainable, and equitable society. Commun. Eng. 2024, 3, 24. [Google Scholar] [CrossRef] [Scilit]
- Koz, O.; Yahiaoui, A.; Guntepe, S.; Celik, O.C. Exploring why the February 6, 2023, Kahramanmaras earthquakes were so destructive: Further analysis of the SGM data and bidirectional effects. ASCE OPEN Multidiscip. J. Civ. Eng. 2025, 3. [Google Scholar] [CrossRef] [Scilit]
- Republic of Türkiye. Afet ve Acil Durum Müdahale Hizmetleri Yönetmeliği [Regulation on Disaster and Emergency Response Services]. In Resmî Gazete, No. 31760; Republic of Türkiye, 2022. Available online: https://aile.gov.tr/media/197773/afet-ve-acil-durum-mudahale-hizmetleri-yonetmeligi.pdf (accessed on 10 November 2026).
- Davis, I. Shelter After Disaster; Oxford Polytechnic Press: Oxford, UK, 1978. [Google Scholar]
- Quarantelli, E.L. Patterns of sheltering and housing in US disasters. Disaster Prev. Manag. 1995, 4, 43–53. [Google Scholar] [CrossRef] [Scilit]
- Corsellis, T.; Vitale, A. Transitional Settlement: Displaced Populations; Oxfam GB in association with the University of Cambridge Shelterproject: Oxford, UK, 2005. [Google Scholar]
- United Nations High Commissioner for Refugees; International Organization for Migration. Collective Centre Guidelines; Global Camp Coordination and Camp Management Cluster: Geneva, Switzerland, 2010. [Google Scholar]
- Sphere Association. The Sphere Handbook: Humanitarian Charter and Minimum Standards in Humanitarian Response, 4th ed.; Sphere Association: Geneva, Switzerland, 2018. [Google Scholar]
- Wong, L. Adaptive Reuse: Extending the Lives of Buildings; Birkhäuser: Basel, Switzerland, 2016. [Google Scholar]
- Vafaie, F.; Remøy, H.; Gruis, V. Adaptive reuse of heritage buildings: A systematic literature review of success factors. Habitat Int. 2023, 142, 102926. [Google Scholar] [CrossRef] [Scilit]
- Kurtoğlu, D. From Reuse Potential to Reuse Success: Developing and Applying the Adaptive Reuse Success Index for Industrial Heritage Buildings. Buildings 2026, 16, 3072. [Google Scholar] [CrossRef] [Scilit]
- Johnson, C. Strategic planning for post-disaster temporary housing. Disasters 2007, 31, 435–458. [Google Scholar] [CrossRef] [Scilit]
- Félix, D.; Branco, J.M.; Feio, A. Temporary housing after disasters: A state of the art survey. Habitat Int. 2013, 40, 136–141. [Google Scholar] [CrossRef] [Scilit]
- Lines, R.; Faure Walker, J.P.; Yore, R. Progression through emergency and temporary shelter, transitional housing and permanent housing: A longitudinal case study from the 2018 Lombok earthquake, Indonesia. Int. J. Disaster Risk Reduct. 2022, 75, 102959. [Google Scholar] [CrossRef] [Scilit]
- Zhong, G.; Zhai, G.; Shang, K.; Chen, W. A two-stage hierarchical model for spatial location and evacuation allocation problem of urban earthquake shelters: A case study in Central urban area of Yangbi County, Yunnan Province, China. Geomat. Nat. Hazards Risk 2022, 13, 1721–1761. [Google Scholar] [CrossRef] [Scilit]
- Makadi, Y.C.; Arlikatti, S.; Zewdu, D.; Maghelal, P. Review of temporary shelter planning models: Global trends and evidence from ongoing practices. Nat. Hazards Rev. 2025, 26, 04025041. [Google Scholar] [CrossRef] [Scilit]
- Tsioulou, A.; Faure Walker, J.; Lo, D.S.; Yore, R. A method for determining the suitability of schools as evacuation shelters and aid distribution hubs following disasters: Case study from Cagayan de Oro, Philippines. Nat. Hazards 2021, 105, 1835–1859. [Google Scholar] [CrossRef] [Scilit]
- International Federation of Red Cross and Red Crescent Societies (IFRC). All Under One Roof: Disability-Inclusive Shelter and Settlements in Emergencies; IFRC: Geneva, Switzerland, 2015. [Google Scholar]
- Disaster and Emergency Management Authority (AFAD). Türkiye Afet Müdahale Planı (TAMP) [Türkiye Disaster Response Plan]; Disaster and Emergency Management Authority (AFAD): Ankara, Türkiye, 2022. Available online: https://www.afad.gov.tr/turkiye-afet-mudahale-plani (accessed on 10 November 2026).
- Adana Governorship; Provincial Directorate of Disaster and Emergency Management (AFAD). Adana Provincial Disaster Risk Reduction Plan (İRAP). Disaster and Emergency Management Authority. 2021. Available online: https://adana.afad.gov.tr/kurumlar/adana.afad/Egitim-Dokuman/ADANA-IRAP.pdf (accessed on 1 October 2026).
- Preiser, W.F.E.; Vischer, J.C. (Eds.) Assessing Building Performance; Elsevier: Oxford, UK, 2005. [Google Scholar]
- Preiser, W.F.E.; Hardy, A.E.; Schramm, U. (Eds.) Building Performance Evaluation: From Delivery Process to Life Cycle Phases, 2nd ed.; Springer: Cham, Switzerland, 2018. [Google Scholar] [CrossRef] [Scilit]
- Gkoumas, I.; Mavridou, T.; Seymour, V.; Nanos, N. Post-disaster housing and social considerations. Int. J. Disaster Risk Reduct. 2025, 124, 105537. [Google Scholar] [CrossRef] [Scilit]
- T.C. Gençlik ve Spor Bakanlığı. 2023 Yılı Kurumsal Mali Durum ve Beklentiler Raporu [2023 Institutional Financial Status and Expectations Report]; Strateji Geliştirme Başkanlığı: Ankara, Türkiye, 2023. [Google Scholar]
- T.C. Adana Valiliği. Vali Elban’dan Geçici Barınma Merkezi’ne Ziyaret [Governor Elban Visits the Temporary Accommodation Center]; T.C. Adana Valiliği: Adana, Türkiye, 2023. Available online: https://www.adana.gov.tr/sy-1153 (accessed on 1 October 2026).
- Khaddour, L.A.; Obead, R.; Yeboah, S.K.; Mendis, T.; El-Berishy, N.M.; Shyha, I. Rethinking Post-Disaster Shelters: An Integrated LCA of Environmental, Techno-Economic and Resilience Across Three Modern Methods of Construction. Buildings 2026, 16, 3552. [Google Scholar] [CrossRef] [Scilit]
- Zea Escamilla, E.; Habert, G. Global or local construction materials for post-disaster reconstruction? Sustainability assessment of twenty post-disaster shelter designs. Build. Environ. 2015, 92, 692–702. [Google Scholar] [CrossRef] [Scilit]
- United Nations High Commissioner for Refugees (UNHCR). Emergency Handbook: Settlement and Shelter. 21 October 2026. Available online: https://emergency.unhcr.org/emergency-assistance/settlement-and-shelter/guidance-settlements/principles-standards-settlement-planning (accessed on 10 November 2026).
- Federal Emergency Management Agency (FEMA). Guidance on Planning for Integration of Functional Needs Support Services in General Population Shelters; U.S. Department of Homeland Security: Washington, DC, USA, 2010.
- Hershberger, R.G. Architectural Programming and Predesign Manager; McGraw-Hill: New York, NY, USA, 1999. [Google Scholar]
- Peña, W.M.; Parshall, S.A. Problem Seeking: An Architectural Programming Primer, 5th ed.; John Wiley & Sons: Hoboken, NJ, USA, 2012. [Google Scholar]
- Twigg, J.; Kett, M.; Bottomley, H.; Tan, L.T.; Nasreddin, H. Disability and public shelter in emergencies. Environ. Hazards 2011, 10, 248–261. [Google Scholar] [CrossRef] [Scilit]
- Brittingham, R.; Wachtendorf, T. The effect of situated access on people with disabilities: An examination of sheltering and temporary housing after the 2011 Japan earthquake and tsunami. Earthq. Spectra 2013, 29, S433–S455. [Google Scholar] [CrossRef] [Scilit]
- CIB Working Commission W60. Working with the Performance Approach in Building; CIB Report, Publication 64; International Council for Building Research Studies and Documentation: Rotterdam, The Netherlands, 1982. [Google Scholar]
- Preiser, W.F.E.; Schramm, U. Building performance evaluation. In Time-Saver Standards for Architectural Design Data, 7th ed.; Watson, D., Crosbie, M.J., Callender, J.H., Eds.; McGraw-Hill: New York, NY, USA, 1997. [Google Scholar]
- Li, P.; Froese, T.M.; Brager, G. Post-occupancy evaluation: State-of-the-art analysis and state-of-the-practice review. Build. Environ. 2018, 133, 187–202. [Google Scholar] [CrossRef] [Scilit]
- OECD/European Union/EC-JRC. Handbook on Constructing Composite Indicators: Methodology and User Guide; OECD Publishing: Paris, France, 2008. [Google Scholar] [CrossRef] [Scilit]
- Kahvecioğlu, B.; Arslan Selçuk, S. Review of sustainable temporary housing and reuse strategy for post-disaster architectures: Current trends and strategic gaps. J. Eng. Appl. Sci. 2025, 72, 8. [Google Scholar] [CrossRef] [Scilit]
- Bakhshi Lomer, A.R.; Rezaeian, M.; Rezaei, H.; Lorestani, A.; Mijani, N.; Mahdad, M.; Raeisi, A.; Jokar Arsanjani, J. Optimizing emergency shelter selection in earthquakes using a risk-driven large group decision-making support system. Sustainability 2023, 15, 4019. [Google Scholar] [CrossRef] [Scilit]
- Türker, H.B.; Kalkan, M.; Ortaç, G. Reimagining resilience: The transformative role of urban green areas in Türkiye’s disaster preparedness. Int. J. Disaster Risk Reduct. 2024, 106, 104397. [Google Scholar] [CrossRef] [Scilit]
- Wang, Z.; Cheng, J.; Xu, C. Earthquake scenario-specific framework for spatial accessibility analysis (SAA) of emergency shelters: A case study in Xichang City, Sichuan Province, China. Front. Earth Sci. 2024, 12, 1376900. [Google Scholar] [CrossRef] [Scilit]
- Hosseini, S.M.A.; Yazdani, R.; de la Fuente, A. Multi-objective interior design optimization method based on sustainability concepts for post-disaster temporary housing units. Build. Environ. 2020, 173, 106742. [Google Scholar] [CrossRef] [Scilit]
- Aslan, Z.; Demiröz, K.; Demiröz Yıldırım, S. An examination of temporary shelter units in terms of minimum standards: The case of the Kahramanmaraş earthquake. Sustainability 2025, 17, 3587. [Google Scholar] [CrossRef] [Scilit]
- Idemen, A.E.; Şener, S.M.; Acar, E. Assessing the adaptive re-use potential of buildings as part of disaster management processes. In Proceedings of the International Conference on Disaster and Emergency Management (ICDEM 2016), Paris, France, 14–15 March 2016; Available online: https://www.researchgate.net/profile/Emrah-Acar/publication/299420415_Assessing_the_adaptive_re-use_potential_of_buildings_as_part_of_disaster_management_processes/links/56f556a708ae81582bf21071/Assessing-the-adaptive-re-use-potential-of-buildings-as-part-of-disaster-management-processes.pdf (accessed on 10 November 2026).
- Kim, Y.O.; Kim, J.Y.; Yum, H.Y.; Lee, J.K. A study on mega-shelter layout planning based on user behavior. Buildings 2022, 12, 1630. [Google Scholar] [CrossRef] [Scilit]
- Xin, F.; Ma, Y.; Liao, P.; Fu, B. Evaluation of the university campus layout for the dual use as a city-level emergency shelter. Habitat Int. 2025, 156, 103285. [Google Scholar] [CrossRef] [Scilit]
- Zhi, X.; Huang, B.; Song, G.; Li, F.; Fan, F. Multi-parameter seismic resilience assessment framework for large-span spatial structure emergency shelters. Structures 2026, 87, 111575. [Google Scholar] [CrossRef] [Scilit]
- Preiser, W.F.E.; Rabinowitz, H.Z.; White, E.T. Post-Occupancy Evaluation; Van Nostrand Reinhold: New York, NY, USA, 1988. [Google Scholar]
- Groat, L.N.; Wang, D. Architectural Research Methods, 2nd ed.; John Wiley & Sons: Hoboken, NJ, USA, 2013. [Google Scholar]
- U.S. Department of Justice. 2010 ADA Standards for Accessible Design; U.S. Department of Justice: Washington, DC, USA, 2010. Available online: https://archive.ada.gov/regs2010/2010ADAStandards/2010ADAStandards.pdf (accessed on 10 November 2026).
- Brauer, R.L. Facilities Planning: The User Requirements Method, 2nd ed.; American Management Association: New York, NY, USA, 1992. [Google Scholar]
- De Chiara, J.; Crosbie, M.J. (Eds.) Time-Saver Standards for Building Types, 4th ed.; McGraw-Hill: New York, NY, USA, 2001. [Google Scholar]
- Patton, M.Q. Qualitative Research & Evaluation Methods: Integrating Theory and Practice, 4th ed.; SAGE Publications: Thousand Oaks, CA, USA, 2015. [Google Scholar]
- Ward, J.H., Jr. Hierarchical Grouping to Optimize an Objective Function. J. Am. Stat. Assoc. 1963, 58, 236–244. [Google Scholar] [CrossRef]
- Everitt, B.S.; Landau, S.; Leese, M.; Stahl, D. Cluster Analysis, 5th ed.; Wiley: Chichester, UK, 2011. [Google Scholar] [CrossRef] [Scilit]
- Nakai, H.; Horiike, R.; Itatani, T.; Tokuoka, M.; Maeda, A.; Iida, H.; Aoki, Y.; Toda, D.; Oe, M. Assessment of the risk of venous thromboembolism in overcrowded shelters: A geospatial and statistical analysis of the 2024 Noto Peninsula Earthquake. Cureus 2025, 17, e95558. [Google Scholar] [CrossRef] [Scilit]
- Ramos, R.A.; de los Reyes, V.C.; Sucaldito, M.N.; Tayag, E. Rapid health assessments of evacuation centres in areas affected by Typhoon Haiyan. West. Pac. Surveill. Response J. 2015, 6, 39–43. [Google Scholar] [CrossRef] [Scilit]
- Akaishi, T.; Morino, K.; Maruyama, Y.; Ishibashi, S.; Takayama, S.; Abe, M.; Kanno, T.; Tadano, Y.; Ishii, T. Restoration of clean water supply and toilet hygiene reduces infectious diseases in post-disaster evacuation shelters: A multicenter observational study. Heliyon 2021, 7, e07044. [Google Scholar] [CrossRef] [Scilit]
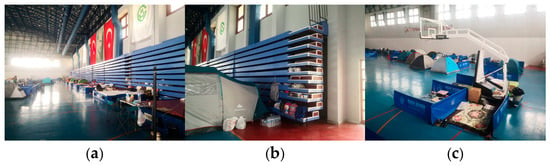
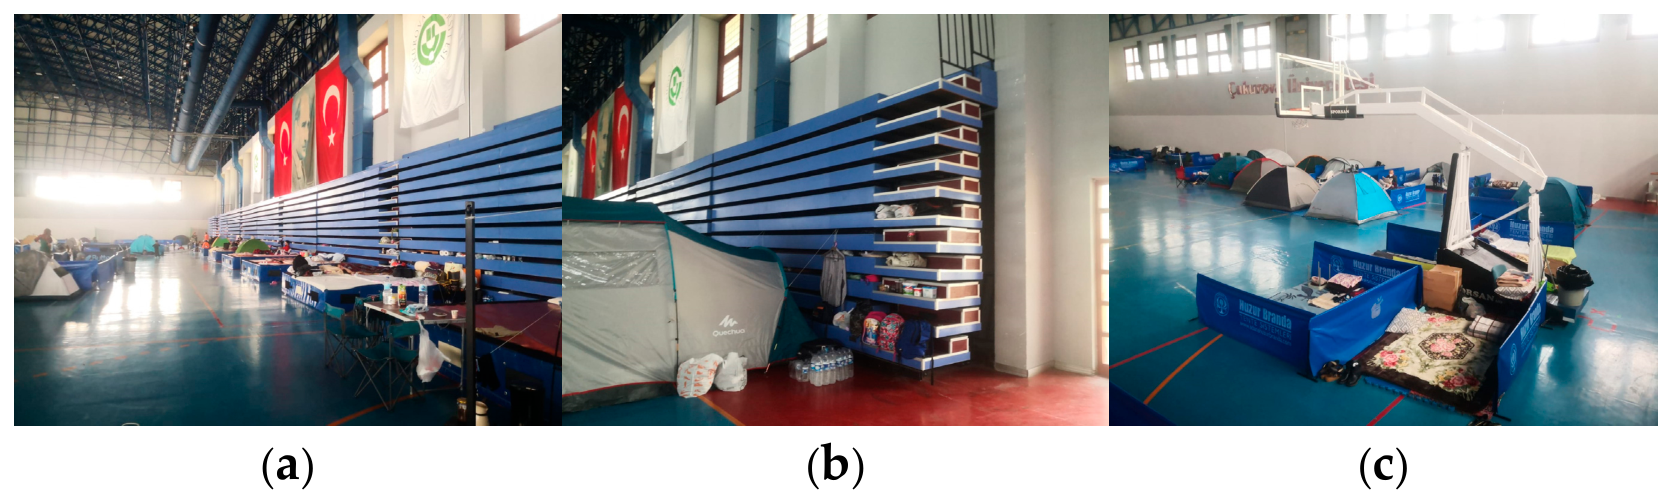
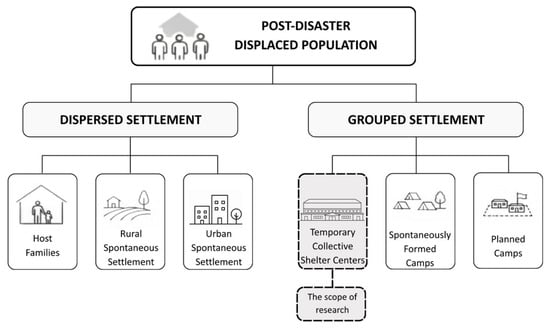
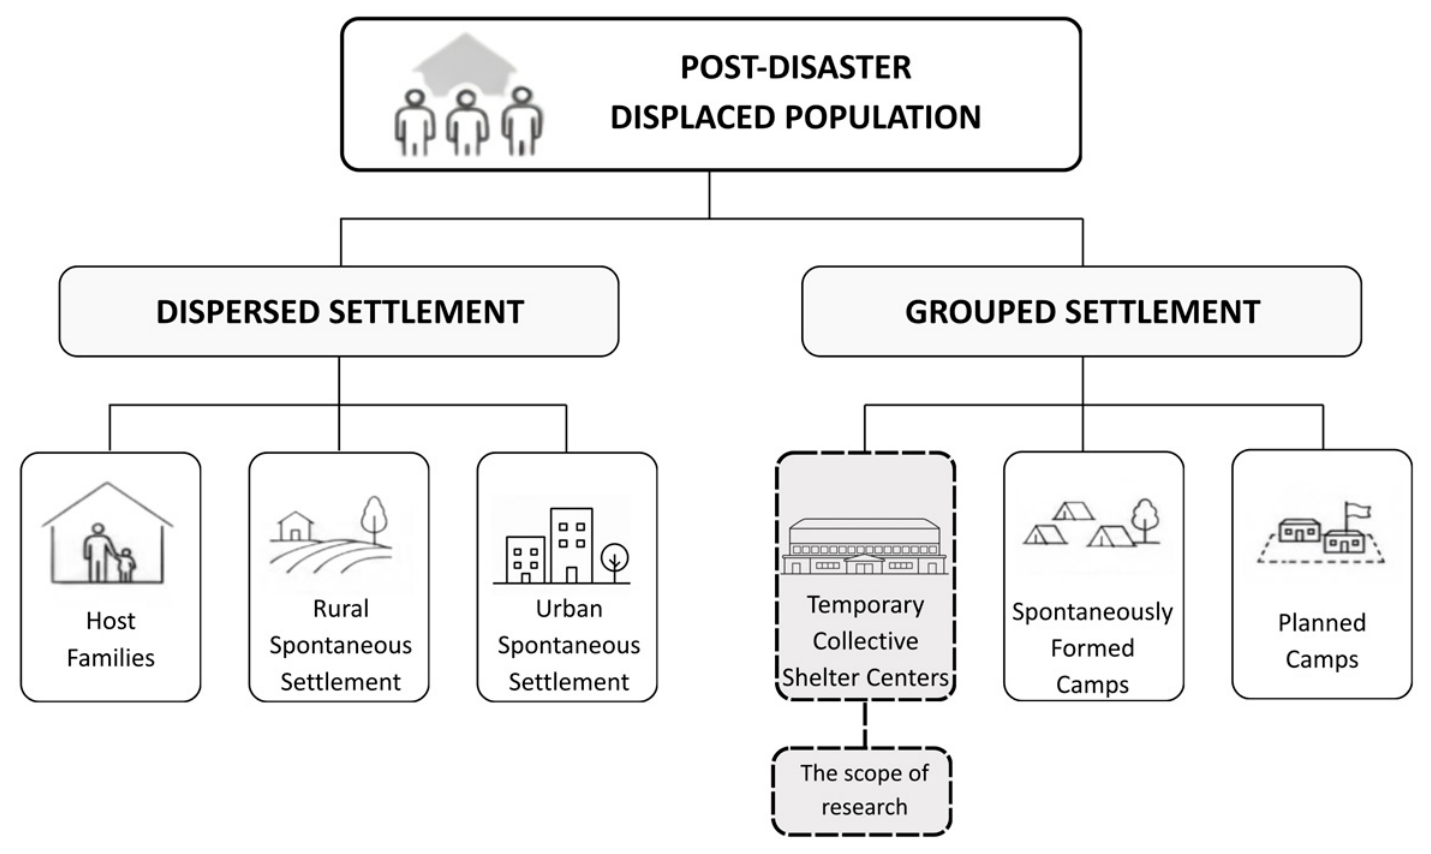
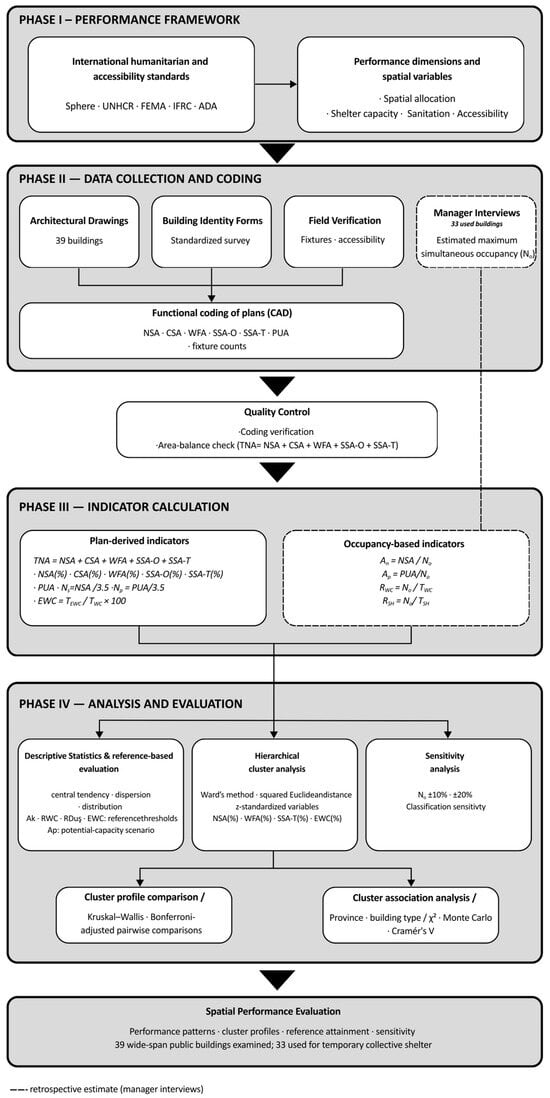
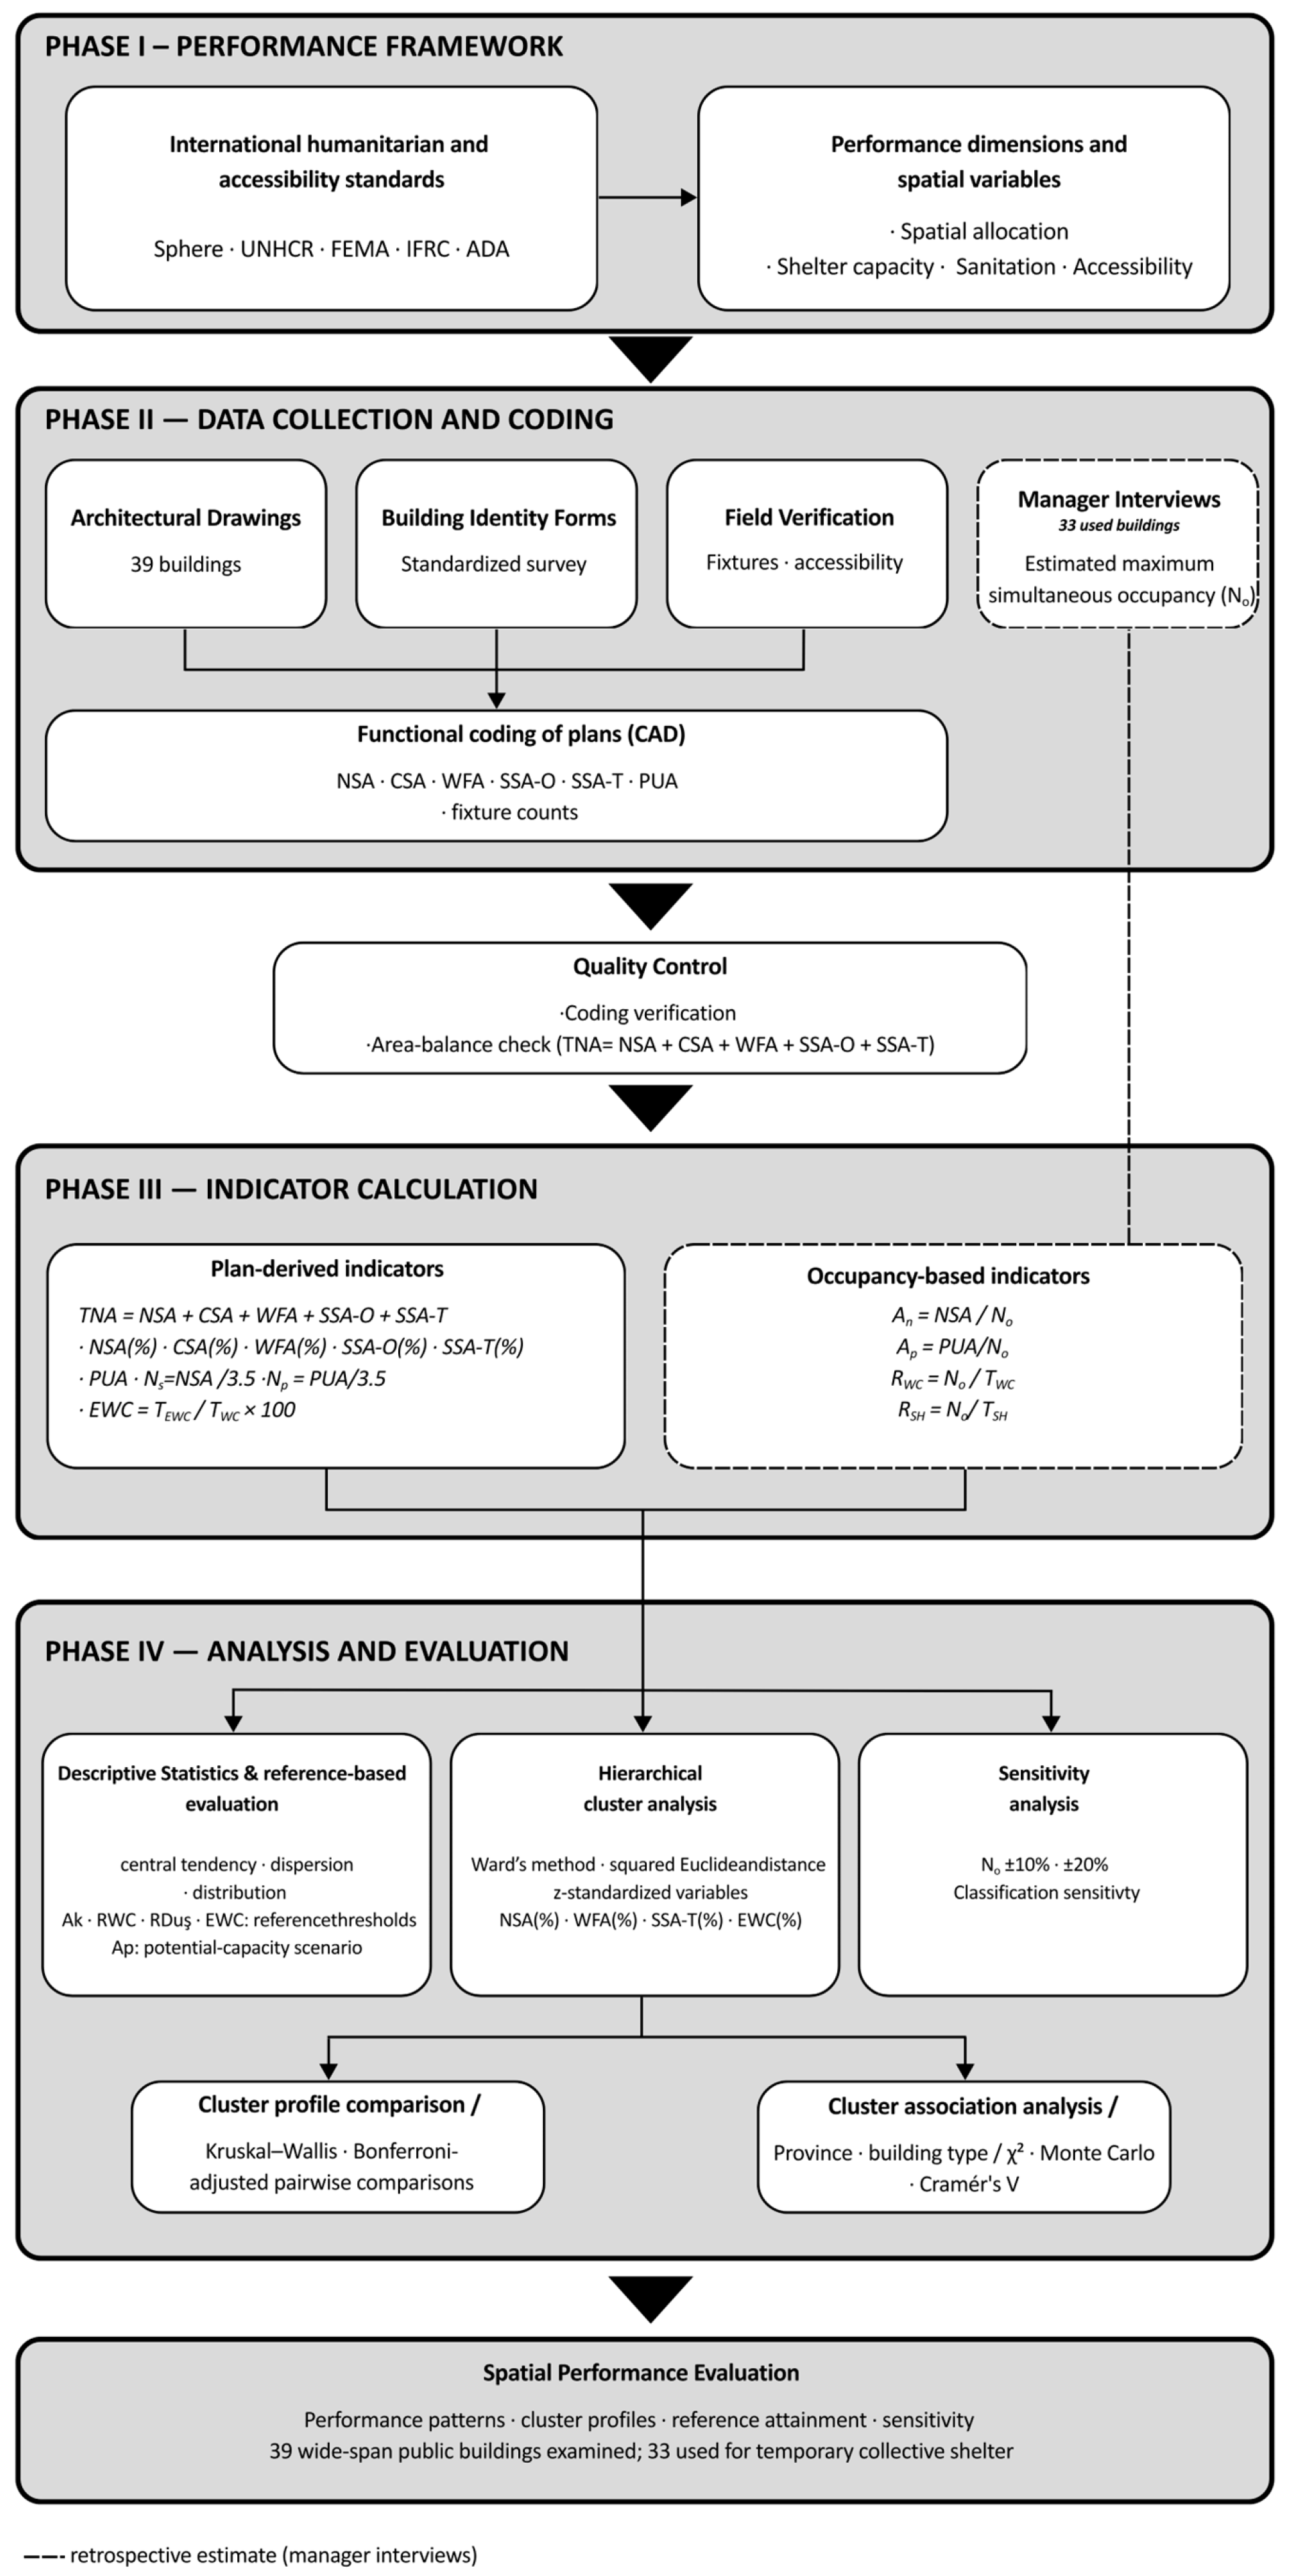
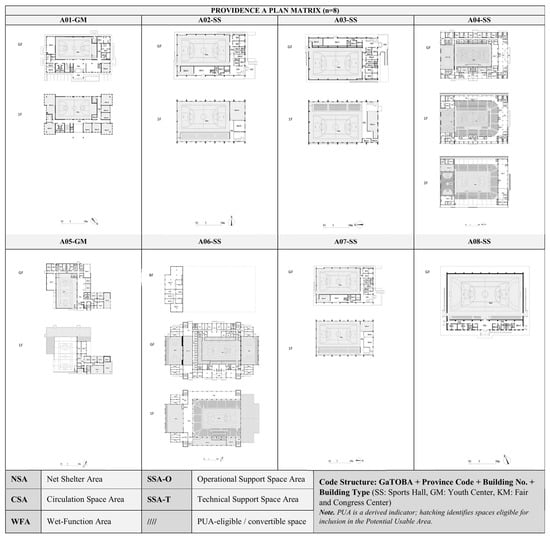
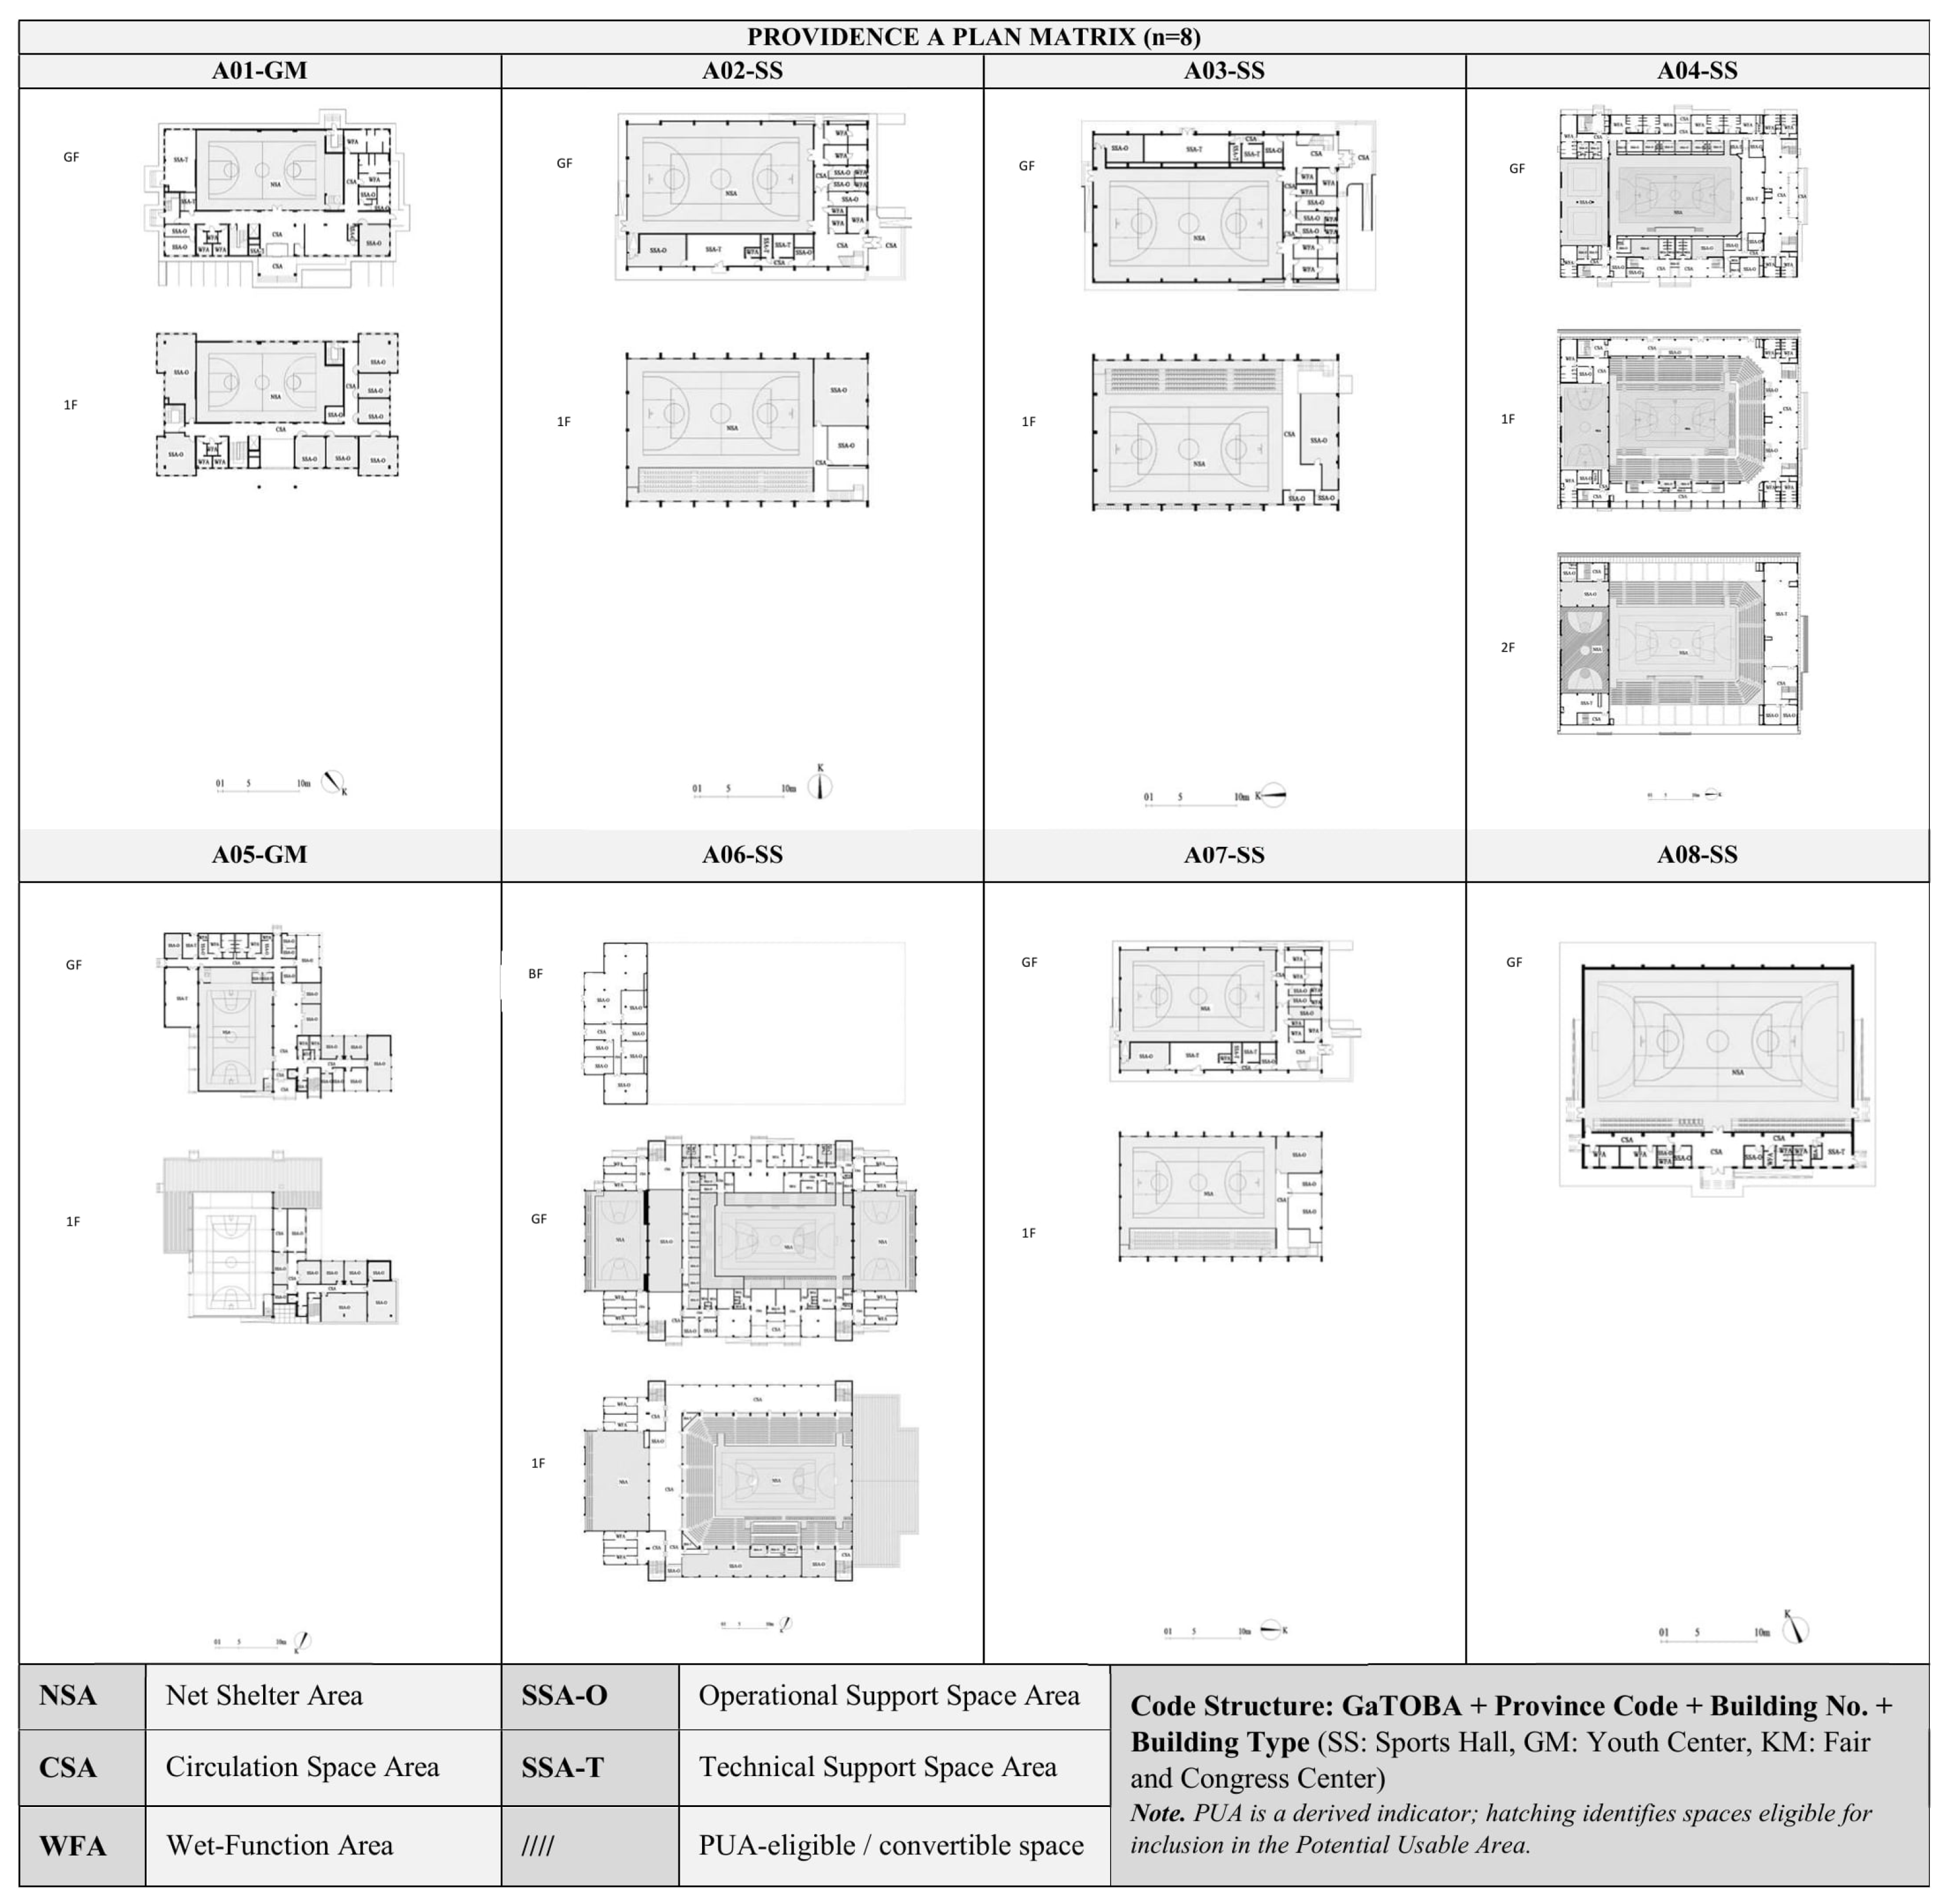
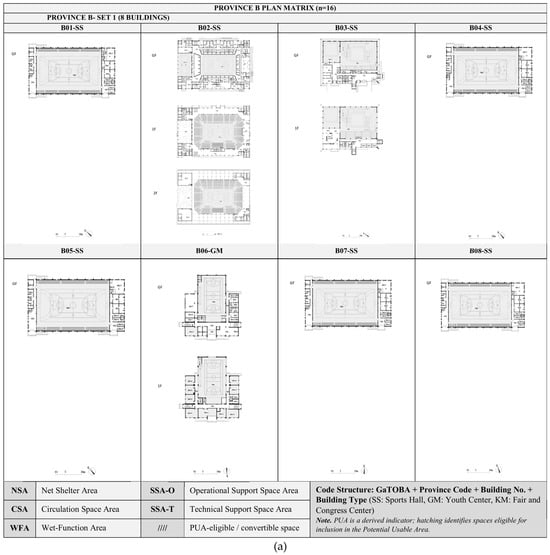
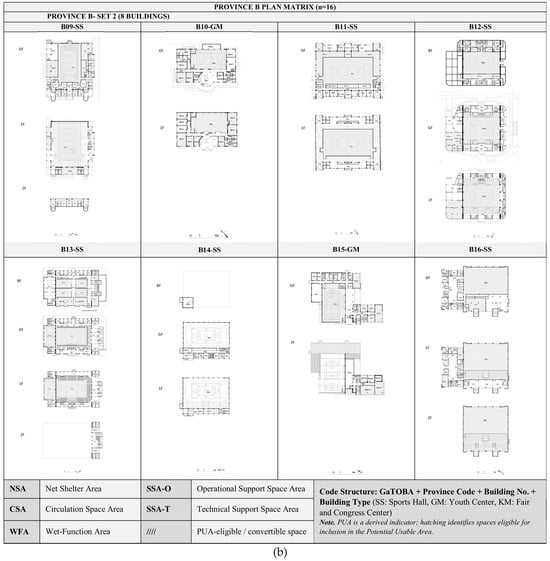
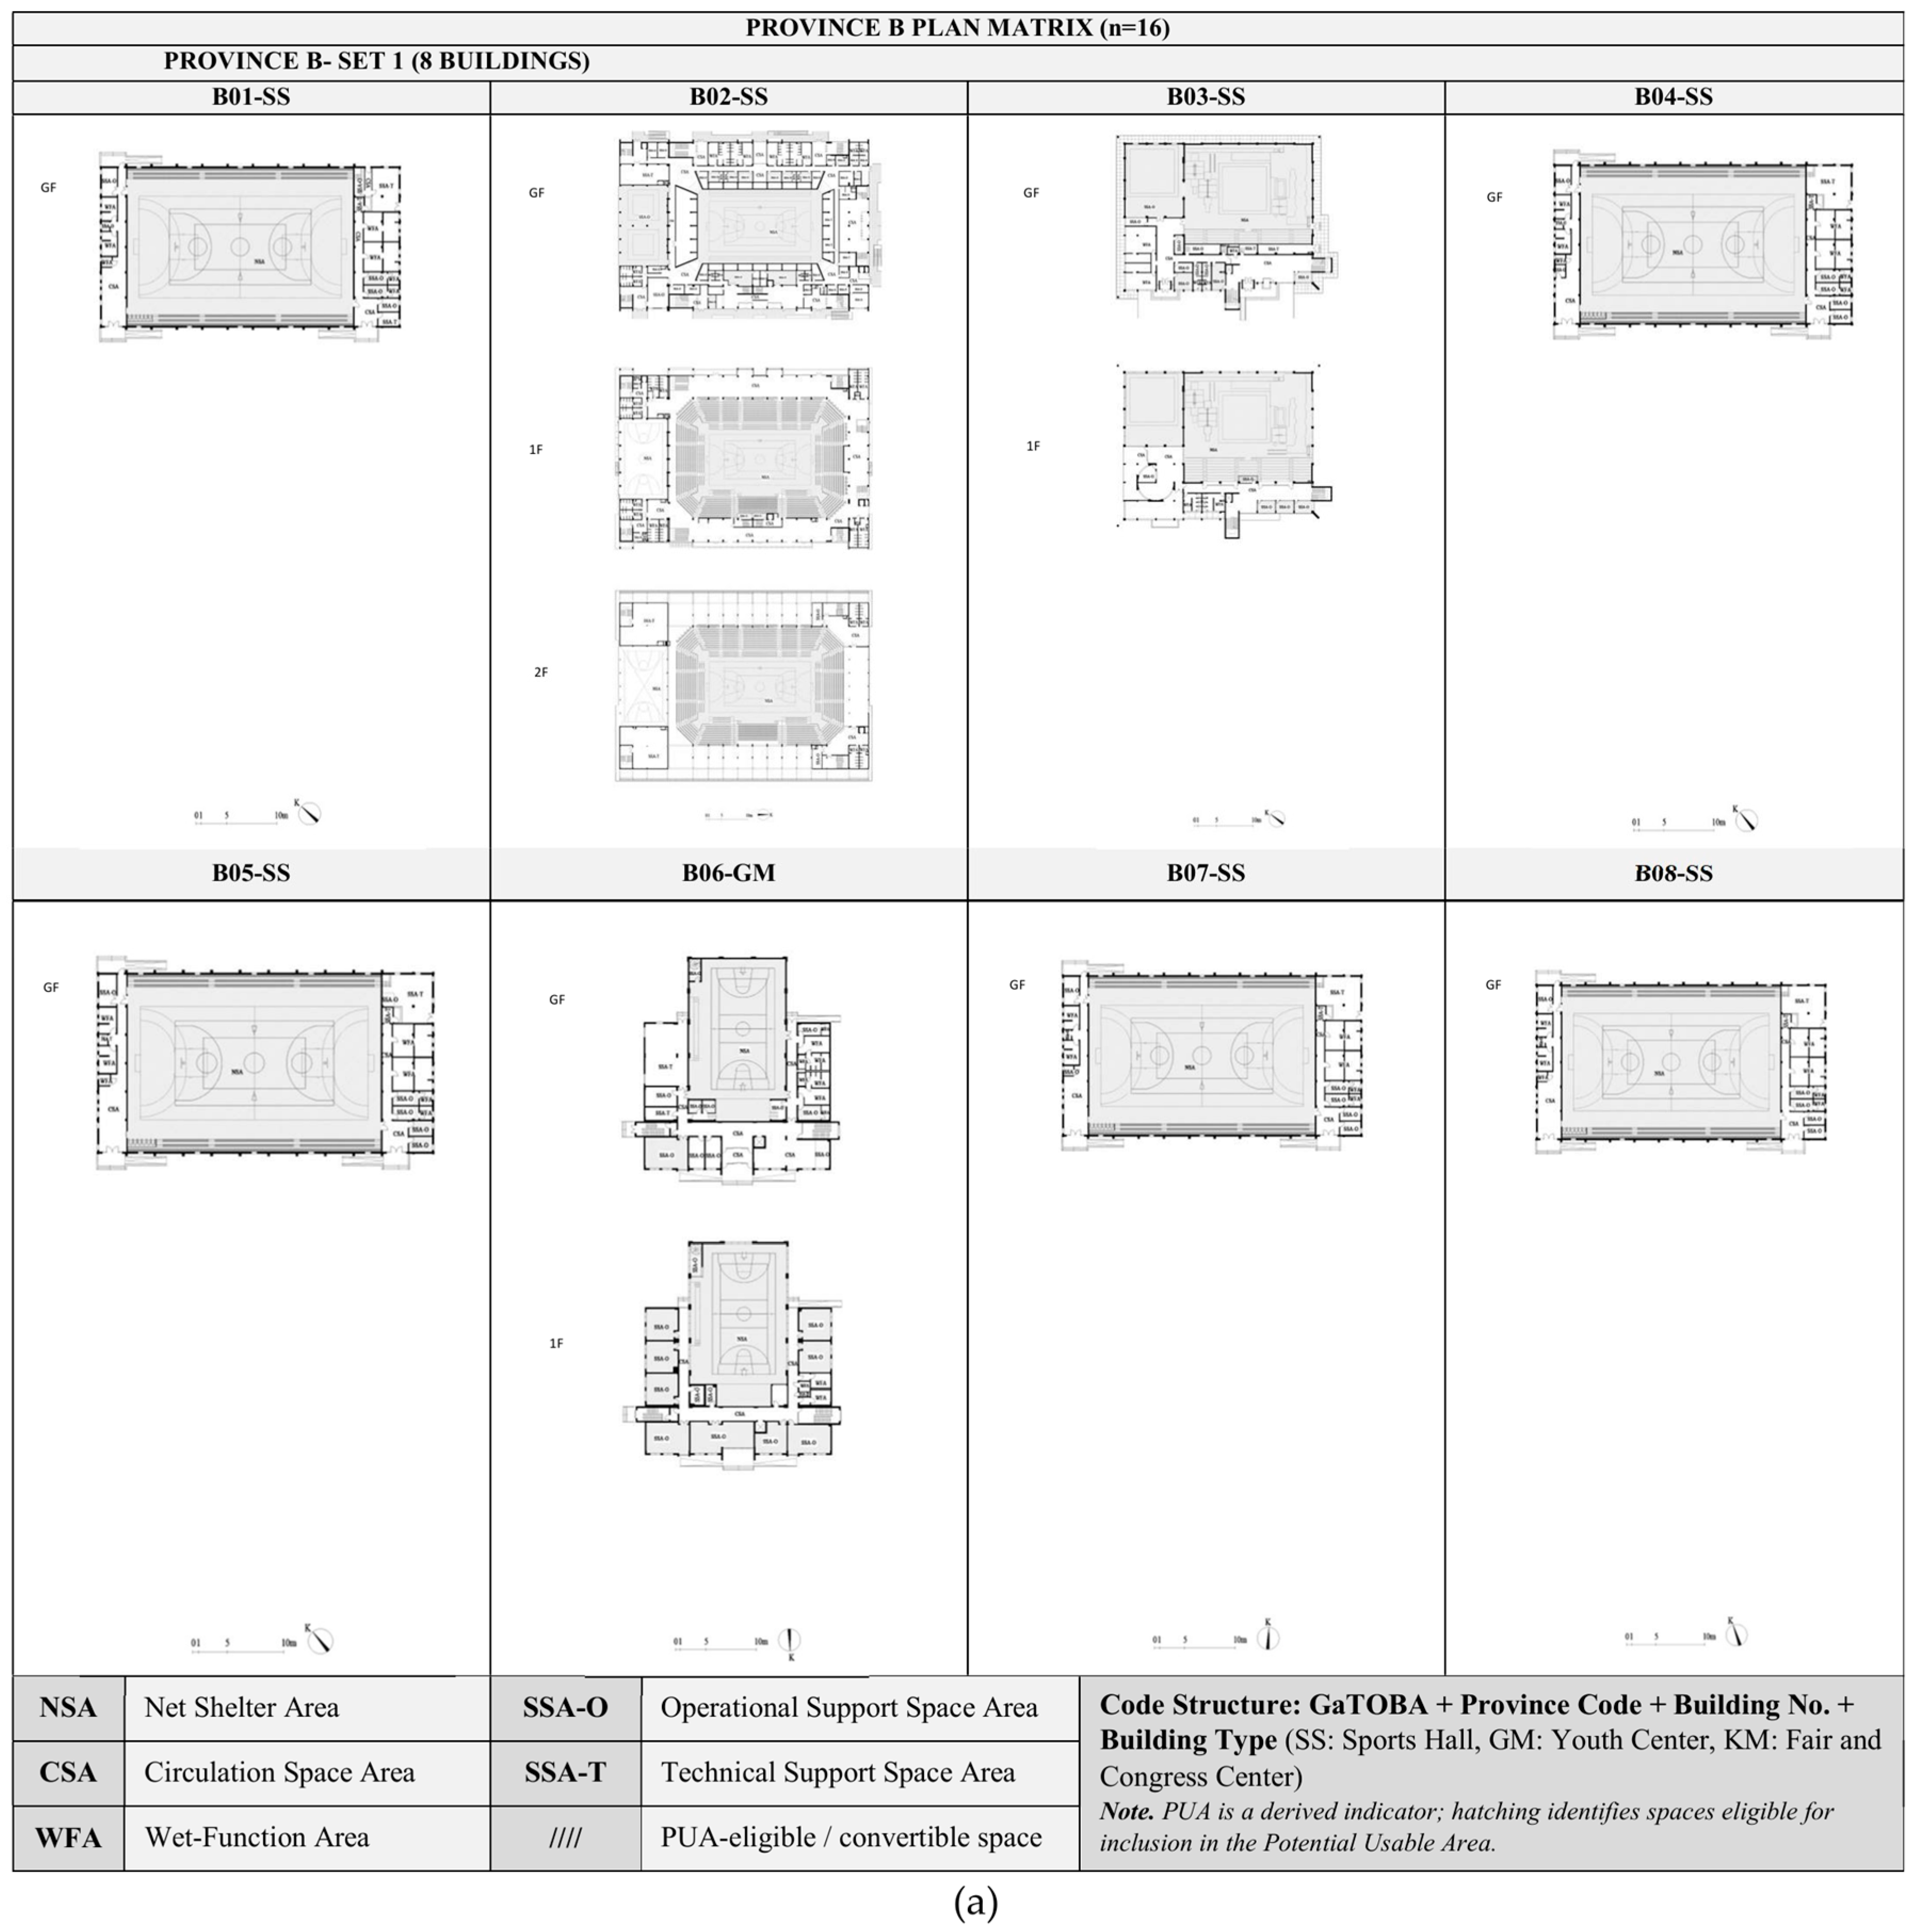
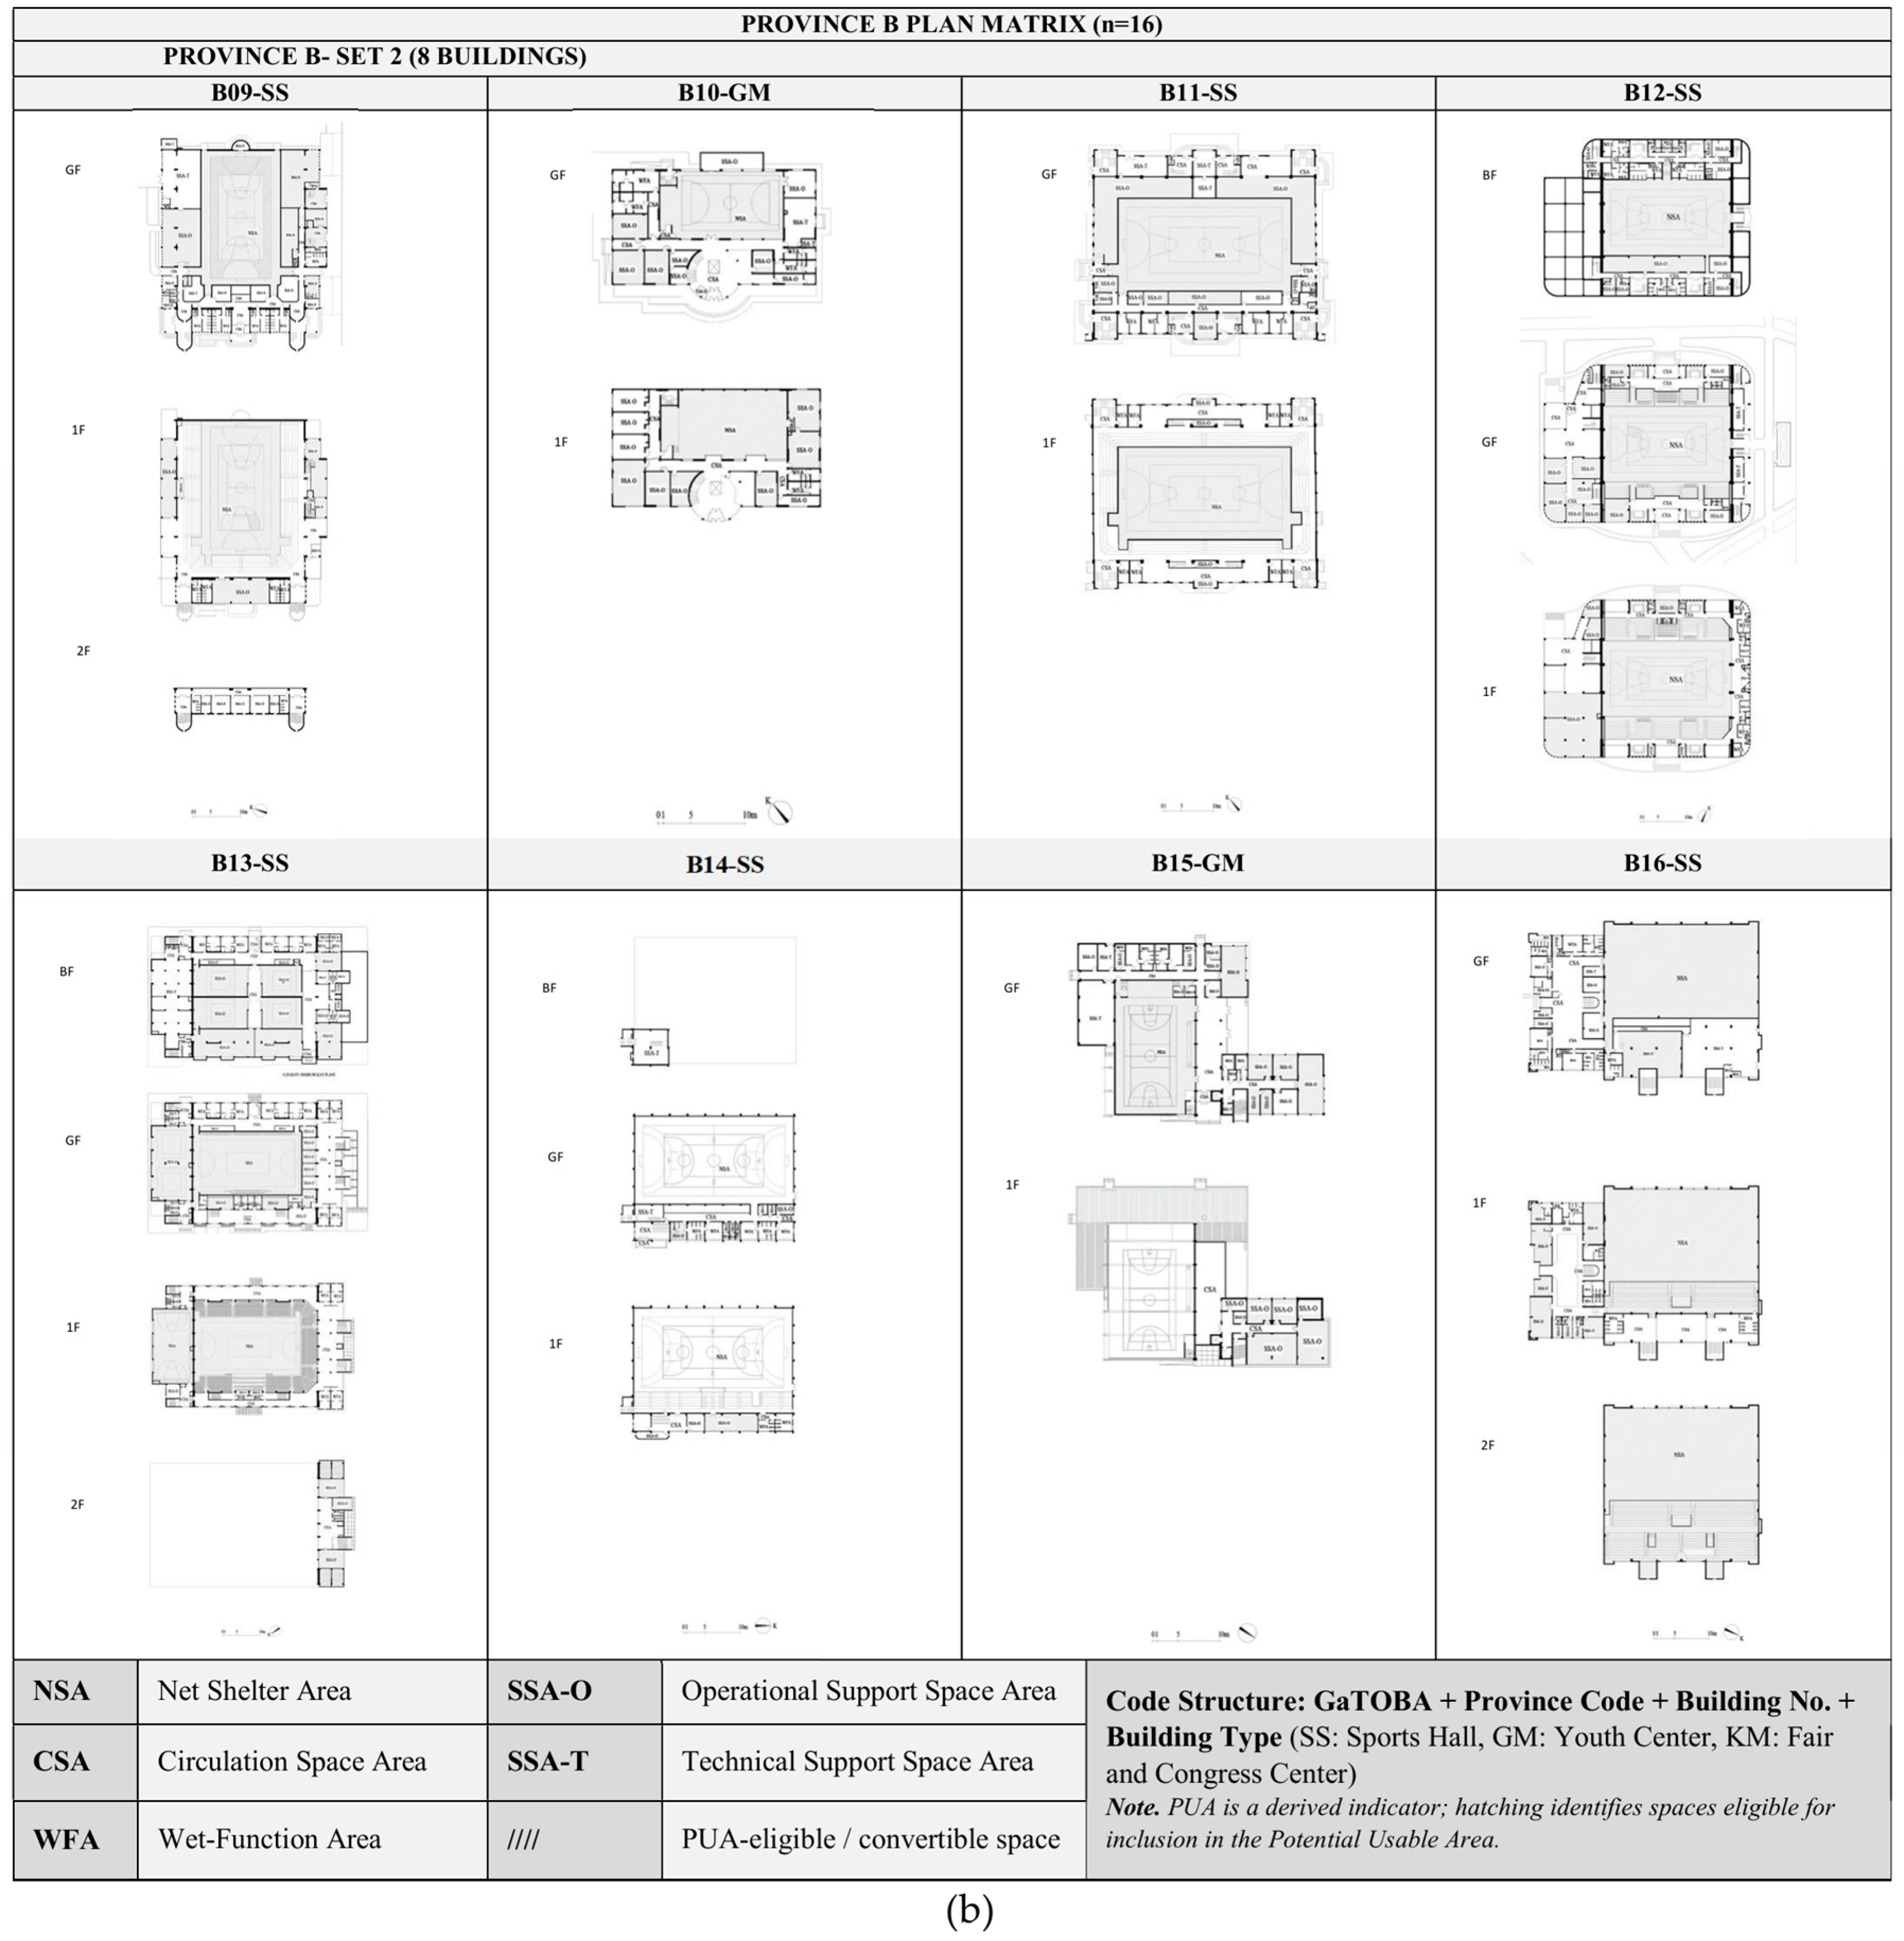
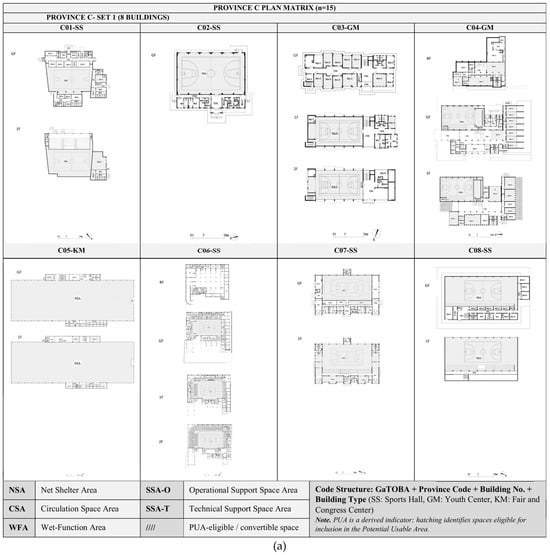
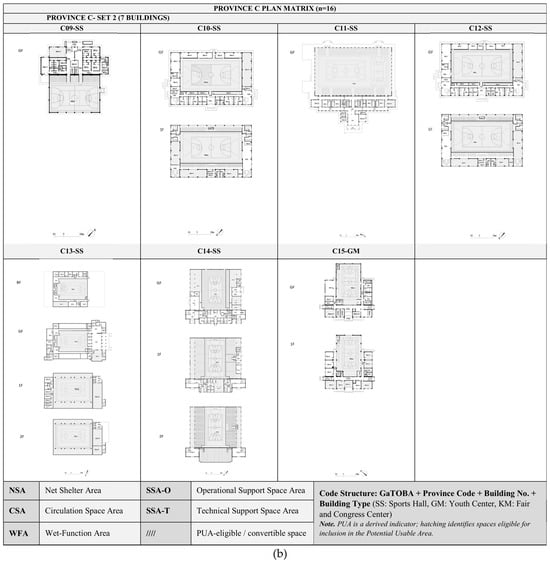
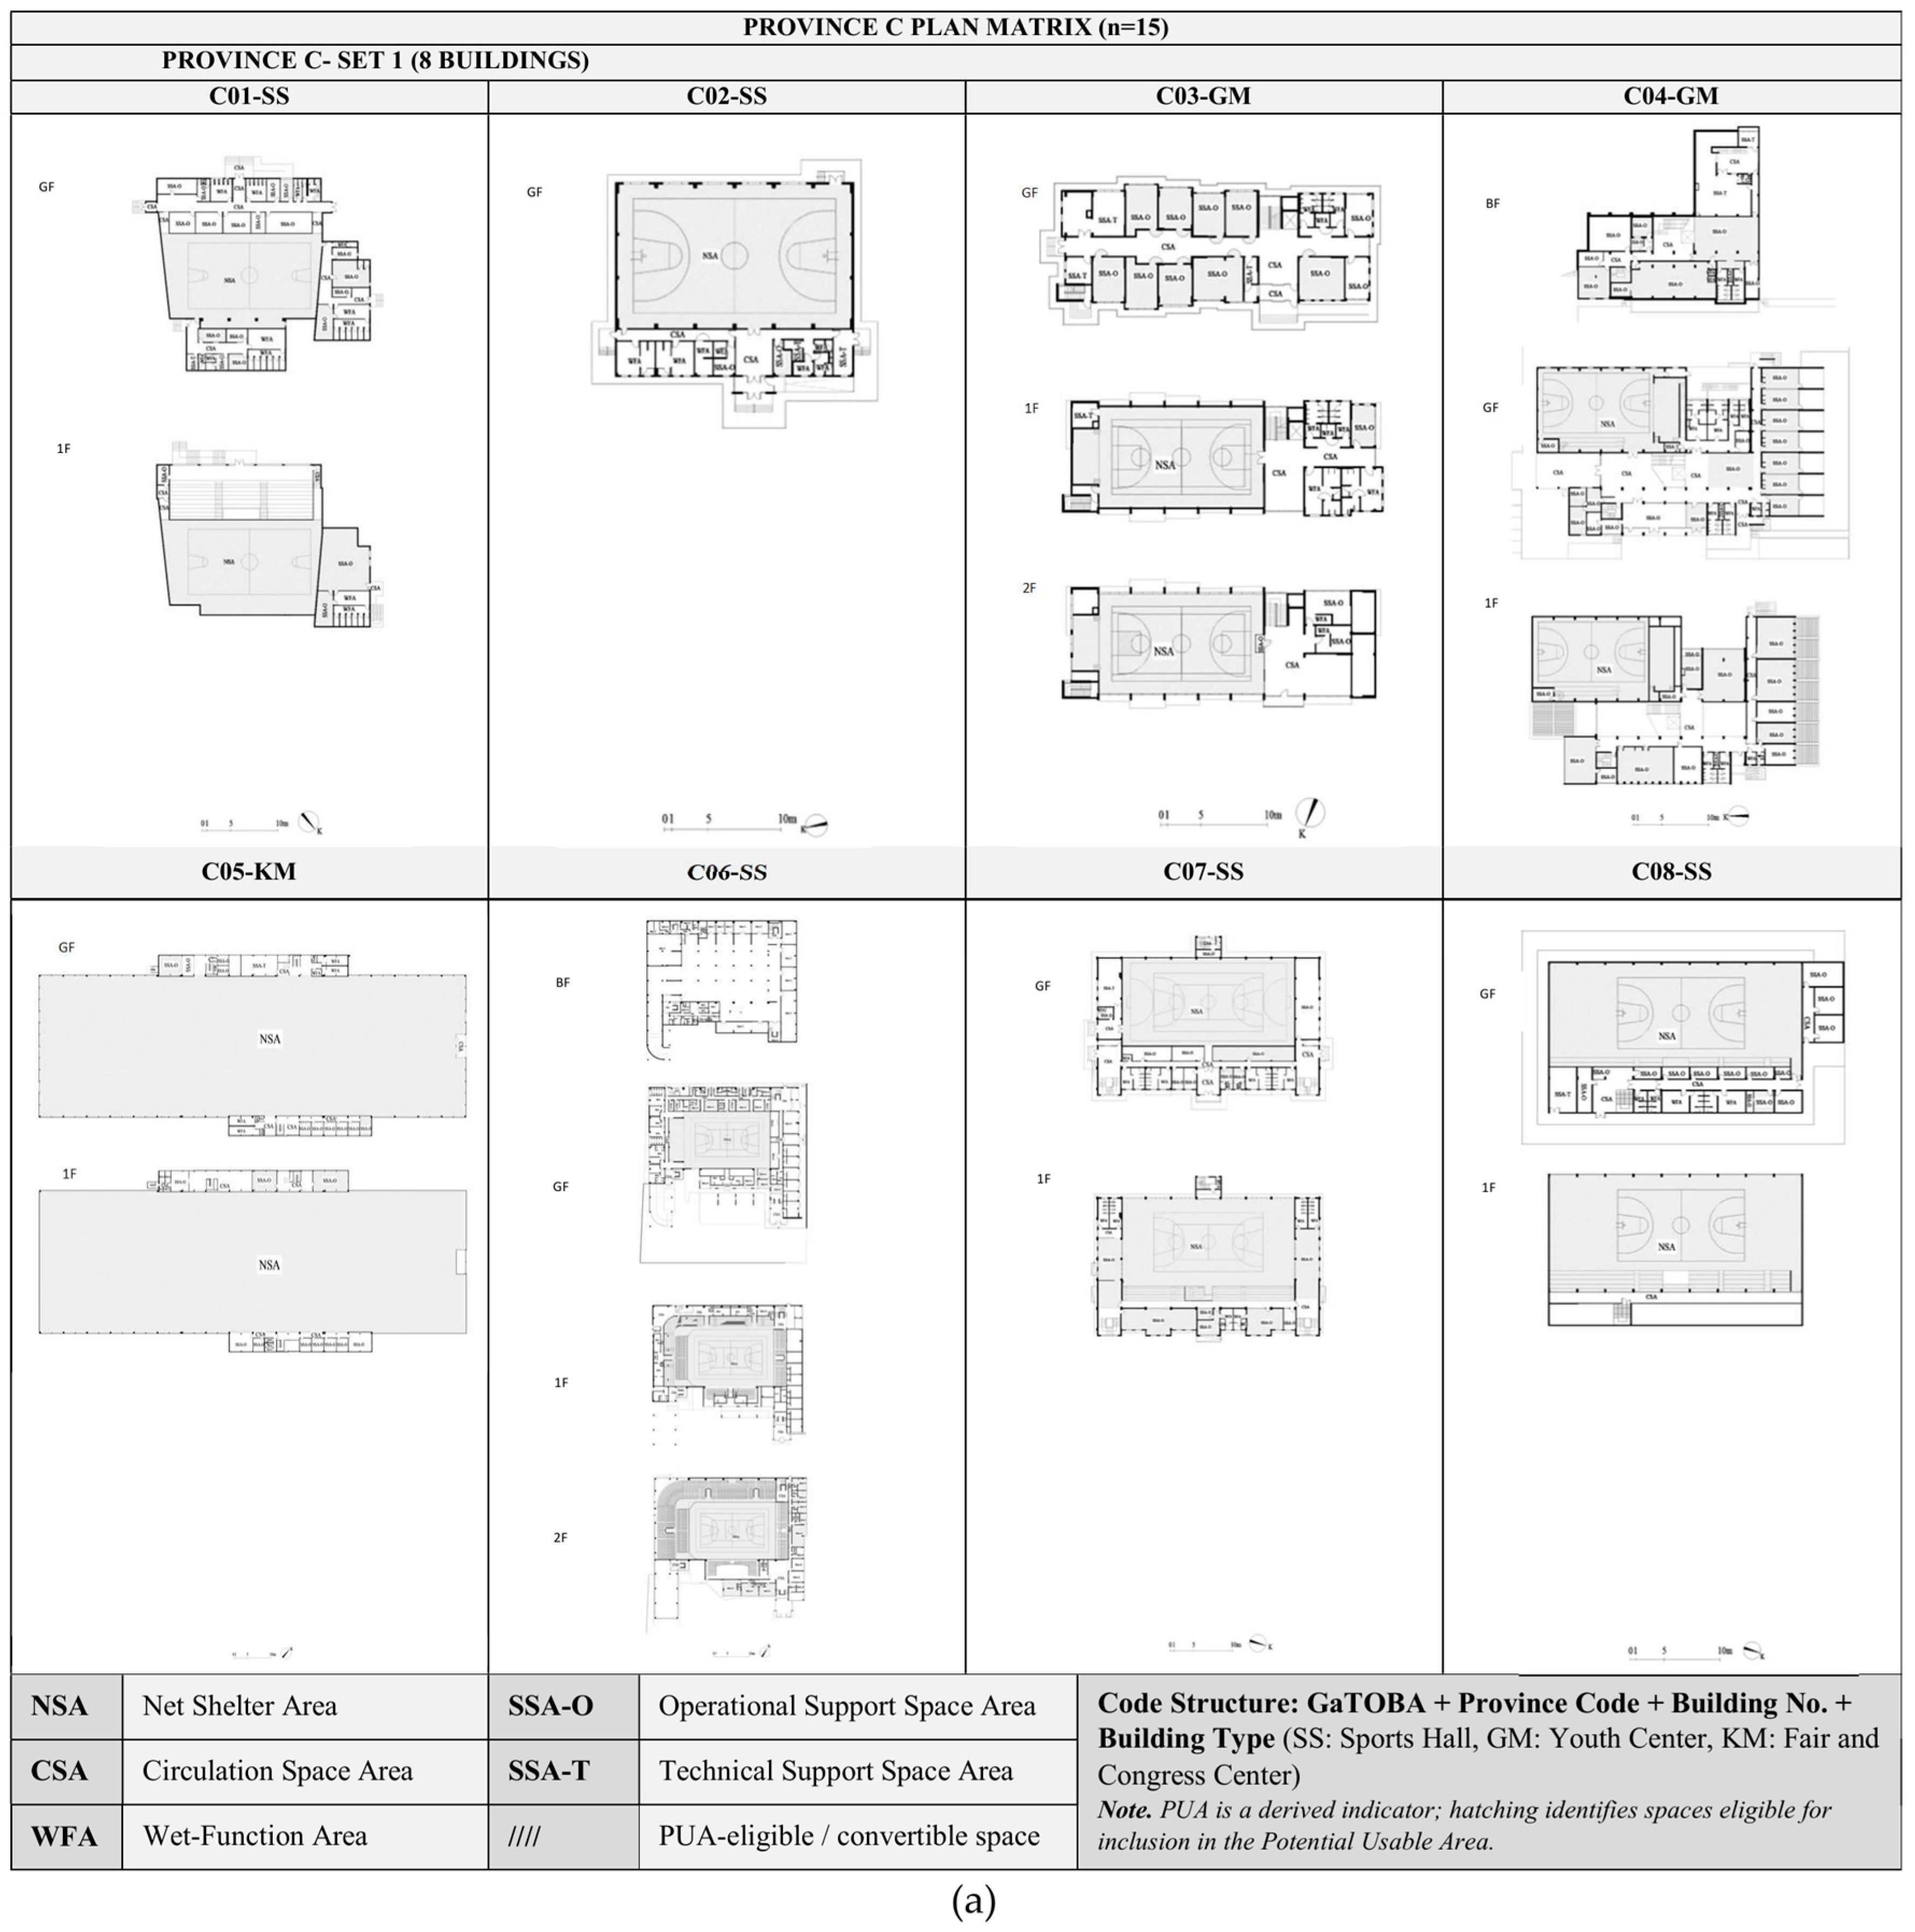
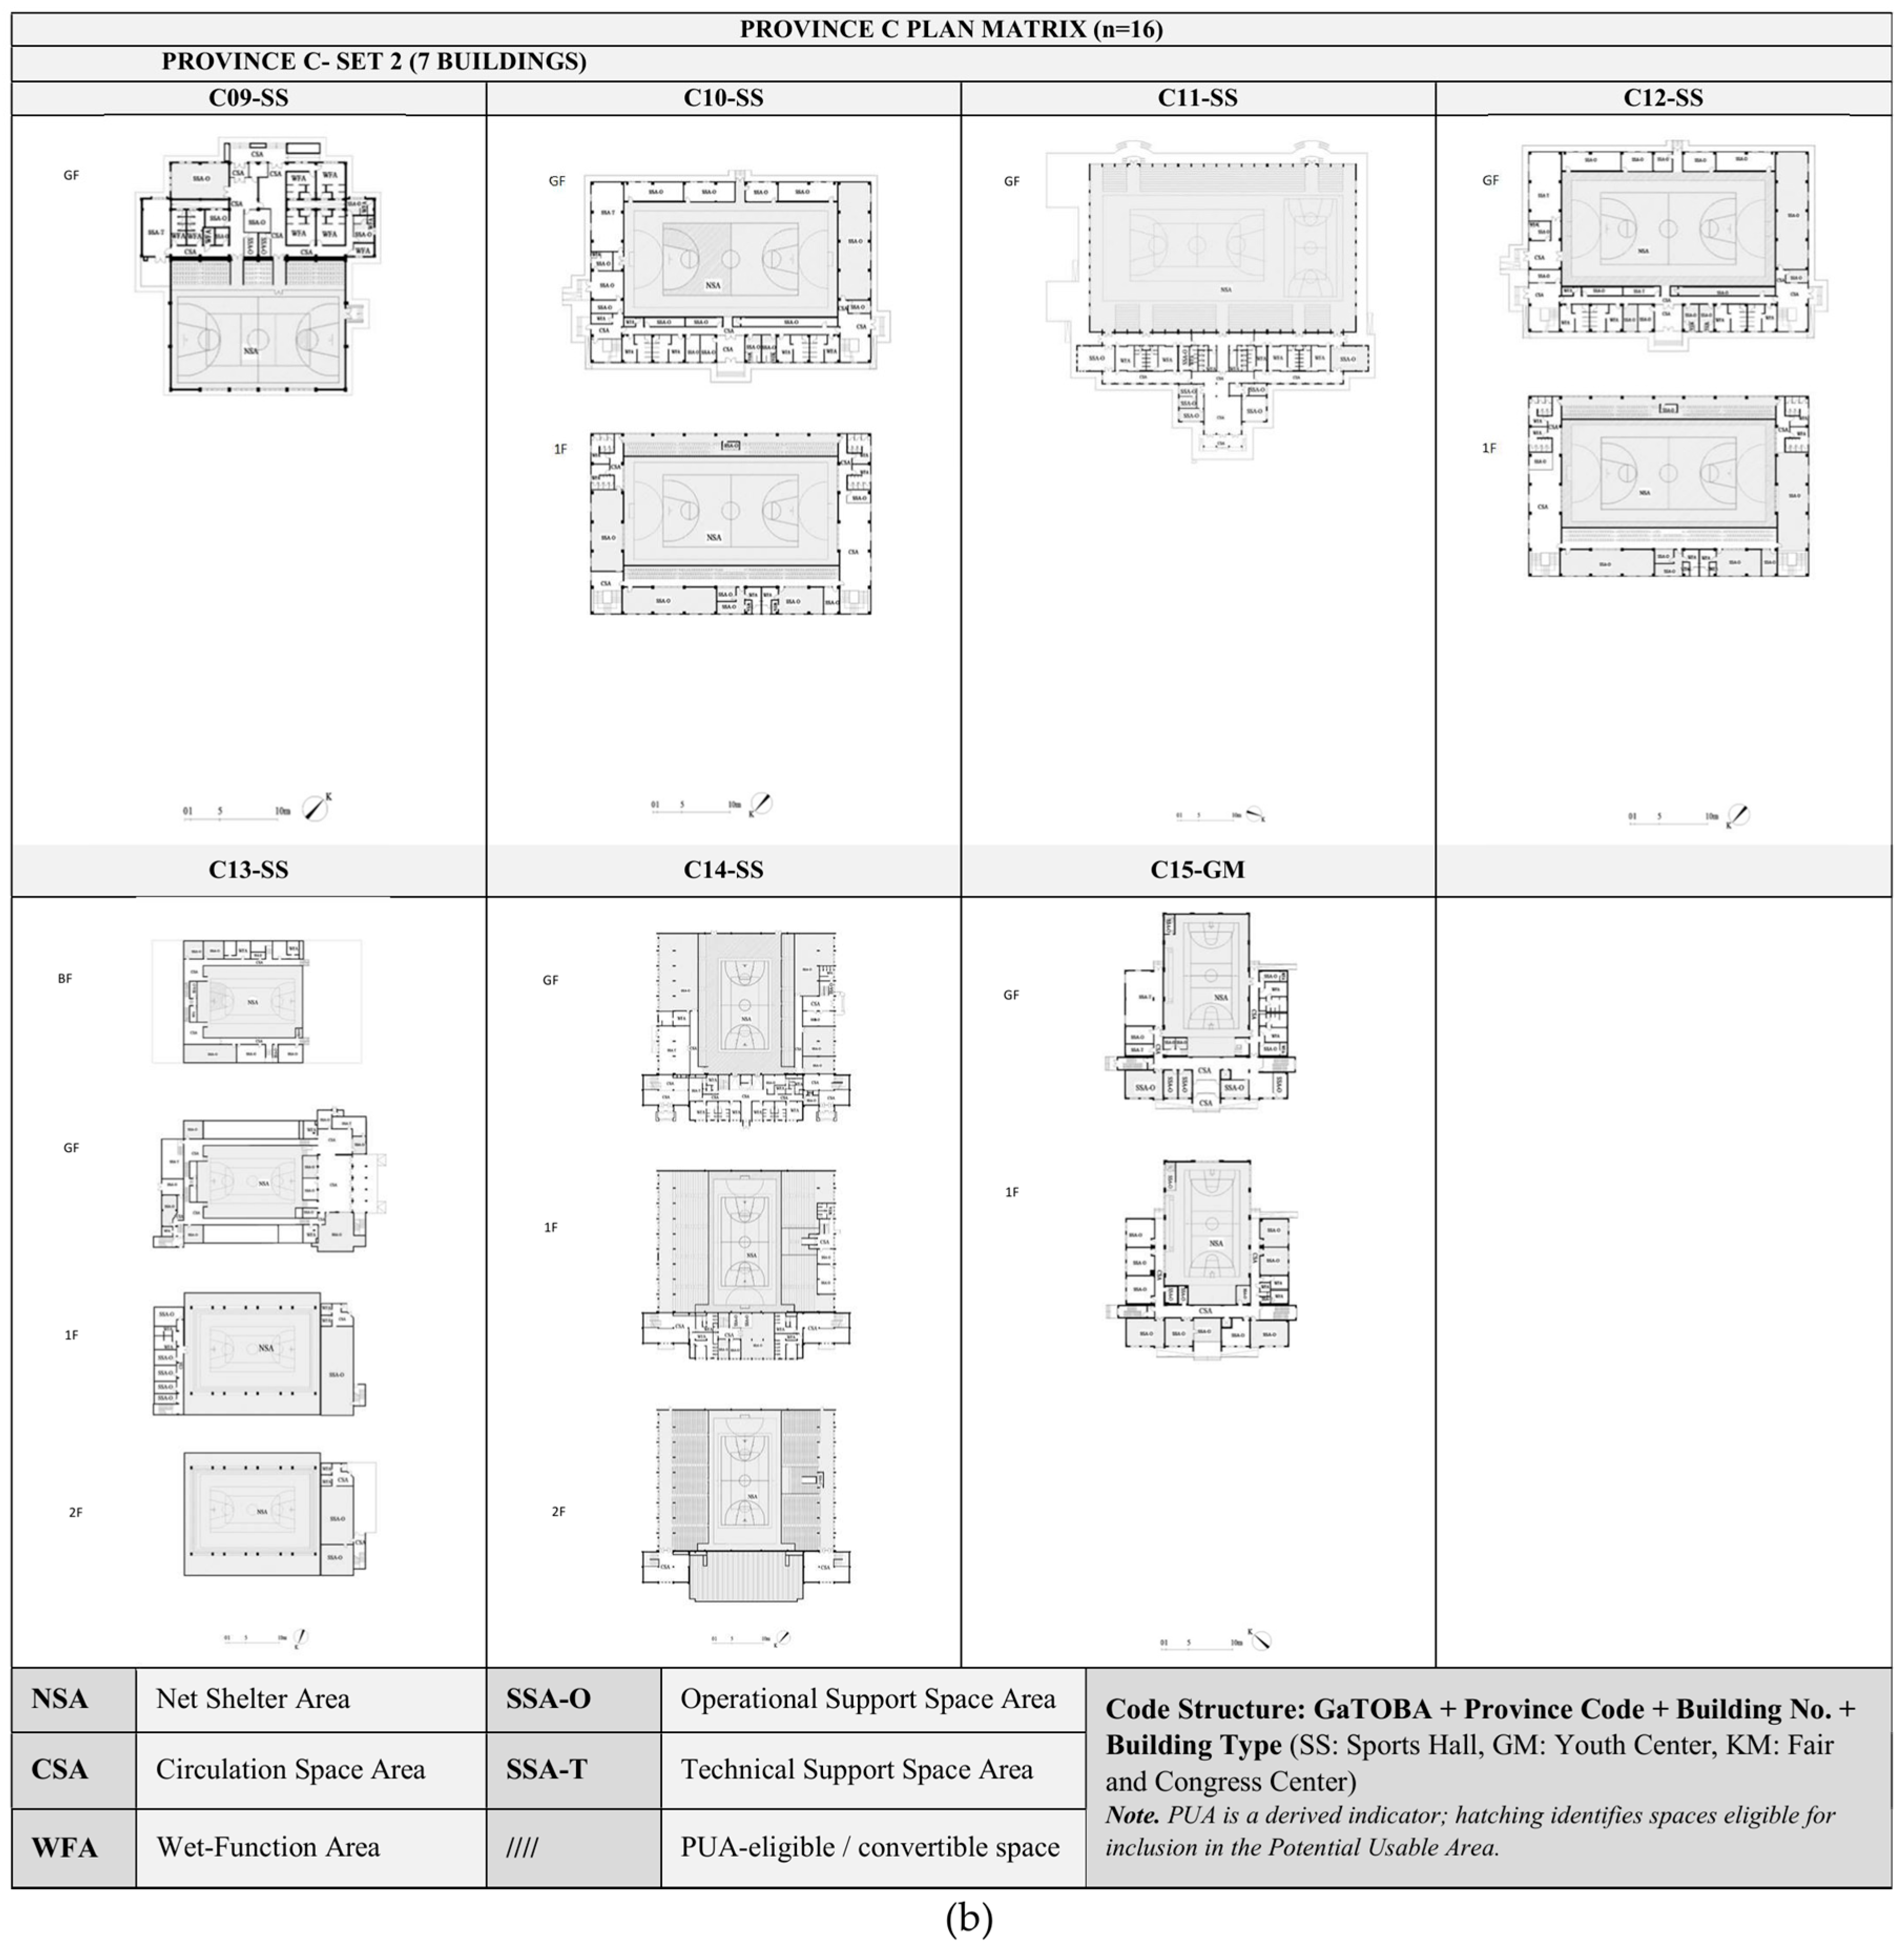
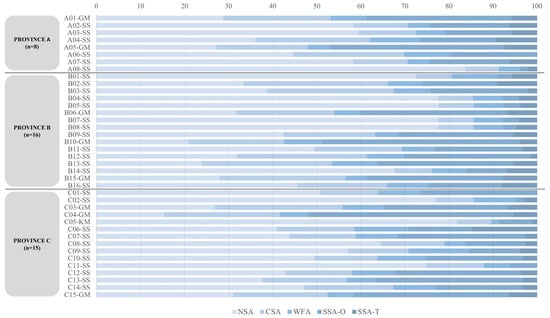
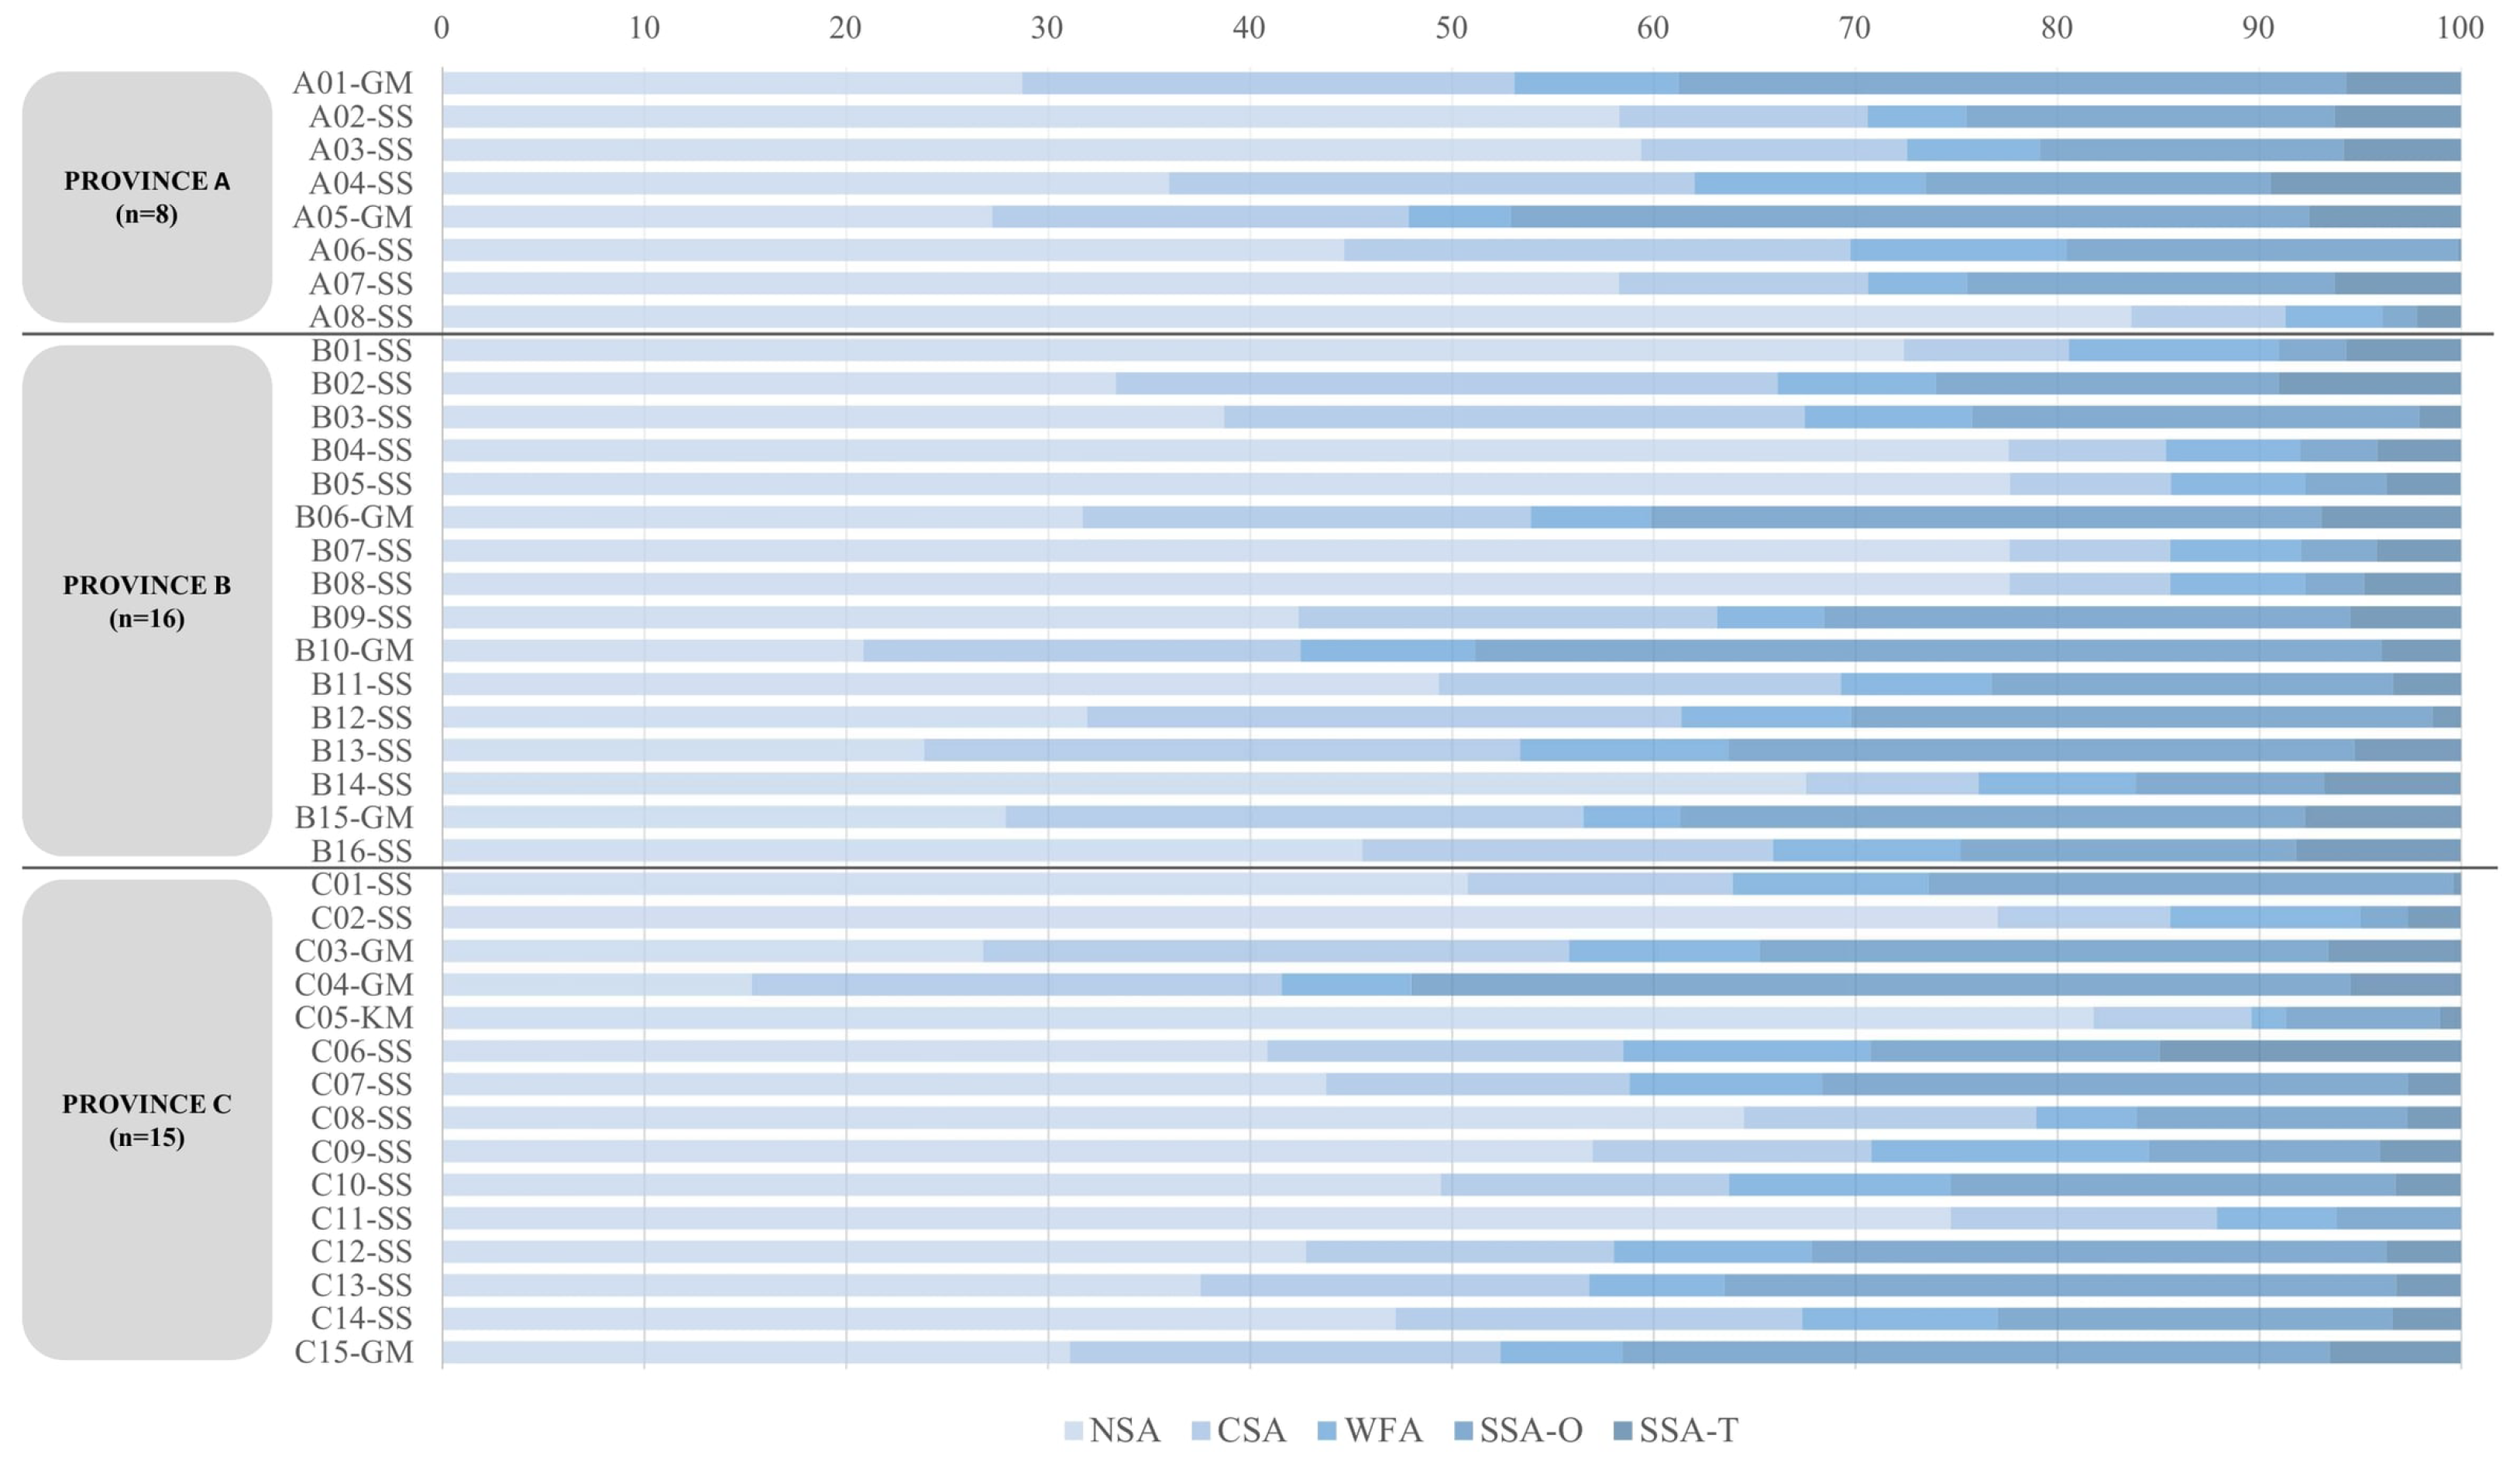
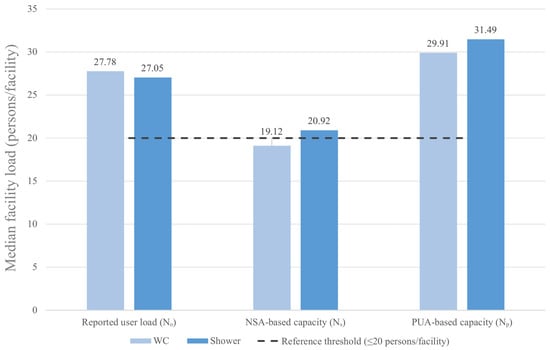
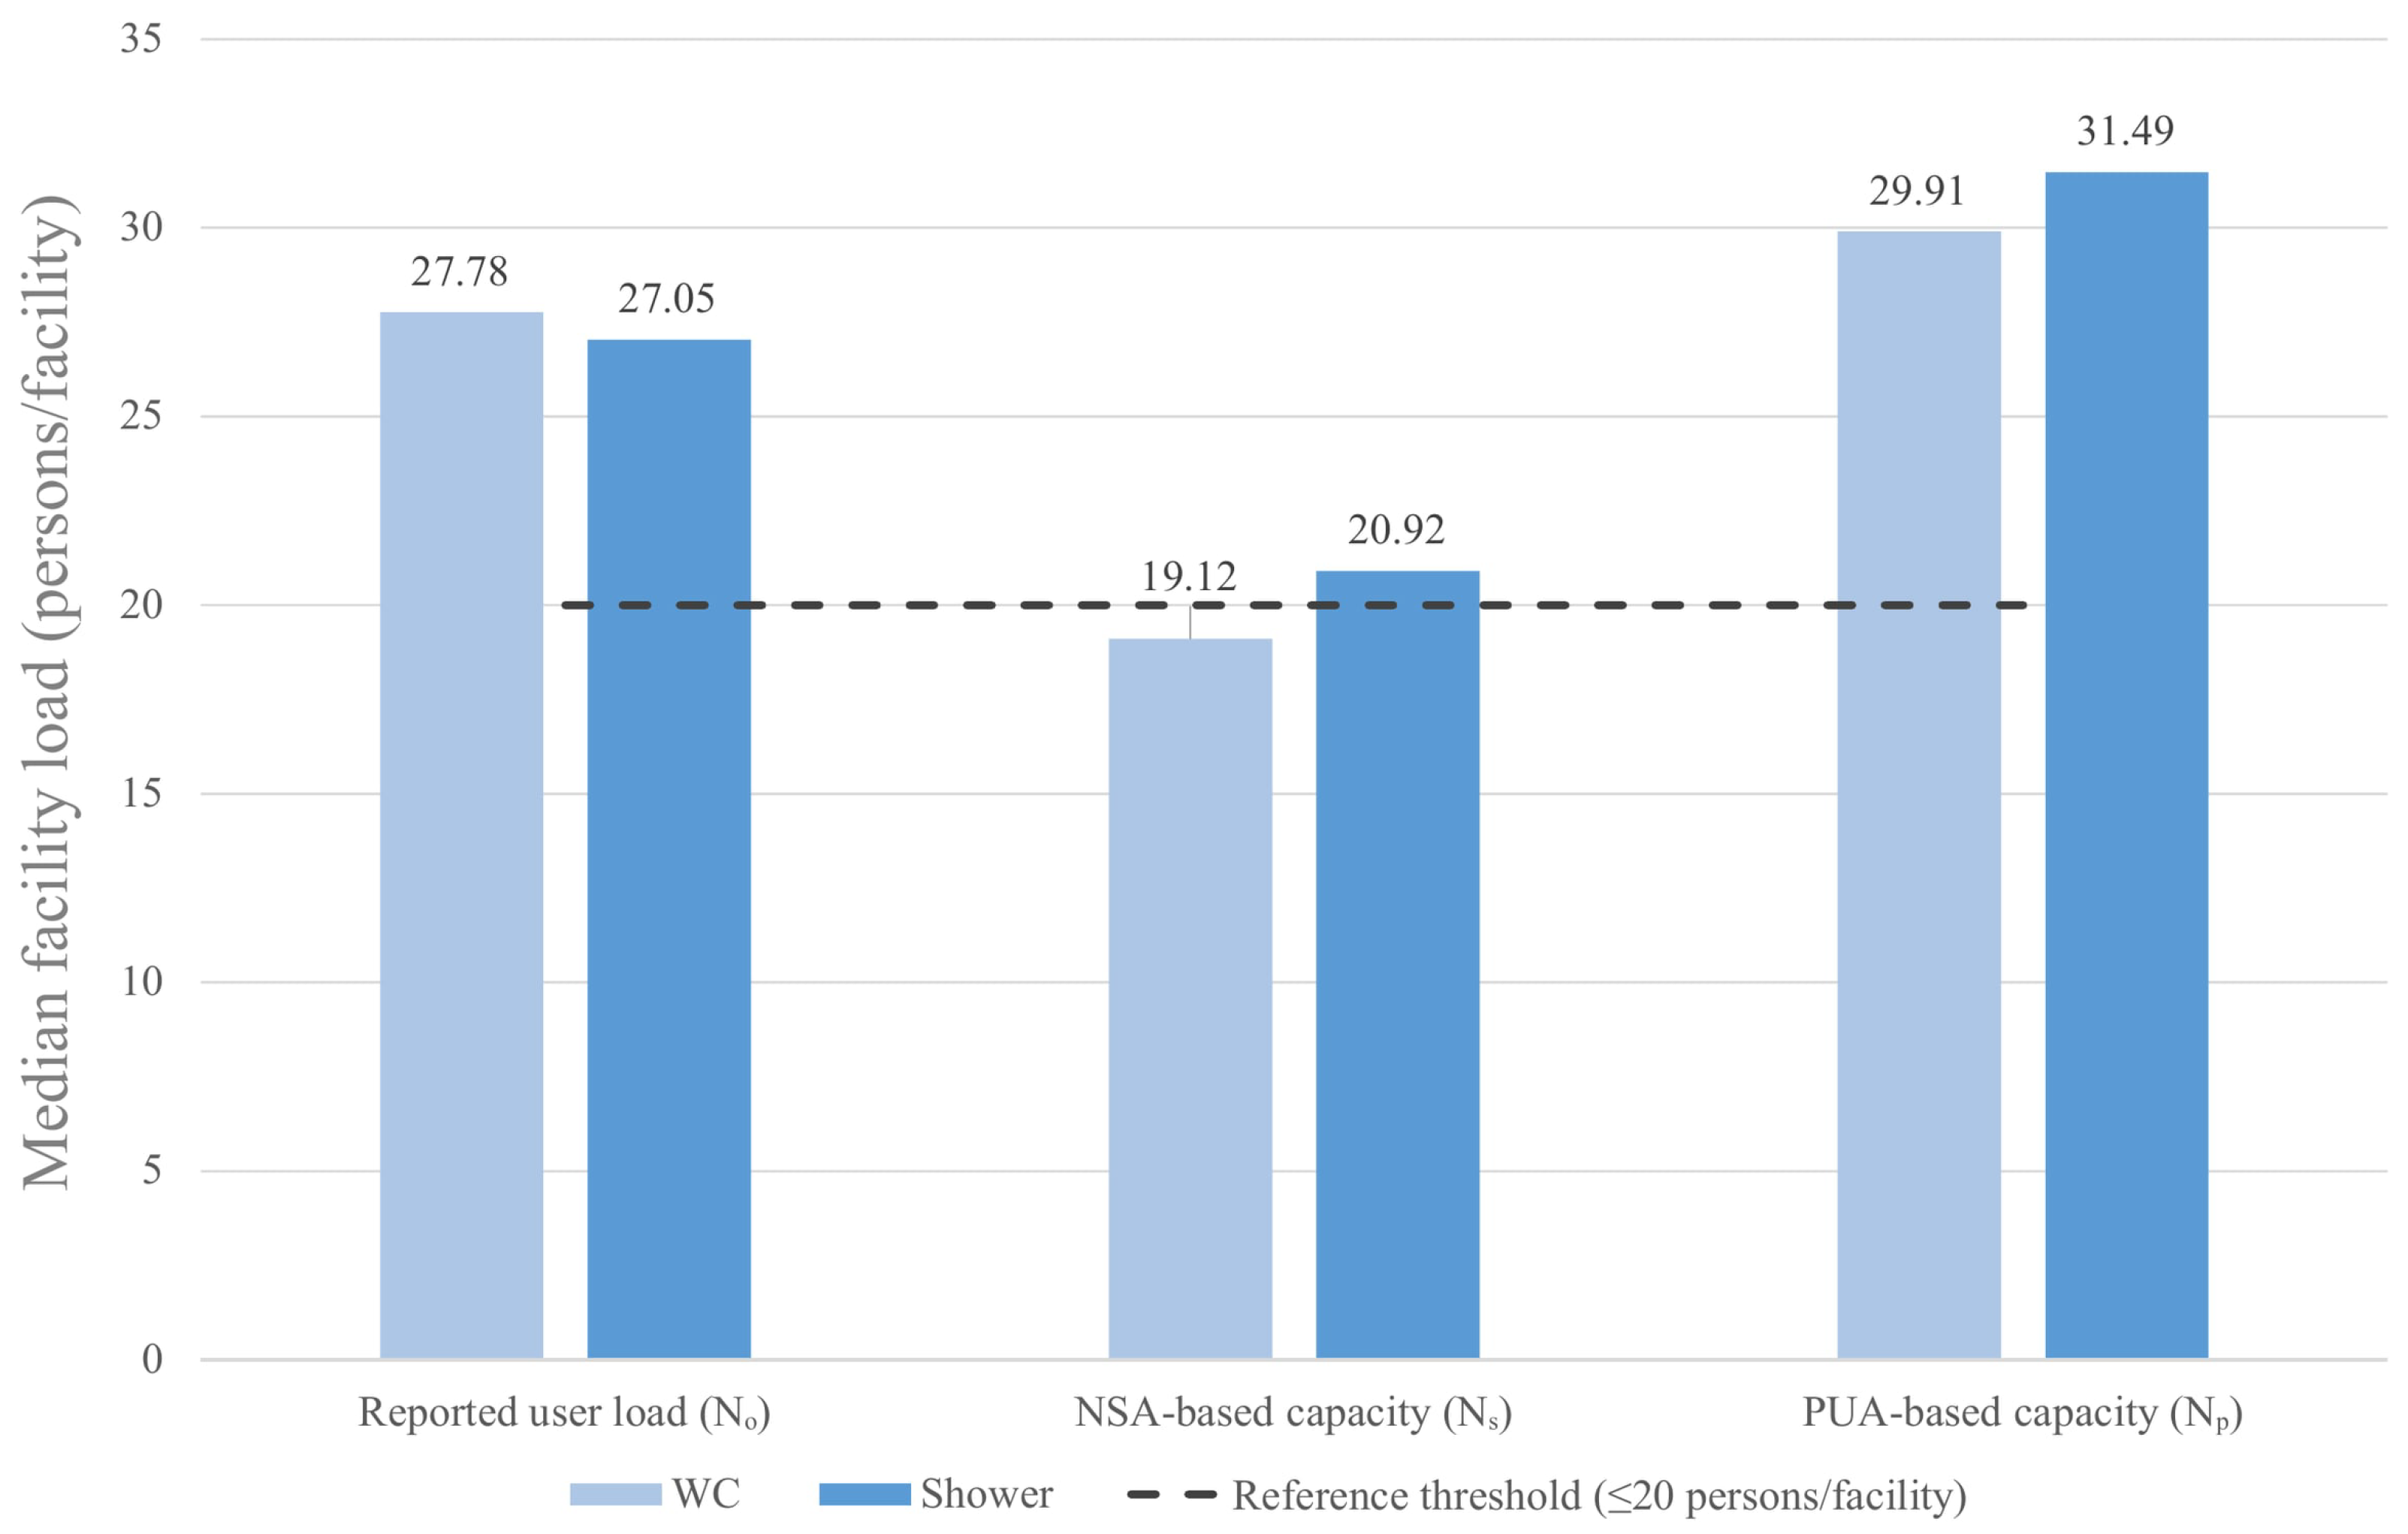
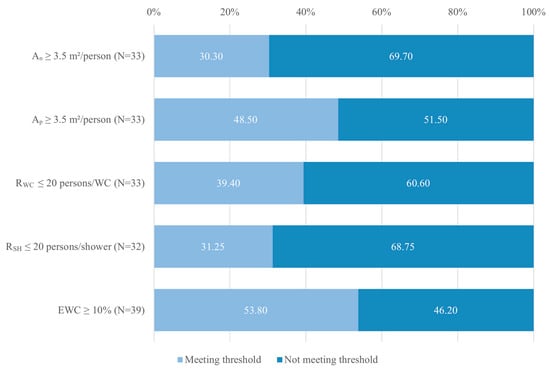
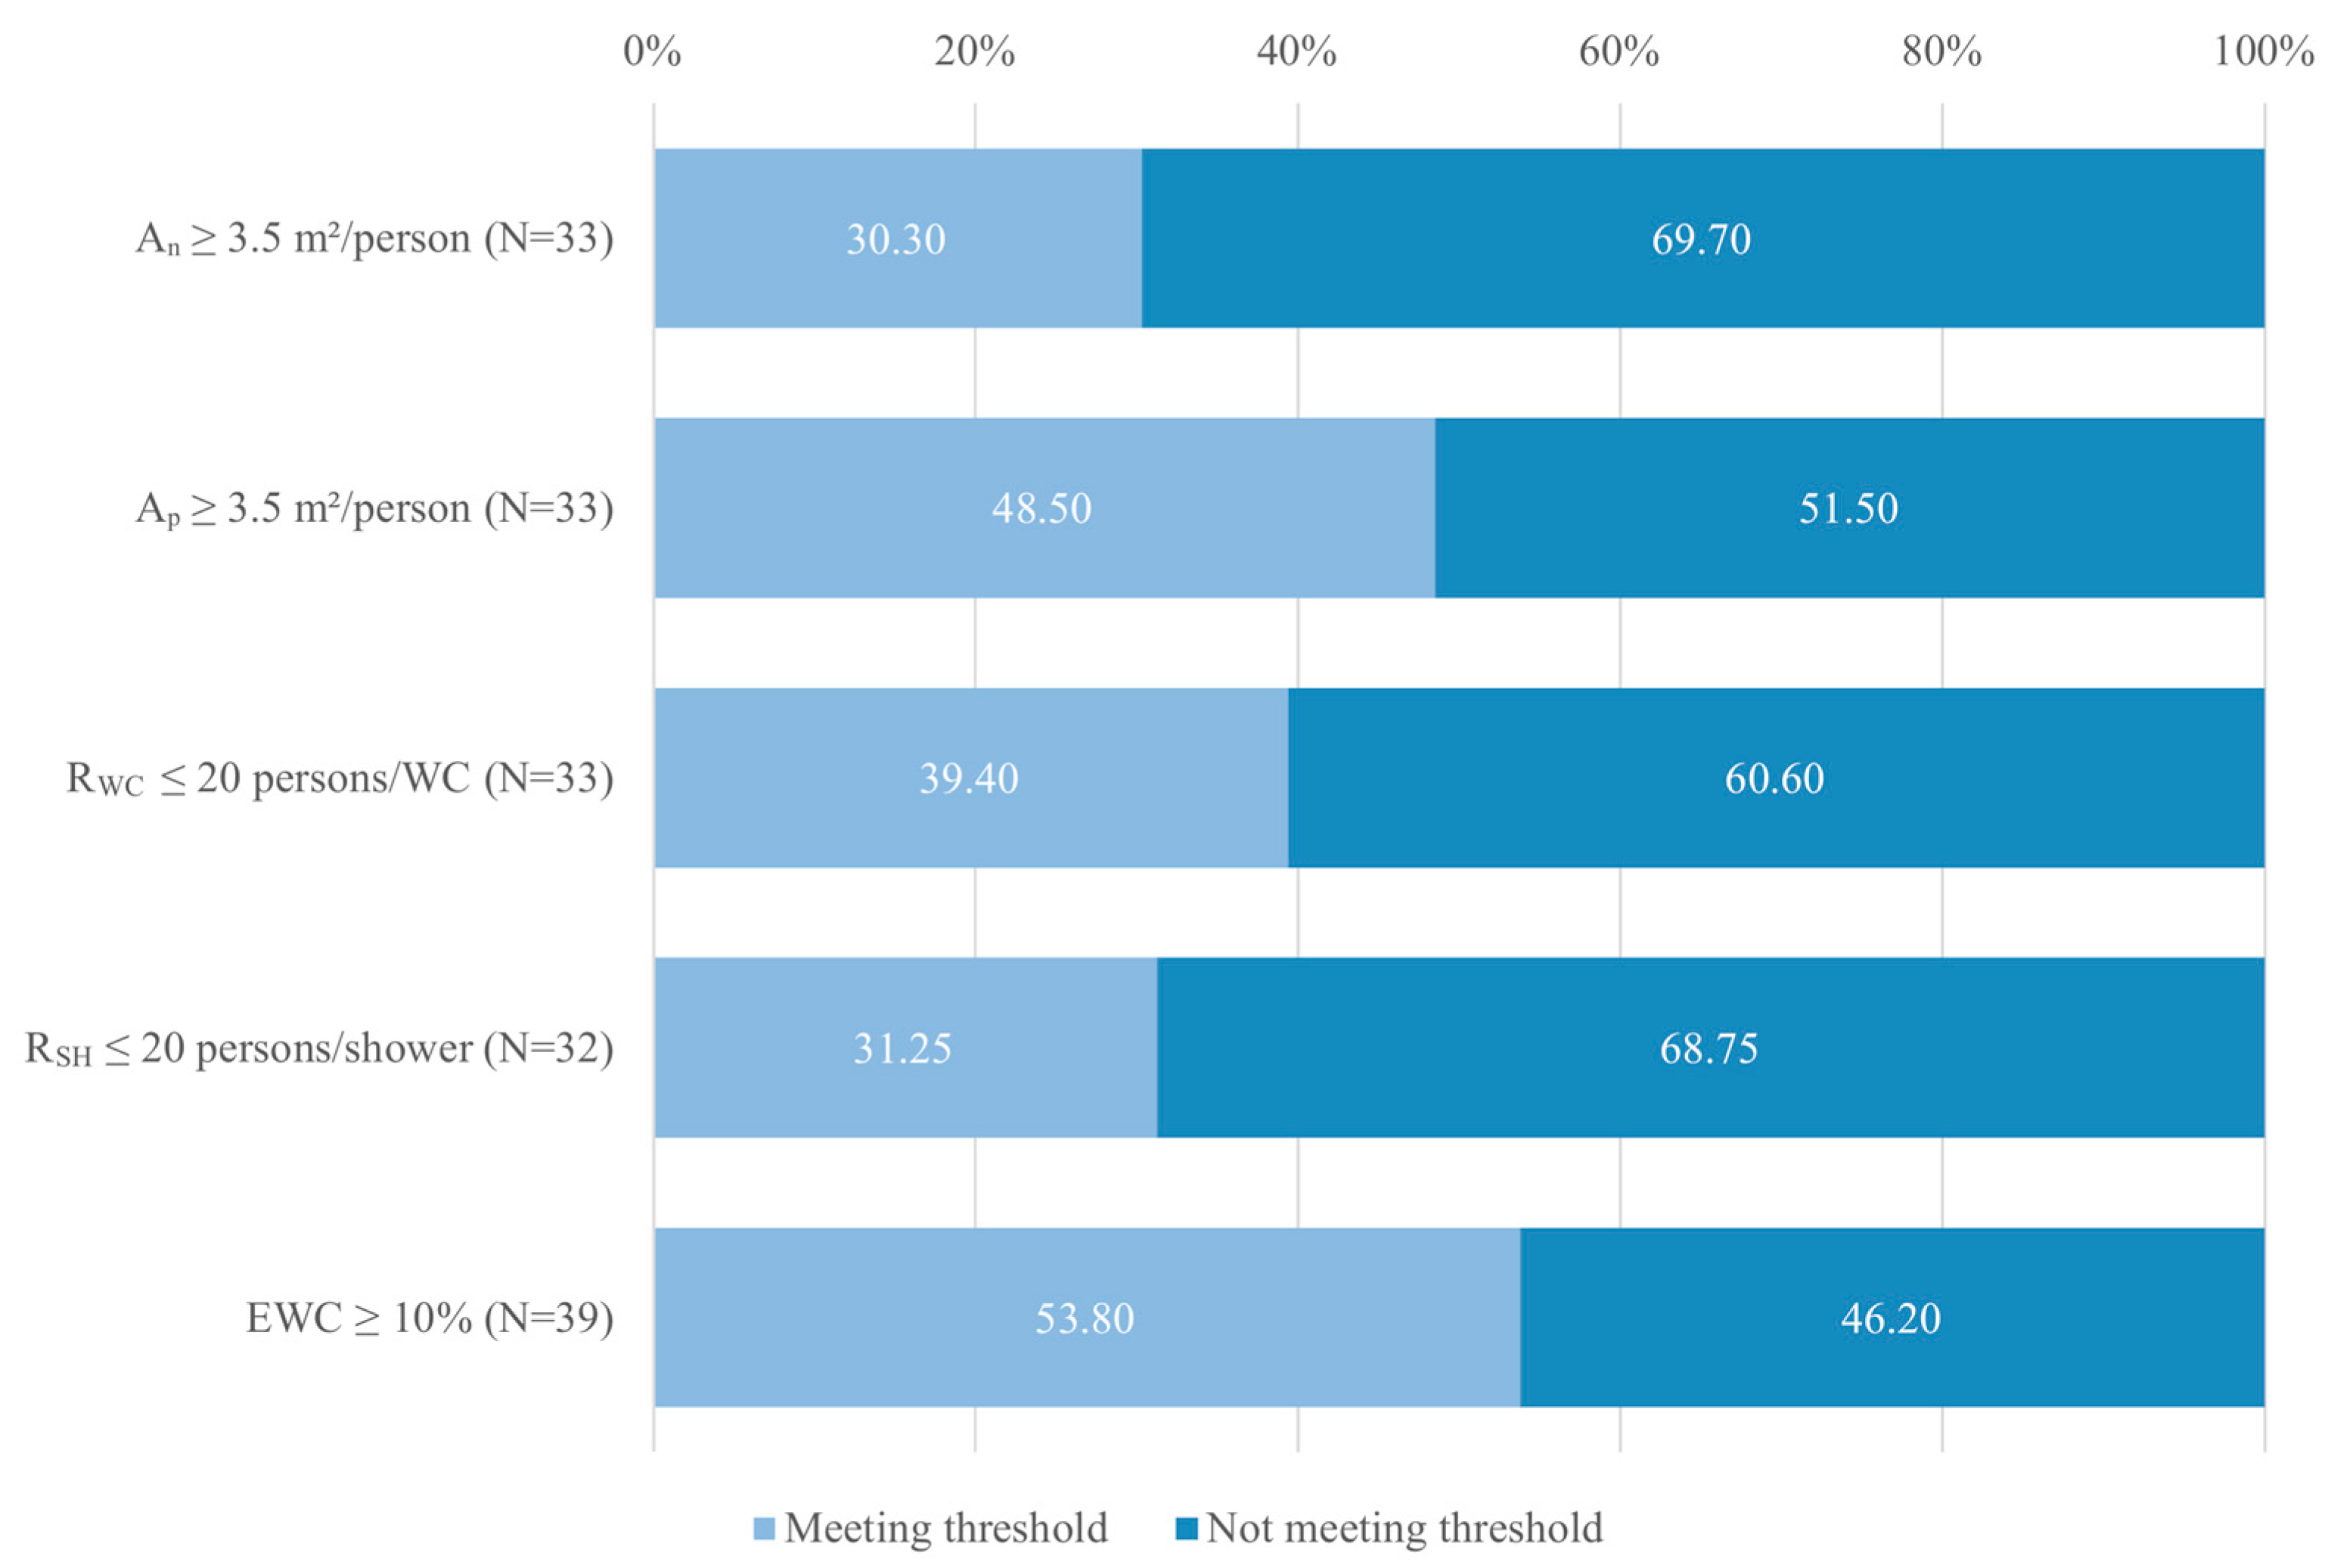
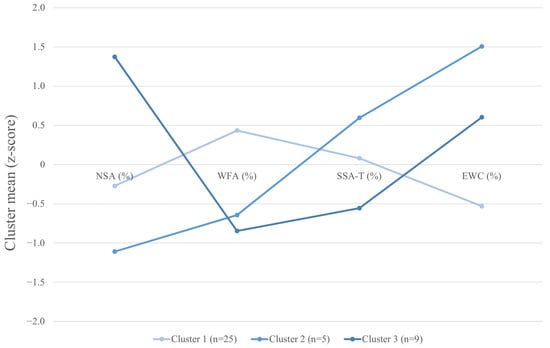
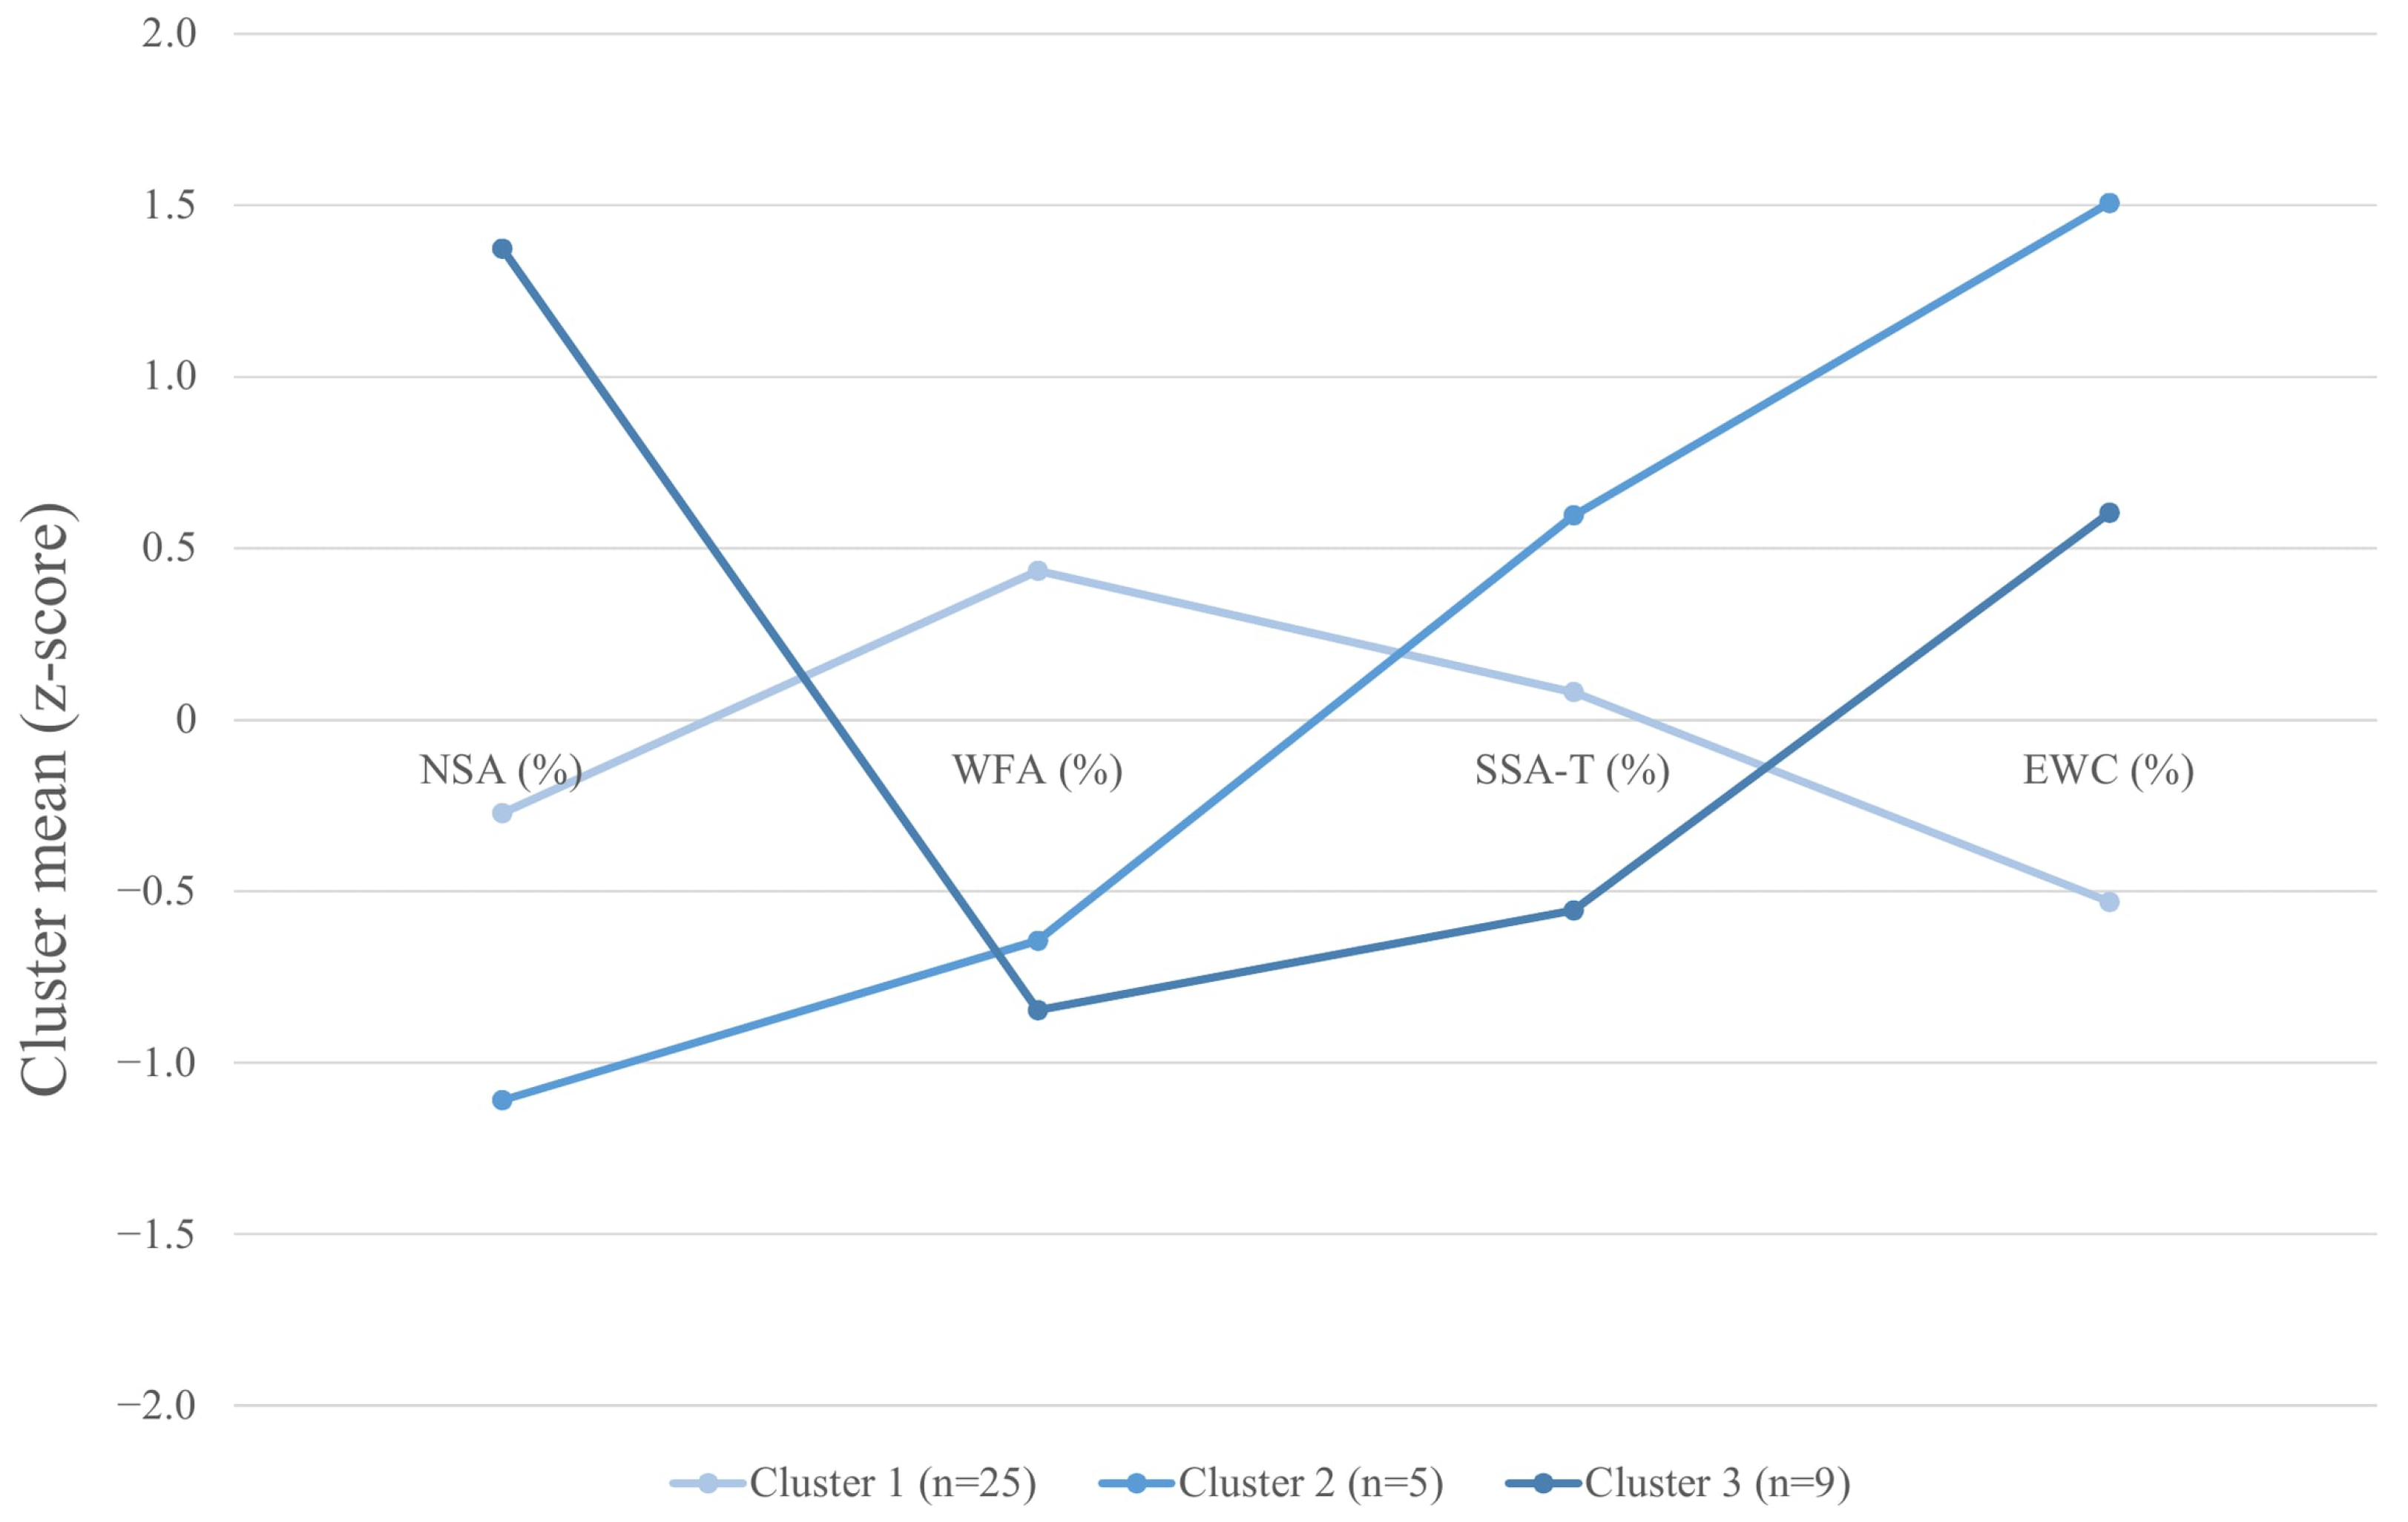
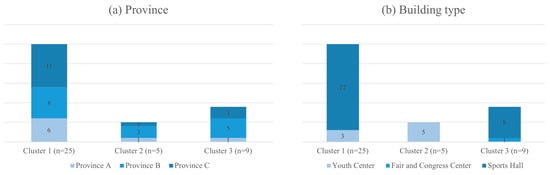
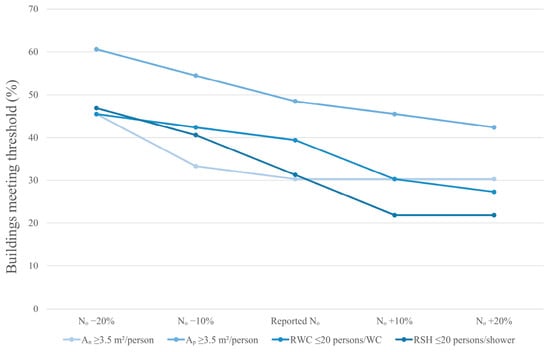

Disclaimer/Publisher’s Note: The statements, opinions and data contained in all publications are solely those of the individual author(s) and contributor(s) and not of MDPI and/or the editor(s). MDPI and/or the editor(s) disclaim responsibility for any injury to people or property resulting from any ideas, methods, instructions or products referred to in the content. |
© 2026 by the authors. Licensee MDPI, Basel, Switzerland. This article is an open access article distributed under the terms and conditions of the Creative Commons Attribution (CC BY) license.