


Abstract
Building energy use in the Western Sichuan Plateau exhibits strong seasonal variability owing to its cold climate and intense solar radiation. The objective of this study is to quantify and interpret the contributions of building design parameters to heating, cooling, and total energy use in the Western Sichuan Plateau by integrating parametric energy simulation with explainable machine learning. First, we analyzed the existing hourly energy consumption data of a specific building. Subsequently, 62,208 parametric building schemes were simulated using EnergyPlus (version: 22.1.0) by varying geometry, orientation, window-to-wall ratio (WWR), and envelope characteristics. XGBoost models were developed to predict heating demand, cooling demand, and total energy use intensity (EUI), achieving R2 values of 0.9998, 0.9997, and 0.9998, respectively, with MAPE values of 0.45%, 2.75%, and 0.26%. SHAP analysis revealed clear target-dependent effects of design parameters. SHAP analysis revealed target-dependent differences in the importance of design parameters. Wall construction, orientation, and building length were the top three contributors to heating EUI; orientation, wall construction, and WWR ranked highest for cooling EUI; and wall construction, building length, and orientation were most influential for total EUI. Increasing WWR generally reduced its SHAP values for heating EUI, with a weaker effect observed for the insulated-wall configuration, whereas its SHAP values for cooling EUI generally increased. Total EUI showed an overall decreasing trend with increasing WWR. These findings highlight the importance of evaluating building design parameters in relation to heating, cooling, and total energy performance. The identified nonlinear and target-dependent response patterns provide insights into climate-responsive building design in the Western Sichuan Plateau.
1. Introduction
As global energy demand continues to grow, the building sector has become a major contributor to energy consumption. According to the International Energy Agency (IEA), the building sector accounted for approximately 30% of global energy demand in 2023, with residential buildings and commercial and public buildings constituting the largest shares of building energy demand [1]. In China, the building sector also faces considerable pressure to reduce energy consumption and carbon emissions. According to the Research Report on Carbon Emissions in China’s Urban and Rural Construction Sector (2024), the entire construction process accounts for 44.96% of China’s energy-related carbon emissions. Among these, carbon emissions from the operational stage of civil buildings account for 52.63% of total carbon emissions from the building sector and 21.8% of national energy-related carbon emissions [2]. Therefore, reducing building operational energy consumption and improving energy efficiency are of great significance for promoting energy conservation and carbon emission reduction in the building sector.
The Western Sichuan Plateau is characterized by high altitude, low air temperatures, and strong solar radiation, resulting in distinct regional characteristics in building thermal environments and energy demand. On the one hand, low temperatures and prolonged heating demand in winter significantly increase building heating loads [3]; On the other hand, strong solar radiation and low air density affect the convective and radiative heat transfer at building envelope surfaces, as well as the dynamic heat transfer process [4,5]. Therefore, buildings in the Western Sichuan Plateau exhibit distinct characteristics in terms of thermal environment and energy demand compared with those in conventional climatic regions [6]. Previous studies have shown that traditional buildings in the Western Sichuan Plateau generally suffer from inadequate thermal performance of building envelopes, poor indoor thermal environments, and high heating energy consumption in winter. Improving building design and introducing solar heating systems can significantly improve indoor thermal environments and reduce heating energy consumption [7]. Questionnaire surveys and energy simulations have also revealed inadequate indoor thermal environments in traditional dwellings of local ethnic communities, while building optimization can effectively reduce winter heating loads [8]. However, existing studies have mainly focused on traditional residences, rural buildings, and specific energy-saving measures, while a systematic understanding of how different building design parameters affect heating, cooling, and total energy consumption in the Western Sichuan Plateau remains limited.
Building energy consumption is influenced by a combination of factors, including climatic conditions, building geometry, envelope characteristics, window-to-wall ratio, building orientation, and operational conditions [9,10]. Building performance simulation tools, such as EnergyPlus, can accurately simulate dynamic building energy consumption under different weather conditions and design parameters, providing a reliable approach for building performance analysis and design optimization [11,12,13]. However, when a large number of building design parameters and parameter combinations are involved, conducting building energy simulations for each combination individually can result in substantial computational costs [14]. Therefore, improving the efficiency of energy consumption prediction and parameter analysis while ensuring the reliability of simulation results has become an important issue in related research.
In recent years, machine learning methods have been increasingly applied to building energy performance analysis. By establishing nonlinear mapping relationships between building characteristics, weather conditions, and energy demand, these methods can improve the efficiency of building energy consumption prediction and have been applied in areas such as building load forecasting, energy management, and energy-saving analysis [15,16,17]. However, traditional machine learning models typically focus on predictive performance, making it difficult to directly interpret the contribution of individual features and the relationships between input variables and energy consumption. Explainable machine learning methods can further quantify the contribution of different features to model predictions, thereby revealing the influence and underlying patterns of building design parameters [18,19]. Therefore, integrating building performance simulation, machine learning modeling, and explainable analysis can facilitate the characterization of nonlinear relationships between building design parameters and energy consumption and the identification of key influencing factors.
To address these research gaps, this study aims to quantify and interpret the contributions of building design parameters to heating, cooling, and total energy use in the Western Sichuan Plateau by integrating parametric energy simulation, XGBoost modeling, and SHAP analysis. Specifically, the study first examines the temporal characteristics of heating and cooling energy consumption in a case building. It then develops an EnergyPlus-based parametric simulation model to generate a dataset covering different combinations of building design parameters. Based on this dataset, XGBoost models are established to characterize the nonlinear relationships between building design parameters and heating, cooling, and total energy use intensity (EUI). Finally, SHAP analysis is conducted to quantify the relative contributions of individual design parameters to the model predictions and to examine their response patterns across the three energy-use targets. Through this approach, the study seeks to clarify how the relative contributions and response patterns of building design parameters differ between heating, cooling, and total energy use under the specified simulation conditions.
2. Methodology
2.1. Research Framework
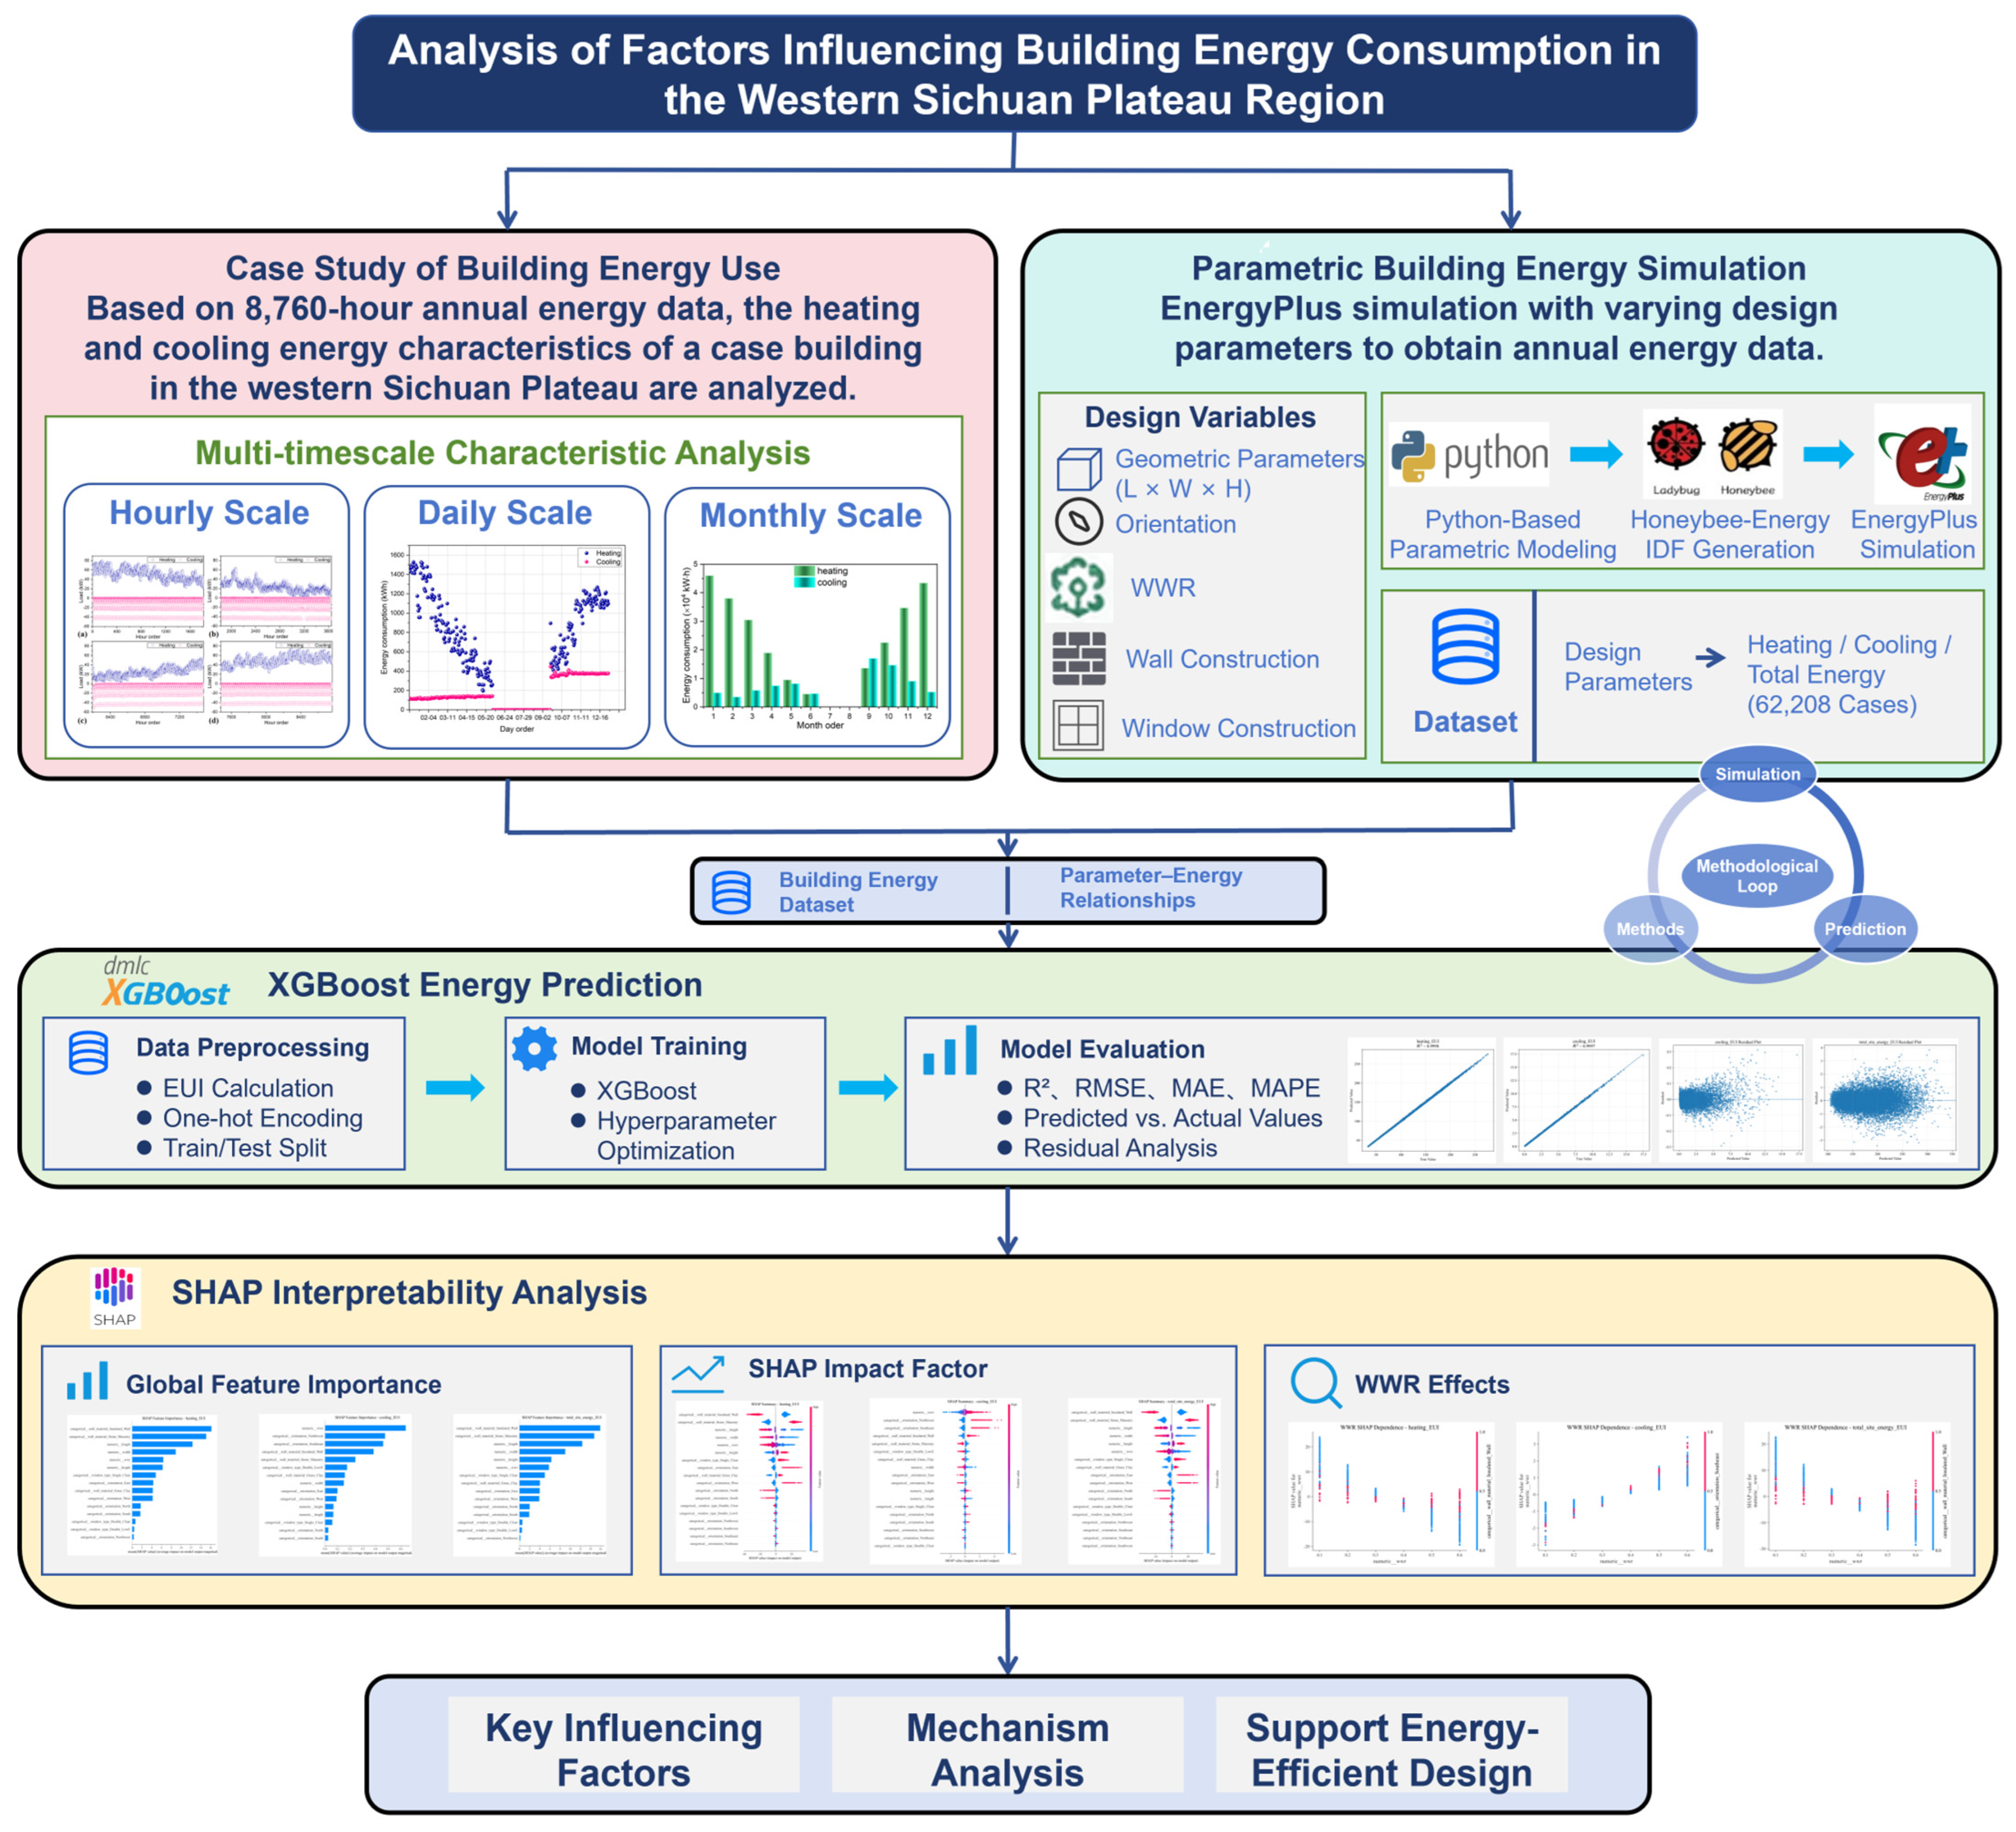
To address the influence of complex climatic conditions and multiple building design parameters on building energy consumption in the Western Sichuan Plateau, this study develops a research framework integrating building energy consumption characterization, parametric energy simulation, and explainable machine learning. Building performance simulations are conducted to obtain heating and cooling demand responses under different combinations of design parameters. On this basis, explainable analysis is used to identify the key influencing factors. The overall research framework is illustrated in Figure 1.
Figure 1.
Research Framework. (notes: A complete year comprises 8760 h, which represents the theoretical number of hourly time steps for annual analysis. However, the operational data available for the case building do not cover all 8760 h because the building was not in operation during part of the year. Therefore, the number of available hourly observations is less than 8760. No missing operational data were interpolated or supplemented.).
First, based on the available hourly operational energy consumption data of the case building in the Western Sichuan Plateau, the temporal characteristics of heating and cooling energy consumption are analyzed. The variations in energy demand at different time scales, including monthly, daily, and hourly scales, are statistically analyzed to identify the seasonal characteristics of heating and cooling loads in high-cold regions, providing a basis for subsequent energy consumption simulation and influencing-factor analysis. The analysis of the case building provides an empirical understanding of the temporal characteristics of building energy use, while the subsequent parametric simulation is conducted independently to investigate the effects of building design parameters on energy performance.
Second, a parametric building energy simulation model based on EnergyPlus is developed. Considering the characteristics of buildings in the Western Sichuan Plateau, building geometric parameters, orientation, window-to-wall ratio, and envelope characteristics are selected as input variables. Dynamic energy simulations are conducted by varying combinations of these parameters to obtain the corresponding heating, cooling, and total energy consumption data for different design schemes, thereby constructing a dataset linking building design parameters with energy consumption responses.
Subsequently, the constructed dataset is used to develop XGBoost models to characterize the nonlinear relationships between building design parameters and energy demand. The models are trained and evaluated using the existing training–test split to assess their performance within the sampled simulation dataset. SHAP analysis is then employed to interpret the contributions of individual design parameters to the model outputs and to identify patterns in their associations with building energy demand.
Through the above research process, a complete workflow is established, encompassing building operational energy consumption analysis, parametric energy simulation, data-driven prediction, and influencing-factor interpretation, providing methodological support for energy-efficient building design and optimization in the Western Sichuan Plateau region.
2.2. Case Building and Energy Consumption Characteristic
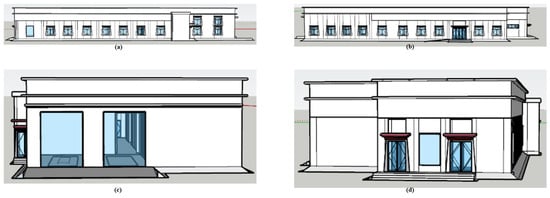
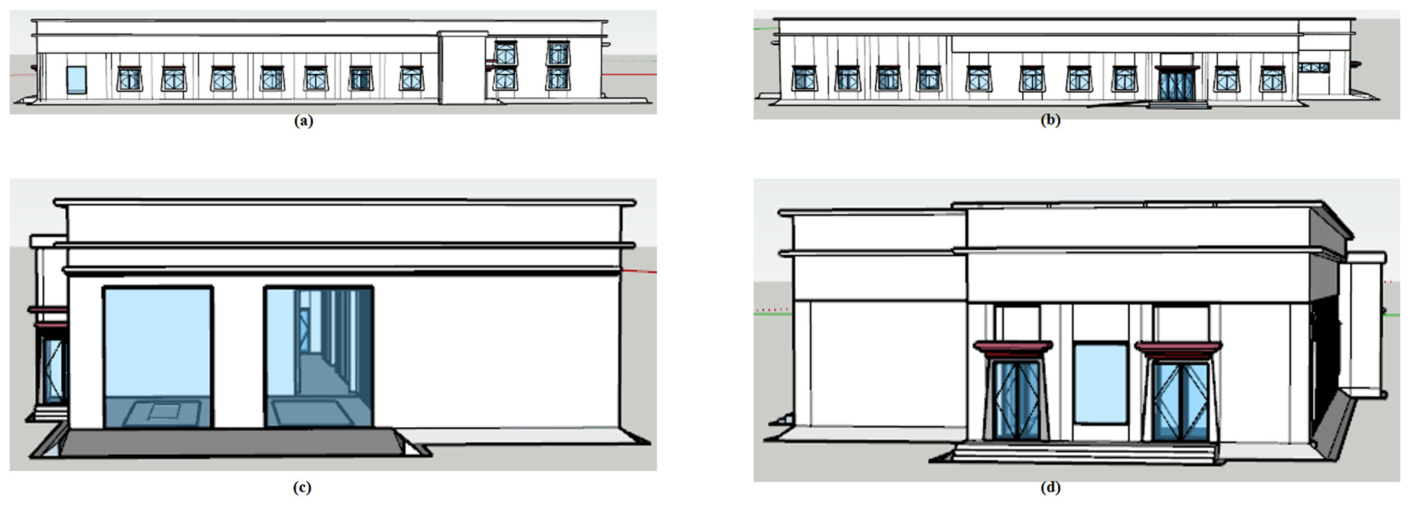
This study selects an actual building in the Western Sichuan Plateau as the case building. The region is characterized by high altitude, low air temperatures, and strong solar radiation, providing a case for investigating building energy consumption characteristics and the effects of design parameters in the Western Sichuan Plateau. Figure 2 presents the three-dimensional model of the case building. The model was developed based on the basic geometric characteristics of the actual building, with reasonable simplifications made to the building spaces and envelope components. While maintaining the main building form and thermal characteristics, the model provides a basis for subsequent energy consumption simulation and analysis.
Figure 2.
Case Building Model: (a) Rear view of the building model; (b) Front view of the building model; (c) Left-side view of the building model; (d) Right-side view of the building model.
The case building is a single-storey reinforced-concrete frame structure with a total floor area of 967.77 m2 and a building height of 5.70 m. The building envelope consists of insulated exterior walls, an insulated roof, a ground-contact floor, and low-emissivity (Low-E) double-glazed windows. The exterior walls have a total thickness of approximately 330 mm and include 110 mm of rock wool insulation, while the roof includes 130 mm of extruded polystyrene insulation. The windows have a thermal transmittance (U-value) of 2.00 W/(m2·K) and a solar heat gain coefficient (SHGC) of 0.38. The building is equipped with heating and cooling systems to maintain the required indoor thermal conditions during its operational periods. Occupancy, lighting, equipment, and system operation schedules were defined according to the actual operating conditions of the building. Detailed operational schedules are not reported to avoid disclosing specific operational information. The building was not in operation from 2 June to 15 September. Accordingly, no operational energy consumption data were available during this period.
The hourly heating and cooling energy consumption data available during the building’s operational periods were collected for the case building. The available hourly data were organized and aggregated at hourly, daily, and monthly time scales to analyze the temporal characteristics of heating and cooling energy consumption.
It should be noted that the case building is primarily used to provide basic data for analyzing building energy consumption characteristics in the Western Sichuan Plateau. The subsequent parametric study does not directly modify the actual parameters of the case building through single-factor adjustments. Instead, to investigate the effects of different building design parameters on energy consumption, an independent parametric building energy simulation model is established based on the climatic conditions and building thermal characteristics of the Western Sichuan Plateau. Building geometric parameters, orientation, window-to-wall ratio, and envelope characteristics are selected as design variables, with corresponding ranges of values defined. Batch energy simulations are then conducted using different combinations of these parameters to construct a dataset linking building design parameters with heating, cooling, and total energy consumption.
2.3. Parametric Building Modeling
2.3.1. Parametric Design Variables
To characterize variations in energy consumption under different building design schemes, a parametric approach was adopted to establish a unified model of building geometry, envelope thermal performance, and building orientation.
For the geometric parameters, a standardized rectangular building plan was adopted to minimize the influence of differences in complex building forms on the energy simulation results. The simplified geometry was not intended to represent a specific building type in the Western Sichuan Plateau, but to provide a controlled configuration for systematically investigating the effects of key geometric and envelope parameters. Based on this configuration, different building forms were generated by varying the building length (L), width (W), and height (H). Eight building orientations were considered: east, south, west, north, northeast, southeast, southwest, and northwest. Because the same WWR was assigned to all four façades, some orientation combinations of the rectangular prototype are geometrically equivalent due to rotational symmetry. These equivalent configurations were retained to maintain a systematic and consistent parameterization of the predefined simulation space. The window-to-wall ratio (WWR) of the four building façades was assigned a unified range of values and parameterized at specified intervals to investigate the effects of different window area ratios on building heating and cooling demands.
The envelope parameters were uniformly managed using the ConstructionSet object in Honeybee-Energy. Different combinations of envelope thermal performance were generated by varying the constructions of the exterior walls, and windows. The U-value was mainly varied for the exterior walls, while both the U-value and SHGC of the windows were adjusted to investigate the effects of different envelope thermal properties on building heating and cooling demand. The thermal properties of the wall constructions and the U-values, SHGC, and visible transmittance of the glazing systems are summarized in Table 1 and Table 2, respectively.
Table 1.
Thermal Properties of wall constructions.
Table 2.
Thermal and optical properties of glazing systems.
The internal loads were uniformly defined, including occupant density, lighting power density, and equipment power density, using the Load object in Honeybee-Energy. The corresponding schedules, indoor heating and cooling setpoints, infiltration, and ventilation conditions were kept consistent across all simulation cases. The building was divided into thermal zones with a consistent ground/floor construction. To minimize the influence of differences in HVAC control strategies, an Ideal Air System was adopted, and the analysis focused on building heating and cooling thermal demands. The design variables considered in the parametric building modeling, together with their corresponding value ranges and intervals, are summarized in Table 3.
All parametric models used the Ganzi Typical Meteorological Year (TMY) weather file in EPW format provided for EnergyPlus as the outdoor weather boundary condition. Based on the statistical analysis of the weather data, the outdoor air temperature ranges from −17.4 to 27.0 °C, with a mean value of 6.2 °C. The global horizontal solar radiation reaches a maximum value of 1231 W/m2, with a mean value of 208 W/m2. The relative humidity ranges from 1.0% to approximately 100%, with a mean value of 59.1%. The wind speed ranges from 0 to 20.0 m/s, with a mean value of 1.6 m/s, and the predominant wind direction is 292°. These climatic characteristics provide the outdoor environmental boundary conditions for the subsequent parametric EnergyPlus simulations and help characterize the climatic conditions under which the simulated heating and cooling demands occur. Using the same weather file across all simulation cases ensured consistent climatic boundary conditions, allowing the analysis to focus on the effects of different building design parameters. However, the resulting energy-use patterns are specific to the climatic conditions represented by this weather file and may vary under different climatic conditions or weather datasets.
Table 3.
Design variables used for parametric building modeling.
2.3.2. Automated Model Generation
Based on the above parameter settings, a Python (version: 3.9.21) program was developed to automate the parametric generation of building models and batch energy simulations. The program traverses all combinations of the predefined design variables and their corresponding value ranges, generating a total of 62,208 parametric building model instances. The corresponding EnergyPlus input files (IDF) are then generated through the Honeybee-Energy interface, and the subprocess module in Python is used to invoke EnergyPlus to perform annual energy simulations.
After the simulations are completed, the program automatically parses the EnergyPlus output files and extracts the annual heating and cooling demands and total site energy for each model. Heating EUI and cooling EUI represent the annual heating and cooling thermal demands per unit floor area, respectively, while total site energy EUI (total_site_energy_EUI) represents the total annual site energy use per unit floor area reported by EnergyPlus. Because the lighting and equipment power densities and their operating schedules were kept constant across all simulated cases, their contributions to total site energy EUI were also constant. Accordingly, total site energy EUI can be expressed as the sum of heating EUI, cooling EUI, and a constant non-HVAC energy component, provided that all three indicators are expressed on a consistent energy basis. In the simulations, interior lighting and equipment electricity together accounted for approximately 69.26 kW∙h/m2. Total site energy was obtained from the EnergyPlus Annual Building Utility Performance Summary. This automated workflow integrates parametric model generation, energy simulation, and dataset construction, providing the data foundation for subsequent XGBoost modeling and SHAP analysis. The internal loads, operating schedules, temperature setpoints, infiltration and ventilation rates, thermal zoning, and roof and ground-contact floor constructions were kept consistent across the parametric simulation cases. The corresponding simulation settings are summarized in Table 4.
Table 4.
Internal Loads, Operating Conditions, and Construction Settings for Parametric Simulations.
2.4. Machine Learning Models
2.4.1. Building XGBoost Model
In this study, XGBoost was not intended to replace the completed EnergyPlus simulations. Instead, it was trained on the EnergyPlus-derived dataset to establish a data-driven representation of the nonlinear relationships between building design parameters and energy-use indicators. This representation provides a consistent basis for comparing parameter contributions across heating, cooling, and total EUI and for subsequent SHAP-based interpretation.
To establish the nonlinear mapping relationship between building design parameters and building energy demand, the Extreme Gradient Boosting (XGBoost) algorithm was employed to develop a model for heating demand, cooling demand, and total site energy use intensity. XGBoost is an ensemble learning algorithm based on Gradient Boosting Decision Trees (GBDT). By iteratively constructing and integrating decision trees, XGBoost can effectively capture complex nonlinear relationships and interactions among features [20].
Considering that building energy consumption in the Western Sichuan Plateau is jointly influenced by multiple factors, including building geometric parameters, building orientation, window-to-wall ratio, and the thermal performance of the building envelope, and that nonlinear relationships and interactions may exist among different design parameters, XGBoost was selected for modeling. The algorithm has good adaptability to different types of input features and controls model complexity through a regularization mechanism, making it suitable for the prediction and analysis of the parametric simulation data in this study.
On this basis, the SHAP (SHapley Additive exPlanations) method was introduced to interpret the XGBoost model based on its prediction results [21]. The contributions of different building design parameters to the building energy consumption prediction results were quantified at both global and local levels, and their influence directions and patterns were further analyzed.
2.4.2. Data Preprocessing
Before model training, the parametric simulation data were uniformly preprocessed. First, the building area was calculated based on the building length and width, followed by the calculation of heating EUI, cooling EUI, and total site energy EUI. Heating and cooling EUI were calculated from the corresponding annual thermal demands per unit floor area, while total EUI was calculated from the annual total site energy reported by EnergyPlus divided by the building floor area. Subsequently, categorical variables, including building orientation, wall construction type, and exterior window construction type, were converted into numerical variables using One-Hot Encoding so that they could be used as input features for the XGBoost model.
After data cleaning, feature construction, and encoding, a supervised learning dataset containing features such as building geometric parameters, building orientation, window-to-wall ratio, and envelope parameters was obtained, comprising a total of 62,208 samples. The dataset was divided into training and testing sets at a ratio of 8:2, with 49,766 samples in the training set and 12,442 samples in the testing set. The training set was used for model training and hyperparameter optimization, while the testing set was used to evaluate model performance under the adopted random-split protocol. Because the samples were generated from a predefined full-factorial parameter space, the evaluation primarily reflects model performance within the investigated simulation space. Furthermore, geometrically equivalent configurations are be present in both subsets; therefore, the reported metrics should not be interpreted as conclusive evidence of generalization to previously unseen configurations or design levels.
2.4.3. Hyperparameter Optimization and Model Evaluation Metrics
To train and evaluate the XGBoost models, this study combined a training set–test set split with five-fold cross-validation (5-fold cross-validation) for model training and performance evaluation. During model training and hyperparameter optimization, only the training set was used for cross-validation. Specifically, the training set was randomly divided into five subsets of approximately equal size. In each iteration, one subset was used as the validation set, while the remaining four subsets were used for model training. This process was repeated five times so that each subset served as the validation set once. For the XGBoost models, RandomizedSearchCV was employed to randomly evaluate 30 hyperparameter combinations using five-fold cross-validation. The search space included n_estimators = {100, 150, 200, 300, 500}, max_depth = {3, 4, 5, 6, 7, 8}, learning_rate = {0.01, 0.03, 0.05, 0.10, 0.15}, subsample = {0.7, 0.8, 0.9, 1.0}, colsample_bytree = {0.7, 0.8, 0.9, 1.0}, min_child_weight = {1, 3, 5}, and gamma = {0, 0.1, 0.3}. The coefficient of determination (R2) was used as the optimization criterion, and the cross-validation results were used to select the optimal hyperparameter combination for each target variable. The optimal hyperparameters were identical for the heating EUI, cooling EUI, and total EUI models: n_estimators = 500, max_depth = 7, learning_rate = 0.05, subsample = 0.7, colsample_bytree = 0.8, min_child_weight = 3, and gamma = 0. The corresponding best cross-validation R2 scores were 0.9998, 0.9997, and 0.9998, respectively. The selected model was then retrained using the entire training set and finally evaluated on the independent test set.
Four metrics, namely the coefficient of determination (R2), root mean square error (RMSE), mean absolute error (MAE), and mean absolute percentage error (MAPE), were adopted to comprehensively evaluate the predictive performance of the model. The calculation formulas are as follows:
Coefficient of Determination (R2):
Root Mean Square Error (RMSE):
Mean Absolute Error (MAE):
Mean Absolute Percentage Error (MAPE):
Combined with the subsequent SHAP-based explainability analysis, the effects of different building design parameters on building energy consumption prediction results are further revealed.
2.5. Shapley Additive exPlanations
To further reveal the degree of influence and underlying patterns of building design parameters on building energy consumption, the SHAP method was introduced based on the XGBoost model to interpret the model prediction results. XGBoost can effectively capture complex nonlinear relationships between building design parameters and energy consumption; however, its ensemble tree structure exhibits certain black-box characteristics, making it difficult to intuitively quantify the specific contribution of each input feature to the model outputs based solely on the prediction results. Therefore, the SHAP method was employed to interpret the XGBoost model, thereby further improving the interpretability of the model prediction results.
The SHAP method is based on the Shapley value from game theory and represents the model prediction as the sum of the contributions of individual input features, thereby quantifying the contribution of different building design parameters to the model output. For an individual sample, the model prediction can be expressed as follows:
where denotes the prediction of the XGBoost model for a given sample, denotes the baseline output of the model, denotes the number of input features, and denotes the SHAP value of the -th feature, representing the contribution of that feature to the current prediction. A larger absolute SHAP value indicates a more significant influence of the feature on the model prediction. A positive SHAP value indicates that the feature increases the predicted value of the target relative to the model baseline, whereas a negative SHAP value indicates that the feature decreases the predicted value of the target relative to the model baseline.
This study primarily interprets the XGBoost model from a global perspective. First, feature importance is ranked by calculating the mean absolute SHAP value of each building design parameter to identify the major factors influencing building heating, cooling, and total energy consumption. Second, the relationship between SHAP values and feature values is examined to analyze the direction of influence and nonlinear variation patterns associated with different parameter values. For key design parameters with relatively large influences, their variation in SHAP values with changes in parameter values is further analyzed to reveal the underlying relationship between building design parameters and energy consumption responses.
3. Results
3.1. Annual Energy Consumption Characteristics of the Case Building
To characterize the temporal patterns of heating and cooling energy consumption in the Western Sichuan Plateau, the case-building energy consumption data were analyzed at hourly, daily, and monthly time scales. The hourly data were aggregated into daily and monthly profiles to examine variations in energy use at different temporal resolutions. These operational data were analyzed separately from the independent EnergyPlus parametric simulation dataset.
The available operational records indicate that no energy consumption data were recorded from 2 June to 15 September, corresponding to a period when the building was not in operation. No interpolation or supplementary data were introduced for this period. Accordingly, the missing records were distinguished from zero energy consumption when analyzing the hourly, daily, and monthly profiles.
3.1.1. Hourly Heating/Cooling Energy Consumption
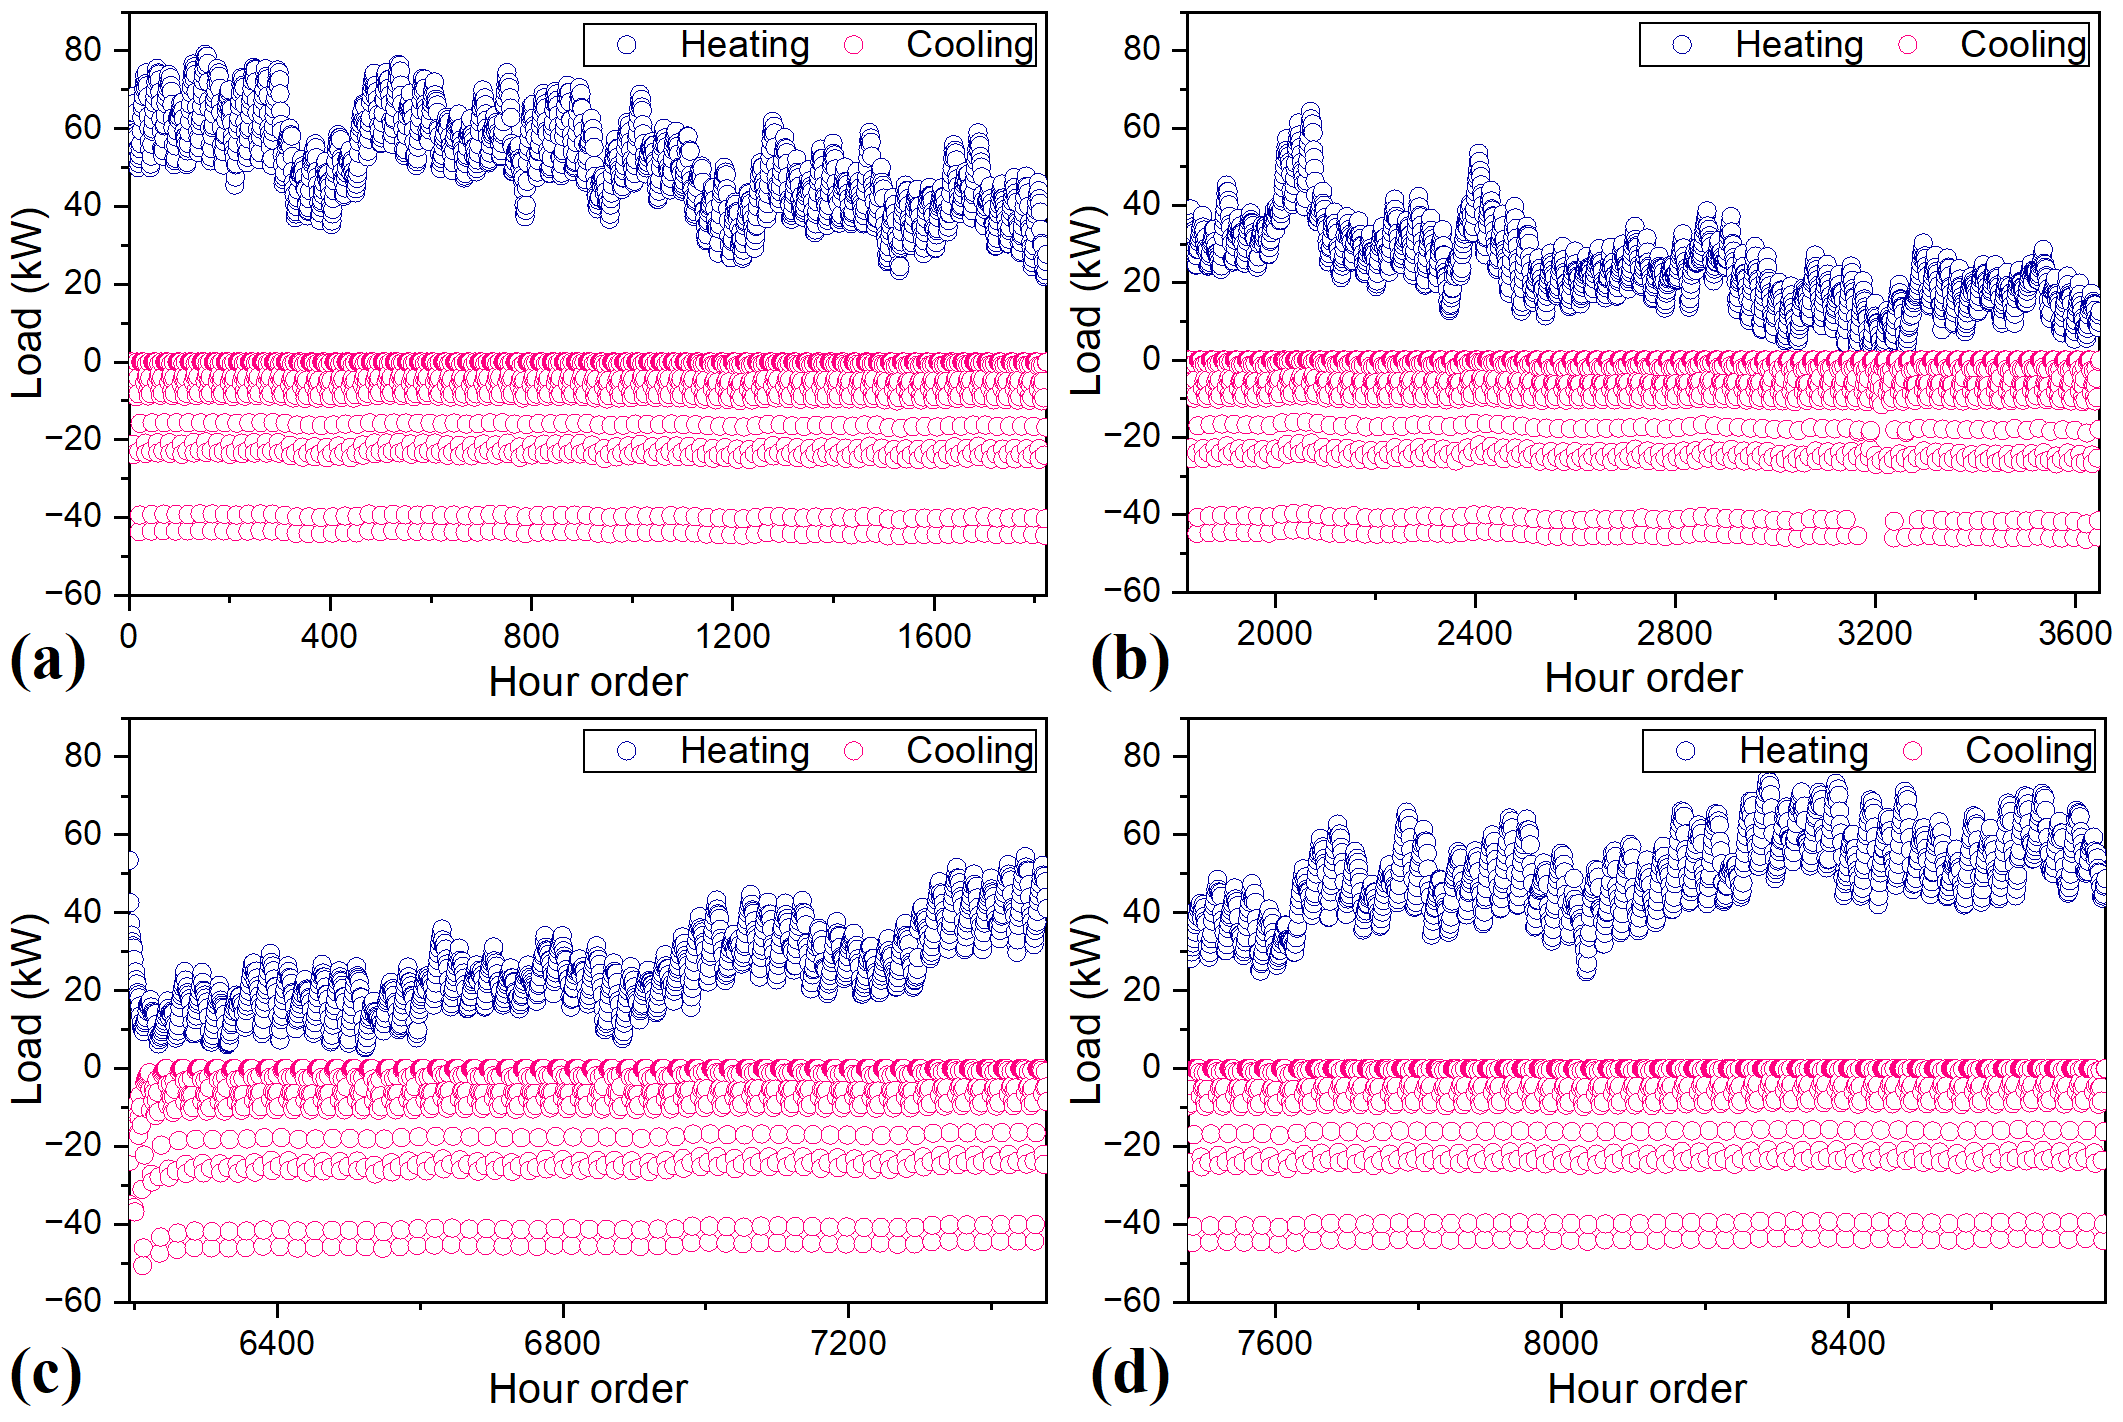
From the perspective of annual hourly energy consumption variations (Figure 3), the case building exhibits distinct seasonal differences in heating and cooling demands. Heating energy consumption is mainly concentrated in winter and some low-temperature periods during the transition seasons, with relatively high energy demand under low-temperature conditions. In contrast, cooling energy consumption varies with building operating conditions, with relatively high values observed in September and October. Overall, the hourly energy consumption of the case building exhibits clear dynamic variations with seasonal changes and building operating conditions, reflecting the influence of seasonal climatic conditions in the Western Sichuan Plateau on building heating and cooling demands. Overall, the hourly energy consumption of the case building exhibits clear dynamic variations with seasonal changes and building operating conditions, reflecting the influence of seasonal climatic conditions in the Western Sichuan Plateau on building heating and cooling demands.
Figure 3.
Hourly Energy Consumption Profile: (a) presents the heating and cooling energy consumption from hours 0 to 1824; (b) presents the heating and cooling energy consumption from hours 1825 to 3600; (c) presents the heating and cooling energy consumption from hours 6193 to 7477; (d) presents the heating and cooling energy consumption from hours 7478 to 8760.
3.1.2. Daily Heating/Cooling Energy Consumption
From the perspective of daily energy consumption variations (Figure 4), the building’s heating energy consumption remains at a relatively high level during the low-temperature season and fluctuates to some extent with changes in weather conditions. Cooling energy consumption varies across the available operating periods, with relatively high values observed in September and October. The non-operational period is excluded from the actual operational energy consumption statistics, and no missing data are interpolated or supplemented. Compared with hourly data, the daily scale can reduce the influence of short-term weather fluctuations to some extent and more clearly reflect the seasonal variation patterns of the building’s annual heating and cooling demands.
3.1.3. Monthly Heating/Cooling Energy Consumption
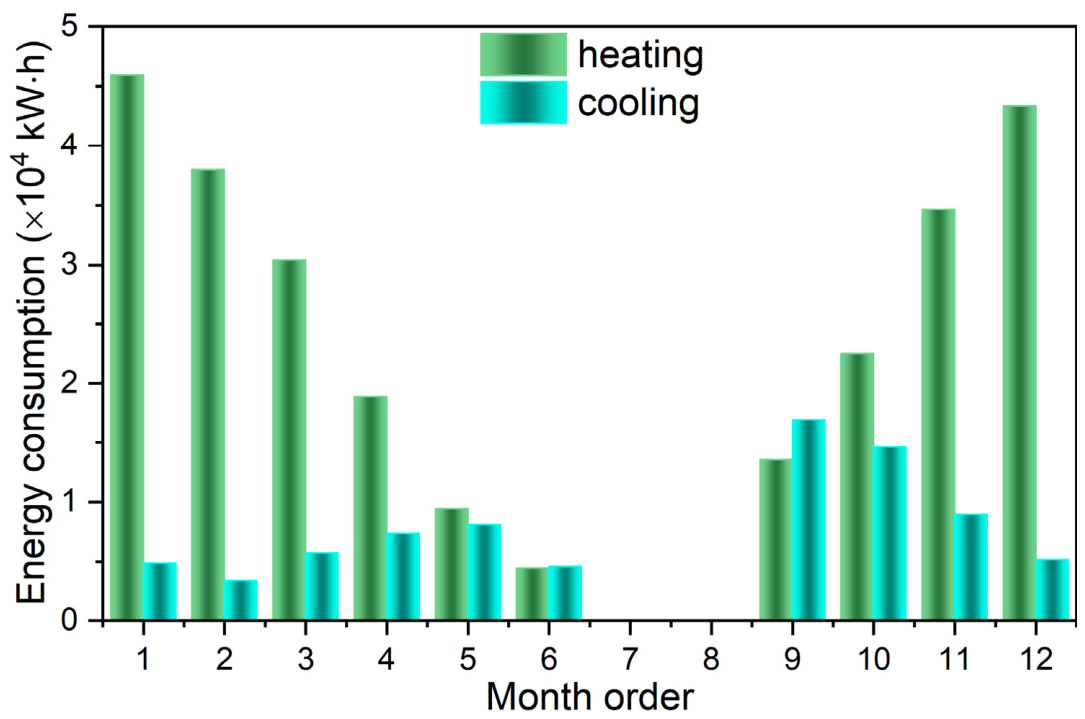
From the perspective of the monthly energy consumption distribution (Figure 5), the building’s heating and cooling demands exhibit relatively clear seasonal concentration. Heating energy consumption is mainly distributed in winter and the low-temperature transition seasons, reaching relatively high levels in the colder months, whereas cooling energy consumption is mainly observed during the available operating periods. The monthly energy consumption values were calculated based on the available operational records for each calendar month. Operational data for 2 June were retained in the June statistics, while no operational data were available during the subsequent non-operational period. Missing data were neither interpolated nor supplemented. Spring and autumn are characterized as transition periods with relatively low heating and cooling demands. Overall, the annual energy consumption of the case building exhibits clear seasonal variation, with heating demand accounting for a relatively important proportion of the annual energy demand.
Figure 4.
Daily Energy Consumption Profile.
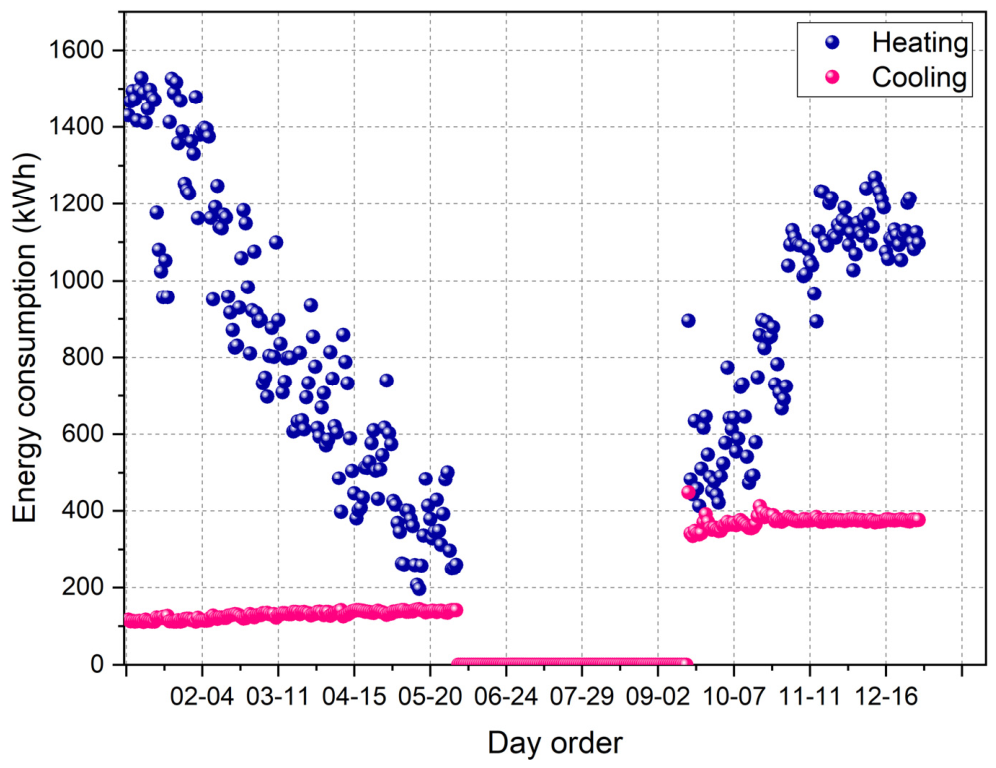
Figure 5.
Monthly Energy Consumption Profile.
The above energy consumption data of the case building are mainly used to analyze the annual energy consumption characteristics under actual operating conditions. The subsequent parametric study is based on unified building operation and simulation conditions, under which energy consumption simulations are conducted for different combinations of building design parameters, and a dataset is constructed for XGBoost prediction and SHAP interpretation analysis.
The case-building analysis provides an empirical basis for understanding the temporal characteristics of heating and cooling energy use in the Western Sichuan Plateau. However, the operational data of the case building do not directly determine the subsequent parametric simulation. Instead, the parametric model was independently constructed to systematically investigate the effects of building design parameters on energy performance under the regional climatic conditions. Thus, the case-building analysis and parametric simulation serve complementary purposes: the former characterizes actual energy-use patterns, while the latter identifies the potential effects of design parameters on heating, cooling, and total energy use.
3.2. Building Energy Demand Distribution Characteristics
An analysis of the heating EUI distribution reveals a degree of dispersion among the 62,208 parametric building samples across various design parameter combinations (Figure 6). Heating EUI values range from 31.46 to 276.85 kW∙h/m2, with a mean of 111.81 kW∙h/m2 and a standard deviation of 43.15 kW∙h/m2. Cooling EUI values range from 0.04 to 17.50 kW∙h/m2, with a mean of 1.47 kW∙h/m2 and a standard deviation of 1.76 kW∙h/m2. Total on-site energy use intensity ranges from 103.33 to 346.20 kW∙h/m2, with a mean of 182.56 kW∙h/m2 and a standard deviation of 42.52 kW∙h/m2. The narrower range and lower mean of the cooling EUI indicate that, under the specific climatic and standardized simulation conditions, cooling demands remain generally low. These results demonstrate that distinct combinations of building design parameters correspond to significantly different heating energy use intensities. Cooling EUI also exhibits a specific distribution range, yet its overall characteristics differ from those of heating EUI, suggesting that heating and cooling demands vary differently across parameter combinations; notably, these parametric simulations employed standardized operational assumptions and an “Ideal Air System” to assess thermal demands.
Figure 6.
Energy Consumption Distribution Figure: (a) Heating EUI Distribution; (b) Cooling EUI Distribution; (c) Total EUI Distribution.
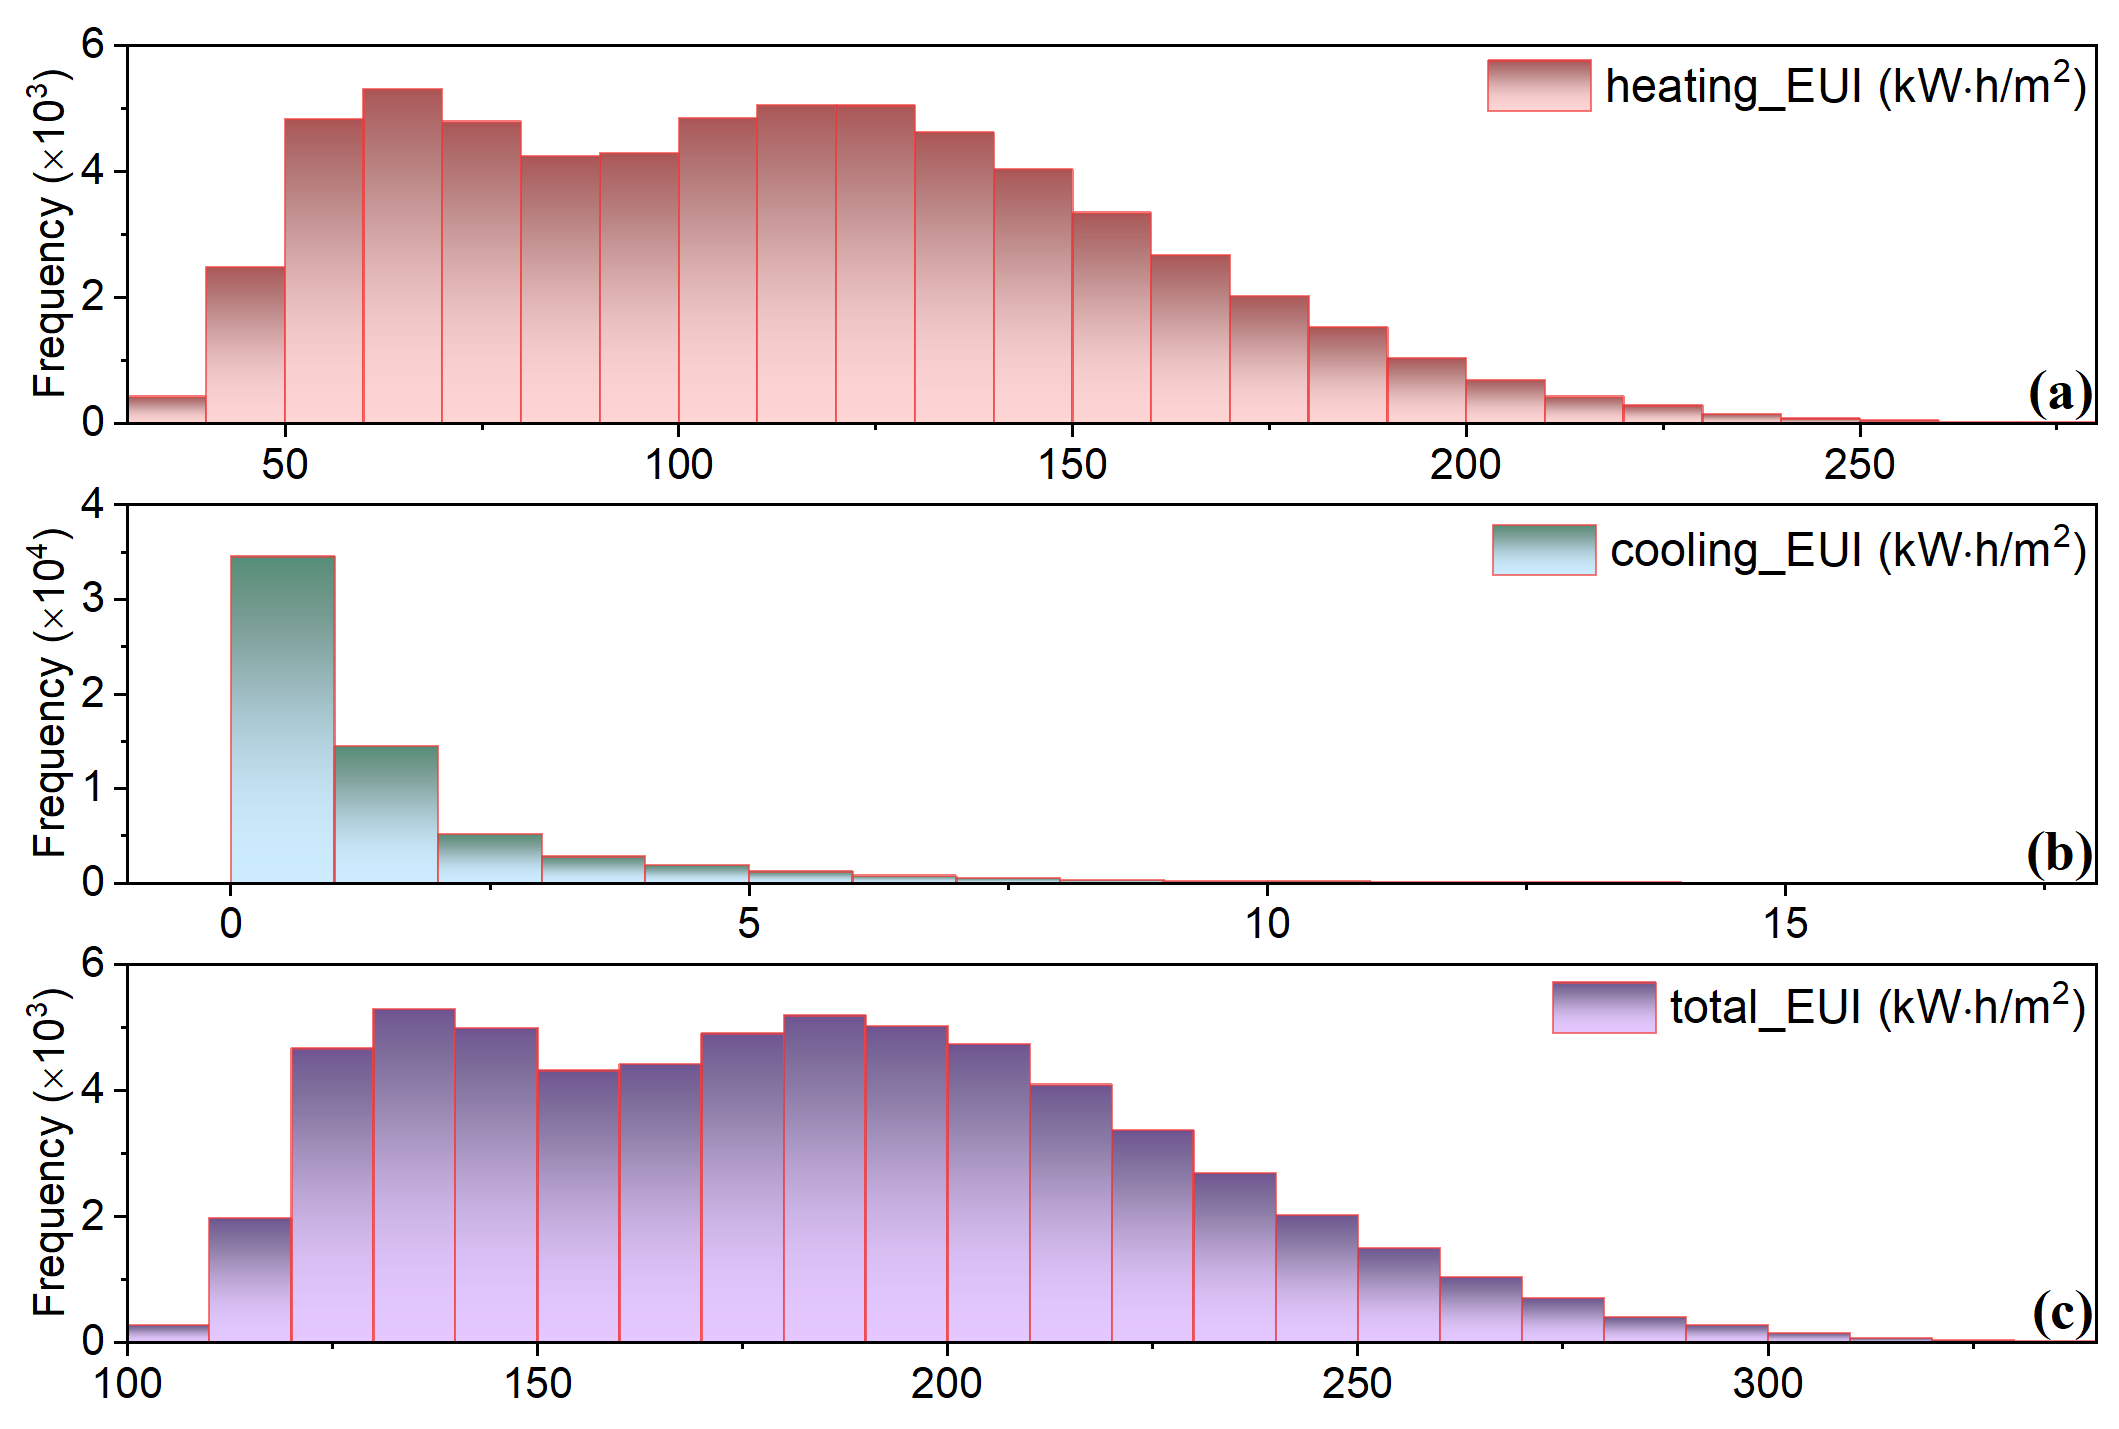
The total EUI reflects the variation in the annual overall energy demand of buildings under different parameter combinations, and its distribution is jointly influenced by heating and cooling energy consumption. Therefore, heating EUI, cooling EUI, and total EUI differ to some extent in terms of their distribution ranges and variation characteristics.
Overall, the heating EUI, cooling EUI, and total site energy EUI of the 62,208 parametric simulation samples exhibit distinct distribution ranges and dispersion characteristics, providing a data foundation for subsequent XGBoost modeling and SHAP analysis of the relationships between building design parameters and the energy-use indicators.
3.3. XGBoost Modeling Results
3.3.1. Model Performance
The parametric analysis examines the relationships between building design parameters and heating, cooling, and total energy use within the predefined simulation space in Table 5.
Table 5.
Model Evaluation Table.
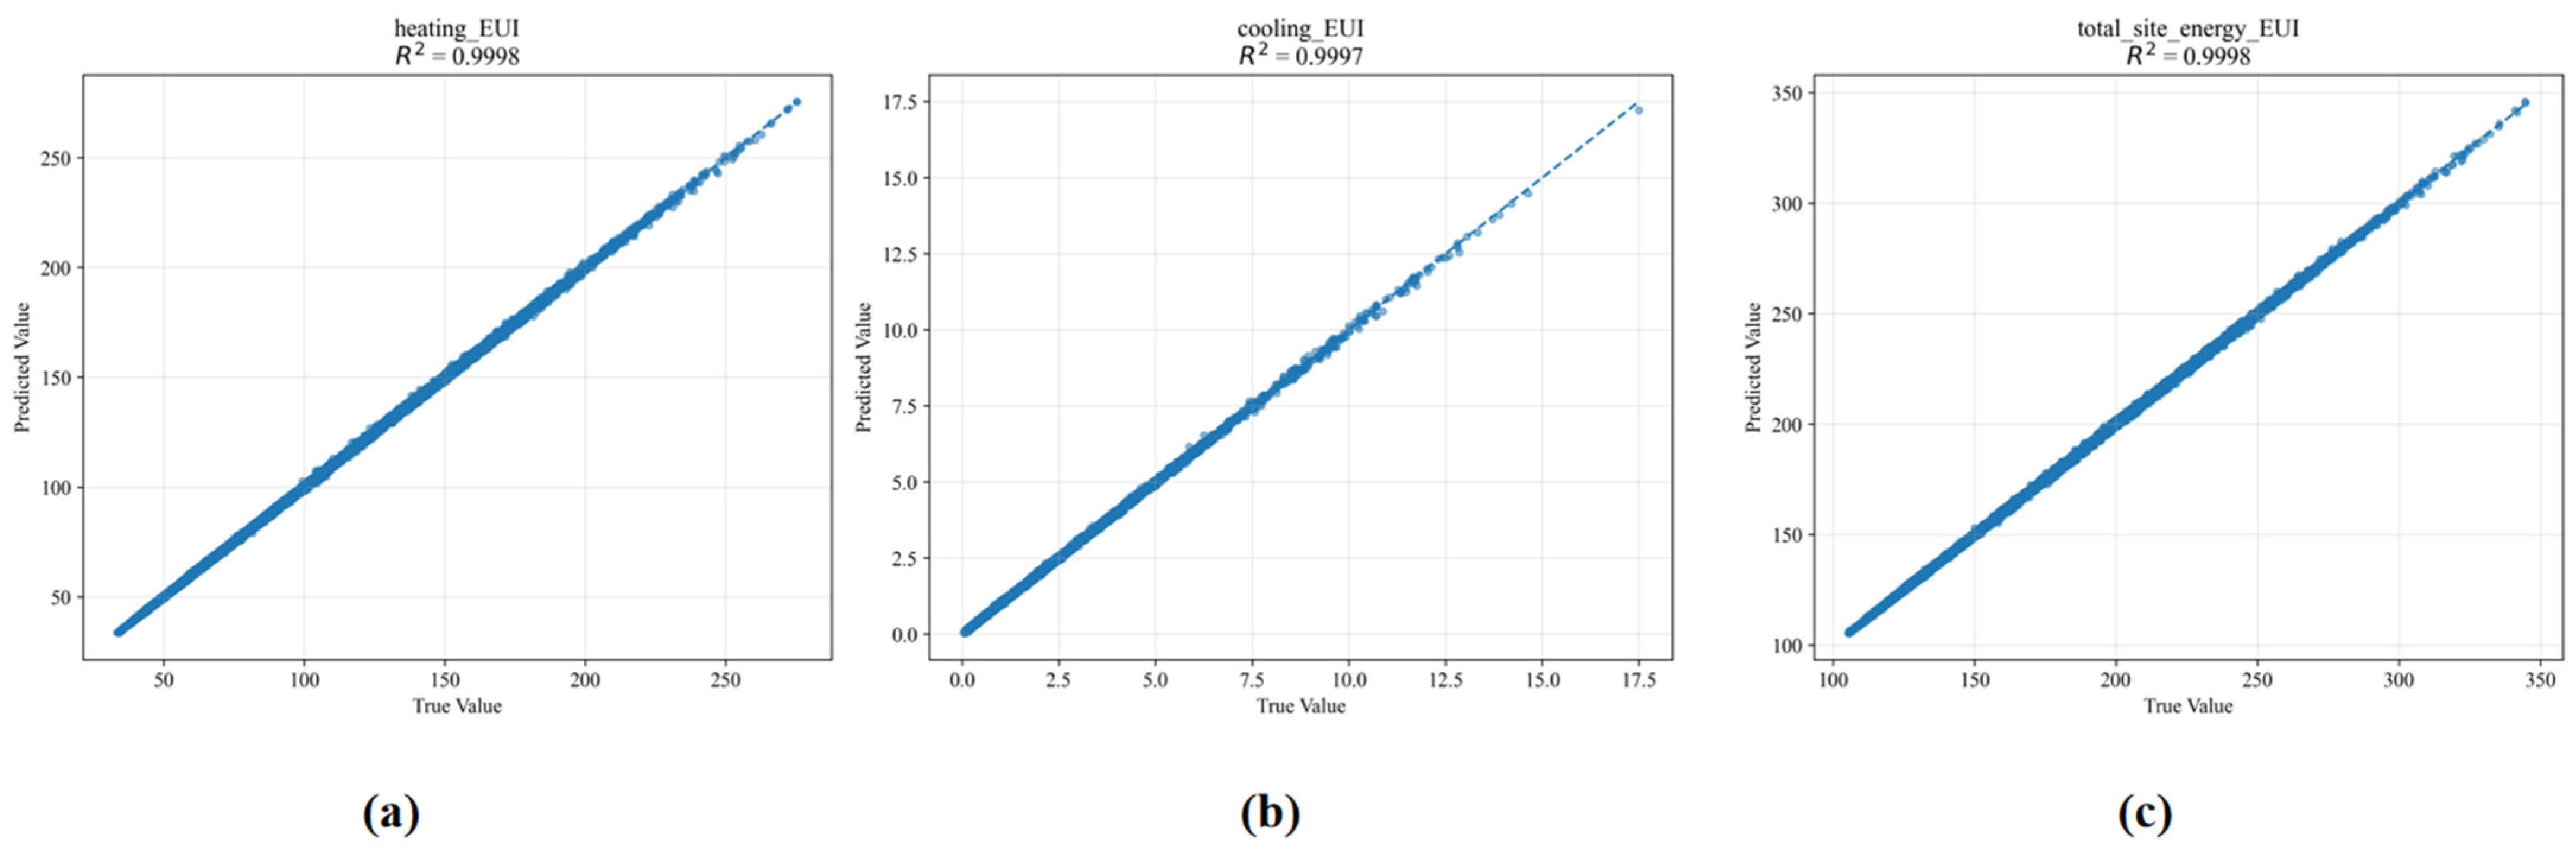
As shown in Table 5, the XGBoost models demonstrate strong predictive performance across the three prediction targets. The heating, cooling, and total site energy EUI models achieve R2 values of 0.9998, 0.9997, and 0.9998, respectively, with relatively low RMSE and MAE values. These results indicate small absolute deviations between the model predictions and the EnergyPlus simulation results and demonstrate that XGBoost can effectively capture the nonlinear relationships between building design parameters and the three energy-use targets.
It should be noted that the cooling EUI values are generally close to zero. Therefore, MAPE is sensitive to small denominators and is not considered a stable primary metric for evaluating the cooling EUI model. For this reason, RMSE and MAE are used as the primary error metrics for cooling EUI, while MAPE is reported as a supplementary metric. The cooling EUI model achieves an RMSE of 0.03 kWh/m2 and an MAE of 0.02 kWh/m2, indicating a small absolute prediction error despite the narrow range of cooling EUI. Overall, the model performance provides a reliable basis for the subsequent SHAP analysis.
3.3.2. Prediction Values vs. Simulation Values
As shown in Figure 7, the sample points for the three prediction targets are generally distributed around the 45° reference line, indicating a high degree of consistency between the XGBoost model predictions and the EnergyPlus simulation results. As the simulated energy consumption level changes, the predicted values can generally follow the variation trend, without obvious systematic deviations, indicating that the model can effectively learn the nonlinear relationships between building design parameters and the simulated energy-use indicators within the investigated dataset.
Figure 7.
Actual vs. Predicted Values: (a) Heating EUI; (b) Cooling EUI; (c) Total EUI.
3.3.3. Residual Analysis of the Model
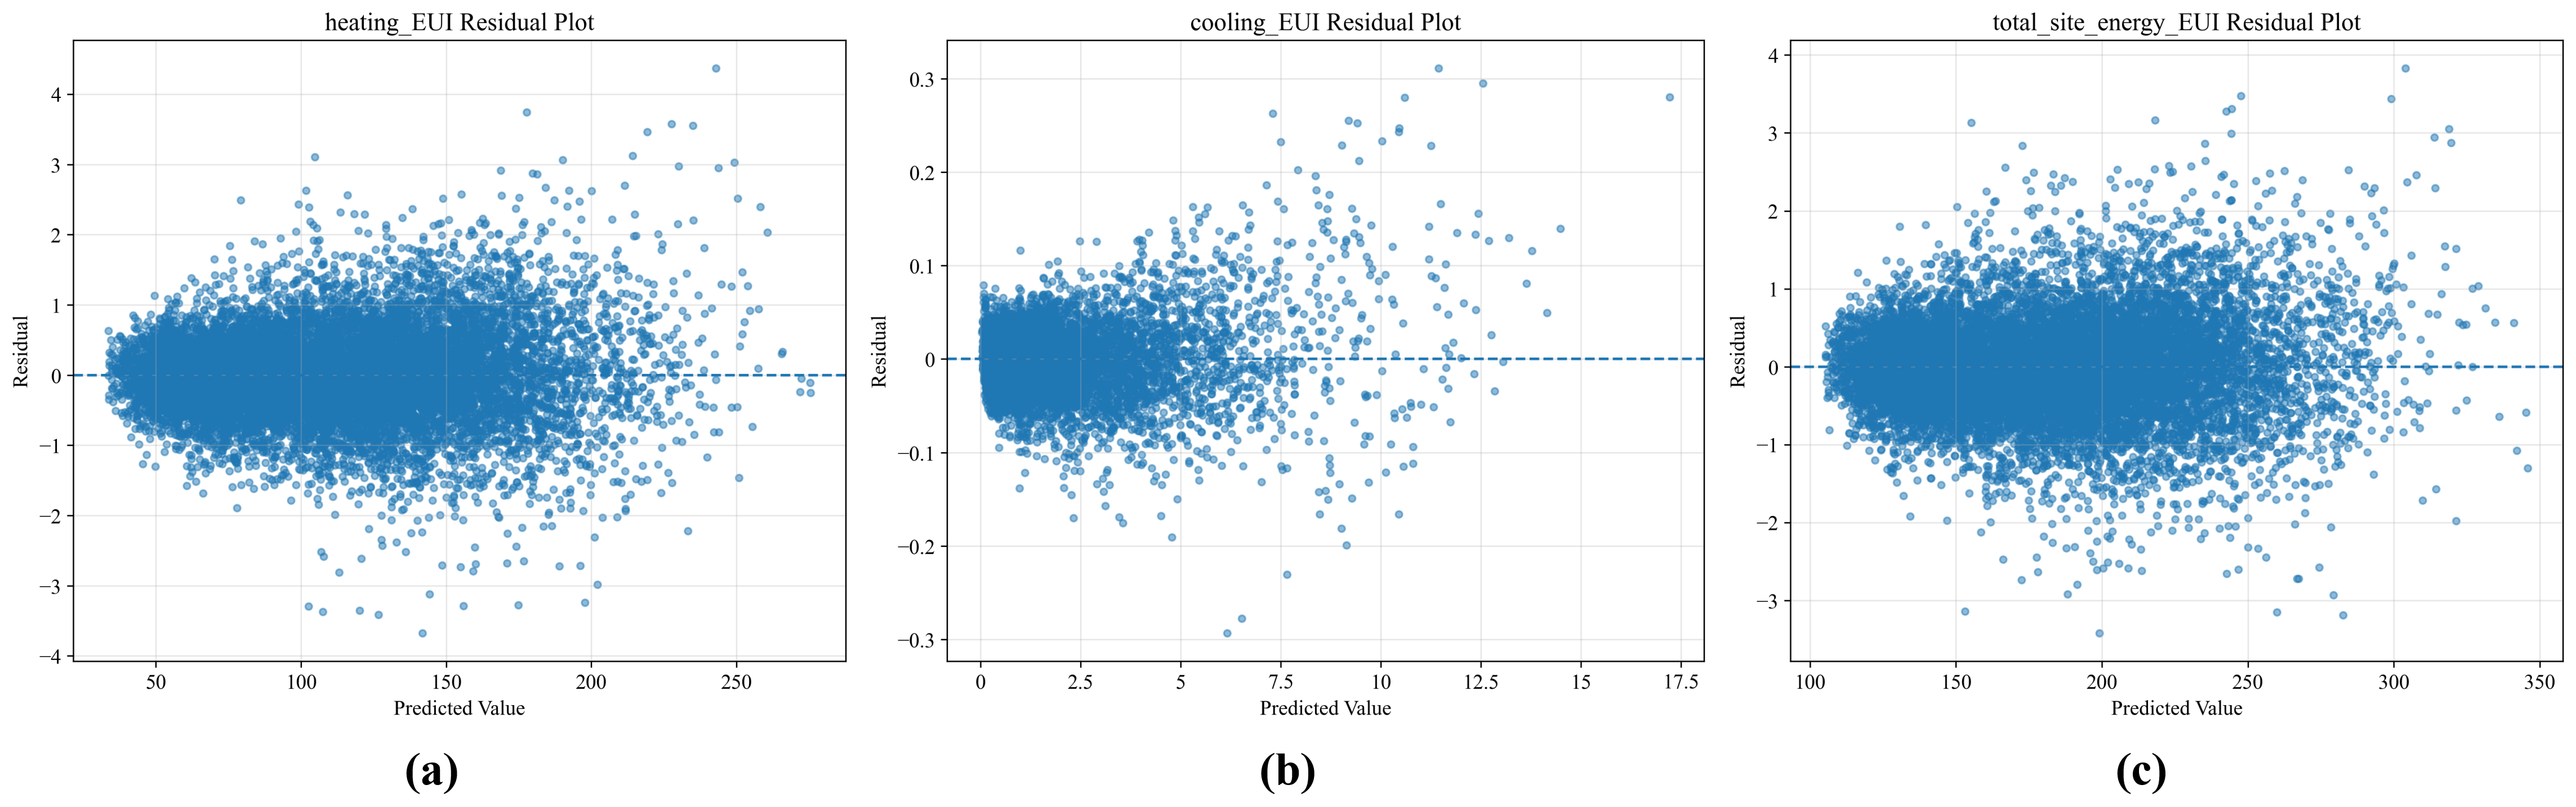
The residual is defined as the difference between the model predicted value and the EnergyPlus simulated value. By examining the distribution range of the residuals and their concentration around zero, it can be determined whether the model has obvious systematic overestimation or underestimation.
As shown in Figure 8, the residuals of the heating EUI, cooling EUI, and total EUI models are generally distributed around zero, with no obvious systematic directional deviations. Most residuals fall within a relatively narrow range, although a small number of samples exhibit larger errors. These patterns suggest that the models do not exhibit pronounced systematic bias on the test set under the adopted random-split evaluation protocol.
Figure 8.
Model Residual Plots: (a) Heating EUI Residuals; (b) Cooling EUI Residuals; (c) Total EUI Residuals.
Taken together, the evaluation metrics, comparisons between predicted and simulated values, and residual distributions indicate that the XGBoost models capture the relationships between building design parameters and the corresponding EnergyPlus-derived energy-use indicators within the investigated simulation dataset. These models are subsequently used for SHAP analysis to examine the relative contributions and response patterns of different design parameters. However, the results do not establish the models’ generalization performance for geometrically distinct or previously unseen design configurations.
3.4. SHAP Analysis of Factors Influencing Energy Demand
3.4.1. Comparison of Feature Importance for Heating, Cooling, and Total Energy Consumption
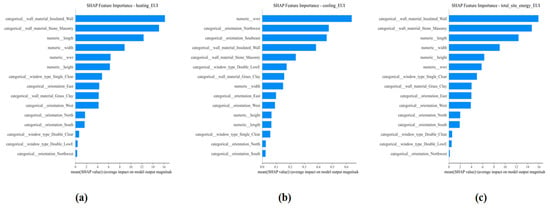
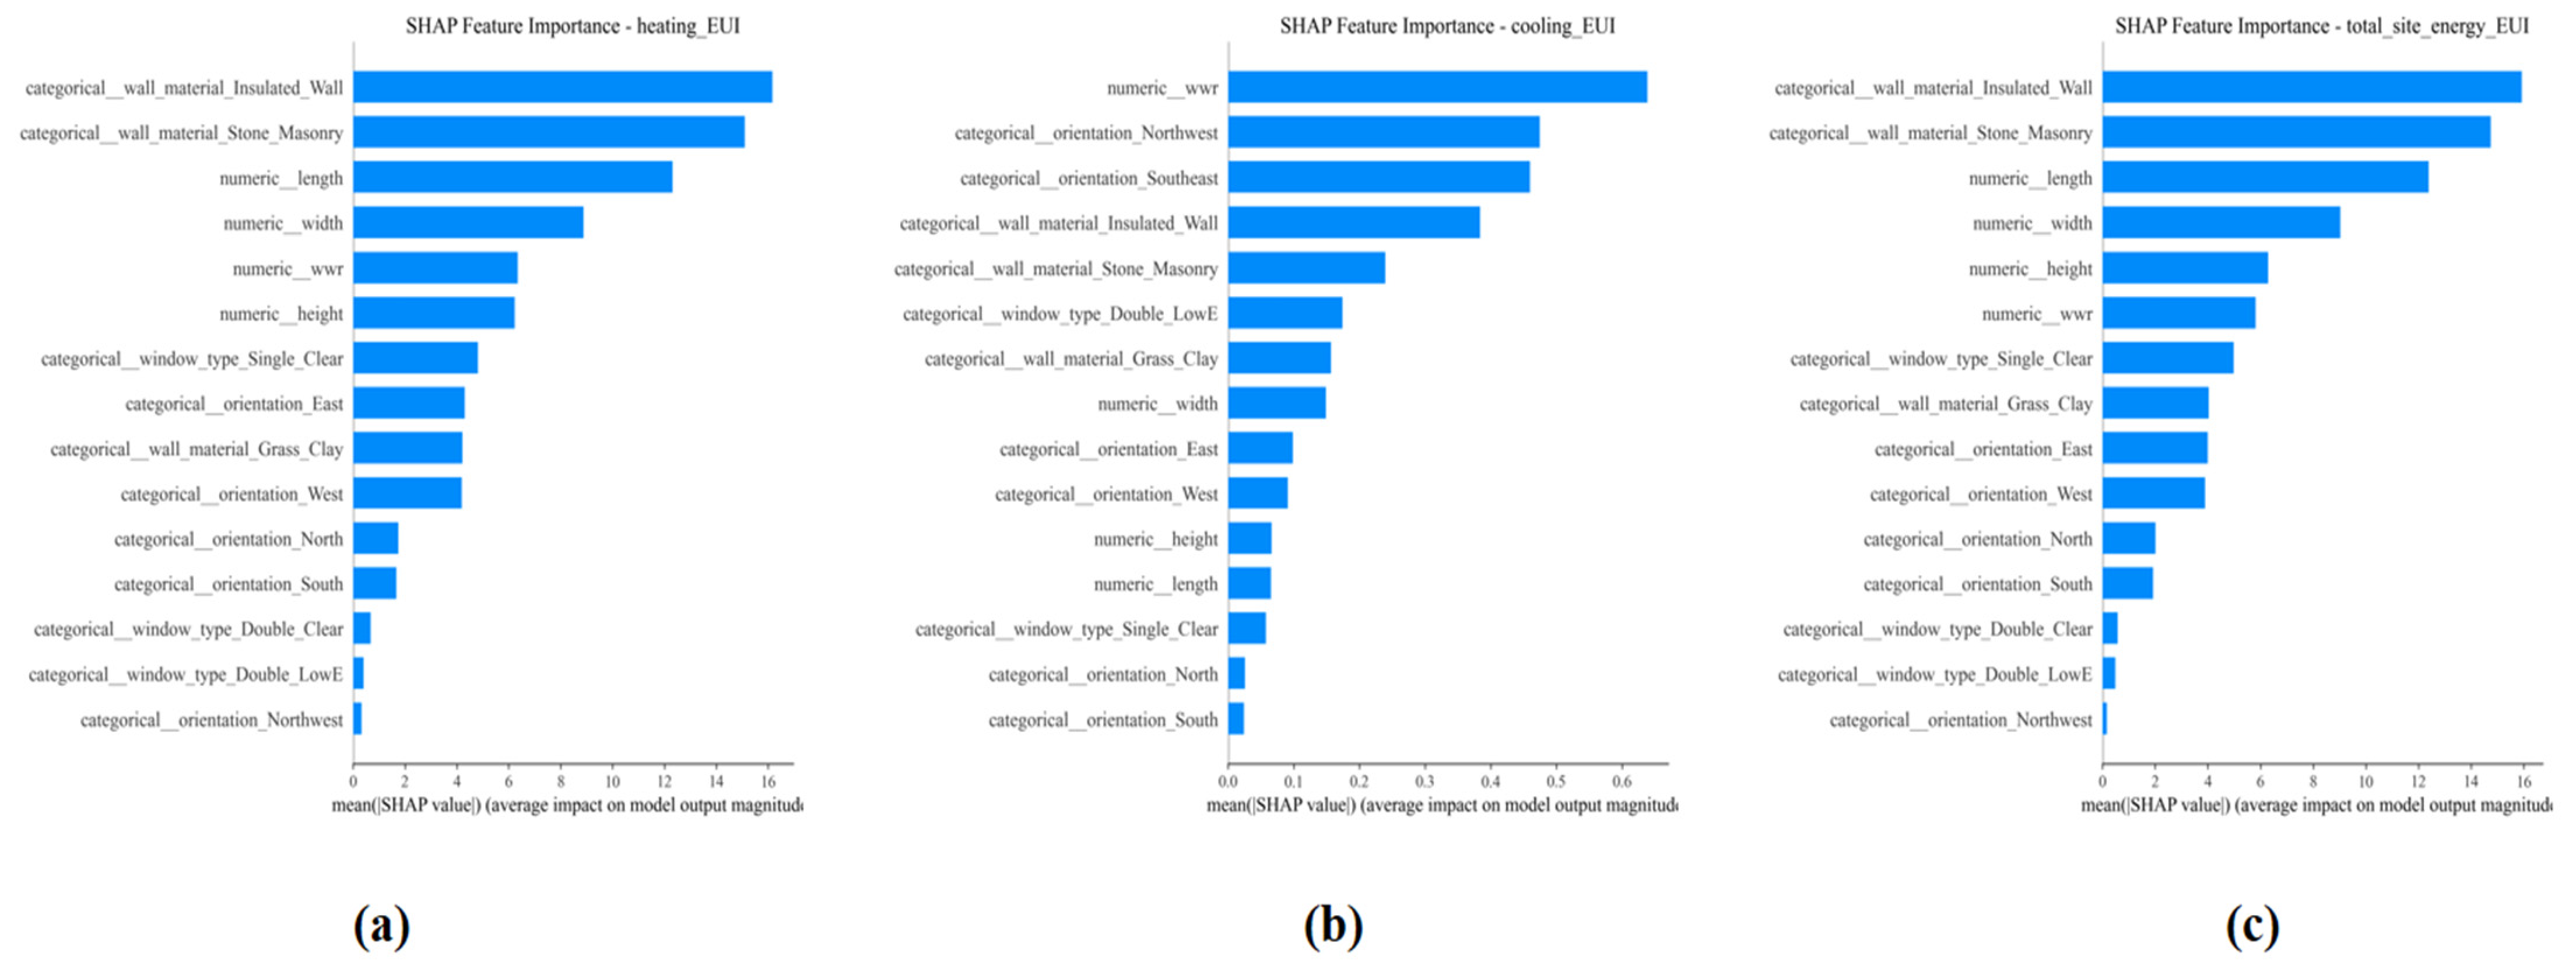
The mean absolute SHAP value (Mean |SHAP value|) was used to measure the overall contribution of each building design parameter to the model prediction results. A larger value indicates that the parameter has a more significant influence on the corresponding energy demand prediction results. Figure 9 shows the SHAP feature importance rankings for the heating EUI, cooling EUI, and total site energy EUI models, respectively.
Figure 9.
Feature Plots: (a) Heating EUI Feature Plot; (b) Cooling EUI Feature Plot; (c) Total EUI Feature Plot.
As shown in Figure 9a, SHAP importance values reflect the varying contributions of encoded building design features to the prediction of Heating EUI. Among these, wall construction types, building geometric parameters, and building orientation exhibit high importance, whereas the construction characteristics of exterior windows show relatively lower importance at the level of encoded features. The grouping results presented in Table 6 further evaluate these contributions at the level of the original variables, enabling a comprehensive assessment of the relative importance of categorical variables.
Table 6.
Grouped SHAP importance of building design parameters for heating, cooling and total site energy EUI.
For cooling EUI, as shown in Figure 9b shows a different pattern of feature importance from that observed for heating EUI. WWR and selected one-hot encoded categories of building orientation and wall construction exhibit relatively high importance. Table 6 complements these feature-level results by reporting the grouped importance of the original design variables. The differences between the heating and cooling results indicate that the relative contributions of design parameters depend on the energy-use target being predicted.
As shown in Figure 9c, the SHAP importance pattern for total EUI differs from those for heating and cooling EUI. Wall construction features and building geometry parameters show relatively high importance at the encoded-feature level. The grouped results in Table 6 provide a complementary assessment of the original design variables and help clarify their relative contributions to total EUI. The grouped SHAP results in Table 6 show that the importance rankings for heating EUI and total EUI are broadly similar, with wall construction ranking first for both targets. However, building orientation and building length exchange their relative positions, indicating that their relative contributions differ slightly between heating and total EUI.
Overall, the SHAP results indicate that the relative contributions of building design parameters vary across heating EUI, cooling EUI, and total EUI. Although the grouped importance rankings for heating EUI and total EUI are broadly similar, differences remain in the relative positions of individual variables, while cooling EUI exhibits a different ranking pattern. Therefore, analyzing the three targets separately provides a more comprehensive understanding of the contributions of building design parameters to heating and cooling demand and total energy use. To further investigate the response patterns of key parameters, the positive and negative SHAP values are examined in relation to changes in parameter values.
In addition to the feature-level SHAP importance shown in Figure 9, grouped SHAP importance was calculated to evaluate the contributions of the original building design variables. For the continuous variables (length, width, height, and WWR), the mean absolute SHAP value was calculated directly across the analyzed samples. For each categorical variable (orientation, wall construction, and window construction), the absolute SHAP values of all corresponding one-hot encoded features were summed for each sample, and the resulting sums were averaged across the samples. The grouped mean absolute SHAP values and their corresponding rankings are reported in Table 6. This analysis provides a variable-level assessment that complements the individual encoded-feature results shown in Figure 9.
3.4.2. Influence Patterns of Key Parameters on Building Energy Demand
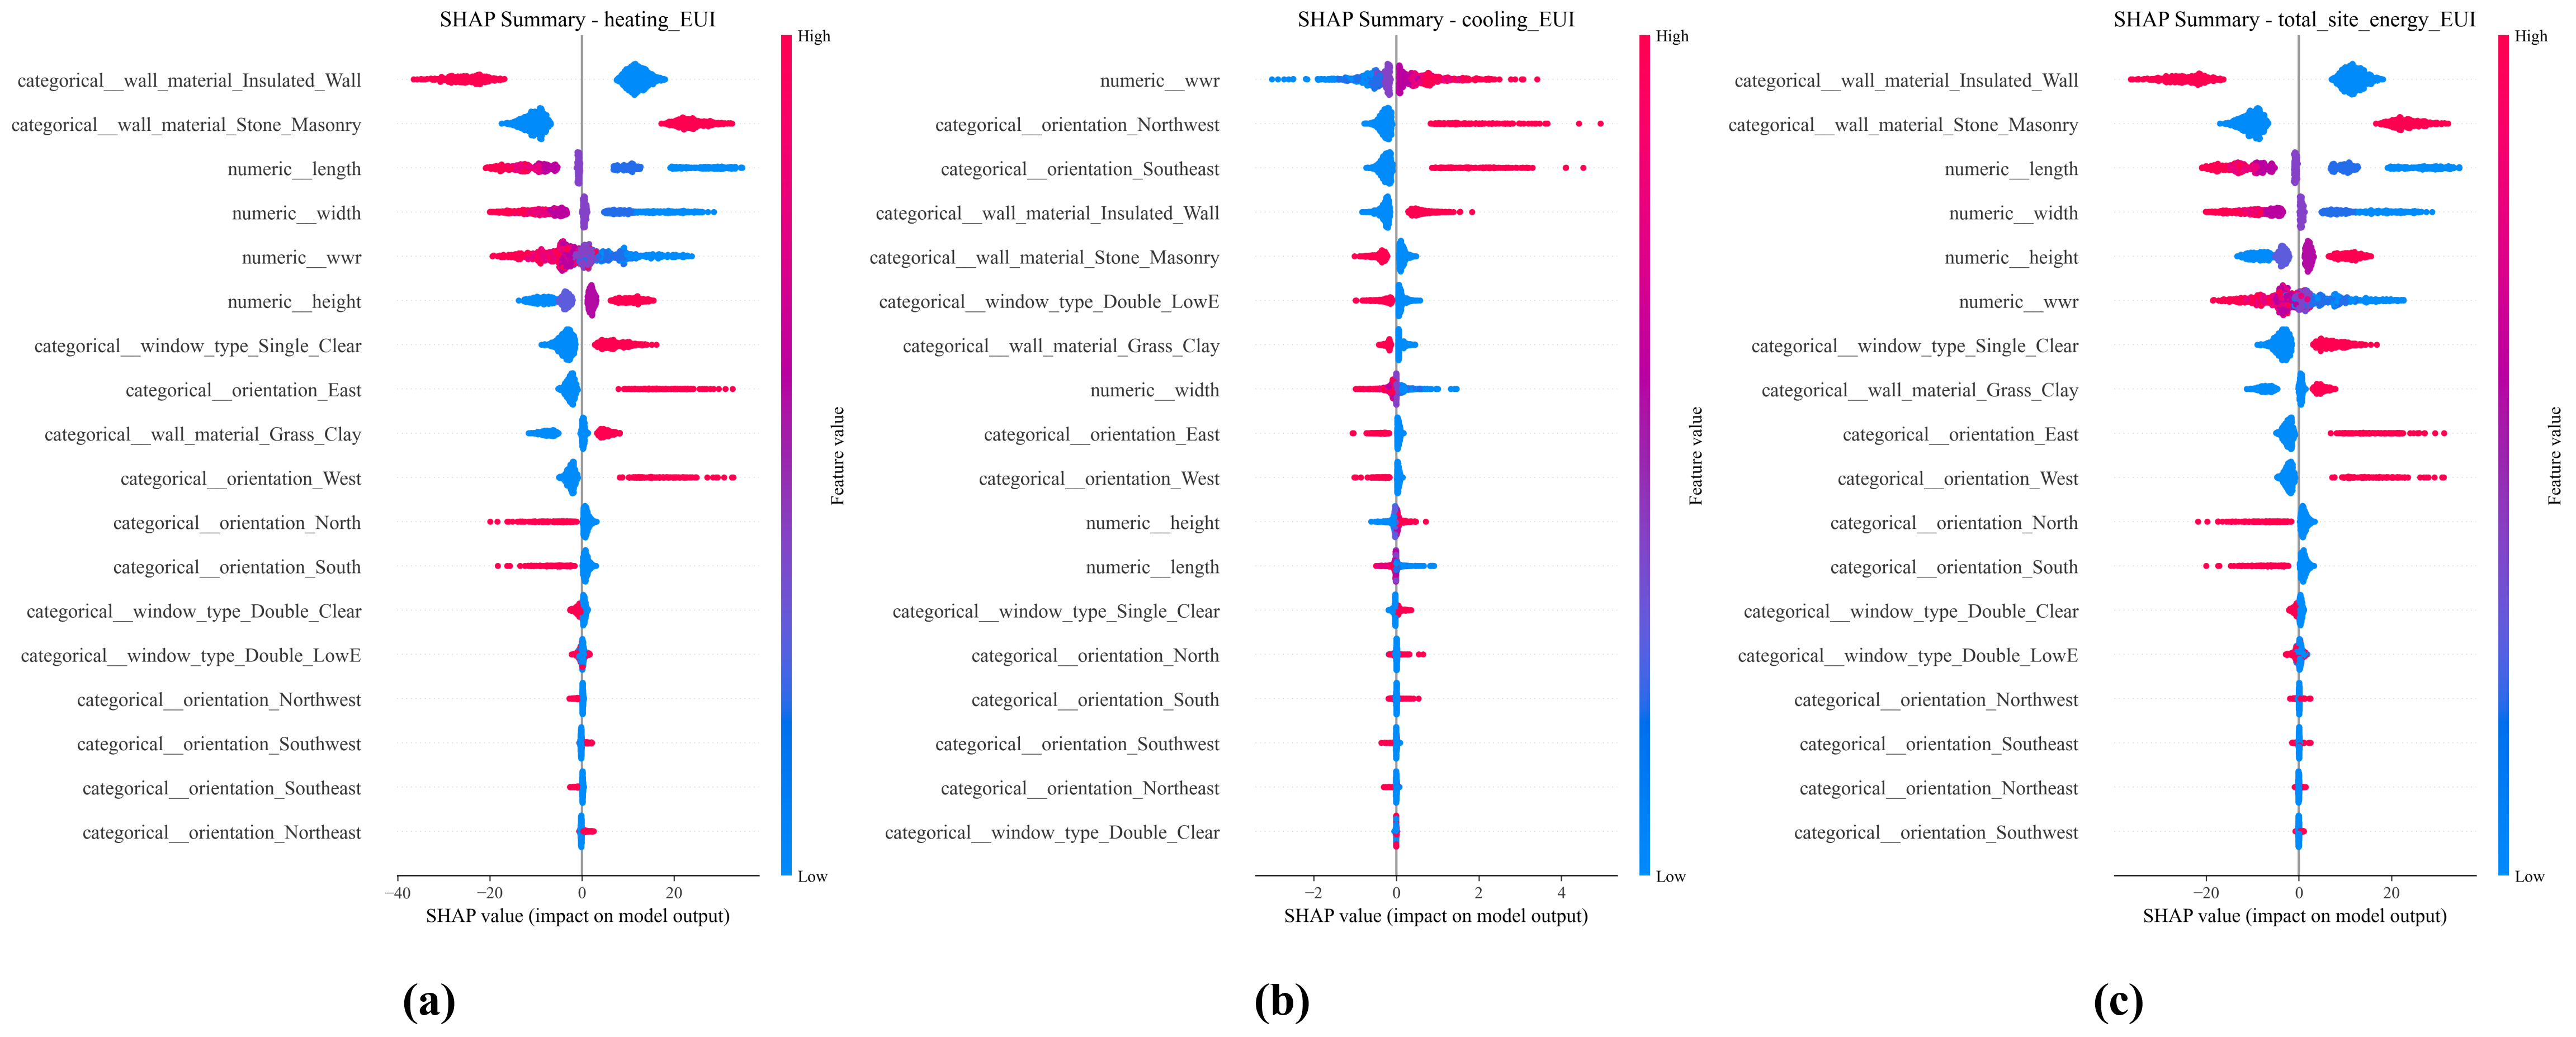
Based on the feature importance analysis, SHAP summary plots were further used to analyze the influence direction and distribution characteristics of each building design parameter on heating EUI, cooling EUI, and total EUI, as shown in Figure 10. A SHAP value greater than 0 indicates that the feature increases the predicted energy consumption relative to the baseline value, while a value less than 0 indicates that the predicted energy consumption decreases. For continuous variables, the color gradient represents relatively high-to-low feature values, respectively. For categorical variables represented by one-hot encoded features, the color should not be interpreted as a high-to-low scale; instead, each dummy feature represents the presence of a specific category. Therefore, the influence of categorical variables should be interpreted based on the corresponding category-specific feature and its SHAP value. By combining the distribution of SHAP values with changes in feature values, the influence direction of each key building design parameter on different energy consumption targets can be further analyzed.
Figure 10.
SHAP Summary Plots: (a) SHAP Summary Plot for Heating EUI; (b) SHAP Summary Plot for Cooling EUI; (c) SHAP Summary Plot for Total EUI.
For heating EUI, the building design parameters ranked higher have a larger dispersion range of SHAP values, indicating that they have a greater influence on the model prediction results. By combining the distribution of feature values and SHAP values, it can be found that the influence directions of different parameters differ significantly. The higher values of some parameters mainly correspond to positive SHAP values, indicating that an increase in their values has an increasing effect on the predicted heating EUI, while other parameters show an opposite trend.
For cooling EUI, the main influencing factors and their SHAP distribution characteristics differ to some extent from those of heating EUI. The distribution of SHAP values for the same building design parameter is not completely consistent between the heating and cooling models, indicating that different design parameters have different degrees and directions of influence on the two types of energy consumption targets. The SHAP distribution of total EUI comprehensively reflects the contributions of different design parameters to the overall annual energy consumption. Its feature influence relationships are jointly affected by heating and cooling energy consumption. Therefore, the importance and SHAP distributions of some parameters differ from those of the individual heating EUI or cooling EUI models.
Overall, the SHAP summary plots can not only reflect the relative importance of different building design parameters to the model prediction results, but also further reveal their influence directions and variation trends by combining feature values. The SHAP distributions of the three prediction targets differ to some extent, indicating that the same building design parameter may exhibit different degrees and directions of influence on heating, cooling, and overall annual energy consumption. It should be noted that the effects of L and W on EUI may partly reflect the floor-area normalization, since the floor area is calculated as (L × W). Changes in these parameters also alter the wall-to-floor-area ratio and other geometric characteristics. Therefore, their SHAP contributions represent the combined effects of building geometry and EUI normalization within the investigated parameter space, rather than a purely isolated effect of building form.
3.4.3. Influence of Window-to-Wall Ratio on Building Energy Demand
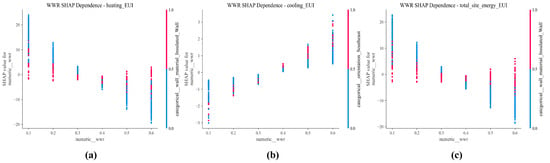
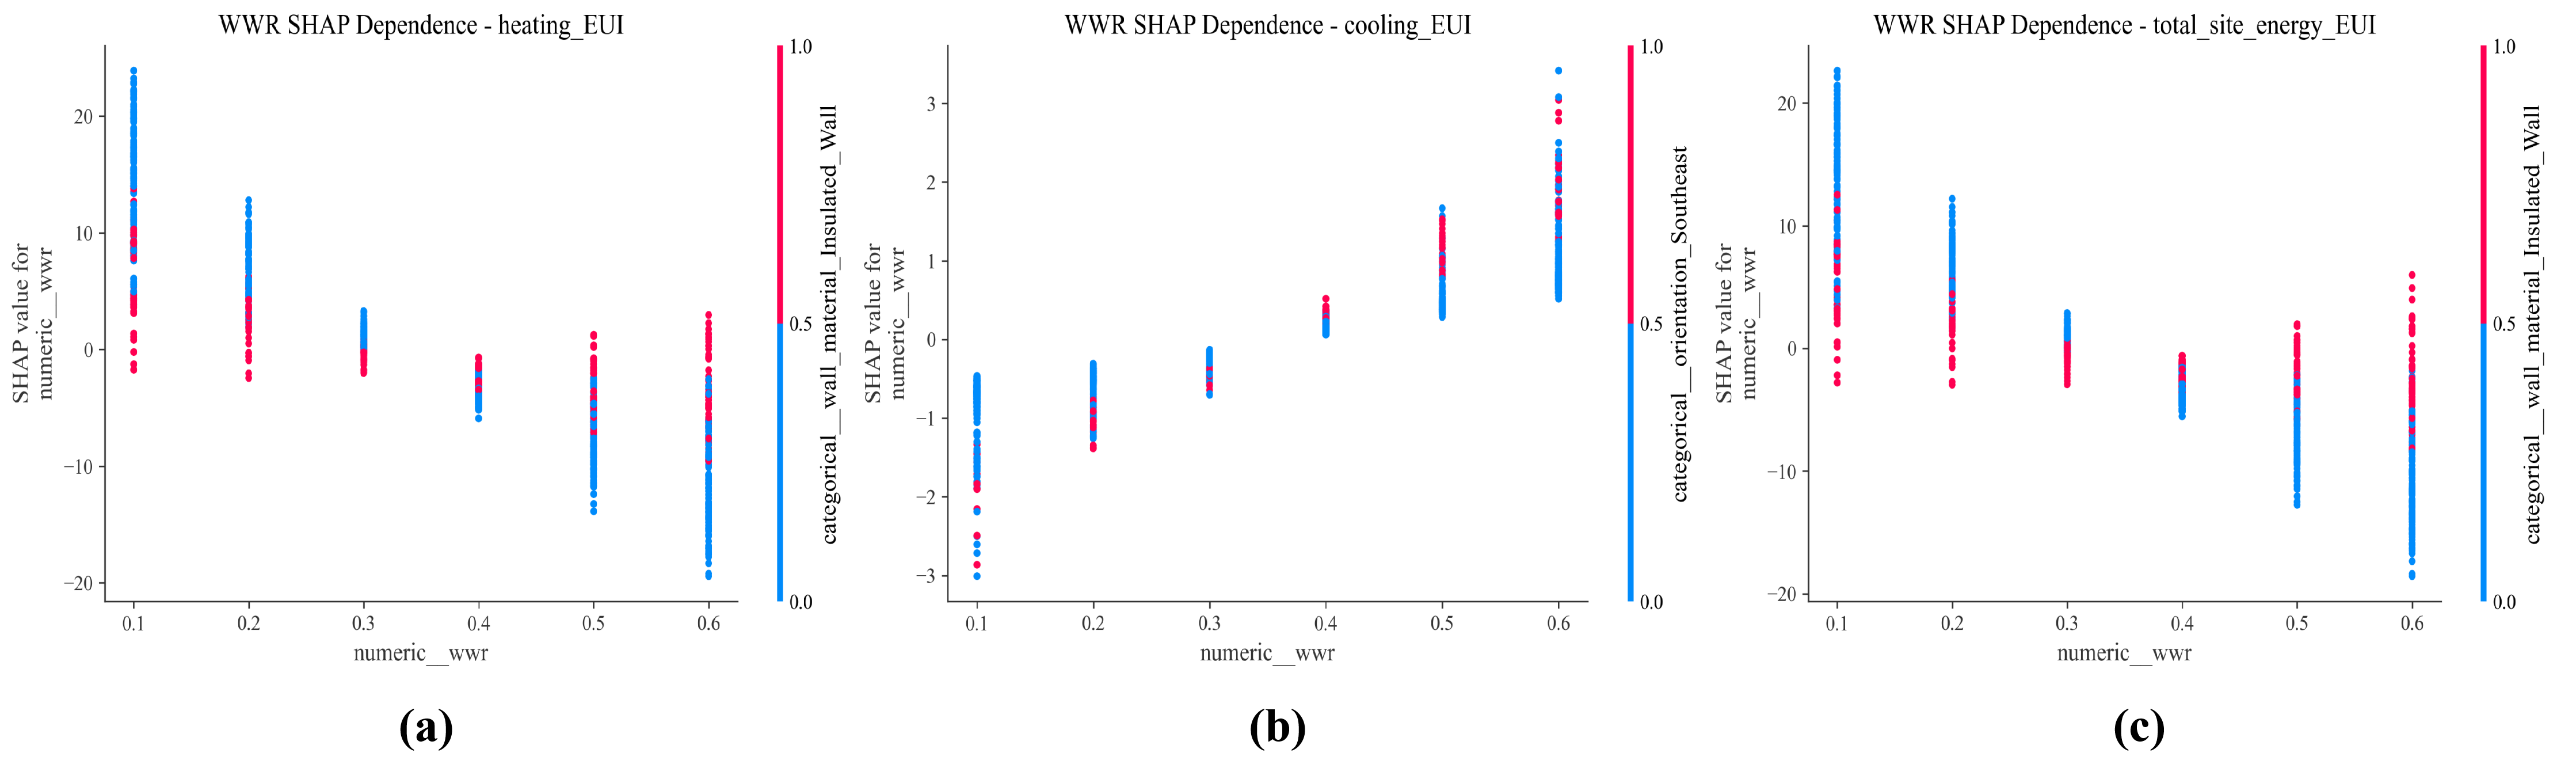
WWR is an important design parameter affecting the thermal performance of the building envelope and solar radiation heat gain. In this section, WWR is selected as a typical continuous parameter, and SHAP dependence plots are used to analyze its relationship with building energy consumption. The results are shown in Figure 11.
Figure 11.
SHAP dependence plots for window-to-wall ratio: (a) Heating EUI dependence plot; (b) Cooling EUI dependence plot; (c) Total EUI dependence plot.
The WWR shows a relatively clear SHAP response relationship with heating EUI. As the WWR increases, the SHAP values generally show a decreasing trend, indicating that a larger WWR has a certain reducing effect on the predicted heating EUI. This change may be related to the increase in solar radiation heat gain after the window area increases, thereby reducing heating demand to some extent. Figure 11a also indicates an interaction between WWR and wall construction. The heating-reduction effect associated with increasing WWR is more pronounced for the less insulated wall constructions, whereas it is weaker for the insulated wall construction. This indicates that the influence of WWR on heating EUI depends partly on the thermal performance of the opaque envelope. Increasing WWR changes both conductive heat transfer through the transparent envelope and solar heat gains through the windows, and the resulting heating response therefore varies with wall thermal performance. The observed pattern should thus be interpreted as an interaction effect between WWR and wall construction rather than as an independent effect of WWR.
For cooling EUI, SHAP values generally increase with WWR, indicating that a larger WWR is associated with higher cooling demand. This trend can be physically explained by the increase in glazed area as WWR rises. Under the high solar-radiation conditions represented by the weather data used in this study, a larger glazed area allows more incident solar radiation to enter the building. The amount of transmitted solar heat is also influenced by the SHGC of the glazing. The resulting increase in solar heat gains raises the cooling load required to maintain indoor thermal conditions. Therefore, the positive relationship between WWR and cooling EUI reflects the combined influence of increased glazed area, glazing SHGC, and incident solar radiation under the specified simulation conditions.
For total EUI, the SHAP values generally decrease as WWR increases, shifting from positive to negative values. However, this overall downward trend does not necessarily indicate a strictly monotonic relationship across the entire WWR range.
Overall, the WWR has a relatively significant influence on heating, cooling, and total EUI, but its influence direction differs. Increasing the WWR negatively affects heating energy use intensity, while its influence on cooling energy use intensity is positive and its contribution to total EUI generally decreases with increasing WWR. This indicates that the influence of the WWR differs significantly among different energy consumption targets, and both heating and cooling demands need to be considered comprehensively in subsequent building design.
4. Discussion
Key Influencing Factors and Their Mechanisms of Action
Based on parametric energy consumption simulation, this study combines the XGBoost and SHAP methods to analyze the effects of different building design parameters on heating demand, cooling demand, and total site energy use intensity. The results show that the importance and influence directions of different design parameters vary under different energy consumption targets, indicating that annual building energy consumption is jointly affected by multiple factors, such as the thermal performance of the building envelope, building geometry, and solar radiation heat gain. Figure 9 presents SHAP importance at the encoded-feature level, whereas Table 6 reports grouped SHAP importance for the original design variables. These two analyses provide complementary perspectives on the relative contributions of individual encoded features and the corresponding design variables.
For heating EUI, wall construction was the most influential variable, followed by building orientation and length (Table 6). Wall construction affects heat transfer through the building envelope, while building length influences the relationship between envelope area and floor area. Building orientation also affects heating demand by altering façade solar exposure and potential solar heat gains through windows, which may offset part of the heating demand during cold periods. However, its contribution depends on the distribution of solar radiation and its interaction with building geometry. Because the same WWR was applied to all four façades, the influence of orientation should be interpreted in conjunction with façade solar exposure and building geometry [22].
For cooling EUI, building orientation ranked first, followed by wall construction and WWR (Table 6). Orientation influences the distribution of solar radiation across façades and the resulting solar heat gains, which can affect cooling demand. Wall construction affects heat transfer through the envelope, while WWR influences the extent of glazed areas and associated solar heat gains. Although orientation is important for both heating and cooling EUI, its effects may differ between the two targets because solar heat gains can offset heating demand during cold periods but increase cooling demand during warm periods. These interpretations apply to the simulation conditions examined in this study.
These findings should also be considered in the context of regional architectural characteristics. Although the parametric model incorporates building geometry and several envelope construction types, these variables represent only selected physical characteristics of buildings. Vernacular architectural features, indigenous material traditions, traditional construction practices, and the integration of buildings with the cultural landscape are not explicitly represented in the current modeling framework. Such aspects may involve considerations beyond operational energy performance, including local material availability, construction techniques, cultural continuity, and the relationship between building form and its surrounding environment. Therefore, the identified contributions of building design parameters to heating energy predictions should be interpreted within the scope of the selected simulation conditions, rather than as a comprehensive assessment of regional architectural sustainability.
The window-to-wall ratio exhibits distinct differences across energy-use targets. SHAP analysis shows that as the window-to-wall ratio increases, the SHAP values of heating EUI generally decrease, with a weaker effect observed for the insulated-wall configuration, while those of cooling EUI generally increase. For total EUI, the SHAP values generally decrease from positive to negative, indicating an overall decreasing trend. These differences may be related to the combined effects of heat transfer through transparent envelope components and solar radiation heat gain. During the heating period, an increase in window area may increase solar heat gains and thereby reduce heating demand to some extent, whereas during the cooling period, increased solar heat gains may increase cooling demand [23].
For total EUI, the SHAP values of the WWR generally decrease from positive to negative as WWR increases, indicating a nonlinear effect on overall annual energy consumption within the parametric simulation range of this study. This pattern reflects the combined effects of WWR on heating and cooling demand and further indicates that its influence on total EUI cannot be described by a simple monotonic relationship. Previous measured-data studies have reported that larger WWRs may be associated with higher total EUI, with WWR having a particularly notable influence on cooling energy consumption [24]. In contrast, the present study shows a nonlinear effect of WWR on total EUI, with SHAP values generally decreasing from positive to negative as WWR increases within the specified simulation conditions. This difference may be attributed to variations in building type, climate conditions, and operational assumptions. In addition, building orientation is relatively important for cooling EUI. Its influence depends not only on façade solar exposure but also on the aspect ratio and geometric symmetry of the parametric models. Different length-to-width ratios and rotational symmetry may lead to different or equivalent façade exposure conditions, affecting solar gains and cooling demand. Therefore, orientation effects should be interpreted in conjunction with building geometry rather than attributed to solar exposure alone.
By considering the three energy consumption targets, it can be found that the ranking of influencing factors for heating EUI, cooling EUI, and total EUI is not completely consistent. The same design parameter may exhibit different importance and even different influence directions under different energy consumption targets. Therefore, evaluating building design parameters based solely on a single energy consumption indicator may not fully reflect their annual energy impacts. For buildings in the Western Sichuan Plateau region, it is necessary to comprehensively analyze the effects of different design parameters on heating and cooling demands from an annual perspective.
From the methodological perspective, parametric energy consumption simulation can obtain the energy consumption responses of multiple building schemes over a relatively wide range of design parameters. XGBoost can establish nonlinear mapping relationships between design parameters and energy consumption indicators, while SHAP further quantifies the relative contributions and influence directions of different parameters. Previous studies have used XGBoost combined with SHAP to analyze the relationships between building design parameters and heating and cooling loads, and have identified important influencing factors such as building compactness, surface area, and glazing area [25]. Recent studies have also shown that combining XGBoost with SHAP can explain the key factors influencing building energy performance while ensuring the prediction accuracy of building energy consumption [26]. Together, these approaches provide complementary information on feature importance and model response patterns within the specified simulation conditions.
5. Conclusions
This study investigates the effects of building design parameters on energy performance in the Western Sichuan Plateau using a workflow integrating case-building operational energy analysis, parametric energy simulation, XGBoost modeling, and SHAP-based interpretation. First, the characteristics of the heating and cooling energy use of the case building are analyzed at hourly, daily, and monthly scales. Subsequently, 62,208 combinations of building design parameters and the corresponding energy consumption data are obtained through parametric modeling and batch simulations using EnergyPlus, and XGBoost prediction models are established for heating EUI, cooling EUI, and total site energy EUI, respectively. Finally, the SHAP method is combined to identify the importance and influence directions of different building design parameters. The main conclusions are as follows:
- The operational heating and cooling energy-use patterns of the case building exhibit clear seasonal variations. Heating energy consumption is mainly concentrated in winter and the low-temperature transition seasons, whereas cooling energy consumption varies with building operating conditions, with relatively high values observed in September and October. These findings characterize the seasonal energy-use patterns of the case building under its actual operating conditions and should not be directly generalized to all buildings in the Western Sichuan Plateau.
- The XGBoost models achieved high agreement with the EnergyPlus simulation results within the investigated dataset, with R2 values of 0.9998, 0.9997, and 0.9998 for heating EUI, cooling EUI, and total site energy EUI, respectively. The corresponding RMSE values were 0.64, 0.03, and 0.64 kW∙h/m2, while the MAE values were 0.47, 0.02, and 0.48 kW∙h/m2, respectively. These results indicate that the models effectively capture the relationships between building design parameters and the simulated energy-use indicators within the predefined parameter space. However, because geometrically equivalent configurations are present in both the training and test sets, the reported metrics should not be interpreted as evidence of generalization to previously unseen design configurations.
- The relative contributions of building design parameters to the model predictions vary across different energy-use targets. According to the grouped SHAP analysis, wall construction ranks first for heating EUI, followed by building orientation and length. For cooling EUI, building orientation ranks first, followed by wall construction and WWR. For total EUI, wall construction, building length, and building orientation are the three most influential variables. These findings demonstrate that the relative importance of building design parameters differs across heating, cooling, and total EUI under the specified simulation conditions, highlighting the need to evaluate these energy-use targets separately.
- The SHAP response patterns of the WWR differ across the three energy-use targets. Within the parameter ranges and simulation conditions considered in this study, WWR generally exhibits decreasing SHAP values for heating EUI, with a weaker effect observed for the insulated-wall configuration, while its SHAP values for cooling EUI generally increase. For total EUI, the SHAP values generally shift from positive to negative as WWR increases, indicating an overall decreasing trend that is not necessarily strictly monotonic. These results highlight the need to examine the contributions of WWR separately for heating, cooling, and total EUI, while accounting for the influence of wall construction.
In summary, this study indicates that building energy performance in the Western Sichuan Plateau region is jointly influenced by multiple design parameters, including building geometry, building envelope, window-to-wall ratio, and orientation, with different parameters exhibiting different effects on heating, cooling, and total energy consumption. The combination of parametric energy consumption simulation with XGBoost and SHAP enables the identification of key influencing factors and analysis of their relationships with building energy consumption across a relatively large design parameter space, providing a reference for building energy consumption analysis and research on building design parameters in the Western Sichuan Plateau region. These findings are based on simulations using a single weather file representing the Western Sichuan Plateau; therefore, their applicability to other climatic conditions requires further investigation.
Limitations and Future Work
This study has several limitations. First, the parametric analysis is based on EnergyPlus simulation data rather than measured data from multiple buildings. Although this enables systematic analysis of different design parameter combinations, the unified assumptions for occupancy, equipment, lighting, and operation cannot fully capture the variability of actual building operation. In addition, a simplified HVAC system was adopted without considering different system types, equipment performance, and control strategies. Furthermore, roof insulation and air infiltration were not included as independent design variables in the current parametric analysis. Therefore, their individual effects and potential interactions with other building design parameters were not explicitly evaluated. Second, the design parameters and their ranges were defined according to the climatic and building conditions of the Western Sichuan Plateau. Therefore, the identified contribution patterns may vary across different building types, scales, or climatic regions. Future research could incorporate measured data from multiple buildings, expand the parameter ranges and building types, and consider different HVAC systems and control strategies to further assess the applicability of the proposed framework. Furthermore, all simulations were conducted using a single weather file representing the Western Sichuan Plateau, which may limit the applicability of the findings to other climatic conditions. Third, this study focuses primarily on quantitative energy performance and does not fully consider qualitative sustainability aspects, such as vernacular architecture, local material practices, and cultural landscape integration. Future research could combine these regional and cultural considerations with quantitative energy analysis to provide a more comprehensive assessment of building sustainability.
Future research can expand the ranges of building design parameters and incorporate simulation and actual operational data from different building types, scales, and climatic conditions to improve the applicability of the research results. In particular, different roof insulation levels and air infiltration rates could be considered to evaluate their individual and interactive effects on building heating, cooling, and total energy consumption. Meanwhile, different HVAC systems and control strategies can be further considered to analyze their coupled effects with building design parameters. On this basis, parametric simulation, machine learning, and explainable analysis can be combined with multi-objective optimization to provide support for the coordinated optimization of building heating, cooling, and annual total energy consumption in plateau regions.
Author Contributions
Conceptualization, J.L.; methodology, J.L. and Y.W.; software, Y.W.; validation, F.G.; formal analysis, Y.W.; investigation, Y.W.; resources, F.G. and W.Z.; data curation, Y.W.; writing—original draft preparation, J.L. and Y.W.; writing—review and editing, F.G. and W.Z.; visualization, F.G.; supervision, W.Z.; project administration, J.L.; funding acquisition, W.Z. All authors have read and agreed to the published version of the manuscript.
Funding
This research was funded by Sichuan University of Science & Engineering Graduate Innovative Research Project (No. Y2026131); Chinese Scholarship Council, grant number (No. 202410890003); In-house research project of Sichuan Provincial Architectural Design and Research Institute Co., Ltd. (KYYN2026012); and Key Research Base Program of Sichuan Social Sciences Association of China (No. 25SCZSXW02).
Data Availability Statement
The data presented in this study are available on request from the corresponding author. The data are not publicly available due to privacy.
Conflicts of Interest
Author Fei Gao was employed by the company Sichuan Provincial Architectural Design and Research Institute (China). The remaining authors declare that the research was conducted in the absence of any commercial or financial relationships that could be construed as a potential conflict of interest. Fei Gao is employee of Sichuan Provincial Architectural Design and Research Institute (China), who provided funding and teachnical support for the work. The funder had no role in the design of the study; in the collection, analysis, or interpretation of data, in the writing of the manuscript, or in the decision to publish the results.
Abbreviations
The following abbreviations are used in this manuscript:
| WWR | Window-to-Wall ratio |
| XGBoost | eXtreme Gradient Boosting |
| SHAP | Shapley Additive exPlanations |
| IEA | International Energy Agency |
| L | Length |
| W | Width |
| H | Height |
| U-value | thermal transmittance |
| SHGC | Solar Heat Gain Coefficient |
| HVAC | Heating, Ventilation, and Air Conditioning |
| TMY | Typical Meteorological Year |
| IDF | Input Data File |
| GBDT | Gradient Boosting Decision Tree |
| EUI | Energy Use Intensity |
| R2 | Coefficient of Determination |
| RMSE | Root Mean Square Error |
| MAE | Mean Absolute Error |
| MAPE | Mean Absolute Percentage Error |
References
- Pauliuk, S.; Carrer, F.; Heeren, N.; Hertwich, E.G. Scenario analysis of supply- and demand-side solutions for circular economy and climate change mitigation in the global building sector. J. Ind. Ecol. 2024, 28, 1699–1715. [Google Scholar] [CrossRef] [Scilit]
- Cai, W.; Yu, Y.; Liu, Y. Research Report on Carbon Emissions in Urban and Rural Construction in China (2024). Constr. Archit. 2025, 2, 56–63. [Google Scholar]
- Jiang, L.; Ding, B.; Zhou, X.; Hu, X.; Shi, P. Household energy consumption and carbon emissions in Xining on Qinghai Plateau. Sci. Geogr. Sin. 2023, 43, 119–129. [Google Scholar] [CrossRef]
- Zhang, S.; Yang, L.; Suonam, B.; Dong, H.; Liu, Y. Method for dynamic thermal insulation design revealing almost real heat transfer characteristics of building envelopes in different Chinese regions. Energy Build. 2022, 274, 112419. [Google Scholar] [CrossRef] [Scilit]
- Yang, L.; Ye, Y.Y.; Qiao, Y.H.; Feng, H.L.; Wang, J.D.; Dou, M.; Wu, Y.W.; Cao, Q.M.; Liu, Y. Thermal performance of south-facing envelopes in solar enrichment zone of Qinghai-Tibet plateau: Field measurements of multiple dwellings in winter and transition seasons. Renew. Energy 2024, 237, 121869. [Google Scholar] [CrossRef] [Scilit]
- Hou, C.P.; Hu, W.T.; Jiang, Y.F.; Gao, W.J. Optimization and Renovation Design of Indoor Thermal Environment in Traditional Houses in Northeast Sichuan (China)-A Case Study of a Three-Section Courtyard House. Sustainability 2024, 16, 2921. [Google Scholar] [CrossRef] [Scilit]
- Li, L.; Zhou, J.R. Application research of solar heating technology in rural buildings in Western Sichuan Plateau. Energy Rep. 2022, 8, 295–306. [Google Scholar] [CrossRef] [Scilit]
- Zhang, Y.; Wang, B. Study on indoor thermal environment and energy consumption of traditional dwellings of ethnic minorities in Sichuan plateau. Sci. Rep. 2025, 15, 14872. [Google Scholar] [CrossRef] [Scilit]
- Song, Y.Y.; Cui, T.; Wang, Y.J. A Review and Evaluation of Building Energy Efficiency Research Based on Forms Design. J. Eng. Sdudies 2023, 15, 104–115. [Google Scholar] [CrossRef] [Scilit]
- Latha, H.; Patil, S.; Kini, P.G. Influence of architectural space layout and building perimeter on the energy performance of buildings: A systematic literature review. Int. J. Energy Environ. Eng. 2023, 14, 431–474. [Google Scholar] [CrossRef] [Scilit]
- Vera-Piazzini, O.; Scarpa, M. Building energy model calibration: A review of the state of the art in approaches, methods, and tools. J. Build. Eng. 2024, 86, 108287. [Google Scholar] [CrossRef] [Scilit]
- Crawley, D.B.; Lawrie, L.K.; Winkelmann, F.C.; Buhl, W.F.; Huang, Y.J.; Pedersen, C.O.; Strand, R.K.; Liesen, R.J.; Fisher, D.E.; Witte, M.J.; et al. EnergyPlus: Creating a new-generation building energy simulation program. Energy Build. 2001, 33, 319–331. [Google Scholar] [CrossRef] [Scilit]
- Roka, R.; Figueiredo, A.; Vieira, A.; Cardoso, C. A Systematic Review of Sensitivity Analysis in Building Energy Modeling: Key Factors Influencing Building Thermal Energy Performance. Energies 2025, 18, 2375. [Google Scholar] [CrossRef] [Scilit]
- Edwards, R.E.; New, J.; Parker, L.E.; Cui, B.; Dong, J. Constructing large scale surrogate models from big data and artificial intelligence. Appl. Energy 2017, 202, 685–699. [Google Scholar] [CrossRef] [Scilit]
- Zhang, L.; Wen, J.; Li, Y.; Chen, J.; Ye, Y.; Fu, Y.; Livingood, W. A review of machine learning in building load prediction. Appl. Energy 2021, 285, 116452. [Google Scholar] [CrossRef] [Scilit]
- Bourdeau, M.; Zhai, X.Q.; Nefzaoui, E.; Guo, X.F.; Chatellier, P. Modeling and forecasting building energy consumption: A review of data-driven techniques. Sustain. Cities Soc. 2019, 48, 101533. [Google Scholar] [CrossRef] [Scilit]
- Ji, J.S.; Yu, H.; Wang, X.D.; Xu, X.X. Machine learning application in building energy consumption prediction: A comprehensive review. J. Build. Eng. 2025, 104, 112295. [Google Scholar] [CrossRef] [Scilit]
- Tang, Z.Y.; Chen, J.Y.; Cheng, J.Y. Benchmarking Automated Machine Learning for Building Energy Performance Prediction: A Comparative Study with SHAP-Based Interpretability. Buildings 2026, 16, 185. [Google Scholar] [CrossRef] [Scilit]
- Fan, C.; Xiao, F.; Yan, C.C.; Liu, C.L.; Li, Z.D.; Wang, J.Y. A novel methodology to explain and evaluate data-driven building energy performance models based on interpretable machine learning. Appl. Energy 2019, 235, 1551–1560. [Google Scholar] [CrossRef] [Scilit]
- Chen, T.; Guestrin, C. XGBoost: A Scalable Tree Boosting System. In Proceedings of the 22nd ACM SIGKDD International Conference on Knowledge Discovery and Data Mining, San Francisco, CA, USA, 13–17 August 2016; pp. 785–794. [Google Scholar]
- Lundberg, S.M.; Lee, S.-I. A unified approach to interpreting model predictions. In Proceedings of the 31st International Conference on Neural Information Processing Systems, Long Beach, CA, USA, 4–9 December 2017; pp. 4768–4777. [Google Scholar]
- Depecker, P.; Menezo, C.; Virgone, J.; Lepers, S. Design of buildings shape and energetic consumption. Build. Environ. 2001, 36, 627–635. [Google Scholar] [CrossRef] [Scilit]
- Ma, R.; Ma, R.; Long, E. Analysis of the rule of window-to-wall ratio on energy demand of residential buildings in different locations in China. Heliyon 2023, 9, e12803. [Google Scholar] [CrossRef] [Scilit]
- Troup, L.; Phillips, R.; Eckelman, M.J.; Fannon, D. Effect of window-to-wall ratio on measured energy consumption in US office buildings. Energy Build. 2019, 203, 109434. [Google Scholar] [CrossRef] [Scilit]
- Salami, B.A.; Abba, S.I.; Adewumi, A.A.; Dodo, U.A.; Otukogbe, G.K.; Oyedele, L.O. Building energy loads prediction using bayesian-based metaheuristic optimized-explainable tree-based model. Case Stud. Constr. Mater. 2023, 19, e02676. [Google Scholar] [CrossRef] [Scilit]
- Kangalli Uyar, S.G.; Ozbay, B.K.; Dal, B. Interpretable building energy performance prediction using XGBoost Quantile Regression. Energy Build. 2025, 340, 115815. [Google Scholar] [CrossRef] [Scilit]

Disclaimer/Publisher’s Note: The statements, opinions and data contained in all publications are solely those of the individual author(s) and contributor(s) and not of MDPI and/or the editor(s). MDPI and/or the editor(s) disclaim responsibility for any injury to people or property resulting from any ideas, methods, instructions or products referred to in the content. |
© 2026 by the authors. Licensee MDPI, Basel, Switzerland. This article is an open access article distributed under the terms and conditions of the Creative Commons Attribution (CC BY) license.