


Abstract
Pitched-roof attics are common in Chinese rural dwellings, but how their comfort and energy benefits vary with roof insulation remains to be quantified. This study used an EnergyPlus model of a traditional U-shaped dwelling in Hanzhong to compare paired Attic and No-attic configurations at roof U-values of 2.7, 1.5, 1.0, 0.6, and 0.3 W/(m2·K). Free-running simulations evaluated the annual percentage of comfortable hours (PCH), hourly indoor temperatures, and attic daily temperature range (DTR) attenuation; conditioned simulations evaluated equivalent electricity consumption for heating and cooling. Attic achieved higher annual PCH and lower heating and cooling consumption in all scenarios. As U-value decreased from 2.7 to 0.3 W/(m2·K), the PCH increment decreased from 1.632 to 0.160 percentage points and the combined energy-saving rate from 19.55% to 11.26%, whereas attic DTR attenuation increased from −18.95% to 61.14%. Stronger insulation narrowed bedroom temperature differences, but Attic had a peak temperature approximately 0.460 °C higher in bedroom A during the hottest week at U = 0.3 W/(m2·K). Roof insulation thus improved overall performance while reducing the annual incremental benefits of the Attic configuration. Reduced attic temperature fluctuations did not necessarily coincide with lower local summer peaks. Roof insulation and attic configuration should be designed jointly to balance annual comfort, energy use, and extreme temperatures.
1. Introduction
Rural dwellings experience seasonal thermal challenges shaped by climate, construction and patterns of use. Limited or intermittent conditioning makes both thermal comfort and heating and cooling energy demand relevant to their evaluation [1,2]. Field investigations in inland and coastal cold regions document indoor discomfort and show that heating may remain concentrated in selected rooms [3,4]. Research in southwest and northwest China links indoor conditions to envelope properties, solar exposure and residents’ use of their dwellings [5,6]. Vernacular studies in Anhui and the hot-summer and cold-winter region identify the combined contribution of enclosure construction, shading and ventilation to indoor thermal performance [7,8]. Residential passive-design research likewise identifies envelope properties, including those of the roof, as determinants of indoor temperature and cooling demand [9]. For low-rise rural dwellings, pitched roofs form an extensive boundary exposed to solar radiation and outdoor weather. Their connection to occupied rooms depends on the intervening construction and spaces, including ceilings and attics. Southern Shaanxi studies connect regional dwelling form and enclosure characteristics with energy performance [10,11], while year-long and seasonal investigations in other regions document variation in indoor conditions and comfort [12,13,14]. These findings make roof and attic arrangements relevant to passive thermal design. Understanding their contribution requires attention to the roof assembly as well as the spatial connection between the exposed roof and rooms beneath it.
A pitched-roof attic changes that connection by introducing a ceiling and an intermediate thermal space. Experimental and numerical studies show that its airflow and heat transfer depend on roof geometry, ventilation, ceiling insulation and external boundary conditions. Analyses of triangular attic spaces describe responses to transient cooling and periodic temperature forcing [15,16]. Research on sealed and vented gable-roof attics connects roof pitch and ventilation to heating loads and transient temperature patterns [17,18]. Winter and summer studies further demonstrate the joint influence of ventilation and ceiling insulation [19,20], with ventilation arrangements affecting the resulting response [21]. Experimental roof comparisons also show that insulation position and assembly arrangement affect attic and ceiling temperatures [22]. These studies examine different constructions and operating conditions, so their reported effects belong to the roof systems investigated. The attic is a thermally active space whose behavior depends on its boundaries, rather than an air layer with a fixed insulating effect. In southern Shaanxi, Xu et al. directly compared dwellings with and without attic space [23]. Their findings on seasonal temperature stability, comfort duration and energy performance provide evidence concerning attic presence in a relevant rural context. Regional research on corridor transition spaces separately links intermediate spatial arrangements to indoor conditions [24]. Together, these studies place attic behavior within the coupled roof, intermediate space and occupied-room system, where both spatial configuration and construction specification matter.
Roof insulation changes the thermal transmittance governing this system and the boundary through which attic effects operate. Rural-house simulations in Chongqing and studies of traditional timber and slate dwellings link roof thermal properties to seasonal indoor conditions and energy use [25,26,27]. Research on passive-design parameters in traditional dwellings and envelope sensitivity analysis in cold-region rural dwellings further connect performance to construction specification [28,29]. Roof U-value describes roof thermal transmittance, providing a common parameter for evaluating different insulation levels. However, the response to that parameter is realized within a particular assembly, including the location of insulation and its relation to the attic and ceiling. Studies of highly insulated roofs and attic-related measures show that roof-system performance depends on insulation level, solar exposure and assembly conditions [30,31,32]. Research on reflective insulation similarly demonstrates construction-dependent seasonal behavior [33]. Such evidence concerns changes within particular roof systems or the addition of particular measures. It establishes that insulation influences roof performance, but retaining or removing an attic also changes the connection between the roof and occupied rooms.
Existing studies have examined attic thermal behavior, ventilation, insulation and roof-system performance. Roof-configuration modeling and experimental comparisons address attic temperatures and cooling loads [34,35], while vernacular-dwelling research considers attic form alongside other envelope and spatial parameters [36]. Studies varying roof pitch and ceiling insulation demonstrate interactions between geometry and thermal specification within naturally ventilated attics [37]. The incremental effects of attic configuration on annual comfort, heating and cooling energy use, and dynamic temperatures across roof U-values still require systematic quantification under matched building conditions. Addressing this issue requires comparing Attic and No-attic at the same roof U-value, distinguishing attic presence from the improvement caused by stronger insulation in both configurations. Whether stronger attic-space buffering corresponds to a greater annual comfort and energy benefit also remains unclear.
The present study examines a representative U-shaped rural dwelling in Donghan Village, Hanzhong, China. An EnergyPlus model assessed against short-period measured indoor temperatures was used to evaluate paired Attic and No-attic configurations at five roof U-values under annual free-running and conditioned modes. The study evaluates how attic presence affects thermal comfort and heating and cooling energy demand, how its incremental benefit changes with roof insulation, and how the associated dynamic temperature responses vary in the attic and occupied spaces. By comparing matched Attic and No-attic configurations across the same roof U-value sequence, the analysis distinguishes the contribution of attic configuration from the improvement produced by roof insulation itself, providing a basis for considering these two passive-design parameters jointly.
2. Methodology
2.1. Study Area and Case-Study Dwelling
The study area is located in Hanzhong City, Shaanxi Province, China. Hanzhong belongs to the hot-summer and cold-winter climate region according to the thermal design classification for civil buildings in China [38]. The local climate is characterized by hot and humid summers and cool to cold winters, making both summer heat protection and winter thermal insulation relevant to rural dwelling design. A field survey was conducted in Donghan Village, Yangxian County, Hanzhong City, Shaanxi Province, China (33.177° N, 107.431° E).
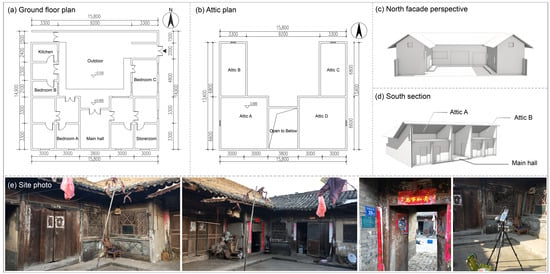
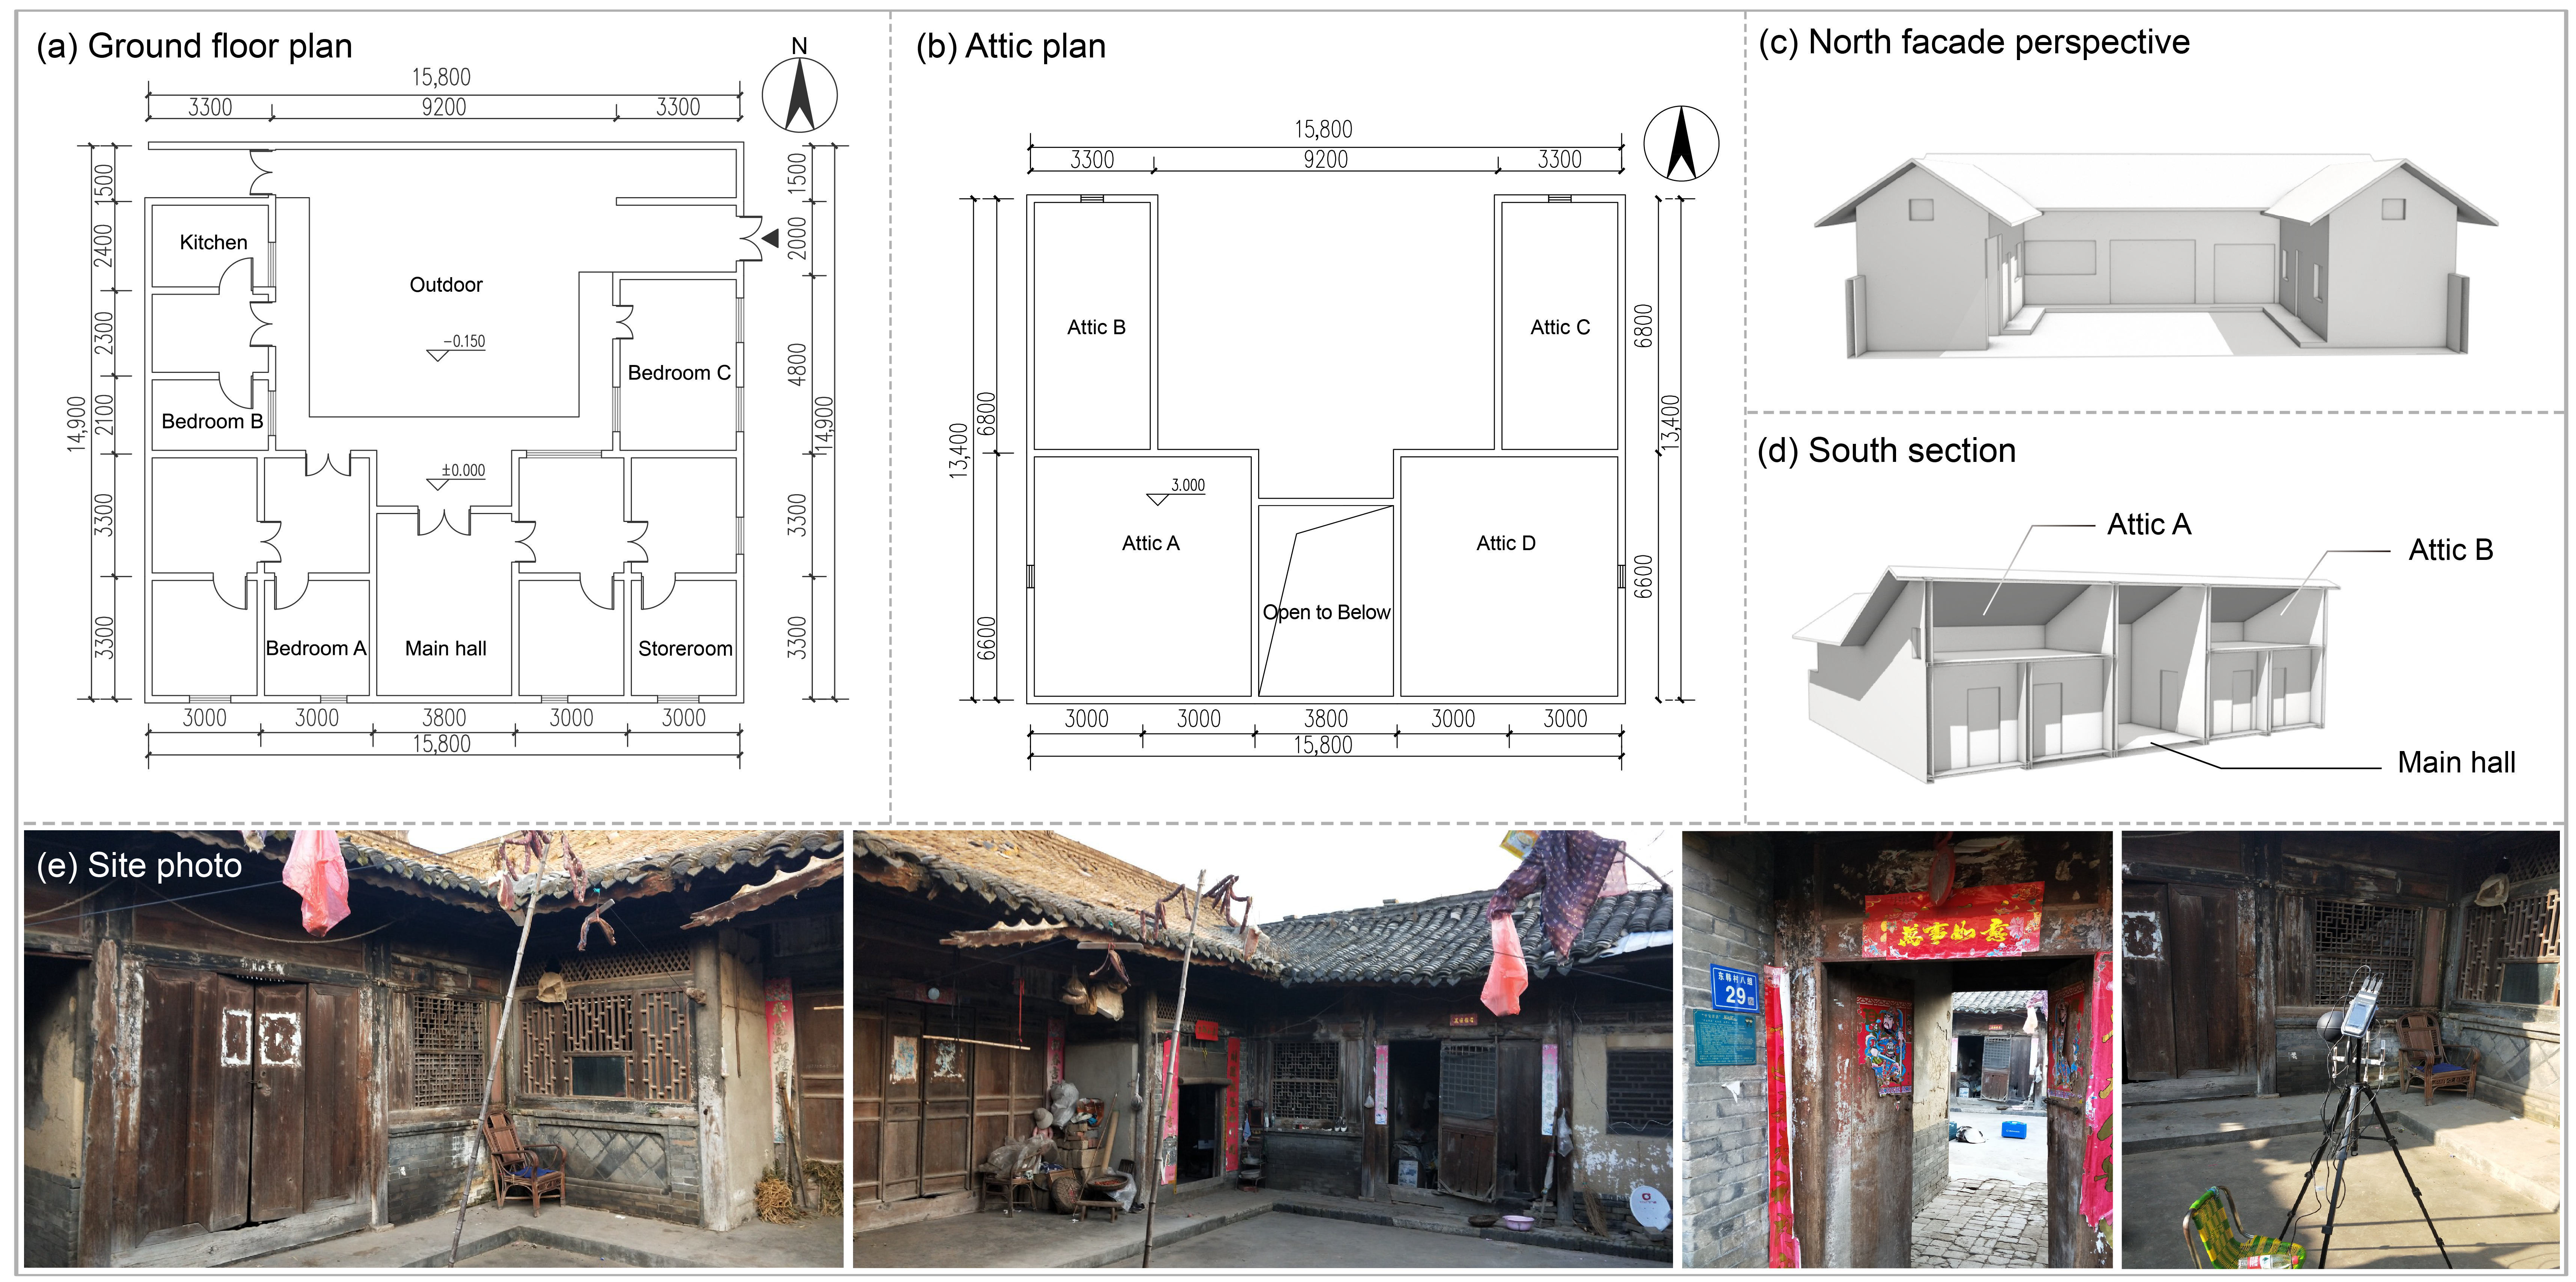
The layout and spatial configuration of the dwelling are shown in Figure 1. The southern main building is slightly higher than the two side wings. The ground floor comprises three bedrooms (Bedroom A: main bedroom; Bedroom B: west bedroom; Bedroom C: east bedroom), a kitchen, a storage room, and a central double-height Main hall that currently serves primarily as a living room. Attic A covers Bedroom A and the adjacent enclosed space; Attic B covers Bedroom B, the kitchen, and other western spaces; Attic C lies above Bedroom C; and Attic D covers the southern enclosed spaces on the east side, including the Storage room. The Main hall remains double-height. For the temperature-agreement check, indoor air temperature was monitored in Bedroom A, together with the corresponding outdoor environmental conditions.
Figure 1.
Architectural configuration of the case-study dwelling: (a) Ground-floor plan; (b) Attic plan; (c) North façade perspective; (d) Southern section; (e) Site photograph.
2.2. Model Development and Simulation Scenarios
2.2.1. Case Study Model Development and Temperature-Agreement Assessment
The parametric model was built in Rhinoceros 8 (SR10) with Grasshopper 1.0.0008, using Ladybug and Honeybee (Ladybug Tools for Grasshopper, version 1.9.19). The energy simulations were performed using EnergyPlus 24.2.0 through OpenStudio 3.9.0. Based on the field survey, the model included the building layout, orientation, thermal zones, pitched roof, attic, and main envelope components. The annual comparative simulations used the typical meteorological year (TMY) weather file for Hanzhong, China (CHN_Shaanxi.Hanzhong.571270_CSWD), obtained from the EnergyPlus weather database (https://energyplus.net/weather (accessed on 15 September 2026)).
During monitoring, the building was unoccupied, the windows were closed, and the heating, ventilation, and air-conditioning (HVAC), lighting, equipment, and domestic hot-water systems were inactive. The model used the same conditions for the monitoring-period temperature-agreement check. Simulated indoor air temperature in Bedroom A was compared with measurements during 6–7 July 2023 (summer) and 26–27 January 2024 (winter), using 25 paired observations for each period. Envelope properties are listed in Table 1.
Table 1.
Envelope construction and thermal properties of the model used for the temperature-agreement check.
Monitoring used AZ 8829 temperature and relative-humidity loggers (AZ Instrument Corp., Taichung, Taiwan; ±0.6 °C and ±3% RH), a Testo 425 anemometer (Testo SE & Co. KGaA, Titisee-Neustadt, Germany), and a JTR04 globe thermometer (Beijing JANTYTECH Technology Co., Ltd., Beijing, China; air-temperature accuracy ±0.5 °C). Measurement points were approximately 1.5 m above the floor. Data were recorded every 10 min, with measures taken to avoid direct solar exposure.
The monitoring-period weather file was based on the Hanzhong TMY EPW. Outdoor air temperature, relative humidity, and wind speed for the monitoring periods were replaced with measured values; other variables were retained from the original file. Simulated and measured Bedroom A air temperatures were compared at corresponding hourly time steps.
Model agreement was evaluated using Willmott’s index of agreement, a dimensionless measure ranging from 0 to 1, with values closer to 1 indicating closer agreement between simulated and observed data. The index was calculated using Equation (1).
where Pi is the simulated value at time step i, Oi is the corresponding observed value, is the mean of the observed values, and n is the number of paired observations.
Following the error-statistics approach of ASHRAE Guideline 14 [39], mean bias error (MBE), mean absolute error (MAE), root mean square error (RMSE), and the coefficient of variation of RMSE (CV(RMSE)) were used alongside Willmott’s index of agreement (d) in Equation (1) to assess indoor-temperature agreement during the selected monitoring periods.
MBE is the mean simulated-minus-measured bias. MBE, MAE, and RMSE are expressed in °C, and d is dimensionless. CV(RMSE) was normalized by the mean measured Celsius temperature (25.292 °C in summer and 4.602 °C in winter), with n = 25 per season. The corresponding validation statistics are presented in Table 2.
Table 2.
Indoor-temperature agreement statistics for Bedroom A.
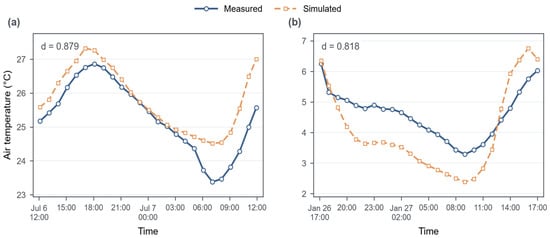
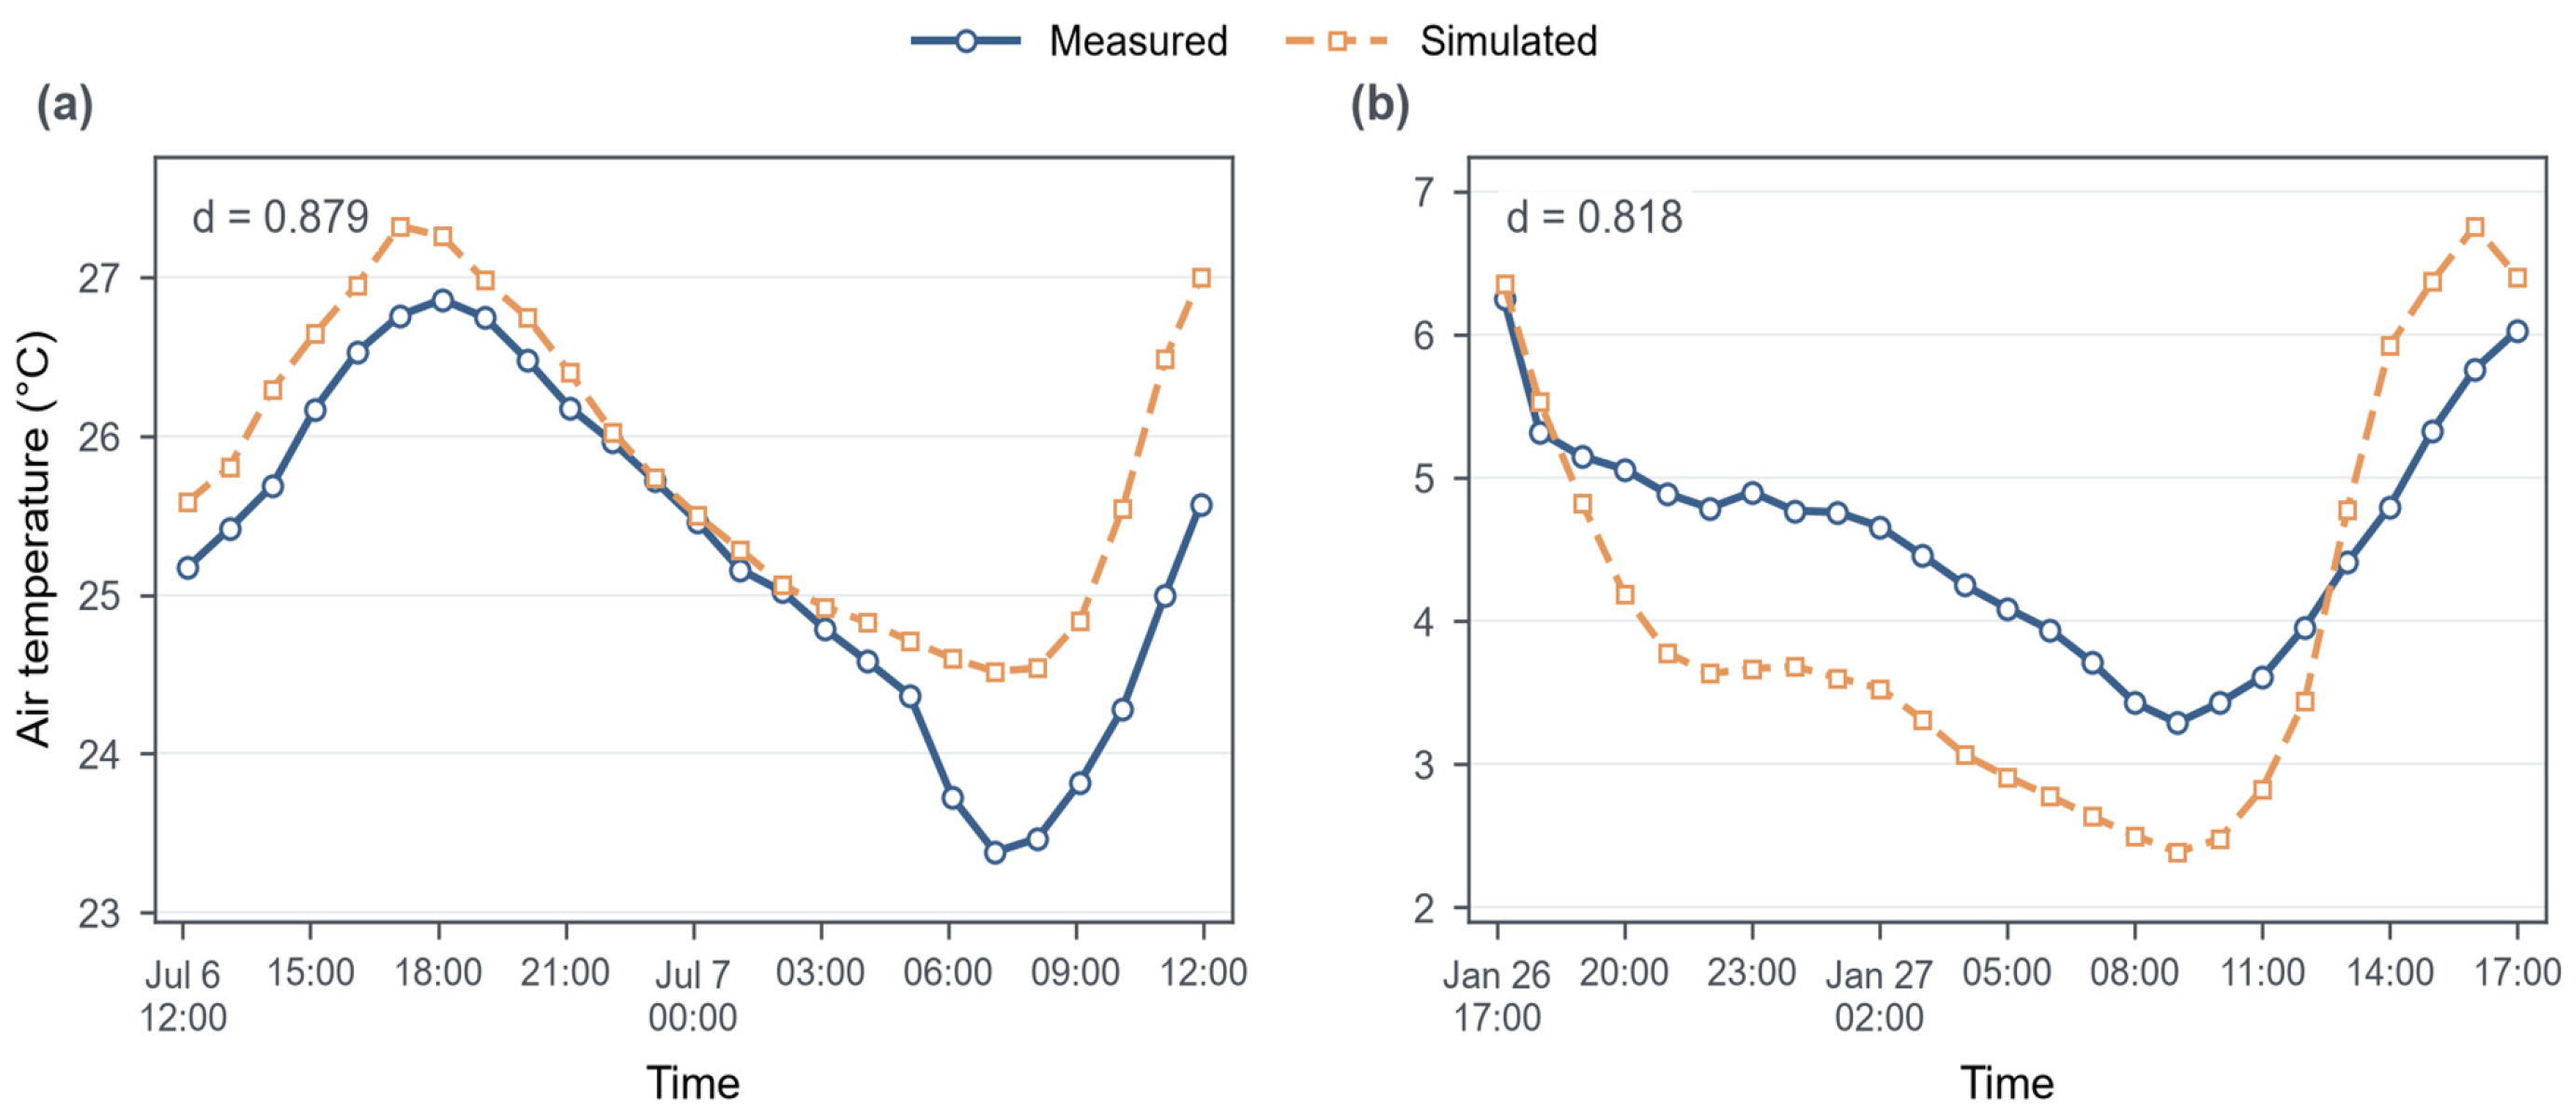
Summer and winter RMSE values were 0.694 and 0.948 °C, respectively, and Willmott’s d values were 0.879 and 0.818, indicating good agreement with indoor-temperature variations during the selected monitoring periods. MBE indicated an overall warm bias in summer and a cold bias in winter. The measured and simulated series are shown in Figure 2.
Figure 2.
Measured and simulated Bedroom A air temperatures: (a) Summer; (b) Winter.
2.2.2. Attic Configurations and Simulation Scenarios
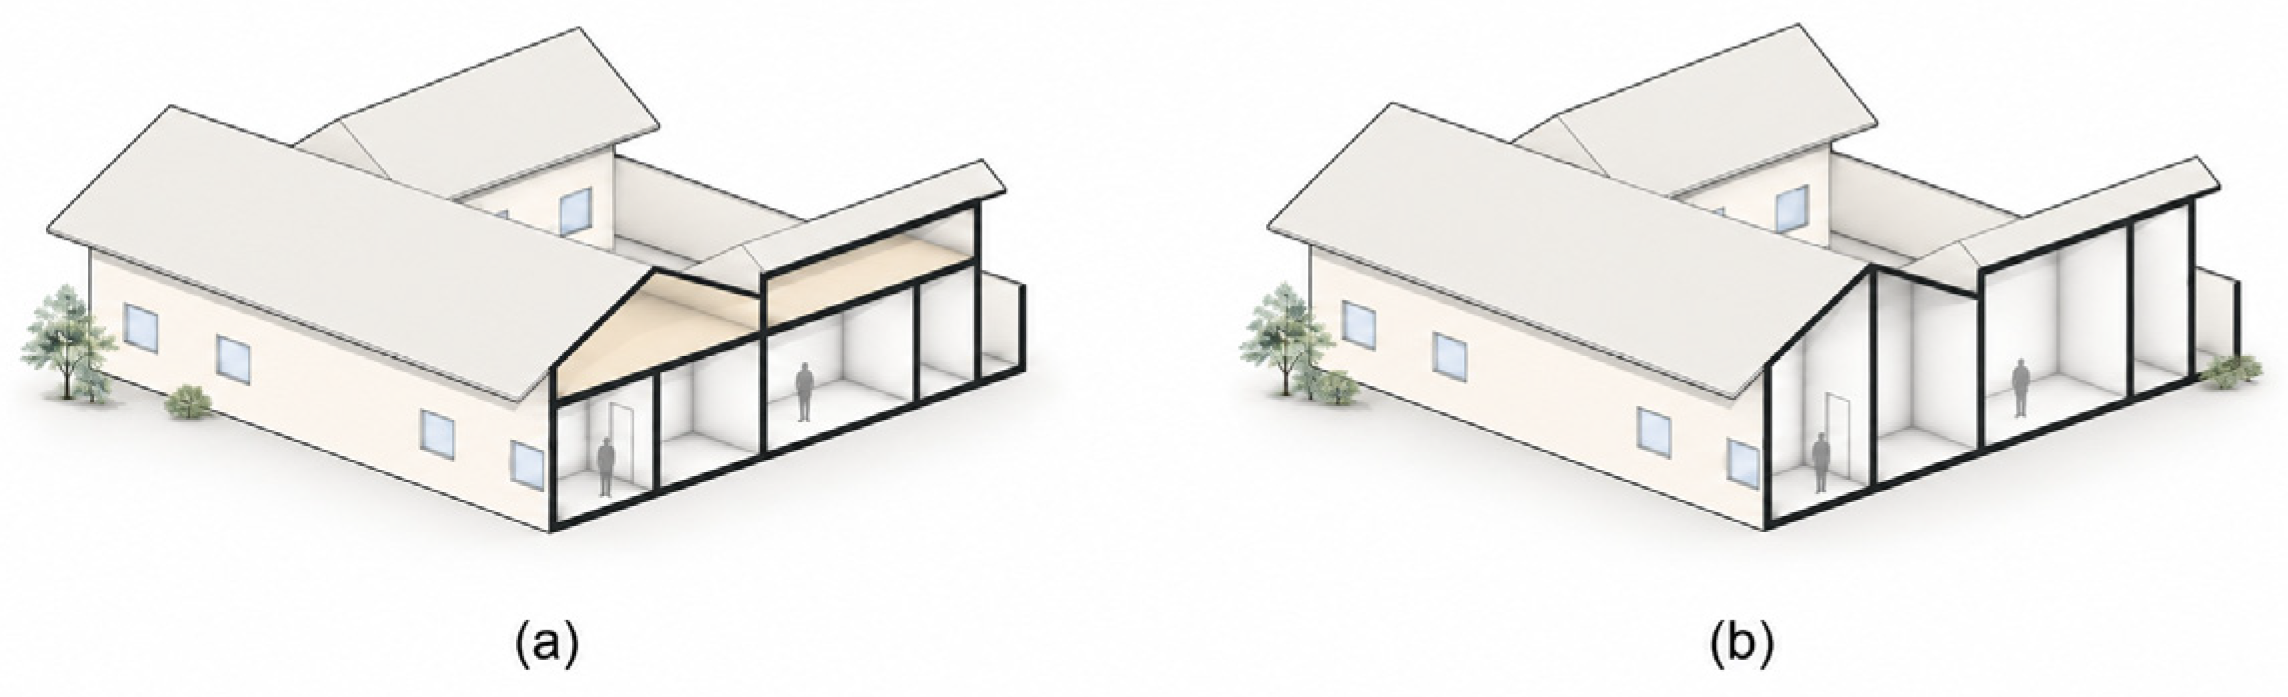
In the Attic configuration, ceilings were retained above the enclosed rooms, forming attic spaces between the ceilings and the pitched roof. In the No-attic configuration, all of these ceilings were removed, allowing the corresponding indoor spaces to extend directly to the pitched roof. The Main hall, which was already double-height and had no attic above it, remained unchanged in both configurations. All other building parameters and operating conditions were kept the same. The two configurations are shown in Figure 3.
Figure 3.
Comparison of the paired (a) Attic and (b) No-attic configurations.
The conditioned floor area is 57.75 m2 in both configurations, whereas conditioned volumes are 215.89 m3 for Attic and 265.73 m3 for No-attic. Roof geometry is the same in both configurations, with approximately 161.90 m2 of sloping external heat-transfer roof surfaces in the whole-building thermal model, excluding separate eave shading surfaces. Of this area, 38.37 m2 corresponds to the roofs above the three bedrooms. Attic retains 32.67 m2 of ceilings above these bedrooms, whereas No-attic removes them; the Main hall remains double-height in both configurations.
Roof U-values of 2.7, 1.5, 1.0, 0.6, and 0.3 W/(m2·K) were implemented using equivalent thermal-resistance constructions with Material:NoMass. With a combined surface resistance of 0.15 m2·K/W, the material resistance was calculated as R = 1/U − 0.15 (Table S1). The ceiling U-value was fixed at 2.22 W/(m2·K), corresponding to an equivalent material resistance of 0.300450 m2·K/W. Model 1 was run without HVAC to evaluate thermal comfort and indoor-temperature responses. In Model 2, only Bedrooms A, B, and C and the Main hall used Ideal Loads for continuous year-round temperature control, with heating and cooling setpoints of 18 °C and 26 °C, respectively, following JGJ 134–2010 [40]. Occupancy followed Table 3. In total, 20 annual simulations were conducted: 2 configurations × 5 roof U-values × 2 models.
Table 3.
Occupancy and equipment schedules.
Table 1 lists the surveyed physical constructions. The parametric simulations used equivalent thermal-resistance constructions; NoMass defines neither a physical insulation-layer position nor heat capacity. Indoor thermal zones used the Well-Mixed air model, with hourly air-temperature outputs for subsequent analysis.
GB 55015-2021 specifies a roof U-value limit of 0.40 W/(m2·K) for residential buildings in hot-summer and cold-winter subregions A and B [41]; 0.3 W/(m2·K) was selected as the high-insulation endpoint of this study.
The analysis focused on four main occupied spaces: Bedroom A, Bedroom B, Bedroom C, and the Main hall. Occupancy, lighting, and equipment schedules were defined according to the typical daily activities of a three-person household, as listed in Table 3. Both models used an air infiltration rate of 0.0003 m3/(s·m2 of exterior surface area) and no mechanical ventilation. The same area-based infiltration intensity was assigned to the modeled rooms and attic zones in both configurations and simulation modes. In the free-running model (Model 1), natural ventilation was enabled in all rooms and attics when indoor air temperature exceeded both 22 °C and outdoor air temperature. The conditioned model (Model 2) had no natural ventilation.
The windows had no blinds or separate shading devices; fixed geometric shading from the eaves and other building elements was retained.
2.3. Performance Metrics and Data Analysis
2.3.1. Thermal Comfort Assessment
Thermal comfort was evaluated using the annual percentage of comfortable hours, PCH (%), calculated separately over all 8760 h for each of the four primary occupied zones and then averaged arithmetically across the zones (Bedroom A, Bedroom B, Bedroom C, and the Main hall), based on the adaptive predicted mean vote (APMV) model (Equations (2)–(4)).
PCHi denotes the percentage of comfortable hours for a specific room i; PMV (predicted mean vote) was calculated using Honeybee; λ is the adaptive coefficient, assigned according to the sign of PMV; t represents the hourly simulation time step; δ(t) is a Boolean comfort function that equals 1 when −1 ≤ APMV(t) ≤ 1, and 0 otherwise.
APMV followed the residential-building method for the hot-summer and cold-winter region in GB/T 50785-2012 [42]: λ = 0.21 for PMV ≥ 0 and λ = −0.49 for PMV < 0, with comfort defined by −1 ≤ APMV ≤ 1.
Metabolic rate and air speed were set to 1.2 met and 0.1 m/s, respectively. Clothing insulation varied between 0.5 and 1.0 clo and was updated according to outdoor temperature at 06:00 each day. Mean radiant temperature and relative humidity were taken from the hourly simulation outputs for each room. The four rooms were equally weighted to characterize the annual building thermal environment.
2.3.2. Energy Demand for Heating and Cooling
Energy demand for heating and cooling (EDHC) was evaluated on an equivalent electricity basis. The annual heating and cooling thermal demands obtained from the Ideal Loads simulations were converted to equivalent electricity consumption using the corresponding coefficients of performance (COPs). EDHC denotes the annual combined equivalent electricity demand (Equation (5)).
EDHC = EH + EC
EC and EH represent annual equivalent electricity consumption for cooling and heating, respectively, in kWh.
The heating and cooling system coefficients of performance were 2.6 and 3.6, respectively, following GB 55015-2021 [41].
At each roof U-value, absolute savings were calculated as No-attic minus Attic electricity consumption. Relative heating, cooling, and combined savings were calculated using Equations (6)–(8):
where the subscripts (A) and (NA) denote the Attic and No-attic configurations, respectively. SH, SC and SHC represent the corresponding energy-saving rates. Positive values indicate lower energy demand for the Attic configuration, whereas negative values indicate increased energy demand relative to the No-attic configuration.
2.3.3. Hourly Temperature Variation and Attic-Zone Thermal Attenuation
Hourly temperature variations were analyzed using the complete 8760 h air-temperature series from Model 1. The Attic and No-attic configurations were compared at matching time steps, with the hourly temperature difference for each occupied zone defined as ΔT = TA − TNA. Positive ΔT indicates that Attic is warmer; negative ΔT indicates that it is cooler. The 5th–95th percentile interval (P5–P95) was used to characterize the central range of the hourly temperature-difference distribution for Bedroom A, Bedroom B, Bedroom C, and the Main hall.
To characterize the thermal attenuation of the attic space, a representative attic temperature was obtained by averaging the hourly air temperatures of the four attic thermal zones. The daily temperature range (DTR) was calculated as the difference between the daily maximum and minimum air temperatures, and the annual mean DTR was determined by averaging the daily values over the year:
where Tmax,d and Tmin,d are the maximum and minimum air temperatures on day (d), respectively; N is the total number of days; and and represent the annual mean daily temperature ranges of the attic space and outdoor environment, respectively. A positive ADTR indicates attenuation of the outdoor daily temperature range within the attic space, whereas a negative value indicates temperature-range amplification.
DTRd = Tmax,d − Tmin,d
DTR attenuation is referenced to outdoor dry-bulb air-temperature DTR: positive values indicate attenuation and negative values amplification. Attic air-temperature fluctuations are also influenced by solar absorption at the roof.
Within the single-year simulation timeline, 359 complete 7-day windows were compared by mean outdoor air temperature. 1–7 January and 25–31 July were selected as the coldest and hottest weeks, respectively. These periods were used to compare the hourly thermal responses of the Attic and No-attic configurations at the two extreme roof U-values of 2.7 and 0.3 W/(m2·K).
3. Results
3.1. Annual Thermal Comfort and Energy Performance
As shown in Figure 4, annual PCH increased steadily in both configurations as the roof U-value decreased from 2.7 to 0.3 W/(m2·K). PCH increased from 46.82% to 49.54% for Attic and from 45.18% to 49.38% for No-attic. At every corresponding U-value, Attic had higher annual PCH than No-attic, indicating better annual thermal comfort.
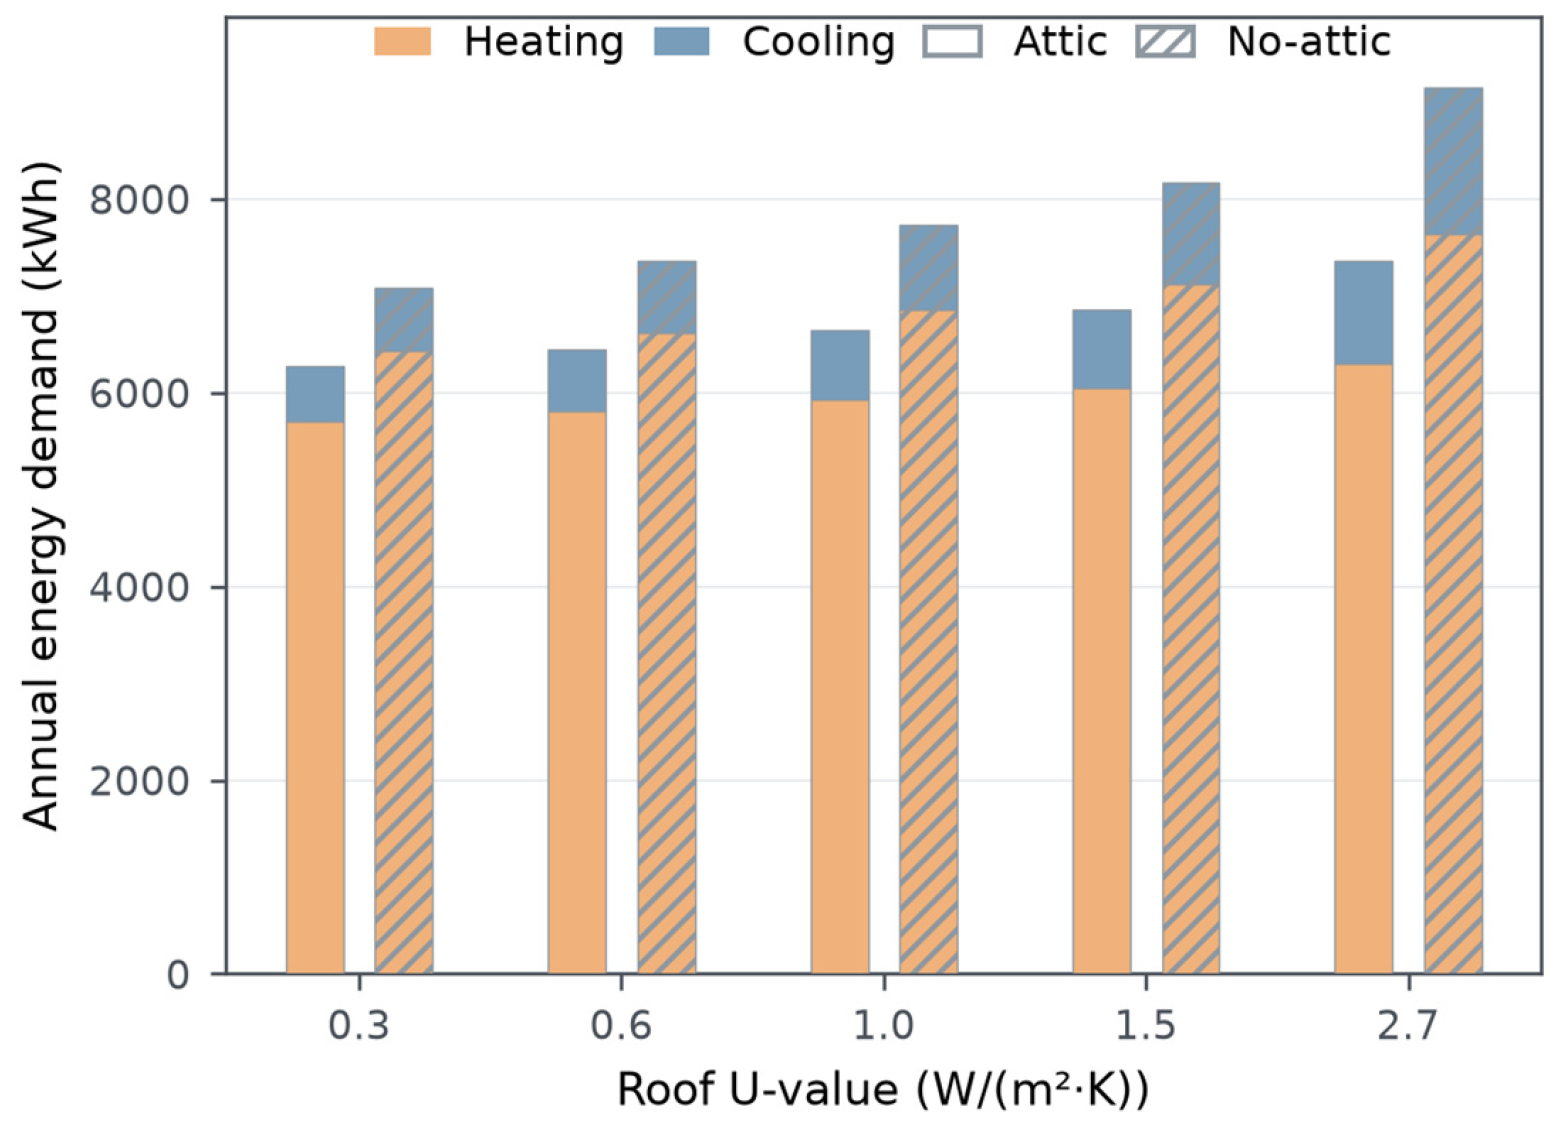
Annual heating and cooling energy demand showed a consistent configuration difference (Figure 5). As U-value decreased, both heating and cooling demand fell, and demand for Attic remained below that for No-attic. At U = 2.7 W/(m2·K), EDHC was 7361.40 kWh for Attic and 9149.76 kWh for No-attic; at U = 0.3 W/(m2·K), the corresponding values were 6279.60 and 7076.05 kWh. Heating accounted for the larger share of EDHC in all scenarios. Table 4 reports the ten scenarios and the absolute and relative savings for each paired comparison.
Table 4.
Annual equivalent electricity consumption and paired savings at five roof U-values.
Figure 4.
Annual mean PCH for Attic and No-attic configurations at five roof U-values.
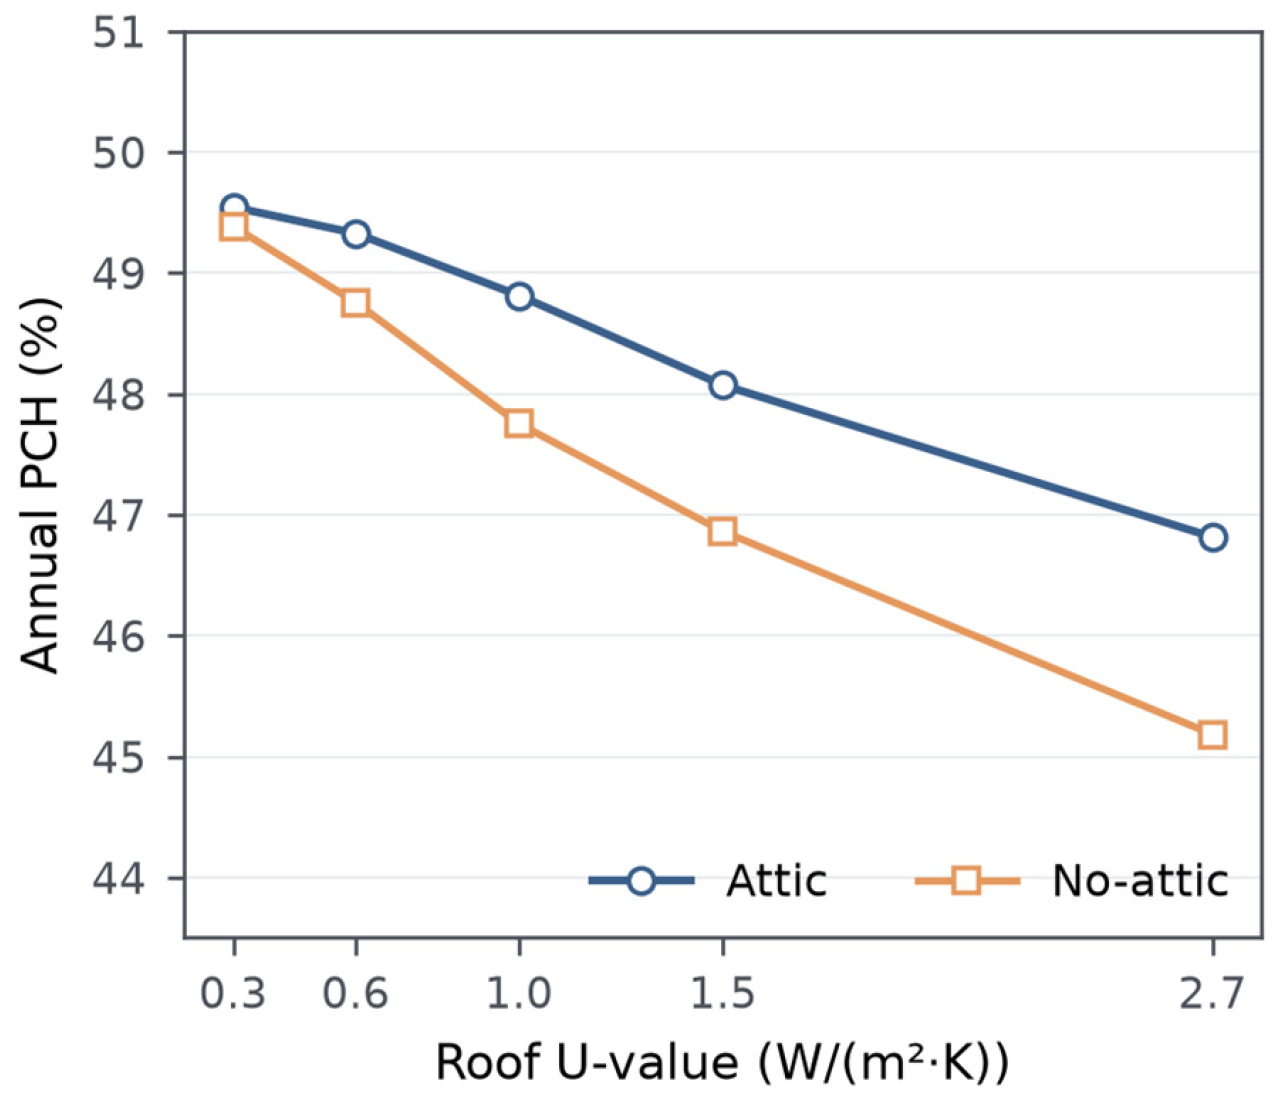
Figure 5.
Annual heating and cooling energy demand for Attic and No-attic configurations at five roof U-values.
3.2. Effect of Roof Insulation on Incremental Attic Benefits
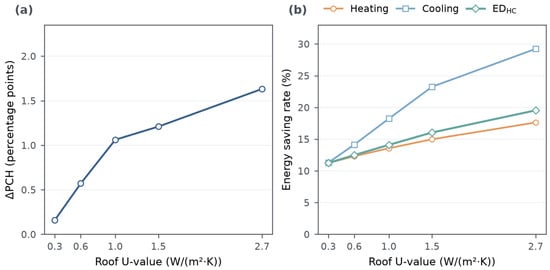
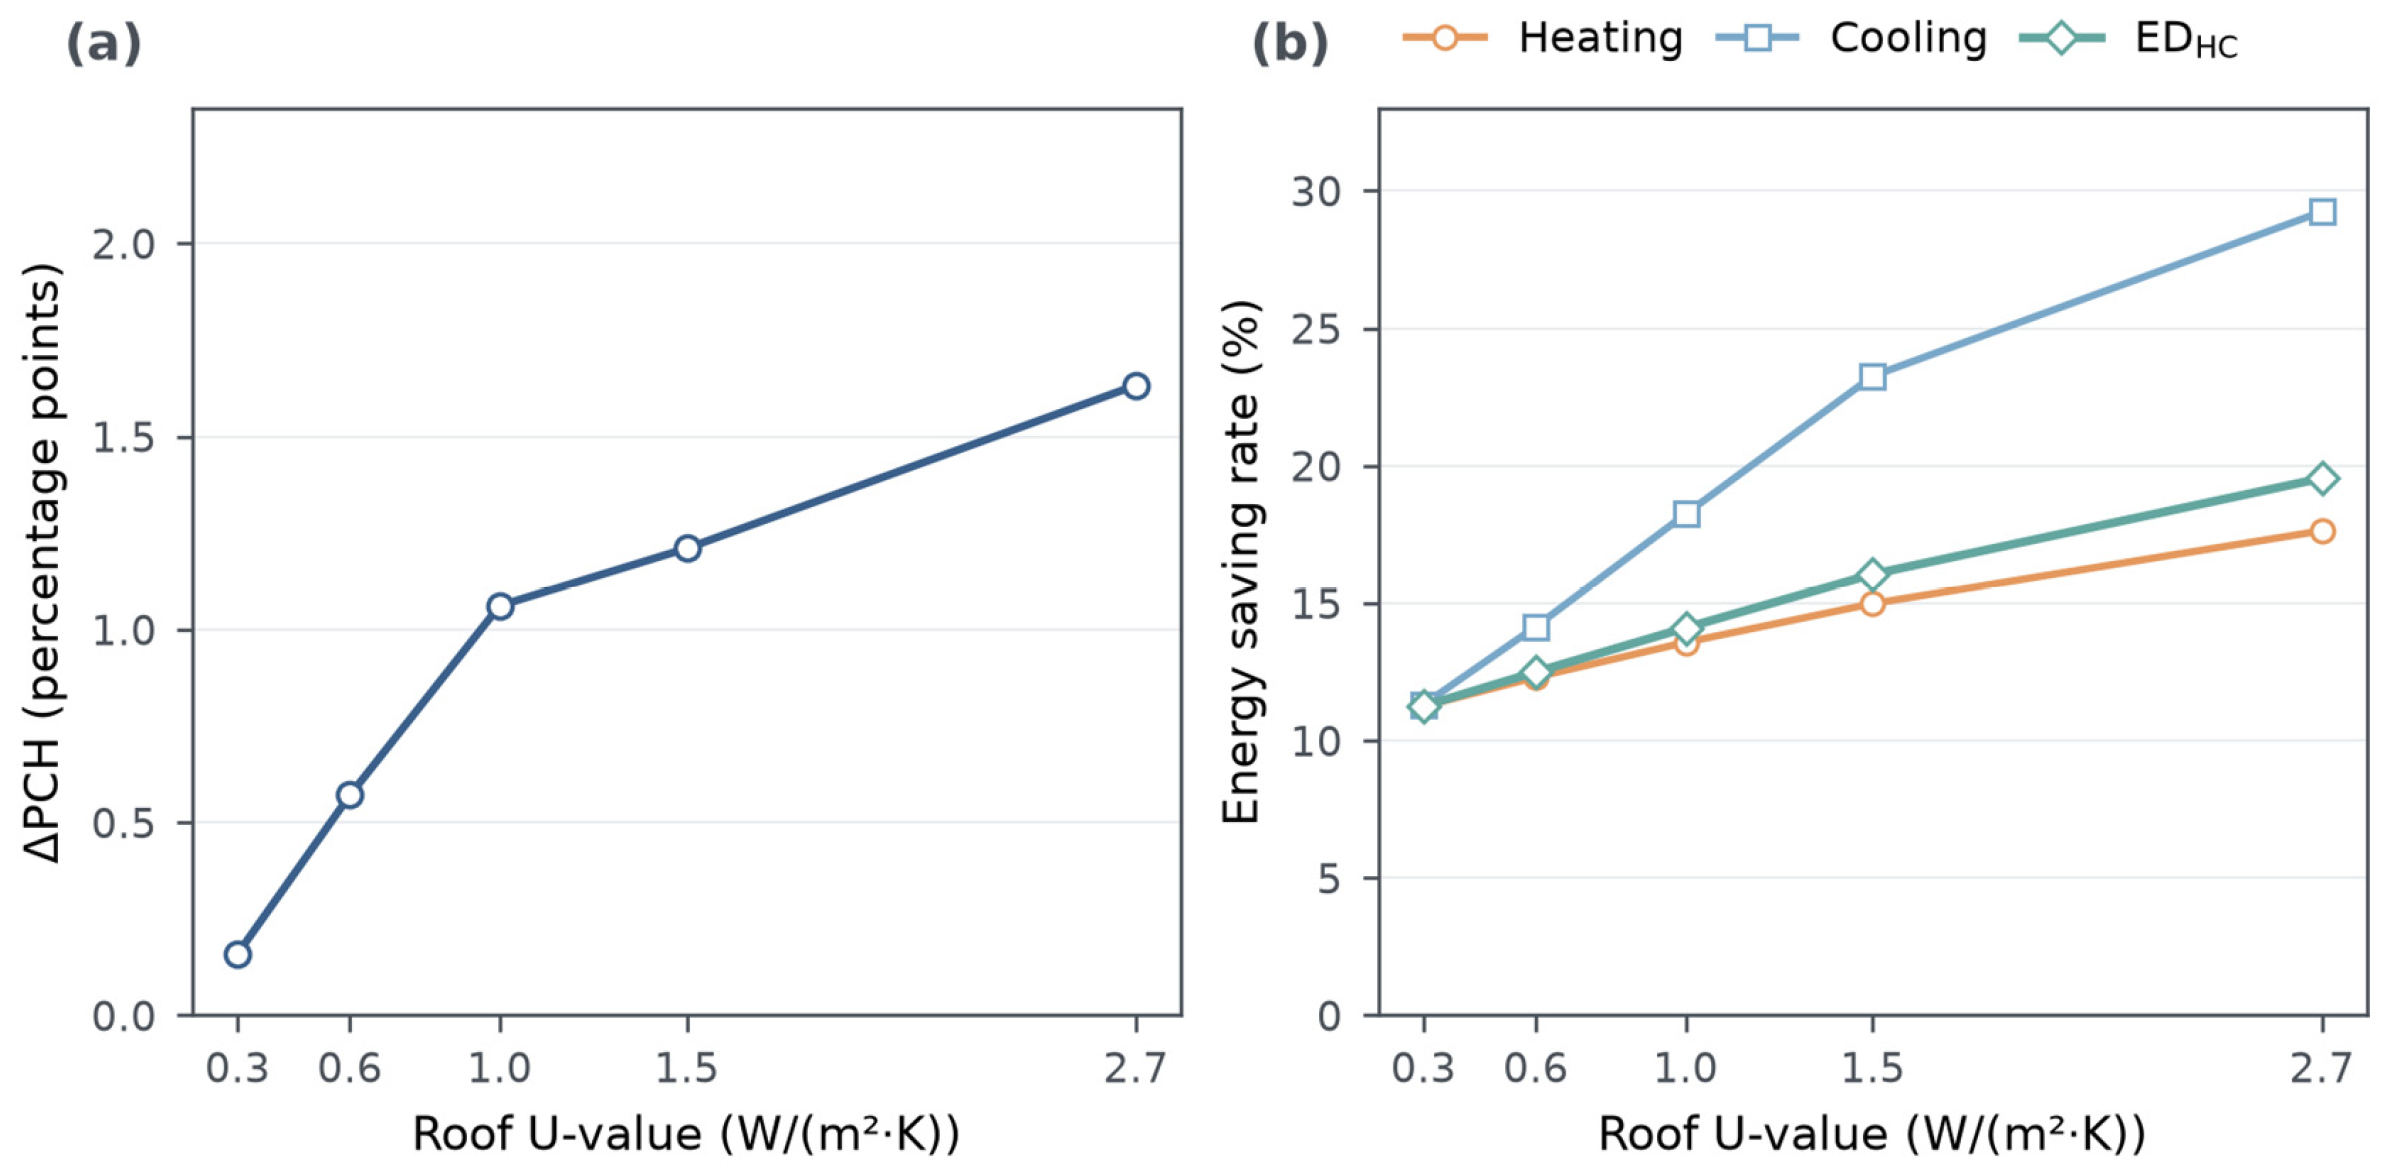
Figure 6a shows the difference in PCH between Attic and No-attic at each U-value. As U-value decreased sequentially from 2.7 to 1.5, 1.0, 0.6, and 0.3 W/(m2·K), ΔPCH declined from 1.632 to 1.210, 1.062, 0.571, and 0.160 pp. ΔPCH remained positive and decreased monotonically, indicating that the incremental comfort benefit of Attic diminished as roof insulation increased.
Figure 6.
Incremental Attic benefits across roof U-values: (a) ΔPCH and (b) Heating, cooling, and EDHC saving rates.
Energy indicators showed the same overall trend (Figure 6b). Heating saving rate decreased from 17.63% to 11.25%, cooling saving rate from 29.24% to 11.31%, and EDHC saving rate from 19.55% to 11.26%. The cooling saving rate decreased by 17.93 pp, the largest reduction, while the heating saving rate decreased by 6.38 pp. At U = 0.3 W/(m2·K), the heating and cooling saving rates differed by only 0.06 pp. Attic’s annual incremental comfort and energy benefits diminished as roof insulation increased, but remained positive throughout the tested range.
3.3. Seasonal and Spatial Response Differences
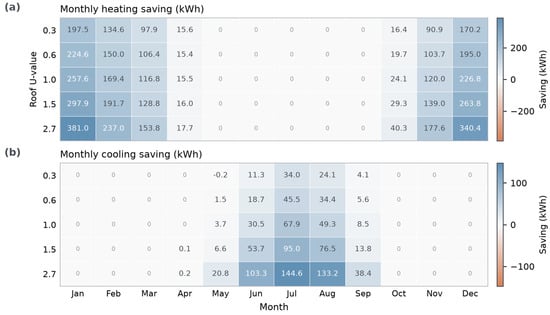
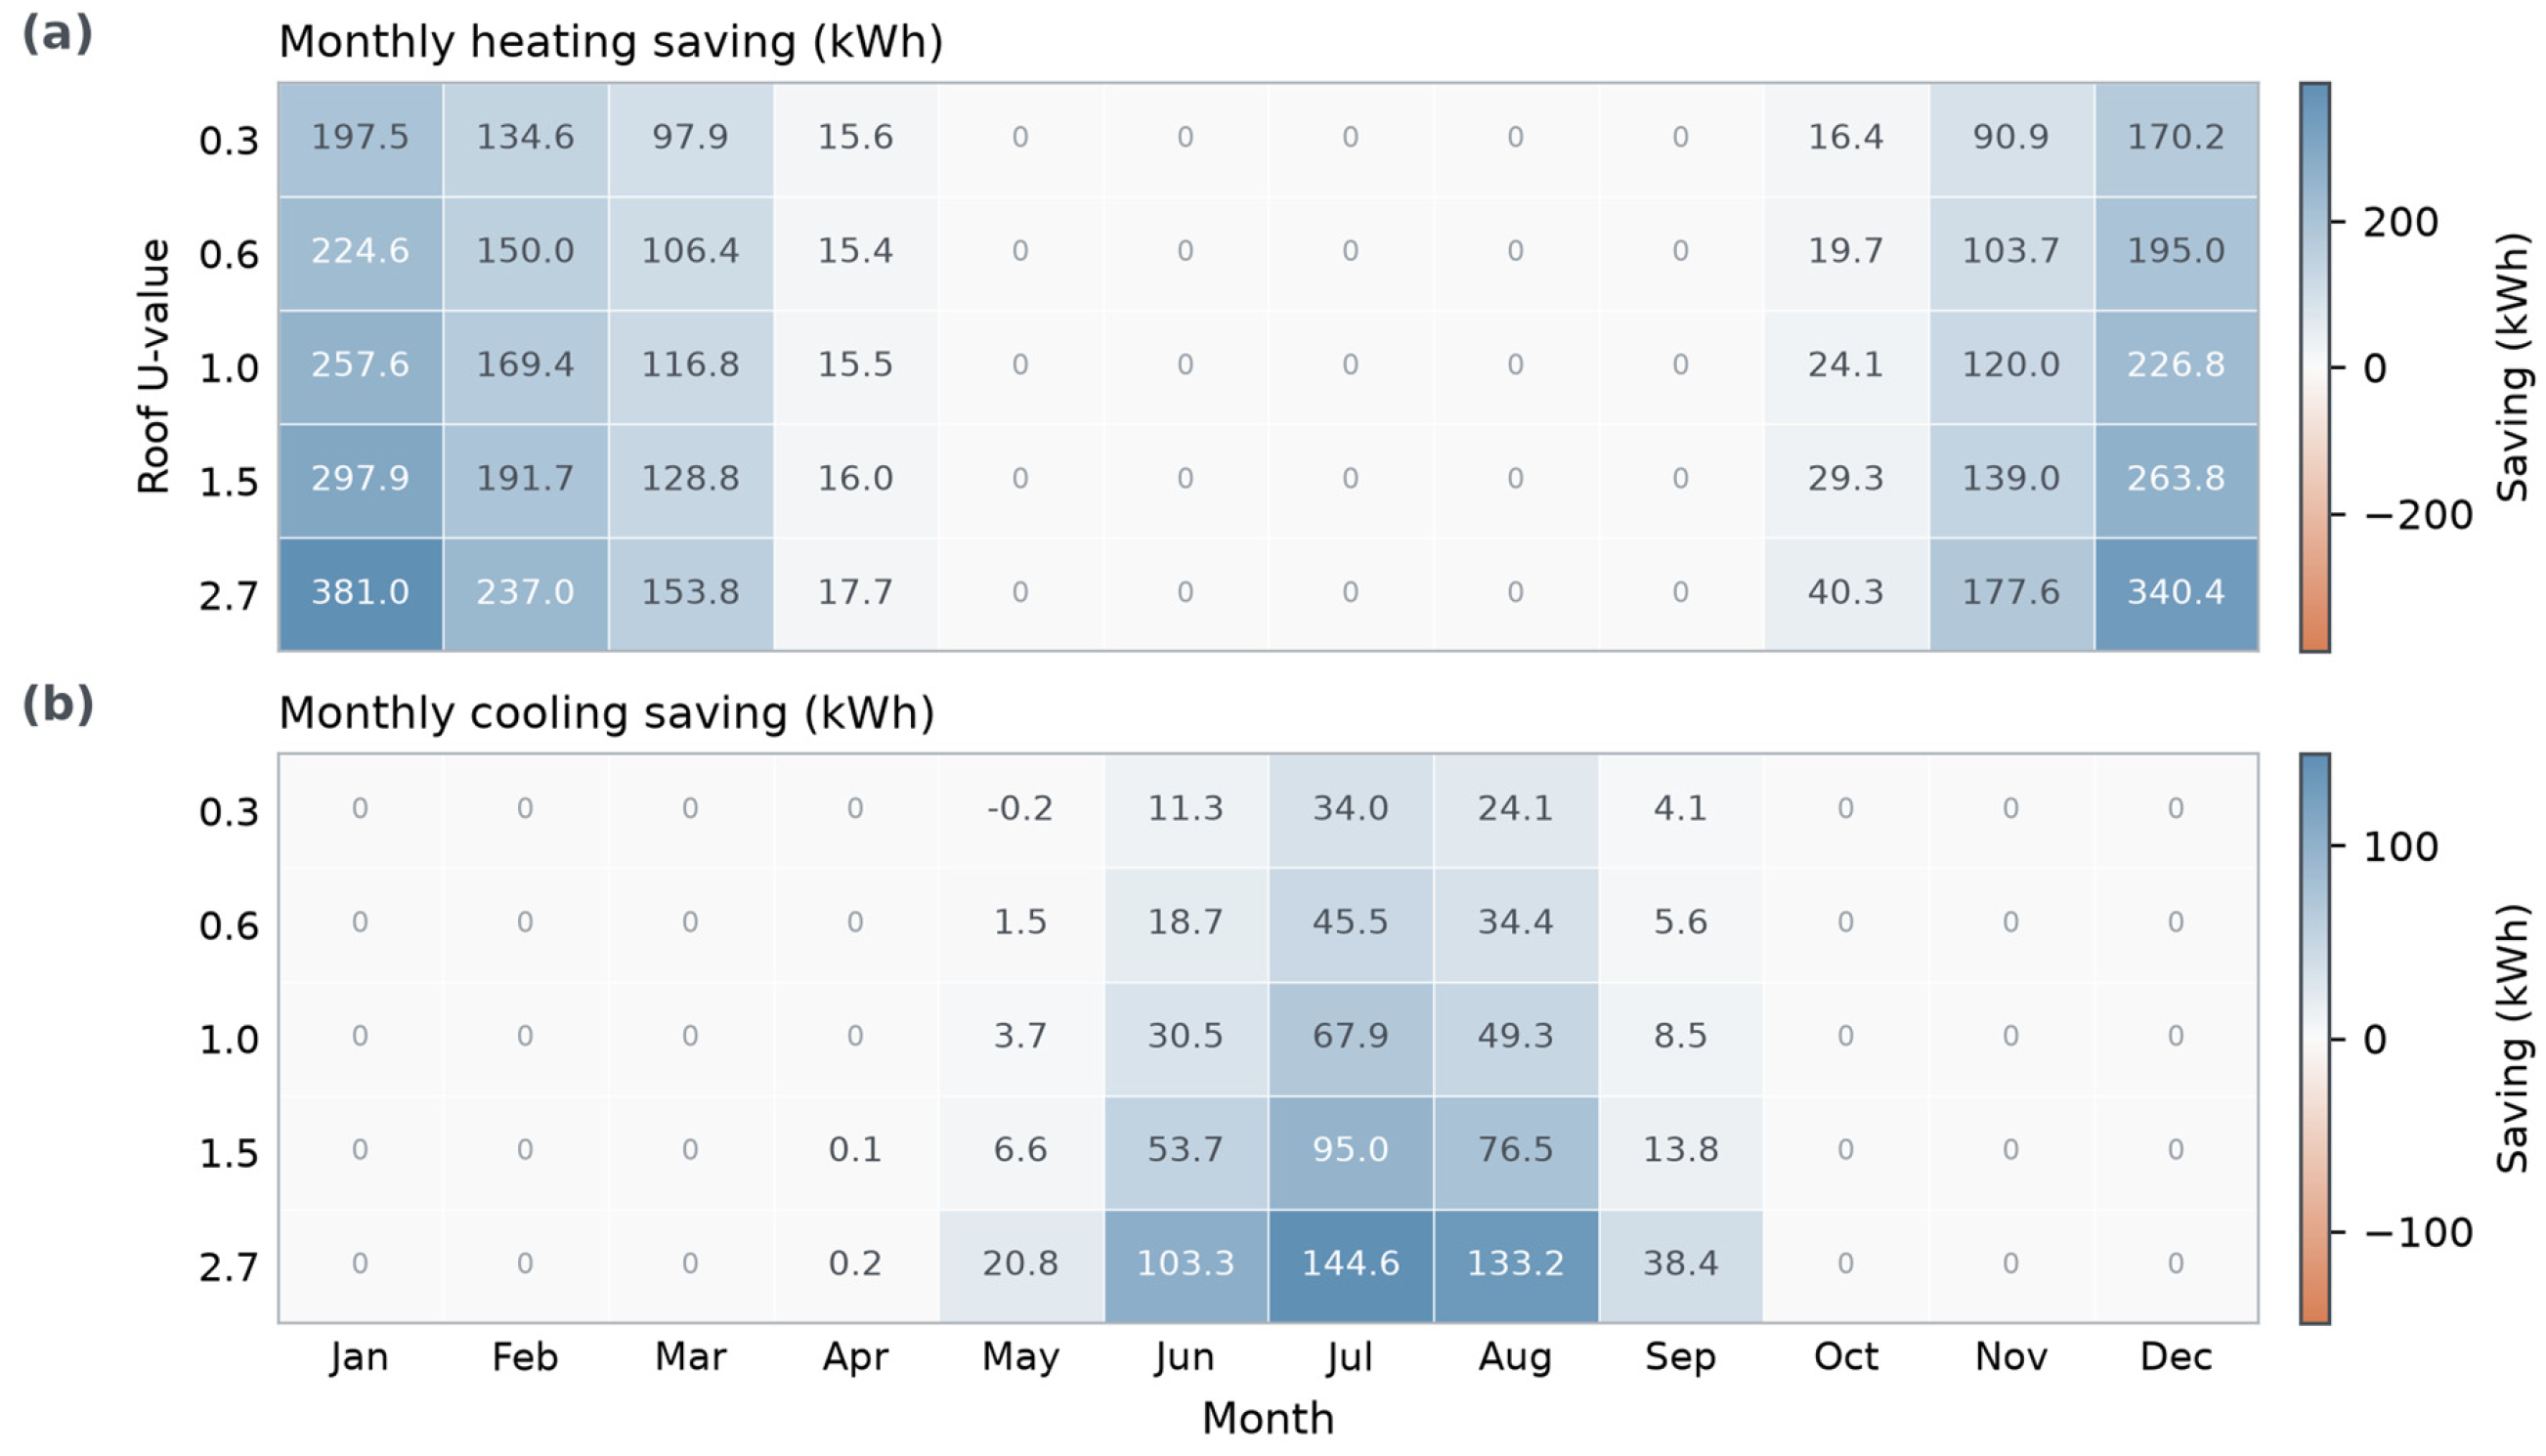
Monthly absolute energy savings had a clear seasonal distribution (Figure 7). Heating savings were concentrated in January–April and October–December, whereas cooling savings occurred mainly from May to September. The largest monthly heating saving occurred in January, decreasing from 380.97 kWh at U = 2.7 W/(m2·K) to 197.49 kWh at U = 0.3 W/(m2·K). The largest monthly cooling saving occurred in July, decreasing from 144.60 to 34.05 kWh. Monthly absolute savings for both heating and cooling generally declined as roof insulation increased.
Figure 7.
Monthly equivalent electricity savings (No-attic minus Attic): (a) Heating; (b) Cooling. Negative values indicate higher consumption in Attic.
Monthly electricity consumption summed to the annual results. The most notable negative monthly cooling saving was −0.191 kWh in May at U = 0.3 W/(m2·K). Relative to the annual cooling saving of 73.43 kWh in the same scenario, this was a minor transitional-season fluctuation, possibly reflecting small differences in the balance between heat gains and heat dissipation under cooler outdoor conditions in the transitional season.
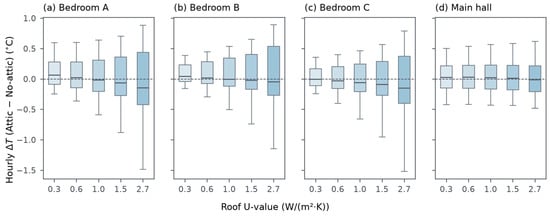
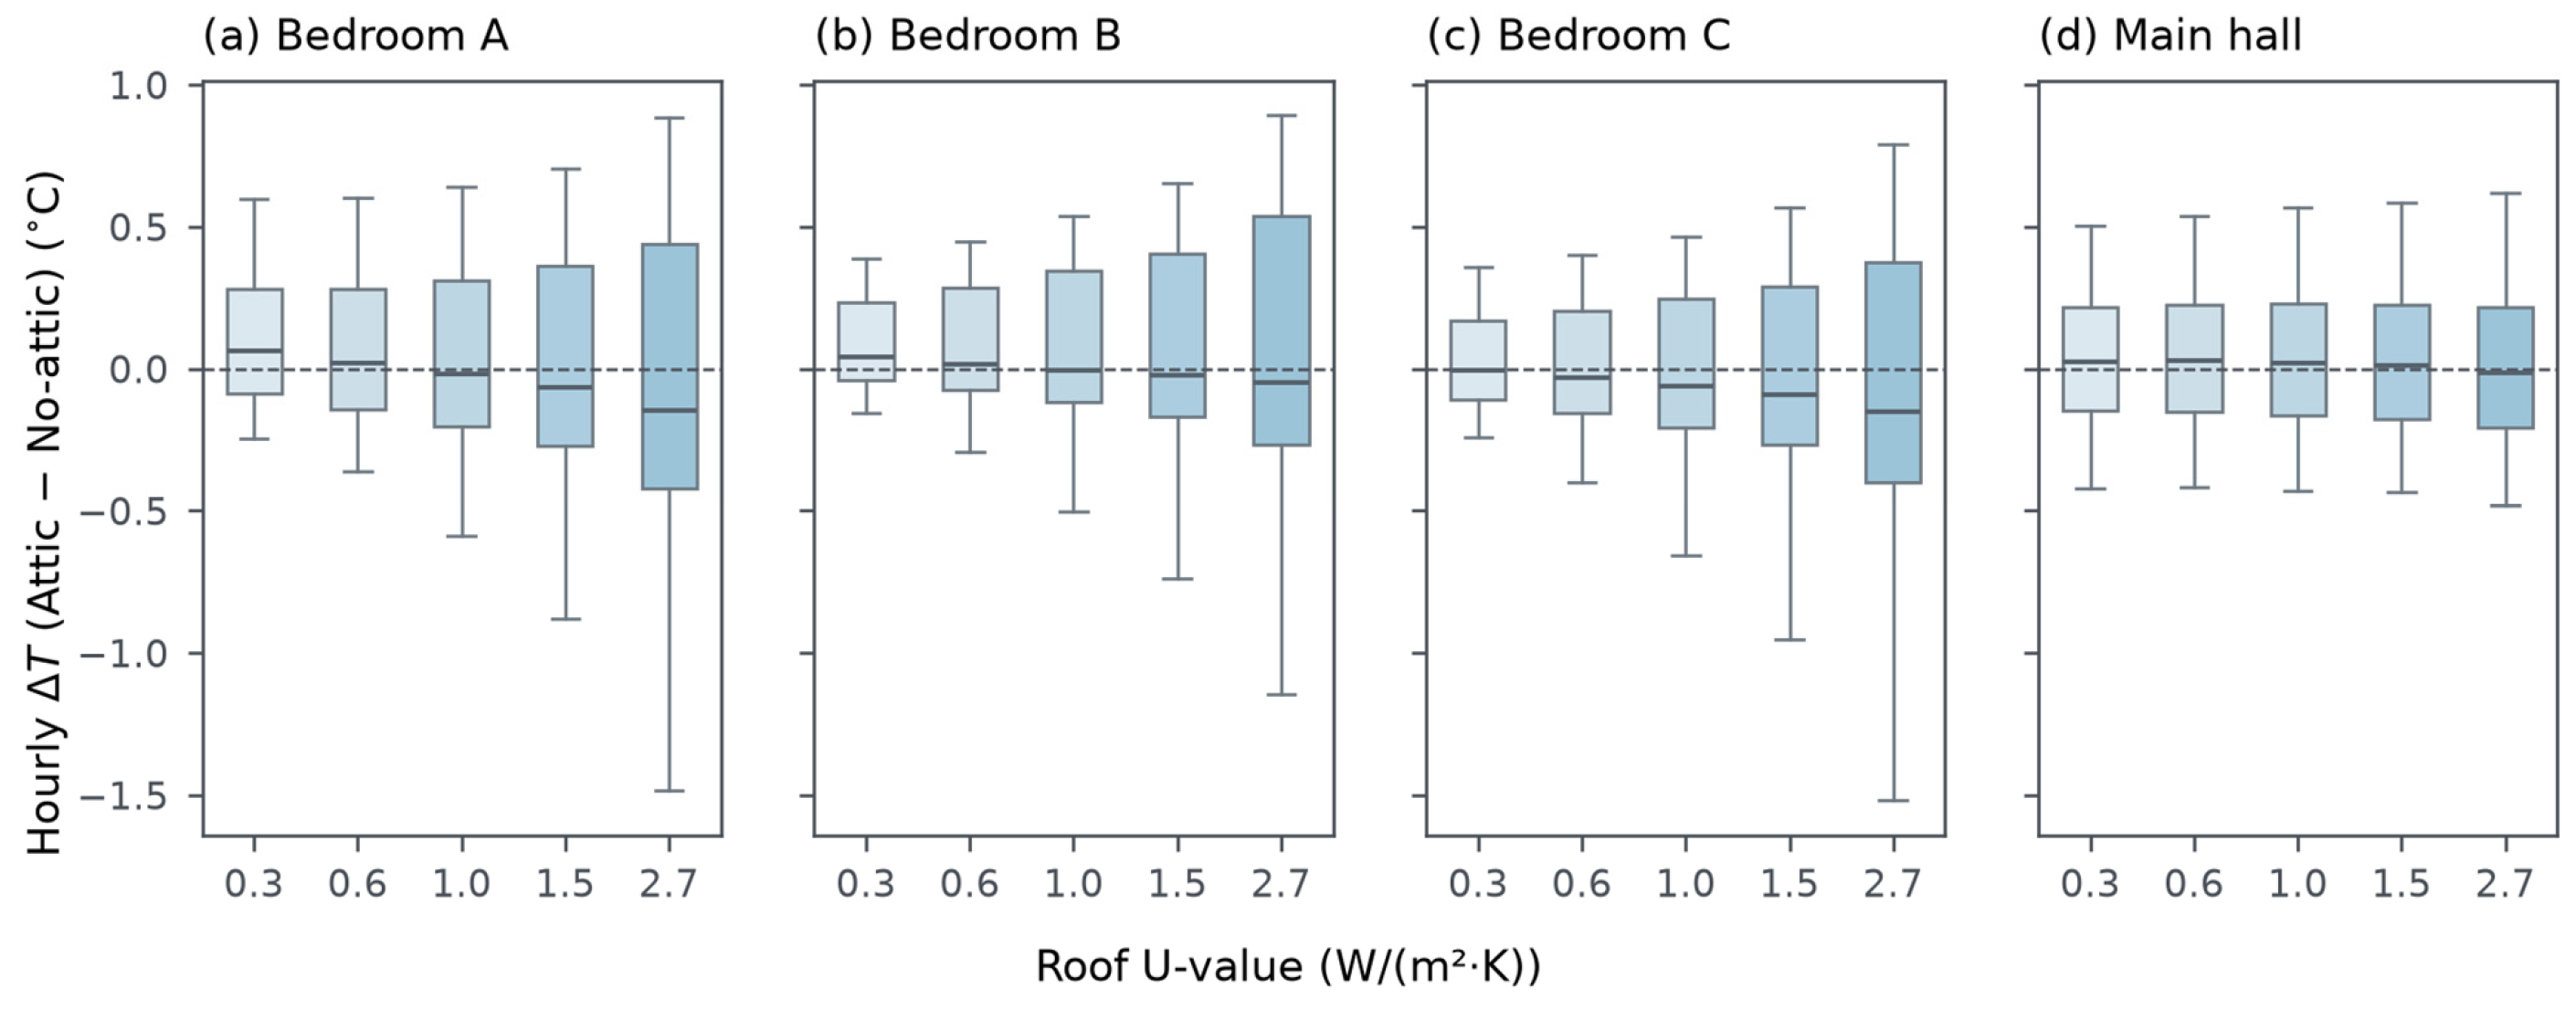
Hourly temperature difference ΔT is defined as the room air temperature in Attic minus that in No-attic. Room-level ΔT distributions show spatial differences (Figure 8). As U-value decreased from 2.7 to 0.3 W/(m2·K), the widths of the 5th–95th percentile (P5–P95) intervals narrowed from 2.37, 2.04, and 2.31 °C to 0.84, 0.55, and 0.60 °C for Bedroom A, Bedroom B, and Bedroom C, respectively. By comparison, the interval width for the Main hall decreased from 1.10 to 0.92 °C, a smaller change.
Figure 8.
Hourly air-temperature differences ΔT (Attic minus No-attic) at five roof U-values: (a) Bedroom A; (b) Bedroom B; (c) Bedroom C; (d) Main hall. Boxes span P25–P75, the central line is the median, and whiskers span P5–P95; outliers are omitted. Each scenario comprises 8760 h.
Hourly ΔT distributions crossed 0 °C for all rooms and U-values, indicating that the Attic–No-attic temperature difference changed sign across hours of the year. With stronger roof insulation, the distributions narrowed markedly in the three bedrooms, while the P5–P95 interval changed less in the Main hall, showing that hourly temperature responses to the Attic configuration differed by space.
The stronger narrowing of bedroom temperature differences, compared with the double-height Main hall, is consistent with the direct changes to the ceiling and roof boundaries of the bedrooms.
3.4. Attic-Zone Daily Temperature-Range Attenuation and Extreme-Period Responses
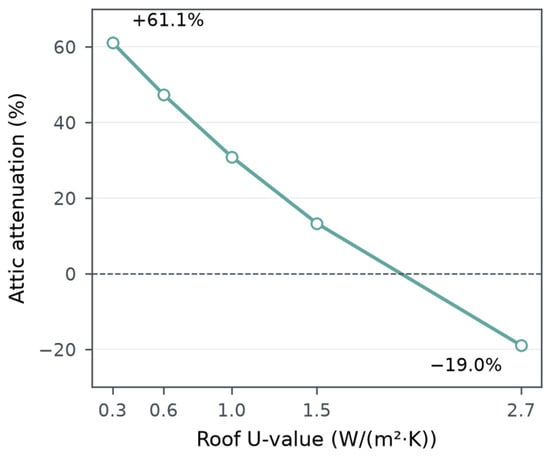
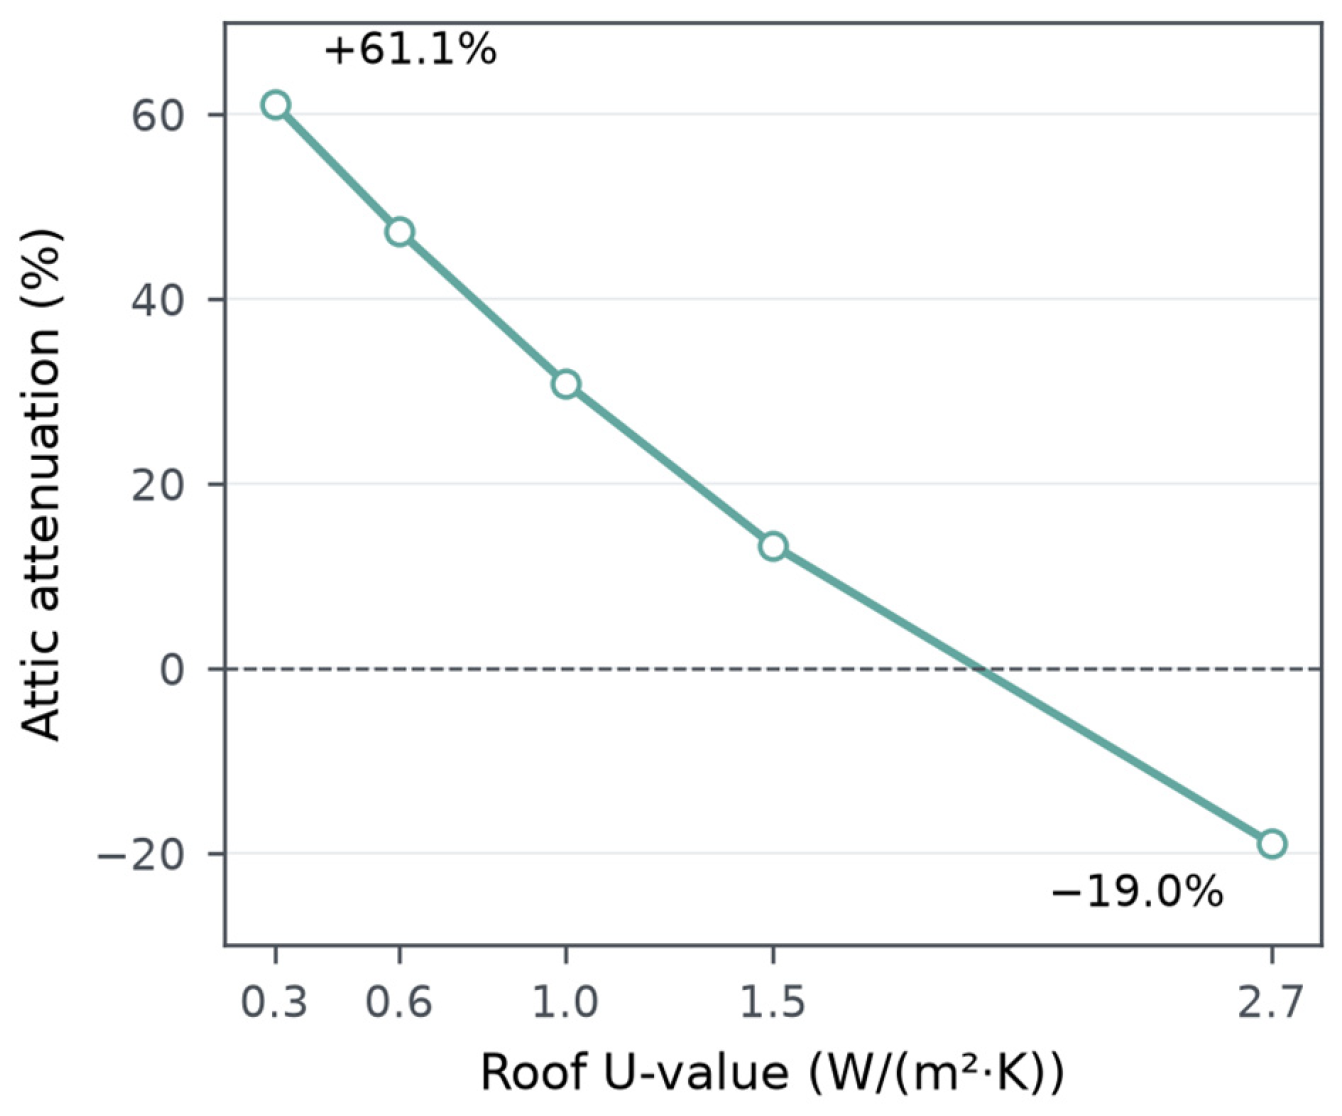
The attic-zone DTR attenuation ratio increased continuously with roof insulation (Figure 9). As U-value decreased from 2.7 to 0.3 W/(m2·K), the ratio rose from −18.95% to 61.14%. The attic zone showed DTR amplification at U = 2.7 W/(m2·K); the ratio became positive at U ≤ 1.5 W/(m2·K) and continued to increase as U-value decreased.
Figure 9.
Annual mean attic-air DTR attenuation relative to annual mean outdoor-air DTR; negative values indicate amplification.
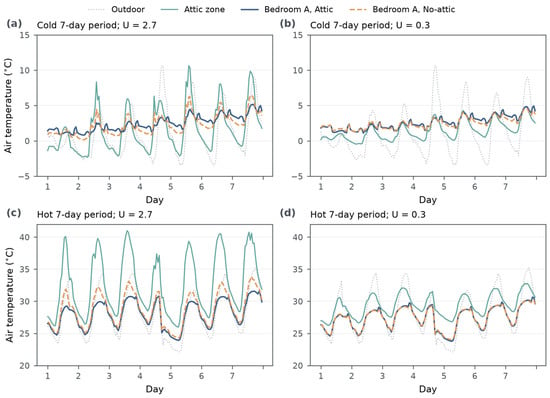
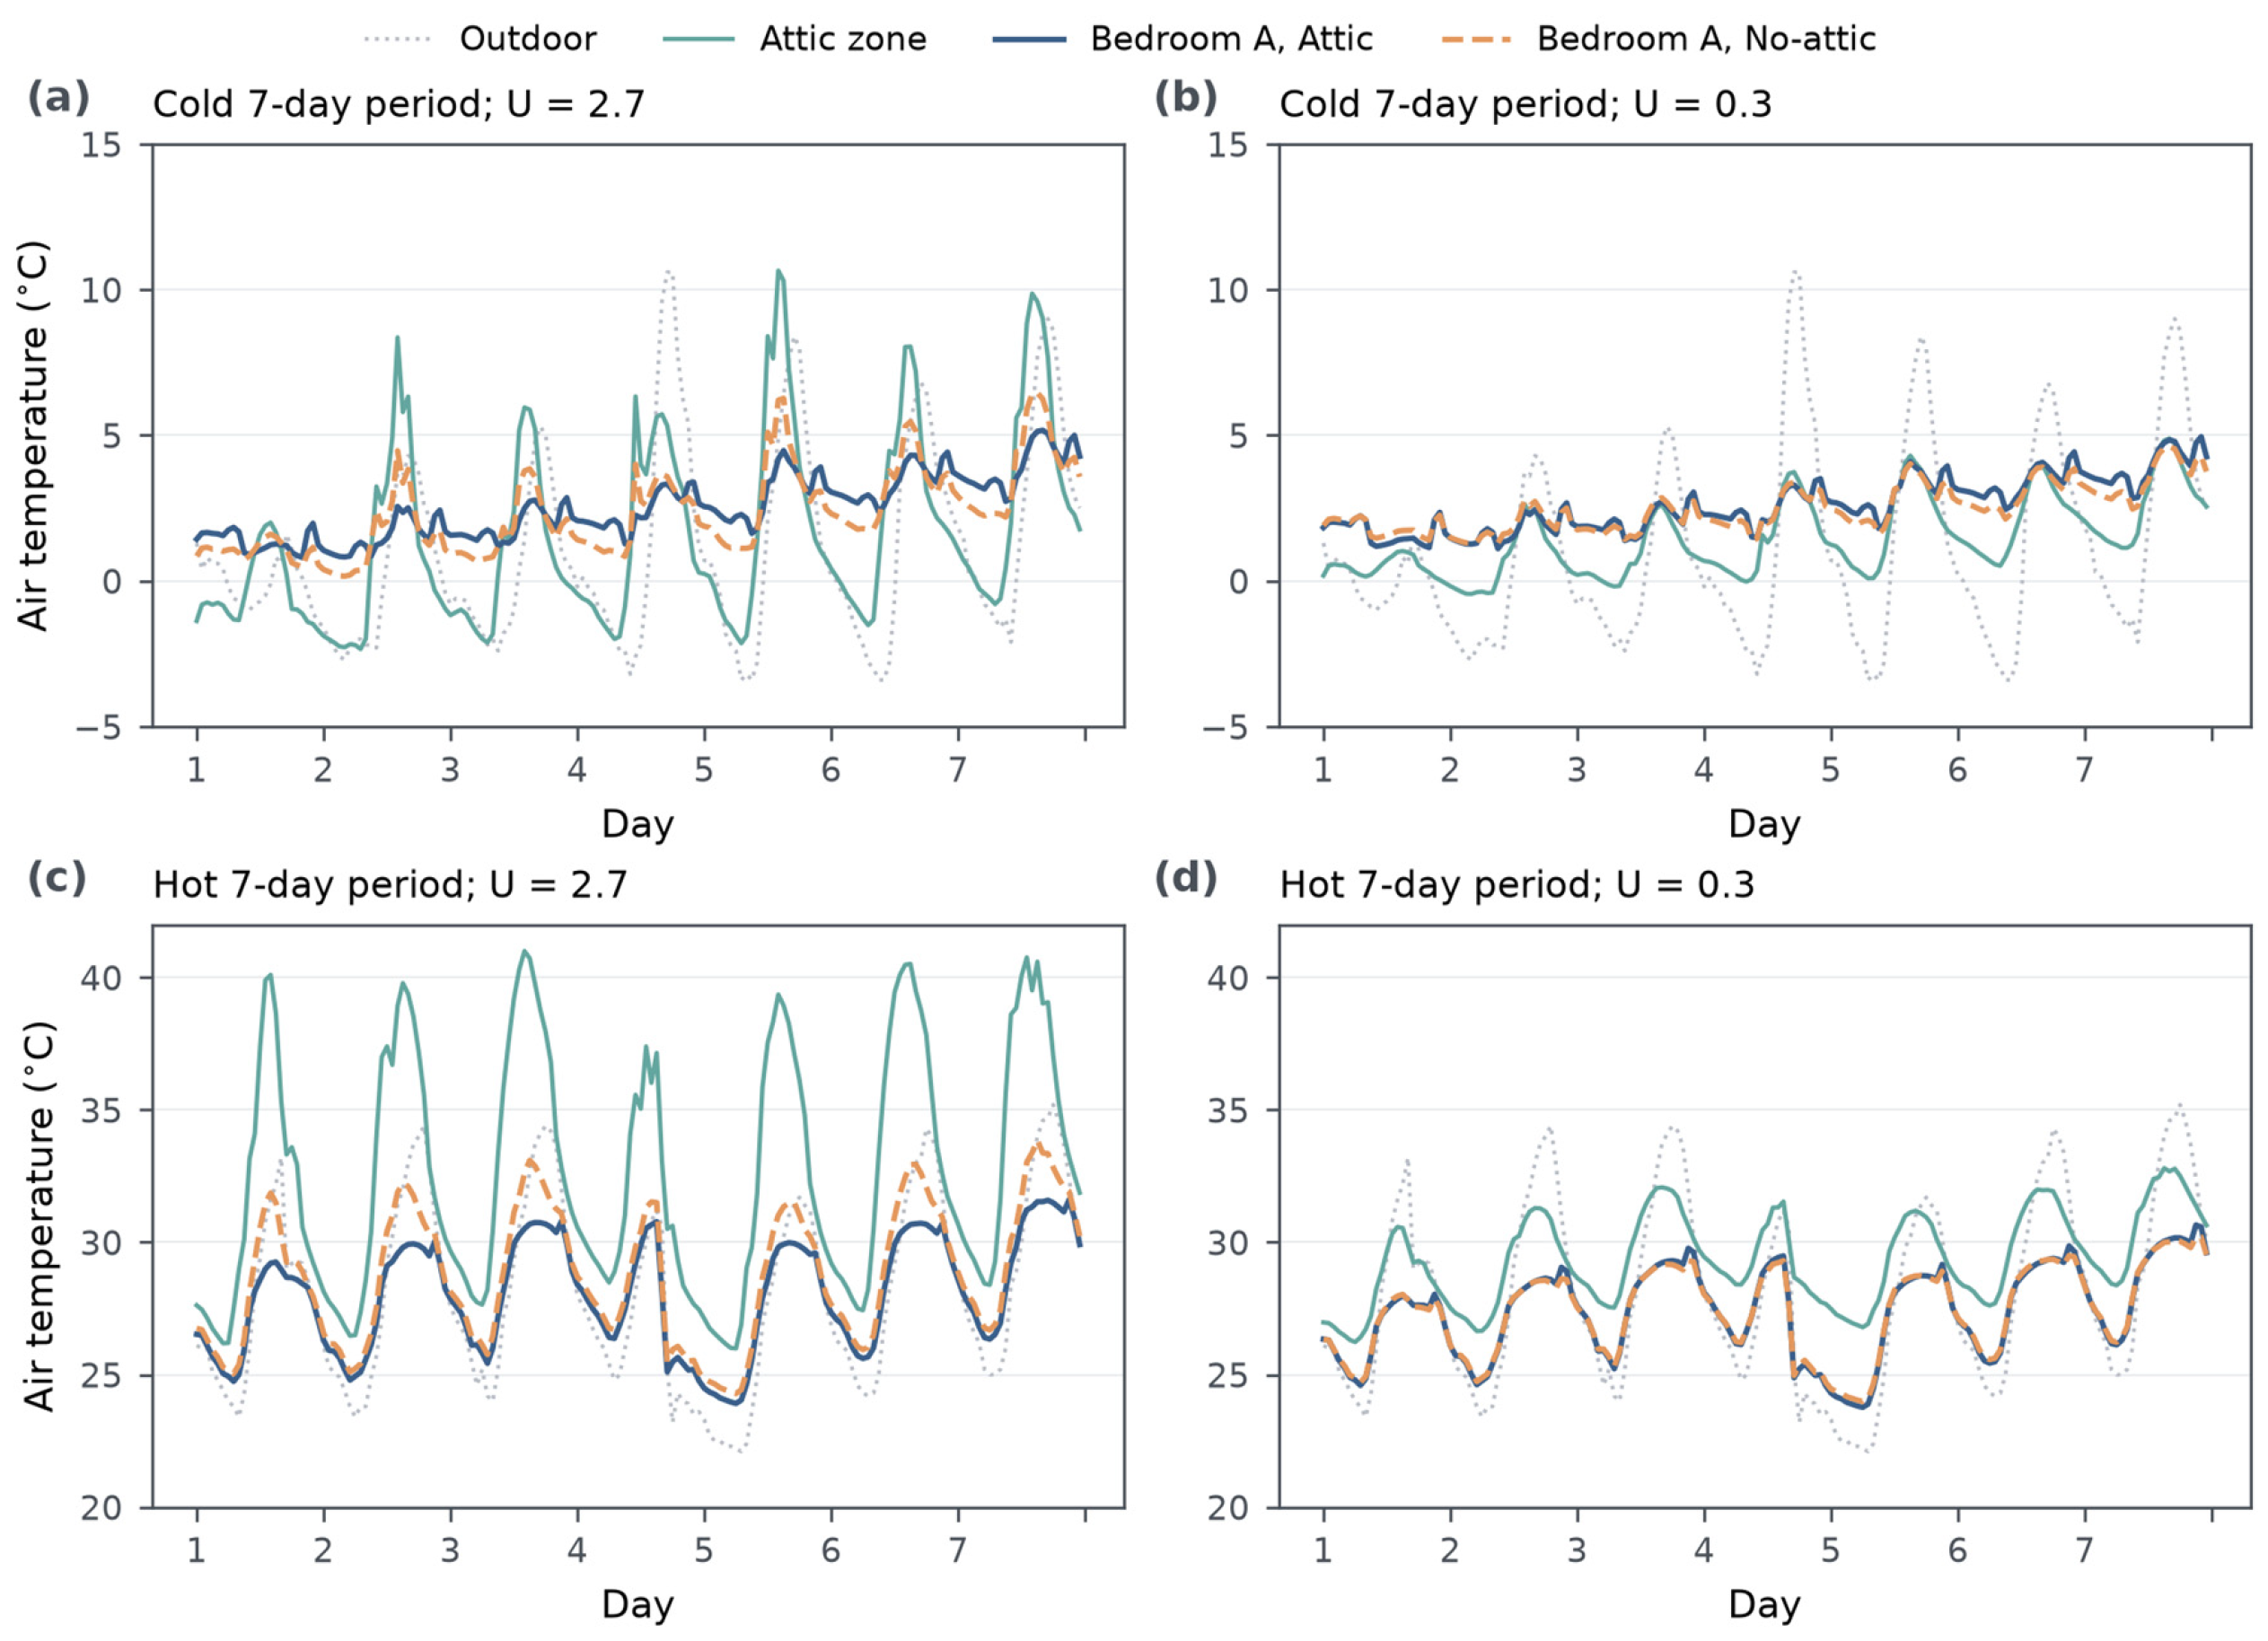
Figure 10 shows hourly temperature profiles during the coldest consecutive 7 days (1–7 January) and hottest consecutive 7 days (25–31 July) in the simulation calendar. At U = 2.7 W/(m2·K), the attic-zone mean DTR over the hottest period was 12.76 °C, compared with 9.87 °C outdoors; during the coldest period, the corresponding values were 9.12 and 9.23 °C. At U = 0.3 W/(m2·K), attic-zone mean DTR during the coldest and hottest periods was 3.17 and 4.37 °C, respectively, both lower than the corresponding outdoor mean DTRs of 9.23 and 9.87 °C. This further shows that attic-zone temperature fluctuations were more strongly attenuated at lower U-values.
Figure 10.
Hourly temperatures during the coldest week (1–7 January) and hottest week (25–31 July) within the annual simulation timeline: (a,b) Cold week at U = 2.7 and 0.3; (c,d) Hot week at U = 2.7 and 0.3 W/(m2·K). Attic temperature is the mean of the four attic zones.
Bedroom A’s dynamic response also varied with U-value. During the coldest 7-day period at U = 2.7 W/(m2·K), the Attic mean and minimum temperatures were 0.18 °C and 0.64 °C higher than in No-attic, respectively, while mean DTR decreased from 3.55 to 2.01 °C. During the hottest 7-day period, Attic mean and maximum temperatures were 0.75 °C and 2.24 °C lower, respectively, and mean DTR decreased from 7.02 to 5.37 °C. At U = 0.3 W/(m2·K), mean temperature responses were close: during the hottest 7-day period, mean ΔT was approximately −0.003 °C, while the Attic maximum remained about 0.460 °C higher and mean DTR was 4.53 °C compared with 4.09 °C for No-attic. Thus, similar mean temperatures under strong insulation coexisted with a local summer peak-temperature reversal.
Figure 6 and Figure 9 show that as roof insulation increased, attic-zone DTR attenuation relative to outdoors strengthened, while the incremental comfort and energy benefits of Attic relative to No-attic diminished. These indicators use different reference conditions: one describes attic-zone DTR relative to outdoors, and the other describes the incremental comfort and energy performance of Attic relative to No-attic at the same roof U-value.
4. Discussion
Across all five roof U-values, the Attic configuration increased annual PCH and reduced heating, cooling, and EDHC. The ceiling and attic space above it alter the thermal boundary between the bedrooms and pitched roof, potentially moderating the magnitude and temporal pattern of roof-related thermal perturbations in the bedrooms. This reflects the combined effect of the ceiling, attic space, and bedroom enclosure as a configuration. Hourly ΔT distributions crossed 0 °C in all rooms, indicating that the attic’s effect shifted between warming and cooling across seasons and hours. During the coldest and hottest 7-day periods at U = 2.7 W/(m2·K), Attic raised Bedroom A’s minimum temperature by 0.64 °C and lowered its maximum temperature by 2.24 °C, moderating winter and summer extremes. Xu et al. [23] compared comfort and energy performance in traditional dwellings with and without attics; Wang et al. [37] examined the effects of roof pitch and ceiling insulation on the thermal response of ventilated attics. Through paired comparisons in the same building at matching roof U-values, this study quantifies annual PCH, equivalent heating and cooling electricity consumption, room temperature differences, and extreme-period responses across five insulation levels, clarifying how roof insulation affects incremental attic benefits.
When roof insulation is weak, the attic and ceiling have a greater role in reducing heat transfer between the roof and the interior. As roof resistance increases, roof-path heat transfer decreases in both configurations and the additional advantage of Attic becomes smaller. This direction is consistent with the basic expectation for steady-state resistances in series.
At U = 0.3 W/(m2·K), the small comfort gain (ΔPCH = 0.160 percentage points) coexisted with an 11.26% reduction in annual energy demand, highlighting the different performance dimensions captured by comfortable-hour availability and energy required to maintain setpoints. The volume-normalized comparison below places the total-energy advantage in the context of the different conditioned volumes and the complete configuration change, rather than an isolated attic-buffer effect. The local summer peak-temperature reversal under high insulation further supports evaluating annual benefits alongside extreme temperatures.
Annual combined equivalent electricity consumption was also normalized by conditioned volume (Table S2). At U = 2.7 W/(m2·K), Attic and No-attic showed similar values of 34.10 and 34.43 kWh/m3, respectively. At U = 0.3 W/(m2·K), Attic had 11.26% lower total consumption but 9.23% higher consumption per unit conditioned volume. Thus, the advantage of Attic in annual total electricity consumption did not consistently translate into lower consumption per unit conditioned volume.
Attic-related energy and temperature responses also varied by season and space. Cooling saving rate decreased from 29.24% to 11.31%, more than the reduction on the heating side, and approached the heating saving rate at U = 0.3 W/(m2·K). This may reflect greater sensitivity of summer performance to roof-related heat gains under weak insulation. Annual cooling energy demand was substantially lower than heating demand, so a higher cooling saving rate represents a larger relative reduction, not a larger annual absolute energy saving. The three bedrooms were among the rooms affected by ceiling removal, whereas the Main hall remained double-height in both configurations. Hourly ΔT distributions narrowed markedly in the three bedrooms as U-value decreased, while the Main hall changed less, indicating greater sensitivity of the directly affected bedrooms to the presence of an attic. During the hottest 7-day period at U = 0.3 W/(m2·K), Bedroom A’s mean temperature difference was approximately −0.003 °C, but the Attic maximum temperature remained about 0.46 °C higher and daily temperature ranges also differed. Thus, mean responses were close under strong insulation while local extremes and daily fluctuations retained differences.
Roof insulation retrofits should be considered jointly with attic retention. Configuration benefits are greater under weak insulation, whereas local summer peaks require closer attention under high insulation. Practical retrofits should also consider construction feasibility, cost, and attic condensation risk.
This study considered one traditional dwelling in Hanzhong under a typical meteorological year, using equivalent-resistance roofs and Well-Mixed thermal zones. Temperature assessment used short-term summer and winter measurements in Bedroom A and an EPW with selected measured weather variables; solar radiation and the remaining weather inputs retained typical-year values. The simulated attic DTR and peak temperatures were not verified against measurements. Neither a separately reserved validation dataset nor a model-parameter calibration procedure was documented for the temperature-agreement assessment; replacing selected weather inputs does not constitute parameter calibration. Applicability to other buildings, climates, and operating conditions requires further examination. Future climate scenarios were not evaluated.
Because the individual room-level PCH results were not retained, the dwelling-level average may obscure differences in comfort improvements among rooms with different orientations. The temperature-agreement assessment was limited to two short monitoring periods in Bedroom A, with 25 hourly observations per season, and cannot establish predictive accuracy throughout the year or in other rooms and attic zones. Both simulation modes used the prescribed infiltration rate, while only Model 1 permitted condition-triggered natural ventilation. Increased attic air exchange could remove accumulated heat when outdoor air is cooler, whereas changes in infiltration could alter indoor temperatures and heating and cooling demand. Without airflow sensitivity analysis, the sensitivity of the Attic–No-attic comparison to these assumptions remains uncertain. At U = 0.3 W/(m2·K), the annual comfort difference (ΔPCH = 0.160 percentage points) and the hottest-week mean temperature difference (ΔT ≈ −0.003 °C) were very small. The temperature difference was substantially smaller than the short-term Bedroom A temperature RMSEs (0.694–0.948 °C), although these RMSEs do not directly represent uncertainty in the paired comparison. The practical significance of these small differences therefore remains uncertain. Future work should retain room-specific comfort outputs, extend monitoring across periods and zones, and assess airflow sensitivity.
5. Conclusions
This study compared Attic and No-attic configurations across five roof U-values in terms of thermal comfort, energy demand, and dynamic temperature response. The results establish the annual effect of the attic and how that effect varies with roof insulation.
Across all tested scenarios, annual PCH was higher for Attic than for No-attic, while heating, cooling, and EDHC demands were lower, indicating a consistent annual comfort and energy benefit within the investigated roof thermal range. However, the incremental benefit diminished as roof insulation increased. As roof U-value decreased from 2.7 to 0.3 W/(m2·K), ΔPCH decreased from 1.632 to 0.160 pp and the EDHC saving rate from 19.55% to 11.26%; heating and cooling saving rates also declined. Meanwhile, PCH improved and energy demand decreased in both configurations, and the hourly ΔT distributions narrowed in Bedrooms A, B, and C, while the Main hall changed less, indicating that stronger roof insulation improved both configurations while narrowing the performance and temperature differences between them.
The attic-zone DTR attenuation ratio increased from −18.95% to 61.14% as roof insulation strengthened, marking a shift from DTR amplification under weak insulation to attenuation. The DTR attenuation ratio compares attic and outdoor temperature ranges, while ΔPCH and energy-saving rates compare Attic with No-attic. At U = 0.3 W/(m2·K), the Attic peak temperature in Bedroom A during the hottest week was approximately 0.460 °C higher than that in No-attic. For the investigated pitched-roof rural dwelling in Hanzhong, attic configuration and roof insulation should be considered together as interrelated passive-design parameters; their combined annual comfort, energy demand, and extreme-temperature performance across roof conditions can guide coordinated design. These findings are specific to the investigated dwelling, five roof U-values, typical meteorological year, and specified model and operating conditions.
Supplementary Materials
The following supporting information can be downloaded at: https://www.mdpi.com/article/10.3390/buildings16214416/s1, Table S1: Nominal roof U-values and equivalent NoMass thermal resistances. Table S2: Annual combined equivalent electricity consumption per unit conditioned volume at five roof U-values.
Author Contributions
Writing—original draft, validation, software, methodology, investigation, formal analysis, and data curation, Y.Z.; conceptualization, J.X.; writing—review and editing, J.X., C.S., Y.P., J.F., L.W. and H.F. All authors have read and agreed to the published version of the manuscript.
Funding
This work was supported by the Fundamental Research Funds of Zhejiang College of Construction (No. Z202601).
Data Availability Statement
Dataset available on request from the authors.
Conflicts of Interest
Author Yuanyuan Peng was employed by the company Shaanxi Agricultural Development Group Co., Ltd. The remaining authors declare that the research was conducted in the absence of any commercial or financial relationships that could be construed as a potential conflict of interest.
Abbreviations
The following abbreviations are used in this manuscript:
| APMV | Adaptive Predicted Mean Vote |
| COP | Coefficient of Performance |
| DTR | Daily Temperature Range |
| EDHC | Energy Demand for Heating and Cooling |
| HVAC | Heating, Ventilation, and Air-Conditioning |
| PCH | Percentage of Comfortable Hours |
| PMV | Predicted Mean Vote |
| TMY | Typical Meteorological Year |
References
- Zhang, J.; Lu, J.; Deng, W.; Beccarelli, P.; Lun, I.Y.F. Thermal comfort investigation of rural houses in China: A review. Build. Environ. 2023, 235, 110208. [Google Scholar] [CrossRef] [Scilit]
- Rui, J.; Zhang, H.; Shi, C.; Pan, D.; Chen, Y.; Du, C. Survey on the Indoor Thermal Environment and Passive Design of Rural Residential Houses in the HSCW Zone of China. Sustainability 2019, 11, 6471. [Google Scholar] [CrossRef] [Scilit]
- Zhang, T.; Duan, Y.; Jiao, Z.; Ye, X.; Hu, Q.; Fukuda, H.; Gao, W. Towards Improving Rural Living Environment for Chinese Cold Region Based on Investigation of Thermal Environment and Space Usage Status. Buildings 2022, 12, 2139. [Google Scholar] [CrossRef] [Scilit]
- Zhang, T.; Jiao, Z.; Duan, Y.; Guan, Y.; Hu, Q.; Gao, W. Winter thermal study in coastal rural dwellings: Focus on elderly comfort in Chinese cold coastal regions. J. Asian Archit. Build. Eng. 2025, 24, 3971–3995. [Google Scholar] [CrossRef] [Scilit]
- Wei, D.; Zhao, G.; Liu, S.; Yang, L. Indoor thermal comfort in a rural dwelling in southwest China. Front. Public Health 2022, 10, 1029390. [Google Scholar] [CrossRef] [Scilit] [PubMed]
- Zhu, Y.; Fan, X.; Wang, C.; Sang, G. Analysis of Heat Transfer and Thermal Environment in a Rural Residential Building for Addressing Energy Poverty. Appl. Sci. 2018, 8, 2077. [Google Scholar] [CrossRef] [Scilit]
- Lin, B.; Tan, G.; Wang, P.; Song, L.; Zhu, Y.; Zhai, G. Study on the thermal performance of the Chinese traditional vernacular dwellings in Summer. Energy Build. 2004, 36, 73–79. [Google Scholar] [CrossRef] [Scilit]
- Gou, S.; Li, Z.; Zhao, Q.; Nik, V.M.; Scartezzini, J.-L. Climate responsive strategies of traditional dwellings located in an ancient village in hot summer and cold winter region of China. Build. Environ. 2015, 86, 151–165. [Google Scholar] [CrossRef] [Scilit]
- Hu, M.; Zhang, K.; Nguyen, Q.; Tasdizen, T. The effects of passive design on indoor thermal comfort and energy savings for residential buildings in hot climates: A systematic review. Urban Clim. 2023, 49, 101466. [Google Scholar] [CrossRef] [Scilit]
- Xu, J.; Lu, Z.; Huo, X. The evolution and adaptive development of traditional dwelling in Southern Shaanxi, China. Environ. Sci. Pollut. Res. 2019, 26, 13914–13930. [Google Scholar] [CrossRef] [Scilit] [PubMed]
- Zhou, Y.; Xu, J.; Peng, Y.; Fukuda, H. The correlation between spatial form and energy consumption of traditional dwellings in southern Shaanxi. City Built Environ. 2026, 4, 12. [Google Scholar] [CrossRef] [Scilit]
- Qian, Y.; Leng, J.; Chun, Q.; Wang, H.; Zhou, K. A year-long field investigation on the spatio-temporal variations of occupant’s thermal comfort in Chinese traditional courtyard dwellings. Build. Environ. 2023, 228, 109836. [Google Scholar] [CrossRef] [Scilit]
- Xu, C.; Li, S.; Zhang, X.; Shao, S. Thermal comfort and thermal adaptive behaviours in traditional dwellings: A case study in Nanjing, China. Build. Environ. 2018, 142, 153–170. [Google Scholar] [CrossRef] [Scilit]
- Shao, T.; Zheng, W.; Jin, H. Analysis of the Indoor Thermal Environment and Passive Energy-Saving Optimization Design of Rural Dwellings in Zhalantun, Inner Mongolia, China. Sustainability 2020, 12, 1103. [Google Scholar] [CrossRef] [Scilit]
- Saha, S.C.; Patterson, J.C.; Lei, C. Natural convection in attics subject to instantaneous and ramp cooling boundary conditions. Energy Build. 2010, 42, 1192–1204. [Google Scholar] [CrossRef] [Scilit]
- Saha, S.C.; Patterson, J.C.; Lei, C. Natural convection and heat transfer in attics subject to periodic thermal forcing. Int. J. Therm. Sci. 2010, 49, 1899–1910. [Google Scholar] [CrossRef] [Scilit]
- Wang, S.; Shen, Z. Effects of Roof Pitch on Air Flow and Heating Load of Sealed and Vented Attics for Gable-Roof Residential Buildings. Sustainability 2012, 4, 1999–2021. [Google Scholar] [CrossRef] [Scilit]
- Tariku, F.; Iffa, E.D. Temperature and Air Flow Patterns in Attic Roofs. J. Archit. Eng. 2017, 23, 04017014. [Google Scholar] [CrossRef] [Scilit]
- Wang, S.; Shen, Z.; Gu, L. Numerical simulation of buoyancy-driven turbulent ventilation in attic space under winter conditions. Energy Build. 2012, 47, 360–368. [Google Scholar] [CrossRef] [Scilit]
- Wang, S.; Shen, Z. Impacts of Ventilation Ratio and Vent Balance on Cooling Load and Air Flow of Naturally Ventilated Attics. Energies 2012, 5, 3218–3232. [Google Scholar] [CrossRef] [Scilit]
- Iffa, E.D.; Tariku, F. Attic baffle size and vent configuration impacts on attic ventilation. Build. Environ. 2015, 89, 28–37. [Google Scholar] [CrossRef] [Scilit]
- Ong, K.S. Temperature reduction in attic and ceiling via insulation of several passive roof designs. Energy Convers. Manag. 2011, 52, 2405–2411. [Google Scholar] [CrossRef] [Scilit]
- Xu, J.; Xu, B.; Yang, W.; Zhu, C.; Li, Q. Comparative research on improving the thermal environment of traditional dwellings with attic space in Southern Shaanxi region, China. Case Stud. Therm. Eng. 2024, 55, 104092. [Google Scholar] [CrossRef] [Scilit]
- Xu, J.; Meng, W.; Yang, W.; Lu, Z.; Xie, G.; Wang, X. Impact of transition spaces on the indoor thermal environment: A case study of traditional dwellings in Southern Shaanxi, China. J. Build. Eng. 2024, 95, 110283. [Google Scholar] [CrossRef] [Scilit]
- Ran, J.; Tang, M.; Jiang, L.; Zheng, X. Effect of Building Roof Insulation Measures on Indoor Cooling and Energy Saving in Rural Areas in Chongqing. Procedia Eng. 2017, 180, 669–675. [Google Scholar] [CrossRef] [Scilit]
- Mao, Z.; Rao, X.; Qi, F. Evaluation Research on Energy-Saving Retrofitting of Roofs of Traditional Wood-Structured Dwellings Based on the Continuation of Historical Features: A Case Study of Guangdu Village No. 280 Dwelling in Zhejiang. Sustainability 2024, 16, 2236. [Google Scholar] [CrossRef] [Scilit]
- Xu, J.; Yang, W.; Lu, Z.; Wu, Y.; Hou, C.; Liu, D. Quality Analysis on Indoor Thermal Comfort and Energy-Saving Improvement Strategy of Slate Dwellings, China. Buildings 2022, 12, 468. [Google Scholar] [CrossRef] [Scilit]
- Lu, Z.; Xu, J.; Gao, W.; Hou, C.; Hao, Y. A comprehensive effectiveness study of passive design parameters for traditional dwellings in Qinba mountainous area. Indoor Built Environ. 2023, 32, 681–698. [Google Scholar] [CrossRef] [Scilit]
- Duan, Y.; Zhang, T.; Yang, Y.; Wei, Y.; Jiao, Z.; Gao, W. Sensitivity Analysis of Envelope Design for Rural Dwellings in Cold Regions of China: An Orthogonal Experiment-Based Approach. Buildings 2025, 15, 3703. [Google Scholar] [CrossRef] [Scilit]
- D’Orazio, M.; Di Perna, C.; Di Giuseppe, E. The effects of roof covering on the thermal performance of highly insulated roofs in Mediterranean climates. Energy Build. 2010, 42, 1619–1627. [Google Scholar] [CrossRef] [Scilit]
- Medina, M.A. On the performance of radiant barriers in combination with different attic insulation levels. Energy Build. 2000, 33, 31–40. [Google Scholar] [CrossRef] [Scilit]
- Tariku, F.; Iffa, E.D. Effect of Attic Insulation Thickness and Solar Gain in a Mild Climate. Energy Procedia 2015, 78, 67–72. [Google Scholar] [CrossRef] [Scilit]
- Fantucci, S.; Serra, V. Investigating the performance of reflective insulation and low emissivity paints for the energy retrofit of roof attics. Energy Build. 2019, 182, 300–310. [Google Scholar] [CrossRef] [Scilit]
- Sirimanna, M.P.G.; Attalage, R.A. A model for analyzing the thermal performance of roof configurations with flat inclined surfaces. Energy Build. 2016, 116, 122–132. [Google Scholar] [CrossRef] [Scilit]
- Quevedo, T.C.; Melo, A.P.; Lamberts, R. Assessing cooling loads from roofs with attics: Modeling versus field experiments. Energy Build. 2022, 262, 112003. [Google Scholar] [CrossRef] [Scilit]
- Jin, R.; Lin, Z.; Li, X. Passive thermal performance of vernacular dwellings in the hot summer and cold winter region of Southern Henan, China. Case Stud. Therm. Eng. 2026, 83, 108186. [Google Scholar] [CrossRef] [Scilit]
- Wang, S.; Shen, Z.; Gu, L. The Impact of Roof Pitch and Ceiling Insulation on Cooling Load of Naturally-Ventilated Attics. Energies 2012, 5, 2178–2196. [Google Scholar] [CrossRef] [Scilit]
- GB 50176–2016; Ministry of Housing and Urban-Rural Development of the People’s Republic of China. Code for Thermal Design of Civil Building. China Architecture & Building Press: Beijing, China, 2016. Available online: https://ebook.chinabuilding.com.cn/zbooklib/book/detail/show?SiteID=1&bookID=74305 (accessed on 20 September 2026).
- ASHRAE. Guideline 14–2023: Measurement of Energy, Demand, and Water Savings; ASHRAE: Peachtree Corners, GA, USA, 2023. [Google Scholar]
- JGJ 134–2010; Ministry of Housing and Urban-Rural Development of the People’s Republic of China. Design Standard for Energy Efficiency of Residential Buildings in Hot Summer and Cold Winter Zone. China Architecture & Building Press: Beijing, China, 2010.
- GB 55015–2021; Ministry of Housing and Urban-Rural Development of the People’s Republic of China. General Code for Energy Efficiency and Renewable Energy Application in Buildings. China Architecture & Building Press: Beijing, China, 2021.
- GB/T 50785–2012; Ministry of Housing and Urban-Rural Development of the People’s Republic of China. General Administration of Quality Supervision, Inspection and Quarantine of the People’s Republic of China. Evaluation Standard for Indoor Thermal Environment in Civil Buildings. China Architecture & Building Press: Beijing, China, 2012.

Disclaimer/Publisher’s Note: The statements, opinions and data contained in all publications are solely those of the individual author(s) and contributor(s) and not of MDPI and/or the editor(s). MDPI and/or the editor(s) disclaim responsibility for any injury to people or property resulting from any ideas, methods, instructions or products referred to in the content. |
© 2026 by the authors. Licensee MDPI, Basel, Switzerland. This article is an open access article distributed under the terms and conditions of the Creative Commons Attribution (CC BY) license.