


Abstract
This study investigated the axial compressive behaviour of sustainable concrete-filled steel tube (CFST) stub columns incorporating glass powder (GP) as a partial cement replacement and nitrile rubber (NR) gloves as additive fibres. A detailed finite element (FE) model was developed in Abaqus using the Concrete Damage Plasticity (CDP) model, in which modified constitutive relationships were adopted to account for the effects of GP and NR fibres. The numerical model was validated against 12 experimental stub columns. The validation showed that the predicted ultimate loads were within 4% of the experimental values, and that the load–axial strain behaviour and the failure modes showed good agreement with the experimental results. A comprehensive parametric study comprising 96 FE models was conducted to evaluate the influence of steel tube diameter, thickness, and yield strength, along with different GP and NR fibre contents. The results indicated that although the incorporation of GP and NR fibres reduced the compressive strength of unconfined concrete, steel confinement significantly compensated for this loss. The confinement effectiveness of steel tubes was found to be highly dependent on the diameter-to-thickness () ratio, with lower ratios providing stronger confinement, enhanced ductility, and improved post-peak behaviour. Increasing tube thickness and steel yield strength markedly improved axial capacity, energy absorption, and confinement efficiency, whereas larger diameters increased strength but reduced ductility. A comparison with eight existing design codes and empirical models showed that several empirical models provided close predictions of the FE results, whereas some design codes either overestimated or underestimated the FE-derived axial capacity of CFST columns incorporating GP and NR fibre concrete. Overall, the study demonstrated that the combined use of GP and NR fibres in CFST columns is structurally viable when adequate confinement is provided. The findings contribute to a better understanding of the confinement behaviour of CFST columns incorporating GP and NR fibres and provide theoretical insights into their axial capacity prediction, while providing a foundation for the development of reliable material models for this novel sustainable concrete in composite structures.
1. Introduction
In the past few decades, due to excessive greenhouse gas emissions, global warming and resource depletion, there has been a growing interest in improving the sustainability of the construction industry. This is especially true in the context of concrete structures. With an annual consumption of 30 billion tonnes, concrete is the most used construction material in the world due to its versatility, durability, and low cost. Cement is a vital component of concrete, which makes up around 15% of its mass but is responsible for around 90% of its carbon footprint [1]. Cement, by itself, is responsible for 8% of global anthropogenic CO2 emissions [2,3]. On the other hand, solid waste disposal accounts for approximately 5% of global CO2 emissions, and the open burning of these waste materials further intensifies the issue [4]. The use of recycled waste materials or industrial by-products as a partial cement substitute in concrete is a viable strategy to introduce sustainability, as it reduces the use of cement in concrete and thereby reduces its carbon footprint.
Researchers have extensively investigated the incorporation of various supplementary cementitious materials (SCMs), such as fly ash, ground granulated blast furnace slag (GGBFS), and silica fume, as partial replacements for cement in concrete to reduce cement consumption and enhance sustainability. A recent study reported that in the US, around 60% of ready-mix concrete contains SCMs [5]. While fly ash and GGBFS account for the majority of SCMs currently used in concrete, the growing demand for SCMs, coupled with the limited availability of these conventional materials, has prompted researchers to explore alternative waste-derived SCMs [6]. In this context, waste glass has attracted growing attention, as it constitutes a significant portion of global solid waste, with its disposal posing an ongoing environmental challenge. Recent estimates indicate that approximately 200 million tonnes of waste glass are landfilled worldwide [7]. Although, from a theoretical perspective, waste glass can be remelted and used to make new glass products, in reality, recycling is often limited due to issues such as contamination, as well as the commingling of different glass types and colours, which complicate the sorting and processing required for recycling [8].
Waste glass powder (GP) as a partial cement replacement not only reduces landfilling of waste glass but also helps in minimising the carbon footprint of cement. For a nominal concrete mix with a total cement content of 550 kg/m3, replacing up to 30% of the cement with GP reduces cement consumption by approximately 165 kg/m3 and diverts an equivalent amount of waste glass from landfill. Recycling one tonne of waste glass saves an equivalent amount of raw materials, together with 19 L of oil, 42 kWh of energy, 3.4 kg of air pollutants, and 1.5 m3 of landfill space [4]. For 100 m3 of concrete at 30% substitution level, this corresponds to 16.5 tonnes of cement replaced with an equal amount of GP, and saves approximately 25 m3 of landfill space, 690 kWh of energy, 310 L of oil, and 56 kg of air pollutants. Also, since the production of one tonne of cement releases approximately 0.8 to 1.0 tonne of CO2, and cement accounts for around 90% of the carbon footprint of concrete [9,10,11], a 30% GP replacement could reduce the CO2 emissions by 13.2 to 16.5 tonnes. Moreover, since glass contains a high percentage of amorphous silica and has higher aspect ratios and a smoother texture compared to cement, it dissolves easily in the highly alkaline environment of concrete. Consequently, GP has been widely investigated as an SCM capable of inducing pozzolanic reactions [12]. The pozzolanic reactivity of GP is strongly influenced by particle size. GP starts exhibiting noticeable reactivity when the particle size is below 75 µm [13]. Furthermore, Mirzahosseini and Riding [14] reported that reducing particle size enhances pozzolanic activity. For instance, GP with a particle size of 25 µm exhibits higher reactivity than that of 75 µm. In terms of compressive strength, the optimal replacement level of GP as a partial substitute for cement varies across studies, as it depends on several factors such as chemical composition, particle size distribution, and the presence of contaminants. Nevertheless, most studies suggest an effective replacement range of approximately 10% to 40% [15,16,17,18,19,20]. A comprehensive review by Jiang et al. [13] indicated that within this range, compressive strength generally tends to decrease with increasing GP content. Although high-strength concrete (HSC) has gained widespread popularity in the construction industry due to its superior load-carrying capacity and enhanced durability, it is inherently more brittle, with ductility decreasing as compressive strength increases [21]. This remains a key limitation in structural applications where energy dissipation and deformation capacity are critical.
The incorporation of fibres derived from waste materials in HSC presents a promising strategy to address its inherent brittleness while advancing sustainability in the concrete industry. In particular, nitrile rubber (NR) gloves constitute a significant and underutilised waste stream, given their widespread global use as single-use protective equipment. These gloves are manufactured from synthetic nitrile butadiene rubber, and the presence of trace amounts of sulphur and nitrogen in their composition renders conventional chemical recycling methods such as pyrolysis and steam gasification largely ineffective [22,23]. Consequently, discarded NR gloves are predominantly disposed of in landfills or subjected to incineration, the latter contributing to greenhouse gas emissions, including CO2. Therefore, utilizing shredded NR gloves as additive fibres in concrete provides a dual benefit. Mechanically, such fibres can enhance ductility and energy absorption capacity [24]. Environmentally, this approach diverts waste from landfills and reduces carbon emissions associated with incineration, thereby lowering the overall carbon footprint. Kilmartin-Lynch et al. [25] were among the first to investigate the effects of shredded NR fibres in concrete, reporting that the incorporation of a small dosage (0.1–0.3% by volume) can lead to an improvement in compressive strength. Meanwhile, Ran et al. [26] observed that at relatively higher fibre contents (0.5–2% by volume), NR fibres contribute to a significant enhancement in fatigue resistance and overall deformability, along with a reduction in crack propagation. However, within this higher dosage range, a reduction in the compressive strength of concrete was also reported.
To date, only one study, by the present authors [24], has investigated the combined use of GP as a partial cement replacement and NR as additive fibres in concrete. In that study, twelve different concrete mixes were experimentally evaluated, with GP contents ranging from 10% to 30% and NR fibre contents from 0.5% to 1%. The results showed that the individual incorporation of GP and NR fibres leads to a moderate reduction in compressive strength, with the degree of strength loss increasing as the dosage of GP and NR fibres increases. Furthermore, their combined use produced a compounded effect, resulting in a more pronounced reduction in strength. To restore the loss of strength, Saleheen et al. [24] also examined the application of steel confinement in GP and NR concrete. The confinement provided by the steel tube is passive in nature, i.e., when the concrete core dilates under compression, the outer steel tube constrains the dilation, thereby increasing the compressive strength significantly [27]. Overall, GP and NR concrete with steel confinement showed results comparable to those of the plain conventional concrete. Additionally, more than half of the strength loss of unconfined concrete was recovered upon steel confinement. However, the study was limited to a single steel tube geometry, which restricts the broader applicability of the findings. The existing literature indicates that the effectiveness of confinement is highly sensitive to parameters such as tube geometry (e.g., diameter and thickness), steel yield strength, and the compressive strength of the core concrete [28,29,30,31]. Furthermore, there is currently no established constitutive or material model available for this novel sustainable concrete incorporating GP and NR fibres.
Therefore, a critical research gap exists in understanding how variations in steel tube geometry and steel material properties influence the confinement behaviour of GP, NR, and GP–NR concrete, as well as in developing a reliable material model for predicting its performance. To address this gap, the present study systematically investigates the effects of different steel tube diameters, thicknesses, and yield strengths, alongside varying GP and NR fibre contents, to provide a more comprehensive understanding of confined behaviour and to support future modelling efforts. The novelty of this study lies in its comprehensive finite element parametric investigation of sustainable concrete-filled steel tubes incorporating waste glass powder and nitrile rubber fibres, where both the properties of the infill concrete and the geometric and mechanical characteristics of the steel tube are varied simultaneously. This study also develops and validates a finite element modelling framework for predicting the structural response of these sustainable composite columns with reasonable accuracy, providing insights into steel–concrete interaction and guidance for their design and optimisation.
2. Summary of Experimental Results
To develop and validate the FE model for GP and NR fibre-based sustainable concrete-filled steel tubular columns, an experimental study was previously conducted by the authors of this study. The detailed methodology and results of that study can be found in Saleheen et al. [24]. This section provides a brief overview of the experimental programme.
A total of 12 concrete mix variations were prepared. The control mix (C) consisted of conventional raw materials (e.g., cement, sand, coarse aggregates, etc.) without any recycled waste materials or fibre addition. The mixes GP10, GP20, and GP30 refer to concrete in which glass powder (GP) was used as a partial cement replacement at levels of 10%, 20%, and 30% by weight, respectively. N05 and N10 denote mixes incorporating nitrile rubber (NR) fibres at 0.5% and 1.0% by volume of concrete, respectively. The GP-N mixes represent hybrid combinations of both materials; for example, GP10-N05 corresponds to a mix containing 10% GP replacement together with 0.5% NR fibre addition. The CFST specimens consisted of 101.6 mm diameter steel tubes with a wall thickness of 3.2 mm and a length of 204 mm. The tubes were cold-formed circular hollow sections of Grade C350L0 conforming to AS/NZS 1163 [32], with a yield strength of 350 MPa. For each batch of concrete, along with one CFST stub column, three unconfined concrete cylinders of 100 mm diameter and 200 mm height were also prepared. The concrete was placed in two layers, and each layer was compacted with 25 strokes of a tamping rod. After 24 h of casting, the specimens were wrapped in plastic and cured at room temperature for 28 days.
The axial compression tests on the CFST stub columns were carried out using a 400-ton hydraulic compression-testing machine. As shown in Figure 1, to ensure uniform load transfer, a 6 mm marine ply was placed at the top of the specimen. The axial load was applied from the top of the specimens using a hydraulic load cell at a controlled low rate of 1 mm/min. The axial deformation was measured using the testing machine’s built-in displacement system and verified with an external laser displacement sensor, while transverse deformations were recorded using two laser sensors positioned on opposite sides of the specimen at mid-height. For local strain measurement, strain gauges were installed at mid-height on opposite faces of the steel tube. The load cell, displacement sensors, and strain gauges were integrated into a universal data acquisition system to continuously record load, deformation, and strain throughout the test. A summary of the experimental results, including the unconfined compressive strength of the concrete cylinders () and the ultimate load-carrying capacity of the CFST stub columns (), is presented in Table 2.
Figure 1.
CFST compression test setup. (a) General arrangement. (b) Schematic diagram [24].
All twelve confined specimens failed by outward local buckling of the steel tube (elephant-foot buckling), which was most pronounced near the ends of the specimens (see Figure 2). When the tubes were cut open after testing, the concrete core was found to be crushed next to the buckled regions of the tube. The crushing core also pushed outwards on the tube and caused bulging near mid-height The failure mode was the same for all concrete mixes, so the addition of GP and NR fibres did not change the failure mode of the confined specimens [24].
Figure 2.
Failure mode of confined specimens [24].
Figure 3 shows the experimental load–strain responses of all CFST specimens. The strains were measured by two strain gauges attached at mid-height of the steel tube, and the positive and negative strain values refer to the hoop strain and axial strain, respectively. All specimens exhibited a steep initial response, with the load increasing rapidly with relatively small increments in strain. Beyond the yield load, the rate of strain development increased, with strain increasing more rapidly under comparatively small increments in load. After reaching the peak load, the specimens exhibited different post-peak responses. While some of the specimens exhibited a post-peak descending branch, others exhibited a relatively flat plateau or strain-hardening behaviour. The latter responses became more pronounced with increasing GP and NR fibre contents, which reduced the compressive strength of the infill concrete and consequently influenced the post-peak response of the composite columns. Due to the excessive deformation of the steel tube during the post-peak stage, some strain gauges were damaged and ceased recording before completion of the tests. Consequently, some of the load–strain curves terminate before the end of the test.
Figure 3.
Experimental load–strain response of the confined specimens. (a) C, GP, and N series. (b) GP-N series [24].
3. Finite Element Modelling
The numerical investigation was carried out using the commercial finite element software Abaqus. This section details the material constitutive models adopted for the steel tube and concrete, along with a detailed description of the finite element modelling methodology, including model development, interaction definitions, boundary conditions, and analysis procedures implemented in Abaqus.
3.1. Material Models
3.1.1. Steel Tube
Different researchers have adopted different material models for steel. For example, Schneider [33] adopted an elastic–perfectly plastic model with no strain hardening, whereas Xiong and Zha [34], as well as Guo et al. [35], used elastic–plastic models with linear strain hardening. In contrast, Abdel-Rahman and Sivakumaran [36] proposed an elastic–plastic model with multilinear strain hardening. Since the axial load–deformation response of the hollow steel tubes used in this study exhibited a bilinear trend with strain-hardening behaviour [24], an elastic–plastic constitutive model with linear strain hardening, as proposed by Han and Huo [37], was adopted to model the steel material in Abaqus, as shown in Figure 4b. The model consists of two distinct stages: a linear elastic stage followed by a plastic stage with linear hardening . The stress–strain relationship is given by Equation (1), where is the yield strength of steel and is the corresponding strain, expressed as . The Young’s modulus of elasticity () of steel was taken as 200 GPa, the strain hardening modulus () was taken as , and the Poisson’s ratio was taken as 0.3 [37,38].
Figure 4.
Stress–strain model for (a) confined concrete (b) steel.
3.1.2. Infill Concrete
When CFST columns are subjected to monotonic axial compression, the infill concrete undergoes lateral expansion and is restrained by the surrounding steel tube. This restraint induces confining pressure on the concrete, resulting in a triaxial stress state that significantly enhances both the strength and ductility of the infill concrete. As this confinement is activated only after lateral expansion of the concrete, it is known as passive confinement. This interaction between the steel tube and the concrete infill, commonly termed composite action, also improves the overall structural performance.
- Elastic Parameters
In Abaqus, the elastic behaviour of concrete is defined by two parameters: Young’s modulus of elasticity and Poisson’s ratio. For concrete without NR fibres, the modulus of elasticity () was determined using Equation (2), as recommended by ACI 318 [39]. However, for concrete with NR fibres, the modulus of elasticity () was calculated using Equation (3), proposed by Bompa et al. [40] for rubberised concrete.
The Poisson’s ratio of conventional concrete typically ranges from 0.15 to 0.22 [41,42]. Accordingly, for concrete without NR fibres, the Poisson’s ratio () was taken as 0.20. For concrete containing NR fibres, a rule of mixtures was employed to estimate the effective Poisson’s ratio, as shown in Equation (4), where and are the volume fractions of concrete and NR fibres, respectively, and and are the Poisson’s ratios of concrete and NR fibres, taken as 0.20 and 0.41, respectively [43].
- b.
- Stress–Strain Relationship
In this study, the inelastic behaviour of infill concrete was modelled using the Concrete Damage Plasticity (CDP) model of Abaqus, which combines plasticity theory with isotropic damage to simulate the nonlinear behaviour of concrete. For CFST columns, the concrete constitutive model should be capable of representing the composite action induced by passive lateral confinement from the steel tube. However, previous studies have shown that the hardening–softening behaviour derived from stress–strain relationships of unconfined concrete is unable to accurately capture the response of passively confined concrete [44]. Consequently, different researchers have proposed various approaches to incorporate confinement effects. Hu et al. [45] adopted the model proposed by Mander et al. [46], which employs empirical equations for confining pressure together with theoretical formulations to account for the enhancement in strength and ductility due to confinement. Yu et al. [44] introduced a confinement-dependent strain hardening–softening rule combined with a modified flow rule to represent the passive confinement provided by FRP. However, this approach requires specialised input data (e.g., axial–lateral strain relationships of concrete under various confining pressures) that are not readily available [44,47,48]. Azad and Uy [47] conducted a series of numerical simulations based on existing confinement models reported in the literature [45,48,49,50,51], and concluded that the confined concrete model proposed by Tao et al. [48] showed the best agreement with experimental results. Accordingly, the confined concrete model developed by Tao et al. [48] was adopted in this study to define the constitutive behaviour of the infill concrete. In this model, the confinement provided by the steel tube is reflected through the enhanced ductility and the modified post-peak response of the concrete.
As shown in Figure 4a, the confined concrete model proposed by Tao et al. [48] consists of three distinct stages. Owing to the difference in Poisson’s ratios of steel and concrete, initially there is little to no interaction between the steel tube and the concrete core. At low axial strains, the concrete exhibits smaller lateral expansion than the steel, resulting in negligible or no confinement. As the axial strain increases, the lateral expansion of the concrete exceeds that of the steel tube, activating the confinement effect. Therefore, Tao et al. [48] suggested that the stress–strain relationship of unconfined concrete can be adopted for the initial ascending branch (OA) of the curve. For the control concrete and glass powder concrete, the model proposed by Samani and Attard [52] was adopted to define the initial ascending branch (OA) of the stress–strain curve, as given in Equation (5), where and The strain at peak stress under uniaxial compression () is calculated according to Equation (6), given by De Nicolo et al. [53].
Previous studies have demonstrated that the incorporation of rubber significantly alters the stress–strain behaviour of concrete [54,55]. At present, no constitutive models are available specifically for NR fibre concrete. Therefore, in this study, the stress–strain relationship developed by Bompa et al. [40] for rubberised concrete containing crumb rubber particles was adopted to represent the stress–strain behaviour of NR fibre concrete. Accordingly, the OA portion of the curve for concrete containing NR fibres was calculated using Equation (7), where the elastic strain of NR fibre concrete . The strain at peak axial stress () of NR fibre concrete was determined using Equation (8), where is the volumetric percentage of NR fibres in concrete.
In the second stage, the enhanced peak strain () at point B was calculated using Equation (9), as proposed by Samani and Attard [52]. In this formulation, represents the confining stress at point B, which can be calculated using Equation (10). For NR fibre concrete, in Equation (9), was replaced with to account for the influence of NR fibres, which enhance the deformability and peak strain capacity of the concrete. The descending branch (BC) of the stress–strain curve was determined using Equation (11), as proposed by Binici [56]. The residual strength of confined concrete () was calculated as per Equation (12), in which the confinement factor , where and are the cross-sectional areas of the steel tube and concrete core, respectively [29].
- c.
- Plasticity parameters for CDP model
The key plasticity parameters of the CDP model in Abaqus include the dilation angle (), ratio of the second stress invariant on the tensile meridian to that on the compressive meridian (), flow potential eccentricity (), ratio of the compressive strength under biaxial loading to uniaxial compressive strength (), and viscosity parameter. Although constant values for these parameters have been adopted in previous studies [51], Tao et al. [48] suggested that, due to the complex behaviour of passively confined concrete, using constant values may not adequately represent the material behaviour in all scenarios. Therefore, different values were adopted in this study for different concrete mixes to more accurately capture the confinement effects.
Typical values of the dilation angle range from 20° to 30° [57]. However, dilation angles as high as 40–55° have been reported for high-strength concrete, while values as low as 10–15° have been adopted for rubberised concrete [58,59]. An increase in the dilation angle leads to greater volumetric expansion of concrete, thereby enhancing the interaction between the steel tube and the concrete core and resulting in higher axial capacity or peak load [57]. Moreover, Elchalakani et al. [57] reported that reducing the value leads to an increase in both the peak load and residual strength of CFST specimens. Since and values cannot be directly measured in standard material tests, previous studies have determined the and values through a sensitivity analysis or calibration against test results [60,61,62,63]. A similar approach was used in this study, where and were determined through a sensitivity analysis for each of the 12 concrete batches. The final values were selected based on the agreement between the FE predictions and the corresponding experimental peak load and load–strain responses and are shown in Table 1. Overall, a decreasing trend in the dilation angle was observed with decreasing concrete strength and increasing rubber fibre content, which aligns with the findings of the existing literature [64]. Unlike the dilation angle, relatively small variations in were required across the 12 concrete batches. The adopted values ranged from 0.75 to 0.80. Additionally, in this study, was determined using the empirical expression proposed by Papanikolaou and Kappos [65], as given in Equation (13). The flow potential eccentricity was set at 0.1 and a small value of 0.002 was selected for the viscosity parameter.
Table 1.
Plasticity parameters of the CDP model.
3.2. Element Type and Mesh Sensitivity
One of the most critical steps in FE analysis is the accurate development of the physical model of the CFST specimens, as the reliability of the numerical results strongly depends on how realistically the CFST specimens are represented in the model. In this study, two different types of elements were used. The concrete core was modelled using eight-node brick elements with reduced integration (C3D8R), while the steel tube was modelled using four-node reduced integration shell elements (S4R). Shell elements were selected for the steel tube because they are capable of accurately capturing local buckling behaviour of thin-walled steel tubes while maintaining reasonable computational efficiency [66].
To identify an optimal mesh size that ensures adequate accuracy with reasonable computational efficiency, a mesh sensitivity analysis was conducted. Several mesh sizes were examined, namely D/5, D/10, D/15, and D/20, where D denotes the outer diameter of the CFST specimens. The corresponding peak loads were 838 kN, 851 kN, 859 kN, and 861 kN, respectively. As shown in Figure 5, the load–strain response for mesh sizes D/15 and D/20 is almost identical, and the difference in peak load is only 0.2%. Therefore, further mesh refinement was considered unnecessary, and a mesh size of D/15 was adopted as an optimal compromise between accuracy and computational efficiency. This mesh size is similar to (or finer than) those used in previous studies [62,67,68], which further supports the suitability of the selected mesh. As reported in the literature [48,66,69], the effects of residual stresses and initial geometric imperfections for CFST stub columns are insignificant, and the concrete infill minimises their effect. Therefore, they were not included in the FE models in this study. Lastly, since reduced integration elements were adopted for both the infill concrete and steel tube, the artificial strain energy ratio was monitored throughout each analysis. The ratio remained below 5% for all models, indicating that hour-glassing had negligible influence on the FE model responses.
Figure 5.
Load–strain graph for different mesh sizes.
3.3. Interaction, Boundary Condition, and Load
The interaction between the concrete core and the steel tube was modelled using a surface-to-surface contact formulation available in the Abaqus library. The steel tube was defined as the master surface, while the concrete was defined as the slave surface. For the normal contact behaviour, a “hard contact” formulation was adopted, allowing separation after contact. A Coulomb friction model was employed to simulate the tangential behaviour of the steel–concrete interface. Previous studies have reported that the friction coefficient between steel and concrete typically ranges from 0.25 to 0.6 [33,51,70,71]. Accordingly, a sensitivity analysis was conducted using four commonly adopted values: 0.25, 0.30, 0.50, and 0.60. The resulting load–axial strain curves were almost identical, with negligible differences in initial stiffness, ultimate load, and post-peak behaviour. This finding is consistent with Tao et al. [48], who reported that the behaviour of CFST stub columns is not sensitive to the friction coefficient when the steel tube and the infill concrete are loaded simultaneously. Therefore, a friction coefficient of 0.5 was adopted in this study, following the recommendations of Kumar et al. [72] and Ding et al. [62]. This value lies towards the upper bound of the commonly reported range and has been shown to improve numerical convergence compared with lower-bound values [73].
As shown in Figure 6, two reference points (RPs) were created near the top and bottom ends of the specimens, and rigid body constraints were used to tie each RP to the corresponding steel tube and concrete core surfaces. The bottom RP was fully restrained against all six translational and rotational degrees of freedom (DOFs). The top RP was restrained against all DOFs except the vertical translational DOF, along which the axial load was applied. The loading was applied in a displacement-controlled mode in small increments, consistent with the experimental loading conditions.
Figure 6.
Details of the finite element model.
4. Validation of FE Modelling
To ensure the reliability of the FE models, the numerical results were validated against the experimental data reported in Saleheen et al. [24]. In total, results from 12 specimens were used for validation, including one control specimen; three specimens incorporating GP as partial cement replacement at levels of 10%, 20%, and 30%; two specimens containing NR fibres with fibre contents of 0.5% and 1.0%; and six specimens combining GP and NR fibres.
Three key parameters were selected for validation, namely ultimate load, failure mode, and load–axial strain relationships. In the experimental test setup, a 6 mm marine ply was placed between the loading plate and the top of the CFST specimen to ensure uniform load distribution. Consequently, the global load–deformation curves reported in Saleheen et al. [24] include the deformation of both the CFST specimen and the marine ply. This resulted in deformation values that were larger than the actual deformation of the CFST columns and therefore unsuitable for direct comparison with the numerical results. Thus, the numerical load–axial strain responses were used for validation and compared with the corresponding experimental results. The experimental strain values presented in Saleheen et al. [24] were obtained from strain gauges attached near the mid-height of the outer steel tube. Accordingly, strains in the numerical models were extracted from the same location. In addition, the ultimate load-carrying capacity and the failure mode of the specimens were also compared to further assess the accuracy of the FE models.
The ultimate load of the specimen was defined as the peak load attained within an axial strain limit of 5%. Table 2 reports the ultimate load obtained from FE analysis , the experimentally measured ultimate load , and the ratio of ultimate load derived from FE and experiments . The ratio ranges from 0.96 to 1.00, with a mean value of 0.98 and a coefficient of variation (COV) of 1.36%, indicating close agreement between the FE predictions and the experimental results. The mean absolute error (MAE), root mean square error (RMSE), and mean absolute percentage error (MAPE) are 17.6 kN, 20.3 kN, and 2.14%, respectively. Moreover, as shown in Figure 7, the load–axial strain curves obtained from the FE analysis showed good correlation with the experimental results.
Table 2.
Details of validated specimens.
Figure 7.
Comparison of load–axial strain curves of experimental and FE models.
During the experiments, the CFST specimens predominantly failed through outward local buckling of the steel tubes (elephant-foot buckling) near the top and bottom ends. In addition, bulging of the concrete core was observed near the mid-height of the specimens, indicative of a drum-like failure mode. In the FE analysis, the failure mode was identified by examining the stress distribution, deformed shape, and the localisation of plastic strain. Figure 8 compares the experimentally observed and numerically predicted failure patterns. Similarly to the experimental observations, the FE models demonstrated outward local buckling of the steel tubes near the top and bottom ends and drum-like bulging of the concrete core near the mid-height of the specimens. This close agreement indicates that the FE models in this study are capable of simulating the observed experimental behaviour with reasonable accuracy. Moreover, the ultimate load and load–axial strain results show that the combined constitutive relationships proposed by Tao et al. [48] and Bompa et al. [40] for infill concrete provide a reasonable representation of GP and NR fibre concrete in CFST columns.
Figure 8.
Comparison of typical failure modes of experimental and FE models.
5. Parametric Studies
In order to investigate the effects of key geometric and material parameters on the axial compressive behaviour of GP and NR fibre-based sustainable concrete-filled steel tubes, a comprehensive parametric study was conducted using the FE models validated in Section 4. All numerical models were developed in accordance with the modelling procedures outlined in Section 3.
In this study, a total of 96 FE models were analysed. The parametric study was structured into three groups to systematically evaluate the effects of steel tube diameter (D), thickness (t), and yield strength. In addition to the variation in steel parameters, twelve different concrete compositions were considered, incorporating varying percentages of GP and NR fibres, both independently and in hybrid combinations. This approach enabled a comprehensive assessment of the combined influence of steel confinement characteristics and sustainable concrete modifications on the axial compressive performance of CFST stub columns. In Group 1, the influence of steel tube diameter was investigated by maintaining a constant tube thickness of 3.2 mm and varying the outer diameter. Four diameters were considered: 76.1 mm, 101.6 mm, 165.1 mm, and 219.1 mm. Group 2 examined the effect of tube thickness while keeping D constant at 101.6 mm. Three thicknesses were considered, namely 1.15 mm, 3.2 mm, and 6.7 mm. In both Groups 1 and 2, the yield strength of the steel tube was kept at 350 MPa. In Group 3, the effect of steel yield strength was evaluated by varying from 250 MPa to 450 MPa, while all other parameters were kept constant. Since the present study focuses on the behaviour of stub columns incorporating GP and NR fibre concrete, the length-to-diameter (L/D) ratio was maintained at 2 for all models to eliminate global buckling effects [74,75]. Table 3 summarises the details of the parametric study, including the key parameters and their corresponding ranges.
Table 3.
Details of parametric study model parameters.
6. Results of Parametric Studies
6.1. Performance Indices
To gain better insight into the influence of different geometrical and material properties on GP and NR fibre-based sustainable CFST columns, several performance indices were adopted in this study. The ultimate load () was defined as the peak load attained within an axial strain limit of 5% [24,76,77]. is the peak stress of the confined concrete columns, calculated by dividing by the total cross-sectional area of the columns (). The strength enhancement due to confining the concrete by steel tubes was quantified using the strength enhancement ratio () and strength index (SI). The strength enhancement ratio () is the ratio of peak stress of confined concrete columns () to the compressive strength of unconfined concrete (). The SI coefficient is defined in Equation (14) [78], where is the ultimate load of the composite columns derived from FE analysis, and is the sectional capacity of the composite column. The Steel Contribution Ratio () and Concrete Contribution Ratio () were employed to quantify the respective contributions of the steel tube and the concrete core to the ultimate axial load-carrying capacity of the CFST columns. The and can be determined using Equations (15) and (16), respectively, where and are the axial loads carried by the steel tube and concrete core, respectively [66].
Before reaching the plastic region, the CFST columns exhibited predominantly linear behaviour. Therefore, the initial compressive stiffness () of the columns can be defined as the secant modulus corresponding to . This approach has been widely adopted for evaluating the axial compressive stiffness of composite columns [38,79].
To evaluate the energy absorption behaviour, the elastic energy absorption capacity () was adopted in this study. The area under the load–deformation curve in the pre-peak region, from the initial loading stage to 75% of and the corresponding deformation (), was used to calculate the , as expressed in Equation (17) [80]. Lastly, in this study, the ductility of the confined columns was quantified using an energy-based ductility index (μ), as proposed by Duarte et al. [64] and expressed as , where and denote the energy corresponding to the peak and yield loads, respectively. The peak load was taken as the highest load attained within an axial strain limit of 5%, and the yield load was taken at around 75% of the peak load [24,38,76,77,81,82]. The absorbed energy was calculated as the area enclosed beneath the axial load–deformation curve, which can be expressed as: .
6.2. Analysis of Load–Deformation Curve
The axial response of the CFST columns can be broadly divided into three stages. In the initial linear-elastic stage, the load–deformation curve exhibits a steep initial slope. During this stage, the steel tube and the concrete core carry the axial load largely independently, and the load increases linearly with increasing axial deformation. The second stage corresponds to the elastic–plastic transition. At this stage, microcracking initiates in the concrete core and the concrete begins to expand laterally. This volumetric expansion activates the confinement effect provided by the surrounding steel tube. As a result of this confinement, the average longitudinal stress in the concrete cross-section exceeds the unconfined compressive strength .
A dimensionless parameter, the confinement factor (), was used to quantify the level of confinement, which is defined as . Depending on the level of confinement, the post-peak behaviour of the columns can be broadly classified into three categories (see Figure 9). Type 1 behaviour occurs when the confinement factor , where the load–deformation curve exhibits a descending branch after reaching the peak load, indicating strain-softening behaviour. When , the column demonstrates perfectly plastic behaviour, characterised by a relatively stable plateau in the load–deformation response following the peak load. In contrast, Type 3 behaviour is observed when , where the post-peak response shows a strain-hardening trend, with the load continuing to increase with increasing deformation due to the strong confinement effect provided by the steel tube. Han et al. [29] proposed that for circular CFST specimens, the value of is around 1.1, which was in agreement with the findings of this study.
Figure 9.
Axial load–deformation behaviour.
6.3. Influence of Steel Tube Diameter ()
The axial load–deformation curves of Group 1 specimens with different types of infill concrete (e.g., C, GP, N, combined GP-N) are shown in Figure 10. As shown in Figure 11, the initial stiffness of the CFST columns increased with increasing D. For instance, in the D76,C specimen, the was 290 × 103 kN, which increased by 60%, 268%, and 508%, when D was increased to 101.6, 165.1, and 219.1 mm, respectively. Consequently, the elastic energy absorption capacity of the CFST columns also increased with increasing D. The D76,C column had an value of 50 N-m, which increased by 82%, 536%, and 1154% when D was increased to 101.6, 165.1, and 219.1 mm, respectively. Along with the EA and values, the ultimate capacity of the specimens also increased when D was increased. The D76,C column had of 572 kN, which increased by 50%, 223%, and 423% when D was increased to 101.6, 165.1, and 219.1 mm, respectively. The observed increase in , , and can be primarily attributed to the enlargement of the concrete core area associated with a larger column diameter. The increased concrete area enhances the load-carrying capacity of the composite section resulting in improved axial resistance and greater structural rigidity.
Figure 10.
Load–deformation curve of Group 1 CFST columns.
Figure 11.
Performance indices for Group 1 (a) initial elastic stiffness, (b) elastic energy absorption capacity, (c) ultimate load.
The post-peak behaviour of the CFST columns generally followed two main trends. The D165 and D219 columns, irrespective of the type of concrete infill, predominantly exhibited Type 1 load–deformation behaviour, characterised by a descending branch after the peak load. In contrast, the D76 columns showed Type 3 behaviour, indicating a strain-hardening response due to the stronger confinement effect associated with the smaller and higher ξ. The D101 series columns with control concrete infill exhibited Type 1 behaviour. However, with the incorporation of GP and NR fibres, the post-peak response gradually transitioned to Type 2, and eventually to Type 3 behaviour, indicating a progressive improvement in the stability and ductility of the load–deformation response.
6.4. Influence of Steel Tube Thickness ()
The axial load–deformation responses of the Group 2 CFST columns with different types of infill concrete are presented in Figure 12. As illustrated in Figure 13, the initial stiffness of the column increased with increasing steel tube thickness. For example, the t = 1.15,C column had an EA of 357 × 103 kN, which increased by 30% and 76%, when the steel tube thickness was increased to 3.2 and 6.7 mm, respectively. Similarly, the benchmark was 64 N-m, which increased by 43% and 166%, when the steel tube thickness was increased to 3.2 and 6.7 mm. The ultimate axial capacity () followed the same trend. The t = 1.15,C column achieved an ultimate capacity of 629 kN, which increased by 36% and 111% as increased to 3.2 mm and 6.7 mm, respectively. These results demonstrate that increasing the steel tube thickness significantly enhances the stiffness, energy absorption capacity, and ultimate load-carrying capacity of the CFST columns. In contrast, as the wall thickness reduces, the confinement effectiveness and overall stability of the column diminish, making it more susceptible to premature local buckling.
Figure 12.
Load–deformation curve of Group 2 CFST columns.
Figure 13.
Performance indices for Group 2 (a) initial elastic stiffness, (b) elastic energy absorption capacity, (c) ultimate load.
The post-peak behaviour of the CFST columns with varying steel tube thickness generally followed three trends. The columns with t = 1.15 mm predominantly exhibited Type 1 load–deformation behaviour, characterised by a descending branch after the peak load. This behaviour can be attributed to the larger D/t ratio and the associated smaller confinement factor (ξ), which results in relatively weak confinement of the concrete core. For the t = 3.2 mm specimens, the post-peak response showed intermediate behaviour. The columns with control concrete exhibited Type 1 behaviour. However, with the incorporation of GP and NR fibres, the response gradually transitioned towards Type 2 behaviour, characterised by a relatively stable plateau after the peak load. This indicates an improvement in post-peak stability due to enhanced material ductility and moderately improved confinement. In contrast, the columns with t = 6.7 mm mainly exhibited Type 3 behaviour, where the load–deformation curves displayed a strain-hardening trend in the post-peak region. This response is associated with the smaller D/t ratio and higher confinement factor provided by the thicker steel tube, which results in stronger confinement of the concrete core and consequently improved ductility and post-peak load-carrying capacity.
6.5. Influence of
As shown in the previous sections, the effect of the diameter-to-thickness () ratio was investigated in two stages. In Group 1, the diameter of the steel tubes was varied while maintaining a constant wall thickness. In Group 2, the diameter was kept constant and the wall thickness was varied. In total, six different ratios were examined for each of the twelve concrete variations. In Group 1, ratios of 23.8, 31.8, 51.6, and 68.5 were considered, while in Group 2, ratios of 15.2, 31.8, and 88.3 were analysed. To further investigate the effects of D/t ratio, performance indices including SI, , SCR, and CCR were examined for Group 1 and Group 2 CFST columns with different concrete infill types.
The SI values of CFST columns with = 15.2 ranged from 1.20 to 1.33. As the ratio increased, the SI values exhibited a decreasing trend (see Figure 14a). However, beyond a ratio of 51.6, the SI values approached unity, ranging approximately between 1.01 and 1.04. Since the SI remained greater than unity for all ratios, the ultimate axial capacities of the CFST specimens exceeded their corresponding cross-sectional capacities, indicating that confinement provided by the steel tube remained effective across the entire range of ratios that were investigated.
Figure 14.
Performance indices of Group 1 and Group 2: (a) strength index, (b) ductility index.
As shown in Figure 14b, the ductility index was observed to be highly sensitive to the ratio. The DI of the control specimens for = 15.2 was 74, which reduced to 3 when the ratio increased to 88.3. Overall, the DI exhibited a decreasing trend as the ratio increased, and specimens with higher ratios such as 68.5 and 88.3 showed very minor change in DI values.
The load-sharing behaviour between the steel tube and the concrete core was also strongly influenced by the ratio. The SCR increased with decreasing , indicating a greater contribution from the steel tube when the tube wall was thicker. For example, in the control specimens, SCR increased from 0.20 to 0.64, when was decreased from 88.3 to 15.2 (see Figure 15b). In contrast, the CCR decreased from 0.80 to 0.36 in that range. This indicates that as the steel tube becomes thinner, a larger proportion of the axial capacity is carried by the concrete core.
Figure 15.
Performance indices of Group 1 and Group 2: (a) strength enhancement ratio, (b) SCR and CCR.
In Group 1, the ultimate axial capacity of the specimens increased with increasing , whereas in Group 2, the ultimate axial capacity decreased with increasing . Therefore, to consistently evaluate the effectiveness of confinement across both groups, the strength enhancement ratio was used. The results showed that the strength enhancement ratio () increased as the ratio decreased. For instance, in the control mix, the ratio increased from 1.25 to 2.66 as the ratio decreased from 88.3 to 15.2 (see Figure 15a). A similar trend was observed for all other concrete types, indicating that the confinement effect becomes more pronounced at lower ratios due to the greater lateral restraint provided by thicker steel tubes.
Figure 16 shows the failure mode of the CFST columns for different ratios. The columns predominantly failed through outward local buckling of the steel tube near the ends, accompanied by bulging of the concrete core around the mid-height. The local buckling became more pronounced with increasing ratio. In columns with lower ratios, the plastic strain was distributed over a larger portion of the column height, whereas in columns with higher ratios, it was concentrated in narrower bands. This behaviour is consistent with the lower confinement factor and the Type 1 post-peak behaviour observed in columns with higher ratios.
Figure 16.
Failure modes of CFST columns with different D/t ratios: (a) D/t = 15.2, (b) D/t = 23.8, (c) D/t = 31.8, (d) D/t = 51.6, (e) D/t = 68.5, (f) D/t = 88.3.
6.6. Influence of Steel Yield Strength
The influence of steel yield strength on the behaviour of CFST columns was evaluated in Group 3 by varying from 250 MPa to 450 MPa. The axial load–deformation curves of Group 3 CFST columns are shown in Figure 17. The ultimate capacity increased consistently with increasing steel yield strength for all infill concrete types. For example, in the control specimens, the ultimate axial capacity at = 250 MPa was 724 kN, which increased by 19% and 37% when was increased to 350 MPa and 450 MPa, respectively (see Figure 18a). Similar trends were observed for all modified concretes, reflecting the greater load-carrying capacity of higher-strength steel tubes.
Figure 17.
Load–deformation curve of Group 3 CFST columns.
Figure 18.
Performance indices of Group 3: (a) ultimate load, (b) strength index.
The load–axial deformation responses of the CFST columns exhibited different post-peak behaviours depending on the steel yield strength and the type of infill concrete. For specimens with steel yield strengths of 250 MPa and 350 MPa, the control concrete primarily showed Type 1 post-peak behaviour, characterised by a noticeable reduction in load immediately after reaching the peak load. This indicates limited post-peak stability when conventional concrete is used with lower-strength steel tubes. However, with the incorporation of GP and NR fibres, the post-peak response gradually transitioned towards Type 2 behaviour, where the load reduction after the peak became less pronounced and the curves exhibited a relatively stable plateau. In contrast, specimens with = 450 MPa generally demonstrated Type 3 post-peak behaviour, characterised by strain hardening after the initial peak load. The higher-strength steel tube provides stronger confinement to the concrete core, allowing the composite section to maintain or slightly increase its load capacity during the post-peak stage. This strain-hardening type response was consistently observed across all concrete mixes.
The ratio and SI also increased with increasing . As shown in Figure 19a, in the control mix, increased from 1.44 at = 250 MPa to 1.71 and 1.98 at = 350 MPa and 450 MPa, respectively. The SI values ranged from 1.05 to 1.21 and showed an increasing trend with increasing (see Figure 18b). This improvement in SI indicates that higher-strength steel enhances the confinement interaction between the steel tube and concrete core, resulting in greater strength enhancement of the composite section.
Figure 19.
Performance indices of Group 3: (a) strength enhancement ratio, (b) SCR and CCR.
The load-sharing mechanism between the steel tube and the concrete core was also influenced by the steel yield strength. The SCR increased with increasing , indicating a greater contribution from the steel tube to the overall axial resistance. For example, in the control specimens, SCR increased from 0.41 to 0.50 as increased from 250 MPa to 450 MPa. Conversely, the CCR decreased from 0.59 to 0.50, suggesting that a smaller proportion of the axial load was carried by the concrete core as the strength of the steel tube increased (see Figure 19b).
Figure 20 shows the failure mode of the CFST columns for different steel yield strengths. The columns predominantly failed by outward local buckling of the steel tube near the ends and bulging near the mid-height of the columns. Moreover, with increasing , the plastic strain became distributed over a larger portion of the column height rather than concentrating within a smaller region around the mid-height. This behaviour is consistent with the enhanced confinement and the Type 3 post-peak response observed with increasing .
Figure 20.
Failure modes of CFST columns with different steel yield strengths: (a) fsy = 250 MPa, (b) fsy = 350 MPa, (c) fsy = 450 MPa.
6.7. Effect of GP and NR in Infill Concrete
As shown in Table 2, the compressive strength of unconfined concrete cylinders decreased with the inclusion of both GP and NR fibres. For GP-only mixes, a strength reduction of approximately 15–20% was observed with 10–30% cement replacement, while the inclusion of 0.5–1% NR fibres resulted in a reduction of about 14–22%. The reduction became more pronounced when GP and NR fibres were used in combination; for instance, a maximum strength loss of approximately 32% was recorded for the GP30-N10 mix.
However, in CFST columns, the passive confinement provided by the steel tube partially compensated for this strength loss. The degree of recovery was strongly dependent on the ratio. At a lower ratio of 15.2, the maximum strength reduction decreased from 32% (unconfined) to approximately 15%, indicating a recovery of about 17% due to effective confinement. However, at a higher ratio of 88.3, the strength reduction remained around 26%, corresponding to only about 6% recovery. This demonstrates that stronger confinement (lower D/t) is highly effective in offsetting the strength reduction associated with GP and NR incorporation, whereas the recovery becomes limited when the is relatively higher. Consequently, the enhanced confinement provided at lower ratios leads to higher values for mixes incorporating GP and NR fibres.
7. Comparison of FE-Model Axial Capacities with Existing Theoretical Models
Several national standards and empirical models are available for predicting the axial capacity of CFST columns. However, most of these models were developed and calibrated primarily for conventional CFST columns filled with plain concrete, and their applicability to CFST columns incorporating GP and NR fibres remains uncertain. Therefore, the ultimate axial capacities obtained from the 96 parametric models were evaluated against eight existing prediction models. The selected models comprised several national design standards, including Eurocode [83], AS 5100 [84], AISC 360 [85], and AIJ [86], as well as empirical models proposed by Giakoumelis and Lam [87], Sakino et al. [28], Lu and Zhao [88], Han et al. [29], and Goode and Narayanan [89]. The corresponding theoretical equations for these models are presented in Table 4. The notations and nomenclature used in these equations are provided in the respective cited references and are therefore not repeated in this section. For consistency in the comparison, all partial safety factors were taken as unity.
Table 4.
Selected existing models for axial capacity prediction of CFST columns.
The comparison between the predicted and FE model ultimate strengths of the CFST columns is presented in Figure 21 to assess the variation among the prediction models. To facilitate a consistent comparison between the predictions and the FE results, a model error () parameter was introduced, defined as the ratio of the FE model ultimate strength () to the ultimate strength predicted by theoretical models (). In addition, the statistical characteristics of the values were evaluated, including the mean, minimum, maximum, coefficient of variation (COV), and confidence intervals at two different percentiles, as summarised in Table 5.
Figure 21.
Axial capacity of CFST columns: FE model vs. theoretical prediction.
Table 5.
Statistical parameters through model analysis.
Among the design codes evaluated, Eurocode [83] and AS 5100 [84] yielded a mean ME of 0.90, whereas AISC 360 [85] produced a mean ME of 1.15. These results indicate that Eurocode [83] and AS 5100 [84] generally overpredicted the FE-derived ultimate axial capacity of the CFST columns, while AISC 360 [85] tended to underpredict it. The ME values for Eurocode [83] and AS 5100 [84] ranged from 0.85 to 1.00, corresponding to an overprediction of the FE-derived axial capacity of up to 15%. In contrast, the ME values for AISC 360 [85] ranged from 1.08 to 1.36, indicating an underprediction of up to 36%. AIJ [86] showed the most consistent predictions among the four design codes, with values ranging from 1.00 to 1.16 and a mean of 1.05. These differences among the design codes can be attributed to the different ways in which the confinement effect of the steel tube is considered. AISC 360 [85] does not account for the confinement effect and limits the compressive strength of the core concrete to . In contrast, Eurocode [83] and AS 5100 [84] account for the increase in concrete strength due to the confining effect of the steel tube. Although AIJ [86] limits the core concrete strength to , it uses a factor η to increase the contribution of the steel tube, thereby indirectly accounting for the confinement effect.
Among the models proposed by previous researchers, the model of Goode and Narayanan [89] gave the mean ME closest to unity, with a value of 1.00, followed by the models of Sakino et al. [28] and Han et al. [29], with mean ME values of 0.99 and 1.01, respectively. The model of Lu and Zhao [88] gave a mean ME of 0.93 and consistently overpredicted the FE-derived ultimate axial capacity across the parametric range. The model of Giakoumelis and Lam [87] gave a mean ME of 0.97, which was close to unity; however, its ME values ranged from 0.85 to 1.24, with a COV of 9.67%.
Among the prediction models, AIJ [86] gave the lowest COV of 3.09%, followed by the models of Sakino et al. [28] and Lu and Zhao [88], with COV values of 3.21% and 3.23%, respectively. Apart from the model of Giakoumelis and Lam [87], the COV values for the remaining seven models ranged from approximately 3% to 6%. This indicates relatively low variability and a consistent level of agreement with the FE results across the parametric range.
Considering the mean, COV, and other statistical characteristics of ME, the models of Sakino et al. [28] and Goode and Narayanan [89] showed close agreement with the FE results for the CFST stub columns incorporating GP and NR fibre concrete over the ranges of diameter, wall thickness, and steel yield strength considered in this study. Among the design codes, AIJ [86] produced the lowest scatter, while remaining slightly conservative, with a mean ME corresponding to an underprediction of approximately 5.5% of the FE-derived ultimate capacity.
8. Conclusions
This study presents a comprehensive numerical investigation into the axial compressive behaviour of CFST stub columns incorporating concrete with recycled GP and NR fibres. The FE model was validated against available experimental data and showed close agreement with the measured structural response. A parametric study was conducted to examine the influence of key variables, including steel tube geometry (diameter and thickness), steel yield strength, and the material properties of GP–NR concrete. Based on the results, the following conclusions can be drawn:
- The FE model developed in Abaqus showed close agreement with the experimental results, with ultimate load ratios ranging from 0.96 to 1.00.
- The incorporation of GP (10–30%) and NR fibres (0.5–1%) led to a reduction in compressive strength of unconfined concrete, with the maximum reduction reaching approximately 32% for hybrid mixes. However, steel confinement effectively mitigated this loss.
- Increasing the steel tube thickness and diameter substantially enhanced the axial stiffness, energy absorption capacity, and ultimate load. However, increasing the diameter at a constant thickness increased the ratio, shifting the post-peak response from strain hardening to strain softening, whereas increasing the thickness produced the opposite effect.
- The confinement effectiveness was strongly governed by the ratio. Lower ratios significantly enhanced strength, ductility, and post-peak stability, whereas higher ratios resulted in reduced confinement efficiency and more brittle behaviour.
- An increase in steel yield strength enhanced the axial capacity and confinement interaction, resulting in higher strength indices and improved post-peak performance.
- The FE axial capacities were compared with several theoretical models and design codes. The models of Sakino et al. [28] and Goode and Narayanan [89], along with the AIJ [86] design code, provided the closest predictions of the FE ultimate loads.
Overall, this study indicates that GP and NR fibre concrete can be effectively used in CFST columns when sufficient confinement is provided. The findings address an important research gap by quantifying the effect of steel geometry and material properties on confinement behaviour and provide a basis for future development of constitutive models and design guidelines for sustainable composite structures.
9. Limitations and Future Recommendations
The FE model was validated against 12 experimental stub columns with different infill concrete variations incorporating varying percentages of GP and NR fibres. The subsequent parametric study extends the application of the validated model beyond the experimentally investigated parameters. Although the model showed good agreement with the experimental results, and the effects of confinement were incorporated using an established confinement model developed and verified over a wide range of concrete and steel material and geometric parameters, a small degree of uncertainty remains when applying the FE model to configurations not directly covered by the experimental programme. Therefore, further experimental validation over a wider range of parameters is recommended.
In the absence of a constitutive model for NR fibre concrete, an engineering approximation was made by adopting modified form of the model proposed by Bompa et al. [40], which requires further verification against larger datasets. Once such data are available, the authors recommend future work on the development of a constitutive model for NR fibre concrete.
The quantitative CO2 reduction discussion presented in this study is limited to cement reduction and waste utilisation. A detailed environmental assessment and life cycle assessment of concrete incorporating glass powder and nitrile rubber fibres was not undertaken and is therefore recommended in future work. The estimated reduction in CO2 emissions also excludes the emissions associated with collecting and grinding the waste glass into GP.
Author Contributions
Conceptualisation, S.F., T.Z., R.R.K., K.G. and Z.S.; methodology, Z.S., T.Z., K.G. and S.F.; software Z.S., T.Z. and S.F., validation Z.S., formal analysis, Z.S. and S.F.; investigation, Z.S. and S.F.; resources, S.F., writing—original draft preparation, Z.S.; writing—review and editing, S.F., T.Z., R.R.K., K.G. and Z.S.; visualisation, Z.S.; supervision, S.F., T.Z. and R.R.K.; project administration, S.F.; funding acquisition, S.F. All authors have read and agreed to the published version of the manuscript.
Funding
This research received no external funding.
Data Availability Statement
Data will be made available on request.
Acknowledgments
The Ph.D. scholarship of the first author was sponsored by Queensland University of Technology, Brisbane, Australia. Computational and data visualisation resources used in this work were provided by the eResearch Office, QUT, Brisbane, Australia. The technical support provided by the QUT materials lab and Pilot Project Precinct (Banyo) during the experimental phase is also acknowledged. During the preparation of this work, the authors used Gen AI tools such as ChatGPT and Claude to improve the readability and language. After using the tool/service, the authors reviewed and edited the content as needed and take full responsibility for the content of the publication.
Conflicts of Interest
The authors declare no conflicts of interest.
References
- Materials Economics: Industrial Transformation 2050—Pathways to Net-Zero Emissions from EU Heavy Industry; University of Cambridge Institute for Sustainability Leadership (CISL): Cambridge, UK, 2019.
- Khaiyum, M.Z.; Sarker, S.; Kabir, G. Evaluation of Carbon Emission Factors in the Cement Industry: An Emerging Economy Context. Sustainability 2023, 15, 15407. [Google Scholar] [CrossRef] [Scilit]
- Massoumi Nejad, B.; Enferadi, S.; Andrew, R. A comprehensive analysis of process-related CO2 emissions from Iran’s cement industry. Clean. Environ. Syst. 2025, 16, 100251. [Google Scholar] [CrossRef] [Scilit]
- Ferdous, W.; Manalo, A.; Siddique, R.; Mendis, P.; Zhuge, Y.; Wong, H.S.; Lokuge, W.; Aravinthan, T.; Schubel, P. Recycling of landfill wastes (tyres, plastics and glass) in construction—A review on global waste generation, performance, application and future opportunities. Resour. Conserv. Recycl. 2021, 173, 105745. [Google Scholar] [CrossRef] [Scilit]
- Kosmatka, S.H.; Panarese, W.C.; Kerkhoff, B. Design and Control of Concrete Mixtures; Portland Cement Association: Skokie, IL, USA, 2002; Volume 5420. [Google Scholar]
- Juenger, M.C.G.; Siddique, R. Recent advances in understanding the role of supplementary cementitious materials in concrete. Cem. Concr. Res. 2015, 78, 71–80. [Google Scholar] [CrossRef] [Scilit]
- Dong, W.; Li, W.; Tao, Z. A comprehensive review on performance of cementitious and geopolymeric concretes with recycled waste glass as powder, sand or cullet. Resour. Conserv. Recycl. 2021, 172, 105664. [Google Scholar] [CrossRef] [Scilit]
- Shi, C. Corrosion of Glasses and Expansion Mechanism of Concrete Containing Waste Glasses as Aggregates. J. Mater. Civ. Eng. 2009, 21, 529–534. [Google Scholar] [CrossRef] [Scilit]
- Li, B.; Ling, T.-C.; Yu, J.-G.; Wu, J.; Chen, W. Cement pastes modified with recycled glass and supplementary cementitious materials: Properties at the ambient and high temperatures. J. Clean. Prod. 2019, 241, 118155. [Google Scholar] [CrossRef] [Scilit]
- Kamali, M.; Ghahremaninezhad, A. Effect of glass powders on the mechanical and durability properties of cementitious materials. Constr. Build. Mater. 2015, 98, 407–416. [Google Scholar] [CrossRef] [Scilit]
- Aliabdo, A.A.; Abd Elmoaty, A.E.M.; Aboshama, A.Y. Utilization of waste glass powder in the production of cement and concrete. Constr. Build. Mater. 2016, 124, 866–877. [Google Scholar] [CrossRef] [Scilit]
- Shi, C.; Wu, Y.; Riefler, C.; Wang, H. Characteristics and pozzolanic reactivity of glass powders. Cem. Concr. Res. 2005, 35, 987–993. [Google Scholar] [CrossRef] [Scilit]
- Jiang, Y.; Ling, T.-C.; Mo, K.H.; Shi, C. A critical review of waste glass powder—Multiple roles of utilization in cement-based materials and construction products. J. Environ. Manag. 2019, 242, 440–449. [Google Scholar] [CrossRef] [Scilit]
- Mirzahosseini, M.; Riding, K.A. Influence of different particle sizes on reactivity of finely ground glass as supplementary cementitious material (SCM). Cem. Concr. Compos. 2015, 56, 95–105. [Google Scholar] [CrossRef] [Scilit]
- Soliman, N.A.; Tagnit-Hamou, A. Development of ultra-high-performance concrete using glass powder—Towards ecofriendly concrete. Constr. Build. Mater. 2016, 125, 600–612. [Google Scholar] [CrossRef] [Scilit]
- Elaqra, H.A.; Al-Afghany, M.J.; Abo-Hasseira, A.B.; Elmasry, I.H.; Tabasi, A.M.; Alwan, M.D. Effect of immersion time of glass powder on mechanical properties of concrete contained glass powder as cement replacement. Constr. Build. Mater. 2019, 206, 674–682. [Google Scholar] [CrossRef] [Scilit]
- Khan, Q.S.; Sheikh, M.N.; McCarthy, T.J.; Robati, M.; Allen, M. Experimental investigation on foam concrete without and with recycled glass powder: A sustainable solution for future construction. Constr. Build. Mater. 2019, 201, 369–379. [Google Scholar] [CrossRef] [Scilit]
- Elaqra, H.; Rustom, R. Effect of using glass powder as cement replacement on rheological and mechanical properties of cement paste. Constr. Build. Mater. 2018, 179, 326–335. [Google Scholar] [CrossRef] [Scilit]
- Omran, A.F.; D.-Morin, E.; Harbec, D.; Tagnit-Hamou, A. Long-term performance of glass-powder concrete in large-scale field applications. Constr. Build. Mater. 2017, 135, 43–58. [Google Scholar] [CrossRef] [Scilit]
- Du, H.; Tan, K.H. Properties of high volume glass powder concrete. Cem. Concr. Compos. 2017, 75, 22–29. [Google Scholar] [CrossRef] [Scilit]
- Saleheen, Z.; Zahra, T.; Fawzia, S. Compressive behaviour of pull-wound GFRP-confined concrete columns incorporating glass powder and rubber fibres: Experimental and theoretical investigation. J. Build. Eng. 2026, 128, 116529. [Google Scholar] [CrossRef] [Scilit]
- Purnomo, C.W.; Kurniawan, W.; Aziz, M. Technological review on thermochemical conversion of COVID-19-related medical wastes. Resour. Conserv. Recycl. 2021, 167, 105429. [Google Scholar] [CrossRef] [Scilit]
- Hazan, M.A.; Mamat, M.S.; Ismail, I.; Hussein, M.Z.; Yaakob, Y. Fractionation of waste nitrile butadiene rubber (NBR) latex sludge. AIP Conf. Proc. 2019, 2151, 020012. [Google Scholar] [CrossRef] [Scilit]
- Saleheen, Z.; Zahra, T.; Krishnamoorthy, R.R.; Fawzia, S. Compressive Behaviour of Sustainable Concrete-Filled Steel Tubes Using Waste Glass and Rubber Glove Fibres. Buildings 2025, 15, 2708. [Google Scholar] [CrossRef] [Scilit]
- Kilmartin-Lynch, S.; Roychand, R.; Saberian, M.; Li, J.; Zhang, G. Application of COVID-19 single-use shredded nitrile gloves in structural concrete: Case study from Australia. Sci. Total Environ. 2022, 812, 151423. [Google Scholar] [CrossRef] [Scilit]
- Ran, T.; Pang, J.; Liu, Y.; Zou, J.; Cai, F. Improving concrete fatigue resistance with COVID-19 rubber gloves: An innovative sustainable approach. Case Stud. Constr. Mater. 2023, 18, e01914. [Google Scholar] [CrossRef] [Scilit]
- He, L.; Lin, S.; Jiang, H. Confinement Effect of Concrete-Filled Steel Tube Columns With Infill Concrete of Different Strength Grades. Front. Mater. 2019, 6, 71. [Google Scholar] [CrossRef] [Scilit]
- Sakino, K.; Nakahara, H.; Morino, S.; Nishiyama, I. Behavior of Centrally Loaded Concrete-Filled Steel-Tube Short Columns. J. Struct. Eng. 2004, 130, 180–188. [Google Scholar] [CrossRef] [Scilit]
- Han, L.-H.; Yao, G.-H.; Zhao, X.-L. Tests and calculations for hollow structural steel (HSS) stub columns filled with self-consolidating concrete (SCC). J. Constr. Steel Res. 2005, 61, 1241–1269. [Google Scholar] [CrossRef] [Scilit]
- Gupta, P.K.; Sarda, S.M.; Kumar, M.S. Experimental and computational study of concrete filled steel tubular columns under axial loads. J. Constr. Steel Res. 2007, 63, 182–193. [Google Scholar] [CrossRef] [Scilit]
- Abed, F.; AlHamaydeh, M.; Abdalla, S. Experimental and numerical investigations of the compressive behavior of concrete filled steel tubes (CFSTs). J. Constr. Steel Res. 2013, 80, 429–439. [Google Scholar] [CrossRef] [Scilit]
- AS/NZS 1163; Cold-Formed Structural Steel Hollow Sections. AS: Sydney, Australia, 2016.
- Schneider, S.P. Axially Loaded Concrete-Filled Steel Tubes. J. Struct. Eng. 1998, 124, 1125–1138. [Google Scholar] [CrossRef] [Scilit]
- Xiong, D.-X.; Zha, X.-X. A numerical investigation on the behaviour of concrete-filled steel tubular columns under initial stresses. J. Constr. Steel Res. 2007, 63, 599–611. [Google Scholar] [CrossRef] [Scilit]
- Guo, L.; Zhang, S.; Kim, W.-J.; Ranzi, G. Behavior of square hollow steel tubes and steel tubes filled with concrete. Thin-Walled Struct. 2007, 45, 961–973. [Google Scholar] [CrossRef] [Scilit]
- Abdel-Rahman, N.; Sivakumaran, K.S. Material Properties Models for Analysis of Cold-Formed Steel Members. J. Struct. Eng. 1997, 123, 1135–1143. [Google Scholar] [CrossRef] [Scilit]
- Han, L.-H.; Huo, J.-s. Concrete-Filled Hollow Structural Steel Columns after Exposure to ISO-834 Fire Standard. J. Struct. Eng. 2003, 129, 68–78. [Google Scholar] [CrossRef] [Scilit]
- Ayough, P.; Ramli Sulong, N.H.; Ibrahim, Z.; Hsiao, P.-C. Nonlinear analysis of square concrete-filled double-skin steel tubular columns under axial compression. Eng. Struct. 2020, 216, 110678. [Google Scholar] [CrossRef] [Scilit]
- ACI 318; Building Code Requirements for Structural Concrete. ACI: Farmington Hills, MI, USA, 2011.
- Bompa, D.V.; Elghazouli, A.Y.; Xu, B.; Stafford, P.J.; Ruiz-Teran, A.M. Experimental assessment and constitutive modelling of rubberised concrete materials. Constr. Build. Mater. 2017, 137, 246–260. [Google Scholar] [CrossRef] [Scilit]
- Bažant, Z.; Nilson, A.H. State-of-the-Art Report on Finite Element Analysis of Reinforced Concrete; American Society of Civil Engineers: New York, NY, USA, 1982. [Google Scholar]
- Hany, N.F.; Hantouche, E.G.; Harajli, M.H. Finite element modeling of FRP-confined concrete using modified concrete damaged plasticity. Eng. Struct. 2016, 125, 1–14. [Google Scholar] [CrossRef] [Scilit]
- Fan, J.; Li, Y.; Wang, B.; Gu, F.; Wu, F.; Yang, H.; Yu, Z.; Hu, Z. An Experimental Study of Axial Poisson’s Ratio and Axial Young’s Modulus Determination of Potato Stems Using Image Processing. Agriculture 2022, 12, 1026. [Google Scholar] [CrossRef] [Scilit]
- Yu, T.; Teng, J.G.; Wong, Y.L.; Dong, S.L. Finite element modeling of confined concrete-II: Plastic-damage model. Eng. Struct. 2010, 32, 680–691. [Google Scholar] [CrossRef] [Scilit]
- Hu, H.-T.; Huang, C.-S.; Wu, M.-H.; Wu, Y.-M. Nonlinear Analysis of Axially Loaded Concrete-Filled Tube Columns with Confinement Effect. J. Struct. Eng. 2003, 129, 1322–1329. [Google Scholar] [CrossRef] [Scilit]
- Mander, J.B.; Priestley, M.J.N.; Park, R. Theoretical Stress-Strain Model for Confined Concrete. J. Struct. Eng. 1988, 114, 1804–1826. [Google Scholar] [CrossRef] [Scilit]
- Azad, S.K.; Uy, B. Effect of concrete infill on local buckling capacity of circular tubes. J. Constr. Steel Res. 2020, 165, 105899. [Google Scholar] [CrossRef] [Scilit]
- Tao, Z.; Wang, Z.-B.; Yu, Q. Finite element modelling of concrete-filled steel stub columns under axial compression. J. Constr. Steel Res. 2013, 89, 121–131. [Google Scholar] [CrossRef] [Scilit]
- Lai, Z.; Varma, A.H. Noncompact and slender circular CFT members: Experimental database, analysis, and design. J. Constr. Steel Res. 2015, 106, 220–233. [Google Scholar] [CrossRef] [Scilit]
- Moon, J.; Lehman Dawn, E.; Roeder Charles, W.; Lee, H.-E. Strength of Circular Concrete-Filled Tubes with and without Internal Reinforcement under Combined Loading. J. Struct. Eng. 2013, 139, 04013012. [Google Scholar] [CrossRef] [Scilit]
- Han, L.-H.; Yao, G.-H.; Tao, Z. Performance of concrete-filled thin-walled steel tubes under pure torsion. Thin-Walled Struct. 2007, 45, 24–36. [Google Scholar] [CrossRef] [Scilit]
- Samani, A.K.; Attard, M.M. A stress–strain model for uniaxial and confined concrete under compression. Eng. Struct. 2012, 41, 335–349. [Google Scholar] [CrossRef] [Scilit]
- De Nicolo, B.; Pani, L.; Pozzo, E. Strain of concrete at peak compressive stress for a wide range of compressive strengths. Mater. Struct. 1994, 27, 206–210. [Google Scholar] [CrossRef] [Scilit]
- Han, X.; Zhou, S.; Chen, A.; Feng, L.; Ji, Y.; Wang, Z.; Sun, S.; Li, K.; Xia, X.; Zhang, Q. Analytical evaluation of stress–strain behavior of rubberized concrete incorporating waste tire crumb rubber. J. Clean. Prod. 2024, 450, 141963. [Google Scholar] [CrossRef] [Scilit]
- Albidah, A.; Alsaif, A.; Abadel, A.; Abbas, H.; Al-Salloum, Y. Role of recycled vehicle tires quantity and size on the properties of metakaolin-based geopolymer rubberized concrete. J. Mater. Res. Technol. 2022, 18, 2593–2607. [Google Scholar] [CrossRef] [Scilit]
- Binici, B. An analytical model for stress–strain behavior of confined concrete. Eng. Struct. 2005, 27, 1040–1051. [Google Scholar] [CrossRef] [Scilit]
- Elchalakani, M.; Ayough, P.; Yang, B. Chapter 4—Numerical methods. In Single Skin and Double Skin Concrete Filled Tubular Structures; Elchalakani, M., Ayough, P., Yang, B., Eds.; Woodhead Publishing: Sawston, UK, 2022; pp. 341–537. [Google Scholar]
- Fakeh, M.; Jawdhari, A.; Fam, A. Recommended concrete damage plasticity parameters and constitutive models for UHPC in ABAQUS. Eng. Struct. 2025, 333, 120154. [Google Scholar] [CrossRef] [Scilit]
- Duarte, A.P.C.; Silva, B.A.; Silvestre, N.; de Brito, J.; Júlio, E.; Castro, J.M. Finite element modelling of short steel tubes filled with rubberized concrete. Compos. Struct. 2016, 150, 28–40. [Google Scholar] [CrossRef] [Scilit]
- Ayough, P.; Ibrahim, Z.; Sulong, N.H.R.; Hsiao, P.-C.; Elchalakani, M. Numerical analysis of square concrete-filled double skin steel tubular columns with rubberized concrete. Structures 2021, 32, 1026–1047. [Google Scholar] [CrossRef] [Scilit]
- Xu, B.; Bompa, D.V.; Elghazouli, A.Y.; Ruiz-Teran, A.M.; Stafford, P.J. Numerical assessment of reinforced concrete members incorporating recycled rubber materials. Eng. Struct. 2020, 204, 110017. [Google Scholar] [CrossRef] [Scilit]
- Ding, F.; Cao, Z.; Lyu, F.; Huang, S.; Hu, M.; Lin, Q. Practical design equations of the axial compressive capacity of circular CFST stub columns based on finite element model analysis incorporating constitutive models for high-strength materials. Case Stud. Constr. Mater. 2022, 16, e01115. [Google Scholar] [CrossRef] [Scilit]
- Raza, A.; Shah, S.A.; Khan, A.R.; Aslam, M.A.; Khan, T.A.; Arshad, K.; Hussan, S.; Sultan, A.; Shahzadi, G.; Waseem, M. Sustainable FRP-Confined Symmetric Concrete Structures: An Application Experimental and Numerical Validation Process for Reference Data. Appl. Sci. 2020, 10, 333. [Google Scholar] [CrossRef] [Scilit]
- Duarte, A.; Silva, B.; Silvestre, N.; De Brito, J.; Júlio, E.; Castro, J. Tests and design of short steel tubes filled with rubberised concrete. Eng. Struct. 2016, 112, 274–286. [Google Scholar] [CrossRef] [Scilit]
- Papanikolaou, V.K.; Kappos, A.J. Confinement-sensitive plasticity constitutive model for concrete in triaxial compression. Int. J. Solids Struct. 2007, 44, 7021–7048. [Google Scholar] [CrossRef] [Scilit]
- Ayough, P.; Ibrahim, Z.; Sulong, N.H.R.; Hsiao, P.-C. The effects of cross-sectional shapes on the axial performance of concrete-filled steel tube columns. J. Constr. Steel Res. 2021, 176, 106424. [Google Scholar] [CrossRef] [Scilit]
- Tao, Z.; Han, L.-H.; Zhao, X.-L. Behaviour of concrete-filled double skin (CHS inner and CHS outer) steel tubular stub columns and beam-columns. J. Constr. Steel Res. 2004, 60, 1129–1158. [Google Scholar] [CrossRef] [Scilit]
- Khusru, S.; Thambiratnam, D.P.; Elchalakani, M.; Fawzia, S. Load–Displacement Behaviour and a Parametric Study of Hybrid Rubberised Concrete Double-Skin Tubular Columns. Buildings 2023, 13, 3131. [Google Scholar] [CrossRef] [Scilit]
- Han, L.-H.; Hou, C.; Hua, Y.-X. Concrete-filled steel tubes subjected to axial compression: Life-cycle based performance. J. Constr. Steel Res. 2020, 170, 106063. [Google Scholar] [CrossRef] [Scilit]
- Lam, D.; Dai, X.H.; Han, L.H.; Ren, Q.X.; Li, W. Behaviour of inclined, tapered and STS square CFST stub columns subjected to axial load. Thin-Walled Struct. 2012, 54, 94–105. [Google Scholar] [CrossRef] [Scilit]
- Nguyen, D.H.; Hong, W.-K.; Ko, H.-J.; Kim, S.-K. Finite element model for the interface between steel and concrete of CFST (concrete-filled steel tube). Eng. Struct. 2019, 185, 141–158. [Google Scholar] [CrossRef] [Scilit]
- Kumar, S.; Gupta, P.K.; Iqbal, M.A. Experimental and numerical study on self-compacting alkali-activated slag concrete-filled steel tubes. J. Constr. Steel Res. 2024, 214, 108453. [Google Scholar] [CrossRef] [Scilit]
- Ahmed, M.; Emara, M.; Patel, V.I.; Chen, W.; Zhang, X.; Hamoda, A. Experimental and numerical analysis of the flexural performance of concrete-filled steel tubular members with partial replacement of fine aggregates with sawdust. Eng. Struct. 2025, 343, 121050. [Google Scholar] [CrossRef] [Scilit]
- Akbarzadeh Bengar, H.; Shahmansouri, A.A. Post-fire behavior of unconfined and steel tube confined rubberized concrete under axial compression. Structures 2021, 32, 731–745. [Google Scholar] [CrossRef] [Scilit]
- Memarzadeh, A.; Shahmansouri, A.A.; Poologanathan, K. A novel prediction model for post-fire elastic modulus of circular recycled aggregate concrete-filled steel tubular stub columns. Steel Compos. Struct. Int. J. 2022, 44, 309–324. [Google Scholar]
- Dai, P.; Yang, L.; Wang, J.; Zhou, Y. Compressive strength of concrete-filled stainless steel tube stub columns. Eng. Struct. 2020, 205, 110106. [Google Scholar] [CrossRef] [Scilit]
- Alatshan, F.; Osman, S.A.; Mashiri, F.; Hamid, R. Explicit Simulation of Circular CFST Stub Columns with External Steel Confinement under Axial Compression. Materials 2020, 13, 23. [Google Scholar] [CrossRef] [Scilit]
- Ren, Q.-X.; Han, L.-H.; Lam, D.; Hou, C. Experiments on special-shaped CFST stub columns under axial compression. J. Constr. Steel Res. 2014, 98, 123–133. [Google Scholar] [CrossRef] [Scilit]
- Huo, J.; Huang, G.; Xiao, Y. Effects of sustained axial load and cooling phase on post-fire behaviour of concrete-filled steel tubular stub columns. J. Constr. Steel Res. 2009, 65, 1664–1676. [Google Scholar] [CrossRef] [Scilit]
- Elchalakani, M.; Hassanein, M.F.; Karrech, A.; Yang, B. Experimental investigation of rubberised concrete-filled double skin square tubular columns under axial compression. Eng. Struct. 2018, 171, 730–746. [Google Scholar] [CrossRef] [Scilit]
- Ma, Y.-X.; Zhao, O.; Tan, K.H. Experimental and numerical studies of concrete-encased concrete-filled steel tube stub columns under uniaxial and biaxial eccentric compression. Eng. Struct. 2021, 232, 111796. [Google Scholar] [CrossRef] [Scilit]
- Liang, Q.Q.; Fragomeni, S. Nonlinear analysis of circular concrete-filled steel tubular short columns under axial loading. J. Constr. Steel Res. 2009, 65, 2186–2196. [Google Scholar] [CrossRef] [Scilit]
- Eurocode 4: Design of Composite Steel and Concrete Structures; European Commission: Brussels, Belgium, 2004.
- AS/NZS 5100.6; Bridge Design, Part 6: Steel and Composite Construction. AS: Sydney, Australia, 2017.
- AISC 360; Specification for Structural Steel Buildings. AISC: Chicago, IL, USA, 2005.
- Standards for Structural Calculation of Steel Reinforced Concrete Structures; AIJ: Tokyo, Japan, 2001.
- Giakoumelis, G.; Lam, D. Axial capacity of circular concrete-filled tube columns. J. Constr. Steel Res. 2004, 60, 1049–1068. [Google Scholar] [CrossRef] [Scilit]
- Lu, Z.-H.; Zhao, Y.-G. Suggested empirical models for the axial capacity of circular CFT stub columns. J. Constr. Steel Res. 2010, 66, 850–862. [Google Scholar] [CrossRef] [Scilit]
- Goode, C.; Narayanan, R. Design of concrete filled steel tubes to EC4. In Proceedings of the ASCCS Seminar on Concrete Filled Steel Tubes—A Comparison of International Codes and Practice, Innsbruck, Austria, 18 September 1997; pp. 1–25. [Google Scholar]
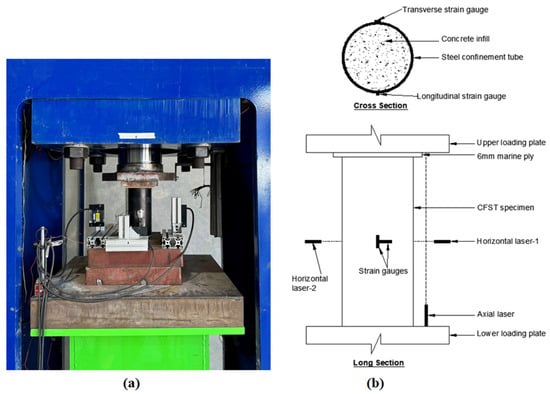
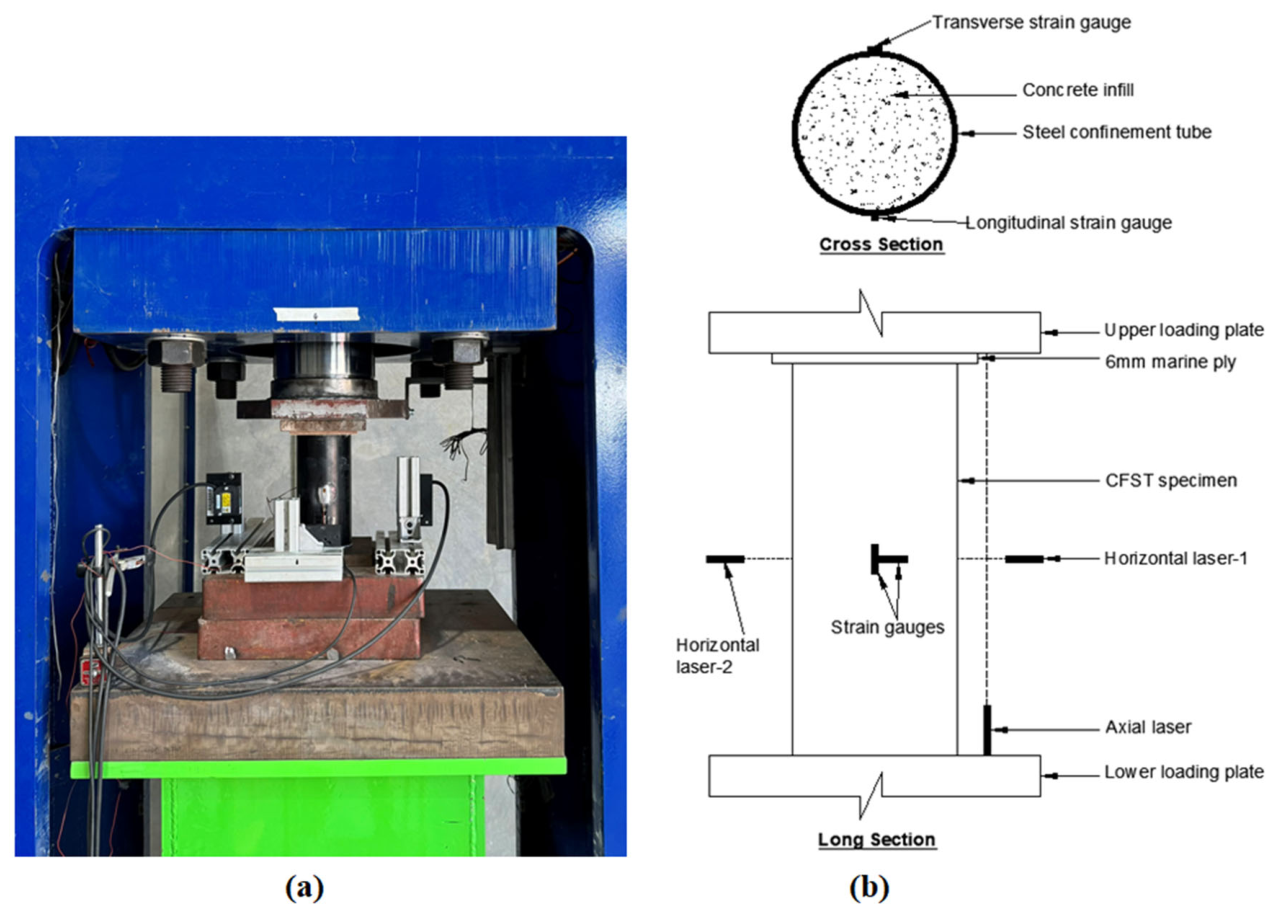
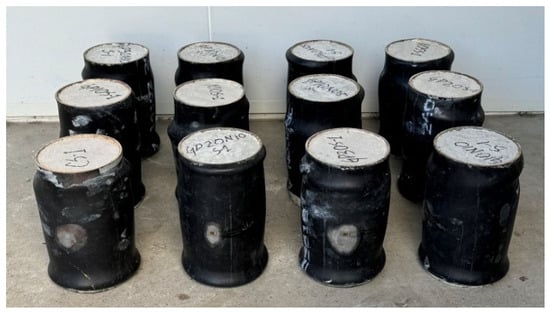
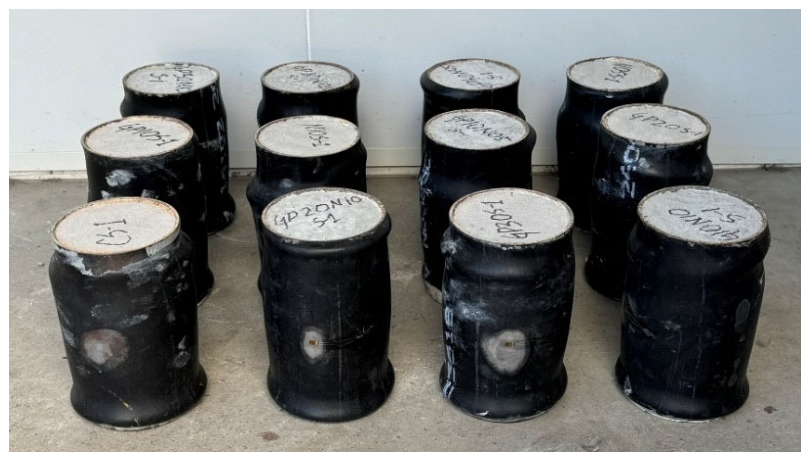
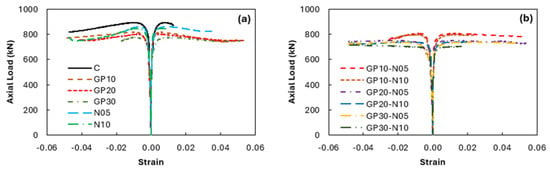
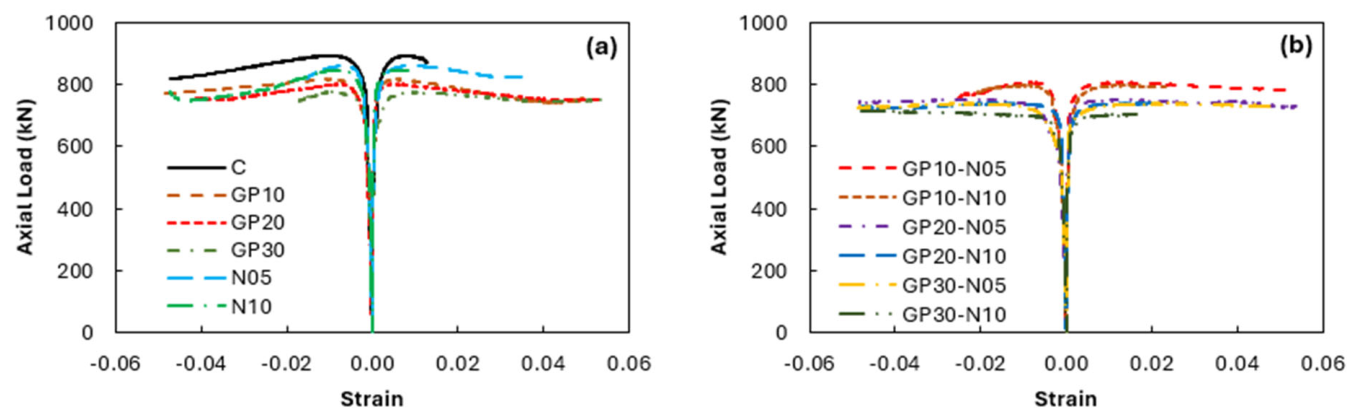
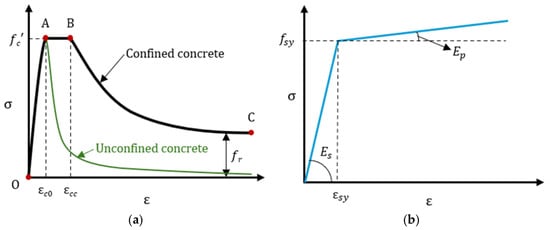
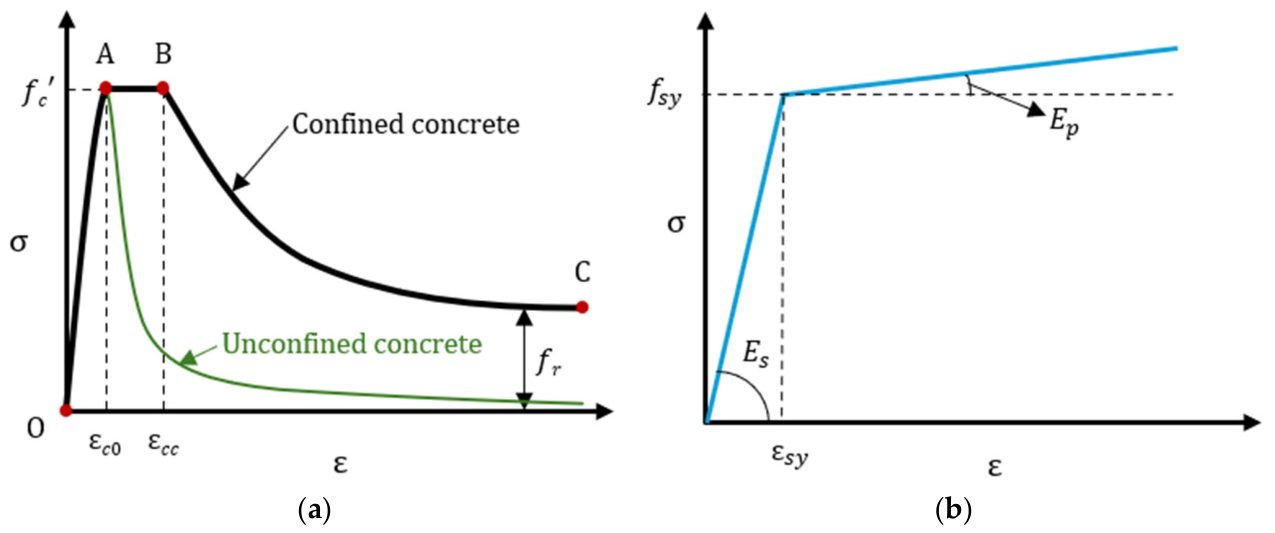
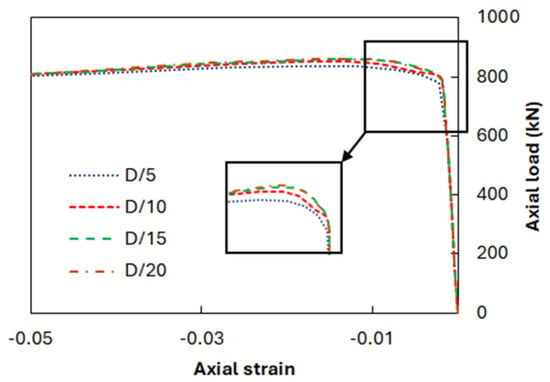
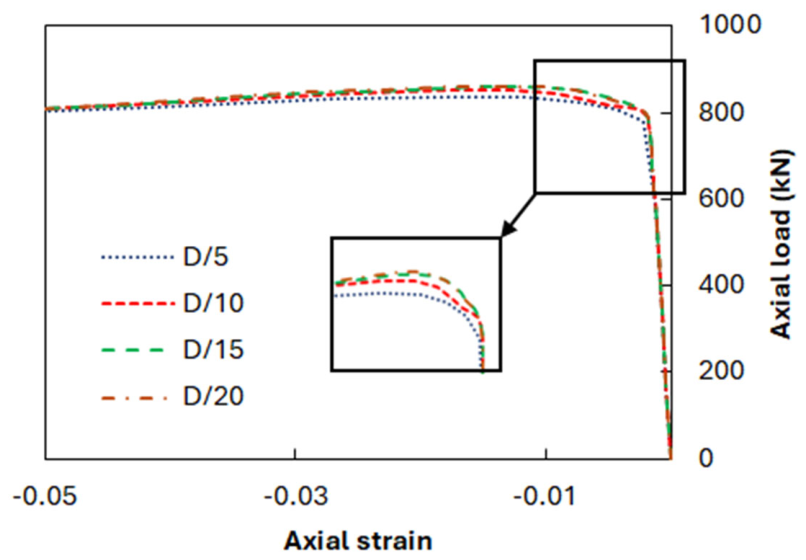
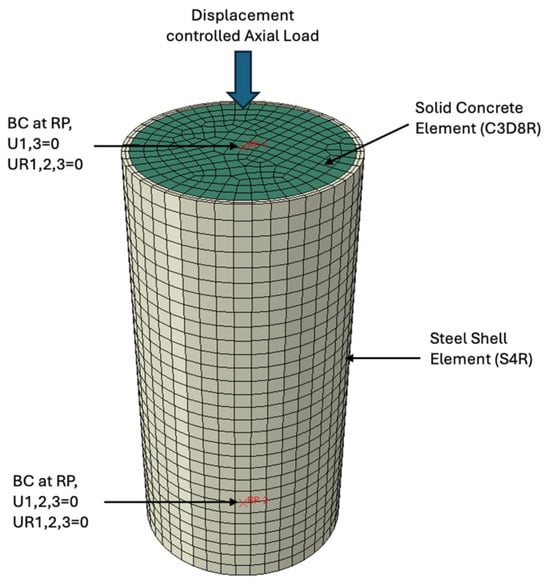
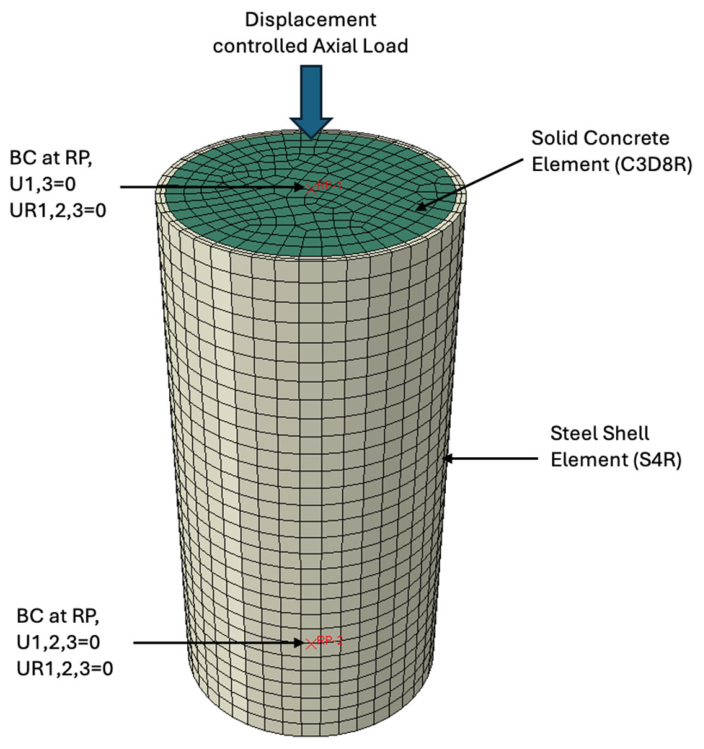
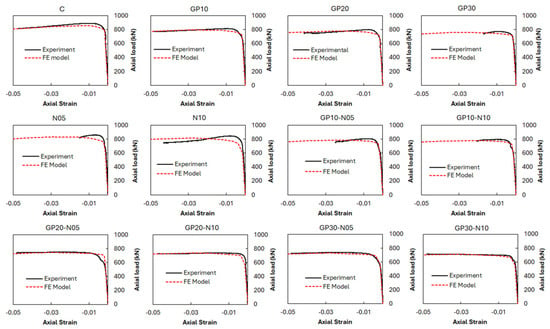
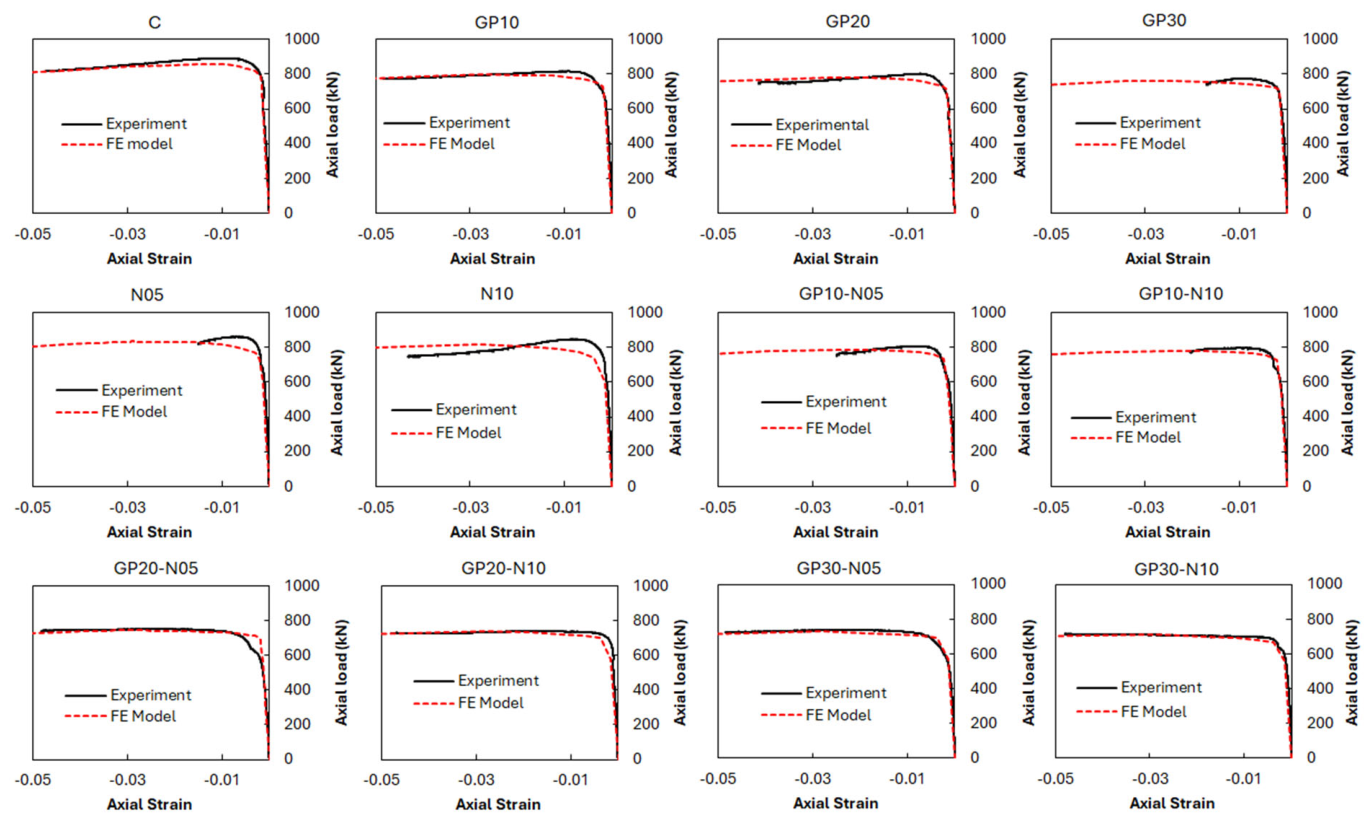
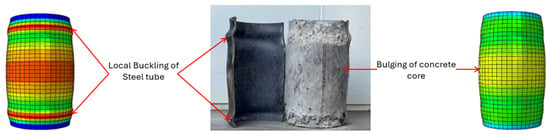
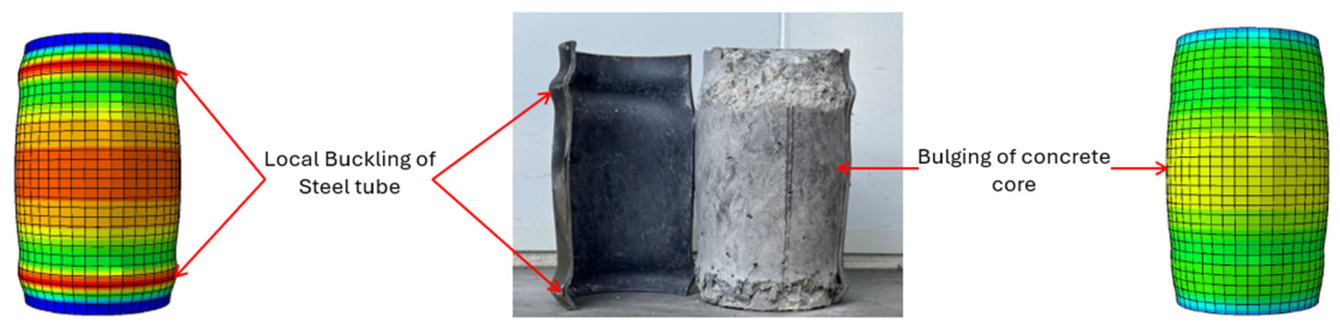
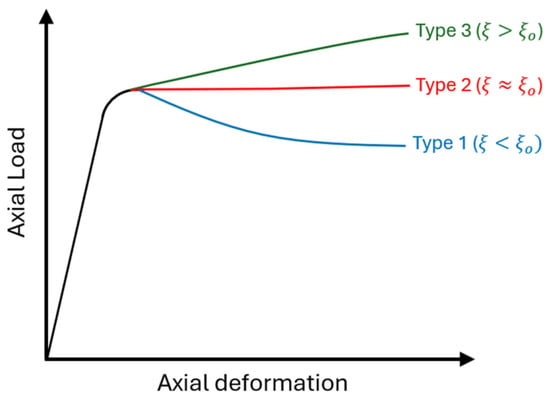
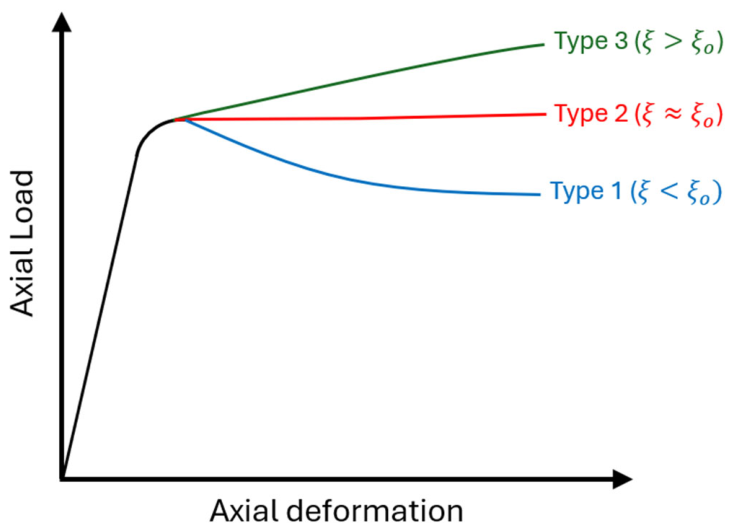
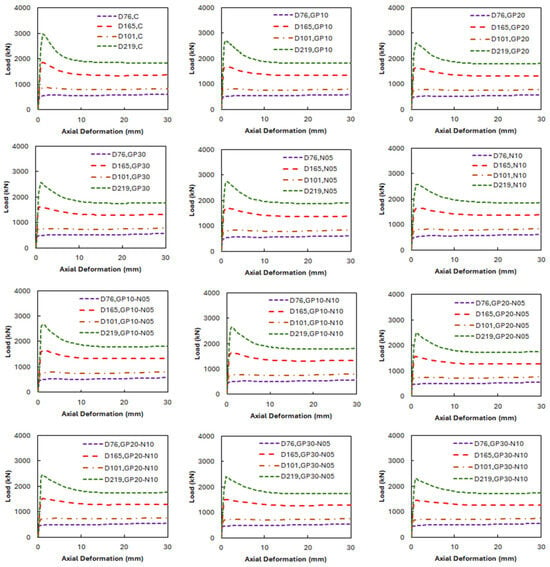
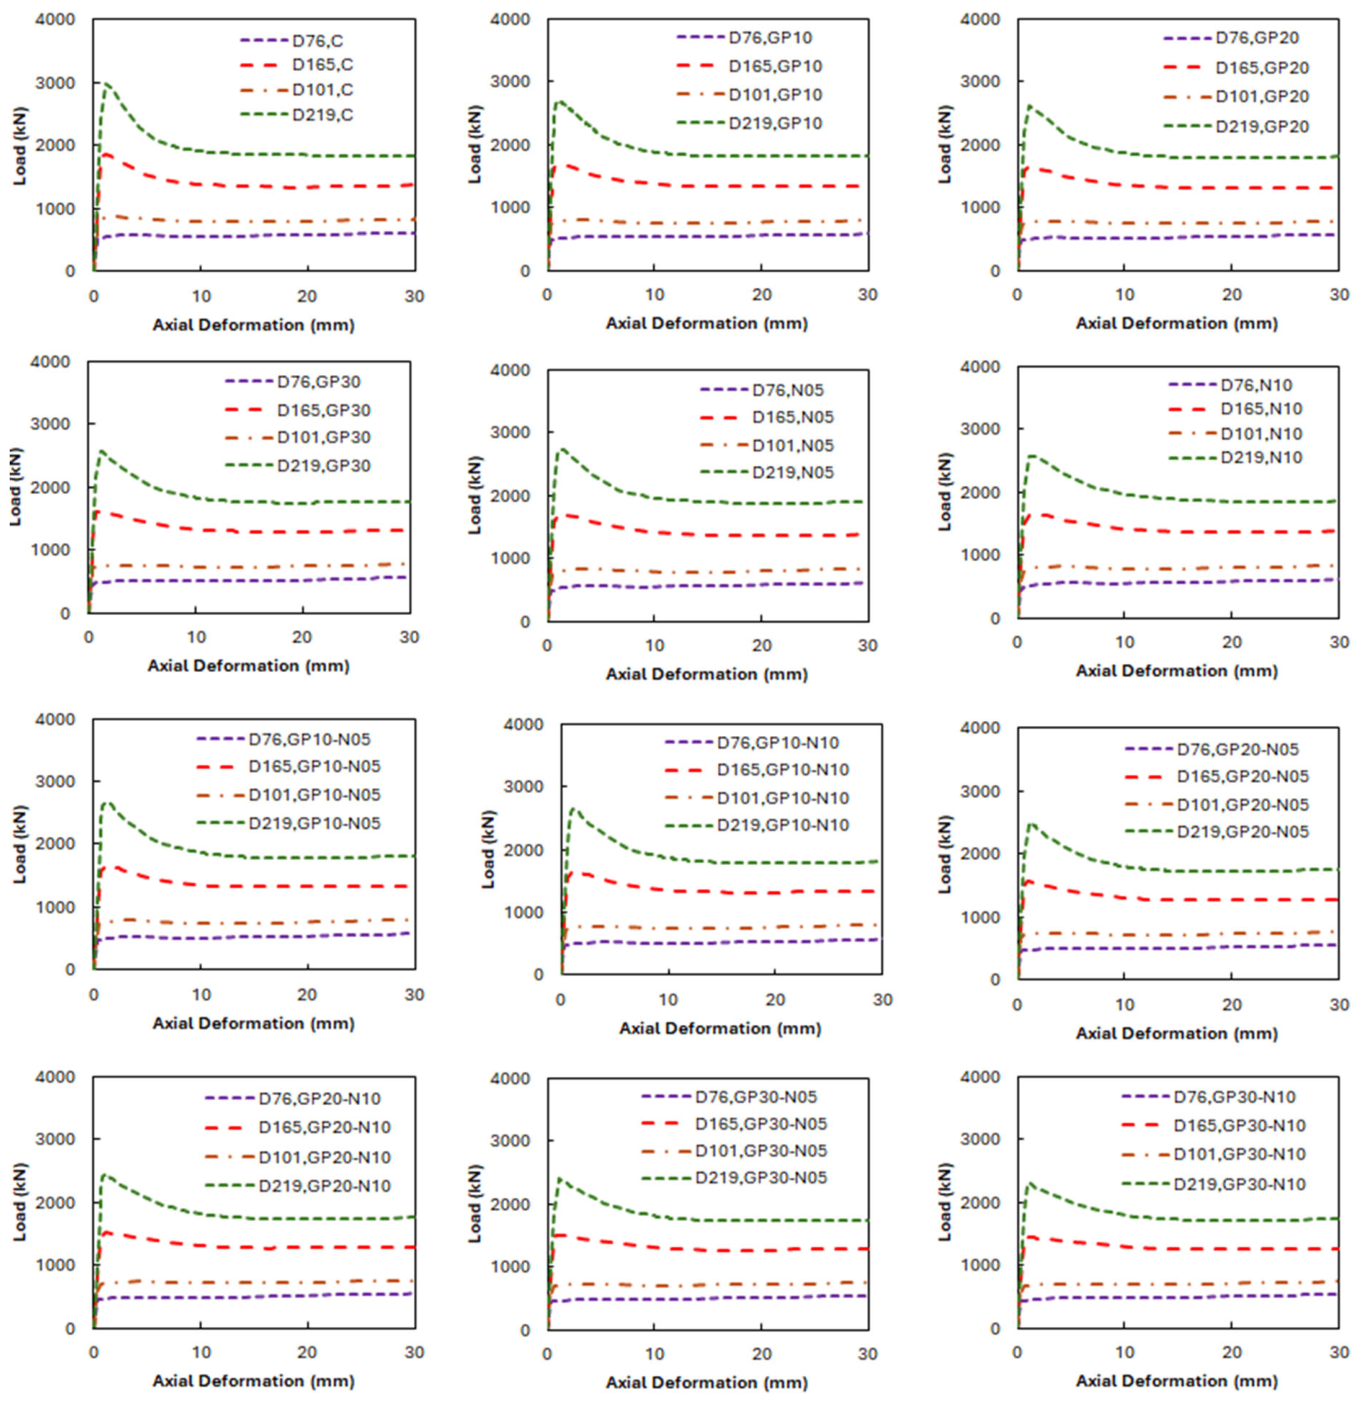
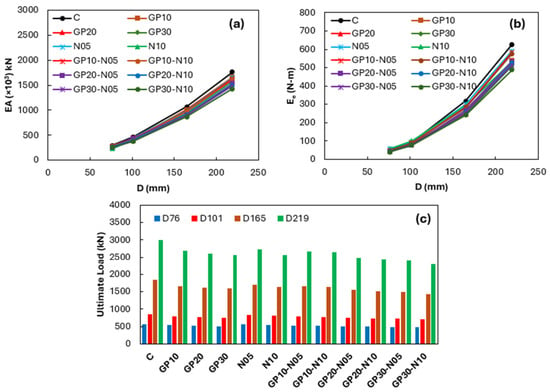
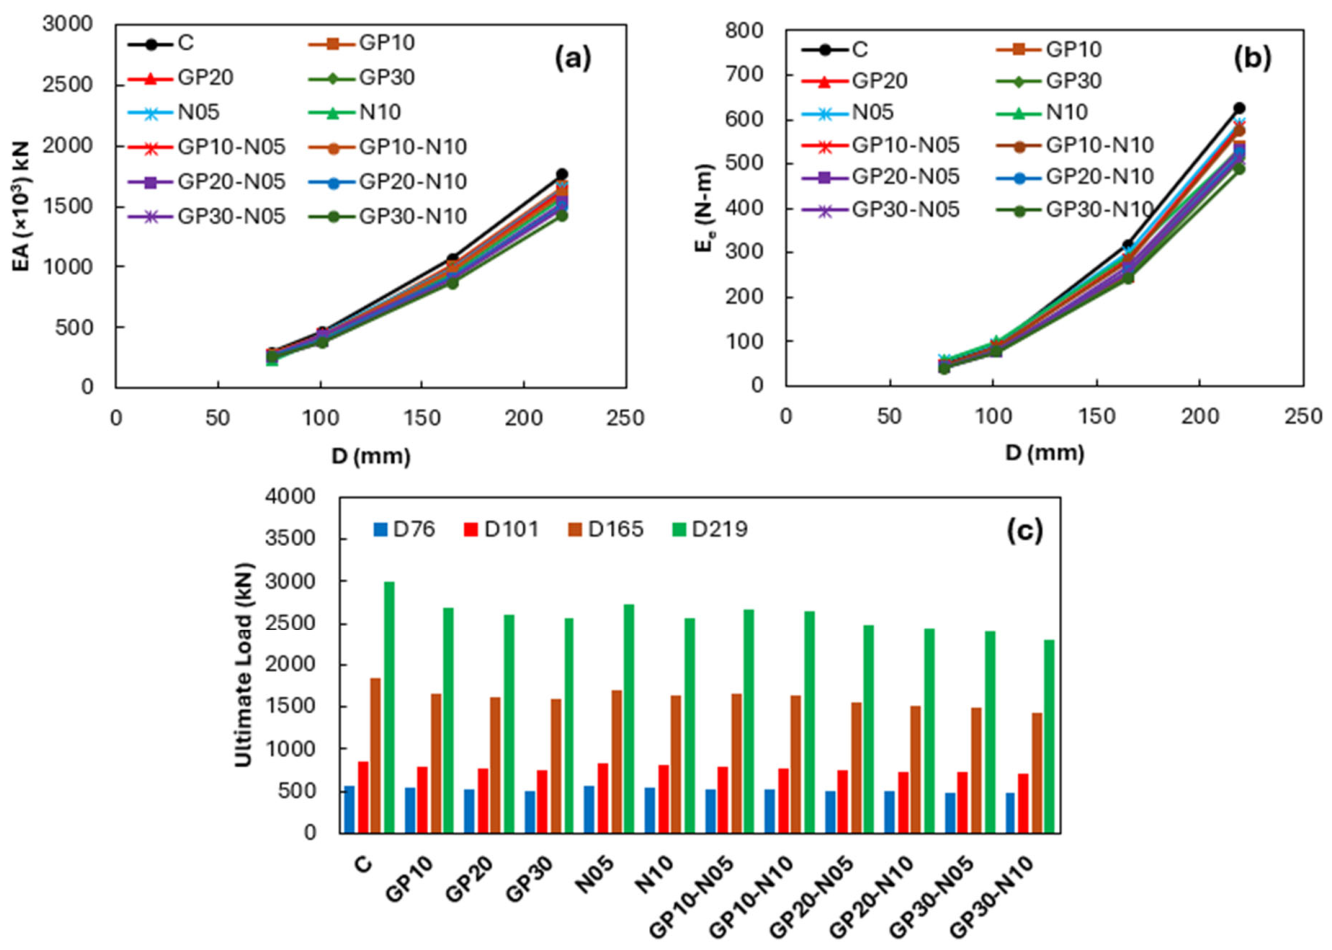
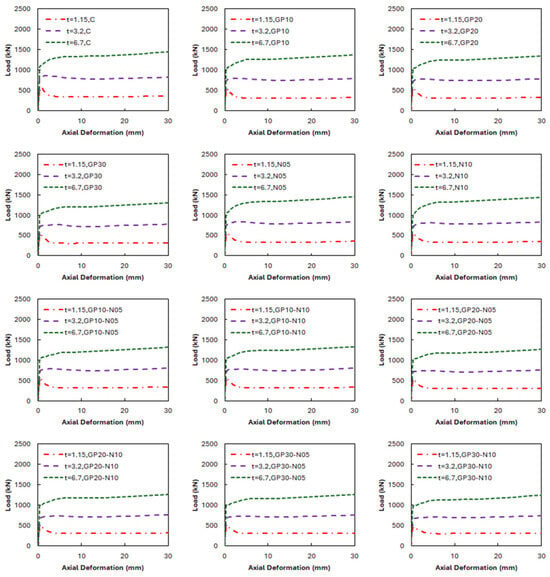
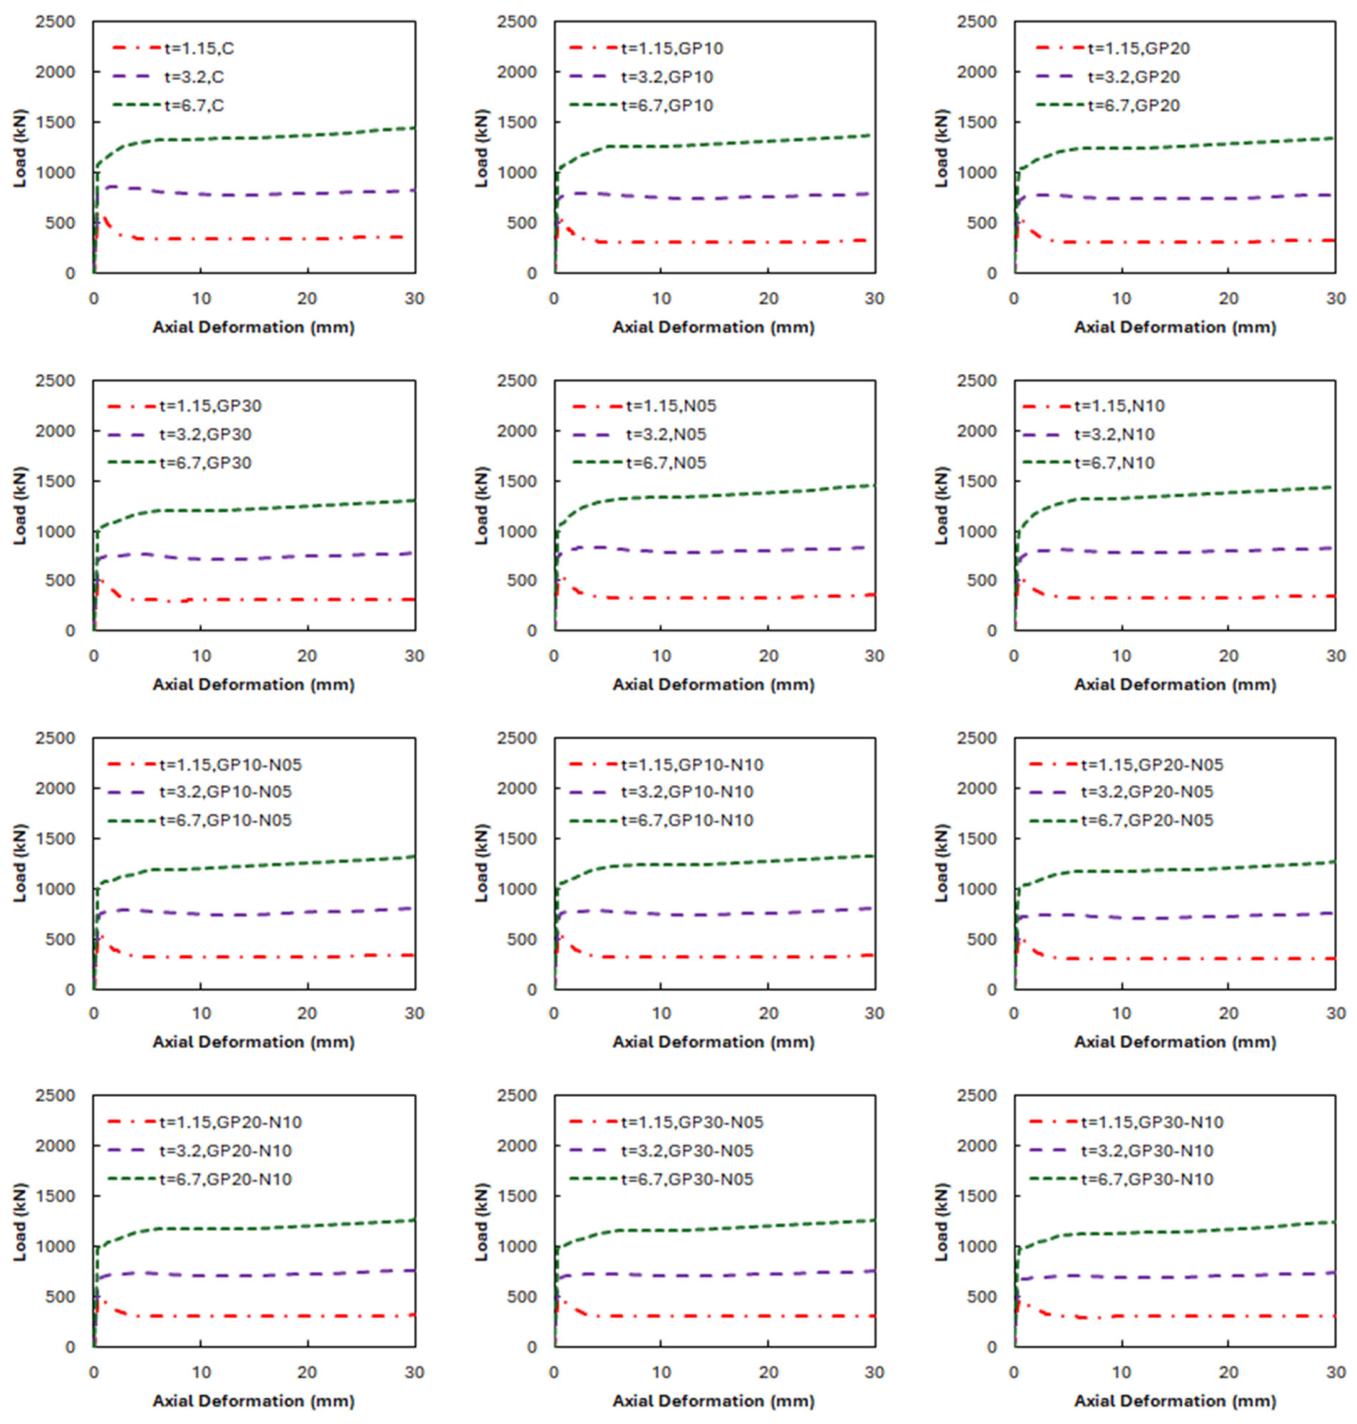
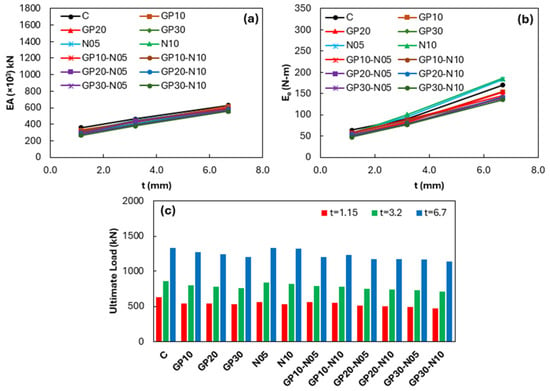
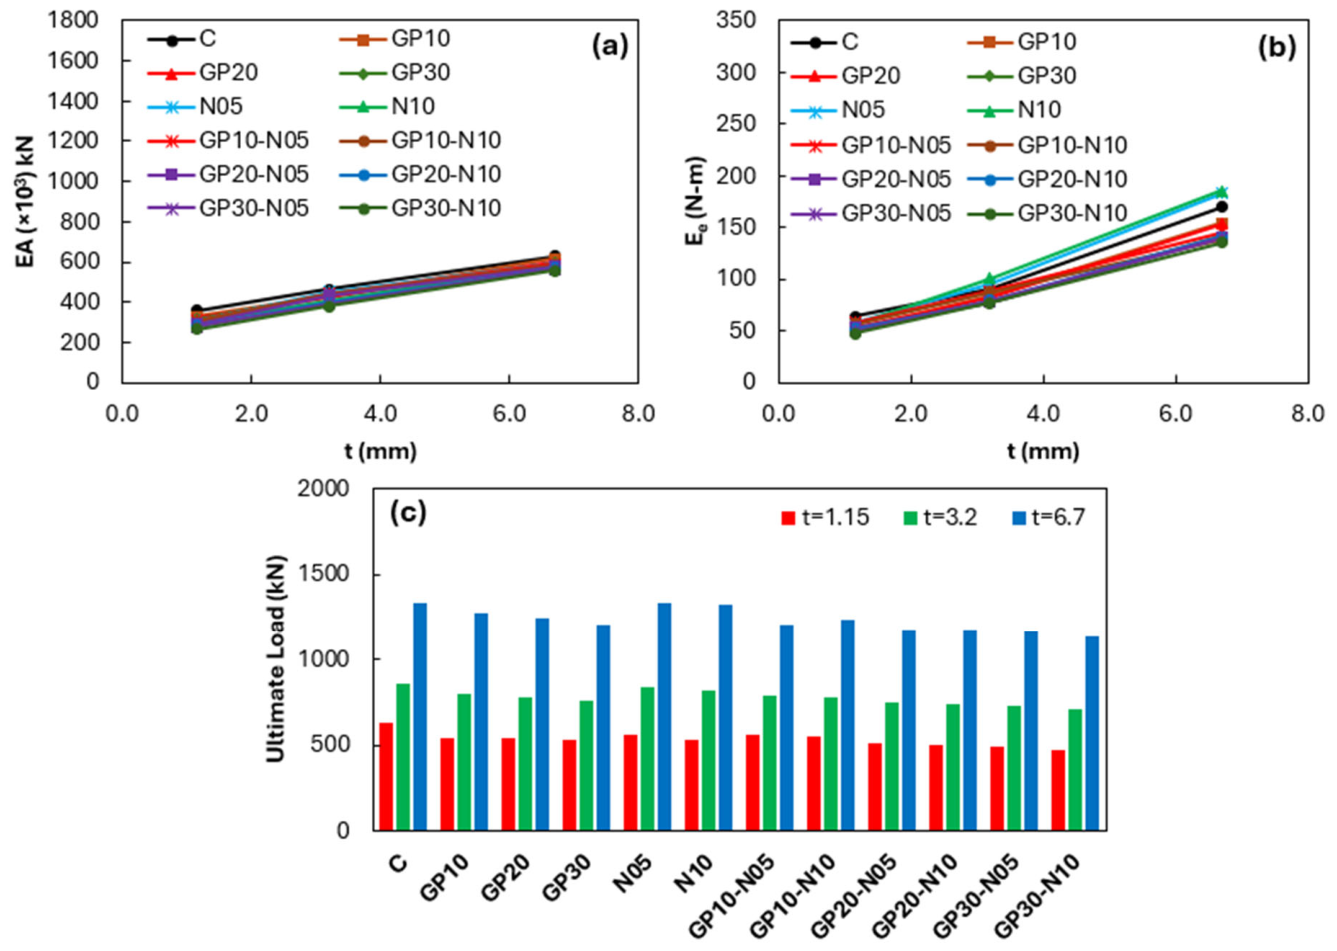
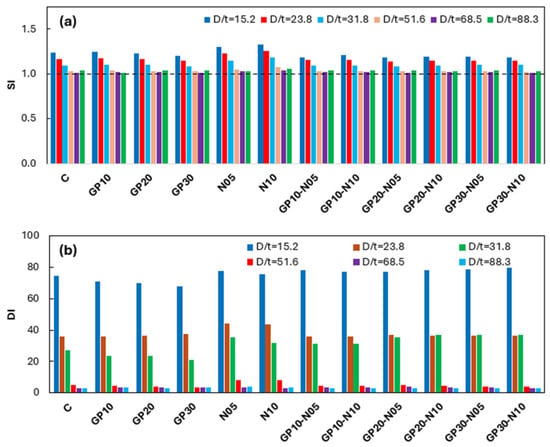
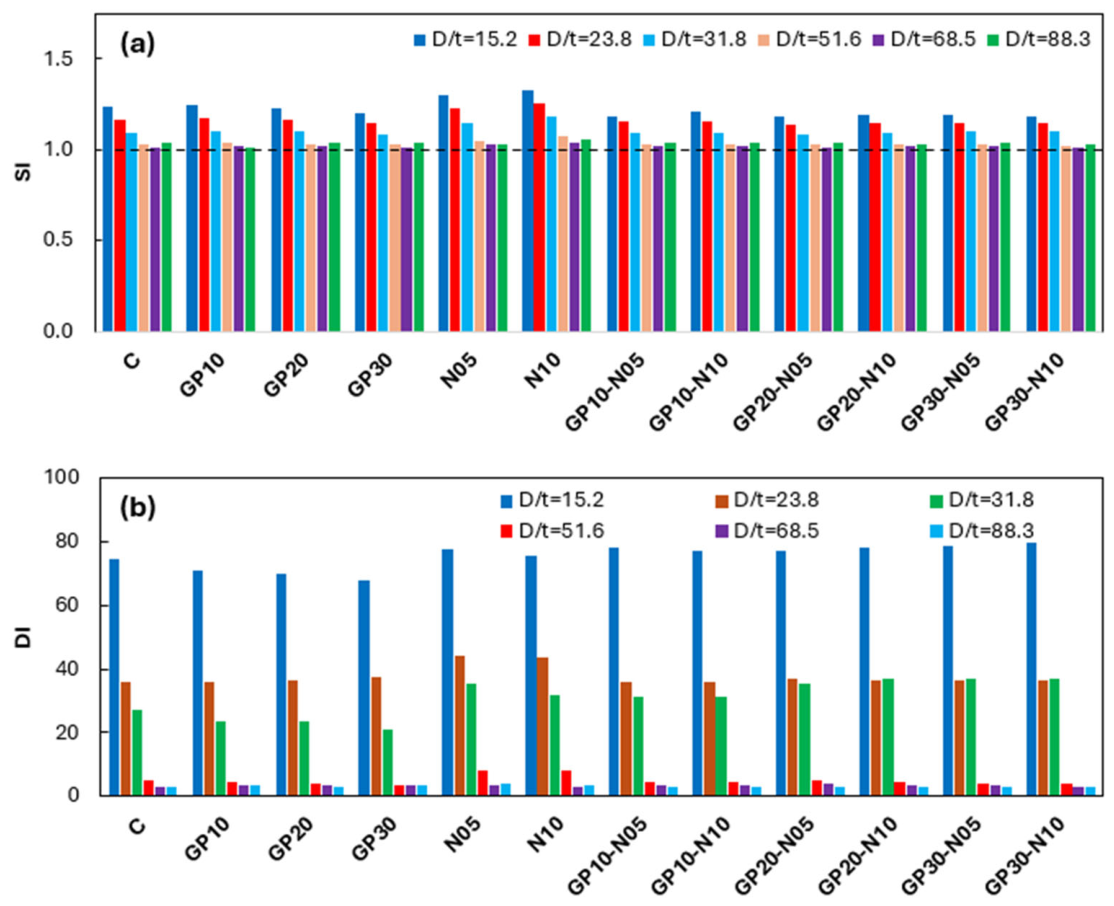
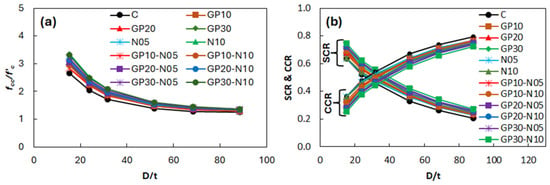
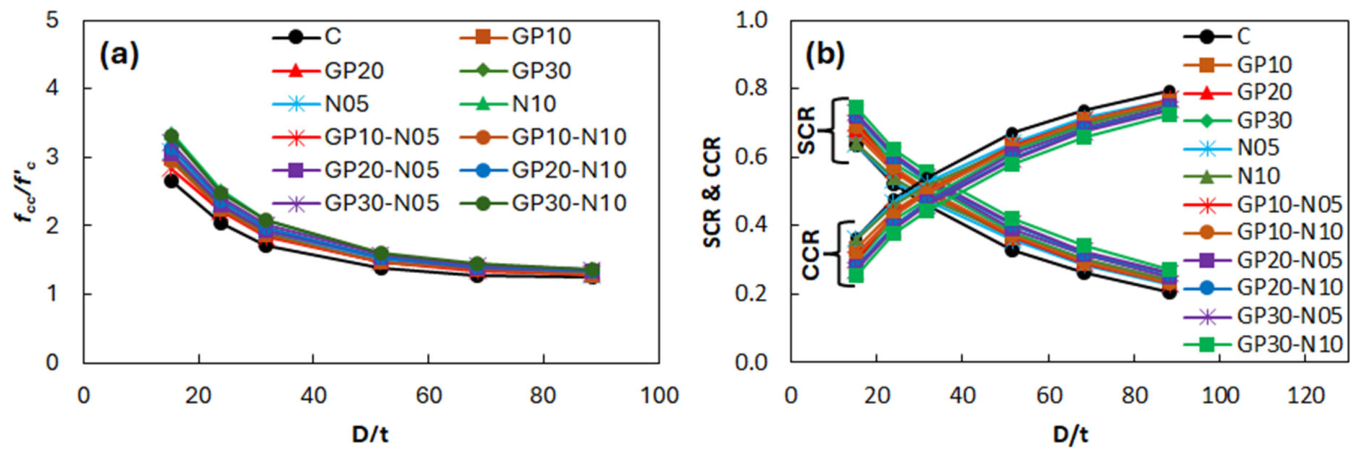
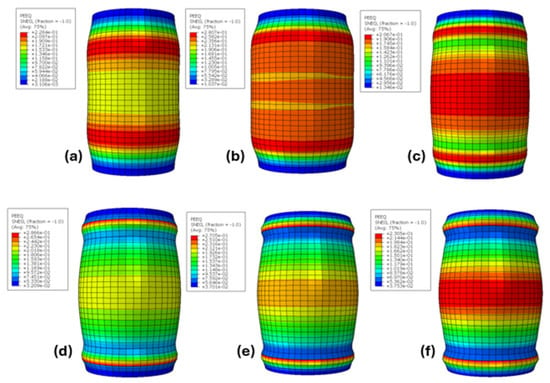
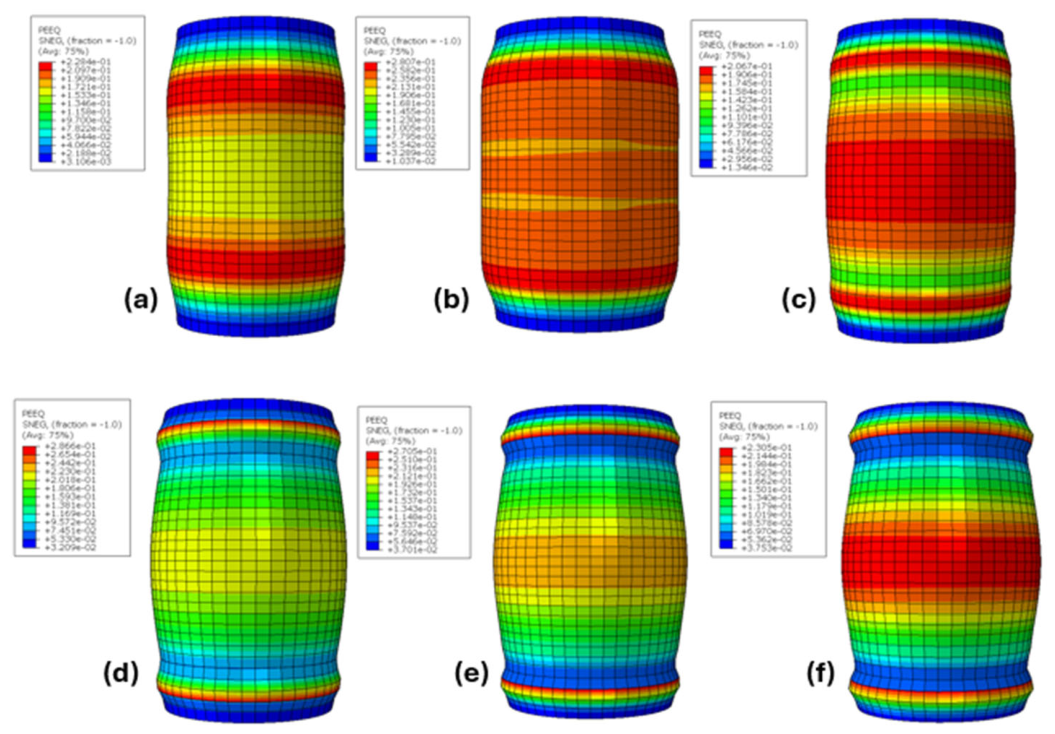
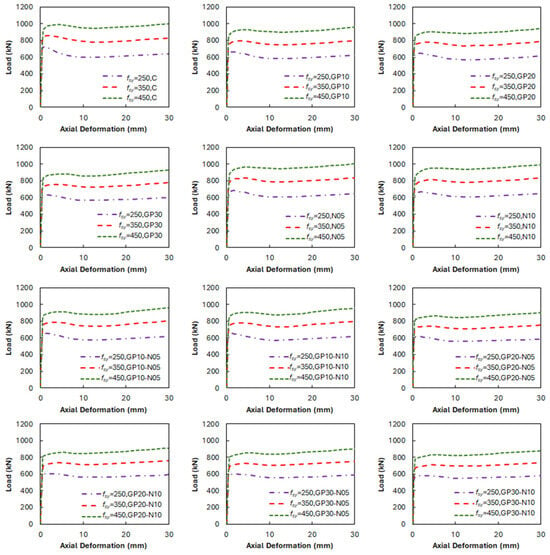
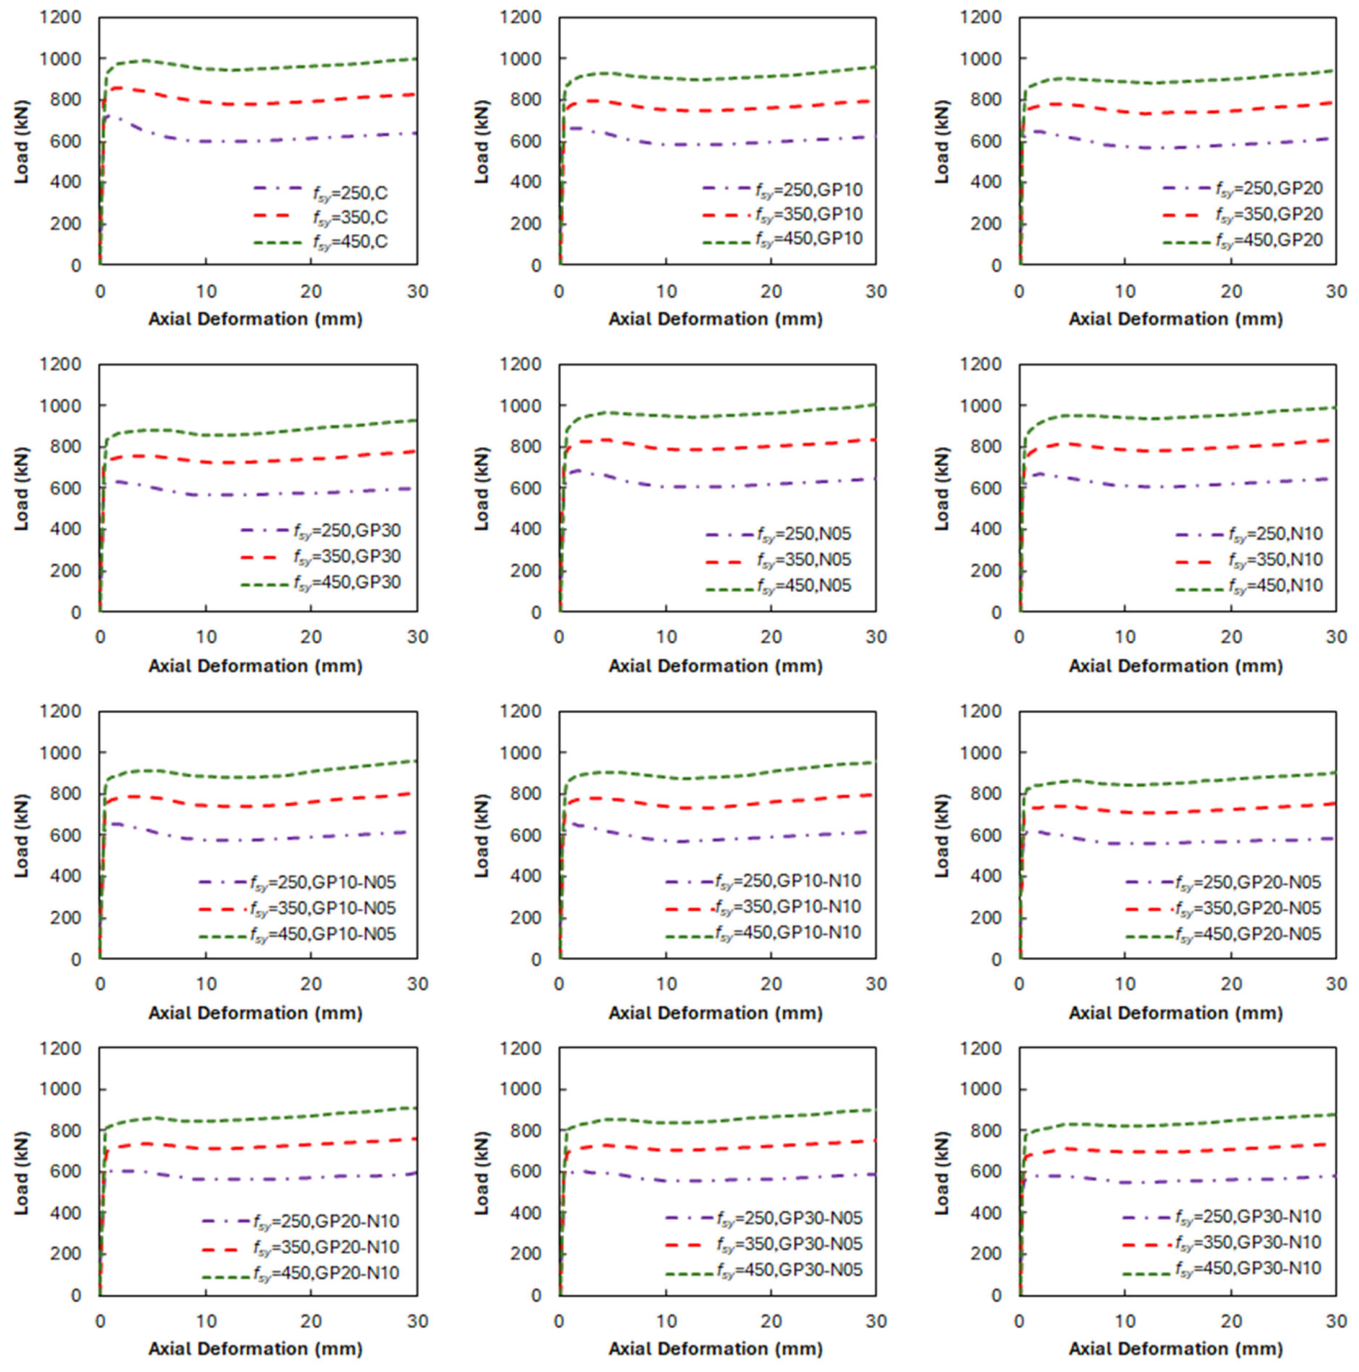
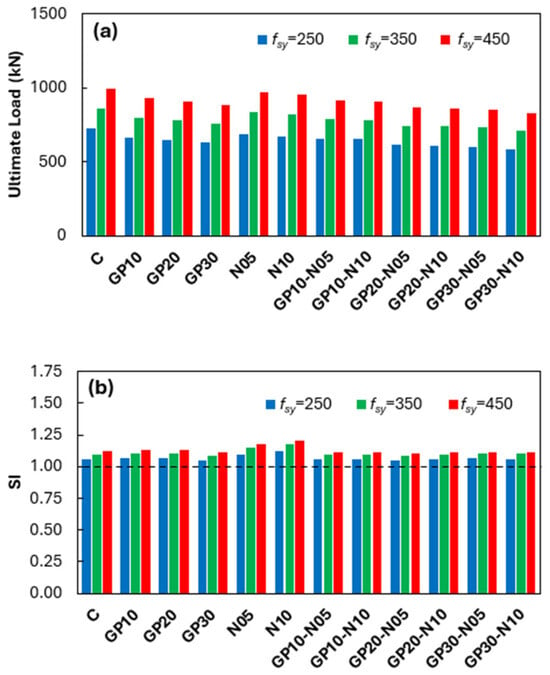
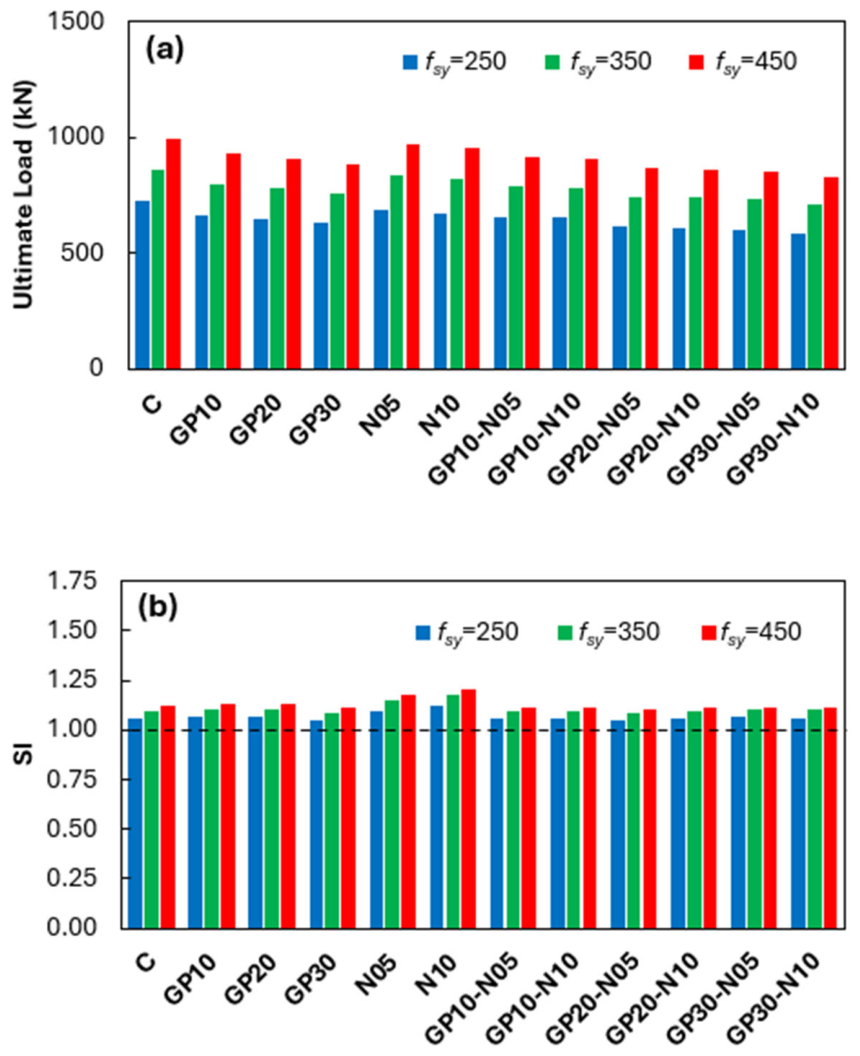
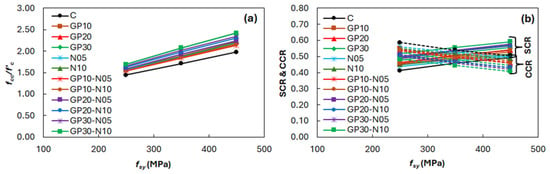
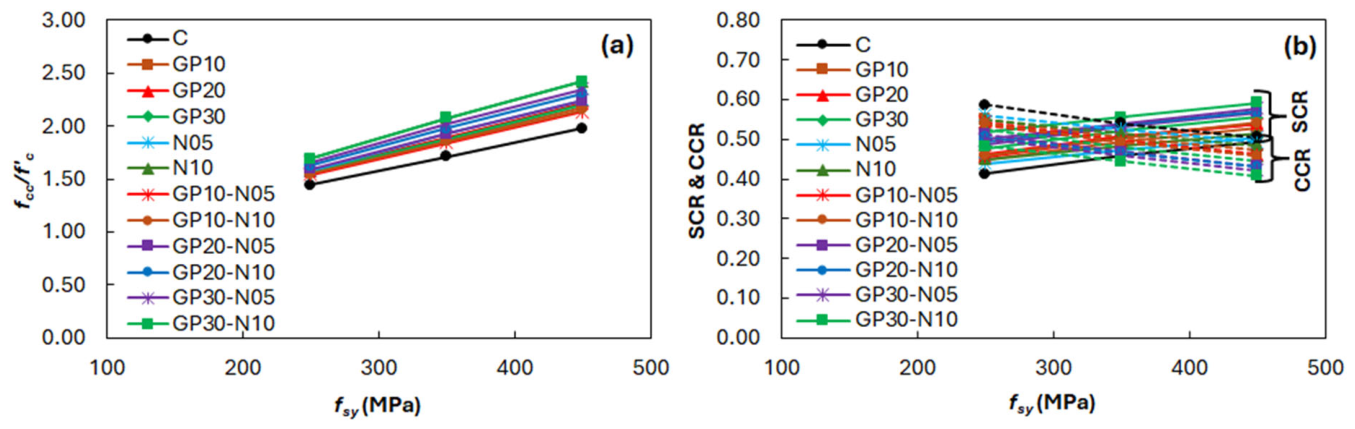
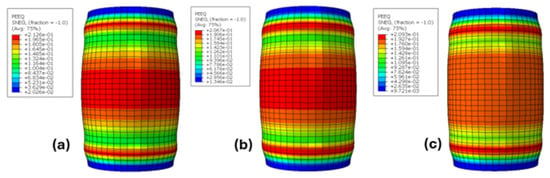
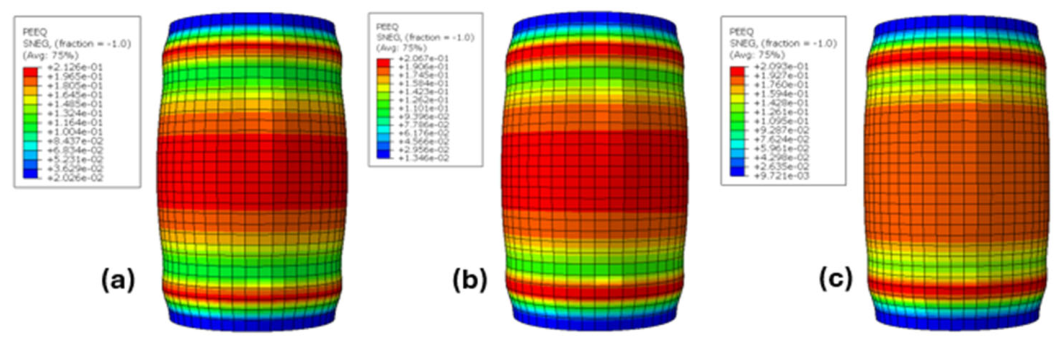
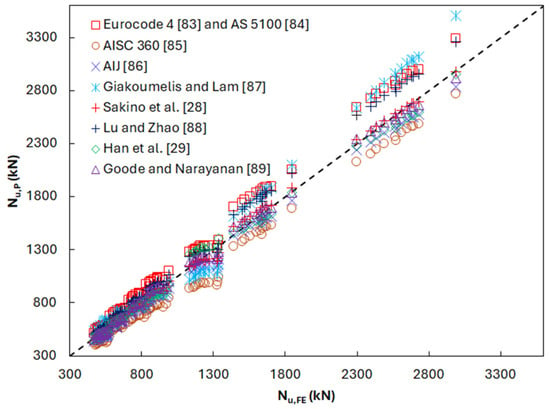
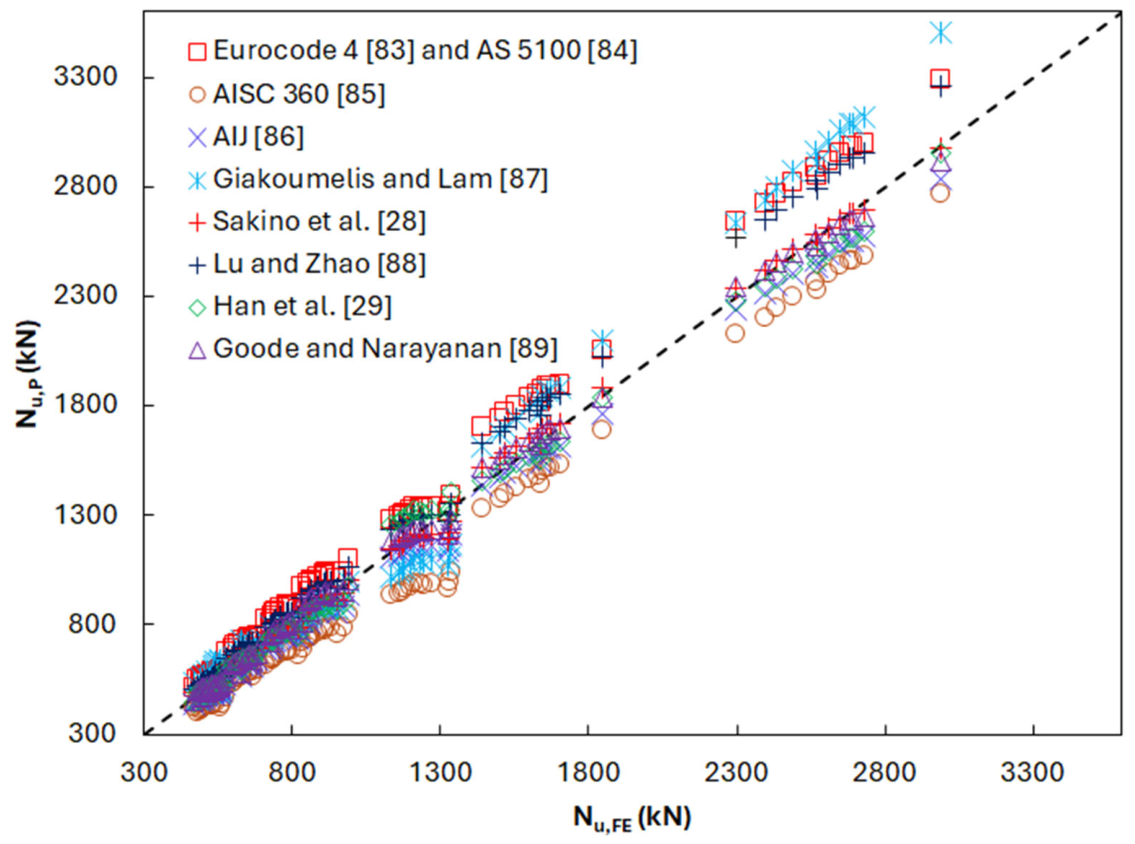

Disclaimer/Publisher’s Note: The statements, opinions and data contained in all publications are solely those of the individual author(s) and contributor(s) and not of MDPI and/or the editor(s). MDPI and/or the editor(s) disclaim responsibility for any injury to people or property resulting from any ideas, methods, instructions or products referred to in the content. |
© 2026 by the authors. Licensee MDPI, Basel, Switzerland. This article is an open access article distributed under the terms and conditions of the Creative Commons Attribution (CC BY) license.