


Abstract
Rapid urbanization is increasingly threatening urban cultural heritage, leading to a systematic imbalance in such heritage and the destruction of its integrity and surrounding environment. The existing assessment methods mostly rely on single-dimensional data or qualitative observations, ignoring the collaborative quantification of the complex state of the heritage-surrounding environment. This study proposes a coupling perspective based on the physical form dimension, functional attribute dimension, and public perception dimension, and constructs a quantitative assessment framework to address the complex state of the heritage-surrounding environment. This framework integrates the spatial perception of SegFormer and the text semantic branch of MacBERT; uses the shared latent space feature alignment mechanism to fuse satellite and street view images, POIs, policy texts, and social media corpora; and, through Bootstrap resampling, builds a three-step adaptive calibration threshold to systematically measure and quantitatively characterize the three indices of spatial form (SMI), functional attribute (FAI), and public meaning drift (PMDI). The empirical evaluation of the Kaitong West Lane corridor reveals pronounced multi-dimensional non-equilibrium spatial evolution characteristics: its physical interface exhibits moderate degradation, and its micro-functional order and commercial ecosystem display severe disorder, yet online public discourse regarding core historical landmarks exhibits low semantic drift. Under dual-anchor conservative criteria, the overall assessment of the study area converges to a “moderately complex state”, while the micro-functional domain independently breaches the severe alert threshold. This framework addresses the perspective limitations of the traditional assessment of the heritage-surrounding environment; realizes the transformation from abstract spatial cognition to computable quantitative models; and thereby provides scientific support for the collaborative protection path and establishes a multimodal computational foundation for multi-dimensional micro-spatial evaluation, providing heuristic guidance for micro-regeneration strategies.
1. Introduction
Urban cultural heritage serves as an important carrier of the historical fabric of historical districts, representing the root and soul of the historical style of the districts, and stimulates the vitality and innovation of historical district development [1]. Under the tide of globalization and rapid urbanization, historical architectural heritage and its surrounding environment are facing unprecedented pressure. Therefore, the United Nations’ “2030 Agenda for Sustainable Development” has clearly emphasized the need to strengthen cultural heritage protection to enhance the inclusiveness and resilience of cities [2], and the “Operational Guidelines for the Implementation of the World Heritage Convention” also clearly state that protection should “go beyond the heritage itself and extend to the buffer zone and the broader environment covering land use, spatial organization, and social perception” [3]. This has prompted rescue restoration of heritage sites, gradually expanding to the systematic maintenance of the overall environment on which heritage sites depend [4]. In the practice of heritage protection around the world, the influence of urban form evolution on the perception and functional order of the surrounding environment of heritage sites is a core and challenging issue. The heritage protection strategies in George Town, Malaysia, and the revitalization of the Kesawan ancient district in Medan, among other global initiatives, indicate that attention to and activation of the surrounding environment of heritage sites have become core elements of cultural heritage protection and urban management [5,6]. In reality, the heritage-surrounding environment faces a dual dilemma: it is necessary to maintain the form control of the cultural heritage space while also continuously upgrading the vitality of the urban district [7,8]. Therefore, how to conduct multi-dimensional scientific cognition and explore micro-regeneration spatial strategies for the heritage-surrounding environment has become a cutting-edge issue in the fields of urban planning and heritage protection [9].
During the urban development process, the surrounding environment of heritage exhibits high complexity. Regarding the spatial structure dimension, renowned architectural scholar Laura Anna Pezzetti pointed out that the historical heritage environment is a “Palimpsest” that combines an explicit physical interface and deep social norms [10]. This complex state essentially stems from the structural conflict between rigid policies and spatial reality, and is prone to leading to the excessive pursuit of beautification and capital accumulation while neglecting local needs during the development process [11]. Therefore, this study proposes researching the complexity of the heritage-surrounding environment by exploring three dimensions—physical form (space), functional attributes (characteristics), and public perception (meaning)—when deconstructing the deep relationships of the heritage-surrounding environment [12].
Current research has achieved significant results in the assessment of cultural heritage features and the exploration of its vitality. However, while several studies combine street view imagery, POIs, and social media data, most existing approaches treat physical form, functional attributes, and public perception as isolated parallel variables, prematurely compressing modalities into independent scalars and failing to capture cross-modal misalignments and structural disparities at high-dimensional semantic levels [13,14]. Regarding the complex relationships between multiple elements in the dynamic evolution of the heritage-surrounding environment, there is still a lack of refined assessment methods that can align and deeply integrate multi-source data. With the cross-evolution of remote sensing geoinformation technology and multimodal deep learning technology, collaborative computing that integrates multi-source heterogeneous data such as images, texts, and spatial coordinates has become increasingly mature, providing a new path for analyzing the implicit correlations of multi-dimensional data and assessing spatial complexity [15,16,17].
Considering these challenges, and to address the scarcity of data samples at the micro-scale of historical districts, this research introduces cross-modal deep learning technology, based on SegFormer [18] and MacBERT [19], to construct a domain-adapted evaluation prototype system that integrates deep pre-trained feature priors, cross-modal contrastive alignment, and small-sample empirical Bayesian shrinkage calibration. Taking the Kaitong West Lane in Xi’an as the empirical object, the aim is to evaluate the multi-dimensional complexity of the surrounding environment of heritage spaces. This research addresses the following key issues:
- How to deconstruct the multi-dimensional complexity of the surrounding environment of a heritage space, and then construct an index system for evaluating the complex state of the space.
- How to fully explore and reasonably organize diverse heterogeneous data and further integrate multimodal datasets into the model architecture.
- How to convert multi-dimensional data features into computable quantitative indices to form a cognitive method for evaluating the complexity of the surrounding environment of a heritage space.
In conclusion, the purpose of this research is to assess and determine the complexity of the heritage-surrounding environment in historical cities through multimodal deep learning and dynamic threshold calibration technology. At the methodological level, this research aims to build a multimodal feature fusion framework based on a shared latent space; achieve cross-modal data alignment of physical form, functional characteristics, and social significance; and rely on three-dimensional quantitative indices and dynamic calibration thresholds to comprehensively judge the complex state of the heritage-surrounding environment. At the practical application level, this research takes the Kaitong West Lane in Xi’an as the empirical test platform for the construction and verification of this quantitative method, aiming to translate the above empirical quantitative assessment results into targeted planning implications for the micro-regeneration of the heritage-surrounding environment.
2. Literature Review
2.1. Theoretical Foundation
The Venice Charter defines historical monuments and explicitly emphasizes that “the protection of historical monuments involves the protection of a certain scale of the surrounding environment” [20]. In the Xi’an Declaration, the surrounding environment of a heritage space is clearly defined as “the surrounding environment that is close to the heritage entity and affects its significance, which not only covers the dimensions of the entity and perspective, but also includes social practices, traditional customs, and the actively developing cultural, social and economic atmosphere” [21]. Furthermore, UNESCO’s “Recommendation on the Historic Urban Landscape” points out that historic cities should be regarded as an overall layered network of cultural and natural values across time and space, encompassing topography, geomorphology, the built environment, spatial organization, and socio-cultural perception, among other multiple dimensions [22]. Following the academic research on the surrounding environment of heritage, Roger Trancik revealed in his seminal book Finding Lost Space that the historical periphery area is prone to physical form fractures and functional disorders during urban renewal [23], and Kevin Lynch explained the construction mechanism of the spatial perception order and collective meaning of a place in The Image of the City [24]. Laura Anna Pezzetti believes that the essence of the historical built environment and its surrounding space comprises the explicit physical layer superimposed by history and the potential structure and perception intertwined. Studies in environmental psychology and cultural geography on place identity jointly demonstrate that public cognition of historic district environments depends not only on the integrity of physical interfaces, but even more on the resonance between spatial functional use and collective narratives. Studies have shown that the cognition of the surrounding environment of heritage needs to overcome one-dimensional thinking [25] and conduct a comprehensive assessment from three dimensions: physical form (spatial explicit texture), functional attributes (legal property constraints), and public perception (meaning perception structure). Thus, a profound understanding of the multi-layered explicit and potential elements presented by the surrounding environment of heritage can be achieved, and then respond to the increasing complexity and heterogeneity of space presented in modern urban renewal evolution.
Spatial complexity is not merely synonymous with physical deterioration or functional disorder; rather, it reflects an inherent neutral heterogeneity of elements within historical districts that, when exacerbated by structural decoupling between institutional policies and physical space, ultimately manifests as a complex state of physical decay and functional conflict. This condition essentially stems from the systematic imbalance between policy goals and the actual site in the surrounding environment of the heritage site [26]. As shown in the logical framework in Figure 1, in the physical form dimension (A), the policy control and engineering construction implemented by the government at the macro level deviate from the actual needs of the public and social activities [27,28], resulting in the fragmentation and disintegration of the physical interface of the heritage-surrounding environment. In the functional attribute dimension (B), the government assigns a definite legal land nature to the space through planning means, but the actual situation is caused by the disorder of functional order triggered by meeting the needs of people’s livelihood services or commercial capital operation [29,30], leading to a mismatch between the legal land nature of the heritage-surrounding environment and the actual commercial and residential attributes [31]. In the public perception dimension (C), the government formulates macro-regional development goals through planning, but fails to deeply and effectively respond to the collective memory and spatial cultural identity of the public [32,33], resulting in the drift of public emotions and social exclusion. These conflicts and contradictions are not caused by a single factor but are the result of the cumulative evolution of multiple-dimensional elements, jointly constituting a dynamic complex space.
Figure 1.
Diagram illustrating the contradiction and conflict between policy goals and the actual situation.
In the face of such multi-dimensional complexity, recent research has shifted from analyzing text or image dimensions to multimodal fusion [34]. Against this backdrop, advances in multimodal representation learning theory [35,36] have driven the development of cross-modal latent space alignment techniques, providing key methodological support for dismantling the semantic barriers of multi-source heterogeneous urban data and uncovering deep structural misalignments. For instance, Ai et al. constructed a spatial–emotional–behavioral trinary matrix to analyze tourists’ perceptions and behaviors in the historical center of Macau [37], Long et al. utilized social media check-ins and street view images to precisely locate these hidden spaces with specific atmospheres through cross-modal fusion [38], and Song et al. established a spatial index framework to examine the impact of various spatial environmental factors on the vitality of different spatial units [39]. These studies collectively indicate that combining multi-source big data with computer models can enhance the quantitative assessment of historical spatial environments [40], providing in-depth exploration experience of the relationship between physical form, functional attributes, and public perception.
2.2. Indicator Construction
Given that the use of multimodal deep representations to analyze micro-spatial complexity remains in an exploratory stage without a universally standardized quantitative mapping paradigm, this study proposes an integrated quantitative evaluation standard. Grounded in classical urban spatial theory, it translates multi-dimensional contradictions between policy objectives and actual spatial conditions into computable vector features and couples them with deep learning algorithms, aiming to transform deep visual and textual representations into an interpretable quantitative indicator system for spatial complexity measurement, thereby providing an exploratory assessment of the complex state of the surrounding environment of the heritage site. Taking Kaitong West Lane in Xi’an, China, as a complete spatial analysis unit, a three-level evaluation index system consisting of the spatial morphological index (SMI), functional attribute index (FAI), and public meaning drift index (PMDI) was constructed (Table 1).
Table 1.
Construction of a three-level index matrix for assessing the complexity of the surrounding environment of the heritage site.
The construction of this indicator system follows a strict logic of “theoretical translation–parameter decomposition–multimodal feature alignment”. From the three dimensions of physical form, functional attributes, and public perception, three secondary spatial phenomenon measurement indicators were selected, namely, form continuity and boundary integrity, planning land use and actual site displacement, and the persistence of collective memory and place drift. The selection of all underlying parameters is anchored in classical spatial and sociological theories:
- Physical spatial dimension (SMI sub-parameters): Morphological proxies () and multi-view continuity () draw upon classical urban morphology and streetscape measurement theories [41,42,43,44] to quantify the physical enclosure and facade degradation of architectural interfaces; planning objective constraints () and geometrical characteristics () originate from space syntax and geometric topology theories [45,46] to capture deviations between on-site conditions and statutory red lines.
- Functional attribute dimension (FAI sub-parameters): System entropy () directly adopts the classical land-use mix entropy model [47,48]; dominant functional gap () and conflict score () are grounded in functional diversity theory [49] and urban vitality friction models [50]; transition ratio () and text embedding drift () reference studies on commercial gentrification and spatial functional succession [51,52].
- Public perception dimension (PMDI sub-parameters): Semantic drift () and emotional distribution drift () are anchored in place-perception mismatch models from environmental cognition theories [53,54], specifically serving here as quantitative proxies for the divergence between digital public communicative imagery and historical narratives.
Subsequently, based on the SegFormer and MacBERT models, a large number of image and text corpora were used for feature extraction, and then mapped to a shared latent space. Through high-dimensional feature convergence and weighted fitting algorithms, these cross-modal aligned features were normalized and folded. Finally, a comprehensive diagnostic index consisting of the SMI (quantifying physical interface degradation), FAI (quantifying micro-functional disorder), and PMDI (quantifying deviation in spatial narrative and public communicative image) was output. To avoid the influence of data volume errors, an adaptive calibration mechanism was introduced in the model. The critical deviations of the SMI, FAI, and PMDI values for the entire region were numerically calibrated. When sub-indices cross critical thresholds, the model effectively characterizes the region as exhibiting complex states of physical interface damage, functional attribute disorder, or disruptions in spatial communicative narratives.
3. Materials and Methods
3.1. Study Area
This study takes the Kaitong West Lane micro-corridor, located within the historical urban district of the Ming City Wall in Xi’an (Figure 2b, which spans a total walled area of 11.32 km2), as the empirical research object. This area retains a high-density traditional urban layout and is located in a complex spatial structure influenced by the overlapping of two heritage sites, namely, the Wolong Zen Temple and the Gao Peizhi’s Former Residence (Figure 2c). This spatial superposition endows Kaitong West Lane with multiple complexities regarding form evolution, functional order, and cultural perception. From the perspective of socio-spatial evolution, sustained urban renewal and tourism development across the historic city have led to significant outmigration of native residents, with daily active populations heavily substituted by external low-income tenants, small street-level commercial operators, and transient tourists. Consequently, the area concentrates composite symptoms: the loss of indigenous social memory carriers, informal commercial encroachment, and architectural material aging. Such micro-evolutionary dilemmas are by no means isolated anomalies, but common challenges universally faced across the Ming City Wall district and high-density walled historic cities throughout China. Therefore, this sample possesses high systemic representativeness and empirical deconstructive value for micro-level socio-spatial evolution research.
Figure 2.
Location of the historical area of Kaitong West Lane: (a) urban area of Xi’an City, Shaanxi Province; (b) Xi’an Ming City Wall Protection Area; (c) site location and the influence area of the heritage site.
3.2. Research Framework
This study has developed a multi-source data-driven, region-level “encoding–alignment–decoding” paradigm-based multimodal quantitative methodology process. Figure 3 shows that this quantitative logical framework is composed of four progressive modules. In the input dimension module, the research constructs a multi-dimensional layered structure covering space, features and meaning. Through two branches of visual images and attribute and emotional texts, it integrates physical form, functional attributes and public perception evaluations, forming a data-driven foundation based on multiple sources. Second, in the cross-modal deep learning module, the architecture follows the feature engineering paradigm. In the data-encoding stage, for a single continuous historical street and alley space, the visual side uses SegFormer to extract the regional-level spatial form proxy, while the text side uses MacBERT to encode the functional attributes and structured features of public perception. In the feature alignment stage, a projection head module is introduced to address cross-modal semantic differences and complete the deep fusion of visual and text features. During the decoding stage, high-dimensional vector processing and algorithm output mapping are carried out. In the Quantitative Scale & Judgment module, based on the fused mapping features, the spatial morphology index (SMI), functional attribute index (FAI) and public meaning drift index (PMDI) are quantitatively calculated, followed by multi-dimensional index fusion. Finally, by integrating these three indicators, a system is constructed to assess the complexity of the heritage-surrounding environment, measure the heterogeneous representation of the spatial status, and provide a basis for the activation and renewal of the heritage-surrounding environment.
Figure 3.
Multimodal quantitative logical framework for identifying the complexity of the surrounding environment of the heritage site.
3.3. Data Sources
To achieve a multi-dimensional analysis of the empirical objects, this study integrates three types of heterogeneous data: physical spatial form data, site functional attribute data, and spatial emotional evaluation data (Table 2).
Table 2.
List of multimodal data collection and preprocessing for Kaitong West Lane.
3.3.1. Physical Space Form Data
The physical spatial form data are responsible for constructing the spatial form structure of the research area, and they specifically include the following three categories:
- Geospatial base data: This includes the road grid, building outlines, building area, and height of the historical West Lane district. The vector data of the roads is sourced from OpenStreetMap, and the geographic coordinates have been uniformly converted.
- Orthophoto satellite images (RS): Centered on the sampling origin of the street view map, orthophoto satellite overhead views with the GeoTIFF spatial coordinate system were acquired from high-resolution web orthophoto remote sensing tiles. This data accurately represents the two-dimensional topological relationship of the perimeter walls, streets, and building outlines within the target area, and is used to extract macroscopic connectivity and geometric closed boundaries.
- Street view images (SVIs): To obtain the gradual variation characteristics of the physical walls of the historical district, this study conducted continuous sampling based on Baidu Maps SVIs. Along the Kaitong West Lane, 73 initial sampling points were set at nominal 5.0 m grid intervals in the EPSG:3857 projection (corresponding to a 3.96 m mean ground step and a 285.4 m cumulative WGS84 trajectory along the lane). Each sampling point was photographed from four directions (0°, 90°, 180°, and 270°), using a 22.5-degree tilt angle and a 90-degree field of view [55]. Based on engineering metadata verification, street view images originate from the historic district baseline acquisition archive (2018 temporal baseline). Kaitong West Lane is situated within the core conservation scope of the ancient city’s historic and cultural district. Multi-temporal satellite remote sensing comparisons (against July 2023 orthoimagery, resolution < 1.0 m) and field audits confirmed that the building footprints, historical courtyard walls, and enclosure patterns maintained high structural stability, with physical facade transformation progressing extremely slowly; thus, the 2018 baseline reliably reflects current physical boundaries. To ensure cross-modal spatial alignment in deep learning, data cleaning was conducted based on three quality-inspection criteria: severe occlusion of effective facade visibility, incomplete multi-view omnidirectional sightlines, and statutory redline decoupling with multimodal misalignment. Fifty-five invalid points were removed from the initial 73 points (specifically, 21 points due to severe facade occlusion by temporary construction hoarding or parked vehicles, 19 points due to incomplete four-direction sightlines at narrow turns or dead-ends, and 15 points due to coordinate drift or statutory redline buffer decoupling), ultimately retaining 18 high-quality spatial data nodes. Each node corresponds to four eye-level street view images and one co-located orthophoto satellite tile, constructing a core dataset of 90 images (18 groups × 5 images) to collaboratively extract facade materials, vertical occlusion, and global topological information. This filtering prioritizes unobstructed public street segments, ensuring a high signal-to-noise ratio and reliable cross-modal spatial correspondence across the retained nodes.
3.3.2. Site Functional Attribute Data
The site functional attribute data is used to define the legal attributes and actual functions of the space, and it includes the following two categories:
- Point of interest (POI) data: Derived from the Web service API of the Gaode Open Platform in 2023, based on its six-digit coding system, POIs were reclassified into standard categories such as dining, retail, commercial/residential, historical/cultural, and public services in accordance with national urban land-use classification standards, while duplicate and defunct business locations were removed to extract verified classification codes and coordinates of core business formats. As for the GCJ-02 coordinate system returned by the API, this study uniformly converted it into the WGS-84 coordinate system using ArcGIS Pro (version 3.0.2) to ensure the accuracy of spatial mapping.
- Policy and planning documents: Based on the government websites at all levels and the public database of the planning bureau, the system collected the “Historic and Cultural City Protection Plan”, “Urban Master Plan”, “Controlled Detailed Planning”, and special planning for the protection of the purple line, as well as relevant documents for the protection of historical heritage buildings within the study area, such as “Protection Plan for Sanxue Street Historical and Cultural District (2021–2035)” and “Examination and Interpretation of Issues Related to the Wolong Temple Steles and Other Matters in Xi’an”. For the original archival data obtained (including web announcement texts, PDF electronic documents, and scanned copies of early planning drawings), a unified process of information extraction and structured representation was performed, systematically extracting statutory land-use designations, plot ratios, building height red lines, and preservation control requirements.
3.3.3. Spatial Emotional Evaluation Data
The spatial emotional evaluation data is designed to quantify the evolution of public significance. Considering the ways in which the public participates in and evaluates the spatial environment, this study takes social platforms with significant “lifestyle-sharing” attributes (such as Xiaohongshu and Weibo) as the core data source.
- Social media user-generated content (UGC): Within the time frame from 10 March 2023 to 28 February 2026, using an automated Python (version 3.10) script, based on location service (LBS) tags and multi-dimensional keywords (including official names, common names, and iconic historical buildings), targeted public feedback data with geographical markers were collected. The study pooled data across the cross-period observation window from 10 March 2023 to 28 February 2026. Because Kaitong West Lane is a secondary micro-alleyway under 300 m in length with low daily posting volume, temporal stratification by quarter or month would result in extreme sample sparsity and induce high-dimensional mathematical noise in deep Transformer embeddings. Pooling observations over this consolidated window ensures the necessary semantic density and representation stability required for NLP modeling.
- Text preprocessing and validation: To ensure the confidence level of the model input, strict Python word segmentation cleaning, semantic relevance filtering, and verification of the research area spatial boundaries were carried out on the original corpus. After eliminating invalid interference, a total of 161 valid texts (including 150 text records from Xiaohongshu and 11 posts from Weibo) were finally determined to enter the subsequent deep learning model. Regarding data representativeness, social media corpora predominantly reflect the real-time spatial experiences of digitally active users and visitor cohorts. Therefore, this study explicitly focuses the measurement scope of this dimension on public spatial perceptions and place cultural imagery within digital communicative contexts, emphasizing the recognition expressed by contemporary mobile populations toward heritage spaces as a dynamic complement to physical morphological metrics. In terms of data compliance and privacy ethics, the pre-processing pipeline thoroughly stripped user nicknames, numerical UIDs, avatar URLs, and device identifiers, retaining solely anonymized text strings. Relying on publicly available, non-interventional online corpora, the study complies with relevant data privacy regulations and does not require formal ethical review under Article 32 of the Measures for Ethical Review of Life Science and Medical Research Involving Humans and the Measures for Academic Morality and Academic Ethics Management of Xi’an University of Architecture and Technology.
3.4. Methodology
This study overcomes the limitations of traditional single-dimensional data or subjective qualitative evaluation and constructs a multimodal feature fusion methodology framework based on deep learning (Figure 4). This computational framework corresponds to the following five progressive levels:
Figure 4.
Flowchart of the research design.
First, at the regional organization level (Figure 4a), the system integrates heterogeneous data from three dimensions: physical form (street scenes and orthophoto satellite images), functional attributes (POI and policy texts), and public perception (public social media texts). Second, at the cross-modal shared encoding layer (Figure 4b), the framework relies on the visual feature extraction network (SegFormer) and the natural language processing model (MacBERT) to extract high-dimensional feature vectors for each modality separately. Third, at the three-dimensional index construction layer (Figure 4c), based on the fused features in the latent space, the spatial morphological index (SMI), functional attribute index (FAI), and public meaning drift index (PMDI) are comprehensively deduced and quantified as the three core evaluation parameters. Fourth, at the threshold calibration layer (Figure 4d), a third-order dynamic threshold calibration mechanism adapted to the characteristics of a single region is introduced to establish the evaluation benchmark. Finally, at the result output and application layer (Figure 4e), the comprehensive determination rules are relied upon to evaluate the spatial complexity of the heritage-surrounding environment. The specific algorithm mechanisms and mathematical reasoning processes of each level within the framework are detailed in the following text.
3.4.1. Encoding of Visual Features of Physical Form
This study employs the open-source pre-trained model SegFormer (nvidia/segformer-b2-finetuned-cityscapes-1024-1024) as the spatial visual encoder. During feature extraction, the encoder backbone parameters are kept strictly frozen (freeze_encoder=True) to prevent catastrophic overfitting on the micro-corridor small sample (18 points). Specifically, orthophoto satellite tiles provide macro two-dimensional topology and the closure logic of physical building boundaries, whereas panoramic street view images capture architectural facade materials, height ratios, and visual occlusion characteristics. After multi-view images are input into SegFormer, the system extracts 19-class pixel-level semantic logits under the Cityscapes benchmark. These logits are aggregated through a predefined label_groups semantic aggregation layer into six macro-structural feature groups (road surface, building enclosure, vegetation, sky openness, vehicular traffic, and pedestrian interface) and input into the SMI component, achieving a robust quantitative characterization of the micro-corridor physical interface.
3.4.2. Textual Semantic Reconstruction of Functional Attributes
Regarding the acquired multi-dimensional spatial attribute texts, this study first integrates and restructures GIS attributes, POI information, and the specific legal control requirements of the heritage environment into a structured spatial description text. The text branch employs the pre-trained checkpoint hfl/chinese-macbert-base (12-layer Transformer, hidden dimension 768), with its backbone parameters kept frozen (freeze_encoder=True). After tokenizing the text, it is input into the model, relying on the multi-layer self-attention mechanism to sensitively capture the semantic dependencies and correlation weights between the spatial attribute tokens. Finally, regional-level sentence representations are aggregated via mean pooling to output a 768-dimensional spatial attribute embedding, constructing an Identity Profile that characterizes the comprehensive attributes of the spatial slice.
3.4.3. Perceived Text and Meaning Drift Quantification
To quantify the cognitive divergence between institutional planning expectations and public communicative imagery, this study employs the pre-trained checkpoint hfl/chinese-macbert-base (with frozen backbone parameters) to collaboratively represent contemporary social media UGC and statutory preservation texts. The framework constructs dual joint measures: first, computing the semantic embedding drift () between the two text populations in the shared latent space; second, attaching a lightweight linear classification head (: negative, neutral, and positive) to the backbone to extract coarse affective polarities via weak supervision on local annotated UGC, thereby calculating the emotional distribution divergence (). To bridge the stylistic gap between statutory planning documents and colloquial social media posts, the PMDI is formulated as a cross-source semantic alignment metric, quantifying the thematic and affective divergence between top-down conservation expectations and bottom-up public imagery.
3.4.4. Multimodal Alignment and Decoding Mechanism Based on Shared Latent Space
The traditional early or late fusion strategies often encounter difficulties in feature alignment and information loss when dealing with cross-domain data with significant view differences [56]. To overcome this limitation, this study constructed a shared latent space feature alignment module and strictly followed the “encoding–alignment–decoding” standard paradigm to complete unified modeling.
During the encoding stage, the system utilizes the aforementioned frozen dedicated encoders to extract high-dimensional visual and textual representations. In the alignment stage, to bridge the heterogeneous gap between visual logits and textual 768-dimensional embeddings, the system constructs non-linear projection heads (two-layer MLPs) to project dual-modal features into a unified shared latent space, strictly enforcing -norm normalization onto a unit hypersphere (). Cross-modal representation alignment is driven by a temperature-scaled () symmetric InfoNCE contrastive loss :
where positive pairs are defined as co-located image–text embeddings from the same spatial slice node, while negative pairs consist of in-batch non-co-located nodes (operating on two primary sub-region views in the training split with a batch size of positive pairs per step). Both foundational backbones (SegFormer-B2 and MacBERT-base) remain fully frozen (freeze_encoder=True); gradient updates optimize the lightweight task-specific layers, including the dual-branch projection heads ( and ), the SegFormer lightweight decode aggregation head, and the linear sentiment head (). Model architecture configurations (configs/base.yaml and configs/kaitong_west_lane_single_region.yaml) and execution scripts are available from the corresponding author upon reasonable request. In the decoding stage, the fused high-dimensional representations are analyzed and mapped to specific quantitative evaluation tasks, thereby outputting various spatial and semantic indices that support the measurement framework.
In the shared latent space, this study not only achieved the mathematical alignment of the underlying data features but also fundamentally constructed a multi-dimensional spatial topological structure that represents the urban spatial form, functional attributes, and public perception. In an ideal urban vitality space, these three modalities of representation should be highly matched, and in the potential space, this is manifested as the high convergence of the three sets of feature vectors in geometric distance. Conversely, when phenomena such as rough demolition and construction, management deficiencies caused by property disputes, or excessive commercialization occur in urban construction, the representation vectors will deviate sharply and mutually repel. The mathematical distance between different modal vectors corresponds to the quantitative projection of the perceptual gap and spatial positioning imbalance of spatial elements in the real world. This deviation of features constitutes the mathematical origin for this study to decode downward and generate complex state assessment indicators of the multi-dimensional space.
3.4.5. Mathematical Derivation of the Evaluation Index System for the Complexity of the Surrounding Environment of the Heritage
Based on the deviation degree and geometric distribution law of multimodal feature vectors in the shared latent space, this study converts the complex spatial evolution and boundary ablation features into computable quantitative indicators. This process systematically reconstructs the abstract dimensions in traditional urban planning theory, completes the engineering transformation of deep learning, and finally constructs a comprehensive evaluation matrix consisting of three core indicators: the spatial morphological index (SMI), the functional attribute index (FAI), and the public meaning drift index (PMDI). The mathematical definitions and calculation models of the specific indicators are as follows:
Spatial Morphology Index (SMI)
The spatial morphology index (SMI), as a crucial anchor indicator in the assessment system, quantitatively measures the divergence between physical reality and statutory preservation planning goals. Mathematically, its computational model adopts a hierarchical mapping architecture: across street and satellite views, underlying sensitivity features are mapped into four macro-spatial dimensions, namely morphological physical proxies (, street enclosure , vegetation , road , mobility , sky , pedestrian , plus satellite proxies ; sum ), planning objective constraints (, statutory redline and target deviations; sum ), geometrical characteristics (, directional geometry; weight ), and multi-view continuity (, street , satellite , cross-view ; sum ); underlying absolute deviations are then weighted and normalized within :
where the normalized macro-weights derived from the multi-view component weight sums (total denominator ) are (), (), (), and (), strictly satisfying . As the SMI value approaches 1, the mismatch in physical spatial form and facade fragmentation becomes more severe.
Functional Attribute Index (FAI)
To precisely measure micro-spatial attribute conflicts caused by commercial mixture and functional friction, this study constructs a two-stage hierarchical formulation for the functional attribute index (FAI):
Stage 1: Synthesizing the functional disorder metadata composite score () based on spatial attribute metadata with fixed weights:
where the nine baseline metadata weights sum to 1.000. To align with the five macro-components in Table 1, these nine sub-indicators structurally aggregate into four metadata macro-groups: system entropy (, combined weight ), functional dominance gap (, ), spatial conflict (, ), and transition ratio (, ).
Stage 2: Second-order linear fusion of the attribute metadata score with the fine-tuned text embedding drift () from the latent space at a 9:1 ratio:
Here, the weighting coefficients serve as fixed prior parameters; what varies across evaluation batches (R1–R4) is the relative empirical contribution percentage of each component to the total score according to local feature intensity.
Public Meaning Drift Index (PMDI)
The public meaning drift index (PMDI) is also a key anchor indicator in the assessment system, used to quantitatively evaluate the cognitive gap between the top-down initial spatial narrative and the bottom-up public real emotions. This study abandons the traditional single emotion scalar subtraction method, relying on the shared text encoder (MacBERT) to jointly extract the high-dimensional semantic and affective features from both social media UGC and statutory planning texts; its composite measurement model is defined as
Here, and denote semantic and affective drift, with . Specifically, the model configuration assigns a dominant weight of 70% () to the emotional distribution drift term and a secondary weight of 30% () to the semantic embedding drift term, highlighting the acute sensitivity of immediate social media sentiment to spatial evolution while normalizing the final PMDI into the interval. The closer the PMDI score is to 1, the more intense the semantic deviation and emotional discontinuity between the current public’s real experience and the spatial expectation, and the more significant the complexity and heterogeneity of the space at the sociological cognitive level.
High-Dimensional Alignment Difference (Alignment Gap)
The high-dimensional alignment difference degree, as an auxiliary monitoring and quality control indicator for the system, is used to evaluate the convergence stability of the feature fusion of multimodal data in the shared latent space. This indicator provides a fundamental measurement basis for the model’s confidence under extremely heterogeneous data and is used to ensure the robustness and reliability of the comprehensive evaluation system.
3.4.6. Ontological Definition of the Threshold for Spatial Complexity Determination
Based on the acquisition of high-dimensional continuous feature vectors and deviation indicators, this study converts the output of deep learning into interpretable urban spatial assessment conclusions through the setting of thresholds. This threshold classification mechanism is specifically tailored for studies with high complexity and strong heterogeneity, and where a single spatial area (such as a single historical street) is used as the verification object. Relying on the three dimensions of spatial form, functional attributes, and public significance, this study divides the regional spatial state into the following four levels:
- Severe complexity state: The surrounding environment of the heritage site has largely stripped away its original historical and planning positioning. The physical form has been completely fragmented, and there is a significant disconnection between public semantics and place memory.
- Moderate complexity state: The surrounding environment of the heritage site has undergone substantial damage and imbalance, with significant architectural environment dislocation or functional interface conflicts.
- Mild complexity state: The surrounding environment of the heritage site shows signs of initial decline and heterogeneity, and preventive intervention at the planning level needs to be introduced.
- No complexity state (none): The spatial form and functional order of the study area remain in good condition, and none of the indicators have reached the lower limit of the complexity threshold, demonstrating a high degree of structural convergence and continuity.
3.4.7. Model-Adaptive Third-Order Calibration Mechanism
In traditional morphological quantitative research, the thresholds are often derived from static constants preset by scholars based on subjective experience. However, this fixed threshold is prone to overfitting or large-scale misjudgments of the model when dealing with complex real urban multimodal big data due to the influence of experiential bias. Therefore, this study has developed a “third-order adaptive calibration mechanism” based on the actual distribution of data. This mechanism starts from the basic configuration values; undergoes distribution extraction, statistical contraction, and label guidance; and finally generates a calibration threshold adapted to the local sample distribution.
Phase 1—Quantile Distribution Estimation Calibration
When the training sample size of the system is sufficient (satisfying the condition aggregated regional evaluation units), the quantile extraction technique is given priority. Statistical and large-scale urban analysis studies have shown that determining the threshold based on the distribution of the data itself offers greater objectivity than subjective presetting. The model directly extracts quantile points from the probability density distribution of the indicators of the large sample to anchor thresholds: by default, the mild, moderate, and severe complexity grades conventionally correspond to the 50th, 70th, and 85th percentiles of the probability density distribution, respectively. This mechanism ensures consistency between the threshold and the macroscopic spatial characteristics of the city.
Phase 2—Small-Sample Resampling Heuristic Linear Shrinkage
To overcome sample sparsity when conducting in-depth analysis on a single micro-corridor in Kaitong West Lane, the calibration mechanism incorporates a heuristic linear shrinkage formulation inspired by empirical Bayes principles. The algorithm performs 256 random resamplings with replacement on the limited local dataset to estimate the local empirical distribution, applying an explicit linear shrinkage formula for smoothing:
where the global baseline prior originates from municipal planning control baselines ( for Alignment Gap). Across the two-view training calibration split (), local bootstrap estimates evaluated from the final trained model are for the SMI, for the PMDI, and for the FAI ( for Alignment Gap). The FAI reaches in this training partition because the two slices sample commercial intersection nodes with higher . Recomputing directly across the four corridor-wide evaluation views (R1–R4) yields FAI cutoffs of , which leaves all complexity classifications unchanged. Because the two calibration views belong to the same corridor with minimal internal variance, serves as a local magnitude anchor, while inter-grade intervals are governed by the municipal prior .
Phase 3—Label-Guided Grid Search Scaling
On top of statistical shrinkage, the algorithm searches through candidate scaling factor matrices to find the multiplier that achieves optimal consistency with expert regulatory benchmark labels. The benchmark regulatory labels were established by three urban heritage conservation researchers through field audits against the Sanxue Street Historic District Conservation Plan (2021–2035), with all three evaluators agreeing on both calibration views. The resulting cutoffs in Table 3 are qualified as within-case calibrated thresholds tailored to Kaitong West Lane. In the Kaitong West Lane empirical test, the optimal scaling factors converged to
Multiplying the core anchor thresholds (SMI and PMDI) by 0.55 proportionally lowers the threshold barriers for complexity determination. This operation heightens the model’s sensitivity to physical fabric degradation and cultural narrative rupture without suppressing the functional disorder score (FAI).
Table 3.
Threshold calibration results of the spatial complexity assessment indicators for Kaitong West Lane.
After the three-stage calibration of “quantile extraction–Bootstrap shrinkage–label scaling”, this study generated the final operational threshold matrix presented in Table 3, accompanied by confidence intervals derived from 256 Bootstrap resamplings across the 18 spatial nodes and 161 UGC text records. Because the cutoffs in Table 3 are case-specific empirical benchmarks tailored to the local spatial features and sample distribution of Kaitong West Lane, applying the framework to other historical districts requires re-running the three-stage calibration pipeline on local multi-source data. These calibrated parameters provide an operational benchmark for evaluating the spatial complexity state of the target street (Figure 5).
Figure 5.
Threshold banding of multi-dimensional evaluation indicators based on the third-order adaptive calibration mechanism and mapping to measured values.
4. Results
4.1. Experimental Workflow and Unified Threshold Mapping
In this stage of the experiment, the West Lane section was regarded as a complete and inseparable spatial assessment unit. During the data-preprocessing stage, this study conducted strict noise removal and spatial coordinate alignment on 73 original sampling points within the area, ultimately selecting 18 core verification points and the corresponding 90 valid street-side SVI sequences, forming a standardized visual assessment dataset. To support the subsequent Bootstrap validation mechanism, the above core points and their associated text and POI data were integrated as a unified overall dataset into the computing framework. At the same time, the study simultaneously retrieved high-resolution satellite images with high spatial matching to the core points, as well as structured public sentiment text data extracted and cleaned from social media open interfaces.
After completing the cross-modal alignment training, the multi-source heterogeneous dataset was input into the shared latent space alignment module. The model moved beyond the traditional single reliance on the vector inner product and norm distance measurement, conducting multi-dimensional composite feature analysis on the feature vectors of each dimension of the street. Through calculation, the model outputted three core indices quantifying the current spatial evolution state of the historical street area: the spatial morphological index (SMI), the functional attribute index (FAI), and the public meaning drift index (PMDI). Subsequently, the model compared and mapped these dynamic continuous values with the unique effective threshold matrix generated through third-order adaptive calibration (Table 3).
4.2. Evaluation of Computational Results Based on Conservative Decision Rules
In the quantitative comparison and hierarchical synthesis stages, to verify the internal stability of evaluating the entire street and alley as an integrated dataset, the system conducted multiple rounds of sampling calculations on this unified dataset. The single-region data loader designated four sub-region Bootstrap resampling evaluation batches (views R1 to R4 in Figure 6) to examine whether the indicators across all dimensions stably cross or remain constrained beneath specific threshold boundaries across batches.
Figure 6.
Trend chart of multi-dimensional complexity indicators (SMI, FAI, PMDI) for the entire section of Kaitong West Lane calculation.
Computational evaluations across the four sub-region bootstrap evaluation views (R1 to R4 in Figure 6, constructed as within-corridor views rather than independent validation to describe within-sample variation across spatial slices) demonstrate low within-sample dispersion:
- Spatial morphology index (SMI): The mean value is (ranging between 0.176 and 0.195; this narrow dispersion reflects the high spatial compactness and architectural homogeneity of the street-facing interface along this micro-corridor of under 300 m). Across all batches, it stably falls between the moderate threshold (0.163) and severe threshold (0.217), with its rating converging to a moderate complexity state (Moderate).
- Functional attribute index (FAI): The mean value is (ranging between 0.615 and 0.642). Across all batches, it exceeds the severe warning threshold of 0.580, exhibiting a severe complexity state (Severe).
- Public meaning drift index (PMDI): The mean value is (ranging between and ). While remaining below the mild threshold point estimate (), this range falls within its bootstrap confidence interval (); hence, it is conservatively qualified as a “None/Borderline Mild” complexity state.
- Auxiliary monitoring parameter (Cross-modal Alignment Gap): The mean value is .
According to the comprehensive judgment logic, because the spatial morphological index (SMI) and the public meaning drift index (PMDI) both belong to the core anchoring indicators with key decision-making authority, their relatively moderate numerical performance effectively balanced the extreme deviation effect of the functional attribute index (FAI). This allows the overall assessment of Kaitong West Lane to converge toward a “moderate complexity state” under the conservative decision rule (Table 4).
Table 4.
Calculation values and judgment mapping matrix of the comprehensive multi-dimensional complexity indicators for the Kaitong West Lane Project.
Final Grade Synthesis Calculation
The empirical data of Kaitong West Lane indicate spatial non-equilibrium characteristics: physical interface degradation exhibits moderate deviation (SMI: 0.185, Moderate complexity), and micro-functional order and the commercial ecosystem display severe disorder (FAI: 0.630, Severe complexity, breaching the 0.580 critical threshold), whereas cultural imagery and emotional resonance within public cognition and evaluation show low discursive drift (PMDI: 0.085, None/Borderline Mild). In the hierarchical synthesis stage, the final comprehensive conclusion is highly contingent upon the choice of decision rules: under a worst-case rule (where a severe level in any single dimension determines an overall severe rating), the street would be designated as “severe complexity”, highlighting the acute threat of commercial encroachment; conversely, under the dual-anchor conservative rule adopted here, the relative resilience of the two anchor indicators representing fabric ontology and cultural continuity (SMI and PMDI) counterbalances the extreme deviation of the functional dimension, allowing the overall assessment of Kaitong West Lane to converge to a “moderate complexity state (Moderate)”. Presenting both decision rules alongside the dimension-specific scores highlights this multi-dimensional non-equilibrium pattern without obscuring localized functional disorder (Table 5). In this ablation, the unaligned baseline uses the same inputs, R1–R4 views, encoders, heads, and Table 3 cutoffs as the proposed pipeline with only disabled; removing alignment increases and moves PMDI into the Moderate tier () without altering the overall rating under either decision rule.
Table 5.
Ablation comparison of cross-modal contrastive alignment, threshold calibration schemes, and decision rules.
4.3. Spatial Multi-Dimensional Analysis of Experimental Computational Results and Their Underlying Evolution Mechanisms
Through shared latent space multimodal fusion and threshold calibration, this study characterizes the complexity state of Kaitong West Lane across alternative decision rules (severe alert under the worst-case rule vs. moderate complexity under the dual-anchor rule). This determination is not an isolated algorithmic mapping, but a systematic representation of the non-equilibrium state of its urban morphological evolution and attribute characteristics. Based on the above multi-dimensional evaluation framework, the heterogeneous output of each sub-indicator characterizes the underlying spatial evolutionary dynamics and causes of structural planning misalignment within this historic district.
First, at the level of deviation between physical form evolution and interface continuity, the moderate deviation of the spatial morphology index (SMI) reflects the complex state of the material interface. Through the feature extraction of shared latent space, the model sensitively captured the local physical barriers of the historical walkway at the macroscopic topology and microscopic facade scales—such as discontinuous hard interfaces, cut-off sight corridors, and locally degraded and deformed building facades. These physical entity states are significantly out of alignment with the positioning of the cultural continuum in the protection policy. To further dissect the specific driving contributions of individual sub-parameters to spatial morphological dislocation, Figure 7 illustrates the contribution weight breakdown of SMI constituent components across four Bootstrap resampling evaluation batches (R1 to R4). The component contribution percentage possesses an explicit mathematical definition, representing the empirical relative proportion of each weighted indicator component relative to the total composite index score:
where and denote the preset weighting coefficient and the unclipped macro-group feature intensity of the k-th component, respectively, with the sum of all components in each evaluation batch (column) normalized to 100%. This heatmap provides macro-level planning interpretability, elucidating the primary driving causes of spatial disharmony.
Figure 7.
Heatmap of the contribution degree of the components of the spatial morphological index (SMI).
Computational statistics indicate (Figure 7) that the planning target redline constraint deviation achieves a contribution rate as high as 45.5–55.6% across batches (averaging 50.5%), which, together with morphological physical proxies (contributing 20.8–30.1%, averaging 24.7%), constitutes the decisive dominant driver of SMI divergence (jointly accounting for over 75%); in contrast, the contributions of multi-view facade continuity and point geometric characteristics are relatively moderate (each accounting for approximately 12%). This empirical evidence confirms that physical degradation in Kaitong West Lane essentially stems from localized encroachments of street-facing building facades beyond statutory preservation redlines, as well as informal additions disrupting the traditional street aspect ratio and enclosure, which is reflected in the moderate SMI rating.
Second, at the level of spatial attribute and functional decline, the severe deviation (Severe) of the functional attribute index (FAI) characterizes the disorder of public space. High information entropy and high conflict scores at the algorithmic level mean that the model cannot identify a dominant planning functional cluster in the region. When mapped onto the built environment, this manifests as the spontaneous encroachment of recyclable waste collection, scattered storage, and disordered street vendors on neighborhood spaces. Figure 8 illustrates the FAI component decomposition heatmap output based on the identical contribution calculation formulation.
Figure 8.
Heatmap of components’ contributions to the functional attribute index (FAI).
Computational results indicate (Figure 8) that system entropy (System entropy value, averaging 29.2%), spatial conflict score (Space conflict score, averaging 28.3%), and dominant functional gap (Dominant functional gap, averaging 27.7%)—the three primary disorder drivers—collectively account for as much as 85.2% of the contributions to the FAI, constituting the fundamental driving forces behind spatial attribute ambiguity and functional mixture; in contrast, the impacts of the spatial transition ratio (averaging 11.3%) and text embedding drift (averaging 3.6%) are relatively moderate. This chaotic mixture of commercial activities lacking a dominant order severely dilutes the localized place attributes of the historical district, marginalizing and obscuring its standing within the ancient city’s overall cognitive landscape and gradually turning it into a passive functional blind spot devoid of cohesion.
Finally, at the level of social significance and emotional connection, the empirical data reveal discursive characteristics that are decoupled from the physical built environment. Across evaluation batches, the public meaning drift index (PMDI) remains stable at – (mean ). Although this falls slightly below the mild threshold point estimate (), it lies squarely within its bootstrap confidence interval (); hence, the PMDI is conservatively qualified as a “None/Borderline Mild” state (low discursive drift). This indicates that statutory preservation decrees and online public texts maintain relatively high thematic consistency regarding core historical landmarks (such as Wolong Zen Temple).
Because social media UGC predominantly reflects younger transient visitors rather than indigenous residents, the research team conducted supplementary contextual field consultations in October 2026 (15–25 min semi-structured street-intercept conversations with 12 long-term participants—seven elderly residents aged 55–78 and five veteran shopkeepers—analyzed via thematic clustering of anonymized notes). Interviewees’ recognition of the Wolong Temple axis and complaints over sidewalk encroachments paralleled the low online drift () and severe FAI disorder (; e.g., Shopkeeper #3 noted “outdoor tables block wheelchairs”), whereas elderly residents noted neighborhood memory dilution as tourist eateries replaced local repair and grocery stalls (Resident #4: “everyday neighborhood warmth has faded”). Thus, online visitor discourse captures landmark persistence but may overlook micro-scale community memory dilution.
In the hierarchical synthesis stage, the multi-dimensional complexity determination reflects a pronounced non-equilibrium reality depending on the chosen decision rule: under the worst-case rule, the extreme degradation of the commercial interface directly triggers a “Severe Complexity” alert (governed by ), ensuring that localized functional crises are not obscured; conversely, under the dual-anchor conservative rule, the stability of physical interface fabric () and cultural landmark narrative () guides the overall district to converge toward a “Moderate Complexity” state. This stepwise reporting explicitly highlights that Kaitong West Lane undergoes acute commercial format disorder alongside resilient physical–cultural continuity. To evaluate the robustness of these diagnostic outcomes against prior weight perturbations, a Monte Carlo sensitivity analysis perturbing all preset weights in Equations (2)–(5) by across 100 iterations was conducted. The resulting profile rankings across the 18 nodes maintained high stability with an average Kendall’s rank correlation of , while the regional complexity classifications across all three dimensions remained robustly consistent without category flipping across the simulation runs (SMI: Moderate; FAI: Severe; PMDI: None/Borderline Mild).
5. Discussion
5.1. Theoretical and Methodological Innovation
Traditional research methods for analyzing heritage spaces mostly rely on static planar forms and subjective qualitative assessments, lacking the deep integration of multimodal heterogeneous data. This limited perspective that focuses on a certain aspect often overlooks the dynamic connections between the physical environment, functional attributes, and public perception, and is unable to effectively measure the multi-dimensional displacement mechanisms of the space [57,58,59]. To overcome this limitation, this study draws on Pezzetti’s superimposed structure theory and constructs a data integration framework that integrates the three dimensions of physical form, functional attributes, and public perception. This provides a set of integrated evaluation methods for systematically identifying and quantifying the complex evolution state of the surrounding environment of heritage sites. Through empirical testing of the historical district of Kaitong West Lane, the empirical results revealed the cultural symbol mismatch, spatial form ambiguity, and functional usage disorder triggered by changes in the heritage-surrounding environment.
In terms of methods, integrating multi-source heterogeneous data with a deep learning recognition framework not only addresses the technical limitations of cross-modal alignment between text and images but also provides a computational workflow that may be adapted to other historic districts for the quantitative assessment of the complex spaces surrounding heritage. At the same time, this research overcomes the limitations of traditional methods in urban quantitative assessment, which rely on preset static thresholds. It introduces an exploratory three-step adaptive threshold calibration mechanism based on shared latent space feature alignment and Bootstrap resampling. This mechanism dynamically calibrates the thresholds, effectively assessing the complexity of the functional and morphological decline of the heritage-surrounding environment, demonstrating that the deep alignment of multimodal features can effectively characterize micro-spatial complexity thresholds, providing quantitative diagnostic references and planning implications for multi-dimensional spatial states in historic districts.
5.2. Adaptive Regeneration Implications Based on Spatial Complexity Assessment
Under the multi-dimensional assessment system, Kaitong West Lane, serving as a micro-corridor connecting key cultural heritage conservation units, displays pronounced spatial multi-dimensional non-equilibrium evolutionary characteristics: the functional attribute dimension (FAI: 0.630) exhibits severe disorder, the physical morphological dimension (SMI: 0.185) shows moderate deviation, and public perception and social recognition (PMDI: ) stably remain at the baseline state (qualified as None/Borderline Mild). These empirical data indicate that current neighborhood contradictions are acutely concentrated on localized physical interface damage and chaotic micro-functional disorder, whereas core heritage landmarks sustain thematic narrative persistence despite localized community memory dilution.
For such non-equilibrium heritage-surrounding environments, regeneration interventions must abandon wholesale demolition or blind cosmetic facadism, pivoting toward “assessment-driven, dimensionally targeted” adaptive micro-regeneration. Therefore, this study proposes heuristic planning orientations grounded in multi-dimensional quantitative assessment findings to provide targeted decision-making references for refined spatial governance:
- Morphological Dimension: Boundary Softening and Redline Regularization (Targeting SMI Moderate Deviation)Addressing the core drivers of street-facing building encroachments and solid enclosure interfaces that exacerbate spatial obstruction (contributing over 75% to the SMI), morphological regeneration should prioritize interface transparency restoration and statutory planning boundary regularization. While strictly adhering to historical district conservation redlines, illegal street-side additions should be progressively cleared, encouraging the introduction of permeable greenery and semi-open boundary elements. Clearing micro-visual corridors and restoring traditional street aspect ratios will enhance facade visual continuity, fostering organic morphological cohesion between heritage entities and the peripheral built fabric.
- Functional Dimension: Commercial Format Access Control and Negative Function Diversion (Targeting FAI Severe Disorder)Addressing severe spatial disorder driven by information entropy surge, functional conflicts, and dominant format deficiency (accounting for 85.2% of FAI contributions), functional interventions must focus on micro-commercial access regulation and the governance of ground-level public space occupancy. We recommend formulating positive compatibility and negative exclusion format catalogs tailored to historic district style, systematically diverting negative peripheral uses such as recyclable waste collection and informal storage that encroach on pedestrian corridors. Moving vehicular static parking and through-traffic outward allows for flexible insertion of composite micro-service amenities that balance native residents’ everyday livelihood needs with light cultural tourism experiences, rebuilding a legible dominant functional order.
- Perceptual Dimension: Memory Maintenance and Low-Impact Micro-Intervention (Targeting PMDI Low Landmark Drift)Given that online discourse regarding core historical landmarks shows low drift while local residents experience subtle neighborhood memory dilution, perceptual interventions should adhere to the preventive conservation principle of “low-impact, micro-intervention, and heritage transmission”. Excessive commercial staging that destructively displaces localized neighborhood life must be averted. Efforts should focus on upgrading age-friendly and convenient micro-interaction facilities along the Wolong Temple cultural axis, subtly encouraging the profound cultural connotations of heritage to permeate into everyday living scenarios through the continuation of traditional paving textures and lightweight spatial cultural cues.
6. Conclusions
This study is contextualized within the prevalent structural mismatch between historical heritage buildings commonly found in the ancient city of Xi’an and their surrounding environments. Taking Kaitong West Lane within the Ming City Wall in Xi’an, China, as an archetypal empirical case, this study constructs a cross-modal deep learning complexity quantitative assessment framework that couples the visual semantic perception of SegFormer with the deep textual comprehension of MacBERT. By establishing a shared metric latent space mapping multimodal high-dimensional features and introducing a three-stage adaptive calibration pipeline accounting for small-sample distributional properties, the system successfully realizes the unified characterization of overlapping multi-dimensional relationships across physical spatial form, statutory planning policies, and community public perception. Empirical calculations indicate that the overall assessment depends on the decision criterion: under the worst-case warning rule, Kaitong West Lane is designated as “severe complexity” (driven by ), whereas under the dual-anchor conservative rule, it converges to a “moderate complexity state” (, ).
The core findings of this study reveal that Kaitong West Lane has not descended into an extreme state of comprehensive degradation, but rather exhibits pronounced “spatial multi-dimensional non-equilibrium evolutionary” characteristics: physical built interfaces display moderate disruption (SMI: Moderate) with prominent statutory redline encroachments, and micro-functional order exhibits severe imbalance (FAI: Severe) with highly fragmented commercial formats, whereas cultural identification within online public communication displays low discursive drift regarding major historical landmarks (PMDI: , falling within the confidence interval of the mild threshold, qualified as None/Borderline Mild), while offline field consultations reveal that long-term residents nonetheless experience subtle lived memory dilution from commercial substitution. Overcoming the limitations of conventional evaluations that rely on single scalars or subjective qualitative appraisals, this study disaggregates micro-scale multi-dimensional heterogeneous reality rather than compressing it into a single rating. It not only offers empirical references for Kaitong West Lane in micro-regeneration practices—such as physical interface regularization, commercial negative list governance, and low-impact cultural node suturing—but also establishes an operational quantitative paradigm for the fine-grained multidimensional assessment of historic urban heritage surroundings.
Several scope conditions of this study point to directions for future research. First, while sensitivity tests confirm computational robustness within this corridor, concerning external generalizability, because empirical validation was conducted on a single micro-corridor, the calibrated thresholds in Table 3 reflect the local feature distribution of Kaitong West Lane and require local re-calibration when adapted to other districts. Second, a temporal gap exists between the 2018 street view archive and the 2023–2026 POI/UGC datasets, and social media posts primarily capture younger visiting cohorts. Nevertheless, the SMI–FAI–PMDI three-dimensional evaluation system, the dual-branch latent space contrastive alignment mechanism, and the adaptive threshold shrinkage pipeline possess potential methodological adaptability. Future research will advance from single-corridor exploration toward multi-center cross-regional validation, ingesting full-element synchronized dynamic data and deepening integration with oral history archives. Concurrently, integrating long-sequence spatio-temporal graph learning models will facilitate the evolutionary transition of spatial complexity assessment from static baseline diagnosis toward the dynamic simulation and longitudinal tracking of post-intervention micro-regeneration effects.
Author Contributions
Conceptualization, M.M. and B.Z.; methodology, M.M.; software, M.M.; validation, M.M. and B.Z.; formal analysis, M.M.; investigation, M.M.; resources, B.Z.; data curation, M.M.; writing—original draft preparation, M.M.; writing—review and editing, B.Z. and M.M.; visualization, M.M.; supervision, B.Z. and J.M.; project administration, B.Z. and J.M.; funding acquisition, B.Z. All authors have read and agreed to the published version of the manuscript.
Funding
This research was funded by the National Natural Science Foundation of China (Grant No. 52008327), the Shaanxi Provincial Philosophy and Social Sciences Office (Grant No. 2025J017), and the Youth Foundation of Humanities and Social Sciences Research of the Ministry of Education of China (Grant No. 22YJC760065).
Institutional Review Board Statement
Ethical review and approval were not required for this study under the Measures for Academic Morality and Academic Ethics Management of Xi’an University of Architecture and Technology and Article 32 of the Measures for Ethical Review of Life Science and Medical Research Involving Humans, as confirmed prior to the October 2026 field consultations: the online social media analysis used exclusively existing, publicly available, and fully anonymized data (covered by Article 32), and the supplementary street-intercept consultations were non-interventional, anonymous inquiries on urban spatial perception that collected no identifiable or sensitive personal data.
Informed Consent Statement
Verbal informed consent was obtained from all participants involved in the exploratory field consultations prior to the interviews.
Data Availability Statement
The datasets, model configuration specifications (configs/base.yaml and configs/kaitong_west_lane_single_region.yaml; min_samples = 10, sample_count = 2), and execution scripts supporting the findings of this study are available from the corresponding author (M.M.) upon reasonable request.
Acknowledgments
We would like to thank the editors and the anonymous reviewers for their insightful comments and constructive suggestions. We also appreciate the staff who previously participated in the conservation planning of the area within the Ming City Wall in Xi’an for their hard work.
Conflicts of Interest
The authors declare no conflicts of interest.
References
- Aldossary, M.J.; Alqahtany, A.M.; Alshammari, M.S. Cultural Heritage as a Catalyst for Sustainable Urban Regeneration: The Case of Tarout Island, Saudi Arabia. Sustainability 2025, 17, 4431. [Google Scholar] [CrossRef] [Scilit]
- UN General Assembly. Transforming Our World: The 2030 Agenda for Sustainable Development; UN General Assembly: New York, NY, USA, 2015. [Google Scholar]
- UNESCO World Heritage Centre. Operational Guidelines for the Implementation of the World Heritage Convention; UNESCO World Heritage Centre: Paris, France, 2005. [Google Scholar]
- Lee, J. Zoning Scenic Areas of Heritage Sites Using Visibility Analysis: The Case of Zhengding, China. J. Asian Archit. Build. Eng. 2023, 22, 1–13. [Google Scholar] [CrossRef] [Scilit]
- Jameel, T.; Ujang, U.; Azri, S. 3D Urban Morphological Spatial–Temporal Patterns and Its Impact on the Malaysian Urban Heritage. In Geospatial Innovation: Igniting Smart Cities, Eco-Synergy, and Urban Resurgence; Yadava, R.N., Ujang, U., Eds.; Springer Nature: Cham, Switzerland, 2026; pp. 125–140. [Google Scholar] [CrossRef] [Scilit]
- Fahmi, N.; Nuraini, C. Revitalization of Kesawan District, Medan (2024): A Theoretical Evaluation Based on Roger Trancik’s Concept of Lost Space. In Proceedings of the International Conference of Digital Sciences and Engineering Technology (ICDSET), Medan, Indonesia, 24 September 2024; pp. 286–295. Available online: https://proceeding.pancabudi.ac.id/index.php/ICDSET/article/view/336 (accessed on 20 October 2026).
- Zhang, Q.; Cheng, T.; Xu, P.; Jiang, X. Balancing Heritage Conservation and Urban Vitality Through a Multi-Tiered Governance Strategy: A Case Study of Nanjing’s Yihe Road Historic District, China. Land 2025, 14, 1894. [Google Scholar] [CrossRef] [Scilit]
- Li, H.; Miao, L. A Study of the Non-Linear Relationship Between Urban Morphology and Vitality in Heritage Areas Based on Multi-Source Data and Machine Learning: A Case Study of Dalian. ISPRS Int. J.-Geo-Inf. 2025, 14, 177. [Google Scholar] [CrossRef] [Scilit]
- Chen, L.; Jiang, X.; Tan, L.; Chen, C.; Yang, S.; You, W. Analysis of Spatial Vitality Characteristics and Influencing Factors of Old Neighborhoods: A Case Study of Ya’an Xicheng Neighborhood. Buildings 2024, 14, 3348. [Google Scholar] [CrossRef] [Scilit]
- Carlotti, P.; Pezzetti, L.A. Layered Morphologies and Latent Structure: Reading, Decoding and Rewriting to Enhance Historic Rurban Landscape. U+D Urbanform Des. 2021, 16, 190–191. [Google Scholar] [CrossRef]
- Verdini, G.; Xin, S. Heritage-Led Regeneration in Chinese Intermediary Cities: Understanding Incremental Changes under a `Business as Usual’ Urban Governance Regime. Town Plan. Rev. 2024, 95, 1–24. [Google Scholar] [CrossRef] [Scilit]
- Wang, M.; Zhang, F.; Wu, F. “Micro-Regeneration”: Toward Small-Scale, Heritage-Oriented, and Participatory Redevelopment in China. J. Urban Aff. 2024, 46, 1953–1970. [Google Scholar] [CrossRef] [Scilit] [PubMed]
- Gao, L.; Xiang, X.; Chen, W.; Nong, R.; Zhang, Q.; Chen, X.; Chen, Y. Research on Urban Street Spatial Quality Based on Street View Image Segmentation. Sustainability 2024, 16, 7184. [Google Scholar] [CrossRef] [Scilit]
- Wu, J.; Lu, Y.; Gao, H.; Wang, M. Cultivating Historical Heritage Area Vitality Using Urban Morphology Approach Based on Big Data and Machine Learning. Comput. Environ. Urban Syst. 2022, 91, 101716. [Google Scholar] [CrossRef] [Scilit]
- Zhang, Y.; Xu, Y.; Gao, J.; Zhao, Z.; Sun, J.; Mu, F. Urban Functional Zone Identification Based on Multimodal Data Fusion: A Case Study of Chongqing’s Central Urban Area. Remote Sens. 2025, 17, 990. [Google Scholar] [CrossRef] [Scilit]
- Li, Z.; Shang, T.; Xu, P.; Deng, Z. Place Recognition Meet Multiple Modalities: A Comprehensive Review, Current Challenges and Future Development. Artif. Intell. Rev. 2025, 58, 363. [Google Scholar] [CrossRef] [Scilit]
- Liu, T.; Chen, H.; Ren, J.; Zhang, L.; Chen, H.; Hong, R.; Li, C.; Cui, W.; Guo, W.; Wen, C. Urban Functional Zone Classification via Advanced Multi-Modal Data Fusion. Sustainability 2024, 16, 11145. [Google Scholar] [CrossRef] [Scilit]
- Xie, E.; Wang, W.; Yu, Z.; Anandkumar, A.; Alvarez, J.M.; Luo, P. SegFormer: Simple and Efficient Design for Semantic Segmentation with Transformers. In Proceedings of the Advances in Neural Information Processing Systems (NeurIPS); Ranzato, M., Beygelzimer, A., Dauphin, Y., Liang, P.S., Vaughan, J.W., Eds.; Curran Associates Inc.: Red Hook, NY, USA, 2021; Volume 34, pp. 12077–12090. [Google Scholar] [CrossRef] [Scilit]
- Cui, Y.; Che, W.; Liu, T.; Qin, B.; Wang, Z.; Hu, G. Revisiting Pre-Trained Models for Chinese Natural Language Processing. In Proceedings of the Findings of the Association for Computational Linguistics: EMNLP 2020; Zong, C., Xia, F., Li, W., Navigli, R., Eds.; Association for Computational Linguistics: Stroudsburg, PA, USA, 2020; pp. 657–668. [Google Scholar] [CrossRef] [Scilit]
- ICOMOS. International Charter for the Conservation and Restoration of Monuments and Sites (The Venice Charter); ICOMOS: Venice, Italy, 1964. [Google Scholar]
- ICOMOS. Xi’an Declaration on the Conservation of the Setting of Heritage Structures, Sites and Historic Areas. In Proceedings of the 15th ICOMOS General Assembly; ICOMOS: Xi’an, China, 2005. [Google Scholar]
- Bandarin, F.; van Oers, R. The Historic Urban Landscape: Managing Heritage in an Urban Century; John Wiley & Sons: Chichester, UK, 2012; pp. 1–264. [Google Scholar] [CrossRef] [Scilit]
- Trancik, R. Finding Lost Space: Theories of Urban Design; Van Nostrand Reinhold: New York, NY, USA, 1986. [Google Scholar]
- Lynch, K. The Image of the City; MIT Press: Cambridge, MA, USA, 1964. [Google Scholar]
- Lewicka, M. Place Attachment: How Far Have We Come in the Last 40 Years? J. Environ. Psychol. 2011, 31, 207–230. [Google Scholar] [CrossRef] [Scilit]
- Zhang, R.; Martí Casanovas, M.; Bosch González, M.; Sun, S. Revitalizing Heritage: The Role of Urban Morphology in Creating Public Value in China’s Historic Districts. Land 2024, 13, 1919. [Google Scholar] [CrossRef] [Scilit]
- Zhu, Y.; González Martínez, P. Heritage Values and Gentrification: The Redevelopment of Historic Areas in China. Int. J. Herit. Stud. 2022, 28, 476–494. [Google Scholar] [CrossRef] [Scilit]
- González Martínez, P. Authenticity as a Challenge in the Transformation of Beijing’s Urban Heritage: The Commercial Gentrification of the Guozijian Historic Area. Cities 2016, 59, 48–56. [Google Scholar] [CrossRef] [Scilit]
- Huang, J.; Hu, X.; Wang, J.; Lu, A. How Diversity and Accessibility Affect Street Vitality in Historic Districts? Land 2023, 12, 219. [Google Scholar] [CrossRef] [Scilit]
- Chen, H.; Wang, L.; Waley, P. The Right to Envision the City? The Emerging Vision Conflicts in Redeveloping Historic Nanjing, China. Urban Aff. Rev. 2020, 56, 1746–1778. [Google Scholar] [CrossRef] [Scilit]
- Gümüş Battal, İ. Developing a Morphological Sustainability Index (MSI) for UNESCO Historic Urban Landscape Areas: A Pilot Study in the Bursa Khans District, World Heritage Site. Sustainability 2026, 18, 1229. [Google Scholar] [CrossRef] [Scilit]
- Liu, K.; Wang, Y.; Yang, R.; Xian, Z.; Takeda, S.; Zhang, J.; Xing, S. Interpreting the Space Characteristics of Everyday Heritage Gardens of Suzhou, China, through a Space Syntax Approach. J. Asian Archit. Build. Eng. 2025, 24, 3471–3496. [Google Scholar] [CrossRef] [Scilit]
- Xie, C.; Yang, J.; Zhang, Y.; Xiao, J. Balancing Local Life and Tourism in the Renewal of Commercialised Historic Districts: A Study of Everyday Life in Yongqing Fang, Guangzhou, China. Buildings 2026, 16, 2618. [Google Scholar] [CrossRef] [Scilit]
- Zhang, F.; Zhou, B.; Liu, L.; Liu, Y.; Fung, H.H.; Lin, H.; Ratti, C. Measuring Human Perceptions of a Large-Scale Urban Region Using Machine Learning. Landsc. Urban Plan. 2018, 180, 148–160. [Google Scholar] [CrossRef] [Scilit]
- Zhang, C.; Yang, Z.; He, X.; Deng, L. Multimodal Intelligence: Representation Learning, Information Fusion, and Applications. IEEE J. Sel. Top. Signal Process. 2020, 14, 478–493. [Google Scholar] [CrossRef] [Scilit]
- Radford, A.; Kim, J.W.; Hallacy, C.; Ramesh, A.; Goh, G.; Agarwal, S.; Sastry, G.; Askell, A.; Mishkin, P.; Clark, J.; et al. Learning Transferable Visual Models From Natural Language Supervision. In Proceedings of the 38th International Conference on Machine Learning (ICML); Meila, M., Zhang, T., Eds.; PMLR: Cambridge, MA, USA, 2021; Volume 139, pp. 8748–8763. [Google Scholar] [CrossRef] [Scilit]
- Ai, D.; Kuang, D.; Tao, Y.; Zeng, F. Integrating Image Recognition, Sentiment Analysis, and UWB Tracking for Urban Heritage Tourism: A Multimodal Case Study in Macau. Sustainability 2025, 17, 7573. [Google Scholar] [CrossRef] [Scilit]
- Long, Y.; Jiao, S.; Yu, Y.; Xiao, K. An Analysis of Spatial Vitality Distribution and Formation Mechanisms in Historical Urban Areas Based on Multi-Source Big Data: A Case Study of Changsha. Front. Archit. Res. 2025, 14, 1727–1749. [Google Scholar] [CrossRef] [Scilit]
- Song, Y.; Zhang, W.; Deng, Y.; Mo, H.; Li, Y. Decoding Spatial Vitality in Historic Districts: A Grey Relational Analysis of Multidimensional Built Environment Factors in Shanghai’s Zhangyuan. Land 2025, 14, 1869. [Google Scholar] [CrossRef] [Scilit]
- Lyu, Y.; Sima, Y.; Abd Malek, M.I.; Liu, C.; Gao, P. Urban Heritage Regeneration by Integrating Space Syntax and Data-Driven Spatial Analysis: Insights from Yushan Historic District, China. J. Asian Archit. Build. Eng. 2025, 1–17. [Google Scholar] [CrossRef] [Scilit]
- Conzen, M.R.G. Alnwick, Northumberland: A Study in Town-Plan Analysis. Trans. Pap. (Inst. Br. Geogr.) 1960, 27, iii-122. [Google Scholar] [CrossRef] [Scilit] [PubMed]
- Caniggia, G.; Maffei, G.L. Architectural Composition and Building Typology: Interpreting Basic Building; Alinea Editrice: Florence, Italy, 2001; pp. 1–252. [Google Scholar]
- Ewing, R.; Cervero, R. Travel and the Built Environment: A Meta-Analysis. J. Am. Plan. Assoc. 2010, 76, 265–294. [Google Scholar] [CrossRef] [Scilit]
- Harvey, C. Measuring Streetscape Design for Livability Using Spatial Data and Methods. Ph.D. Thesis, University of Vermont, Burlington, VT, USA, 2014. [Google Scholar]
- Hillier, B.; Hanson, J. The Social Logic of Space; Cambridge University Press: Cambridge, UK, 1984; pp. 1–296. [Google Scholar] [CrossRef] [Scilit]
- Siksna, A. The Effects of Block Size and Form in North American and Australian City Centres. Urban Morphol. 1997, 1, 19–33. [Google Scholar] [CrossRef] [Scilit]
- Frank, L.D.; Andresen, M.A.; Schmid, T.L. Obesity Relationships with Community Design, Physical Activity, and Time Spent in Cars. Am. J. Prev. Med. 2004, 27, 87–96. [Google Scholar] [CrossRef] [Scilit] [PubMed]
- Cervero, R.; Kockelman, K. Travel Demand and the 3Ds: Density, Diversity, and Design. Transp. Res. Part D Transp. Environ. 1997, 2, 199–219. [Google Scholar] [CrossRef] [Scilit]
- Jacobs, J. The Death and Life of Great American Cities; Random House: New York, NY, USA, 1961; pp. 1–458. [Google Scholar]
- Montgomery, J. Making a City: Urbanity, Vitality and Urban Design. J. Urban Des. 1998, 3, 93–116. [Google Scholar] [CrossRef] [Scilit]
- Zukin, S. Gentrification: Culture and Capital in the Urban Core. Annu. Rev. Sociol. 1987, 13, 129–147. [Google Scholar] [CrossRef]
- Atkinson, R. The Hidden Costs of Gentrification: Displacement in Central London. J. Hous. Built Environ. 2000, 15, 307–326. [Google Scholar] [CrossRef] [Scilit]
- Relph, E. Place and Placelessness; Pion: London, UK, 1976; pp. 1–156. [Google Scholar]
- Tuan, Y.F. Space and Place: The Perspective of Experience; University of Minnesota Press: Minneapolis, MN, USA, 1977; pp. 1–235. [Google Scholar]
- He, J.; Zhang, J.; Yao, Y.; Li, X. Extracting Human Perceptions from Street View Images for Better Assessing Urban Renewal Potential. Cities 2023, 134, 104189. [Google Scholar] [CrossRef] [Scilit]
- Baltrušaitis, T.; Ahuja, C.; Morency, L.P. Multimodal Machine Learning: A Survey and Taxonomy. IEEE Trans. Pattern Anal. Mach. Intell. 2018, 41, 423–443. [Google Scholar] [CrossRef] [Scilit]
- Wang, J.; Zakaria, S.A. Design Application and Evolution of 3D Visualization Technology in Architectural Heritage Conservation: A CiteSpace-Based Knowledge Mapping and Systematic Review (2005–2024). Buildings 2025, 15, 1854. [Google Scholar] [CrossRef] [Scilit]
- Wu, Y.; Chen, Y.; Zhang, R.; Cui, Z.; Liu, X.; Zhang, J.; Wang, M.; Wu, Y. A Spatial Information Extraction Method Based on Multi-Modal Social Media Data: A Case Study on Urban Inundation. ISPRS Int. J.-Geo-Inf. 2023, 12, 368. [Google Scholar] [CrossRef] [Scilit]
- Zhang, C.; Teng, J.; Liu, P.; Liu, C. Ecological Suitability Evaluation of Traditional Village Locations in Jiangxi Province Based on Multi-Model Integration Using Artificial Intelligence. PLoS ONE 2025, 20, e0332375. [Google Scholar] [CrossRef] [Scilit] [PubMed]
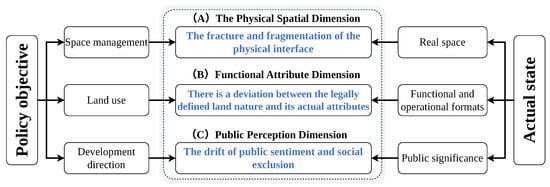
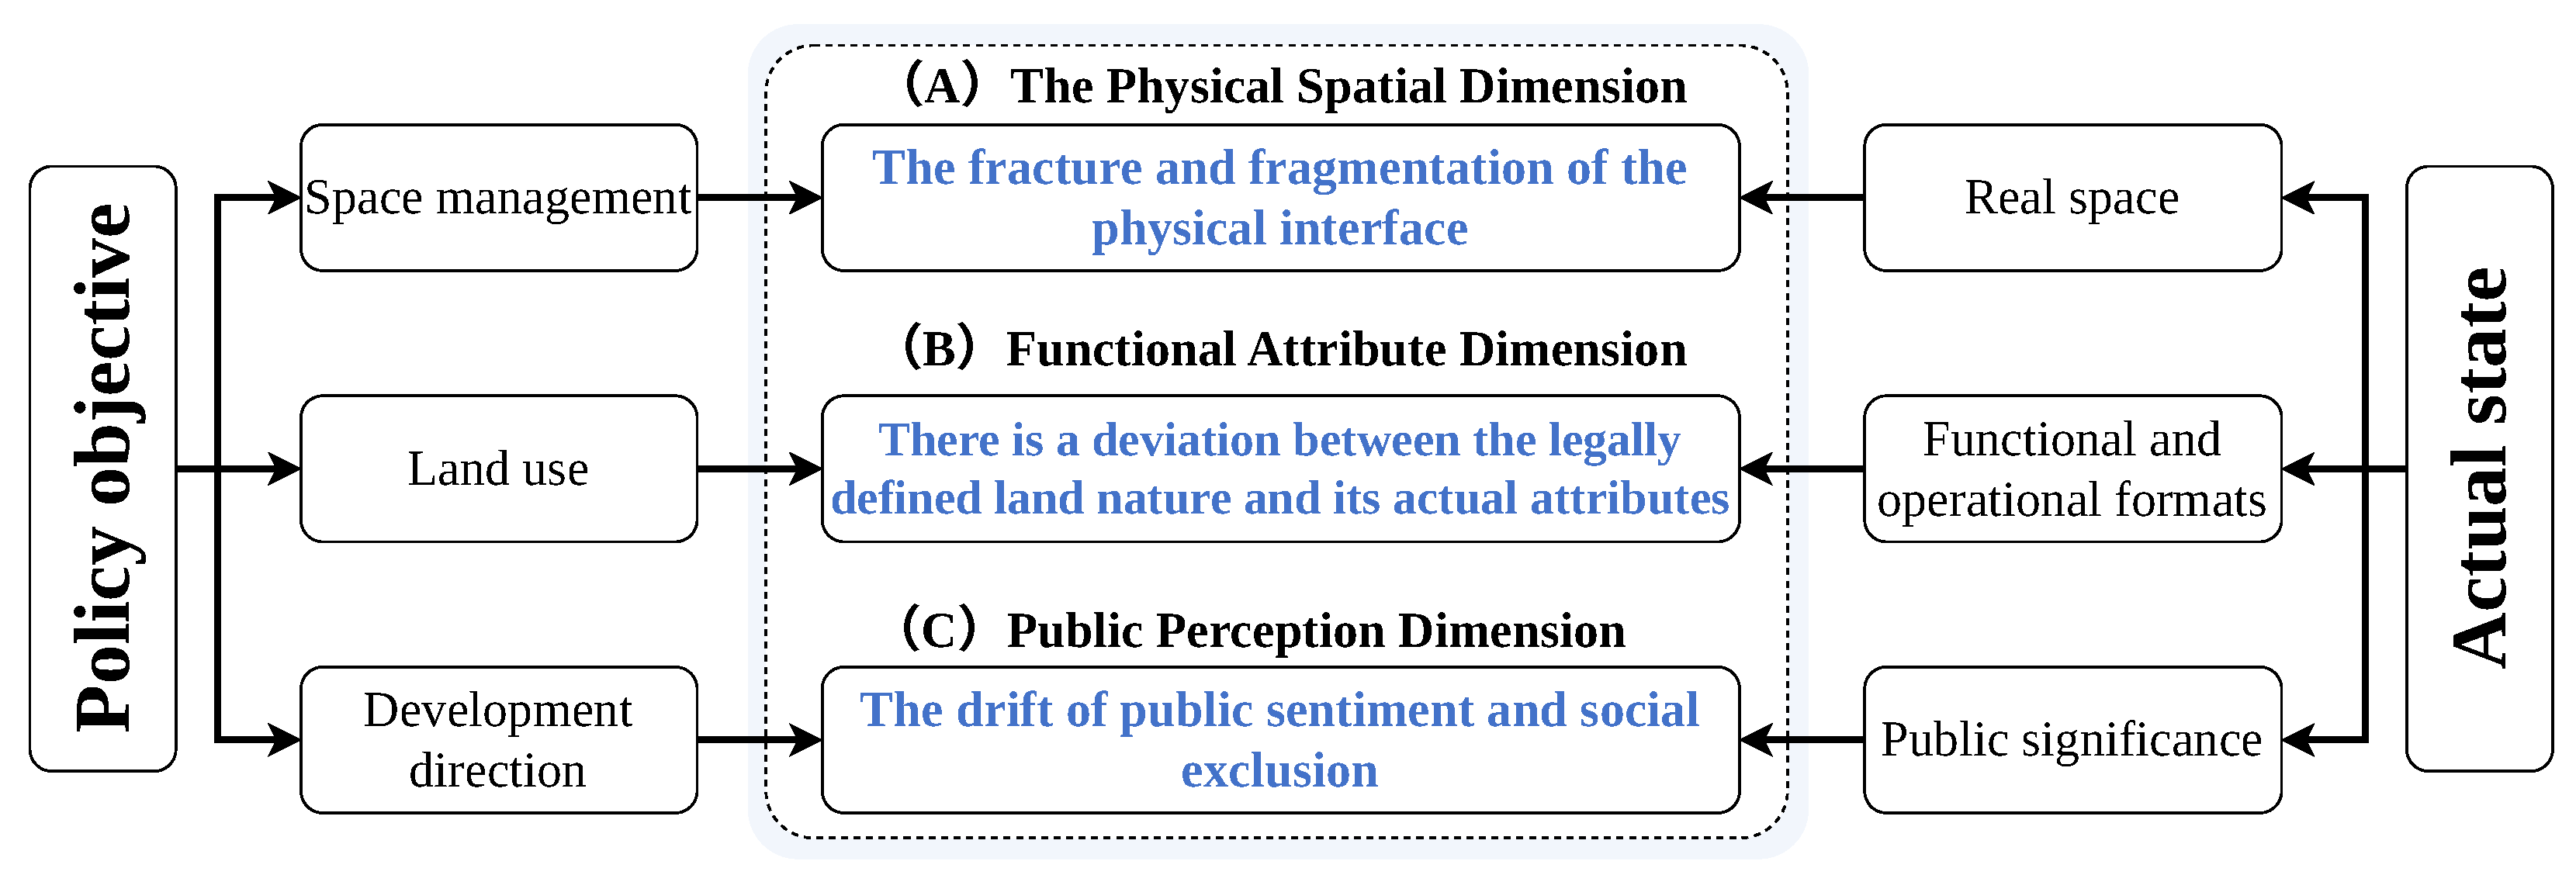
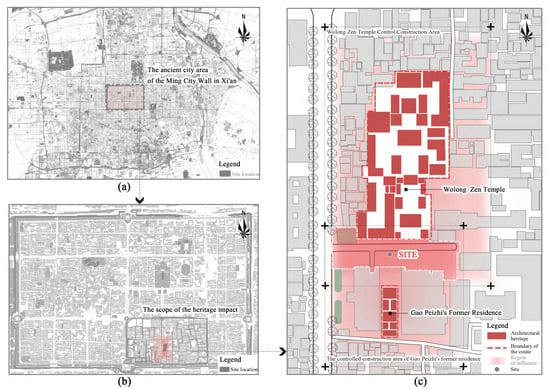
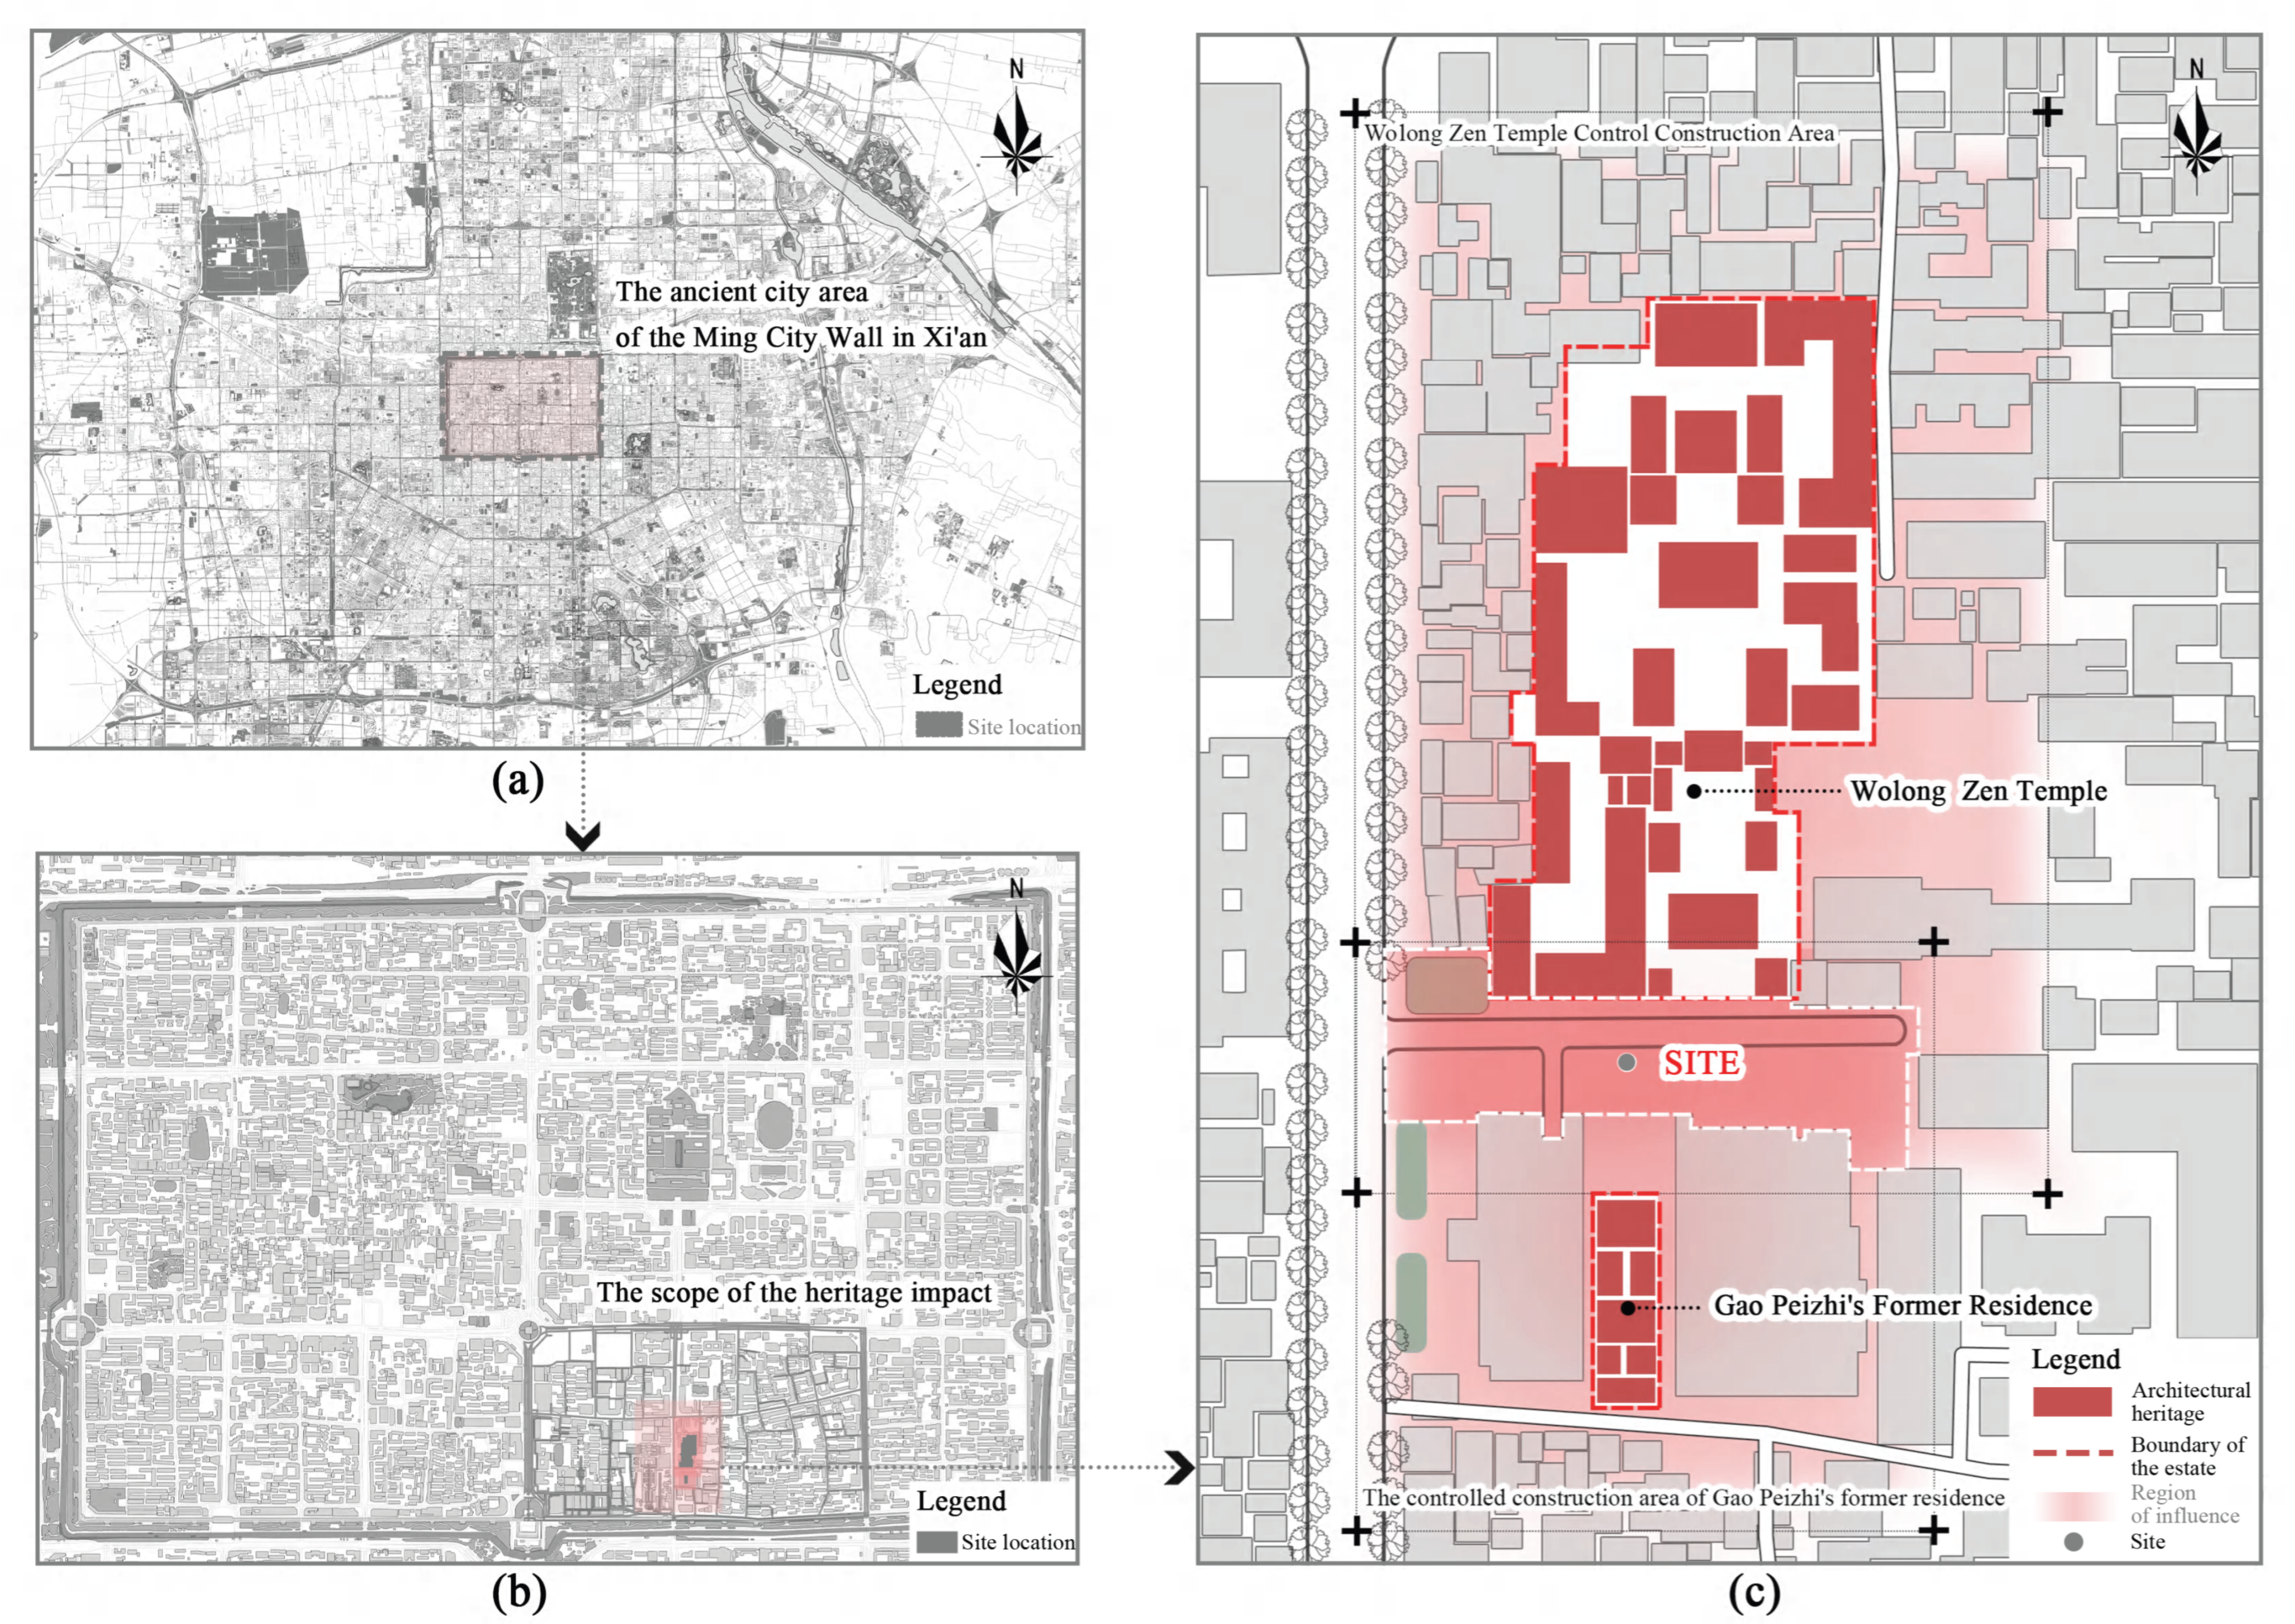
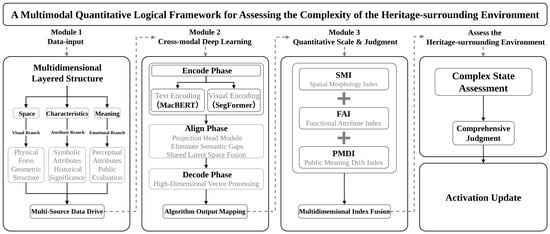
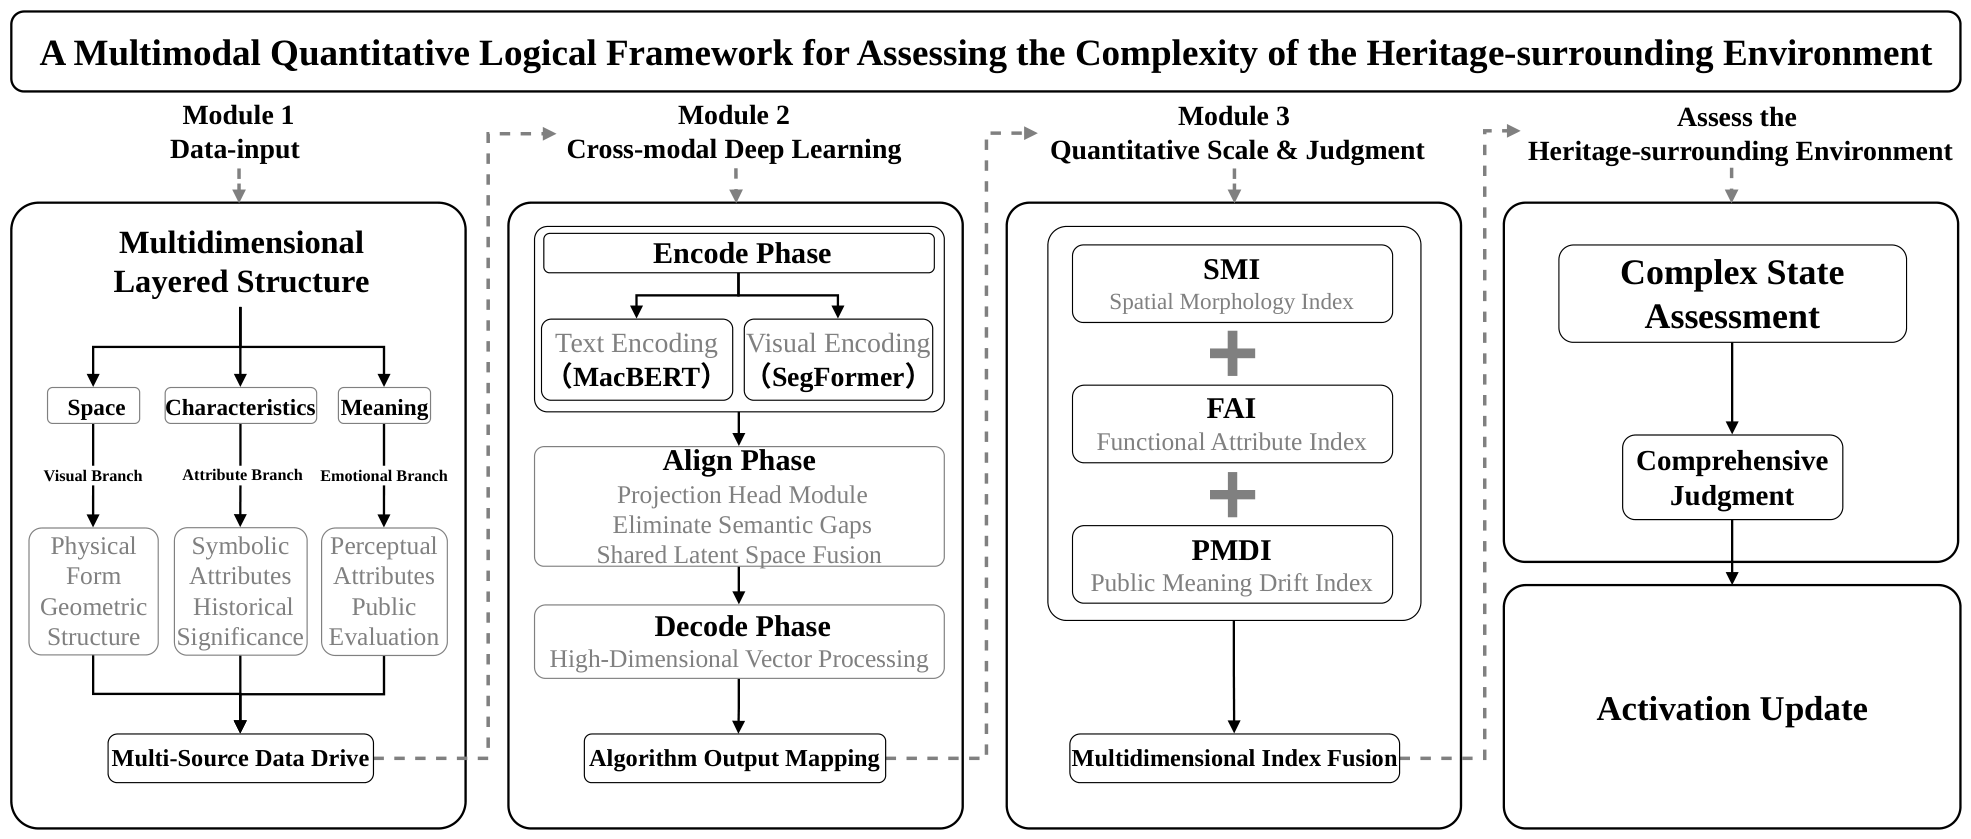
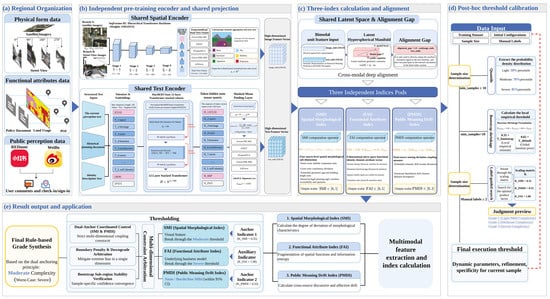
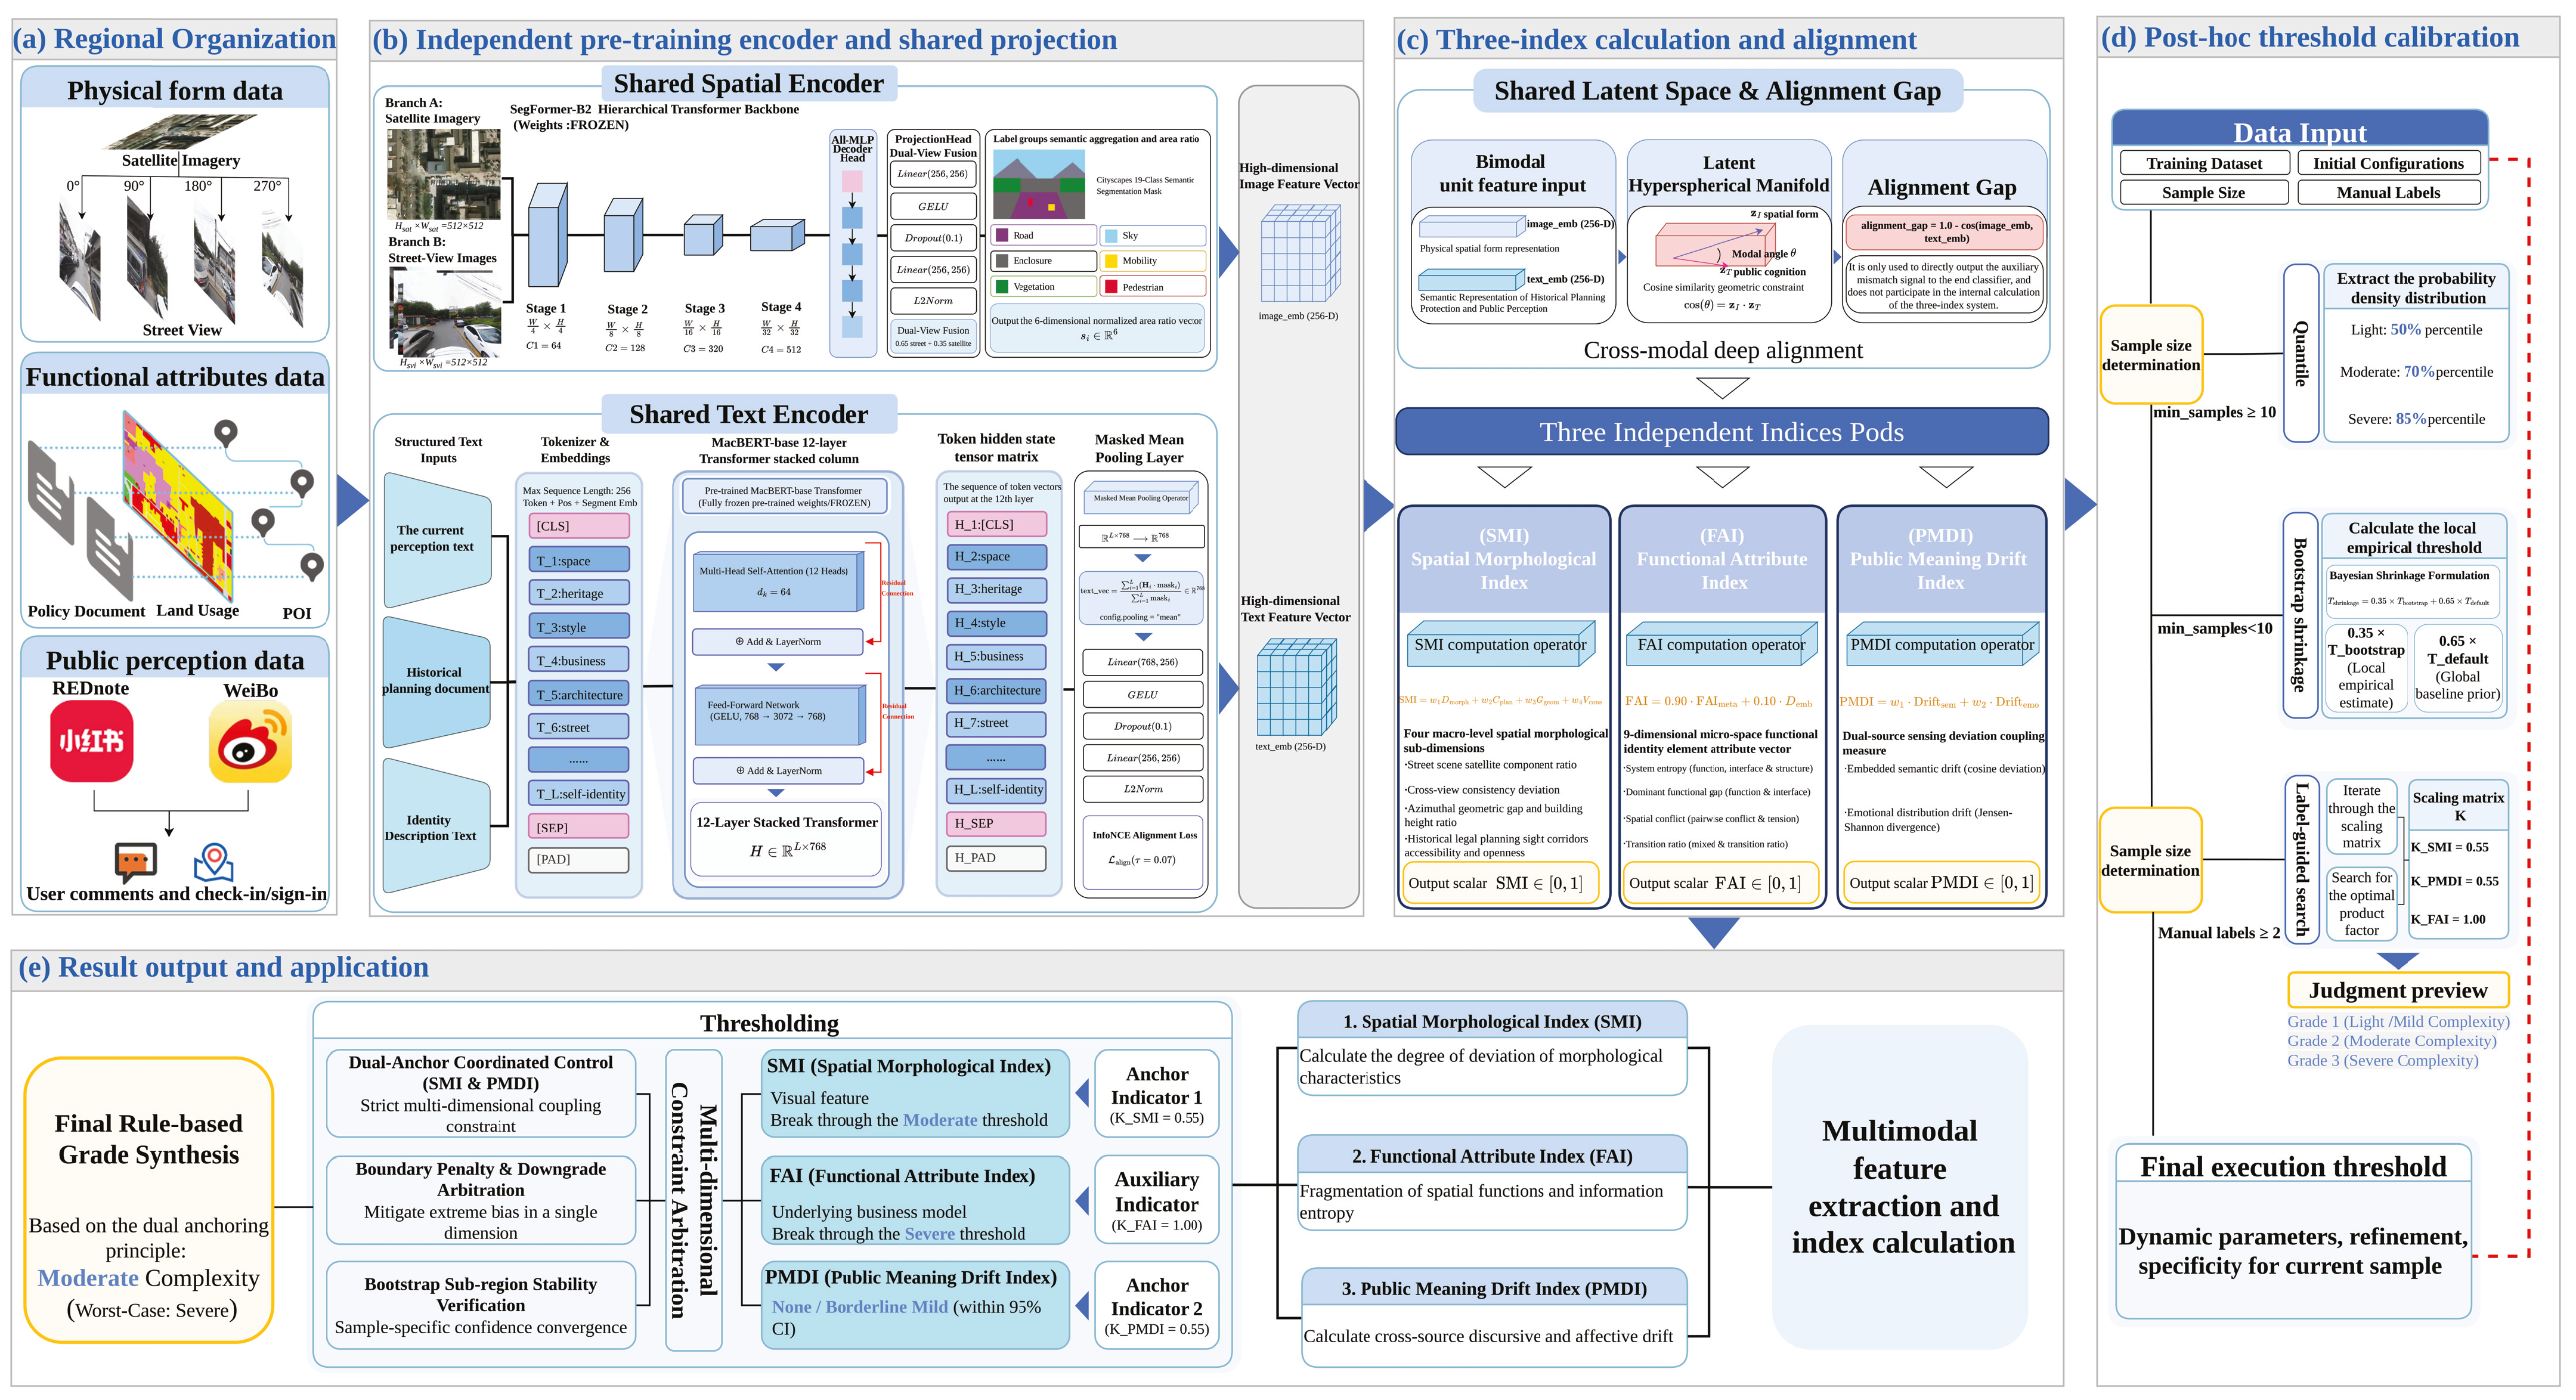
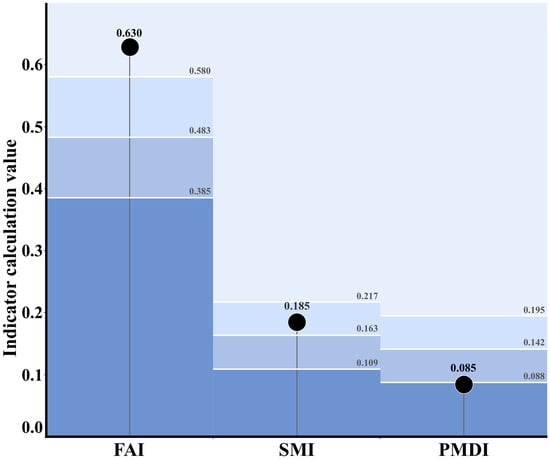
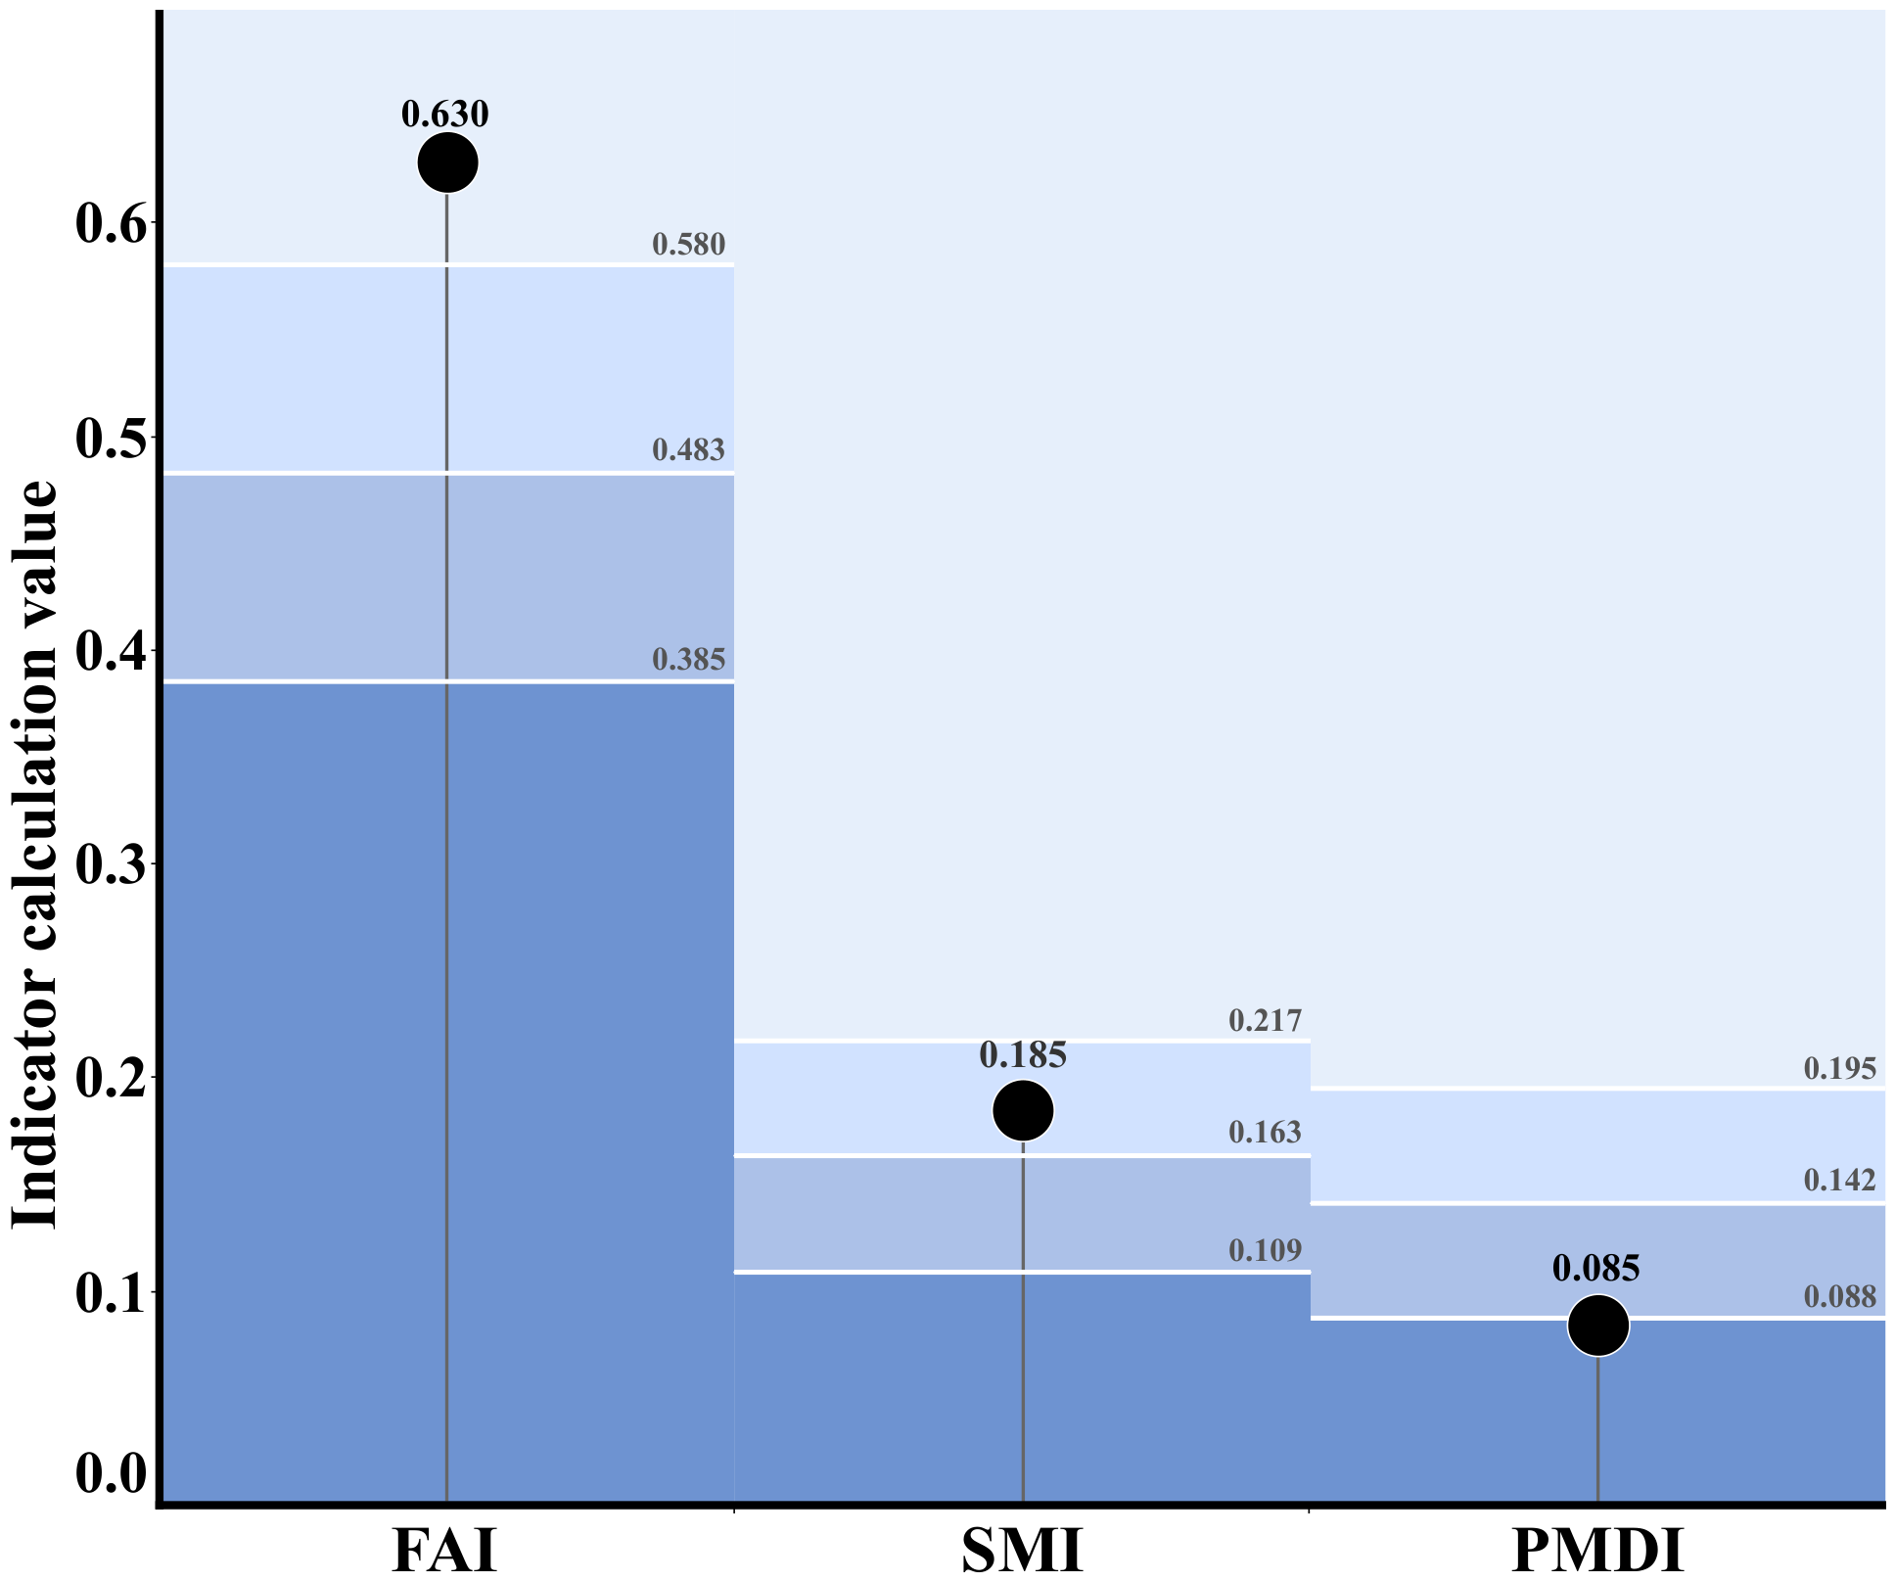
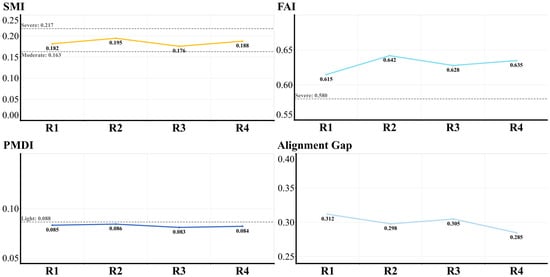
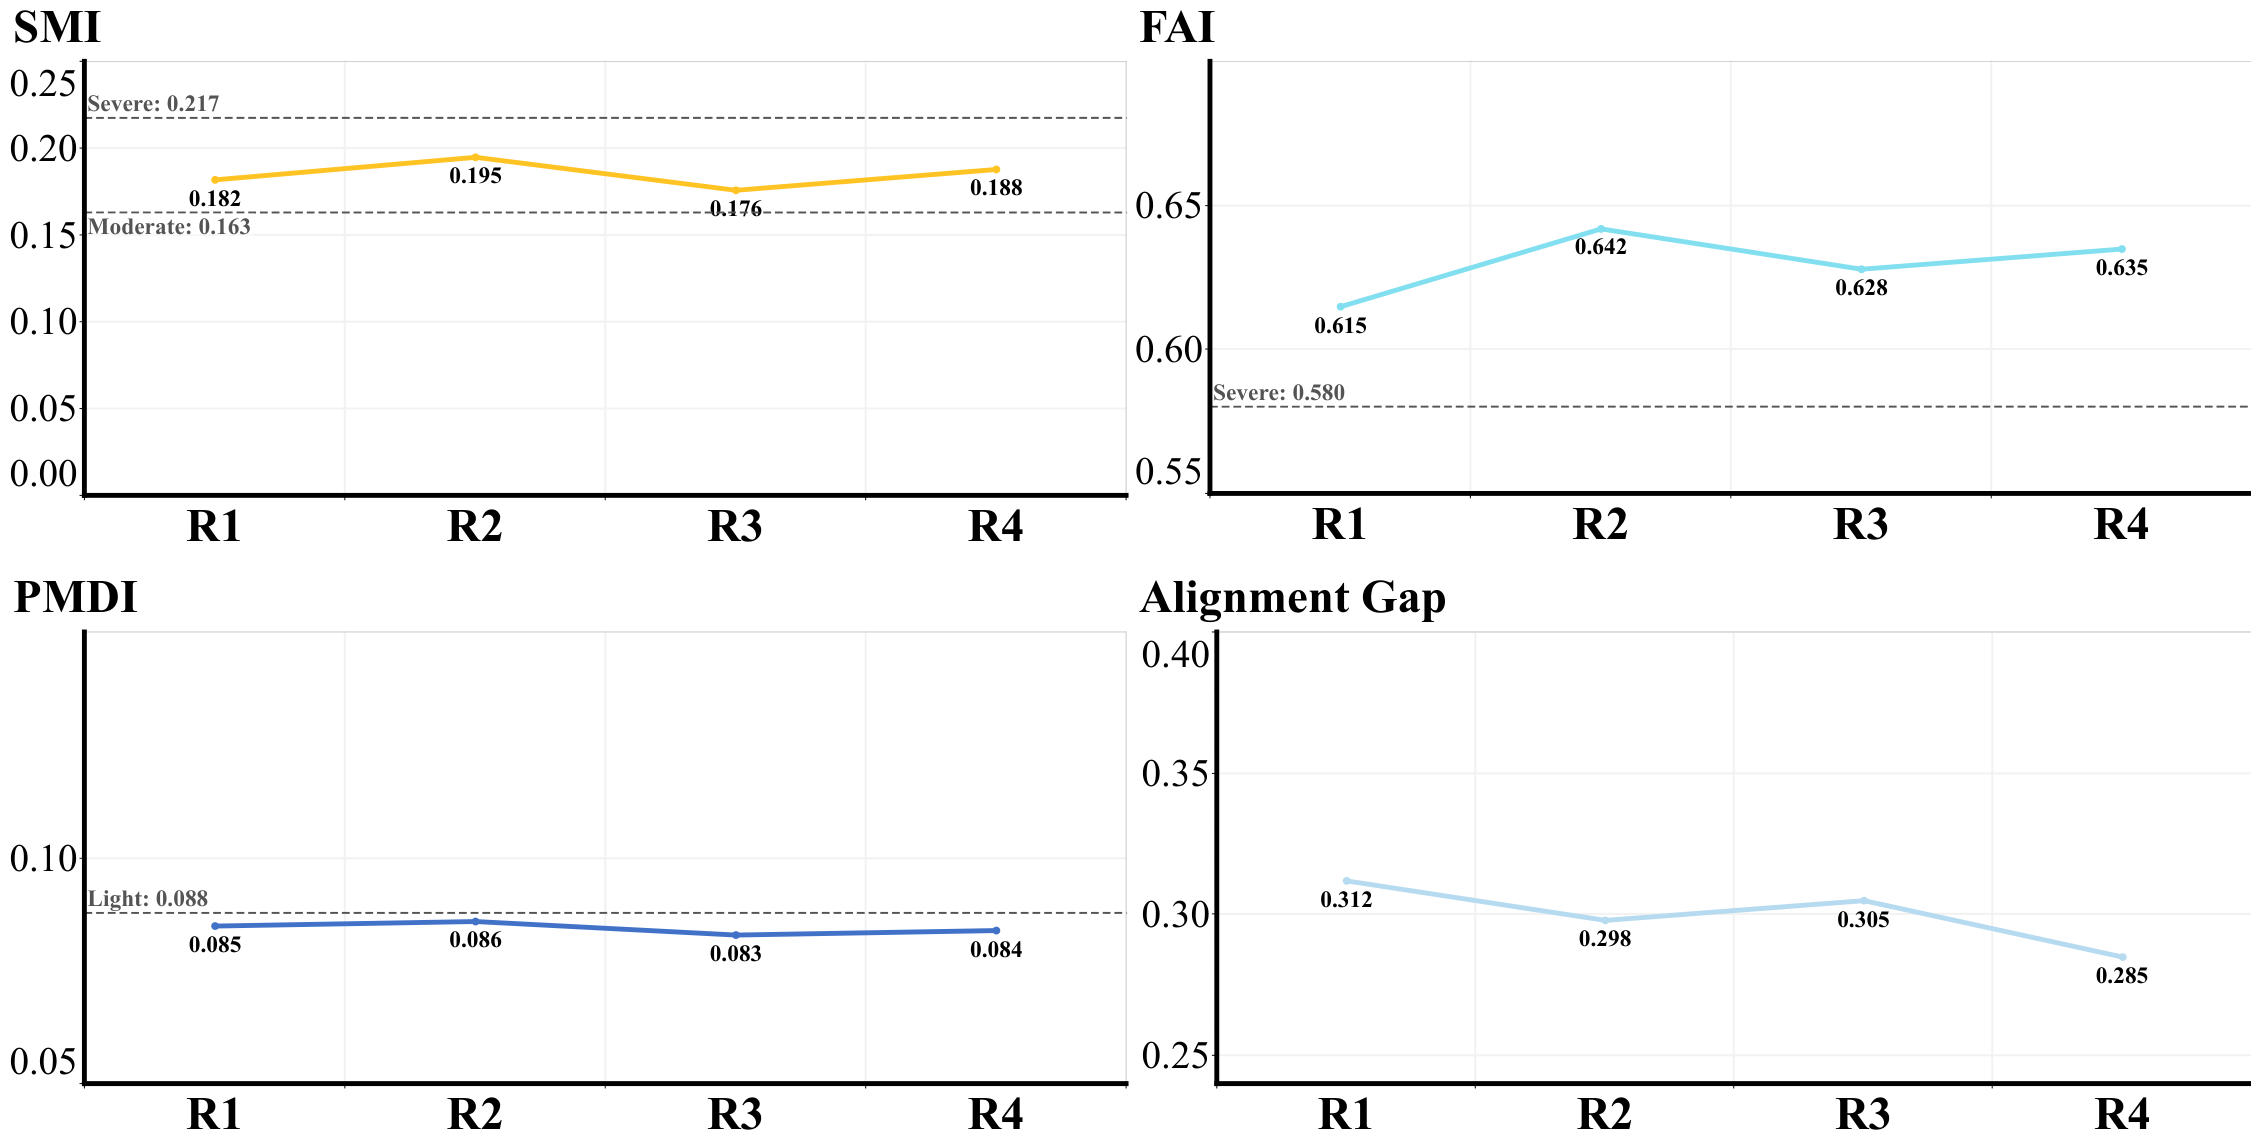
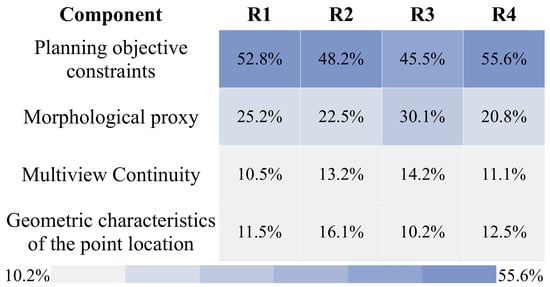
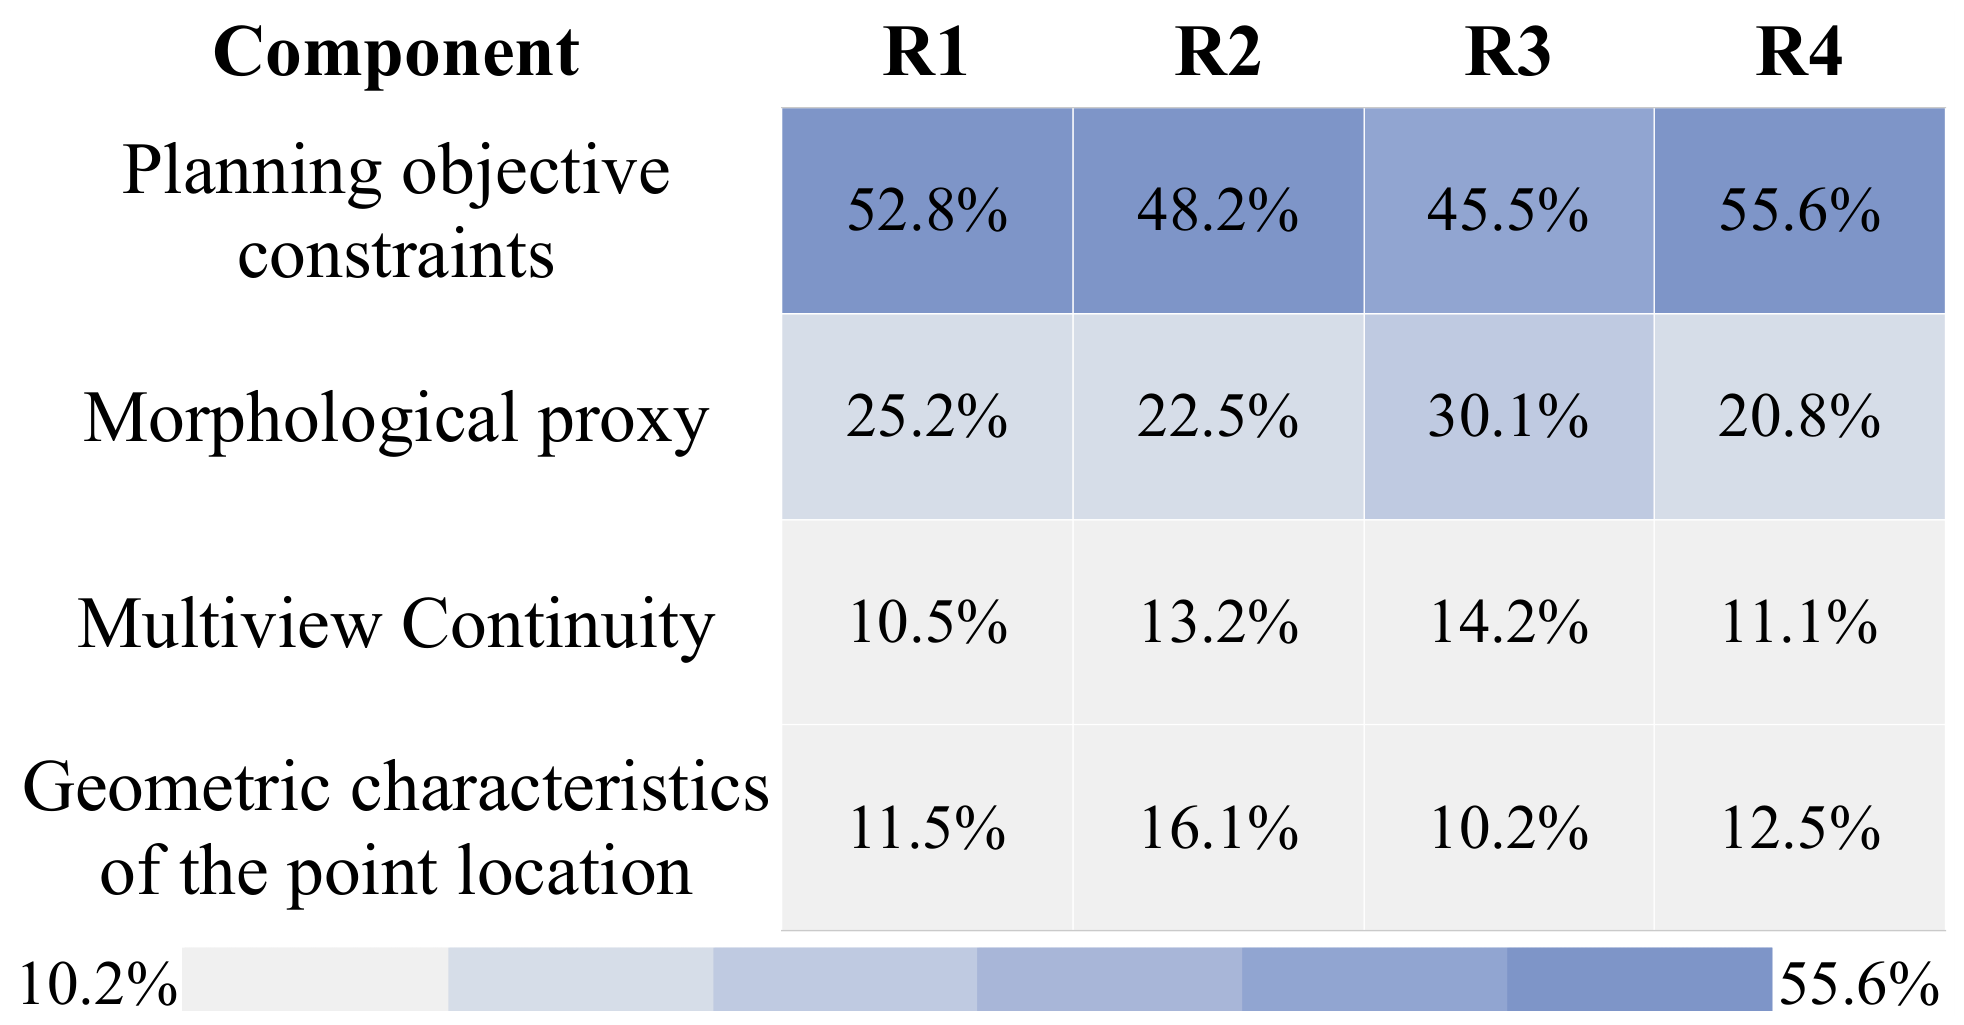
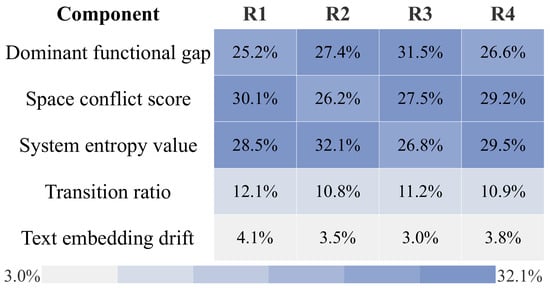
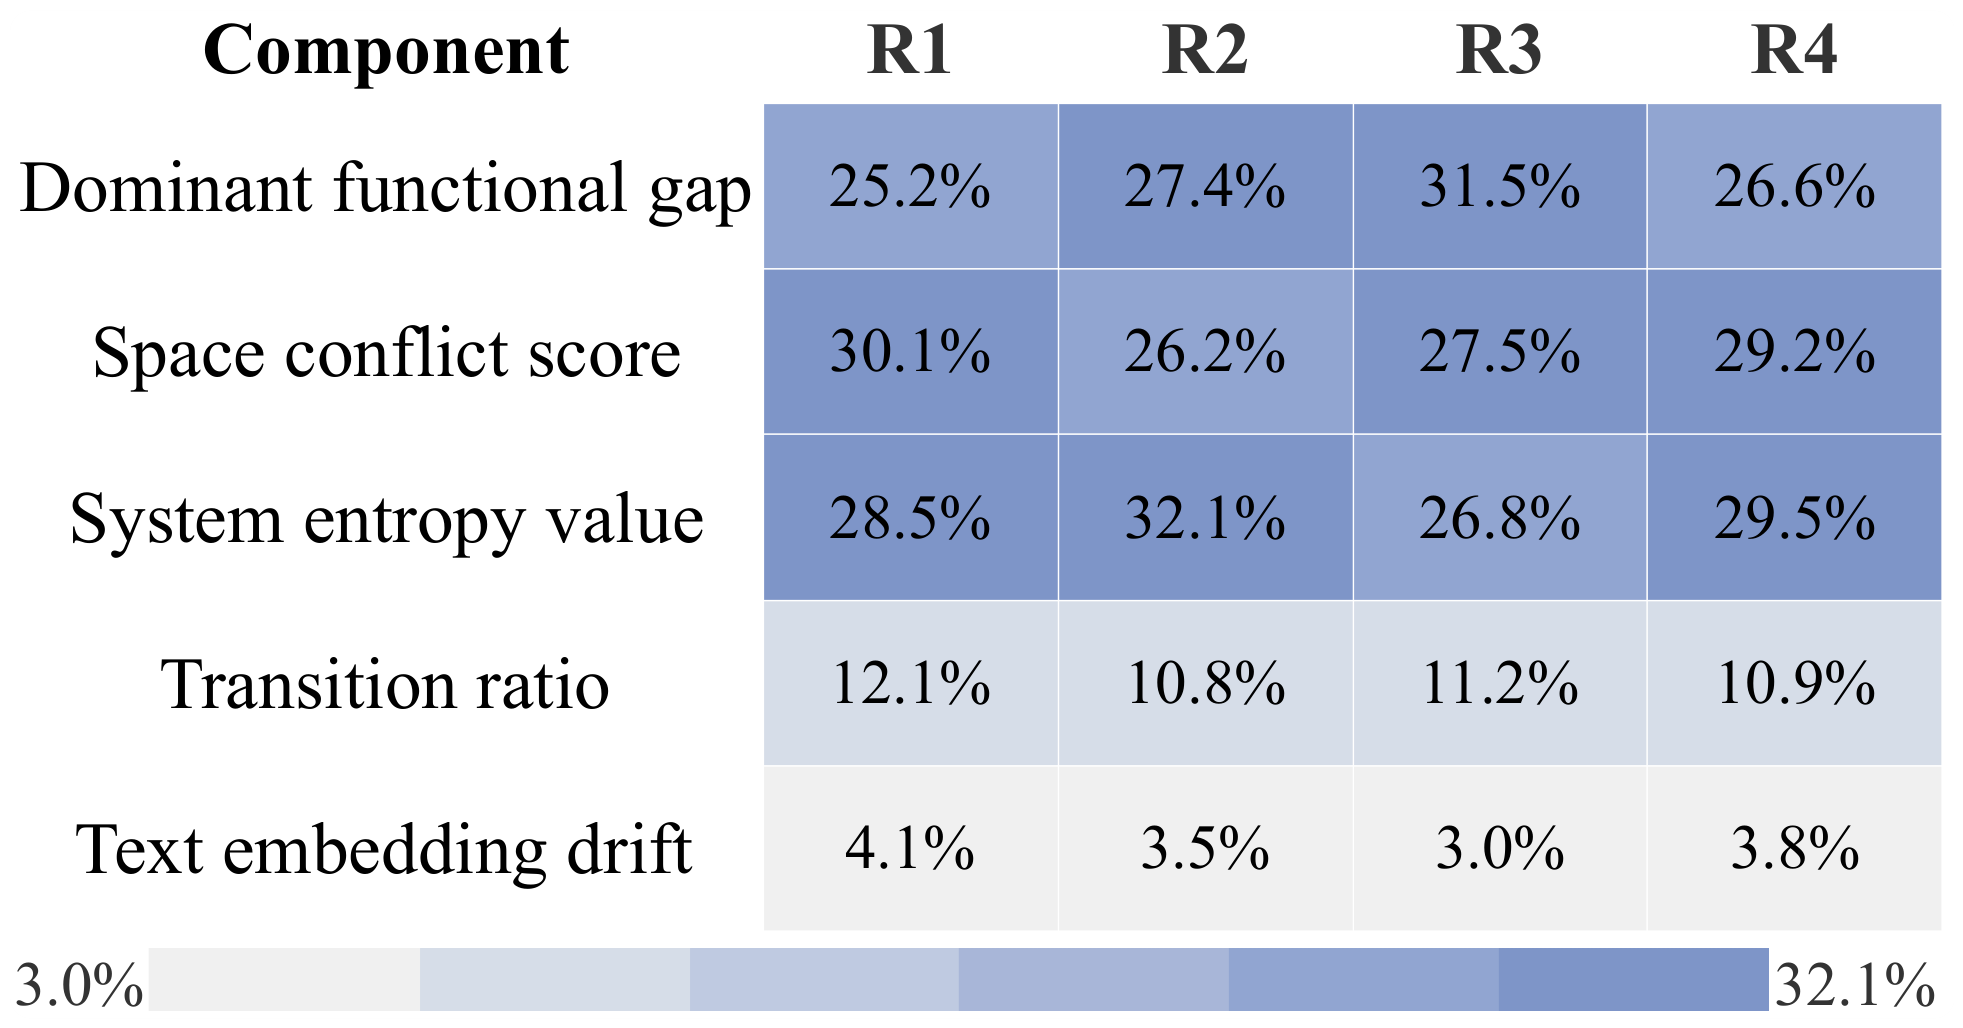

Disclaimer/Publisher’s Note: The statements, opinions and data contained in all publications are solely those of the individual author(s) and contributor(s) and not of MDPI and/or the editor(s). MDPI and/or the editor(s) disclaim responsibility for any injury to people or property resulting from any ideas, methods, instructions or products referred to in the content. |
© 2026 by the authors. Licensee MDPI, Basel, Switzerland. This article is an open access article distributed under the terms and conditions of the Creative Commons Attribution (CC BY) license.