


Abstract
Tunnel linings are prone to cracking under the influence of various external factors, while manual inspection and traditional digital image-based detection methods are limited by low efficiency and insufficient accuracy. Considering the limitations of existing YOLO models in small object detection, shape adaptation, and lightweight implementation, this study proposes an improved Ghost-YOLOv8-SF model. This model achieves a balanced integration of lightweight characteristics and long-range feature capture capabilities while enhancing small object detection performance. In order to preserve high-frequency features of minute cracks, the model incorporates a WaveletLikeConv module which simulates wavelet transforms through four-branch convolutions. In addition, an ElongatedConv module is designed to adapt to elongated crack morphologies. It employs scenario-based data augmentation strategies and a noise suppression gate module to enhance model generalization and interference resistance. Incorporating GhostNet V2 principles, the backbone network is restructured for lightweight optimization through enhanced Ghost modules, feature subsampling optimization, and GhostV2 bottleneck improvements. Comprehensive experiments are conducted using an integrated multi-scenario dataset. Furthermore, ablation studies are designed to evaluate the performance of the model in terms of detection accuracy, computational efficiency, and real-time capability. Experimental results show that the proposed model improves overall detection accuracy and false-alarm suppression, achieving higher mAP and precision while maintaining practical inference capability. Although the enhanced feature representation introduces additional parameter and computational costs, the model provides a favorable trade-off between detection performance, robustness, and computational efficiency.
1. Introduction
During tunnel operation, lining structures are continuously subjected to adverse factors such as cyclic loading, changes in surrounding geological conditions, and temperature variations, which may gradually induce different forms of damage [1]. Surface cracks are among the most common and representative forms of lining deterioration [2]. If not detected and treated in a timely manner, they may degrade structural performance, induce secondary damage, and threaten traffic safety and long-term serviceability. Therefore, reliable and efficient crack inspection is essential for the condition assessment and maintenance of tunnel linings [3].
Conventional tunnel lining crack detection mainly relies on manual inspection and digital image-based methods. Manual inspection requires inspectors to visually identify and record cracks on site; under poor lighting and harsh working conditions, this approach is inefficient, error-prone, and potentially unsafe [4]. Digital image-based techniques can improve the visualization, quantification, and recording of crack information. Ouyang et al. [5] proposed a computer-vision-based tunnel crack data management method for visualizing, quantifying, and recording three-dimensional crack data, while Gehri et al. [6] employed digital image correlation to detect cracks and measure crack kinematics. However, conventional image-based methods remain sensitive to illumination variations, image-acquisition quality, and complex crack morphology [1]. Consequently, their accuracy and efficiency may still be insufficient for rapid and reliable detection of small cracks in complex tunnel environments [7].
Beyond tunnel monitoring, image-based damage detection has also been applied to other transportation infrastructures. Deep-learning-based visual detection methods have been investigated for road defects and pavement cracks, demonstrating the broader applicability of computer vision to automated infrastructure inspection [8,9,10]. These studies provide useful methodological references for image-based tunnel lining crack detection.
Deep learning has been widely applied in tunnel crack defect detection due to its unique technical advantages. With its powerful automatic feature extraction capability, excellent nonlinear modeling performance, and efficient learning capability, deep learning has found widespread application in the field of tunnel crack defect detection [11]. Among them, convolutional neural networks (CNNs) can learn complex image features through extensive sample training and identify key information such as the shape, size, and direction of tunnel cracks. This capability improves the accuracy and reliability of crack detection [12]. At the same time, deep learning models exhibit good generalization capabilities and can adapt to detection tasks under different environments and conditions, demonstrating great application value in engineering practice. Liao et al. [2] proposed a deep learning-assisted method based on distributed optical fiber sensing strain measurement. In their study, a conditional generative adversarial network (cGAN) was employed to generate synthetic data, alleviating the scarcity of measured data and enabling severity assessment of cracks in shield tunnel segments. Pan et al. [3] developed the EDeepLab method, which improved the original DeepLabV3+ framework by replacing and optimizing the lightweight backbone network, achieving high-precision segmentation and detection of cracks on the lining surface; Duan et al. [4] improved the YOLOv5 model by introducing data augmentation techniques and a feature encoding module, ensuring crack detection accuracy in low-light, low-contrast, and high-noise environments; Yang et al. [7] proposed the YOLOv8-GSD model, which integrates mechanisms such as dynamic snake convolution and bidirectional routing attention, enabling crack size measurement error to be controlled within 5%.
2. Literature Review
The core process of tunnel lining crack detection includes three key steps: crack identification, localization, and quantification. Existing research has developed various targeted technical solutions based on this process.
Feature extraction and fusion optimization are core directions for enhancing detection performance. Li et al. [11] proposed the Repvit-YOLO model, which uses Repvit as the backbone network to strengthen feature capture capabilities. The model further achieves cross-level feature fusion through a global feature pyramid, thereby enhancing its generalization ability. Zhang et al. [13] proposed the YOLOv8-CM framework, which integrates YOLOv8 with a convolutional block attention module to achieve automatic detection and segmentation of various defects and key objects in tunnels. Zhou et al. [14] improved the YOLOv7 algorithm to obtain YOLO-LD, replacing the original structure with an asymptotic feature pyramid network and adding an attention module. They constructed a radar image dataset for lining quality assessment through simulation.
Adaptation and integration frameworks for specific scenarios have attracted increasing research attention. Fan et al. [12] utilized the YOLOv8N model to detect structures such as steel mesh and voids in mountain tunnels, providing support for lining quality evaluation and highlighting the potential of deep learning automation technology.
In response to the full-process requirements of tunnel automatic detection, an integrated detection framework is gradually taking shape. Xu et al. [15] constructed a mobile image acquisition system and a deep learning integration framework, developed the YOLO-LD model that integrated attention and dynamic snake convolution, achieved panoramic image generation and high-precision crack detection, and enhanced engineering adaptability.
3. Methodology
3.1. Principles of the YOLOv8 Algorithm
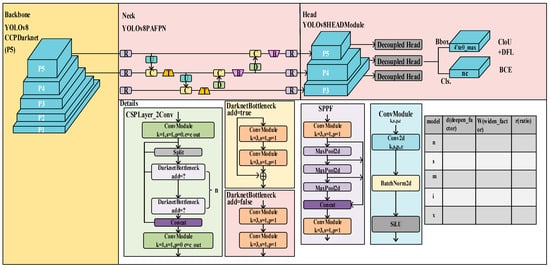
In the field of real-time object detection, YOLOv8, as a significant iteration, has constructed a model framework that is more suitable for detecting objects in complex scenes from multiple aspects. At the network architecture level, YOLOv8 replaces the conventional C3 module used in earlier YOLO architectures with the C2f module. The C3 module follows a cross-stage partial design in which the input features are propagated through two principal branches: one branch contains stacked Bottleneck blocks for feature transformation, while the other provides a relatively direct feature path. The two branches are subsequently concatenated and fused by a convolutional layer. In contrast, the C2f module adopts a more flexible split-and-concatenate strategy. After the initial feature transformation, part of the feature channels is successively processed by Bottleneck blocks, while the outputs of multiple intermediate stages are retained and concatenated before the final fusion convolution. Compared with C3, this design enhances feature reuse and gradient propagation and reduces redundant feature transformation. Consequently, fine-grained information from shallow and intermediate layers can be preserved more effectively, providing a suitable feature-extraction foundation for small tunnel lining cracks with limited pixel-scale representation. Meanwhile, YOLOv8 simplifies redundant convolutional layers in the backbone network, thereby reducing computational complexity while preserving feature extraction capability. This streamlined backbone also provides a foundation for the lightweight optimization proposed in this study. Although YOLOv8 does not completely abandon NMS, it significantly reduces post-processing latency by optimizing confidence sorting and IOU calculation logic. This optimization reduces post-processing latency, making the model more suitable for real-time tunnel inspection.
Relevant research provides valuable references for the improvement of the YOLO series of models. Ou et al. [8] proposed an improved lightweight multi-scale feature fusion model to address the challenges of existing methods in complex detection scenarios and resource-constrained environments. This model adopts a novel lightweight architecture named GSF-ST, which integrates feature generation, asymmetric convolution, and grouped channel shuffling optimization. By combining these strategies, the model reduces computational complexity and parameter count while enhancing both global and local feature representation. However, YOLOv8 still has some shortcomings, providing directions for improvement for future research. First, the basic YOLOv8 model has a relatively high parameter count and computational load, which limits its deployment on edge devices such as Jetson Nano. Restricted memory bandwidth and limited parallel computing capability make it difficult to achieve real-time inspection frame rates in such environments. Second, YOLOv8 shows insufficient robustness in small-target detection, especially for small cracks with limited pixel-scale representation under uneven lighting and interference from water stains or dust, which may lead to missed detections. Third, its generalization ability may decrease when the training dataset lacks diverse tunnel scenarios, resulting in an increased false alarm rate (FAR) in new environments.
This study proposes a series of innovative improvement strategies to enhance the detection accuracy and stability of the model for small targets in complex scenes. It optimizes the utilization efficiency of computational resources, and enhances the applicability of the model in practical engineering.
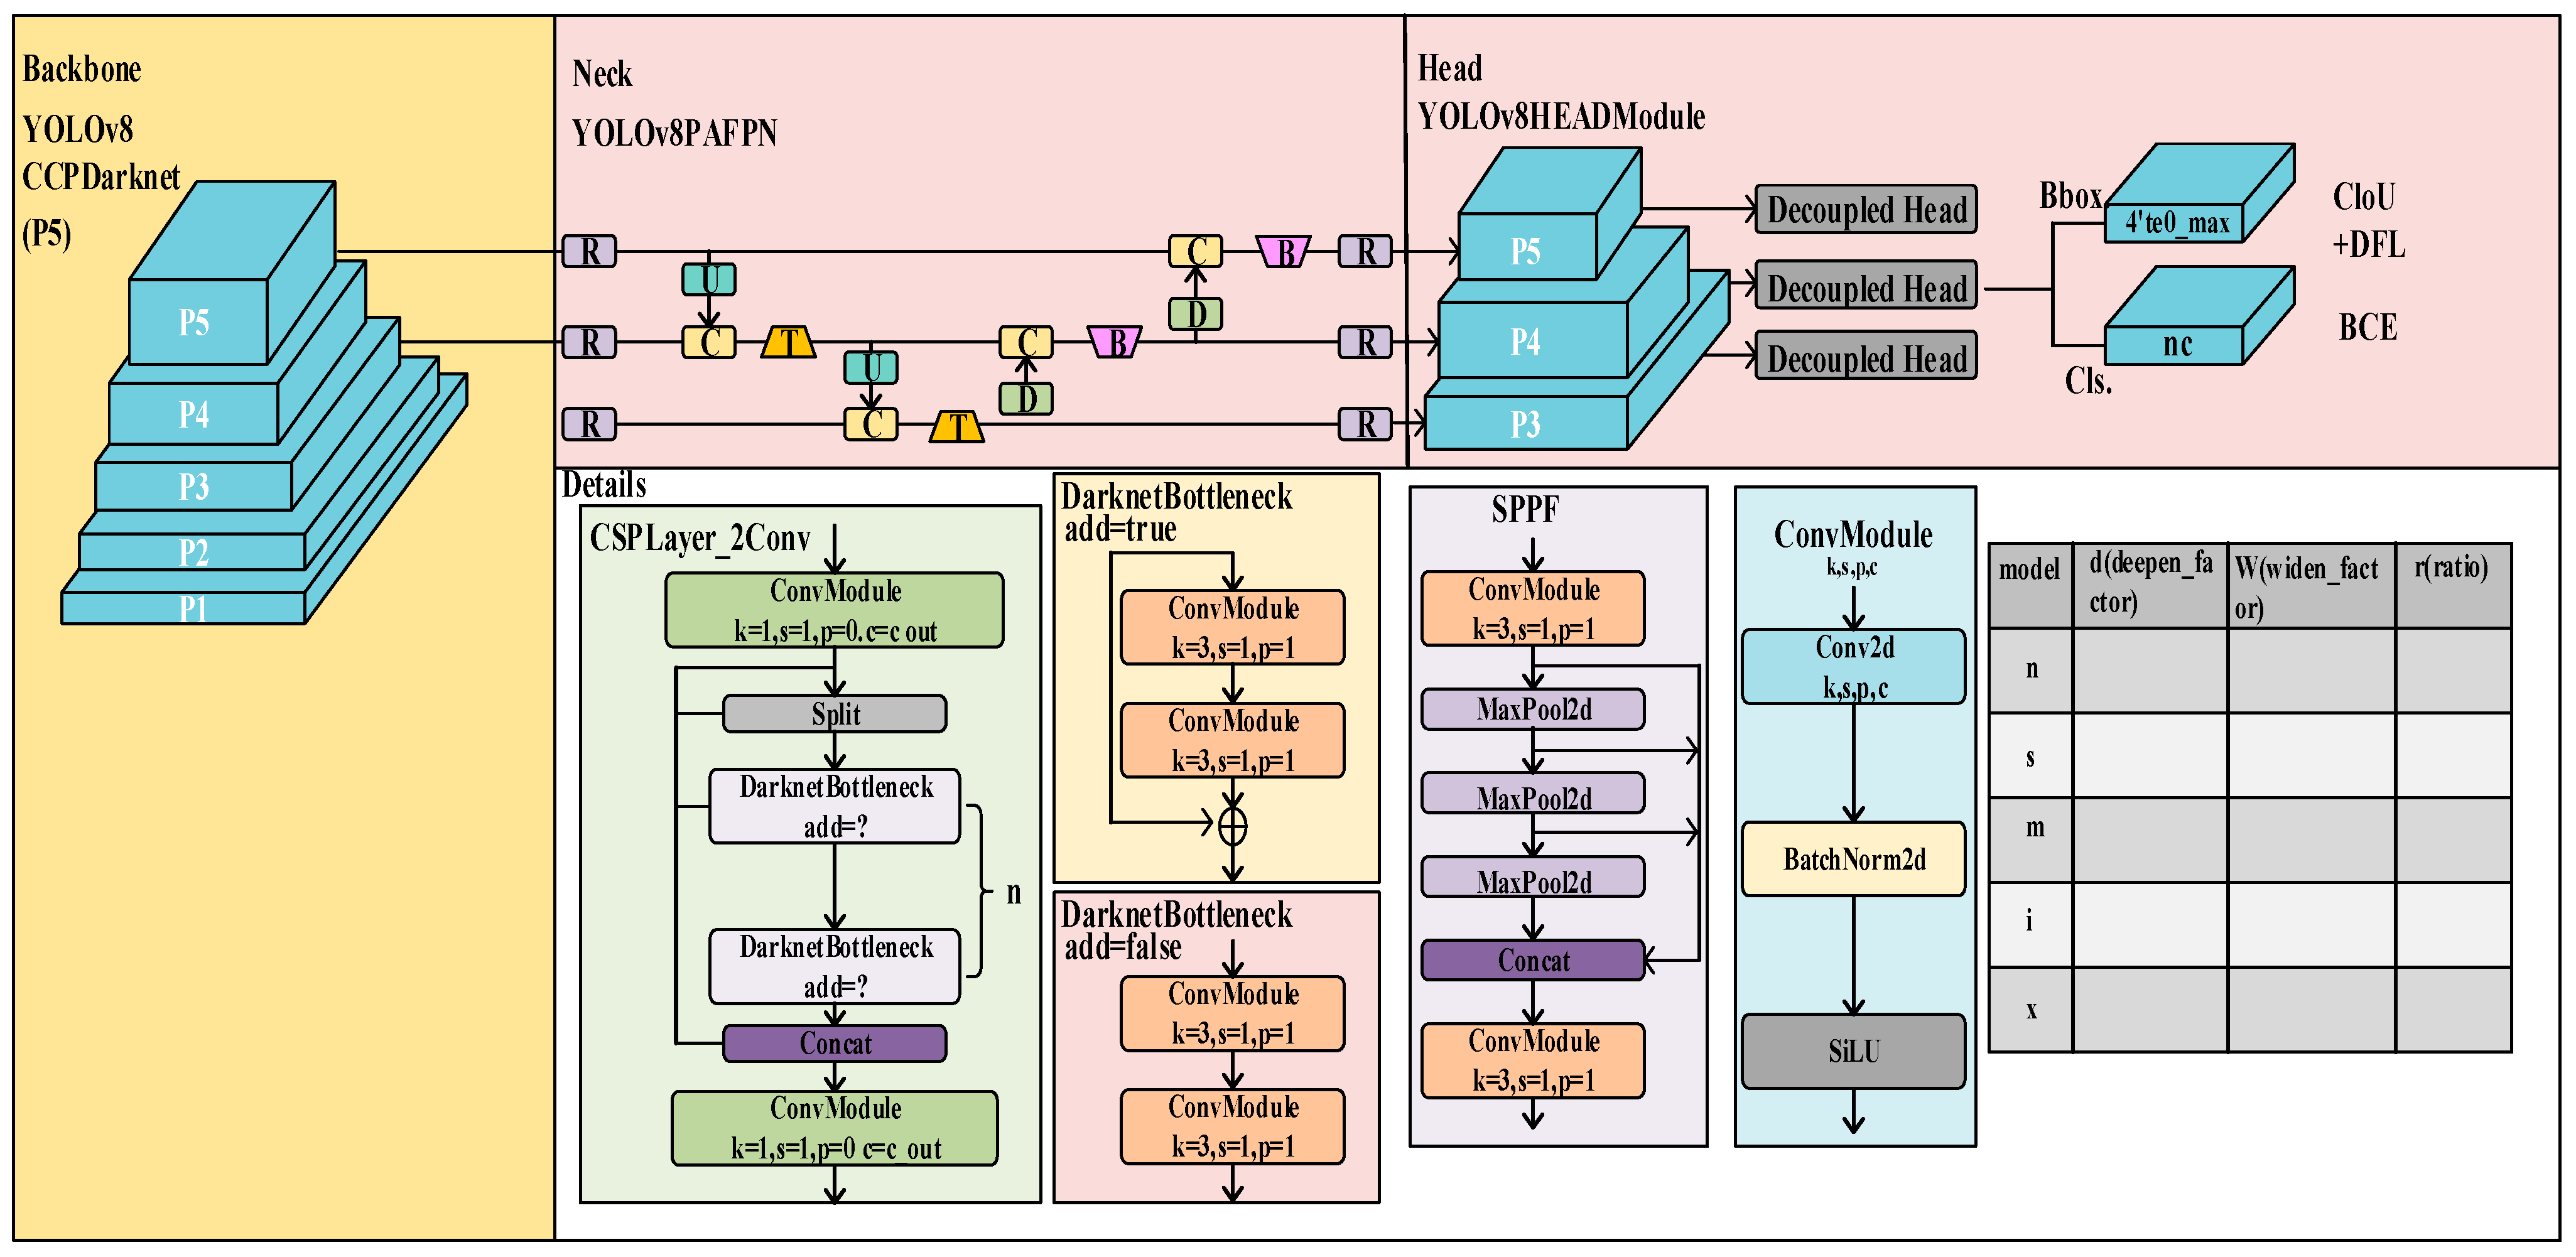
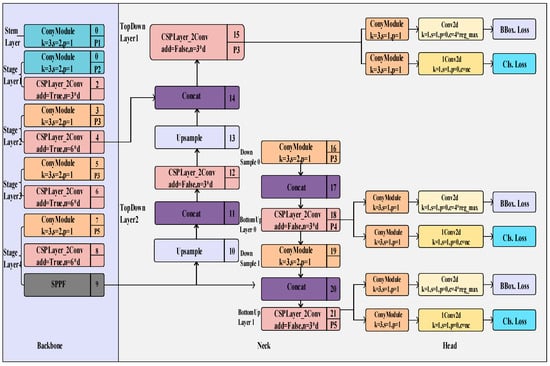
To facilitate the interpretation of Figure 1 and Figure 2, the principal abbreviations and notations are defined as follows. CIoU denotes Complete Intersection over Union loss, and DFL denotes Distribution Focal Loss. The parameter reg_max denotes the number of discrete regression bins used for each bounding-box coordinate in distribution-based bounding-box regression. Accordingly, 4 × reg_max represents the total regression-channel dimension corresponding to the four bounding-box coordinates, and c = 4 × reg_max denotes the corresponding channel dimension of the regression branch.
Figure 1.
Schematic diagram of YOLOv8 module-level topological algorithm.
Figure 2.
Schematic diagram of YOLOv8 process-level topology algorithm. The asterisk (*) denotes multiplication.
3.2. Small Target Crack Detection Enhancement
The standard YOLOv8 model may suffer from high-frequency feature loss when detecting small crack targets because of limitations in its feature extraction and scale adaptation mechanisms. From the perspective of feature extraction, the C2f module employed in the backbone network strengthens feature propagation through branch connections when dealing with small and elongated crack targets with limited pixel-scale representation. However, during repeated feature compression and downsampling, key high-frequency information, such as edge textures and bifurcation details of small cracks, may be progressively lost. In terms of scale adaptability, tunnel lining cracks exhibit substantial variations in their image-space scales. Fine cracks may occupy only a small region of the image, whereas crack patterns observed from different viewing distances may exhibit different apparent scales. Although YOLOv8 has constructed a multi-scale detection mechanism, there are significant deficiencies in the fusion process of features at different scales. Background interference also has a serious impact on the performance of traditional YOLOv8 in detecting small target cracks in tunnel lining. The internal environment of tunnels is extremely complex, coupled with variable lighting conditions and frequent transitions between light and dark. These interference factors are reflected in the image data, confusing the model with the features of small target cracks, making it difficult for the model to accurately extract effective crack features and increasing the probability of false detections.
To address the limited performance of existing models in small object detection, previous studies have optimized network structures and introduced attention mechanisms. Some studies reconstruct the network and introduce cross-scale feature fusion modules, reducing the number of parameters while enhancing detail extraction. Ou et al. [8] replaced the backbone network with Swin Transformer and integrated an improved bidirectional feature pyramid network to enhance the feature representation ability in complex scenes. Zou et al. [16] proposed LTS-YOLOv10, which enhances multi-scale feature capture and fusion through a four-dimensional dynamic convolution and attention-guided feature pyramid network. Li et al. [9] introduced a multi-scale dilated attention module, depthwise separable convolution, and a visual global attention upsampling module to improve semantic feature extraction and localization accuracy. However, these improvements are not fully adapted to the tiny and elongated characteristics of small target cracks in tunnels and the anti-interference requirements in complex environments, making it difficult to meet engineering detection requirements.
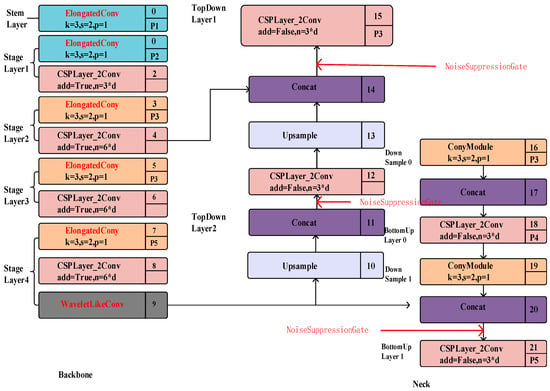
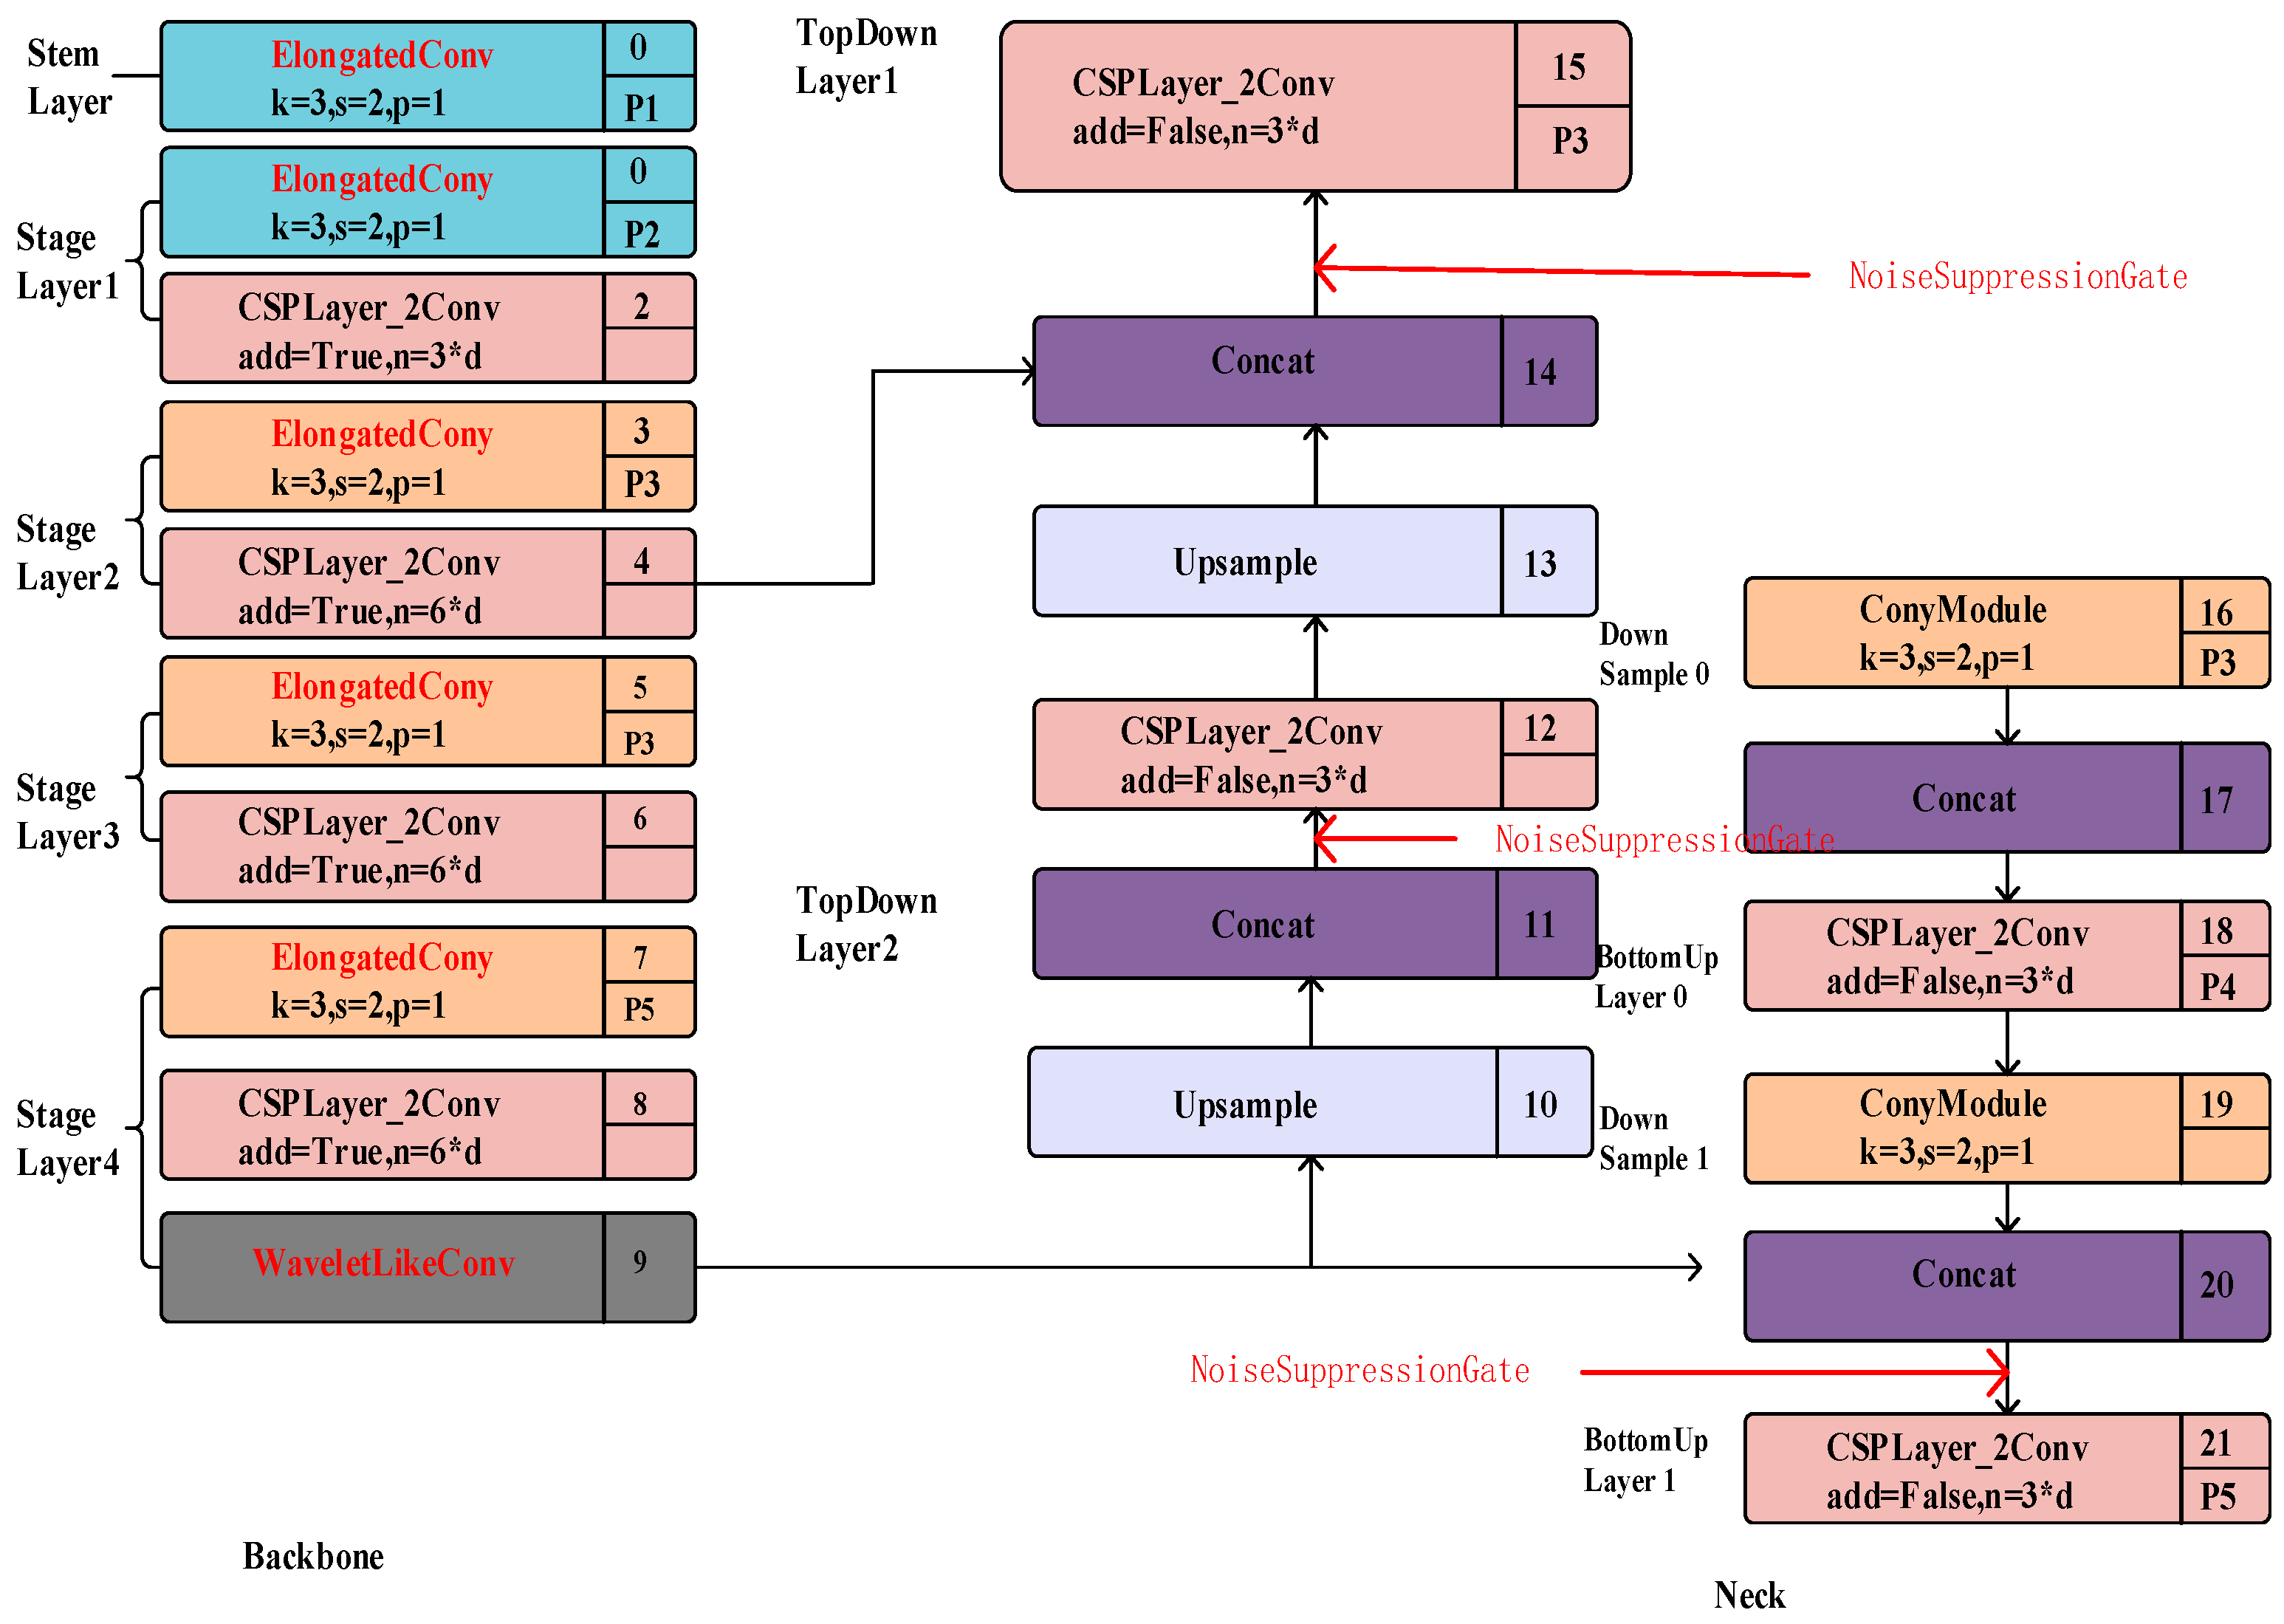
This study constructs a multi-dimensional small target crack detection enhancement system. Based on the YOLOv8 framework, innovative modules are designed from five dimensions: high-frequency feature preservation, morphological adaptation, multi-scale fusion, noise suppression, and data augmentation. These modules form a targeted optimization strategy for improving small crack detection in tunnel linings. These provide core technical support for the multi-modal computer vision detection framework, enhancing the accuracy and stability of small target crack detection in tunnels (Figure 3).
Figure 3.
Schematic diagram of embedding the small target crack detection enhancement module. Colored blocks represent network modules, and black arrows indicate the direction of feature flow. Red text highlights the introduced modules, while red arrows indicate the insertion points of the noise suppression gates. The asterisk (*) denotes multiplication.
3.2.1. Wavelet Simulation for High-Frequency Feature Extraction
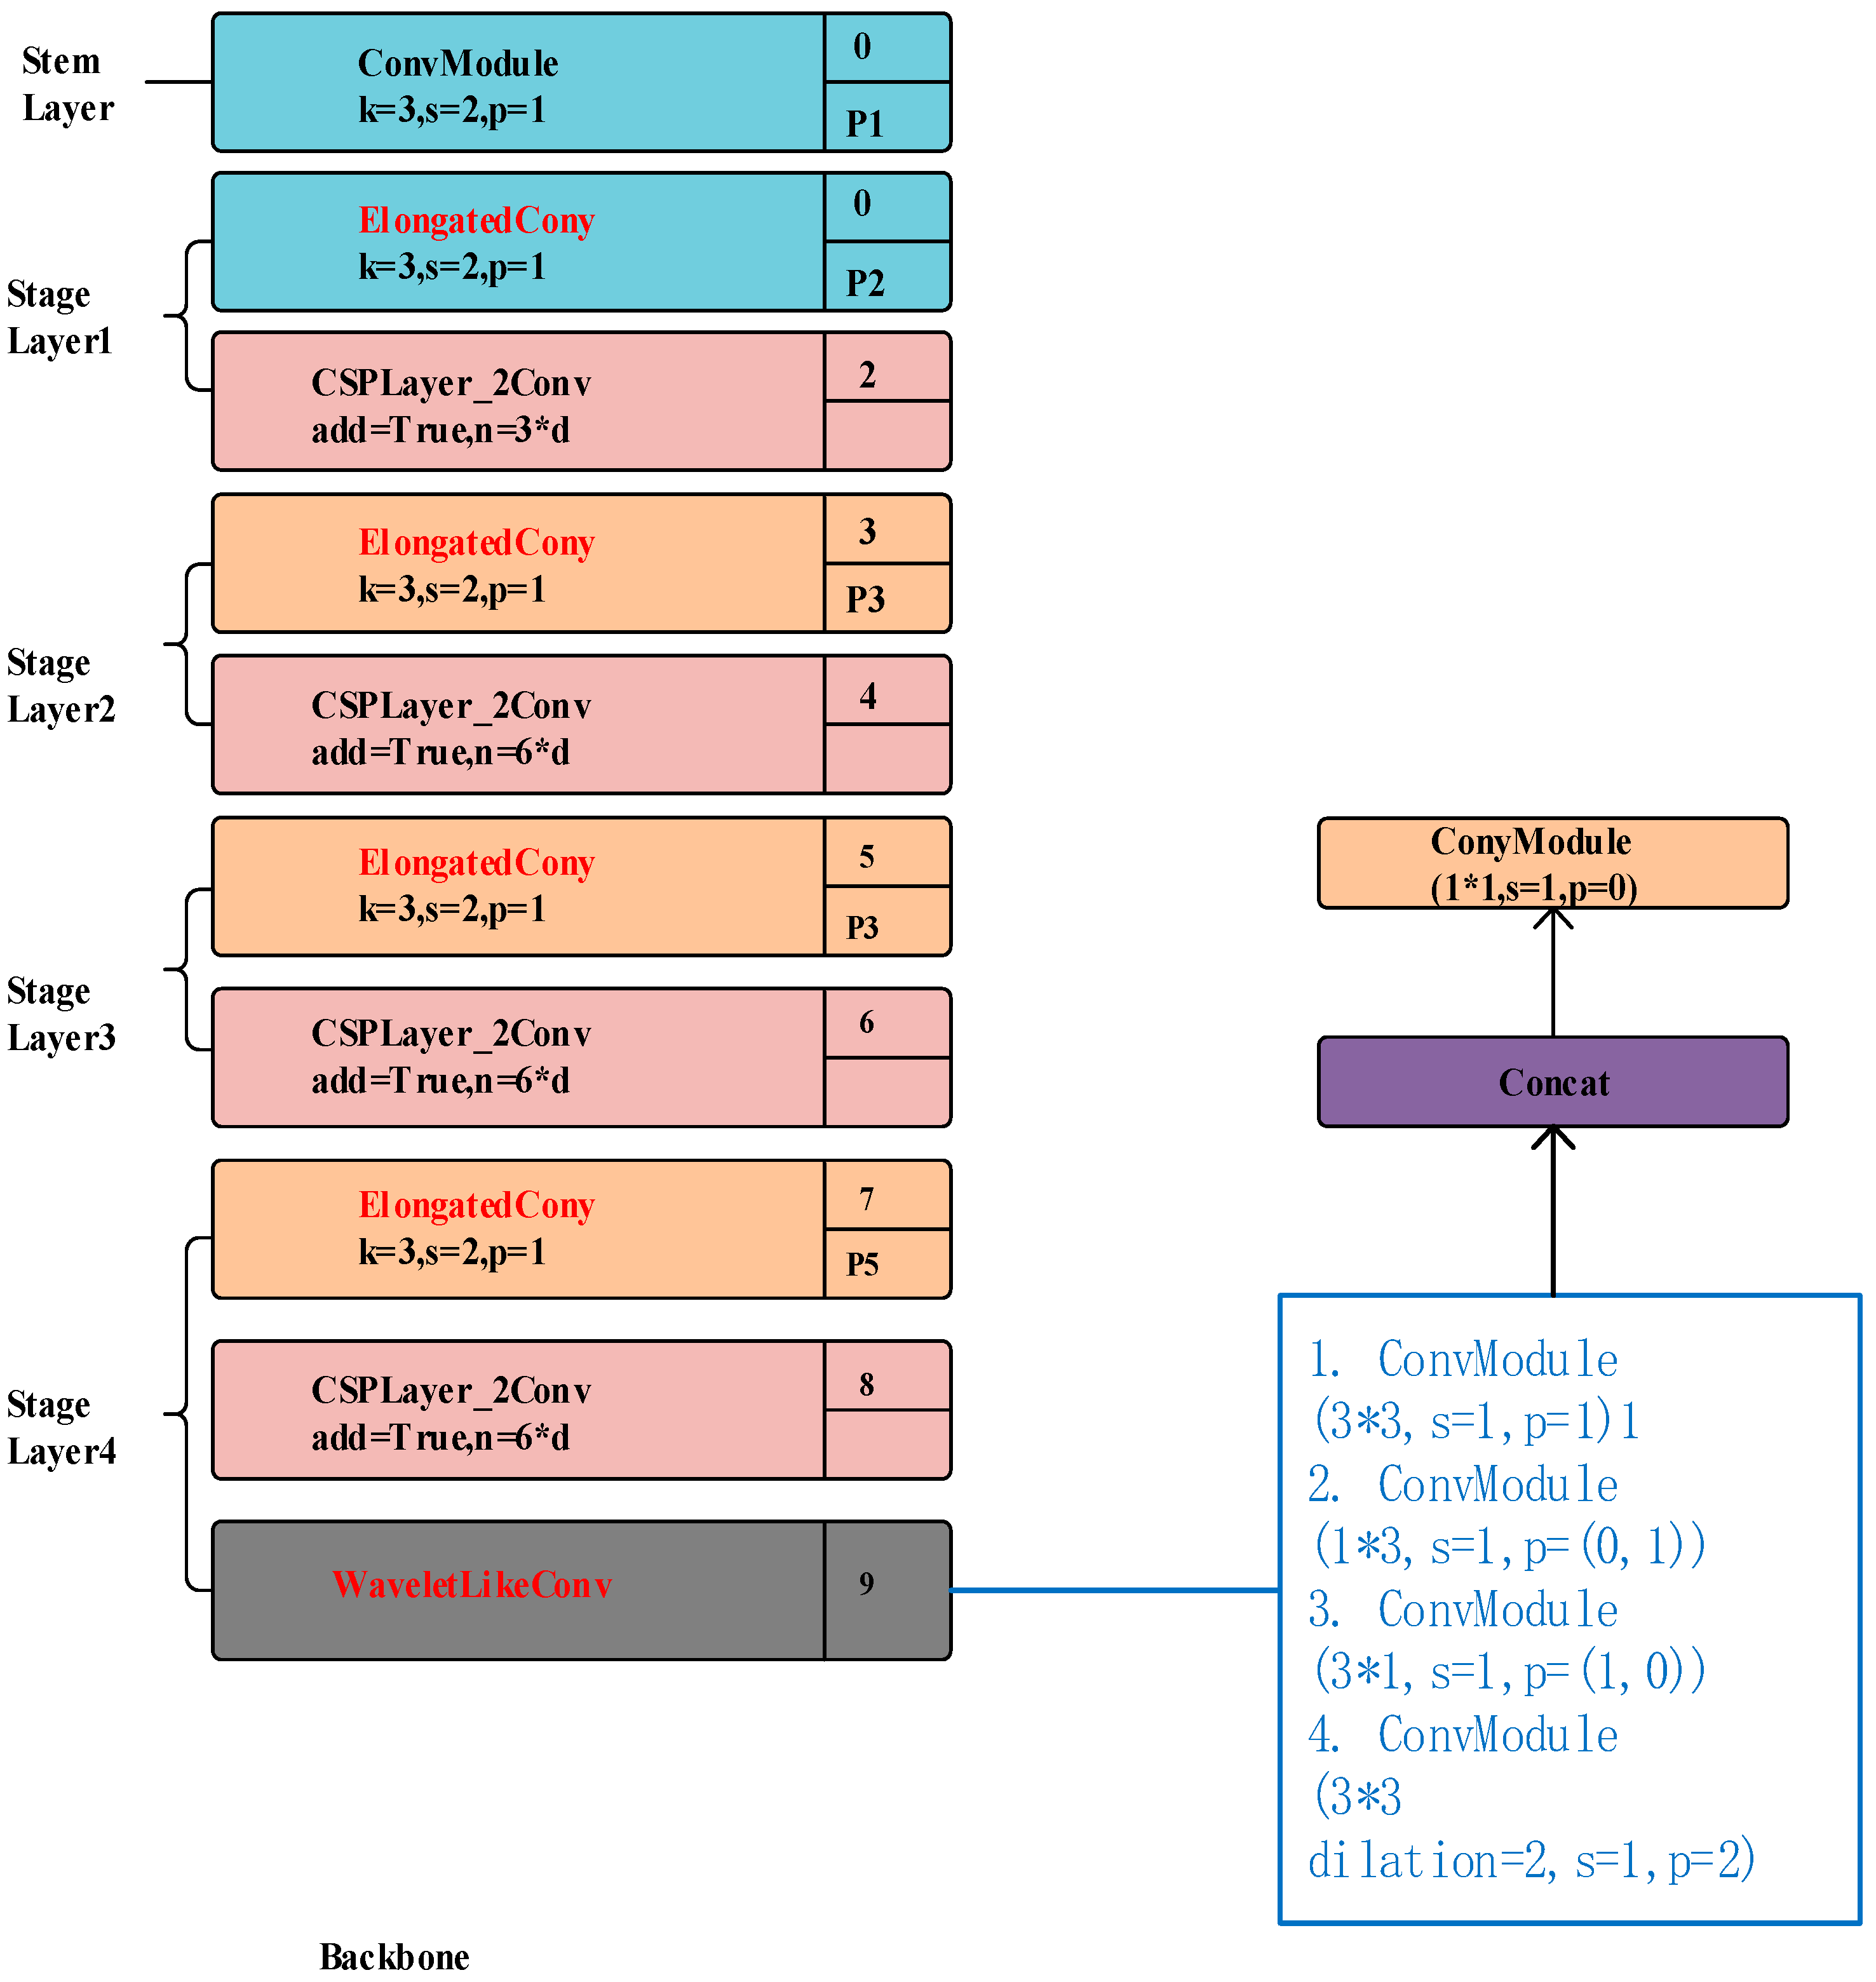
The standard convolutional operations in the YOLOv8 backbone have limited ability to capture high-frequency details. As a result, edge textures of micro-cracks may be lost during feature extraction. This study designs a WaveletLikeConv high-frequency feature extraction module to enhance feature retention. The WaveletLikeConv module is inserted in the latter part of the YOLOv8 backbone, before the extracted features are passed to the neck. It consists of four parallel convolutional branches for complementary feature extraction. The branch outputs are concatenated along the channel dimension and subsequently compressed by a 1 × 1 convolution to maintain compatibility with the subsequent network. Its feature fusion process satisfies
In Equation (1), represents the low-frequency basic features extracted by 3 × 3 convolution, ensuring global background support for crack localization. and capture horizontal and vertical crack edges through 1 × 3 and 3 × 1 convolutions, respectively; expands the receptive field with a dilated convolution to cover diagonal bifurcated crack details. The features extracted from the four branches are concatenated using Concat[·] and then compressed by a 1 × 1 convolution to align the output channel dimensions with the subsequent YOLOv8 network. This operation enriches the high-frequency representation of small cracks and helps reduce the loss of crack details during feature propagation.
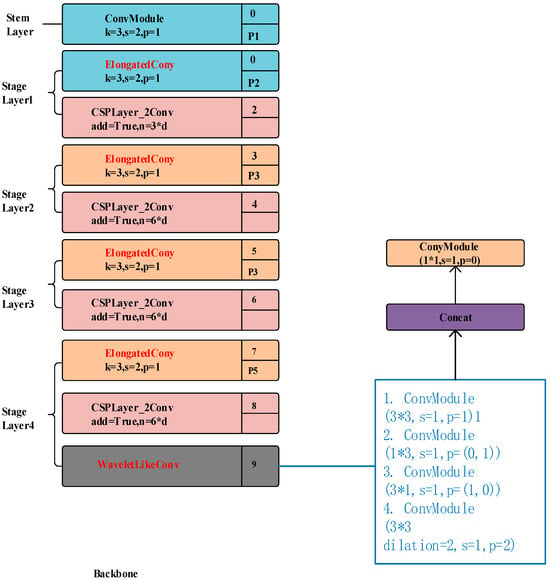
The diagonal branch expands the receptive field via a 3 × 3 dilated convolution with a dilation rate of 2 without increasing kernel size. Distinct from the horizontal and vertical branches that mainly extract linear crack edges along orthogonal directions, this dilated branch targets oblique and bifurcated crack segments. Standard convolutions with constrained receptive fields often cannot fully capture discontinuous textures at crack bifurcations. The feature outputs of this diagonal branch are concatenated together with other branch outputs and compressed by the 1 × 1 convolution operation shown in Equation (1). Consequently, fine-grained information for slanted bifurcated small cracks is maintained in the fused feature map, which mitigates missed detection induced by incomplete feature coverage at crack bifurcations. After the four-branch output features are concatenated, a 1 × 1 convolution is applied to compress the channel dimension and align it with the output of the original backbone. This operation preserves compatibility with the subsequent network structure while supplementing the high-frequency features of small crack targets. The specific structural principle is shown in Figure 4.
Figure 4.
Improved schematic diagram of wavelet simulation.Colored blocks represent network modules, and red text highlights the introduced modules. Black arrows indicate feature flow, while the blue connector links WaveletLikeConv to its detailed structure. The asterisk (*) represents × in kernel dimensions and denotes multiplication in expressions such as n = 3d and n = 6 * d.
3.2.2. Long Strip Convolutional Adaptation Optimization
This study addresses the issues of inadequate adaptability and susceptibility to background interference in traditional square convolutional shapes for thin and elongated cracks in tunnel linings. It designs the ElongatedConv module and optimizes the backbone network. Tunnel lining cracks often exhibit “thin and elongated” geometric characteristics, with an aspect ratio typically greater than 10:1. Traditional 3 × 3 square convolution has significant limitations in capturing such morphological features and is highly susceptible to background texture interference. The ElongatedConv module is introduced into the shallow-feature extraction stage of the YOLOv8 backbone by replacing the corresponding conventional convolutional operation in the selected C2f block. The module adopts two parallel directional convolution branches with kernel sizes of 1 × 5 and 5 × 1 to emphasize horizontal and vertical elongated crack features, respectively. The feature enhancement logic of this module is as follows:
In Equation (2), the 1 × 5 and 5 × 1 dual-branch convolutions focus on capturing the characteristics of horizontal and vertical thin and elongated cracks, respectively. The outputs of the two branches are combined by element-wise addition, followed by BatchNorm and ReLU activation. This module adopts a dual long convolution branch design to improve the accuracy and anti-interference ability of thin and elongated crack feature extraction. The 1 × 5 convolution focuses on the feature extraction of horizontal thin and elongated cracks, while the 5 × 1 convolution focuses on capturing the details of vertical thin and elongated cracks. Compared to traditional 3 × 3 convolution, the matching degree between the convolution kernel shape and the geometric characteristics of cracks is improved, reducing the ineffective response to non-crack textures on the lining surface.
In terms of feature enhancement mechanism, after the superposition of features from the two branches, BatchNorm is applied to stabilize the feature distribution during training and prevent gradient drift. The ReLU activation function enhances the nonlinear representation capability of the model. It further amplifies the grayscale differences between small cracks and the lining background, thereby improving the distinguishability of crack features. This optimization enables the model to capture the morphological information of elongated cracks during the mid-to-shallow feature extraction stage, avoiding the concealment of small target crack features by background noise.
3.2.3. Data Augmentation and Noise Suppression
The scarcity of small target crack samples, coupled with a limited range of scenarios and significant interference from complex environments, constitutes a core issue that constrains the performance of detection models. To address these issues, this study designs a scenario-based data augmentation strategy and an attention-based noise suppression module.
In terms of spatial dimension enhancement design, the focus is on simulating changes in the perspective, position, and orientation of cracks. RandomResizedCrop is applied to randomly crop and scale tunnel lining images, thereby simulating perspective differences between close-up and distant inspections. This operation enables the model to adapt to variations in crack scale under different inspection distances. HorizontalFlip and VerticalFlip are introduced to increase the directional diversity of crack samples. These operations are suitable because tunnel lining cracks are often distributed along horizontal or vertical orientations. Random flipping enhances the robustness of the model in detecting cracks with different orientations. ShiftScaleRotate is then applied to simulate image translation, scaling, and rotation caused by jitter during the movement of inspection equipment. This operation helps the model stably identify small cracks even when positional shifts occur.
In terms of pixel dimension enhancement design, the focus is on restoring the complex lighting and imaging interference within tunnels. RandomBrightnessContrast is applied to simulate uneven LED lighting inside tunnels, alternating bright and dark regions near tunnel portals, and variations in lighting intensity at different times. This operation enhances the model’s ability to extract features from low-contrast and tiny cracks. GaussianBlur is introduced to simulate image blur caused by dust adhering to the lens and airborne particles inside tunnels. This operation helps reproduce real-world imaging conditions for blurred small cracks and prevents the model from relying only on clear crack features.
Design an enhancement strategy tailored to the tunnel environment, expanding the distribution range of small crack training samples through diversified perturbations. The probability enhancement logic centered around horizontal flipping can be represented as follows:
In Equation (3), denotes the original input image, denotes the augmented output image, and r is a random number uniformly distributed in the interval [0, 1]. In addition to horizontal flipping, several augmentation operations are employed to reproduce complex imaging conditions in tunnels. RandomResizedCrop is applied with a scaling range of 0.8–1.0 to simulate crack appearance changes between close-up and distant views. VerticalFlip is used with a probability of 0.2 to improve the model’s adaptability to vertically distributed cracks. ShiftScaleRotate is configured with a translation of 0.1, scaling of 0.2, and rotation of 15° to simulate jitter caused by inspection equipment. RandomBrightnessContrast and GaussianBlur are applied with probabilities of 0.3 and 0.2, respectively, to simulate tunnel lighting fluctuations, dust occlusion, and image blurring. This approach prevents overfitting caused by a single type of sample and enhances the generalization ability of small crack detection.
To suppress false detections caused by water stains, dust, and other background interference, the noise suppression gate is embedded in the 256-channel feature layer of the YOLOv8 neck. A 1 × 1 convolution followed by a Sigmoid function is used to generate a dynamic attention mask, which is applied to the input feature map through element-wise multiplication. Its calculation logic is as follows:
In Equation (4), Conv1 × 1(X) corresponds to the 1 × 1 convolution layer of the attention network in the code, which is used to generate attention weight-based features. Sigmoid(·) maps weights to the [0, 1] interval to generate a dynamic attention mask. The symbol ⊙ represents pixel-wise multiplication, which weights the feature map using the generated attention mask. This operation strengthens feature responses in small-crack regions while suppressing irrelevant background responses caused by interference such as water stains and dust. The contribution of this mechanism to the overall anti-interference performance is evaluated together with the other enhancement modules through the comparative and ablation experiments presented in Section 4.
WaveletLikeConv is embedded at the end of the backbone network and receives 512-channel feature maps before the neck module. It contains four parallel convolution branches: a 3 × 3 convolution for low-frequency features, a 1 × 3 horizontal convolution, a 3 × 1 vertical convolution, and a dilated 3 × 3 convolution with dilation rate of 2 for diagonal crack details. After concatenation along channel dimension, a 1 × 1 convolution compresses feature channels back to 512.
ElongatedConv replaces standard convolution inside the second C2f block of the shallow backbone, operating on 256-channel feature maps. It adopts two parallel branches with kernel sizes of 1 × 5 (padding = (0, 2)) and 5 × 1 (padding = (2, 0)). Output features from two branches are fused via element-wise addition.
The noise-suppression gate is inserted into the neck’s 256-channel feature layer after multi-scale feature fusion, employing a 1 × 1 convolution followed by Sigmoid function to produce dynamic attention masks without modifying channel dimensions.
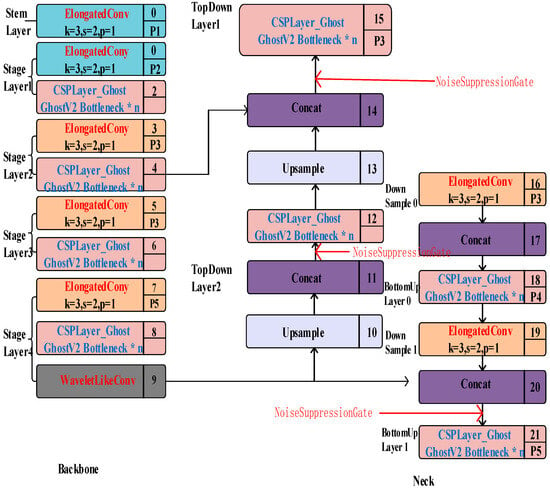
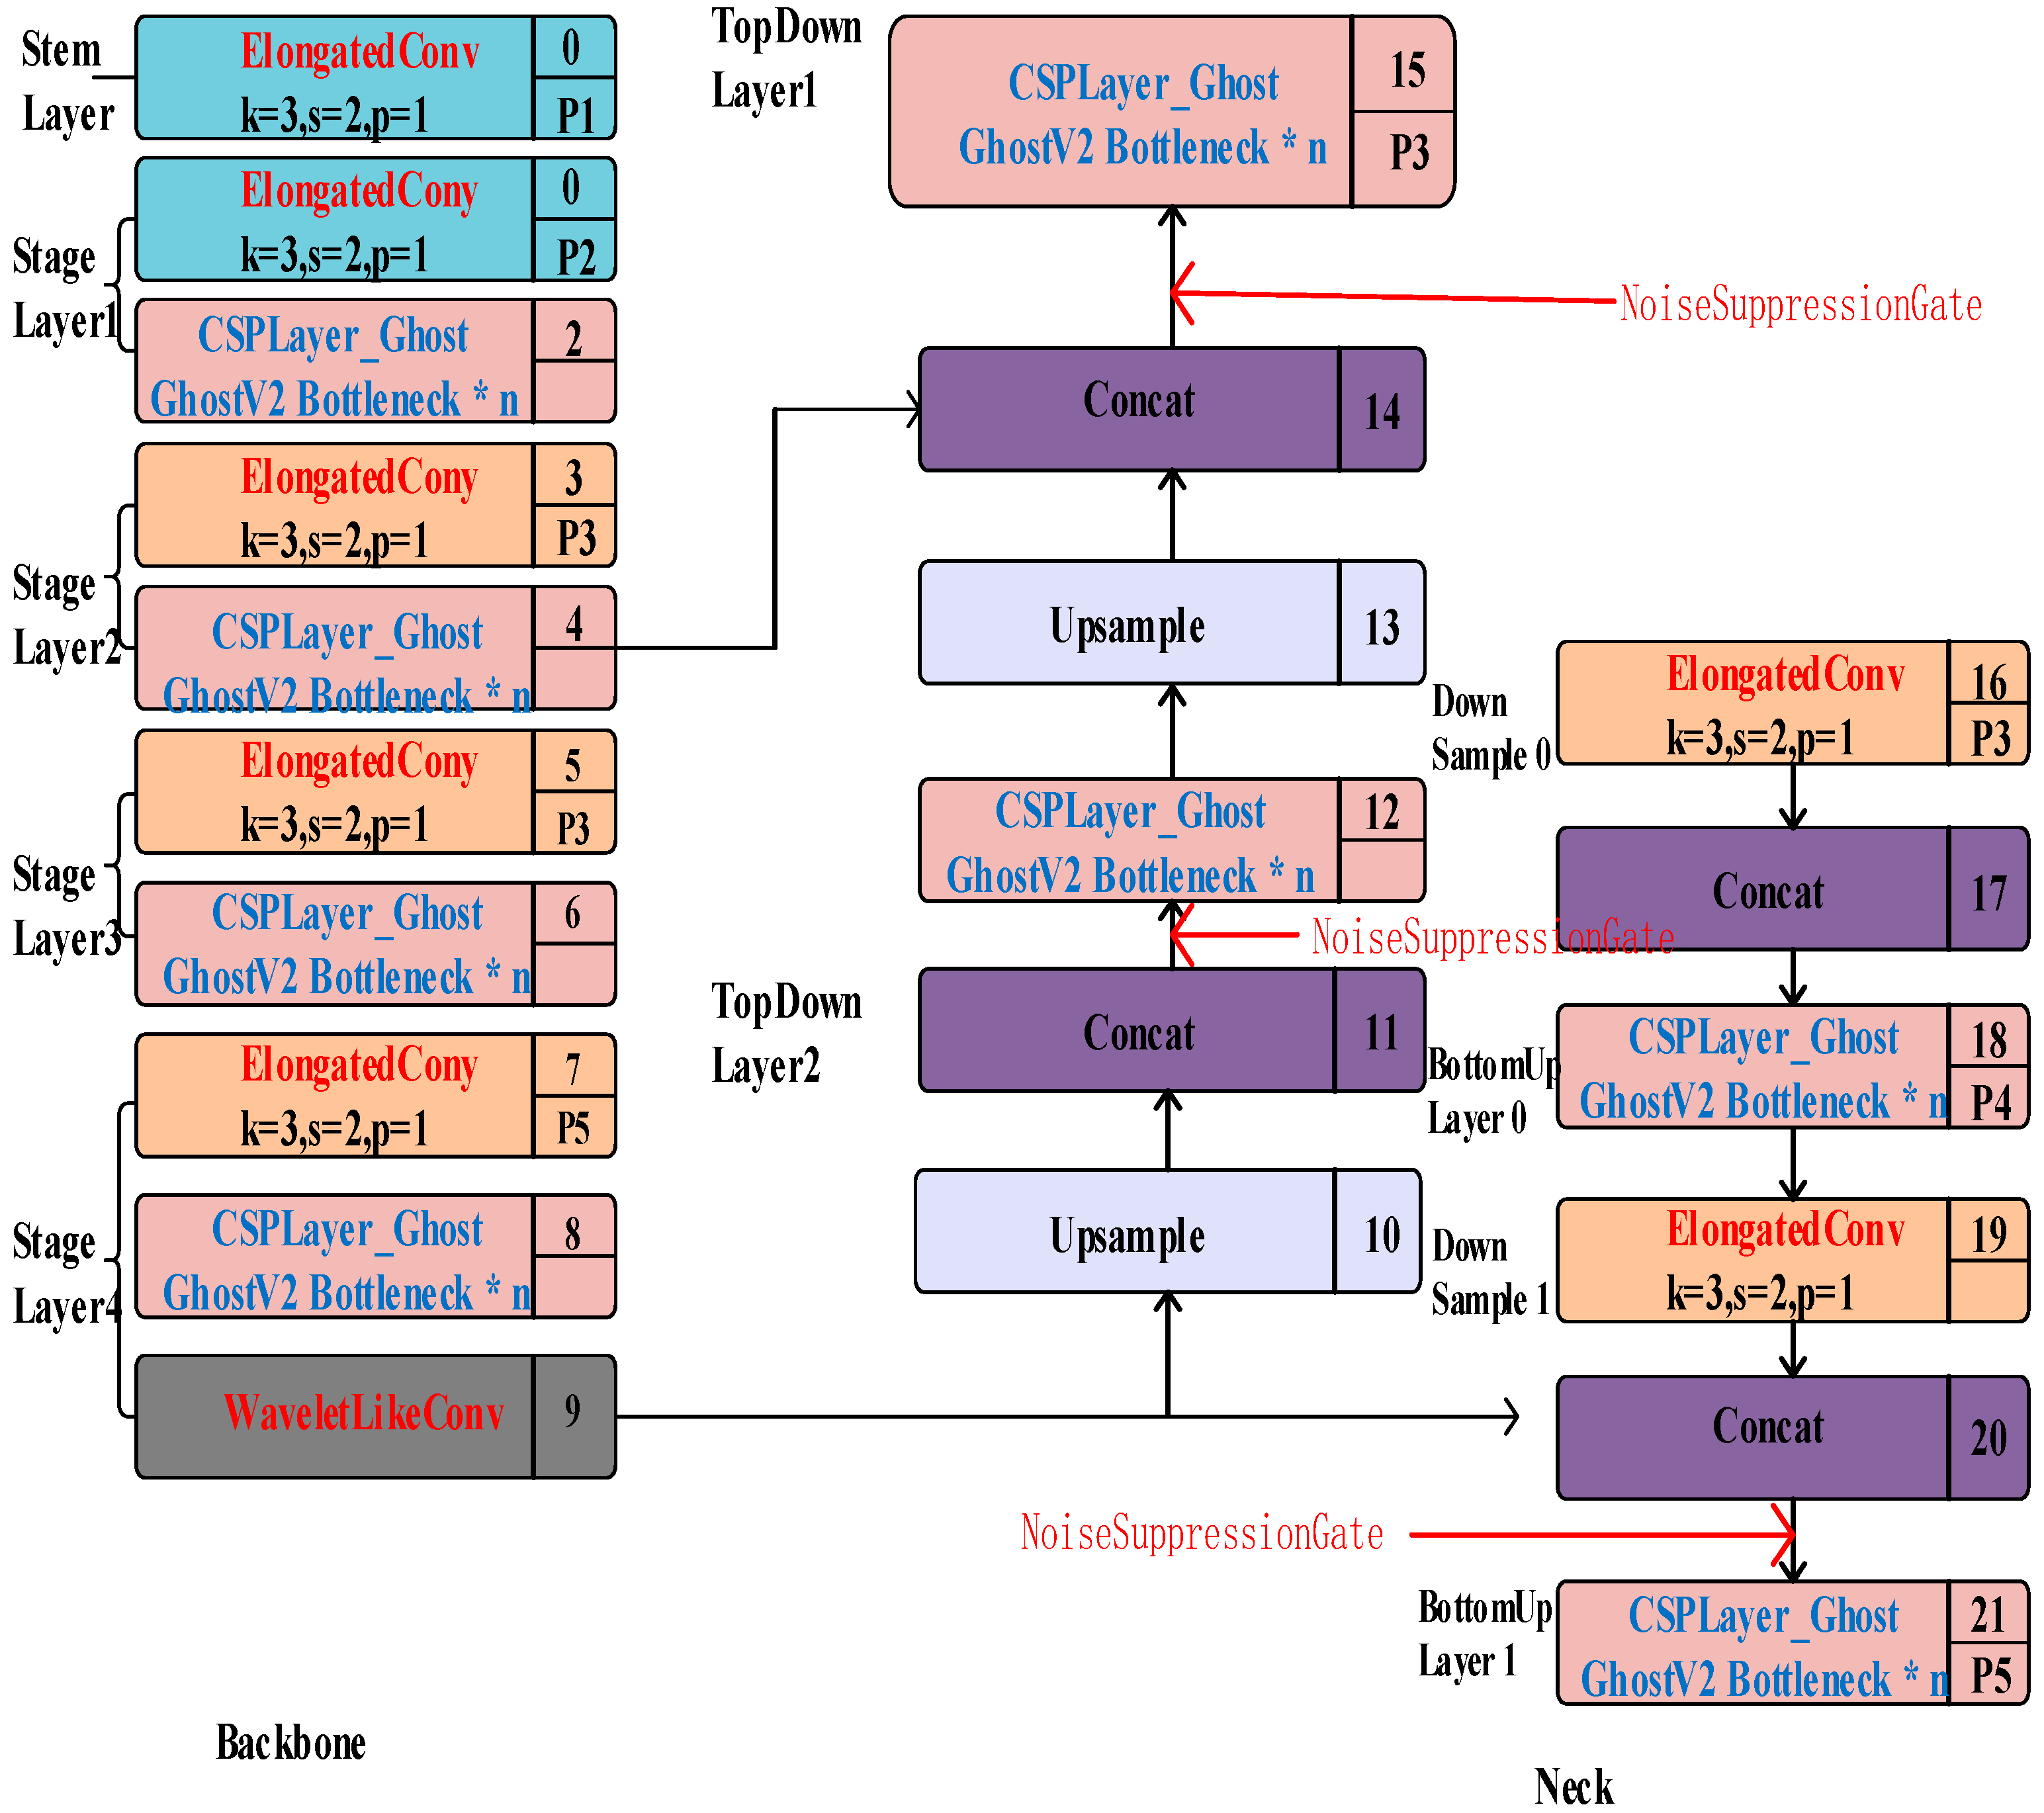
The enhanced Ghost-V2 series components reconstruct the entire YOLOv8 backbone. Enhanced Ghost modules and improved GhostV2 bottleneck replace original C2f blocks, and feature down-sampling optimization is embedded inside each enhanced Ghost module.
3.3. Ghost-YOLOv8-SF Model Principle
To improve the balance between lightweight deployment and feature representation, this study reconstructs the YOLOv8 backbone by introducing the hardware-friendly design principles of GhostNet V2. By enhancing the Ghost module, optimizing feature downsampling, and improving the GhostV2 bottleneck, a detection model that combines lightweight characteristics with long-range feature capture capability is constructed. The specific structural design is shown in Figure 5.
Figure 5.
Schematic diagram of lightweight improvement of YOLOv8 based on GhostNet V2.Colored blocks represent network modules. Red labels highlight ElongatedConv, WaveletLikeConv, and the noise suppression gates, while blue labels identify Ghost-based modules. Black arrows indicate feature flow, and red arrows mark the insertion points of the noise suppression gates. The notation “GhostV2 Bottleneck * n” indicates n repetitions of the bottleneck block.
3.3.1. Enhanced Ghost Module
The original Ghost module has limited spatial information capture capability because only part of its core features participates in cross-pixel interaction. To address this limitation, this study introduces DFC attention, a hardware-friendly attention mechanism from GhostNet V2, to enhance the output features of the Ghost module. This complements and optimizes the issue of a loss of details in minor cracks. The computational logic is as follows:
In Equation (5), Y represents the output features of the original Ghost module; DFCh and DFCv are lightweight fully connected operations in the horizontal and vertical directions, respectively. They are used to capture long-distance spatial dependencies of cracks through low-complexity computation. A is a dynamic attention mask that enhances the features of crack regions through pixel-wise weighting () and suppresses background noise from the lining. By retaining the high-frequency features described in Section 3.2.1, this design improves the ability of Ghost-YOLOv8-SF to capture the overall morphology of cracks.
3.3.2. Feature Downsampling Optimization
To balance computational cost and feature accuracy, this study reduces the additional overhead caused by the parallel operation of DFC attention and the Ghost module. Accordingly, a compact processing flow is designed, consisting of downsampling, attention calculation, and upsampling. The mathematical expression is as follows:
In Equation (6), AvgPool2×2 retains the global contour of cracks through average pooling to avoid downsampling distortion; BilinearUp restores the feature size through bilinear interpolation to ensure compatibility with the output of the Ghost module.
This optimization significantly reduces the computational load of DFC attention, while maintaining the high-frequency detail preservation capability of the WaveletLikeConv module described in Section 3.2.1. The WaveletLikeConv module focuses on preserving the high-frequency detail features of cracks. While reducing computational costs, it emphasizes capturing the long-distance dependency features of cracks. The synergistic effect of the two ensures the extraction of high-frequency information, such as subtle edges and textures of cracks within a lightweight framework, while enhancing the modeling ability for long-distance dependencies such as the overall shape and direction of cracks. This achieves an efficient fusion of long-distance dependency capture and high-frequency detail preservation.
3.3.3. GhostV2 Bottleneck Improvements
Focusing on enhancing key feature expression, targeted improvements have been made to the inverted residual bottleneck structure of GhostNet V2. Considering the crucial role of the extended feature stage in carrying detailed crack information, only this stage has been enhanced and optimized. The structural calculation logic is as follows:
In Equation (7), GhostModule1 is the Ghost module in the expansion stage, generating high-channel expansion features Xexp; DFC calculates attention for the downsampled input features Xdown, and after upsampling, it is weighted with Xexp for enhancement; GhostModule2 compresses the channels and outputs Xout, ultimately retaining the basic features through residual connections.
Based on the adaptation of the 2.2 long strip convolution shape, this improvement further enhances the expressive power of extended features.
4. Experiment
4.1. Data Collection and Processing
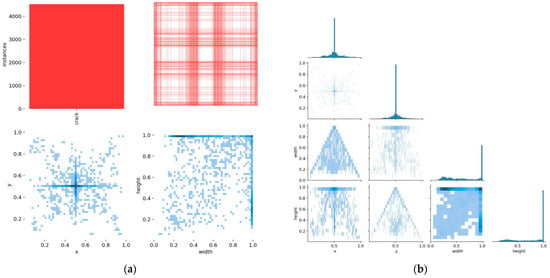
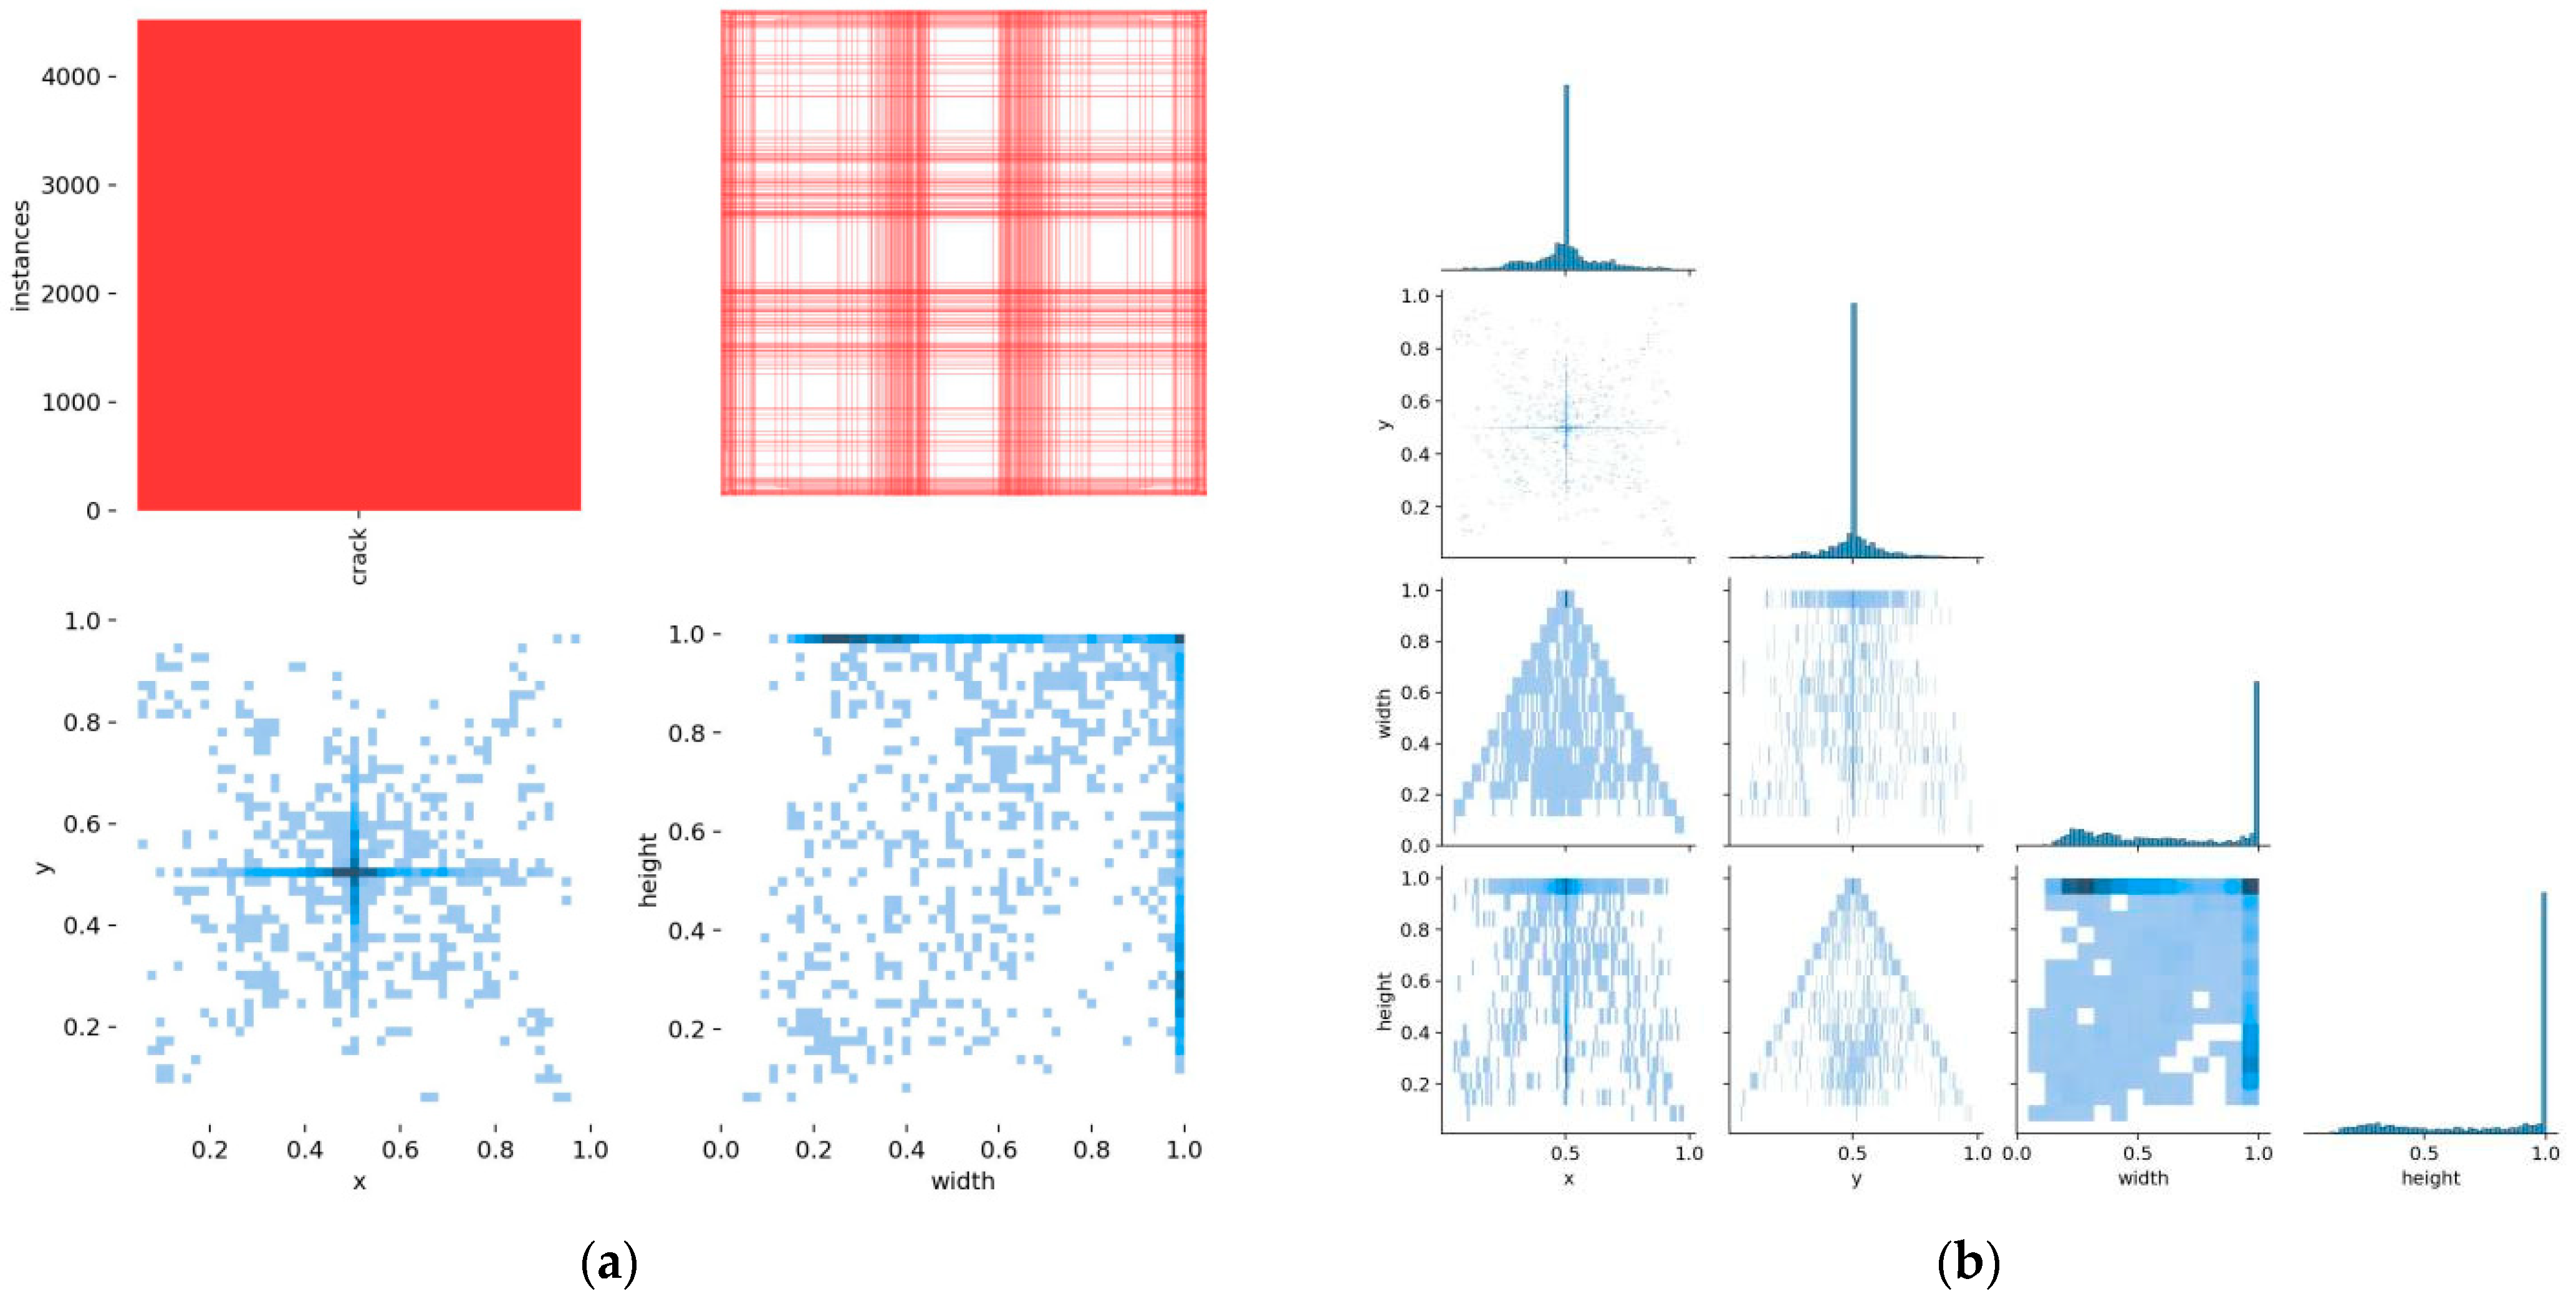
This study utilizes 4711 images selected from the Mendeley open-source dataset “Concrete Crack Images for Classification” [17], which was generated from high-resolution concrete images using the method proposed by Zhang et al. [10]. For the object-detection task, crack regions are represented using bounding-box annotations, and the statistical distribution of the bounding boxes is presented in Figure 6b. The dataset selection considers various lighting levels, interference scenarios, and the presence of multiple cracks, aiming to enhance the robustness of the object detection model. For experimental consistency, the dataset is divided into a training set and a validation set at a ratio of 7:1, corresponding to 87.5% and 12.5% of the available samples, respectively. This ratio allocates the majority of the data to model training and weight optimization while retaining an independent subset for validation-based performance evaluation and hyperparameter adjustment. Considering the available dataset size and the need to balance sufficient training data with reliable validation, the 7:1 split is applied consistently throughout all experiments. In addition, tunnel lining crack images collected under various complex external conditions are used as a test set for the subsequent objective evaluation of the performance, generalization ability, and robustness of the improved model.
Figure 6.
Data processing result chart. (a) Instance quantity and spatial-position distribution of crack bounding-box annotations. (b) Width–height statistical distribution of crack bounding boxes.
After data collection and dataset partitioning, an image preprocessing stage is performed before model training. All images are resized to 640 × 640 pixels using adaptive padding to preserve the original crack morphology and are subsequently standardized before being input into the detection network. These deterministic operations constitute the preprocessing stage. Stochastic transformations used for data augmentation are applied subsequently only during model training.
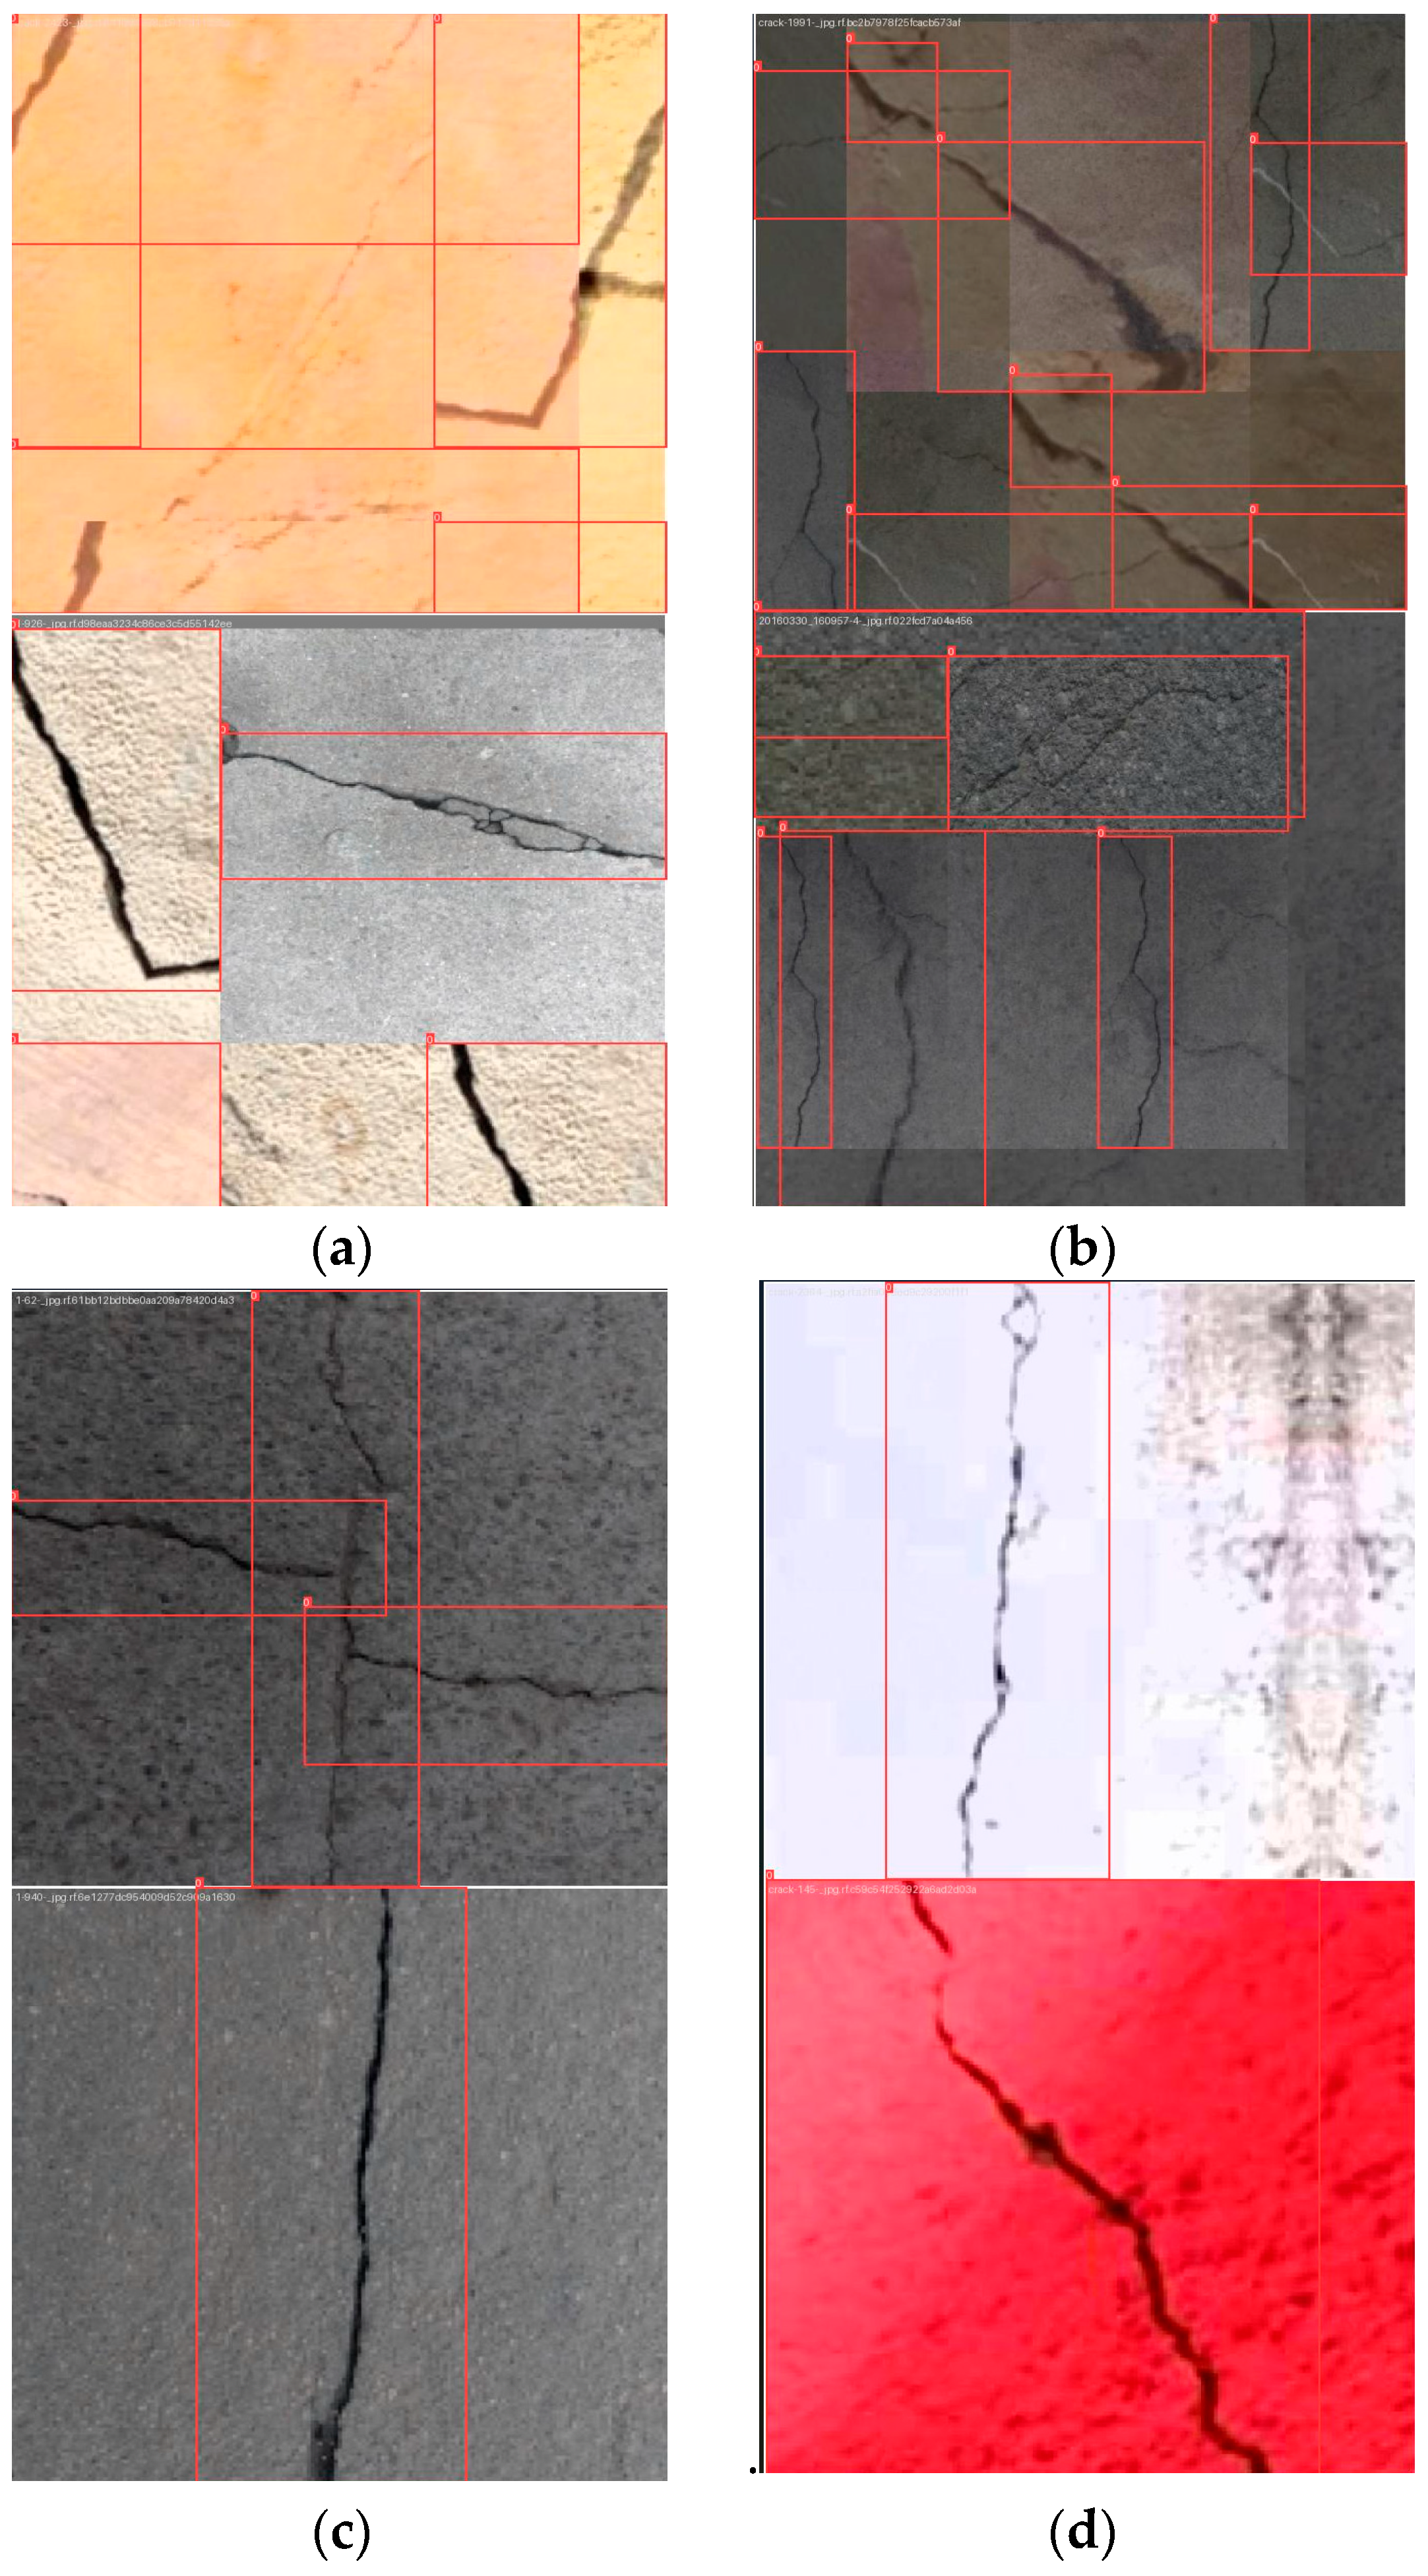
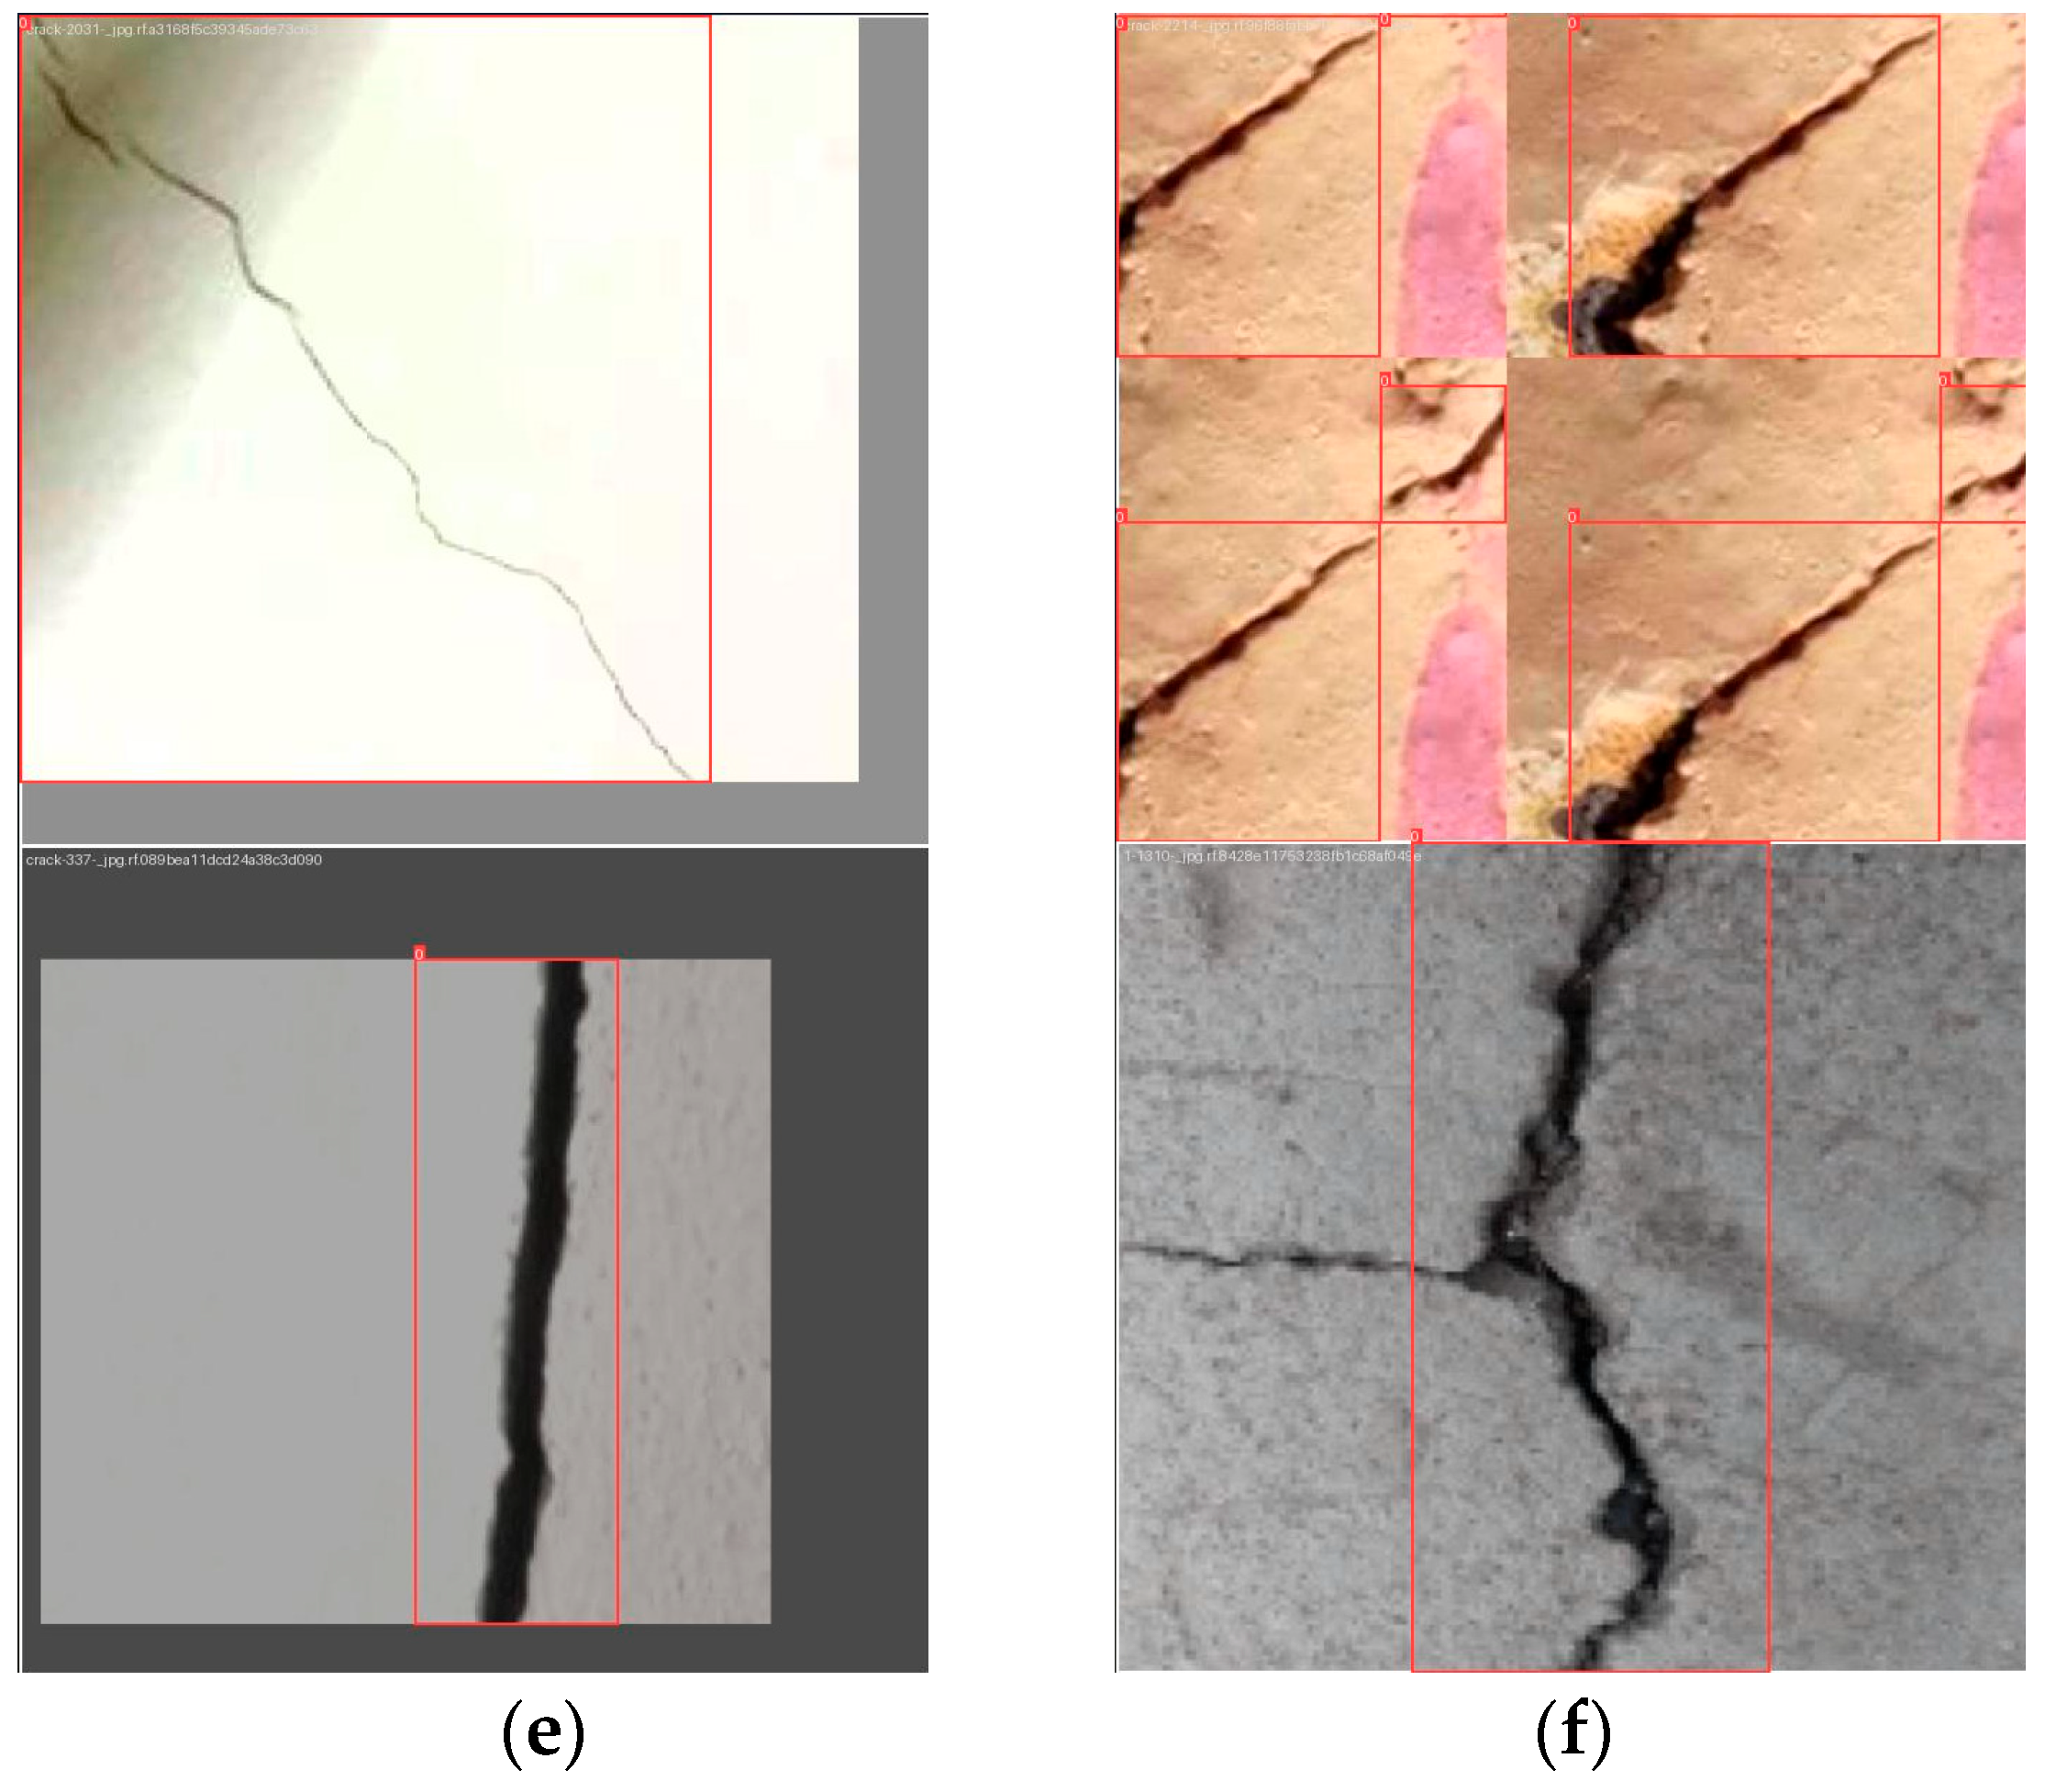
The statistical characteristics of bounding-box scale and spatial distribution for the open-source dataset are visualized in Figure 6. Representative patches of self-collected field images under complex tunnel environments are displayed within the prediction visualization sub-figures in Figure 7a–f.
Figure 7.
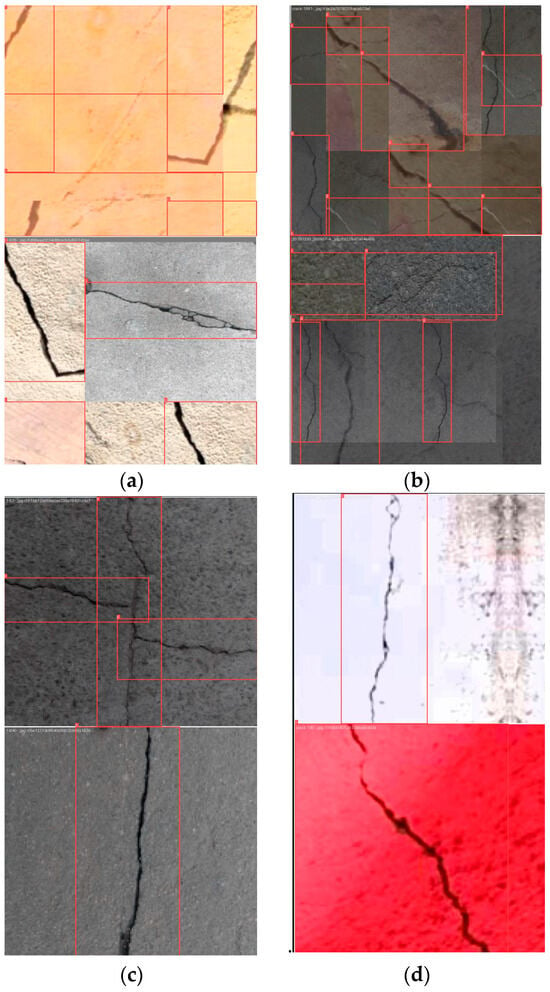
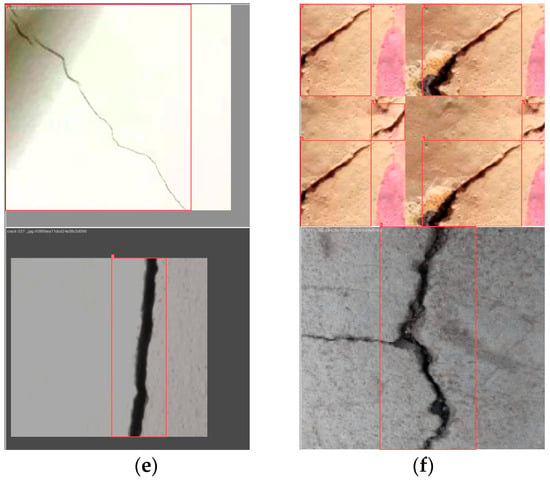
Visualization of the prediction results from the crack detection model. (a) Normal lighting with multiple cracks. (b) Faint light and slender cracks. (c) Dust covers small cracks. (d) Water stain interference crack. (e) Alternating light and dark cracks at the entrance and exit. (f) Multiple interference superimposed fractures.
4.2. Experimental Environment and Parameter Settings
This study clarifies the experimental environment configuration and full-process parameters. It takes into account both the reproducibility of results and the adaptability to edge device deployment. To ensure the reproducibility of experimental results and adapt to the deployment scenarios of edge devices in practical engineering, this study defines the hardware and software environment configurations and sets targeted parameters for the entire process of dataset preprocessing, model training, and inference.
We adopted a two-level hardware configuration consisting of a training platform and an edge deployment test platform to balance model training efficiency and practical deployment adaptability. The training end utilizes a Lenovo workstation (Lenovo, Beijing, China) equipped with an Intel (R) Xeon (R) Gold 6226R server-grade CPU (32 logical cores, base clock speed of 2.90 GHz, maximum turbo clock speed of 3.90 GHz), paired with an NVIDIA RTX A4000 professional-grade graphics card (16 GB VRAM), 128 GB DDR4 high-speed memory, 1.9 TB NVMe solid-state drive, and 7.3 TB large-capacity mechanical storage, respectively meeting the needs of multi-threaded parallel computing, large-scale feature storage, high-speed data set reading and writing, and training result archiving; the edge deployment test end utilizes NVIDIA Jetson series embedded devices and ARM architecture portable terminals to simulate the low computing power environment of vehicle-mounted and handheld detection devices, verifying the real-time performance and adaptability of the model.
The software environment is constructed with a focus on deep learning tasks to ensure the stability and efficiency of experimental workflows. The training system is deployed with the Arch Linux 6.17.8-arch1-1 operating system, utilizing PyTorch 2.7.1 + cu118 as the foundational deep learning framework, and incorporates the ultralytics 8.0.196 YOLOv8 core library. Image preprocessing and augmentation are facilitated by OpenCV 4.12.0 and albumentations 2.0.8, respectively. Training metrics are consolidated using openpyxl 3.1.5, while results are visualized through Matplotlib 3.10.3. GPU acceleration is enabled by leveraging CUDA 13.0 and NVIDIA computational libraries.
The experimental parameters are configured for the tunnel lining crack detection scenario, facilitating the coordinated optimization of data preprocessing, model training, and inference. The deterministic preprocessing procedure described in Section 3.1 is applied consistently to all images before model input. During model training, additional stochastic augmentation operations are introduced to increase sample diversity and simulate complex tunnel inspection conditions. Specifically, Mosaic augmentation is applied with a probability of 0.8 and MixUp with a probability of 0.2. HSV-based photometric transformations are also employed, including hue variation of ±1%, saturation variation of ±40%, and brightness variation of ±20%, together with geometric transformations. Additional scenario-oriented transformations, including cropping, flipping, translation, scaling, rotation, brightness/contrast adjustment, and blurring, are described in Section 3.2.3. Model training is conducted for 30 epochs using the AdamW optimizer. The first five epochs are used as the warm-up stage, during which the learning rate increases from 1 × 10⁻⁵ to 1 × 10⁻³. After the warm-up stage, cosine annealing is adopted for learning-rate scheduling. The weight decay coefficient and momentum are set to 5 × 10⁻⁴ and 0.9, respectively. CrossEntropyLoss is used for classification, whereas CIoULoss is employed for bounding-box regression. The loss component associated with small cracks is assigned a weighting factor of 1.5. The batch size is set to 2, with a gradient accumulation step of 2. Early stopping is enabled with a patience of 5 epochs. Multi-threaded data loading and AMP mixed-precision training are disabled by setting workers = 0 and AMP = False, respectively. In the inference stage, the input size is maintained at 640 × 640, and detection boxes are refined through NMS post-processing. The training phase preserves full precision, whereas the edge device phase leverages TensorRT 10.3.0 for precision compression and acceleration. It ultimately retains detection boxes with high confidence levels to strike a balance between detection accuracy and efficiency.
Figure 6 presents the statistical features of the dataset. Figure 6a shows the instance statistics and spatial location distribution of crack bounding-boxes. Figure 6b visualizes the width-and-height distribution of annotated crack boxes. It can be observed that numerous crack samples occupy relatively small pixel areas, and a considerable number of samples possess large aspect ratios, corresponding to thin-and-elongated tunnel-lining cracks. This statistical characteristic further motivates the design of our small-target enhancement module and the ElongatedConv module for elongated crack feature extraction (Table 1).
Table 1.
List of Parameters.
4.3. Design and Implementation of Comparative Experiments
To comprehensively evaluate the performance of the Ghost-YOLOv8-SF model, this study constructs an evaluation system comprising six comparative models. This system covers basic models of the same series, iterative models of the same architecture, classic models across architectures, domain-specific improved models, and individual verification models of some improved components. Among them, the original YOLOv8 serves as a direct improvement benchmark to quantify the overall improvement effect. The original YOLOv10 represents the new technological route of the YOLO series and is used to compare the performance differences with iterative models of the same architecture. Faster R-CNN is used as a benchmark for two-stage architectures to evaluate the balance between accuracy and real-time performance. SSD is used as a representative of single-stage multi-scale models, with a focus on comparing the accuracy performance in detecting small target cracks. Additionally, two partially improved models, YOLOv8 + Small-Target DE and YOLOv8 + Lightweight Rec, are added to further dissect the independent contributions of core components.
To ensure the objectivity and reproducibility of the experimental results, all comparative models follow the same experimental protocol. The input data format and training settings are kept consistent. The unified inference configurations include an input image size of 640 × 640, an NMS confidence threshold of 0.5, and an NMS IoU threshold of 0.3. TensorRT FP16 mixed-precision inference is used for edge-device evaluation. These settings are kept unchanged across the comparative models so that the observed performance differences primarily reflect differences in model architecture.
4.4. Ablation Experiment
To verify the independent contributions of each innovative module and clarify the effectiveness of core improvement directions, multiple sets of ablation experiments are designed based on the original YOLOv8 as the benchmark model. The experiments strictly controlled variables: all experimental groups use the dataset divided in Section 3.1, and the training and inference parameters set in Section 3.2. Quantitative analysis is conducted from four dimensions: detection accuracy, lightweight performance, real-time performance, and anti-interference capability. The experimental design and results are as follows:
- Benchmark group (G0): The original YOLOv8 model, without any improvements, is used to evaluate basic performance.
- Experimental Group 1 (G1): G0 + WaveletLikeConv module (Section 3.2.1, high-frequency feature preservation), to verify the effect of capturing high-frequency details on micro-crack detection;
- Experimental Group 2 (G2): G1 + ElongatedConv module (Section 3.2.2, Elongated Morphology Adaptation), to verify the gain of elongated convolution in extracting features of elongated cracks;
- Experimental Group 3 (G3): G2 + Noise Suppression Gate module (Section 3.2.3, Noise Suppression), to verify the suppression effect of attention masking on background interference;
- Experimental Group 4 (G4, complete improved model): G3 + enhanced Ghost module (Section 3.3, lightweight improvement), to verify the effect of the lightweight module in reducing resource consumption while maintaining accuracy.
4.5. Evaluation Metrics
To verify the performance of the Ghost-YOLOv8-SF model in the task of detecting cracks in highway tunnel linings, an evaluation index system is designed based on three core dimensions: detection accuracy, lightweight performance, and real-time performance, taking into account the detection requirements of small target cracks, elongated cracks, and complex background interference in tunnel linings.
4.5.1. Detection Accuracy Metrics
- (1)
- Average Precision (AP)
AP is the core metric for measuring the accuracy of single-class detection in object detection tasks, achieved by calculating the area under the Precision-Recall curve (AUC). For tunnel lining crack detection, the overall crack AP and small-target crack AP are calculated separately to evaluate the model’s detection performance for cracks at different image scales. Small-target cracks are defined according to the image-space bounding-box scale, with targets smaller than 32 × 32 pixels treated as small targets. Because the images were obtained from different sources and under different imaging conditions, no unified pixel-to-millimeter conversion is assumed in this study. The calculation of AP consists of two main steps. First, Precision and Recall are calculated at different confidence thresholds. Precision represents the ratio of correctly detected cracks to all crack detections generated by the model, as shown in Equation (8). Recall represents the ratio of correctly detected cracks to all actual cracks in the dataset, as shown in Equation (9). Second, the Precision–Recall curve is plotted based on these values, and the area under the curve is taken as the AP value.
In Equation (8), TP (True Positive) represents the number of correctly detected cracks, while FP (False Positive) denotes the number of false positive detections.
The recall rate represents the ratio of the number of cracks correctly detected to the total number of actual cracks in the dataset, and its formula is as follows:
In Equation (9), FN (False Negative) represents the number of undetected cracks. The P-R curve is plotted based on the Precision and Recall values at different confidence thresholds, and the area under the curve is the AP value. The higher the AP value, the better the detection accuracy of the model.
- (2)
- Accuracy (Acc)
Accuracy measures the overall discriminative ability of the model between the “crack” and “non-crack” categories, and is suitable for evaluating the model’s resistance to background interference, such as water stains and dust on the lining surface. The formula is:
In Equation (10), TN (True Negative) represents the number of correctly identified non-crack areas. The higher the value of this indicator, the stronger the model’s ability to distinguish between cracks and background.
- (3)
- Miss Rate (MR) and False Alarm Rate (FAR)
In response to the engineering requirements for tunnel crack detection, the missed detection rate and false detection rate are added as key indicators.
Missed Detection Rate (MR): The ratio of the number of missed cracks to the total number of actual cracks, which directly reflects the model’s ability to cover cracks. The formula is:
False alarm rate (FAR): The ratio of the number of false positive detections to the total number of detection results from the model, reflecting the model’s ability to suppress background interference. The formula is:
In engineering applications, it is required that MR be less than or equal to 5% and FAR be less than or equal to 8% to ensure that no cracks are missed and the detection results are highly reliable.
4.5.2. Lightweight Performance Metrics
Lightweight performance indicators are used to evaluate the resource utilization of the model and its adaptability to edge device deployment. These indicators mainly include the number of parameters and FLOPs.
- (1)
- Parameters
The parameter count reflects the storage complexity of the model, measured in millions of parameters (M) and calculated by counting the total number of all trainable parameters in the model. By comparing the parameter count differences between the improved and original models, we can evaluate the lightweight effect. The smaller the parameter count, the lower the model’s storage requirement.
- (2)
- FLOPs
The computational complexity of a model is reflected by its computational volume, measured in billions of floating-point operations (G FLOPs). This is calculated by summing up the number of floating-point operations performed during the forward inference process of the model, including all convolutional and fully connected operations. The focus is on the computational volume of the model when the input size is 640 × 640. The lower the computational volume, the less demanding the model is on hardware computing power, making it more suitable for edge devices.
4.5.3. Real-Time Performance Metrics
The real-time performance metric focuses on the inference speed of the model, meeting the dynamic detection requirements of tunnel inspection equipment. Specifically, the frame rate (Frames Per Second, FPS) indicates the number of images that the model can process per second, with the unit being “frames/second (FPS)”. The inference frame rate of the model is tested on both the training platform (NVIDIA RTX A4000) and the edge deployment test platform (NVIDIA Jetson Orin NX).
5. Results and Discussion
5.1. Model Comparison Results
5.1.1. Comparison with Benchmark Models
Based on the original four representative comparison models, as well as YOLOv8 with small target detection (YOLOv8 + Small-Target DE) and lightweight (YOLOv8 + Lightweight Rec), a quantitative comparison is conducted with the fully improved model. Combining the core requirements of tunnel lining crack detection, a quantitative comparison is carried out from three dimensions: detection accuracy, lightweight performance, and real-time performance. All experiments are conducted based on a unified dataset and experimental parameters, and the results are shown in the table below.
As shown in Table 2, Ghost-YOLOv8-SF achieves the highest mAP50 (0.915), mAP50-95 (0.644), and precision (92.8%) among the compared models, while reducing the FAR to 7.2%. Compared with the original YOLOv8, mAP50 increases from 0.863 to 0.915 and mAP50-95 from 0.533 to 0.644. However, the parameter count increases from 25.86 M to 28.26 M and the computational load increases from 79.1 to 91.5 G FLOPs. In addition, the MR changes from 16.9% to 17.3%. Therefore, the proposed model should not be interpreted as uniformly reducing model complexity or missed detections; rather, it prioritizes improvements in detection accuracy and false-alarm suppression at the cost of moderate additional computational overhead.
Table 2.
Comparison results of benchmark models.
5.1.2. Ablation Results
To verify the independent contributions and synergistic effects of each improved module, five experimental groups (G1-G4) are designed based on the original YOLOv8 as the benchmark group (G0). Strict control is maintained over the consistency of datasets, training parameters, and inference configurations. The core of the evaluation revolved around key indicators for tunnel detection. The results are presented in Table 3.
Table 3.
Comparison results of ablation experiments.
The ablation results reveal different contributions from the individual modules and also indicate clear trade-offs among the evaluation metrics. G1, obtained by introducing the WaveletLikeConv module, achieves the highest mAP50-95 of 0.6700 and the highest recall of 87.9375%, indicating that high-frequency feature preservation is particularly beneficial for detailed crack representation and reducing missed detections. After integrating all modules, G4 achieves an mAP50 of 0.9146 and the highest precision of 88.35%, while reducing the FAR to 11.65%, the parameter count to 25.2 M, and the computational load to 76.8 G FLOPs. However, its mAP50-95 and recall are slightly lower than those of G1. Therefore, the complete configuration should be interpreted as providing a more balanced trade-off among detection accuracy, false-alarm suppression, and model complexity rather than achieving uniform improvement across all metrics.
Taking G0 as the benchmark, G1 achieves an mAP50 of 0.9133 after adding the WaveletLikeConv module, representing a 2.27% improvement over G0, and the MR decreases to 12.0625%. G2 experiences slight fluctuations in indicators after adding the ElongatedConv module, but it lays the foundation for subsequent optimization. G4, which integrates all modules, reduces the parameter count by 2.55% to 25.2 M and decreases the computational load by 2.91% to 76.8 G FLOPs compared with G0. It also increases the edge-side frame rate by 178.6% to 7.8 FPS, achieving a comprehensive balance among accuracy, robustness, and lightweight performance.
5.2. Model Validation and Discussion
To verify the engineering applicability and performance advantages of the improved model in the detection of cracks in highway tunnel linings, this study conducts verification from two dimensions: qualitative visualization and quantitative scenario-based analysis. By combining typical detection scenarios in actual tunnel operations, we compare the detection performance of the improved model with that of the benchmark model to clarify the practical utility of the improved model.
Based on the crack-detection prediction results of Ghost-YOLOv8-SF shown in annotated Figure 7, combined with quantitative results listed in Table 2, we conduct a comparative analysis against YOLOv8, YOLOv10, Faster R-CNN and SSD baseline models. The comparison involved several benchmark models, including the original YOLOv8, YOLOv10, Faster R-CNN, and SSD. Six typical tunnel detection scenarios were considered: multiple cracks under normal lighting, thin and elongated cracks under weak lighting, small cracks covered by dust, cracks affected by water stains, cracks under alternating light and dark conditions near tunnel entrances and exits, and cracks under multiple types of interference.
For the baseline models, YOLOv8 frequently produces missed detections for dust-covered tiny cracks and generates false alarms induced by water-stain background textures. YOLOv10 suffers serious missed detection for thin elongated cracks under low-light conditions. Faster R-CNN yields reliable crack localization for clear cracks but shows degraded performance for low-contrast micro-cracks. SSD is prone to false positive outputs under complex background interference. These qualitative observations are consistent with their quantitative FAR, MR and mAP metrics in Table 2.
Combining the quantitative results in Table 2 with the visual comparisons in Figure 7, Ghost-YOLOv8-SF demonstrates favorable overall detection performance in the evaluated tunnel scenarios. Specifically, it achieves the highest mAP50 (0.915), mAP50-95 (0.644), and precision (92.8%), together with the lowest FAR (7.2%) among the compared models. Taking the representative sample under normal-lighting multi-crack condition in annotated Figure 7a as an example, Ghost-YOLOv8-SF achieves favorable bounding-box alignment against real crack contours on this sample without obvious missed or false detections. It should be noted that the MR, FAR, recall and precision metrics summarized in Table 2 correspond to the overall performance evaluated on the complete test dataset, rather than metrics computed only for this single scene. For low-light, dust-occluded, water-stain-interfered and alternating-illumination cases shown in Figure 7b–f, the proposed model also exhibits promising detection behaviour on these representative samples. The overall quantitative superiority of Ghost-YOLOv8-SF over YOLOv8, YOLOv10, Faster R-CNN and SSD can be fully observed from mAP, precision, MR and FAR listed in Table 2. In dust-covered scenarios, the model achieves a low false positive rate of 7.2% relying on the WaveletLikeConv module, compared to a missed detection rate of 16.9% for YOLOv8 and a false positive rate of 13.1% for SSD. In water stain interference and alternating light and dark scenarios, its precision is 92.8%, with an mAP50 of 0.915, significantly outperforming the performance decline of other models. In scenarios with multiple interferences, the model still maintains an mAP50 of 0.915, a missed detection rate of 17.3%, and a false positive rate of 7.2%, while all benchmark models fail to meet practical standards.
The specialized verification of small target crack detection confirms that Ghost-YOLOv8-SF’s multi-scale detection capability is significantly superior. Specifically, its mAP50-95 reaches 0.644, representing a 10.1% improvement over YOLOv10 and a 20.8% improvement over YOLOv8. The precision is 92.8%, exceeding YOLOv8 and YOLOv10 by 5.2 percentage points and 12.7 percentage points, respectively. The missed detection rate is 17.3%, lower than YOLOv10’s 25.1%. The false positive rate is 7.2%, a decrease of 41.9% compared to YOLOv8 and a decrease of 63.8% compared to YOLOv10. Ablation experiment data support this, showing that after adding the WaveletLikeConv module to Group G1, the mAP50-95 increases by 10.2% compared to the baseline Group G0. Combined with the distinguishing effect of the ElongatedConv module on target features and background interference, it effectively solves the problem of high-frequency information loss in traditional models, enhancing the accuracy and completeness of small target detection.
The deployment-related performance should be interpreted from multiple dimensions. Under a 640 × 640 input size and TensorRT FP16 inference, Ghost-YOLOv8-SF has a parameter count of 28.26 M, a computational load of 91.5 G FLOPs, a training-platform frame rate of 9.98 FPS, and an edge-side frame rate of 2.5 FPS. As shown in Table 2, Faster R-CNN and SSD achieve higher edge-side frame rates of 20.7 FPS and 19.9 FPS, respectively. Therefore, Ghost-YOLOv8-SF does not provide the highest edge-side inference speed among the compared models. Its principal advantage is instead reflected in detection performance, with the highest mAP50 (0.915), mAP50-95 (0.644), and precision (92.8%), together with the lowest FAR (7.2%). These results indicate a trade-off between detection performance and deployment efficiency, and therefore parameter count, FLOPs, and measured FPS should be considered jointly when evaluating the models.
In terms of false-alarm suppression, Ghost-YOLOv8-SF achieves a FAR of 7.2% in the benchmark comparison, compared with 12.4% for YOLOv8, 19.9% for YOLOv10, 13.8% for Faster R-CNN, and 13.1% for SSD. In the ablation experiments, the complete configuration G4 achieves a FAR of 11.65%, compared with 14.8% for the baseline G0. These results indicate that the complete enhancement framework improves the suppression of false alarms under complex environmental interference. Because multiple enhancement modules are progressively integrated in the ablation sequence, the improvement in FAR is interpreted as the combined effect of the complete framework rather than being attributed solely to the noise suppression gate. Among the benchmark models, YOLOv10 has a false positive rate of 19.9%, Faster R-CNN has 13.8%, and SSD has 13.1%, all of which are significantly higher than that of Ghost-YOLOv8-SF. This indicates that the model can effectively resist interferences such as low light, dust, and water stains, maintaining stable detection accuracy in complex tunnel environment scenarios: (a) multiple cracks under normal lighting; (b) thin-elongated cracks under weak light; (c) small cracks covered by dust; (d) cracks interfered by water stains; (e) cracks under alternating light-and-dark near tunnel portals; (f) fractures under multiple superimposed interferences. Key analysis regions including faint cracks, bifurcations and background-interference zones are annotated in each sub-plot. Quantitative detection performance for YOLOv8, YOLOv10, Faster R-CNN and SSD baseline models is reported in Table 2.
6. Conclusions
This study proposes Ghost-YOLOv8-SF for real-time detection of highway tunnel lining cracks under complex environmental conditions. The proposed framework incorporates WaveletLikeConv for preserving high-frequency crack details, ElongatedConv for adapting to elongated crack morphology, a noise suppression gate for reducing irrelevant background responses, and a GhostNet V2-based lightweight reconstruction strategy for balancing feature representation and computational efficiency. These modules jointly improve the model’s ability to represent small and elongated cracks under complex tunnel conditions.
Experimental results demonstrate that Ghost-YOLOv8-SF achieves an mAP50 of 0.915, an mAP50-95 of 0.644, and a precision of 92.8%, which are the highest values among the compared benchmark models, while obtaining the lowest FAR of 7.2%. Compared with the original YOLOv8, the proposed model improves mAP50 from 0.863 to 0.915 and mAP50-95 from 0.533 to 0.644. However, its parameter count and computational load increase from 25.86 M and 79.1 G FLOPs to 28.26 M and 91.5 G FLOPs, respectively. Therefore, the proposed model should be interpreted as providing a favorable trade-off between detection accuracy, false-alarm suppression, robustness, and computational cost rather than achieving uniform improvement across all performance metrics.
Despite these improvements, several limitations remain. Detection performance may still be affected by extreme illumination conditions and crack textures that are highly similar to the lining background. Future work will focus on further improving deployment efficiency through model pruning and quantization, integrating multimodal information for more comprehensive crack characterization, and exploring semi-supervised learning to reduce annotation costs and improve adaptability to complex tunnel environments.
Author Contributions
Conceptualization, Y.D. and S.W.; methodology, Y.D.; software, Y.D.; validation, Y.D., S.W., G.L.; formal analysis, Y.D.; investigation, Y.D.; data curation, G.L.; writing—original draft preparation, Y.D.; writing—review and editing, S.W.; visualization, Y.D.; supervision, S.W.; project administration, S.W.; funding acquisition, S.W. All authors have read and agreed to the published version of the manuscript.
Funding
This research was funded by the National Natural Science Foundation of China, grant number 52178398.
Data Availability Statement
Part of the experimental data is derived from the public Mendeley dataset “Concrete Crack Images for Classification” [17], which is available at https://data.mendeley.com/datasets/5y9wdsg2zt/2 (accessed on 28 August 2025). The self-collected tunnel-lining crack field images are not publicly released because of engineering project confidentiality and ongoing related research. Representative visual samples of self-collected complex-condition crack images can be observed in Figure 7a–f. Qualified researchers may submit formal data-access requests to the corresponding author via email; access will be granted upon project-relevant authorization approval.
Acknowledgments
The authors are grateful to the reviewer for their comments which improved the paper.
Conflicts of Interest
Author Yiwen Du is affiliated with Southwest Jiaotong University. Author Guanlin Li was employed by the company Guizhou Xinsiwei Technology Co., Ltd. Author Shimin Wang is affiliated with the School of Civil Engineering, Southwest Jiaotong University. All authors declare that, apart from the employment relationship disclosed above, they have no other commercial or financial relationships that could be construed as a potential conflict of interest.
Abbreviations
The following abbreviations are used in this manuscript:
| CNN | Convolutional Neural Network |
| Ghost Net | Ghost Neural Network |
| FPS | Frames Per Second |
| FLOPs | Floating-Point Operations |
| DFC | Dynamic Feature Compensation |
| NMS | Non-Maximum Suppression |
References
- Zhou, Z.; Li, S.; Yan, L.; Zhang, J.; Zheng, Y.; Yang, H. Intelligent recognition of tunnel lining defects based on deep learning: Methods, challenges and prospects. Eng. Fail. Anal. 2025, 170, 109332. [Google Scholar] [CrossRef] [Scilit]
- Liao, X.; Yan, Q.; Xiang, C.; Qiao, M.; Li, B.; Zhang, C. Crack severity assessment of shield tunnel segments based on DFOS strain measurements assisted by deep learning. Measurement 2025, 256, 118332. [Google Scholar] [CrossRef] [Scilit]
- Pan, Z.; Zhang, X.; Jiang, Y.; Li, B.; Golsanami, N.; Su, H.; Cai, Y. High-precision segmentation and quantification of tunnel lining crack using an improved DeepLabV3+. Undergr. Space 2025, 22, 96–109. [Google Scholar] [CrossRef] [Scilit]
- Duan, S.; Zhang, M.; Qiu, S.; Xiong, J.; Zhang, H.; Li, C.; Jiang, Q.; Kou, Y. Tunnel lining crack detection model based on improved YOLOv5. Tunn. Undergr. Space Technol. 2024, 147, 105713. [Google Scholar] [CrossRef] [Scilit]
- Ouyang, A.; Di Murro, V.; Daakir, M.; Osborne, J.A.; Li, Z. From pixel to infrastructure: Photogrammetry-based tunnel crack digitalization and documentation method using deep learning. Tunn. Undergr. Space Technol. 2025, 155, 106179. [Google Scholar] [CrossRef] [Scilit]
- Gehri, N.; Mata-Falcón, J.; Kaufmann, W. Automated crack detection and measurement based on digital image correlation. Constr. Build. Mater. 2020, 256, 119383. [Google Scholar] [CrossRef] [Scilit]
- Yang, K.; Bao, Y.; Li, J. Deep learning-based YOLO for crack segmentation and measurement in metro tunnels. Autom. Constr. 2024, 168, 105818. [Google Scholar] [CrossRef] [Scilit]
- Ou, J.; Zhang, J.; Li, H.; Duan, B. An improved YOLOv10-based lightweight multi-scale feature fusion model for road defect detection and its applications. Adv. Eng. Softw. 2025, 208, 103976. [Google Scholar] [CrossRef] [Scilit]
- Li, Z.; Xiong, F.; Huang, B.; Li, M.; Xiao, X.; Ji, Y.; Xie, J.; Liang, A.; Xu, H. MGD-YOLO: An enhanced road defect detection algorithm based on multi-scale attention feature fusion. Comput. Mater. Contin. 2025, 84, 5613–5635. [Google Scholar] [CrossRef] [Scilit]
- Zhang, L.; Yang, F.; Zhang, Y.D.; Zhu, Y.J. Road crack detection using deep convolutional neural network. In Proceedings of the 2016 IEEE International Conference on Image Processing (ICIP), Phoenix, AZ, USA, 25–28 September 2016; IEEE: Piscataway, NJ, USA, 2016; pp. 3708–3712. [Google Scholar] [CrossRef] [Scilit]
- Li, S.; Li, S.; Li, H.; Zhou, Z. Data enhancement and feature extraction optimization in tunnel surface defect detection: Combining DCGAN-RC and Repvit-YOLO methods. Eng. Fail. Anal. 2025, 177, 109715. [Google Scholar] [CrossRef] [Scilit]
- Fan, Z.; Chen, B.; Wang, Z.; Gou, X.; Miao, Y.; Li, H.; Feng, Z.; Lu, Y. Defects recognition in on-site GPR images of mountain tunnel linings based on YOLOv8N model. Case Stud. Constr. Mater. 2025, 23, e05196. [Google Scholar] [CrossRef] [Scilit]
- Zhang, C.; Chen, X.; Liu, P.; He, B.; Li, W.; Song, T. Automated detection and segmentation of tunnel defects and objects using YOLOv8-CM. Tunn. Undergr. Space Technol. 2024, 150, 105857. [Google Scholar] [CrossRef] [Scilit]
- Zhou, Z.; Zhou, S.; Li, S.; Li, H.; Yang, H. Tunnel lining quality detection based on the YOLO-LD algorithm. Constr. Build. Mater. 2024, 449, 138240. [Google Scholar] [CrossRef] [Scilit]
- Xu, H.; Wang, M.; Liu, C.; Li, F.; Xie, C. Automatic detection of tunnel lining crack based on mobile image acquisition system and deep learning ensemble model. Tunn. Undergr. Space Technol. 2024, 154, 106124. [Google Scholar] [CrossRef] [Scilit]
- Zou, Y.; Liu, S. Small object detection algorithm based on improved YOLOv10 for traffic sign. Transp. Res. Interdiscip. Perspect. 2025, 32, 101501. [Google Scholar] [CrossRef] [Scilit]
- Özgenel, Ç.F.; Sorguç, A.G. Performance comparison of pretrained convolutional neural networks on crack detection in buildings. In Proceedings of the 35th International Symposium on Automation and Robotics in Construction (ISARC 2018), Berlin, Germany, 20–25 July 2018; pp. 693–700. [Google Scholar] [CrossRef] [Scilit]

Disclaimer/Publisher’s Note: The statements, opinions and data contained in all publications are solely those of the individual author(s) and contributor(s) and not of MDPI and/or the editor(s). MDPI and/or the editor(s) disclaim responsibility for any injury to people or property resulting from any ideas, methods, instructions or products referred to in the content. |
© 2026 by the authors. Licensee MDPI, Basel, Switzerland. This article is an open access article distributed under the terms and conditions of the Creative Commons Attribution (CC BY) license.