


Abstract
This study presents a full-scale experimental and numerical investigation of the flexural behaviour of a newly developed side intermeshed steel connection (side ISC), with particular emphasis on its implementation in and comparative performance between built-up and standard rolled beam sections. Four full-scale beam specimens incorporating the side ISC at mid-span were tested under monotonic pure-bending loading representative of gravity load effects. Global load–deflection behaviour and local deformation were measured to investigate the connection response and load transfer mechanisms. The standard rolled beams reached yield loads corresponding to approximate yield load, whereas the built-up beams reached approximately 83%, with the differences attributed to material strength, fabrication effects, and manufacturing tolerances. The specimens exhibited ductile behaviour, with failure concentrated in the lower side plates. Nonlinear finite element models of the four specimens were developed and showed good agreement with the experimental global load–displacement response and local deformation behaviour. Within the limited scope of four monotonic pure bending tests, the results demonstrate the potential of the intermeshed connection concept for demountable steel construction. However, further testing, including repeated assembly, disassembly, component replacement, and reloading, is required to establish its reusable performance.
1. Introduction
In the last few decades, many alternatives to traditional steel connections have been developed, especially after the 1994 Northridge earthquake when some moment-resisting connections experienced unexpected brittle fracture at the welded beam-flange-to-column-flange joints [1,2,3]. In response a number of new connections entered the public domain including the reduced beam section connections (RBS) [4,5], bolted flange plate connections (BFP) [6,7] and welded unreinforced flange connections (WUF-W) [8,9,10]. Over the years, several proprietary connections have also been developed such as the cast bolted bracket (CBB) moment connection [11,12], the ConXtech ConXL moment connection [13,14], the SidePlate moment connection [15,16] and the Simpson Strong-Tie (SST) Strong Frame moment connection [17,18]. Despite the wide range of alternatives, market penetration of these connection types has remained limited. Furthermore, structural steel has yet to fully benefit from recent developments in advanced manufacturing such as advanced computer controlled volumetric cutting to devise new shapes and connection types that could accelerate structural steel erection by avoiding or minimising the use of supplementary materials and methods.
Recent research has continued to advance the performance and practical applicability of steel structural systems through improved material utilisation, member configurations, and design methodologies. In a previous study, researchers [19] investigated hybrid stainless-steel girders incorporating high-strength stainless steel flanges and normal strength stainless steel webs, demonstrating the potential of hybrid configurations to improve structural performance and durability while reducing material costs. In another study researchers [20] investigated welded stainless-steel I beams with web openings under localised loading and developed improved design provisions based on extensive numerical analyses. Such developments demonstrate the continuing effort to improve the efficiency, durability, and engineering applicability of steel structural systems. Nevertheless, improving member-level performance alone does not fully address the growing requirement for circular construction, in which structural components should ideally be recoverable and reusable at the end of a building’s first service cycle.
Increasing attention has been directed towards damage-controlled steel connections incorporating replaceable structural fuses. These systems are designed to concentrate inelastic deformation within predetermined sacrificial components, thereby protecting the primary structural members and facilitating rapid post-event repair. In a recent study [21], replaceable buckling-restrained fuse plates have been introduced in steel beam-to-column joints, where experimental investigations demonstrated that plastic damage could be effectively concentrated within the fuse plates and that repaired connections could recover seismic performance comparable to that of the original joints. Similar concepts employing replaceable slit-plate fuses have also been investigated for moment-resisting frames to enhance ductility and energy dissipation while limiting damage to the main structural components [22]. More recently, Atar [23] introduced a sleeve-fuse mechanism for bolted end-plate connections, in which a steel sleeve positioned within the bolted assembly acts as a sacrificial component and modifies the connection response without requiring intentional weakening of the beam. Subsequent experimental and numerical investigations demonstrated that appropriately designed replaceable sleeve fuses can substantially increase connection deformation capacity and energy dissipation while preserving the initial stiffness and strength of conventional configurations [24]. Recent experimental work on bolt-sleeve devices has further confirmed that the sleeve mechanism can more than double the deformation capacity of bolted steel connections and increase energy dissipation by up to 80% [25]. Older studies [26,27,28] showed that the sleeve device significantly increases the rotational capacity of the connection without undermining its load-bearing capacity. Hysteresis evaluations also showed that the system increases ductility and dissipation of energy by factors of three and four approximately compared to standard connection designs. Collectively, these studies demonstrate a growing shift towards connection concepts in which damage is deliberately localised within accessible and replaceable components, offering important benefits for structural resilience, repairability, and extension of the service life of primary steel members. Comparatively less attention has been given to connection systems designed specifically to facilitate rapid assembly and disassembly and, importantly, the recovery and direct reuse of the primary steel elements at the end of a structure’s service life.
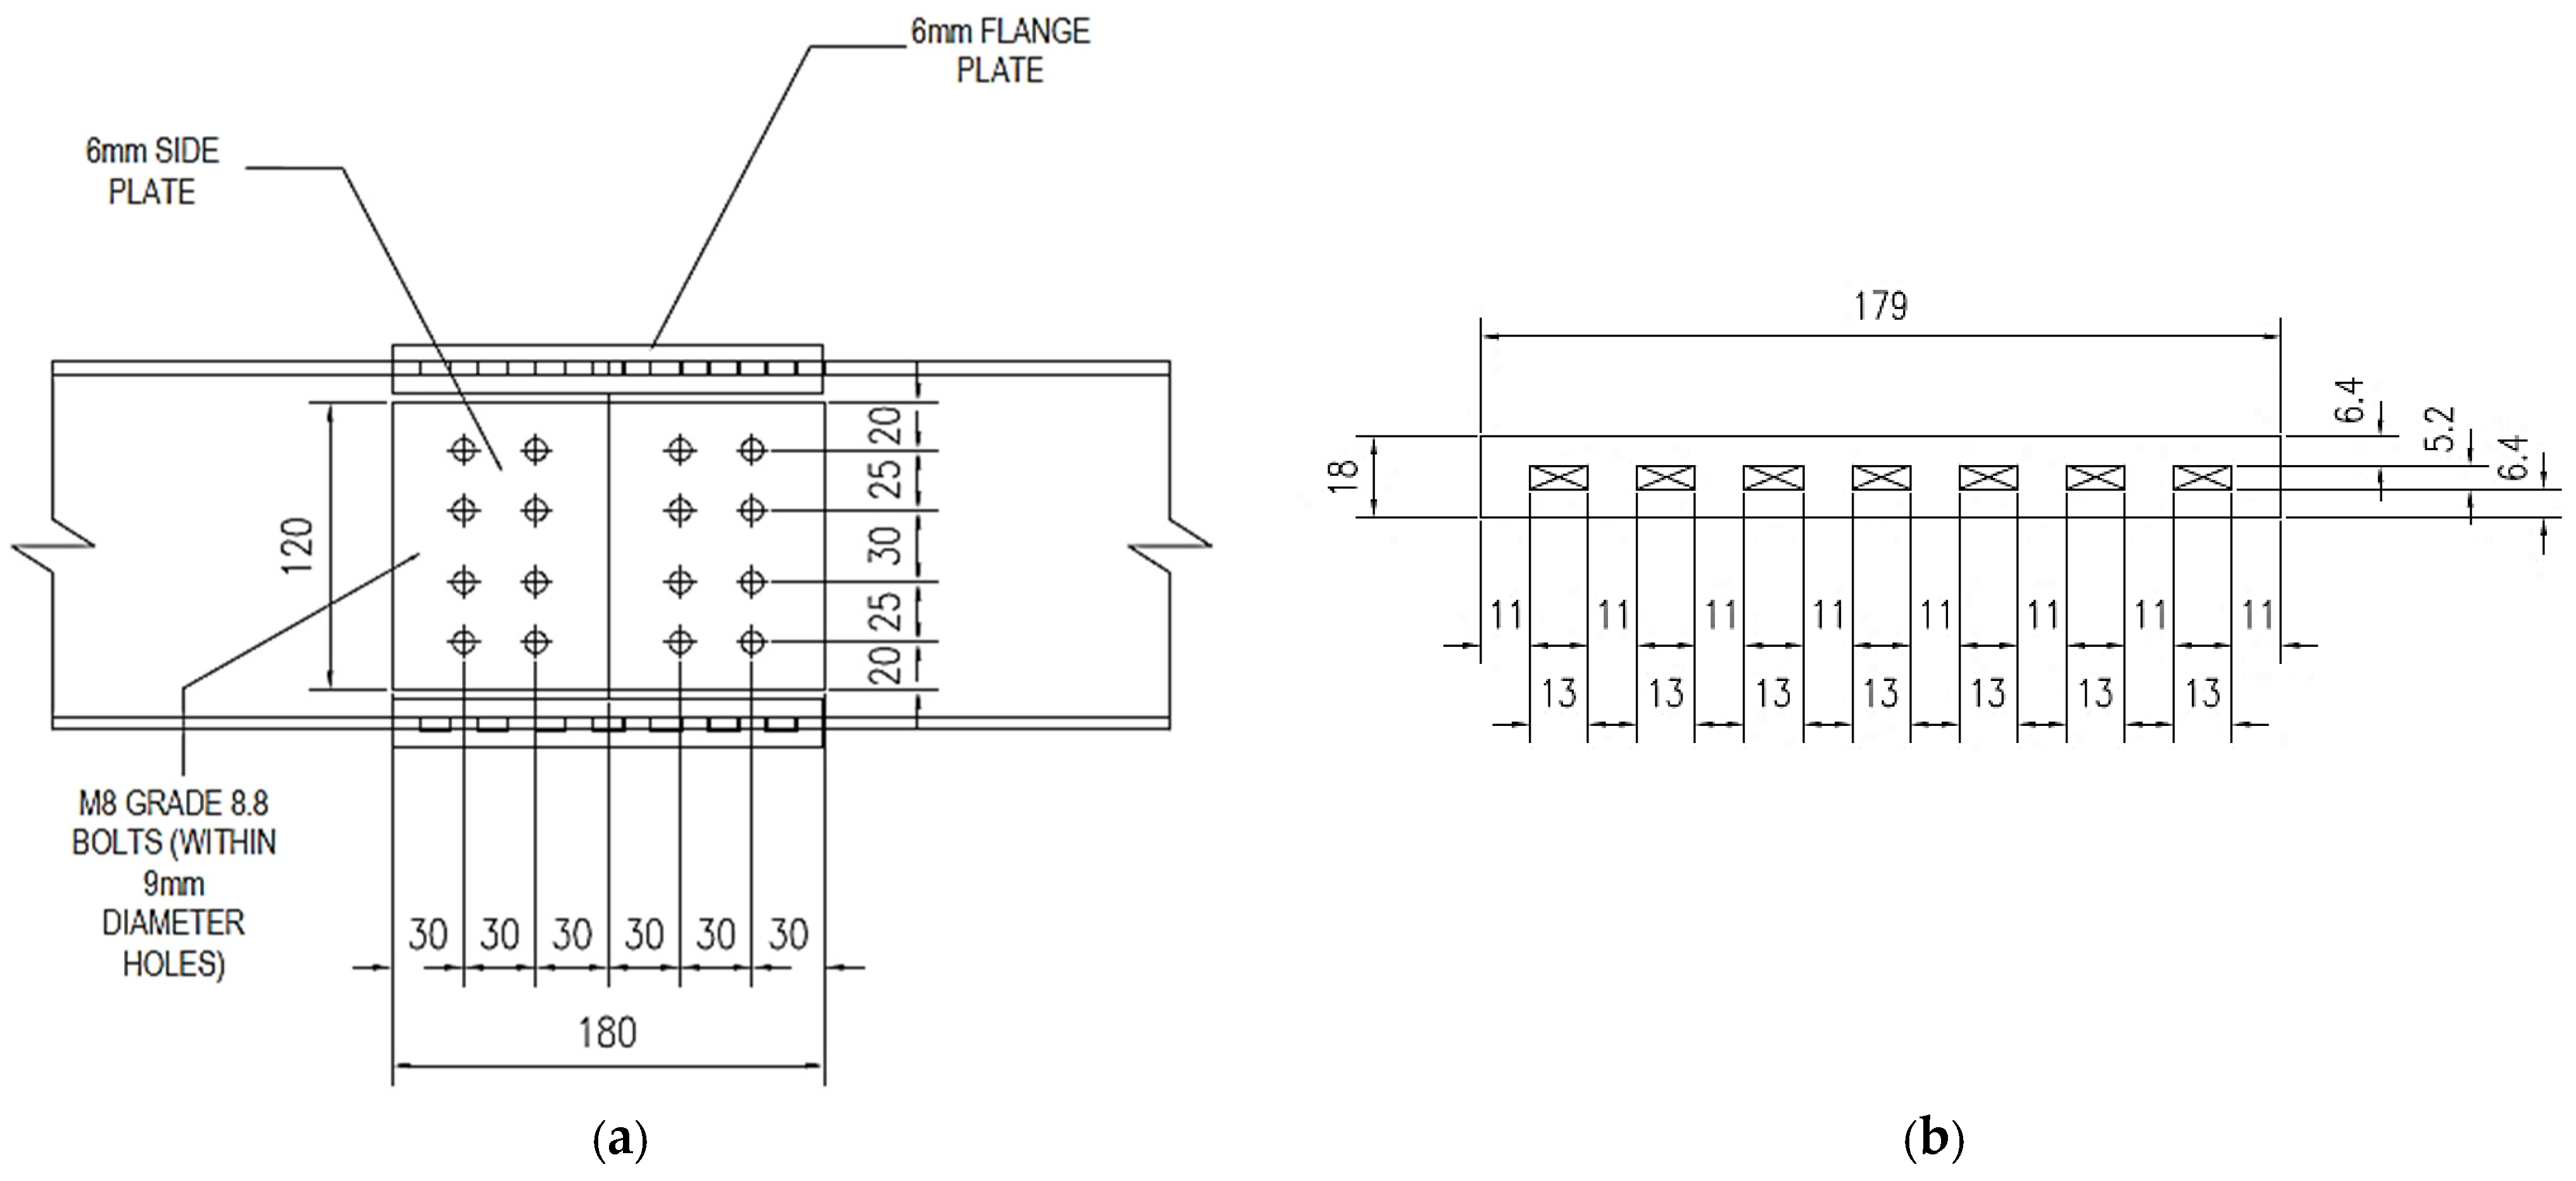
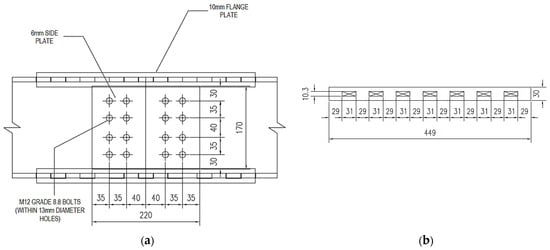
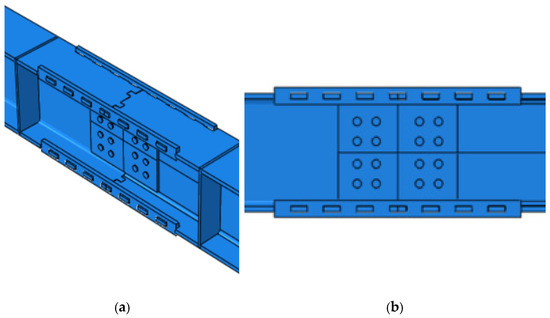
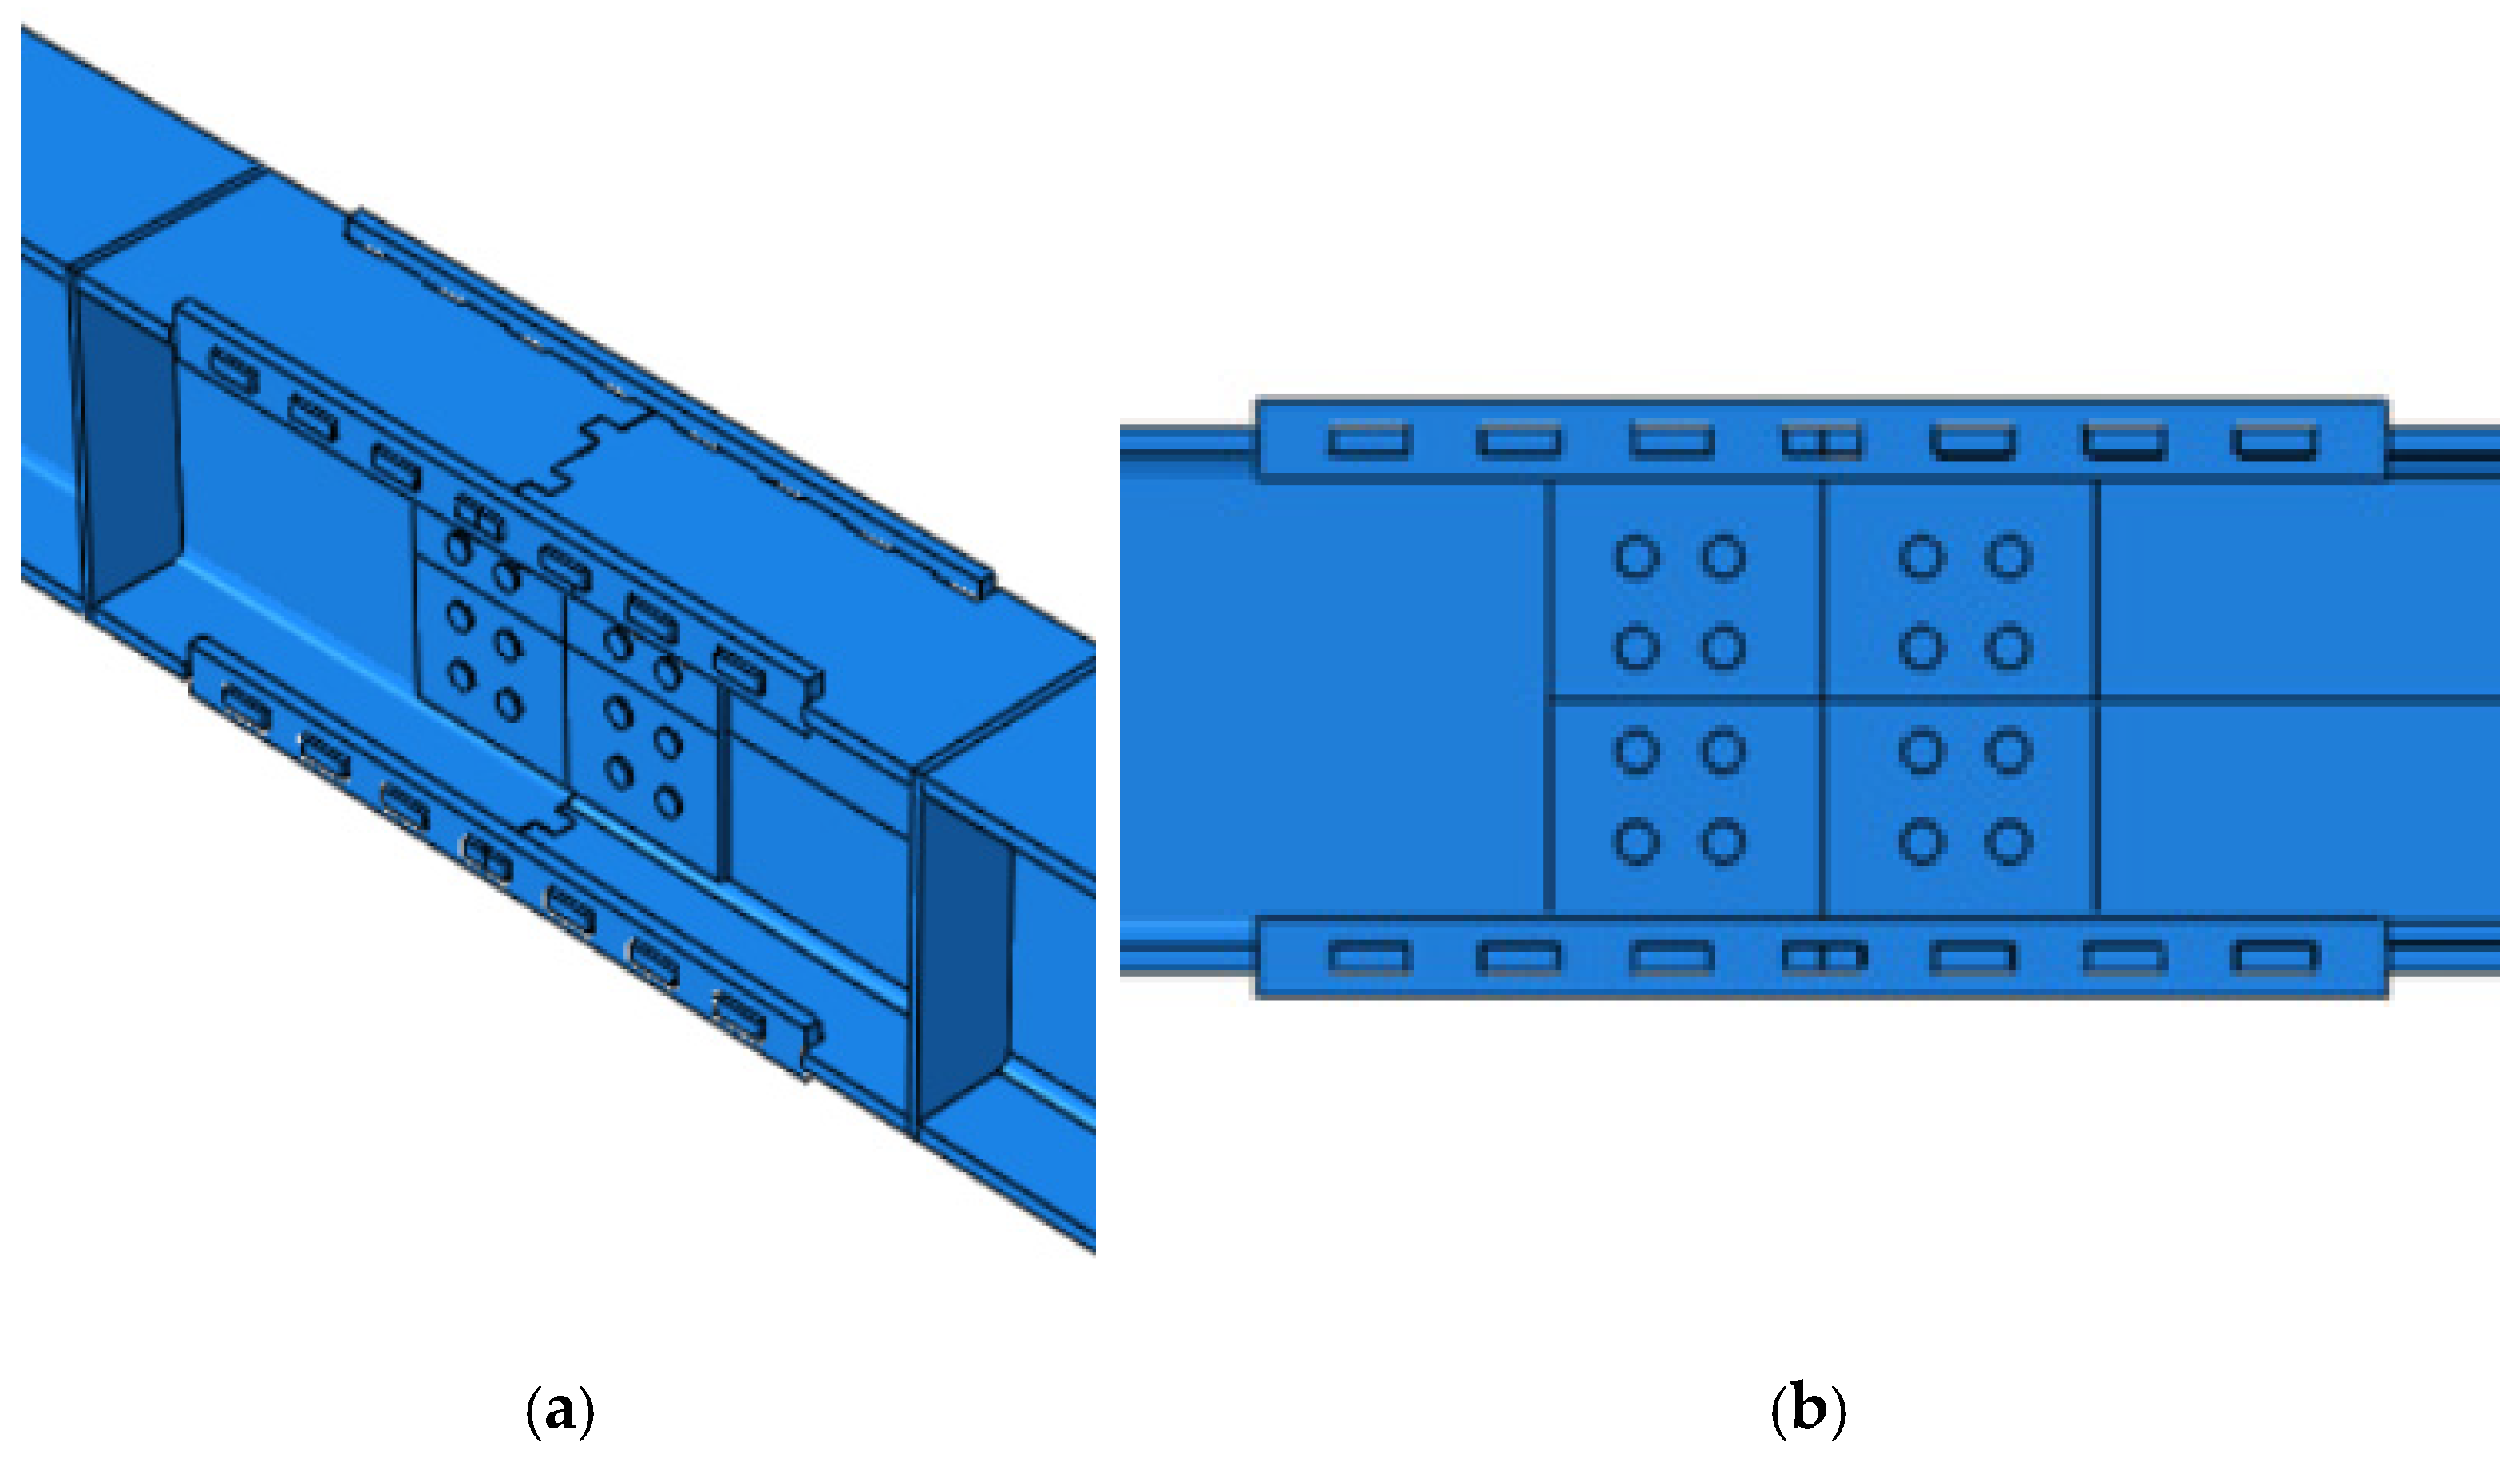
In order to address these limitations of the existing connection methods and achieve heightened steel element and material reuse, the Advanced Manufacturing for the Assembly of Structural Steel (AMASS) research team has developed the ‘’Intermeshed Steel Connections’’ (ISC) [29,30]. This class of ‘’snap together’’ or ‘’interlocking’’ steel connections are universal (beam–beam; beam–column; column–column). The ISC uses precisely shaped ends that mesh together to create a connection able to transfer force through common bearing surfaces. They introduce side plates at the top and bottom flanges, to transfer compressive and tensile forces resulting from bending moments. Teeth are cut along the flange edges, which allow side plates with matching holes to be slotted into position. The side plates can then be fixed in place with T-head bolts. Shear load transfer is achieved through bolted shear web plates, as shown in Figure 1 and Figure 2. These connection methods have many practical advantages over existing connections, since they could also facilitate fast assembly and disassembly of steel components and could be easily reused after the structure’s end of life by replacing the flange side plates and the shear web plates, as they are sacrificial.
Figure 1.
The intermeshed steel connection for built-up beams. (a) Side view. (b) Flange plate (elevation).
Figure 2.
The intermeshed steel connection for the standard beams. (a) Side view. (b) Flange plate (elevation).
Previously, researchers at the University of Minnesota conducted an experimental testing programme to examine the behaviour of intermeshed connections under various loading conditions. Four full-scale specimens (including a pure moment and three combined moment–shear loads) featuring intermeshed connections were designed to support gravity loads in steel frame members. The specimens were fabricated using plasma cutting for the rolled sections and waterjet cutting for the side angles. Those test results established that the ISC can provide sufficient bending moment and shear force through direct bearing between individual components. In several cases, the load-carrying capacity of the tested samples exceeded the target design load by as much as 167% (in part due to steel coupon tests showing higher steel capacities than indicated by the manufacturer’s rating) [31].
Building upon previous full-scale investigations of intermeshed steel connections, the present study investigates a newly developed side intermeshed steel connection (side ISC) geometry through experimental and numerical analyses. The specific novelty of this work lies in the proposed side ISC configuration and in the systematic comparison of its structural behaviour when incorporated into built-up and standard rolled steel beams, thereby assessing the influence of beam type on the connection response. Four full-scale beam specimens were designed and tested under controlled loading conditions to evaluate the structural response of the connection when subjected to pure bending. The experimental programme focused on capturing both global and local behaviour through load–displacement measurements and strain measurements at critical locations of the connection. In parallel, detailed nonlinear finite element (FE) models were developed in Abaqus software to simulate the behaviour of the tested specimens and to provide further insight into the underlying mechanics of load transfer within the connection. The study aims to improve understanding of the structural performance of intermeshed steel connections and to assess their suitability for applications where dismantling and reuse are desirable.
2. Experimental Test Set-Up and Specimens
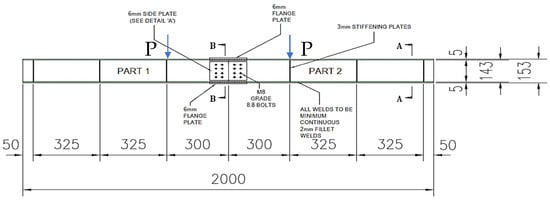
The experimental programme consisted of four tests (Test 1–4), two for the built-up and two for the standard (rolled) beam sections as per the test configuration shown in Figure 3. In all the tests, the side intermeshed steel connection (Side ISC) was located in a pure bending moment region at the mid-span of the beam. A pure flexural loading (with no shear force at the region of the connection) test was important since the side plates and the flange teeth were designed with a specific bending resistance.
Figure 3.
Experimental configuration for Tests 1–4. P indicates loading location.
In these experimental tests, S275JR steel beams were used. For the standard rolled beam sections, a UB 203 × 133 × 30 section was selected from commonly employed members based upon engineering judgement. Span lengths of 2 m were selected for the testing programme due to space testing limitations of the Dartec hydraulic actuator in the laboratory. The side intermeshed steel connections for the built-up and standard beams were designed according to the procedure described in the Appendix A and Appendix B, and detailed sketches were sent for fabrication using waterjet cutting equipment for the beam sections and for the side plates.
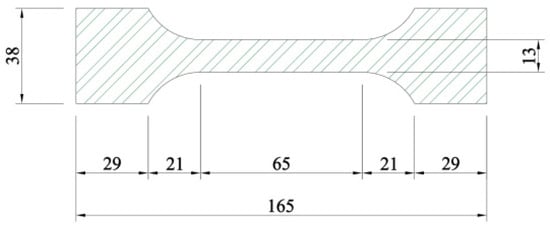
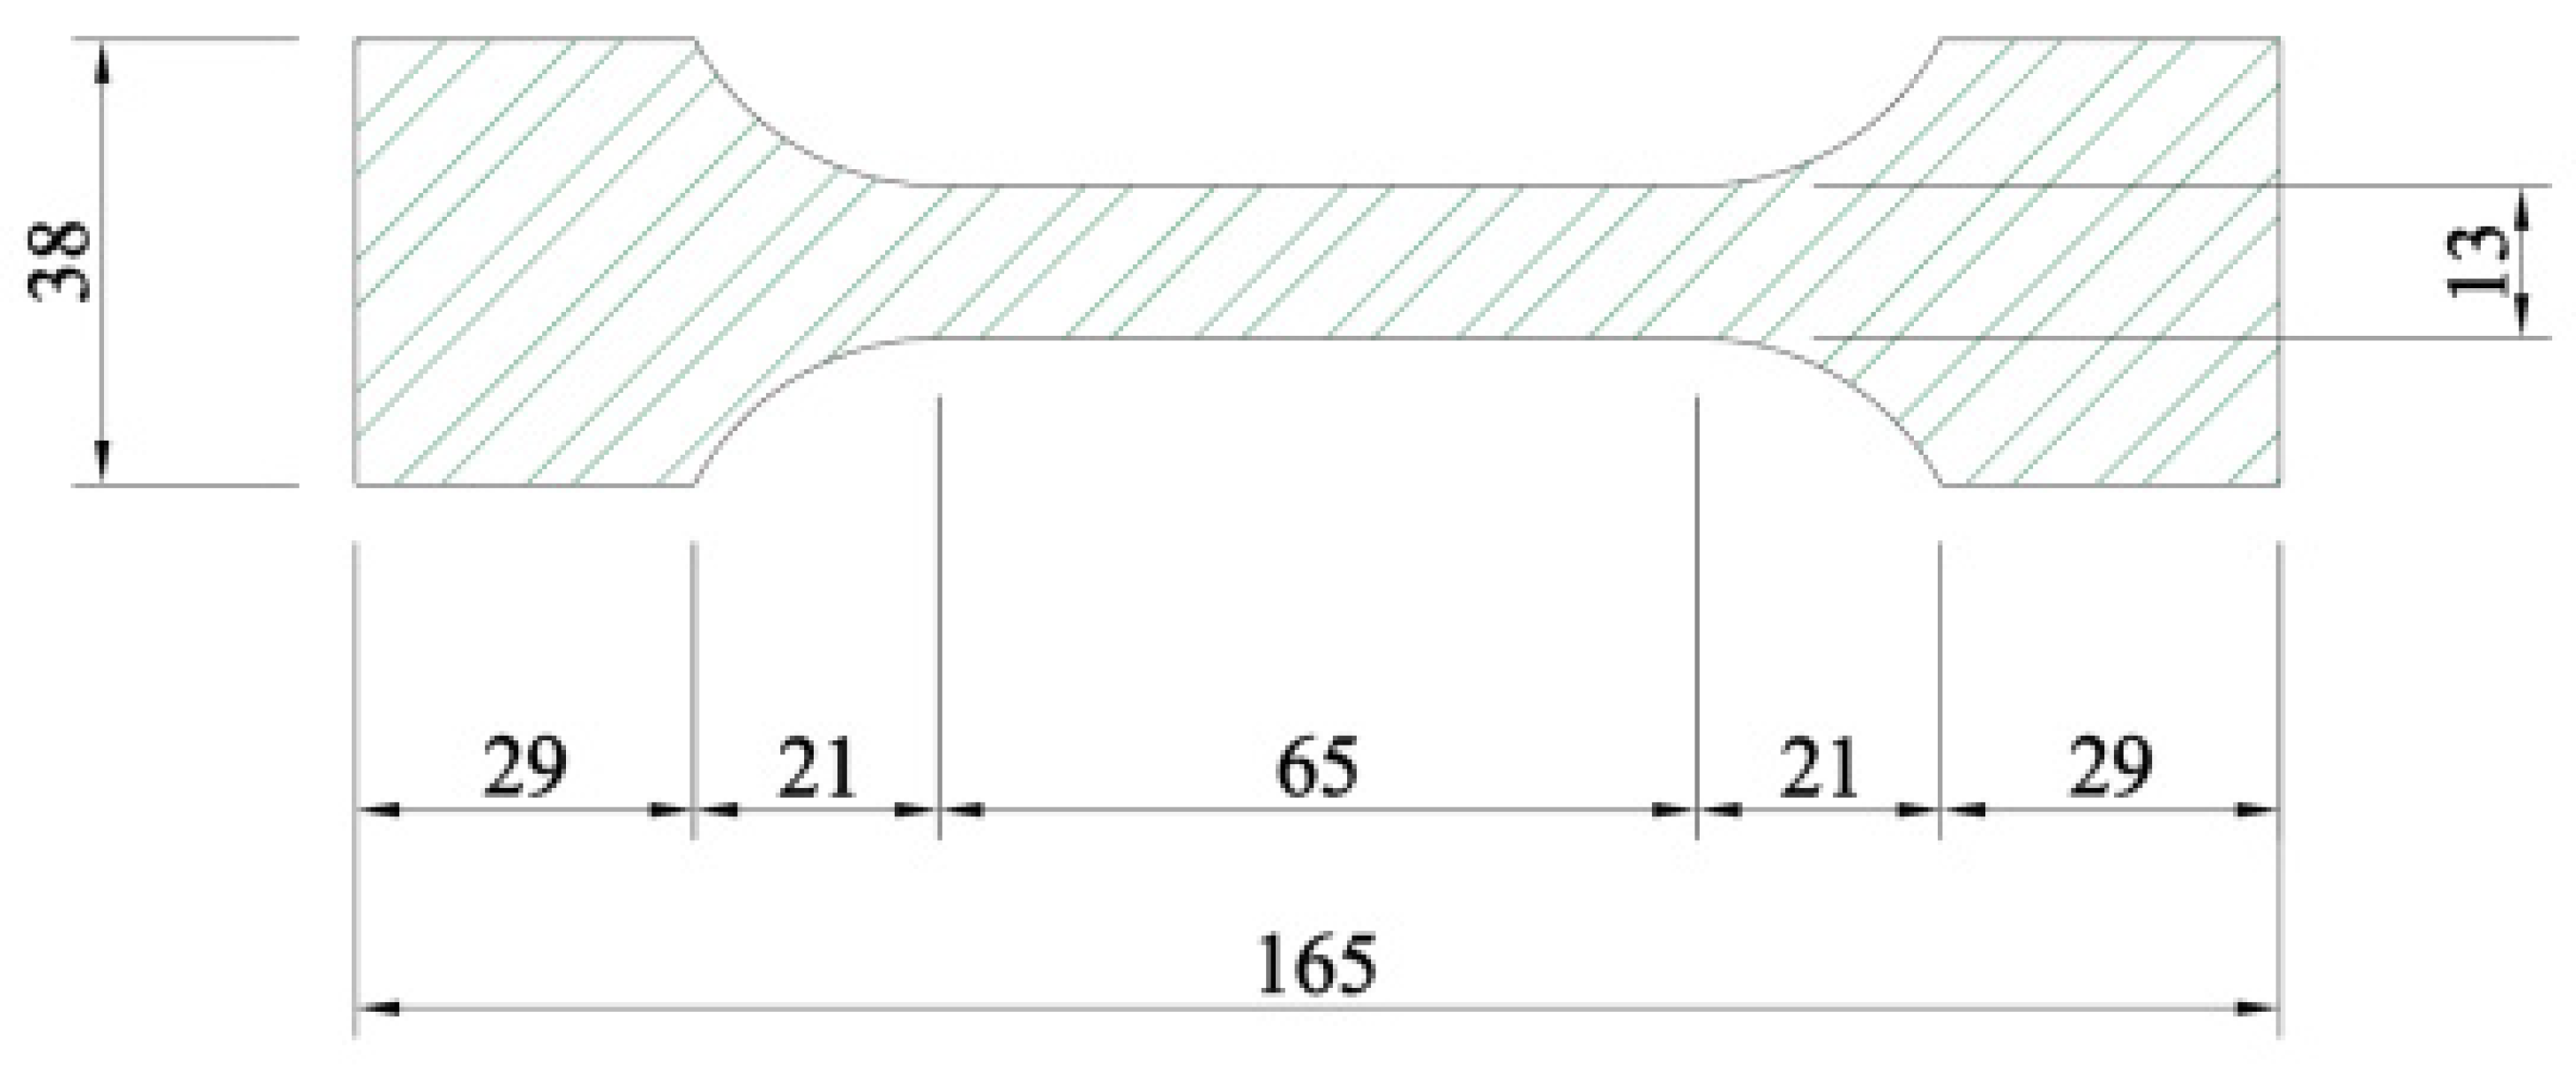
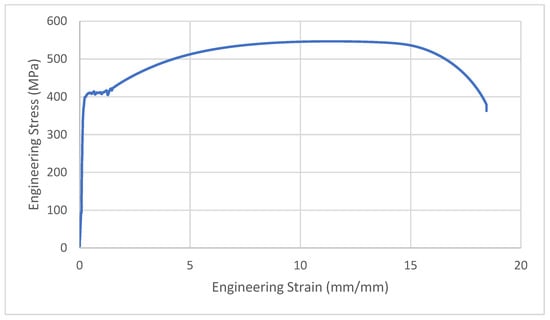
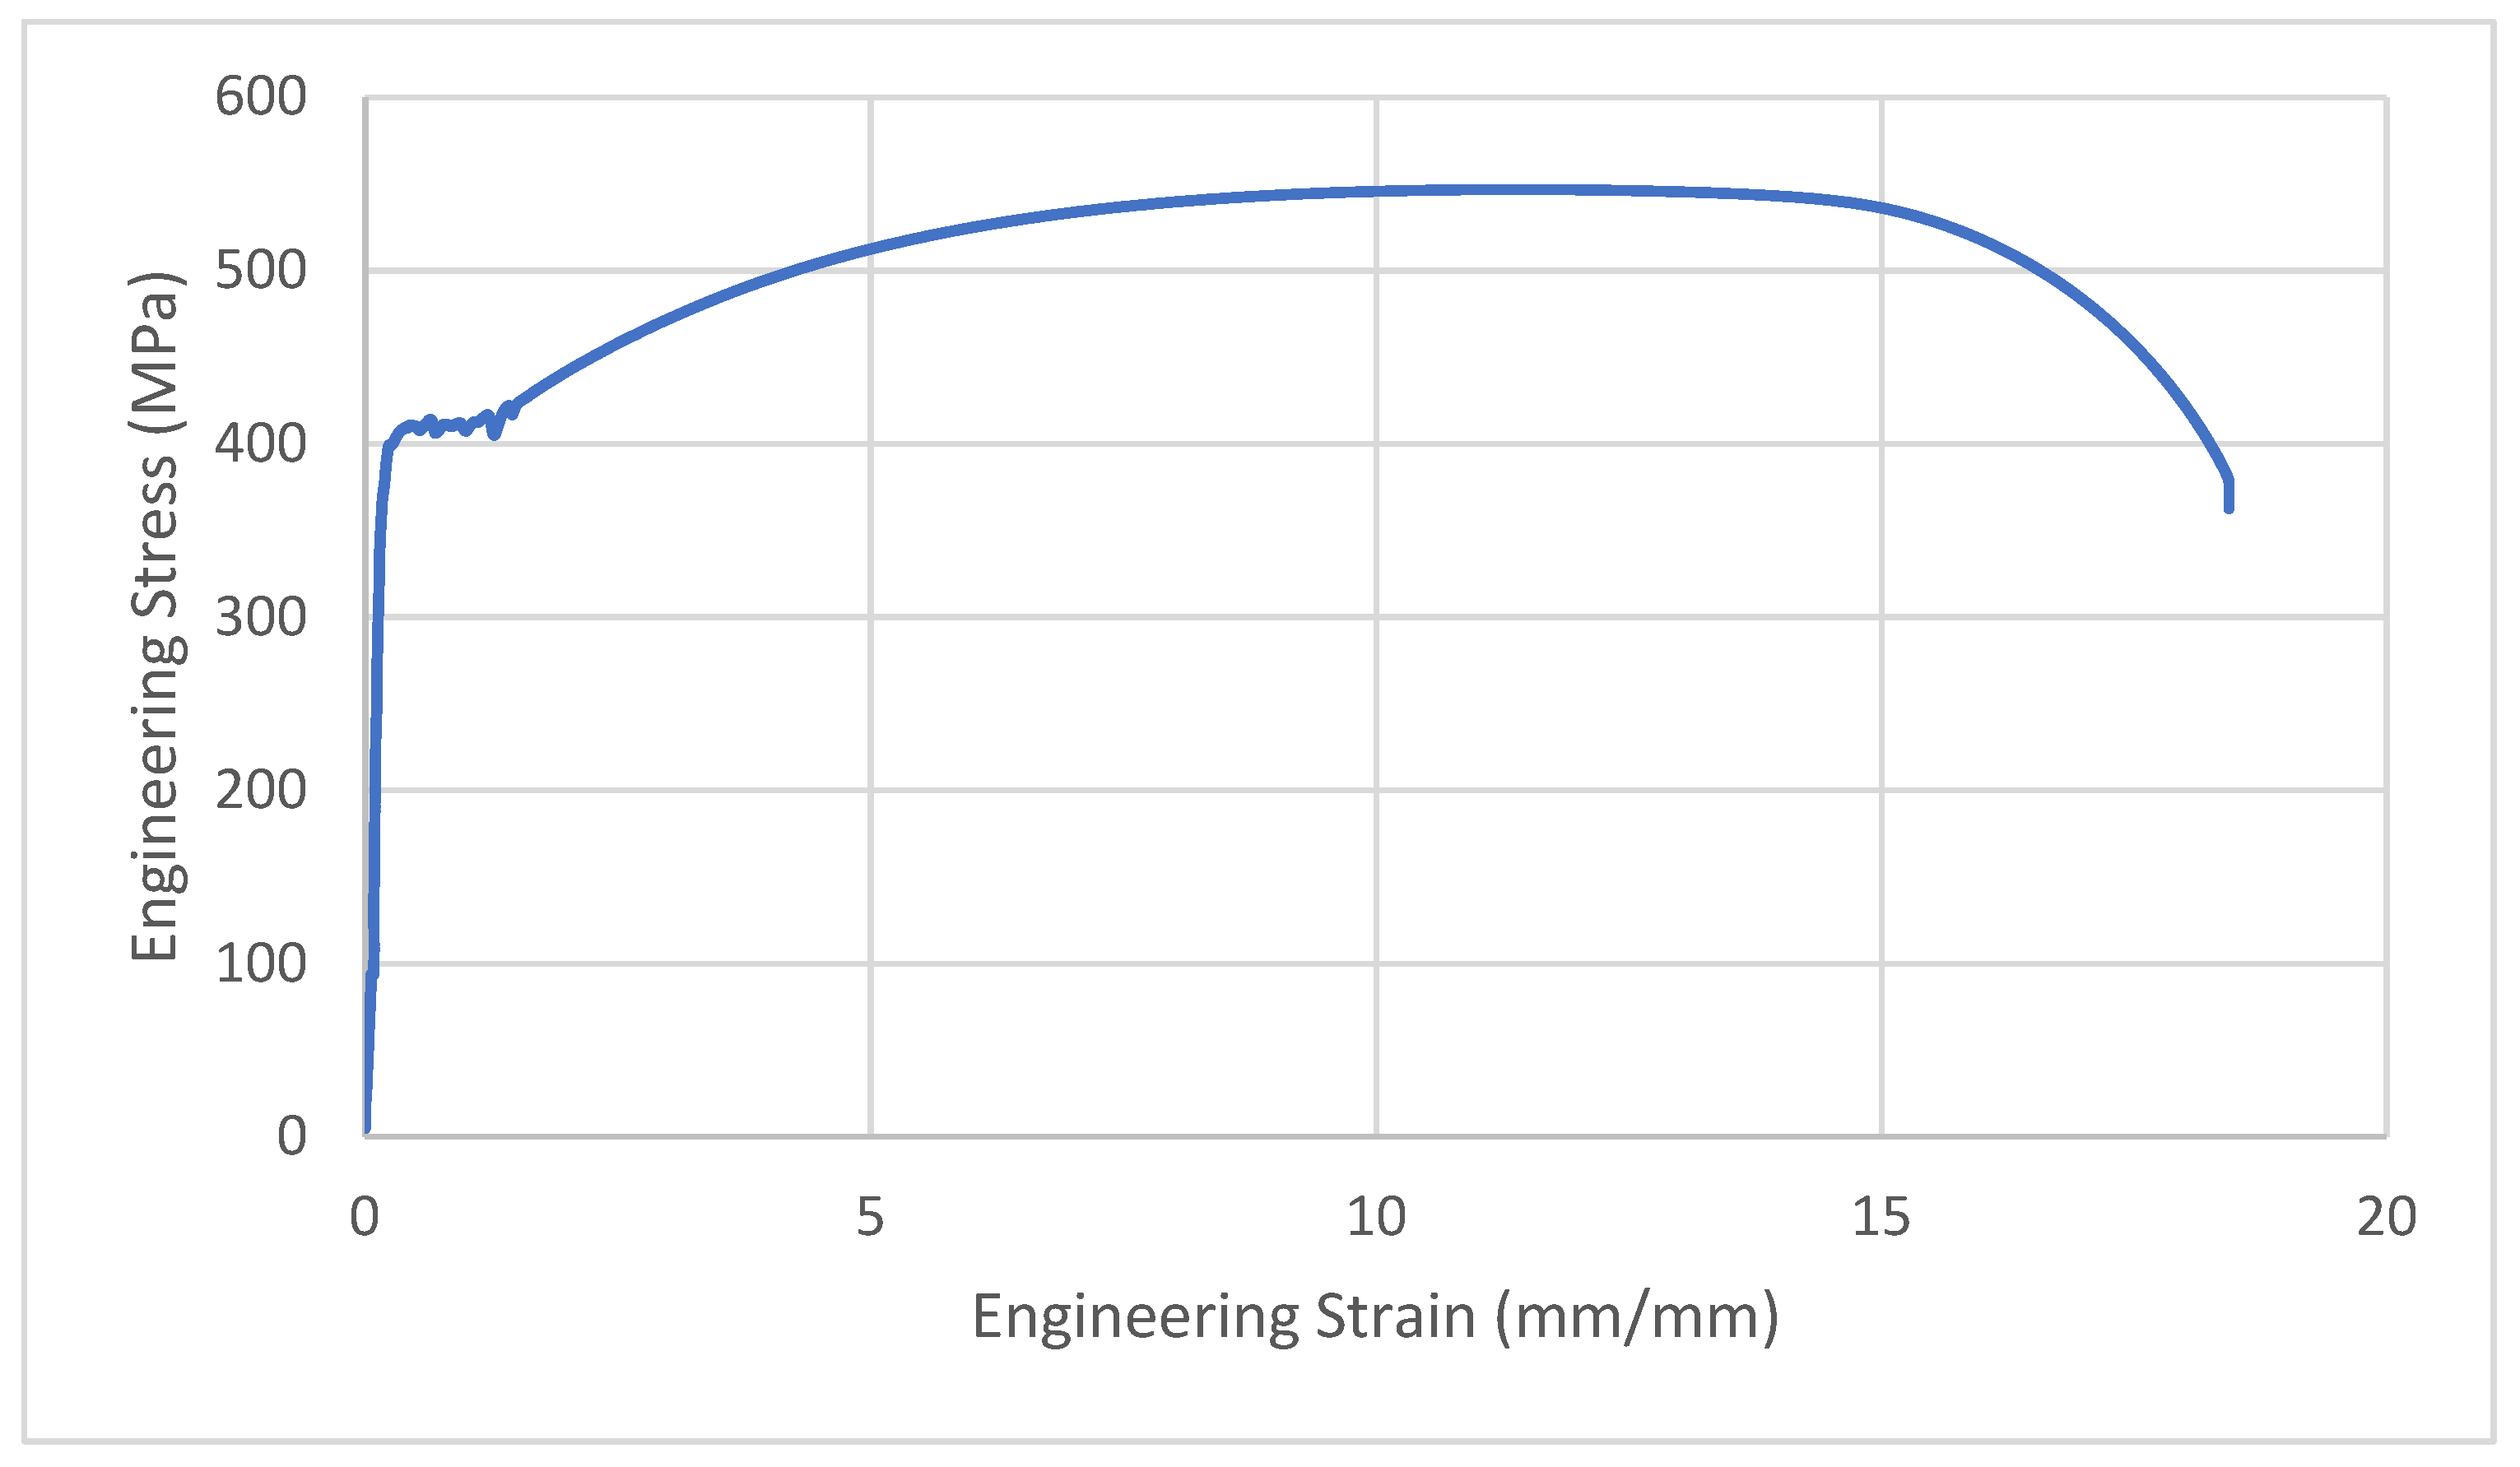
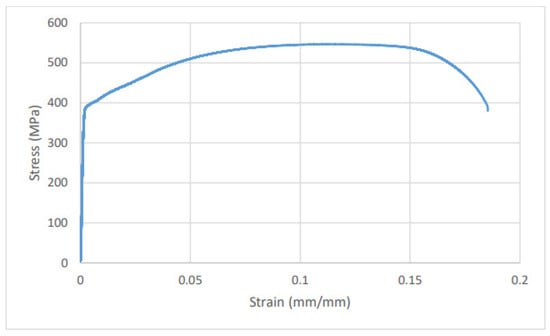
Tensile dog-bone tests on samples of the beams were performed to establish the basic material stress–strain response (Figure 4) which utilised in the development of the numerical models. The tests were conducted in accordance with BS EN ISO 6892-1 [32]. The dimensions of the tensile samples are illustrated in Figure 4, and the results of material testing are presented in Table 1, with an example stress–strain curve presented in Figure 5.
Figure 4.
Dimensions of material tensile samples in mm.
Table 1.
Measured material properties from tensile tests.
Figure 5.
Engineering stress–strain curve of a dog-bone sample (T6) of 6mm thickness.
It should be noted that some Young’s modulus values in Table 1, obtained from the individual tensile coupon tests exhibited considerable scatter and were considered physically implausible for structural steel. These implausible values were therefore excluded from the determination of the representative average engineering stress–strain. Only tensile-test results providing a reliable and representative material response were considered when establishing the averaged material behaviour. Similarly, ‘N.A.’ indicates cases where a reliable yield stress could not be determined from the corresponding experimental stress–strain data, and these unavailable values were not included in determining the representative material properties used in the numerical analyses. This average engineering stress–strain curve obtained from the experiments was later converted to true stress, and true plastic strain, using the following equations:
where and are the average engineering stress and average engineering strain respectively and E is the average Young’s modulus adopted for the elastic material response. Accordingly, the plastic material data implemented in Abaqus were defined in terms of true stress and true plastic strain.
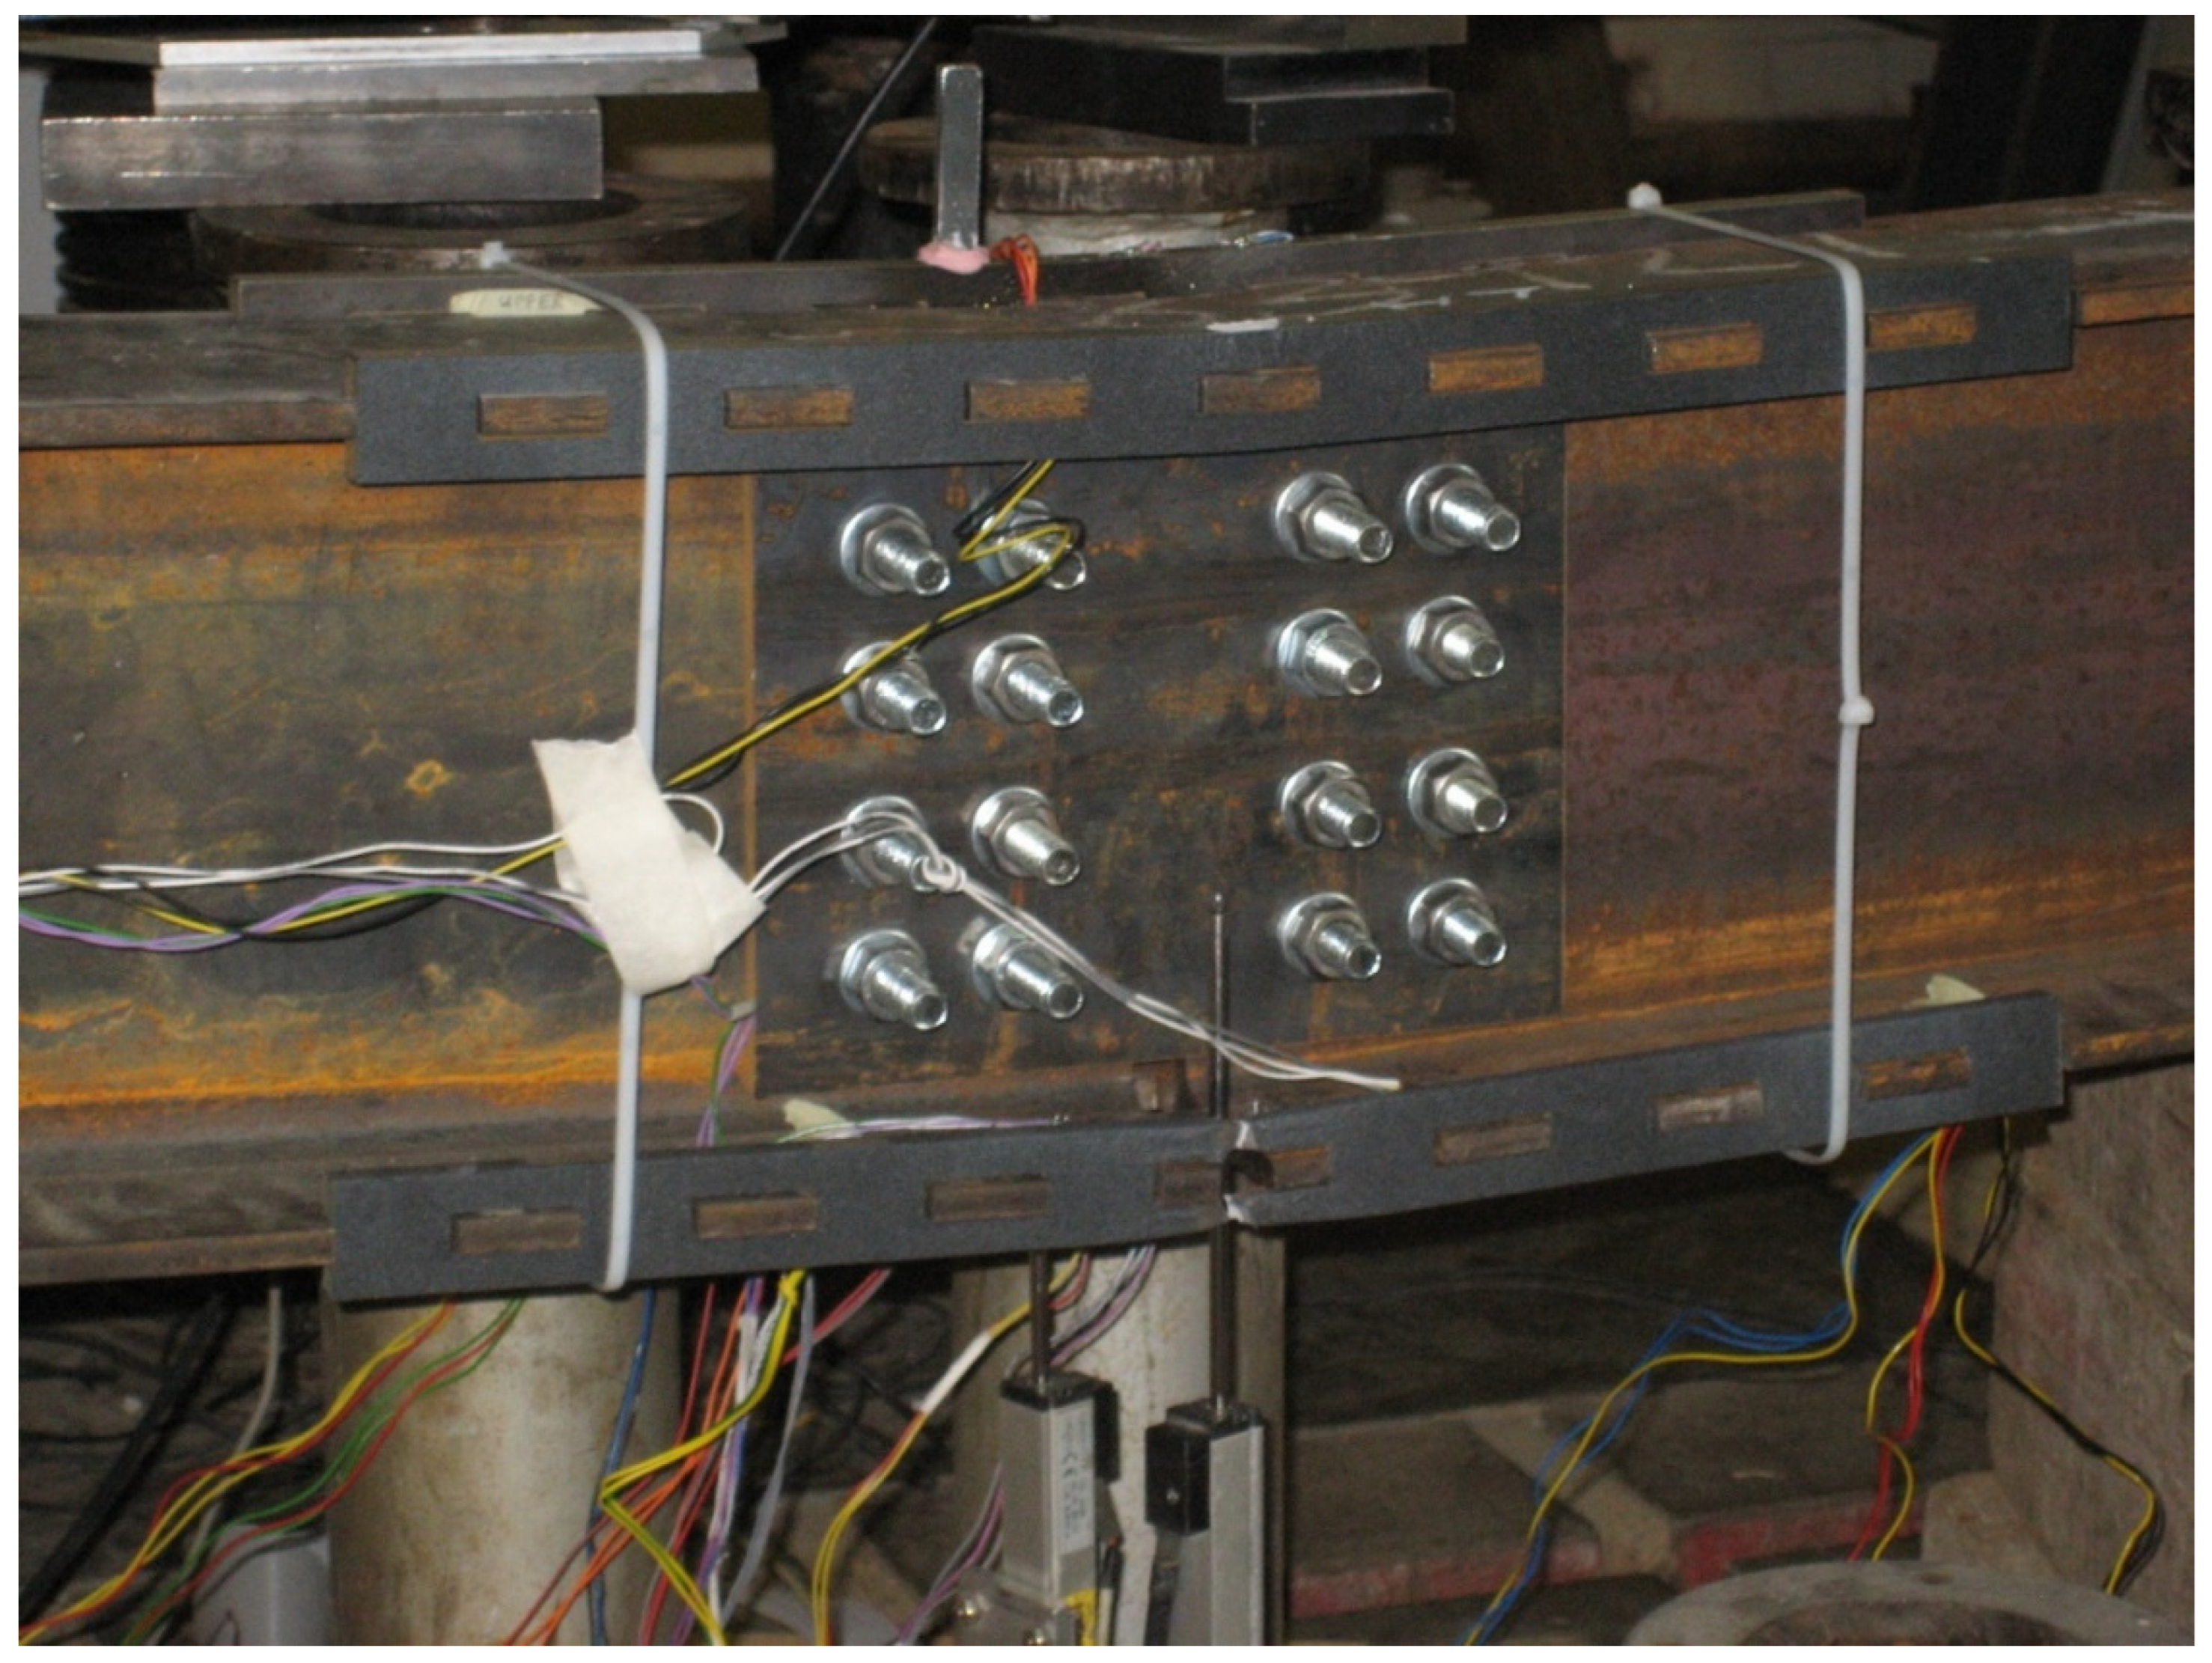
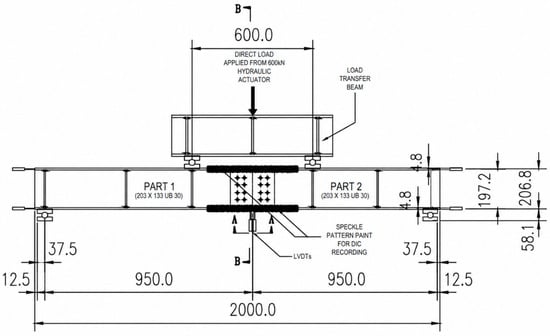
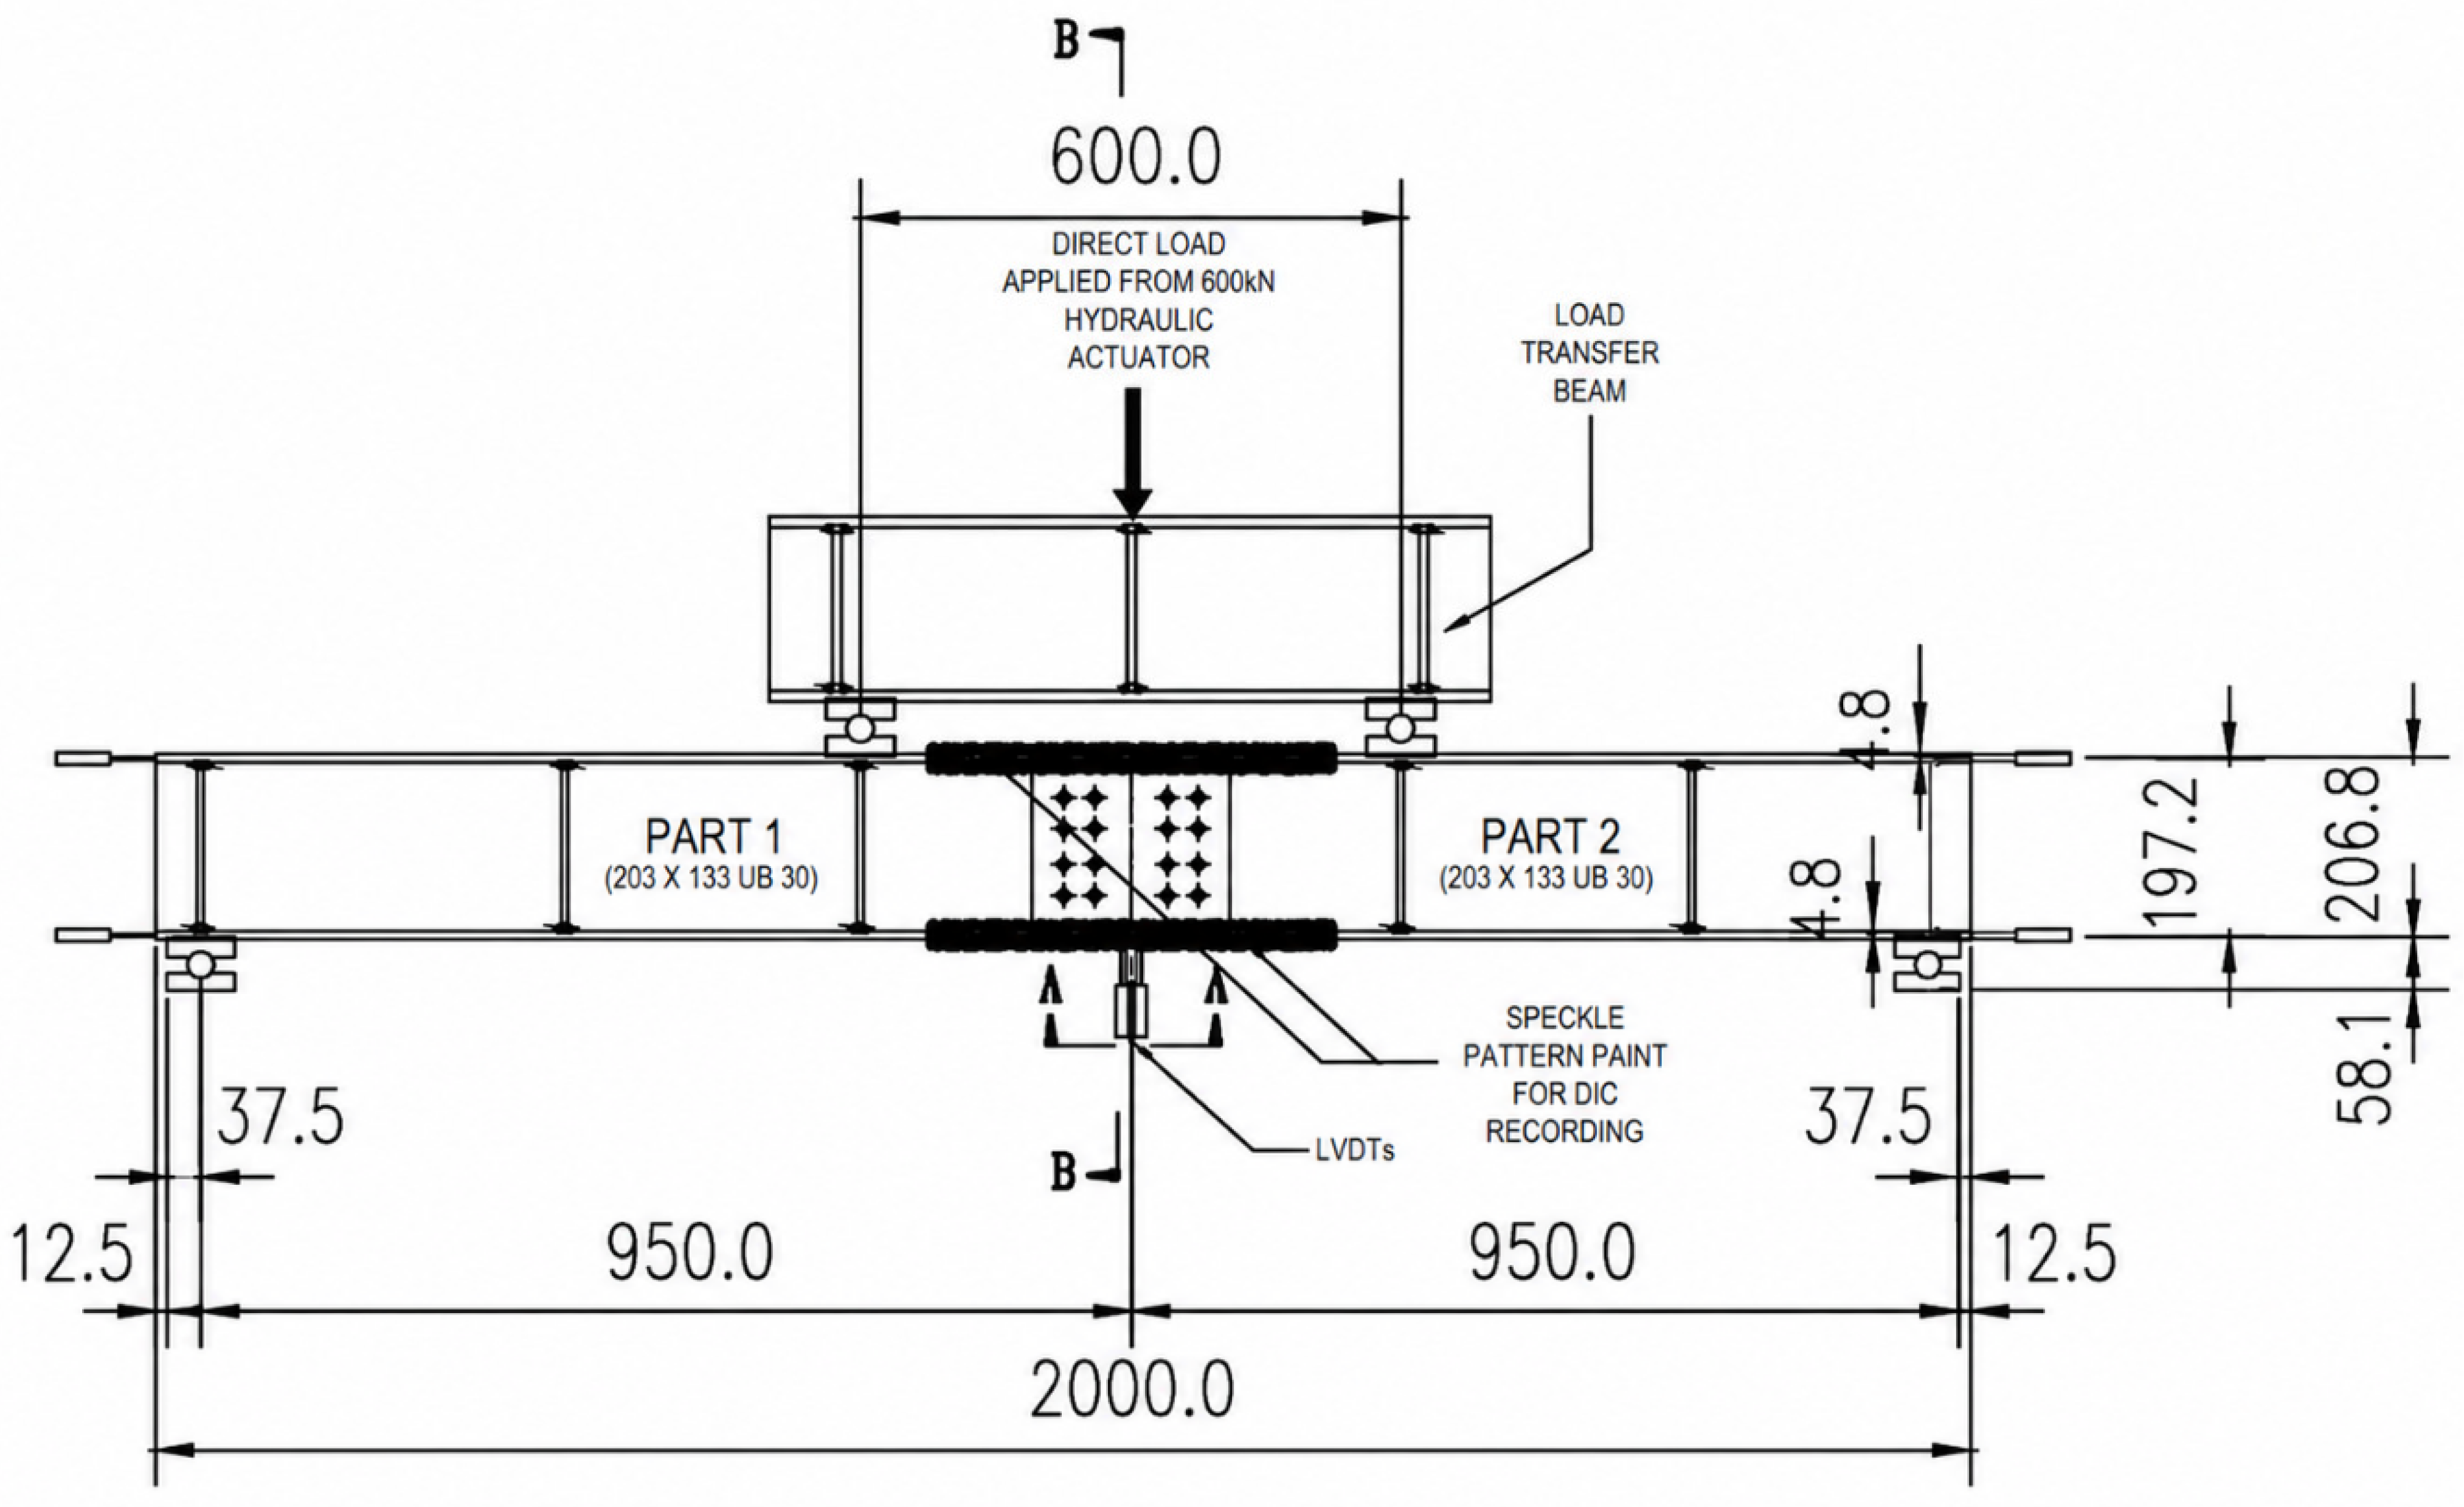
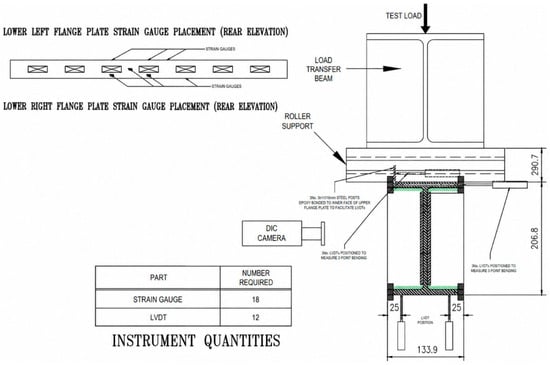
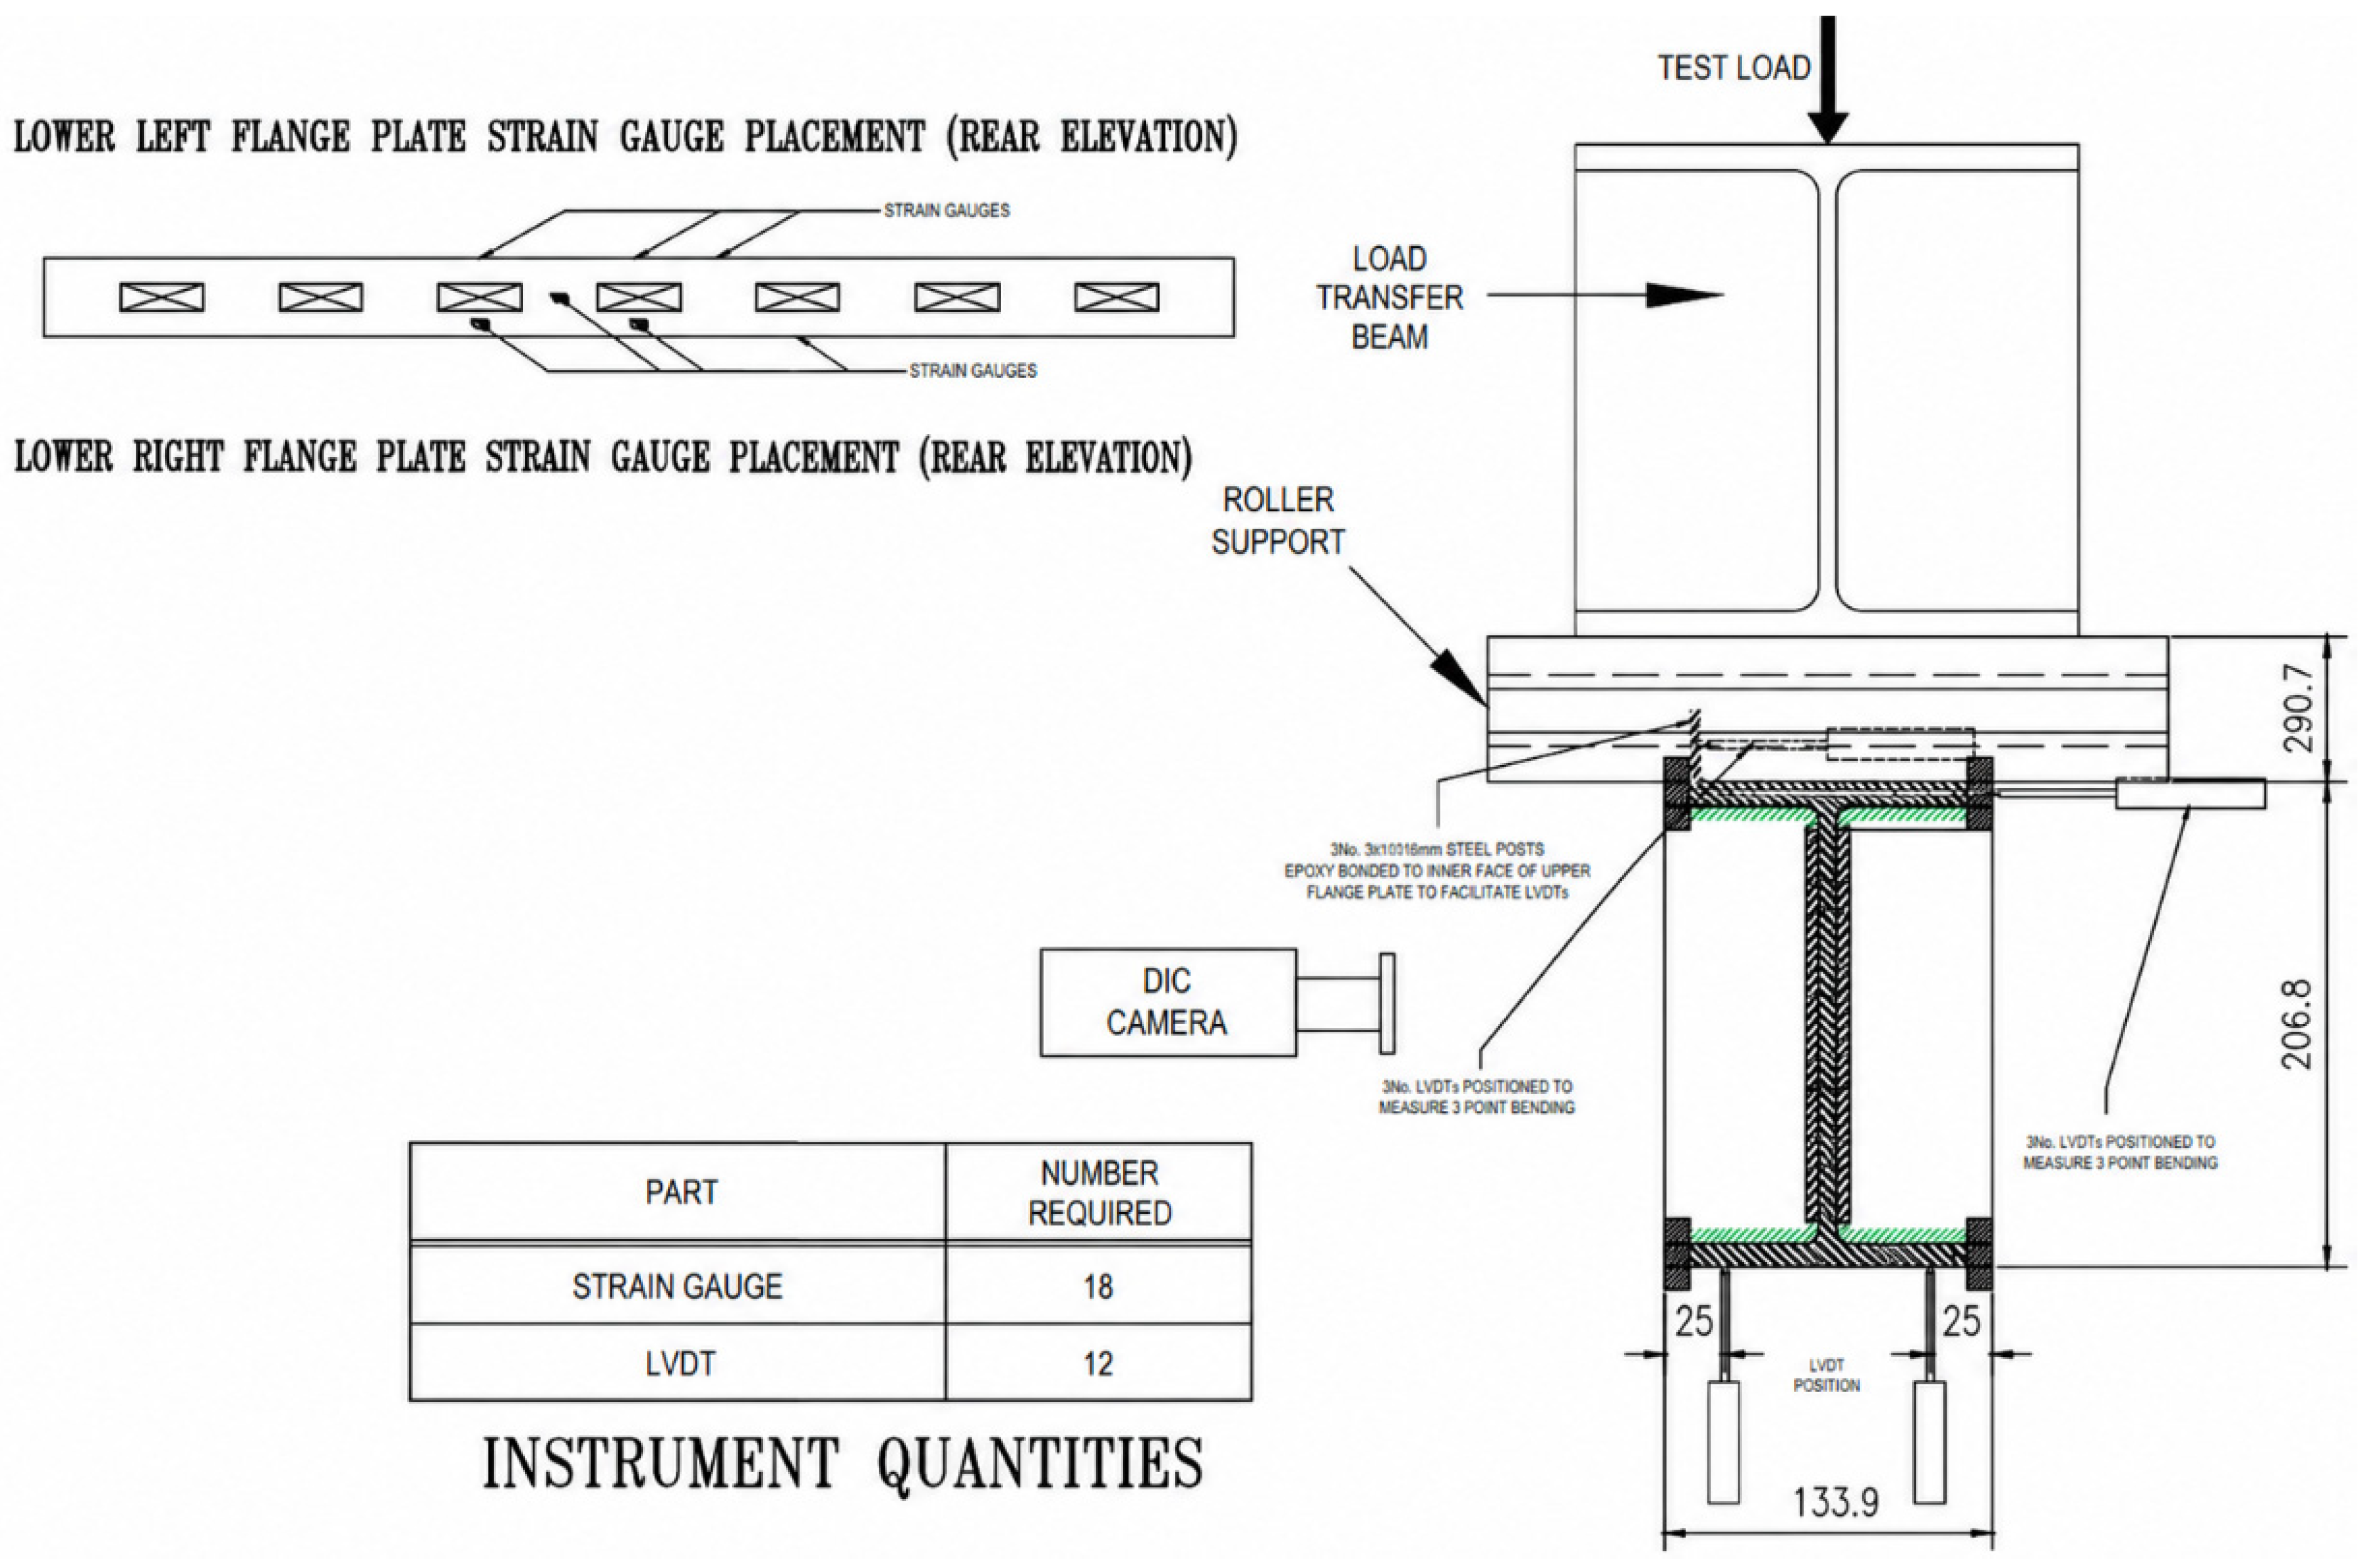
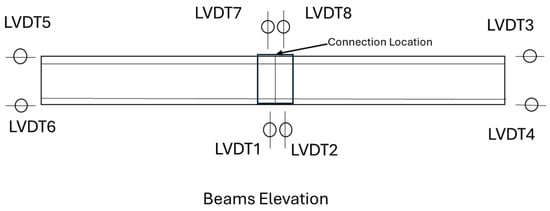
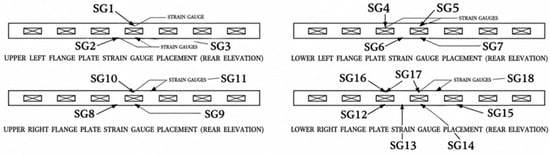
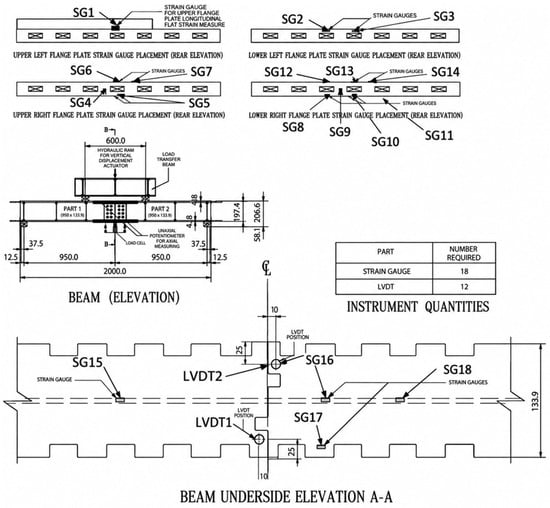
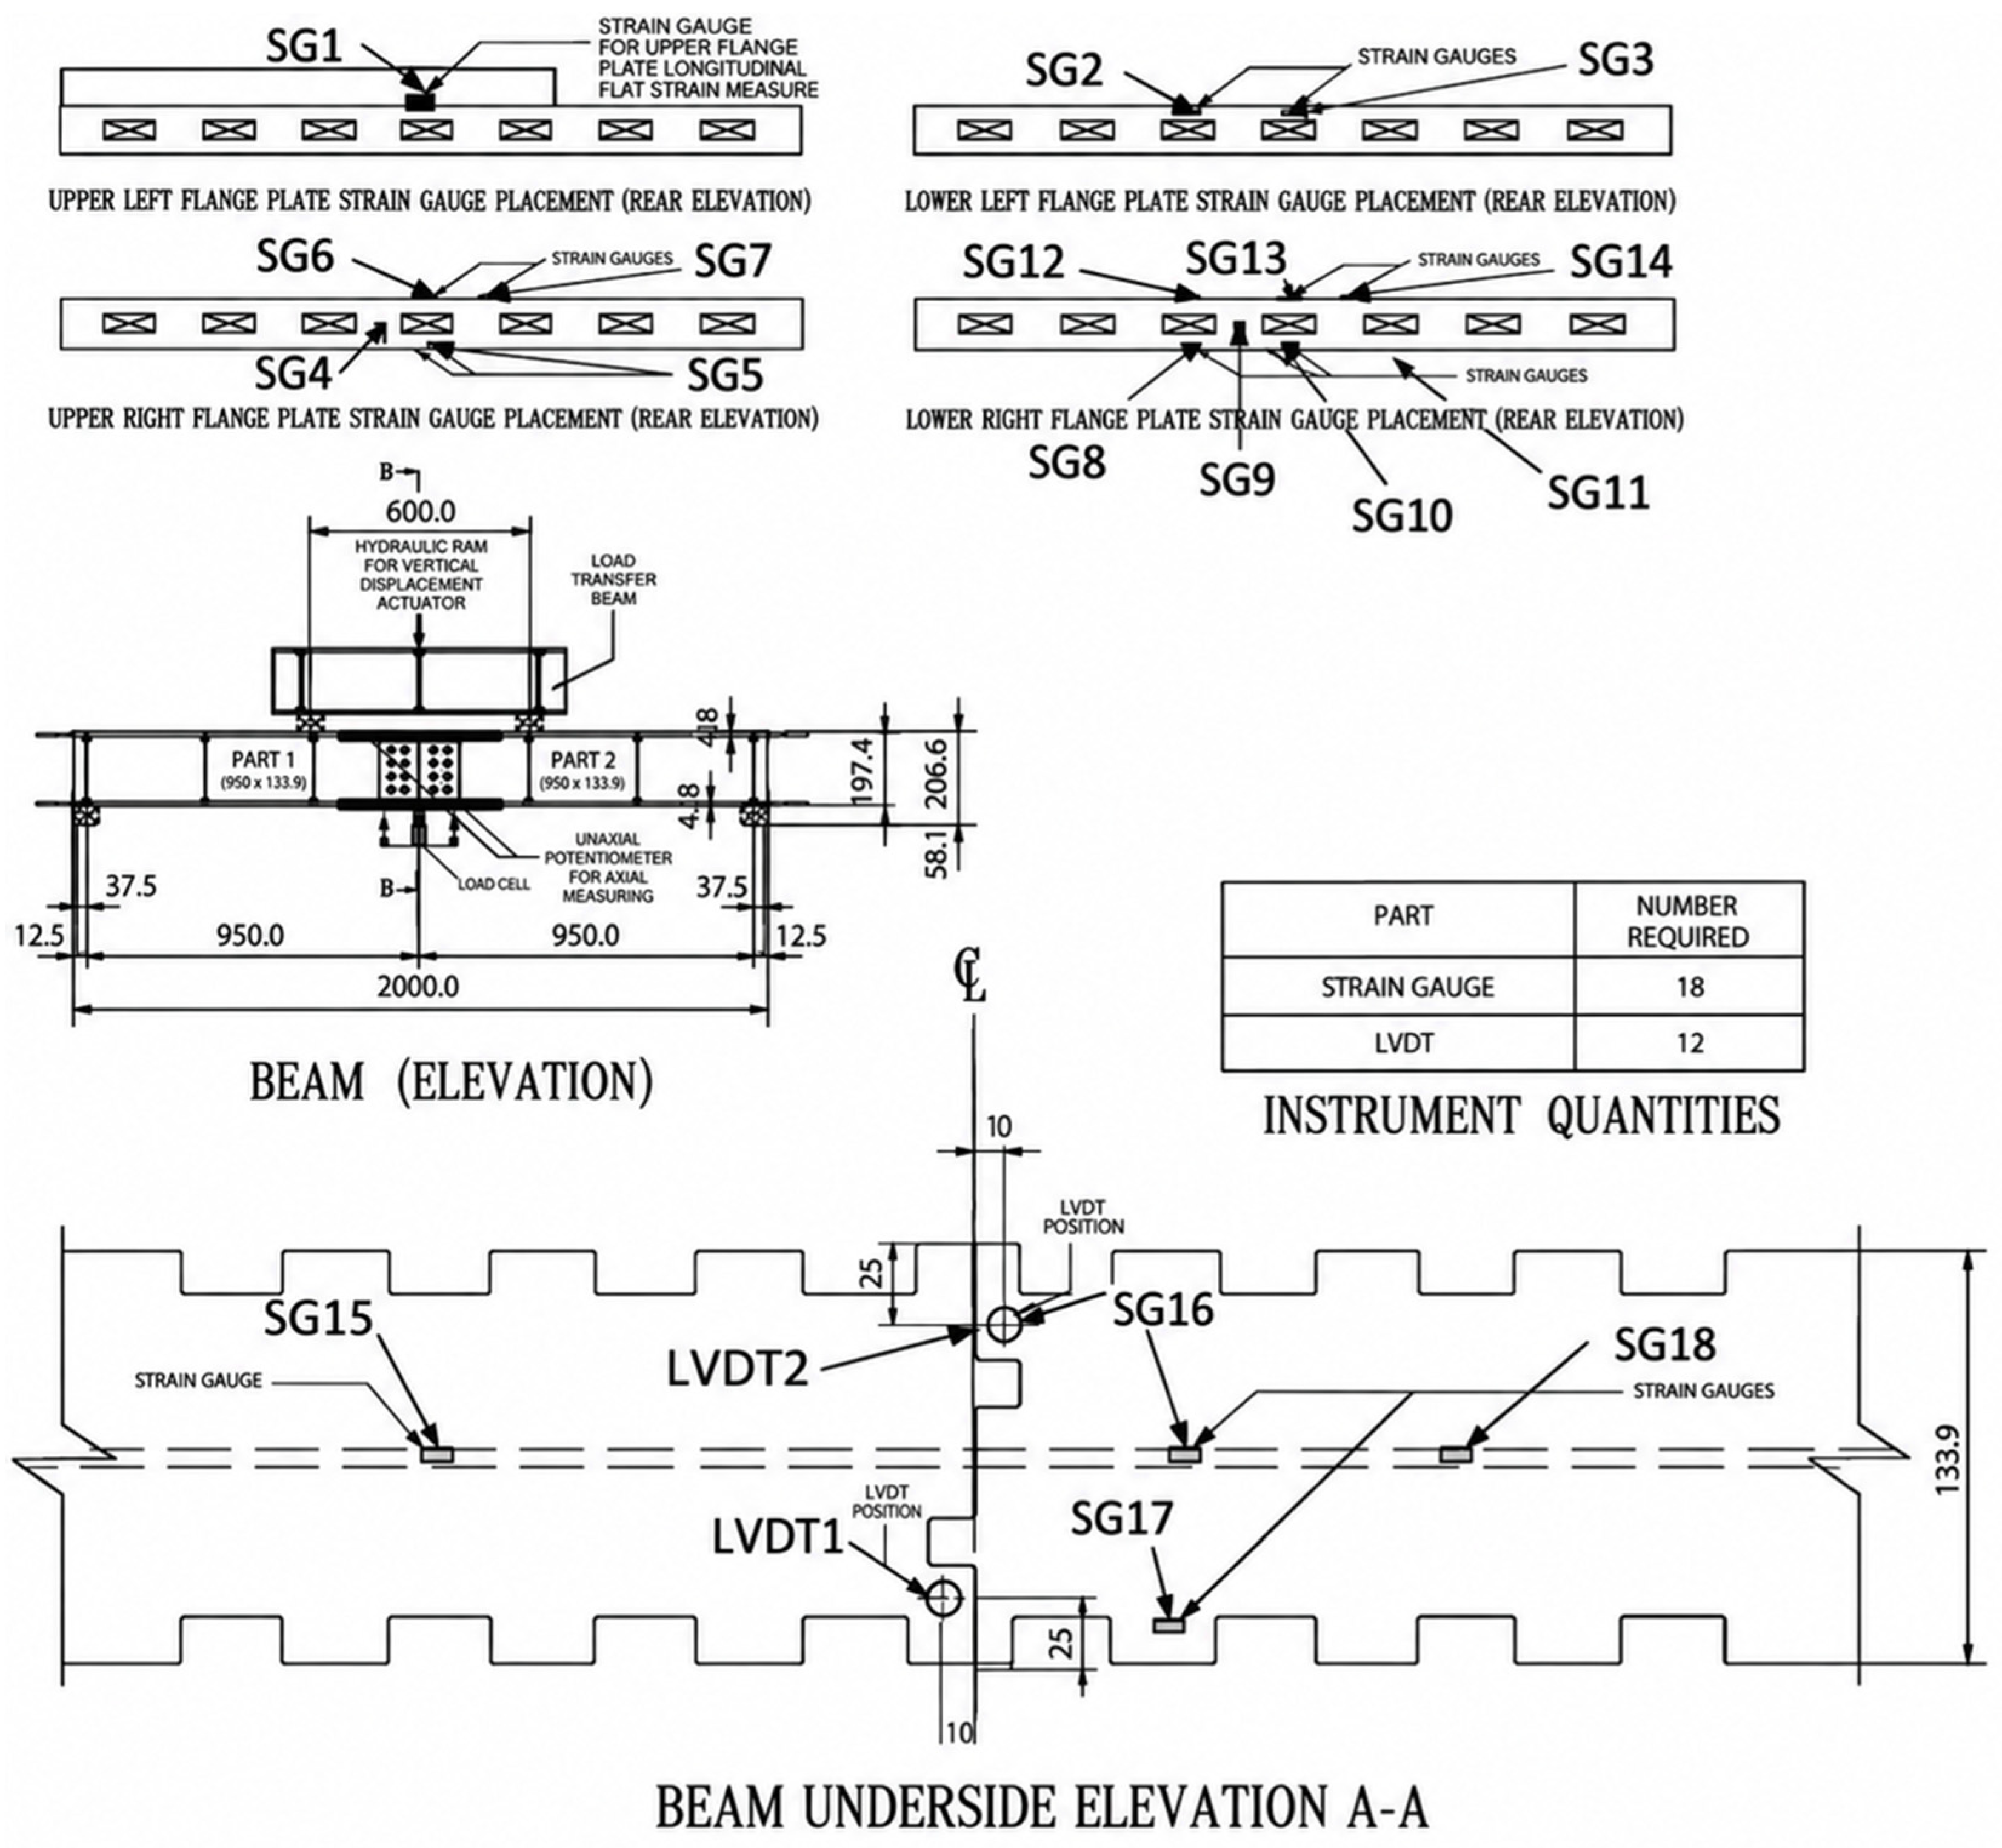
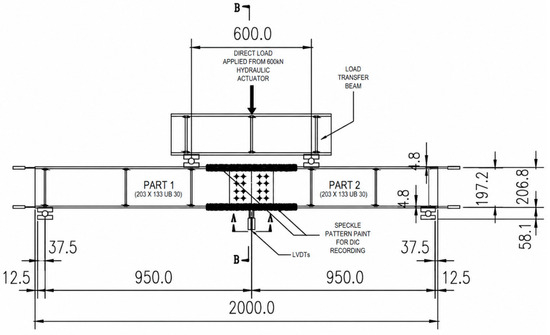
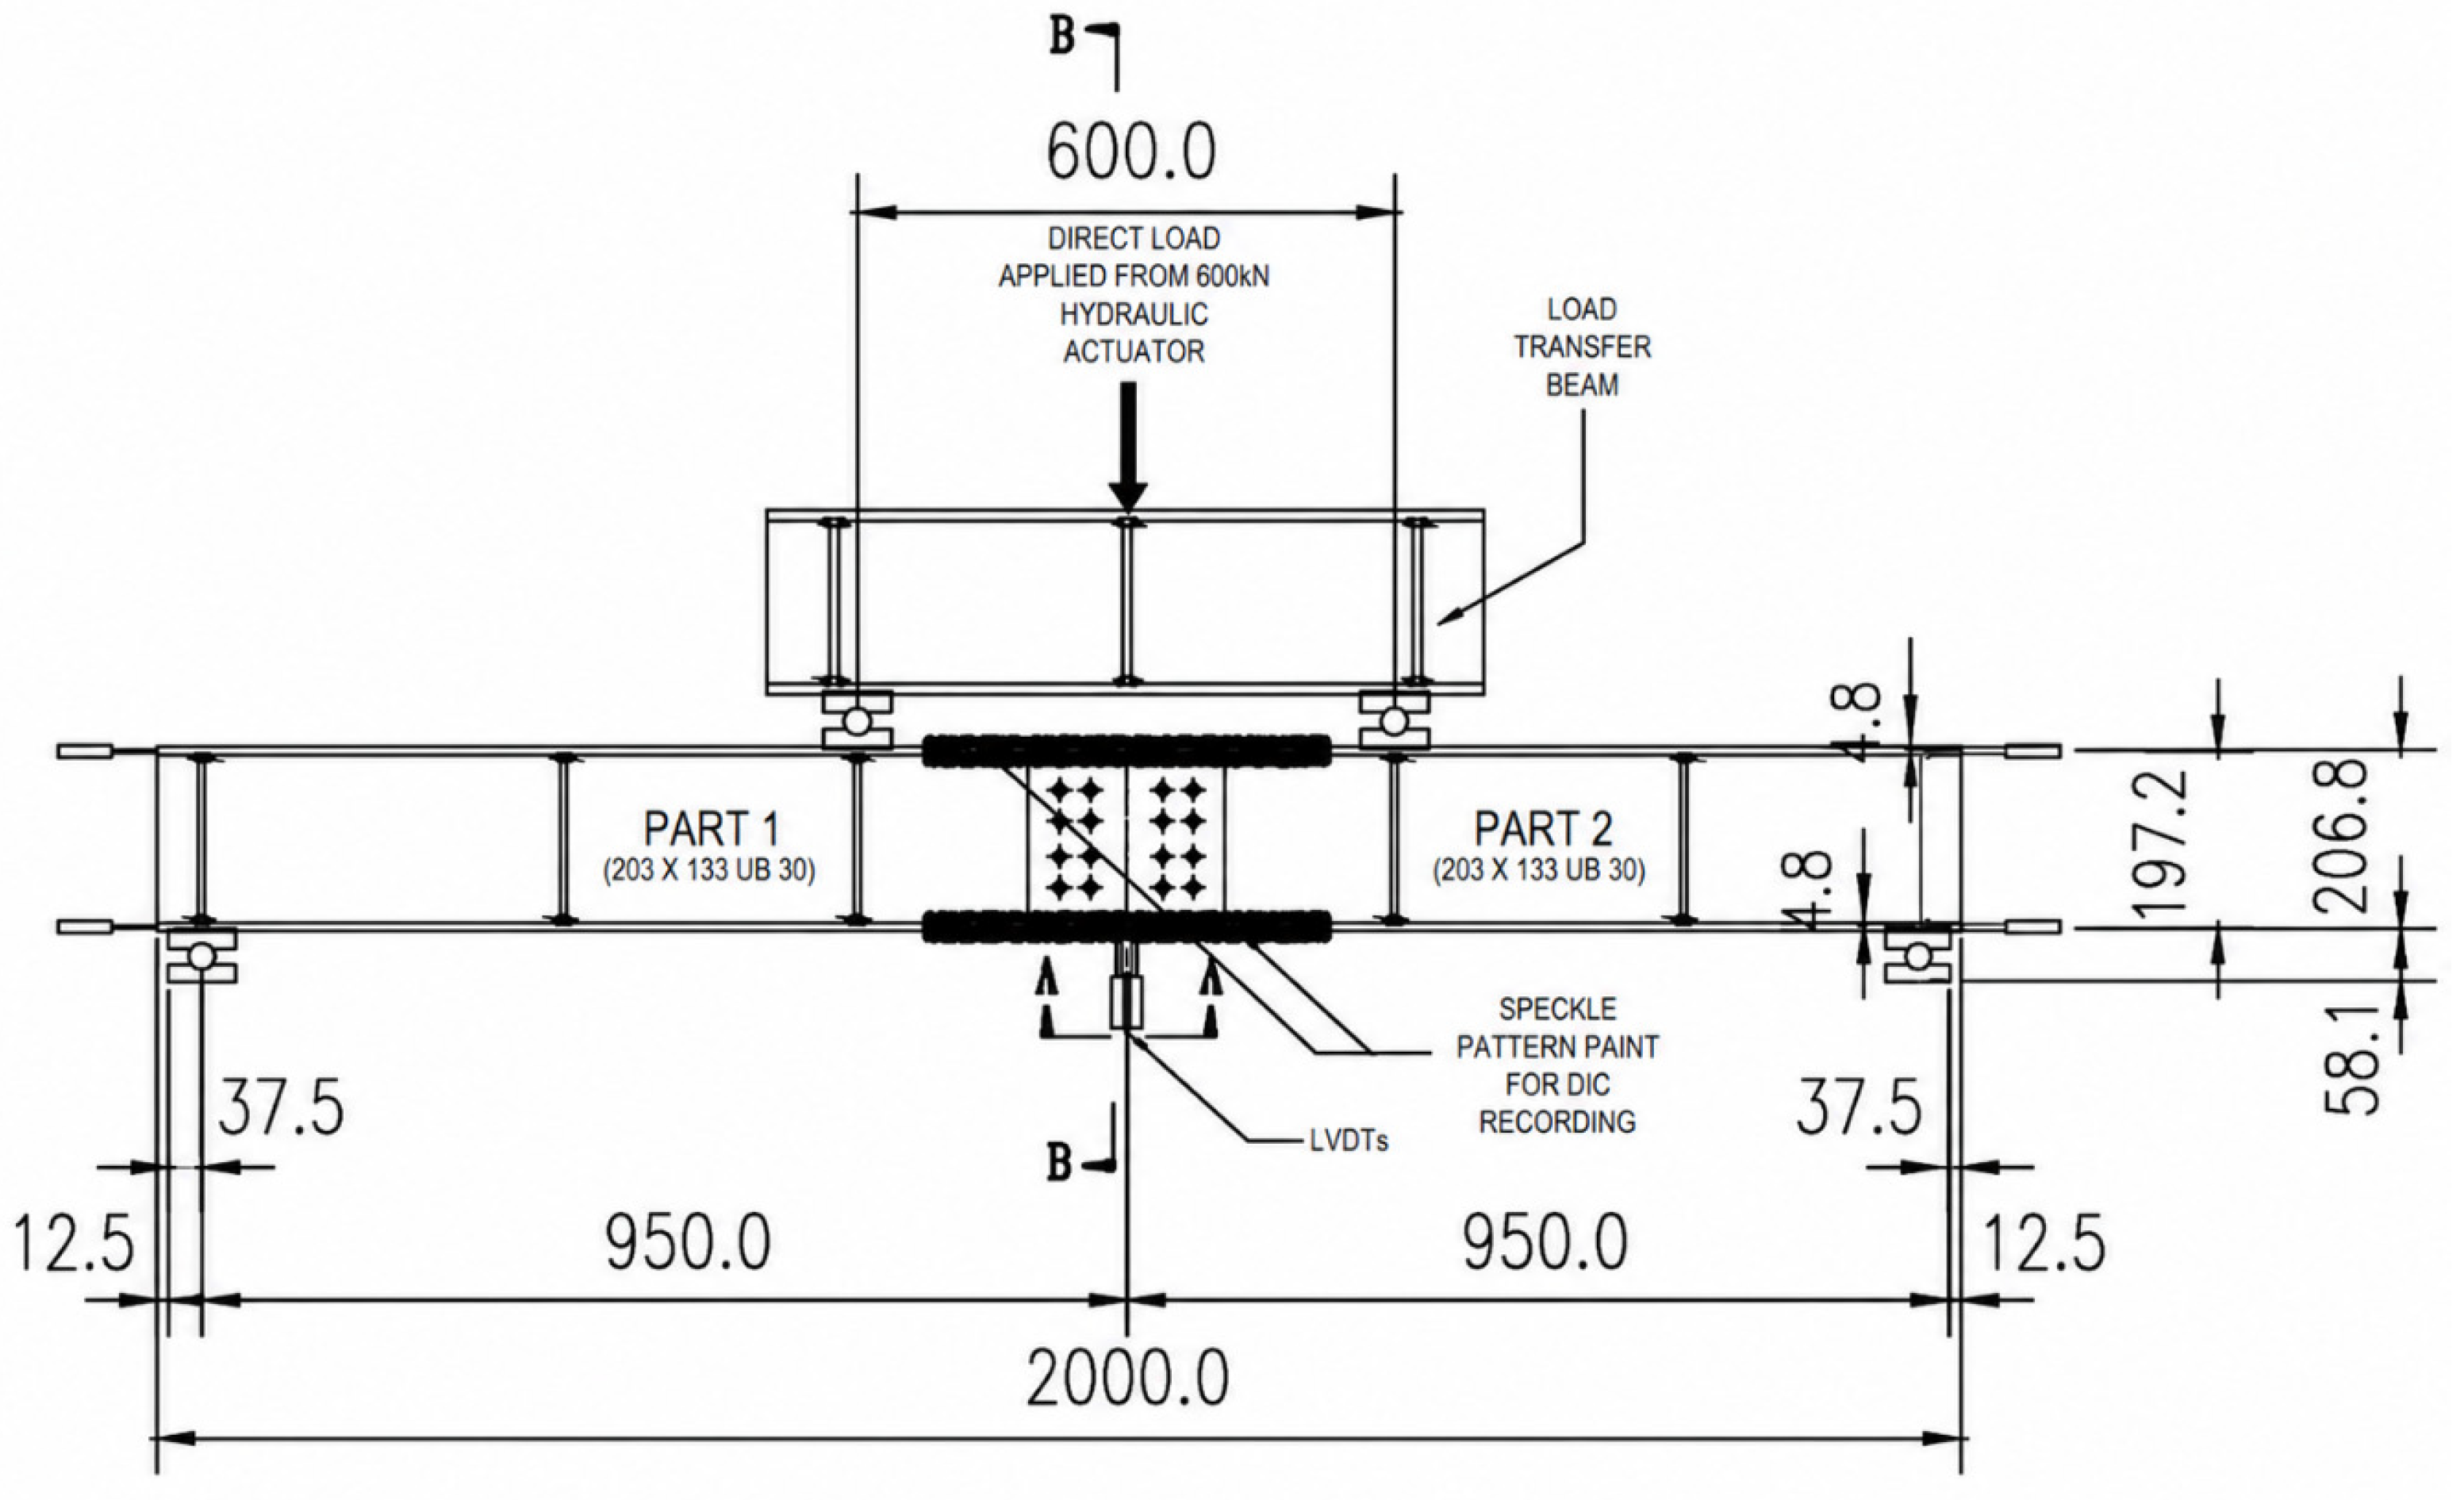
The beams were simply supported with a certain loading scheme as shown in Figure 1, Figure 6 and Figure 7. Eight Linear Variable Differential Transformers LVDT’s were used and they were located in the beam as shown in Figure 6 and Figure 7. The location of the LVDT’s on the beams is shown in Figure 8. To sample the stress state in the beam, 18 strain gauges were located at the flange side plates of the connection as shown in Figure 9 for Test 2 and Test 4 and Figure 10 for Test 1 and Test 3.
Figure 6.
Test set-up for the standard beam section (dimensions in mm).
Figure 7.
Test set-up for the standard beam section cross-section (dimensions in mm).
Figure 8.
Location of LVDTs on the beams.
Figure 9.
Location of strain gauges (SG) on the beams for Test 2 and Test 4.
Figure 10.
Location of the strain gauges (SG) on the beams for Test 1 and Test 3.
In this study, the experimental yield load was identified from the combined assessment of the load–displacement response and strain-gauge measurements. The yield load was taken as the load corresponding to the first clear departure from the initial approximately linear-elastic response, supported by the strain-gauge measurements indicating the onset of inelastic behaviour in the critical region of the connection. The reported yield loads therefore represent the experimentally identified onset of yielding of the connection.
3. Experimental Results and Observations
3.1. Test 1 Results
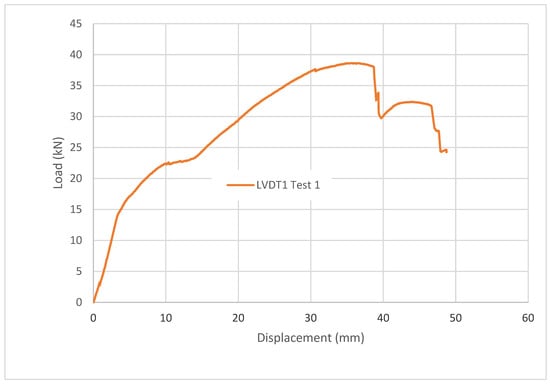
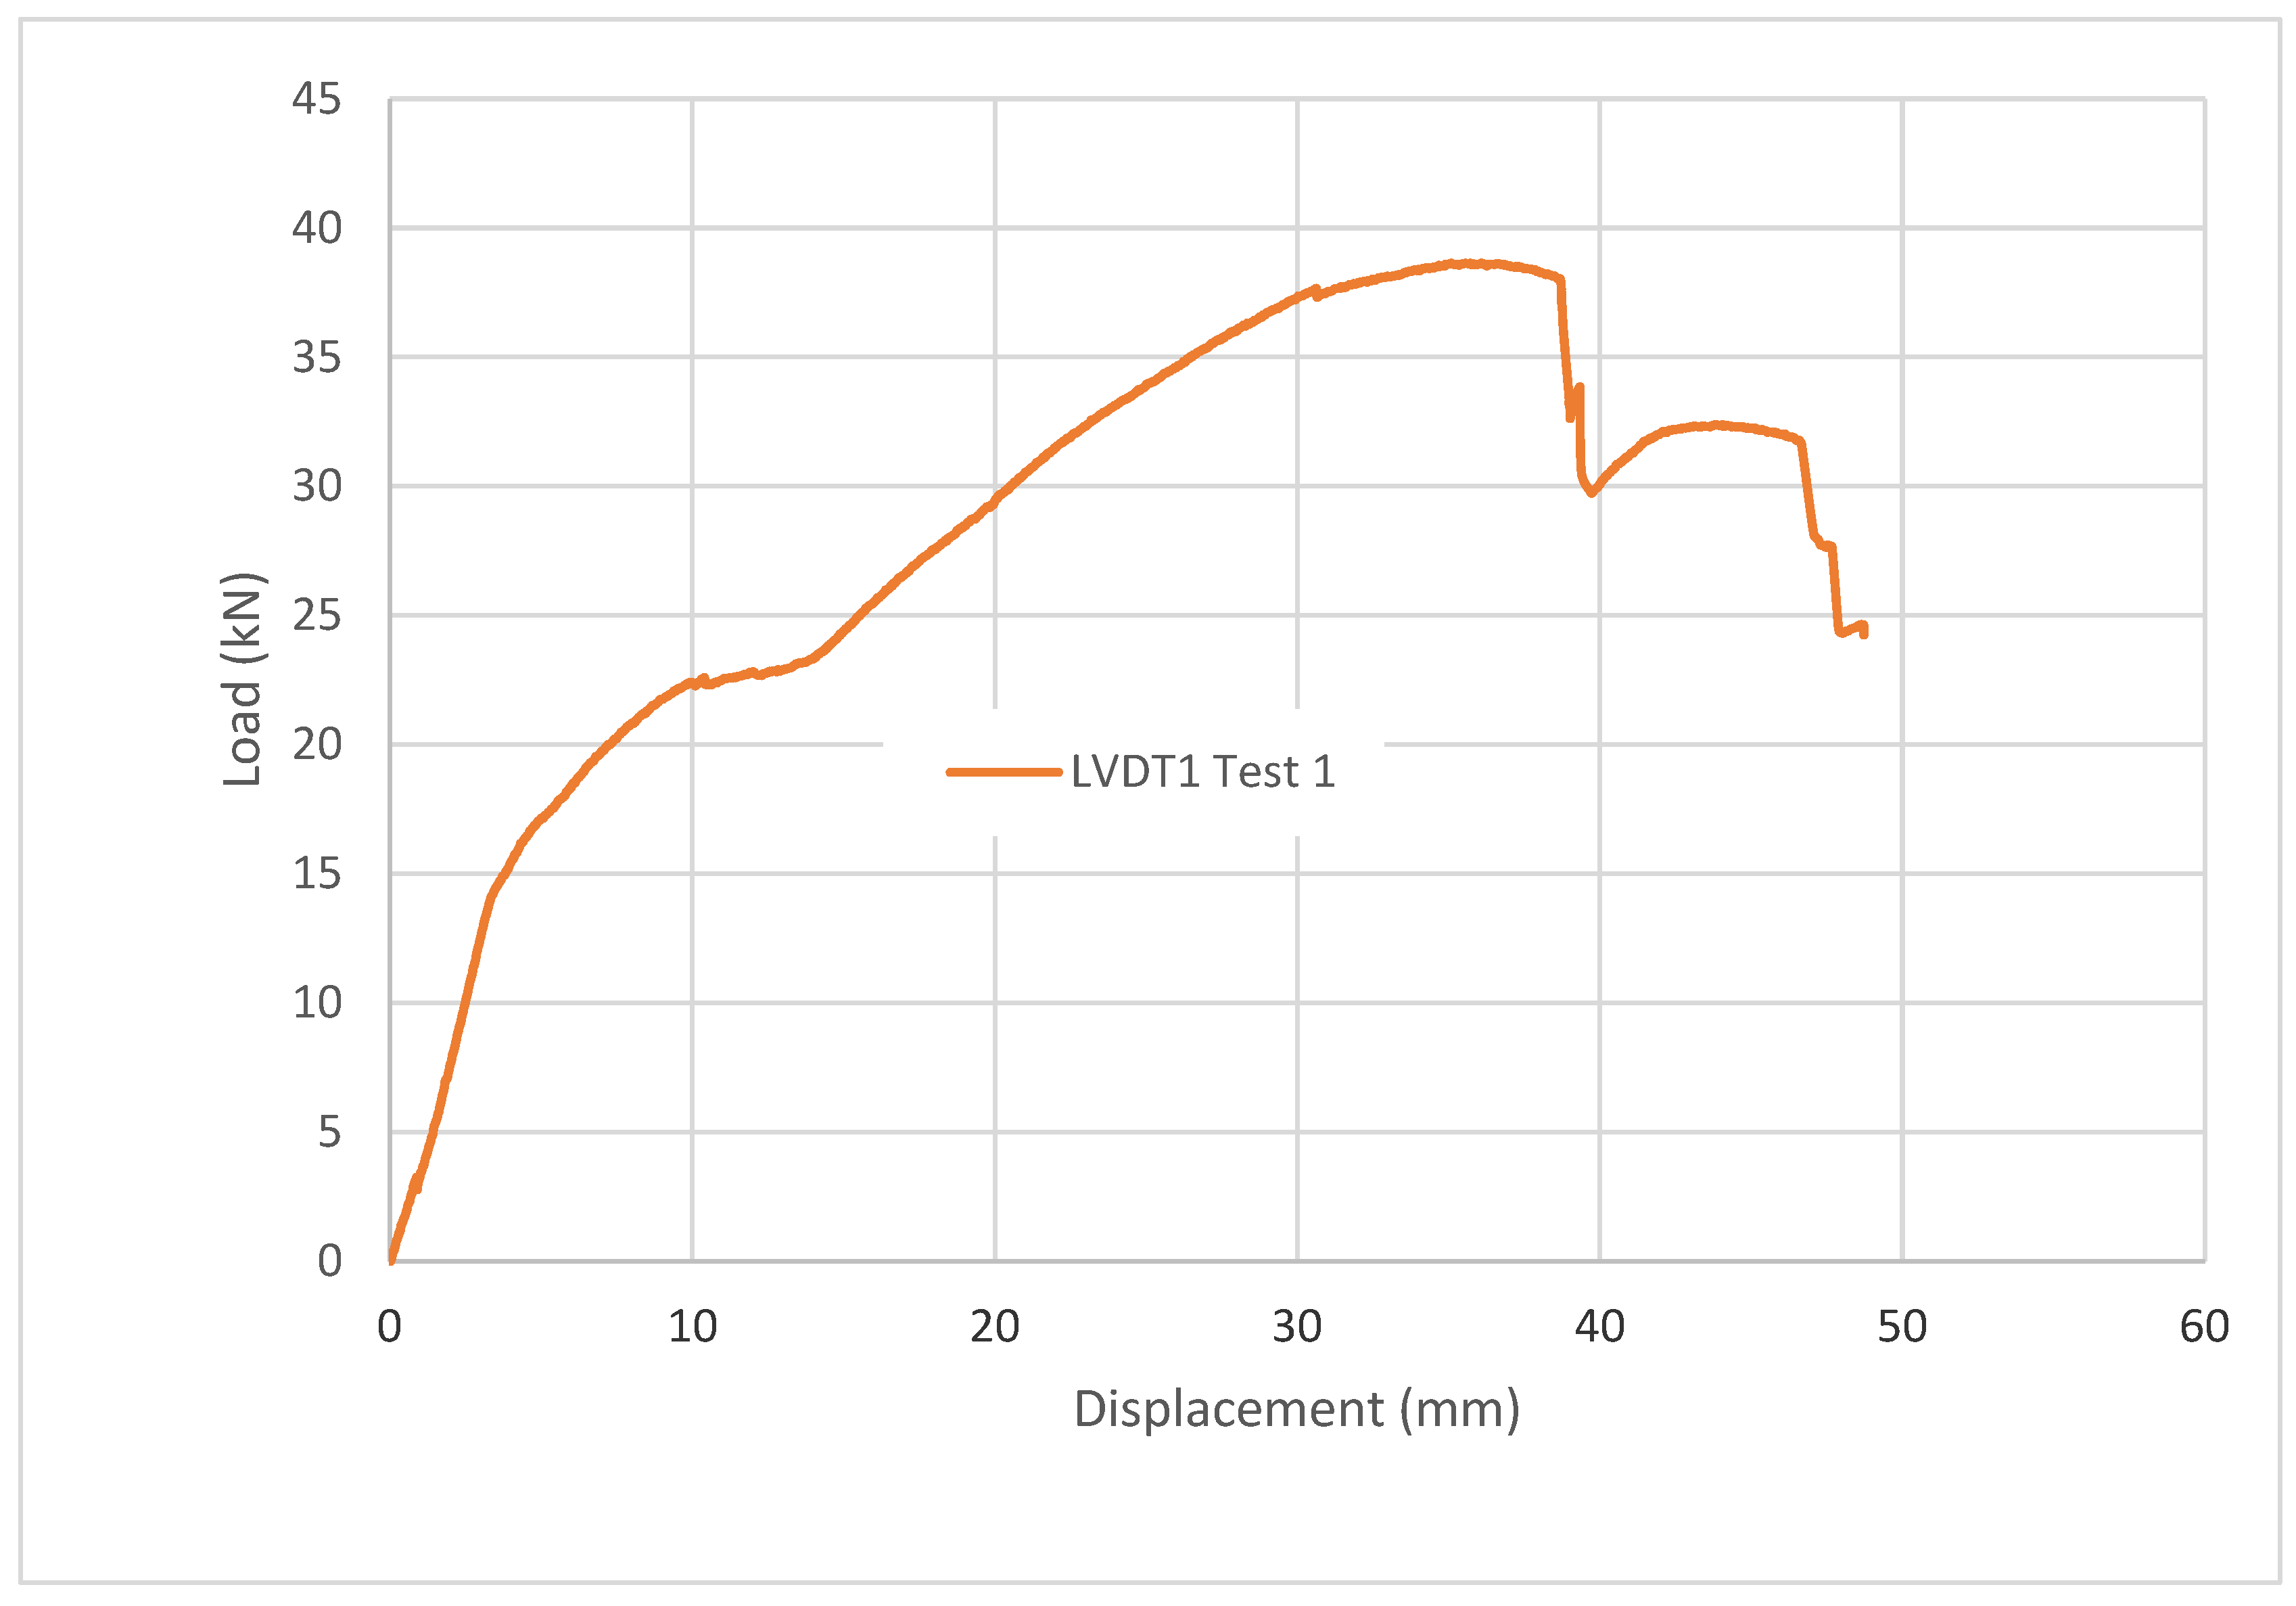
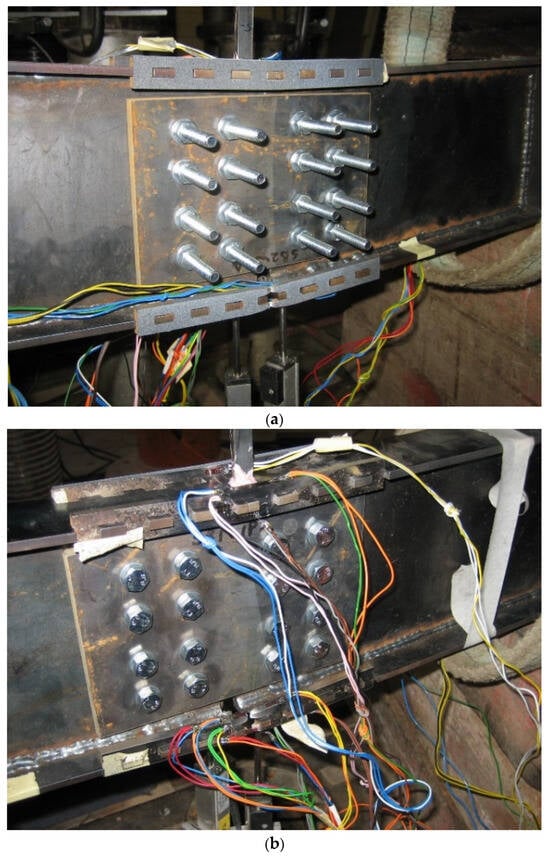
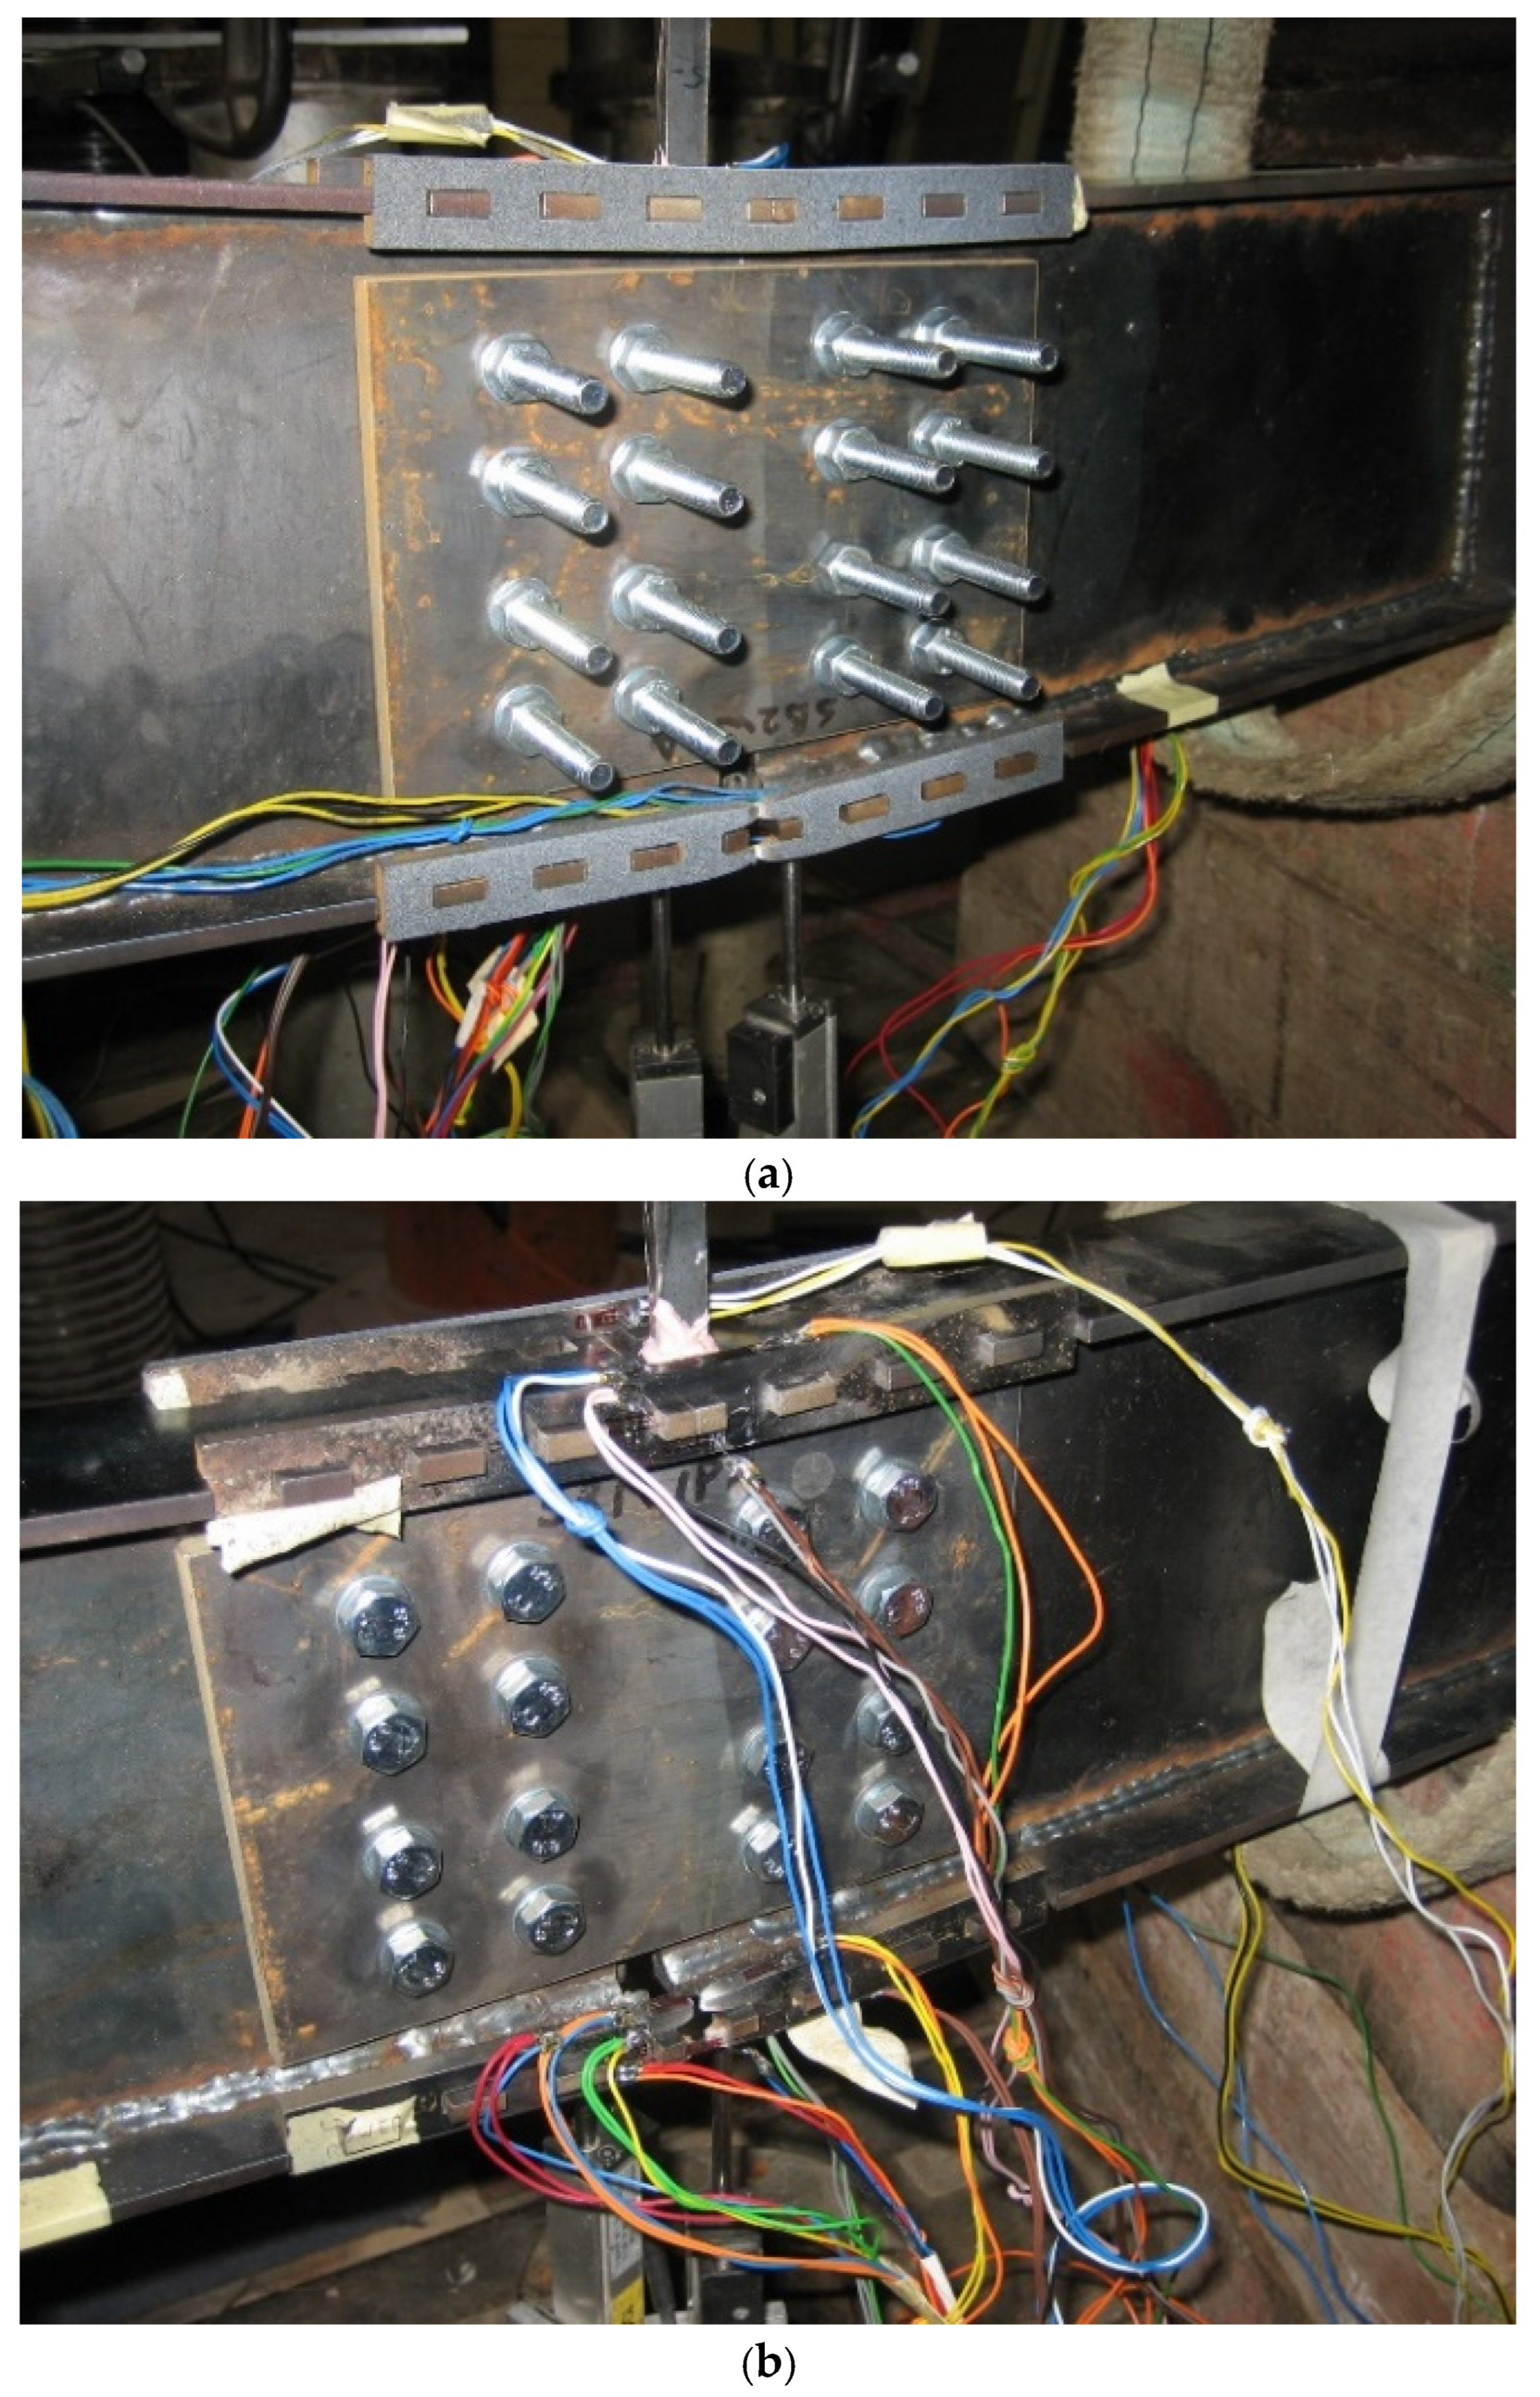
The first beam test was a bending moment test (Figure 10) of the built-up beam and it was conducted using a displacement control protocol. Figure 11 presents the data recorded from the LVDT1. During the linear elastic stage, the beam flanges at the top moved closer together, and the flanges at the bottom moved farther apart. The specimen started to yield around a displacement of 4.2 mm at a load of 16 kN. At 10 mm the vertical displacement increases without any significant increase in load. This suggests that the connection moves within the tolerance gaps around teeth and holes before the connection is fully engaged again and stiffer hardening behaviour observed, i.e., increase in load with displacement. However, strength degradation did not start until later (at a displacement of 38 mm) which shows a significant amount of specimen ductility. During the test an ultimate load of 38.6 kN was recorded. The various connection elements continue to deform plastically after the ultimate load was reached. The connection eventually failed due to a ductile fracture at the midpoint of the two lower side plates, as shown in Figure 12a, and following this, the beam was unloaded. In Figure 12b the separation between the beams at the lower flange at failure can be observed.
Figure 11.
Test 1 total load vs. vertical LVDT1 displacement.
Figure 12.
(a) Experimental failure mode of the side intermeshed steel connection for the built-up beam in bending. (b) Experimental failure mode showing the two built-up beams disconnected with each other.
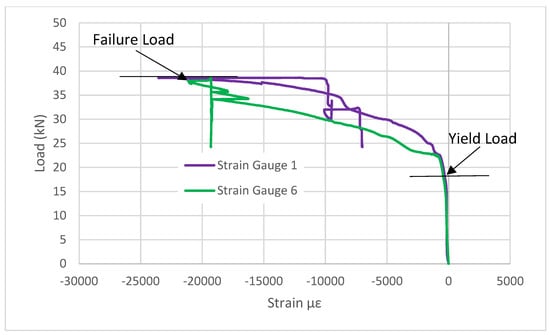
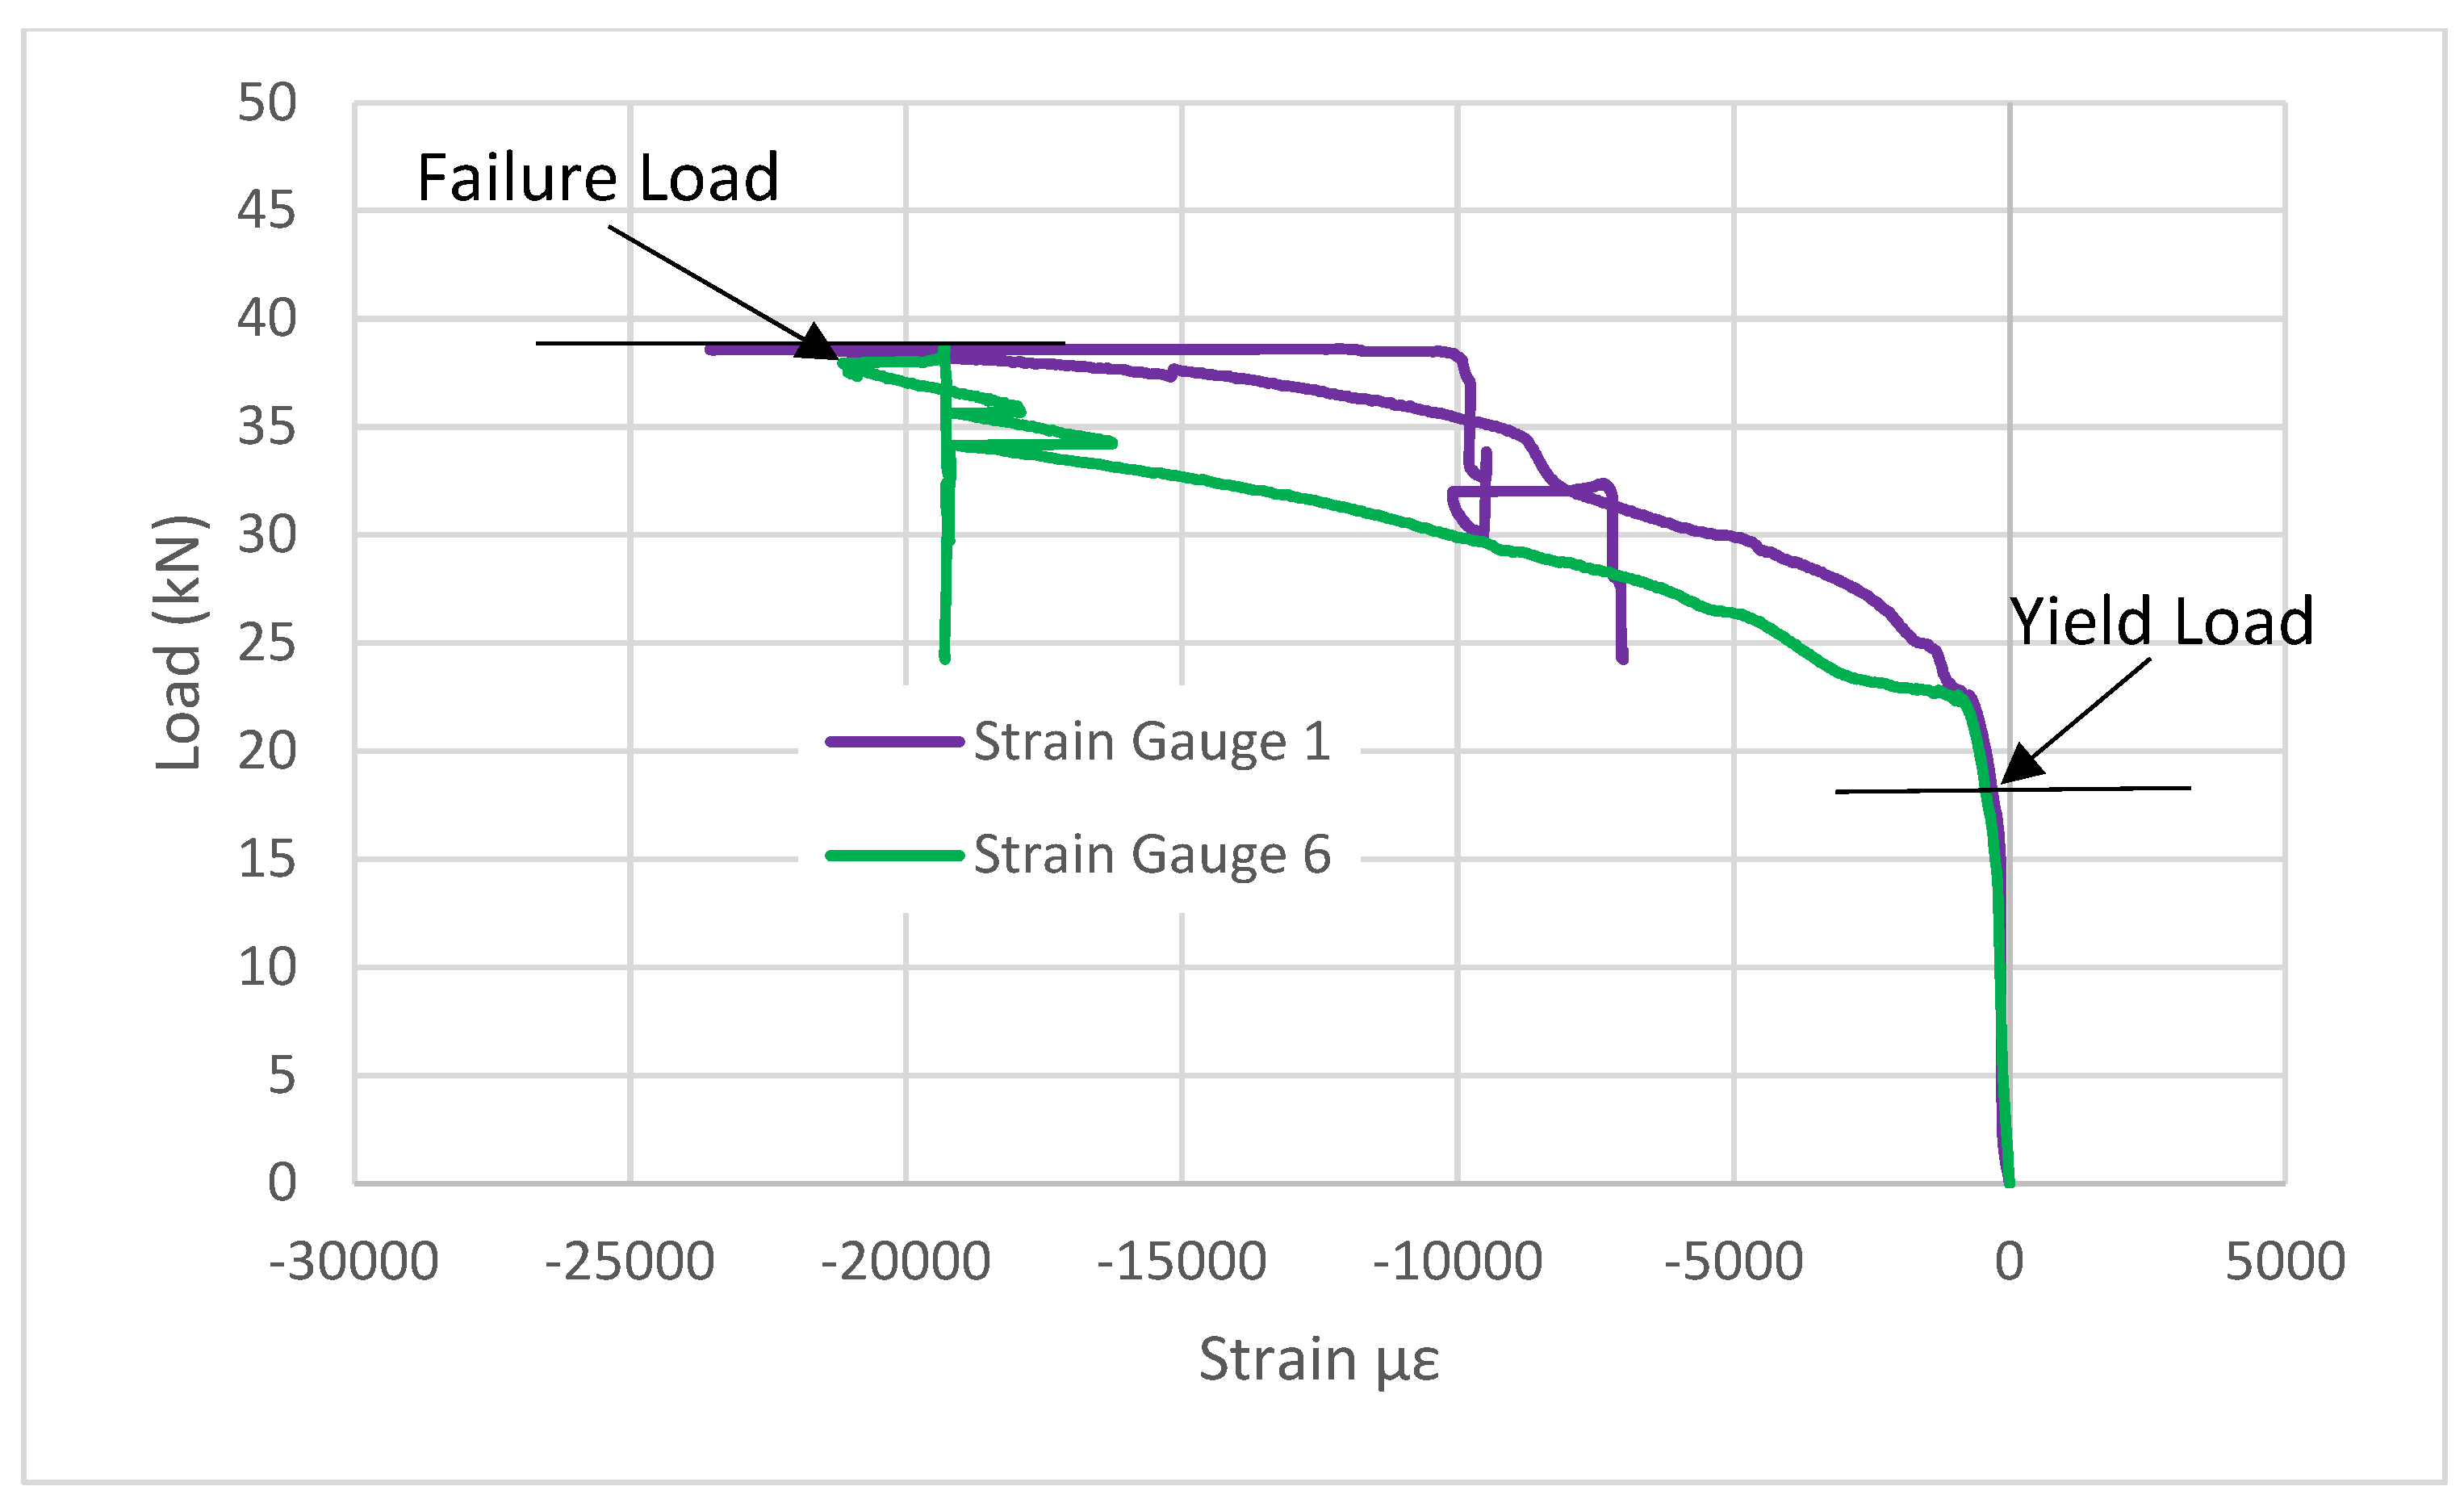
Two strain gauges on the beam recorded higher inelastic behaviour than the others. A comparison between curves in Figure 13 shows that initiation of plasticity in the side plates started at a load of approximately 16 kN. At this load level, the two beams strain gauges (SG1 and SG6) indicated linear elastic behaviour. Strain gauges SG1 and SG6 are only presented because they recorded a higher plastic behaviour. Beyond this load level, the two strain gauges (SG1 and SG6) showed inelastic plastic behaviour in the side plate with large deformation until a load of 38.6 kN was reached. The compressive strain at this point reaches −20,000 με and the connection fails in the middle of the two lower-flange side plates due to tension (at the extreme tension fibres).
Figure 13.
Test 1 total vertical load vs. different compressive strains from strain gauges (SG1 and SG6).
3.2. Test 2 Results
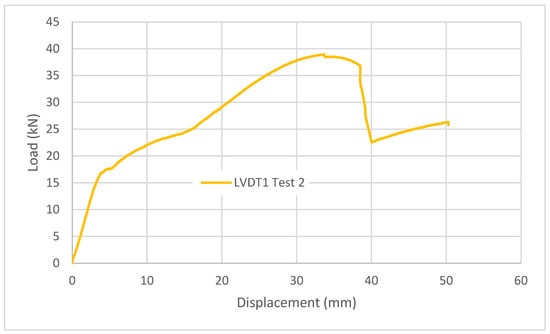
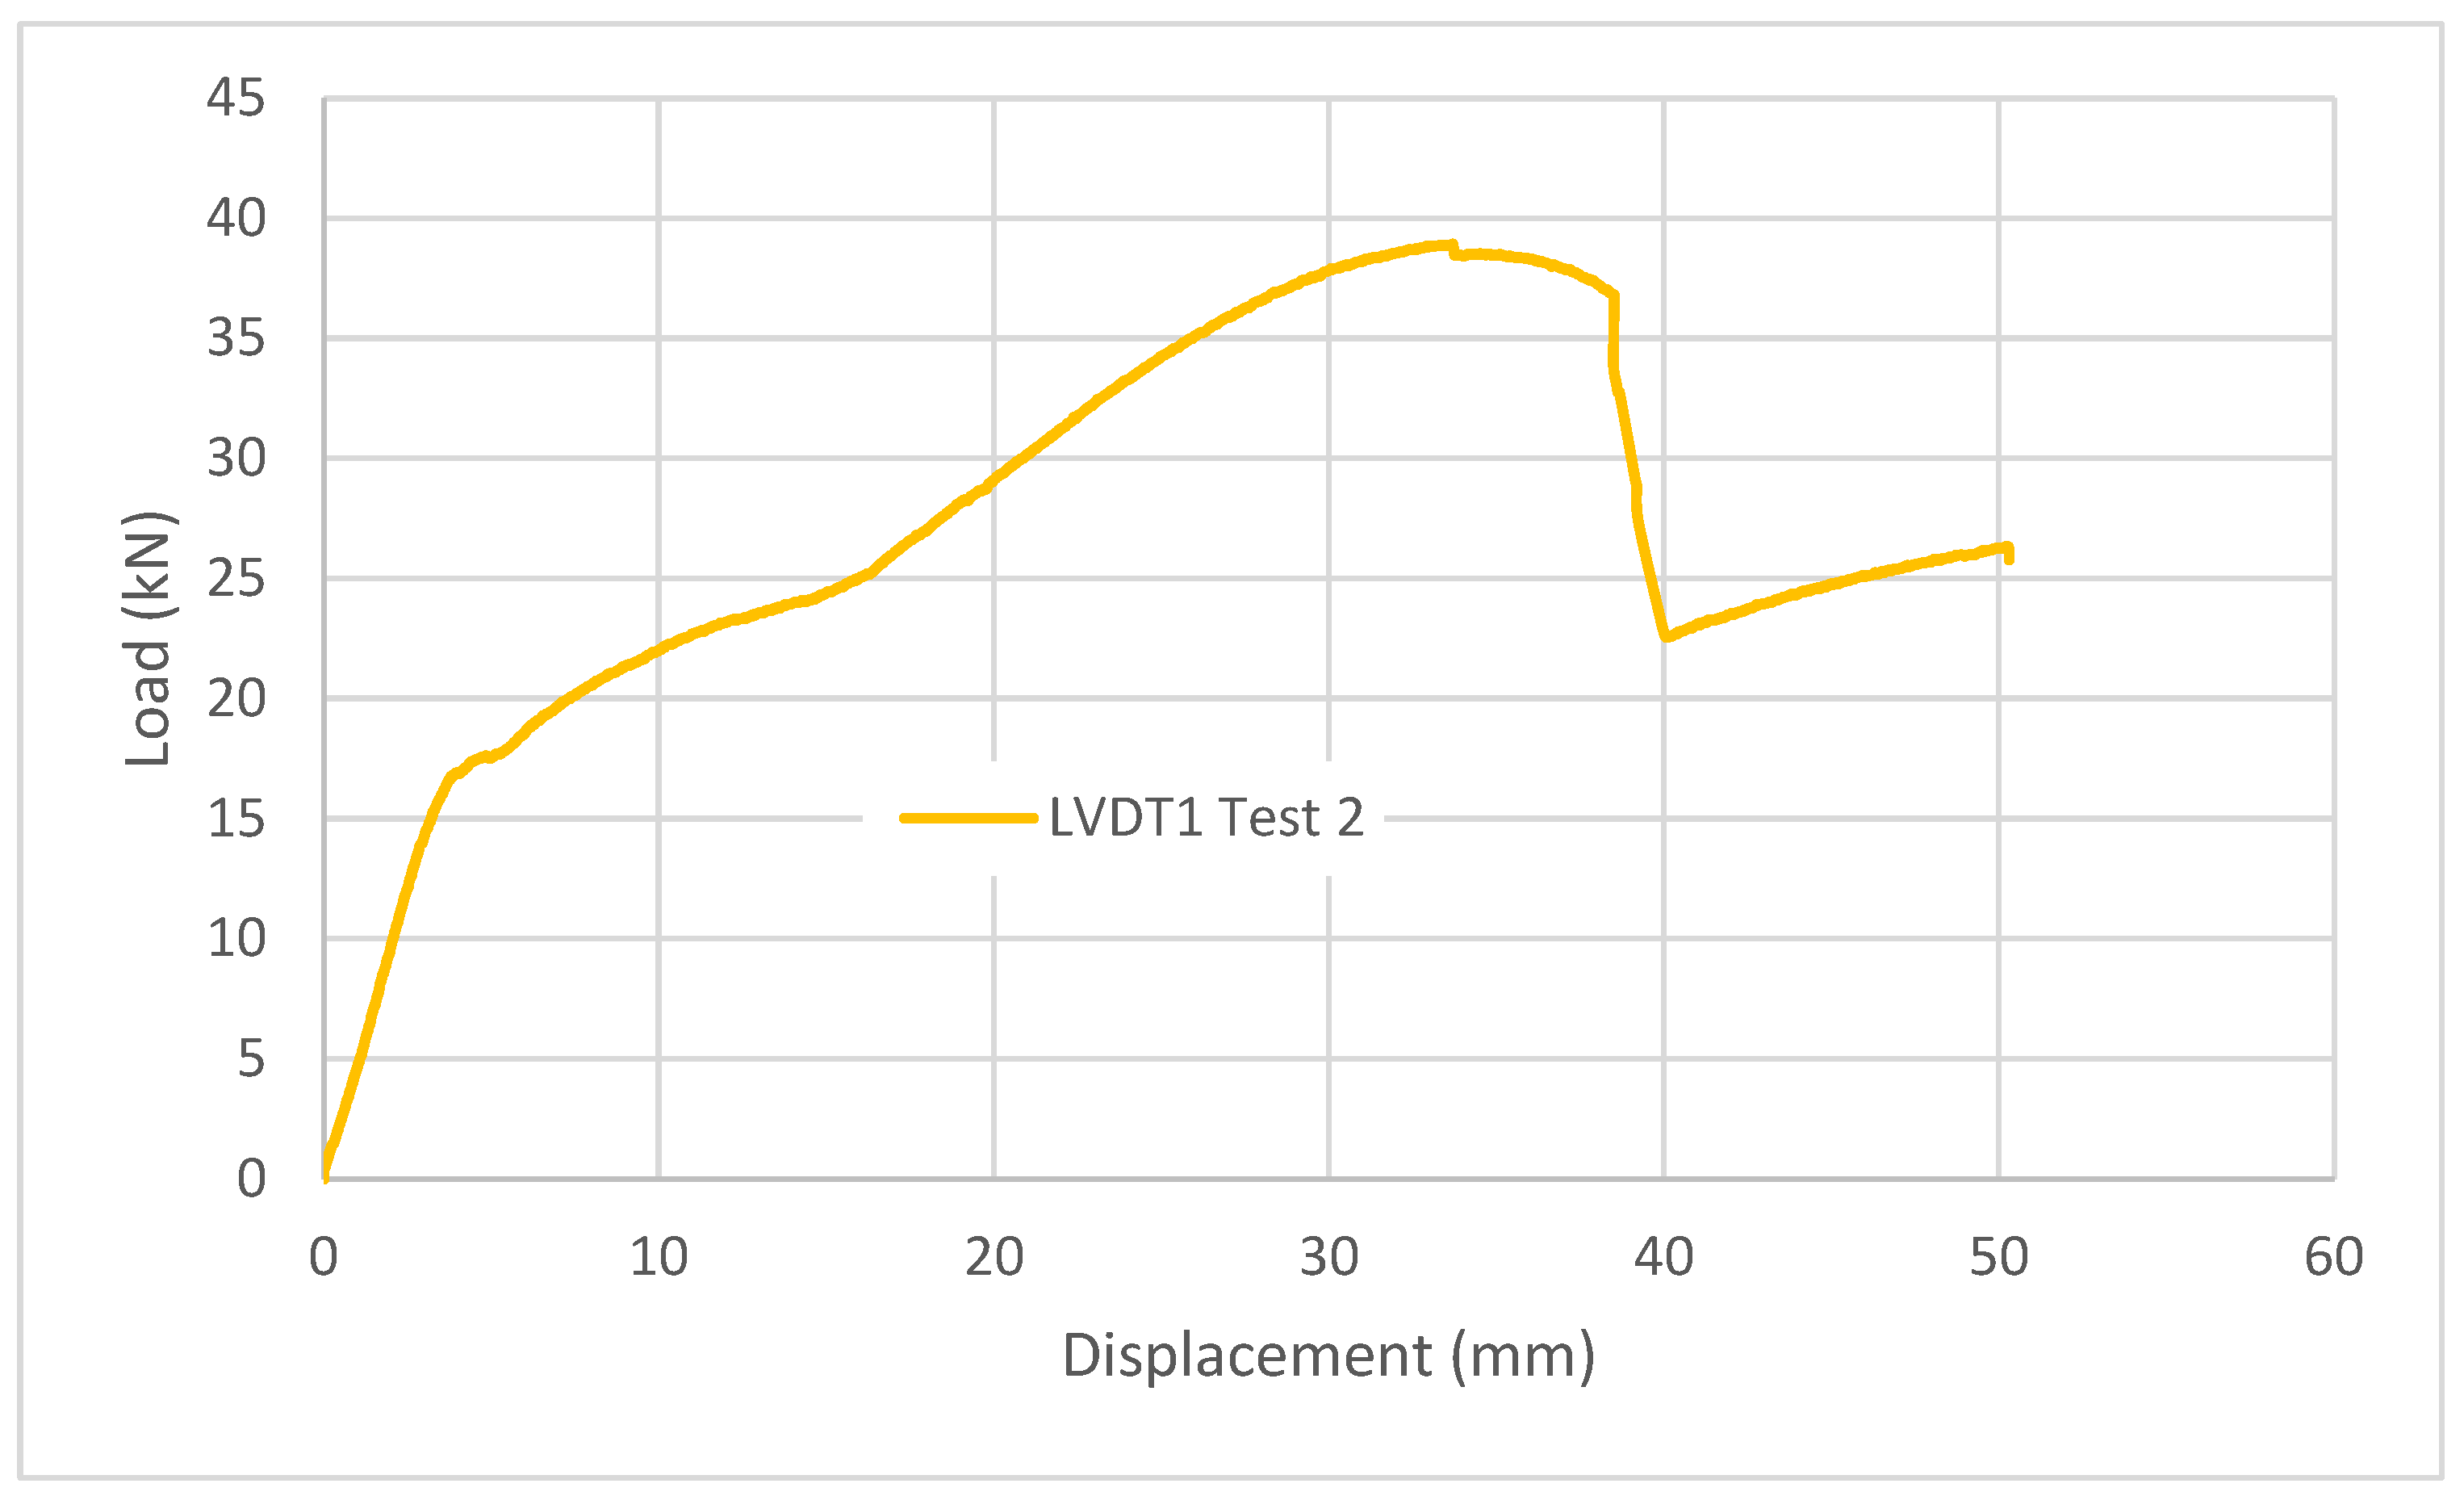
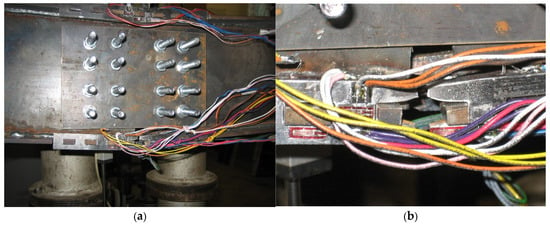
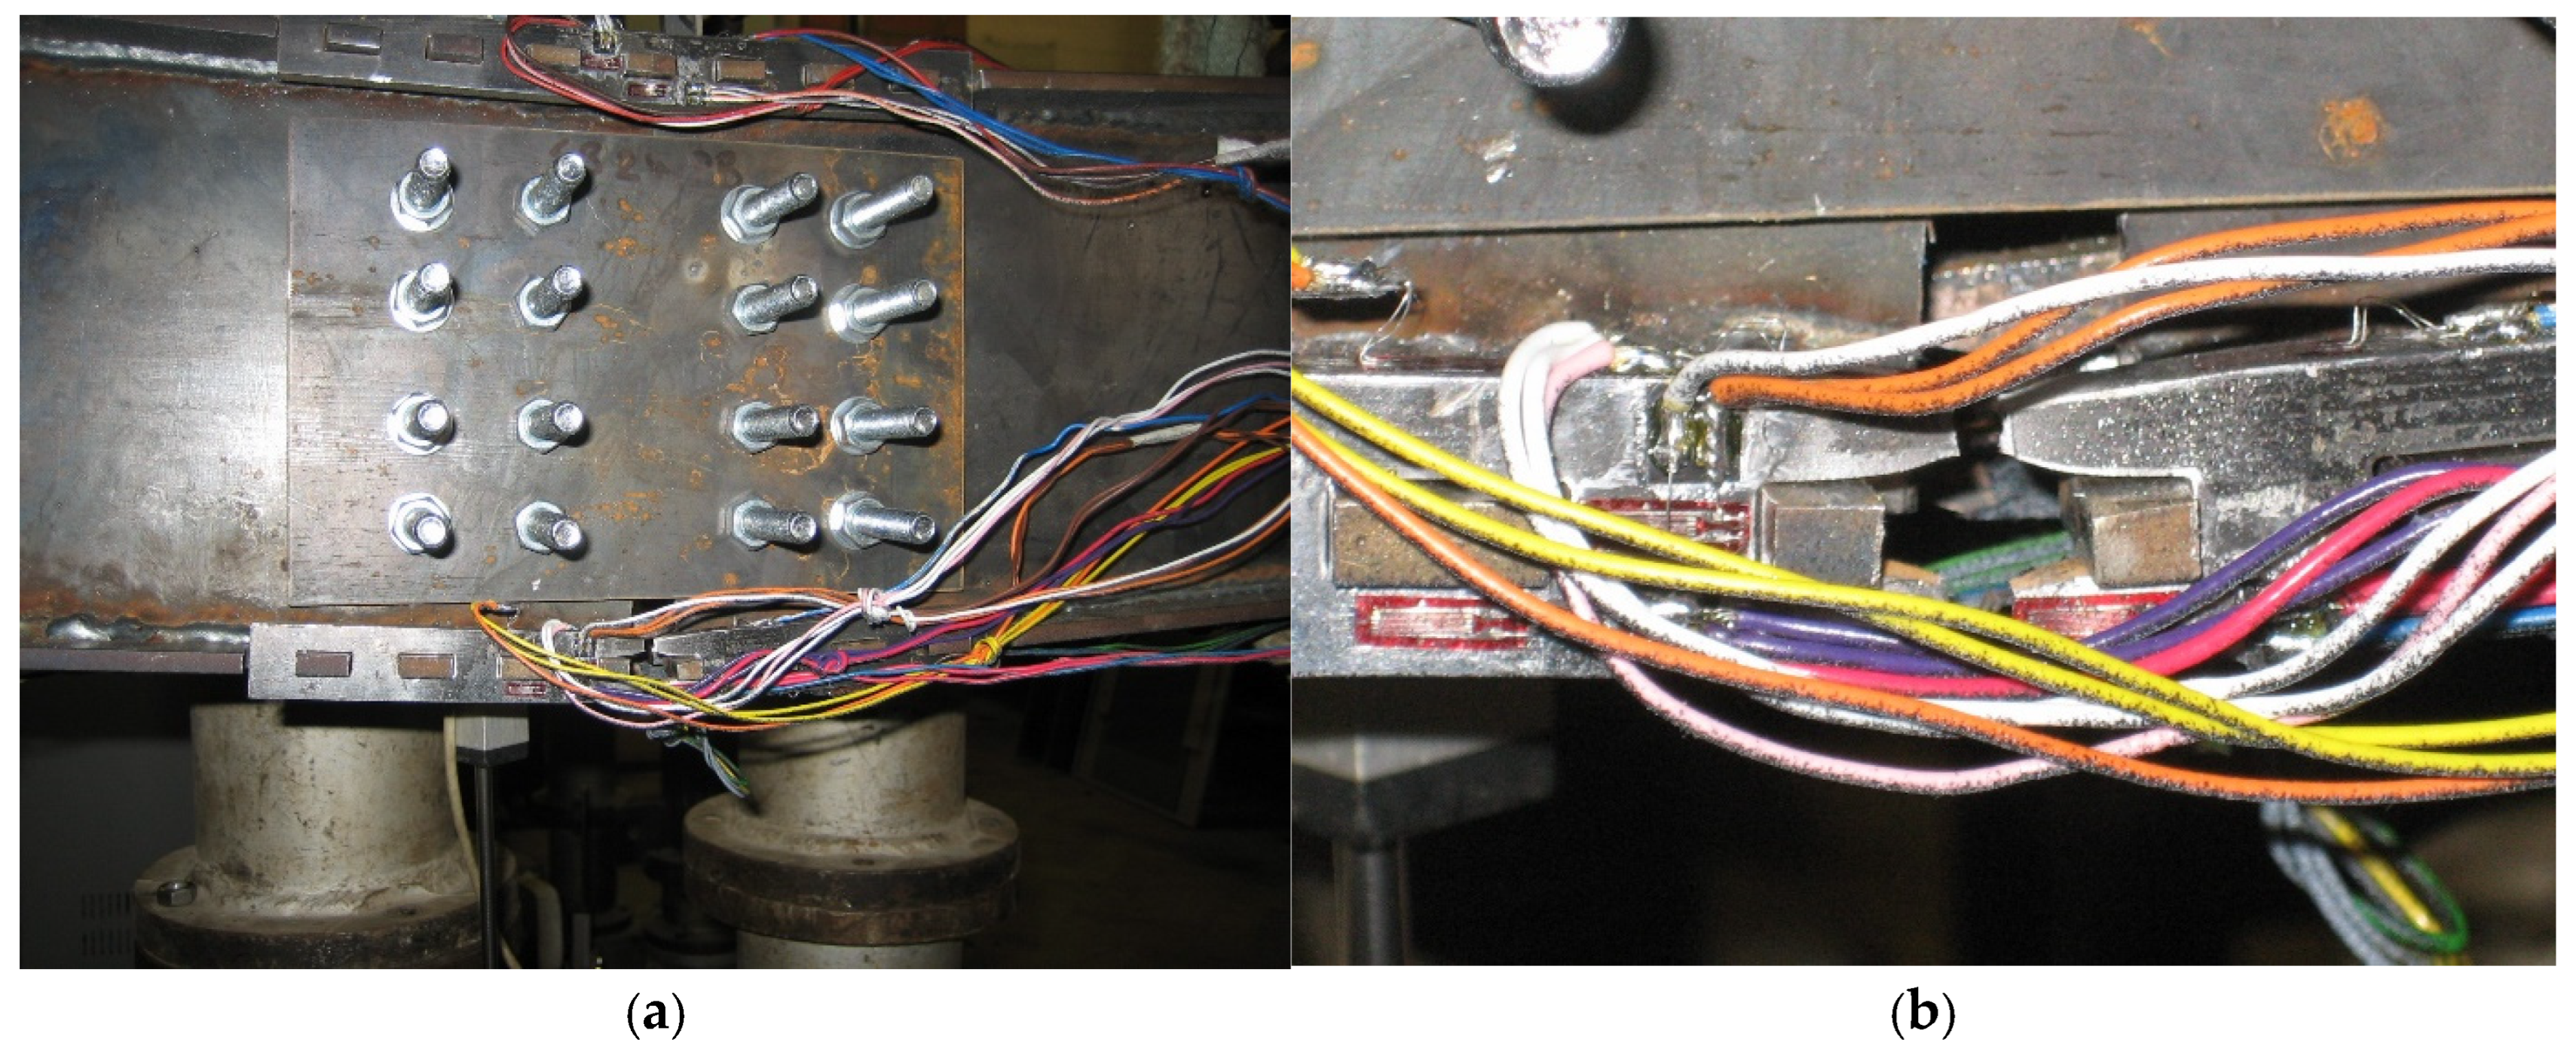
Test 2 was a built-up beam bending moment test conducted utilising a displacement control procedure. Figure 14 displays the data recorded by the LVDT1. During the linear response, the top beam flanges moved closer together, while the bottom flanges went farther apart. At a load of 17 kN, the specimen began to yield about a displacement of 4 mm. However, the decrease in strength did not begin until later (at a displacement of 36 mm), indicating a substantial level of specimen ductility. Throughout the test, a maximum load of 38.9 kN was measured. After the peak load has been reached, the various connecting elements continue to deform irreversibly. As indicated in Figure 15a, the connection failed due to a fracture at the centre of the two bottom side plates where the two beams interface. As depicted in Figure 15b, the two built-up beams were disengaged from each other when the fracture occurred at the centre of the two bottom side plates.
Figure 14.
Test 2 total load vs. vertical LVDT1 displacement.
Figure 15.
(a) Experimental failure mode for the second built-up beam in bending incorporating the intermeshed steel connection. (b) Experimental failure mode showing the two built-up beams are disengaged from each other.
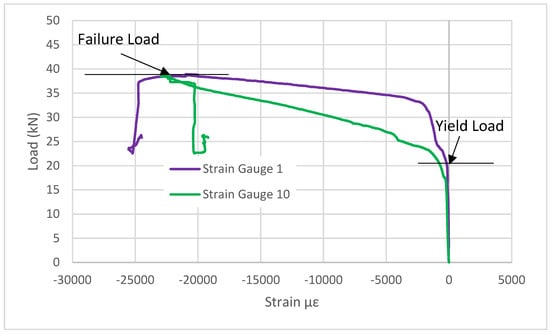
The load versus axial strain data of Test 2 is presented in Figure 16. During the first stage of loading, all elements in the connection behaved elastically. Inelastic behaviour was first observed at a later stage of loading and it started in the side plates at about 17 kN load. Before this load level, the two strain gauges (SG1 and SG10) on the two beams revealed linear elastic behaviour. Beyond this load level, the two strain gauges (SG1 and SG10) exhibited inelastic plastic behaviour with considerable deformation until a load of 38.9 kN was reached, at which point the compressive strain reached −22,500 με and the beams failed due to tension in the centre of the two bottom-flange side plates of the connection (at the extreme tension fibres) at the interface between the two beams. This was the same failure mode as reported in Test 1.
Figure 16.
Test 2 total vertical load vs. different compressive strains from strain gauges (SG1 and SG10).
3.3. Test 3 Results
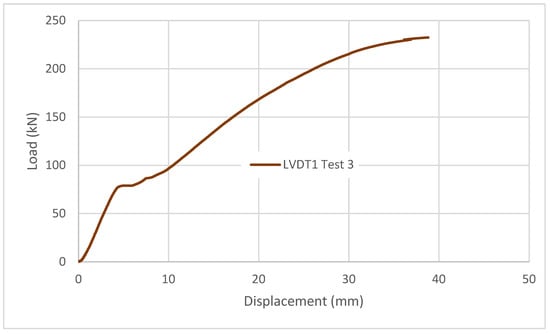
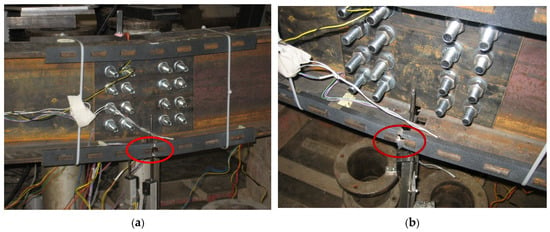
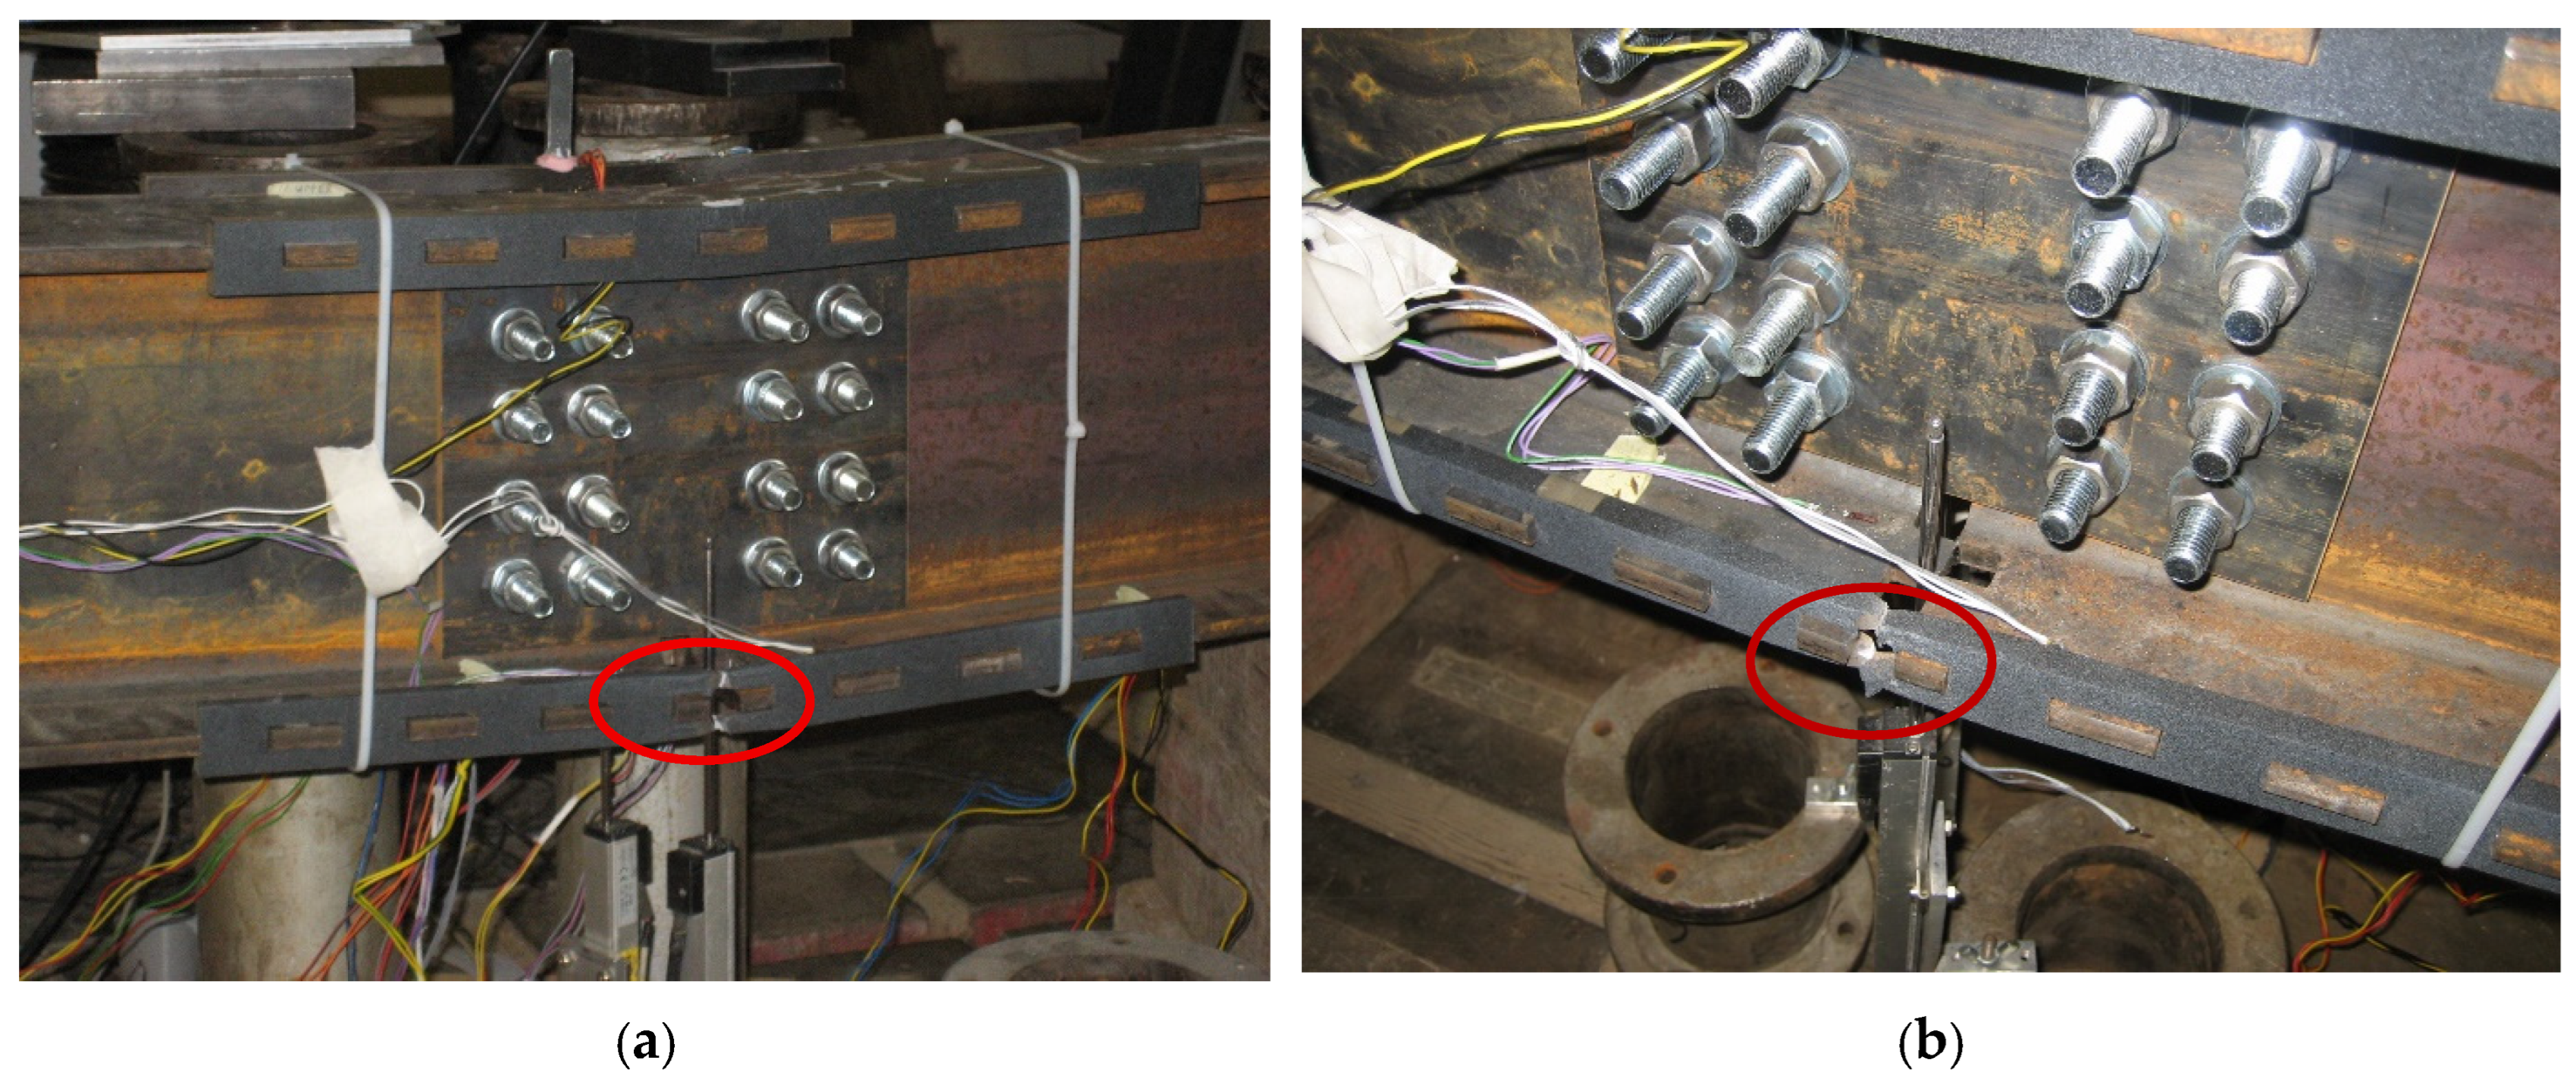
Test 3 was a standard (rolled) beam four-point bending moment test conducted utilising a displacement control procedure. Figure 17 displays the data recorded by the LVDT1. During the linear stage, the top-beam flanges moved closer together, while the bottom flanges went farther apart. At a load of 78.5 kN, the specimen began to yield around a displacement of 4.7 mm. However, strength loss did not begin until later (at a displacement of 39 mm), indicating a substantial level of specimen ductility. Throughout the test, a maximum load of 232.5 kN was measured. After the peak load has been reached, the various connecting elements continue to deform inelastically. As indicated in Figure 18a, the connection failed due to a fracture at the centre of the two bottom side plates at the interface between the two beams. As depicted in Figure 18b, the two standard beams disengaged from each other when the two bottom side plates fractured.
Figure 17.
Test 3 total load vs. vertical LVDT1 displacement.
Figure 18.
(a) Experimental failure mode of the standard (rolled) beam in bending incorporating the intermeshed steel connection. (b) Close-up view of experimental failure mode showing that the two standard beams are disengaged from each other.
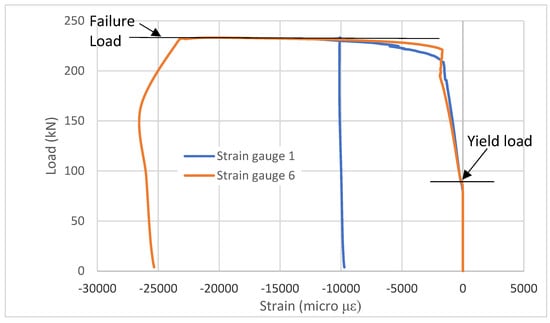
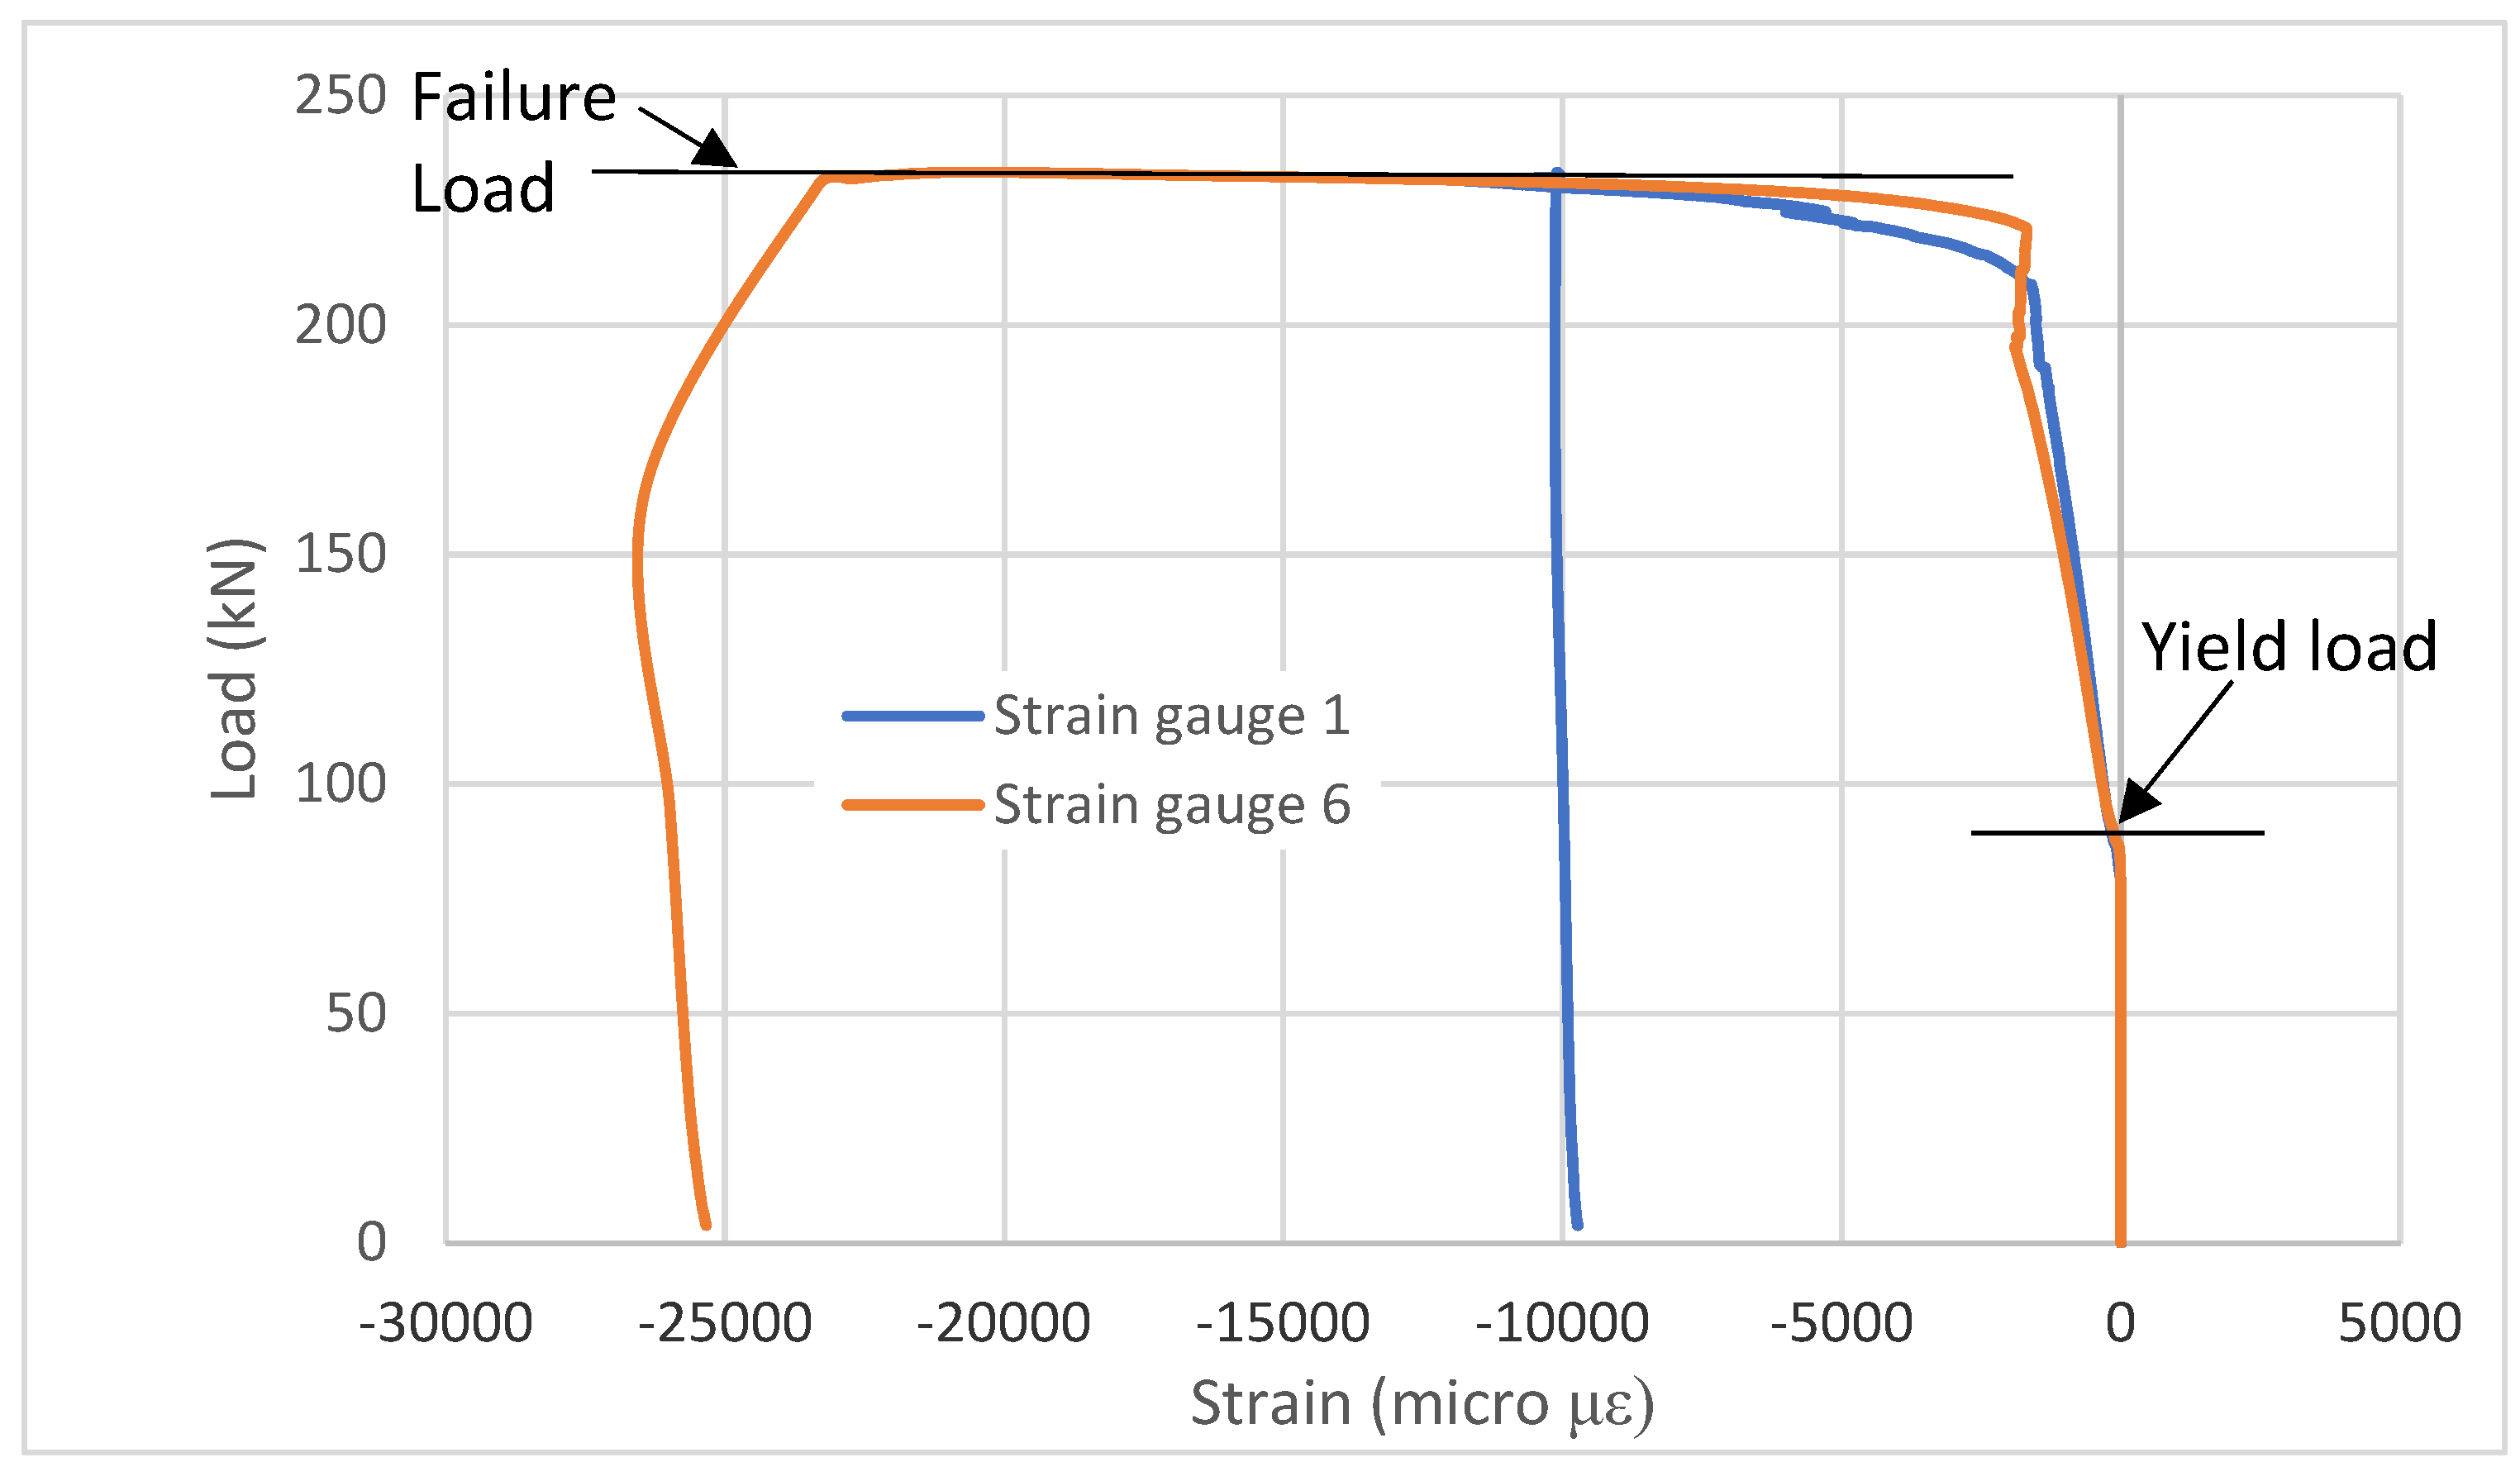
Figure 19 shows the load versus compressive axial strain data from Test 3. All elements in the connection behaved elastically during the first stage of loading. Inelastic behaviour was first observed later in the loading process, beginning in the side plates at around 78.5 kN load. The two strain gauges (SG1 and SG6) on the two beams revealed linear elastic behaviour prior to this load level. Beyond this load level, the two strain gauges (SG1 and SG6) exhibited inelastic plastic behaviour with significant deformation until a load of 232.5 kN was reached, at which point the compressive strain reaches −23,000 με and the beams failed due to tension at the centre of the two bottom-flange side plates of the connection (at the extreme tension fibres).
Figure 19.
Test 3 total vertical load vs. different compressive strains from strain gauges (SG1 and SG6).
3.4. Test 4 Results
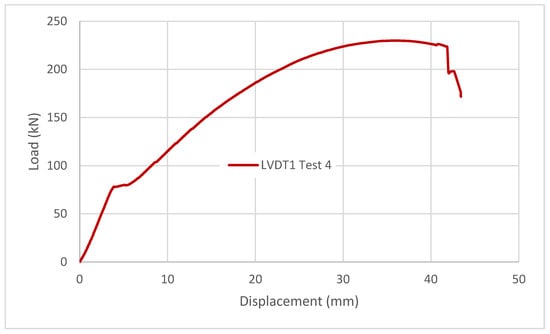
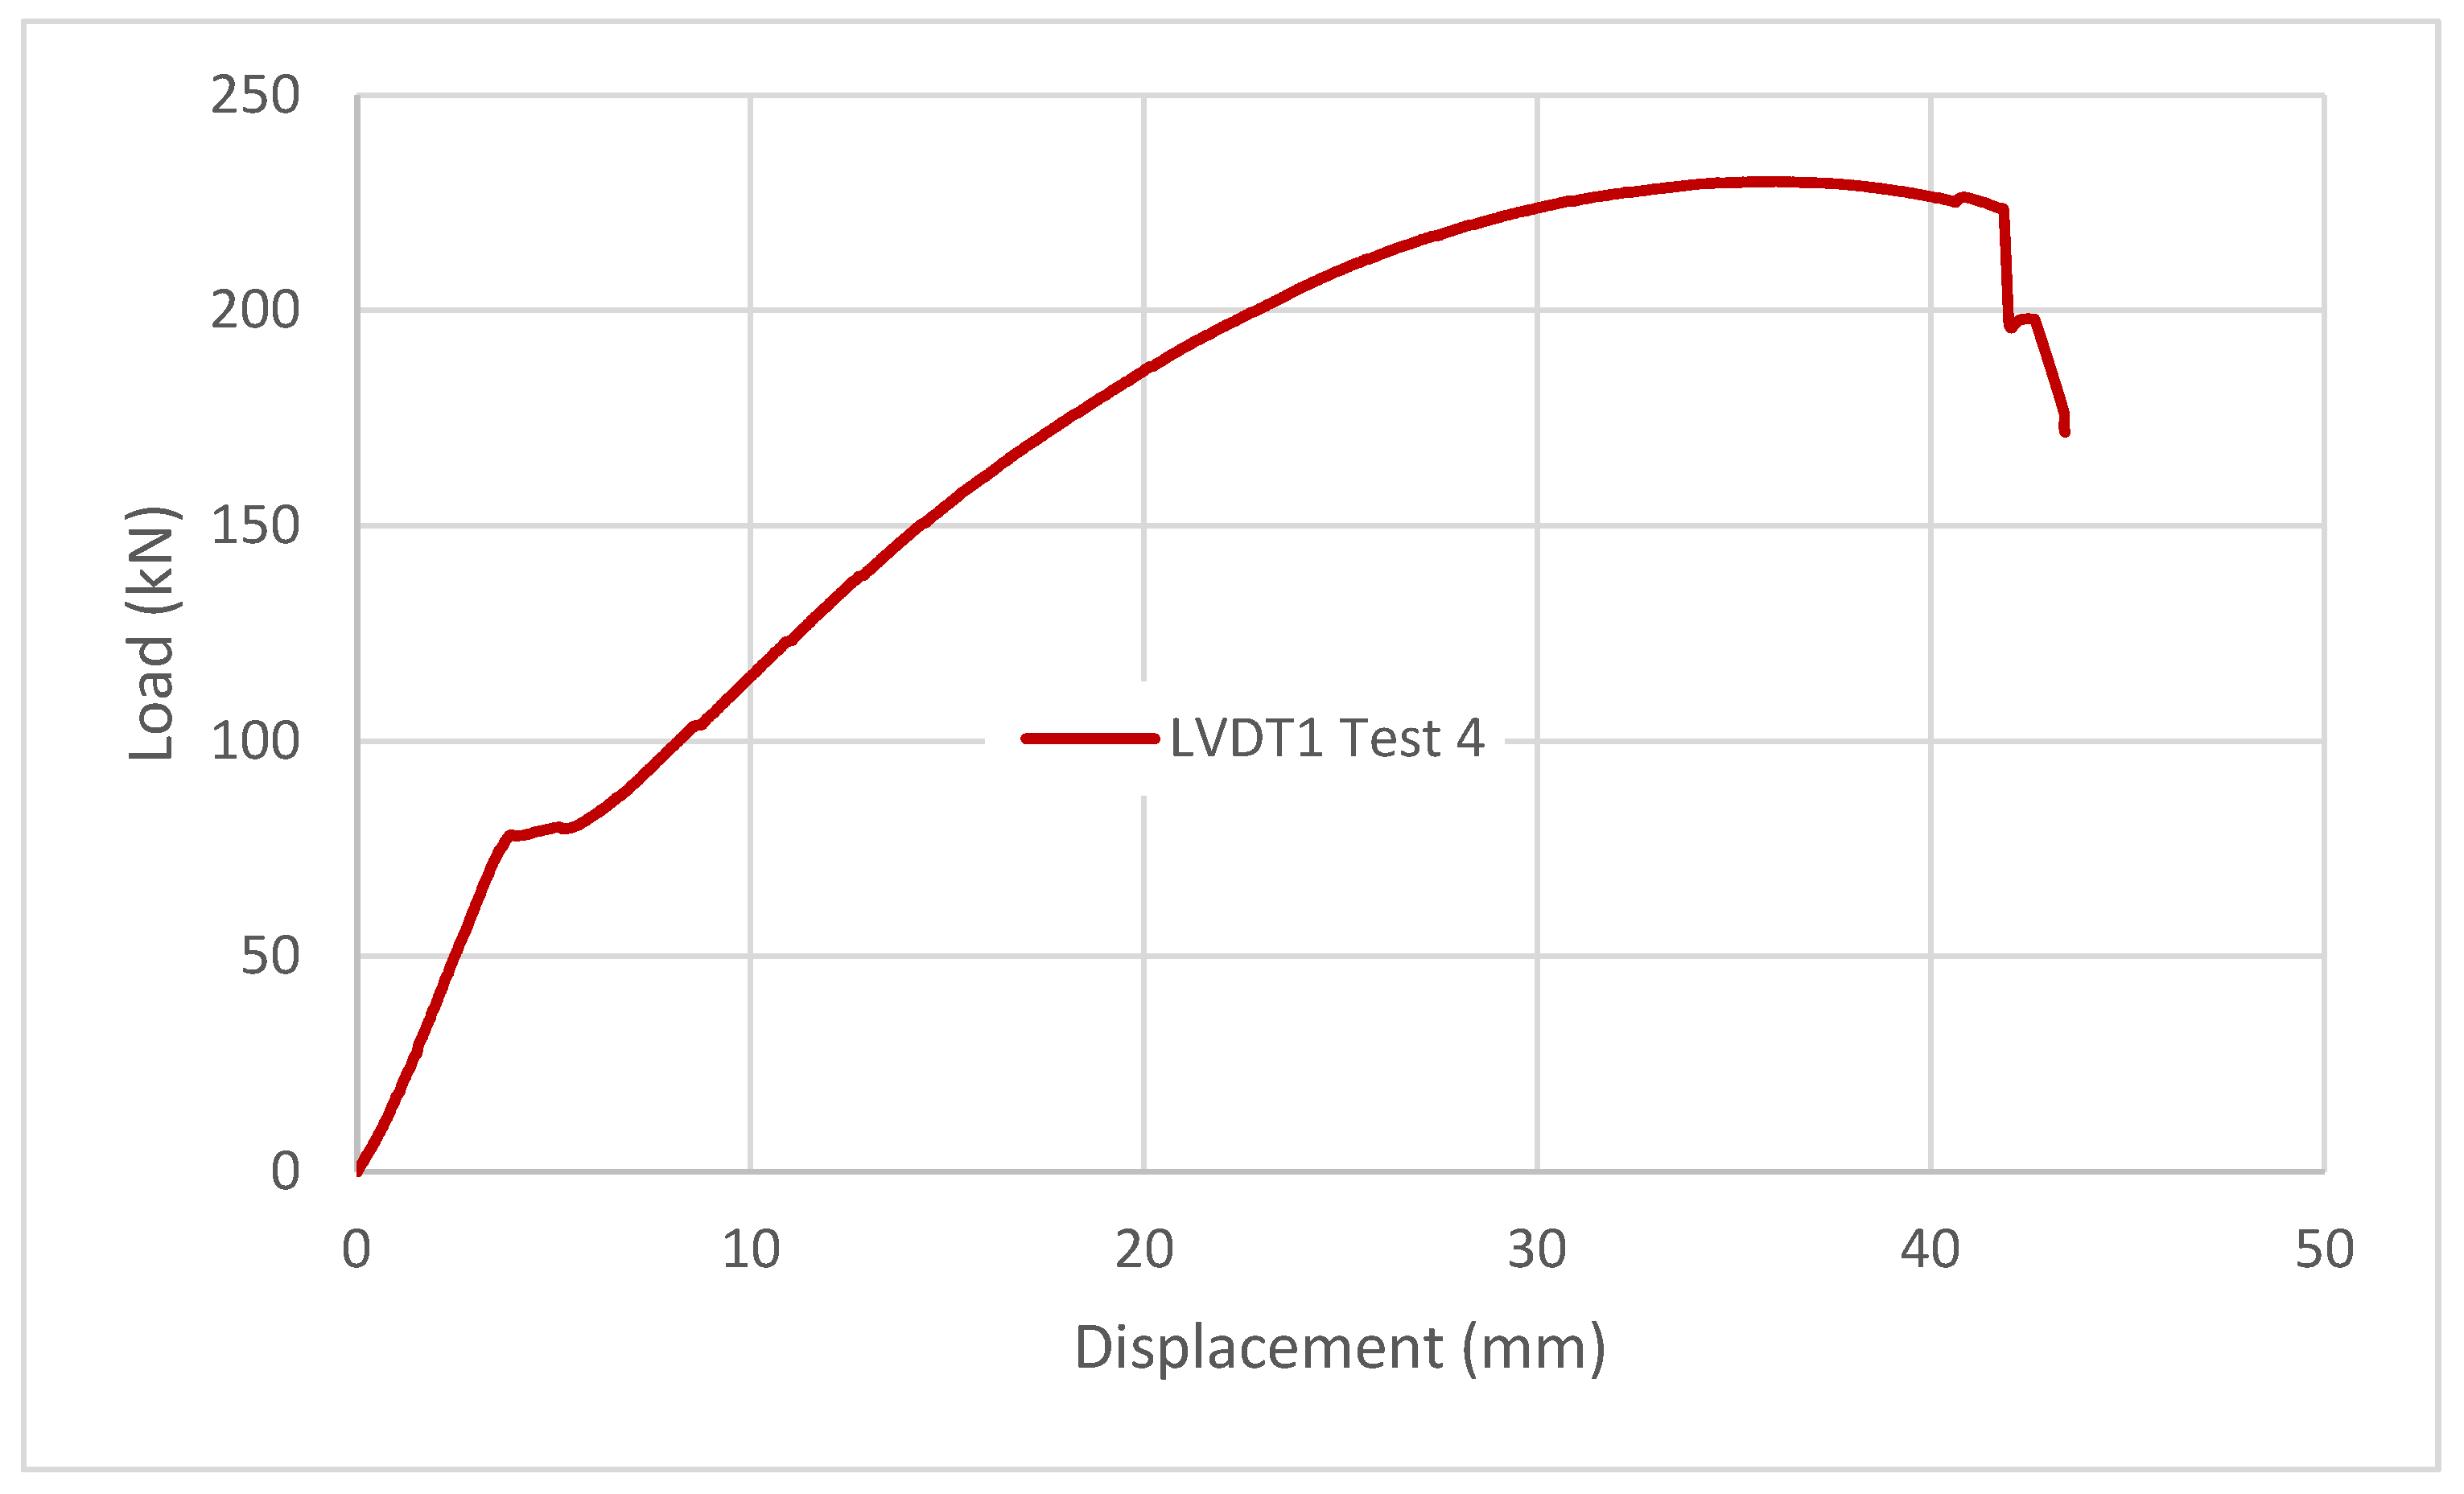
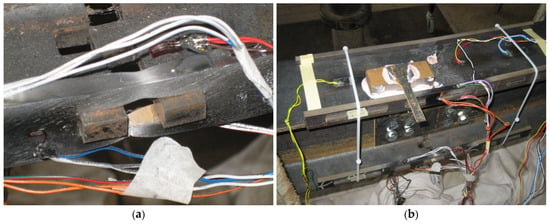
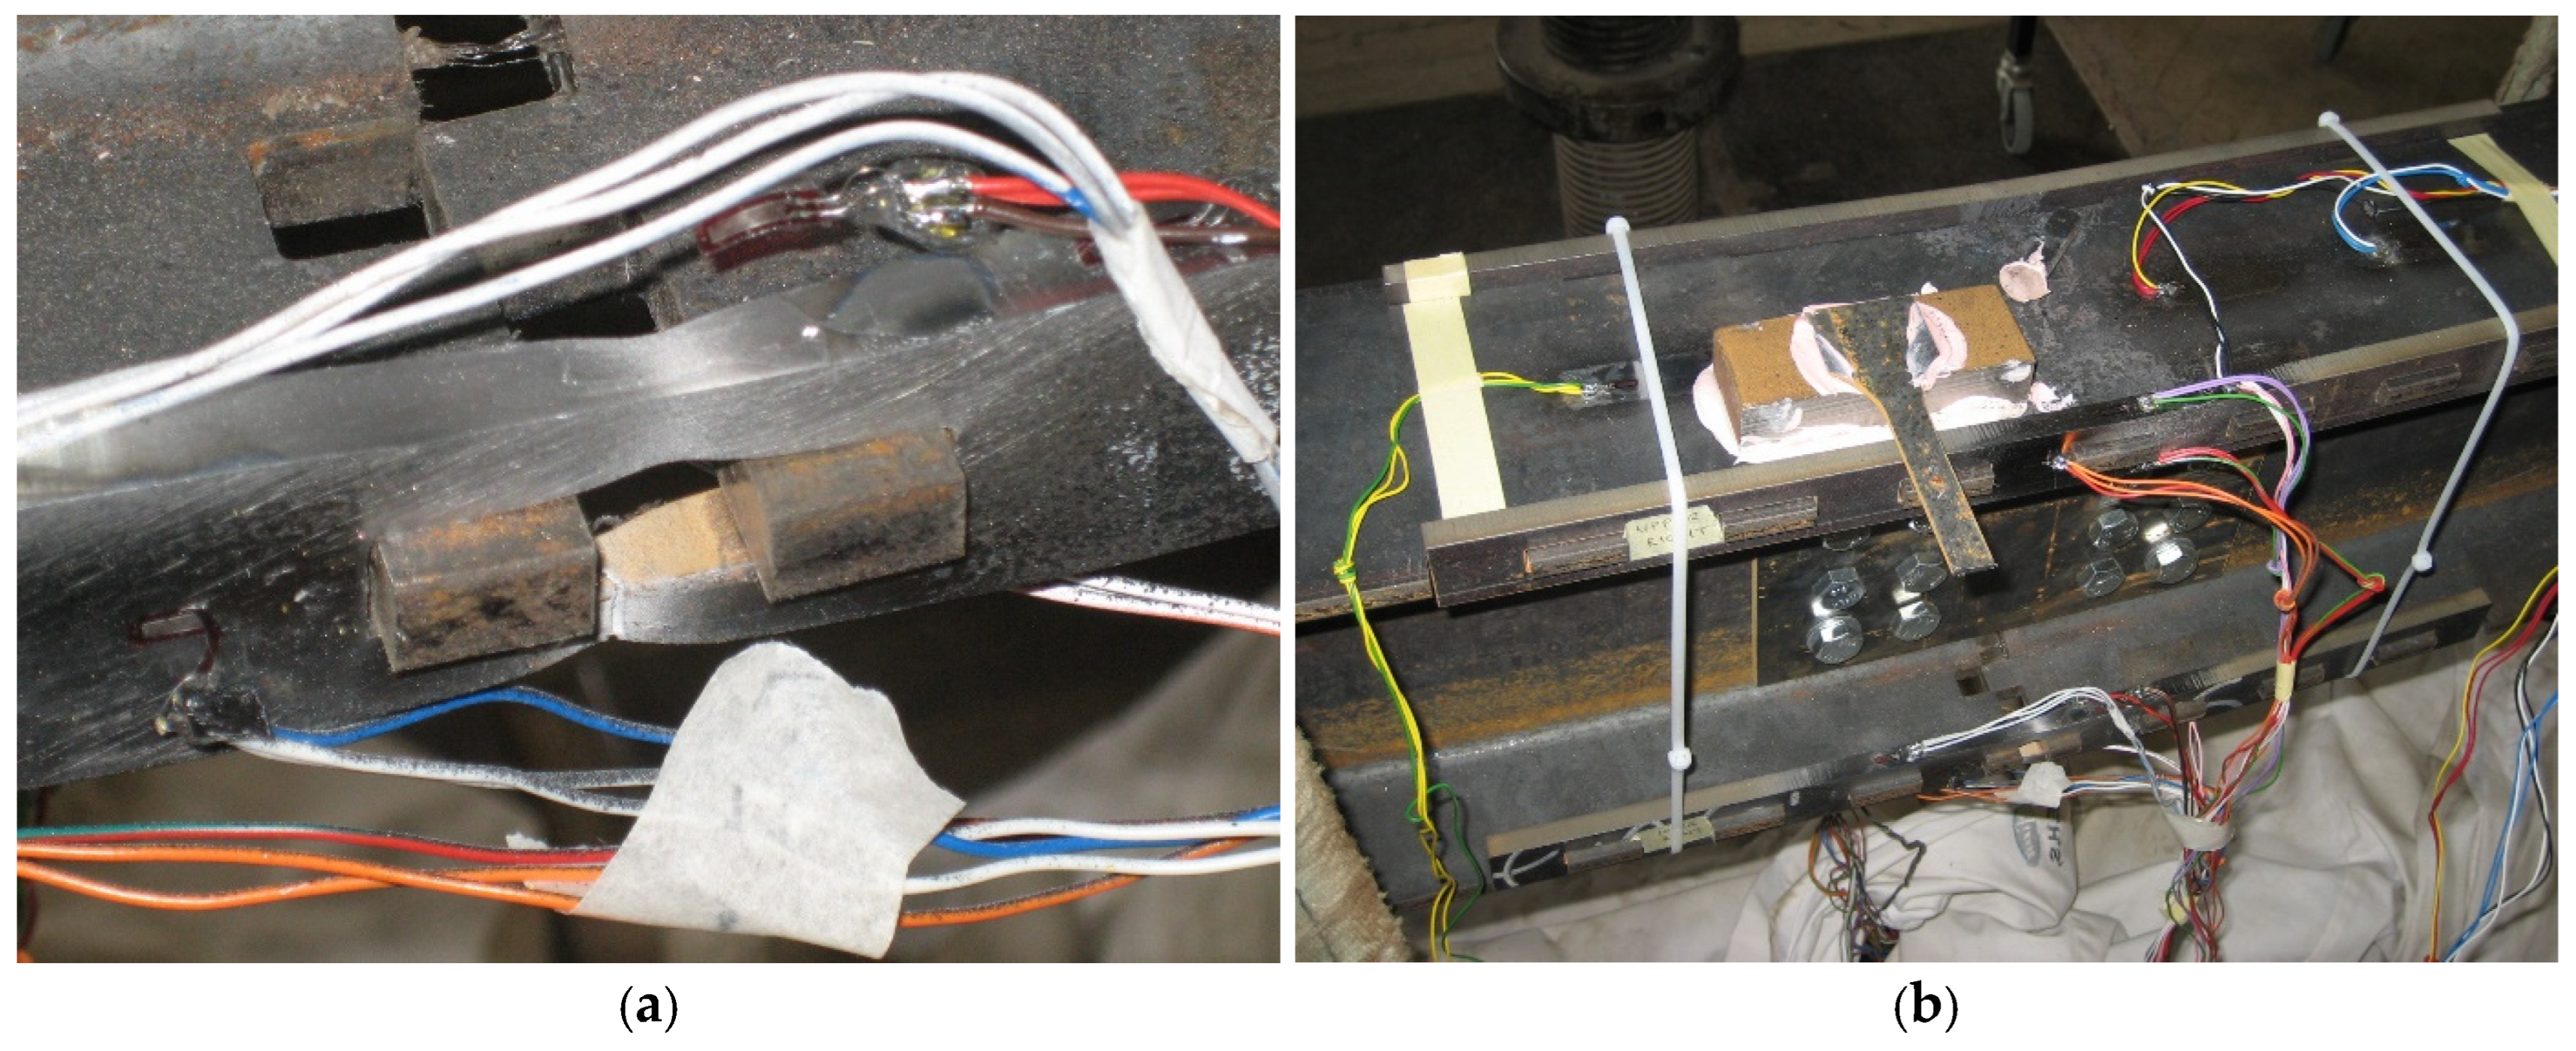
Test 4 was a standard (rolled) beam under four-point bending moment loading that was performed with a displacement control procedure. The data recorded by the LVDT1 is shown in Figure 20. The top beam flanges moved closer together during the linear stage, while the bottom flanges moved farther apart. The specimen began to yield around 4.5 mm after a load of 78.3 kN. However, strength loss did not occur until a displacement of 37 mm, indicating that the specimen was ductile. A maximum load of 229.9 kN was measured throughout the test. After reaching the peak load, the various connecting elements continue to deform inelastically. As illustrated in Figure 21a, the connection failed due to fracturing in the centre of each of the two bottom side plates. As shown in Figure 21b, at that point the bottom of the two beams began to disengage from each other.
Figure 20.
Test 4 total load vs. vertical LVDT1 displacement.
Figure 21.
(a) Experimental failure mode of standard (rolled) beam with the intermeshed steel connection in bending. (b) Close-up view of experimental failure mode showing that the two standard beams are detached from each other.
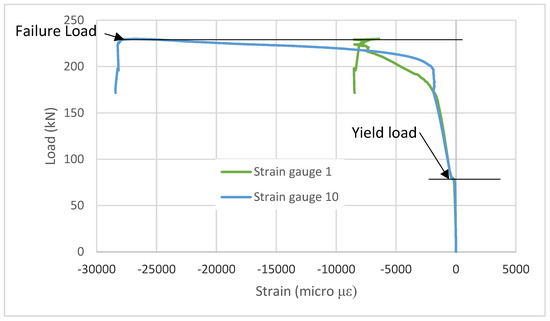
Two strain gauges on the standard beam recorded higher inelastic behaviour than the other strain gauges. Figure 22 is showing the vertical load vs. compressive axial strain data for the standard beam. A comparison between the curves in the above graph showed that initiation of plasticity started at a load of 78.3 kN. At this load level, two strain gauges (SG1 and SG10) on the two beams indicated linear elastic behaviour. Beyond this load level, the two strain gauges (SG1 and SG10) exhibited inelastic plastic behaviour with significant deformation until a load of 229.9 kN was applied when the compressive strain reached −27,822 με and the beams failed due to tension in the centre of the two lower-flange side plates (at the extreme tension fibres).
Figure 22.
Test 4 total vertical load vs. different axial compressive strains from strain gauges (SG1 and SG10).
4. Numerical Analysis of the Built-Up Beam in Bending
In the case of the experimental study of the intermeshed connection, it was not possible to install strain gages in the teeth and bolts, since they were encased by the side and web plates respectively. Therefore, there is no test data to indicate whether bolts experienced plasticity or to determine the load share for each tooth. To answer these and other questions, a finite element model was developed for each test specimen and nonlinear analyses were conducted for both verification and investigation. Such a model can help to better understand the behaviour of the intermeshed connection by learning in detail the underlying mechanics behind the phenomena observed during the experimental testing. The FE simulations were performed in Abaqus, which is capable of handling material and geometrical nonlinearity, as well as contact between individual surfaces.
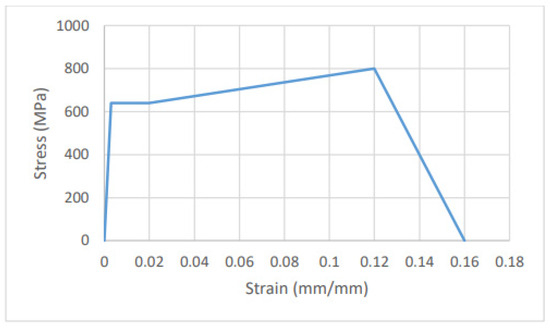
The material behaviour was characterised with uniaxial tensile tests in accordance with BS EN ISO 6892-1 [32]. This behaviour was then introduced to Abaqus using a stress–strain curve. Figure 23 shows the average engineering stress–strain curve for the built-up beam that was implemented in Abaqus. Isotropic hardening was considered to describe the deformation hardening behaviour for a material under monotonic loading. Isotropic hardening assumes that the initial yield surface expands uniformly without distortion or translation as plasticity develops. Figure 24 shows the material model used in Abaqus for the grade 8.8 M8 bolts.
Figure 23.
Average engineering stress–strain curve for the built-up beam introduced in Abaqus.
Figure 24.
Material model used in Abaqus for the M8 bolts grade 8.8 [33].
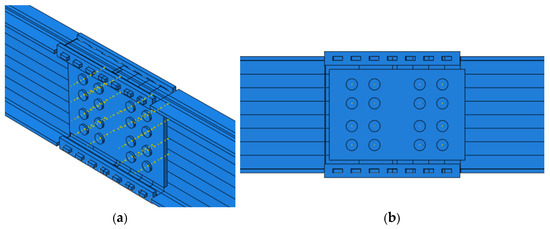
Figure 25 shows the connection simulated in Abaqus. In order to increase the accuracy of the model, the small geometric details were also incorporated in the Abaqus model including tolerances and special side plate shapes. Furthermore, to match the experimental design, no gap was introduced at the location where the beams interface at the centre of the connection.
Figure 25.
(a) 3D view of the built-up beam connection in Abaqus. (b) Side view of the built-up beam connection in Abaqus.
4.1. Model Assumptions for the Built-Up Beam
The intermeshed connection consists of multiple elements that work together through bearing and/or friction, or their combination, to transfer force and moment in the splice region. A key factor in modelling the connection properly is in understanding the interaction between different components of the connection. To do so, the potential contact area of each element and its counterpart should be determined, and the suitable contact properties should be assigned. This required modelling the contact behaviour and transfer of forces between the flange teeth and the side plates and between the bolts and the web plates, surface to surface contact with finite relative sliding was implemented using the general contact algorithm in Abaqus. It was assumed that all teeth were initially in contact. For the normal contact behaviour, the ‘penalty’ constraint enforcement method was employed using the default ‘hard’ contact pressure–overclosure relationship. Tangential behaviour was modelled using the default penalty friction formulation and the isotropic Coulomb friction model. A friction coefficient of 0.3 was selected based on early parametric studies by the authors [30].
No bolt pretension was introduced in the FE models, consistent with the experimental programme in which no prescribed bolt pretension was applied. Zero bolt-hole clearance was assumed, and the threaded and shank regions of the bolts were not modelled separately; instead, the bolts were idealised using a uniform geometry. Contact interactions at the bolt-to-hole, plate-to-beam, tooth-to-plate, and beam-end interfaces were represented using hard contact in the normal direction and a penalty formulation in the tangential direction. A uniform coefficient of friction of μ = 0.3 was assigned to all frictional contact interfaces, and no interface-specific friction coefficients were considered.
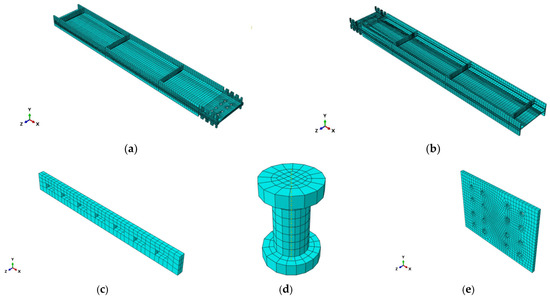
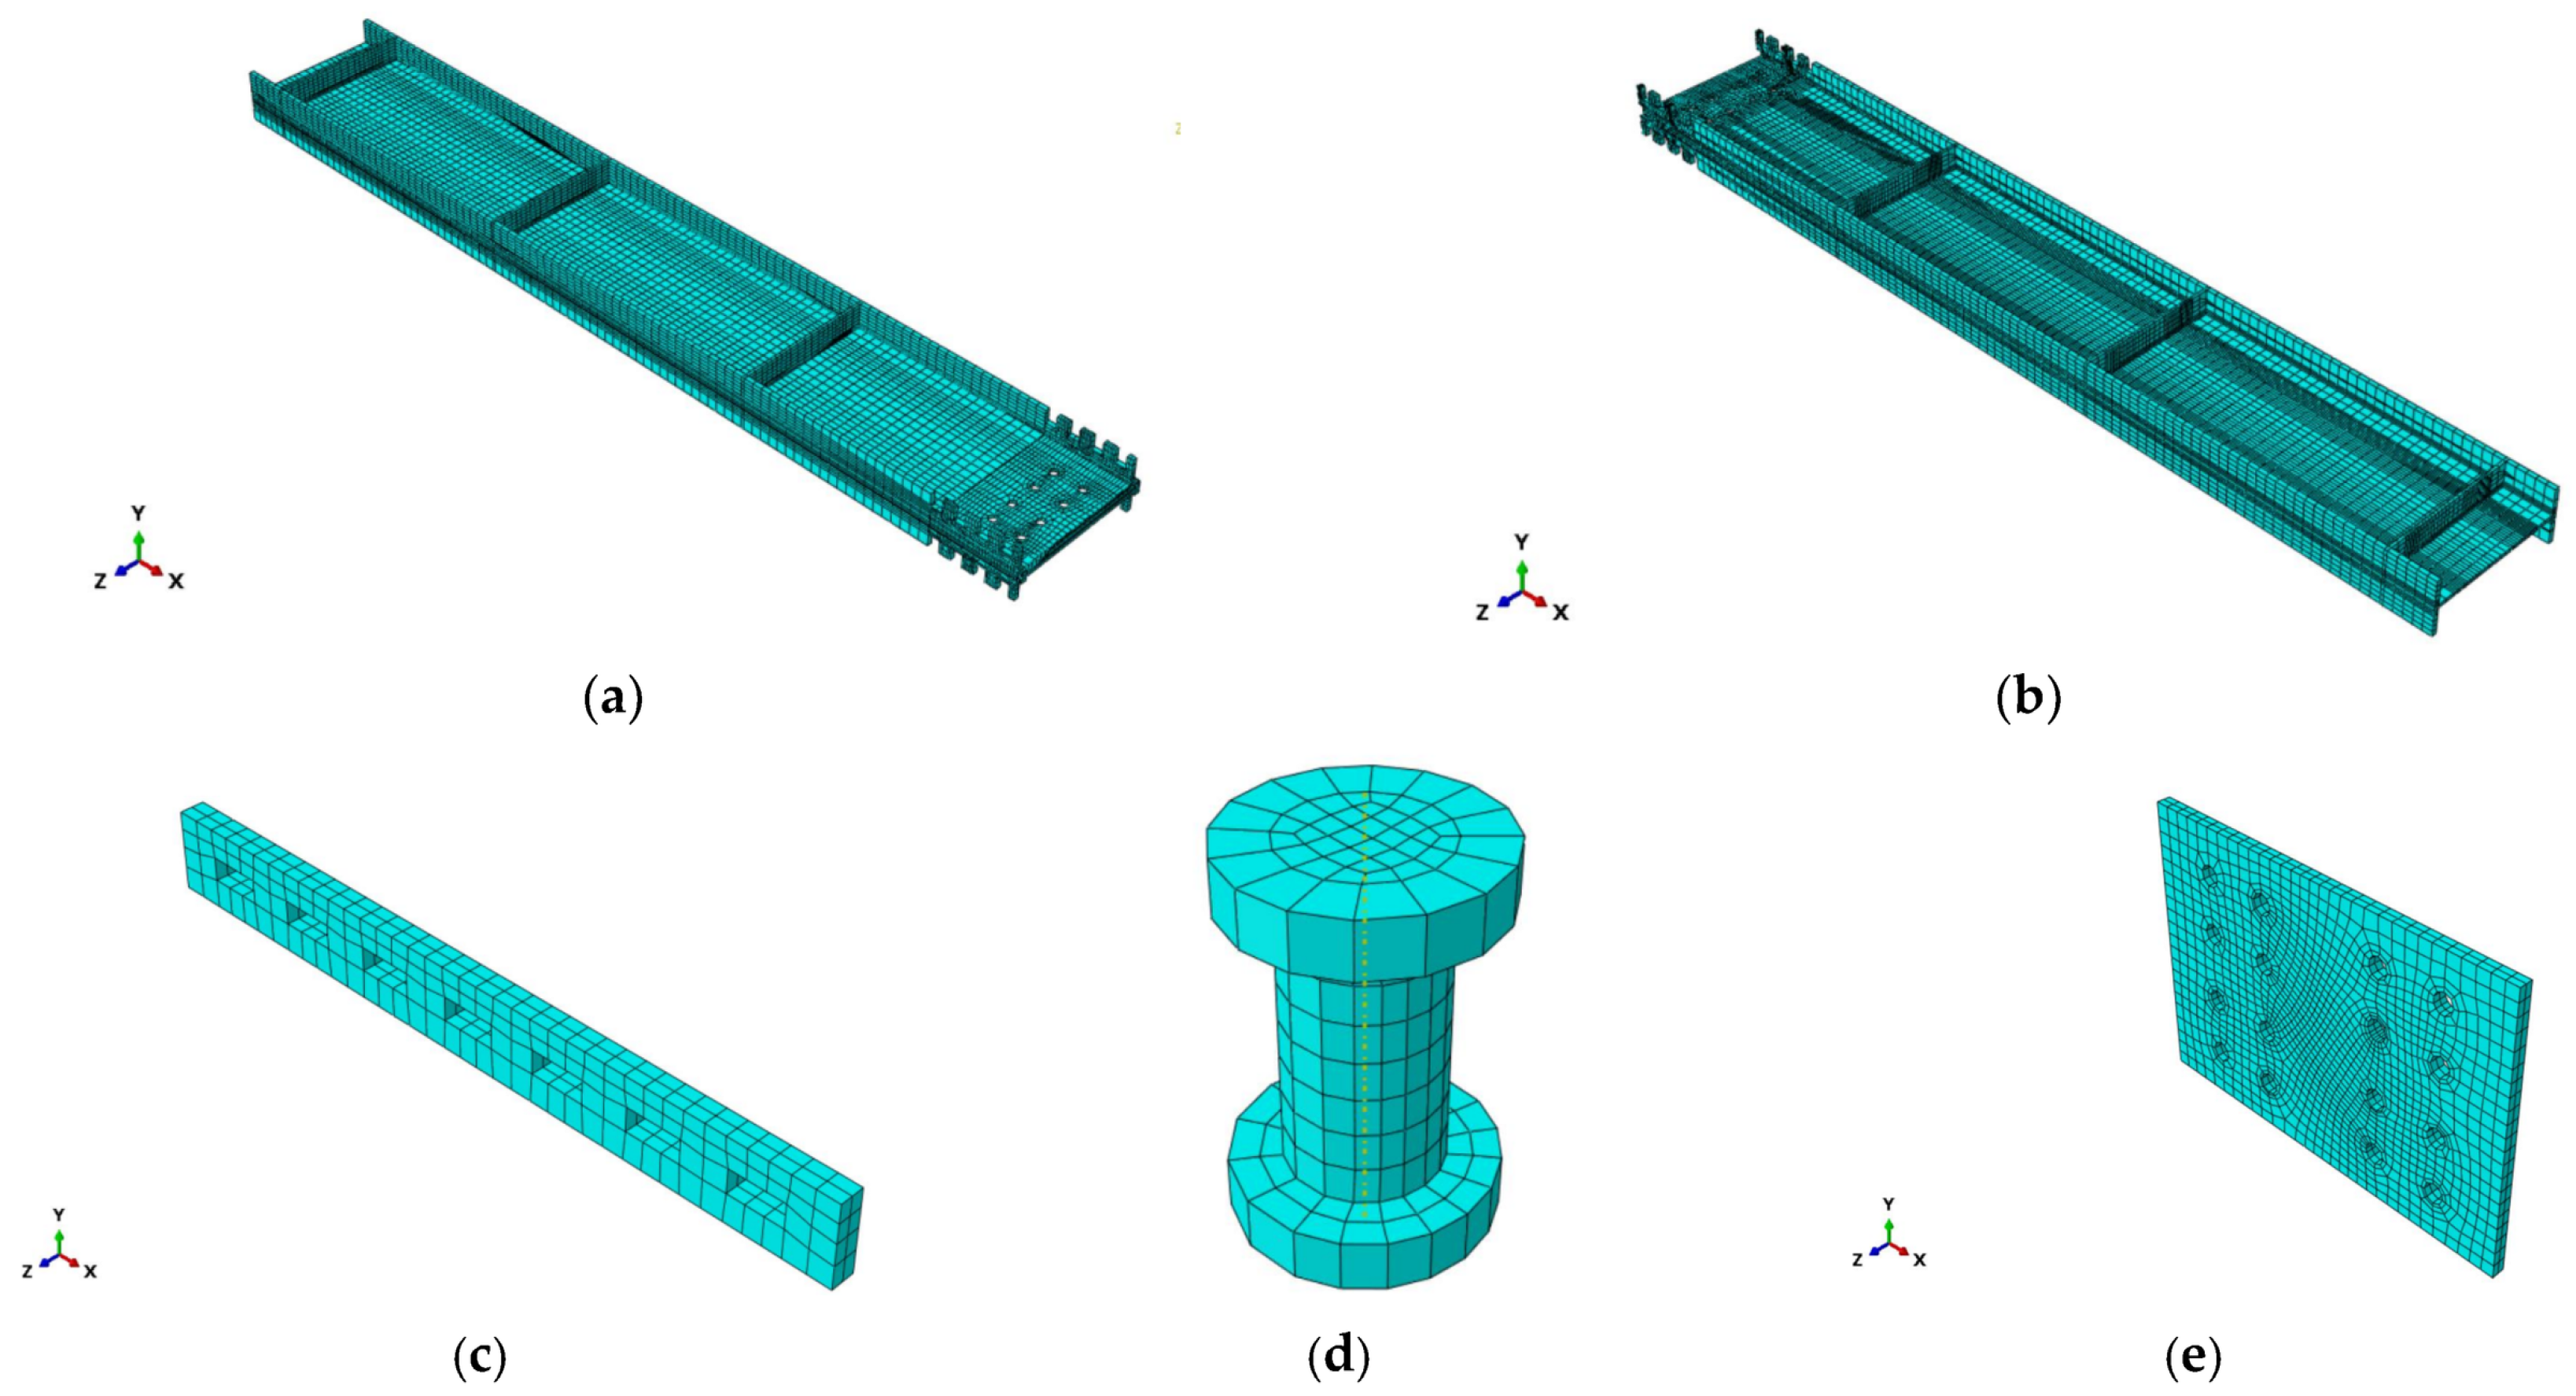
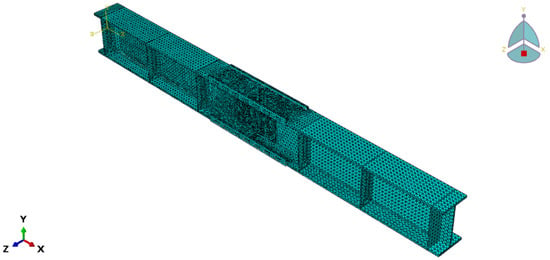
The structure was discretized by an 8-node 3-dimensional solid brick elements (C3D8R) with linear displacement interpolation, which is suitable for complex nonlinear analyses involving contact, plasticity, and large deformations. The mesh size was limited to a maximum of 3 mm in the flange side plates and web plate, as higher accuracy was needed in that region due to the likelihood of complex phenomena. For the M8 bolts, a mesh size of 2.1 mm was used. Everywhere else in the model, a coarser mesh was used which had a maximum mesh size of 10 mm. Notably, other mesh sizes and patterns were also tested at this stage but the mesh sizes above were found to be the optimal, as using a finer mesh did not increase the accuracy of the results. For the first built-up beam shown in Figure 26a, total of 19,546 elements were used. For the second built-up beam shown in Figure 26b, a total of 14,416 elements were used. For the flange side plate, a total of 608 elements was used as shown in Figure 26c. For the M8 bolts, a total of 336 elements was used as shown in Figure 26d, and for the web plate a total of 4656 elements was used as shown in Figure 26e.
Figure 26.
(a) Mesh density of the first built-up beam. (b) Mesh density of the second built-up beam. (c) Mesh density of the flange side plate. (d) Mesh density of the M8 bolts grade 8.8. (e) Mesh density of the web plate in Abaqus.
4.2. Loading and Boundary Conditions (Built-Up Beam)
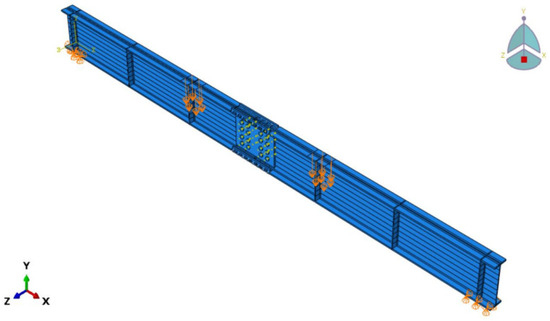
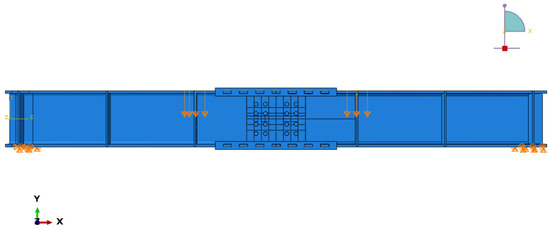
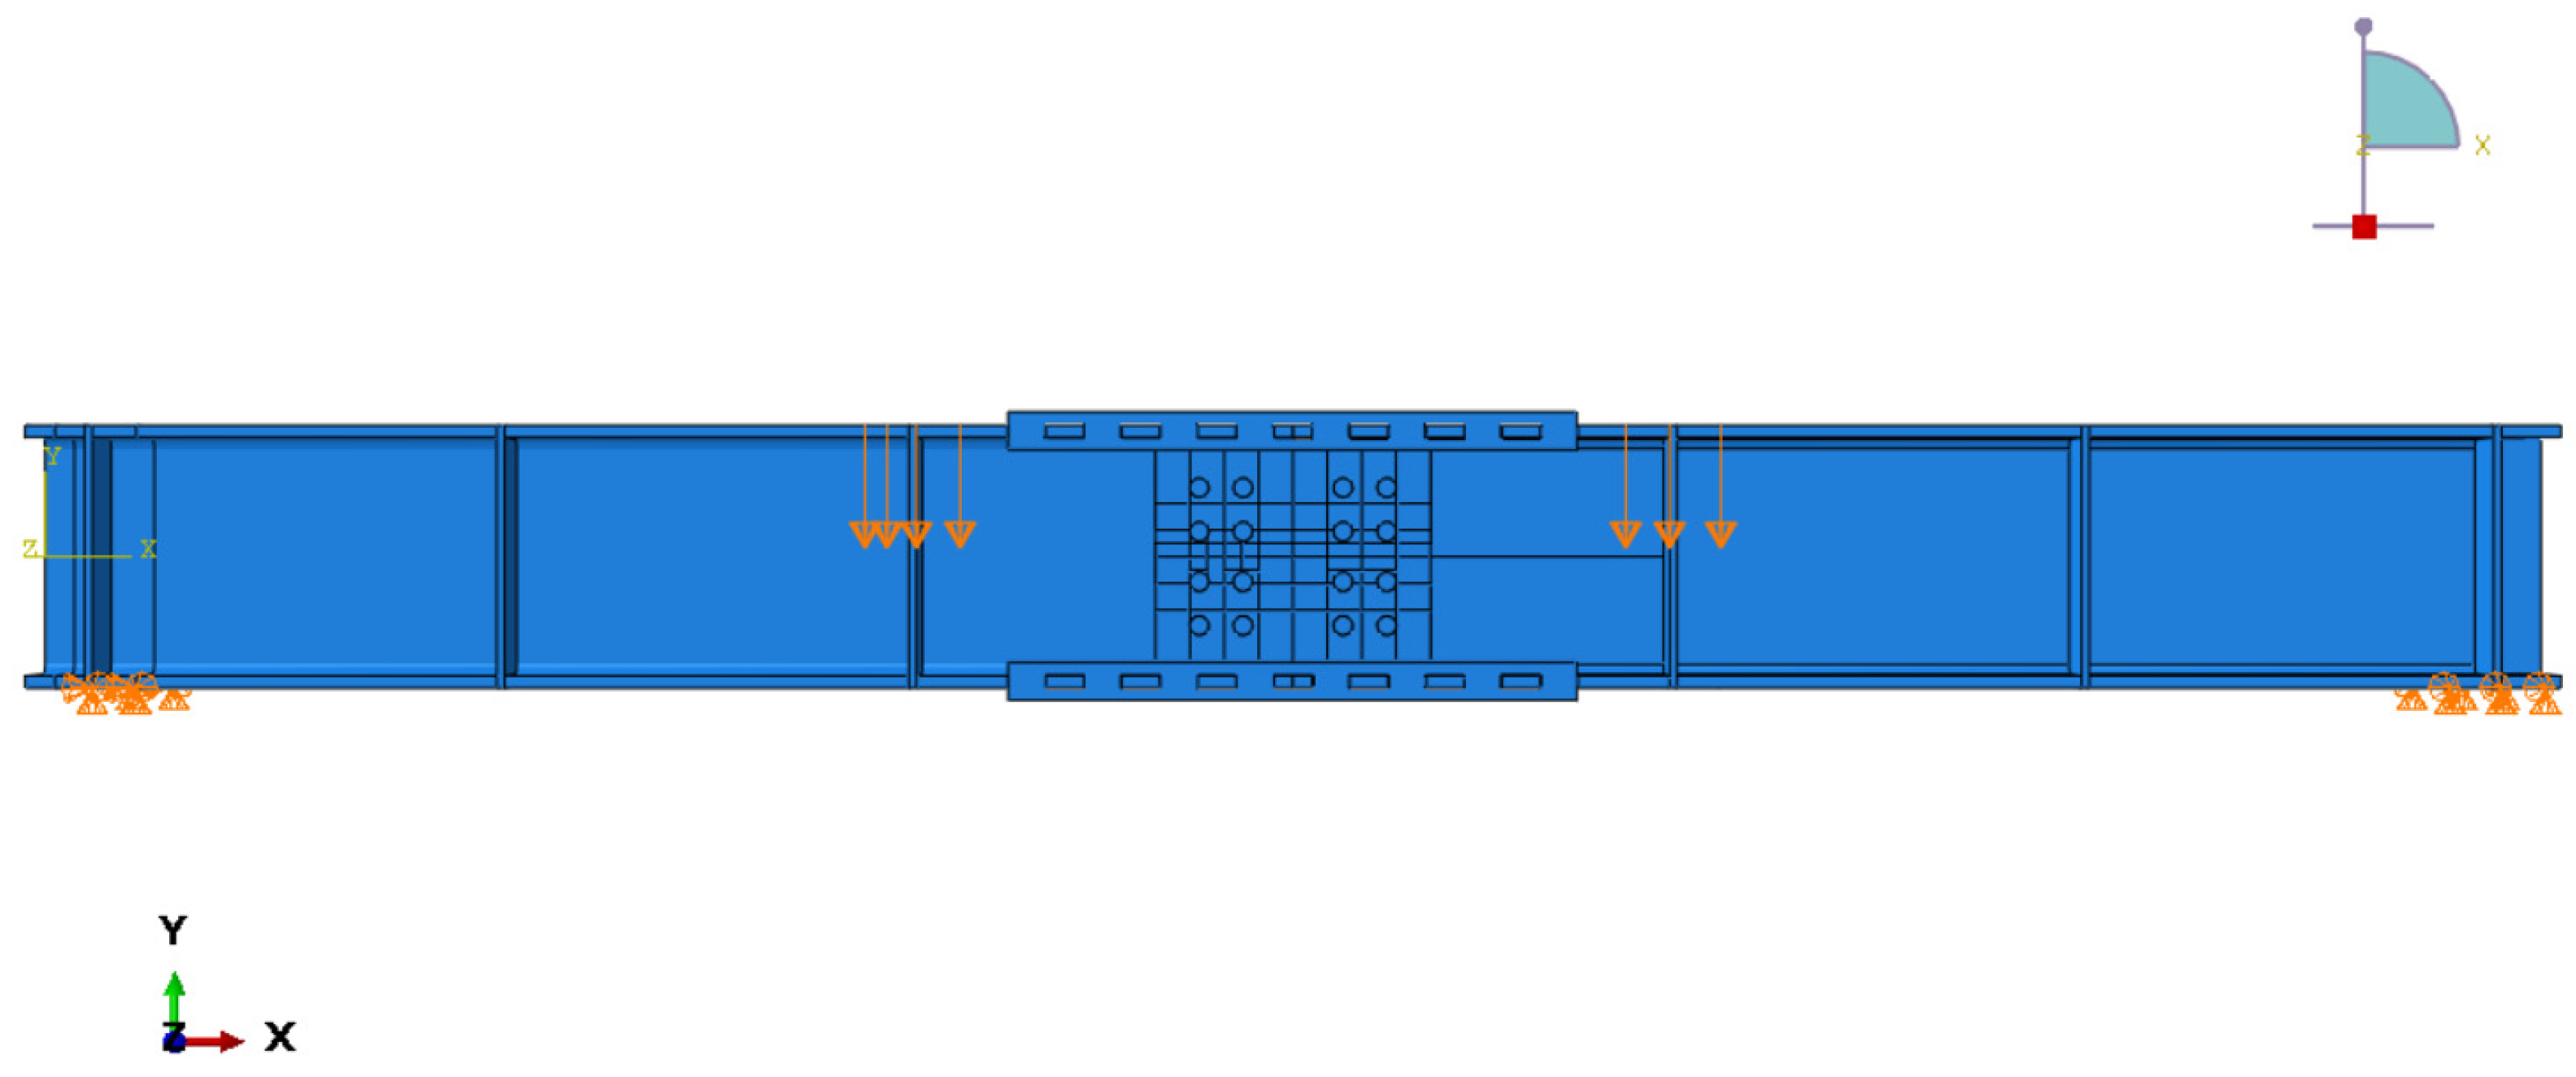
Two specimens using the built-up beam section with intermeshed connection in the middle were tested in the Heavy Structures Lab at Queen’s University Belfast as outlined in Section 2. The identical specimens had the same loading scenario as each section was tested under double-pressure loads. The experiments were conducted using a displacement control protocol at small increments. As a result, the testing procedure could be considered quasi-static since the inertial effects were negligible. Based on this description, a quasi-static Explicit Dynamic analysis was used, in which the jack displacement was applied to the loading areas of the specimen as shown in Figure 27.
Figure 27.
Loading and boundary conditions of the built-up beam sections in Abaqus.
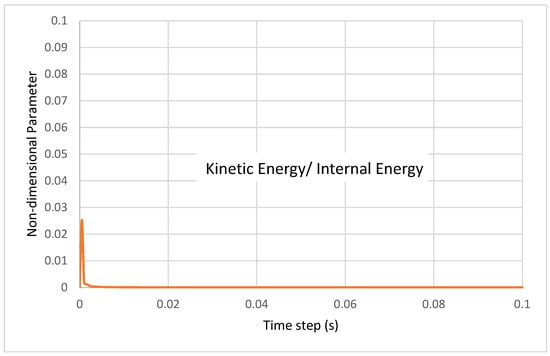
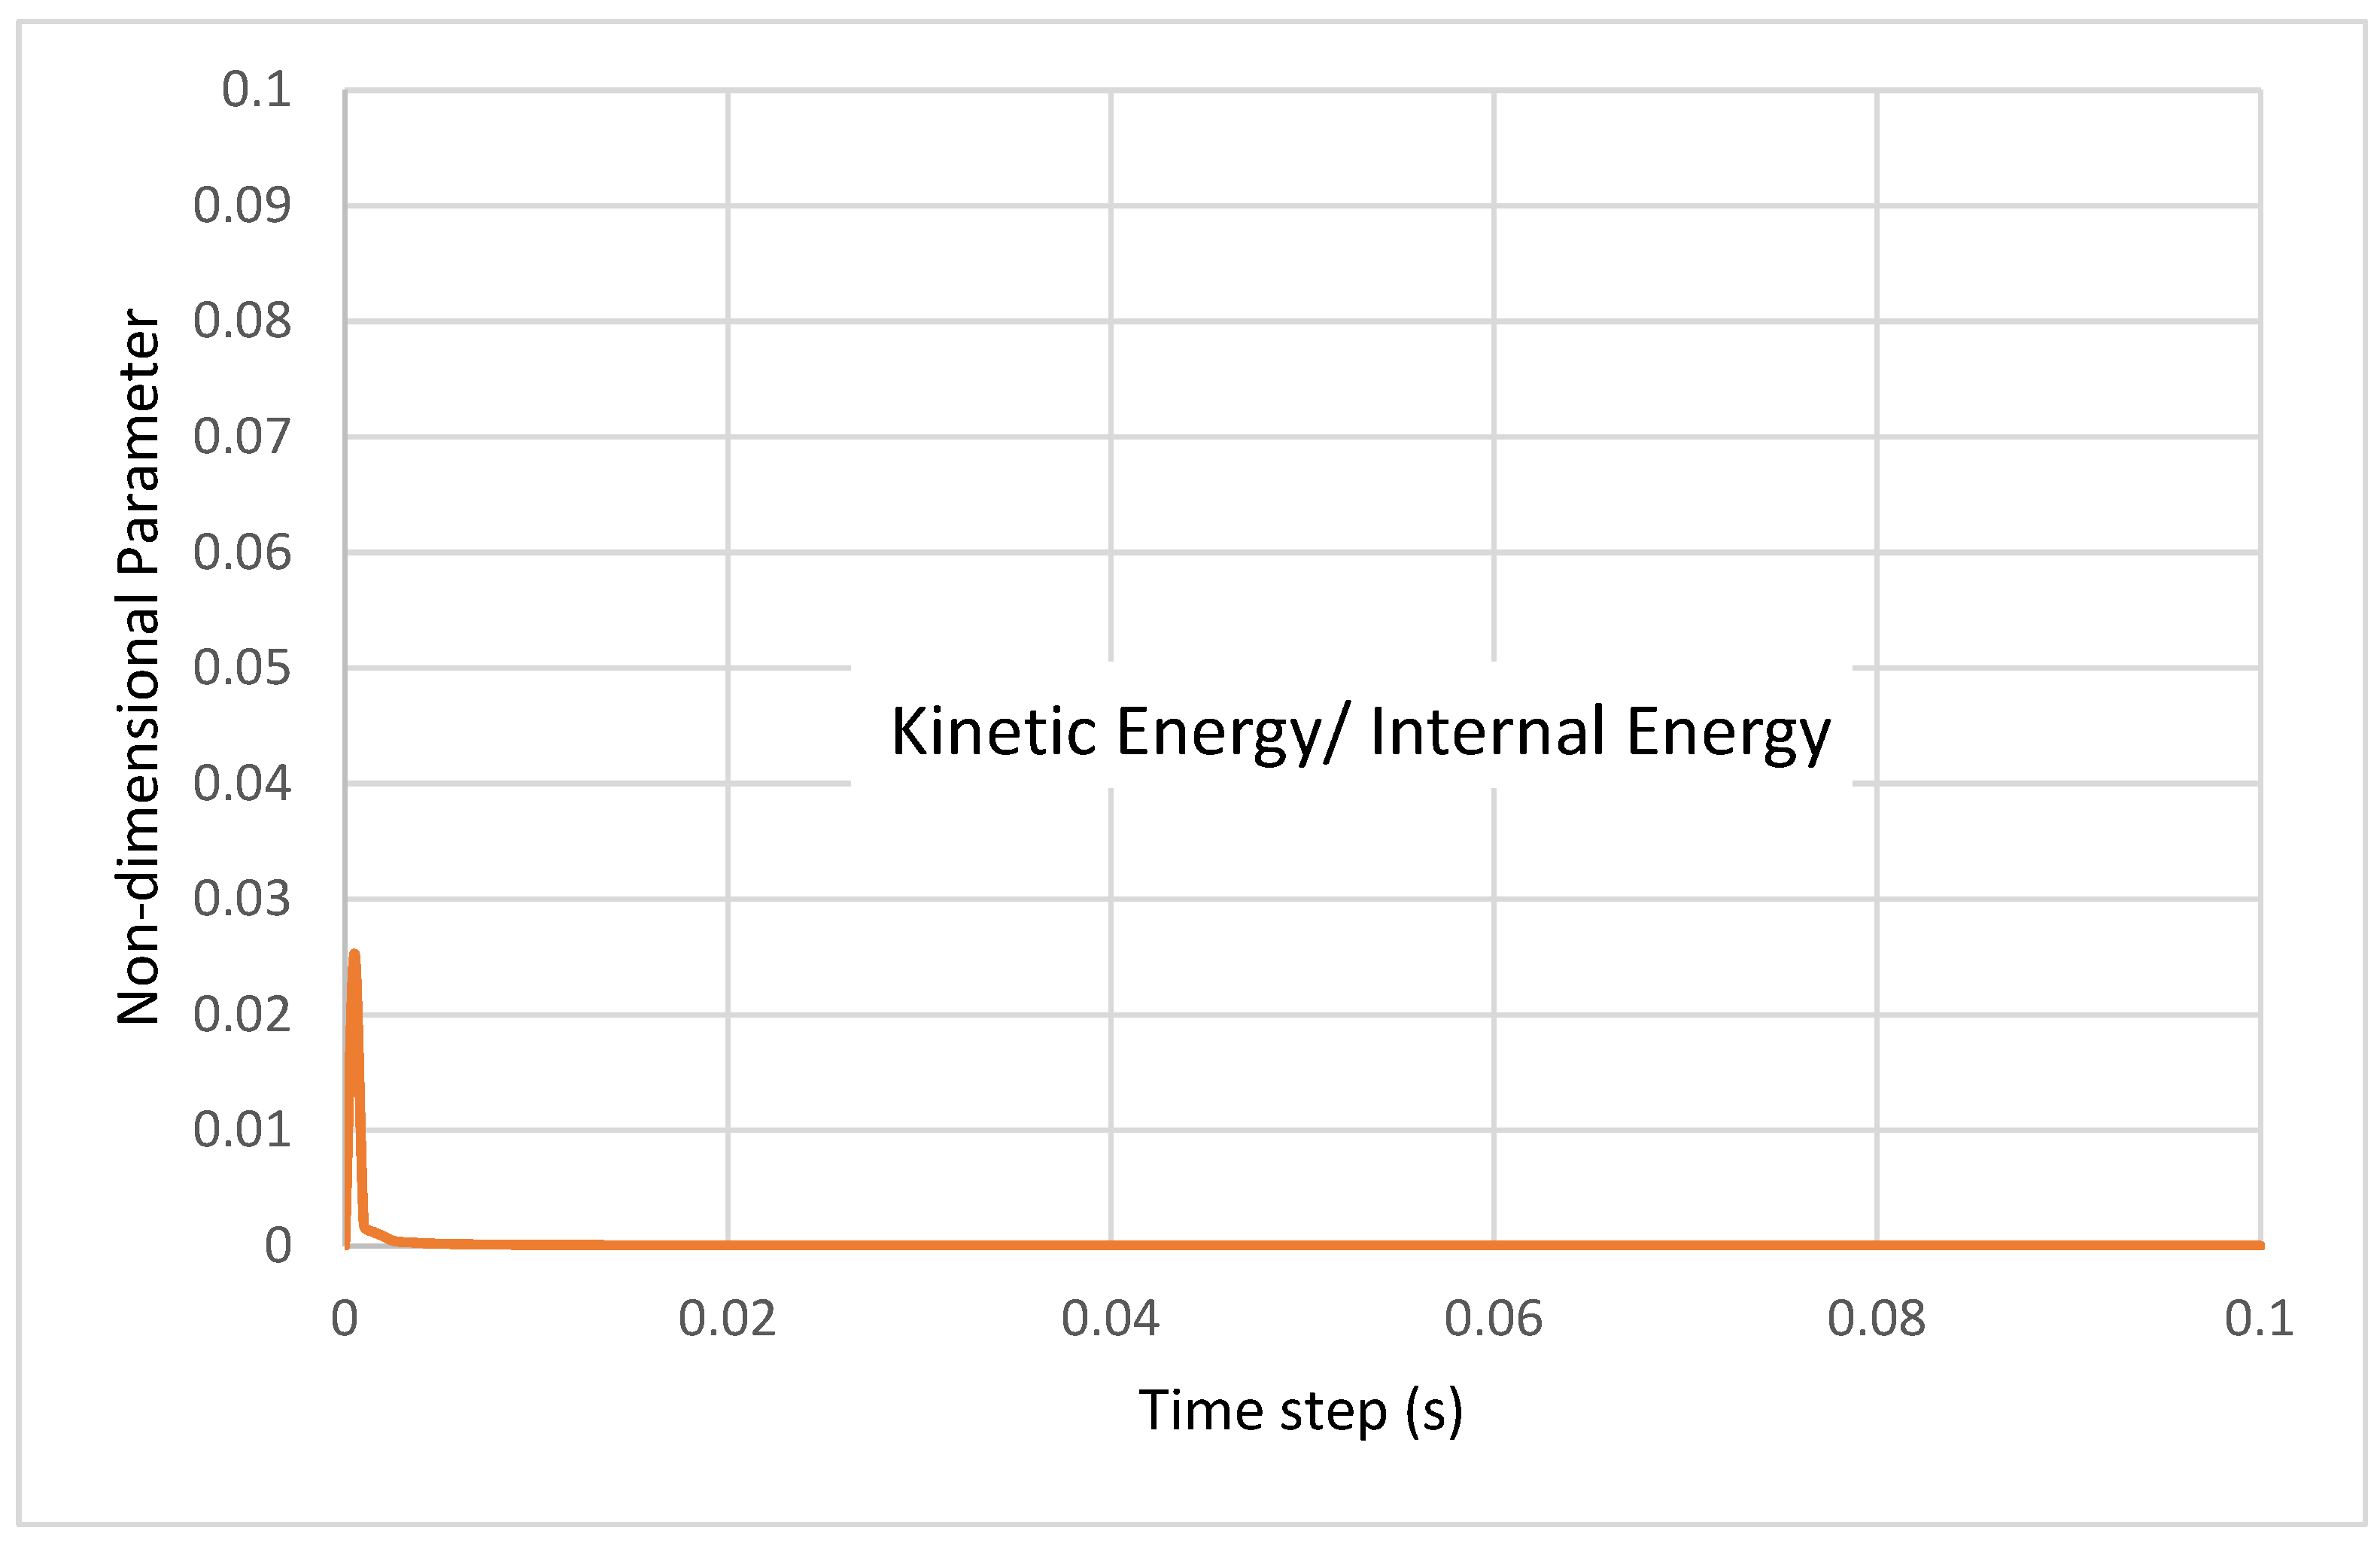
The nonlinear analyses were performed using Abaqus/Explicit with a total time step of 0.1 s, and no mass scaling was employed. The physical loading rate was 1 mm/min. To verify that the numerical response remained quasi-static and that inertial effects were negligible, the kinetic energy and internal energy were monitored throughout the complete loading history. Figure 28 presents the ratio of kinetic energy to internal energy, as a function of analysis time. A brief initial peak of approximately 0.025 (2.5%) was observed at the beginning of the analysis, after which the ratio rapidly decreased to a negligible value and remained close to zero for the remainder of the loading history. The consistently low kinetic energy relative to the internal energy during the relevant structural response indicates that inertial effects were negligible and confirms the quasi-static nature of the Abaqus/Explicit analysis.
Figure 28.
Ratio of kinetic to internal energy to validate the quasi-static analyses in Abaqus.
Regarding the boundary conditions, the built-up beams were modelled as simply supported with pin support (U1 = U2 = U3 = 0) at the left and first stiffener and roller support (U2′ = U3′ = 0) at the right and last stiffener. Thus, the physical support rollers used in the experiments were not explicitly represented as rigid bodies. Instead, their mechanical effect was reproduced through the boundary conditions used to establish the simply supported configuration.
4.3. Verification Against Experiment (Built-Up Beam)
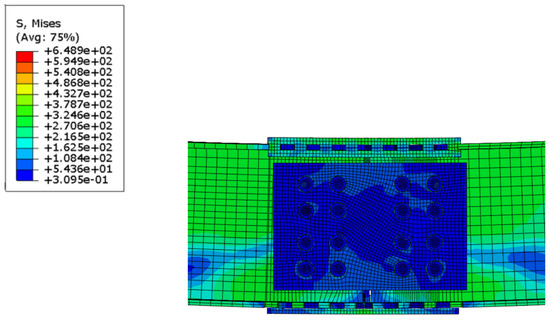
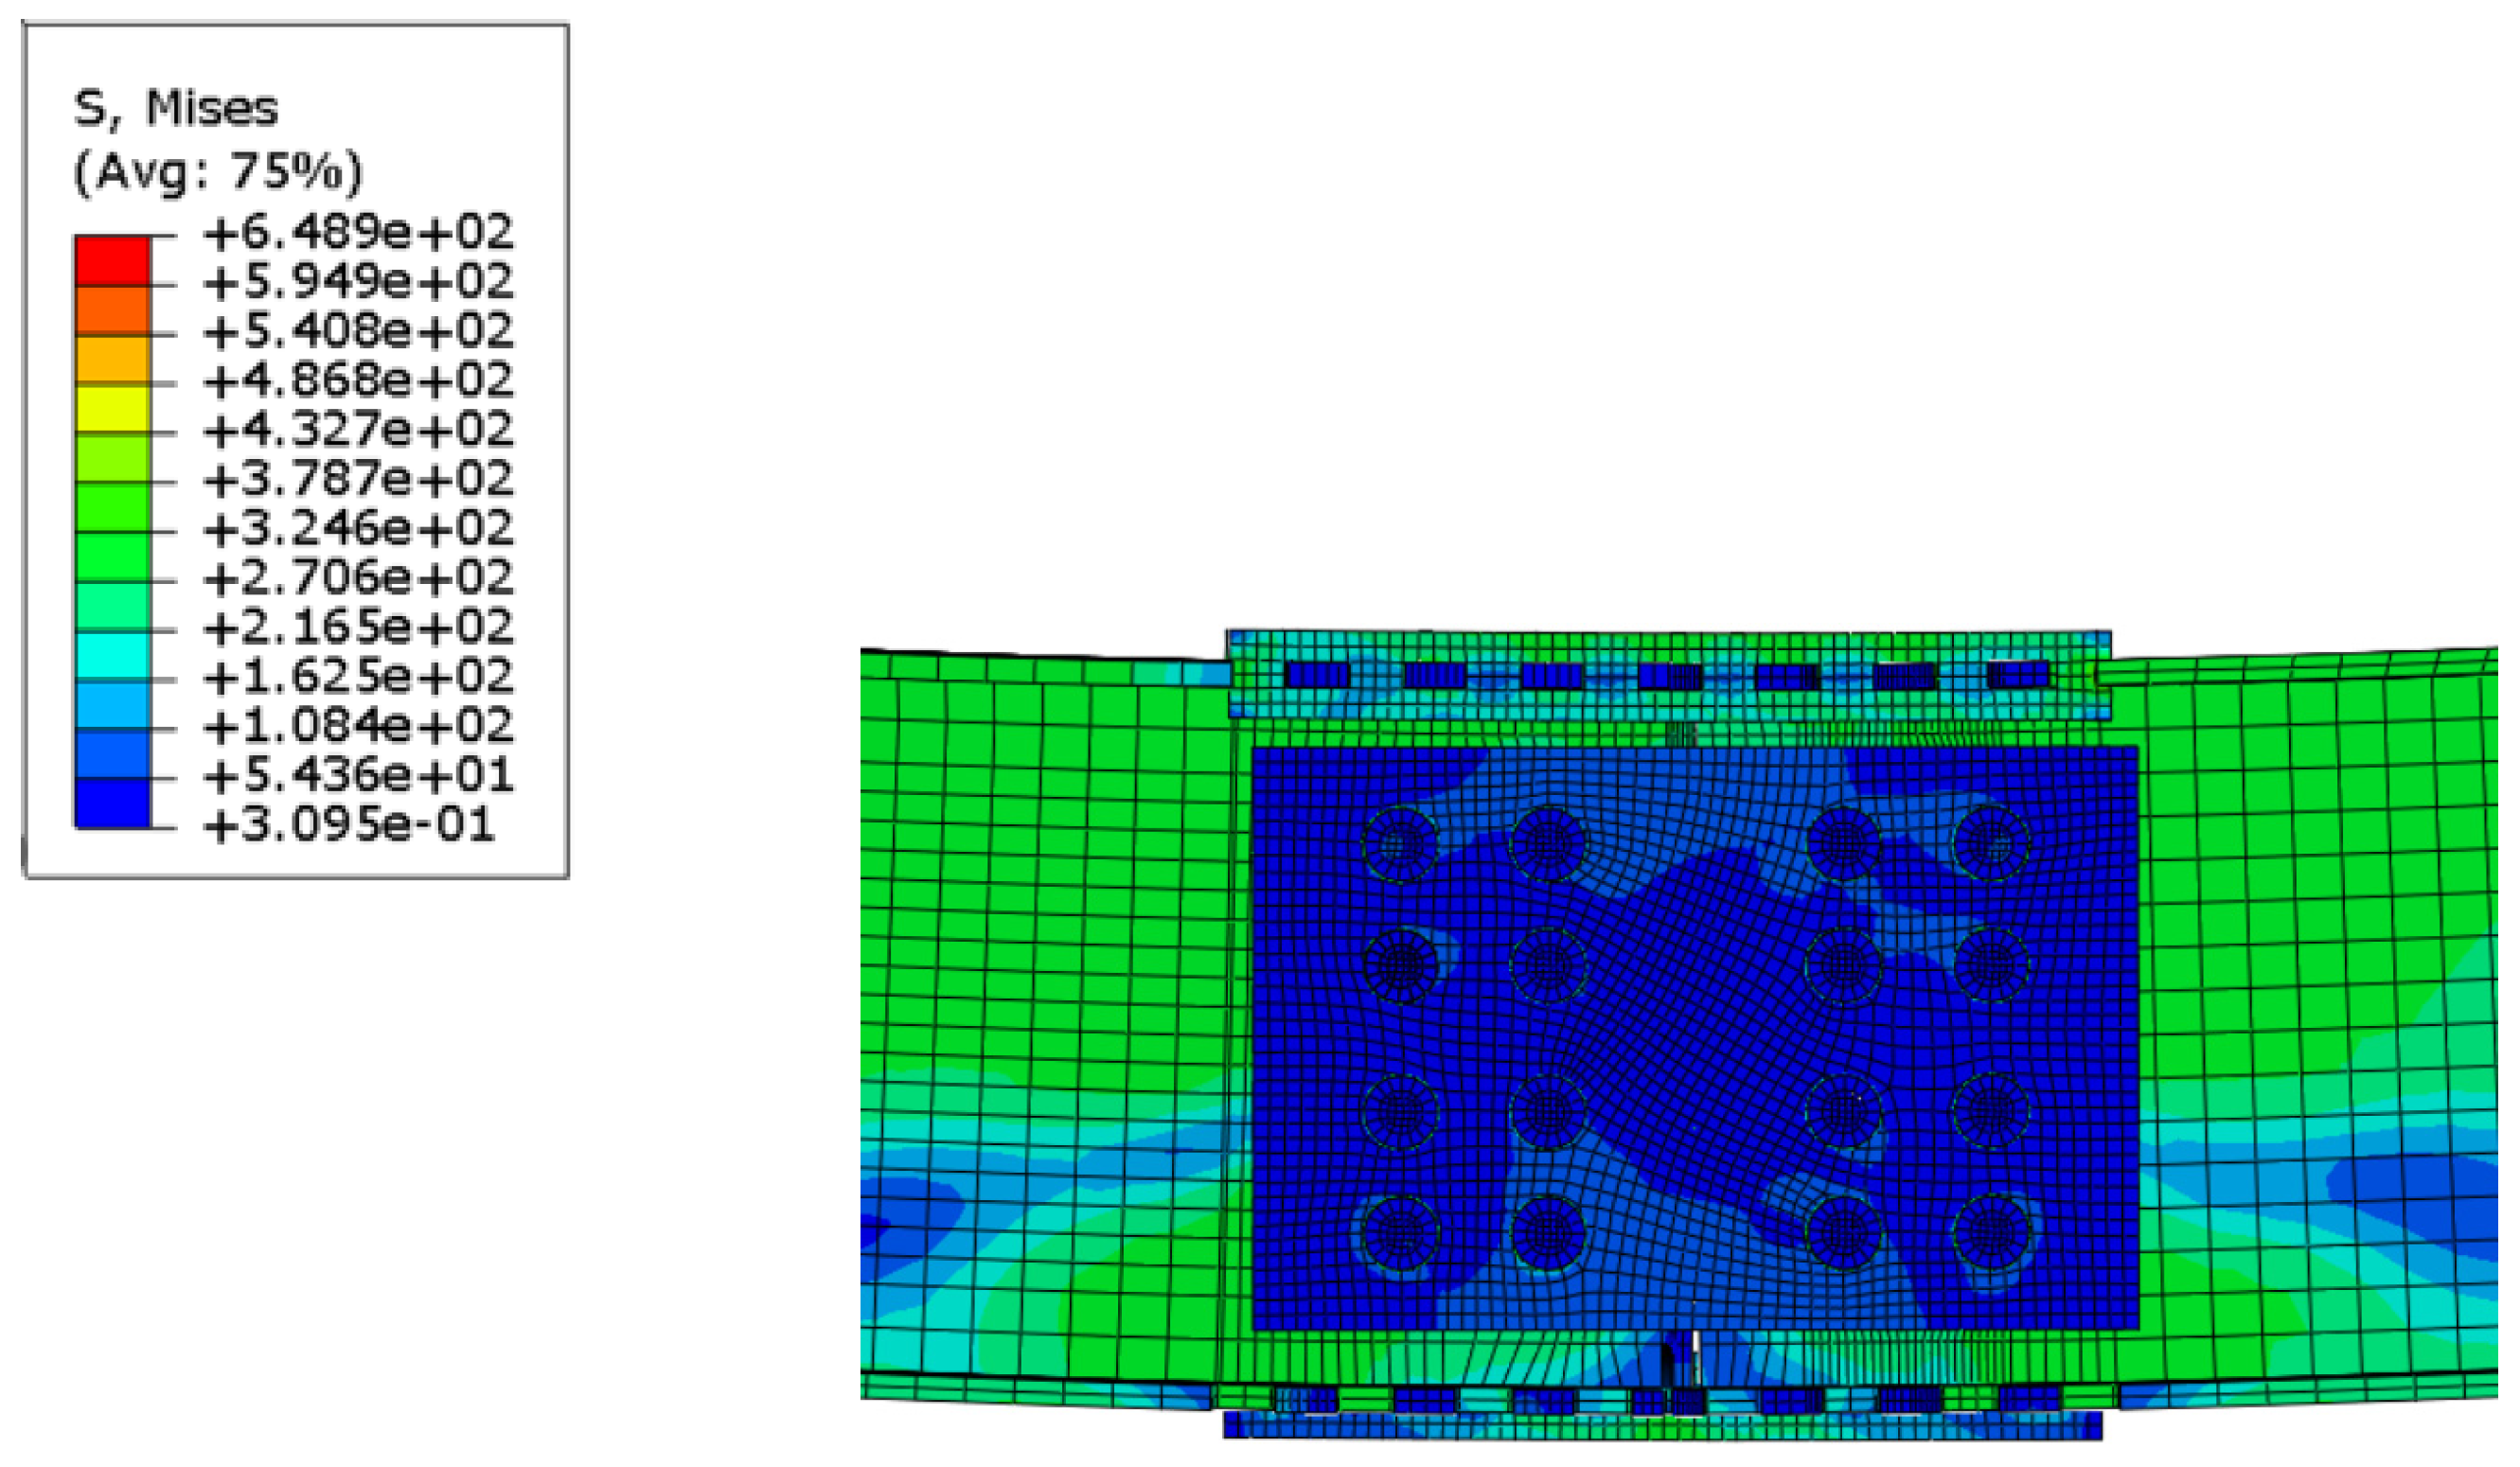
To ensure the validity of the assumptions implemented in the FE models, results of the simulated specimen tests needed verification with the experimental data and visual observations. The numerical model was developed in Abaqus to replicate the response of the two specimens which were tested in the laboratory. Geometry, material properties, and boundary conditions were assigned to the FE model in a way that describes the experiments’ conditions as best as possible, as discussed in detail in the previous section. The loading scenario which was a pure moment load was considered in the FE model. Nonlinear finite element analysis was then carried out in Abaqus so that the models could be validated by comparing numerical results with the experimental data observations from the intermeshed built-up beam programme. Both global observations, such as failure modes and force–displacement responses, and local observations, such as stress distributions and regional deformations, are presented. Investigating and comparing these results with the data from the experimental tests shows good agreement at both global and local levels, which is reported in detail herein.
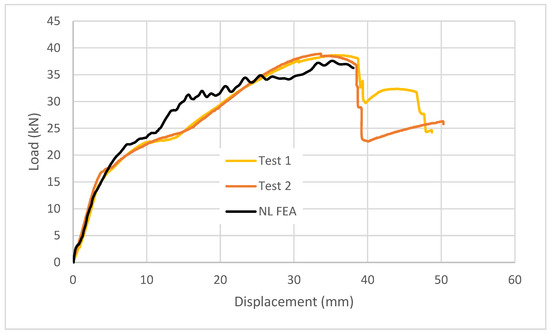
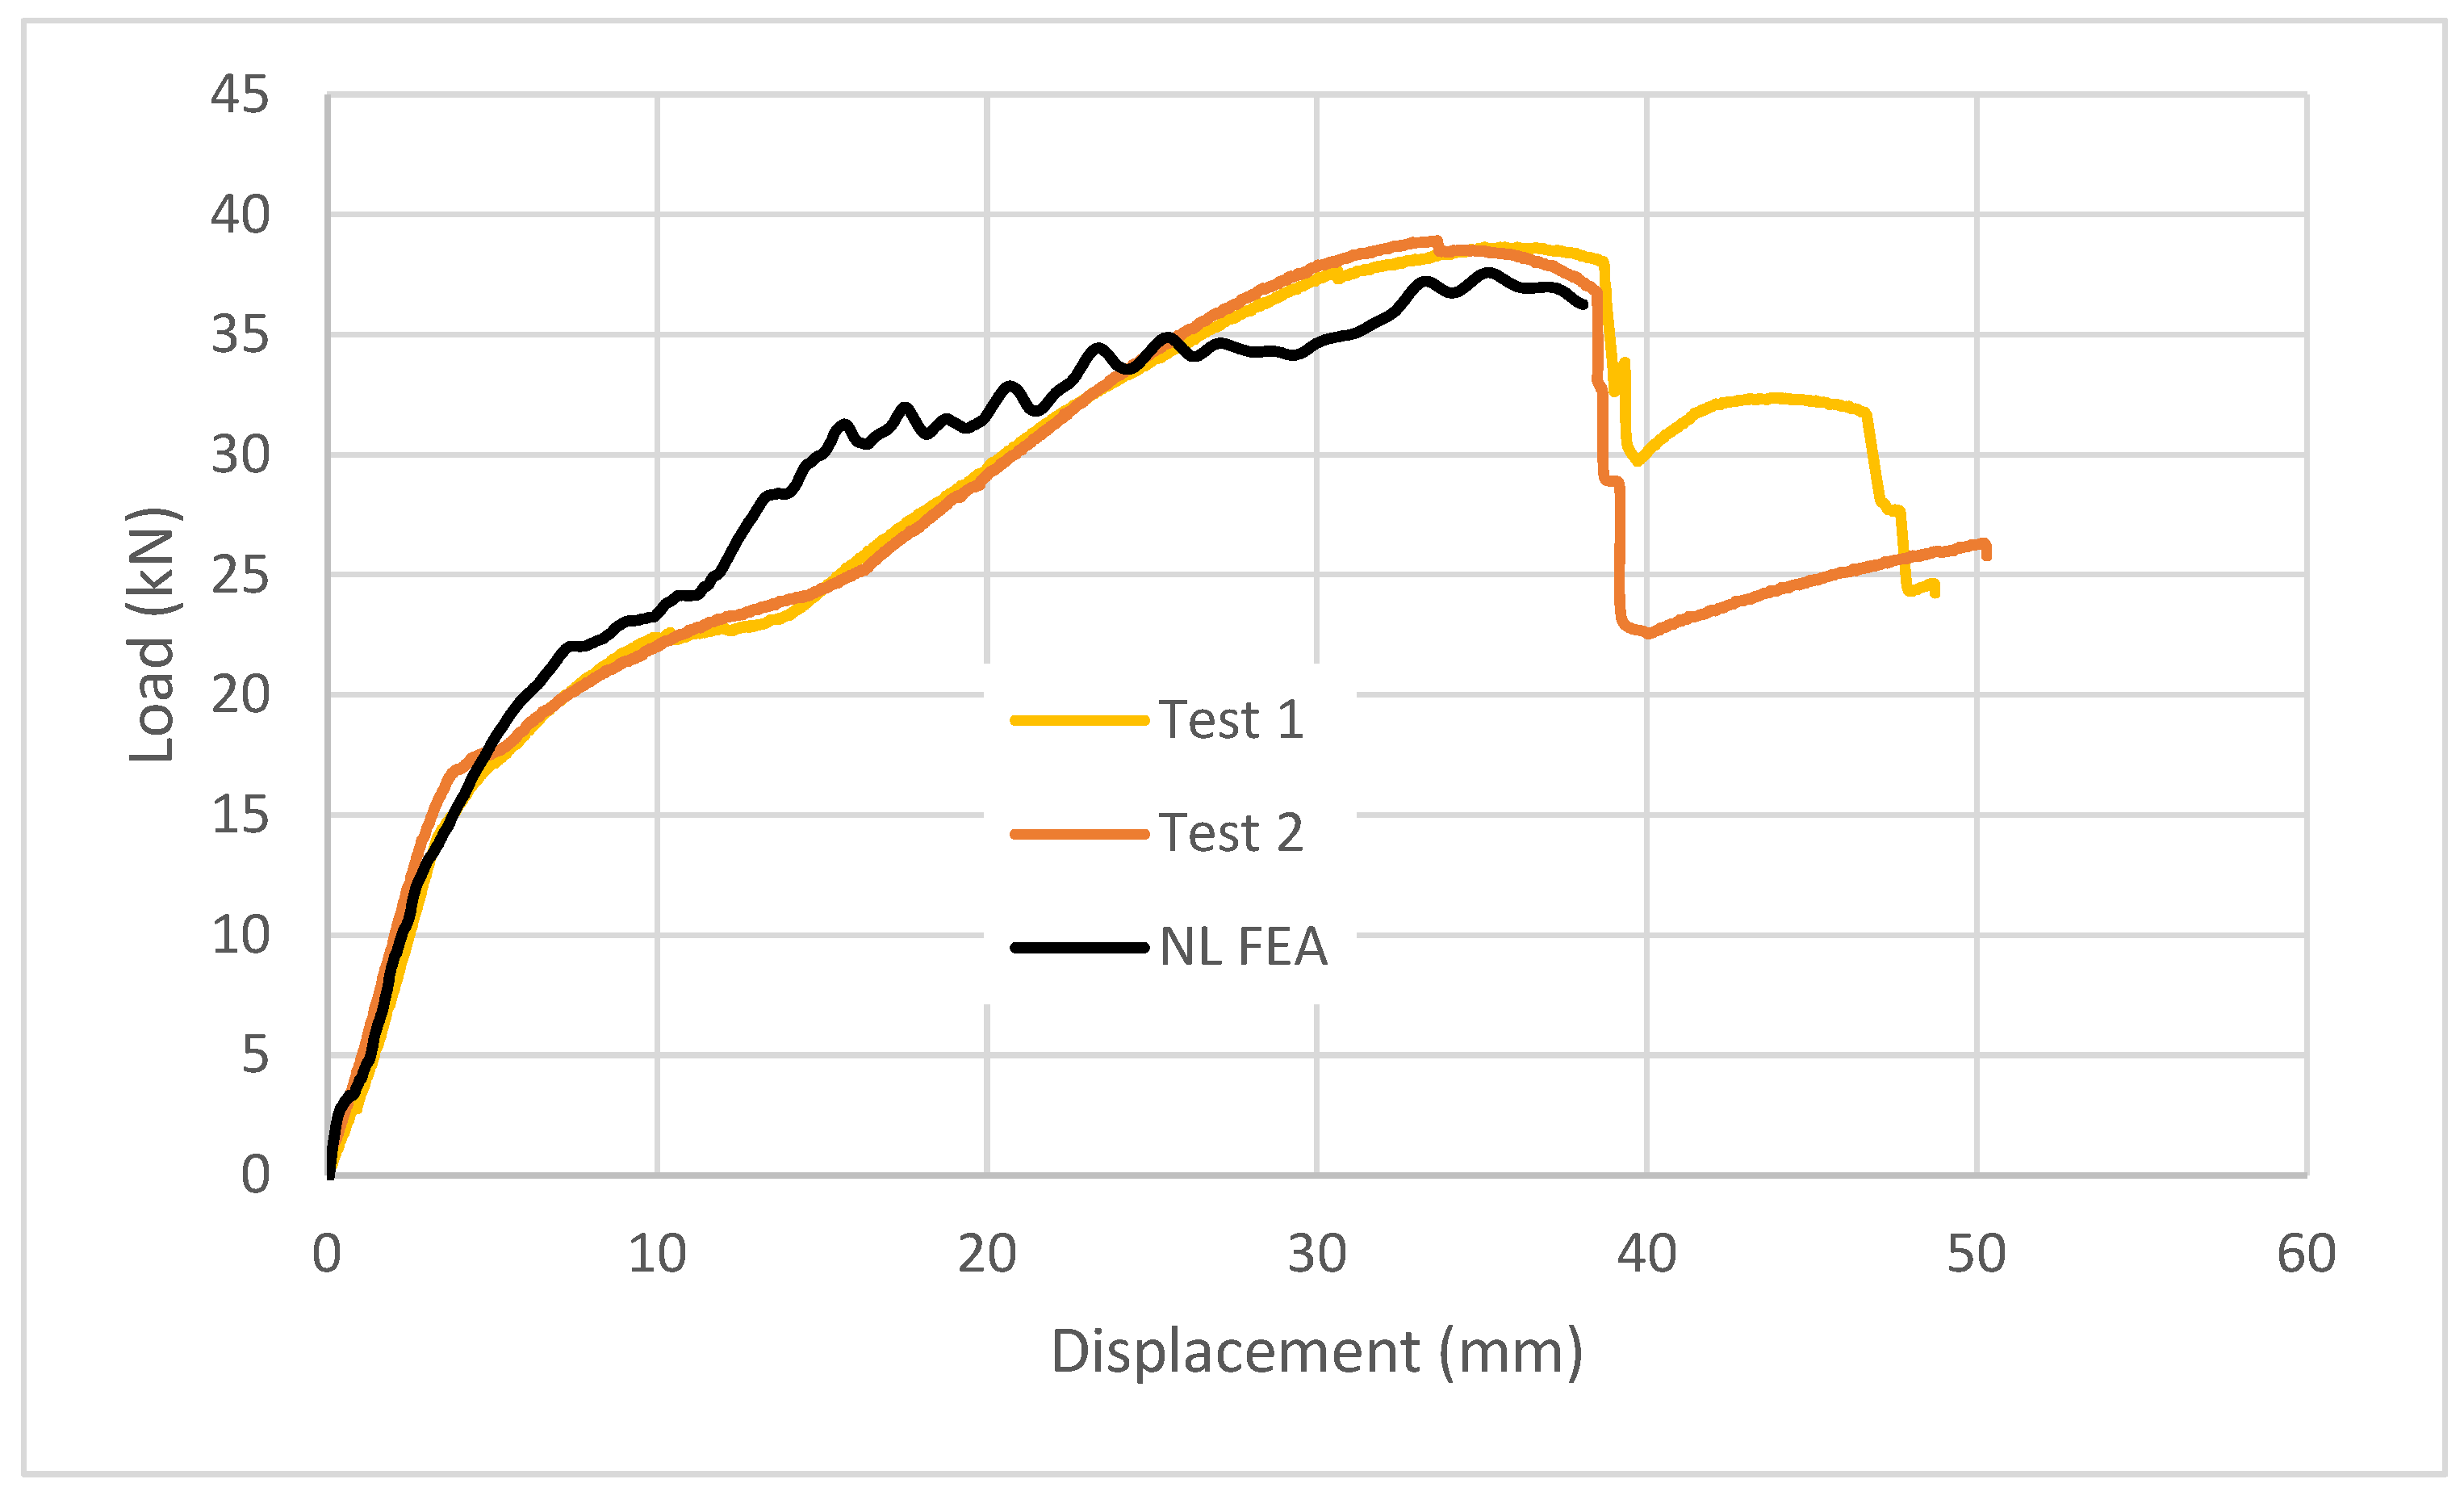
The FE model for the built-up beam was analysed under two vertical pressure loads, which resulted in constant moment in the intermeshed connection region. The analysis was displacement-controlled, and it stopped at an approximate displacement level of 39 mm, where failure occurred in the tests. Fracture was not explicitly incorporated in the FE models. Therefore, no ductile-damage initiation criterion, damage evolution law, or element deletion technique was employed. The purpose of the numerical analyses was to reproduce the nonlinear response of the specimens up to the displacement at which fracture was experimentally observed and to investigate the associated deformation, plasticity, contact behaviour, and load transfer mechanisms. The analyses were therefore terminated at approximately the experimentally observed fracture displacement. Explicit prediction of fracture initiation and propagation was outside the scope of the present study, as the additional material fracture characterisation and calibration required to establish a reliable ductile-damage model were not undertaken. Consequently, the numerical results are used to identify the critical regions of plastic deformation associated with the experimentally observed failure mechanism rather than to simulate physical crack initiation and material separation. Side plates performed in a way that allowed the beams to separate generating numerical singularity due to large plasticity. This was the point of failure of the numerical model. At this step of the FE analysis, the beam has failed at the centre of the two bottom side plates at the interface between the two beams. As depicted (in Figure 29, Figure 30 and Figure 31), the two built-up beams were disengaged (separated) from each other when the failure occurred at the centre of the two bottom side plates. This was similar to the failure mode as depicted in Test 1 and 2, shown in Figure 32. Comparison of the global behaviour through force–displacement curves further proves that the FE model was able to simulate Test 1 and Test 2 accurately, as shown in Figure 29.
Figure 29.
Load–displacement behaviour of the built-up beams according to tests and FE analysis.
Figure 30.
Front failure mode of the built-up beam according to FE analysis.
Figure 31.
Close-up view of the failure mode of the intermeshed built-up beam in Abaqus.
Figure 32.
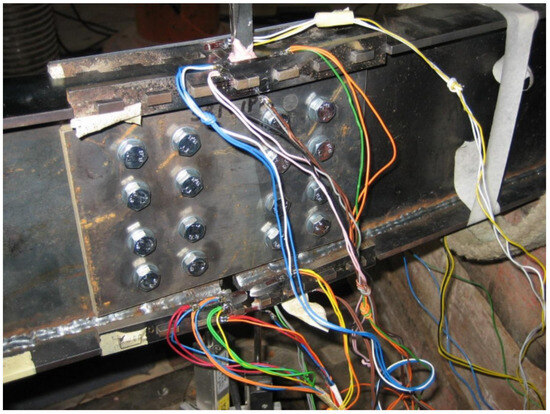
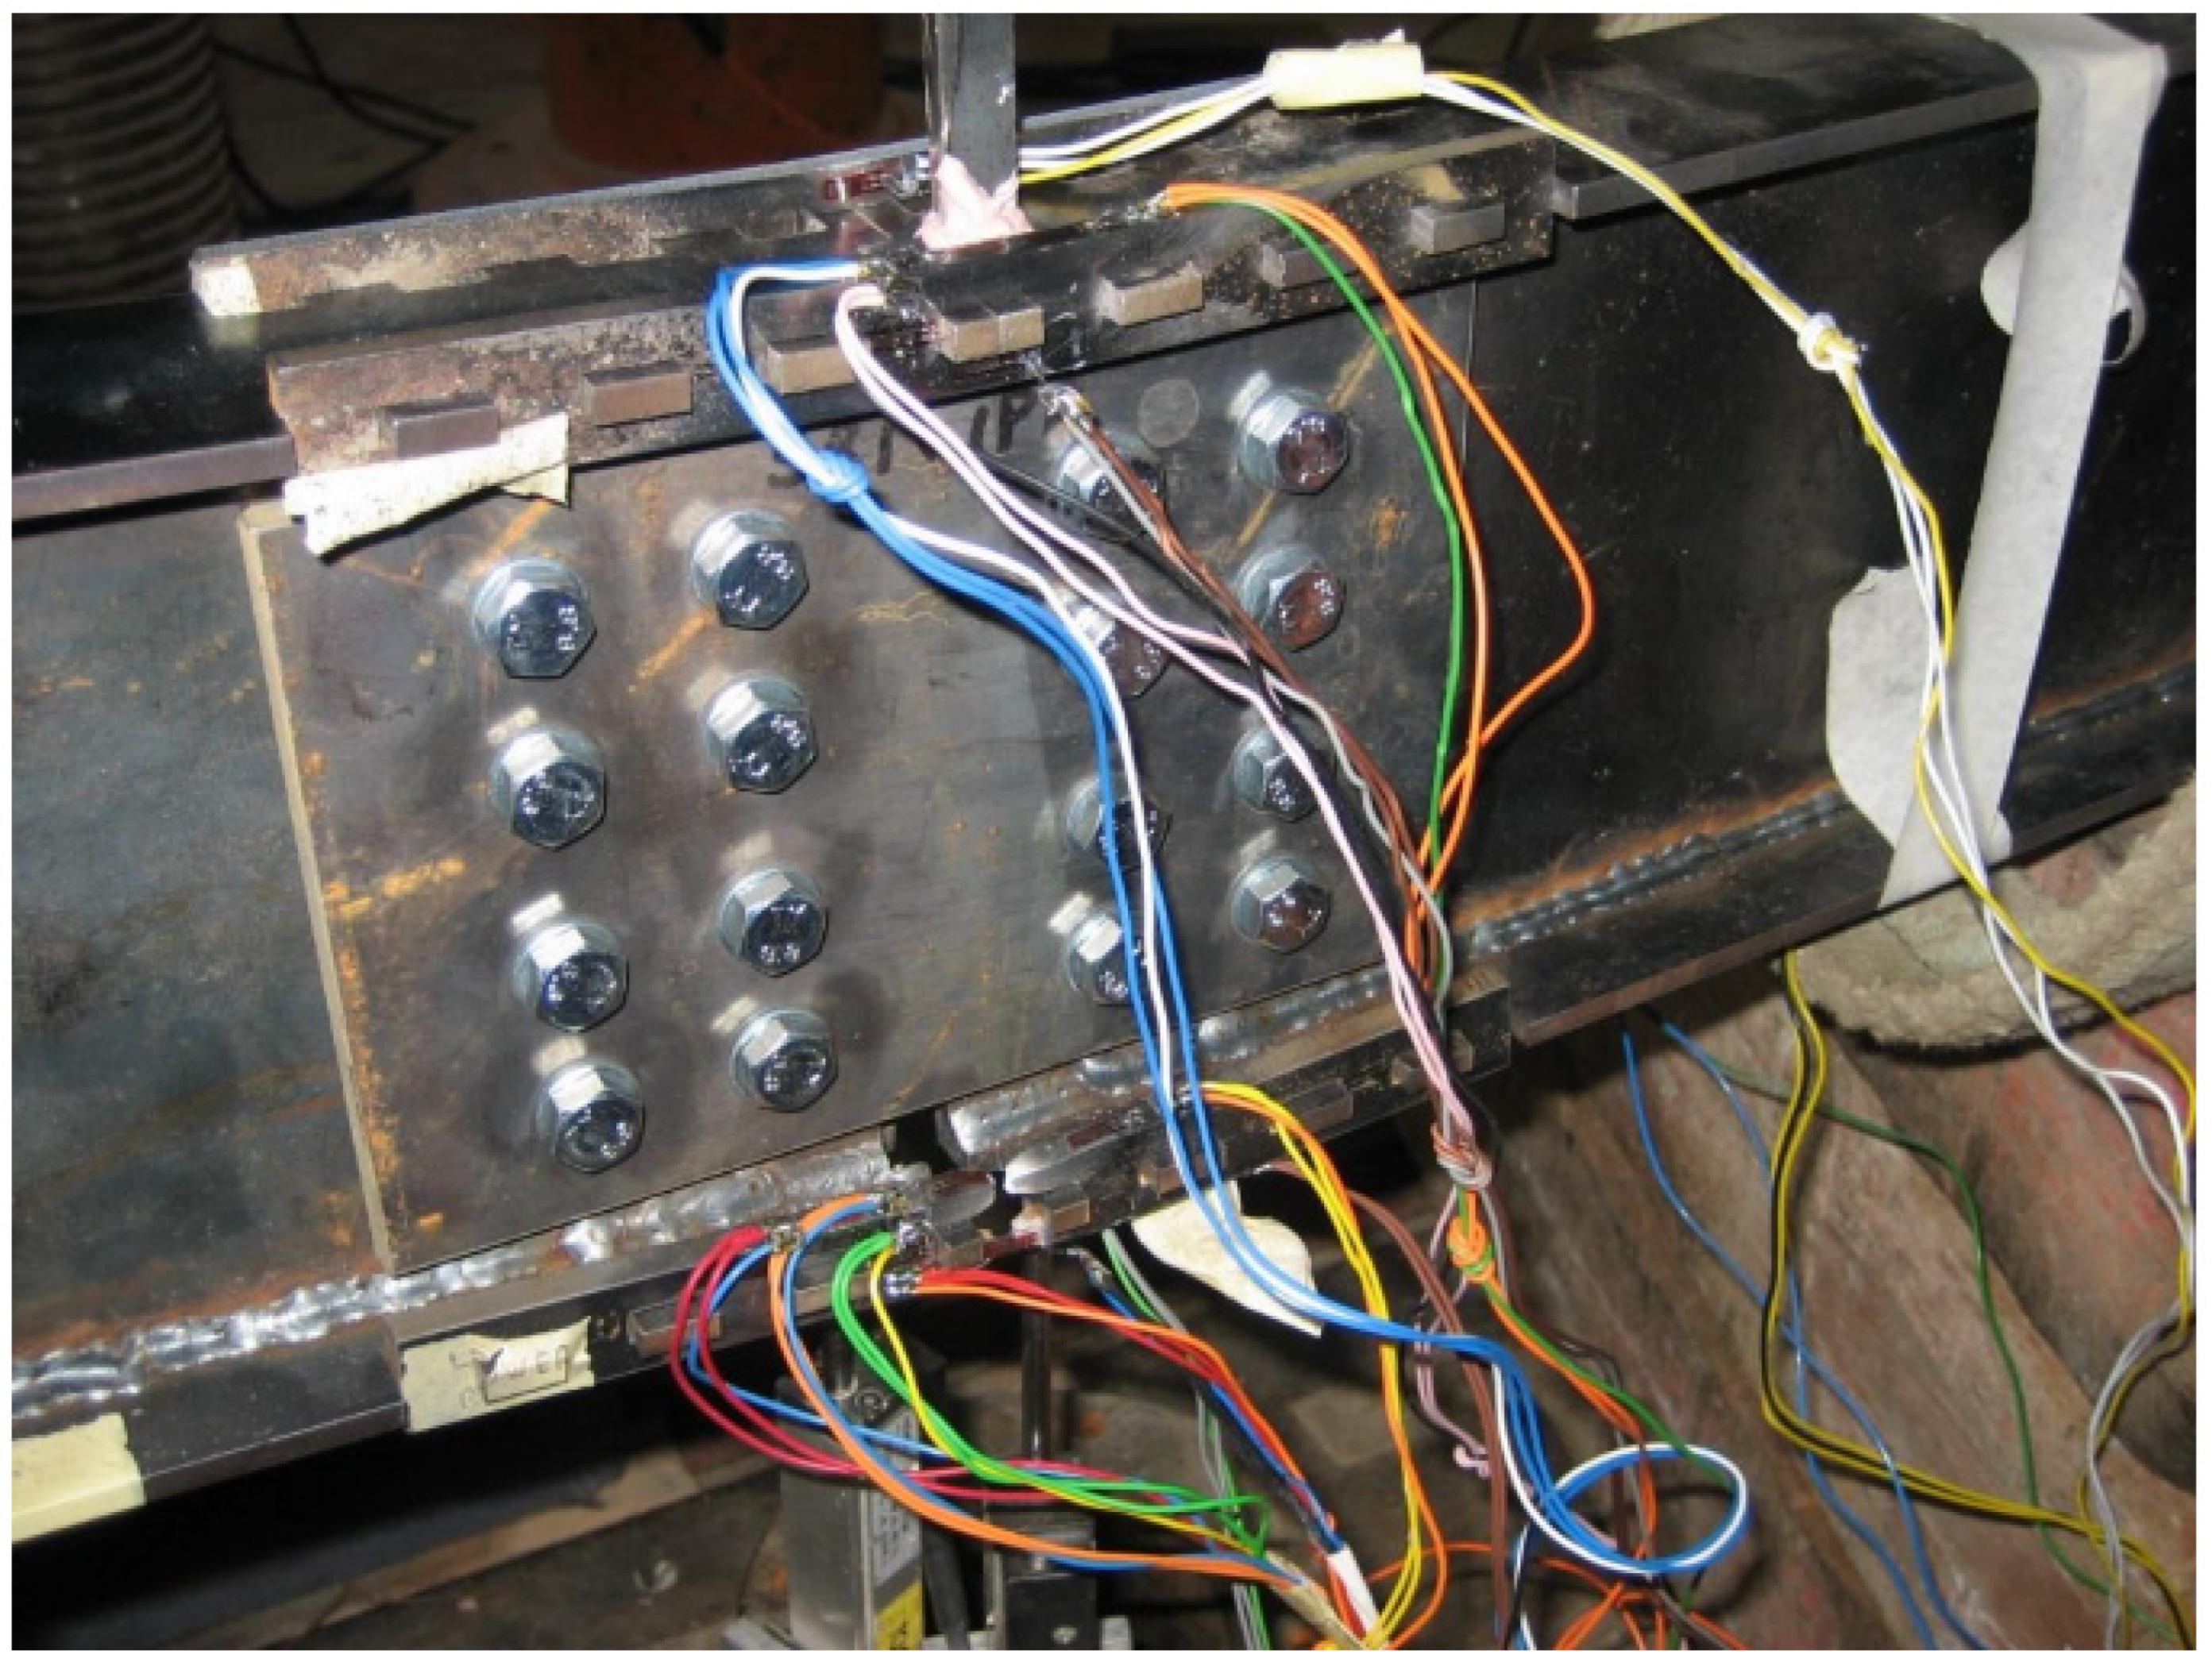
Close-up view of the failure mode of the intermeshed built-up beam according to the experiment.
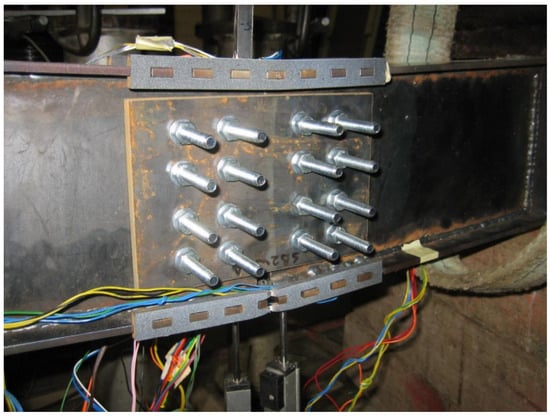
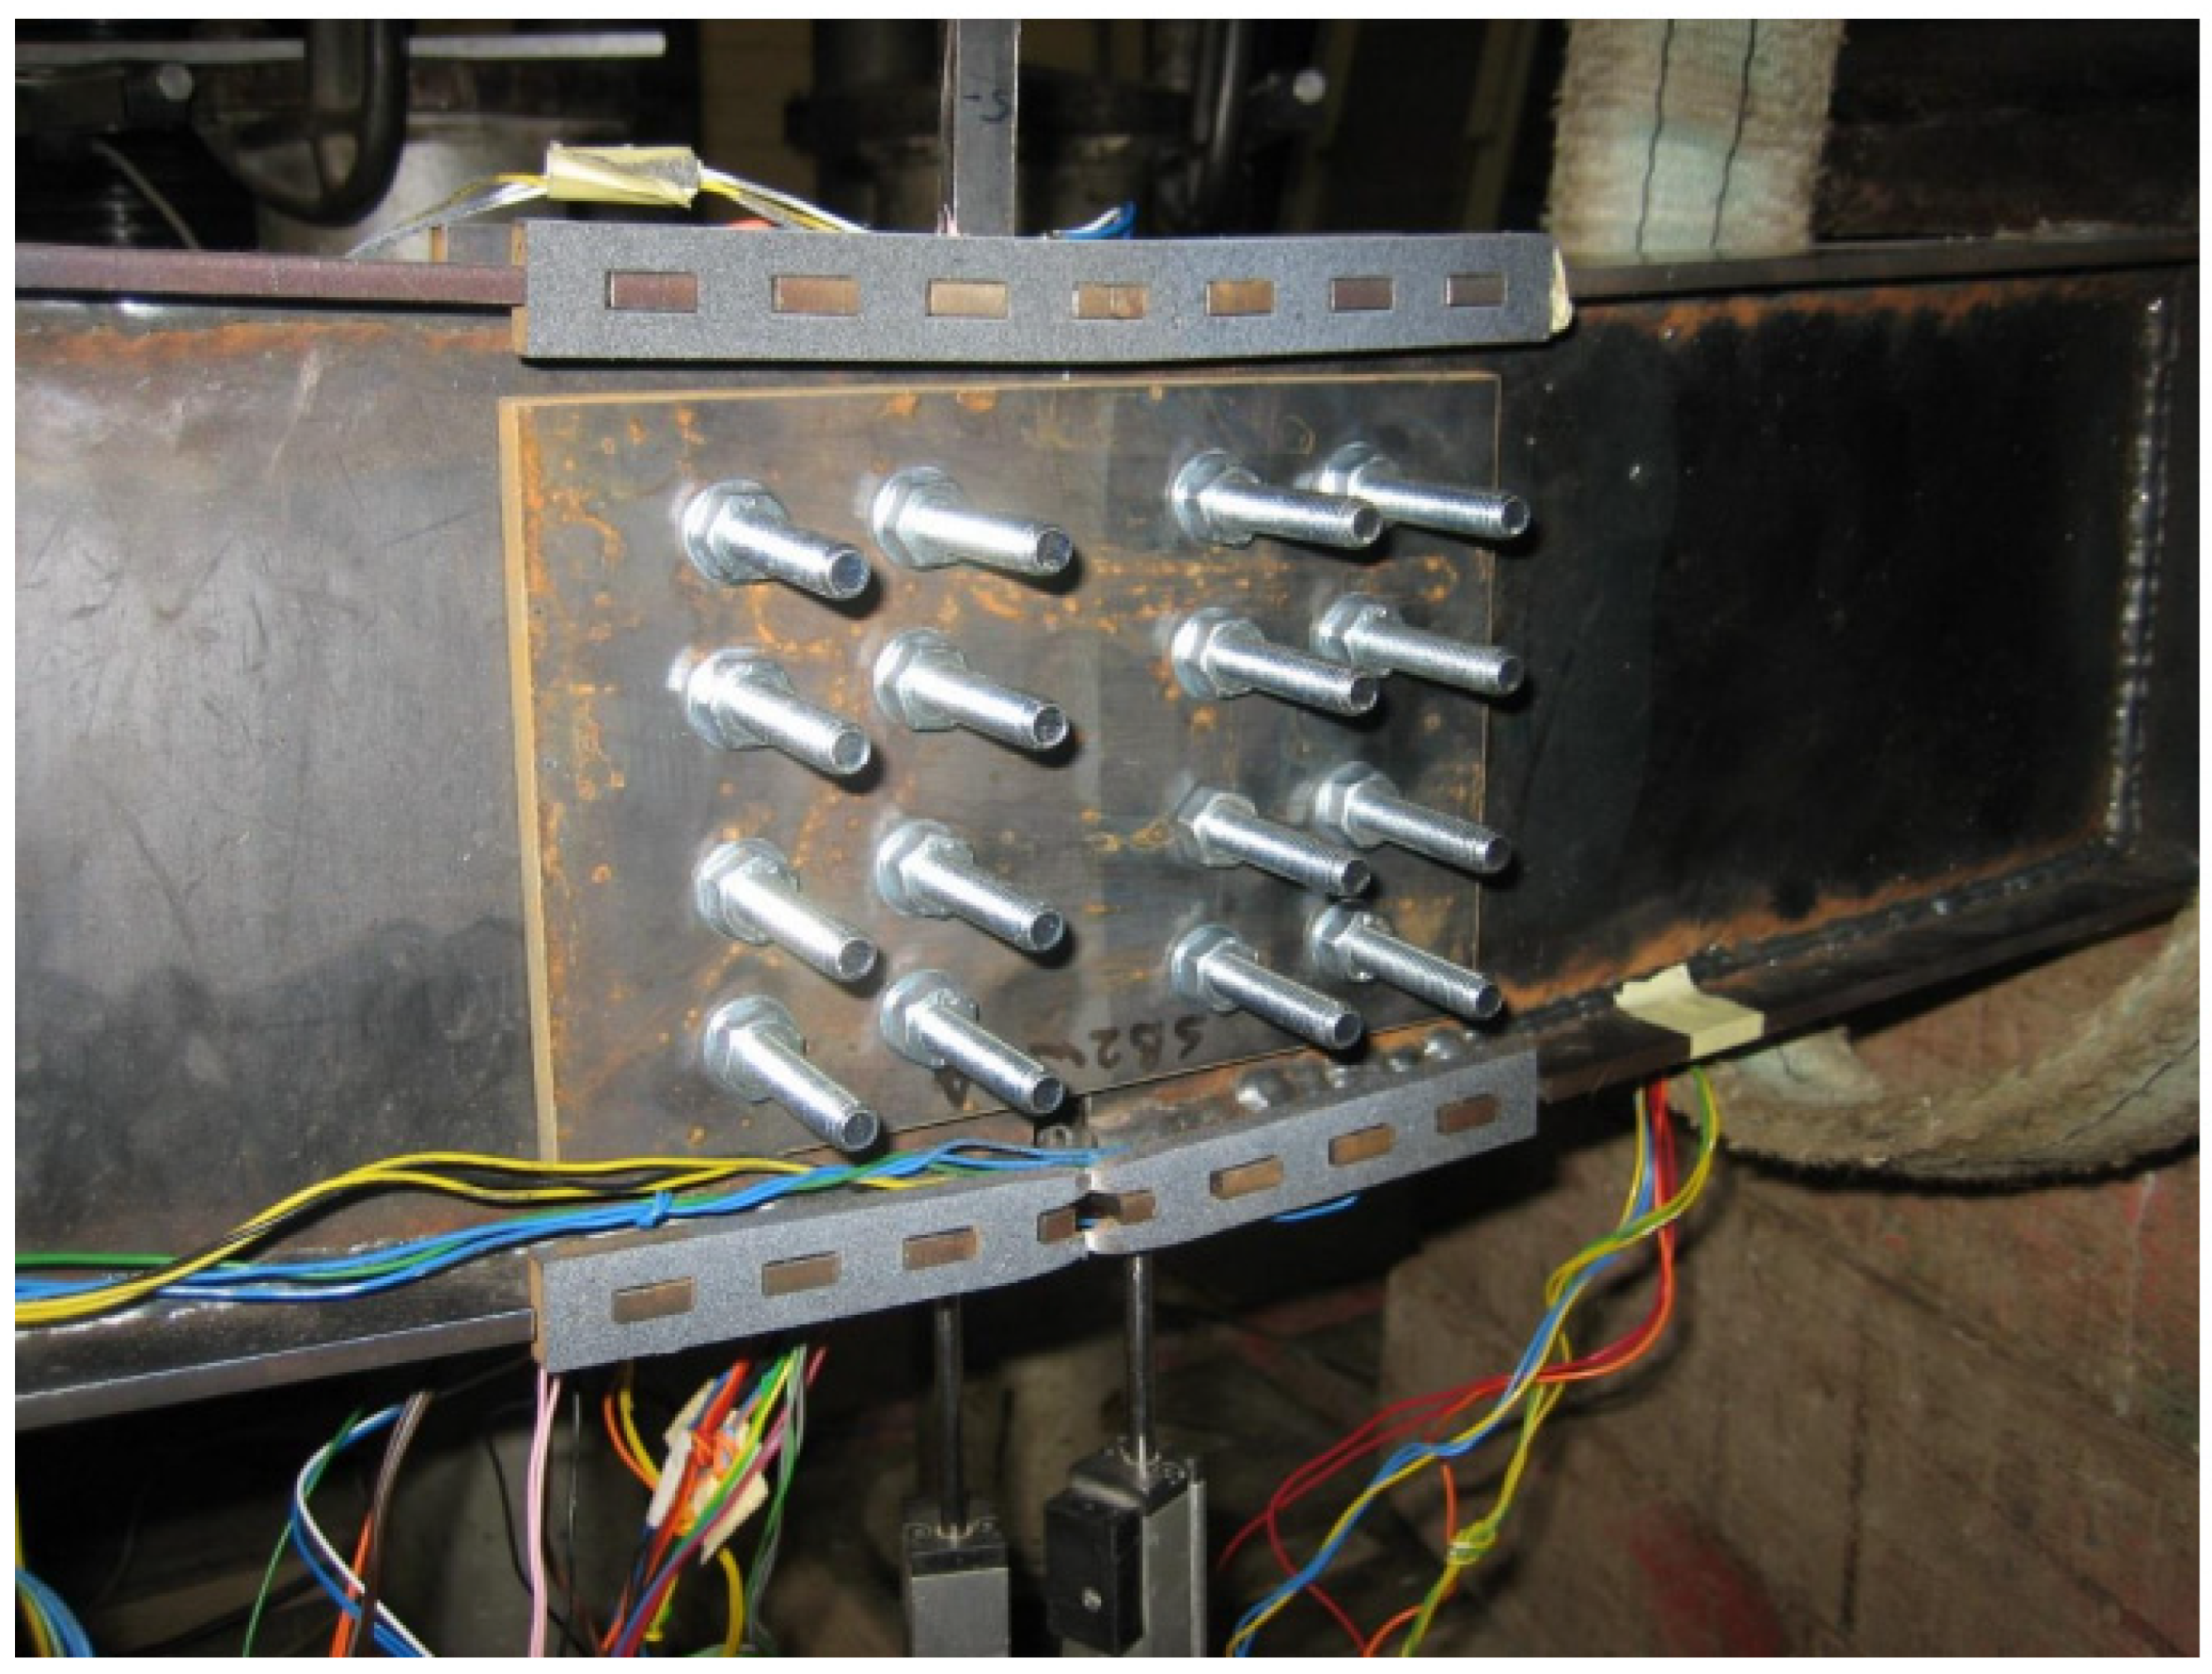
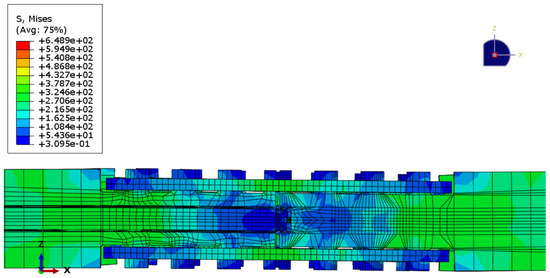
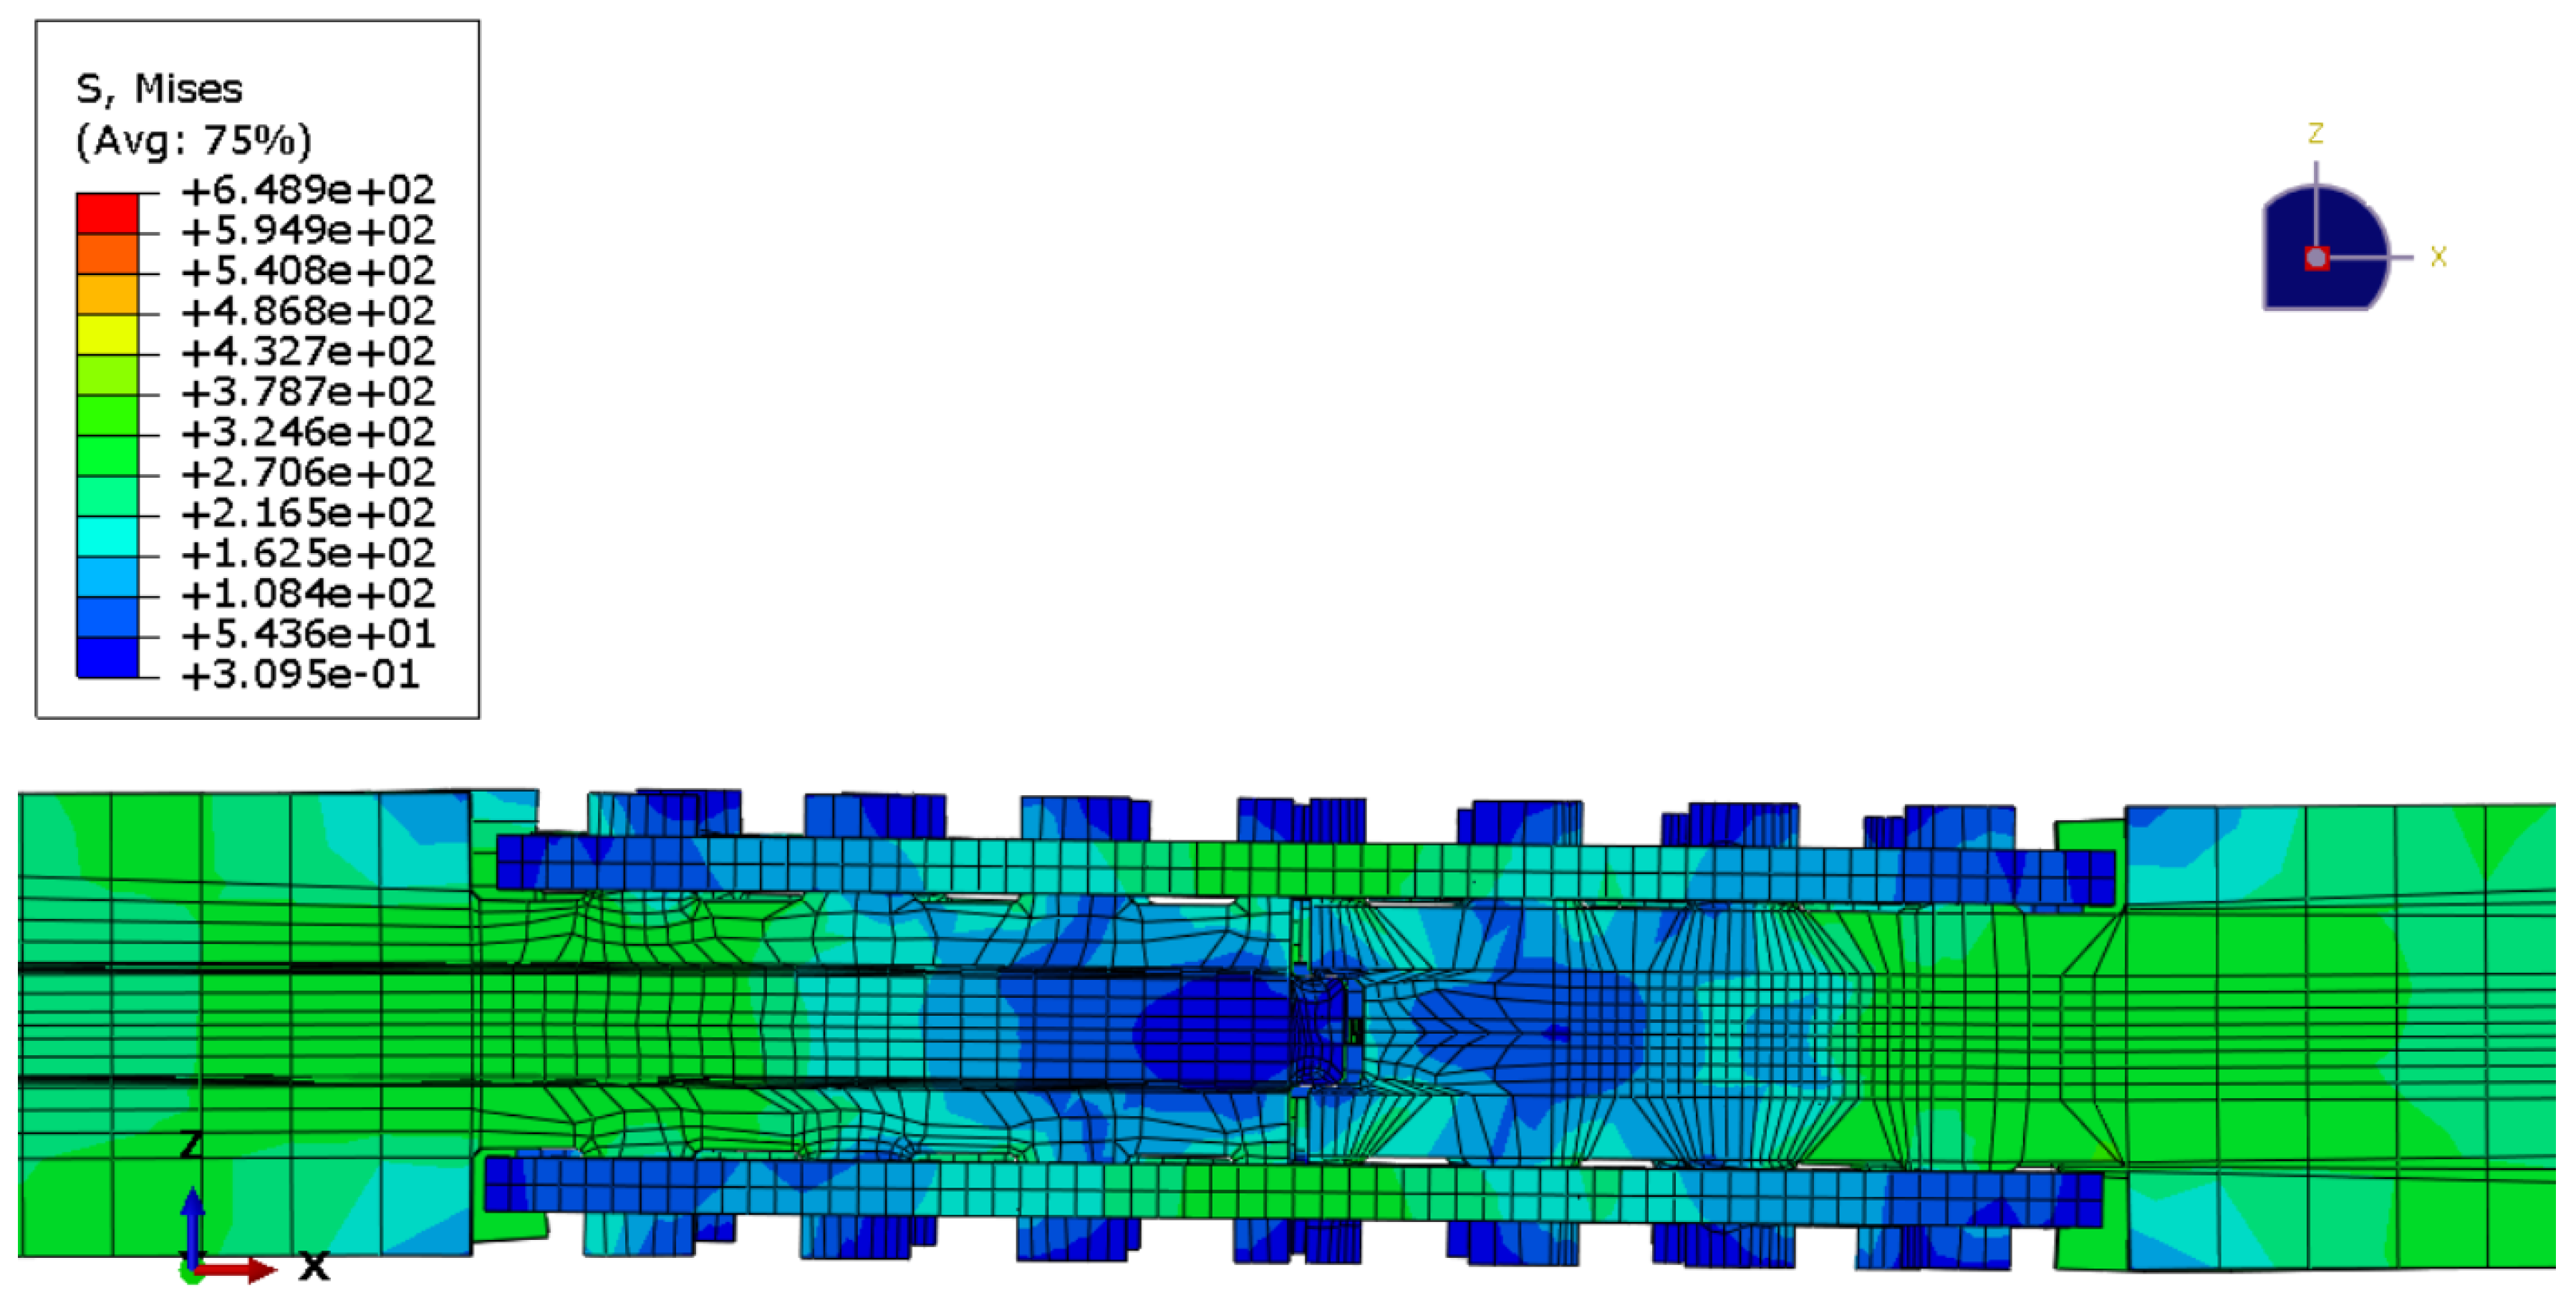
Figure 33 shows the close-up view of the deformed shape of the connection without the bottom lower-flange side plate. The separation between the two beams is shown better in this figure and in Figure 34. Finally, for comparison with the experimental test data, the close-up view of the failure mode of the intermeshed steel connection of test is shown in Figure 35.
Figure 33.
Close-up view of the failure mode of the intermeshed built-up beam shown without the front lower-flange side plate which was included in the analysis.
Figure 34.
Close-up view of the intermeshed built-up beam from below showing the disengagement between the two beams.
Figure 35.
Failure mode of the intermeshed built-up beam from experimental test.
5. Numerical Analysis of the Standard Beam in Bending
For the standard (rolled) beam (UB 203 × 133 × 30) the material behaviour was characterised with uniaxial tensile tests in accordance with BS EN ISO 6892-1 [32]. This behaviour was then introduced to Abaqus using stress–strain curve. Isotropic hardening was considered to describe the deformation hardening behaviour for a material under monotonic loading. Figure 36 shows the equivalent simulated connection in Abaqus. In order to maintain the authenticity of the specimen and increase the accuracy of the model, the small geometric details were also incorporated in the Abaqus model including tolerances and special side plate shapes. Therefore, the numerical model also included an extra 1 mm of space that was provided in the experiments between the teeth and the flange side plates. Furthermore, no gap was left where the beam faces meet each other at the centre of the connection as designed in the experimental tests.
Figure 36.
(a) 3-D view of the standard beam connection in Abaqus. (b) Side view of the standard beam connection in Abaqus.
5.1. Model Assumptions for the Standard Beam
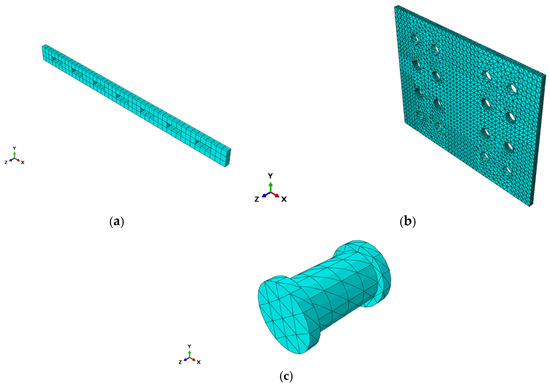
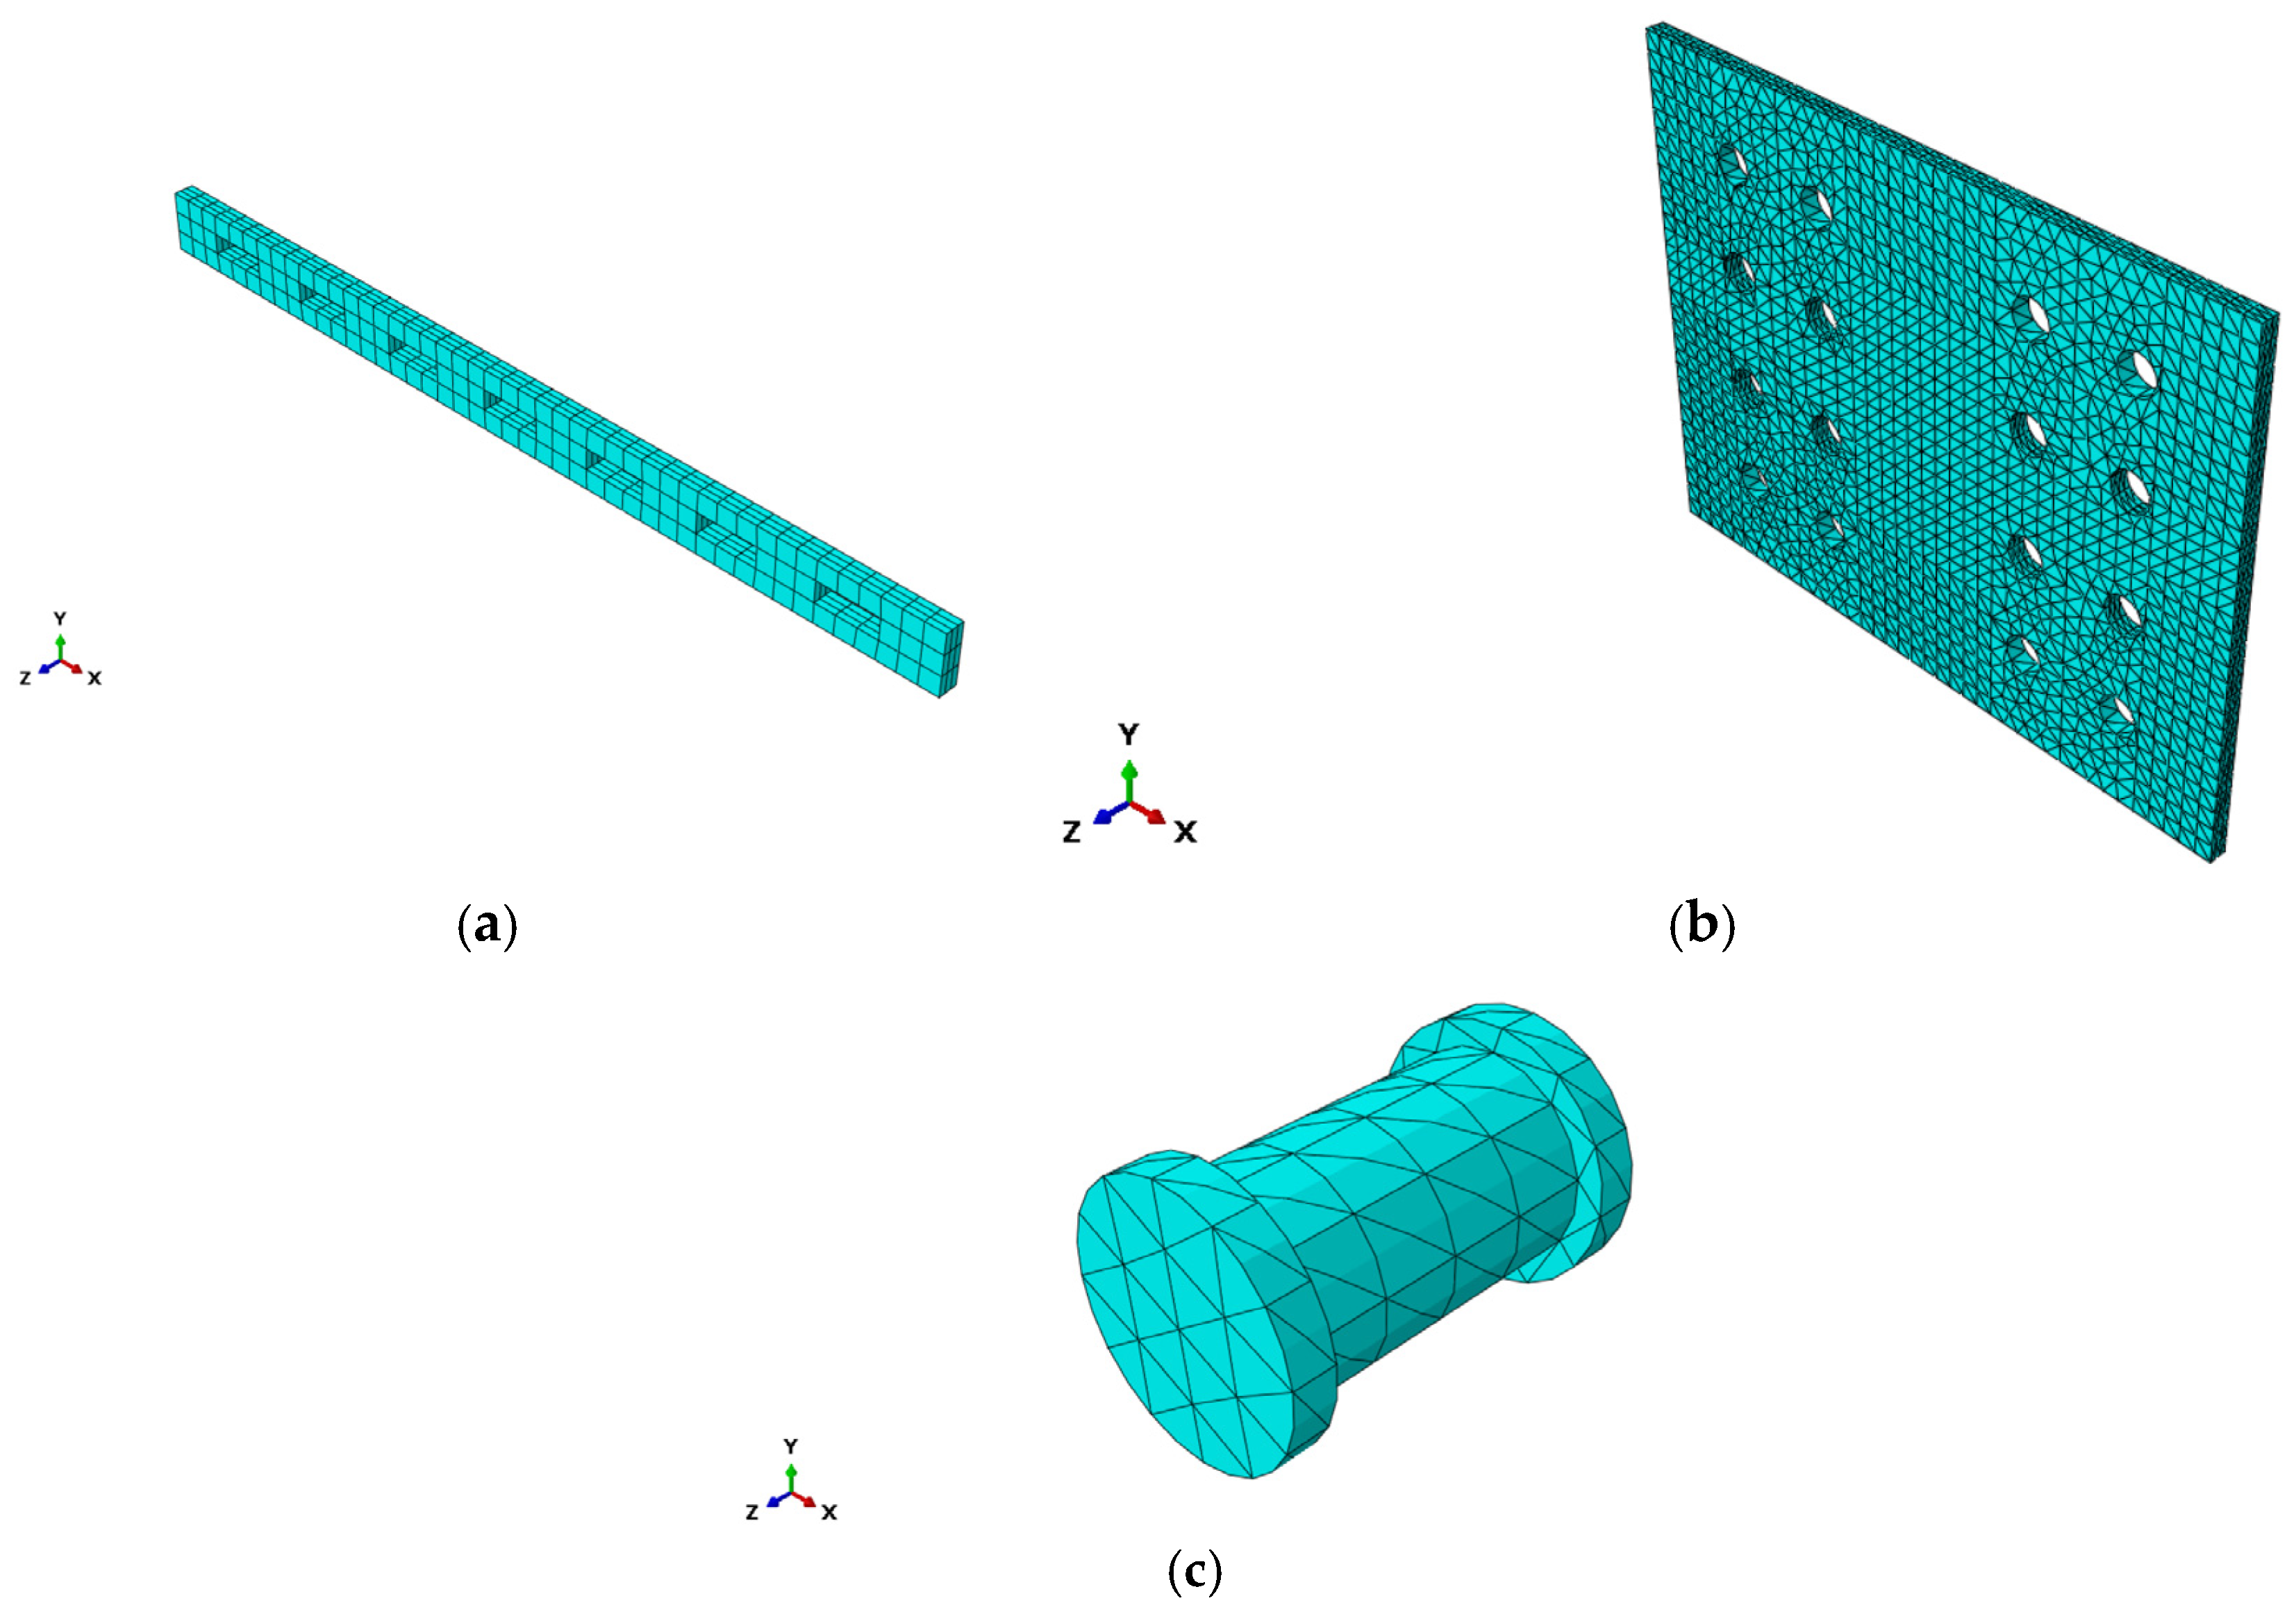
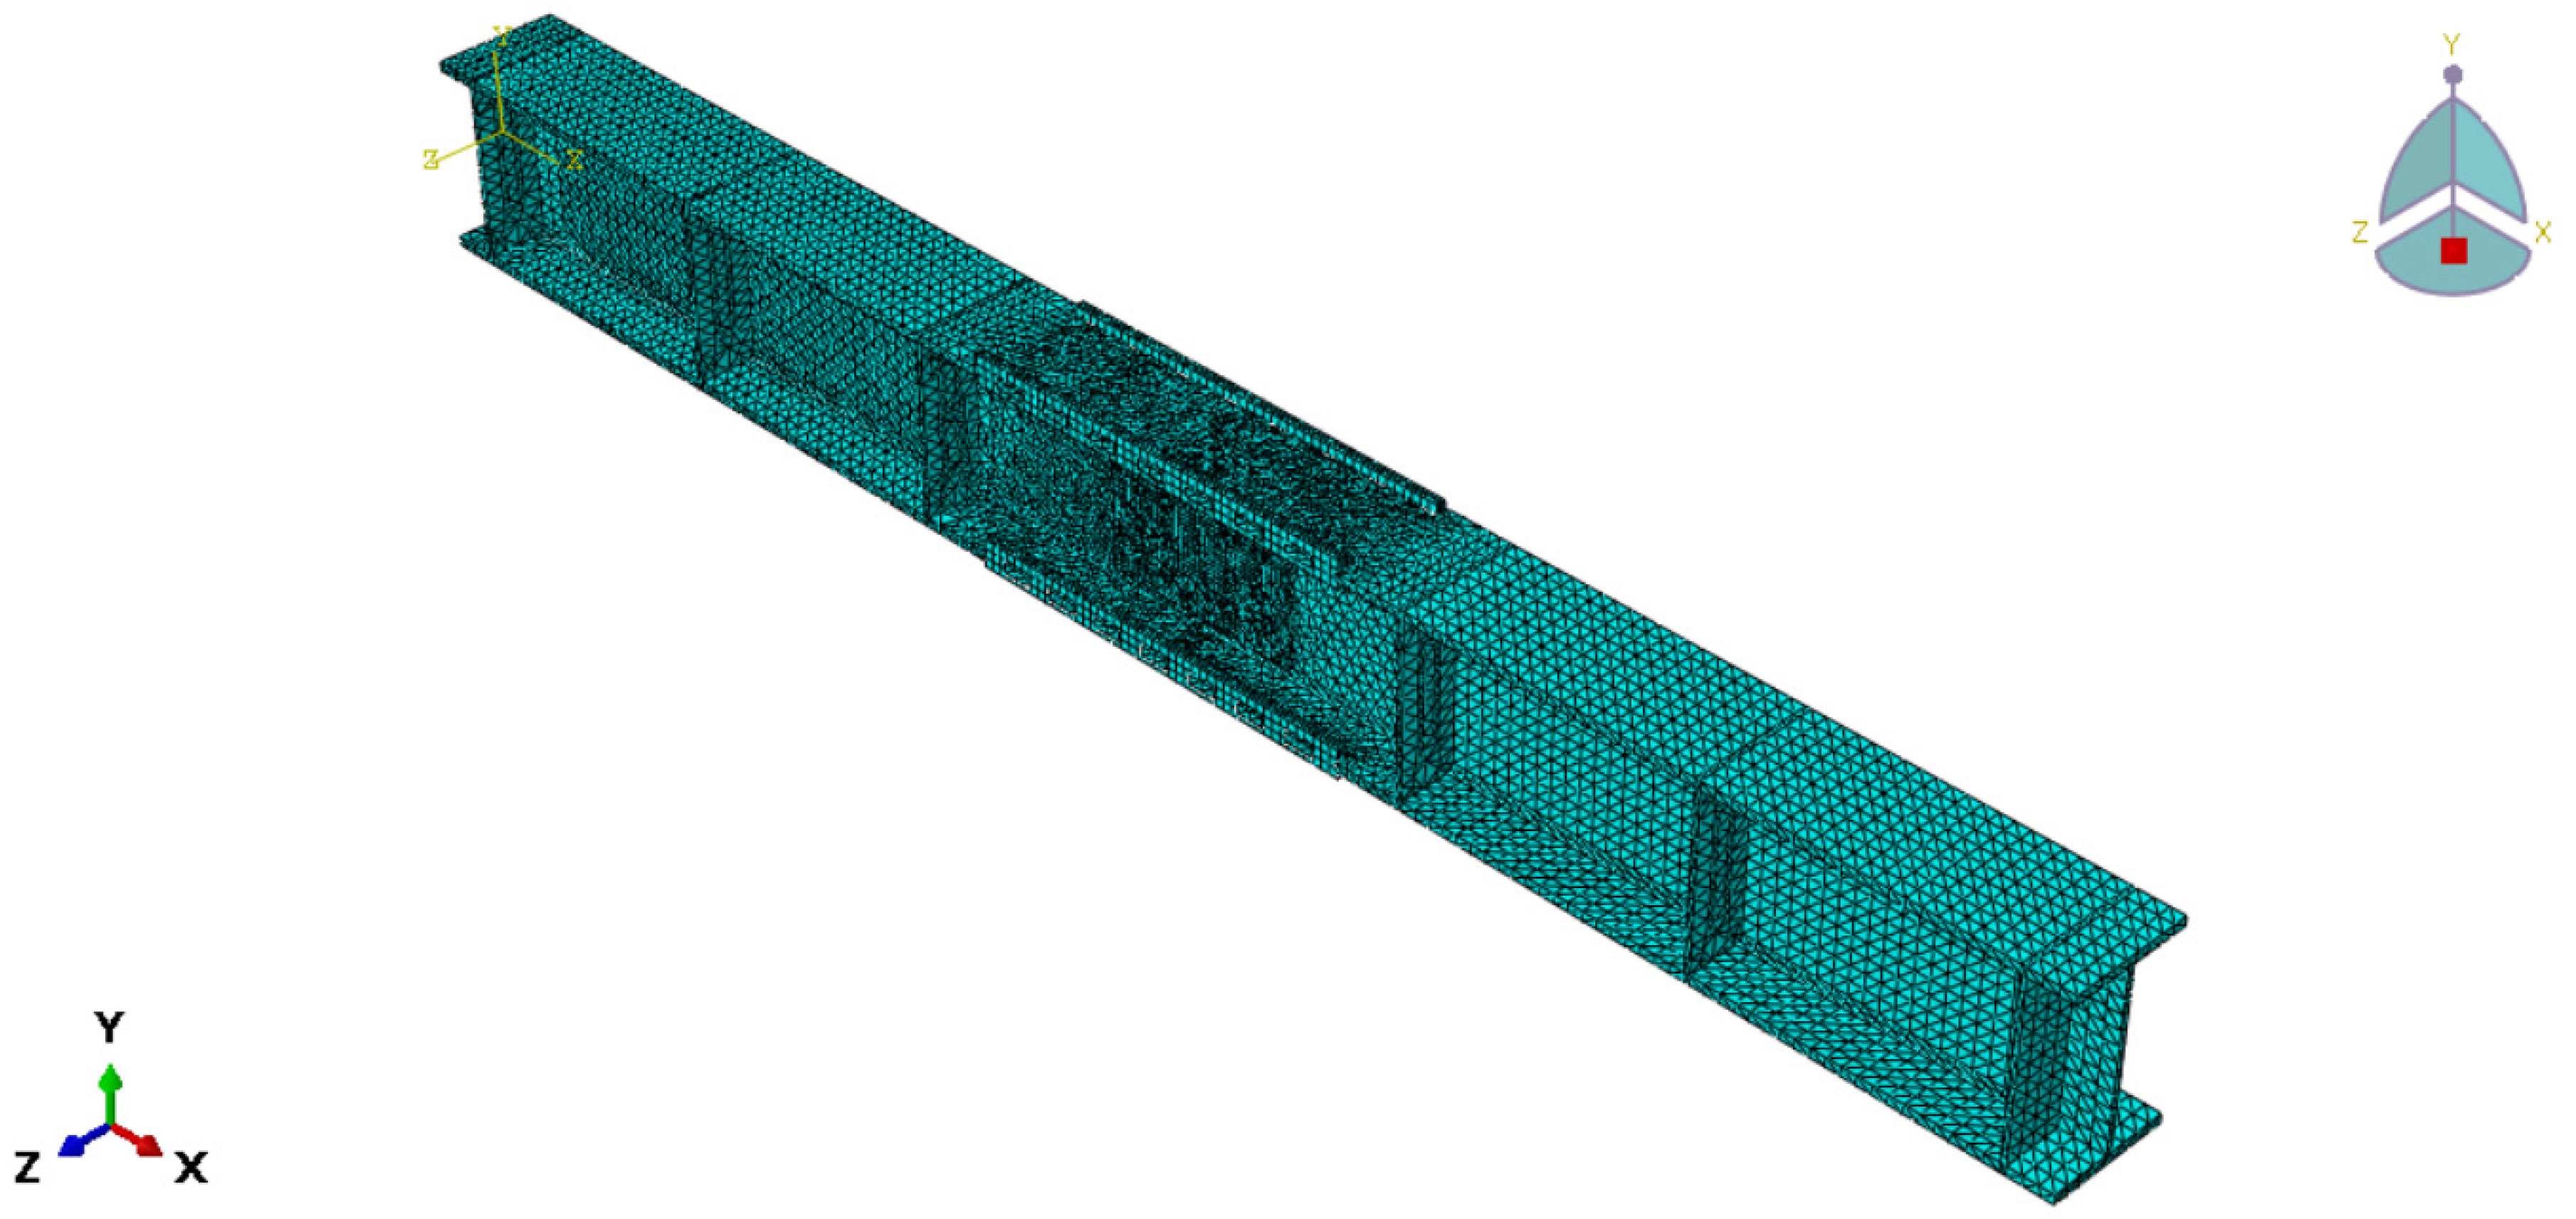
The finite element modelling of the standard beams is different from the built-up beams in the type of elements that were used for the mesh; therefore, all the assumptions that were made are presented herein. The structure was discretised by four-node linear tetrahedral elements (C3D4) which is suitable for complex nonlinear analyses involving contact, plasticity, and large deformations except of the flange side plates which was discretised with eight-node 3-dimensional solid brick elements (C3D8R) with linear displacement interpolation. For the flange side plates the mesh size was 10 mm and the total number of elements that was used, was 342 for each flange side plate. Figure 37a shows the mesh density for the flange side plate. For the web plate the approximate global size was 6 mm and the total number of elements was 19,015. Figure 37b shows the mesh density for the web plate in Abaqus. For the M12 bolts grade 8.8, the approximate global size was 4 mm and the total number of elements used was 352. Figure 37c shows the mesh density of the M12 bolts grade 8.8 adopted in Abaqus. For the first and second standard beam the approximate global size was 15 mm. Figure 38 shows the mesh density of the assembly of the standard beams in Abaqus. It should be stressed that: (i) C3D4 elements were used primarily to accommodate the complex geometry of the standard-beam model, (ii) C3D8R elements were retained in the critical flange side plates, (iii) first-order tetrahedral elements can require greater refinement than brick elements when highly localised stress/strain quantities are sought, and (iv) the good agreement with the experimental ultimate resistance, global load–displacement behaviour and failure mechanism, as shown later, provides the principal validation of the adopted discretisation for the objectives of the present study.
Figure 37.
(a) Mesh density of the flange side plate. (b) Mesh density of the web plate. (c) Mesh density of the M12 bolts grade 8.8 in Abaqus for the standard beam.
Figure 38.
Mesh density adopted for the FE model of the standard beams with the side intermeshed steel connection.
5.2. Loading and Boundary Conditions
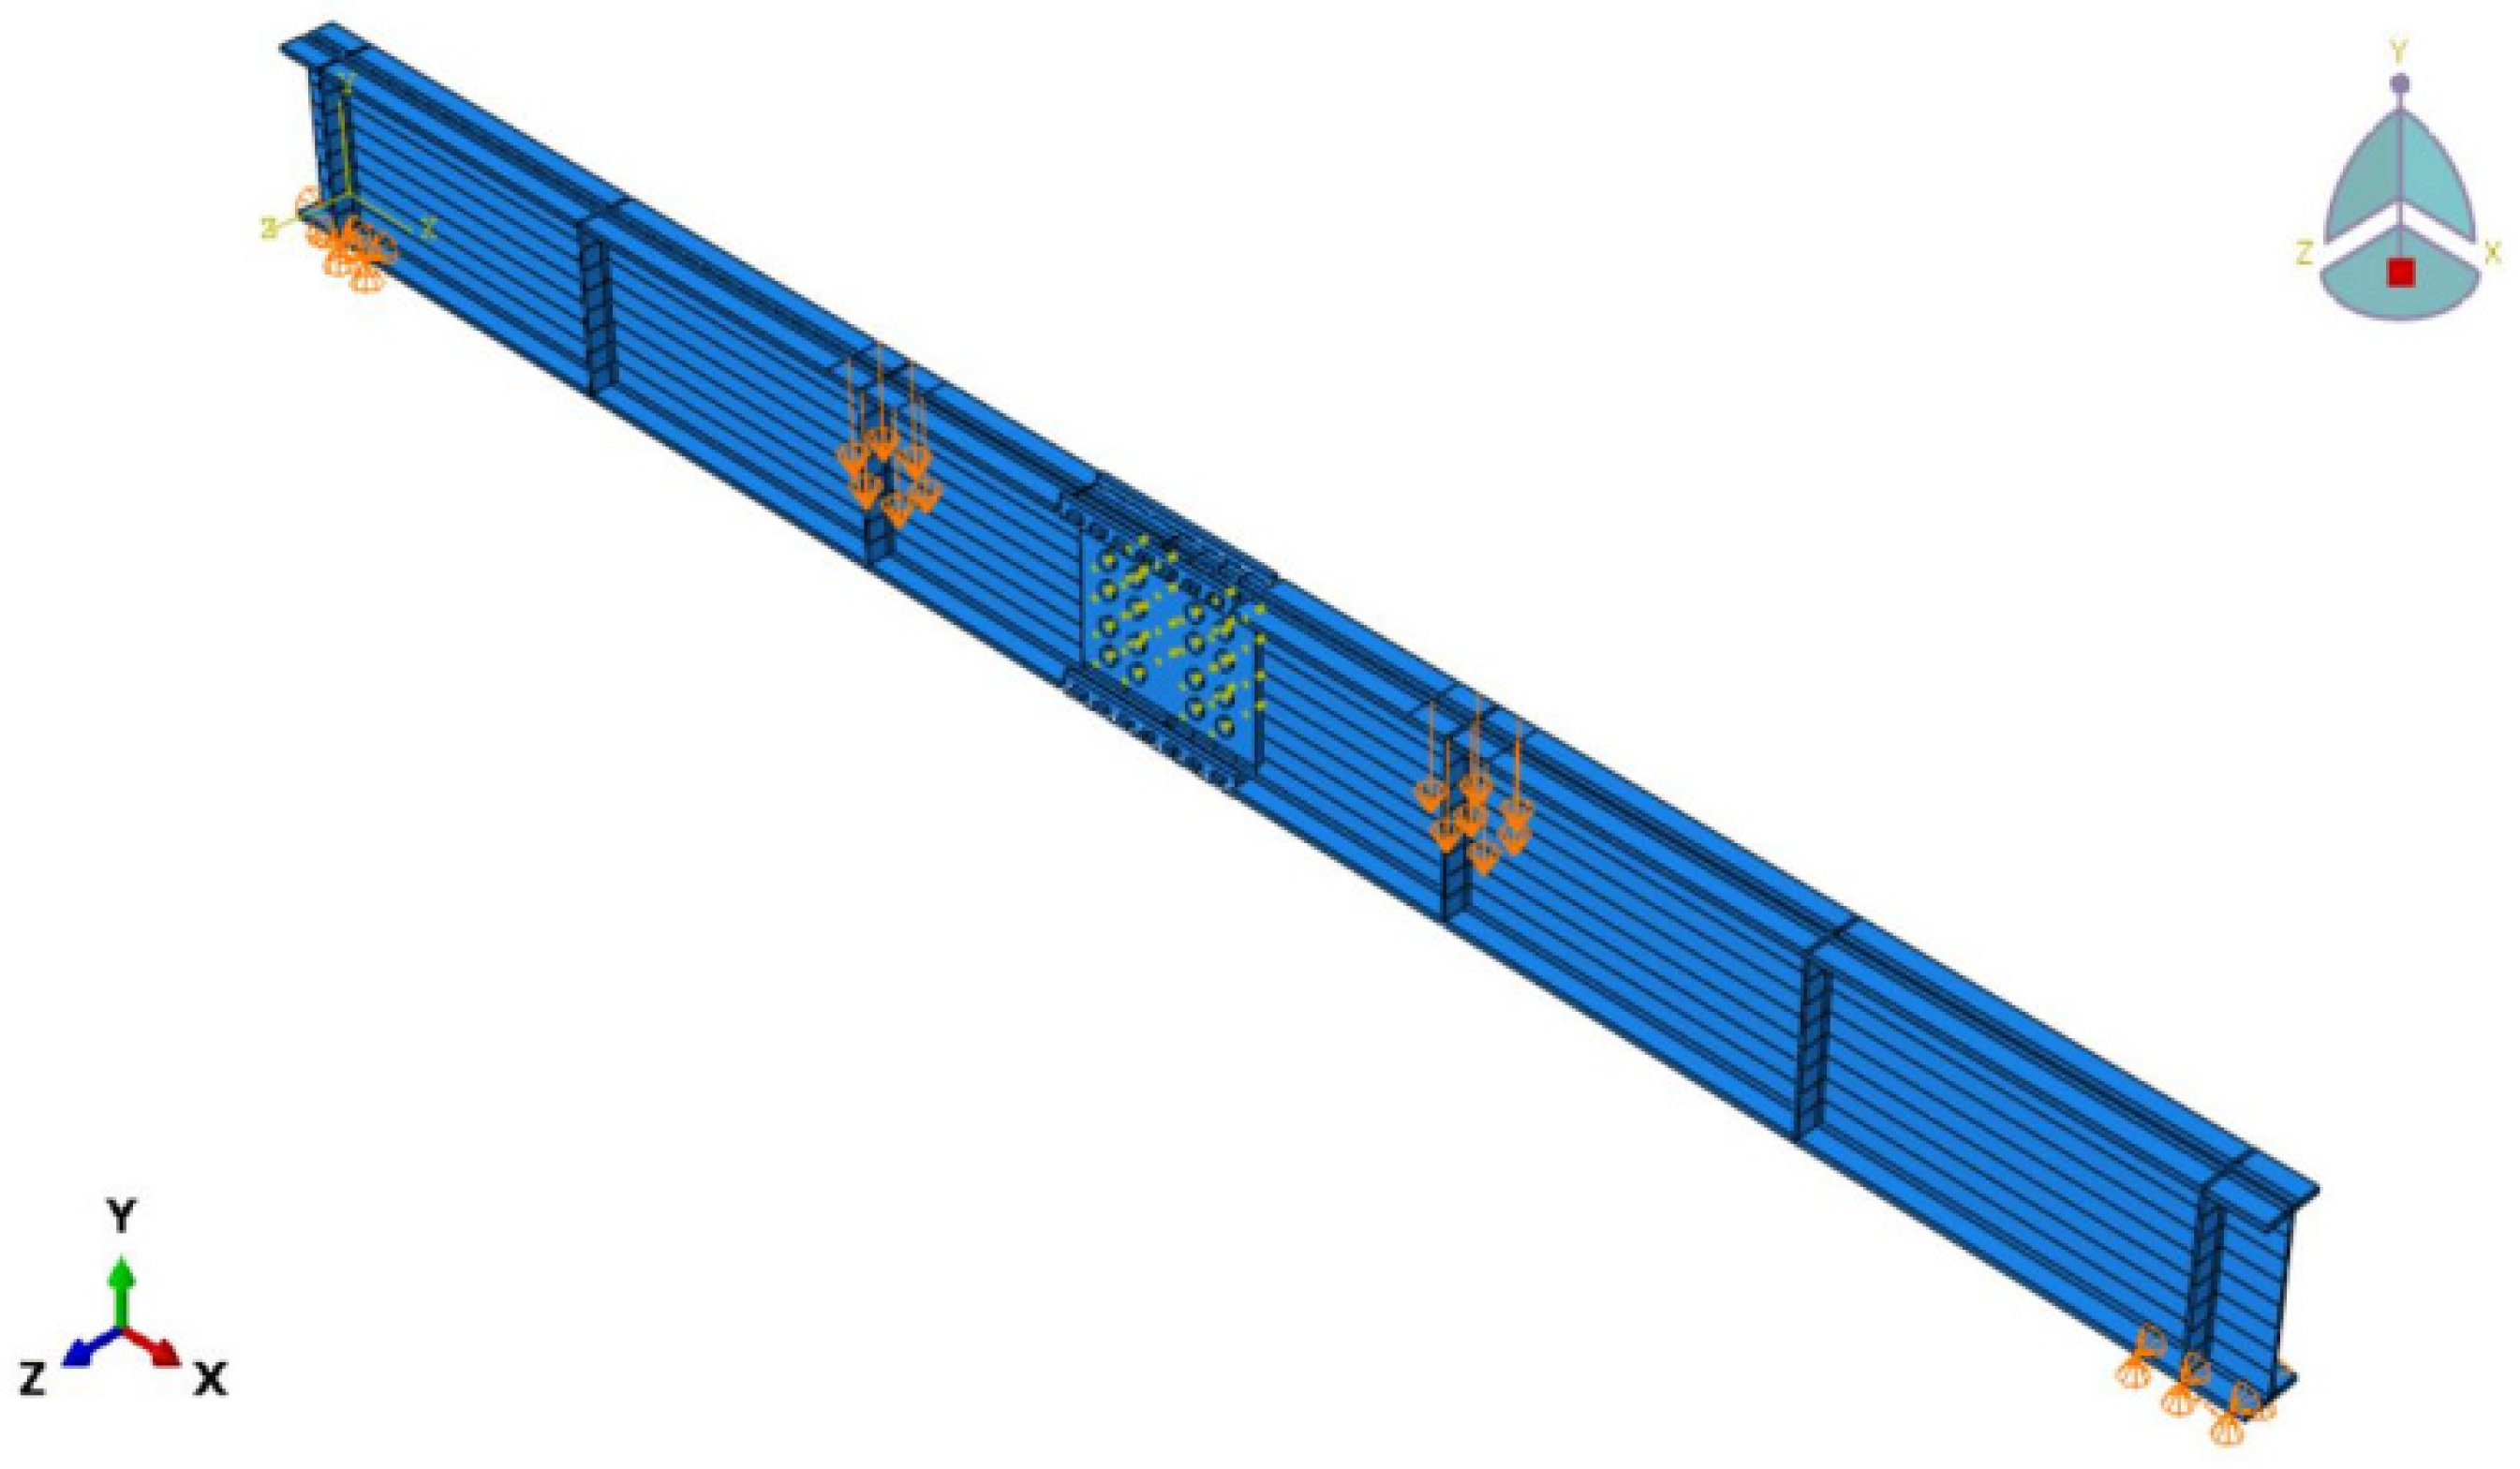
The identical specimens had the same loading scenario as each section was tested under double pressure loads. The experiments were conducted using a displacement control protocol at small increments. As a result, the testing procedure could be considered quasi-static since the inertial effects were negligible. Based on this description, an Explicit Dynamic analysis as quasi-static was used in which the jack displacement was applied to the loading areas of the specimen as shown in Figure 39.
Figure 39.
Loading and boundary conditions for the 3D NL FEA of the standard beams with the side intermeshed steel connection in bending around the major axis.
Regarding the boundary conditions the standard (rolled) beam was modelled as simply supported with pin support (U1 = U2 = U3 = 0) at the left and first stiffener and roller support (U2′ = U3′ = 0) at the right and last stiffener as shown in Figure 40.
Figure 40.
Boundary conditions for the experimental test of the standard beams with the side intermeshed steel connection in bending around the major axis.
5.3. Verification Against Experiment (Standard Beam)
The FE model for the standard beams was analysed under two vertical pressure loads, which resulted in constant moment in the intermeshed connection region. The analysis was displacement-controlled and it stopped at an approximate displacement level of 41 mm. At this step of the FE analysis, the experimental beams had failed at the centre of the two bottom side plates at the interface between the two beams. Comparison of the global behaviour through load–displacement curves further proves that the FE model was able to simulate Test 3 and Test 4 accurately, as shown in Figure 41. As depicted (in Figure 42, Figure 43 and Figure 44), the two standard beams were disengaged (separated) from each other when the failure occurred at the centre of the two bottom side plates. This was similar to the failure mode as depicted in Test 3 and Test 4 shown in Figure 45.
Figure 41.
Load–displacement behaviour of the standard beams according to tests and FE analysis.
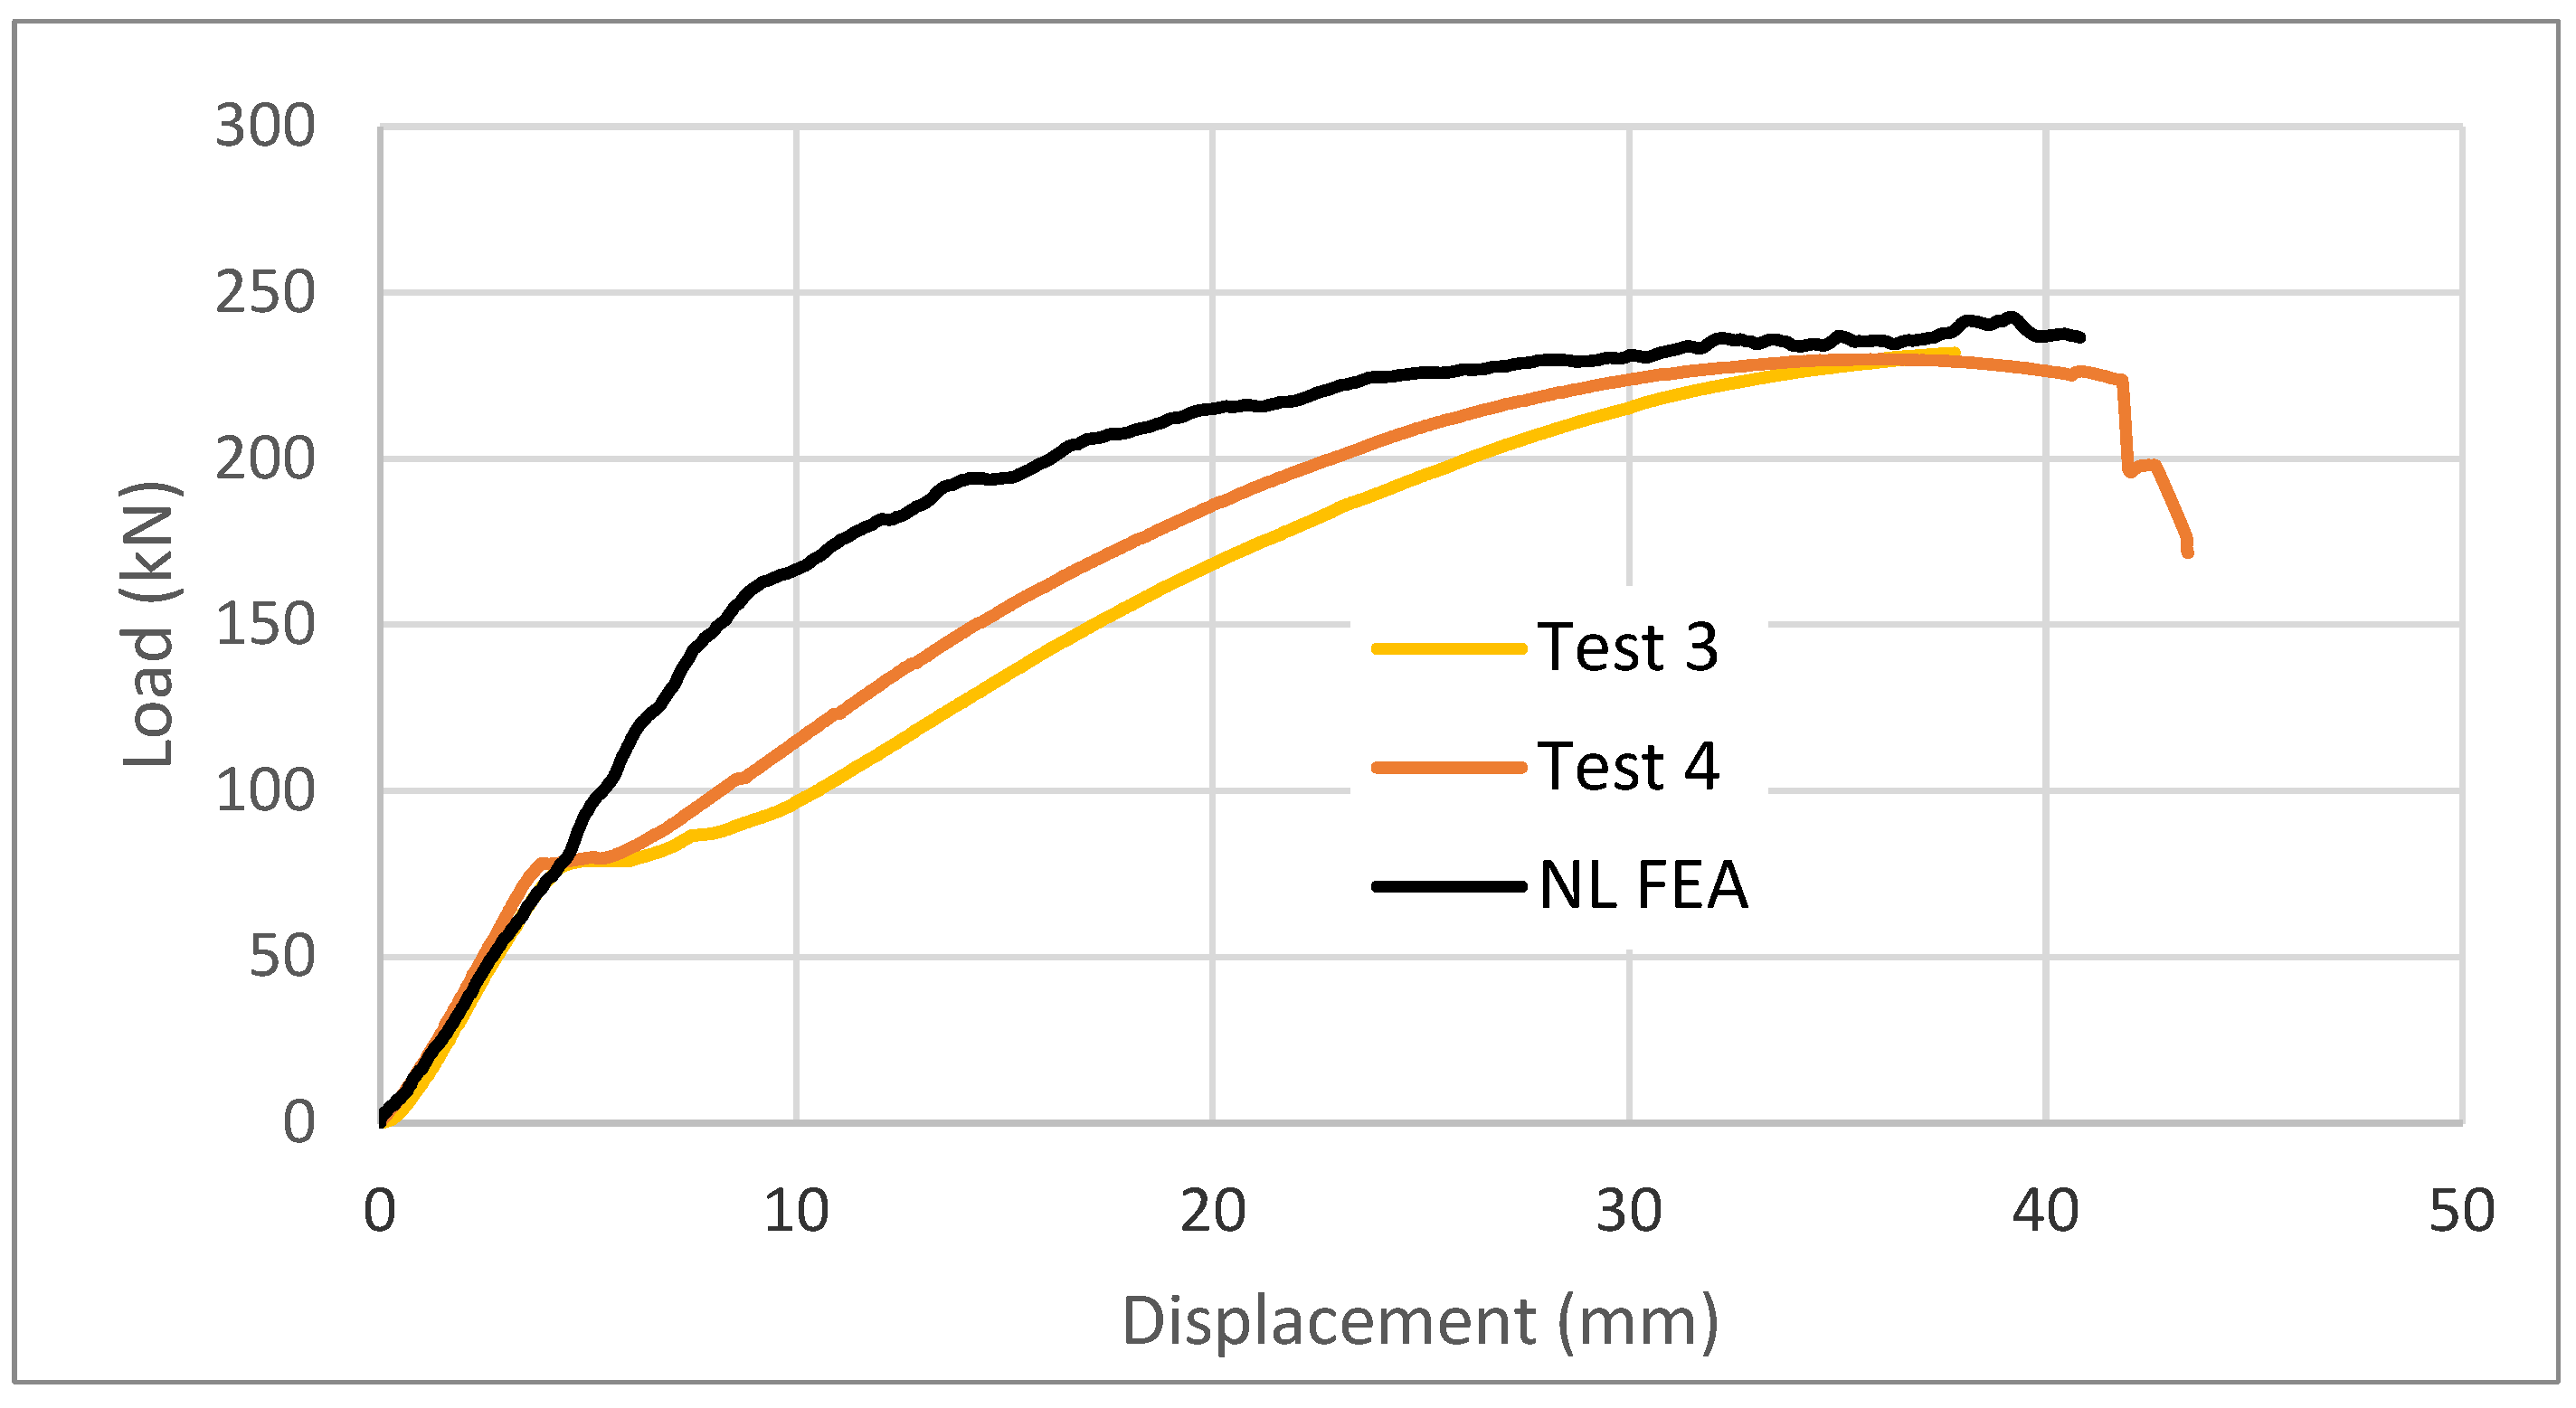
Figure 42.
Side view of the failure mode obtained from the 3D NL FEA of the standard beams incorporating the side intermeshed steel connection.
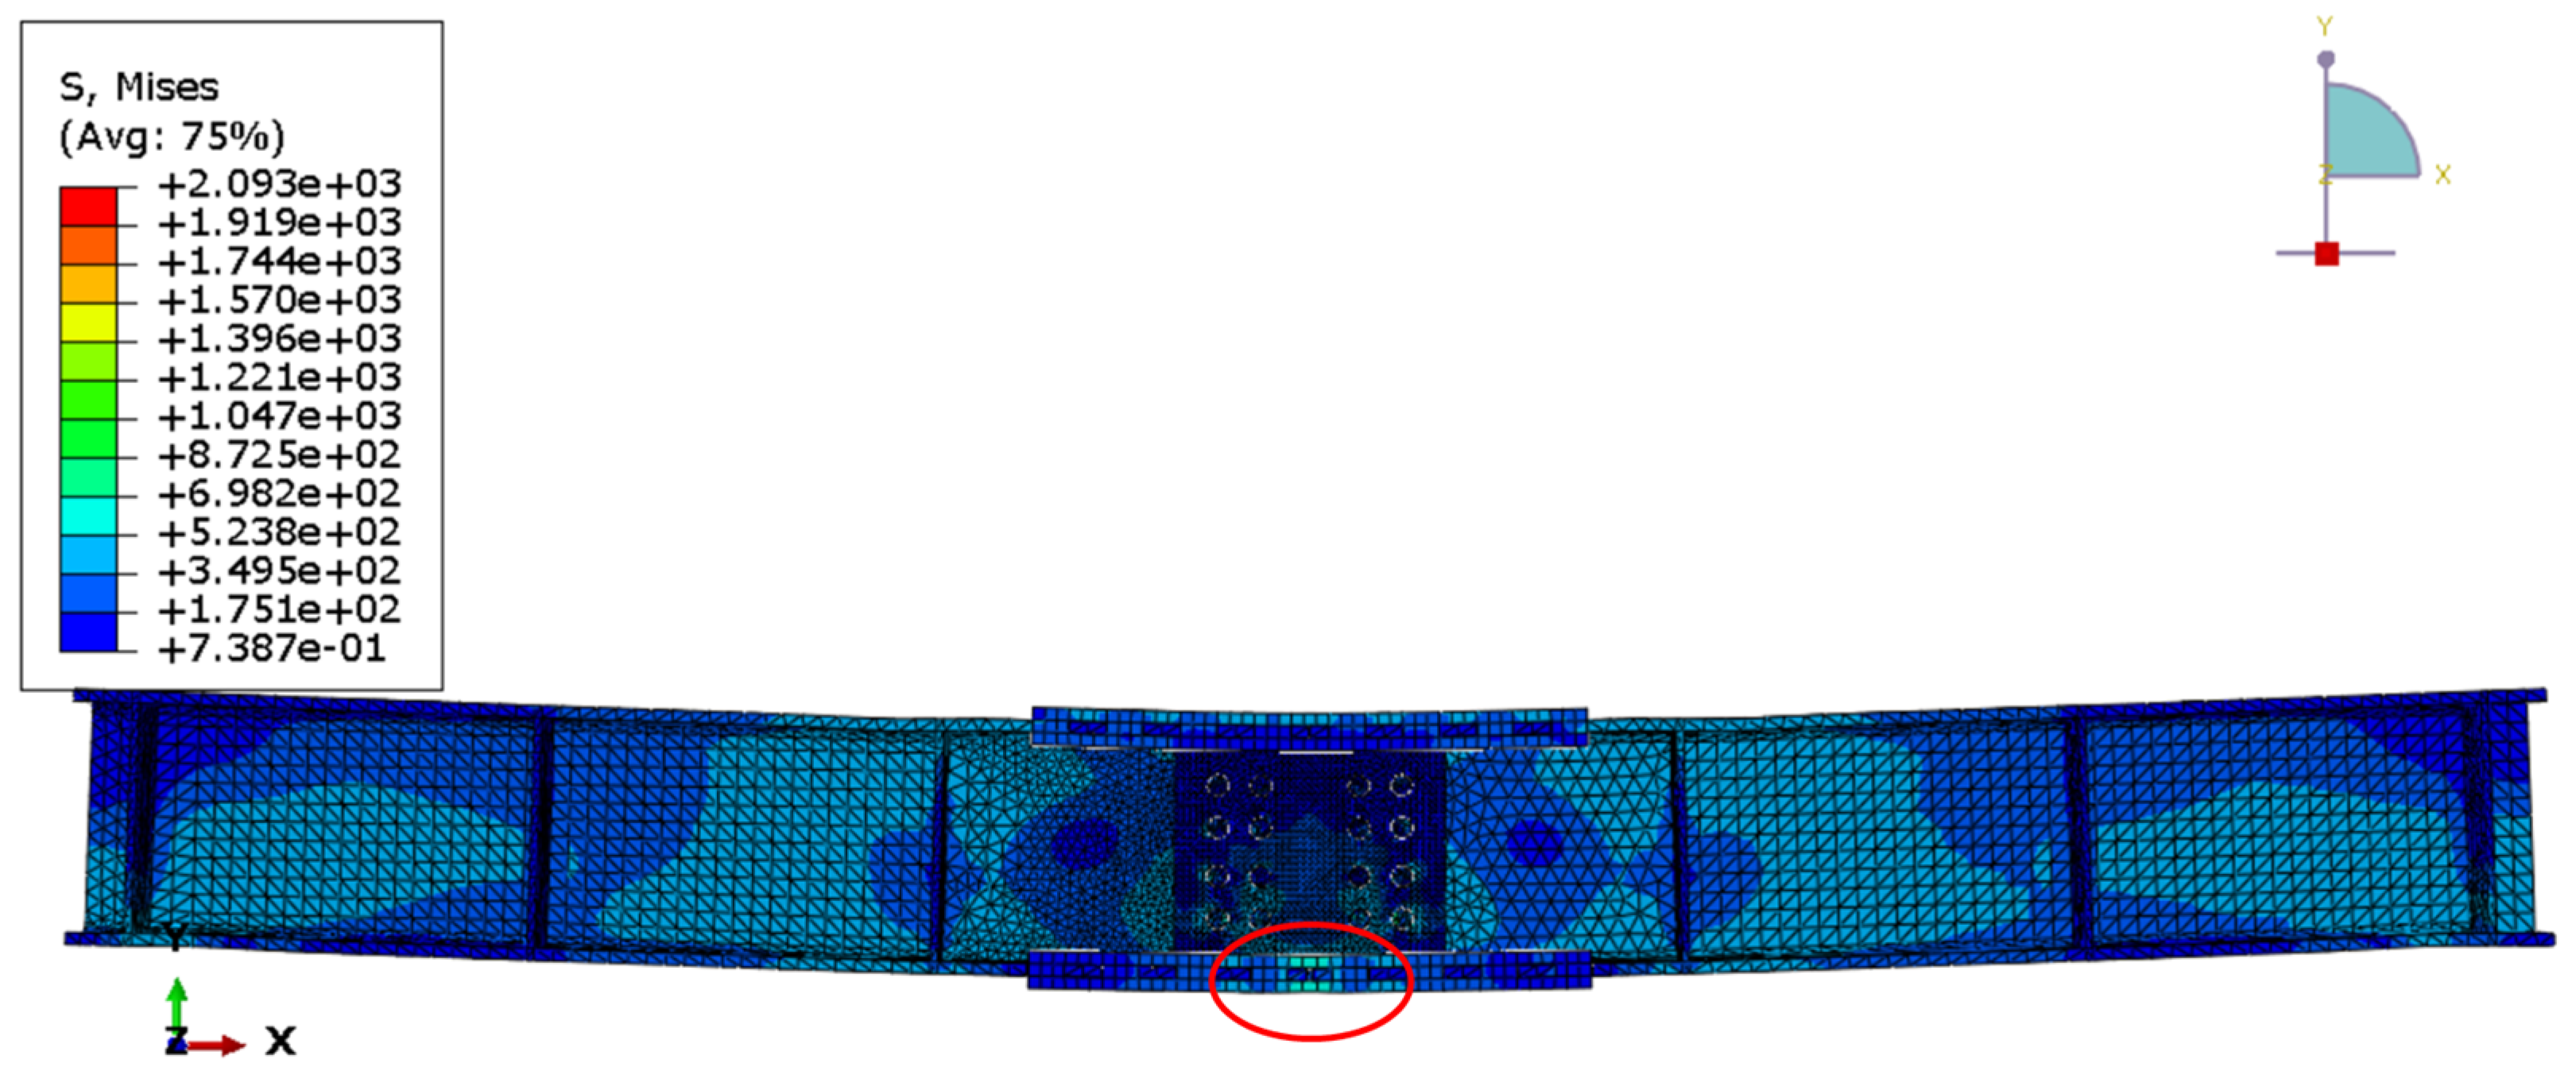
Figure 43.
Failure mode of the experimental test of the standard beams with the intermeshed steel connection in bending.
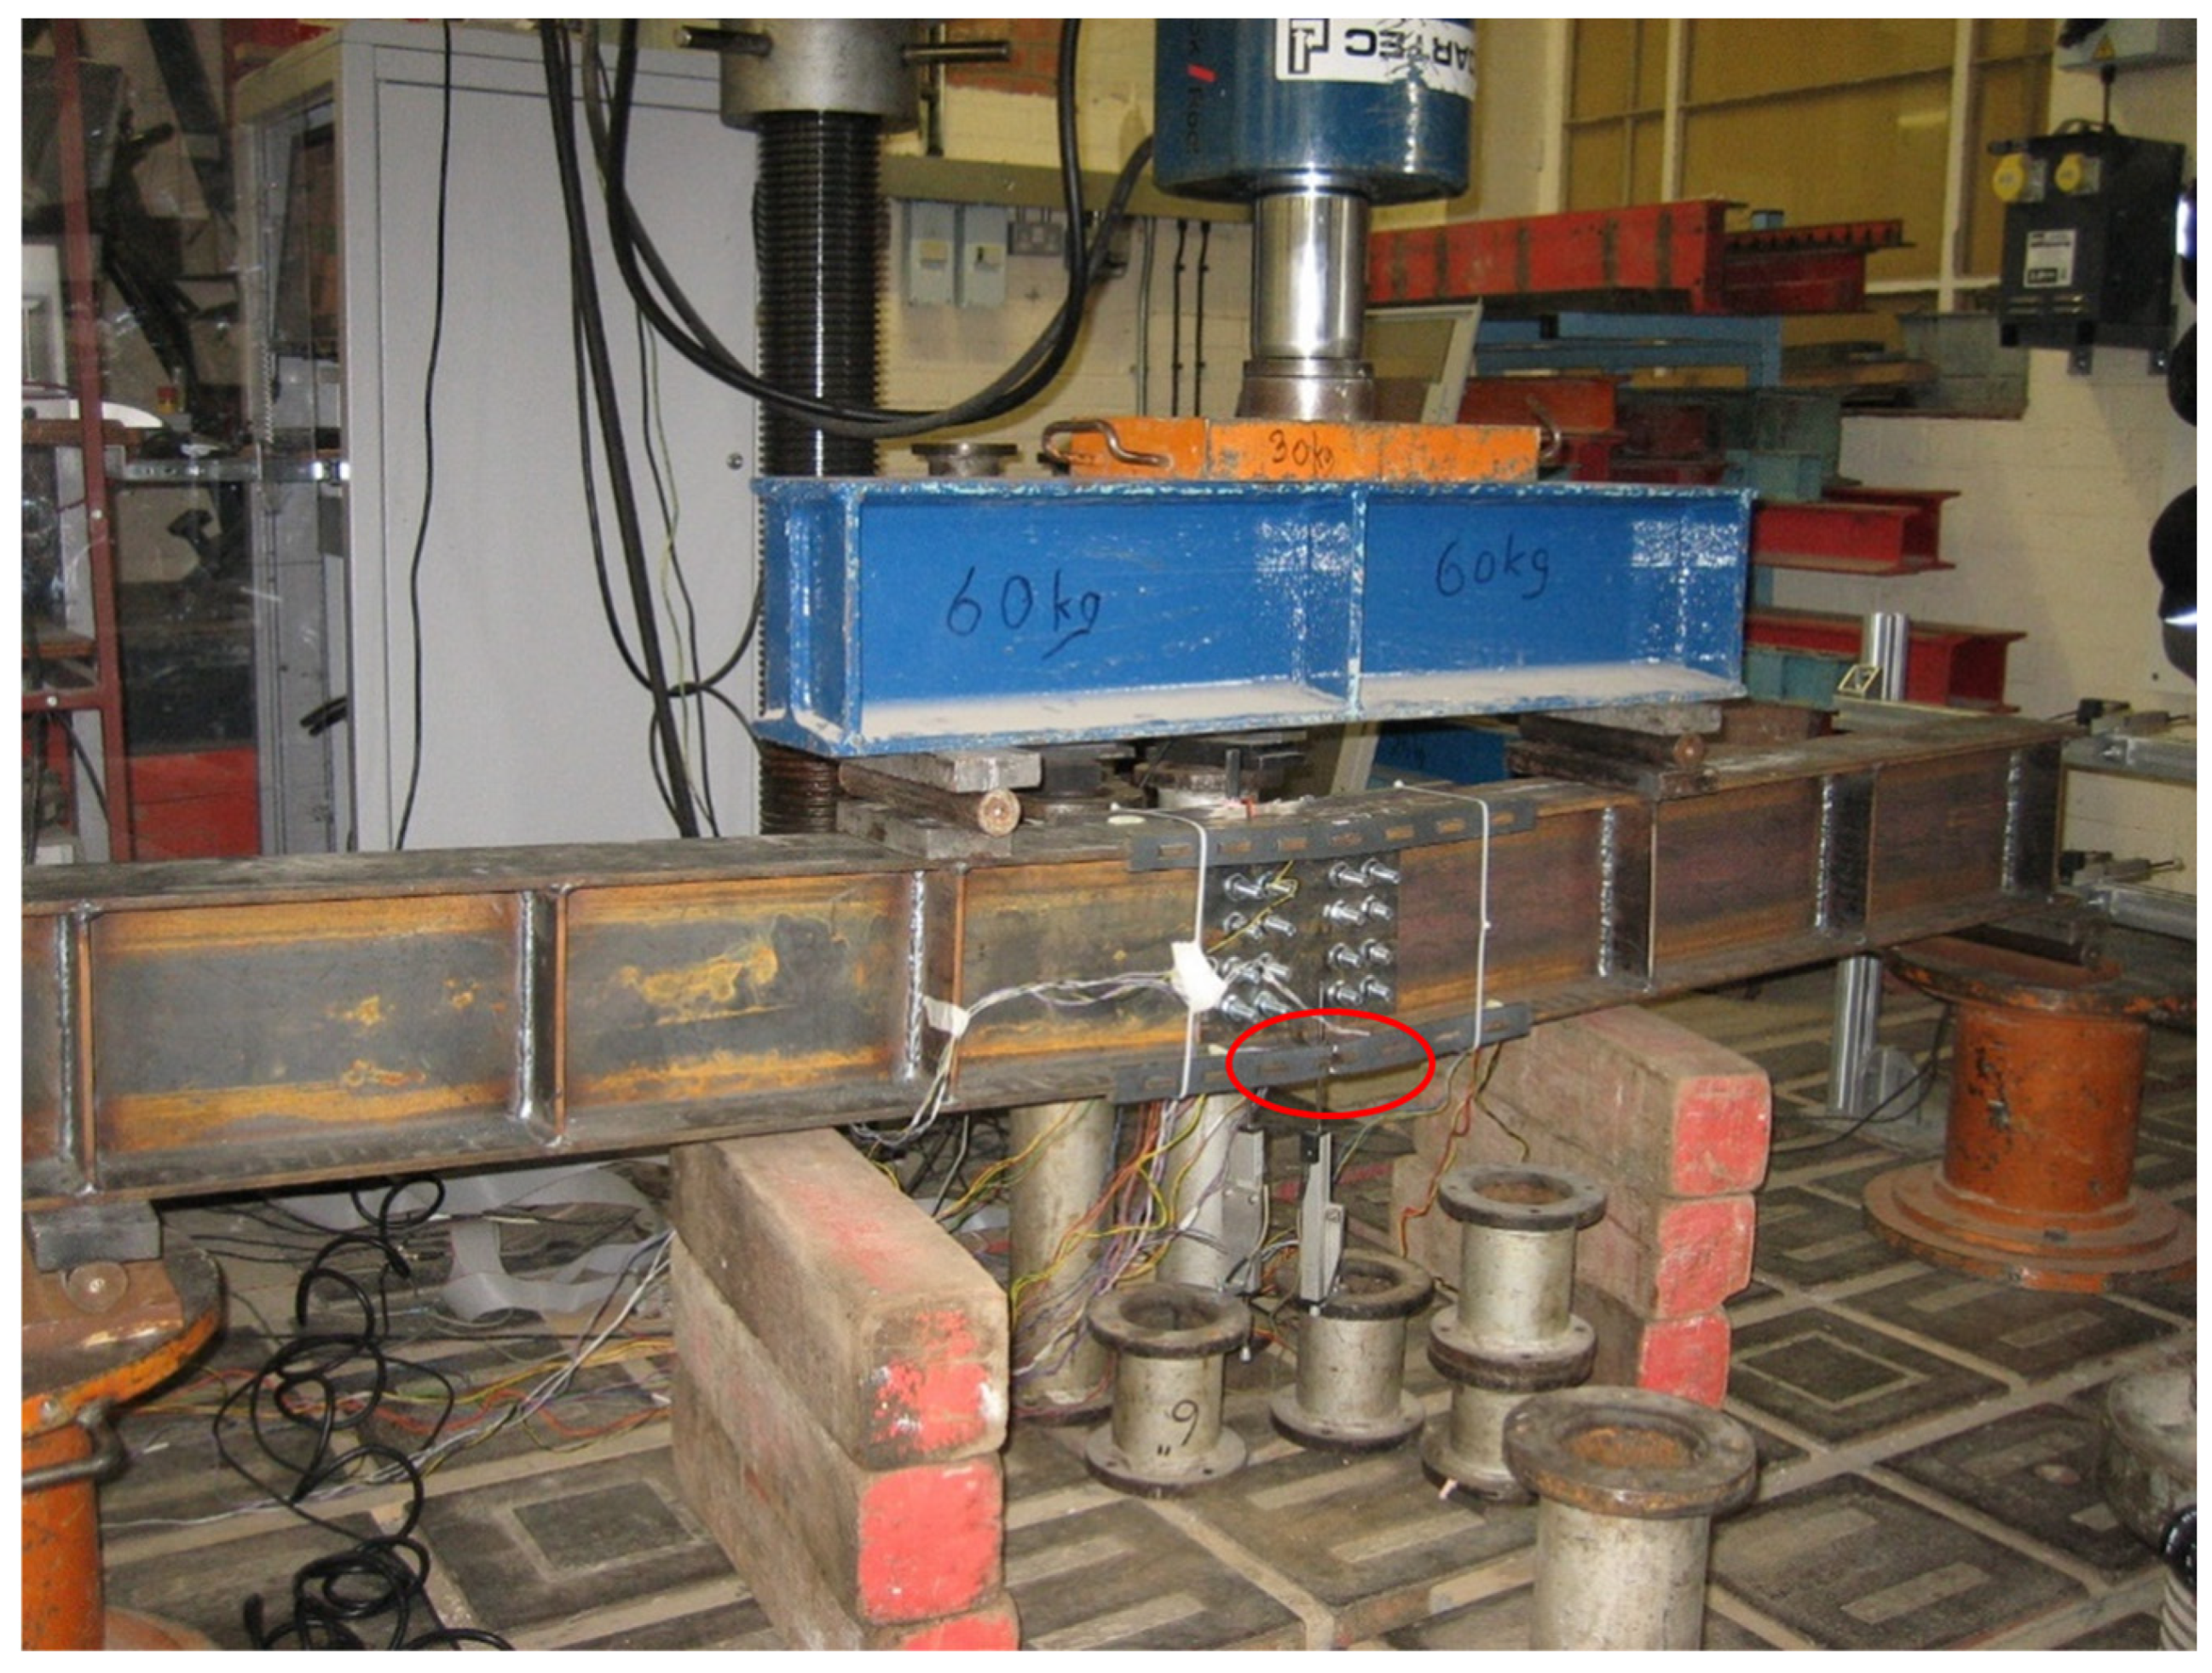
Figure 44.
Close-up view of failure mode obtained from the 3D NL FEA for the standard beam incorporating the side intermeshed steel connection.
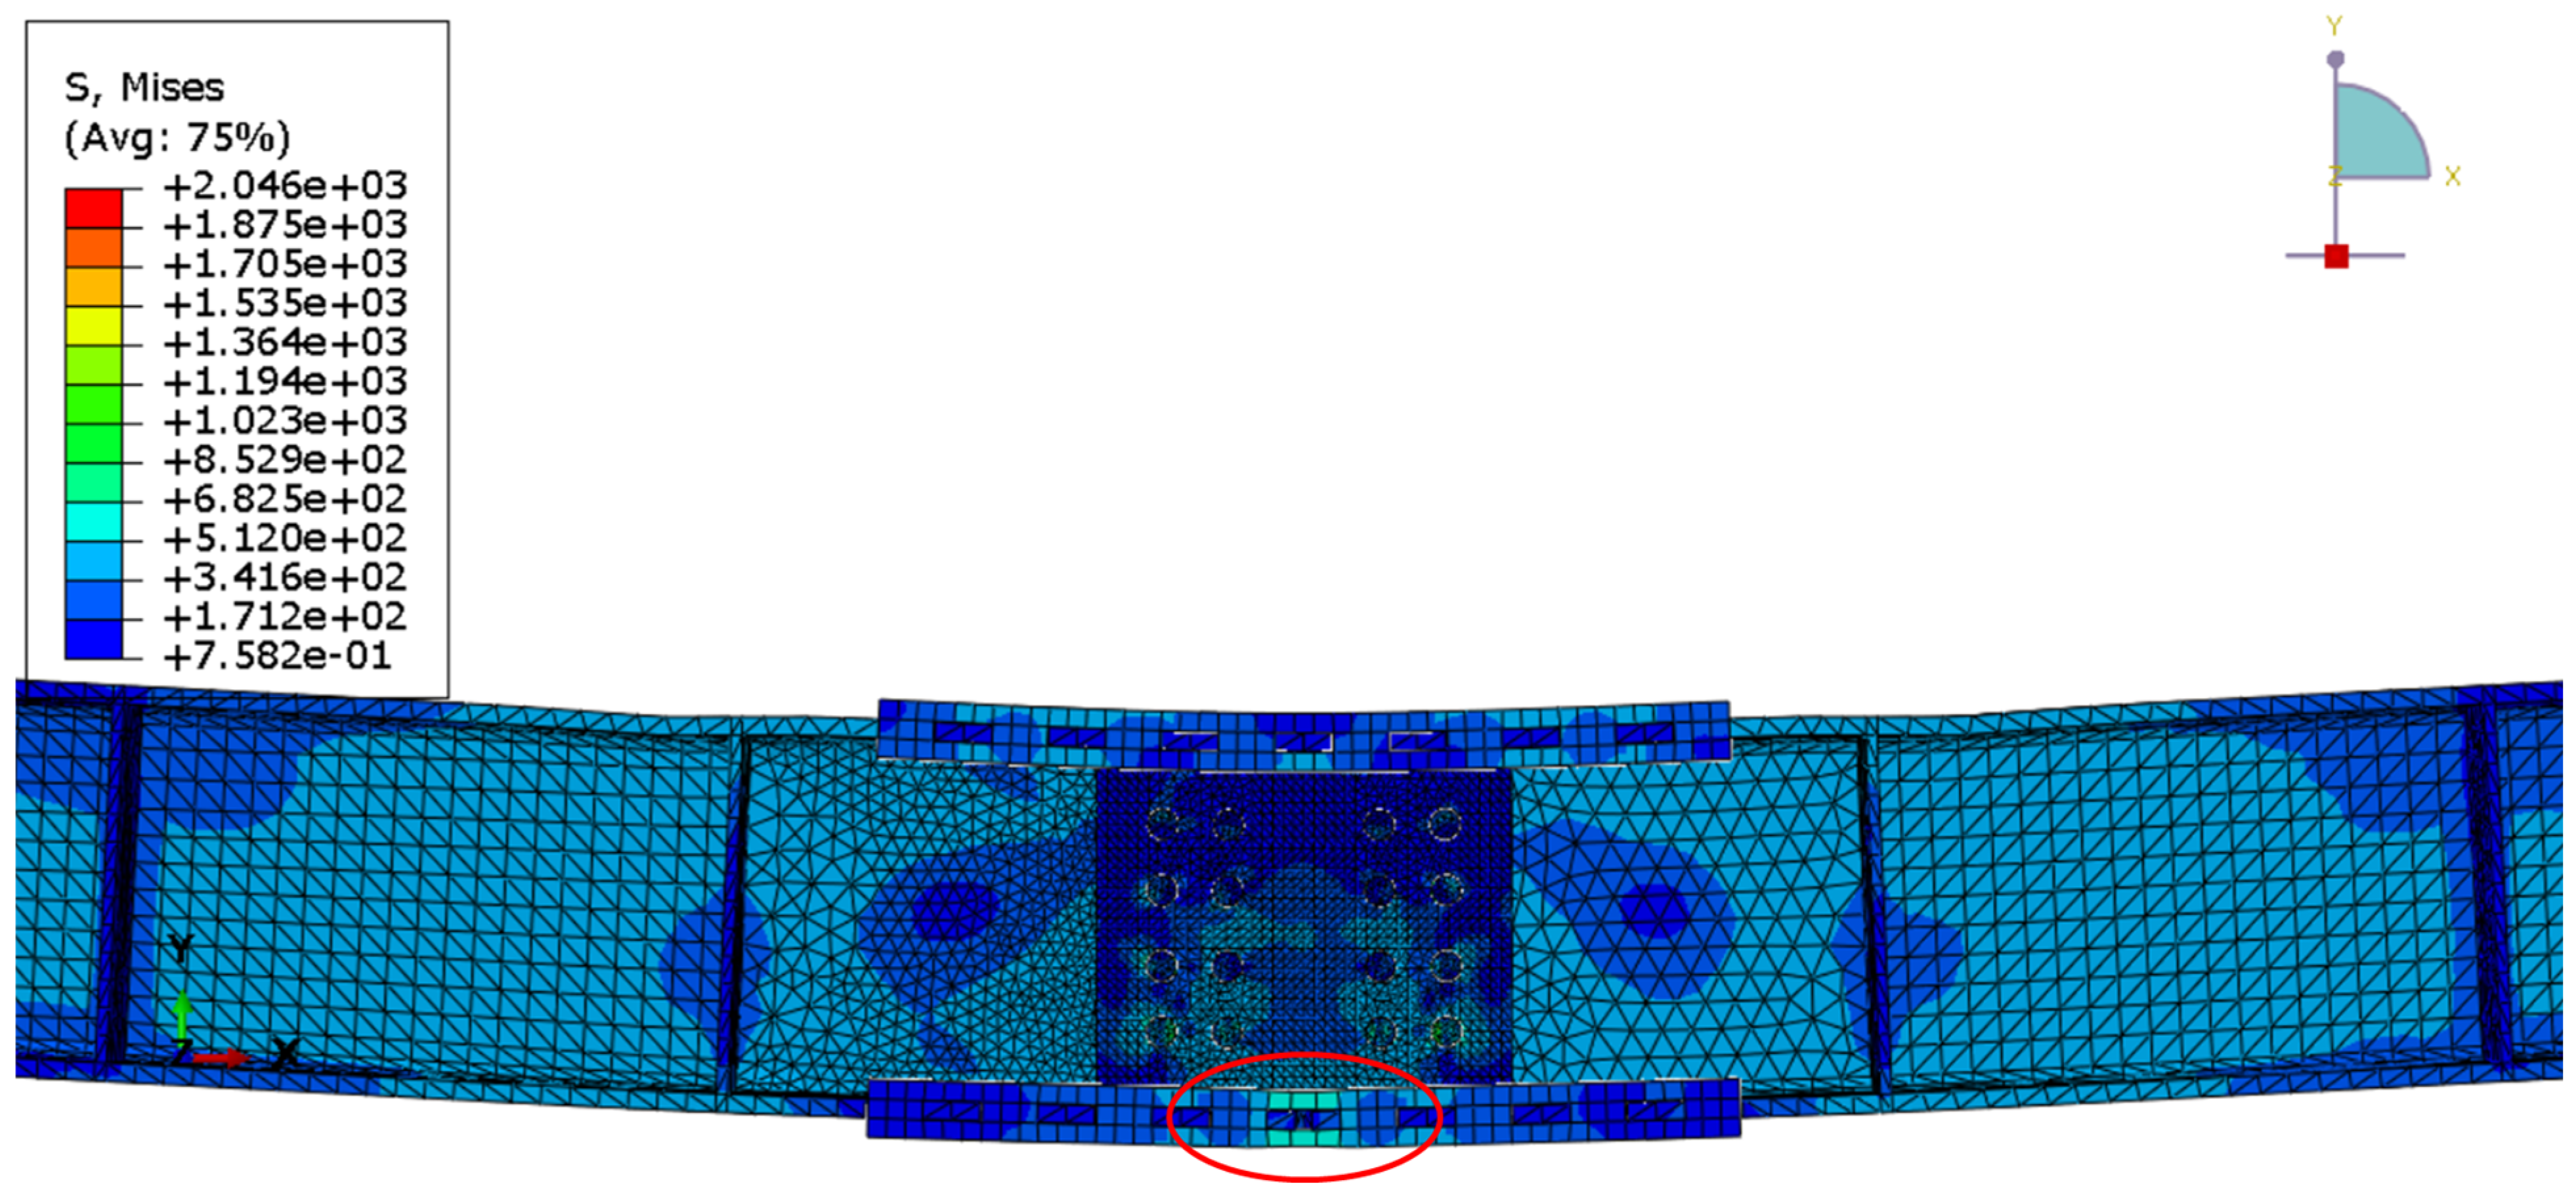
Figure 45.
Close-up view of failure mode obtained from the experimental test of the standard beam in bending.
In the experimental tests, there is some slippage of the bolts that occurs at approximately 4.2 mm. This was observed during the experiments. In the 3D NL FEA there is perfect geometry of the bolt and bolt hole; this is why there is no plateau in the FEA. However, the yielding and failure mode occurs at the midpoint of the lower-flange side plates (extreme tension fibres) according to the numerical analysis and the NL FEA shows very good agreement with the experimental tests. No parametric study was performed because the goal was to study and analyse only the pure flexural behaviour of the beams using the side intermeshed steel connection on full scale.
The numerical models employed idealised connection geometry and did not explicitly account for the as-built bolt-hole clearances or tooth-to-slot fabrication tolerances. Although bolt slip was observed experimentally at approximately 4.2 mm displacement, the idealised bolt and bolt-hole geometry adopted in the FE models did not reproduce the corresponding plateau observed in the experimental load–displacement response. Detailed specimen-specific measurements of the bolt-hole clearances and tooth-to-slot tolerances were not systematically recorded during the experimental programme and therefore could not be reliably incorporated retrospectively into the numerical models. Furthermore, a coefficient of friction of 0.3 was adopted consistently for the relevant contact interactions, and a parametric sensitivity study of this value was outside the scope of the present investigation. Consequently, the influence of fabrication tolerances, connection clearances and friction on the detailed local response should be regarded as a limitation of the present numerical study and necessitate dedicated investigation in future work.
6. Discussion of Results
Table 2 below shows the experimental results of displacements and Yield and Ultimate load values between Test 1 and Test 2 and between Test 3 and Test 4.
Table 2.
Displacement and load values comparisons between tests.
According to Test 1, the built-up beam specimen started to yield at approximately 16.0 kN with a corresponding displacement of 4.2 mm. The design yield load of the beam is 19.2 kN; therefore, yielding occurred at approximately 83.3% of the design value. Although yielding initiated at this load level, strength degradation did not commence until a displacement of approximately 37 mm, indicating that the specimen sustained an additional 32.8 mm of plastic deformation after yielding. This corresponds to approximately 8.8 times the yield displacement, demonstrating a high level of deformation capacity and ductile behaviour prior to the onset of strength degradation. During the test, a maximum load of 38.6 kN was recorded. The various connection elements continue to deform inelastically after the ultimate load was reached. The connection eventually failed due to a ductile fracture at the midpoint of the two lower side plates. For the built-up beam in Test 2, a similar behaviour with Test 1 was observed. The specimen of Test 2 started to yield approximately at a load of 17 kN at a displacement of 4 mm approximately. The maximum load permitted on the beam according to the design is 19.2 kN. Therefore, according to Test 2 the specimen started to yield at 88.5% of the design yield load. The design had a light tolerance, so the difference is due to the tolerance assumed in the design for Test 1 and Test 2. During the test a maximum load of 38.9 kN was recorded. After that load the various connection elements continue to deform inelastically until the connection failed with the same way as observed in Test 1. The similarities of the results of Test 1 and Test 2 shows that the results are consistent and reliable. Table 2 shows the similarities of the results for Test 1 and Test 2 not only at the yield and ultimate load.
For the standard beam, in Test 3 the specimen started to yield at a load of approximately 78.5 kN at a displacement of 4.7 mm. The maximum load permitted on the beam according to the design is 65.9 kN. Therefore, the specimen started to yield at 119% of the design yield load. Throughout the test, a maximum load of 232.5 kN was measured. The various connection elements continue to deform inelastically after the ultimate load was reached. The connection eventually failed due to a ductile fracture at the midpoint of the two lower side plates. In Test 4, the standard beam presented similarities in the yield load, ultimate load and failure mode with Test 3. In Test 4, for the standard beam a yield load of 78.3 kN was measured at a displacement of 4.5 mm. The maximum load permitted on the beam according to the design is 65.9 kN. Thus, the specimen started to yield at 118.8% of the design yield load. This discrepancy can be attributed to manufacturing tolerances in the specimen and the actual strength of the steel exceeding its nominal design strength. Throughout, the test an ultimate load of 229.9 kN was measured at a displacement of 37 mm. These similarities of the results between Test 3 and Test 4 show that the results are consistent and reliable. Table 2 shows the similarities of the results for Test 3 and Test 4, not only for the yield and ultimate load.
In all the tests, the side intermeshed steel connection (side ISC) failed consistently in a ductile manner at the midpoint of the lower side plates, as was intended in the design. This finding is significant as it could possibly facilitate component replacement and future reuse.
Further information will be required in future testing to confirm and expand on those results since the effect and impact of the fabrication tolerances of the side plates of the connection was not studied during this experimental and numerical study. More tests are needed with more strain gauges applied at the lower side plates would be beneficial to determine the effect of fabrication tolerances in the performance and behaviour of the connection. The FE analysis can give better insight to the load transfer mechanisms between individual components of the connections and the teeth performance.
7. Conclusions
This study focused on the performance of intermeshed connections by conducting tests and nonlinear finite element analyses in Abaqus. The main goals were to generate further insight on the bending behaviour of the tested intermeshed beam specimens, and to improve the structural behaviour of the connection. Four detailed models including general contact were developed to simulate the response of the four beam specimens, with intermeshed connection and two different beam sizes, the built-up section and the standard 203 × 133 UB 30 section that were tested in the laboratory. The results of these models were presented at global and local level scales to provide a platform with which to evaluate the validity of the FE models to simulate the experimental response data. Comparison of the numerical and experimental results confirmed that by choosing suitable analysis methods and model parameters, Abaqus can accurately simulate the behaviour of intermeshed connection in bending. For that, the boundary conditions for the beams and the application of loading are very important. The connections for the four beam specimens were designed and investigated numerically in Abaqus.
The nonlinear FE analyses reproduced the overall load–displacement response and local deformation behaviour of the tested specimens with varying levels of accuracy. For the built-up beams, the numerical yield load of approximately 17.1 kN was close to the experimentally observed yield loads of 16.0 and 17.0 kN, while the predicted ultimate load of approximately 37.5 kN compared well with the experimental values of 38.6 and 38.9 kN. For the standard rolled beams, the predicted ultimate load of approximately 241 kN also showed reasonable agreement with the experimental ultimate loads of 232.5 and 229.9 kN. However, the numerical model substantially overpredicted the onset of yielding for the standard rolled beams, predicting approximately 123 kN compared with the experimentally identified values of 78.5 and 78.3 kN. The numerical model should therefore be considered more reliable for reproducing the overall nonlinear response and ultimate load than for predicting the onset of yielding in the standard rolled-beam specimens. Fracture was not explicitly modelled in the FE analyses. Therefore, no ductile-damage initiation criterion, damage evolution law, or element deletion technique was employed. The numerical analyses reproduced the development and localization of plastic deformation up to the displacement associated with the experimentally observed fracture condition but did not simulate crack initiation, propagation, or material separation. Consequently, the fracture of the lower side plates reported in the experimental programme should be regarded as an experimentally observed failure mechanism rather than a fracture mode directly predicted by the FE model. No out-of-plane movement was observed in any of the specimens and the specimens failed due to damage associated with yielding in the connection zone as planned. In particular, the intermeshed steel connection failed at the centre of the two lower-flange side plates and the two beams were separated from each other. This desirable failure mechanism provides the potential for the disassembly of the beam specimens, after some damage and replacement of the flange side plates and the shear web plates.
The findings of this study should be interpreted within the scope of the experimental programme considered. The experimental investigation comprised four full-scale specimens, including two nominally identical built-up beams and two nominally identical standard rolled beams, with the side ISC located within a pure-moment region. Although the repeat tests provided useful evidence of the reproducibility of the observed structural response, the programme was limited to a single side ISC configuration and one beam size within each beam category. Consequently, the conclusions drawn from the present study are specific to the connection geometries, beam sections, material properties, and loading conditions investigated and should not be generalised to other intermeshed beam connection configurations without further validation.
Although the observed failure was primarily concentrated in the replaceable side plates, the present experimental programme did not directly demonstrate the reusability of the connection. The specimens were not disassembled following testing, fitted with replacement side plates, reassembled, and subsequently retested. Consequently, any residual deformation or local damage to other connection components, including the intermeshed beam teeth, bolt holes, web plates, and beam ends, was not quantified. The observed failure mechanism therefore indicates that the proposed configuration could facilitate component replacement and future reuse, but should not be interpreted as experimental verification of reusable performance. Further experimental investigation involving repeated assembly, disassembly, component replacement, reassembly, and reloading, together with detailed assessment of residual deformation and damage, is required to establish the reusable performance of the proposed connection. In addition, future experimental and numerical investigations should examine a wider range of parameters, including beam size, side ISC geometry, tooth dimensions, flange and side-plate thicknesses, and other relevant geometric and material variables.
Author Contributions
Conceptualisation, P.M., P.J.M. and K.D.T.; Methodology, P.M.; Software, T.M. and S.T.; Validation, P.M.; Formal analysis, P.M. and M.E.S.; Investigation, P.M. and A.E.S.; Resources, T.M., P.J.M., S.T. and A.E.S.; Data curation, T.M. and K.D.T.; Writing—original draft, P.M.; Writing—review and editing, M.E.S. and K.D.T.; Visualisation, P.M.; Supervision, S.T.; Project administration, P.J.M., S.T. and A.E.S.; Funding acquisition, P.J.M. and A.E.S. All authors have read and agreed to the published version of the manuscript.
Funding
The research presented in this paper is part of a collaboration and partnership between Queen’s University Belfast (QUB), University College Dublin (UCD) and the University of Minnesota (UMN). The authors wish to express their gratitude for the funding received from the USA-Ireland Research and Development Partnership Programme, supported by the Department for the Economy (DfE) and Invest Northern Ireland (Invest NI) through grant USI-096, by National Science Foundation (NSF) through grant CMMI-1563115, from Science Foundation Ireland through grant SFI/15/US/B3234 and from Enterprise Ireland through grant CF20160454.
Data Availability Statement
The original contributions presented in this study are included in the article. Further inquiries can be directed to the corresponding author.
Conflicts of Interest
The authors declare no conflict of interest.
Appendix A
Design of Built-up Beams in Bending
The following symbols are used throughout the design calculations presented in Appendix A and Appendix B.
Table A1.
All symbols used in the Appendix A and Appendix B.
The design calculations in this Appendix were made before the material tensile testing. Therefore, the yield strength of steel was assumed to be 275 N/mm2. Design checked in accordance with BS EN 1993-1-1:2005+A1:2014 [34].
The design of the built-up beam is the following:
Figure A1.
Built-up beam design, shear force diagram, bending moment.
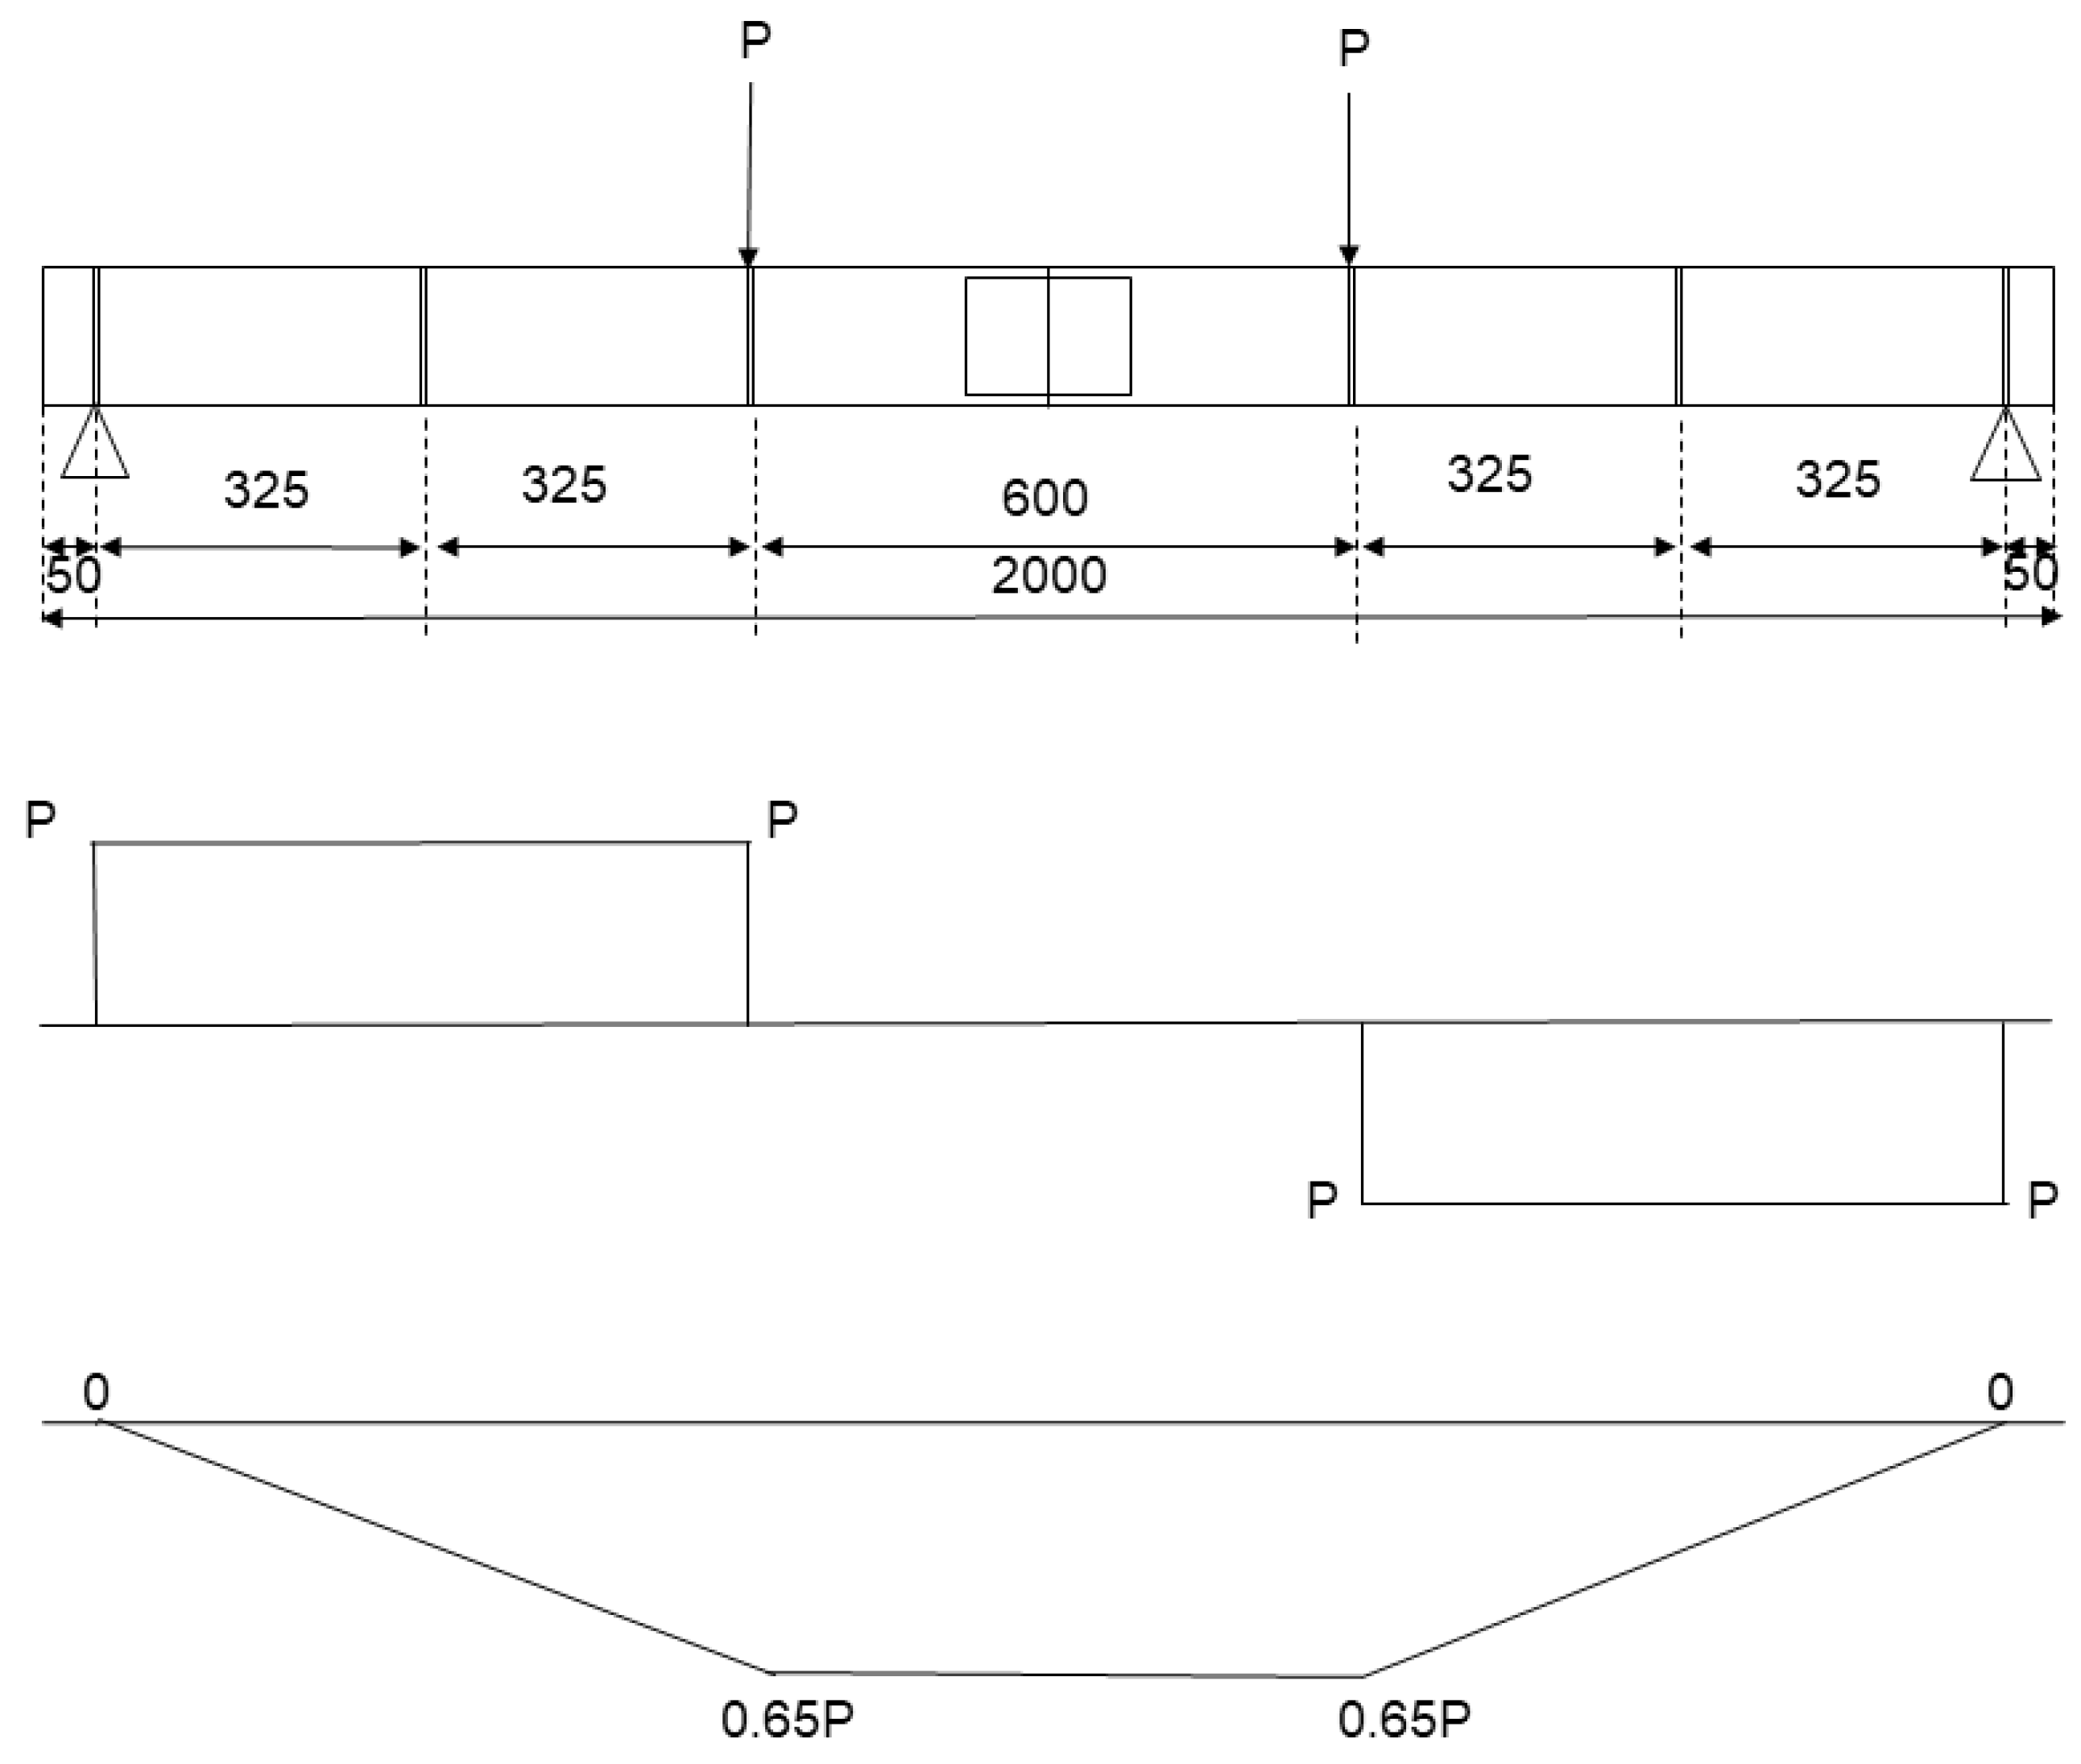
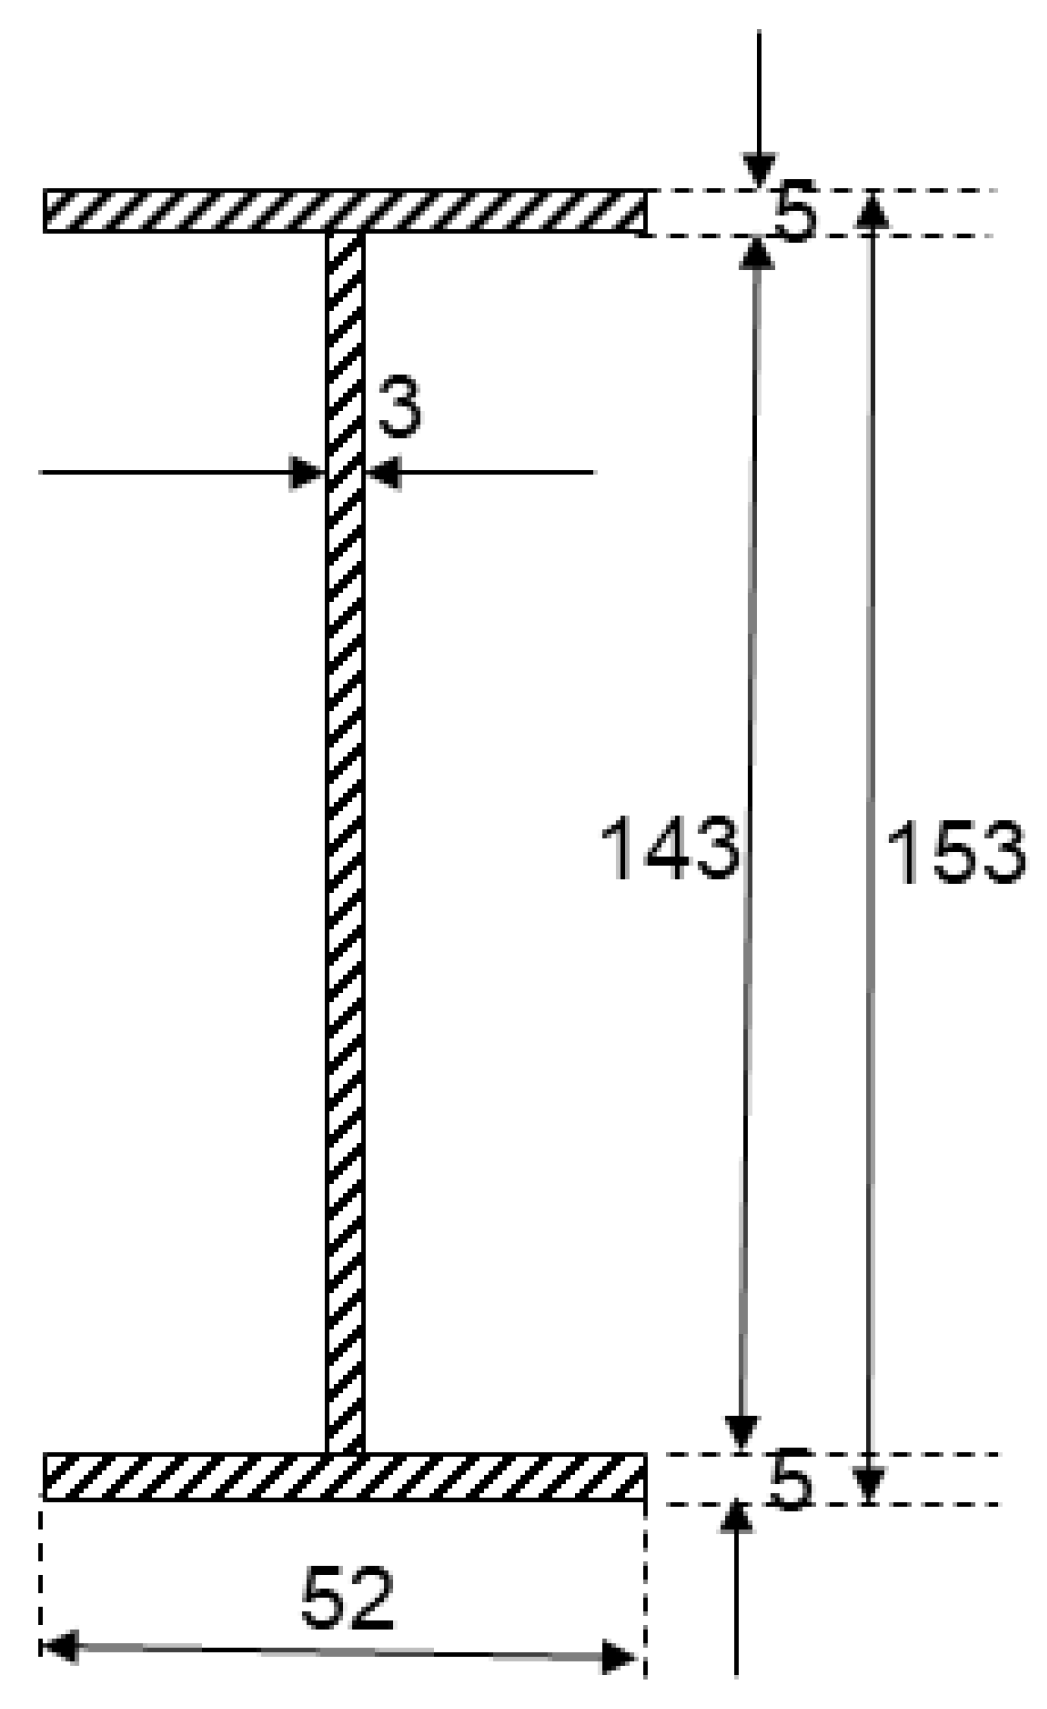
Figure A2.
Built-up beam design, shear force diagram, bending moment diagram and cross-section (units in mm).
Loading and Structural Arrangement
According to Figure A1:
Fv = P and Mu =0.65 P
Considering sectional properties:
At the interface between web and flange it was necessary to evaluate the shear stress and select an appropriate weld.
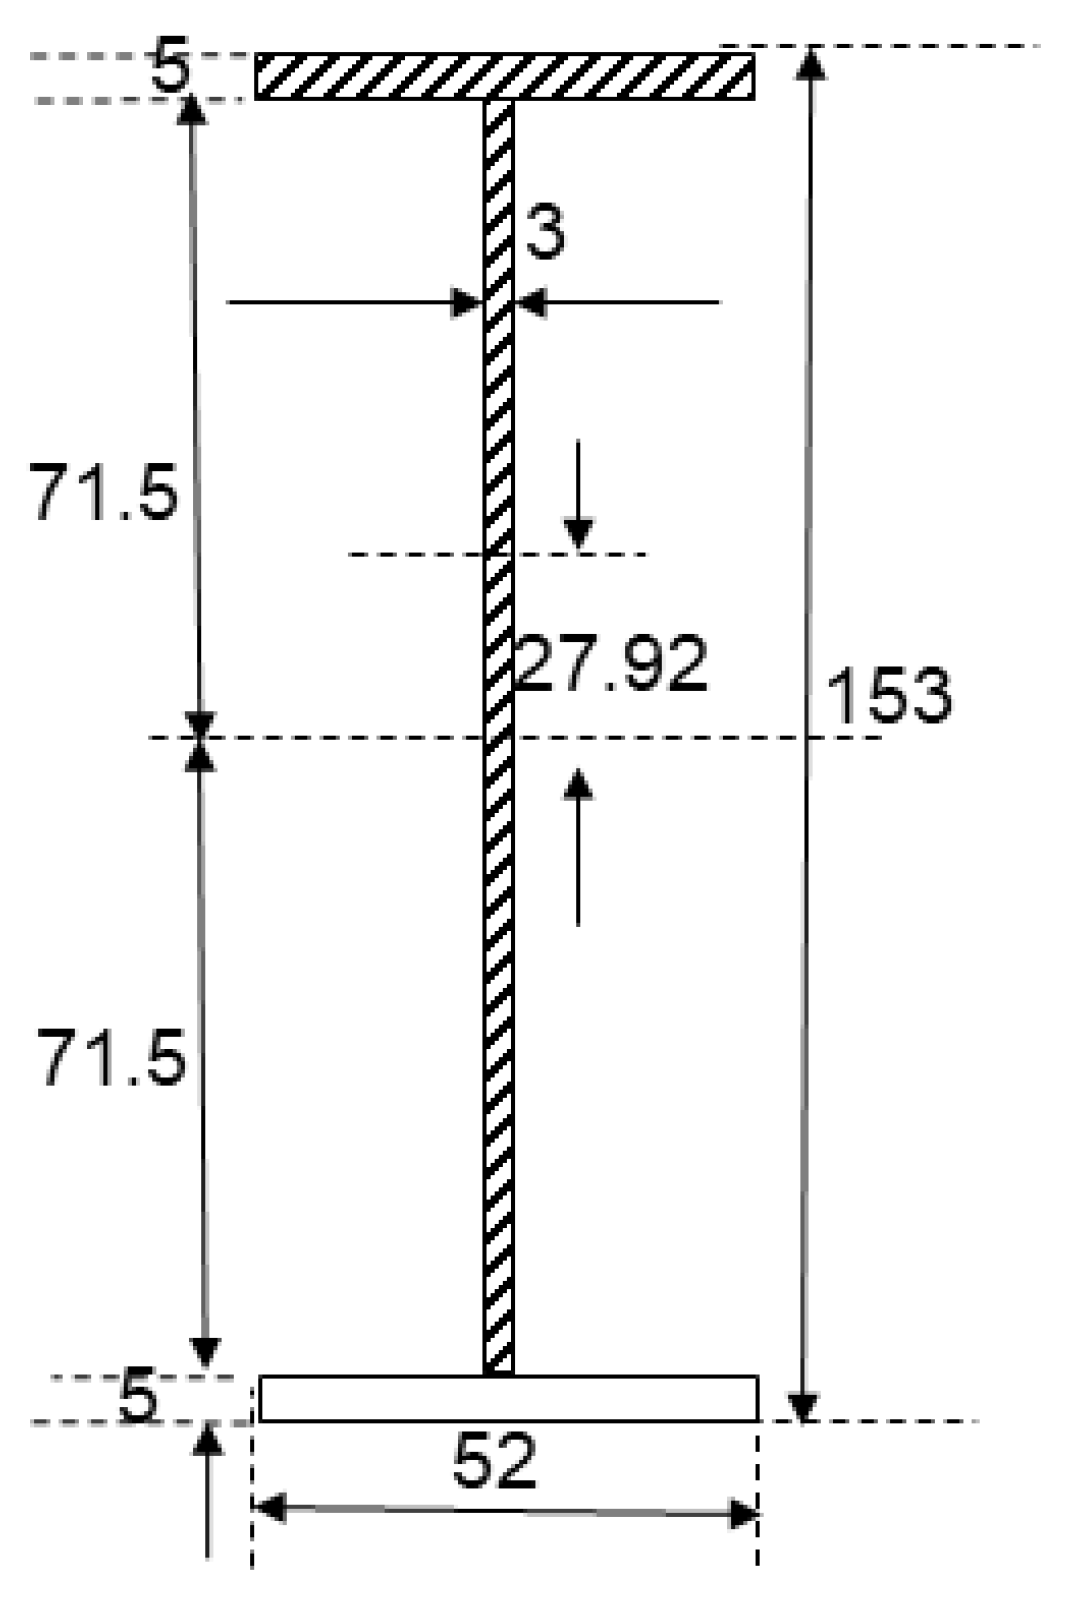
Figure A3.
Built-up beam shear stress (units in mm).
Cross-sectional Properties
According to Figure A3:
Taking moments about centre of section:
A’= A1 + A2 = (52 × 5) + (3 × 143) = 533 mm2
At this stage, it is best to base the weld design on the full shear capacity of the built-up section.
Pv = 0.6 py Av = 0.6 × 275 × (3 × 143) = 70,785 N = 70.785 kN
Weld Design
Considering a 2 mm continuous fillet weld.
Weld strength, pw = 220 N/mm2, s = 2 mm, α = 0.7s = 1.4 mm
Longitudinal strength, PL = pw α = 220 × 1.4 = 308 N/mm2
Longitudinal capacity of twin 2 mm welds = 308 × 2 = 616 N/mm2 > τ: 2 mm continuous
Fillet welds ensure integrity up to web shear failure.
Section Classification and Buckling
Due to the built-up nature, it is first necessary to classify the section:
ε = = 1.0 = 4.9ε, = 47.7ε Section is Plastic.
Considering buckling
A = (5 × 52) × 2 + (3 × 143) = 949 mm2
Plastic section: ϐw = 1.0
u = 1.0
Welded section
pb = 191.66 N/mm2
Mb = pb Wpl = 191.66 × 38,480 = 7380 N.m
From the conditions so far considered
Mb = 7380 N.m = 7.380 kN m
Mcx = 10,580 N.m = 10.580 kN m
Pv = 70,790 N = 70.79 kN
Bolt Design
For the shear splice consider shear capacity force acting through mid-span bolts.
-Assume M8 grade 8.8 bolts.
Shear capacity of M8 Grade 8.8 bolts:
Ps = psAs
ps = 375 N/mm2
Ps = 375 × 50.26 = 18,840 N = 18.84 kN (single shear)
However these bolts act in double shear: Shear capacity per bolt = 2 × 18.84 = 37,700 N = 37.7 kN.
No of bolts required > > 1.88: Try 5 No of M8 grade 8.8 bolts per side.
Pbb = d tp pbb = 8 × 3 × 1000 = 24,000 N = 24 kN
Pbs = kbsd tp pbs < 0.5kbs e tp pbs
Assume e = 20 mm: Pbs = 1.0 × 8 × 3 × 460 < 0.5 × 1 × 20 × 3 × 460 = 11,040 N < 13,800 N.
Pbs = 11,040 N = 11.04 kN
Bolt bearing capacity = 11,040 N
Capacity of 5 No of bolts = 11.04 × 5 = 55,200 N = 55.2 kN
No of bolts required > > 6.4
Use 8 No of M8 (8.8) bolts per side.
Minimum spacing = 2.5 d = 2.5 × 9 = 22.5 mm
Maximum spacing = 14 t = 14 × 3 = 42 mm
Minimum edge/end distance = 1.25 D = 1.25 × 8 = 10 mm
Maximum edge/end distance = 11t e = 11 × 3 × 1.0 = 33 mm.
AMASS Connection Design
For the beams with the AMASS connection to fail before they fail in buckling the capacity must be such that bending moment does not exceed 7380 N.m.
0.65P = 7380
Force in lower flange = = 49,860 N = 49.86 kN.
Figure A4.
Teeth design of the connection for the built-up beam (units in mm).
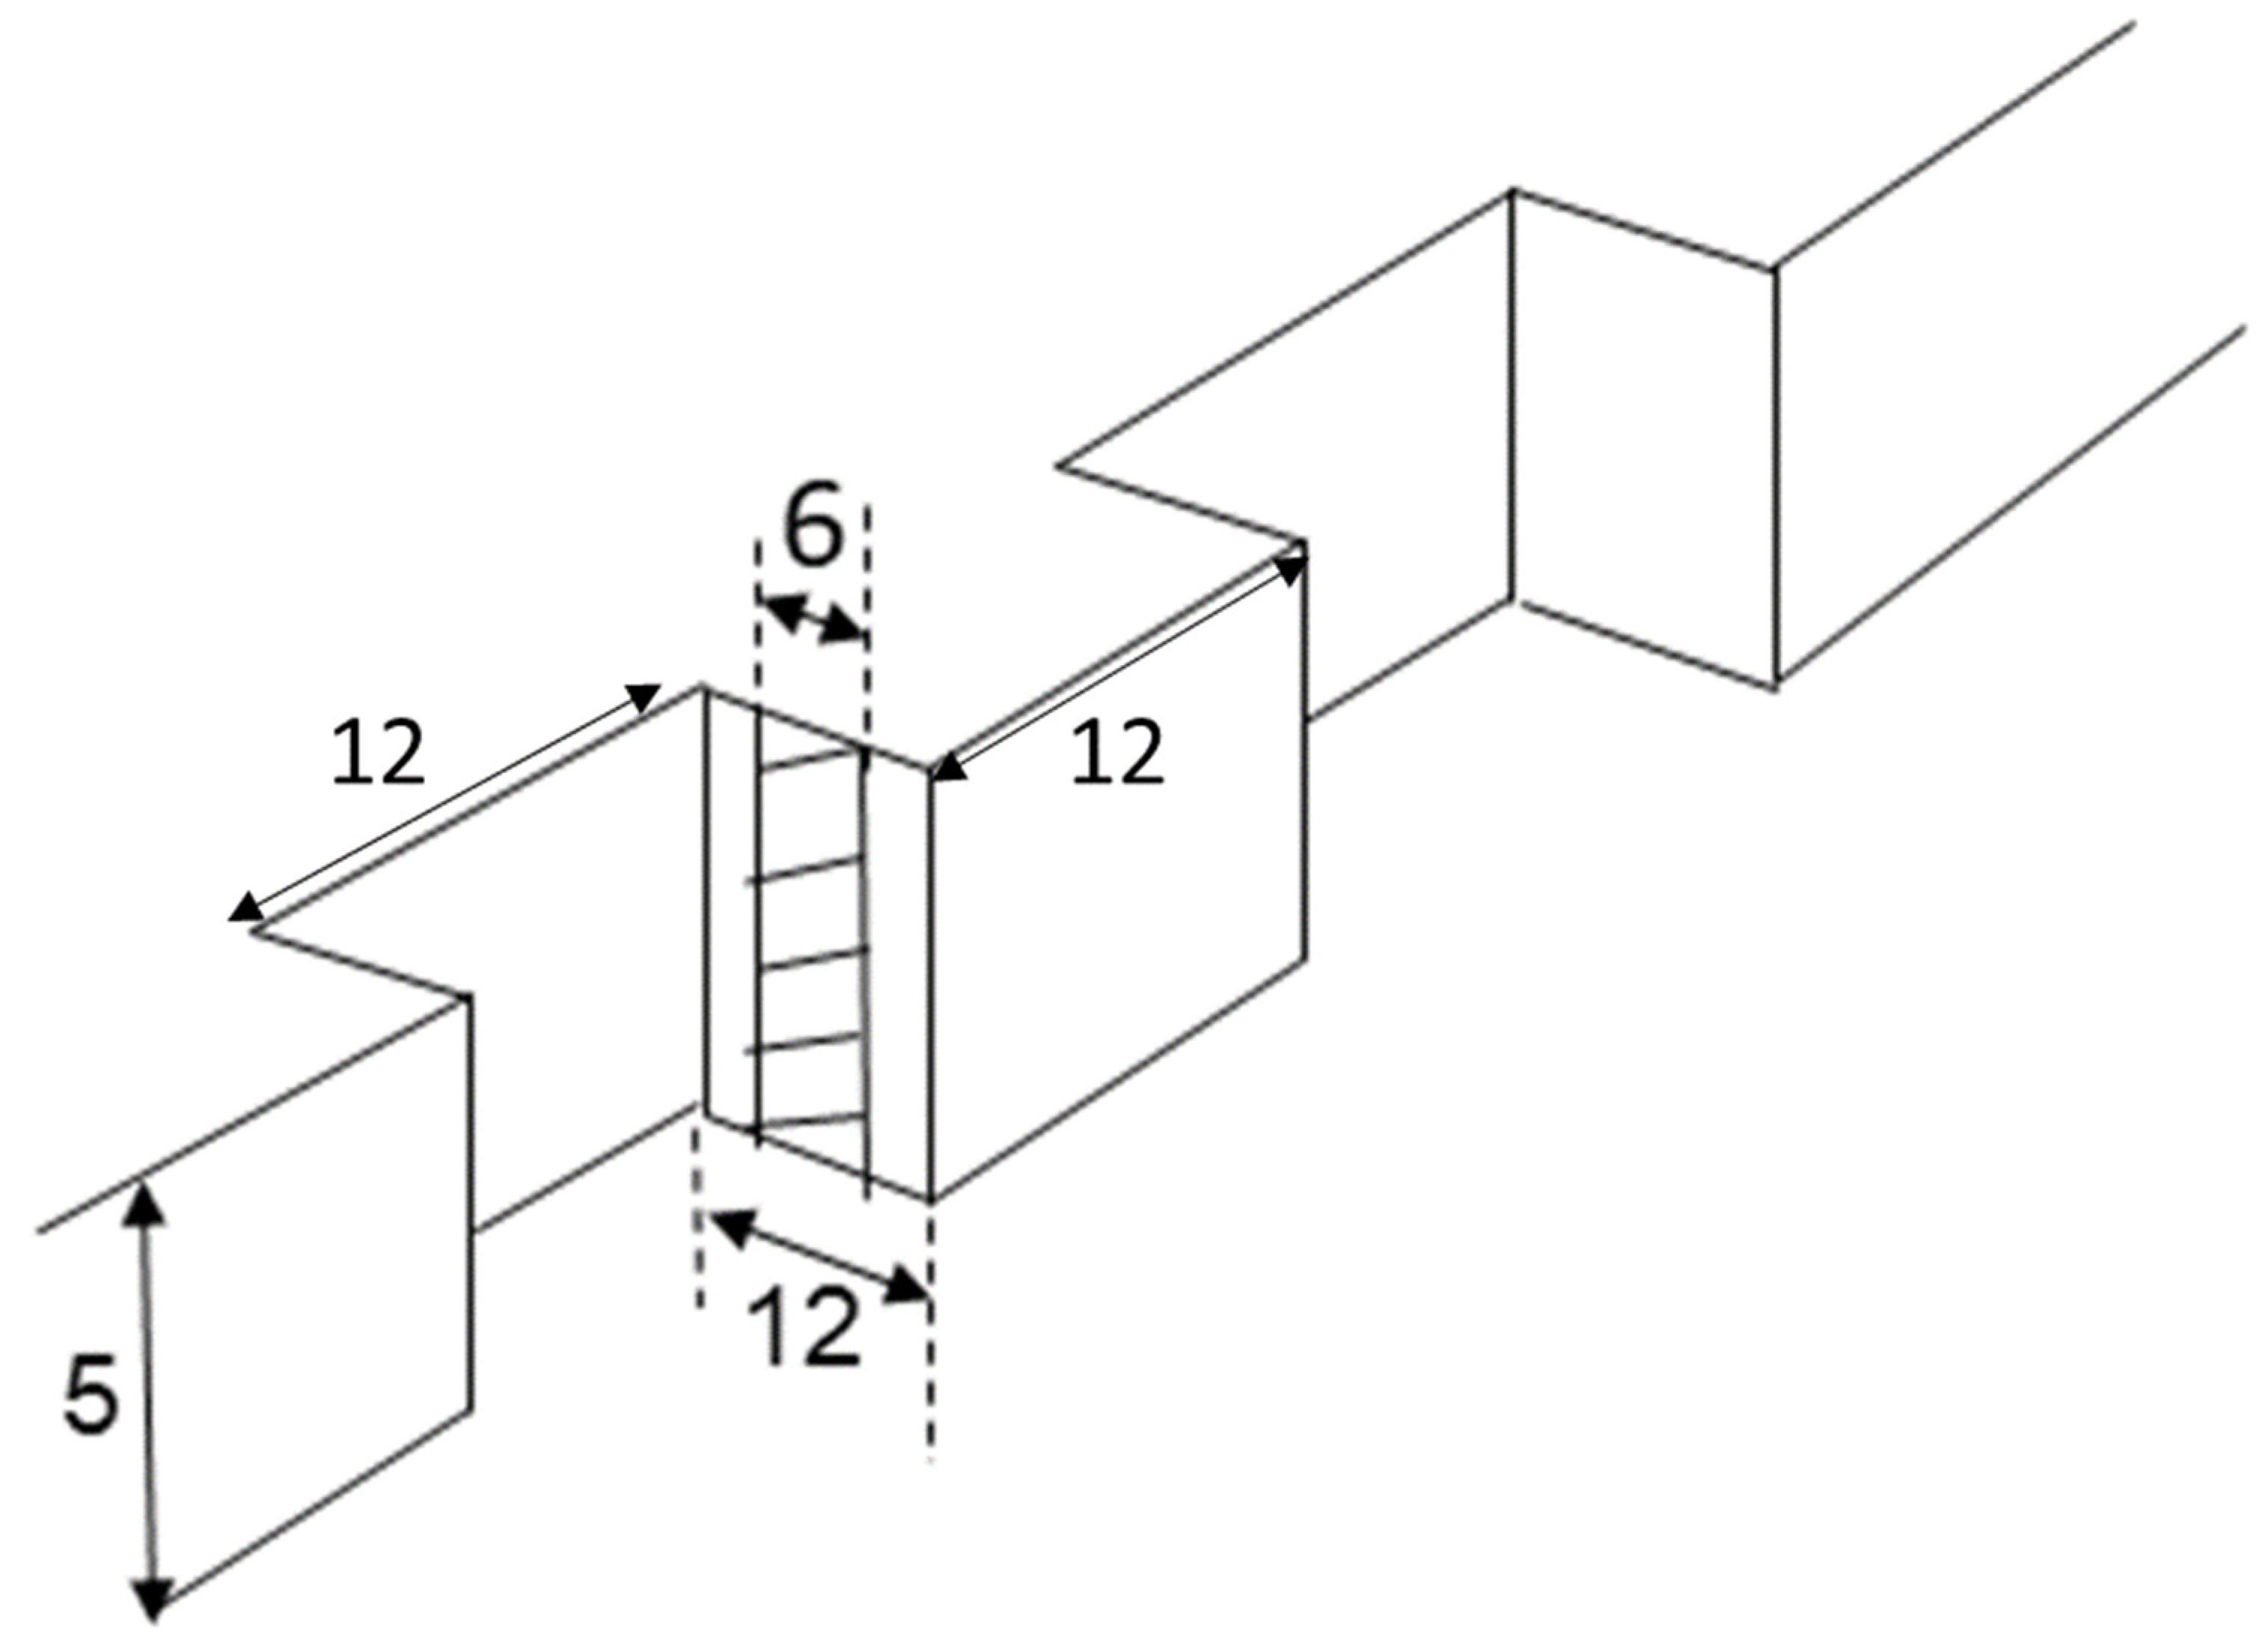
According to Figure A4:
N × 6 × 5 × 275 = 49,860: N = = 6.04:. Design really needs 4 No of teeth on each side of the splice (top and bottom).
Tensile capacity of flange plate (pair) = (20 − 5.2) × 6 × 275 × 2 = 48,840 N = 48.84 kN.
Figure A5.
Flange side plate design for the built-up beam (units in mm).
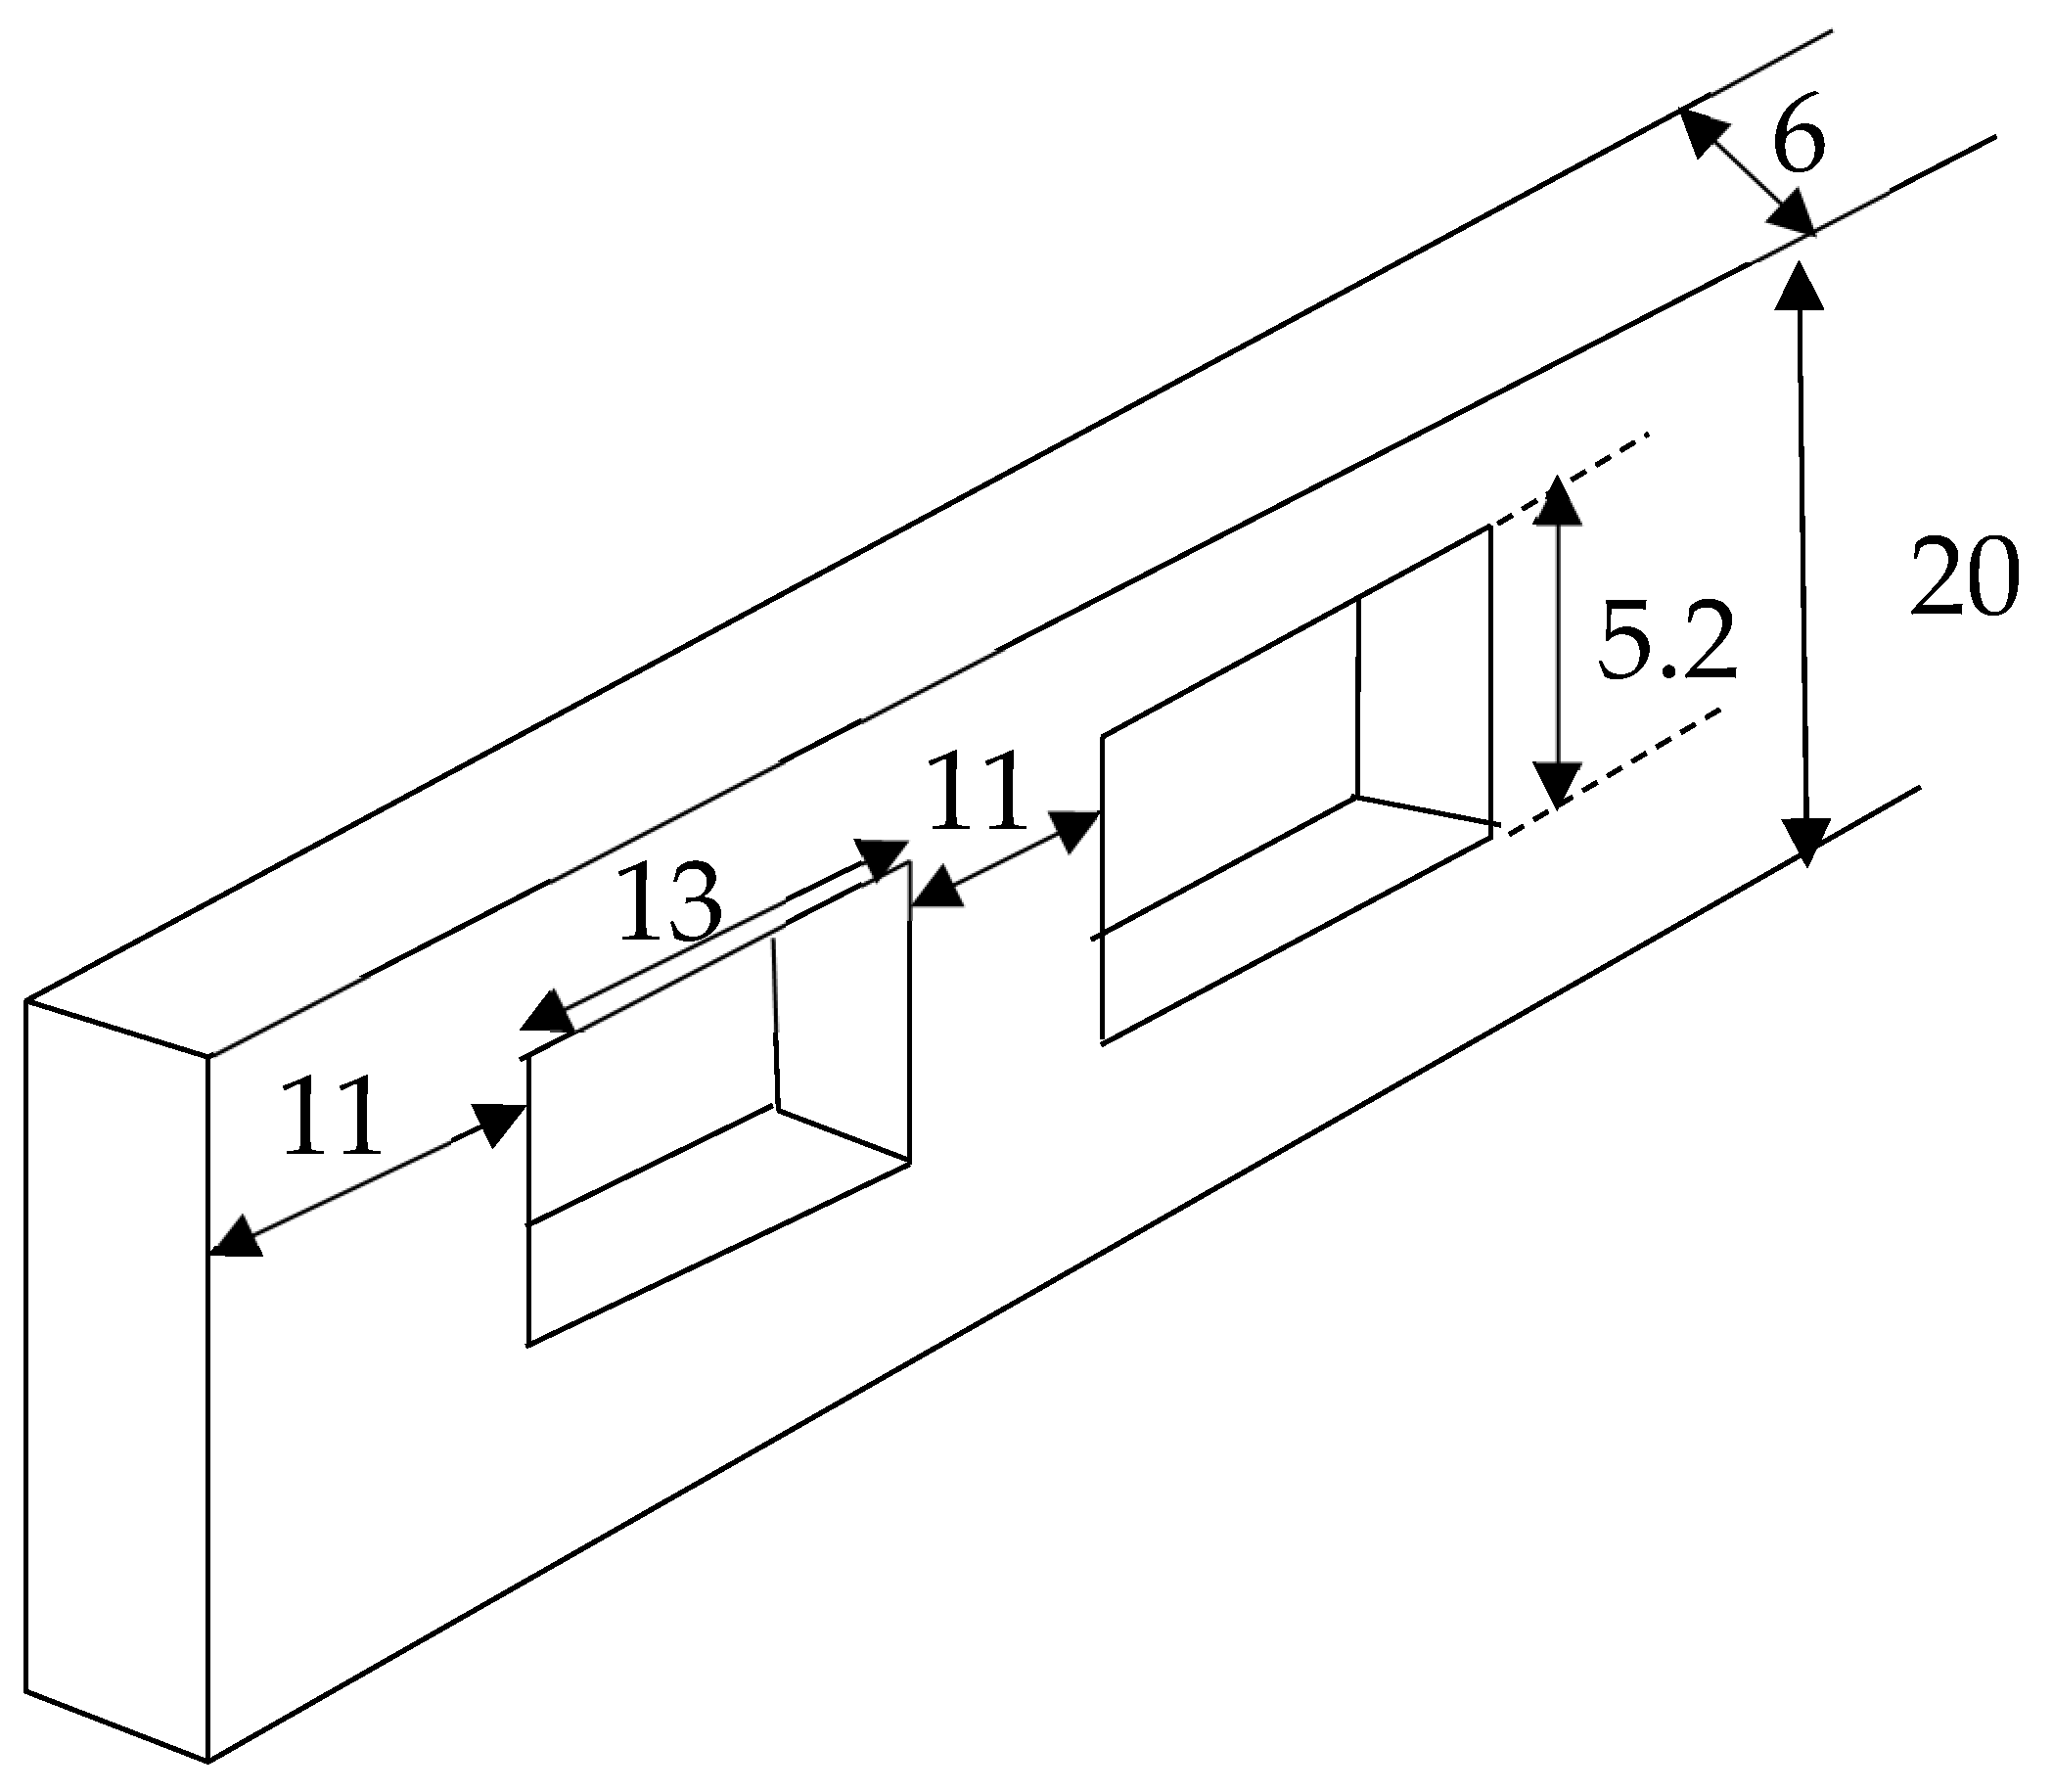
Flange side plate Design
According to Figure A5:
With 3 No teeth on either side the capacity at tooth = [6 × 5 × 275] × 3 × 2 = 49,500 N
In order to make the flange plate the weak link, form this, from 18 mm wide plate.
Tensile capacity (pair) = (18 − 5.2) × 6 × 275 × 2 = 42,240 N
Moment which can be resisted = 42,240 × (153 − 5) = 6251 Nm
Total load permitted = 2 × 9616 = 19,233 N: Ultimate capacity = 19,233 N = 19.2 kN
This is controlled by failure in 6 mm thick flange plates.
Appendix B
Design of Standard Beams in Bending
The design calculations in this Appendix were made before the material tensile testing and therefore the yield strength of steel was assumed to be 275 N/mm2. Design checked in accordance with BS EN1993-1-1+A1:2014 [34].
The design for the standard (rolled) beam is as follows:
Chosen section: 203 × 133 UB 30 (S275) Design checked in accordance with BS EN 1993 Part 1 (2015) [34]
Figure A6.
Standard (rolled) beam design, shear force diagram, bending moment.
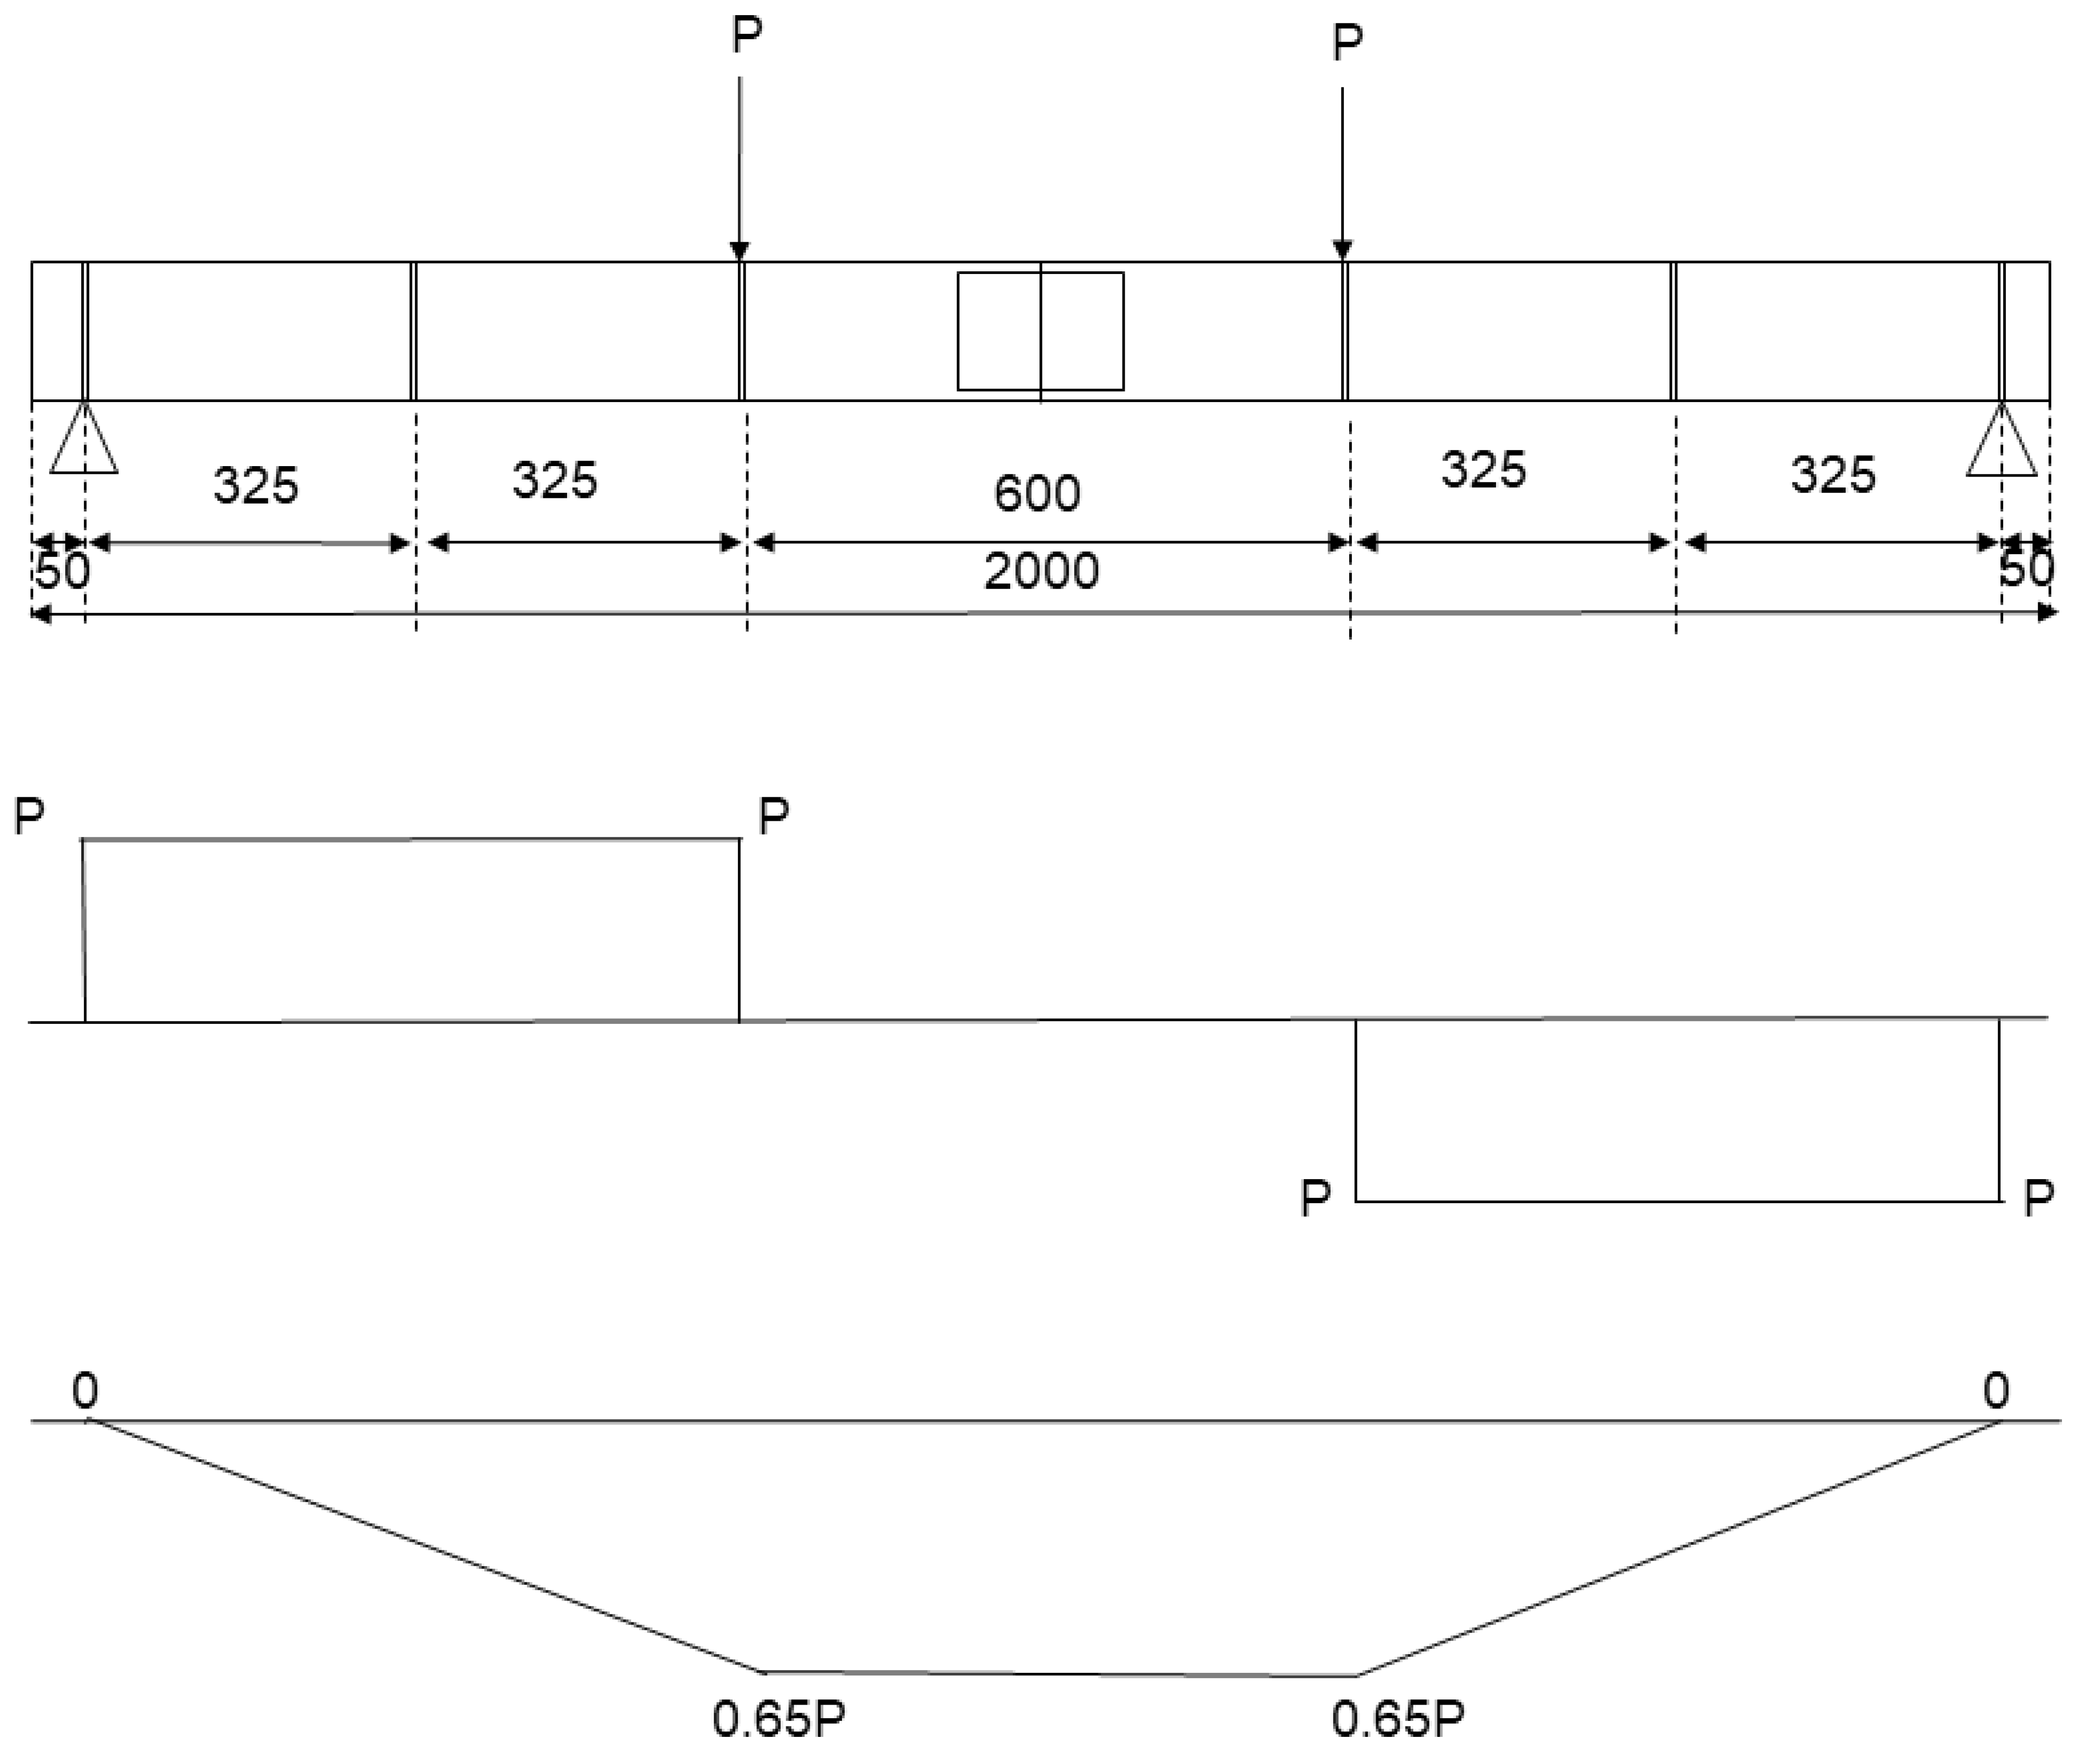
Loading and Structural Arrangement
According to Figure A6:
Fv = P. and Mu = 0.65P
Pv = 0.6 pyAv = 0.6 × 275 × (6.4 × 206.8) = 218,300 N
For shear resistance 218,300 = P: Pmax = 218, 300 N (shear) = 218.3 kN.
Bending resistance, Mcx = Wpl py/γM0 = 314 × 103 ×275/1= 86.4 × 10⁶ Nmm = 86,400 Nm: For bending 0.65P = 86,400
Pmax= 132,900 N (bending)
Buckling resistance: Mb = 86,400 Nm: Pmax = 132,900 N = 132.9 kN (Buckling): Section is limited by bending/buckling capacity.
It is necessary to check shear capacity at mid-span. However this should (in theory) be zero but it should be designed in accordance with Pmax = 132,900 N = 132.9 kN.
Bolt and Web Plate Design
Use:—M12 grade 8.8 bolts.
- 2 No 6 mm S275 side plates.
No of bolts required > > 2.1: Use 4 No per side.
Check bearing: Pb = 16,600 N
Bolt group capacity = 16,600 × 4 = 66,400 N = 66.4 kN: (Insufficient)
If the maximum shearing force encountered in the beam is applied at mid-span then the bolt group capacity based upon bolt/ply bearing on the web of the steel section will dictate capacity.
To overcome this problem, 2 No columns of bolts shall be employed on either side of the central connection.
Shear capacity = 4 × 2 × 16,600 = 132,800 N = 132.8 kN
This will work with 2 No 6 mm side plates.
Minimum spacing = 2.5 d = 2.5 × 12 = 30 mm
Maximum spacing = 14 t = 14 × 6 = 84 mm
Minimum edge/end distance = 1.25 D = 1.25 × 13 = 16.25 mm
Maximum edge/end distance = 11 t ε = 11 × 6 × 1.0 = 66 mm
Figure A7.
Web plate design (units in mm).
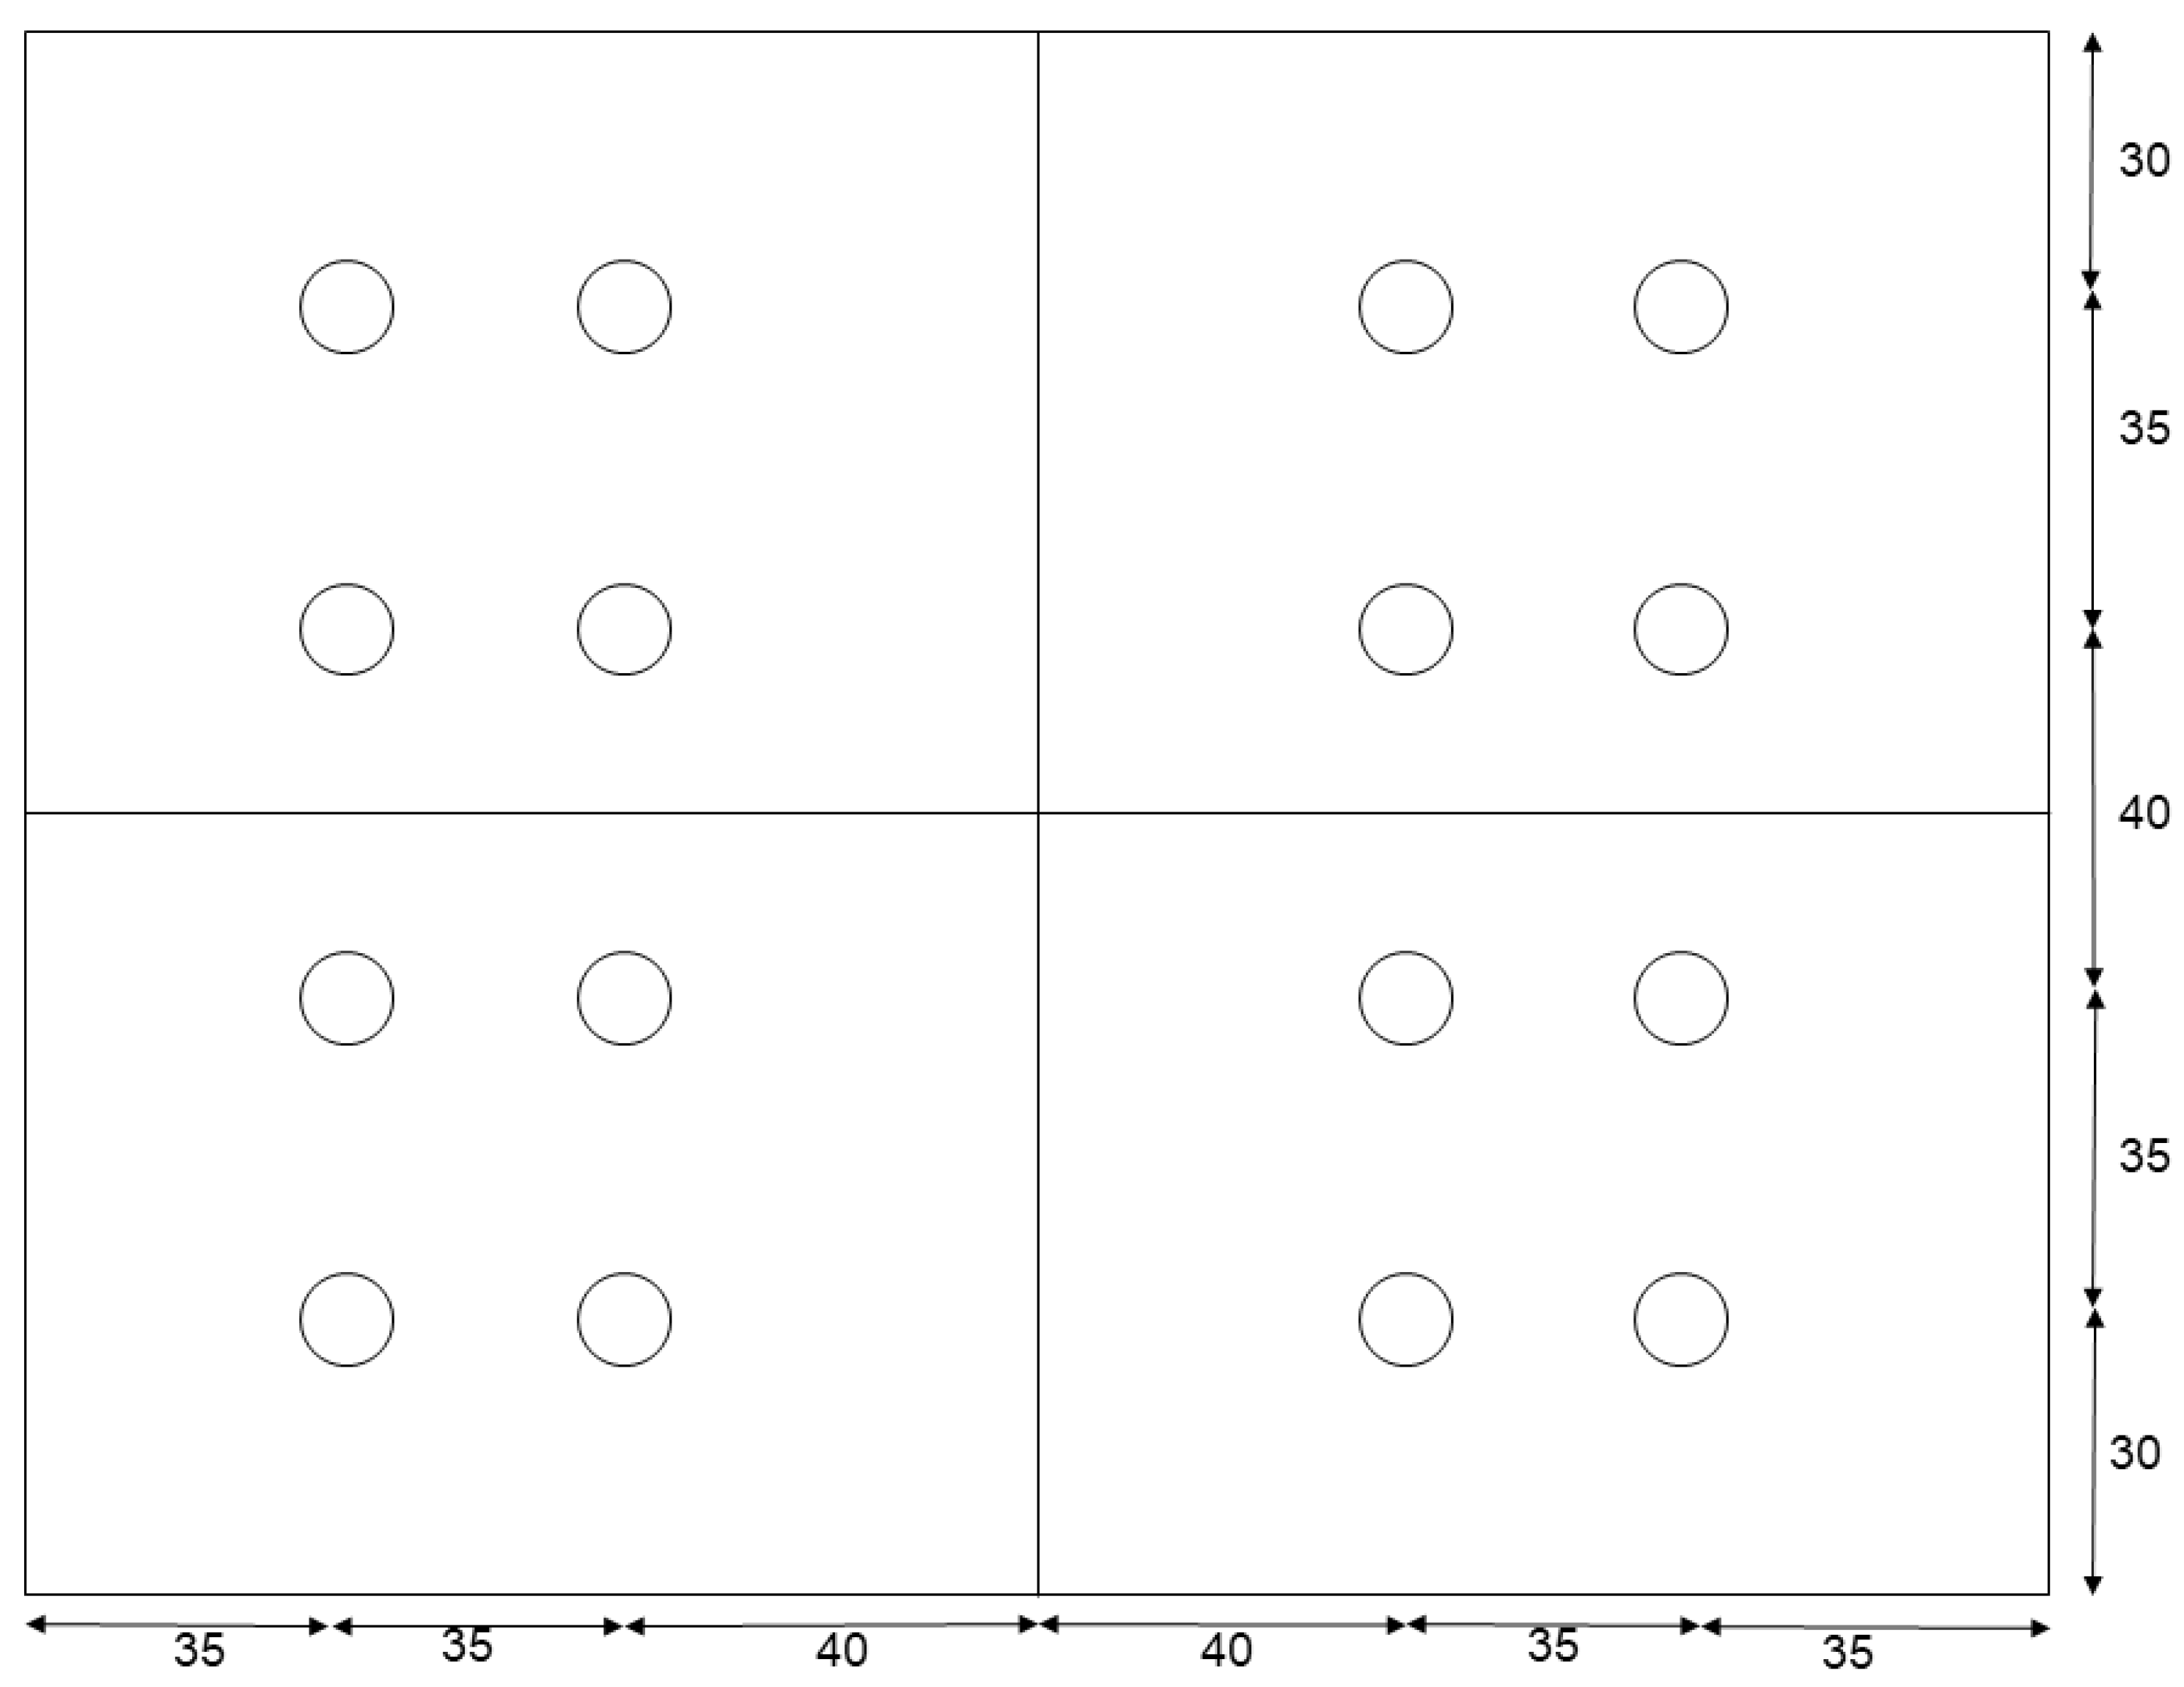
According to Figure A7:
203 × 133 UB 30 (S275) will be OK with splice plate at mid-span. Capacity = 132,800 N = 132.8 kN Must know check teeth capacity.
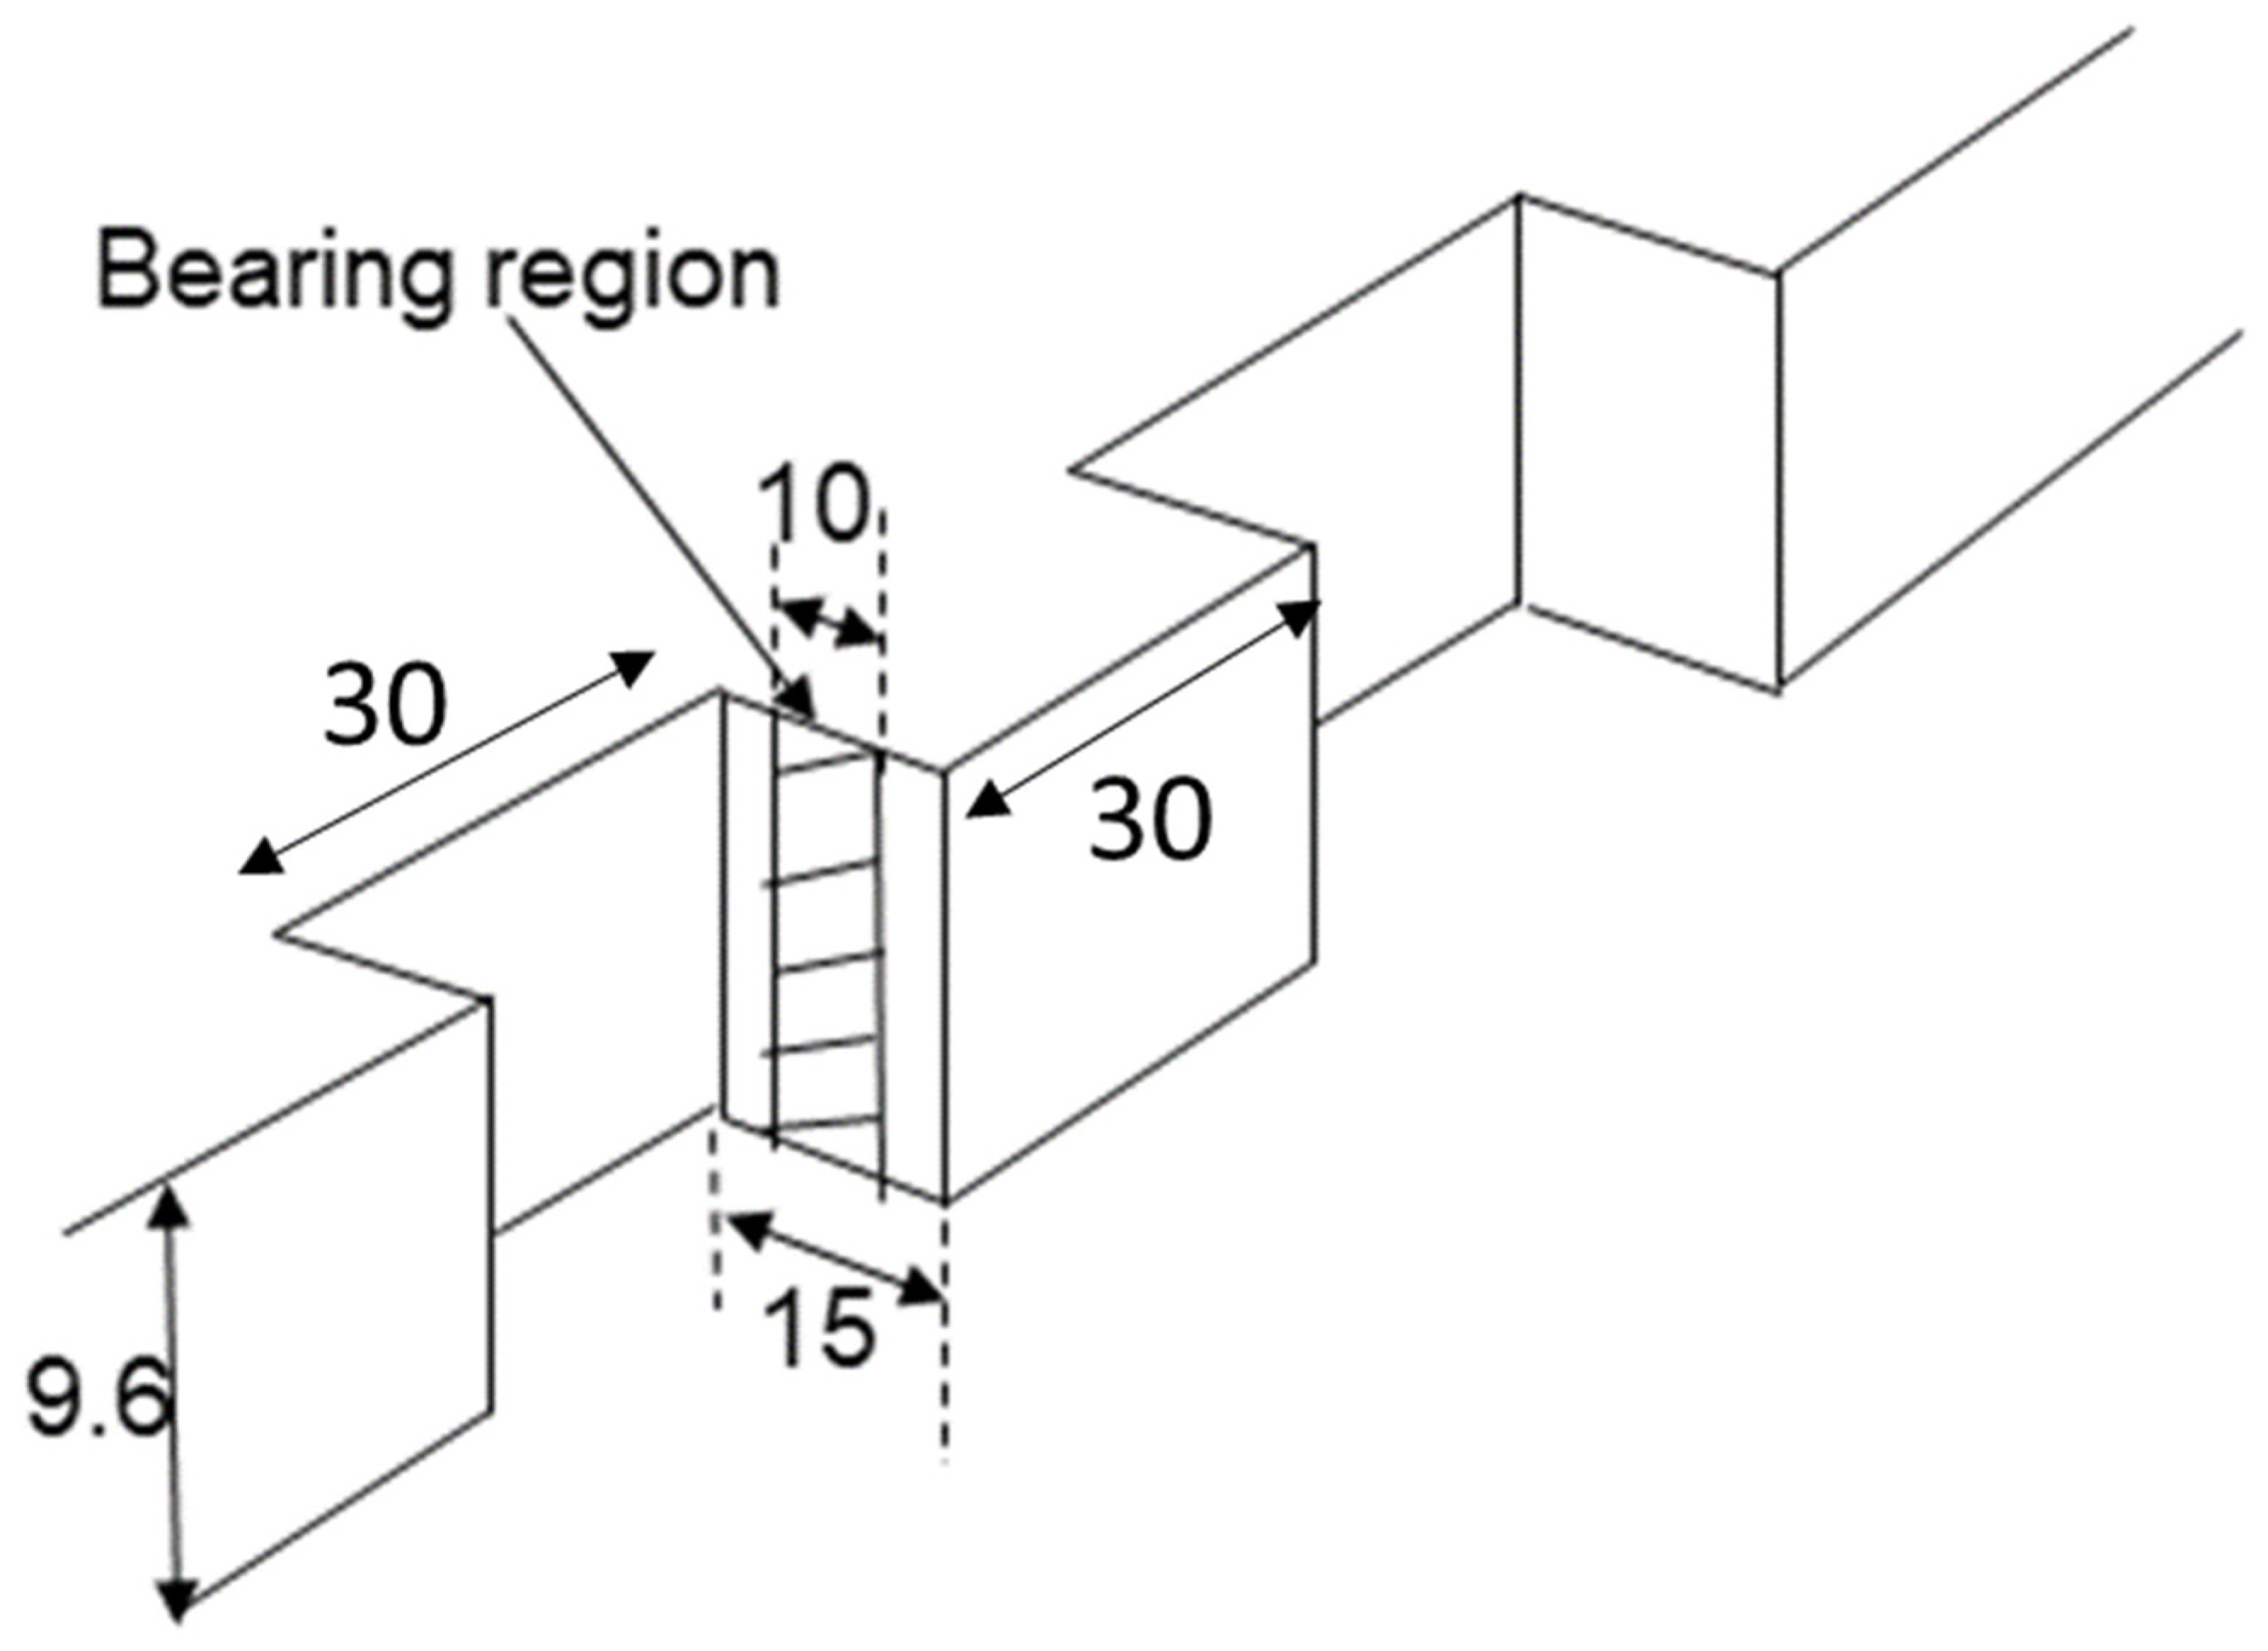
Flange depth = 9.6 mm
10 mm flange plates to be used within 15 mm deep teeth.
Figure A8.
Teeth design of the connection for Standard beam (units in mm).
AMASS connection Design
According to Figure A8:
Assuming worst case bending moment = 0.65P = 0.65 × 132,900 = 86,400 Nm
Force in flange plates = = 460,600 N = 460.6 kN
Assuming py = 275 N/mm2 and that this aspect of the design consider behaviour up yielding.
N × [10 × 9.6 × 275] = 460.6 × × 103: N = 17.45
However, as 3 No teeth are specified from the preliminary design on either side (top and bottom) the maximum force which can be resisted by the teeth is:
Maximum force with 3 No of teeth on either side= [10 × 9.6 × 275] × (3 × 2) = 158,400 N = 158.4 kN
Bending capacity = (158.4 × 103) × (206.8-2 × 9.6) = 29,720 Nm
As maximum bending moment = 0.65P: 0.65P = 29,720: P = 45,700 N
Total load allowed on beam = 2 × 45,700 = 91,400 N = 91.4 kN
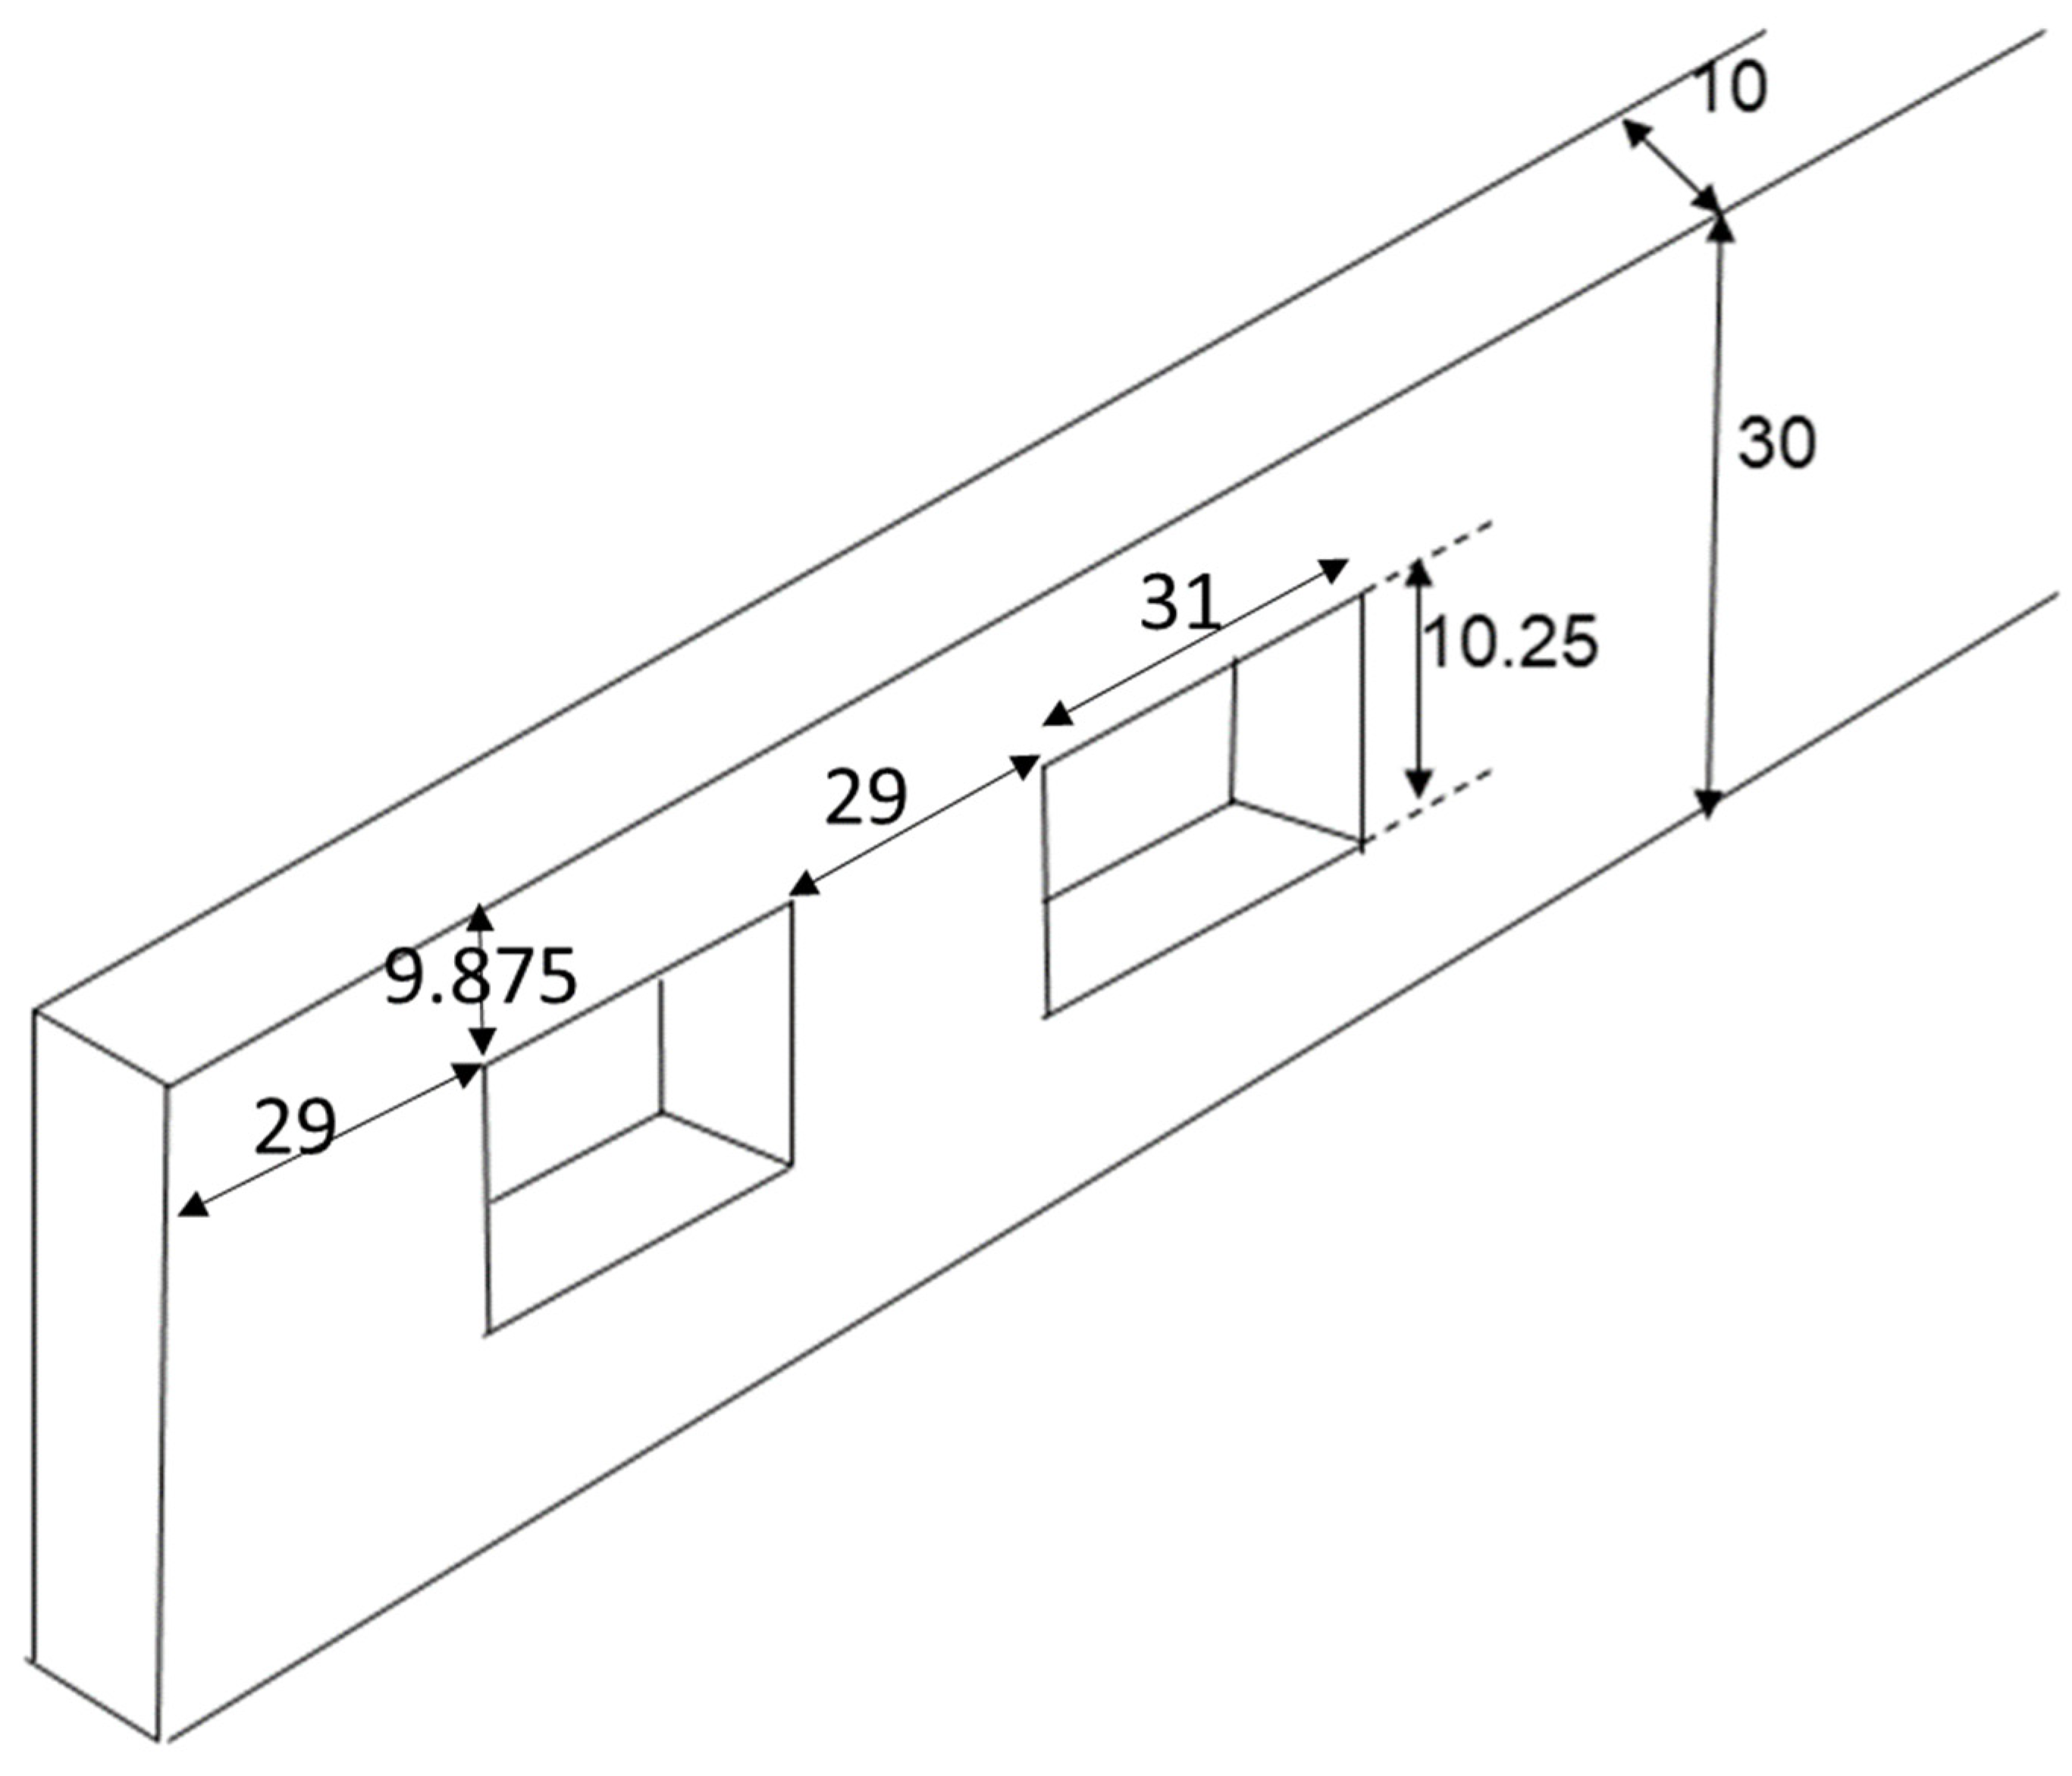
Tensile capacity of 10 mm thick flange plate 30 mm wide
Figure A9.
Flange side plate for the standard beam (units in mm).
Flange side plate Design
According to Figure A9:
Area under tension = (30 − 10.25) × 10 = 197.5 mm2
Tensile capacity of 2 No lower plates = [197.5 × 275] × 2 = 108,630 N = 108.63 kN
This is lower than the bending capacity of the teeth and will dictate sample capacity.
Bending capacity = [108.63 × 103] × [206.8 − 9.6] = 21,420 Nm: 0.65P = 21,420: P = 32,950 N.
Maximum total load allowed on beam = 2 × 32,950 =65,900 N = 65.9 kN
Ultimate capacity = 65,900 N = 65.9 kN
This is controlled by failure in 10 mm thick flange plates.
References
- ANSI/AISC 358-22; Prequalified Connections for Special and Intermediate Steel Moment Frames for Seismic Applications. American Institute of Steel Construction, Inc.: Chicago, IL, USA, 2022.
- Hamburger, R.O. Prequalified connections for special and intermediate steel moment frames for seismic applications, ANSI/AISC 358-05. In Proceedings of the Structures Congress 2006: Structural Engineering and Public Safety; ASCE: Reston, VA, USA, 2006. [Google Scholar]
- Cordova, P.P.; Hamburger, R.O. Steel Connections: Proprietary or Public Domain? Mod. Steel Constr. 2011, 24–31. [Google Scholar]
- Morshedi, M.A.; Dolatshahi, K.M.; Maleki, S. Double reduced beam section connection. J. Constr. Steel Res. 2017, 138, 283–297. [Google Scholar] [CrossRef] [Scilit]
- Qiao, H.; Chen, Y.; Wang, J.; Chen, C. Experimental study on beam-to-column connections with reduced beam section against progressive collapse. J. Constr. Steel Res. 2020, 175, 106358. [Google Scholar] [CrossRef] [Scilit]
- Liu, J.; Xue, Y.; Wang, C.; Nie, J.; Wu, Z. Experimental investigation on seismic performance of mechanical joints with bolted flange plate for precast concrete column. Eng. Struct. 2020, 216, 110729. [Google Scholar] [CrossRef] [Scilit]
- Fidalgo, A.; Packer, J.A. Evaluation of bolted CHS flange-plate connections under axial tension. J. Constr. Steel Res. 2022, 196, 107399. [Google Scholar] [CrossRef] [Scilit]
- Han, S.W.; Moon, K.H.; Jung, J. Cyclic performance of welded unreinforced flange-welded web moment connections. Earthq. Spectra 2014, 30, 1663–1681. [Google Scholar] [CrossRef] [Scilit]
- Nia, Z.S.; Ghassemieh, M.; Mazroi, A. WUF-W connection performance to box column subjected to uniaxial and biaxial loading. J. Constr. Steel Res. 2013, 88, 90–108. [Google Scholar] [CrossRef] [Scilit]
- Sim, H.B.; Ballantyne, G.; Chen, A.; Uang, C.M. Effect of beam tension on cyclic performance of WUF-W steel moment connection. J. Struct. Eng. 2017, 143, 04017102. [Google Scholar] [CrossRef] [Scilit]
- Anastasiadis, A. Behavior of steel building structures subjected to strong and benchmark seismic actions: An overview of damage from the observations of the last 40 years. Tech. Ann. 2024, 1. [Google Scholar] [CrossRef] [Scilit]
- Adan, S.M.; Gibb, W. Experimental Evaluation of Kaiser Bolted Bracket Steel Moment resisting Connections. Eng. J. AISC 2009, 46, 181–195. [Google Scholar] [CrossRef] [Scilit]
- Seek, M.W.; Murray, T.M. Cyclic Test of 8-Bolt Extended Stiffened Steel Moment End Plate Connection with Concrete Structural Slab; American Institute of Steel Construction, Virginia Polytechnic Institute and State University: Blacksburg, VA, USA, 2005. [Google Scholar]
- Yang, C.; Yang, J.F.; Su, M.Z.; Liu, C.Z. Numerical study on seismic behaviours of ConXL biaxial moment connection. J. Constr. Steel Res. 2016, 121, 185–201. [Google Scholar] [CrossRef] [Scilit]
- Chou, C.C.; Tsai, K.C.; Wang, Y.Y.; Jao, C.K. Seismic rehabilitation performance of steel side plate moment connections. Earthq. Eng. Struct. Dyn. 2010, 39, 23–44. [Google Scholar] [CrossRef] [Scilit]
- Faridmehr, I.; Osman, M.H.; Tahir, M.B.; Nejad, M.A.F.; Hodjati, R. Seismic and progressive collapse assessment of SidePlate moment connection system. Struct. Eng. Mech. 2015, 54, 35–54. [Google Scholar] [CrossRef] [Scilit]
- Irvani, M.; Ezati, H.; Khafajeh, R.; Jaari, V.R.K. Numerically study on the seismic response of partially restrained moment connection with structural fuse T-stub for European sections. Structures 2022, 35, 82–105. [Google Scholar] [CrossRef] [Scilit]
- Judd, J.; Pryor, S.; Chi, B. Seismic Performance of Buildings with Special Steel Moment Frames Using Modified End Plate and Shear Plate Connections. J. Struct. Eng. 2022, 148, 04021300. [Google Scholar] [CrossRef] [Scilit]
- Wang, Y.; Chen, B.; Hu, S.; Ye, Q.; Sun, Y.; Li, B.; Zhao, H. Testing, simulation and design of hybrid stainless steel girders under shear. J. Constr. Steel Res. 2026, 236, 110000. [Google Scholar] [CrossRef] [Scilit]
- Jiang, Y.; Li, L.; Zhu, L.; Xu, W.; Wang, Y.; Chen, B.; Chi, Y.; Wu, G. Design provision assessment for localized-loading resistance of welded stainless steel I-beams with web openings. Case Stud. Constr. Mater. 2025, 22, e04854. [Google Scholar] [CrossRef] [Scilit]
- Chen, P.; Pan, J.; Hu, F.; Wang, Z. Experimental investigation on earthquake-resilient steel beam-to-column joints with replaceable buckling-restrained fuses. J. Constr. Steel Res. 2022, 196, 107413. [Google Scholar] [CrossRef] [Scilit]
- Pratap, M.; Vesmawala, G.R. An experimental and numerical analysis of slit plate as replaceable fuse in moment resisting frame. Structures 2024, 67, 107011. [Google Scholar] [CrossRef] [Scilit]
- Atar, M. Sleeve Fuse System For Improved Steel Connection Performance. Bitlis Eren Üniversitesi Fen Bilim. Derg. 2025, 14, 1504–1518. [Google Scholar] [CrossRef] [Scilit]
- Atar, M. Experimental and Numerical Comparison of Replaceable Sleeve Fuses and Reduced Web Sections for Improved End-Plate Bolted Connection Performance. Buildings 2025, 15, 4316. [Google Scholar] [CrossRef] [Scilit]
- Atar, M.; Shaheen, M.A. Experimental and numerical investigation of a bolt-sleeve device for enhanced ductility of steel connections. Structures 2026, 88, 111754. [Google Scholar] [CrossRef] [Scilit]
- Shaheen, M.A.; Tsavdaridis, K.D.; Ferreira, F.P.V.; Cunningham, L.S. Rotational capacity of exposed base plate connections with various configurations of anchor rod sleeves. J. Constr. Steel Res. 2023, 201, 107754. [Google Scholar] [CrossRef] [Scilit]
- Shaheen, M.A.; Atar, M.; Cunningham, L.S. Enhancing progressive collapse resistance of steel structures using a new bolt sleeve device. J. Constr. Steel Res. 2023, 203, 107843. [Google Scholar] [CrossRef] [Scilit]
- Shaheen, M.A.; Foster, A.S.J.; Cunningham, L.S. A novel device to improve robustness of end plate beam–column connections: Analytical model development. Thin-Walled Struct. 2022, 172, 108878. [Google Scholar] [CrossRef] [Scilit]
- Al-Sabah, S.; Laefer, D.F.; Truong Hong, L.; Minh Phuoc, H.; Le, J.-L.; Martin, T.; Matis, P.; McGetrick, P.; Schultz, A.; Shemshadian, M.E.; et al. Introduction of the Intermeshed Steel Connection—A New Universal Steel Connection. Buildings 2020, 10, 37. [Google Scholar] [CrossRef] [Scilit]
- McGetrick, P.J.; Matis, P.; Martin, T.; Robinson, D.; Laefer, D.F.; Al-Sabah, S.; Truong-Hong, L.; Phuoc Huynh, M.; Schultz, A.E.; Le, J.-L.; et al. Experimental testing and analysis of the axial behaviour of intermeshed steel connections. Proc. Inst. Civ. Eng.-Struct. Build. 2022, 175, 153–173. [Google Scholar] [CrossRef] [Scilit]
- Labbane, R. Experimental Investigation of the Performance of Intermeshed Steel Beam Connections. Master’s Thesis, University of Minnesota, Minneapolis, MN, USA, 2019. [Google Scholar]
- BS EN ISO 6892-1:2016; Metallic Materials. Tensile Testing. Method of Test at Room Temperature. BSI: London, UK, 2016.
- Hu, Y.; Davison, B.; Burgess, I.; Plank, R. Multi-Scale Modelling of Flexible End Plate Connections under Fire Conditions. Open Constr. Build. Technol. J. 2010, 4, 88–104. [Google Scholar] [CrossRef] [Scilit]
- BS EN 1993-1-1:2005+A1:2014; Eurocode 3: Design of Steel Structures—Part 1-1: General Rules and Rules for Buildings. British Standards Institution: London, UK, 2015.

Disclaimer/Publisher’s Note: The statements, opinions and data contained in all publications are solely those of the individual author(s) and contributor(s) and not of MDPI and/or the editor(s). MDPI and/or the editor(s) disclaim responsibility for any injury to people or property resulting from any ideas, methods, instructions or products referred to in the content. |
© 2026 by the authors. Licensee MDPI, Basel, Switzerland. This article is an open access article distributed under the terms and conditions of the Creative Commons Attribution (CC BY) license.