


Abstract
The deterioration processes caused by atmospheric conditions in cultural heritage structures carved into low-strength pyroclastic rocks can result in material loss and weakening of surface integrity over time. In this study, we investigated the current deterioration condition of Church No. 2 in the Kayadibi District of Konya, the largest province of Central Anatolia, Türkiye, where rock-carved cultural heritage structures are extensively located. For this purpose, in situ observations and non-destructive testing (NDT), as well as various physicomechanical tests in laboratory conditions, were conducted to assess the current condition of the monument. Within the scope of the in situ NDT, light detection and ranging (LiDAR), deep moisture (DM), indirect P-wave velocity (VPID), and Schmidt hammer rebound (SHR) measurements were performed. In the laboratory studies, dry density (ρd), apparent porosity (n), water absorption by weight (Wa), cutting rate (CR), penetration rate (PR), SHR, direct P-wave velocity (VPD) and VPID tests were conducted. Using the NDT measurement data obtained from the monument surface, NDT variation maps showing the spatial distribution of these parameters were prepared. Surface deterioration patterns of the monument, documented and classified following the ICOMOS-ISCS terminology, included fractures, contour scaling, black crusts, moisture-related areas, biological colonization, efflorescence, and impact damage. The NDT variation maps revealed that DM values were markedly higher in areas associated with cracks. Strong linear relationships were found between DM and SHR (R2 = 0.87), DM and VPID (R2 = 0.86), and SHR and VPID (R2 = 0.97). These findings highlight the potential of combining moisture measurements, Schmidt hammer testing, and P-wave velocity measurements to characterize spatial variations in the condition of rock-cut heritage structures. However, since the measurements were collected during a single field campaign, the observed relationships should be interpreted as spatial associations rather than evidence of temporal trends or causal relationships.
1. Introduction
Cultural heritage structures constructed using rock materials may be subjected to irreversible deterioration processes over time under the influence of atmospheric and environmental conditions to which they are exposed for long periods. During this process, moisture may enter the rock mass, move through the pore system, and be retained within the material; it is therefore considered one of the primary factors controlling the development of deterioration. The identification of moisture-induced damage in monuments and the quantitative determination of the damage level are important for establishing conservation priorities and developing appropriate intervention strategies [1,2]. In deterioration assessments conducted using non-destructive testing (NDT) methods, moisture measurements are used as an important parameter for determining the spatial distribution of deterioration on monument surfaces and evaluating the relationships between moisture and other deterioration indicators. In applications aimed at determining moisture in cultural heritage structures, two main approaches based on measurement depth are prominent. The first is surface moisture measurement, which aims to determine the moisture condition in the zone extending to a depth of approximately 4 cm from the monument surface [1,3,4,5,6,7]. The second approach is deep moisture measurement, which allows the determination of moisture extending to a depth of approximately 30 cm from the surface [5,6,7,8,9,10,11,12]. An uncontrolled increase in the moisture content within a monument can lead to changes in the physical and mechanical properties of the material, thereby accelerating the development of various damage types [9]. Therefore, determining the source and distribution of moisture, identifying the level of moisture-induced damage, and evaluating it quantitatively as far as possible are important for limiting the progression of deterioration and establishing long-term conservation approaches [2]. This is particularly critical for cultural heritage structures composed of or carved into porous, low-strength pyroclastic rocks with high water absorption capacity. In such rocks, the ability of water to move readily through the pore system can cause moisture to remain within the material for long periods, thereby allowing associated deterioration mechanisms to develop more effectively. Accordingly, in studies aiming to assess deterioration processes occurring in monuments, approaches based on determining moisture conditions and jointly evaluating data obtained through different NDT methods are widely employed [4,5,6,7,8,9,10,11,12,13,14,15,16,17,18,19,20].
Hatır et al. [4] evaluated the deterioration condition of the building stones used in Küçükköy Church, one of the structures constructed in the 19th century in Cappadocia (Nevşehir, Türkiye) that exhibits an advanced degree of deterioration, and investigated its causes using NDT methods. They determined that the degree of deterioration was strongly related to the lithological and physical properties of the building stones used in the monument and that the degree of deterioration was associated not only with environmental conditions but also with the properties of the stone itself. In their study investigating the effects of moisture (water) on deterioration in a historical rock monument, İnce et al. [6] evaluated surface moisture measurements and deep moisture measurements together in the same structure. By using both methods, they determined that a better assessment could be made regarding whether deterioration in cultural heritage structures constructed from natural building stones develops only at the surface or also in deeper parts of the rock mass. Korkanç et al. [16], in their study of the İvriz Rock Monument, an important rock relief from the Late Hittite period, demonstrated that the distribution of deterioration in the monument could be explained by jointly evaluating the fractured and brecciated structure of the rock mass and atmospheric and anthropogenic effects. They determined that, among the NDT results, surface moisture, P-wave velocity, and Schmidt hammer rebound values were particularly effective in identifying deteriorated areas. Özer et al. [19] conducted one of few studies in which deterioration in cultural heritage monuments carved into low-strength pyroclastic rocks was evaluated using NDT methods (SHR, Vp, and SM). Balci [12] investigated the deterioration occurring in the Emir Ali Tomb in Ahlat (Bitlis, Türkiye) and its causes using NDT. It was demonstrated that the deterioration in the Emir Ali Tomb was particularly associated with capillary water movement and the related wetting and drying processes, and that these deterioration processes and their causes could be identified non-destructively through the combined use of deep moisture, P-wave velocity, and infrared thermography methods.
Despite the increasing use of NDT techniques in the assessment of stone-built and rock-carved heritage structures, previous studies have generally considered individual physical or mechanical properties separately, and relatively limited attention has been given to the integrated spatial assessment of rock condition within rock-carved monuments.
Within the scope of this study, Kayadibi Church No. 2, one of the cultural heritage structures carved into pyroclastic rocks exhibiting high porosity and low-strength properties in the Konya region of Türkiye, was investigated. This monument enables the evaluation of the bedrock condition within its original geological and architectural context. Therefore, this study aims to address the following questions: (i) What is the current physical and mechanical condition of the ignimbrite forming the church? (ii) How do these properties vary spatially across the monument? (iii) How does the integration of NDT methods and high-resolution three-dimensional documentation establish a reliable basis for identifying deterioration-prone zones and supporting conservation assessments? Rather than merely documenting the condition of a single monument, the study integrates spatially distributed SHR, DM, VPID measurements with LiDAR-based three-dimensional documentation and observed deterioration patterns to characterize the condition and spatial variability of the bedrock. This integrated approach provides a site-specific framework for interpreting deterioration processes and supporting conservation evaluations in rock-carved cultural heritage structures.
In the first stage of the study, the current condition of the monument was assessed in situ by documenting the observed deterioration types and their spatial distribution. Based on these observations, a deterioration catalog and a corresponding atlas of deterioration maps were prepared.
Subsequently, the physical, mechanical, and excavatability properties of the rock material into which the monument was carved were determined. In the final stage of the study, in situ DM, SHR, and VPID measurements were performed on the monument surfaces, and NDT variation maps of the monument were prepared using the obtained data. These maps were evaluated together with the deterioration types identified through observations, with the aim of revealing the relationships among rock properties, moisture conditions, and deterioration.
2. Materials and Methods
2.1. General Characteristics of the Monument
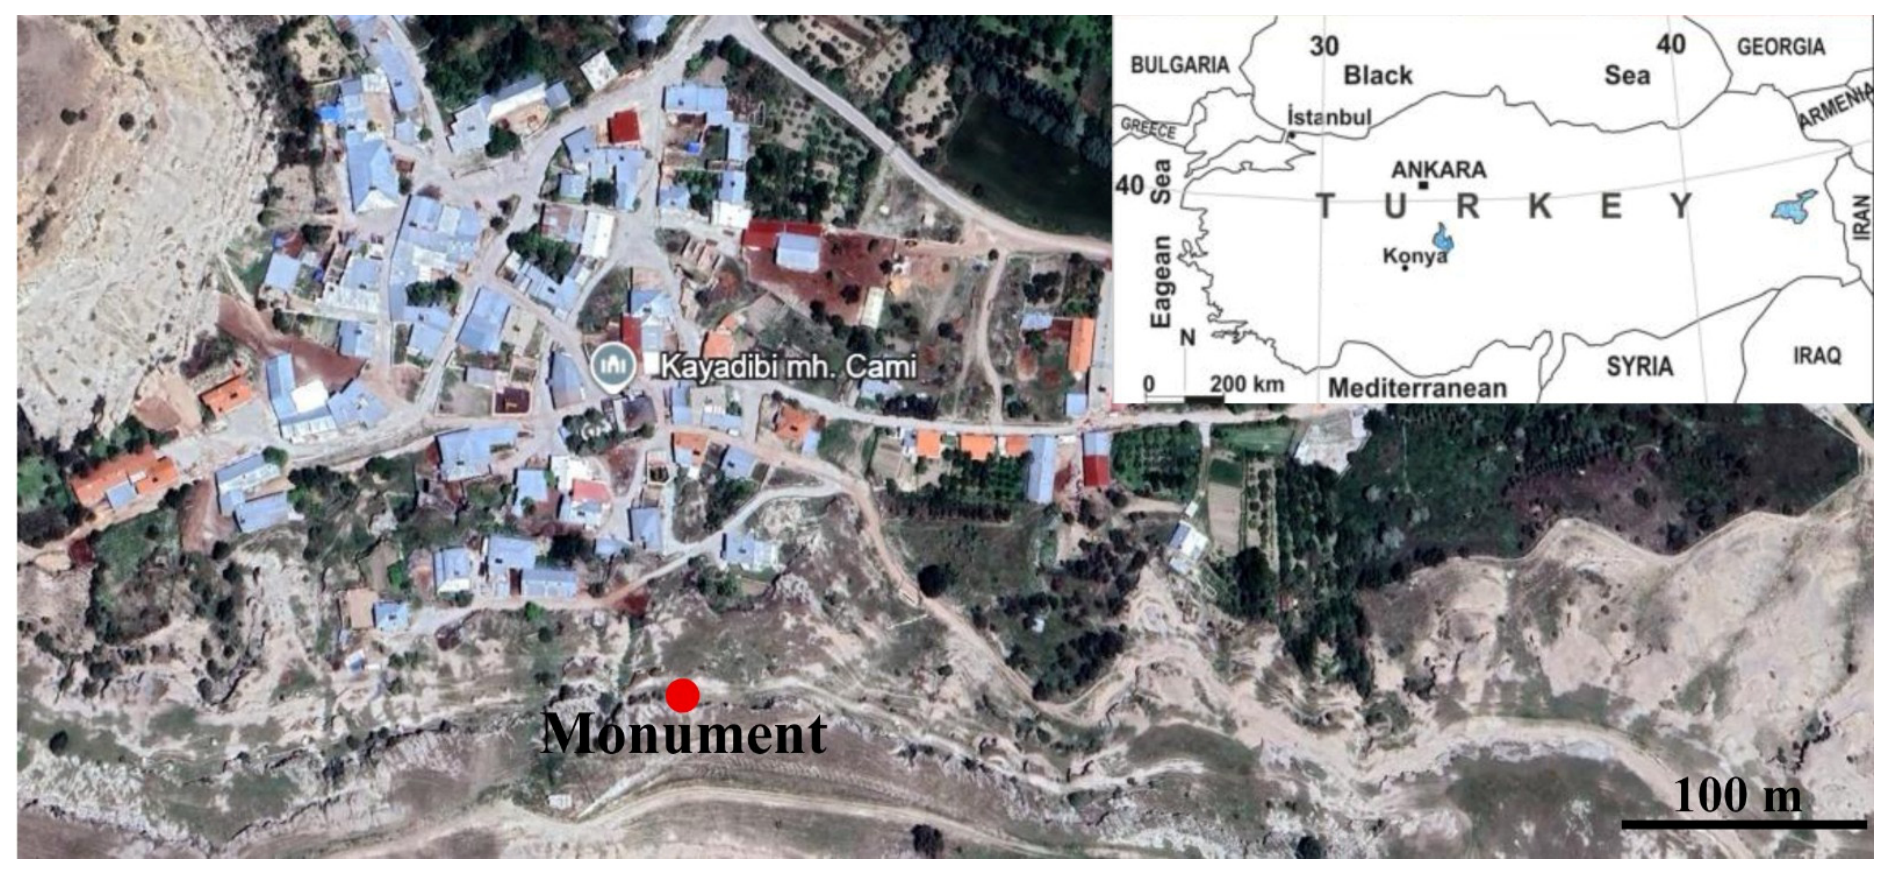
In this study, the church structure of cultural heritage significance, carved into the rock on the southern slope of Kayadibi District in Konya Province, was investigated. This monument was identified as Church No. 2 by Uçkan and Mimiroğlu [21]. The church is located approximately 43 km southwest of Konya city center, approximately 30 m above the settlement area (Figure 1). The structure is one of the few surviving original examples of ancient rock-carved architecture in the Konya region and constitutes an important component of the historical and cultural heritage of the region.
Figure 1.
Location map of Kayadibi Church No. 2.
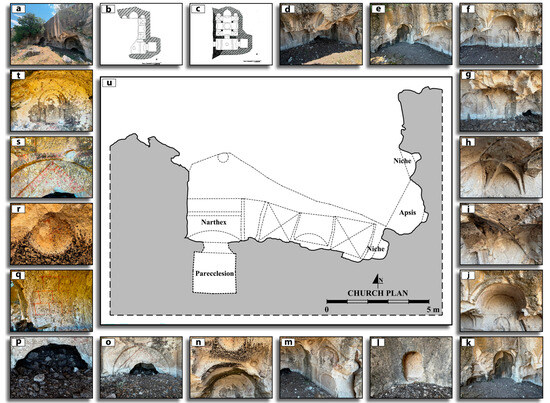
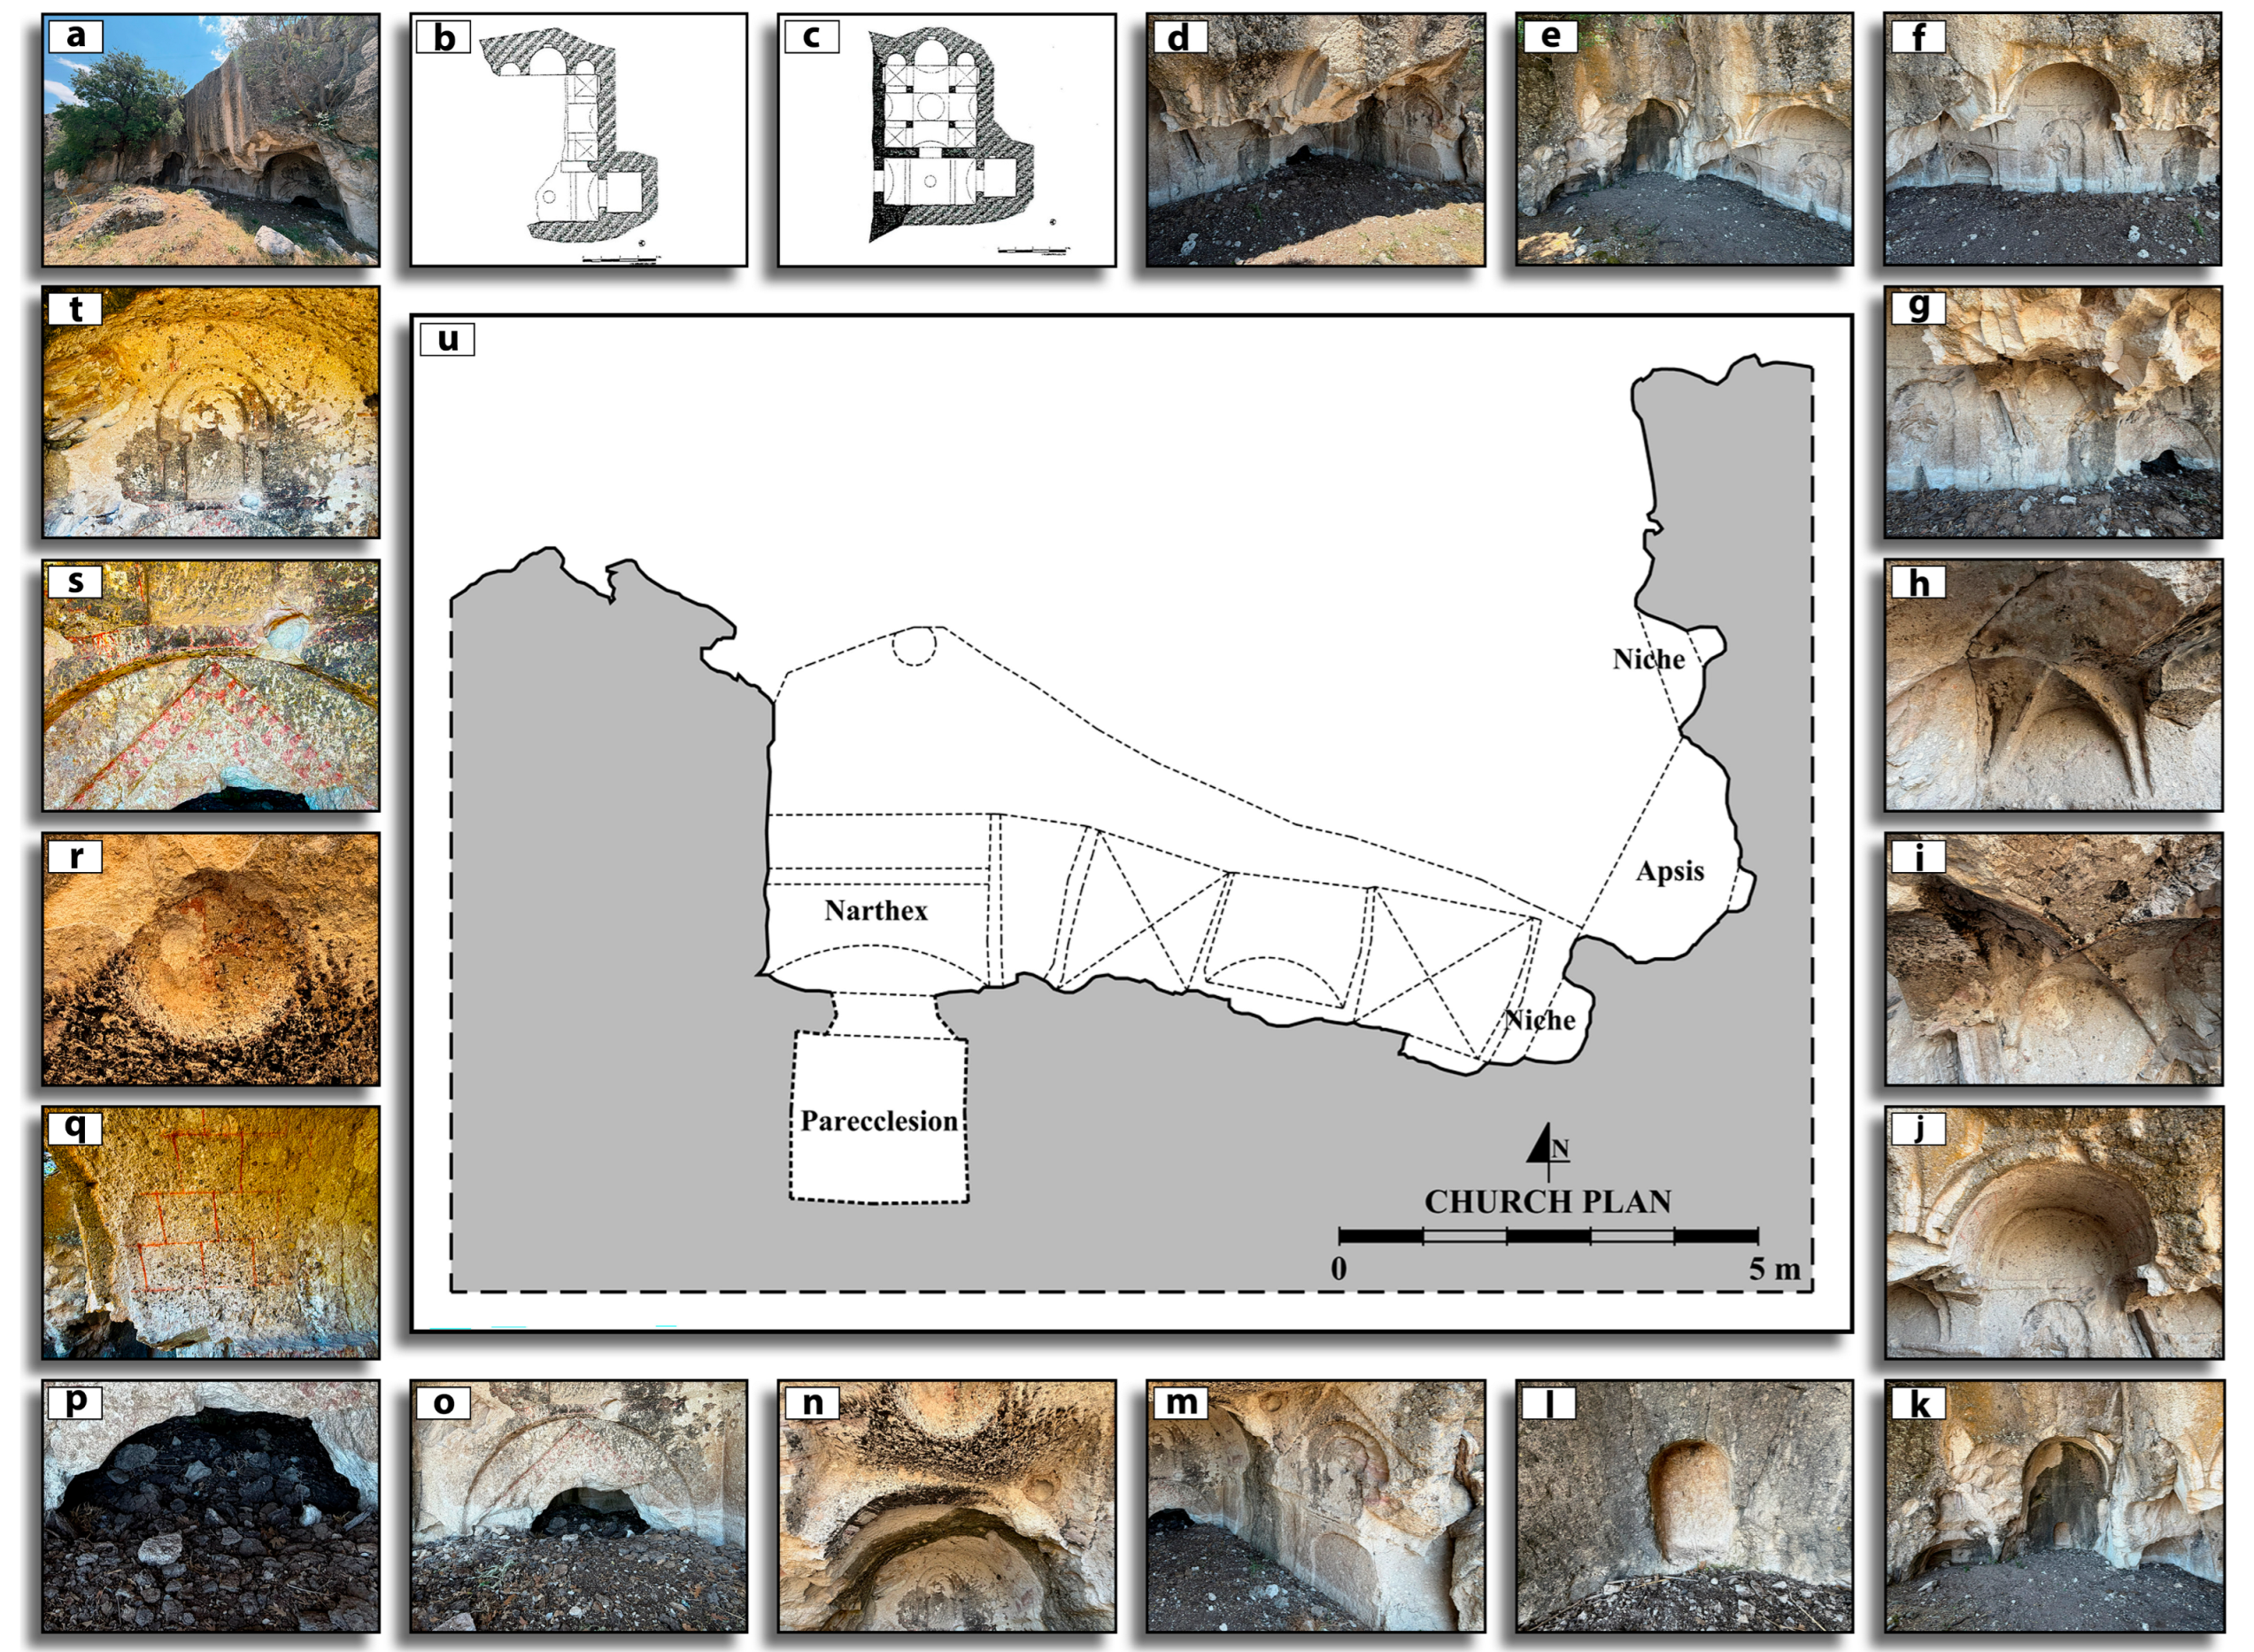
The church was created by carving bedrock located on a northward sloping hillside (Figure 2a). The northern part of the structure has not survived to the present day, and approximately 0.5 to 1.0 m of the area below the current ground level remains buried under soil (Figure 2b). Based on existing architectural and structural data, Uçkan and Mimiroğlu [21] evaluated the structure as having a closed Greek cross plan typology (Figure 2c). The southwestern and southeastern corner spaces of the naos and the southern cross arm have been preserved (Figure 2d–f). The southern façade arrangement is made up of horseshoe-shaped arches, which give the façade a rhythmic and dynamic appearance (Figure 2g). The preserved corner spaces were determined to be covered with cross vaults (Figure 2h,i), whereas the southern cross arm was covered with a barrel vault (Figure 2j). The semicircular apsis on the eastern façade and the niches located on both sides of the apsis have survived to the present day (Figure 2k). At the center of the apsis wall, there is a rectangular niche terminating in a round arch (Figure 2l). The narthex of the church extends in the north–south direction, and its southern and western walls are enriched with triangular pedimented arrangements and horseshoe-shaped arches (Figure 2m). The roof covering of the narthex consists of a barrel vault in the southern section and a flat ceiling in the central section (Figure 2n). A small dome-shaped recess is located at the center of the flat ceiling in the central axis. A parekklesion is located to the south of the narthex. Access to this space is provided through a largely damaged round-arched opening (Figure 2o). The floor of this rectangular section was observed to be currently covered with rubble (Figure 2p). Two different groups of decorations created using red paint and relief techniques were identified on the monument. Within the painted decorations, quadrangular motifs resembling ashlar masonry are present on the vault of the southern cross arm opening into the naos (Figure 2q), a cross motif is present within the dome-shaped recess in the narthex ceiling (Figure 2r), and colored decorations are present above the arch providing access to the parekklesion to the south of the narthex (Figure 2s). The decorations created using the relief technique consist of Greek cross motifs carved within frames located on the southern and western walls of the narthex (Figure 2t). Considering that the monument architecturally reflects the closed Greek cross plan type commonly used during and after the Middle Byzantine Period (Figure 2u), together with the typological characteristics of the decoration, the structure was dated to the 10th to 11th centuries [21]. As a result of the LiDAR scanning of the monument, a high-resolution three-dimensional digital model consisting of 831,432 vertices and 1,395,101 triangles was generated. Following the application of high-resolution texture mapping and model optimization to the model, the total surface area of the surviving section of the church was determined to be 213.45 m2, while the existing floor area was determined to be 37.12 m2.
Figure 2.
Architectural features of the church. (a) General view of the church; (b) plan of the church [21]; (c) original plan scheme of the church [21]; (d) southwestern section of the naos; (e) southeastern section of the naos; (f) southern cross arm of the naos; (g) horseshoe-shaped arches; (h) cross vault covering the southeastern corner space of the naos; (i) cross vault covering the southwestern corner space of the naos; (j) barrel vault covering the southern cross arm of the naos; (k) apsis and niches located on both sides of the apsis; (l) niche located at the center of the apsis wall; (m) triangular pedimented arrangements and horseshoe-shaped arches on the western wall of the narthex; (n) roof covering of the narthex; (o) round arched opening providing access to the parekklesion located to the south of the narthex; (p) floor of the parekklesion; (q) decorations on the vault of the southern cross arm opening into the naos; (r) cross motif within the dome-shaped recess in the narthex ceiling; (s) decorations above the arch providing access to the parekklesion; (t) Greek cross motif carved within a frame on the southern wall of the narthex; and (u) the current existing plan of the structure.
2.2. Stages of Investigation
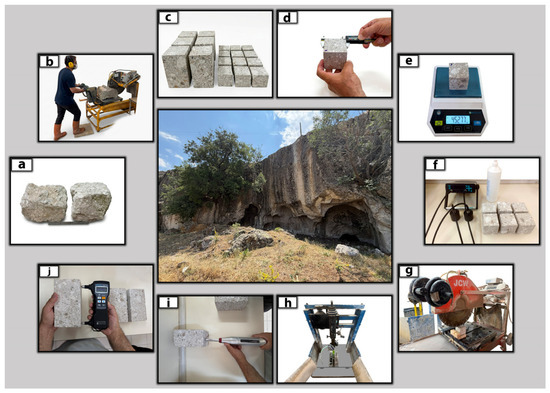
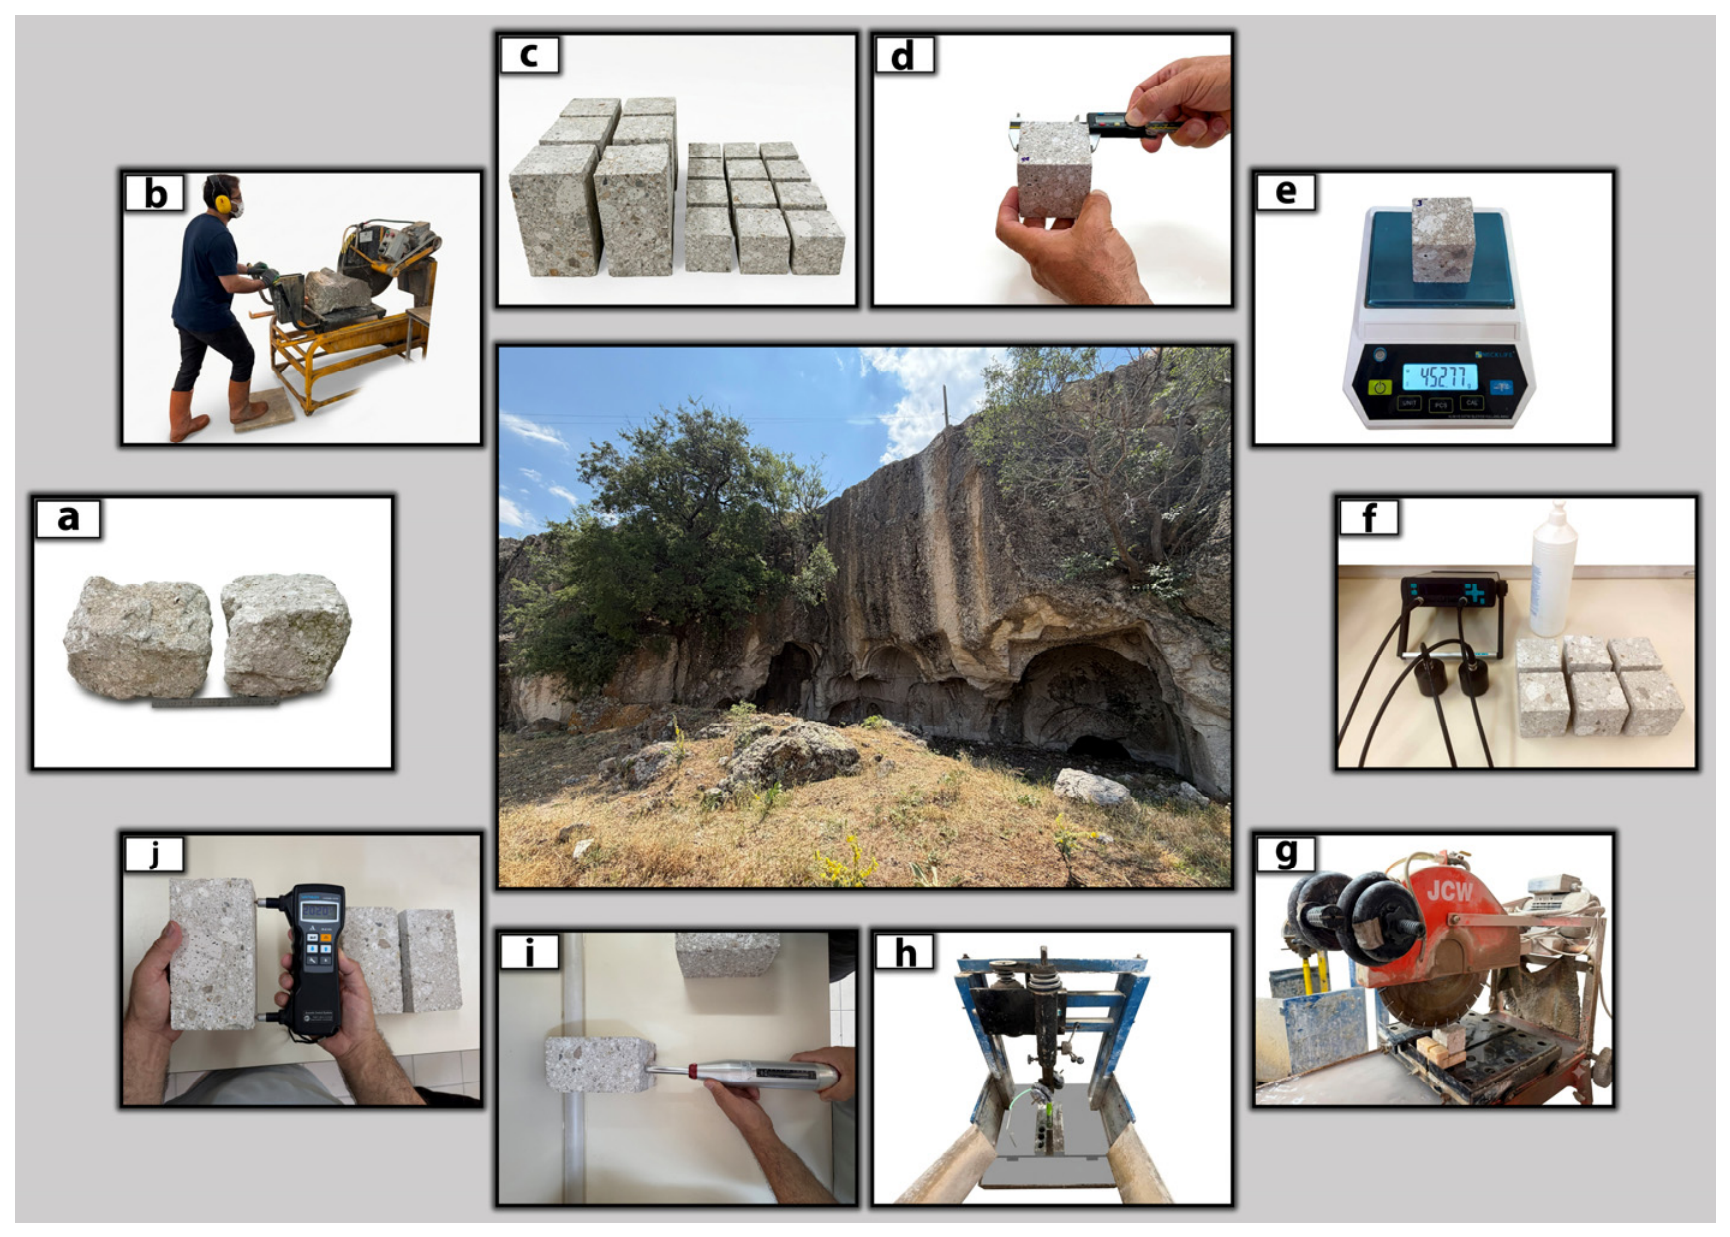
The investigations of the monument were conducted in two main stages, namely laboratory studies and field studies, including visual analysis and NDT measurements. As part of the laboratory investigations, five block samples, each measuring 40 × 40 × 30 cm, were collected from the continuation of the geological level at which the monument was carved. The blocks were selected to exhibit similar textural and physical characteristics to the rock forming the monument and were used to determine its physical and mechanical properties (Figure 3a). This sampling strategy was adopted to avoid further intervention or damage to the monument while obtaining material representative of the host rock. Considering the potential heterogeneity of pyroclastic rocks, the laboratory results were used as approximate site-specific reference ranges rather than as the exact original properties of the monument rock. From these block samples, twelve cubic specimens with an edge length of 7 cm were prepared by considering the methods recommended in TS EN 1936 [22] (Figure 3b,c). In addition, six square prismatic specimens with a base area of 10 cm × 10 cm and a height of 18 cm were prepared (Figure 3c). Six of the prepared cubic specimens were used to determine the physical properties of the rock into which the monument was carved, including porosity, dry density, water absorption by weight, and P-wave velocity, while the other six cubic specimens were used to determine the mechanical properties, including cutting and drilling rates. The square prismatic specimens were used to determine the reference NDT values of the rock into which the monument was carved, including SHR and VPID.
Figure 3.
Experimental stages. (a) Block sample; (b) specimen preparation; (c) specimens; (d,e) measurement of specimen dimensions and mass; (f) VPD measurement; (g) cutting rate; (h) drilling rate; (i) SHR measurement in the laboratory; and (j) VPID measurement in the laboratory.
For the determination of physical properties, the edge lengths of the prepared cubic specimens in the x, y, and z directions were measured multiple times using a digital caliper, and the specimen volumes were calculated based on the arithmetic mean values of the measurements (xavg, yavg, and zavg) (Figure 3d). The dry and water-saturated masses of the specimens were determined using an electronic balance with a precision of 0.001 g (Figure 3e). Dry density was calculated as the ratio of the dry specimen mass to the specimen volume determined from the caliper measurements. Apparent porosity and water absorption by weight were calculated based on the water-saturated masses of the specimens and the volume values determined using the caliper method. VPD measurements of the rock were determined according to the standards recommended in ASTM E494 [23]. VPD measurements were performed using a Pundit PL 200 model device manufactured by Proceq (Schwerzenbach, Switzerland) (Figure 3f). For the VPD measurements, transmitter and receiver transducers with a frequency of 50 kHz were placed on two opposite corresponding surfaces of the cubic specimens. The travel time of the ultrasonic pulse through the specimen was measured, and the P-wave velocity was calculated as the ratio of the distance between the transducers to the measured travel time.
Cutting rate (CR) tests of the rock constituting the monument were conducted on three cubic specimens using a laboratory-scale JCW cutting device (Norton Clipper, Saint Gobain Abrasives, France) (Figure 3g). The device is equipped with a segmented diamond circular blade with a radius of 14 cm (280 mm in diameter), which was operated at a rotational speed of 2620 rpm, corresponding to a peripheral speed of approximately 36.0 m/s. Throughout all experiments, the water flow rate and applied normal load were kept constant, and the cutting process was conducted under a load of 291.15 N and a water flow rate of 0.131 L/s. The cutting time was measured using a high-precision stopwatch, while the cutting depth was measured using a digital caliper. The cutting rate was calculated by dividing the measured cutting depth by the cutting time, and it was expressed in mm/s. In rock sawing, the cutting rate is a principal indicator of sawing performance and largely controls the sawing cost [24]. The cutting and drilling rate tests were repeated on three cubic specimens, and the arithmetic mean of the obtained results was determined as the characteristic cutting and drilling rates of the rock representing the historical structure. A laboratory-scale core drilling system was used to determine the drilling performance of the rock (Figure 3h). The cubic geometry was preferred because it provided more stable fixation of the specimen during the test and allowed more homogeneous contact between the drill bit and the specimen. The experimental procedure was designed by considering the general principles of rock mechanics testing recommended by the International Society for Rock Mechanics (ISRM) [25]. The drilling system was supported by a water circulation unit to remove debris generated during drilling, cool the drill bit, and keep the cutting zone clean [26]. An NQ diameter (42 mm) tungsten carbide core drill bit was used in the tests, and a constant axial load of 208.95 N, a constant rotational speed of 1462 rpm, and a constant water flow rate of 0.153 L/s were applied throughout all tests. The hole depth was measured using a digital caliper, while the drilling time was recorded using a precision stopwatch. The drilling rate was calculated as the ratio of penetration length to drilling time and expressed in mm/s. This drilling rate is hereafter referred to as the penetration rate (PR), which is one of the most important parameters used to evaluate drilling performance in laboratory rotary core drilling tests [26,27]. To characterize the mineralogical and petrographic properties of the rock, three thin sections were prepared according to the methods recommended in TS EN 12407 [28]. The prepared thin sections were examined using a LEICA DM2700 P polarizing microscope.
Within the scope of the NDT methods, P-wave velocity and Schmidt hammer measurements were performed on the square prismatic specimens prepared from the rock blocks collected from the field (Figure 3i,j). These laboratory values provided a basis for evaluating changes in the physical and mechanical properties associated with deterioration by comparison with the measurement results obtained from the monument surfaces. Handheld P-wave velocity measurements in the laboratory and in situ were performed using an ACS UK1401 model device (Moscow, Russia). This device performs VPID measurements using two fixed probes positioned 15 cm apart and operates at a frequency of 50 kHz within a measurement range of 1 to 10 km/s. The probes have needle-shaped contact tips, which provide localized contact with the rock surface and help minimize the influence of minor surface irregularities during measurements. VPID measurements were performed according to the standards specified in ASTM E494 [23]. Measurements on the square prismatic specimens or at the measurement points were repeated three times, and the arithmetic mean of these measurements was determined as the VPID. SHR measurements in the laboratory and on the monument were performed using an ELE L type Schmidt hammer (Leighton Buzzard, UK). The device allows rebound values in the range of 10 to 100 to be measured depending on the hardness properties of the rock surface. The methods specified in ASTM D5873 [29] were followed for SHR measurements conducted in the laboratory and in situ. The measurements were performed perpendicular to the vertical surface, and ten repetitions were conducted for each measurement point. Following the criteria specified in the relevant standard, measurements differing by 7 units or more from the mean value were excluded, and the arithmetic mean of the remaining measurements was taken as the SHR value for the corresponding specimen or measurement point.
Within the scope of the visual examinations conducted on the monument, the existing deterioration types and their distributions on the structural surfaces were systematically recorded using a Canon EOS 600D digital camera (Tokyo, Japan). A metric scale was used during photography to determine the actual dimensions of the deterioration features and to enable the visual data to be evaluated to scale. The deterioration types observed on the monument were identified according to the approaches recommended in ICOMOS-ISCS [30].
A three-dimensional digital model of the monument was created using the 3D Scanner App application compatible with mobile devices supporting light detection and ranging (LiDAR) sensor technology. During the scanning process, all accessible surfaces within the effective measurement range of the LiDAR sensor were systematically and comprehensively scanned (Figure 4a). The obtained point data were processed to create a scaled three-dimensional model of the monument with a polygonal mesh structure (Figure 4b). Subsequently, the visual quality and realism of the three-dimensional model were improved using the high-resolution texture mapping and model optimization features of the application (Figure 4c). Plan and elevation views were generated from the three-dimensional model, and these images were saved in appropriate file formats for use in digital documentation and subsequent evaluation processes.
The digital documentation studies were continued using AutoCAD Architecture 2026 (Autodesk, Inc., San Francisco, CA, USA) [31], a Computer-Aided Design (CAD)-based software. The previously obtained plan and elevation images were transferred into the software environment and scaled, and the boundaries, surface divisions, and elevation differences were modeled linearly in accordance with architectural drawing principles, thereby completing the digital documentation process of the monument. Distribution maps of the NDT measurements were prepared using Surfer 13 (Golden Software LLC, Golden, CO, USA) [32].
Since the monument was created by carving into the rock surface, it was necessary to establish a reference system that would allow measurements to be repeated at the same locations over time. Accordingly, a temporary reference measurement grid with a spacing of 50 × 50 cm was established on the monument surfaces, and the NDT measurements were systematically performed at the intersection points (Figure 4d–f). A total of 273 measurement points were distributed across the three vertical façades of the monument, including 32 points on the west façade, 146 points on the south façade, and 95 points on the east façade. The ceiling and carved decorative elements were excluded from the measurement program because the measurements were intended to characterize the condition of the accessible vertical rock surfaces. SHR, DM, and VPID measurements were performed at each designated measurement point. The NDT distribution maps were generated using Point Kriging interpolation based on the measured values at the corresponding spatial locations, with the interpolation restricted to the boundaries of the investigated façades.
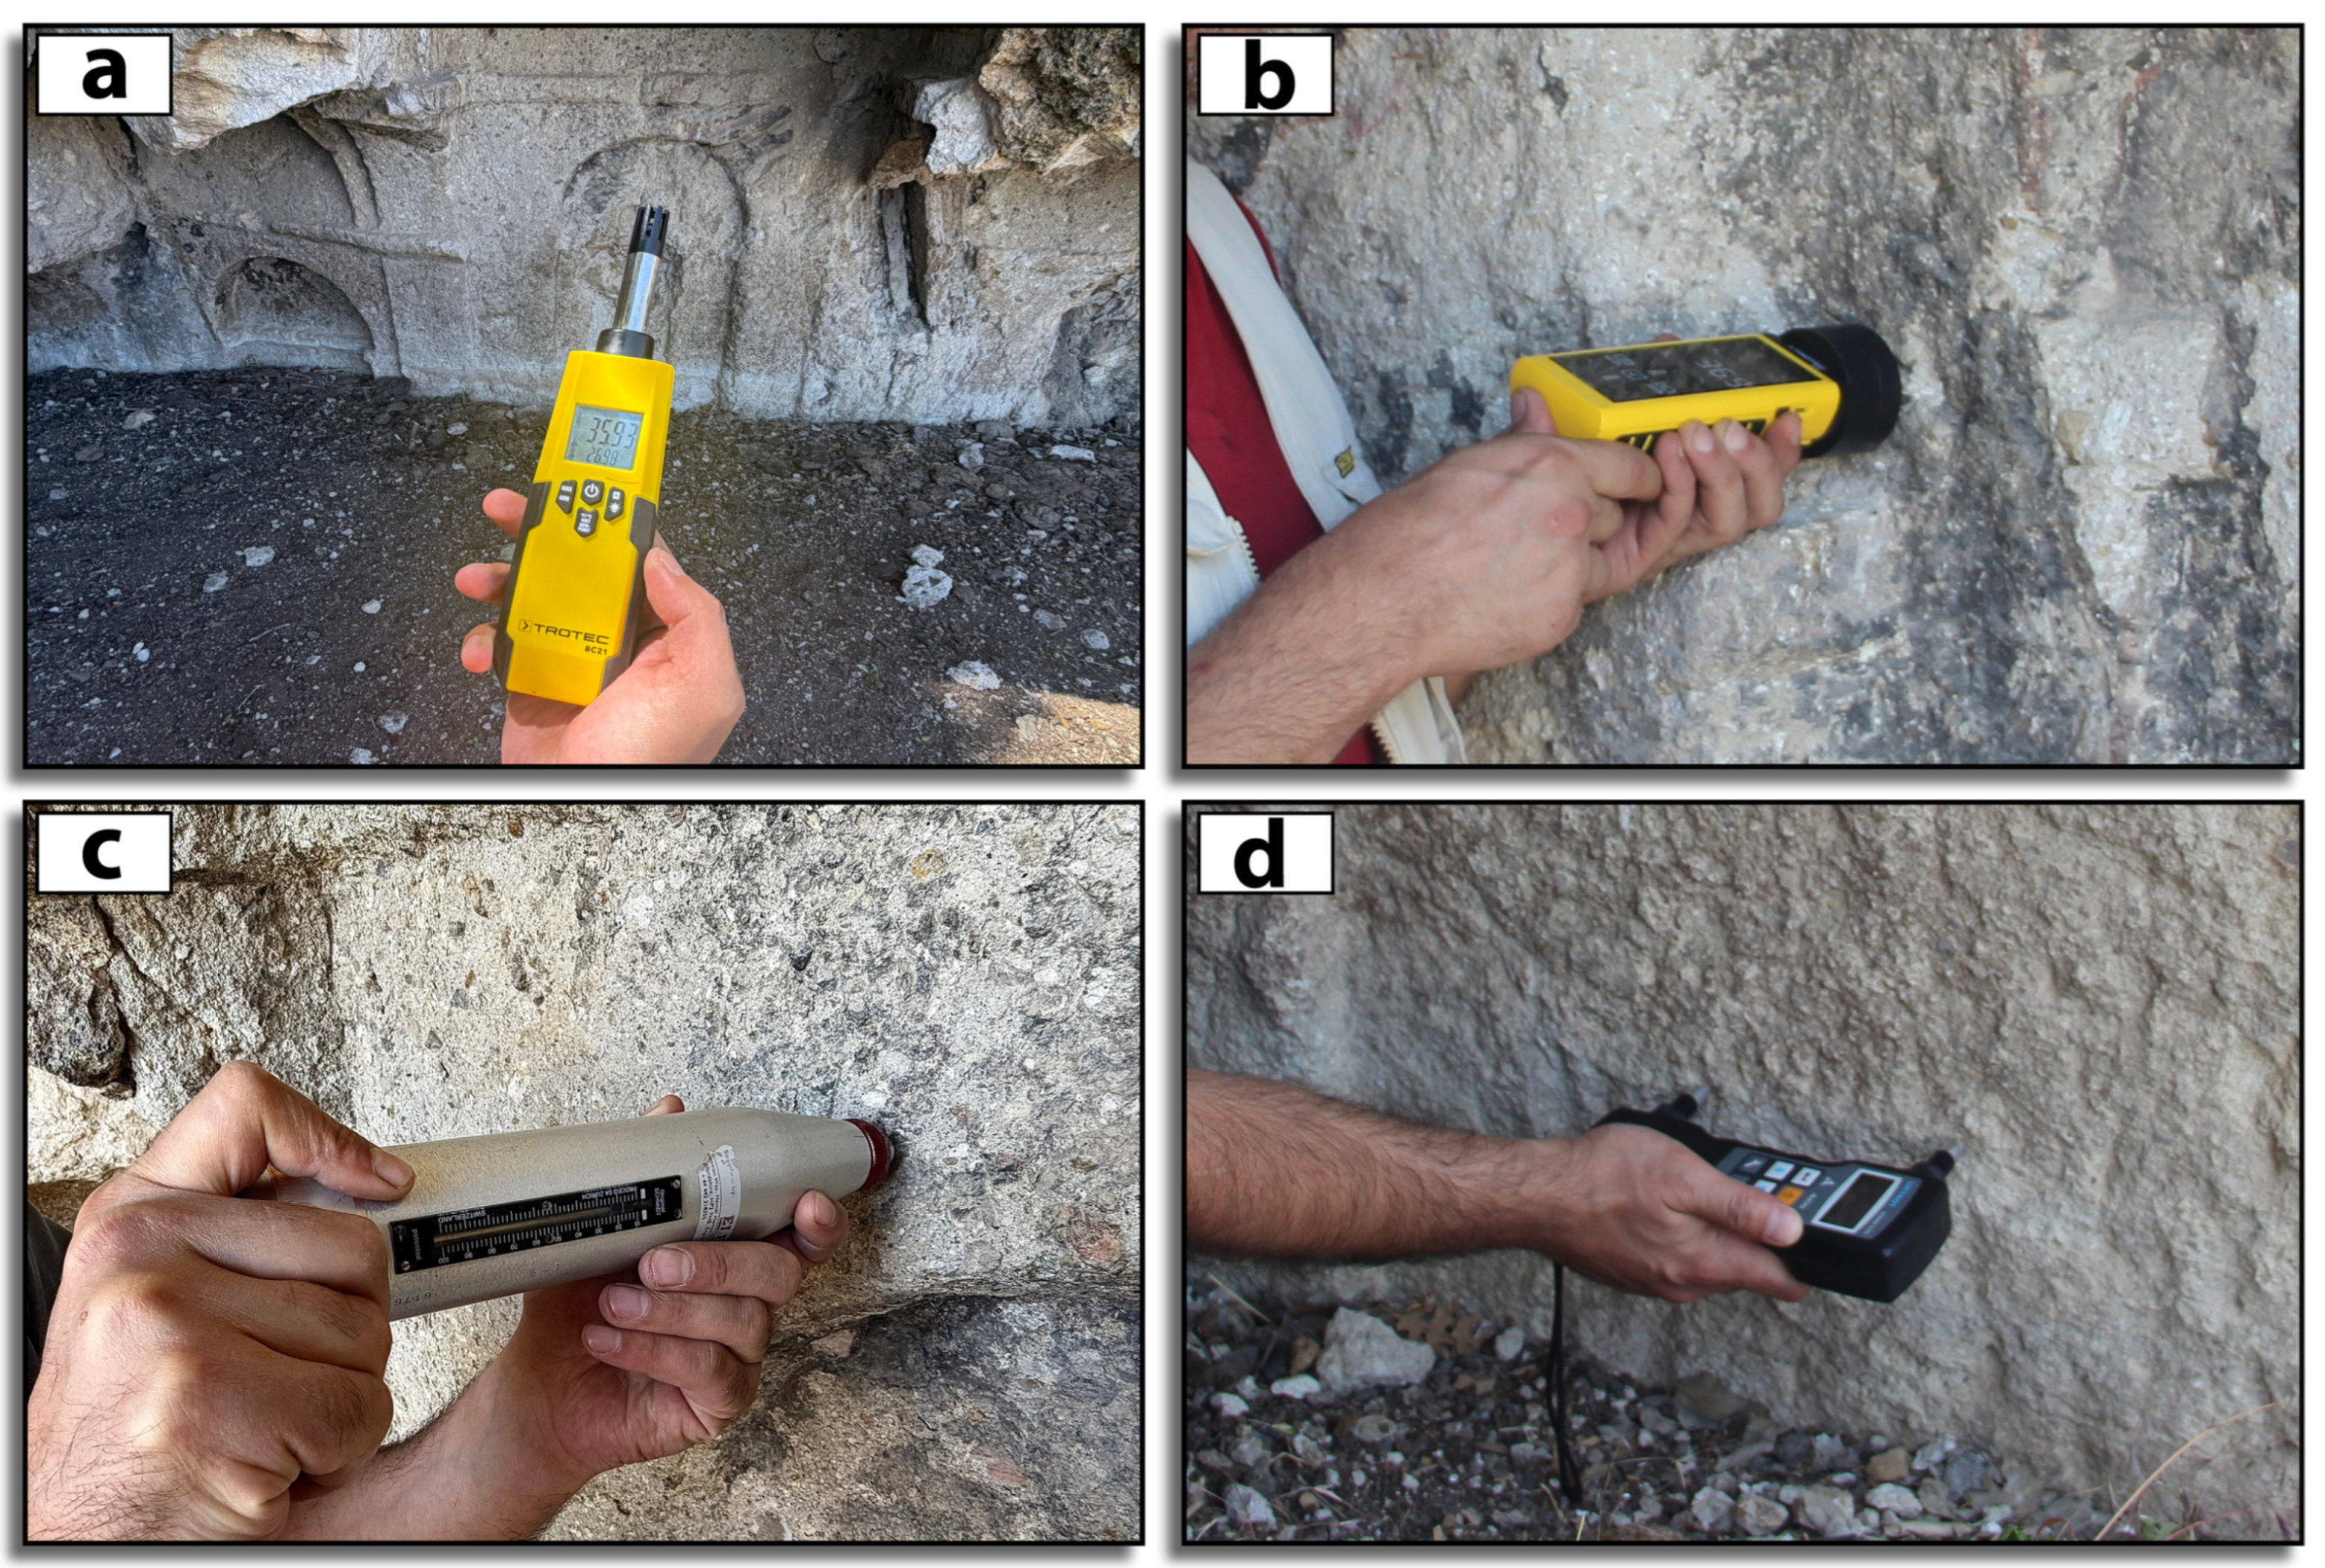
At the beginning and end of the NDT measurements conducted on the monument, ambient temperature and relative humidity values were recorded using a TROTEC BC21 device (Trotec GmbH, Heinsberg, Germany) (Figure 5a). DM measurements were performed to assess the relative spatial distribution of subsurface moisture within the monument. A TROTEC T610 testing device (Trotec GmbH, Heinsberg, Germany), which operates based on the microwave measurement principle and has a maximum penetration depth of 300 mm, was used for these measurements (Figure 5b). The T610 provides material-related relative moisture readings rather than direct measurements of gravimetric moisture content.
Measurements at all designated measurement points were repeated three times, and the arithmetic mean of the obtained values was considered the representative value of the relevant point. SHR and VPID measurements performed on the monument surfaces were conducted based on the measurement procedure applied to the square prismatic specimens in the laboratory (Figure 5c,d).
Figure 4.
Digital documentation process of the monument. (a) Scanning of the monument surfaces using a LiDAR sensor; (b) scaled three-dimensional polygonal mesh textured model of the monument; (c) photorealistic three-dimensional model created in accordance with the original visual characteristics of the monument; and (d–f) distribution of the 50 × 50 cm measurement grids and NDT measurement points on the three façades used for spatial modeling of the measured values in Surfer 13 [32].
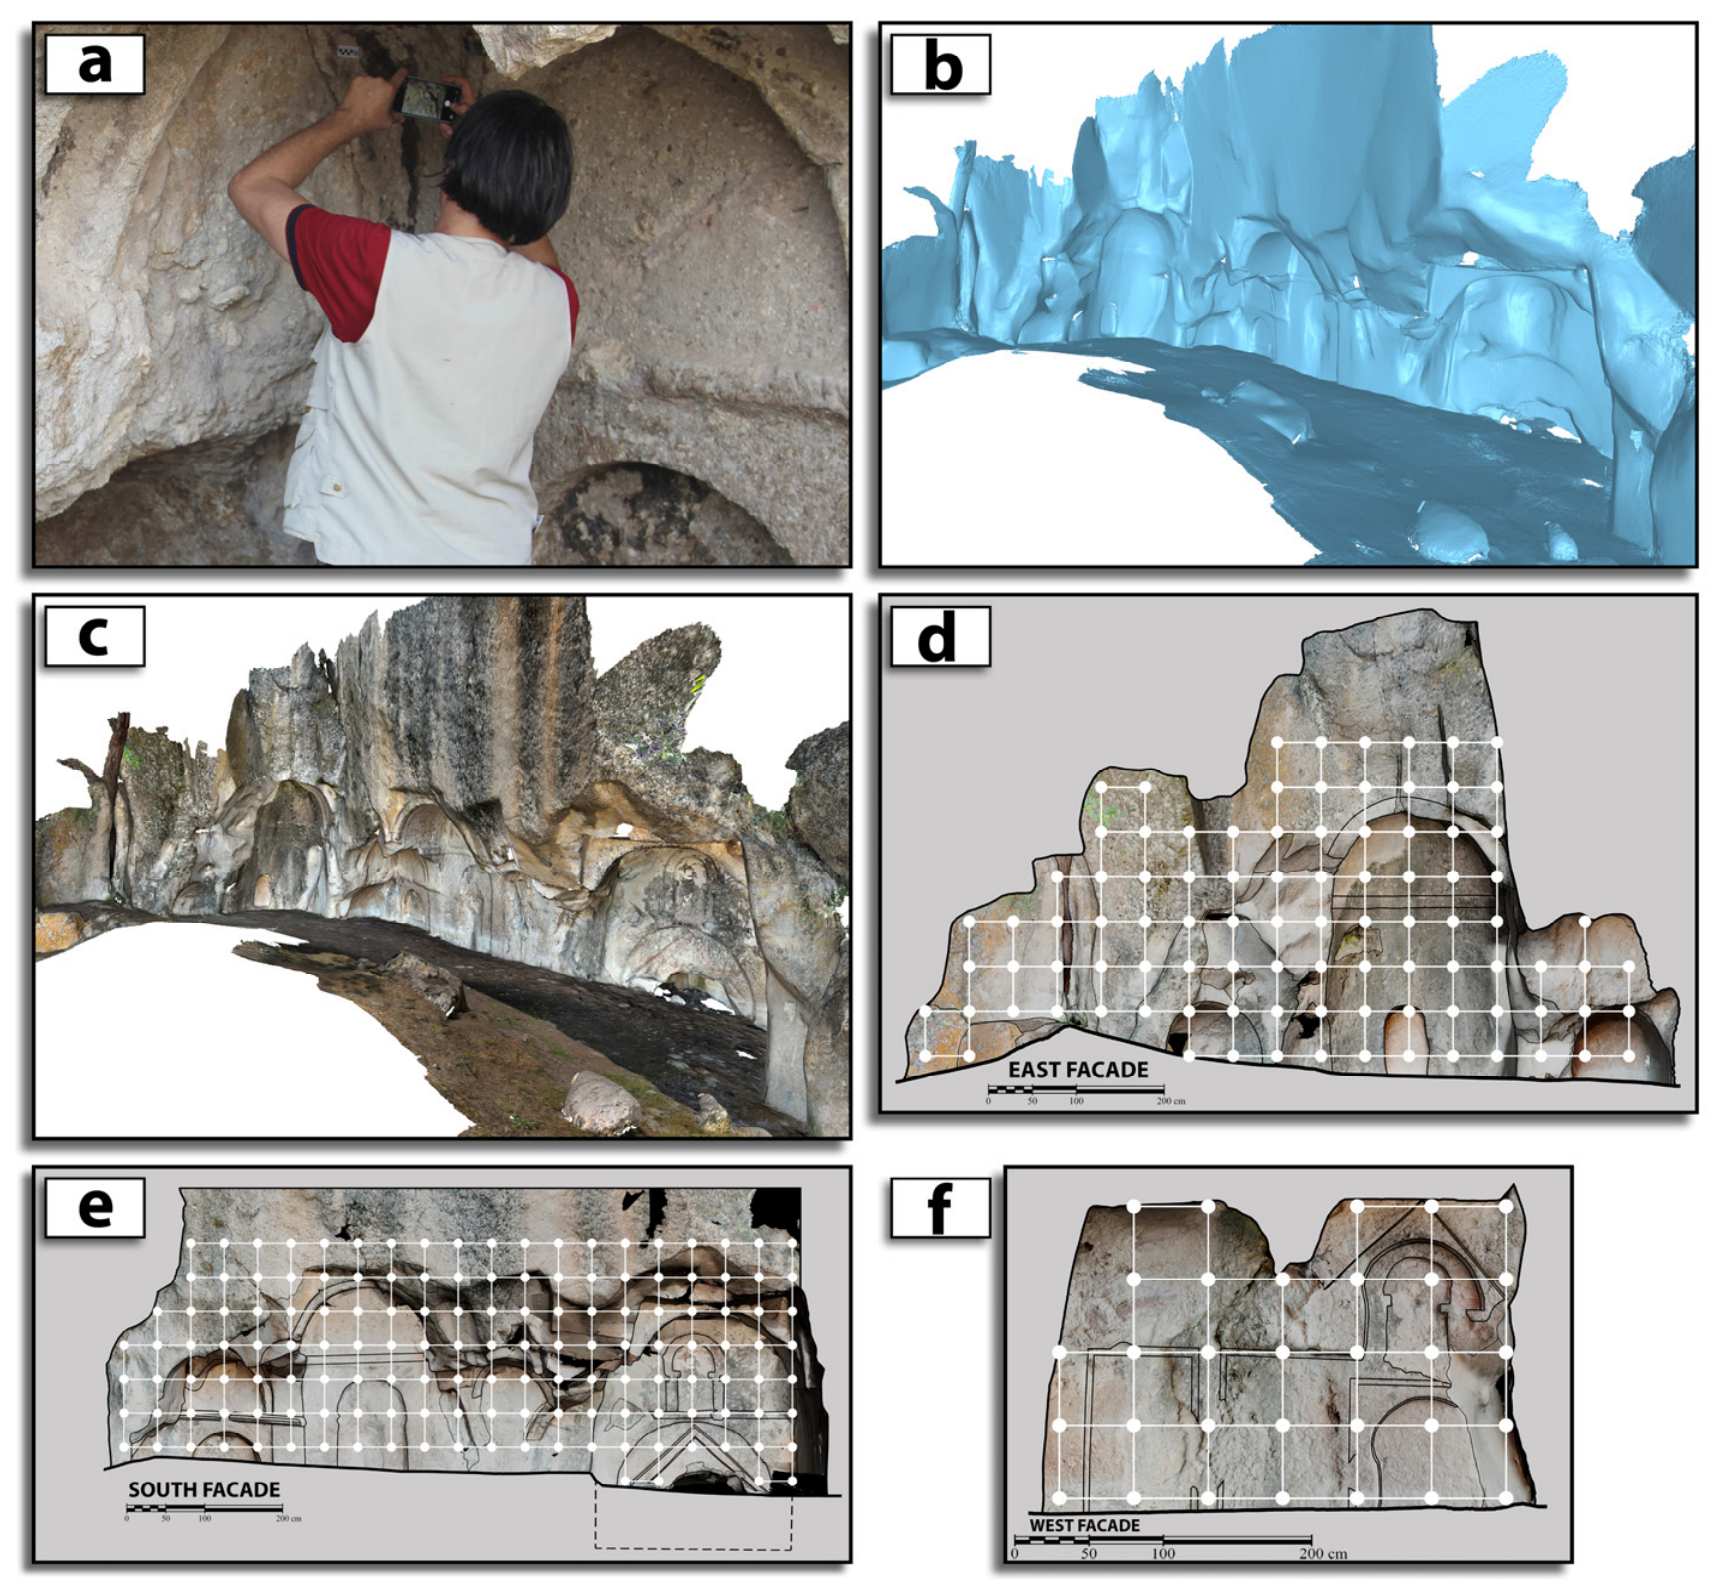
Figure 5.
NDT measurements conducted on the monument. (a) Ambient temperature and relative humidity measurement; (b) deep moisture measurement; (c) SHR measurement; and (d) VPID measurement.
3. Results and Discussion
3.1. Geological Setting and Mineralogical and Petrographic Characterization of the Monument Rock
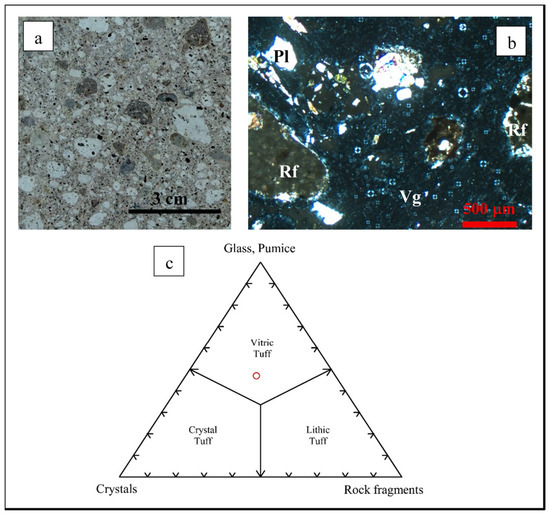
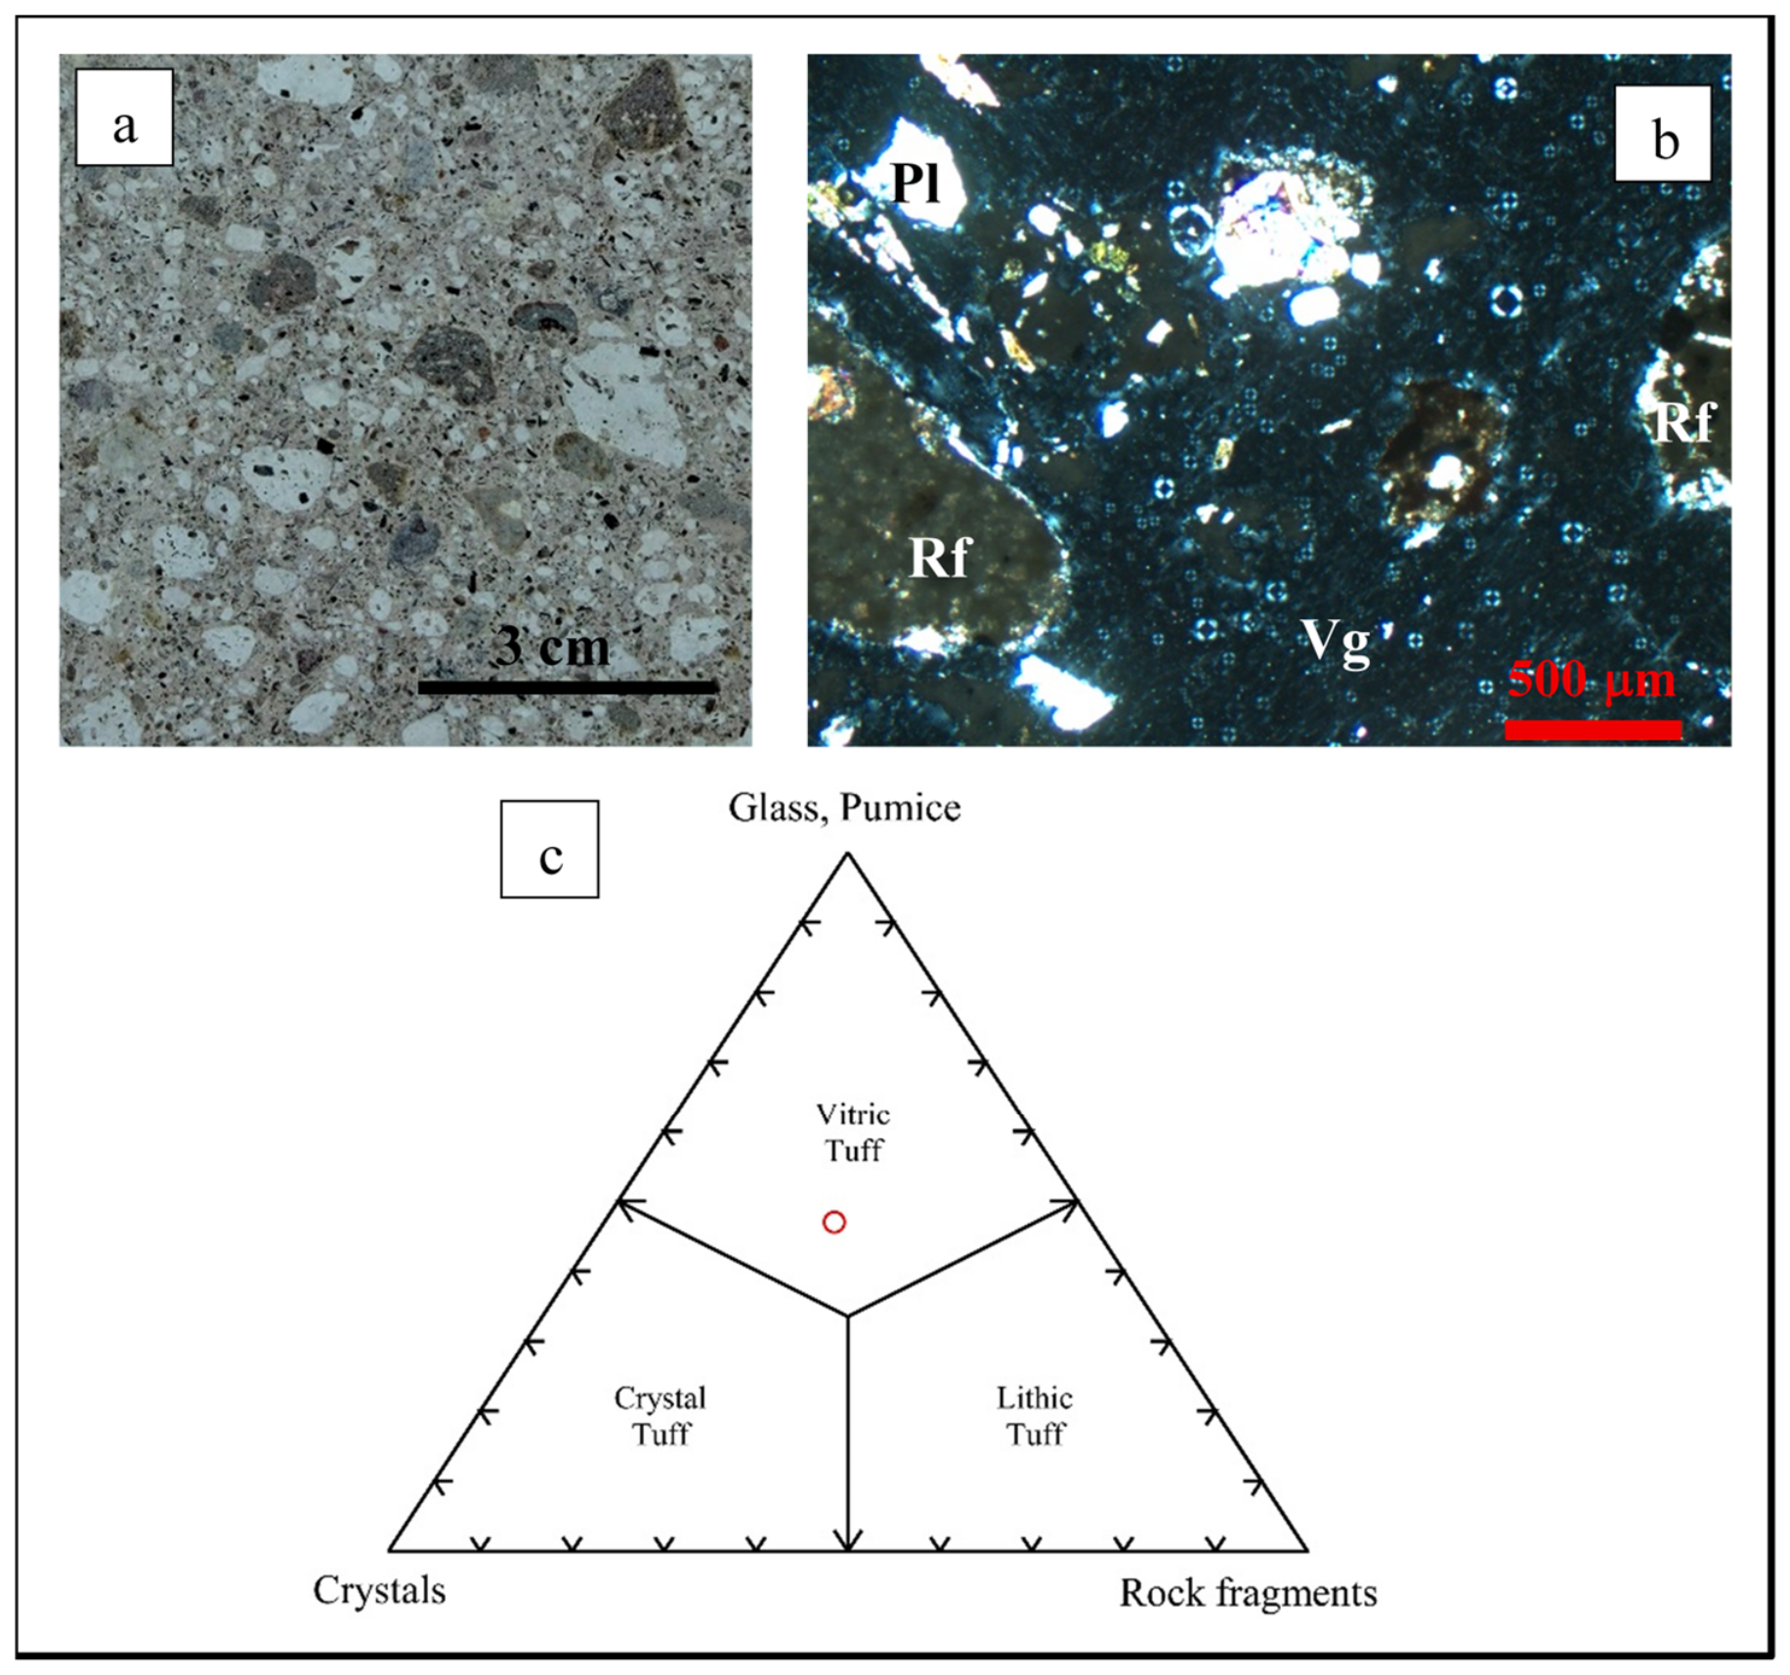
The monument is located within Neogene volcanic rocks that extend over a broad area of approximately 1.000 to 1.200 km2 in the Konya (Türkiye) region. The Neogene volcanic units of Konya mainly consist of lavas with intermediate to acidic composition and pyroclastic rocks, while lavas with basic composition have a limited distribution at the regional scale [33]. The monument is situated within the pyroclastic unit identified as the Erenkaya Ignimbrite, which was first named by Keller et al. [34]. The rock unit into which the monument was carved is gray in color and is characterized by the presence of crystal and rock fragments and medium- to coarse-sized pumice components within an unwelded matrix (Figure 6a,b). The mineralogical and petrographic characteristics of the rock unit were evaluated using a polarizing microscope. The mineral compositions and petrographic characteristics of the rock are presented in Table 1. The basic mineralogical composition of the samples consists of volcanic glass (47%), plagioclase (15%), biotite (8%), and quartz (5%), together with rock fragments (25%) (Figure 6b). It was determined that the rock into which the monument was carved exhibits a hyaline porphyritic texture. According to the classification of Schmid [35], the pyroclastic rock was classified as vitric tuff (Figure 6c).
Figure 6.
View of the rock. (a) Macro; (b) micro; (c) Schmid’s classification [35] diagram (Pl: plagioclase, Rf: rock fragment, Vg: volcanic glass).
Table 1.
Mineralogical composition of the monument rock.
3.2. Physical Properties and Excavatability of Monument Rock
The physical properties of the pyroclastic rock into which the monument was carved are presented in Table 2. The dry density, porosity, and water absorption by weight values of the monument rocks are 1.46 g/cm3, 22.69%, and 15.55%, respectively. According to the dry density classification of NBG [36], the monument rock is classified as having a “very low” density, while it exhibits a “very high” porosity characteristic. The VPD of the rock determined in the laboratory was 2.41 km/s, whereas the VPID was 1.95 km/s. The SHR value obtained from the square prism representing the rock unit into which the monument was carved was determined as 23. These laboratory measurements were used as approximate site-specific reference ranges for the sampled host rock.
Table 2.
The physical properties of the pyroclastic rock from which the monument was carved.
The PR and CR values obtained in the laboratory for the historical building stone were used to evaluate the effects of the properties of the rock material into which the monument was carved (strength, textural properties, discontinuities, abrasiveness, fracture behavior, etc.) on the interaction between the cutting tool and the rock surface. The PR and CR values of the rock were determined as 1.262 mm/s and 1.190 mm/s, respectively. The PR/CR ratio was 1.06. Although no standard classification exists for this ratio, a value close to unity indicates that, under the applied test conditions, the rock offers comparable resistance to rotary core drilling and circular sawing. This is consistent with the finding that the cuttability and drillability of rocks are related to common intrinsic properties such as brittleness [37]. The very low density and very high porosity of the rock [36], together with its low SHR value (23.00), are also consistent with its low excavation resistance, since the penetration rate in core drilling decreases with increasing density and Schmidt hardness and generally increases with increasing porosity [26]. Because the point load strength index and discontinuity spacing were not determined, rock mass excavatability charts [38,39] were not applied, and this assessment refers to the intact rock material, which can be described as easily excavatable.
However, CR and PR are performance parameters rather than intrinsic rock properties. In addition to rock properties, sawing performance depends on operating variables such as saw diameter, advance rate, and depth of cut [24,40], and core drilling performance depends on the applied load and rotational speed; for instance, the penetration rate increases with increasing thrust up to an optimum value and decreases beyond it [26]. Consequently, the CR and PR values obtained in this study are directly comparable only with data obtained under equivalent test configurations, and comparisons with studies using different equipment should be limited to relative trends.
3.3. Deterioration Assessment in the Monument
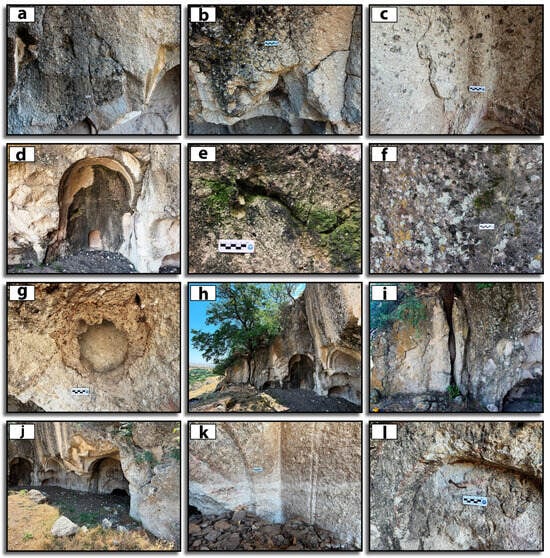
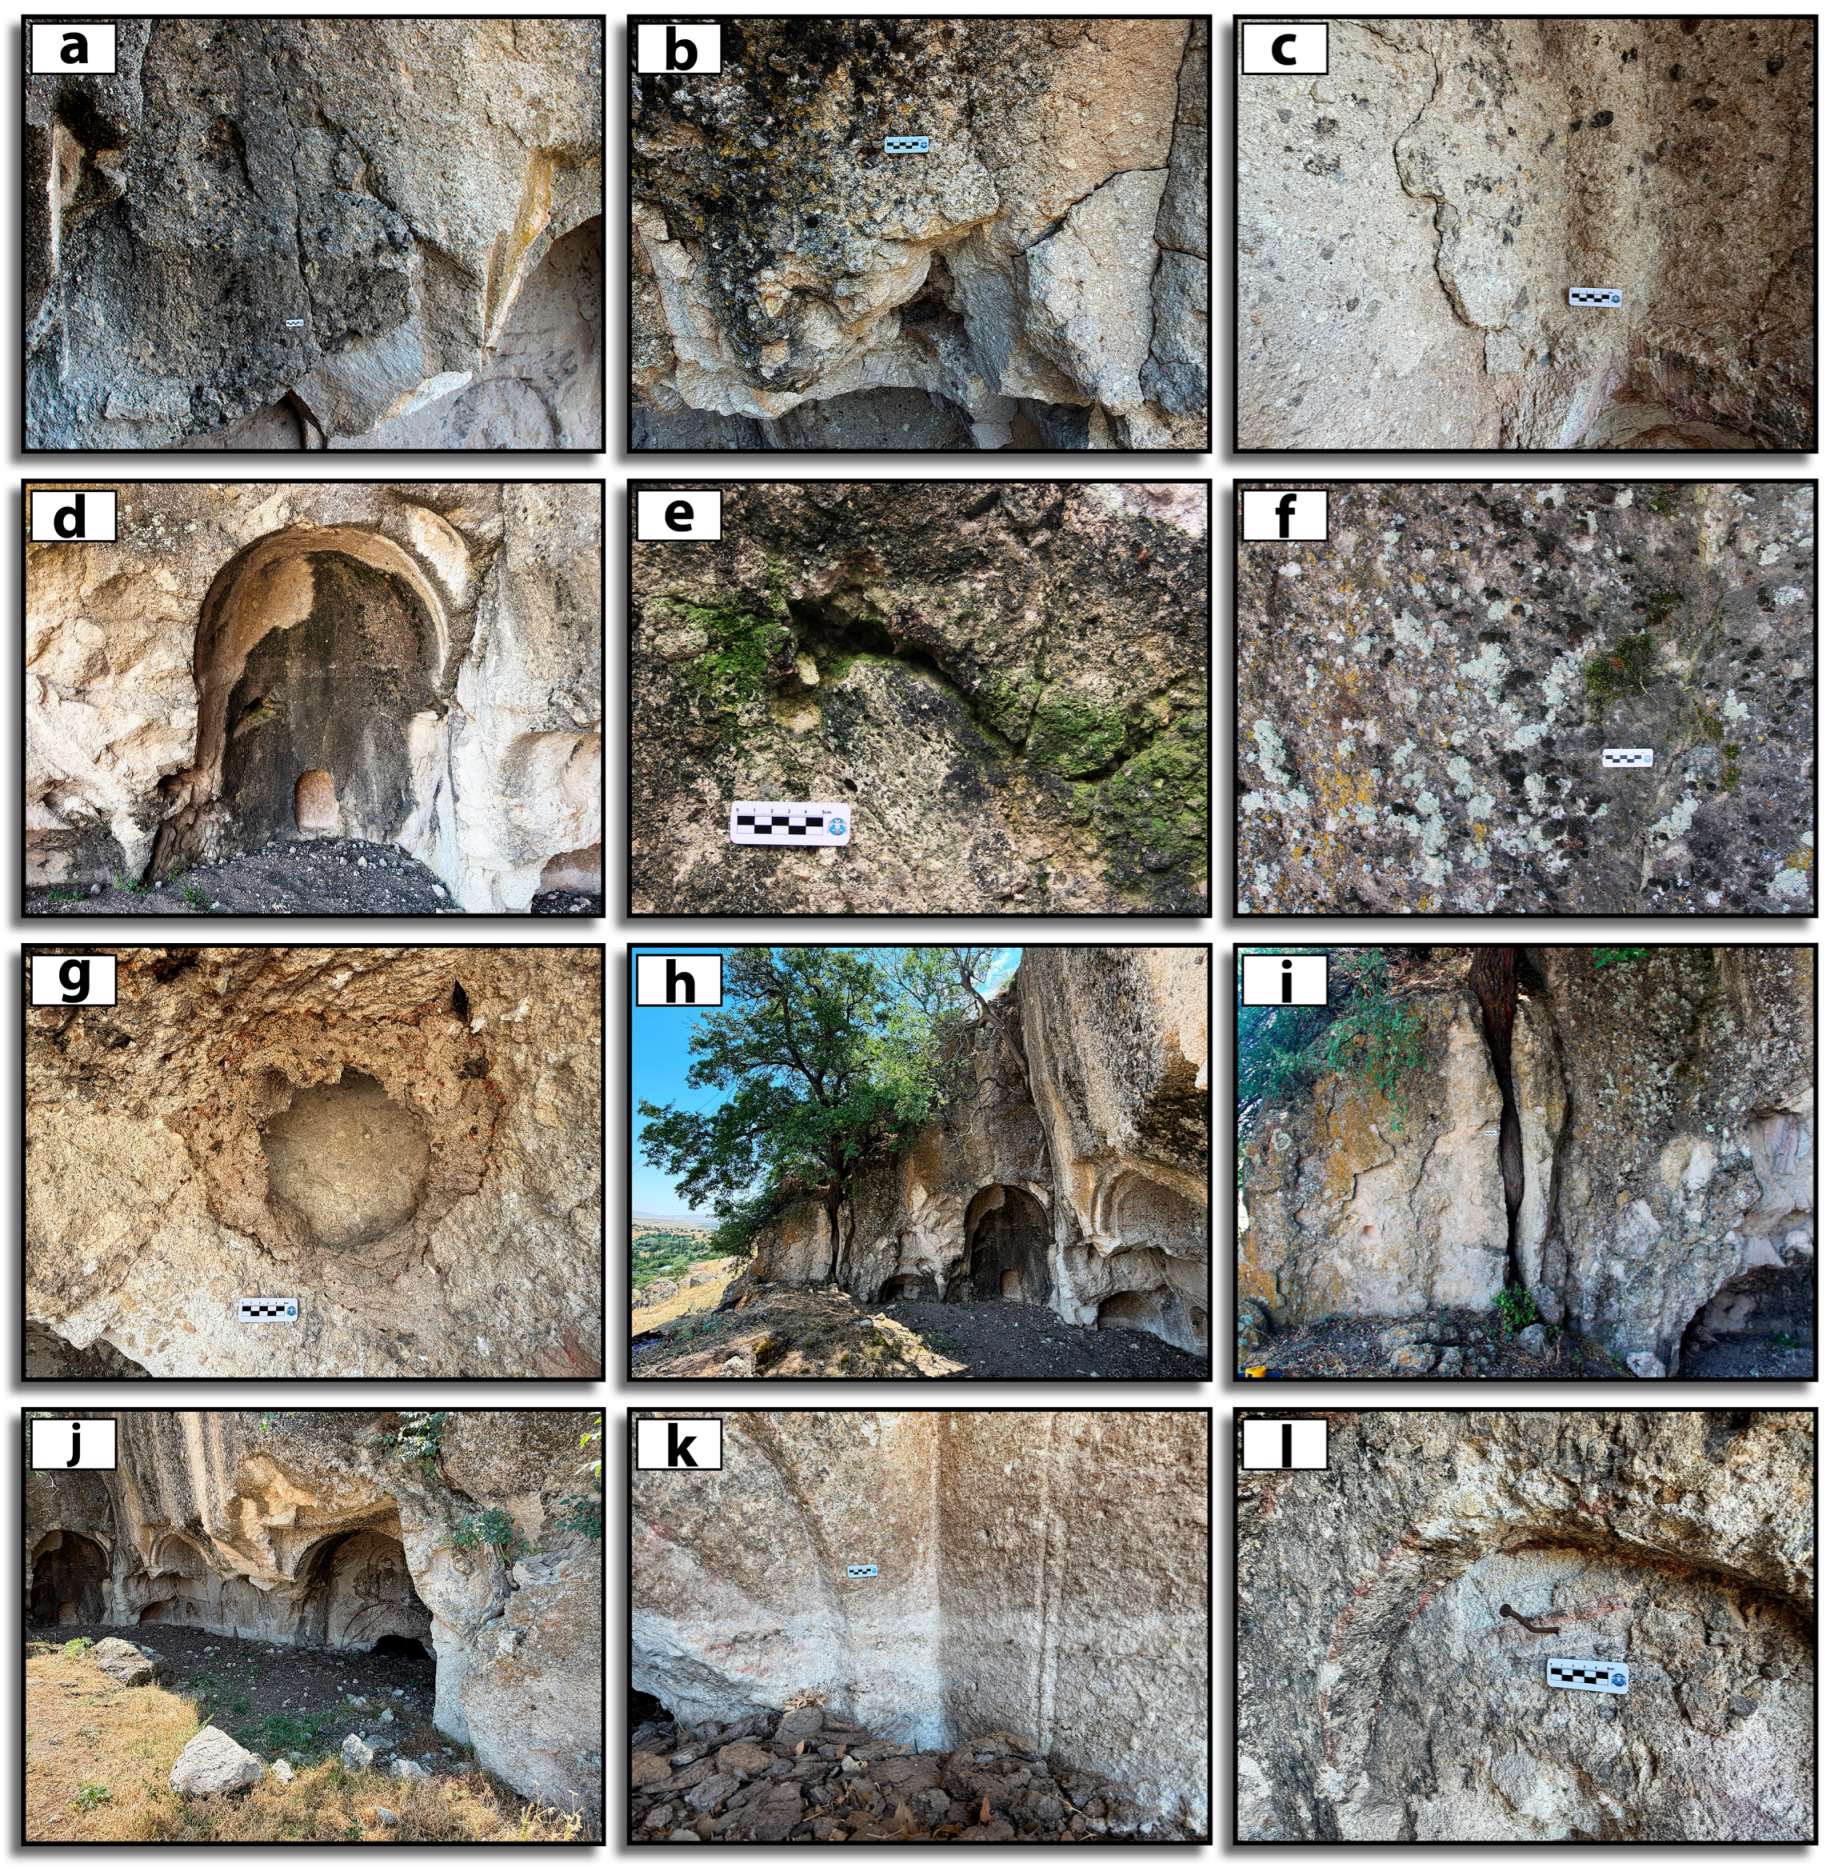
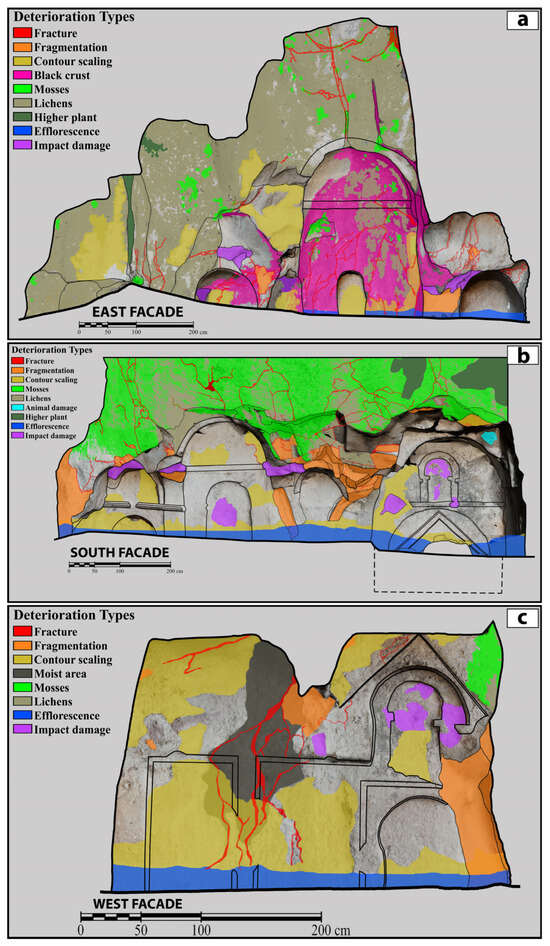
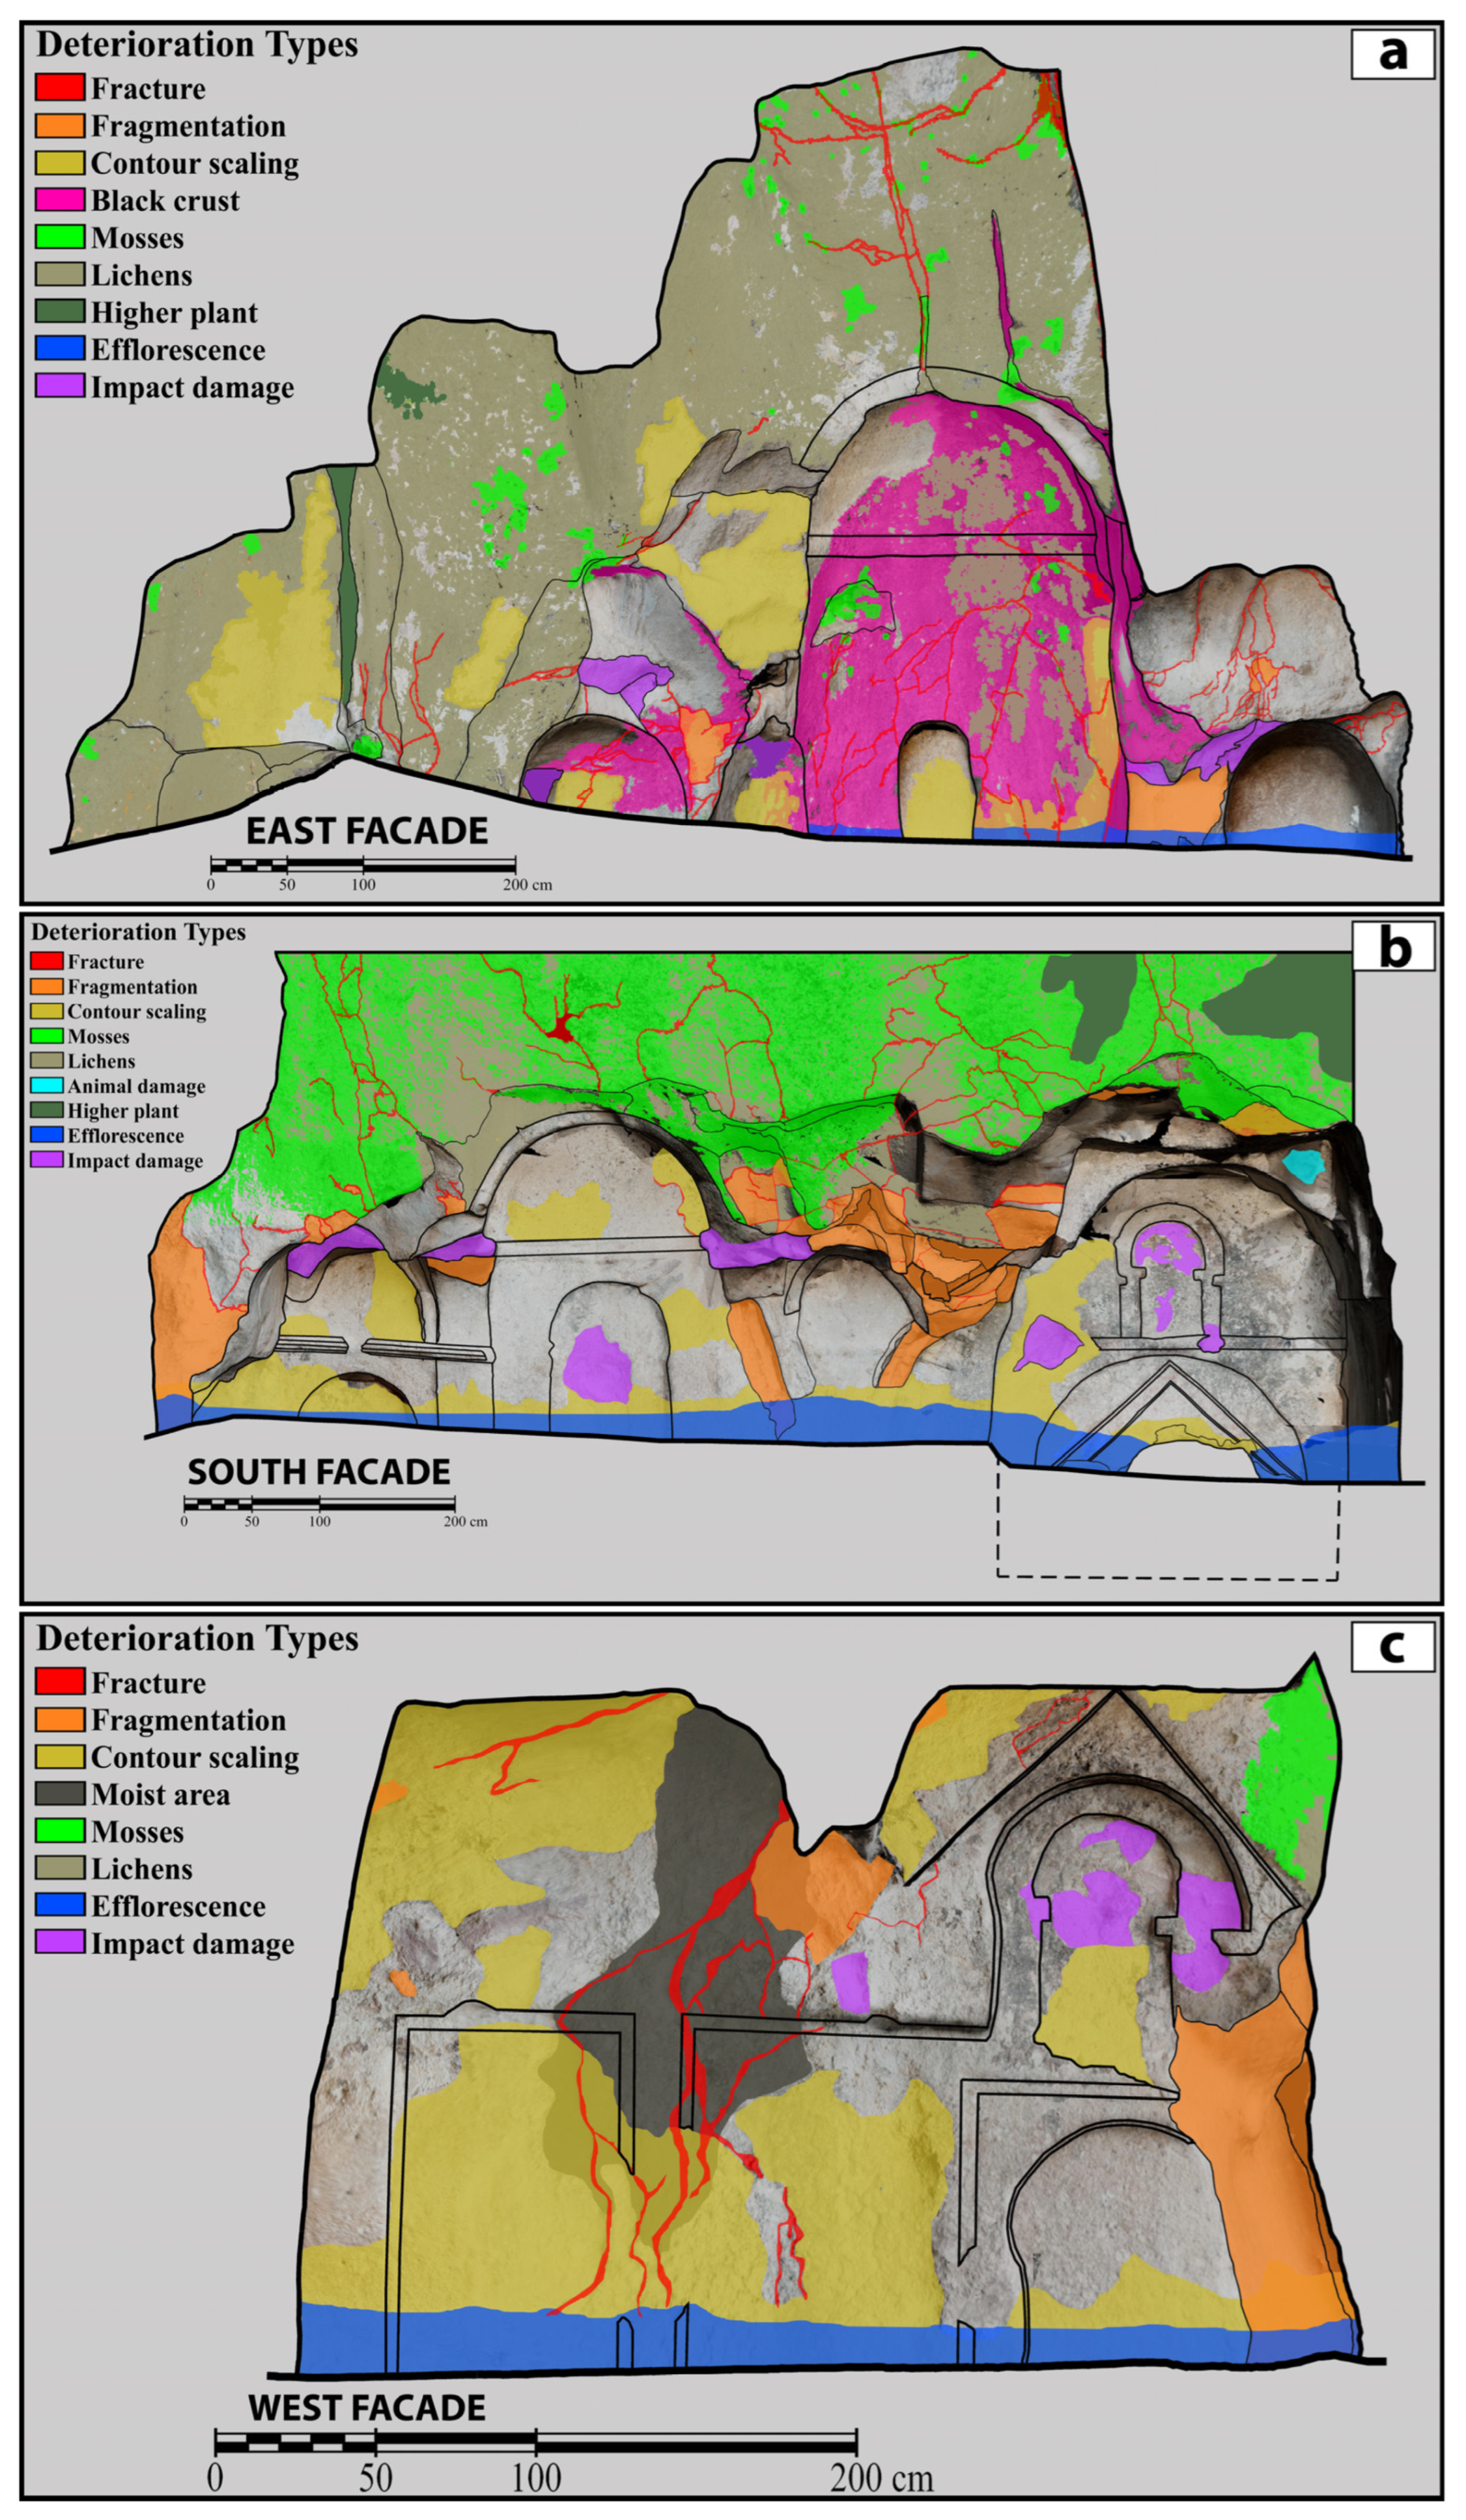
The deterioration types identified on the monument were evaluated in accordance with the classification proposed by ICOMOS-ISCS [30], and the main deterioration types identified are shown in Figure 7. The fractures identified on the monument were classified into two main groups considering their formation mechanisms and development conditions. One group of these fractures is related to the geological characteristics of the rock mass (Figure 7a and Figure 8), while the other group is attributed to atmospheric deterioration processes (Figure 7b and Figure 8). In relation to atmospheric deterioration processes, surface detachments with thicknesses ranging from the millimeter scale to the centimeter scale on the monument surface were classified as contour scaling (Figure 7c and Figure 8). Black crust formation was commonly observed in different parts of the monument, and this type of deterioration was observed to develop most prominently in the apsis area (Figure 7d and Figure 8). Moisture areas and moss were widely observed in association with the geological discontinuities in the monument (Figure 7e,f and Figure 8). In addition, biological colonization was found to be widespread on the exterior surfaces of the monument, and these formations were mainly observed as lichen, moss, and algae growth (Figure 7g and Figure 8). Higher plant growth was observed along the discontinuities (Figure 7h,i and Figure 8). Rock fragments have detached from the monument surface along fractures, locally disrupting the integrity of the monument; this is probably associated with the progression of fractures under atmospheric influences (Figure 7j and Figure 8). Widespread efflorescence formations were identified in the capillary areas above the existing ground level of the monument (Figure 7k and Figure 8). Impact damage effects associated with human activity and interventions were observed in different parts of the monument (Figure 7l and Figure 8).
Figure 7.
Catalog of the monument’s deterioration. (a,b) Fracture; (c) contour-scaling; (d) black crust, (e,f) moisture area and moss; (g) biological colonization (lichen, moss, and algae); (h,i) higher plant; (j) rockfall; (k) efflorescence; and (l) impact damage.
Figure 8.
Deterioration maps showing the distribution of observed deterioration types on the monument’s façades: (a) east façade; (b) south façade; and (c) west façade.
3.4. NDT Variation Maps from In Situ Measurements
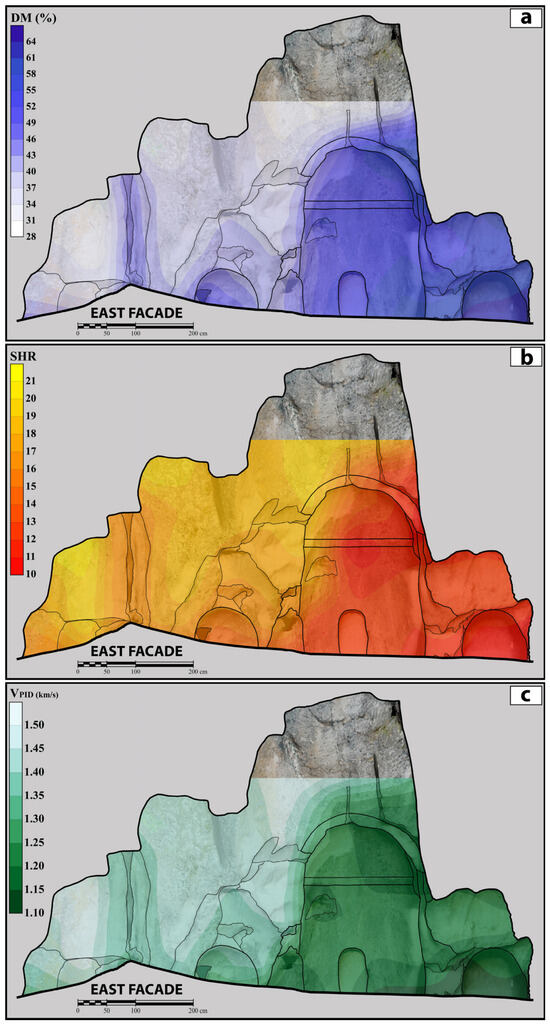
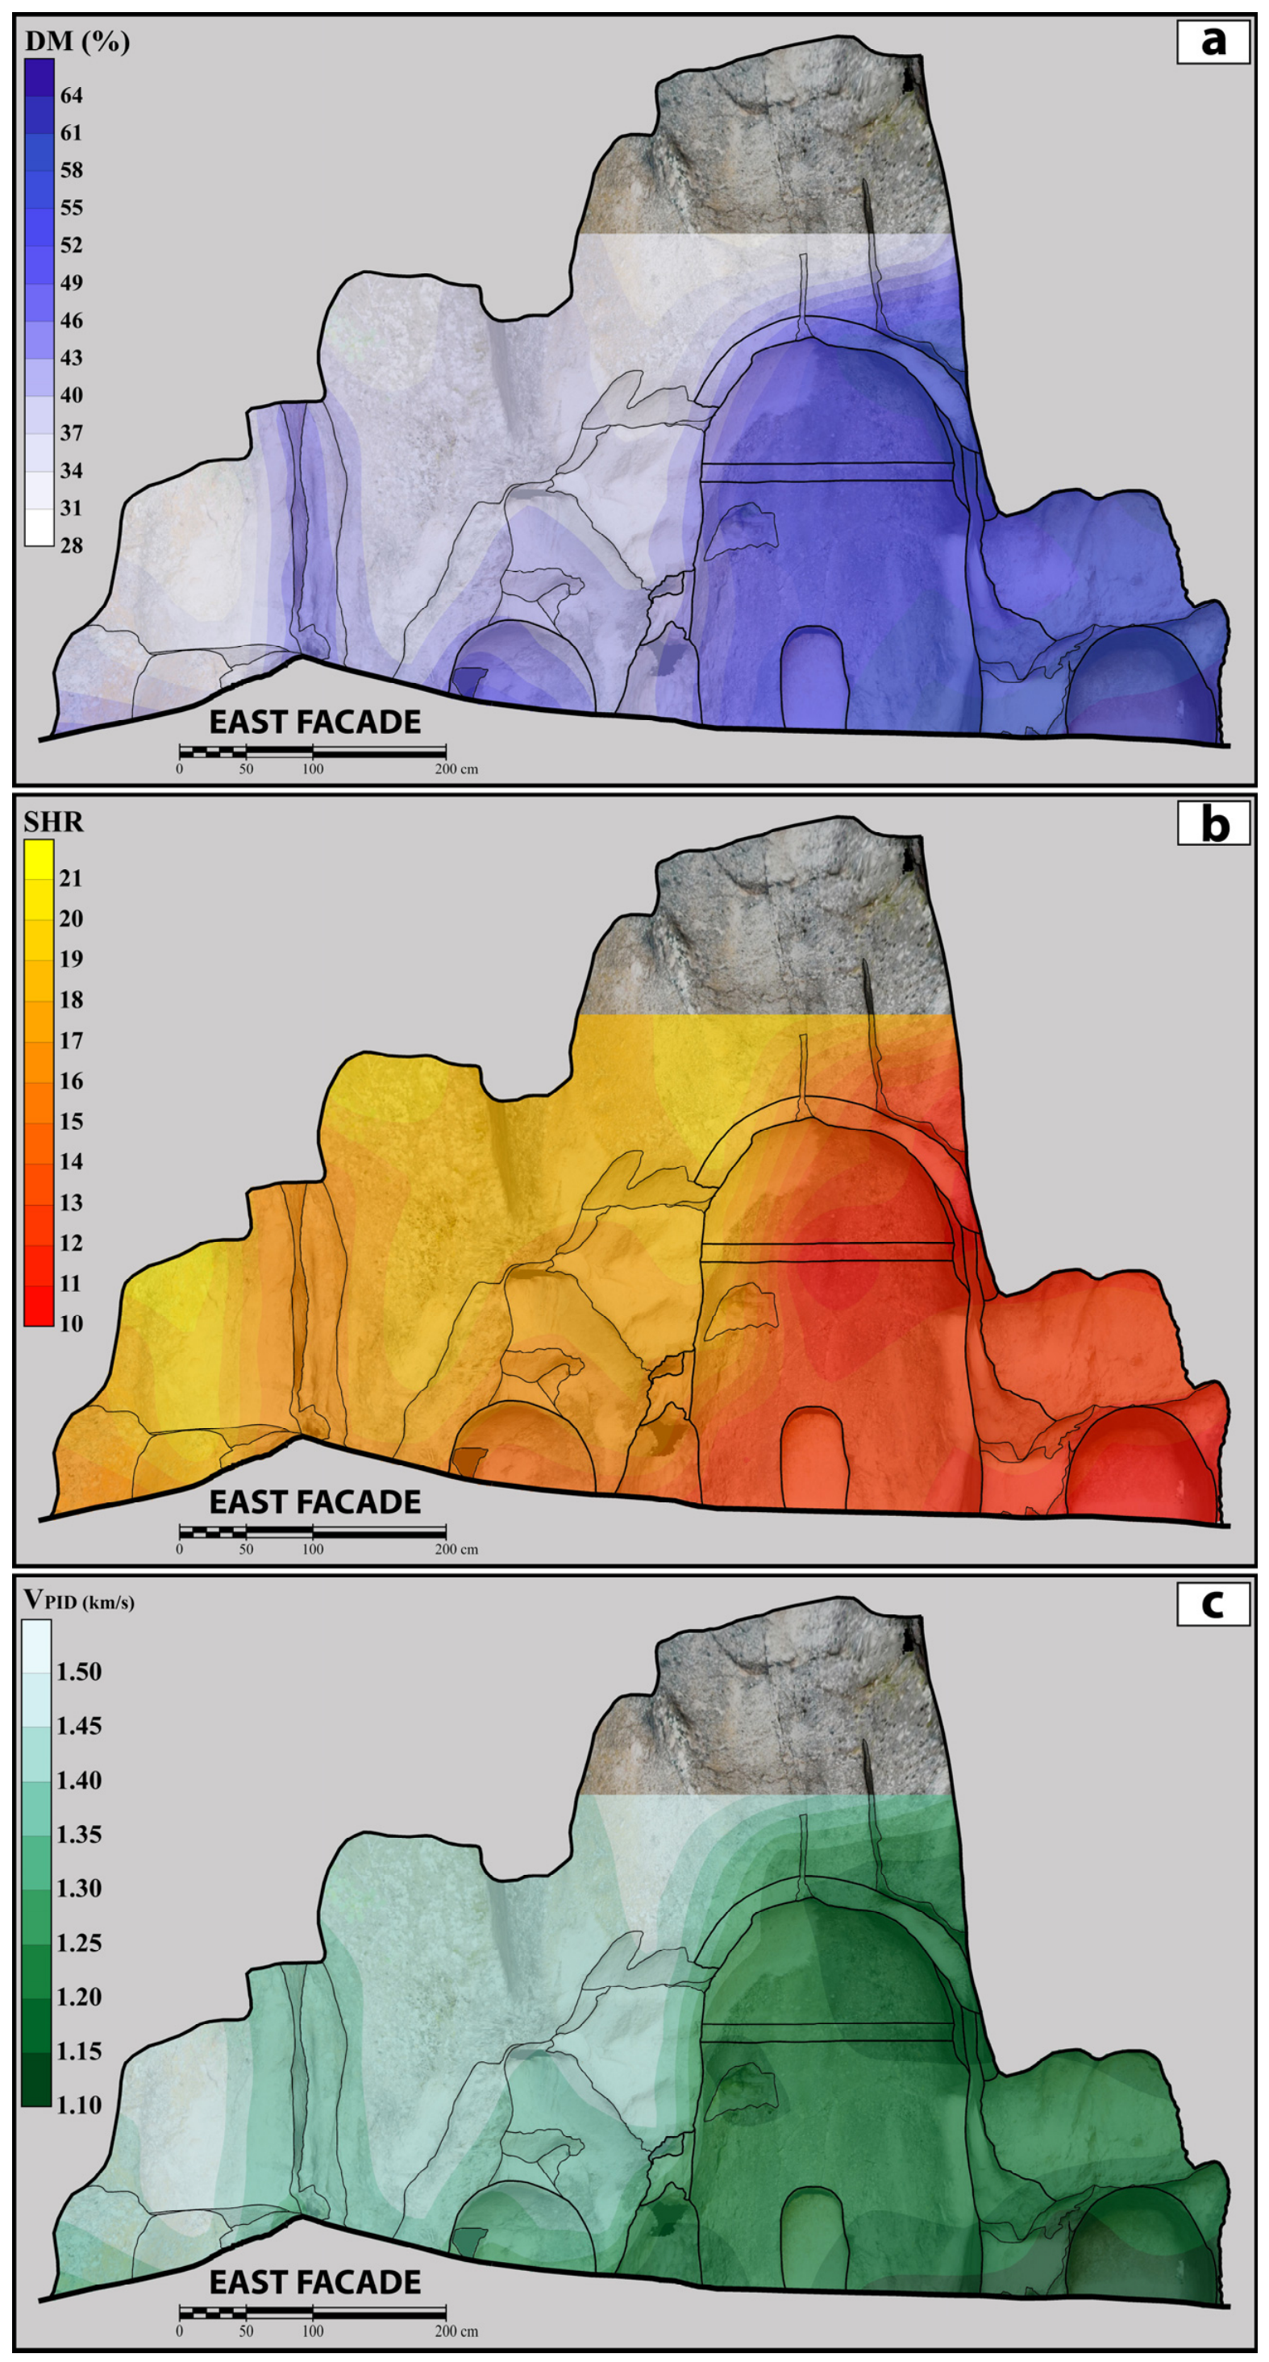
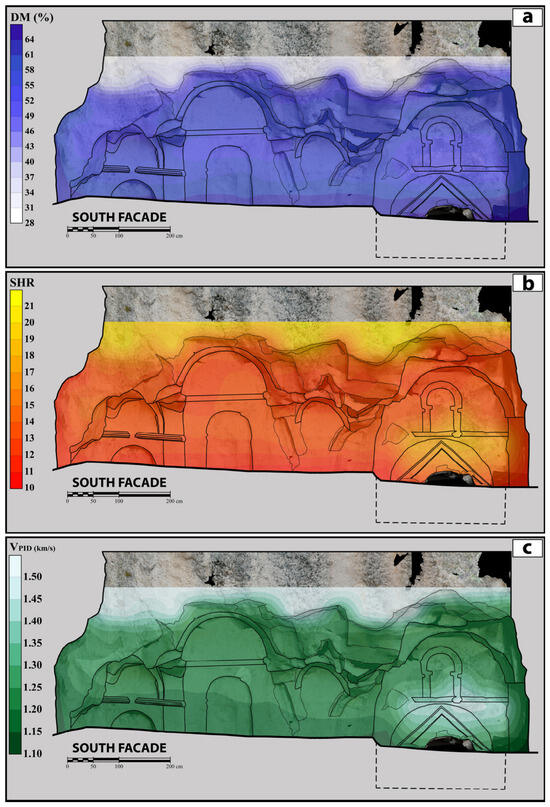
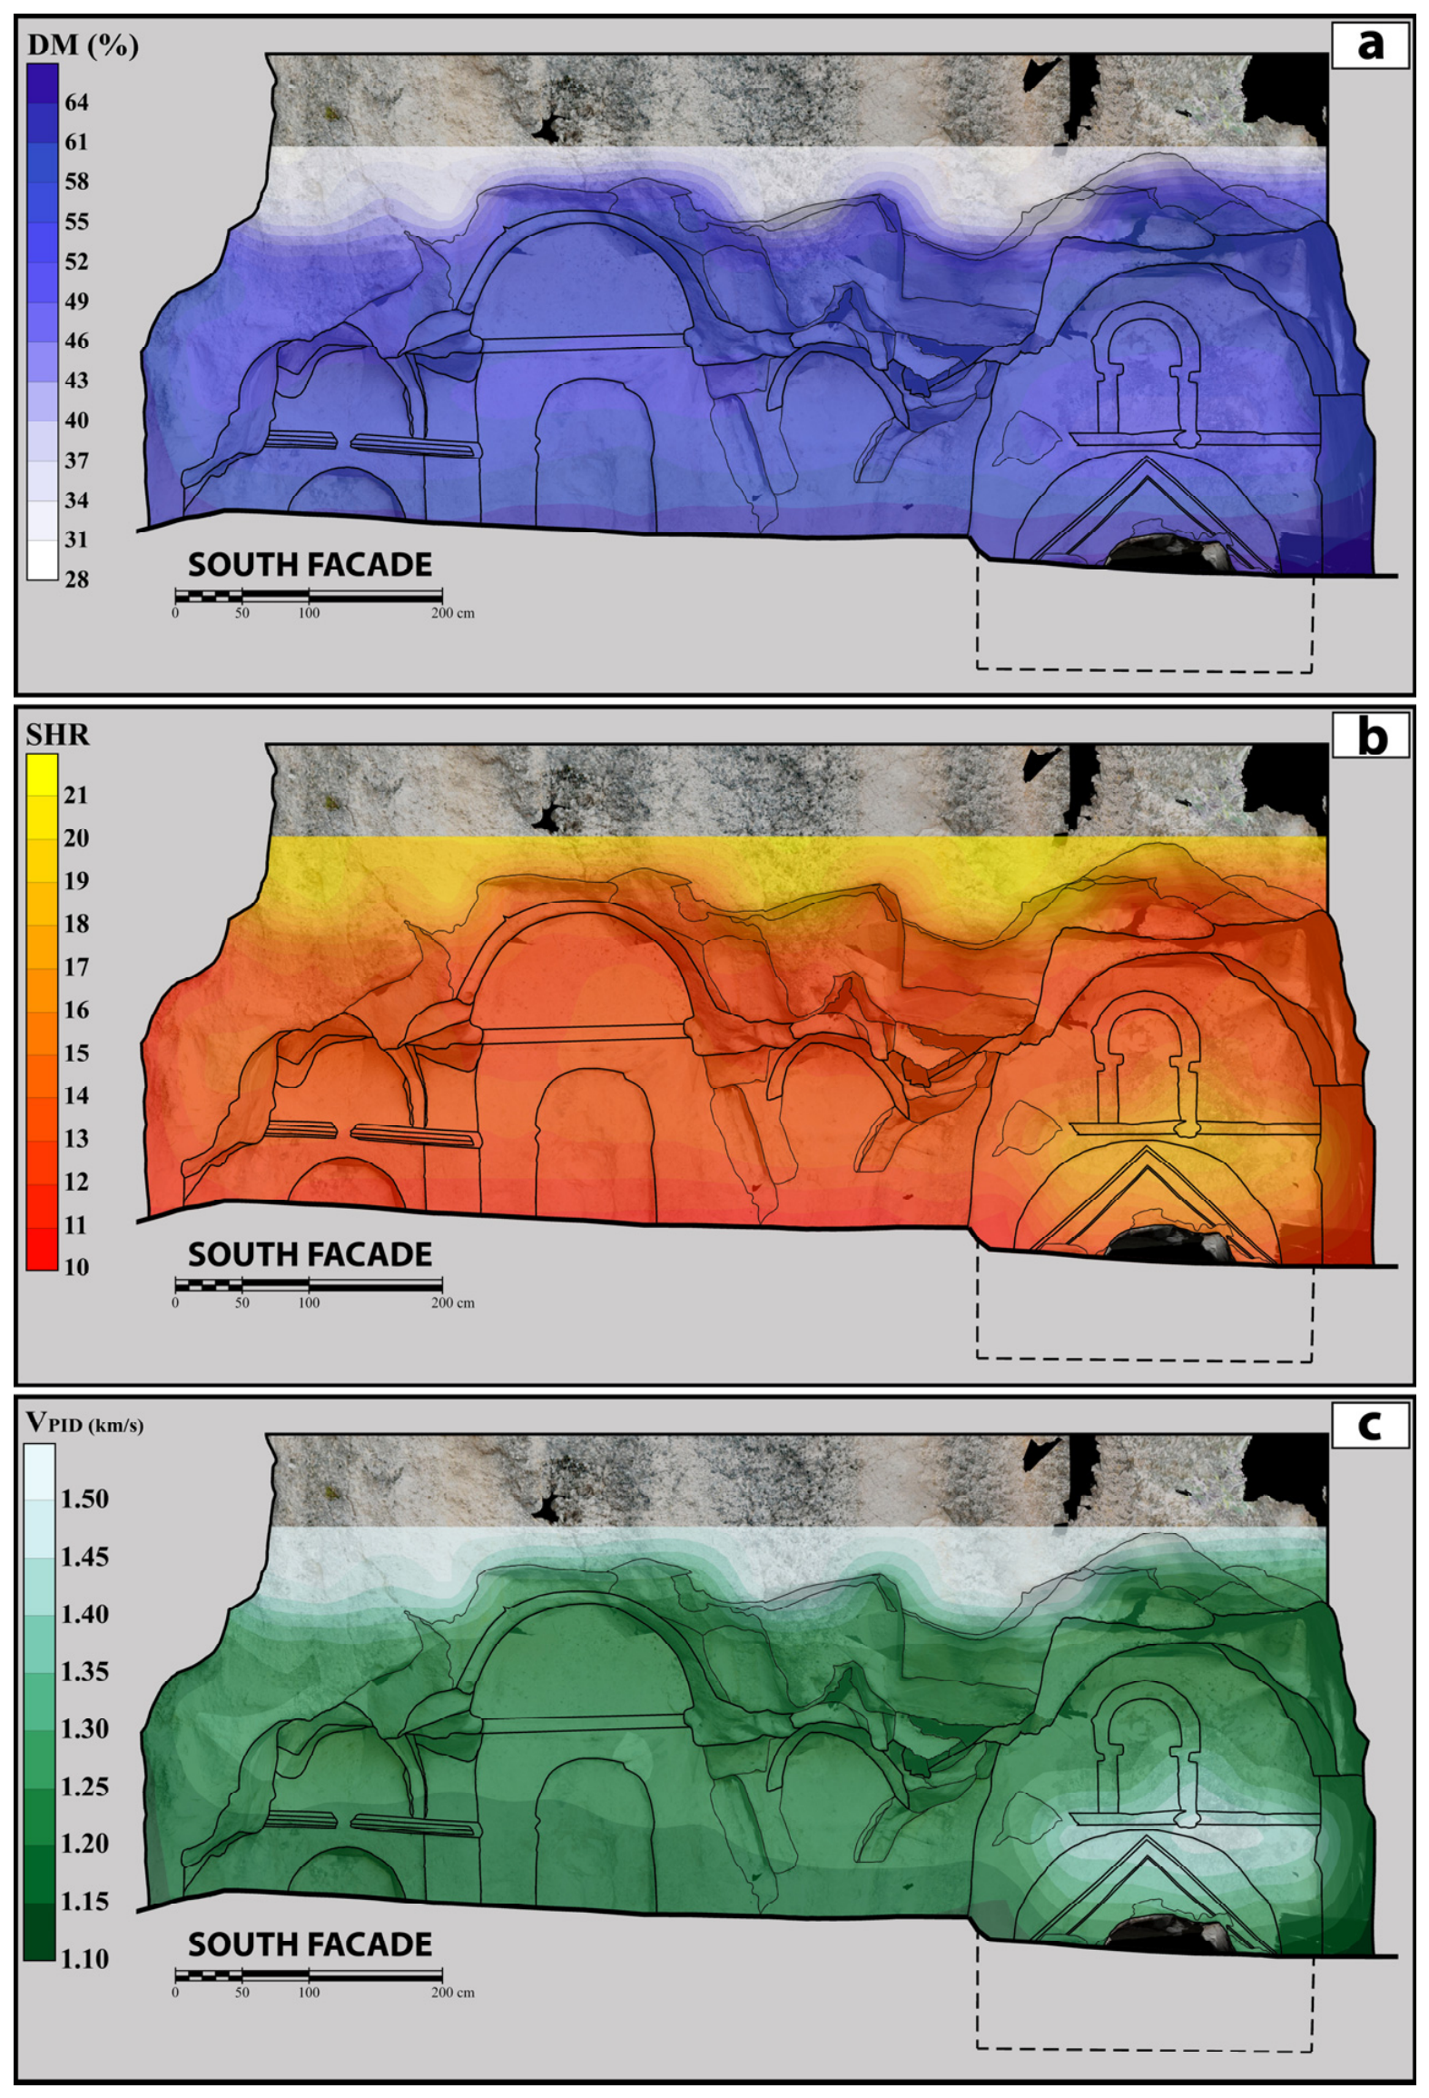
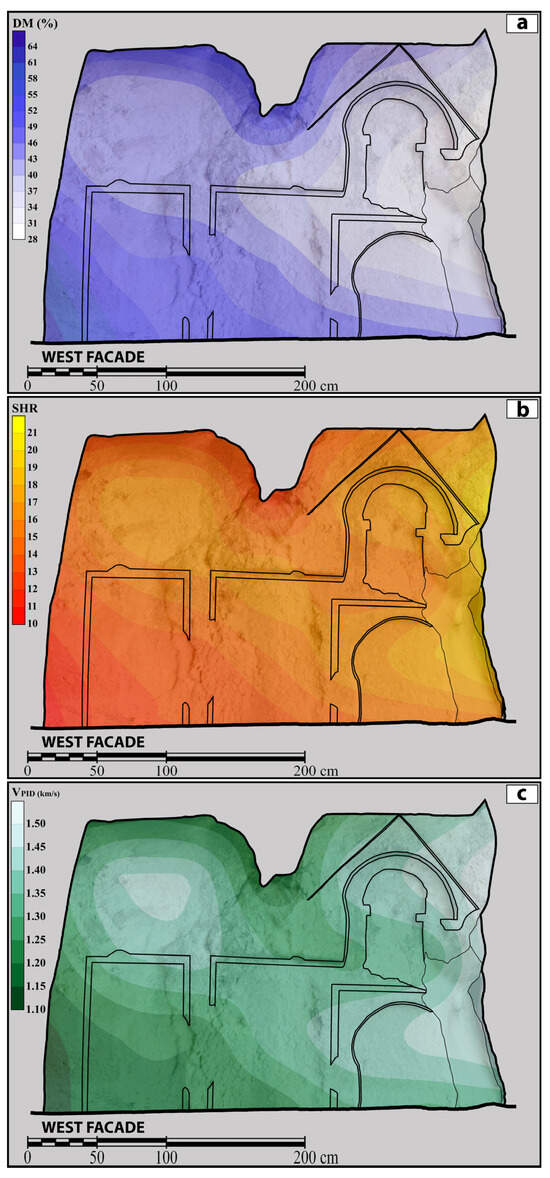
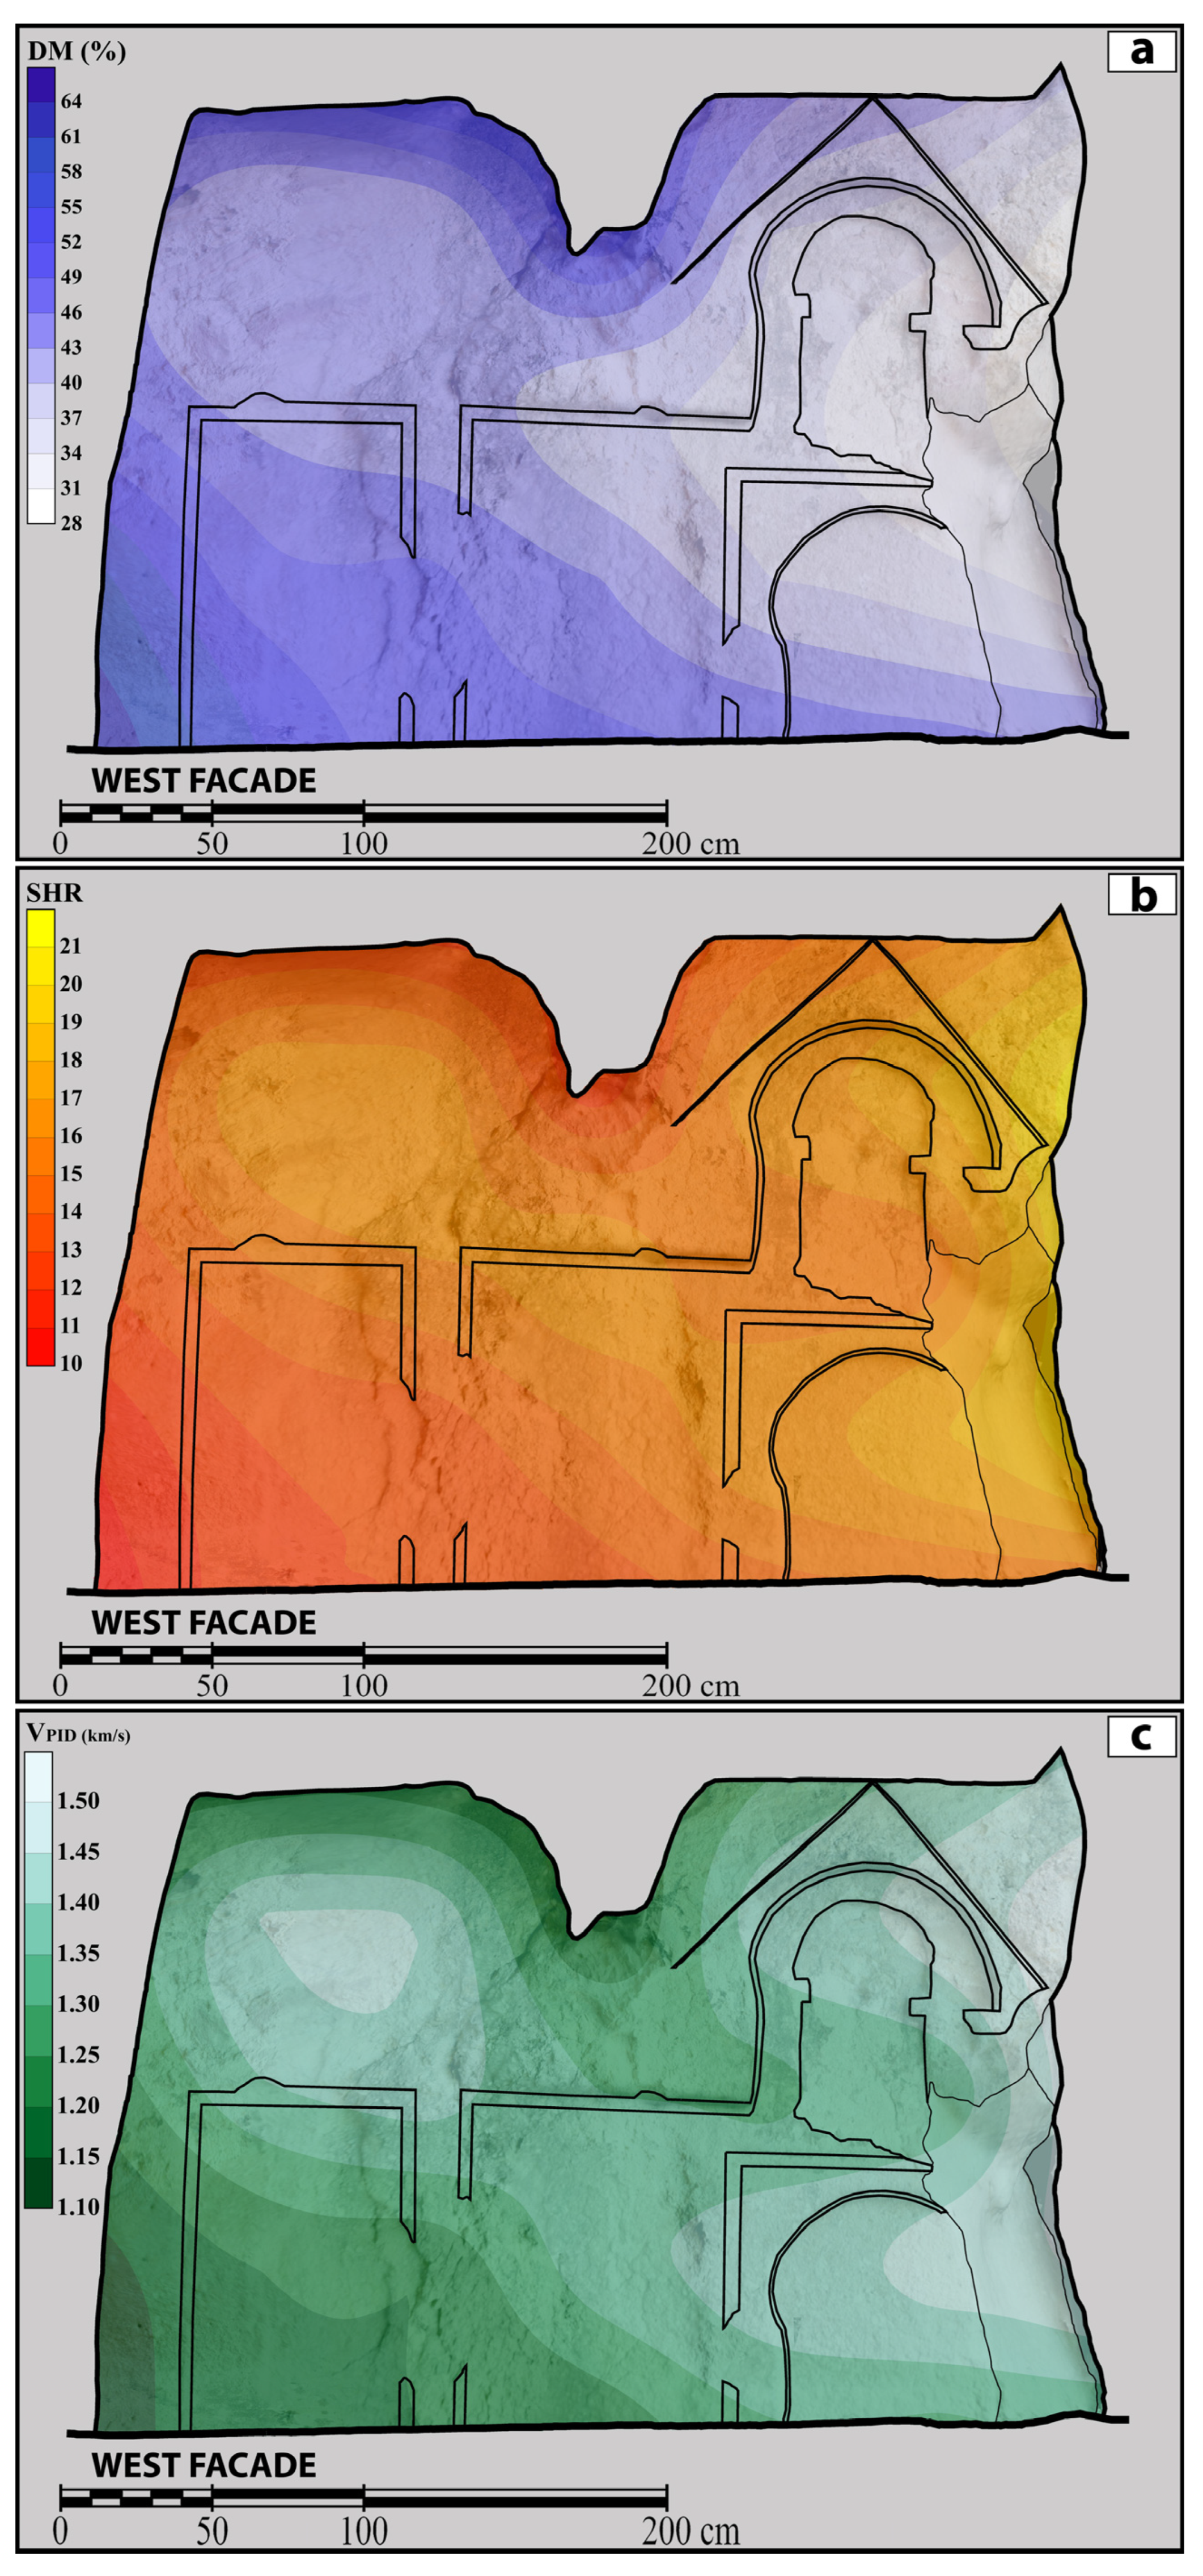
The NDT measurements conducted on the monument were performed under atmospheric conditions in which the air temperature was approximately 30 °C and the relative humidity was 32% before and after the measurements. DM values measured on all façades of the monument (east, west, and south) were determined to range between 28% and 64% (Figure 9a, Figure 10a and Figure 11a). On the eastern façade, the high DM values were spatially associated with tree roots developing along the discontinuity in the northern part of the façade and with the discontinuities in the apsis area. On the southern façade of the monument, the DM values were determined to be generally high in the capillary zone and lower at higher elevations. The lower DM values in the northern part of the western façade may be related to the greater exposure of this open section to solar radiation; however, solar exposure was not measured in this study. The general evaluation of the DM maps revealed that the zones containing high moisture were largely associated with the fractures in the monument.
Figure 9.
NDT variation maps of the eastern façade of the monument. (a) DM; (b) SHR; and (c) VPID.
Figure 10.
NDT variation maps of the south façade of the monument. (a) DM; (b) SHR; and (c) VPID.
Figure 11.
NDT variation maps of the west façade of the monument. (a) DM; (b) SHR; and (c) VPID.
In the SHR measurements conducted on the façades of the monument, the values were determined to range between 10 and 22 (Figure 9b, Figure 10b and Figure 11b). SHR values were low in the capillary zone and fracture areas, where surface deterioration was observed. In addition, pronounced spatial differences in SHR values were observed on both sides of the discontinuities, which may be related to surface deterioration along the discontinuities. Higher SHR values were observed on the surface where the burial chamber (parecclesion) is located on the southern façade of the monument. This may be related to the lower moisture content of this surface and the correspondingly more limited deterioration. Higher SHR values were also measured on relatively fresh surfaces exposed by the detachment of rock fragments. Similarly, the higher SHR values on the convex sections of the monument may reflect limited water retention and lower weathering intensity on these surfaces.
The in situ VPID measurements conducted on the façades into which the monument was carved were determined to range between 1.10 and 1.52 km/s (Figure 9c, Figure 10c and Figure 11c). The VPID and SHR distribution maps were observed to be similar. The low and high values obtained by both methods were determined to be concentrated in largely similar zones on the monument surface. This agreement suggests that both methods respond similarly to variations in surface deterioration and moisture conditions and provide mutually supportive results in the assessment of the current condition of the monument. The in situ SHR (10–22) and VPID (1.10–1.52 km/s) values were generally lower than the laboratory reference ranges (21–26 and 1.63–2.20 km/s, respectively), which is consistent with surface deterioration. However, these differences may also reflect the moisture condition at the time of measurement, differences in surface condition and natural variability within the rock. The low SHR and VPID values in regions where high moisture levels are observed and the spatial overlap of their distributions suggest that moisture conditions may contribute to surface deterioration.
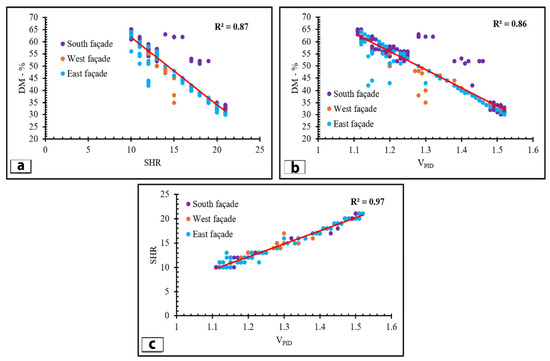
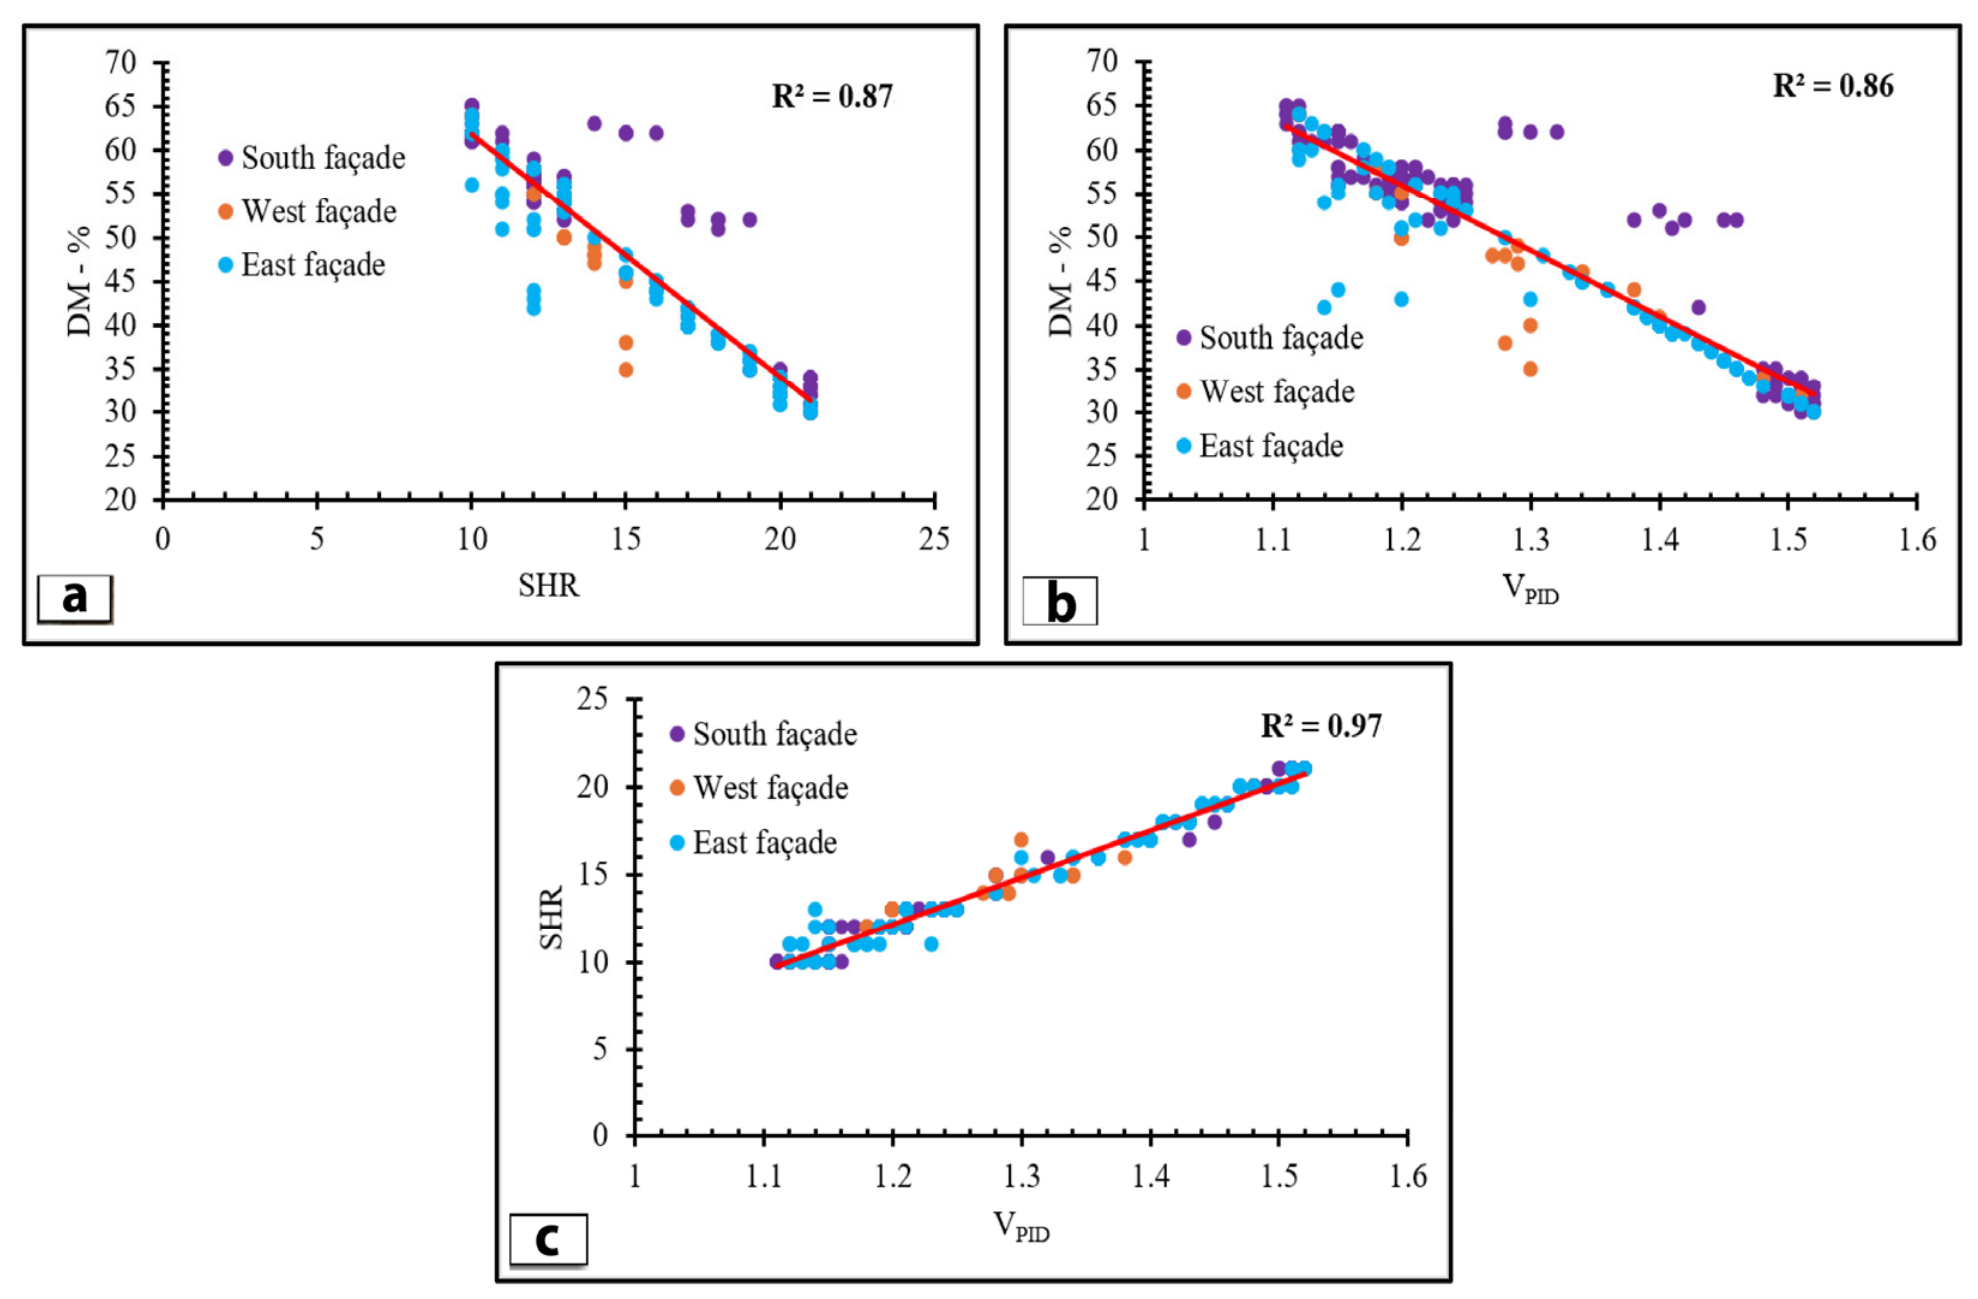
To avoid relying solely on the visual comparison of distribution maps, the DM, SHR, and VPID values corresponding to the identical spatial locations across all façades were evaluated together (Figure 12). The regression analyses were performed using the DM, SHR and VPID values measured at the same grid points (n = 273; west: 32, south: 146, and east: 95). The relationships were fitted by simple linear regression using the ordinary least-squares method. Data from the three façades were pooled because all façades are carved into the same ignimbrite unit and were measured during a single campaign under identical ambient conditions, using the same instruments and procedures. Data points are color-coded by façade in Figure 12. The coefficient of determination (R2) was calculated for the DM–SHR, DM–VPID, and SHR–VPID relationships. The results indicated strong relationships among the NDT parameters. An R2 value of 0.87 was obtained for the relationship between DM and SHR, while R2 values of 0.86 and 0.97 were obtained for the relationships between DM and VPID and between SHR and VPID, respectively. In particular, the high R2 value obtained for the SHR–VPID relationship indicates a high degree of compatibility between the spatial distributions of these two parameters across the façades. These results provide quantitative support for the similarities observed in the distribution maps and enable the relationships among DM, SHR, and VPID to be evaluated on a statistical basis.
Figure 12.
Correlation relationships among the NDT measurements: (a) DM-SHR, (b) DM-VPID, and (c) SHR-VPID.
The spatial comparison of deterioration and NDT maps shows a clear spatial correspondence between observed deterioration types and the physical measurements of the host rock. The spatial alignment between deterioration types and NDT results suggests that the observed damage is not randomly distributed but is spatially associated with variations in moisture conditions and mechanical properties. This is consistent with the interpretation that a moisture-related reduction in mechanical strength, together with the susceptibility of the pyroclastic rock to weathering, may contribute to the development of the observed deterioration features. Accordingly, NDT maps provide quantitative support for visual deterioration assessment and assist in identifying zones that may require priority monitoring and conservation intervention.
One of the main limitations of this study is that the in situ measurements were conducted during a single field survey. Therefore, the observed relationships should be interpreted as spatial associations rather than as definitive evidence of temporal or causal processes. Additional time-dependent in situ monitoring is required to assess and validate the potential effects of moisture, solar exposure, capillary movement, and other environmental factors on deterioration processes.
The deterioration processes of cultural heritage structures constructed from low-strength rocks can be significantly influenced by environmental conditions, particularly moisture fluctuations and seasonal wetting–drying cycles. In this context, the interpretation of in situ NDT results requires careful consideration of the moisture condition of the rock. Frodella et al. [41], in their study of the Vardzia rock-carved cultural heritage site in Georgia, demonstrated that areas of deterioration associated with moisture and seepage in tuff could be effectively identified by integrating infrared thermography, UAV-based digital photogrammetry, and conventional field investigations. Their findings emphasized the importance of considering moisture distribution when assessing deterioration processes and conservation conditions of rock-carved cultural heritage sites. Similarly, Özer et al. [19], who investigated two structures excavated into low-strength rocks at the ancient site of Kilistra, demonstrated that SHR and P-wave velocity measurements were sensitive to the presence of water within the rock mass. Therefore, the researchers emphasized that NDT measurements obtained during relatively dry periods more reliably reflect the mechanical condition of the rock. They also reported that the high moisture levels during the winter months may contribute to the deterioration process and that appropriate preventive measures should be implemented to mitigate the potential effects of seasonal moisture accumulation. These findings are particularly relevant to the interpretation of the results of the present study. The variations observed in SHR and VPID values within the investigated monumental structure should not necessarily be interpreted as evidence of irreversible material deterioration, as part of the measured variability may be attributable to differences in moisture conditions. In contrast, the persistent observation of consistently low values under comparable moisture conditions may provide stronger evidence of low material strength and progressive deterioration. Therefore, evaluating SHR and VPID data in conjunction with moisture measurements and visual observations may provide a more reliable basis for distinguishing short-term environmentally induced variations from long-term deterioration processes. The consistency between the present observations and the findings reported in the study conducted at Kilistra further supports the importance of considering seasonal moisture conditions when assessing the conservation state of low-strength pyroclastic rocks into which stone cultural heritage structures have been carved.
4. Conclusions
The main findings of this study, which characterizes the physical, mechanical, and excavatability properties of the rock housing Kayadibi Church No. 2 (Konya, Türkiye); classifies its deterioration types; and maps its NDT variations (VPID, SHR, and DM), are summarized below:
- •
- The monument is carved into a vitric tuff unit consisting of crystals, rock fragments, volcanic glass, and medium- to coarse-grained pumice components, with an average dry density of 1.46 g/cm3, porosity of 22.69%, water absorption by weight of 15.55%, and direct P-wave velocity of 2.41 km/s.
- •
- The intact rock material yielded PR and CR values of 1.262 mm/s and 1.190 mm/s, respectively. Combined with its very low density, very high porosity, and low SHR, these properties indicate that the intact rock material is easily excavatable with low excavation resistance.
- •
- Following the ICOMOS-ISCS classification, the observed deteriorations on the monument include fractures, contour scaling, black crusts, moisture areas, biological colonization (lichens, mosses, algae, and higher plants), efflorescence, and impact damage.
- •
- DM values range between 28% and 64%, with high moisture concentrations localized primarily in fractured zones.
- •
- SHR values span from 10 to 22, associated mainly with the degree of surface deterioration and moisture conditions.
- •
- In situ VPID measurements range between 1.10 and 1.52 km/s, showing a general spatial consistency with the SHR maps.
- •
- Strong linear relationships were found between DM and SHR (R2 = 0.87), DM and VPID (R2 = 0.86), and SHR and VPID (R2 = 0.97) (n = 273).
As the measurements were performed in a single field campaign, the observed relationships represent spatial associations, and seasonal monitoring is recommended. Considering that the monument is carved into low-strength pyroclastic rocks, controlling water seepage and minimizing its adverse effects on the rock surfaces are fundamental requirements for the long-term preservation for future generations. The spatial overlap observed between high moisture levels and areas with lower SHR and VPID values highlights the importance of mitigating moisture ingress and preventing prolonged water-rock interaction.
Author Contributions
M.B.T.: conceptualization, methodology, investigation, data curation, formal analysis, validation, visualization, writing—original draft preparation, and writing—review and editing. E.K.: methodology, formal analysis, validation, and resources. M.C.B.: investigation, data curation, visualization, and writing—review and editing. İ.İ.: methodology, investigation, data curation, visualization, and resources. All authors have read and agreed to the published version of the manuscript.
Funding
This research received no external funding.
Data Availability Statement
The original contributions presented in this study are included in the article. Further inquiries can be directed to the corresponding author.
Conflicts of Interest
The authors declare no conflicts of interest.
Abbreviations
The following abbreviations are used in this manuscript:
| CR | Cutting Rate |
| DM | Deep Moisture |
| ICOMOS-ISCS | International Council on Monuments and Sites, International Scientific Committee for Stone |
| LiDAR | Light Detection and Ranging |
| NDT | Non-Destructive Testing |
| PR | Penetration Rate |
| SHR | Schmidt Hammer Rebound |
| Vp | P-wave Velocity |
| VPD | Direct P-wave Velocity |
| VPID | Indirect P-wave Velocity |
References
- Michette, M.; Bichlmair, S.; Kilian, R. Diagnosing Decay Mechanisms at the Porta Nocera Necropolis, Pompeii: The First Step Towards Effective Preventive Conservation. Stud. Conserv. 2018, 63, 195–202. [Google Scholar] [CrossRef] [Scilit]
- Wang, F.; Huan, J.; Fu, Y. Convolutional Neural Network-Based Multimodal Image Information Fusion for Moisture Damage Assessment of Cultural Heritage Buildings. Measurement 2025, 242, 115972. [Google Scholar] [CrossRef] [Scilit]
- Mol, L.; Viles, H.A. Geoelectric Investigations into Sandstone Moisture Regimes: Implications for Rock Weathering and the Deterioration of San Rock Art in the Golden Gate Reserve, South Africa. Geomorphology 2010, 118, 280–287. [Google Scholar] [CrossRef] [Scilit]
- Hatır, M.E.; Korkanç, M.; Başar, M.E. Evaluating the Deterioration Effects of Building Stones Using NDT: The Küçükköy Church, Cappadocia Region, Central Turkey. Bull. Eng. Geol. Environ. 2019, 78, 3465–3478. [Google Scholar] [CrossRef] [Scilit]
- Michette, M.; Viles, H.; Vlachou, C.; Angus, I. Bellweathered: Reigate Stone Decay Mechanisms at the Bell Tower, Tower of London. In Monuments in Monuments 2019; Hyslop, E., Gerdwilker, C., Gonzalez, V., Eds.; Historic Environment Scotland: Edinburgh, UK, 2019; pp. 53–64. [Google Scholar]
- İnce, İ.; Korkanç, M.; Hatır, M.E. Evaluation of Weathering Effects Due to Surface and Deep Moisture in a Roman Rock Tomb: Lukianos Monument Konya (Turkey). Mediterr. Archaeol. Archaeom. 2020, 20, 121–133. [Google Scholar] [CrossRef]
- Michette, M. Integrating Non-Destructive Techniques into the Scientifically Robust Assessment of Vulnerable Historic Masonry: Case Studies on Reigate Stone. J. Build. Surv. Apprais. Valuat. 2021, 10, 242–256. [Google Scholar] [CrossRef] [Scilit]
- Michette, M.; Viles, H.; Vlachou, C.; Angus, I. In Situ, Non-Destructive Testing for Evaluating the Role of Pointing Mortar in Preventive Conservation Strategies: A Case-Study on Reigate Stone at the Wardrobe Tower, Tower of London. Minerals 2021, 11, 345. [Google Scholar] [CrossRef] [Scilit]
- Ksit, B.; Szymczak-Graczyk, A.; Nazarewicz, B. Diagnostics and Renovation of Moisture Affected Historic Buildings. Civ. Environ. Eng. Rep. 2022, 32, 59–73. [Google Scholar] [CrossRef] [Scilit]
- Hatır, M.E.; İnce, İ.; Bozkurt, F. Investigation of the Effect of Microclimatic Environment in Historical Buildings via Infrared Thermography. J. Build. Eng. 2022, 57, 104916. [Google Scholar] [CrossRef] [Scilit]
- Gineiko, A.; Kiviste, M. Strength- and Moisture-Related Studies of Historical Building Materials: A Case Study from Southern Estonia. Buildings 2024, 14, 3565. [Google Scholar] [CrossRef] [Scilit]
- Balci, M.C. Evaluation of Deterioration in Cultural Stone Heritage Using Non-Destructive Testing Techniques: The Case of Emir Ali Tomb (Ahlat, Bitlis, Türkiye). Appl. Sci. 2025, 15, 10404. [Google Scholar] [CrossRef] [Scilit]
- Kamh, G.M.E.; Koltuk, S. Micro-topographic and geotechnical investigations of sandstone wall on weathering progress, Aachen City, Germany, case study. Arab. J. Sci. Eng. 2016, 41, 2285–2294. [Google Scholar] [CrossRef] [Scilit]
- Kamh, G.M.E.; Koltuk, S.; Ismael, H. Refinement of categorization and scaling of weathering-related damage to natural stone: Case study on oolitic limestone from El-Shatbi Tombs (Egypt). Bull. Eng. Geol. Environ. 2017, 76, 39–57. [Google Scholar] [CrossRef] [Scilit]
- Zhang, J.; Huang, J.; Liu, J.; Jiang, S.; Li, L.; Shao, M. Surface weathering characteristics and degree of Niche of Sakyamuni Entering Nirvana at Dazu Rock Carvings, China. Bull. Eng. Geol. Environ. 2019, 78, 3891–3899. [Google Scholar] [CrossRef] [Scilit]
- Korkanç, M.; İnce, İ.; Hatır, M.E.; Tosunlar, M.B. Atmospheric and Anthropogenic Deterioration of the İvriz Rock Monument: Ereğli-Konya, Central Anatolia, Turkey. Bull. Eng. Geol. Environ. 2021, 80, 3053–3063. [Google Scholar] [CrossRef] [Scilit]
- Patil, S.M.; Kasthurba, A.K.; Patil, M.V. Characterization and assessment of stone deterioration on heritage buildings. Case Stud. Constr. Mater. 2021, 15, e00696. [Google Scholar] [CrossRef] [Scilit]
- Freire-Lista, D.M.; Gonçalves, G.V.; Vazquez, P. Weathering detection of granite from three asynchronous historical quarries of Sabrosa municipally (North Portugal). J. Cult. Herit. 2022, 58, 199–208. [Google Scholar] [CrossRef] [Scilit]
- Özer, F.; Söylemez, M.; İnce, İ.; Günaydın, O. Detection of Deteriorations in Cultural Structures Created by Carving into Low-Strength Rocks by the Non-Destructive Test (NDT) Method. Front. Archit. Res. 2023, 12, 788–802. [Google Scholar] [CrossRef] [Scilit]
- Mammoliti, E.; Cupido, M.; Teloni, R.; Tittarelli, F.; Giuli, G.; Paris, E.; Farabollini, P.; Santini, S. Implementation of a non-destructive method to assess weathering deterioration of sandstones in cultural heritage. Bull. Eng. Geol. Environ. 2024, 83, 110. [Google Scholar] [CrossRef] [Scilit]
- Uçkan, Y.; Mimiroğlu, İ.M. Konya Kayadibi Köyünde Bulunan İki Kaya Oyma Kilise. In Proceedings of the IX. Ortaçağ ve Türk Dönemi Kazıları ve Sanat Tarihi Araştırmaları Sempozyumu, Erzurum, Türkiye, 21–23 April 2005; pp. 353–359. [Google Scholar]
- TS EN 1936; Natural Stone Test Methods: Determination of Real Density and Apparent Density and of Total and Open Porosity. Turkish Standards Institution: Ankara, Türkiye, 2010.
- ASTM E494; Standard Practice for Measuring Ultrasonic Velocity in Materials. ASTM International: West Conshohocken, PA, USA, 2010.
- Ersoy, A.; Atici, U. Performance characteristics of circular diamond saws in cutting different types of rocks. Diam. Relat. Mater. 2004, 13, 22–37. [Google Scholar] [CrossRef] [Scilit]
- Hawkins, A.B.; Ulusay, R.; Hudson, J.A. The Complete ISRM Suggested Methods for Rock Characterisation, Testing and Monitoring. Bull. Eng. Geol. Environ. 2009, 68, 287–288. [Google Scholar] [CrossRef] [Scilit]
- Bilim, N.; Karakaya, E. Penetration Rate Prediction Models for Core Drilling. Min. Metall. Explor. 2021, 38, 359–366. [Google Scholar] [CrossRef] [Scilit]
- Sakız, U.; Aydın, H.; Yaralı, O. Investigation of the rock drilling performance of rotary core drilling. Bull. Eng. Geol. Environ. 2022, 81, 24. [Google Scholar] [CrossRef] [Scilit]
- TS EN 12407; Natural Stone Test Methods: Petrographic Examination. Turkish Standards Institution: Ankara, Türkiye, 2019.
- ASTM D5873; Standard Test Method for Determination of Rock Hardness by Rebound Hammer Method. ASTM International: West Conshohocken, PA, USA, 2014.
- ICOMOS-ISCS. Illustrated Glossary on Stone Deterioration Patterns; International Council on Monuments and Sites, International Scientific Committee for Stone: Champigny/Marne, France, 2008. [Google Scholar]
- Autodesk Inc. AutoCAD Architecture 2026, version 25.1; Autodesk Inc.: San Francisco, CA, USA, 2025.
- Golden Software, L.L.C. Surfer, version 13; Golden Software, L.L.C.: Golden, CO, USA, 2016.
- Bozdağ, A.; Bayram, A.F.; İnce, İ.; Asan, K. The relationship between weathering and welding degree of pyroclastic rocks in the Kilistra ancient city, Konya (Central Anatolia, Turkey). J. Afr. Earth Sci. 2016, 123, 1–9. [Google Scholar] [CrossRef] [Scilit]
- Keller, J.; Jung, D.; Burgath, K.; Wolff, F. Geologie und Petrologie des Neogenen Kalkalkali-Vulkanismus von Konya (Erenler Dağ-Alaca Dağ-Massiv, Zentral-Anatolien). Geol. Jb. 1977, B25, 37–117. [Google Scholar]
- Schmid, R. Descriptive Nomenclature and Classification of Pyroclastic Deposits and Fragments: Recommendations of the IUGS Subcommission on the Systematics of Igneous Rocks. Geol. Rundsch. 1981, 70, 794–799. [Google Scholar] [CrossRef] [Scilit]
- NBG. Engineering Geology and Rock Engineering, 2nd ed.; Handbook No. 2; Norwegian Group for Rock Mechanics: Trondheim, Norway, 1985. [Google Scholar]
- Atici, U.; Ersoy, A. Correlation of specific energy of cutting saws and drilling bits with rock brittleness and destruction energy. J. Mater. Process. Technol. 2009, 209, 2602–2612. [Google Scholar] [CrossRef] [Scilit]
- Franklin, J.A.; Broch, E.; Walton, G. Logging the mechanical character of rock. Trans. Inst. Min. Metall. Sect. A 1971, 80, A1–A9. [Google Scholar]
- Pettifer, G.S.; Fookes, P.G. A revision of the graphical method for assessing the excavatability of rock. Q. J. Eng. Geol. 1994, 27, 145–164. [Google Scholar] [CrossRef] [Scilit]
- Kahraman, S.; Fener, M.; Gunaydin, O. Predicting the sawability of carbonate rocks using multiple curvilinear regression analysis. Int. J. Rock Mech. Min. Sci. 2004, 41, 1123–1131. [Google Scholar] [CrossRef] [Scilit]
- Frodella, W.; Elashvili, M.; Spizzichino, D.; Gigli, G.; Adikashvili, L.; Vacheishvili, N.; Kirkitadze, G.; Nadaraia, A.; Margottini, C.; Casagli, N. Combining infrared thermography and UAV digital photogrammetry for the protection and conservation of rupestrian cultural heritage sites in Georgia: A methodological application. Remote Sens. 2020, 12, 892. [Google Scholar] [CrossRef] [Scilit]

Disclaimer/Publisher’s Note: The statements, opinions and data contained in all publications are solely those of the individual author(s) and contributor(s) and not of MDPI and/or the editor(s). MDPI and/or the editor(s) disclaim responsibility for any injury to people or property resulting from any ideas, methods, instructions or products referred to in the content. |
© 2026 by the authors. Licensee MDPI, Basel, Switzerland. This article is an open access article distributed under the terms and conditions of the Creative Commons Attribution (CC BY) license.