


Abstract
The shear response of lightweight concrete beams depends on the member size, shear span-to-depth ratio, and longitudinal reinforcement type. Based on checks against two previously reported LC60 beam tests and three-dimensional nonlinear finite element analysis, this study evaluated these parameters within the investigated model series. Increasing the effective depth from 85 to 340 mm substantially increased the absolute shear capacity, while the nominal ultimate shear strengths remained approximately 0.895, 0.951, and 0.937 MPa and showed no pronounced classical monotonic decrease. Increasing the shear span-to-depth ratio from 1.5 to 5.0 shifted the computed response from arch action toward beam action and reduced the nominal ultimate shear strength by up to 75.9%. Replacing steel reinforcement with lower-modulus GFRP reinforcement reduced the stiffness and ultimate shear strength, although the difference between the two reinforcement types decreased with the member size. These results provide a numerical basis for understanding the effects of the member size, shear span-to-depth ratio, and longitudinal reinforcement type on the shear response of LC60 lightweight concrete beams.
1. Introduction
Lightweight concrete offers low density, high specific strength, and reduced structural dead load, making it attractive for long-span bridges, prefabricated structures, and marine transportation infrastructure. However, because of the porous nature of lightweight aggregates and the characteristics of the aggregate–matrix interface, its elastic modulus, tensile properties, and fracture toughness are generally lower than those of normal-weight concrete of comparable strength. Lightweight concrete members are therefore more susceptible to diagonal cracking, localized damage, and brittle failure under shear. In a previous study [1], small-scale beams without stirrups were tested to systematically examine the effects of the lightweight aggregate type, glass fiber content, and steel or GFRP longitudinal reinforcement on shear behavior. The results showed that concrete incorporating fly ash-based artificial core–shell lightweight aggregates exhibited favorable cracking resistance and shear performance, whereas the low elastic modulus of GFRP bars increased the longitudinal deformation and crack width and reduced both the cracking load and shear capacity [1]. That study, however, considered only a single member size and a limited range of shear spans; the applicability of its findings to structural-scale members therefore remains to be established.
Size-dependent shear behavior has been reported for conventional and FRP-reinforced concrete beams [2,3,4,5,6,7,8,9,10]. Whether a classical decrease in nominal shear strength occurs in the present LC60 system is treated as a research question. The shear span-to-depth ratio also governs the transition between arch action and beam action, and numerical studies have shown that increasing the ratio shifts the reinforced concrete beam response away from shear-dominated behavior [11,12,13].
In addition to the member size and shear span-to-depth ratio, the longitudinal reinforcement type and axial stiffness influence the shear behavior. Steel-, GFRP-, CFRP-, and BFRP-reinforced beams have shown depth-dependent responses, while the lower elastic modulus of FRP reinforcement can produce larger longitudinal strains and wider cracks [8,9,10,14,15,16]. Studies of lightweight and recycled aggregate concrete further show that the aggregate system and reinforcement detailing can alter the shear and flexural response [17,18,19,20]. These studies provide context, but they do not directly validate the present LC60 finite element model.
For beams made with lightweight aggregate concrete, there is therefore a lack of systematic studies that assess the member size, shear span-to-depth ratio, and longitudinal reinforcement stiffness within a single material system, under geometrically similar conditions, and without the contribution of stirrups. In particular, it remains unclear, in quantitative terms, whether low longitudinal reinforcement stiffness further increases crack opening and aggravates the reduction in shear strength in large members and at large shear span-to-depth ratios.
Building on the previous experimental study [1], the present work combines experimental validation with three-dimensional nonlinear finite element analysis to develop numerical models of lightweight aggregate concrete beams reinforced with either steel or GFRP bars, and to systematically investigate the effects of the member size, shear span-to-depth ratio, and longitudinal reinforcement stiffness on the shear behavior. By examining the nominal shear strength, crack evolution, longitudinal reinforcement strain, concrete damage, and the development of diagonal struts, the study elucidates the mechanism linking reduced longitudinal reinforcement stiffness to increased longitudinal deformation, wider diagonal cracks, diminished shear transfer across the cracked zone, and reduced shear strength. The coupled relationships among the size effect, shear span-to-depth ratio, and longitudinal reinforcement stiffness are then identified, and an approach for evaluating the shear behavior of structural-scale core–shell lightweight aggregate concrete beams is established to support the design of lightweight concrete members and the refinement of existing shear models.
2. Materials and Experimental Program
2.1. Materials
The LC60 core–shell lightweight aggregate concrete used in the previous study [1] was adopted in the present work. The binder consisted of P.O 52.5 ordinary Portland cement, Class I fly ash, and silica fume. Shale lightweight fine aggregate with a particle size of 0–3 mm was used as the fine aggregate, and fly ash-based artificial core–shell lightweight aggregate with a particle size of 5–10 mm was used as the coarse aggregate. A polycarboxylate high-range water-reducing admixture with a water reduction ratio of 27% was used, and tap water served as the mixing water. The basic properties of the shale lightweight aggregate and core–shell lightweight aggregate used in the previous study are listed in Table 1.
Table 1.
Main physical and mechanical properties of the lightweight aggregates [1].
The mixture proportions of the LC60 core–shell lightweight aggregate concrete are given in Table 2. Because the core–shell lightweight aggregate has a relatively high water absorption, it was prewetted to a saturated surface-dry condition before mixing to minimize further water uptake by the aggregate and the associated effect on concrete workability. After casting, the concrete was cured at room temperature for 28 d. The mixture proportions and material properties are presented in Table 2 and Table 3, respectively.
Table 2.
Mixture proportions of LC60 core–shell lightweight aggregate concrete (kg/m3) [1].
Table 3.
Basic properties of LC60 core–shell lightweight aggregate concrete at 28 d.
2.2. Beam Geometry
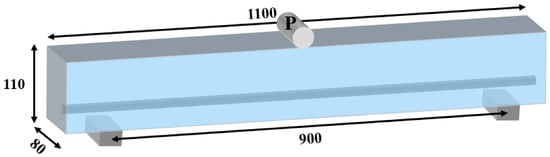
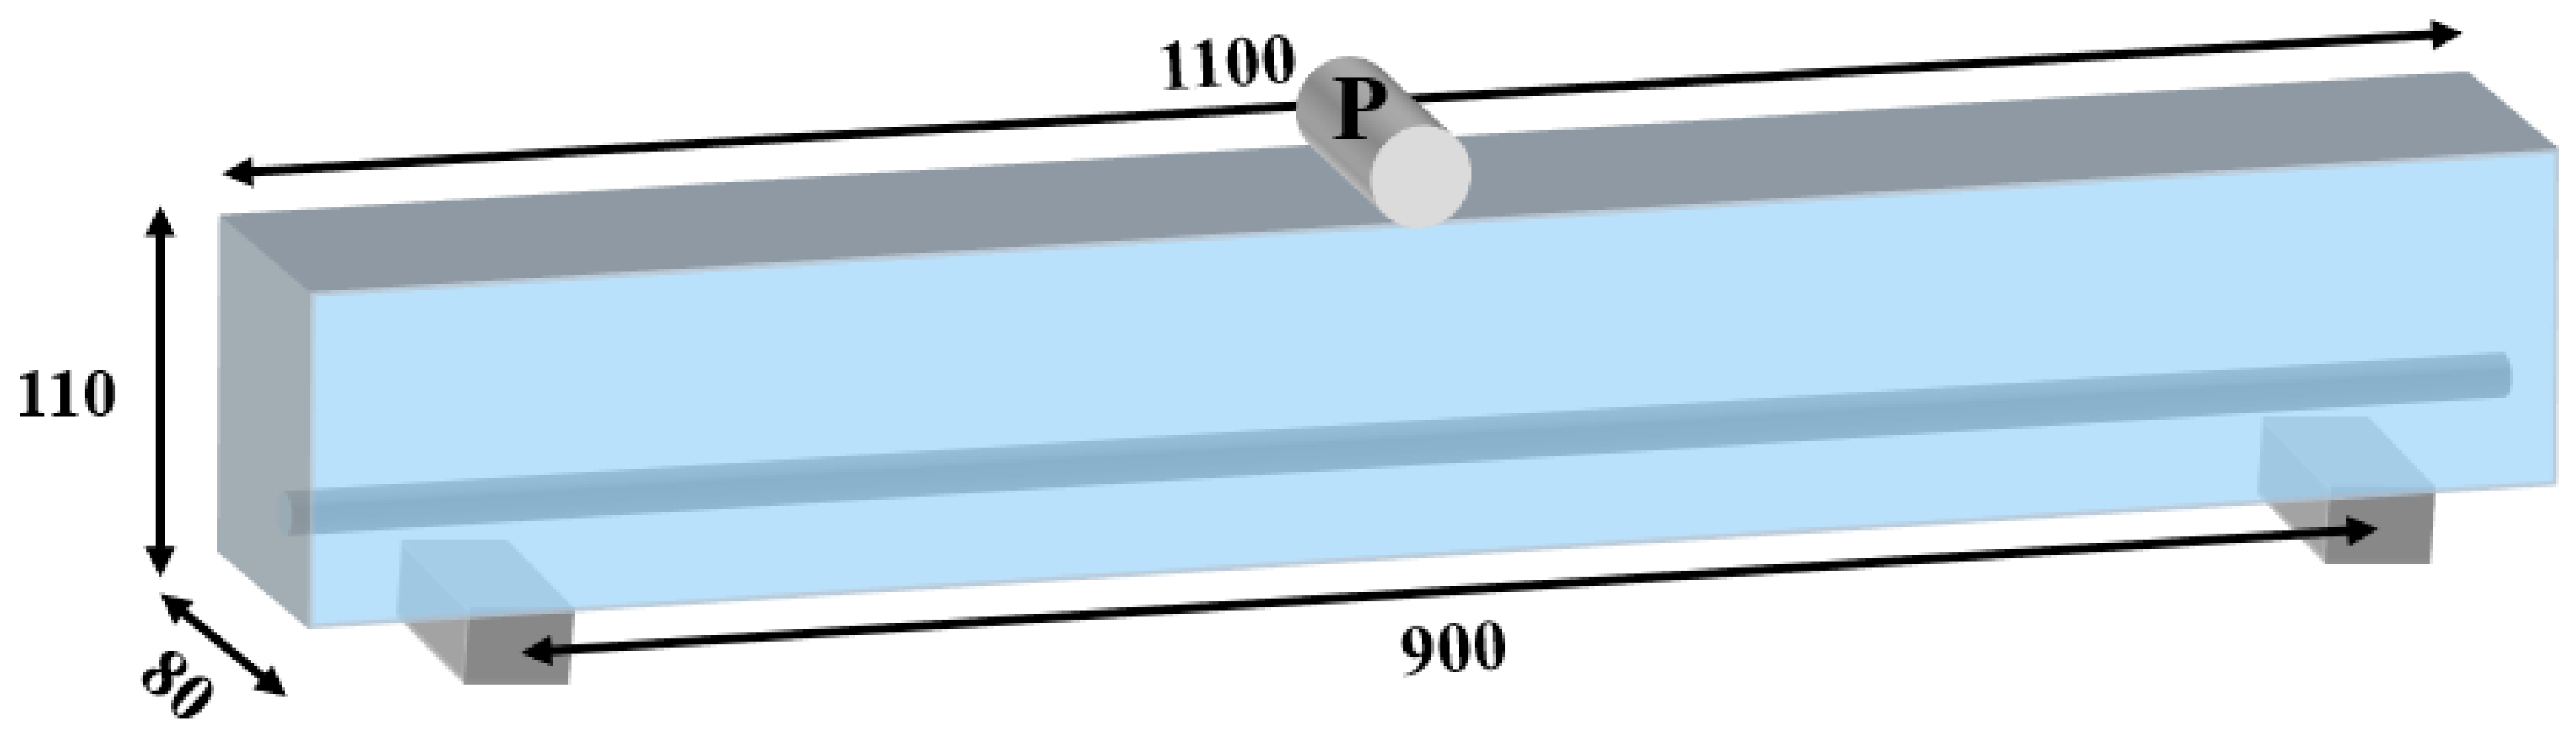
The two baseline beams reported in Ref. [1] were singly reinforced rectangular beams tested under three-point bending, with one specimen for each reinforcement configuration. Each beam was 1100 mm long with an 80 mm × 110 mm cross-section and an effective depth of d = 85 mm. The clear shear span was a = 425 mm, measured from the inner face of the 50 mm wide support contact region to the loading line and calculated as (900 − 50)/2. One 10 mm diameter steel or GFRP bar was placed in the bottom tension zone, the concrete cover was 20 mm, and no stirrups were provided. The geometry and the parameters required to define and check the finite element models are shown in Figure 1 and Table 4; the complete experimental program is reported in Ref. [1].
Figure 1.
Geometry and cross-sectional parameters of the beam specimens.
Table 4.
Design parameters of the test beams [1].
2.3. Testing Procedure
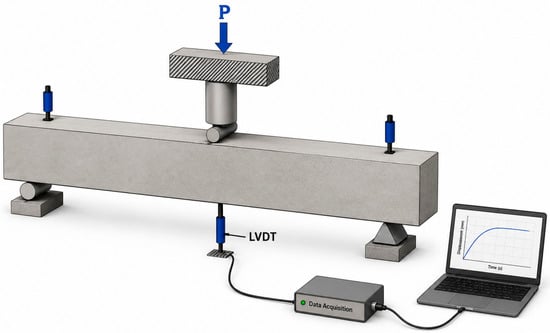
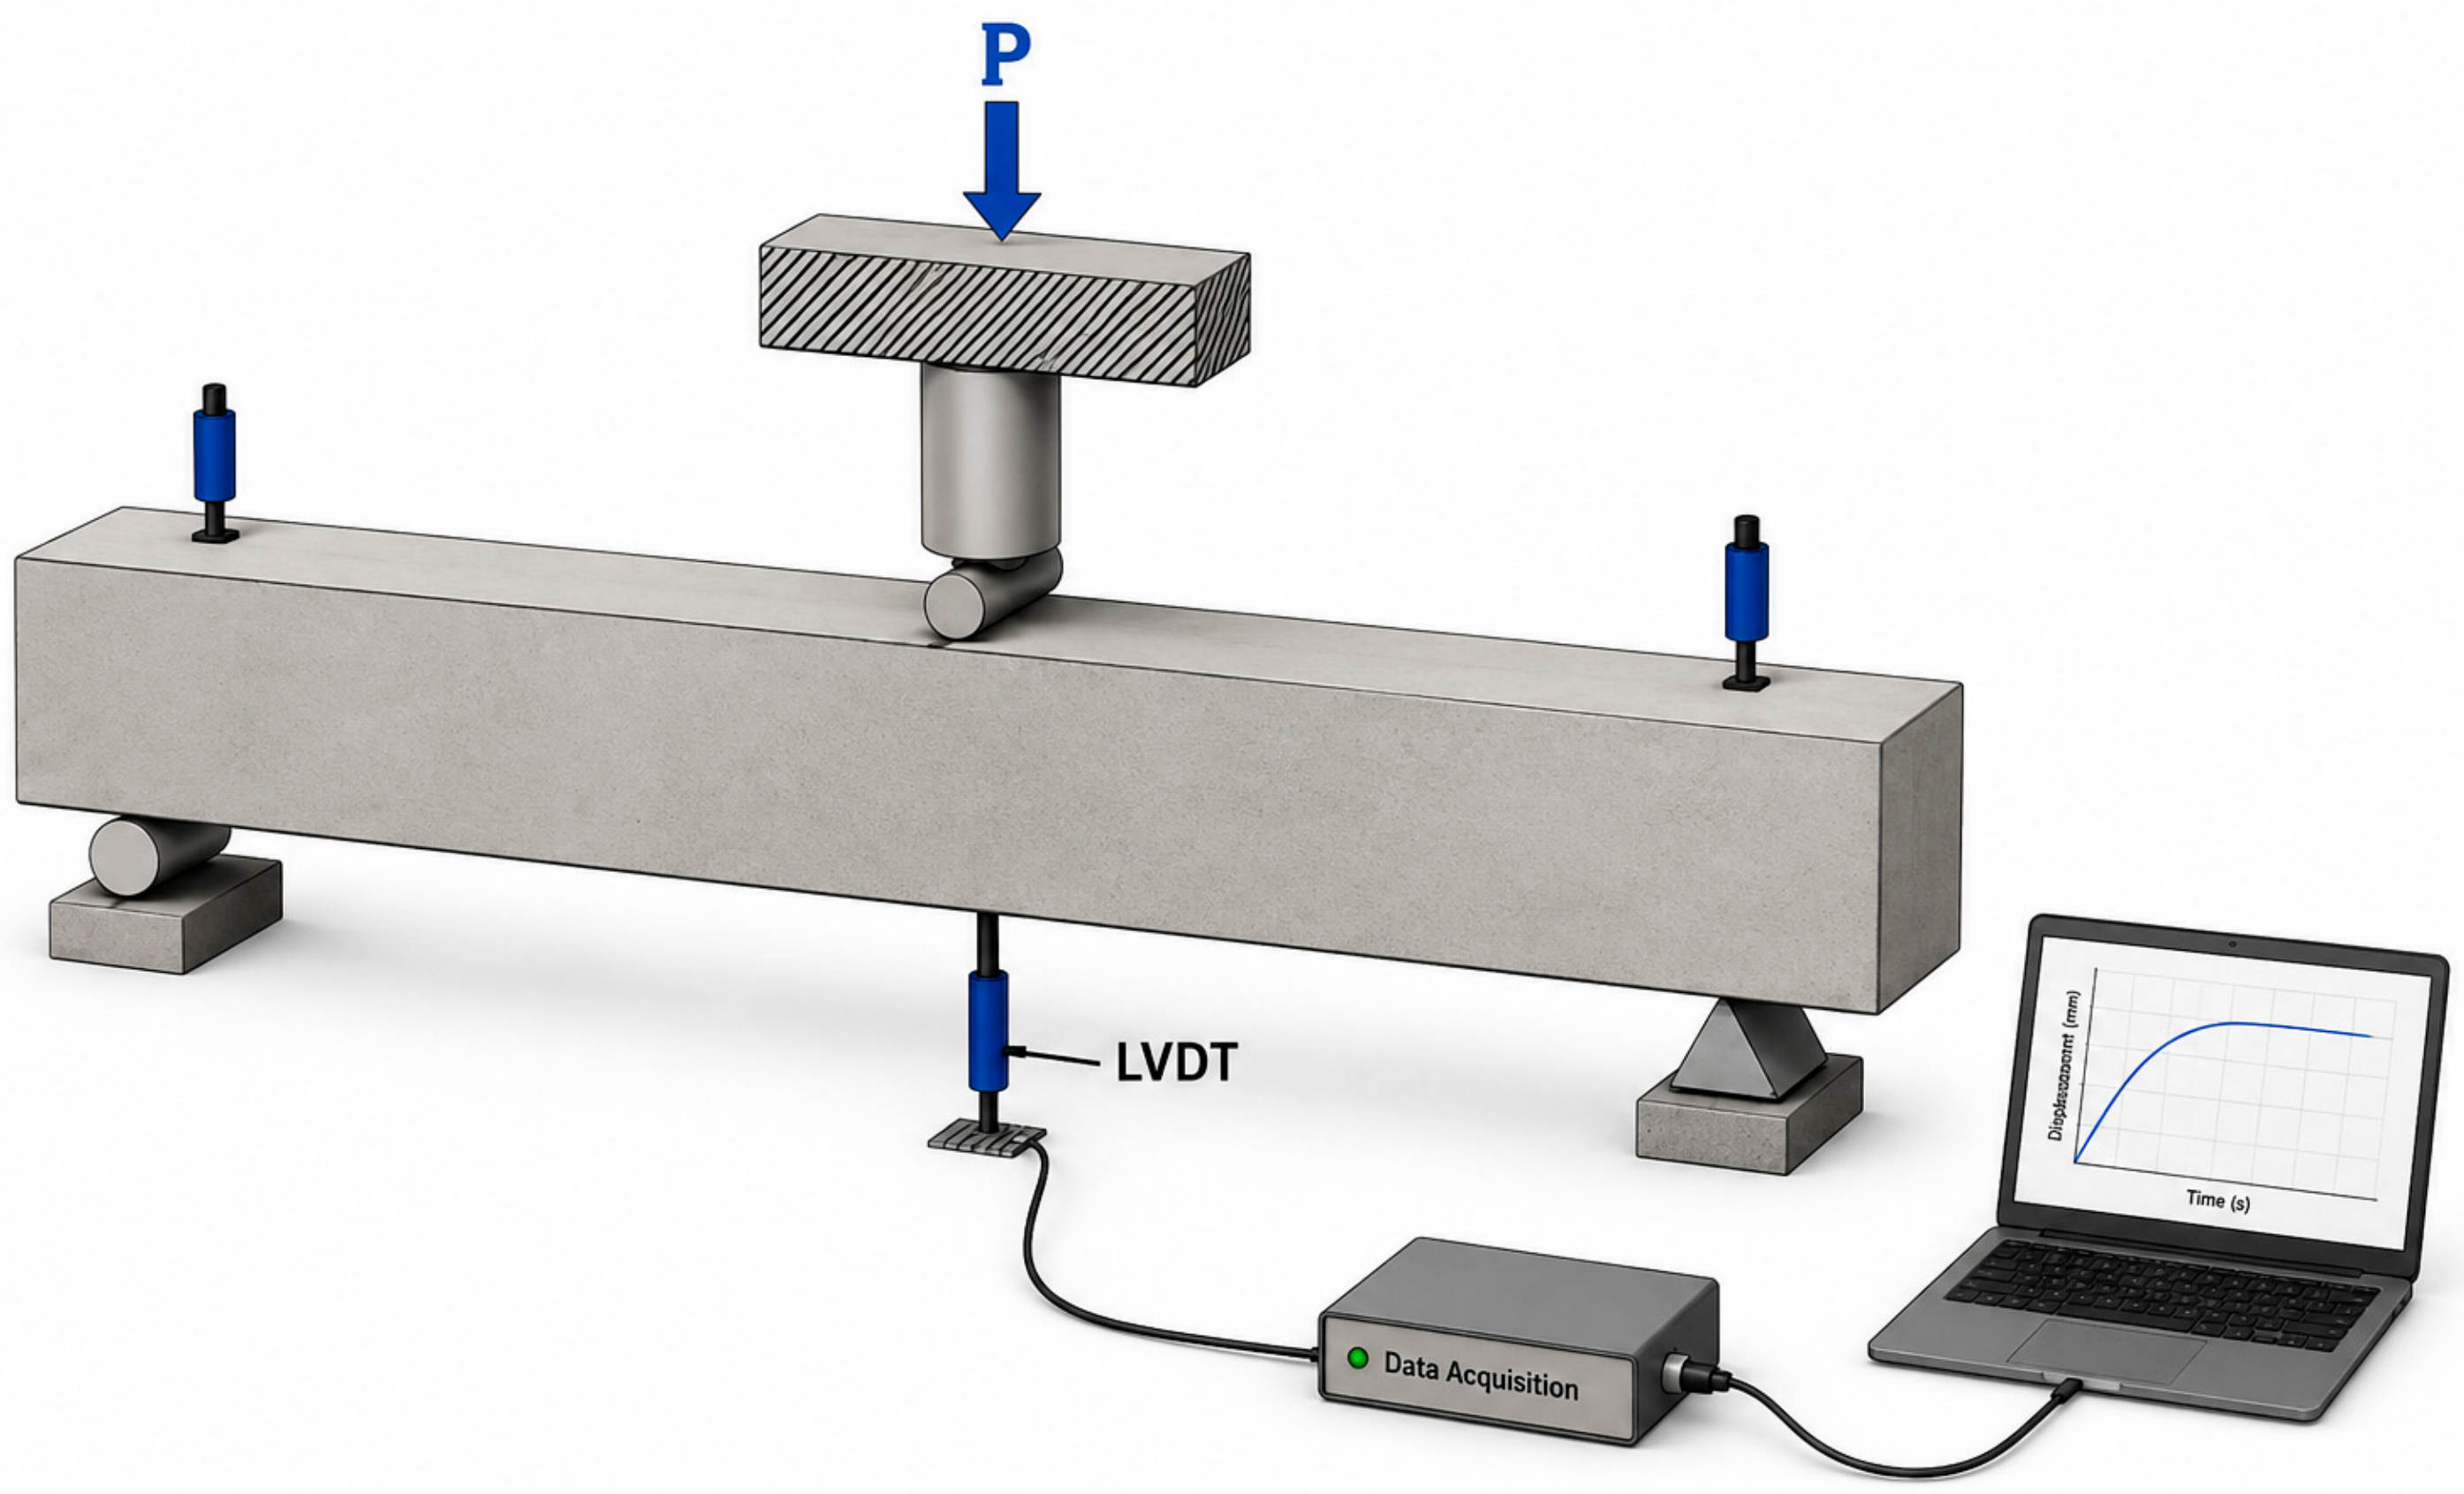
The beams were subjected to monotonic three-point loading over a 900 mm support spacing. LVDTs were installed at midspan and at both supports, as shown in Figure 2. The influence of support movement was removed from the reported midspan displacement using the support LVDT measurements.
Figure 2.
Test setup and instrumentation layout.
Loading was initially applied under load control. At approximately 80% of the theoretically estimated peak load, the loading mode was switched to displacement control and maintained until failure. Load and corrected midspan displacement were recorded continuously. The baseline cracking and peak load results used for deterministic model checking are reported in Ref. [1]; no estimate of specimen-to-specimen variability is claimed.
2.4. Finite Element Modeling
To extend the ranges of the member size and shear span-to-depth ratio beyond those covered by the previous experiments, three-dimensional nonlinear finite element models of LC60 lightweight concrete beams without stirrups were developed in ABAQUS 2026. The LC60-S and LC60-G baseline tests reported in Ref. [1] were used for model checking. Subsequent configurations were numerical parametric predictions for the investigated LC60 system.
2.4.1. Concrete
The LC60 concrete was modeled as a homogeneous continuum using C3D8R solid elements and the Concrete Damage Plasticity (CDP) model. Individual coarse and fine aggregates, mortar, and aggregate–mortar interfacial transition zones were not explicitly represented. The reported 5–10 mm aggregate size characterizes the experimental mixture and is not a geometric parameter of the finite element model. Table 5 lists the adopted concrete properties.
Table 5.
Finite element parameters of LC60 core–shell lightweight aggregate concrete.
The CDP plasticity parameters used in the simulations were a dilation angle of 38°, a flow potential eccentricity of 0.1, fb0/fc0 = 1.16, Kc = 0.6667, and a viscosity parameter of 0.0001. This parameter set was adopted for the present simulations; its uniqueness was not established through inverse identification.
The compressive behavior was described using the modified Collins stress–strain model reported in Ref. [21], as expressed in Equations (1)–(5):
where σc and εc are the uniaxial compressive stress and total compressive strain, respectively; is the concrete compressive strength; εc0 is the strain at peak compressive stress; Ec is the elastic modulus; n and k are curve shape parameters; and is the compressive inelastic strain. The resulting stress–strain relationship was converted into the compressive inelastic strain required by the ABAQUS CDP model.
The tensile response follows the strain-based softening law adopted from Ref. [21], as expressed in Equations (6)–(8). Because this formulation is not regularized by element characteristic length, mesh-objective post-cracking behavior is not claimed. A fracture energy-based crack-opening formulation would provide a more rigorous regularization of localized cracking.
where σt and εt are the uniaxial tensile stress and total tensile strain, respectively; ft is the concrete tensile strength; and εt0 is the strain at the peak tensile stress. The tensile stress–strain relationship was further converted into the cracking strain and tensile damage variables required by the CDP model.
σt = Ecεt, 0 ≤ εt ≤ εt0
εt0 = ft/Ec
2.4.2. Reinforcement
The longitudinal steel and GFRP bars were modeled using T3D2 truss elements and coupled to the concrete with an Embedded Region constraint under a perfect bond assumption. Steel was represented by a bilinear elastoplastic law with Es = 200 GPa. GFRP was represented as linear elastic with Ef = 40 GPa. Table 4 retains the experimentally reported GFRP tensile strength of 1200 MPa [1]. A reference strength of 900 MPa and the corresponding strain of 2.25% were used only for post-processing assessment; they were not implemented as an ABAQUS rupture criterion, damage initiation rule, stiffness degradation rule, or element deletion criterion. The model does not represent reinforcement concrete slip, material-specific surface and anchorage behavior, or their effects on local crack opening and stiffness.
2.4.3. Concrete Beam Model
The geometry and parameters of the finite element beam models are summarized in Table 6. The supports were modeled as three-dimensional rectangular blocks. For B1, each support measured 80 mm× 50 mm× 20 mm. The transverse support width was scaled with a beam width to 160 mm for B2 and 320 mm for B4, while the 50 mm longitudinal contact length was unchanged. Loading was applied through a cylindrical steel rod with an unchanged diameter across B1, B2, and B4. The loading rod/beam and support/beam interfaces used surface-to-surface contact with finite sliding and isotropic Coulomb friction (μ = 0.3). Reinforcement concrete interaction used Embedded Region under the perfect bond assumption.
Table 6.
Finite element modeling parameters for the beams.
The boundary conditions reproduced a simply supported beam. At the left support, U1, U2, and U3 were constrained while UR1 was released. At the right support, U1 and U2 were constrained and U3 and UR1 were released. Loading was displacement-controlled at the loading rod reference point. A Static, General step with geometric nonlinearity enabled was used, with total step time 1 and initial increment 0.001.
3. Results and Discussion
3.1. Validation of the Finite Element Model
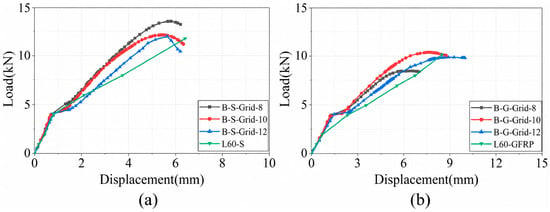
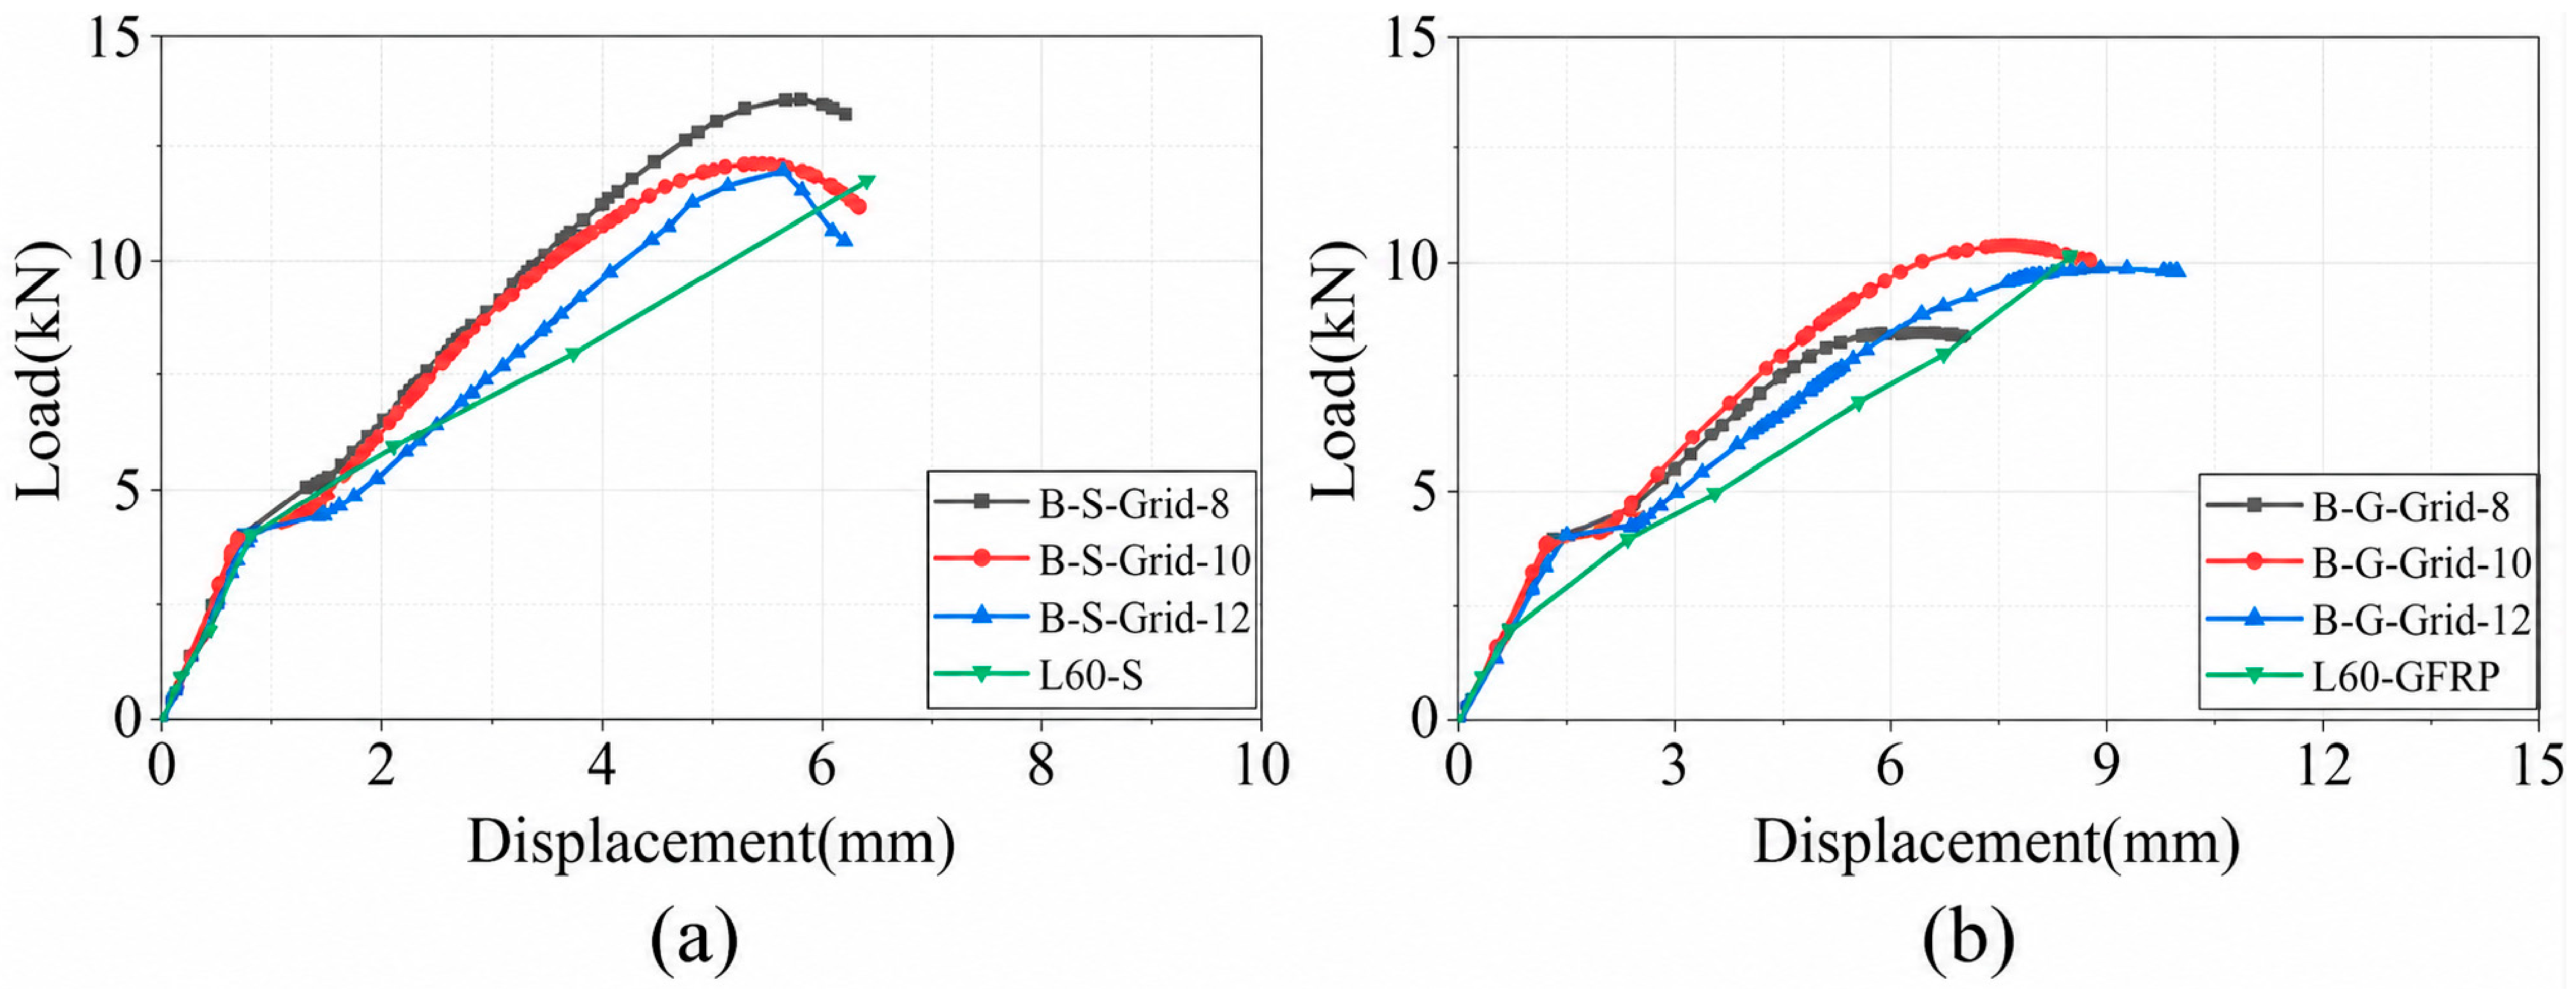
The 8, 10, and 12 mm baseline comparisons were used to select a practical global mesh for load–displacement and peak load response, as shown in Figure 3. As shown in Table 7, a 10 mm global mesh was then held fixed for consistency. The results indicate that the selected mesh size provides good agreement.
Figure 3.
Comparison of experimental and numerical load–displacement curves for different mesh sizes: (a) steel-reinforced beam; (b) GFRP-reinforced beam.
Table 7.
Comparison of peak loads for models with different mesh sizes.
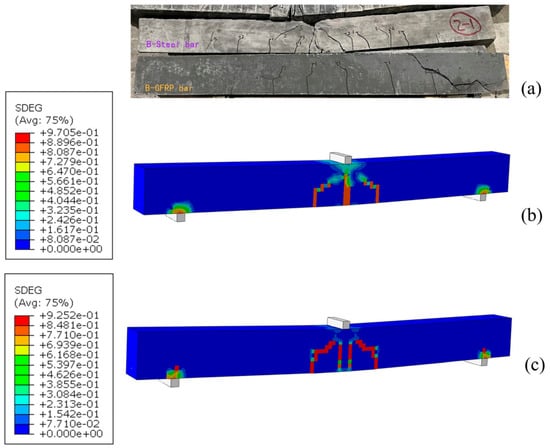
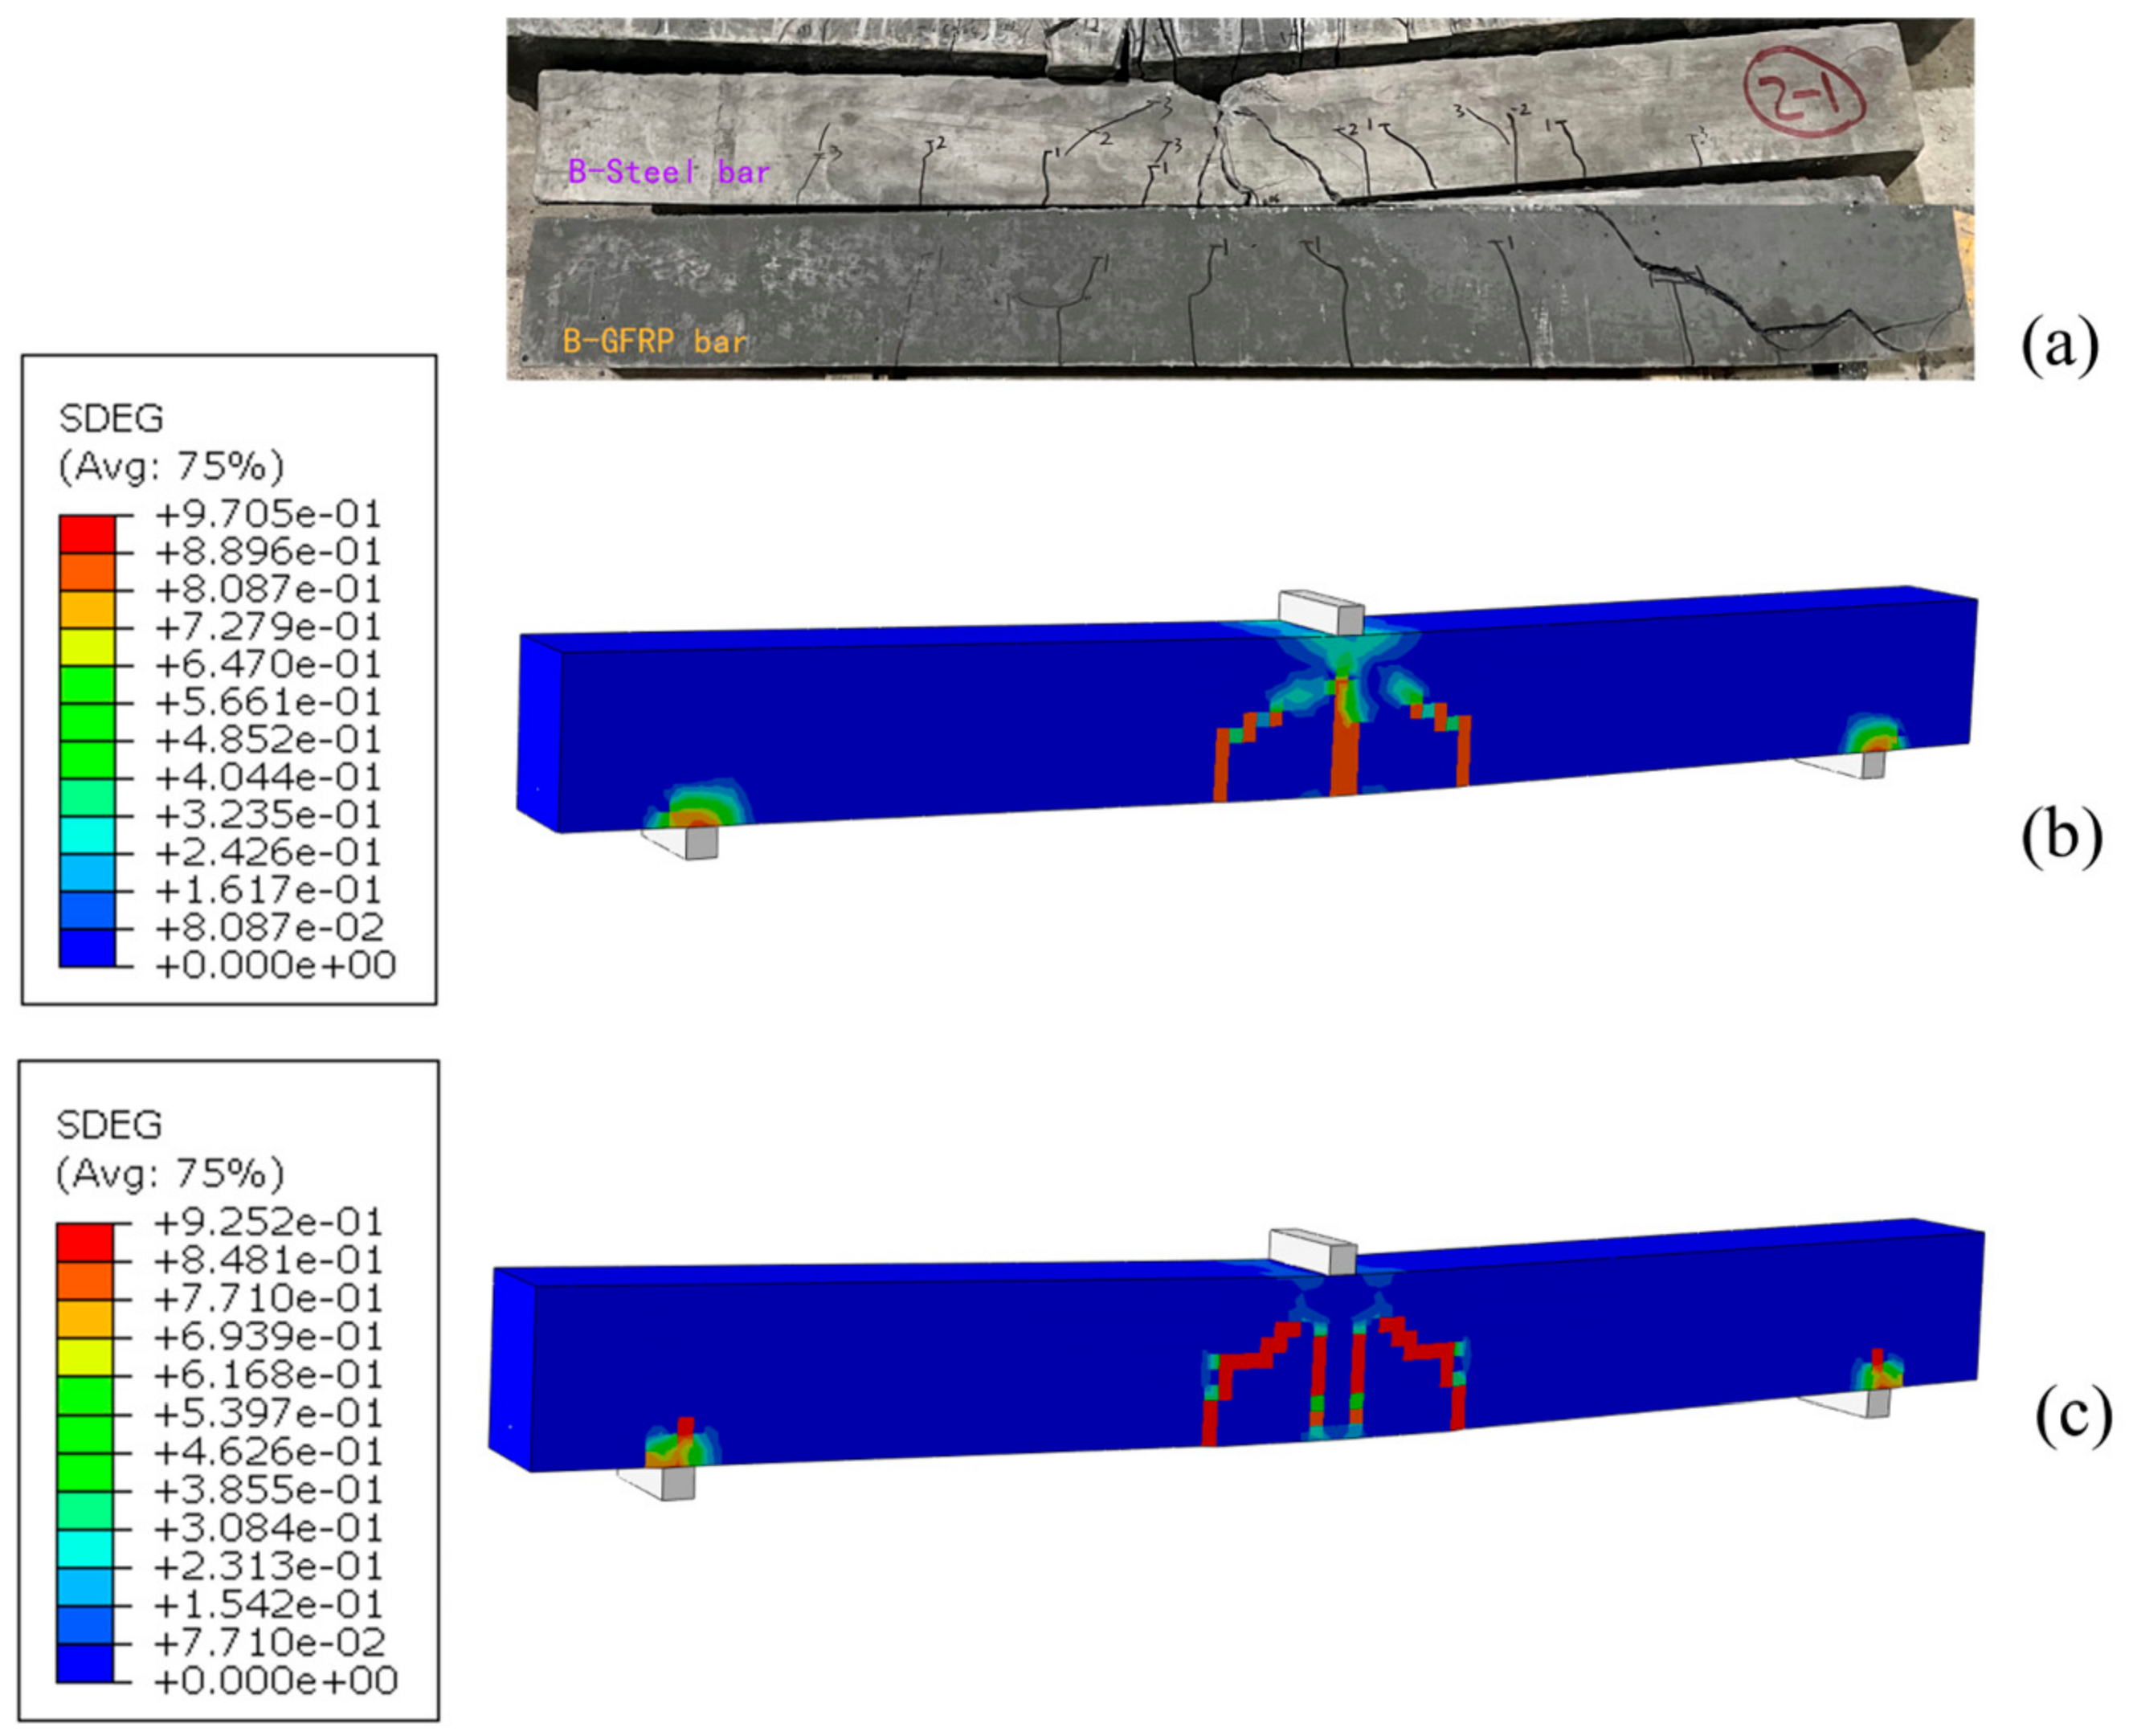
Figure 4 compares the experimental failure patterns of the LC60-S and LC60-G beams with the SDEG contour lines of the corresponding 10 mm reference model. SDEG is used solely as a scalar indicator of stiffness degradation to approximately assess the similarity to the failure characteristics of the experimental beams. Overall, the damage characteristics of the two show a high degree of similarity.
Figure 4.
Comparison of experimental failure patterns and finite element SDEG contours: (a) experimental failure of LC60-Steel and LC60-GFRP; (b) SDEG contour of LC60-S; (c) SDEG contour of LC60-GFRP.
3.2. Member Size Effect
The B1, B2, and B4 models form a controlled member size series rather than a strictly geometrically similar size effect series. The longitudinal reinforcement ratio was maintained at approximately ρl ≈ 1.15%. Table 6 uses 1ϕ10, 4ϕ10, 4ϕ20 for both reinforcement types, with total areas of 78.2, 312.8, and 1251.2 mm2. Departures from strict similitude include the discrete bar arrangement, unchanged 50 mm longitudinal support contact length, unchanged loading rod diameter, and fixed 10 mm mesh.
3.2.1. Cracking and Shear Strengths
For symmetric three-point loading, the shear force in each shear span was calculated as V = P/2. The cracking and ultimate shear forces and their nominal strengths were evaluated using Equations (9) and (10). The numerical first cracking loads were Pcr = 3.982 kN for LC60-S and 3.879 kN for LC60-G, compared with experimental values of 2.90 and 2.50 kN [1]. The finite element values are higher by 37.3% and 55.2%, respectively; therefore, the models reproduce peak load response more accurately than the exact onset of first cracking.
where b is the beam width and d is the effective depth, both in mm; Vcr and Vu are in N; and vcr and vu are in MPa. The calculated results for beams of different sizes are given in Table 8.
vcr = Vcr/(bd)
vu = Vu/(bd)
Table 8.
Cracking and ultimate shear strengths of beams with different sizes.
Absolute cracking and ultimate shear forces increased with the member size. Increasing the effective depth from 85 to 340 mm increased the ultimate shear force from 6083 to 101,972.5 N, while the nominal ultimate shear strengths were approximately 0.895, 0.951, and 0.937 MPa. The nominal values do not show a pronounced classical monotonic decrease over the investigated range; the results are therefore described as member size-dependent responses under the adopted boundary conditions.
3.2.2. Load–Displacement Curves and Normalized Response
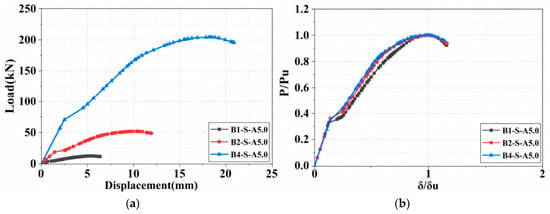
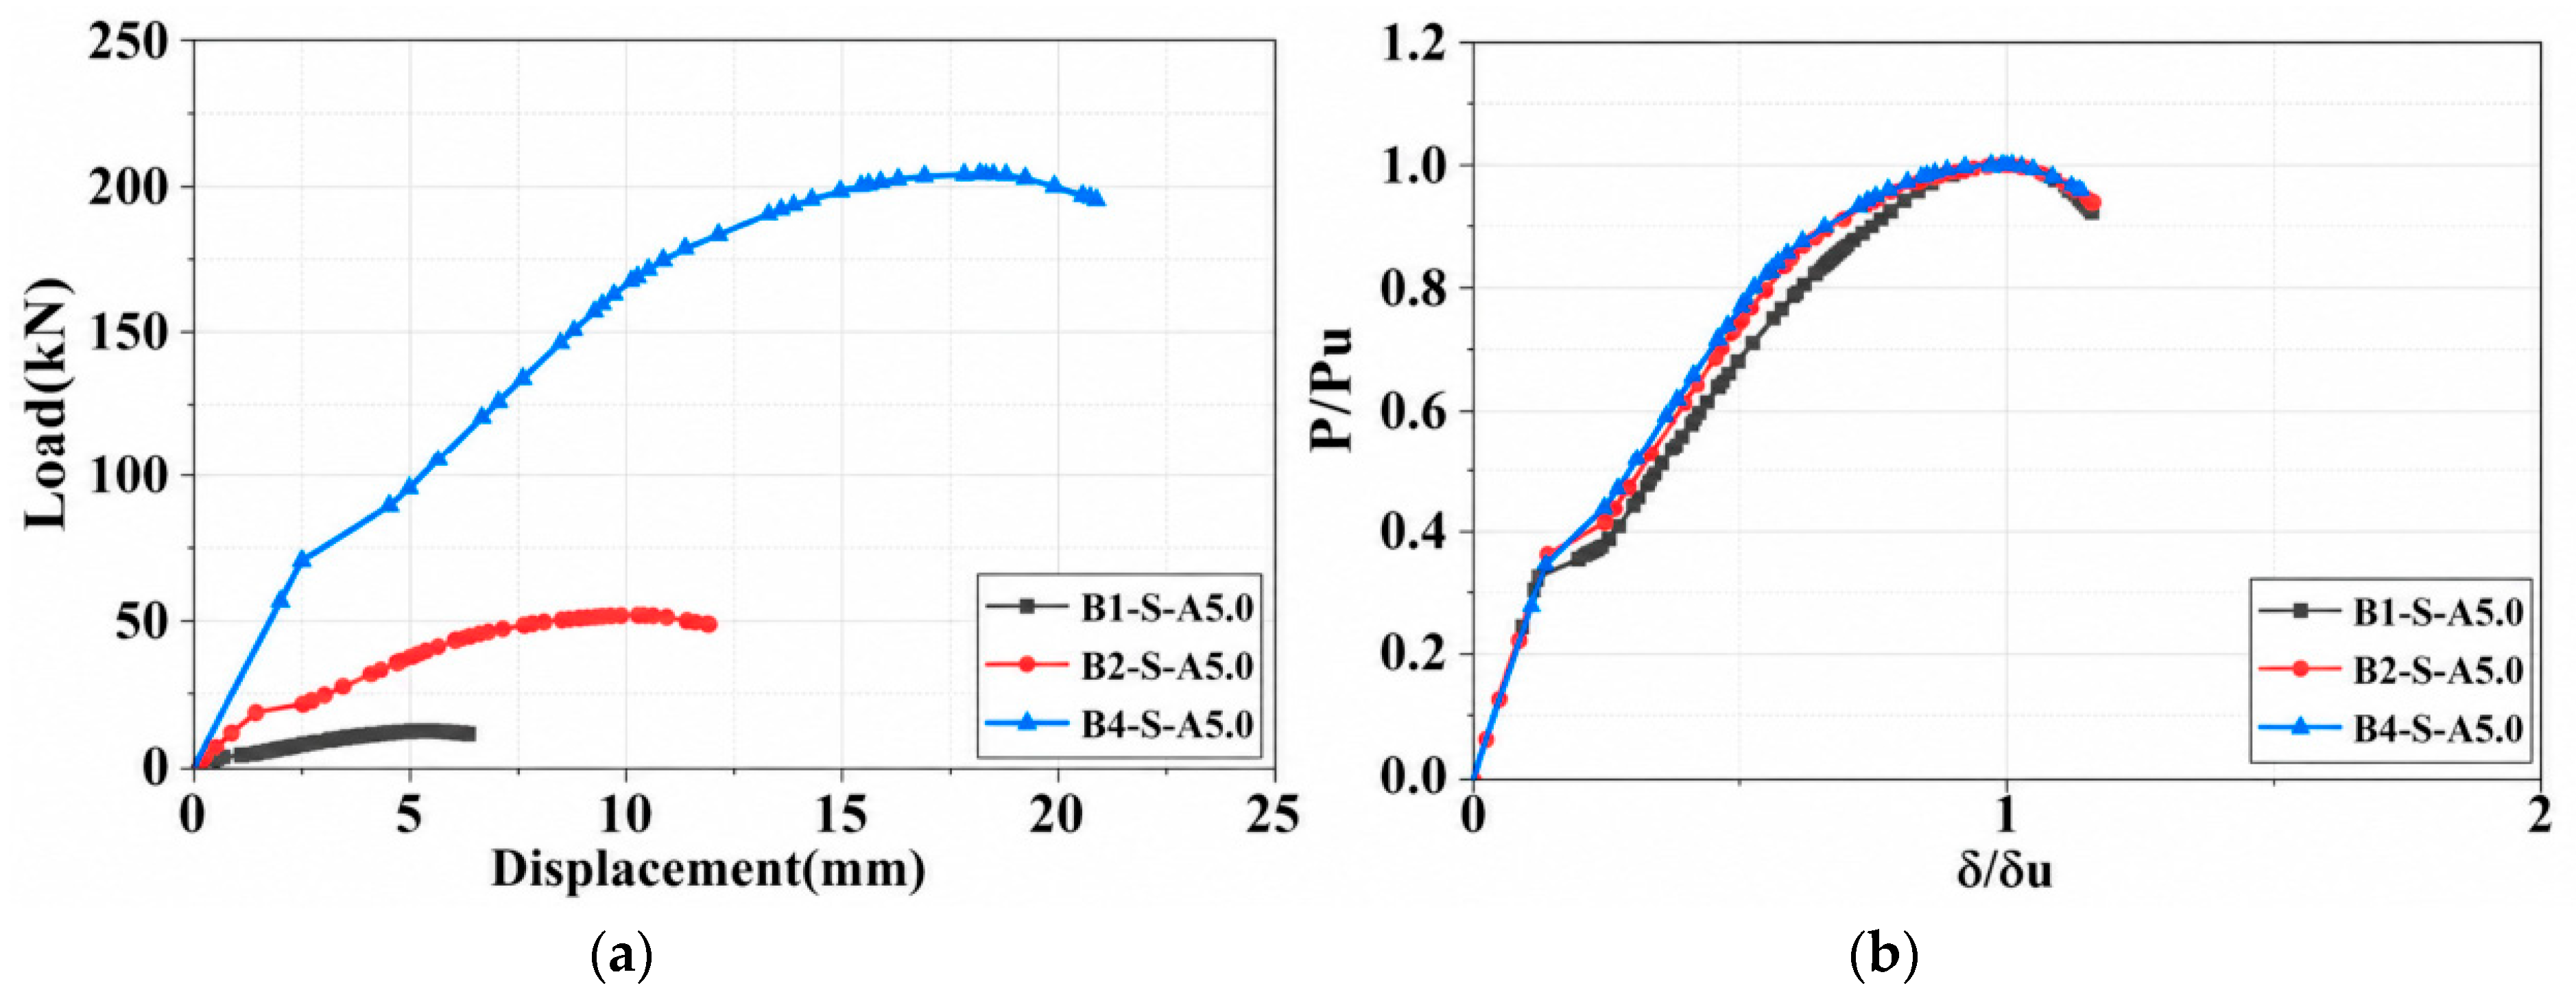
The load–displacement curves and normalized curves for beams of different sizes are shown in Figure 5a and Figure 5b, respectively. As the member size increased, the peak load rose from 12.166 to 203.945 kN and the displacement at the peak load increased from 5.4707 to 18.3148 mm, indicating substantial increases in both absolute shear capacity and ultimate deformation capacity. After normalization, the curves for the different sizes were nearly coincident before cracking and throughout the pre-peak nonlinear stage, suggesting that changing the member size did not appreciably alter the initial stiffness degradation pattern or the overall crack development process.
Figure 5.
(a) Load–displacement curves for beams of different sizes; (b) normalized load–displacement curves.
3.2.3. Structural Stiffness and Global Energy Dissipation
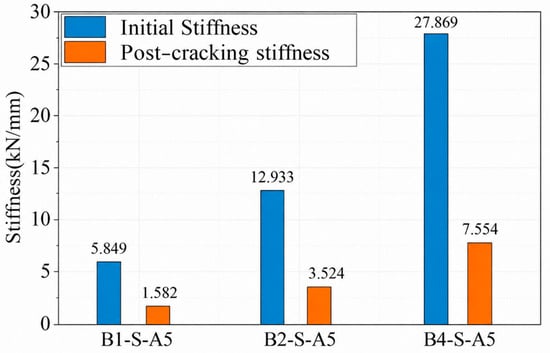
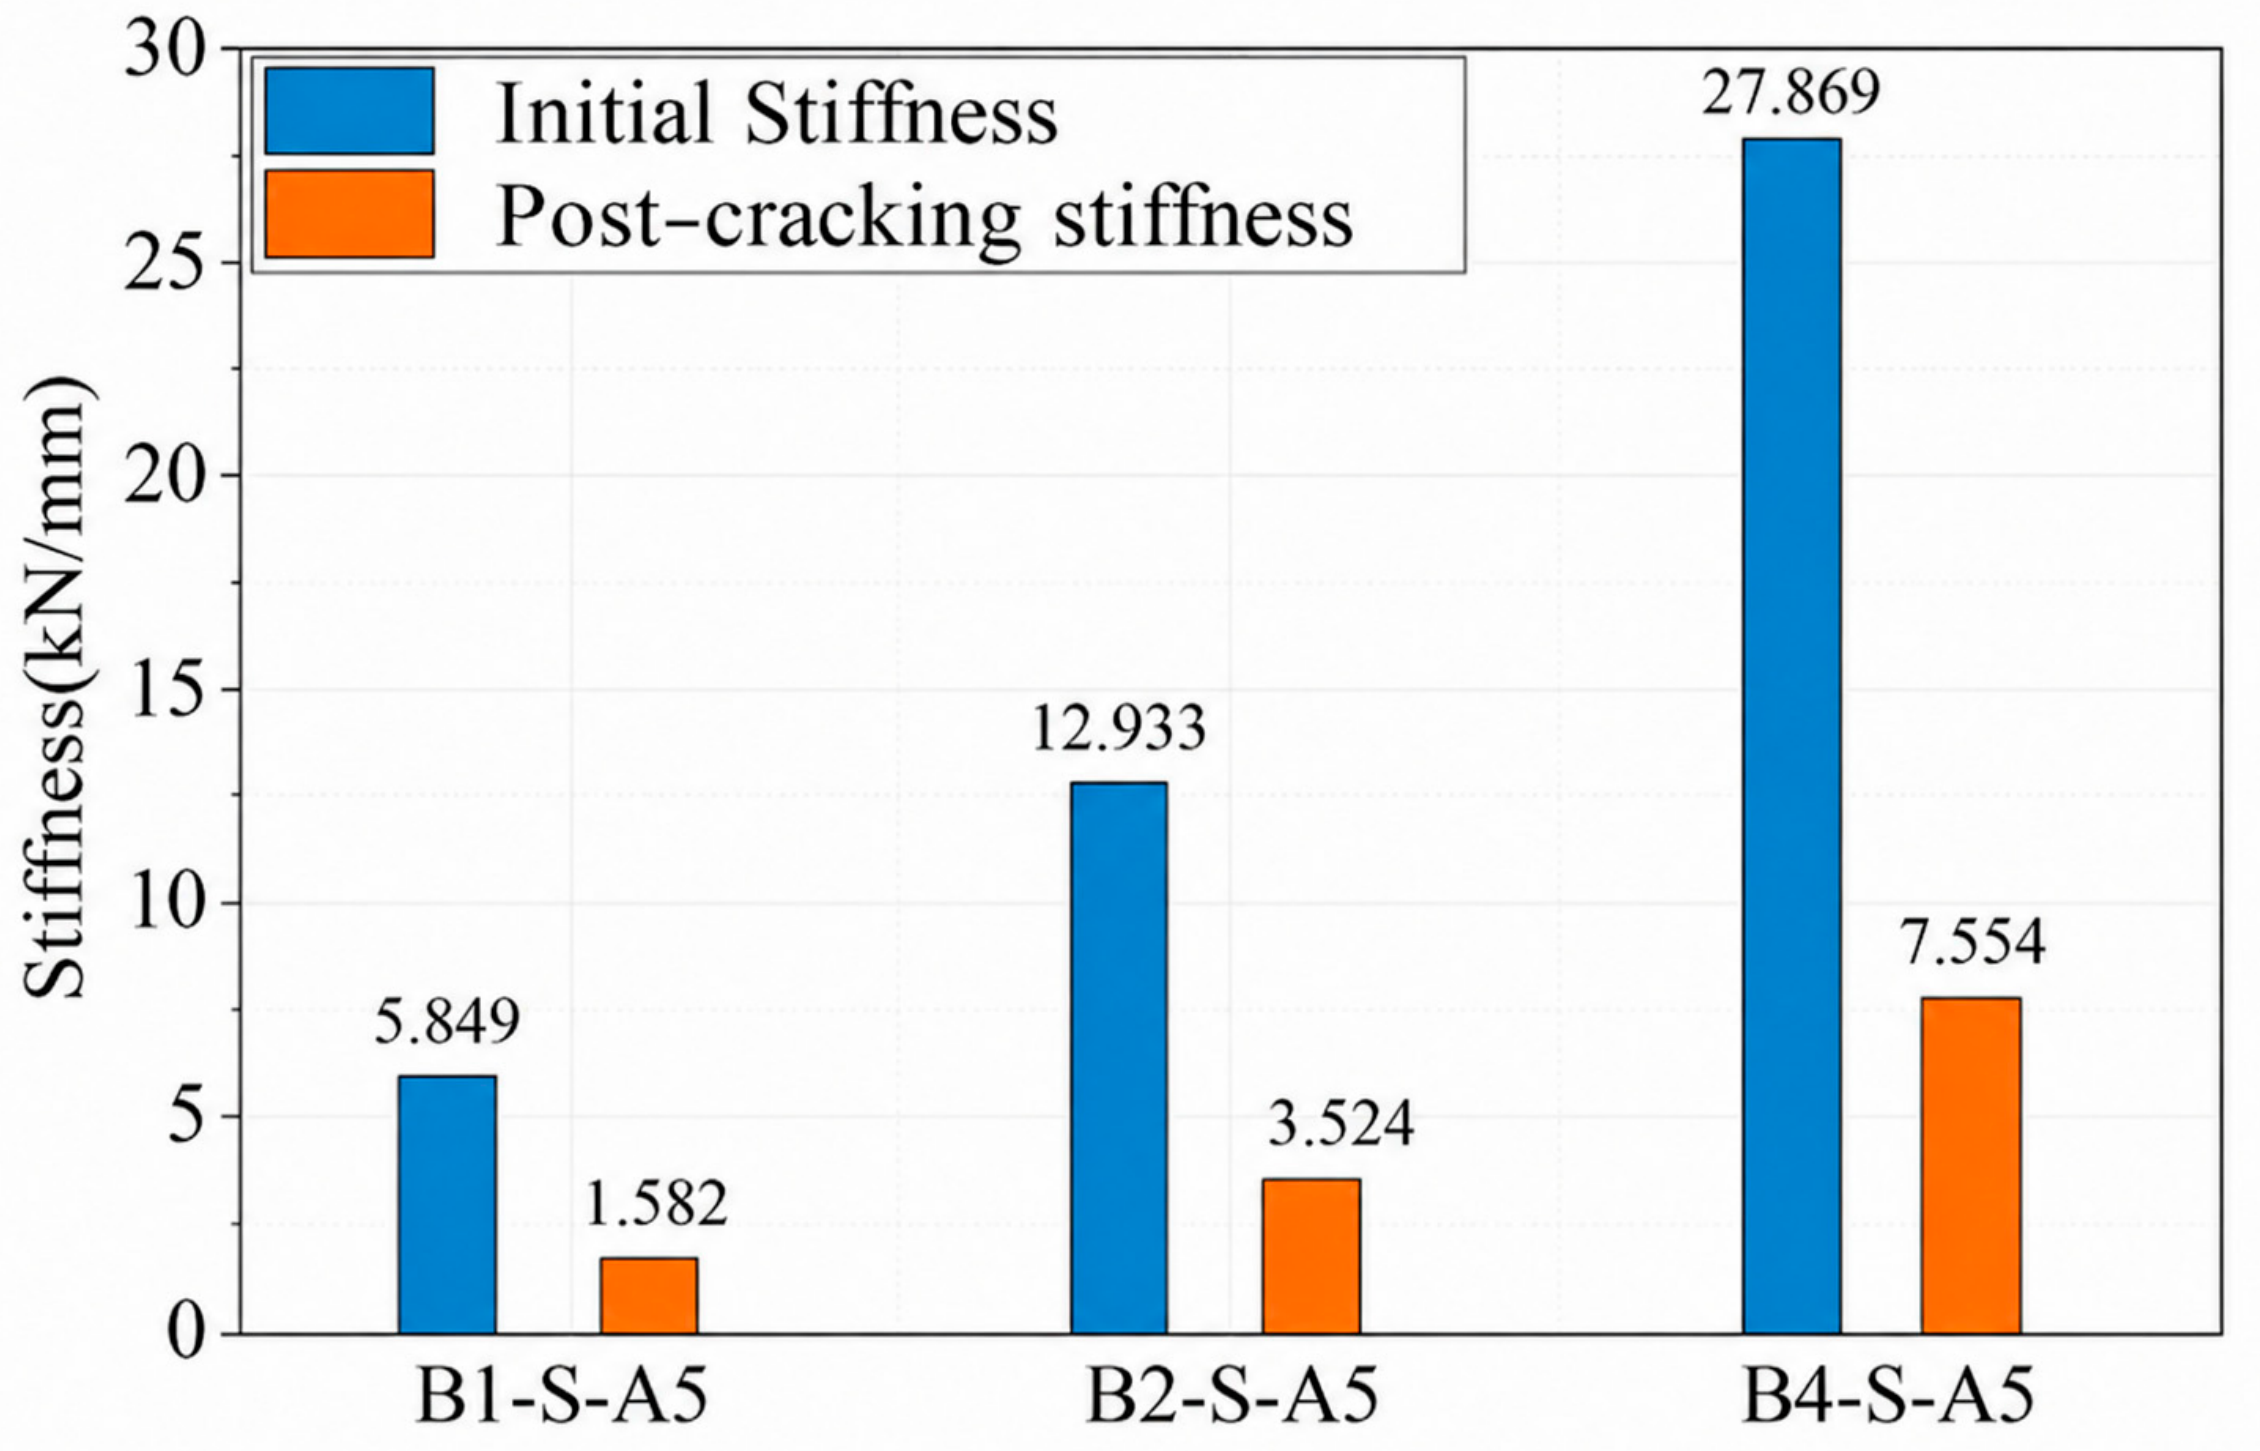
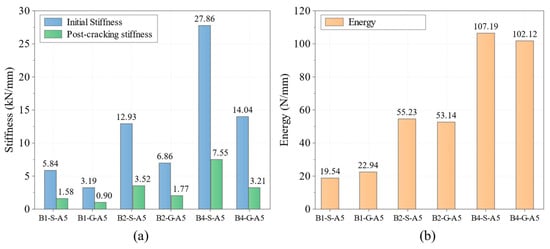
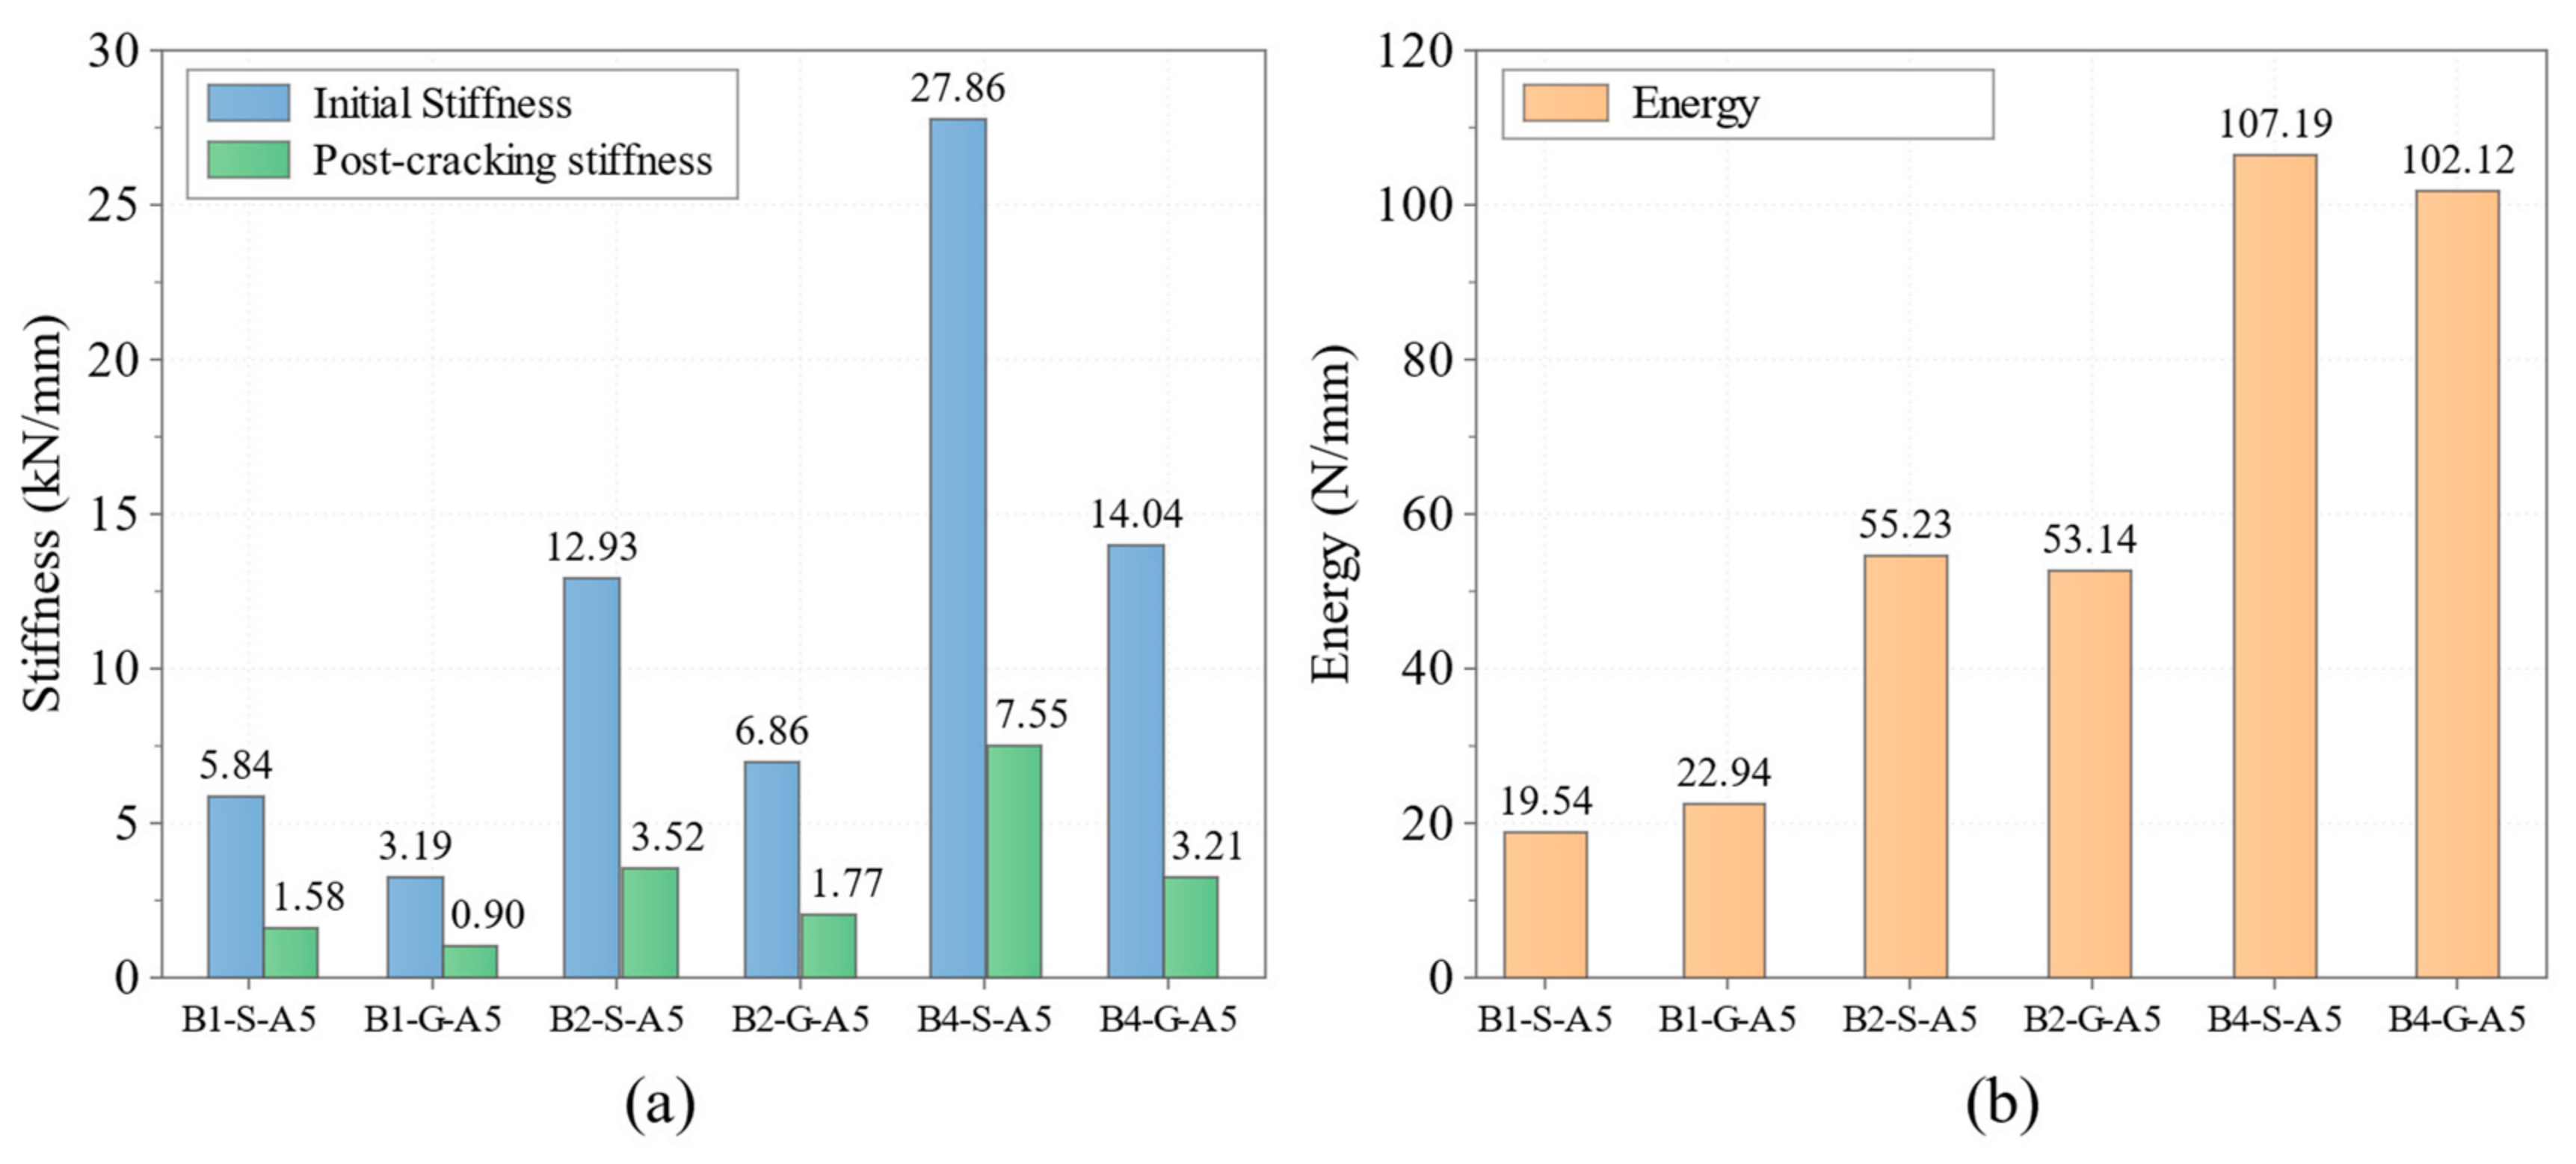
The initial and post-cracking stiffnesses of beams with different sizes are compared in Figure 6. As the beam dimensions increased, the initial stiffness Ki increased from 5.849 to 27.869 kN/mm and the post-cracking stiffness Kcr increased from 1.582 to 7.554 kN/mm. Relative to B1-S-A5.0, Ki increased by 121.1% and 376.5% for B2-S-A5.0 and B4-S-A5.0, respectively, while Kcr increased by 122.8% and 377.5%. These results show that increasing the member size substantially enhances the overall beam stiffness, primarily because the larger cross-section increases the sectional moment of inertia and therefore improves resistance to deformation during loading.
Figure 6.
Comparison of stiffness for beams of different sizes.
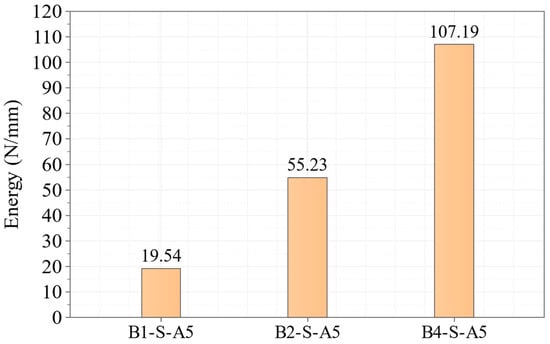
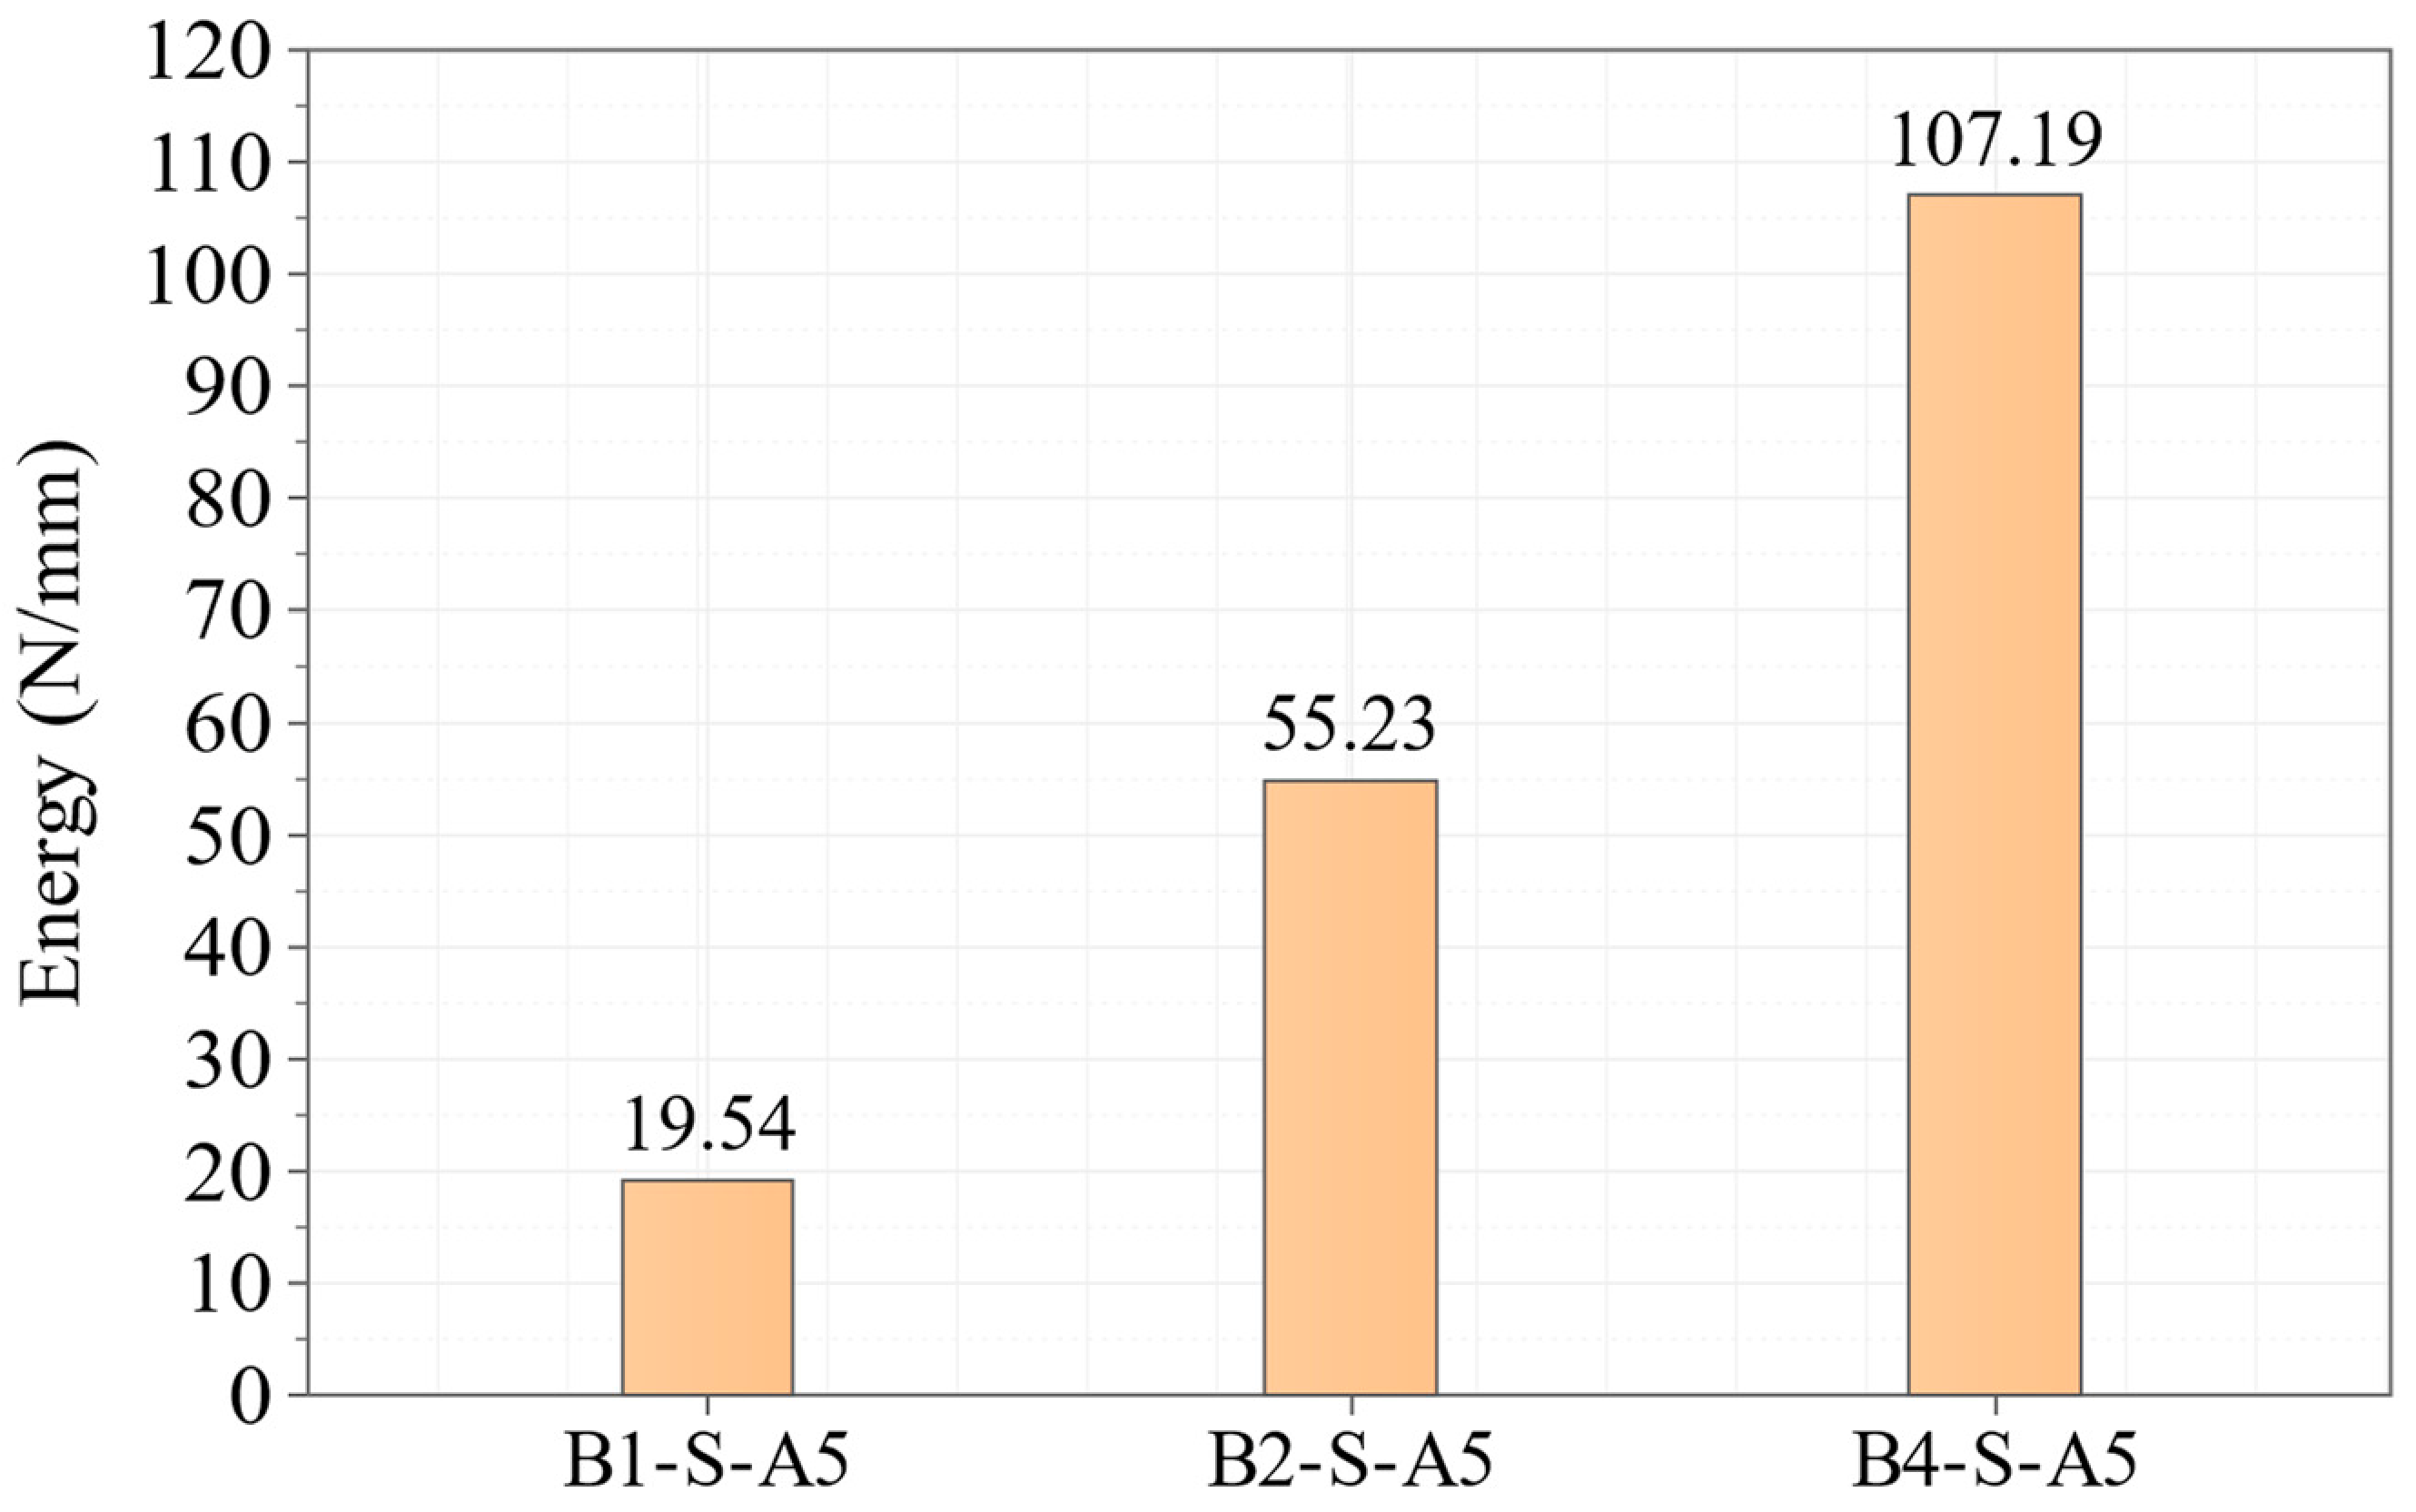
The area W under the structural load–displacement curve was integrated from loading onset to a common descending branch endpoint at approximately 0.90 Pu. The global structural energy dissipation index Gs was normalized by the reference sectional area Aref = bd, as defined in Equations (11)–(13). This index is a whole-member structural response measure and not an intrinsic Mode-I fracture energy parameter.
Aref = bd
Gs = W/Aref = W/(bd)
The global structural energy dissipation indices of beams with different sizes are shown in Figure 7. Their absolute magnitudes depend on the common post-peak integration endpoint, and no endpoint sensitivity analysis was performed. The localization and post-peak energy trends are consistent with quasi-brittle damage processes, but the CDP formulation combines plasticity and stiffness degradation and the nominal strength does not show a classical monotonic size effect reduction. The simulations therefore do not establish an exclusive fracture mechanics description.
Figure 7.
Global structural energy dissipation index for beams of different sizes.
3.2.4. Final Failure Characteristics
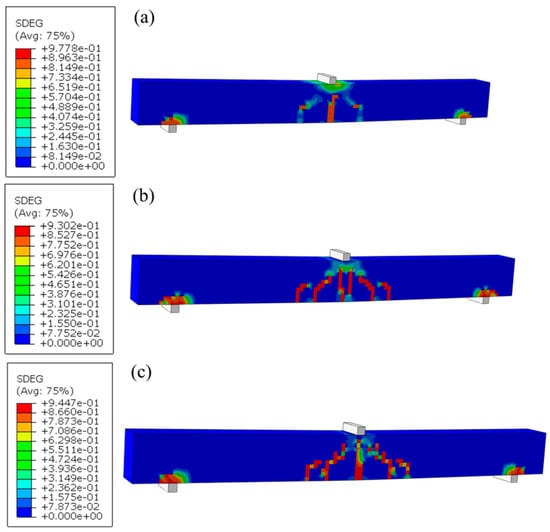
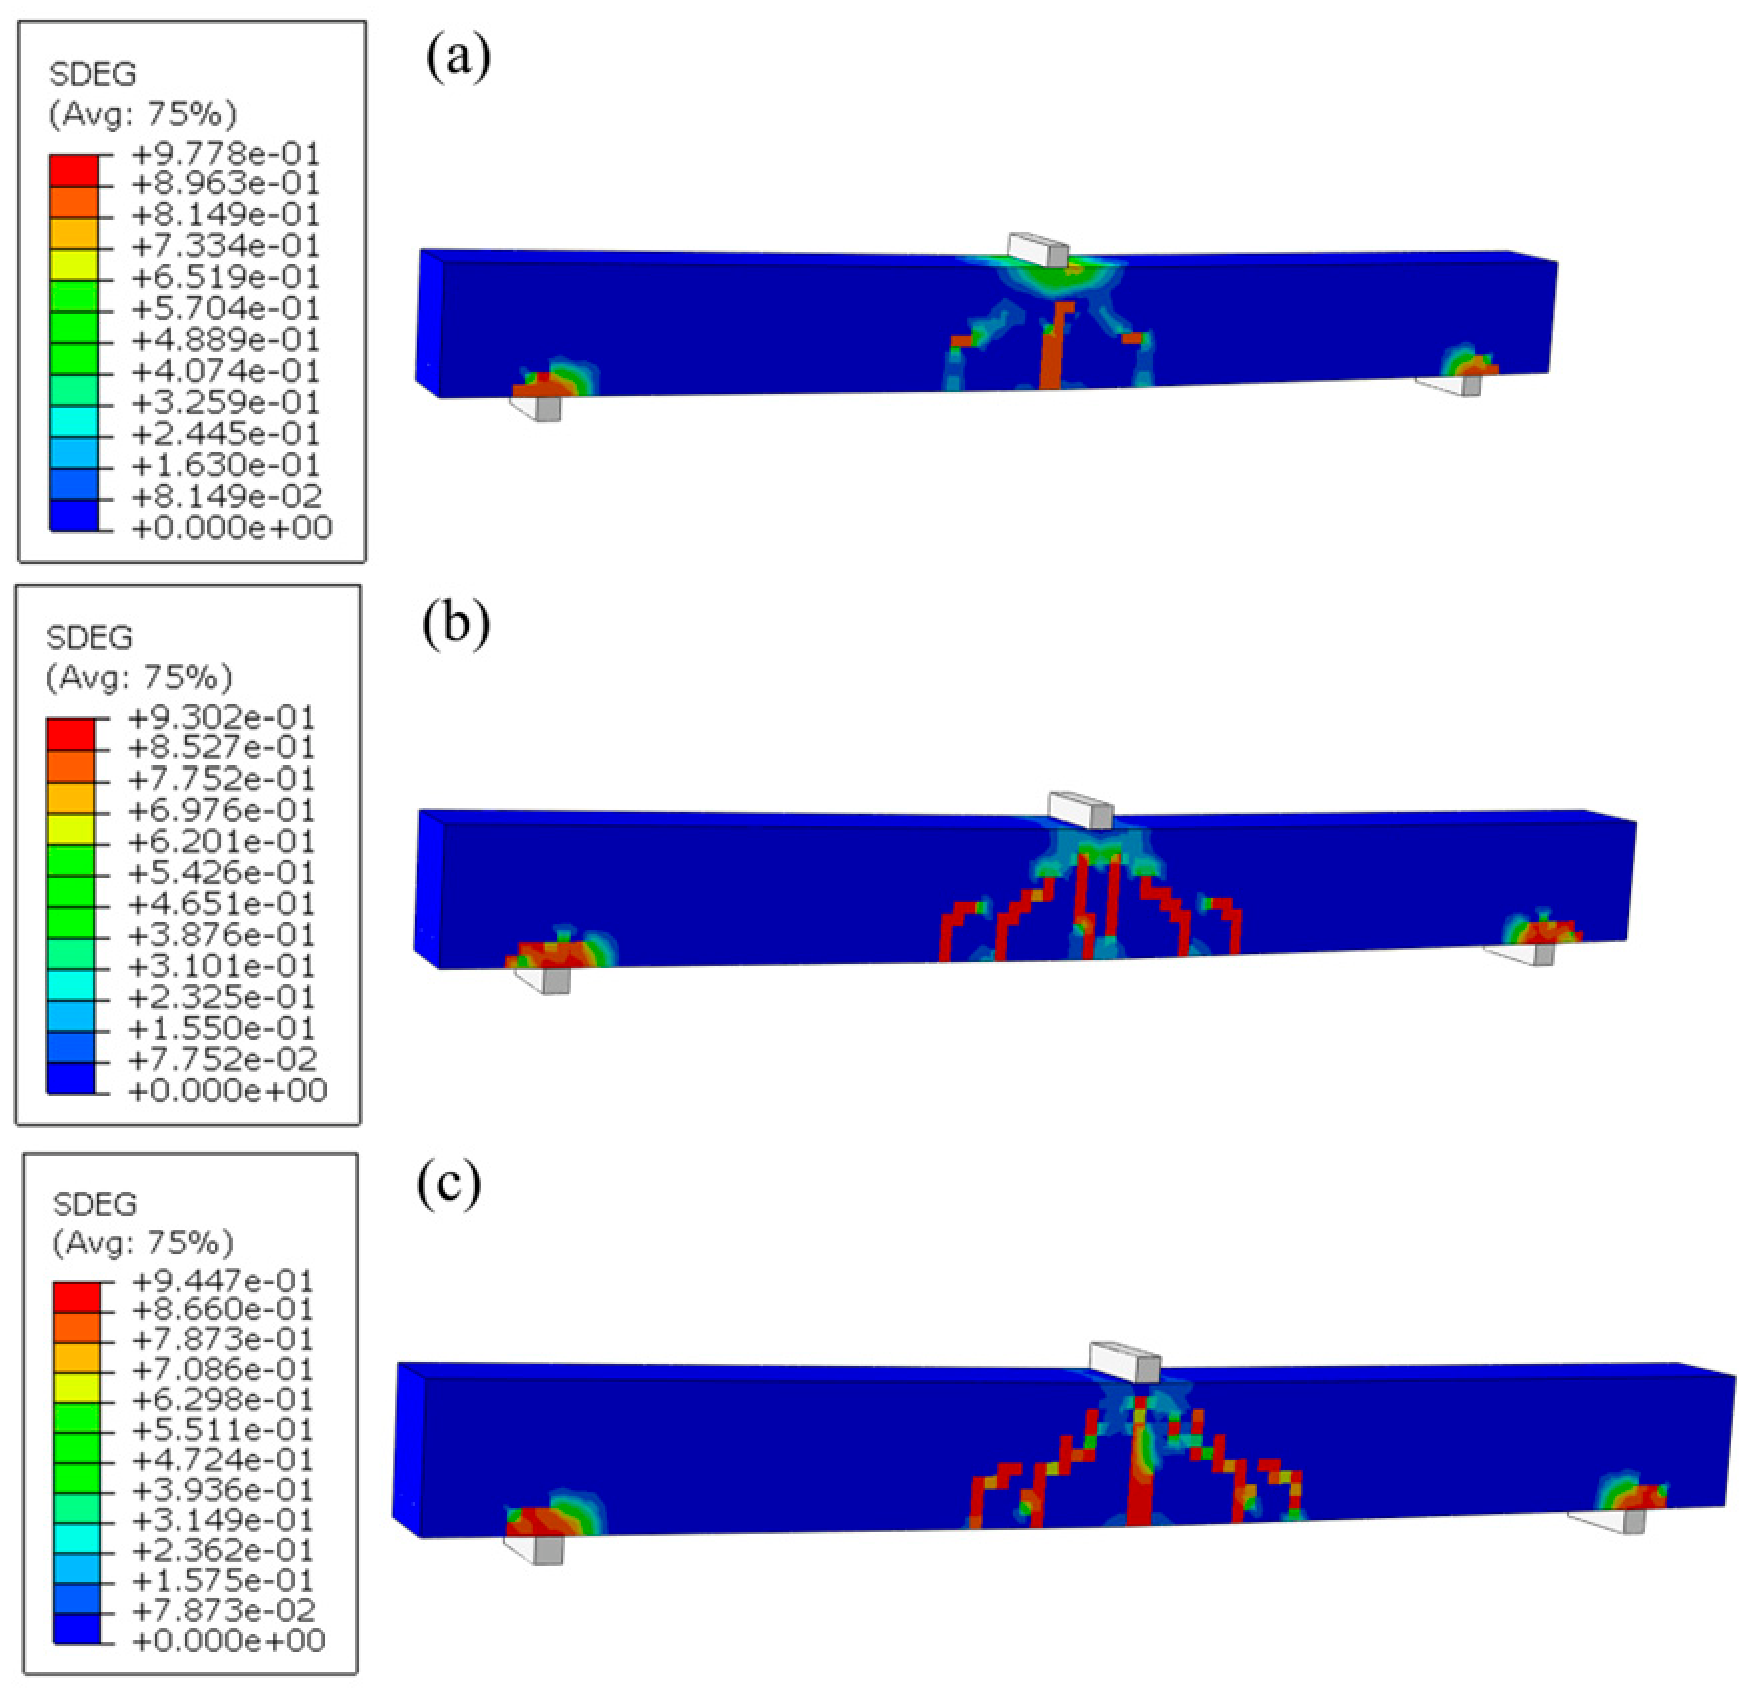
The SDEG contours at the ultimate load are shown in Figure 8. They indicate numerical damage localization rather than measured physical crack width. A dominant diagonal damage localization band developed between the loading region and the support in each model, while the extent of the high-damage region increased from B1 to B4.
Figure 8.
Final SDEG failure patterns for beams of different sizes: (a) B1-S-A5; (b) B2-S-A5; (c) B4-S-A5.
3.3. Effect of Shear Span-to-Depth Ratio
3.3.1. Cracking and Shear Strengths
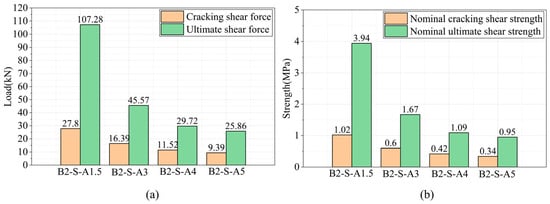
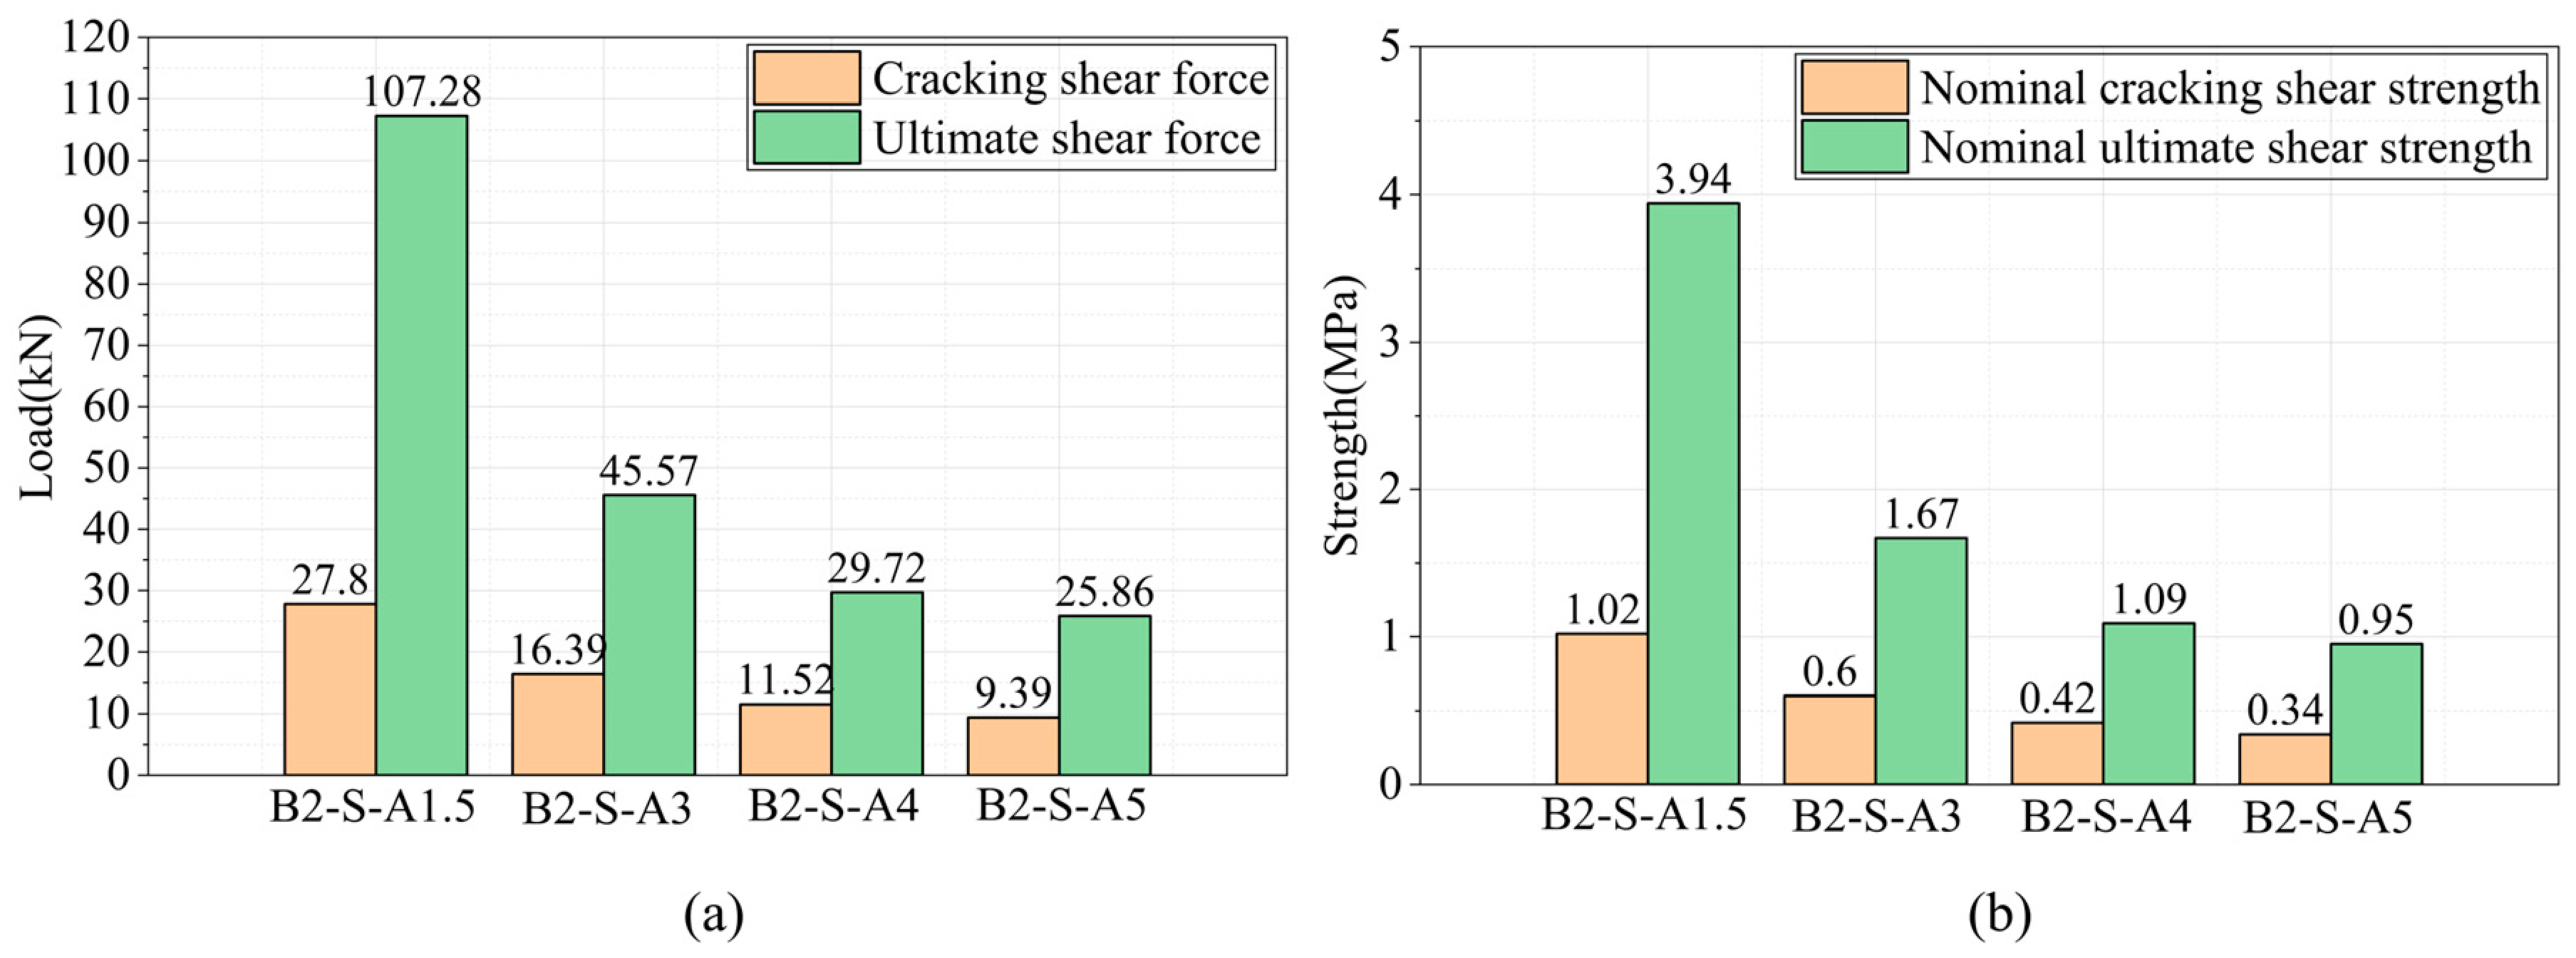
The calculated Vcr, vcr, Vu, and vu values for models with different shear span-to-depth ratios are presented in Figure 9. As a/d increased from 1.5 to 5.0, both the cracking shear force and nominal cracking shear strength decreased. Taking a/d = 1.5 as the reference, vcr decreased by 41.0%, 58.6%, and 66.2% for the other three models. The ultimate shear force and nominal ultimate shear strength followed a similar trend, with vu decreasing by 57.5%, 72.3%, and 75.9%, respectively. These results demonstrate that increasing a/d markedly reduces both the cracking and ultimate shear performance of the beams, with a more pronounced effect on the ultimate shear strength.
Figure 9.
Comparison of beams with different shear span-to-depth ratios: (a) shear force; (b) shear strength.
3.3.2. Load–Displacement Curves and Normalized Response
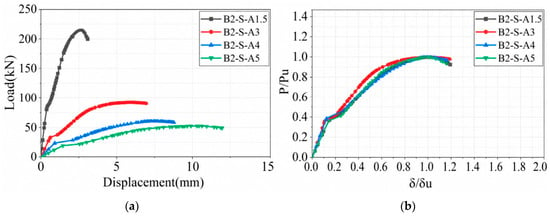
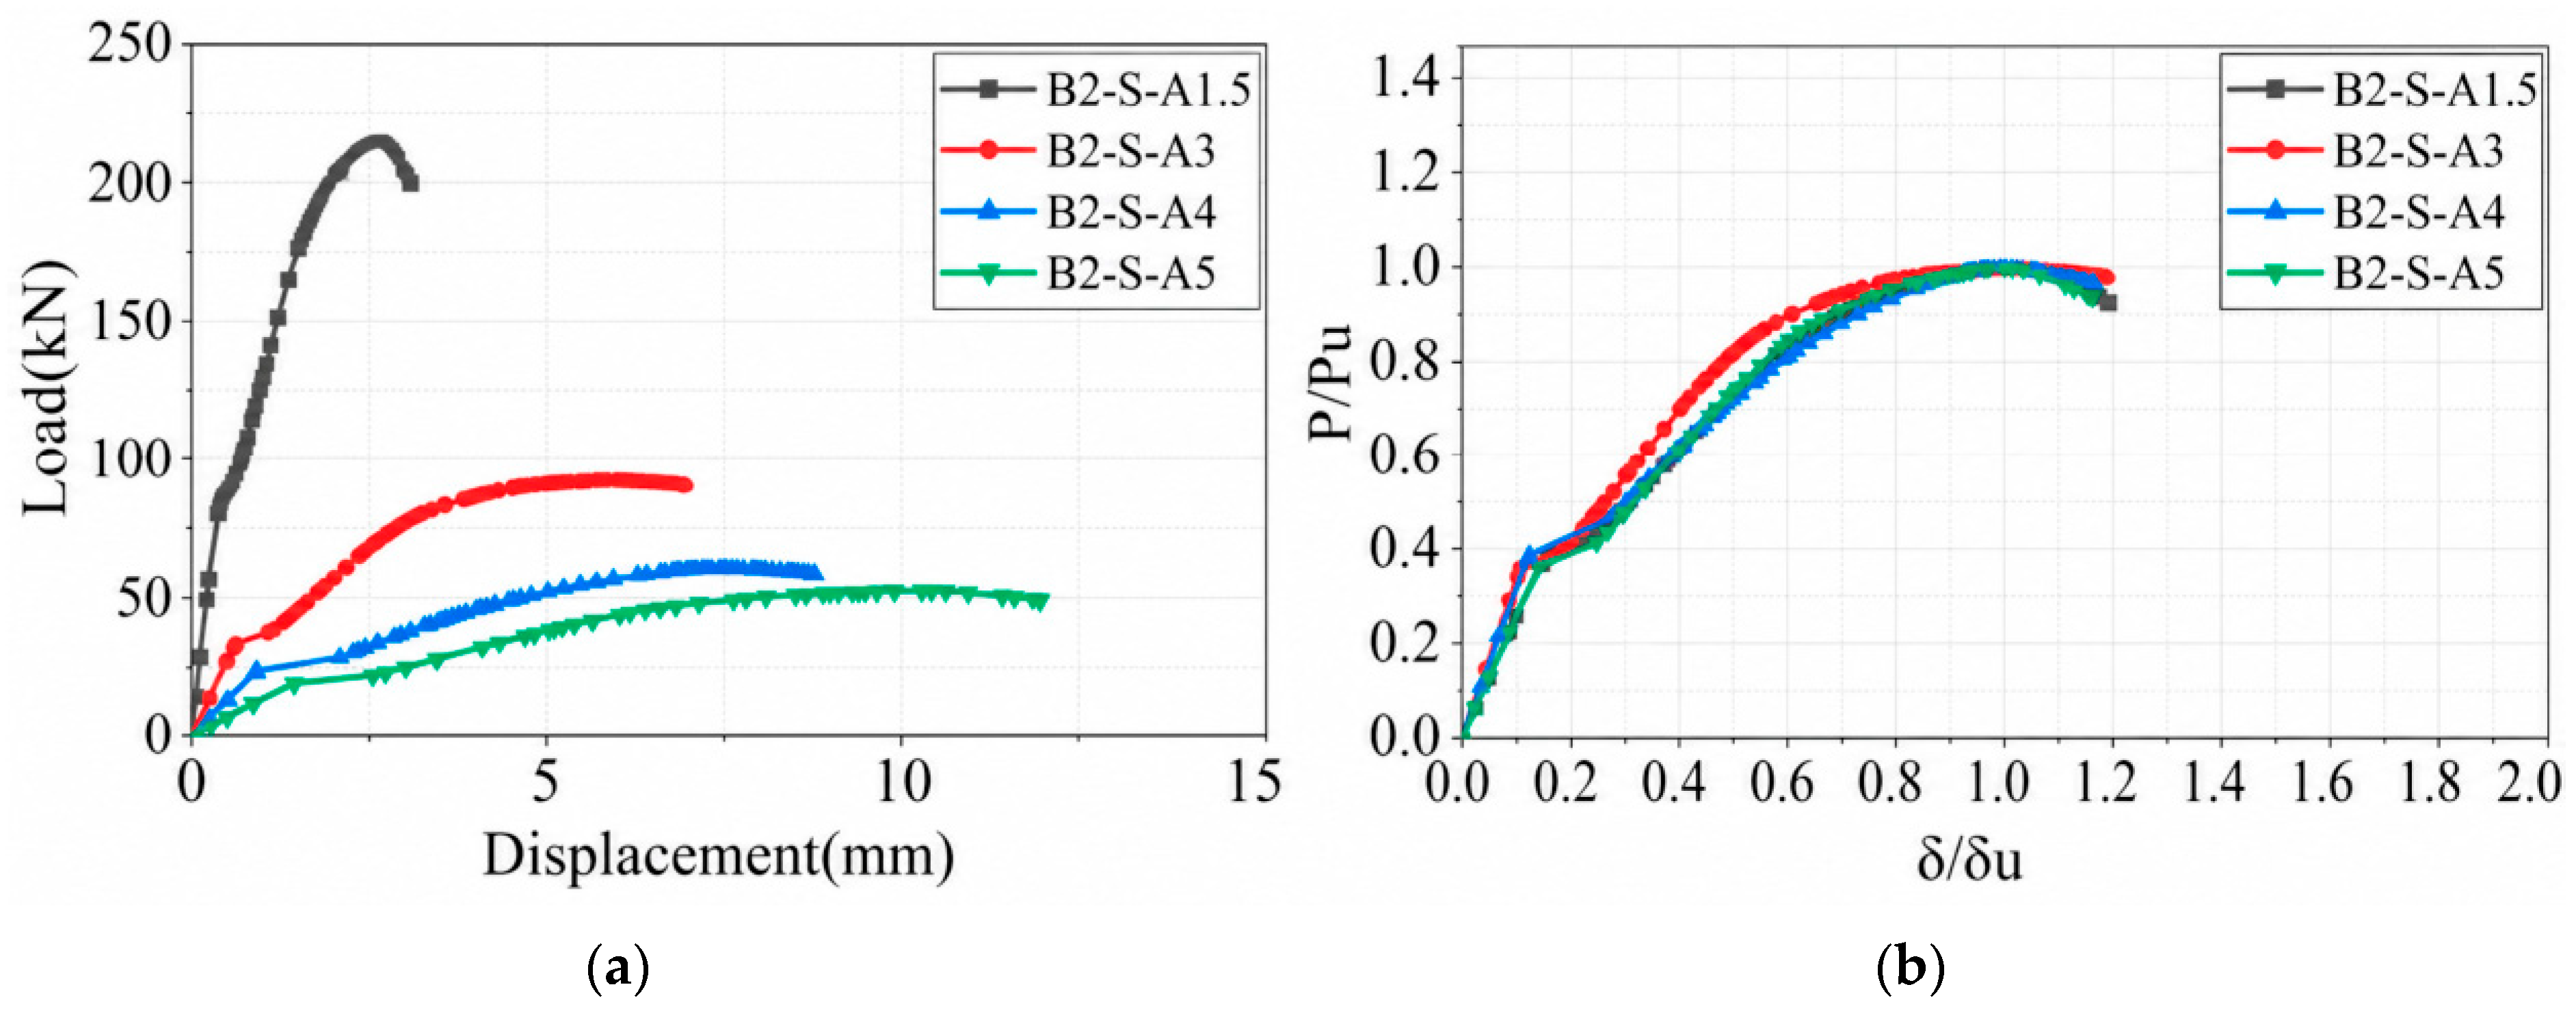
The load–displacement curves and normalized curves for beams with different shear span-to-depth ratios are shown in Figure 10a and Figure 10b, respectively. As a/d increased from 1.5 to 5.0, the displacement at the peak load increased from 2.59 to 10.26 mm, whereas the ultimate load decreased from approximately 214.56 to approximately 51.72 kN. After normalization, the curves for the different a/d values showed a high degree of similarity, with comparable trends through cracking and subsequent nonlinear development. This indicates that the shear span-to-depth ratio primarily governs the load level and deformation scale, while having a relatively limited effect on the normalized evolution of deformation.
Figure 10.
(a) Load–displacement curves for beams with different shear span-to-depth ratios; (b) normalized load–displacement curves.
3.3.3. Structural Stiffness and Global Energy Dissipation
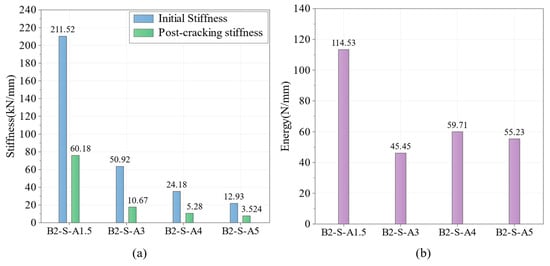
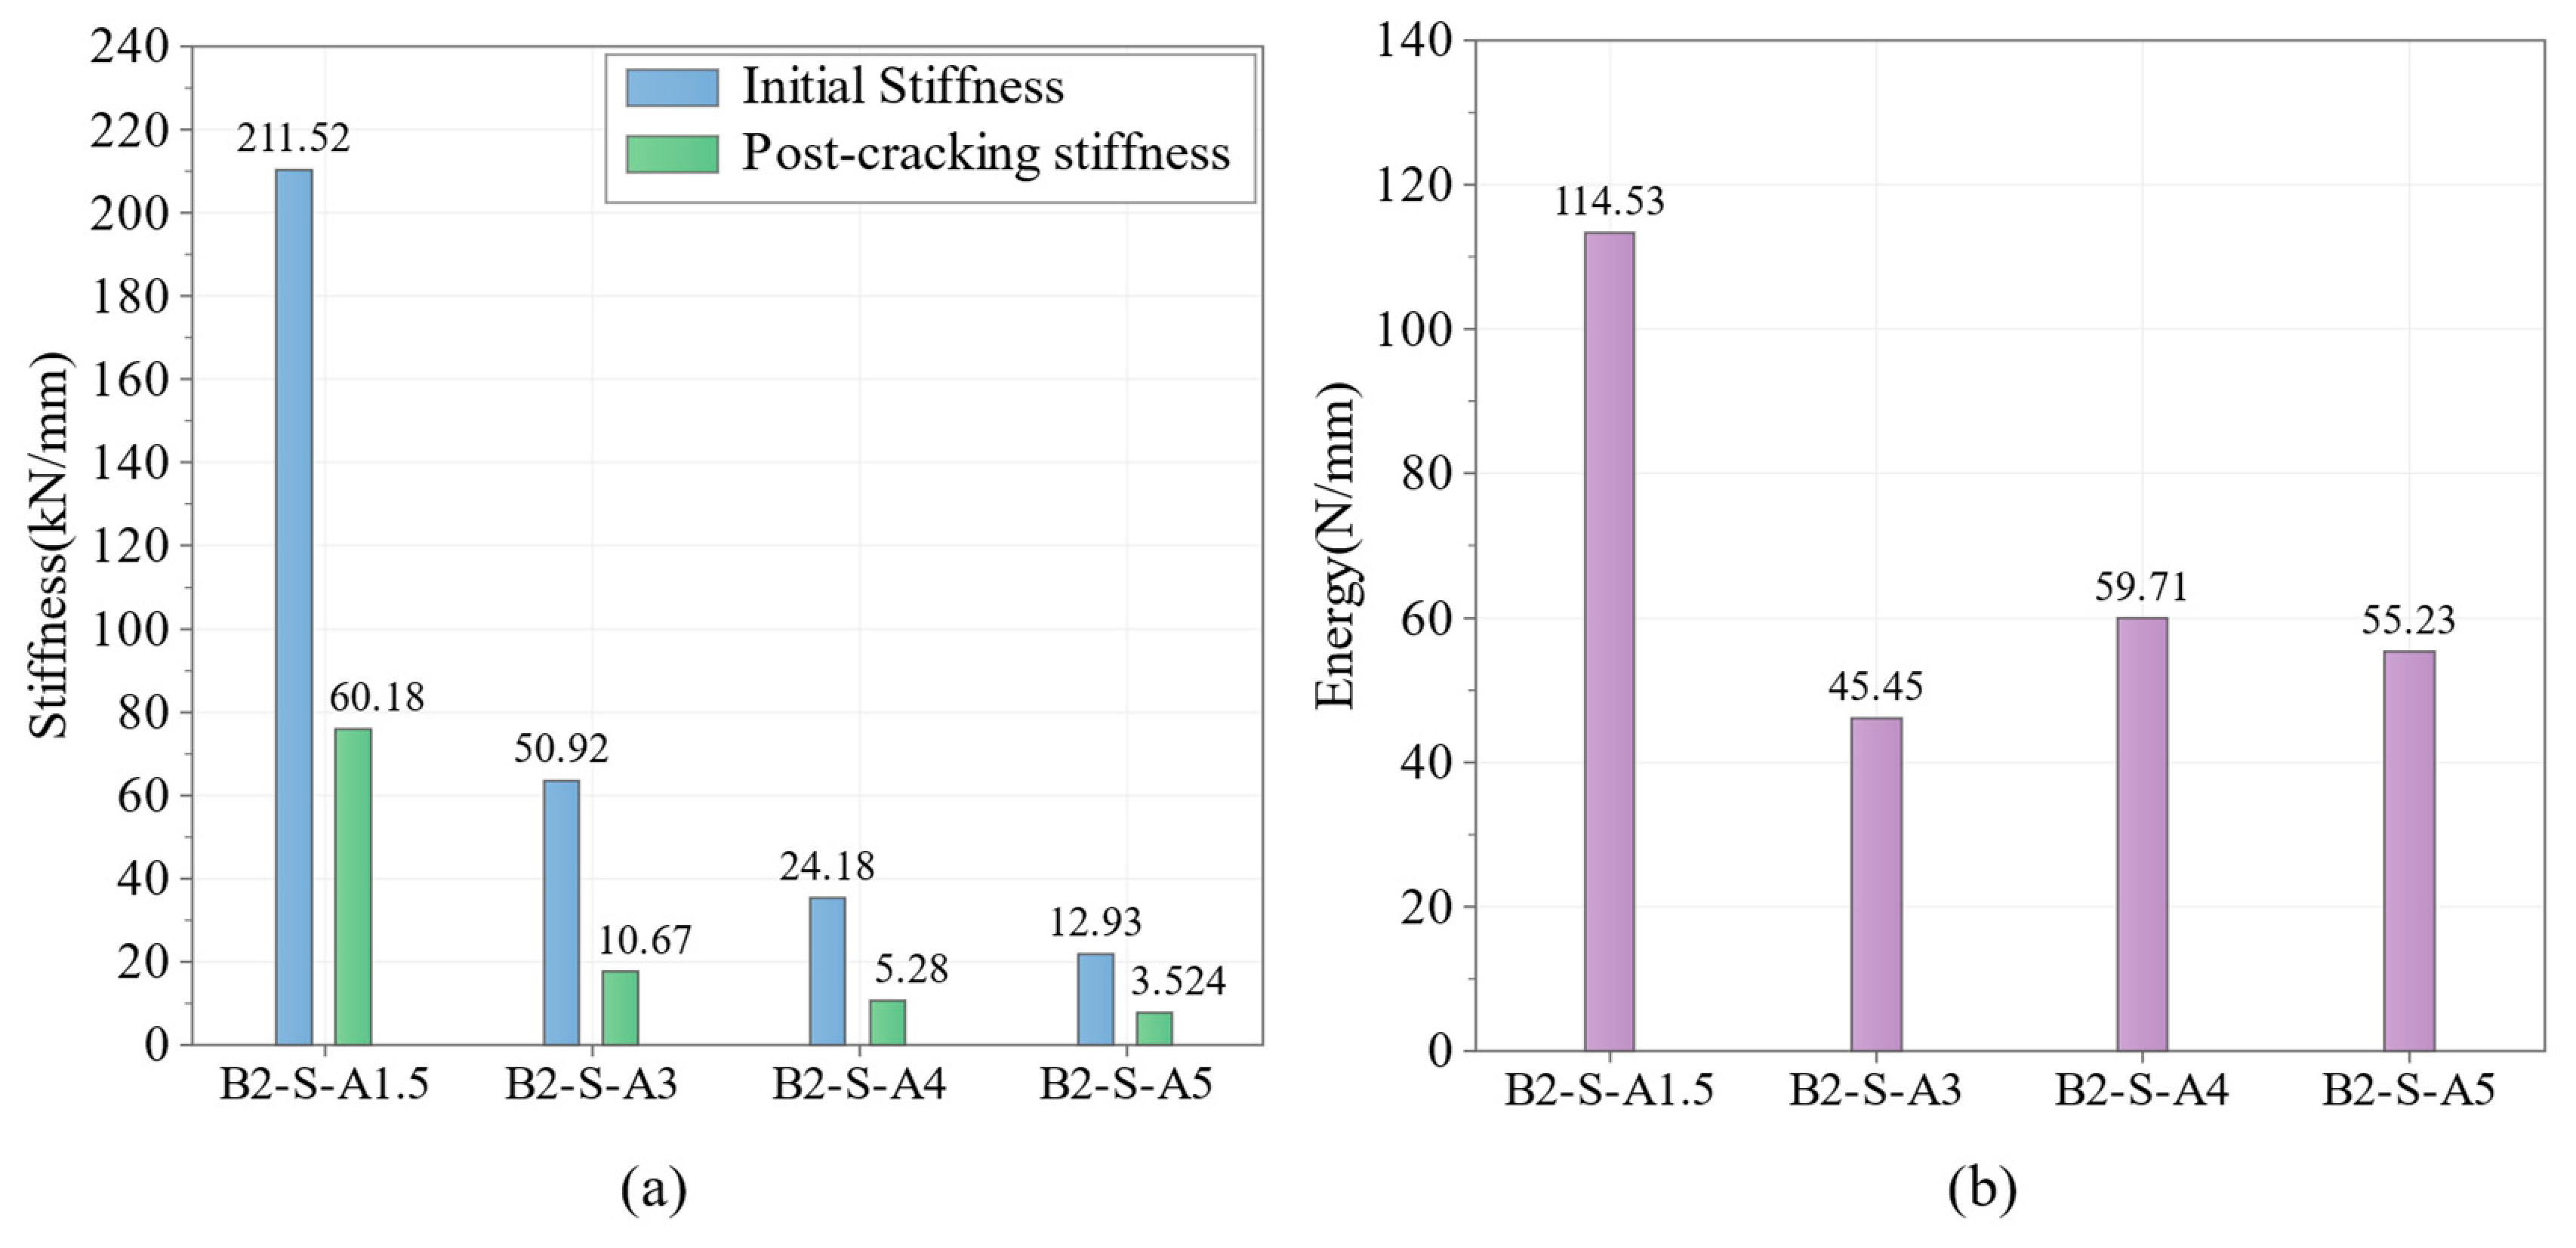
The structural stiffnesses and global energy dissipation indices of beams with different shear span-to-depth ratios are compared in Figure 11. As a/d increased from 1.5 to 5.0, both the initial and post-cracking stiffness decreased. The global energy index was evaluated to the same approximate 0.90 Pu endpoint for all models and is not an intrinsic material fracture energy.
Figure 11.
Comparison of beams with different shear span-to-depth ratios: (a) stiffness; (b) global structural energy dissipation index.
3.3.4. Final Failure Characteristics
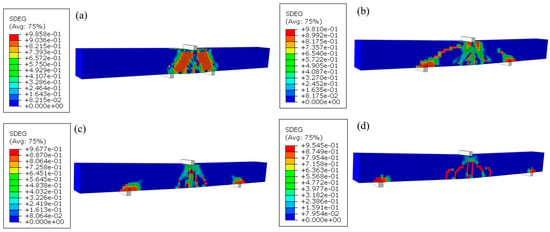
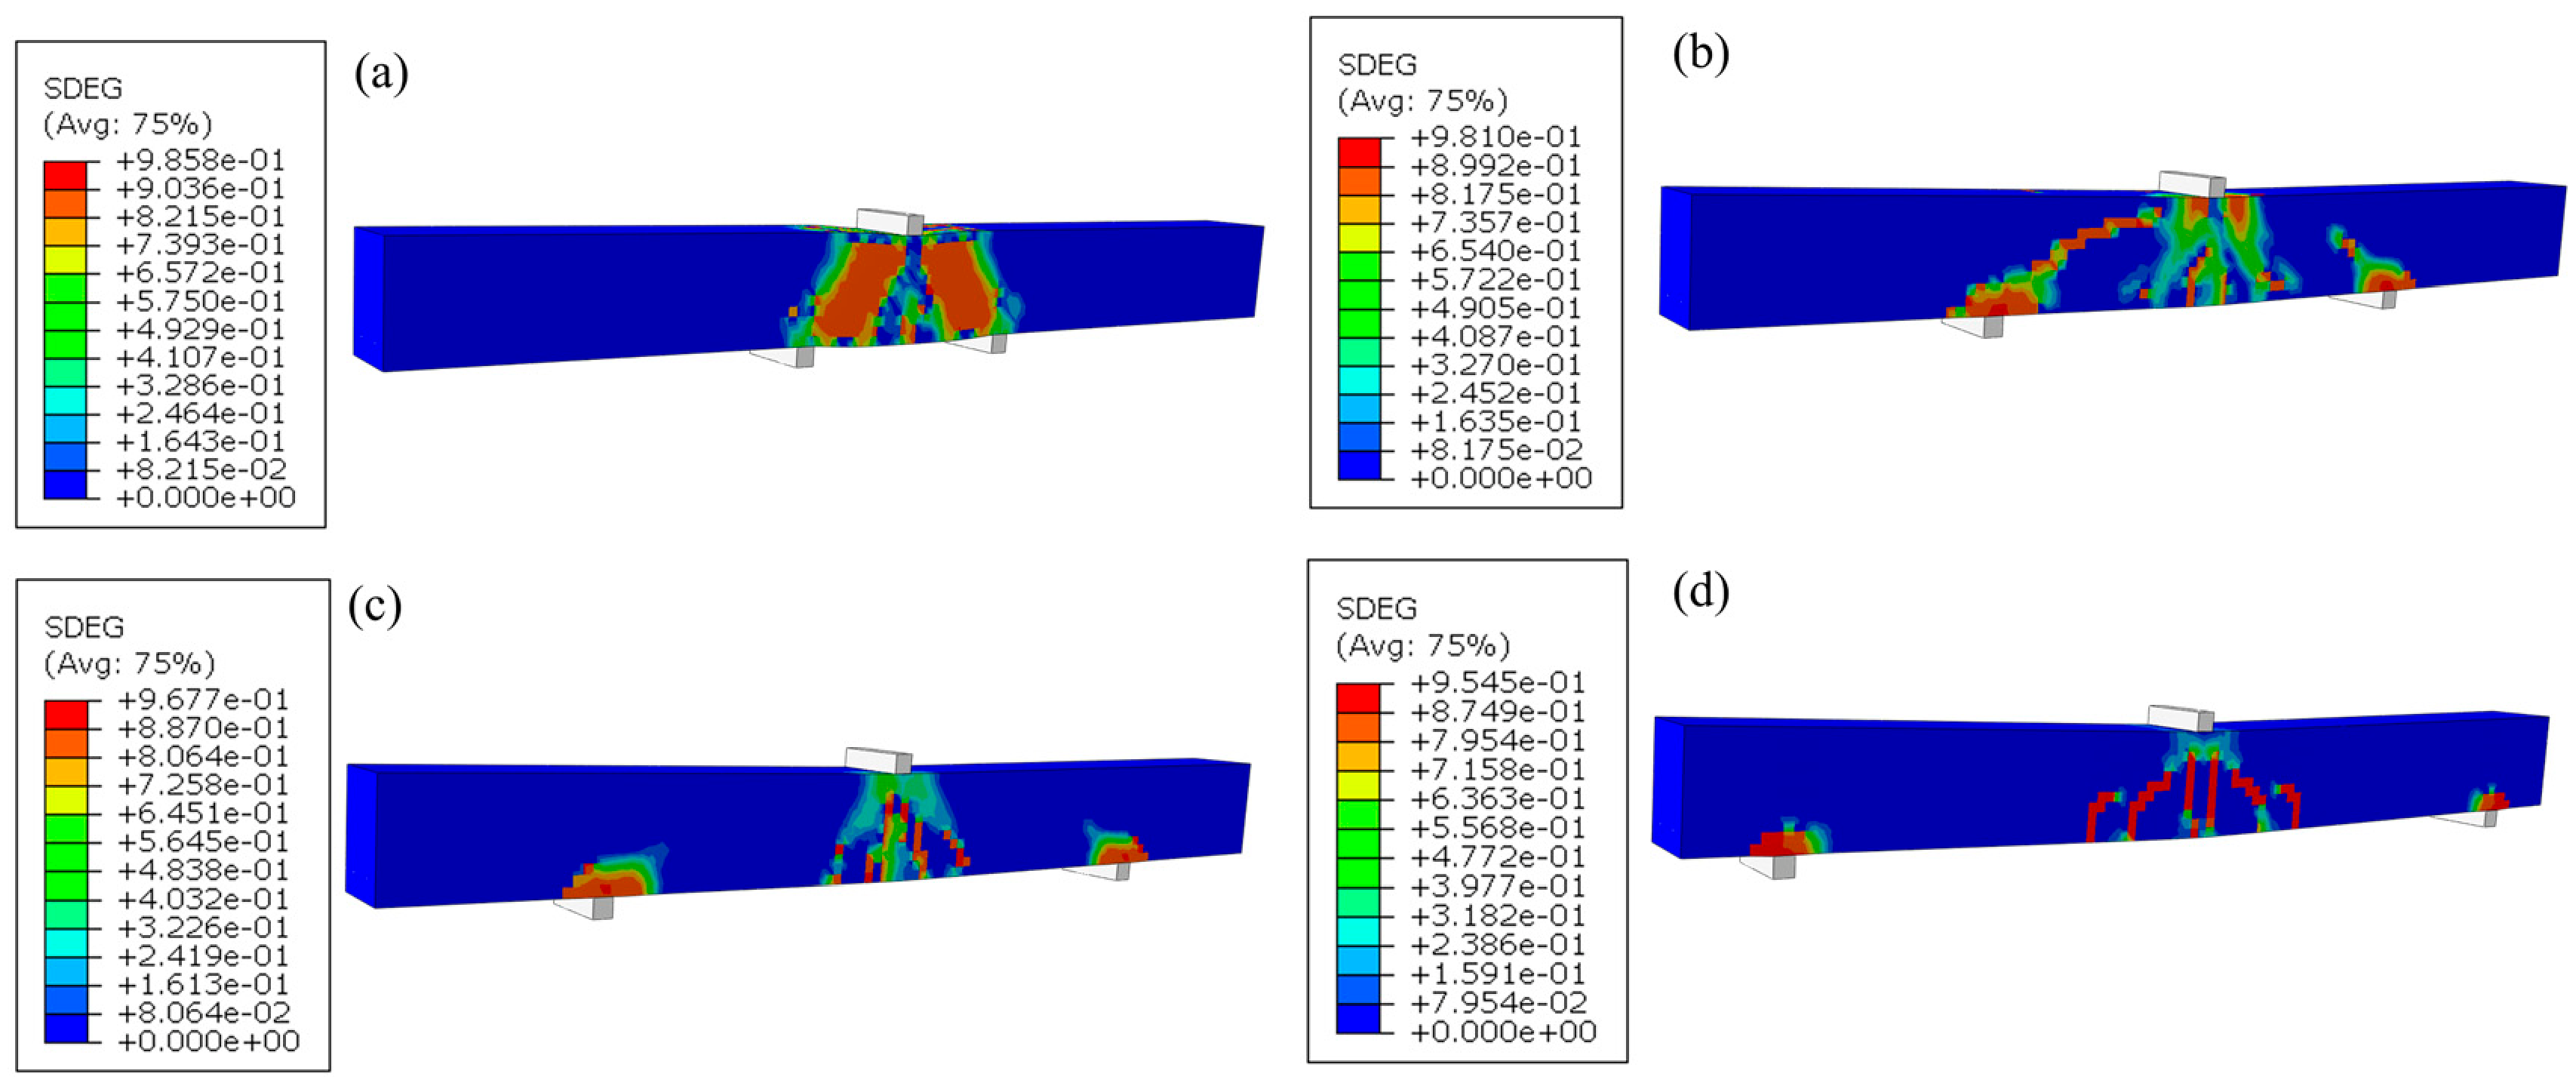
The SDEG contours at final failure are shown in Figure 12. The a/d = 1.5 model is interpreted as an arch action/deep beam regime, whereas the larger a/d models progressively approach beam action [22]. The region near a/d ≈ 3 is discussed as a numerical transition region rather than a universal mechanistic boundary.
Figure 12.
Final SDEG failure patterns for beams with different shear span-to-depth ratios: (a) B2-S-A1.5; (b) B2-S-A3; (c) B2-S-A4; (d) B2-S-A5.
3.4. Effect of Longitudinal Reinforcement Type
3.4.1. Cracking and Shear Strengths
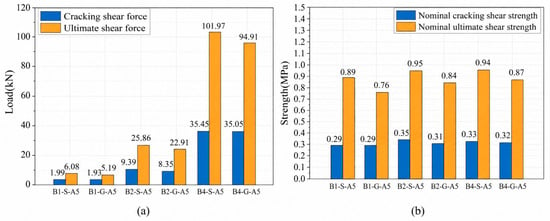
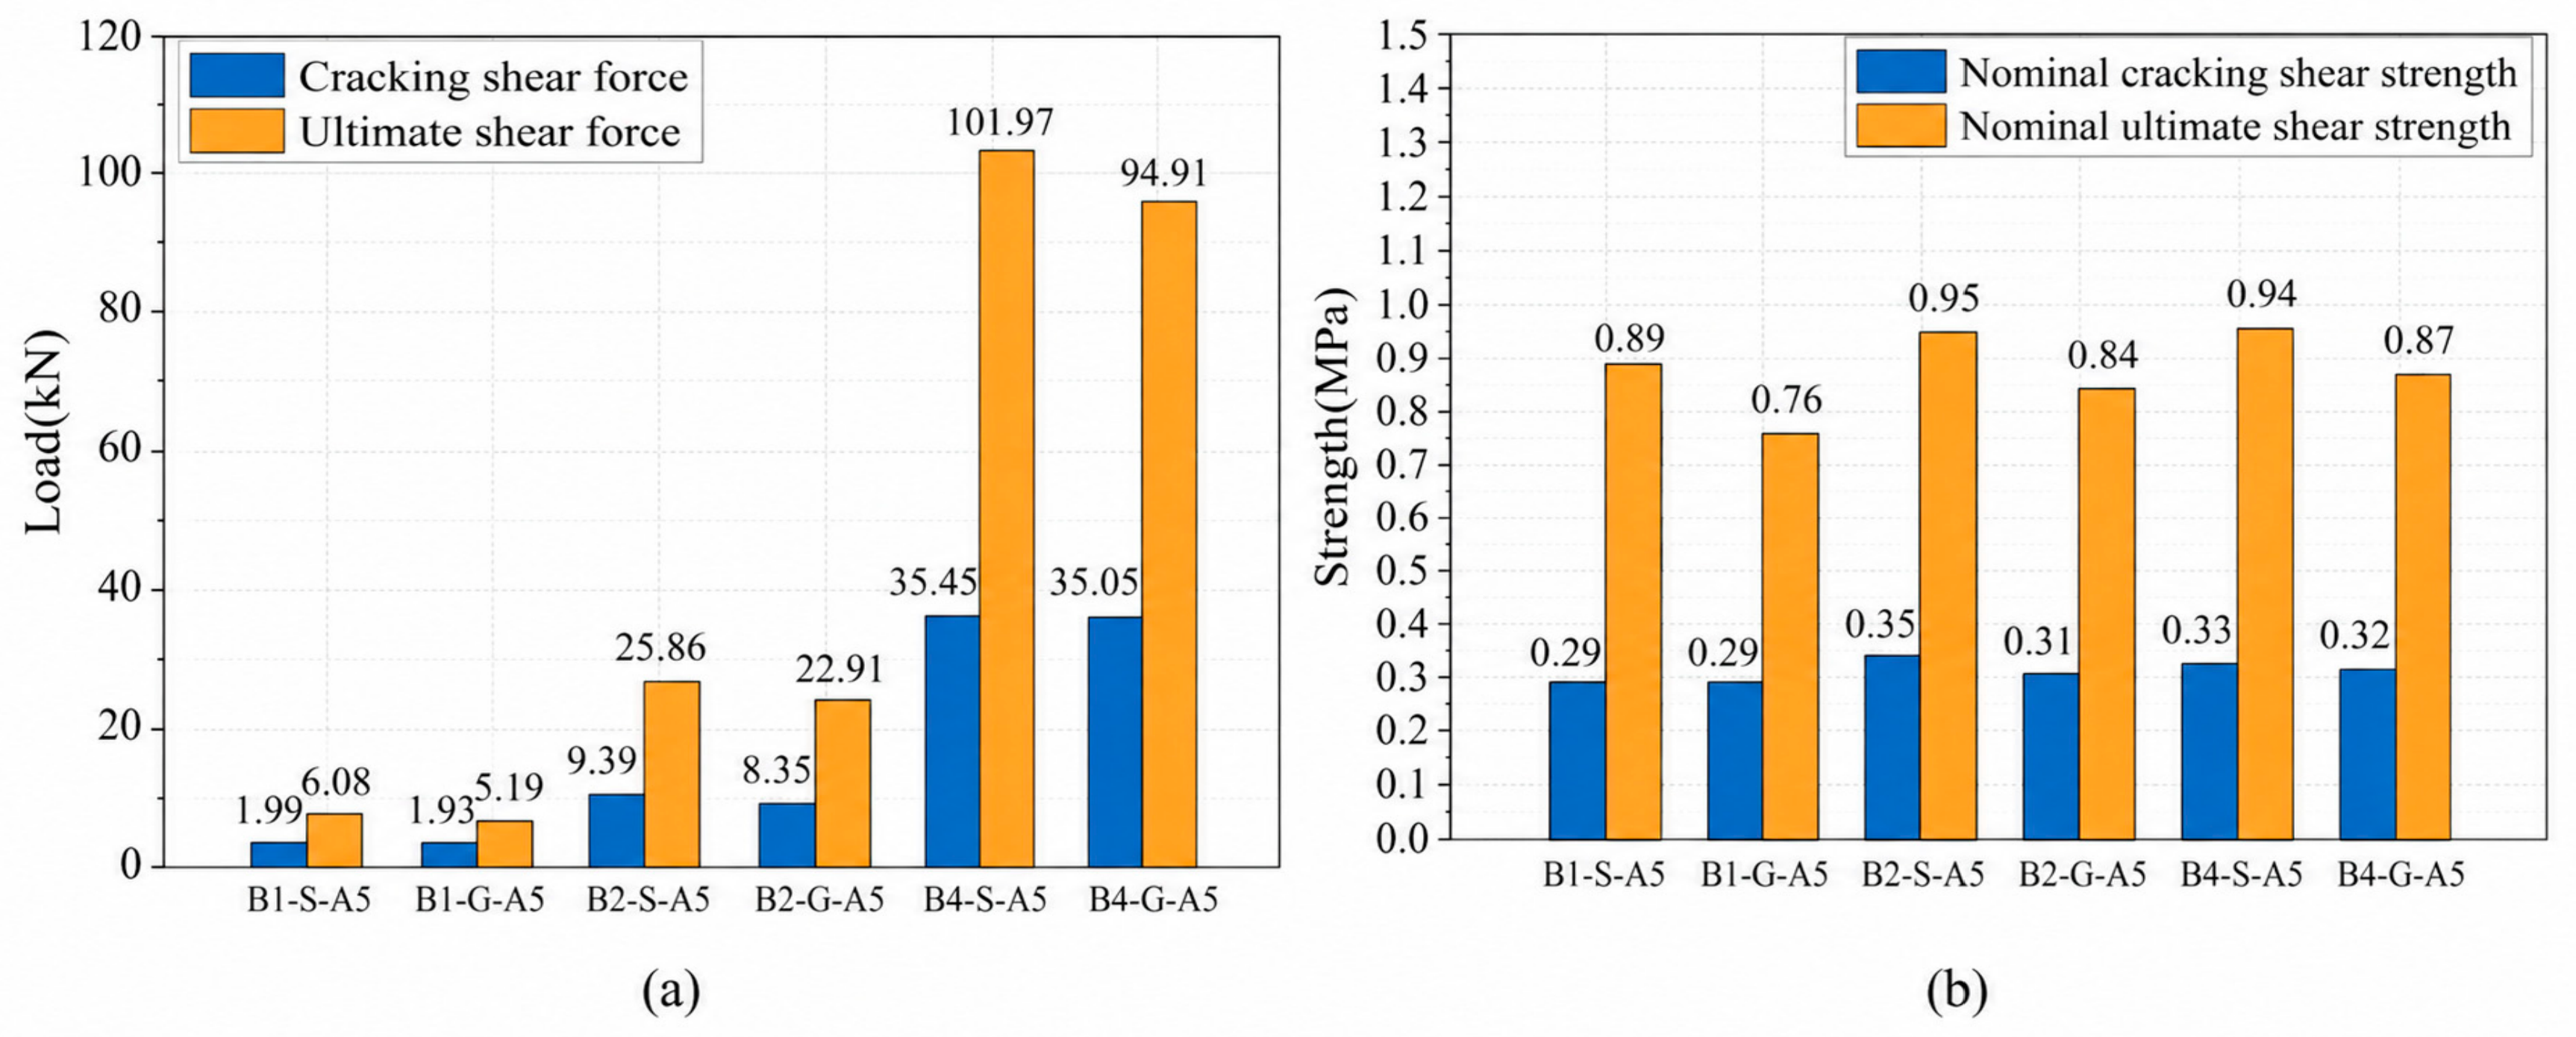
The cracking shear force Vcr and ultimate shear force Vu were extracted from the finite element results for the steel- and GFRP-reinforced beams, and the nominal cracking strength vcr and nominal ultimate shear strength vu were used to compare the size-dependent behavior of beams with different longitudinal reinforcement. As shown in Figure 13, both Vcr and Vu increased substantially with the member size for the two reinforcement types, whereas the changes in vcr and vu were much smaller than the corresponding increases in shear force. Steel- and GFRP-reinforced beams therefore exhibited broadly similar size-dependent trends.
Figure 13.
Comparison between steel- and GFRP-reinforced beams: (a) shear force; (b) nominal shear strength.
At a given member size, Vcr of the GFRP-reinforced beams was 2.59%, 11.0%, and 1.14% lower than that of the corresponding steel-reinforced beams, while vcr was unchanged for B1 and lower by 11.43% and 3.03% for B2 and B4, respectively. Except for the intermediate-size beam, the differences between the two reinforcement types at cracking were small and did not vary monotonically with size. This suggests that reducing the longitudinal reinforcement stiffness has a limited effect on the initial formation of diagonal cracks, and that cracking shear resistance remains governed primarily by the tensile properties of the concrete and the cross-sectional geometry. By contrast, the effect of the reinforcement type was more evident at the ultimate stage. Relative to the corresponding steel-reinforced beams, Vu of the GFRP-reinforced beams was lower by 14.62%, 11.41%, and 6.92%, while vu was lower by 14.61%, 11.58%, and 7.45%, respectively. As the member size increased from B1 to B4, the relative difference in ultimate shear performance between the two reinforcement types progressively decreased. Lower longitudinal reinforcement stiffness therefore weakens shear transfer after diagonal cracking, but its relative influence on ultimate shear performance diminishes with increasing member size.
3.4.2. Load–Displacement Curves and Normalized Response
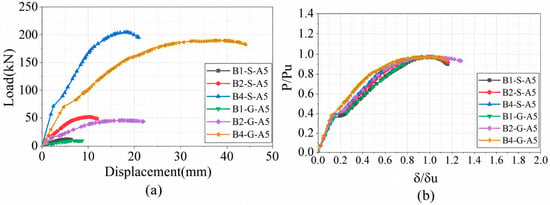
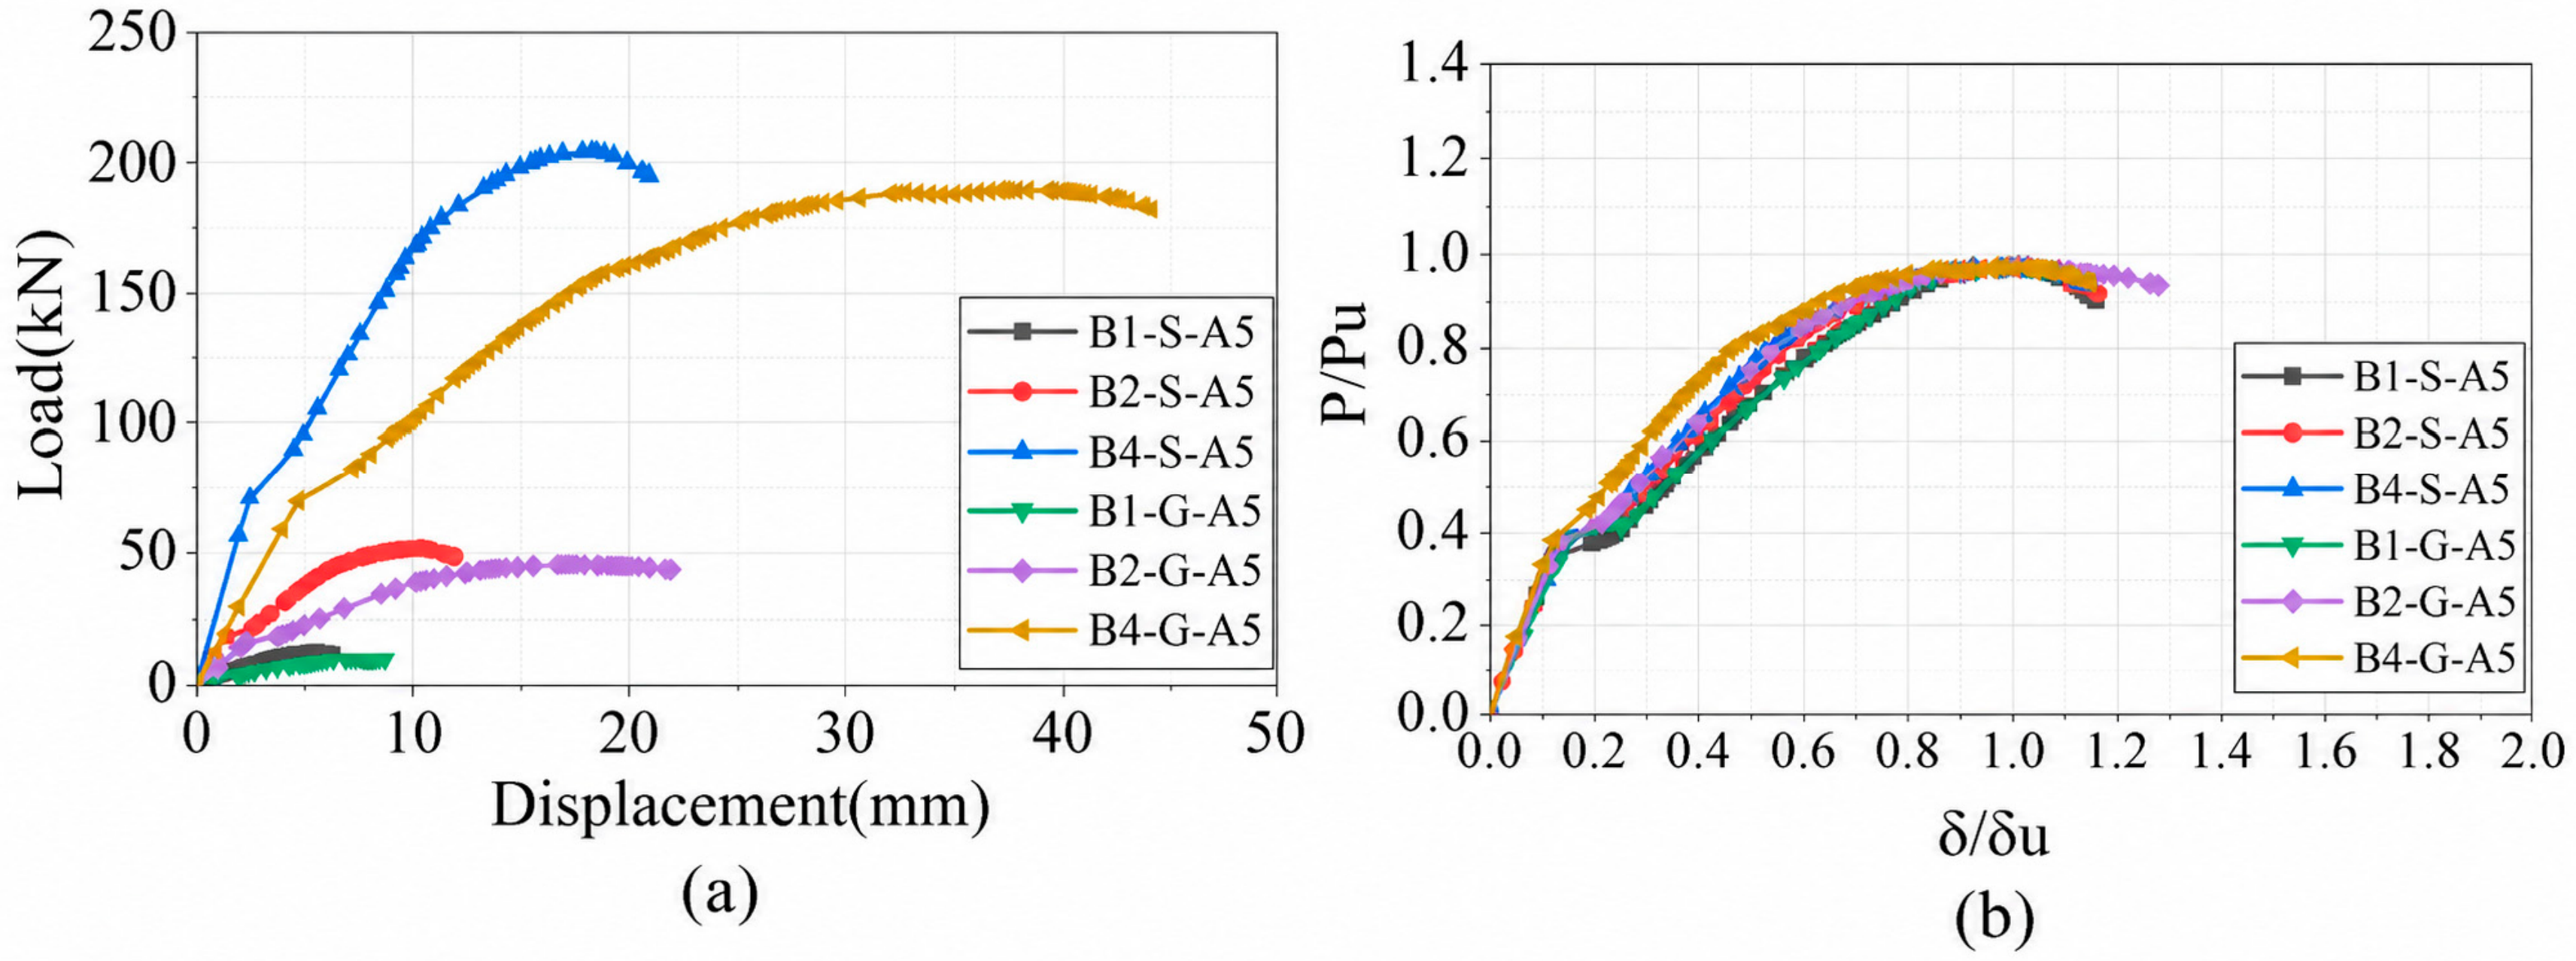
The load–displacement and normalized curves for steel- and GFRP-reinforced beams are shown in Figure 14. Under the intentional perfect bond assumption, the computed differences are associated primarily with the imposed reinforcement elastic and axial stiffness. The model suppresses slip and cannot quantify material-specific bond or anchorage effects on local cracking and stiffness.
Figure 14.
Load–displacement behavior of beams at different sizes: (a) load–displacement curves; (b) normalized load–displacement curves.
After normalization, the curves for both reinforcement types showed broadly similar model series trends. The GFRP-reinforced models had lower peak load and larger displacement at peak load. These deterministic differences are interpreted within the adopted perfect bond model and are not evidence of an independently isolated bond–slip mechanism.
3.4.3. Structural Stiffness and Global Energy Dissipation
The numerical stiffnesses and global structural energy dissipation indices are shown in Figure 15. At each member size, the GFRP-reinforced beams had lower initial and post-cracking stiffness than the steel-reinforced beams. The global energy index was evaluated to the common post-peak endpoint and should not be interpreted as intrinsic material fracture energy.
Figure 15.
Effect of longitudinal reinforcement type: (a) stiffness comparison; (b) global structural energy-dissipation comparison.
3.4.4. Final Failure Characteristics
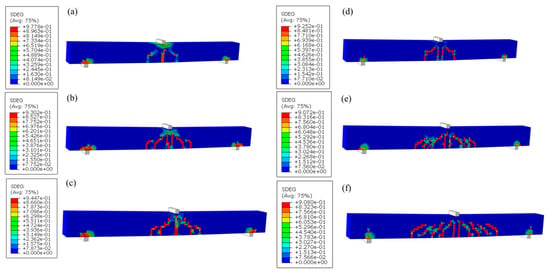
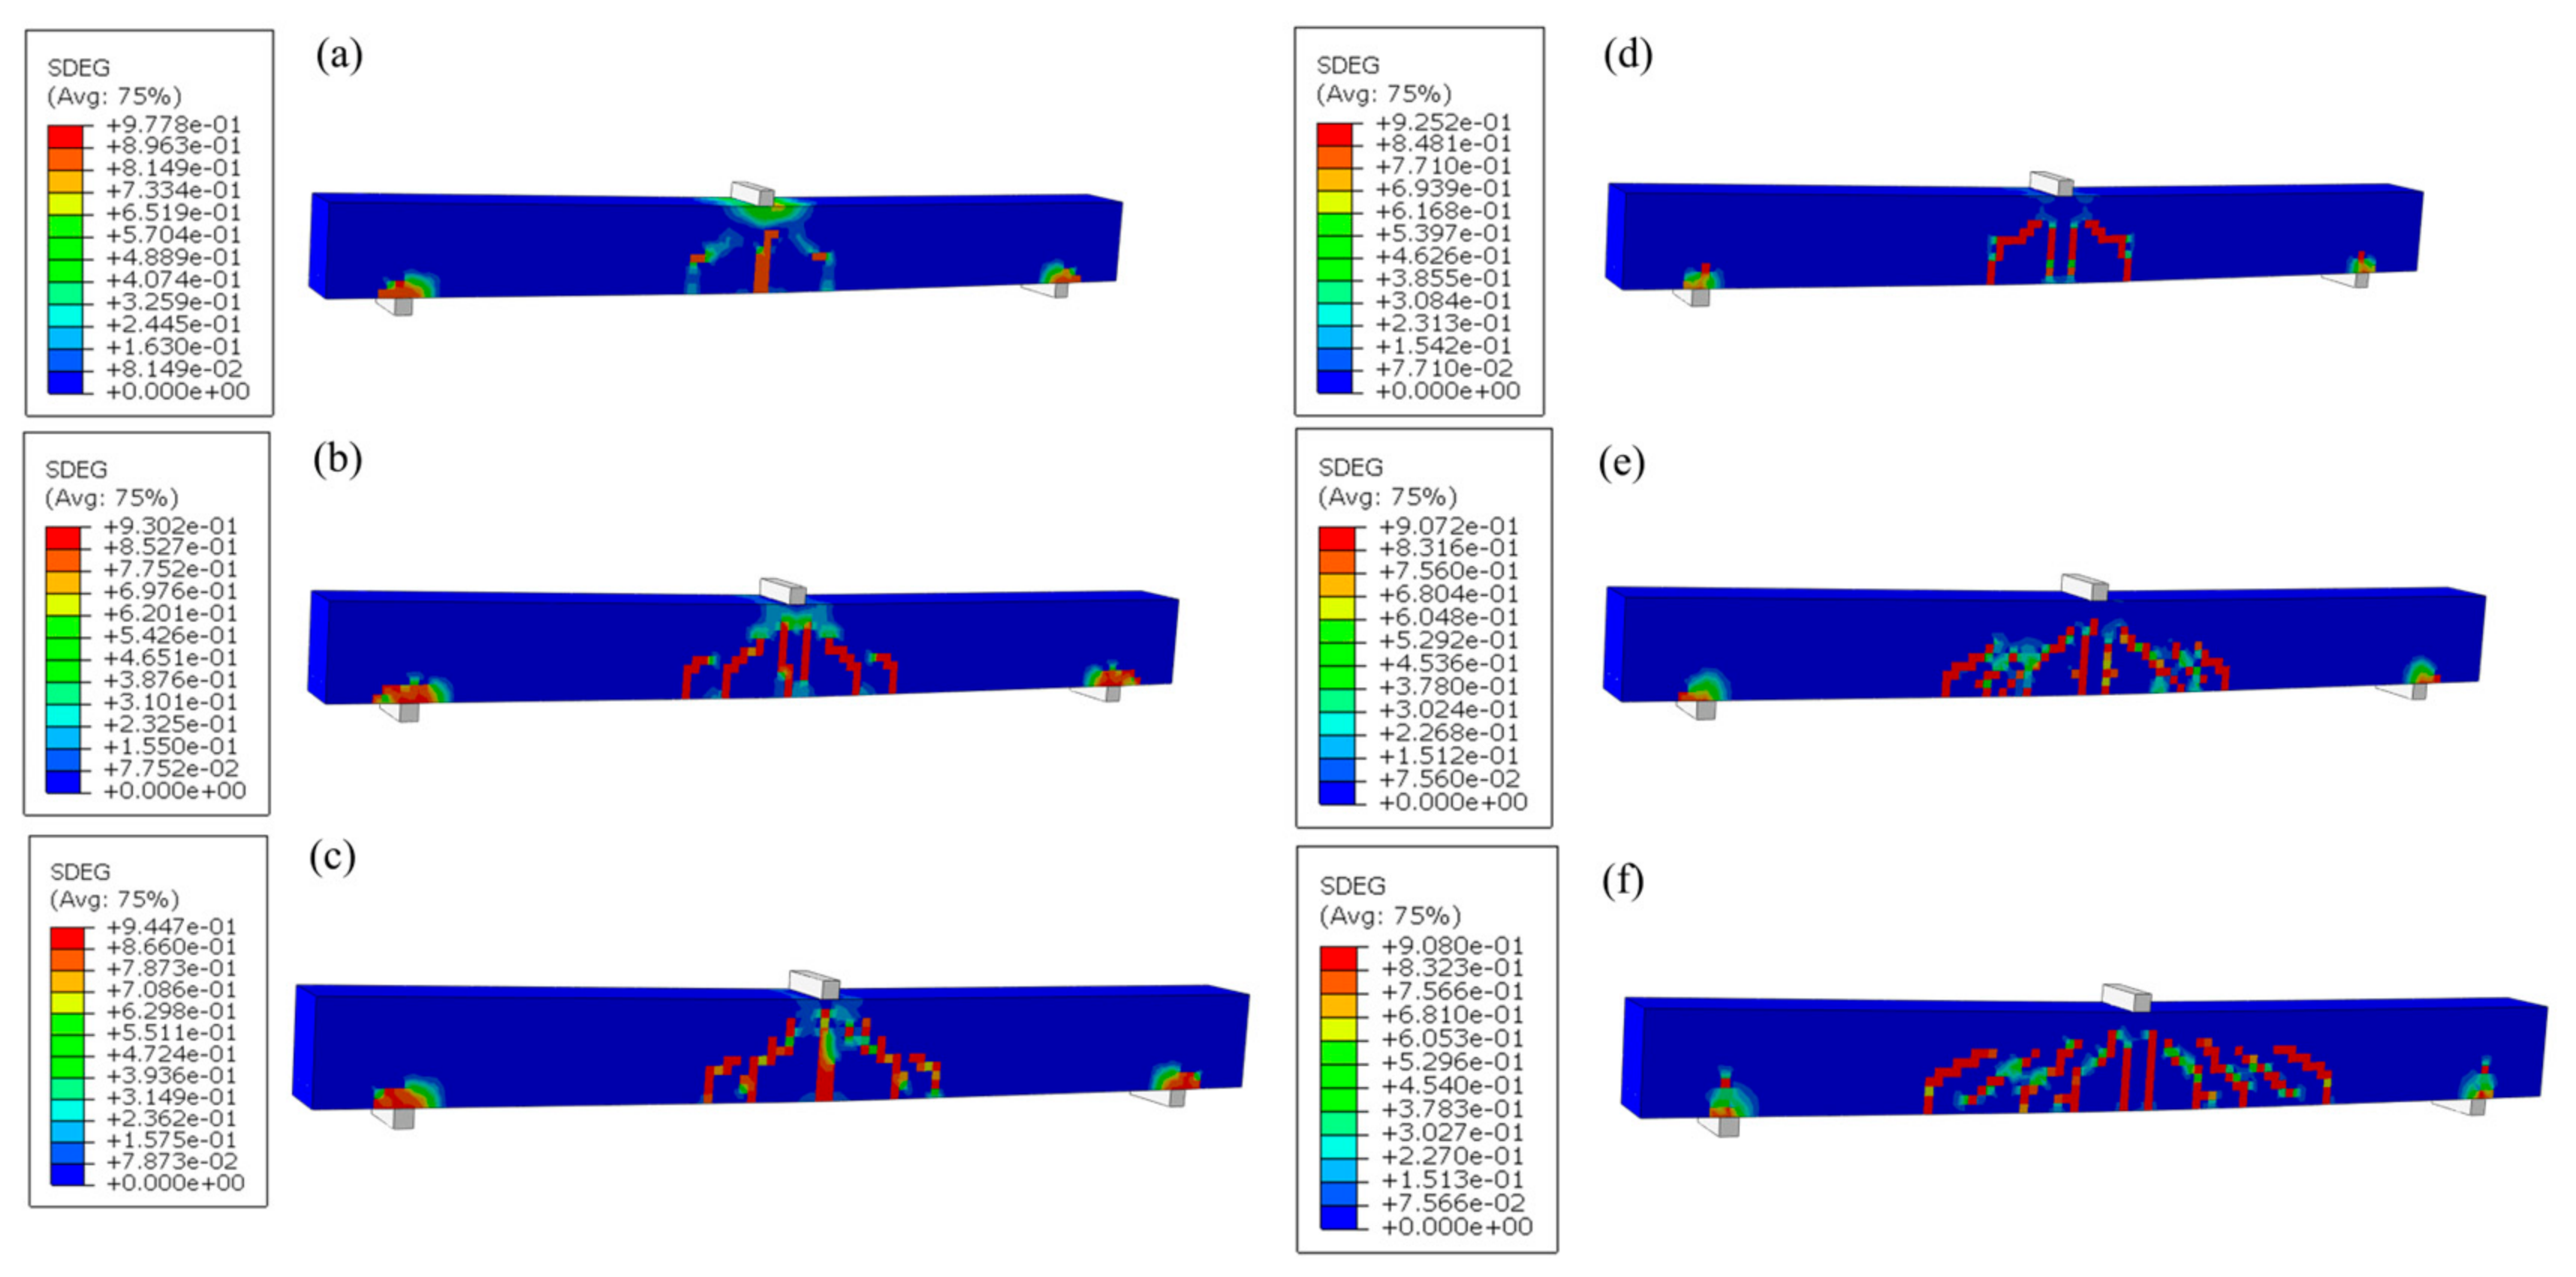
The SDEG contours at final failure for the steel- and GFRP-reinforced beams are shown in Figure 16. Dominant diagonal damage localization in the shear span supports classification of the computed failure as shear-dominated. The maximum GFRP strain remained well below the reference tensile strain of 2.25%, so GFRP rupture did not govern. For the steel-reinforced beams, the available evidence does not exclude local yielding; complete absence of flexural action is therefore not claimed. Because perfect bond suppresses slip and SDEG does not measure physical crack opening, the model does not directly prove a bond–slip or physical crack transfer mechanism.
Figure 16.
Final SDEG failure patterns: (a) B1-S-A5; (b) B2-S-A5; (c) B4-S-A5; (d) B1-G-A5; (e) B2-G-A5; (f) B4-G-A5.
4. Mechanisms and Design Context Comparison
4.1. Member Size Effect
A classical shear size effect is commonly characterized by decreasing nominal strength with increasing effective depth. Here, the member size is evaluated through the numerical B1-B4 series while recognizing departures from strict geometric similitude and the fixed modeling assumptions.
Increasing the effective depth from 85 to 340 mm increased the absolute shear capacity, while the nominal ultimate shear strengths remained approximately 0.895, 0.951, and 0.937 MPa. The longitudinal reinforcement ratio remained approximately ρl ≈ 1.15%, but the local longitudinal bearing dimensions, loading rod diameter, and absolute mesh size were not scaled.
The B1–B4 results are therefore interpreted as member size-dependent numerical responses under the adopted boundary conditions. No classical monotonic nominal strength size effect reduction is claimed, and local bearing effects cannot be completely separated from the computed response.
4.2. Effect of Shear Span-to-Depth Ratio
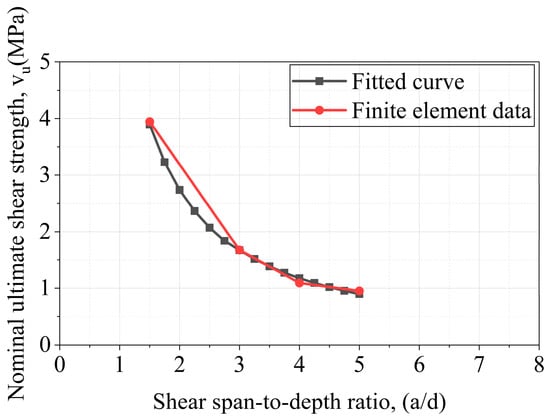
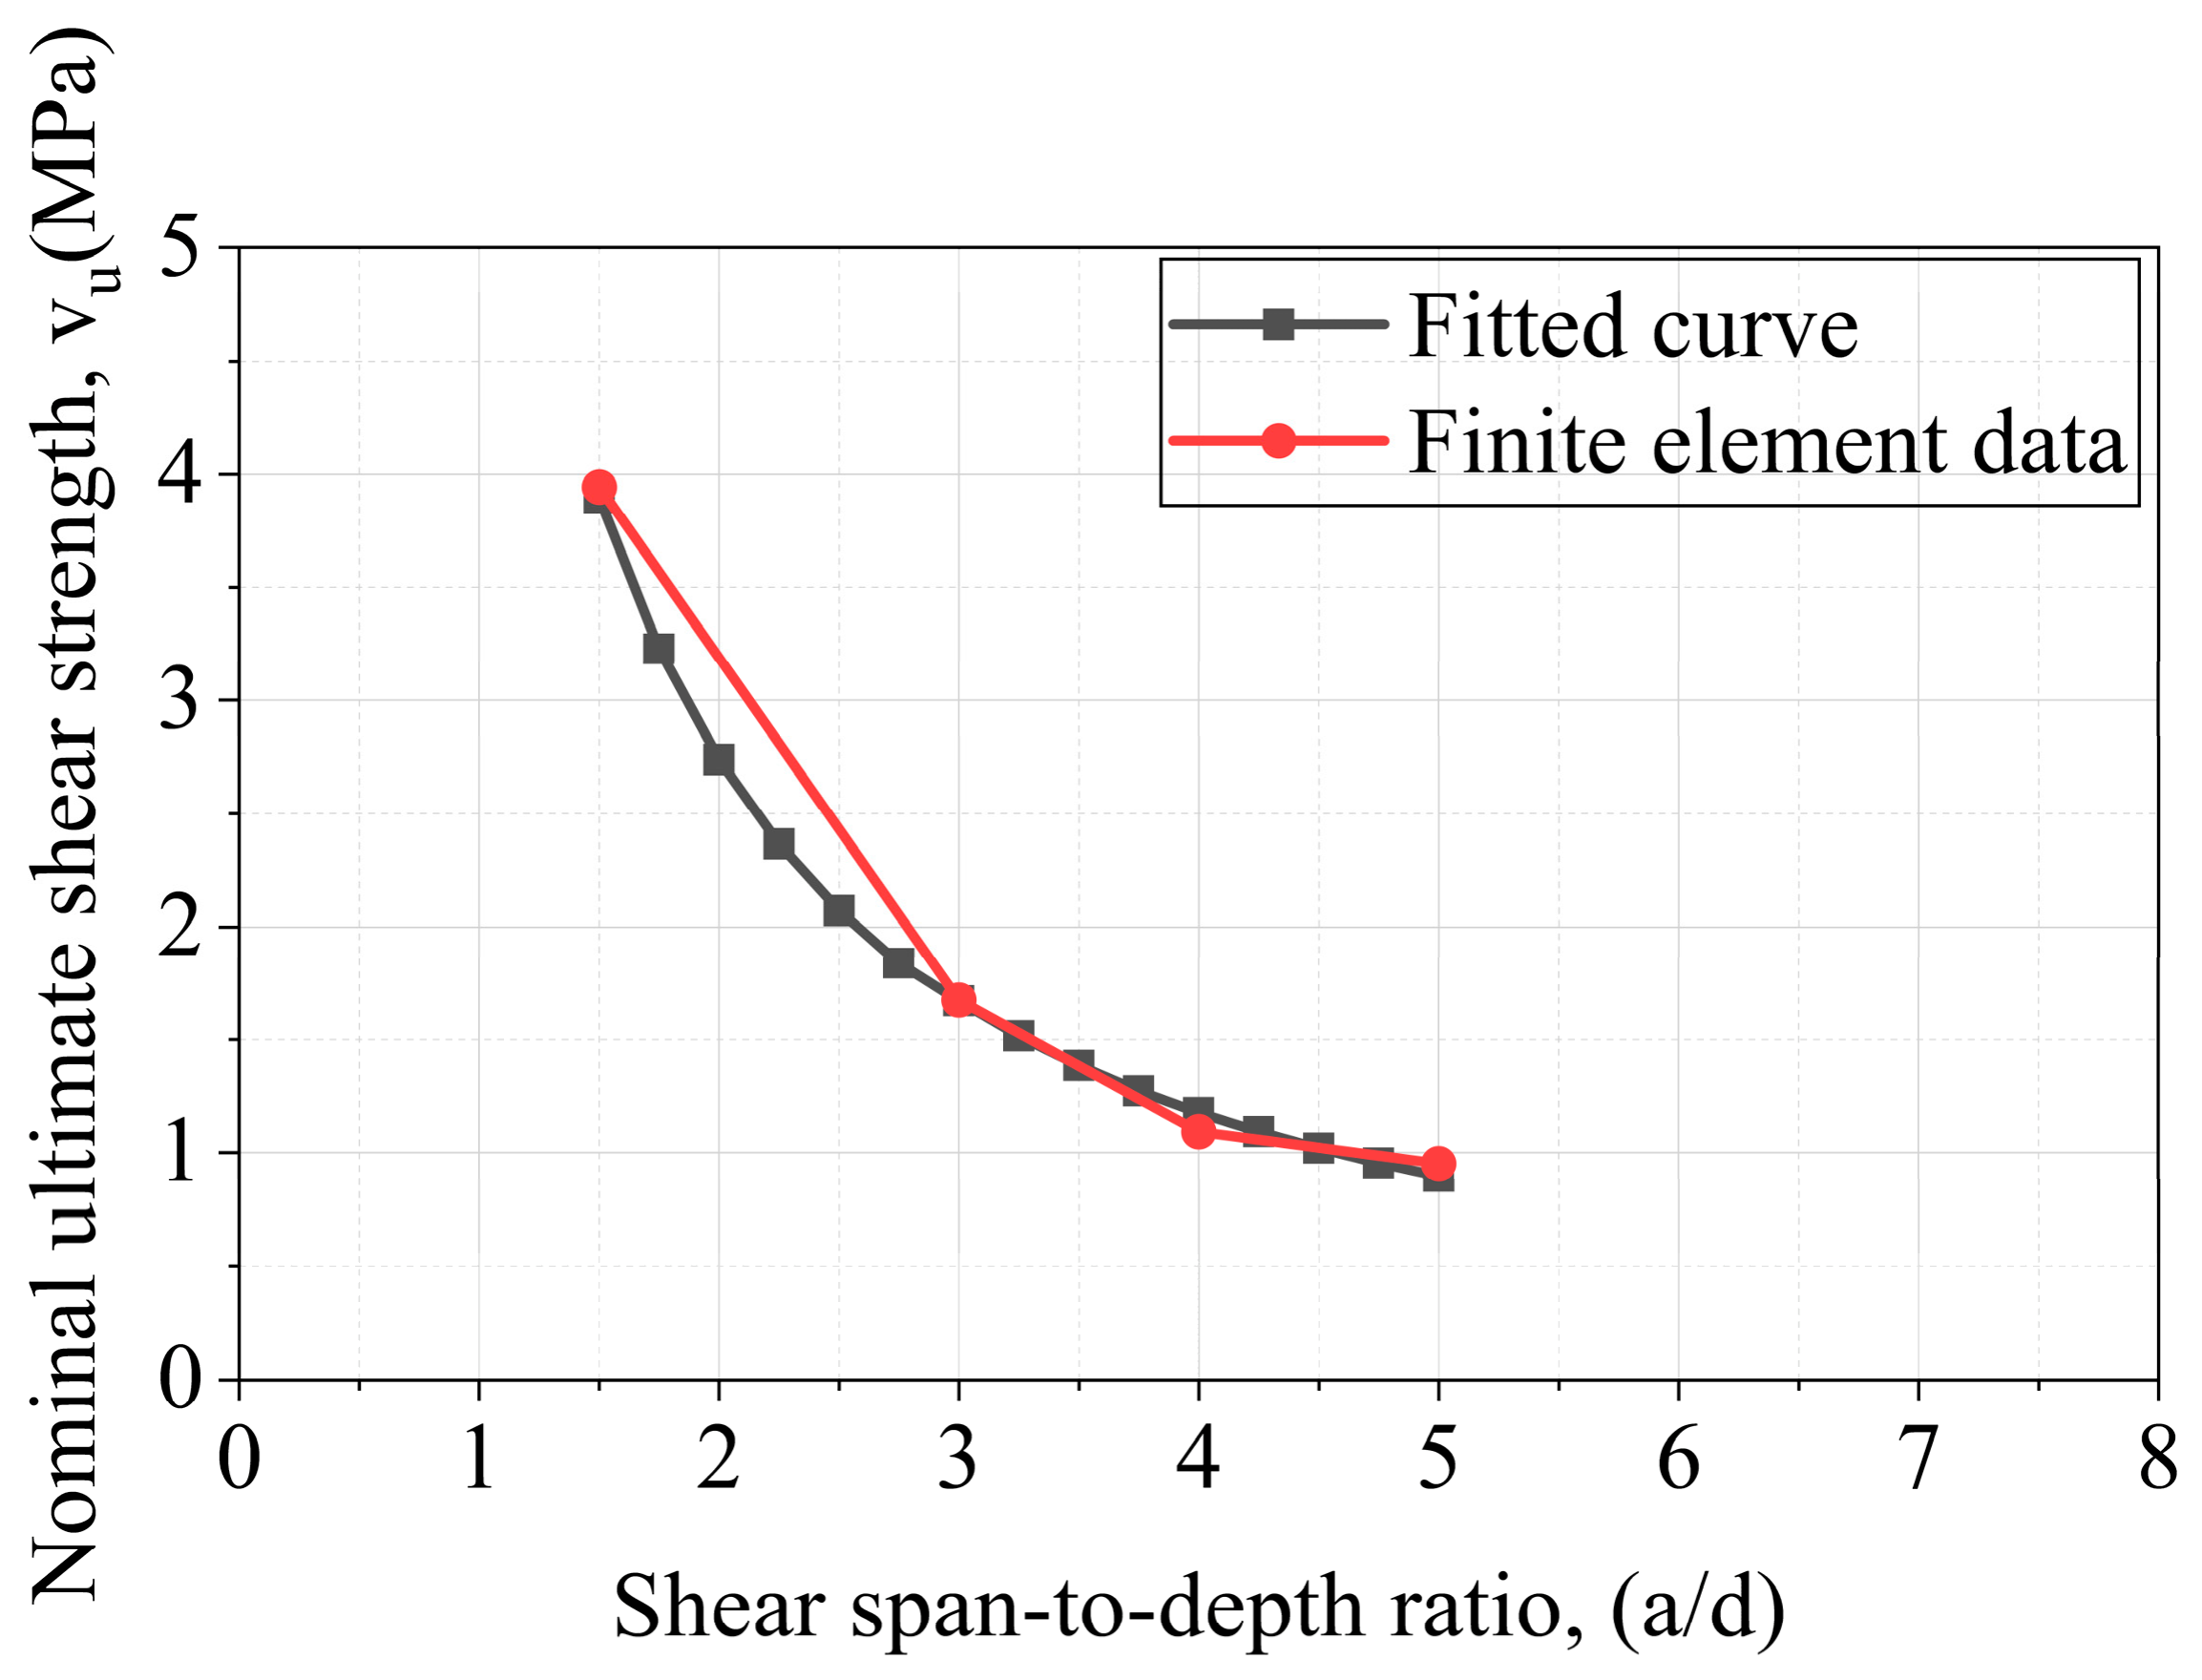
For a fixed member size and reinforcement definition, Equation (14) is retained as an empirical descriptor of the computed trend over 1.5 ≤ a/d ≤ 5. It is not presented as a universal mechanistic or design relationship.
The a/d = 1.5 model lies in an arch action/deep beam regime, whereas the larger a/d models progressively approach beam action. The region near a/d ≈ 3 is interpreted as a numerical transition region. Equation (15) and its coefficient of determination in Equation (16) describe only the sampled numerical interval.
vu = 1.6716(λ/3)−1.22
The coefficient of determination for the fitted relationship is given in Equation (16):
R2 = 0.998
The finite element results and the empirical curve are shown in Figure 17. As a/d increased from 1.5 to 5.0, the ultimate shear force and nominal ultimate shear strength decreased. The relation summarizes the computed points, including the deep beam case, and should not be extrapolated beyond the investigated range.
Figure 17.
Comparison between fitted and finite element results for the shear span-to-depth ratio effect.
4.3. Effect of Longitudinal Reinforcement Type and Axial Stiffness
To compare the two reinforcement definitions, the dimensionless longitudinal reinforcement stiffness ηl and the longitudinal reinforcement ratio ρl were defined by Equations (17) and (18), respectively:
where ρl is the longitudinal reinforcement ratio, El is the longitudinal reinforcement modulus, Ec is the concrete modulus, As is the reinforcement area, and b and d are the beam width and effective depth. The B1, B2, and B4 models use As = 78.2, 312.8, and 1251.2 mm2, respectively, with ρl ≈ 1.15%. With Ec = 20.5 GPa, ηl,steel ≈ 0.1122 and ηl,GFRP ≈ 0.0224 at each member size.
ηl = ρlEl/Ec
ρl = As/(bd)
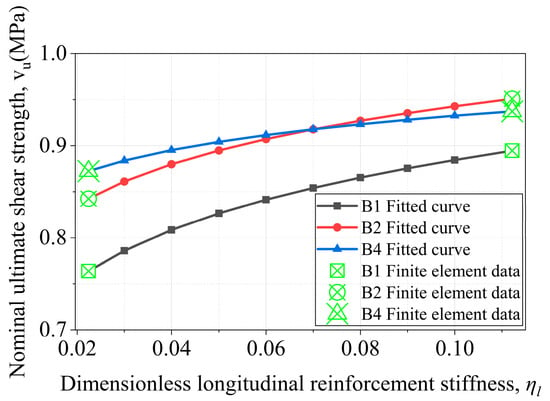
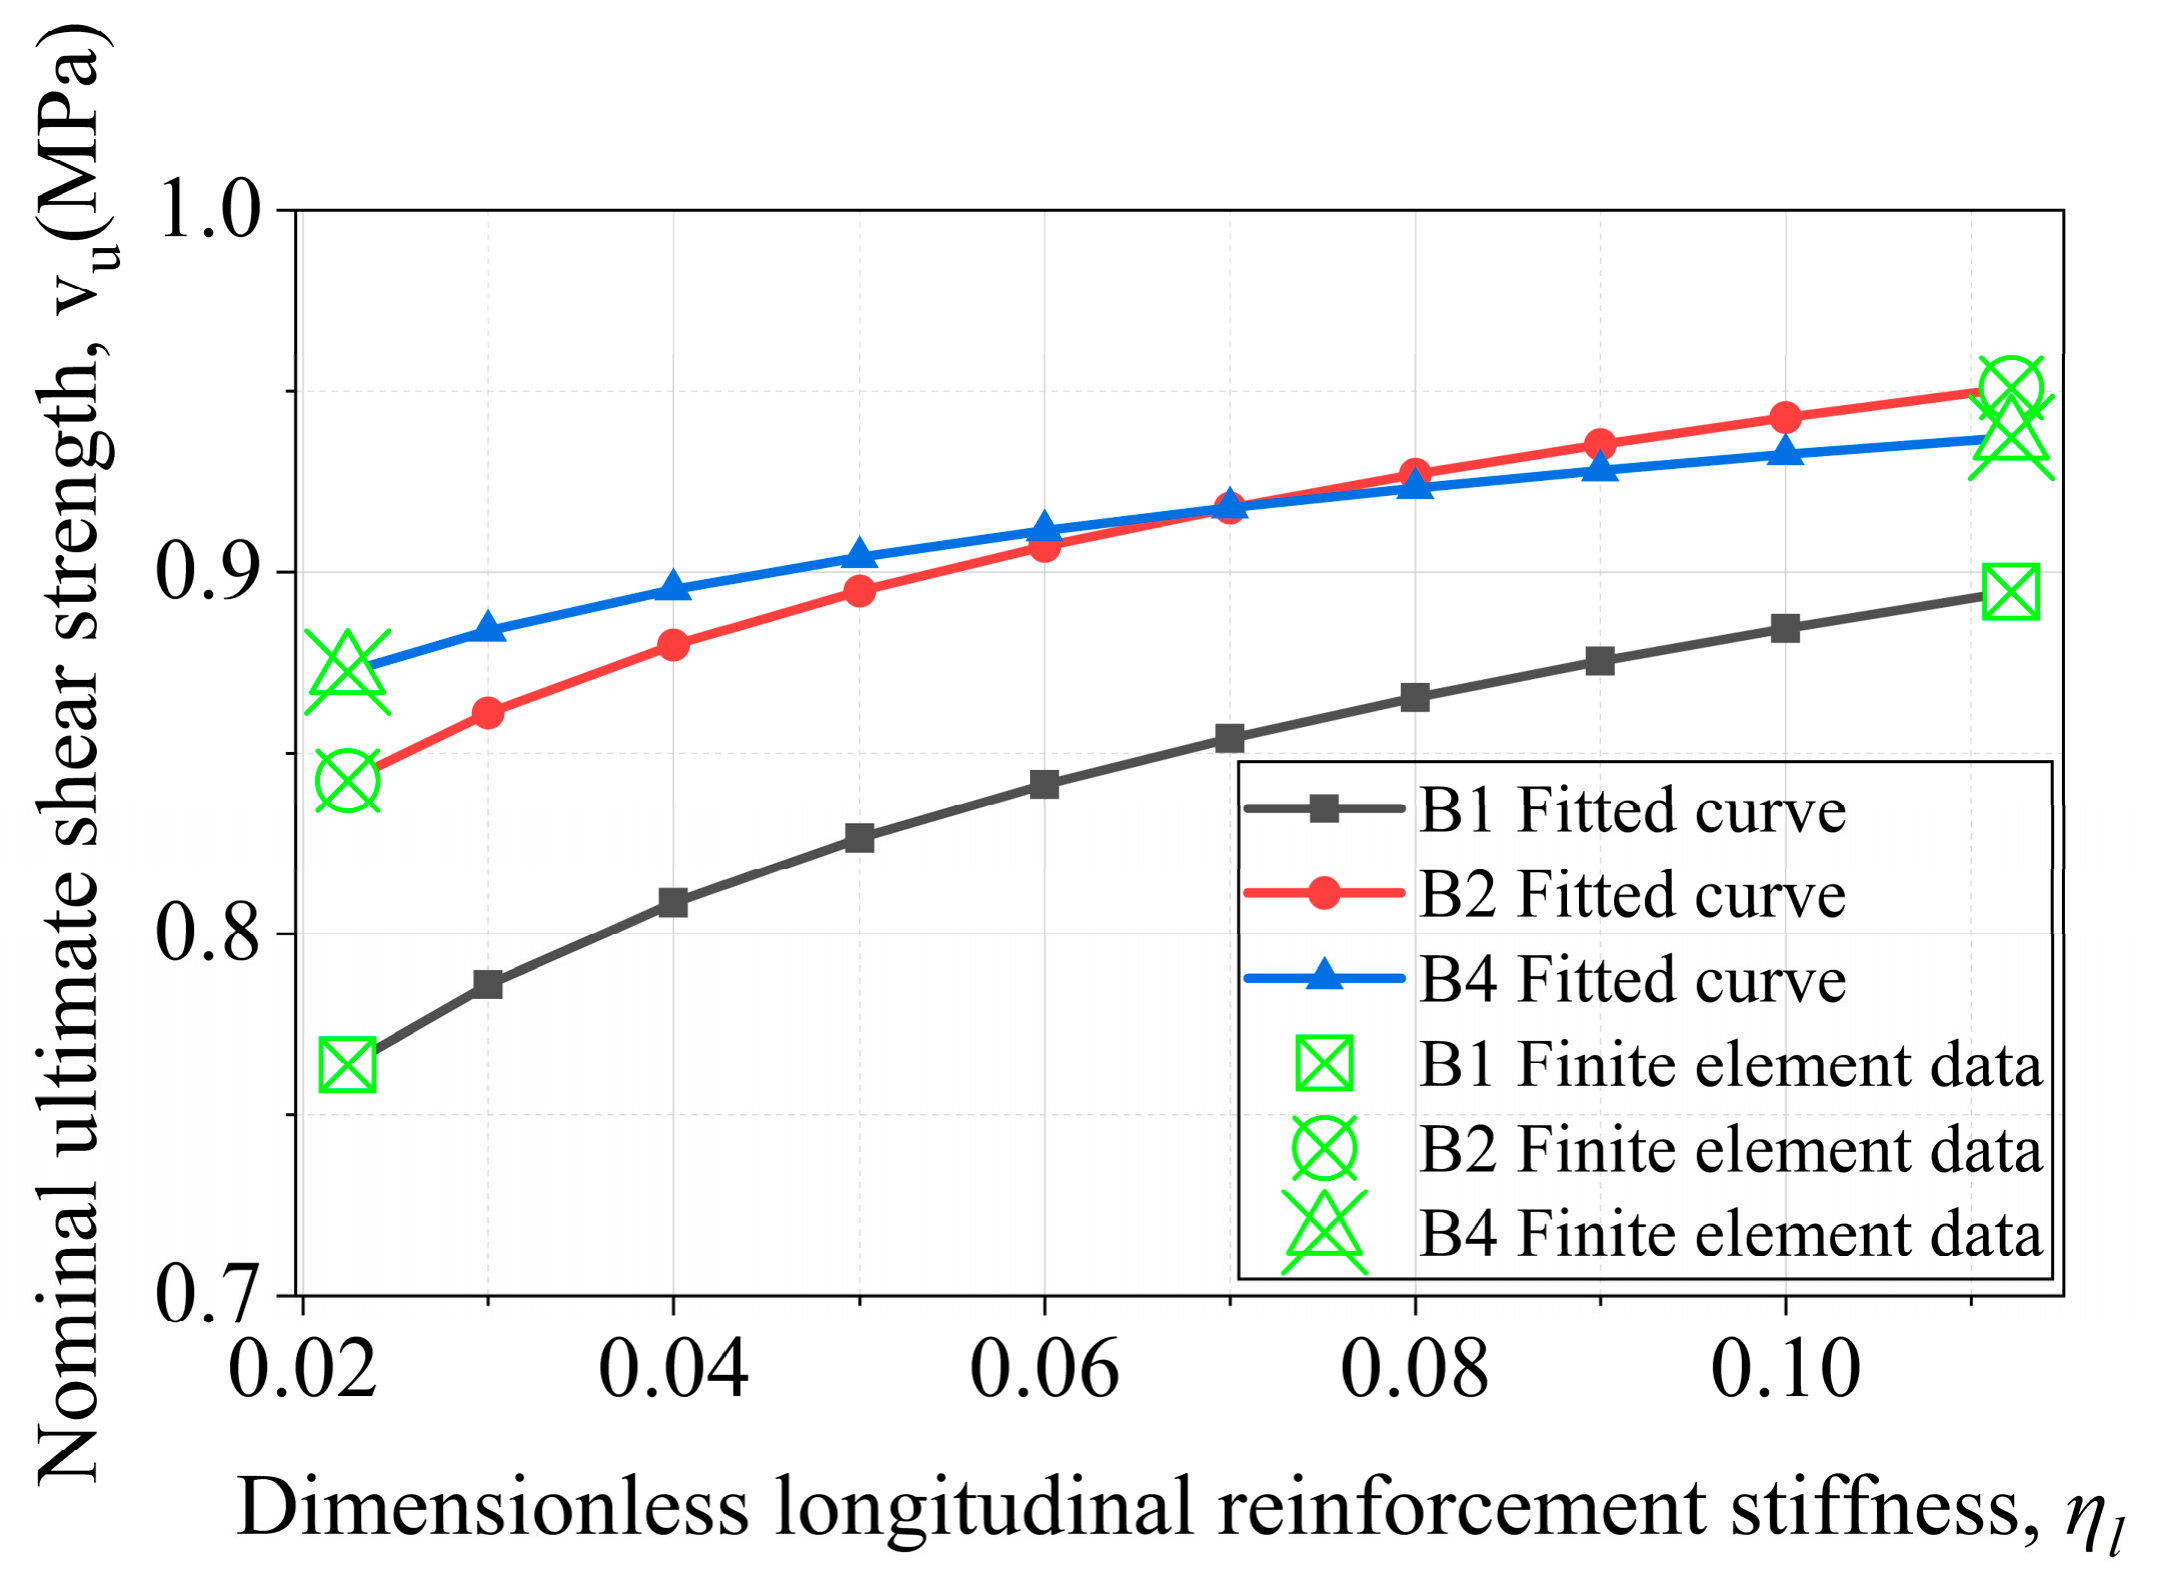
For a fixed member size and shear span-to-depth ratio, Equation (19) provides a two-point description between the steel and GFRP configurations:
The reference stiffness is the value for the steel-reinforced beam of the same size. Because ηl,steel/ηl,GFRP = 5, the p = 0.098, 0.075, and 0.045 remain unchanged. They are descriptive two-point stiffness sensitivity indices rather than regression constants, material constants, or a universal scaling law.
The model series trend is shown in Figure 18. The longitudinal reinforcement ratio was maintained at approximately 1.15% across B1, B2, and B4, so the decreasing steel–GFRP difference is not attributed to a change in the reinforcement ratio. It may reflect the member size together with constitutive assumptions, fixed mesh size, perfect bond, discrete reinforcement arrangement, and local loading/support geometry. The relationship is restricted to the investigated LC60 system, 1.5 ≤ a/d ≤ 5, effective depths of d = 85–340 mm, and the modeled reinforcement configurations [20].
Figure 18.
Fitted relationship for the effect of longitudinal reinforcement stiffness.
4.4. Equation-Level Code Comparison
For the steel-reinforced LC60 beams without transverse shear reinforcement, nominal concrete shear resistance was evaluated using ACI CODE-318-25 [23]. The governing equation was
The reinforcement ratio and size effect factor were evaluated as
ρw = As/(bwd)
The LC60 calculation inputs were . No axial load was applied, so the axial load contribution did not affect the calculated resistance. The concrete strength term was limited according to ACI CODE-318-25:
The prescribed lower-bound and maximum limits were checked and did not govern. Nominal equation-level values were used without a strength reduction factor. For symmetric three-point loading, PACI = 2Vc. These unnumbered code equations preserve the manuscript’s existing Equations (1)–(19) sequence.
Table 9 provides the baseline equation-level comparison with ACI CODE-318-25, EN 1992-1-1:2023 [24], and fib Model Code 2020 [25]. Table 10 extends the ACI comparison to the steel-reinforced LC60 series for which the sectional provision is applicable.
Table 9.
Comparison of experimental and numerical peak loads with equation-level code predictions.
Table 10.
Extended comparison of FE peak loads with ACI CODE-318-25 predictions for steel-reinforced LC60 beams.
For the a/d = 5 steel-reinforced series, the ACI predictions remain within approximately 9% of the finite element peak loads over d = 85–340 mm. As a/d decreases, PACI/PFE decreases and the sectional prediction becomes increasingly conservative relative to the computed peak load. The a/d = 1.5 model lies in the ACI deep beam domain; the conventional sectional equation is not applied and the strut-and-tie model therein is required. The comparison is a design context reference, not a validated design rule or reliability-calibrated safety margin. Previous experiments on FRP-reinforced concrete beams without transverse reinforcement reported depth-dependent reductions in nominal shear strength for steel-, GFRP-, CFRP-, and BFRP-reinforced series [9,10]. Tests on BFRP-reinforced short beams also showed that the effective depth, reinforcement ratio, and shear span-to-depth ratio affected the measured response [15]. These studies provide qualitative context.
5. Limitation
The study is limited by one specimen per experimental configuration and direct model checking against only two baseline beams; the larger-size and other-a/d models therefore remain numerical extrapolations. The Embedded Region constraint imposes perfect bond and does not represent reinforcement concrete slip, material-specific interface behavior, or anchorage effects. The LC60 concrete was modeled as a homogeneous continuum without explicit aggregate particles or interfacial transition zones. A fixed 10 mm mesh and strain-based tensile softening were used, so damage localization and the structural energy index may remain mesh-dependent. The longitudinal reinforcement ratio was maintained at approximately ρl ≈ 1.15% across B1, B2, and B4 using 1ϕ10, 4ϕ10, 4ϕ20, although the discrete arrangement is not a strict geometric mapping. Support transverse width was scaled with beam width, whereas the 50 mm longitudinal contact length and loading rod diameter were fixed. Equation (19) is a two-point descriptive relation, and the structural energy index was integrated to approximately 0.90 Pu. No classical monotonic decrease in nominal shear strength was observed over d = 85–340 mm. These limitations restrict the conclusions to the investigated LC60 system, reinforcement configurations, boundary conditions, and parameter ranges.
6. Conclusions
The main findings of this paper are as follows:
(1) A three-dimensional nonlinear finite element model was checked against the load–displacement response, peak load, and damage pattern of two previously reported LC60 baseline beams. The remaining configurations are numerical parametric predictions within the adopted model assumptions.
(2) Increasing the effective depth from 85 to 340 mm substantially increased the absolute shear capacity, while the nominal ultimate shear strengths remained approximately 0.895, 0.951, and 0.937 MPa. The results show a member size-dependent response but no pronounced classical monotonic reduction in the nominal shear strength over the investigated range.
(3) Increasing the shear span-to-depth ratio from 1.5 to 5.0 reduced the computed shear response and shifted the load transfer mechanism from an arch action/deep beam regime toward progressively stronger beam action. The power law relation is an empirical descriptor of the sampled numerical interval.
(4) At an approximately constant 1.15% longitudinal reinforcement ratio, GFRP-reinforced models exhibited lower stiffness and ultimate shear strength than the steel-reinforced models. The decreasing difference with the member size is a numerical model series trend associated with the reinforcement type and axial stiffness and is not presented as a universal scaling law.
(5) ACI CODE-318-25 equation-level predictions for the a/d = 5 steel-reinforced series remained within approximately 9% of the finite element peak loads over d = 85–40 mm. The sectional prediction became increasingly conservative as a/d decreased, and the a/d = 1.5 model requires deep beam strut-and-tie treatment. All findings are restricted to the investigated LC60 system, model assumptions, boundary conditions, and parameter ranges.
Author Contributions
J.Z.: Conceptualization, writing—review and editing, supervision, and fund sponsorship. Z.Y. and N.R.: Investigation, data curation and writing—review and editing. W.W.: Conceptualization, investigation, data curation, writing—original draft, writing—review and editing. All authors have read and agreed to the published version of the manuscript.
Funding
This study was financially supported by the PolyU Postdoc Matching Fund Scheme (1-W32U) and the Young Scientists Fund of the National Natural Science Foundation of China (Grant No. 51408091).
Data Availability Statement
All data generated or analyzed during this study are included in this published article.
Conflicts of Interest
The authors declare no conflicts of interest.
Abbreviations and Symbols Summary
| Acronym/Symbol | Full Name/Meaning |
| LC60 | LC60 core–shell lightweight aggregate concrete |
| GFRP | Glass fiber-reinforced polymer |
| FRP | Fiber-reinforced polymer |
| CFRP | Carbon fiber-reinforced polymer |
| LVDT | Linear variable differential transformer |
| ABAQUS | Finite element analysis software used for the numerical models |
| CDP | Concrete Damage Plasticity model |
| C3D8R | 8-node three-dimensional linear brick element with reduced integration (ABAQUS element type) |
| T3D2 | 2-node three-dimensional truss element (ABAQUS element type) |
| SDEG | Scalar stiffness degradation variable used to characterize the final damage/failure pattern |
| DAMAGET | Concrete tensile damage variable in the CDP model |
| NLGEOM | Geometric nonlinearity option in the finite element analysis |
| U1, U2, U3 | Translational degrees of freedom in the global 1-, 2-, and 3-directions, respectively |
| UR1 | Rotational degree of freedom about the global 1-axis |
| h | Cross-sectional height (mm) |
| b | Beam cross-sectional width (mm) |
| d | Effective depth of the beam cross-section (mm) |
| c | Concrete cover depth (mm) |
| a | Shear span (mm) |
| a/d | Shear span-to-depth ratio |
| As | Cross-sectional area of the longitudinal tensile reinforcement (mm2) |
| ϕ | Nominal bar diameter symbol |
| Ec | Elastic modulus of concrete (GPa) |
| ν | Poisson’s ratio of concrete |
| ρ | Concrete density (kg·m−3) |
| Concrete compressive strength (MPa) | |
| ft | Concrete tensile strength (MPa) |
| σc | Uniaxial compressive stress of concrete |
| εc | Total compressive strain of concrete |
| εc0 | Strain at peak compressive stress |
| n (Equations (1)–(4)) | Curve shape parameter in the modified Collins compressive stress–strain model |
| k | Curve shape parameter in the modified Collins compressive stress–strain model |
| Compressive inelastic strain | |
| σt | Uniaxial tensile stress of concrete |
| εt | Total tensile strain of concrete |
| εt0 | Strain at peak tensile stress |
| Vcr | Cracking shear force (N) |
| Vu | Ultimate shear force (N) |
| vcr | Nominal cracking shear strength (MPa) |
| vu | Nominal ultimate shear strength (MPa) |
| Ki | Initial structural stiffness (kN/mm) |
| Kcr | Post-cracking structural stiffness (kN/mm) |
| P | Applied load variable in the load–displacement curve |
| Pu | Peak (ultimate) load used to normalize the load–displacement curve |
| δ | Displacement variable in the load–displacement curve (mm) |
| δu | Displacement at peak (ultimate) load used for curve normalization (mm) |
| W | Area under the structural load–displacement curve to the common endpoint at approximately 0.90 Pu |
| Aref = bd | Reference sectional area used to normalize global structural energy; Aref = bd |
| Gs | Global structural energy dissipation index; Gs = W/(bd) |
| λ | Shear span-to-depth ratio; λ = a/d |
| λ0 | Reference shear span-to-depth ratio; λ0 = 3 |
| vu(λ) | Nominal ultimate shear strength at the specified shear span-to-depth ratio |
| Nominal ultimate shear strength at the reference shear span-to-depth ratio | |
| n (Equation (14)) | Shear span ratio effect exponent in the fitted power law relationship |
| R2 | Coefficient of determination of the fitted relationship |
| ηl | Dimensionless longitudinal reinforcement stiffness |
| ρl | Longitudinal reinforcement ratio |
| El | Elastic modulus of longitudinal reinforcement (GPa) |
| vu(ηl) | Nominal ultimate shear strength at the specified dimensionless longitudinal reinforcement stiffness |
| Nominal ultimate shear strength corresponding to the reference stiffness | |
| η0 | Reference dimensionless longitudinal reinforcement stiffness; taken as the value of the steel-reinforced beam of the same size |
| p | Two-point descriptive stiffness sensitivity index in Equation (19) |
References
- Wu, W.; Zhang, C.; He, X.; Tang, Z.; Liao, Q.; Zhou, A.; Lu, J.-X.; Thomas, C.; Poon, C.S. Shear performance of lightweight concrete structures prepared with eco-friendly lightweight aggregates. Constr. Build. Mater. 2025, 487, 142139. [Google Scholar] [CrossRef] [Scilit]
- Bažant, Z.P.; Kim, J.K. Size effect in shear failure of longitudinally reinforced beams. ACI J. Proc. 1984, 81, 456–468. [Google Scholar] [CrossRef] [Scilit]
- Bažant, Z.P.; Kazemi, M.T. Size effect on diagonal shear failure of beams without stirrups. ACI Struct. J. 1991, 88, 268–276. [Google Scholar] [CrossRef] [Scilit]
- Zararis, P.D.; Papadakis, G.C. Diagonal shear failure and size effect in RC beams without web reinforcement. J. Struct. Eng. 2001, 127, 733–742. [Google Scholar] [CrossRef] [Scilit]
- Bažant, Z.P.; Yu, Q. Designing against size effect on shear strength of reinforced concrete beams without stirrups: I. Formul. J. Struct. Eng. 2005, 131, 1877–1885. [Google Scholar] [CrossRef] [Scilit]
- Bažant, Z.P.; Yu, Q. Designing against size effect on shear strength of reinforced concrete beams without stirrups: II. Verif. Calibration J. Struct. Eng. 2005, 131, 1886–1897. [Google Scholar] [CrossRef] [Scilit]
- Fernández Ruiz, M.; Muttoni, A.; Sagaseta, J. Shear strength of concrete members without transverse reinforcement: A mechanical approach to consistently account for size and strain effects. Eng. Struct. 2015, 99, 360–372. [Google Scholar] [CrossRef] [Scilit]
- Alam, M.S.; Hussein, A. Effect of Member Depth on Shear Strength of High-Strength Fiber-Reinforced Polymer–Reinforced Concrete Beams. J. Compos. Constr. 2012, 16, 119–126. [Google Scholar] [CrossRef] [Scilit]
- Alam, M.S.; Hussein, A. Size effect on shear strength of FRP reinforced concrete beams without stirrups. J. Compos. Constr. 2013, 17, 507–516. [Google Scholar] [CrossRef] [Scilit]
- Jumaa, G.B.; Yousif, A.R. Size effect in shear failure of high strength concrete beams without stirrup reinforced with basalt FRP bars. KSCE J. Civ. Eng. 2019, 23, 1636–1650. [Google Scholar] [CrossRef] [Scilit]
- Zhang, N.; Tan, K.H. Size effect in RC deep beams: Experimental investigation and STM verification. Eng. Struct. 2007, 29, 3241–3254. [Google Scholar] [CrossRef] [Scilit]
- Košćak, J.; Damjanović, D.; Bartolac, M.; Duvnjak, I. Shear behavior of RC beams without transverse reinforcement: An analysis of crack kinematics and transfer mechanisms based on stereophotogrammetric measurements. Eng. Struct. 2022, 255, 113886. [Google Scholar] [CrossRef] [Scilit]
- Özkılıç, Y.O.; Aksoylu, C.; Arslan, M.H. Numerical evaluation of effects of shear span, stirrup spacing and angle of stirrup on reinforced concrete beam behaviour. Struct. Eng. Mech. 2021, 79, 309–326. [Google Scholar] [CrossRef]
- Oller, E.; Marí, A.; Bairán, J.M.; Cladera, A. Shear design of reinforced concrete beams with FRP longitudinal and transverse reinforcement. Compos. Part B Eng. 2015, 74, 104–122. [Google Scholar] [CrossRef] [Scilit]
- Abed, F.; El Refai, A.; Abdalla, S. Experimental and finite element investigation of the shear performance of BFRP-RC short beams. Structures 2019, 20, 689–701. [Google Scholar] [CrossRef] [Scilit]
- Wei, B.; He, X.; Wu, W.; Wu, C.; He, J. Research on the flexural behavior of polypropylene fiber reinforced concrete beams with hybrid reinforcement of GFRP and steel bars. Mater. Struct. 2024, 57, 66. [Google Scholar] [CrossRef] [Scilit]
- Jin, L.; Jiang, X.A.; Xia, H.; Chen, F.J.; Du, X.L. Size effect in shear failure of lightweight concrete beams wrapped with CFRP without stirrups: Influence of fiber ratio. Compos. Part B Eng. 2020, 199, 108257. [Google Scholar] [CrossRef] [Scilit]
- El-Sayed, A.K.; Fares, G.; Albidah, A.S.; Alhozaimy, A.M.; Al-Saawani, M.A.; Al-Negheimish, A.I. Assessment of concrete shear resistance of lightweight SCC beams containing scoria aggregates. J. Build. Eng. 2023, 78, 107591. [Google Scholar] [CrossRef] [Scilit]
- Yang, X.; Wu, T.; Liu, X.; Liu, Y. Influence of web reinforcement on shear behavior and size effect of lightweight aggregate concrete deep beams: Experimental and theoretical studies. Eng. Struct. 2025, 322, 119119. [Google Scholar] [CrossRef] [Scilit]
- Özkılıç, Y.O.; Althaqafi, E.; Karalar, M.; Aksoylu, C. Shear and flexural performance of reinforced concrete beams with recycled concrete aggregates. Rev. Adv. Mater. Sci. 2025, 64, 20250140. [Google Scholar] [CrossRef] [Scilit]
- Li, H.; He, X.; Yang, W.; Ge, S.; Xu, W.; Jiang, X.; Liao, Q.; Xu, G.; Wu, W. Effects of protective concrete cover and cross-section size on the mechanical properties of lightweight concrete beams: An experimental and simulation investigation. Results Eng. 2026, 29, 109211. [Google Scholar] [CrossRef] [Scilit]
- Gu, D.; Zhu, Y.; Luković, M.; Pan, J. Arch action and beam action in reinforced engineered cementitious composite (ECC) beams subjected to shear. Eng. Struct. 2026, 357, 122468. [Google Scholar] [CrossRef] [Scilit]
- Standard’s ACI CODE-318-25; Building Code for Structural Concrete—Code Requirements and Commentary. American Concrete Institute: Farmington Hills, MI, USA, 2025.
- Standard’s EN 1992-1-1:2023; Eurocode 2: Design of Concrete Structures—Part 1-1: General Rules and Rules for Buildings, Bridges and Civil Engineering Structures. CEN: Brussels, Belgium, 2023.
- International Federation for Structural Concrete (fib). fib Model Code for Concrete Structures (2020); Version 1.2; fib: Lausanne, Switzerland, 2024. [Google Scholar]

Disclaimer/Publisher’s Note: The statements, opinions and data contained in all publications are solely those of the individual author(s) and contributor(s) and not of MDPI and/or the editor(s). MDPI and/or the editor(s) disclaim responsibility for any injury to people or property resulting from any ideas, methods, instructions or products referred to in the content. |
© 2026 by the authors. Licensee MDPI, Basel, Switzerland. This article is an open access article distributed under the terms and conditions of the Creative Commons Attribution (CC BY) license.