


Abstract
Layer height is a fundamental process parameter in 3D concrete printing (3DCP), yet its influence on the reliability and non-destructive assessment of printed concrete remains poorly quantified. This study investigated the effect of layer height (10, 12.5, 15, 17.5, and 20 mm) on the multi-directional mechanical and ultrasonic properties of extrusion-based 3D-printed concrete. The program comprised 395 ultrasonic pulse velocity (UPV) measurements and 56 compressive strength tests with high-speed failure imaging and multi-face failure-mode documentation in three orthogonal directions. Layer height did not significantly affect mean compressive strength in any direction (ANOVA p = 0.825), but systematically governed strength reliability: the Z-direction (across layer interfaces) showed the highest strength variability (CV = 7.6–17.1%), suggesting the likely heterogeneity of interlayer bond quality. A tentative negative correlation was observed between ultrasonic velocity CV and compressive strength CV in the Z-direction (r = −0.975, p = 0.005, n = 5), suggesting that ultrasonic CV may be related to the spatial arrangement of interlayer interfaces rather than to bond quality alone; this association is based on five data points and is sensitive to the exclusion of three outlier specimens, so it should be regarded as exploratory. These findings suggest that ultrasonic CV may offer a complementary non-destructive route for interlayer bond reliability assessment, and that layer height selection involves a trade-off between printing efficiency and mechanical reliability.
1. Introduction
1.1. Background
Extrusion-based 3D concrete printing (3DCP) has emerged as a transformative construction technology, enabling free-form, formwork-free, and automated construction, and its sustainability is further advanced through the incorporation of waste materials and solid by-products into printable mixtures [1]. Unlike conventional cast concrete, 3DCP deposits material layer-by-layer and filament-by-filament, creating a material with inherent orthotropy. The mechanical behavior of 3D-printed concrete is governed not only by the base material properties but critically by the quality of the interlayer and interfilament interfaces formed during deposition.
Layer height is one of the most fundamental process parameters in 3DCP. It directly controls the number of interfaces within a given structural height, the printing efficiency, and the surface conditions between successive layers. Understanding how layer height influences the mechanical and physical properties of printed concrete is therefore essential for both process optimization and structural design.
1.2. Anisotropy of 3D-Printed Concrete
The orthotropic nature of 3D-printed concrete has been extensively documented. Compressive strength is generally evaluated in three orthogonal directions: along the printing direction (X), across the filaments (Y), and across the layer interfaces (Z). Most studies report that the Z-direction, where loads act perpendicular to layer interfaces, exhibits the lowest strength due to the weak interlayer bond.
A foundational study by Panda et al. [2] demonstrated the anisotropic mechanical performance of 3D-printed fiber-reinforced geopolymer, establishing that the extrusion process induces direction-dependent properties. The orthotropic behavior arises from two distinct interface systems: horizontal interlayer interfaces formed by successive layer stacking and vertical interfilament interfaces between adjacent filaments. Wolfs et al. [3] showed that the interlayer bond strength of 3D-printed concrete depends critically on process parameters such as the interlayer interval time, nozzle height, and surface dehydration. The fiber orientation induced by the nozzle, as characterized by Arunothayan et al. [4], further contributes to anisotropy through preferential fiber alignment along the printing direction.
The influence of layer height on anisotropy has been systematically quantified in recent studies. Surehali et al. [5] varied layer height (6, 13, and 20 mm) and found that anisotropy coefficients increased with layer height, with interface-parallel cracking becoming the dominant failure mechanism at larger layer heights. Aminpour and Memari [6] quantified that interlayer time intervals amplify anisotropic coefficients, with shear being the most affected. Rehman and Kim [7] reviewed the influence of rheology, mix design, and printing parameters on the mechanical and durability characteristics of 3D-printed concrete, confirming the central role of interface quality. These studies collectively establish that interlayer bond quality, and hence anisotropy, is governed by a complex interplay of process parameters including layer height, extrusion conditions, and interlayer time interval.
A critical but often overlooked aspect is that anisotropy manifests not only in mean strength reduction but also in spatial variability. The coefficient of variation (CV) of strength reflects the uniformity of mechanical behavior across a structure. For 3DCP, the Z-direction CV is typically elevated due to the spatial heterogeneity of interlayer bond quality. However, most existing studies report only mean values, without systematically quantifying this spatial variability.
1.3. Ultrasonic Non-Destructive Testing of 3DCP
Ultrasonic pulse velocity (UPV) is a mature non-destructive testing technique for concrete quality assessment, with established procedures for defect detection [8,9] and tomography-based imaging [10,11]. It is sensitive to the presence of voids, cracks, and material discontinuities. In the context of 3DCP, UPV offers a promising tool for evaluating interlayer bond quality without destructive sampling.
However, the relationship between UPV and compressive strength in 3DCP is not straightforward. Skibicki et al. [12] found that UPV differences between printed and cast specimens were not statistically significant despite strength differences of up to 29.6%. This suggests that UPV reflects elastic properties, while interlayer bond problems manifest primarily in strength terms, which may not correlate directly with elastic wave velocity.
A less-explored ultrasonic indicator is the coefficient of variation of velocity (CVUPV). Since interlayer interfaces are acoustic impedance discontinuities, their spatial heterogeneity should manifest as spatial variability in UPV measurements. The CV of UPV may therefore serve as a proxy for interlayer bond uniformity, complementing the mean velocity which reflects overall elastic modulus.
1.4. Research Objectives
Because layer height simultaneously governs printing efficiency and structural reliability, it is a decisive process parameter in 3DCP. However, a systematic multi-layer-height study combining mechanical strength, ultrasonic characterization, failure-mode analysis, and damage-evolution assessment is lacking. Specifically, three gaps remain: (1) the influence of layer height on the spatial variability (CV) of strength across multiple directions has not been systematically quantified; (2) the relationship between ultrasonic CV and strength CV in 3DCP has not been established; and (3) how layer height governs interface involvement in failure paths, damage evolution, and mechanical anisotropy has not been examined in an integrated manner.
To the best of our knowledge, this is the first study to systematically combine multi-layer-height compressive strength reliability, multi-directional ultrasonic CV, failure-mode analysis, and damage-evolution assessment in a single integrated experimental program for extrusion-based 3D-printed concrete. This study addresses these gaps by examining five layer heights (10–20 mm) using: (1) multi-directional ultrasonic scanning (395 measurement points); (2) multi-directional compressive strength testing (56 specimens); (3) systematic failure-mode documentation; and (4) load-time curve analysis for damage evolution. The objective is to establish a mechanistic understanding of how layer height governs the quantity–quality trade-off of interlayer interfaces, and to evaluate the potential of ultrasonic CV as a non-destructive indicator of interlayer bond uniformity.
2. Materials and Methods
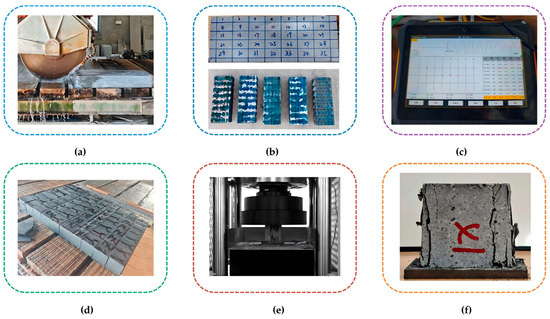
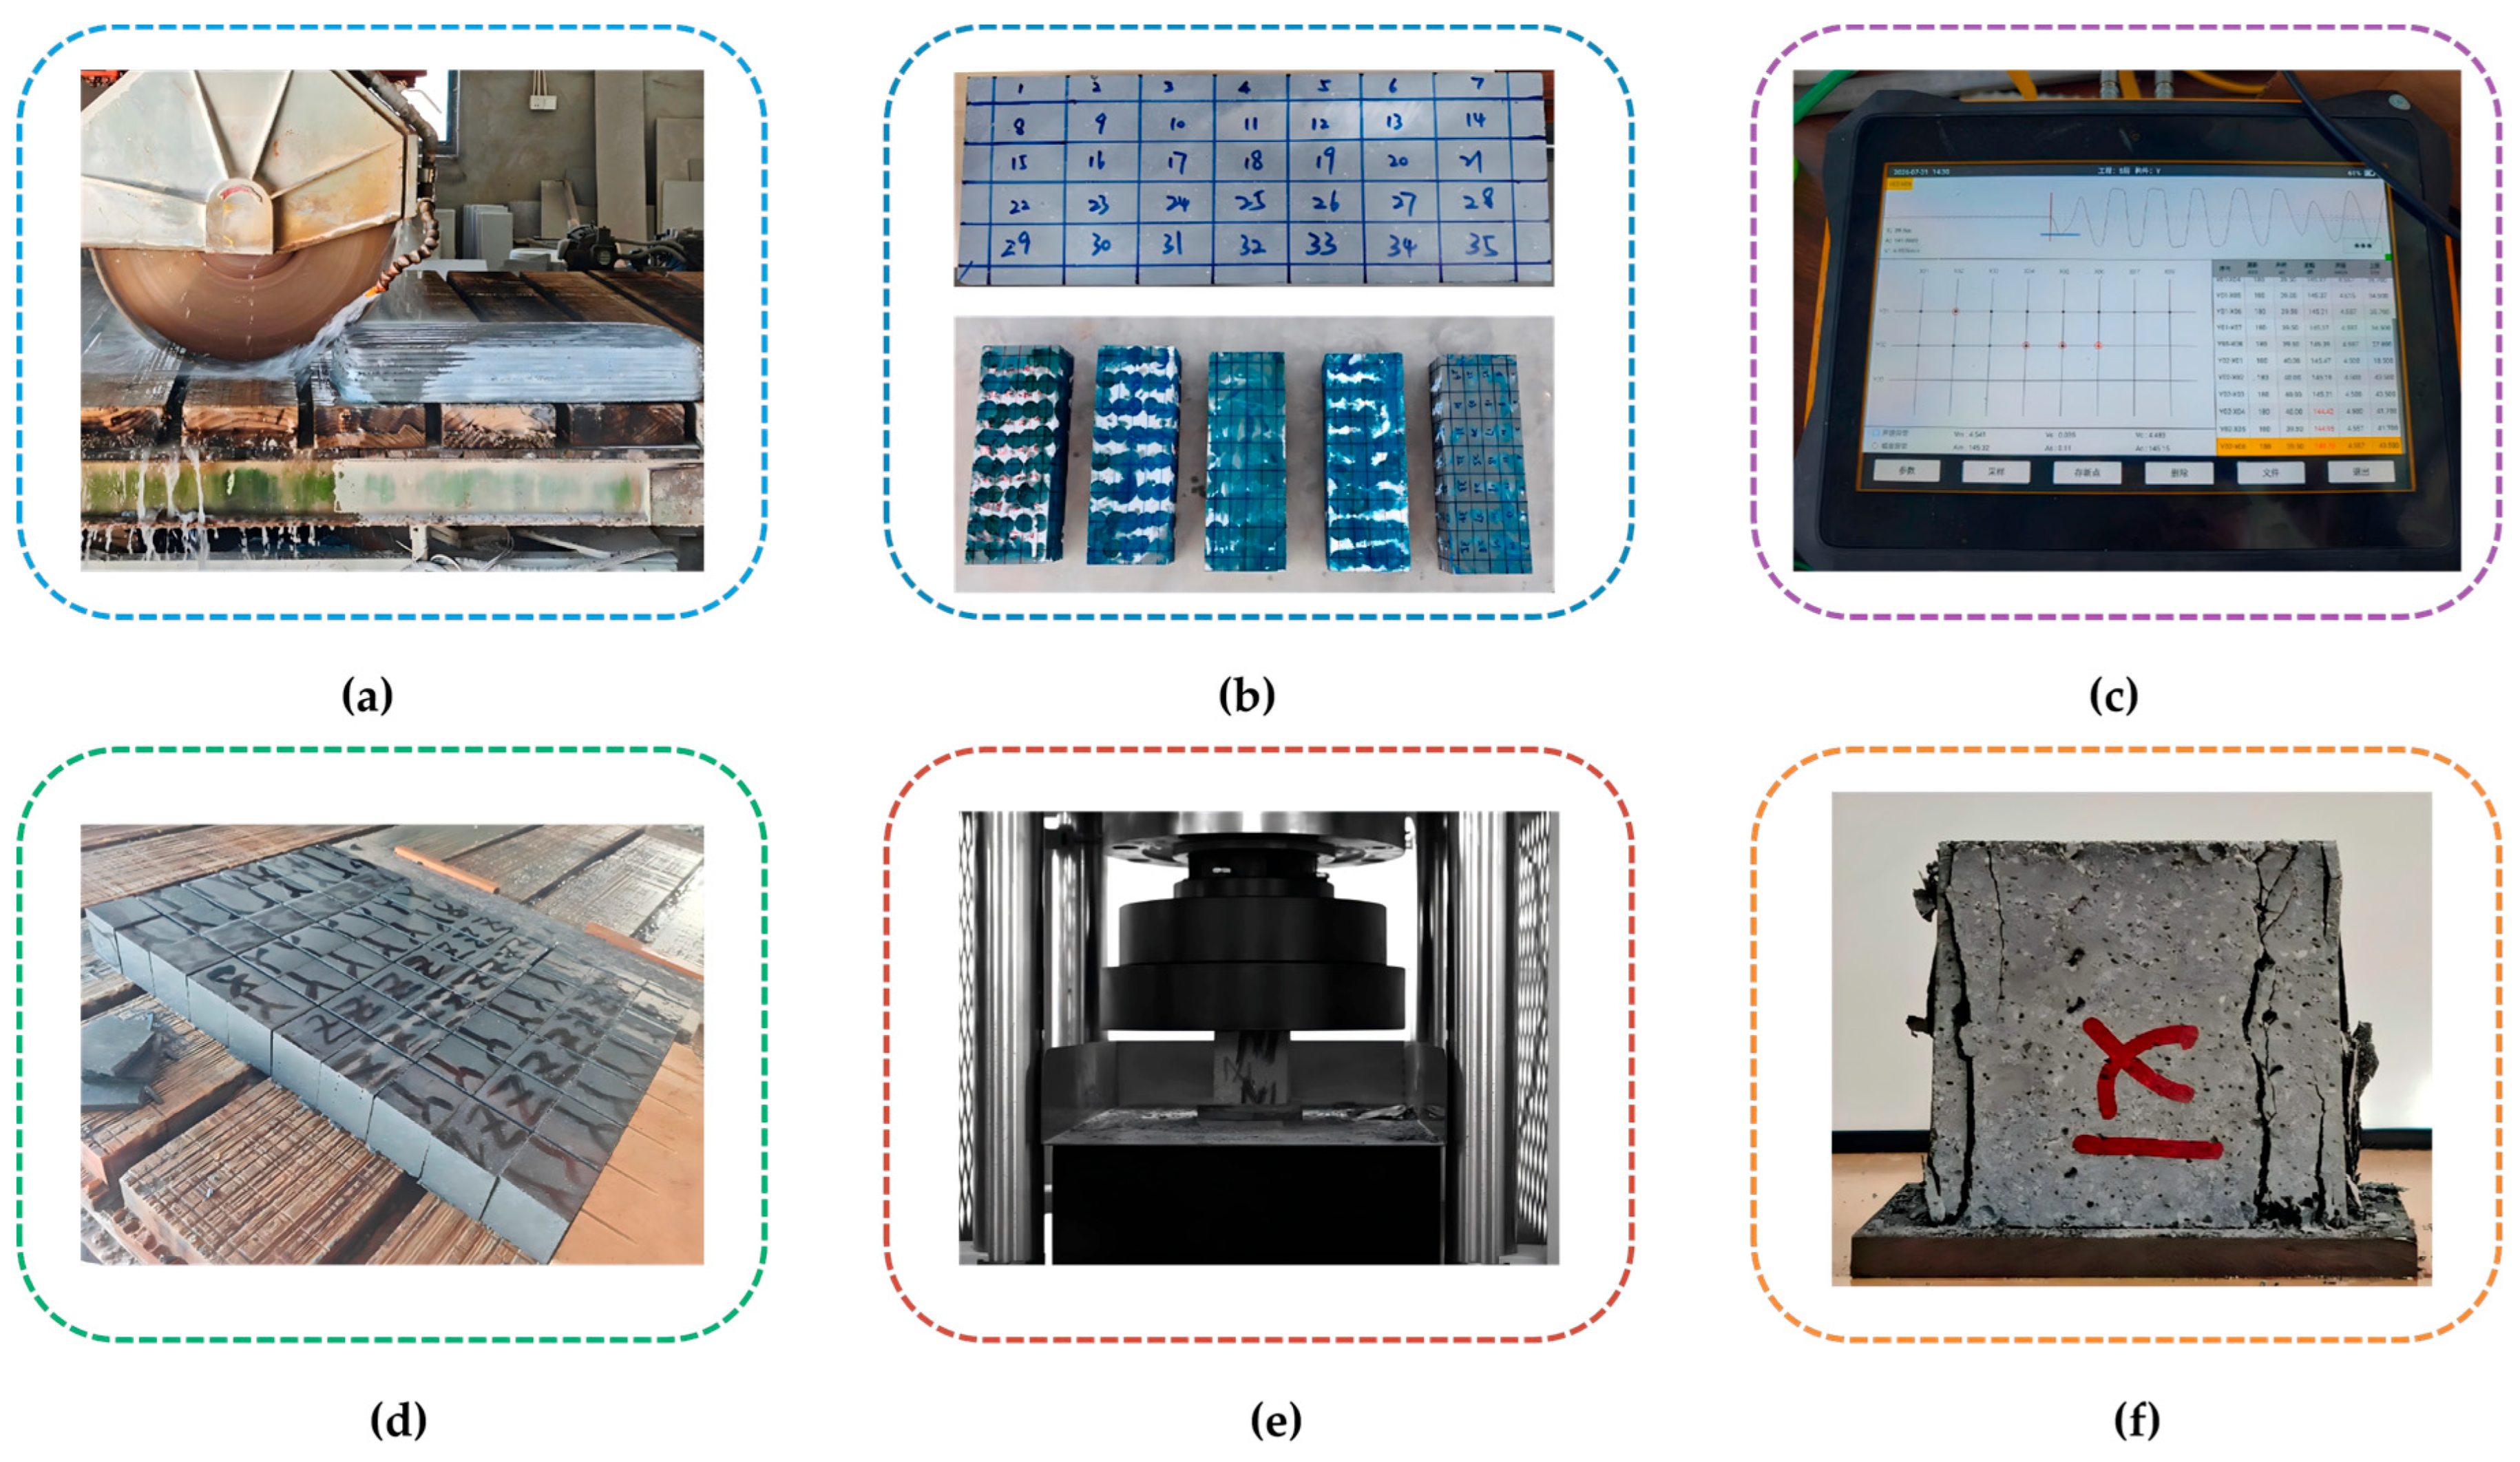
The complete experimental procedure is illustrated in Figure 1, comprising six stages: (1) surface trimming of the printed blocks, (2) marking of ultrasonic measurement grids, (3) ultrasonic scanning in three directions, (4) cutting of 70.7 mm cubes, (5) compressive strength testing with high-speed photography, and (6) post-failure documentation of failure modes. The overall experimental scale is summarized in Table 1, comprising ultrasonic scanning of 395 measurement points, compression testing of 56 cubes, and systematic failure-mode documentation for all 56 specimens across five layer heights and three loading directions.
Figure 1.
Experimental flow: (a) surface trimming; (b) grid marking; (c) ultrasonic scanning, showing the Chinese-language display screen of the HC-U91 ultrasonic instrument; (d) cube cutting; (e) compression testing; (f) failure-mode documentation.
Table 1.
Experimental scale summary.
2.1. Printing Materials and Parameters
The 3D-printed concrete used in this study was extruded using a gantry-type 3D printer (designed by China Construction Eighth Engineering Division Corp., Ltd.; manufactured by Jiangsu Boda CNC Complete Equipment Co., Ltd., Changzhou, China) with a 30 mm diameter nozzle. The mixture was a commercial cement-based premixed dry mortar (Zhejiang Jizhu Technology Co., Ltd. (Geobuild), Ningbo, Zhejiang, China), supplied in 25 kg bags and used in dry condition. Its general composition comprised ordinary Portland cement (P.O 42.5), rapid-hardening cement, dried sand (maximum aggregate size not exceeding about 2.5 mm), silica fume, gypsum, a water-reducing admixture, hydroxypropyl methylcellulose, a nano-clay viscosity-modifying admixture, and polyvinyl alcohol (PVA) fibers (6 mm). The dry mortar was mixed with water at a water-to-powder ratio of 0.15 (0.15 kg of externally added mixing water per 1 kg of dry powder) immediately before printing; this ratio refers only to the added water, as the premixed material itself contains no water. Five blocks were printed with layer heights of 10, 12.5, 15, 17.5, and 20 mm, corresponding to 10, 8, 7, 6, and 5 layers, respectively, within a nominal height of 100 mm (105 mm for the 15 and 17.5 mm layer heights). Each block measured approximately 500 mm (X, along the printing direction) × 180 mm (Y, across the filaments) × 90 mm (Z, height after surface trimming). All five blocks were printed on the same day (8 April 2026) from the same batch of premixed dry material. The dry material was mixed in batches of three 25 kg bags (75 kg of dry powder per mixing batch); each mixing batch was used continuously to print successive blocks until exhausted before the next batch was mixed, following the practice used in real printing projects. The five blocks were printed from three mixing batches of the same material batch, so that material-batch variability did not confound the layer-height comparison.
The extrusion screw speed was set at 60 rpm for the smallest layer height (10 mm) and increased with layer height up to about 100 rpm for the largest layer height (20 mm), to maintain the required extrusion rate (the filament cross-section scales with layer height); the upper end of this range also compensates for the reduced conveying efficiency caused by material adhesion on the screw-barrel wall [13]. The traverse speed was adjusted within a range of 6000–7000 mm/min to maintain a consistent filament width of approximately 30–32 mm. The filament spacing was 32 mm, with 8 filaments per layer. The G-code parameters were verified for all five blocks, confirming identical strip spacing and number of strips across layer heights.
All specimens were cured under natural outdoor conditions for approximately 112 days prior to testing, ensuring that hydration was essentially complete and strength had stabilized. Printing took place between 17:00 and 18:00 on 8 April 2026 in Changzhou (Jiangsu Province, China), under ambient conditions of approximately 15–19 °C and 65–76% relative humidity (per local meteorological records). The printing parameters are summarized in Table 2.
Table 2.
Printing parameters.
2.2. Specimen Preparation
The printed blocks measured approximately 610 mm (X, along the printing direction) × 270 mm (Y, across the filaments) × 100 mm (Z, layer stacking height; 105 mm for the 15 and 17.5 mm layer heights). Each block was first trimmed on its side and top/bottom surfaces to remove the uneven exterior layers, reducing the dimensions to approximately 500 × 180 × 90 mm. The width of 180 mm after trimming was set to match the maximum cutting depth of the circular saw (Zhejiang Changzhi Machinery Co., Ltd., Taizhou, China), allowing the block to be cut through its full height in a single pass when oriented upright. Ultrasonic measurements were conducted on the trimmed blocks before cutting. Subsequently, each block was cut into 70.7 mm cubes using a circular saw with a cutting depth capacity of 180 mm, and the spacing between successive cuts accounted for the saw blade thickness (kerf). The cubes were cut following the standard specimen size for mortar-type specimens specified in JGJ/T 70 [14] and the test method for 3D-printed concrete T/CBMF 183 [15].
Each 70.7 mm cube retained the original printing orientation, allowing compression testing in three directions: X (along the printing direction), Y (across the filaments), and Z (across the layer interfaces). A total of 56 cubes were tested, with three specimens per direction as the base configuration. Additional specimens were prepared where the initial three specimens within a group exhibited notable strength deviation, in order to confirm whether the deviation represented a genuine outlier or inherent material variability. This resulted in 9–12 specimens per layer height depending on the observed variability: the 12.5 mm layer height required no supplementary specimens (9 total, three per direction), whereas layer heights with higher strength variability (e.g., 10 and 17.5 mm) required up to 12 specimens. The number of supplementary specimens therefore varied with the observed strength variability within each layer height.
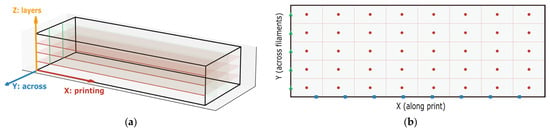
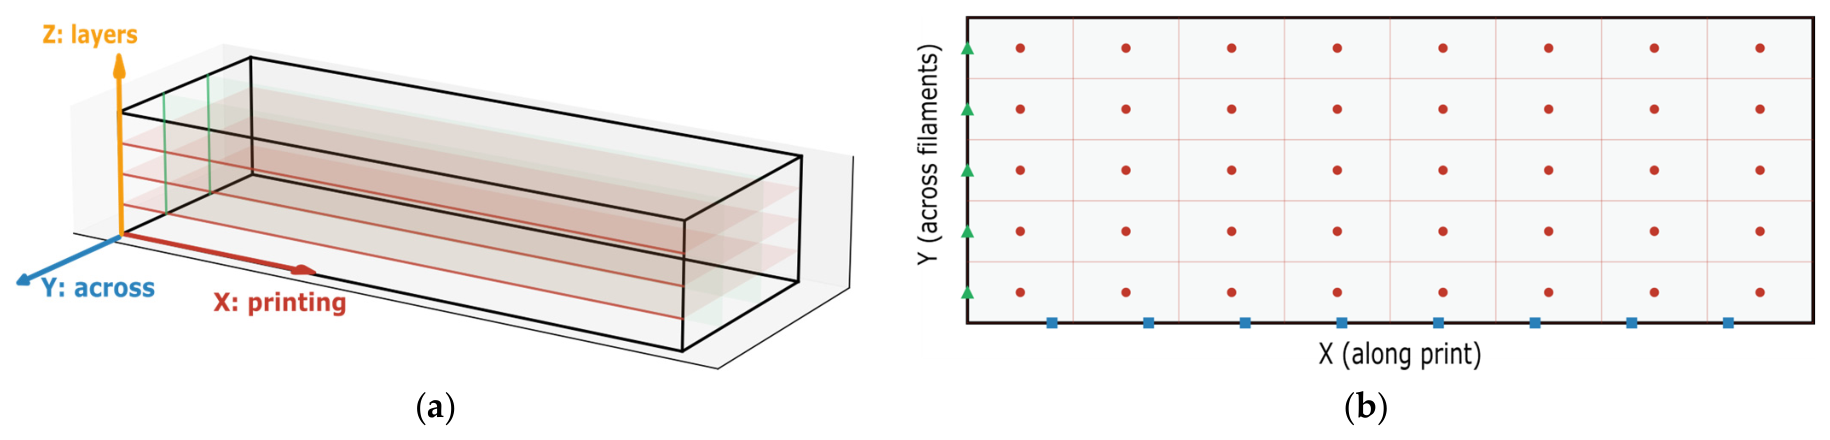
The three loading directions relative to the printing and interface systems are illustrated in Figure 2a. The interlayer interfaces (horizontal planes formed by layer stacking) and interfilament interfaces (vertical planes between adjacent filaments) constitute the two principal interface systems of the printed material.
Figure 2.
(a) Loading directions, interface systems; (b) ultrasonic measurement grids.
2.3. Ultrasonic Pulse Velocity Measurement
Ultrasonic testing was conducted using an HC-U91 ultrasonic pulse velocity instrument (Hichance Technology Co., Ltd., Beijing, China), following the procedures of T/CECS 21-2024 [16] and ASTM C597–22 [17] equipped with HC-PP50 transducers (50 kHz center frequency, 37 mm diameter). The complete measurement configuration is summarized in Table 3. Through-transmission measurements were performed in three orthogonal directions on the trimmed blocks:
Table 3.
Ultrasonic measurement configuration.
- Z-direction (across the layer interfaces): 40 points (5 × 8 grid) on the top-bottom faces (X–Y plane), path length 90 mm
- Y-direction (across the filaments): 24 points (8 × 3 grid) on the front-back faces (X–Z plane), path length 180 mm
- X-direction (along the printing direction): 15 points (5 × 3 grid) on the left-right faces (Y–Z plane), path length 500 mm
The sampling interval was 0.5 μs with 1024 sampling points per trace (a 512 μs recording window), and the transmitting voltage was 500 V. For each measurement point, the transit time, amplitude, and dominant frequency were recorded. The velocity was computed as the path length divided by the transit time. The zero-time correction was calibrated prior to each measurement session.
The measurement grid configurations for the three orthogonal directions are illustrated in Figure 2b.
2.4. Compressive Strength Testing
Compression tests were conducted using a 200-ton electro-hydraulic servo testing machine (SZTM; Suzhou Tiema Automation Technology Co., Ltd., Suzhou, China) in force-control mode at a loading rate of 1.5 kN/s (0.3 MPa/s), consistent with JGJ/T 70 [14] for mortar specimens. Each 70.7 mm cube was loaded until failure. The compressive strength was calculated as the peak load divided by the cross-sectional area measured with a digital caliper (0.1 mm accuracy). The density of each specimen was determined from mass and volume.
Before testing, each specimen’s loading faces were checked for parallelism using a square and feeler gauge, and specimens with deviations exceeding 0.5 mm were rejected or ground. The load-time curves were recorded for all specimens by the testing machine.
2.5. High-Speed Photography and Failure-Mode Documentation
The failure process was observed using a high-speed camera (MER2-1220-32U3M; Daheng Imaging, China Daheng Group, Inc., Beijing, China; 24 fps, 4024×3036 pixels) positioned perpendicular to a side face, capturing crack initiation and propagation during loading. High-speed footage of representative specimens was used to characterize the failure sequence, complementing the multi-face post-failure documentation described below.
After compression testing, all photographed specimens were documented on multiple faces (X–Y, Z–Y, X–Z, or Y–Z planes depending on loading direction). The crack patterns were recorded in detail, including crack orientation (vertical/oblique/horizontal), crack location (central/edge/corner), and damage morphology (splitting/shear/crushing/spalling). Failure modes were classified into categories including vertical splitting, oblique shear, local crushing, and interface-related cracking.
2.6. Statistical Analysis
For each combination of layer height and loading direction, the mean, standard deviation, and coefficient of variation (CV) of compressive strength were computed. One-way analysis of variance (ANOVA) was used to test the effect of layer height on strength in each direction, and the effect of direction on strength within each layer height. Pearson correlation analysis was conducted between ultrasonic parameters (velocity, CV, amplitude, frequency) and strength parameters (mean, CV). The Dixon Q test was applied for outlier detection in small sample groups (n = 3–5). A significance level of α = 0.05 was adopted throughout.
3. Results
3.1. Ultrasonic Pulse Velocity
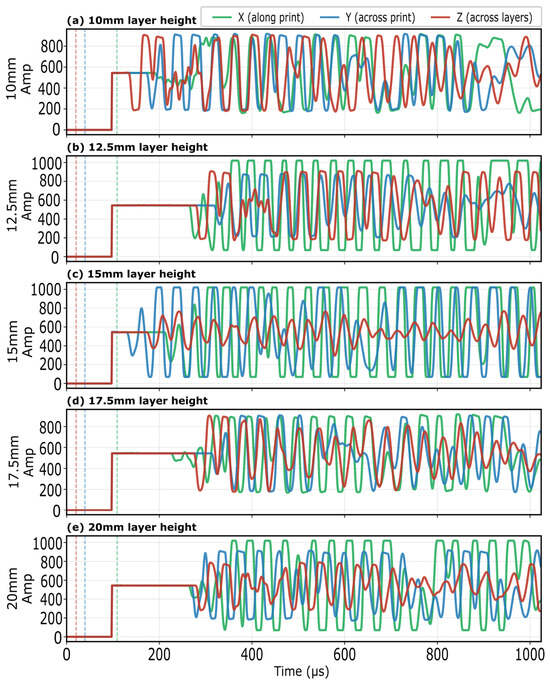
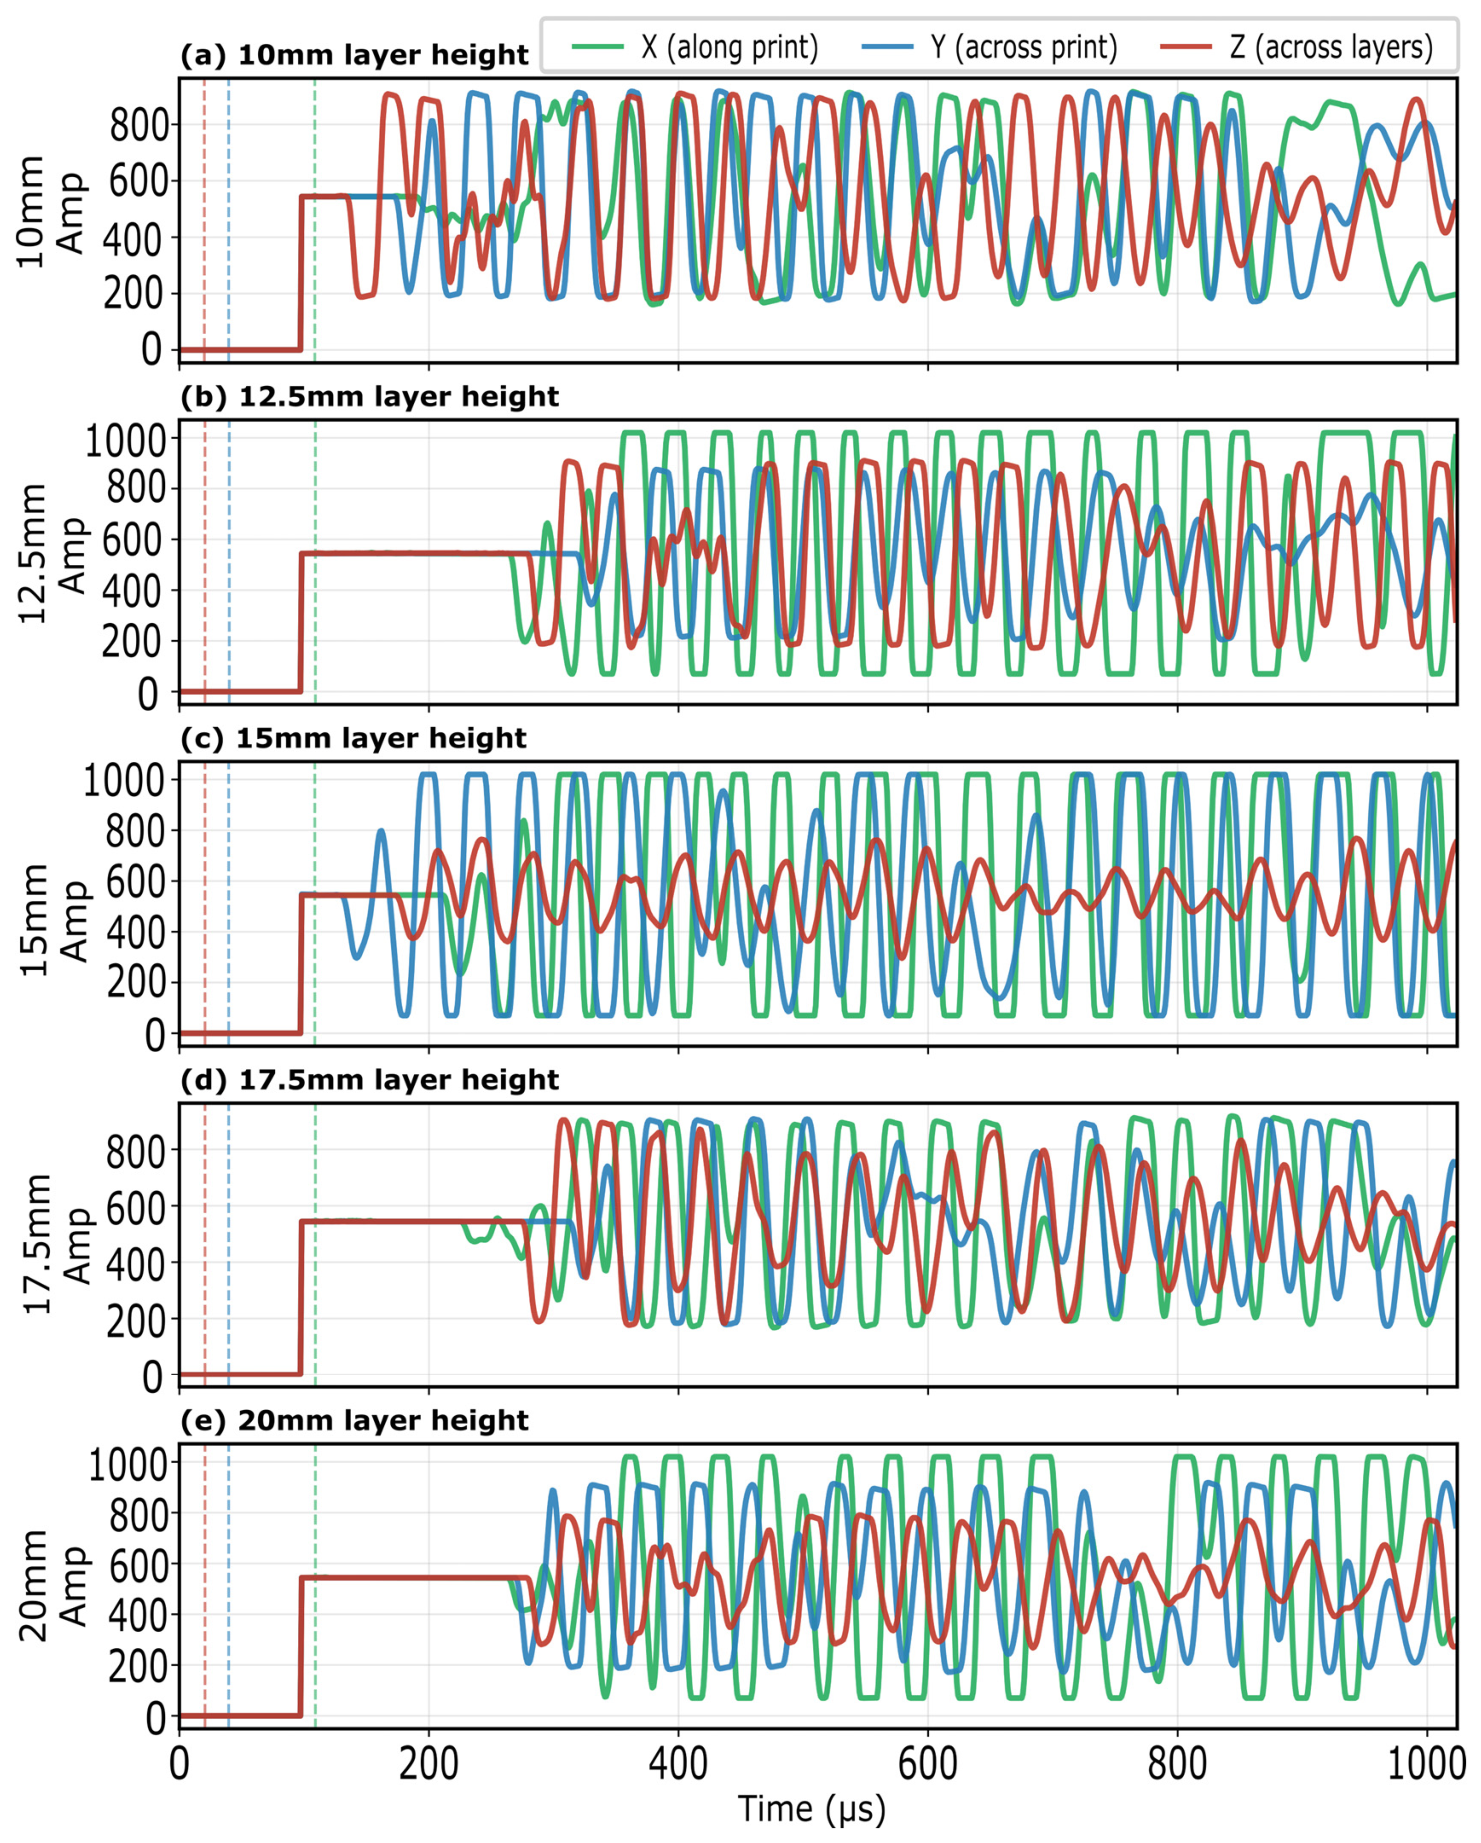
Table 4 summarizes the ultrasonic measurement results. Representative waveforms for each layer height and direction are shown in Figure 3, displaying the full 0–512 μs recording window with first-arrival markers.
Table 4.
Ultrasonic pulse velocity results.
Figure 3.
Representative ultrasonic waveforms; the dashed vertical lines mark the first arrival time (travel time) of each direction.
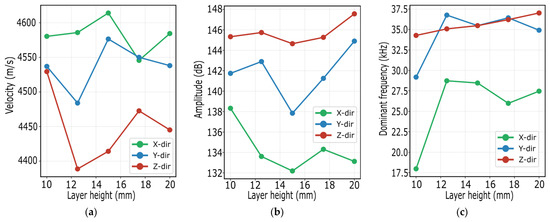
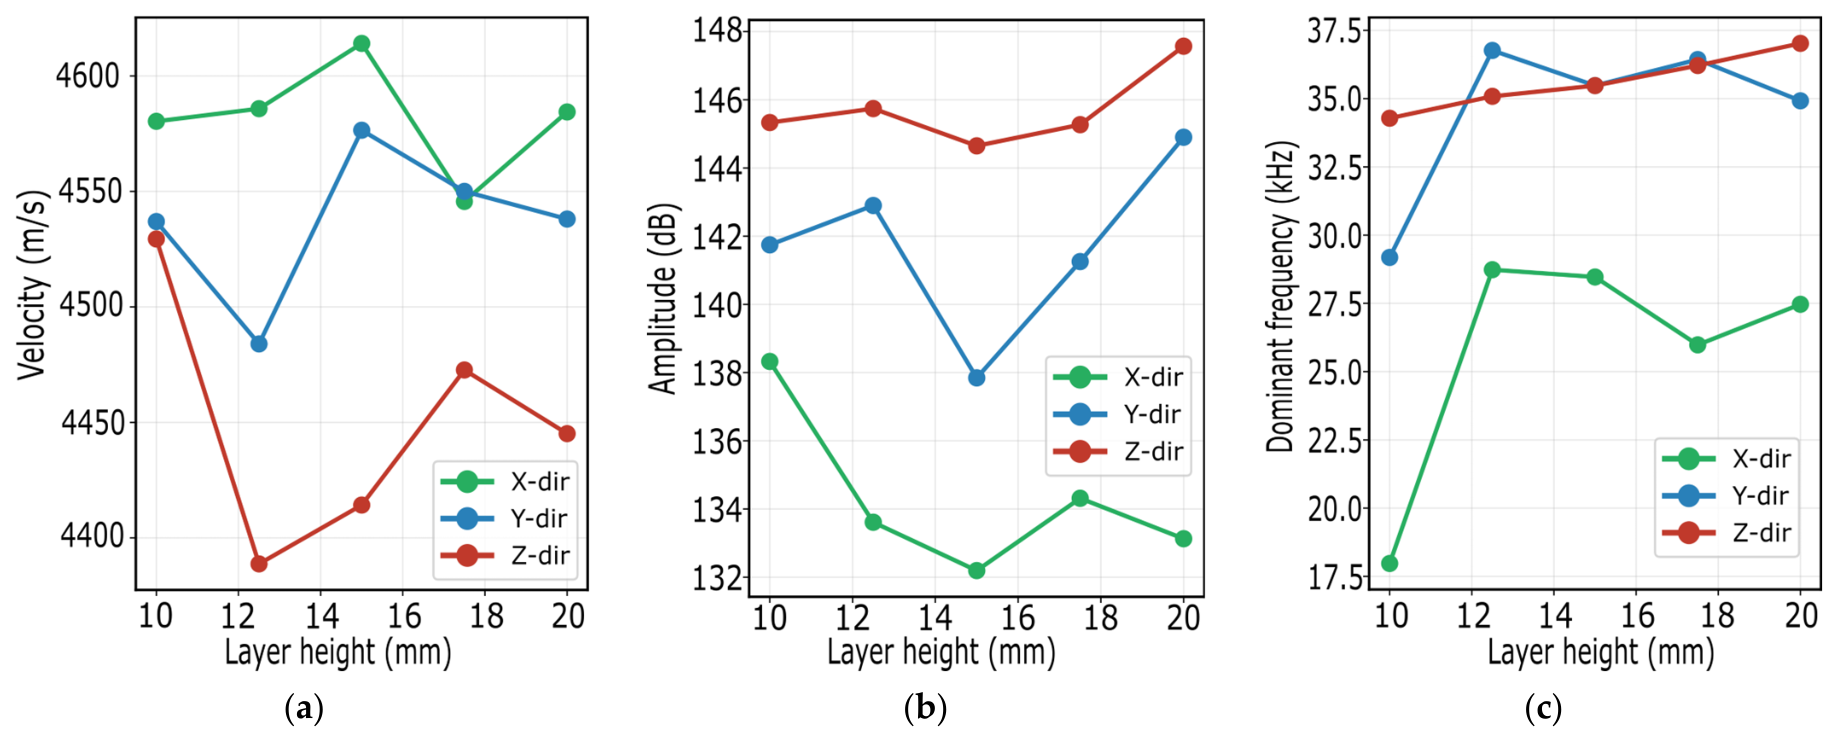
The three-directional ultrasonic parameters (velocity, amplitude, and dominant frequency) are jointly compared across directions and layer heights in Figure 4. The three-directional velocities consistently followed the order X > Y > Z across all layer heights: the Z-direction velocity (across the layer interfaces) was consistently the lowest (4389–4529 m/s), reflecting the acoustic impedance discontinuity introduced by interlayer interfaces. The velocity anisotropy ratio Vz/Vx ranged from 0.957 to 0.989. The dominant frequency was primarily governed by the transmission path length (90–500 mm), as discussed in Section 4.
Figure 4.
Three-direction ultrasonic parameters: (a) velocity; (b) amplitude; (c) frequency.
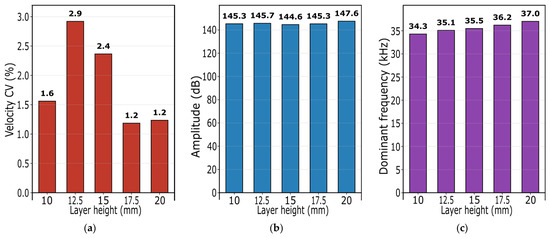
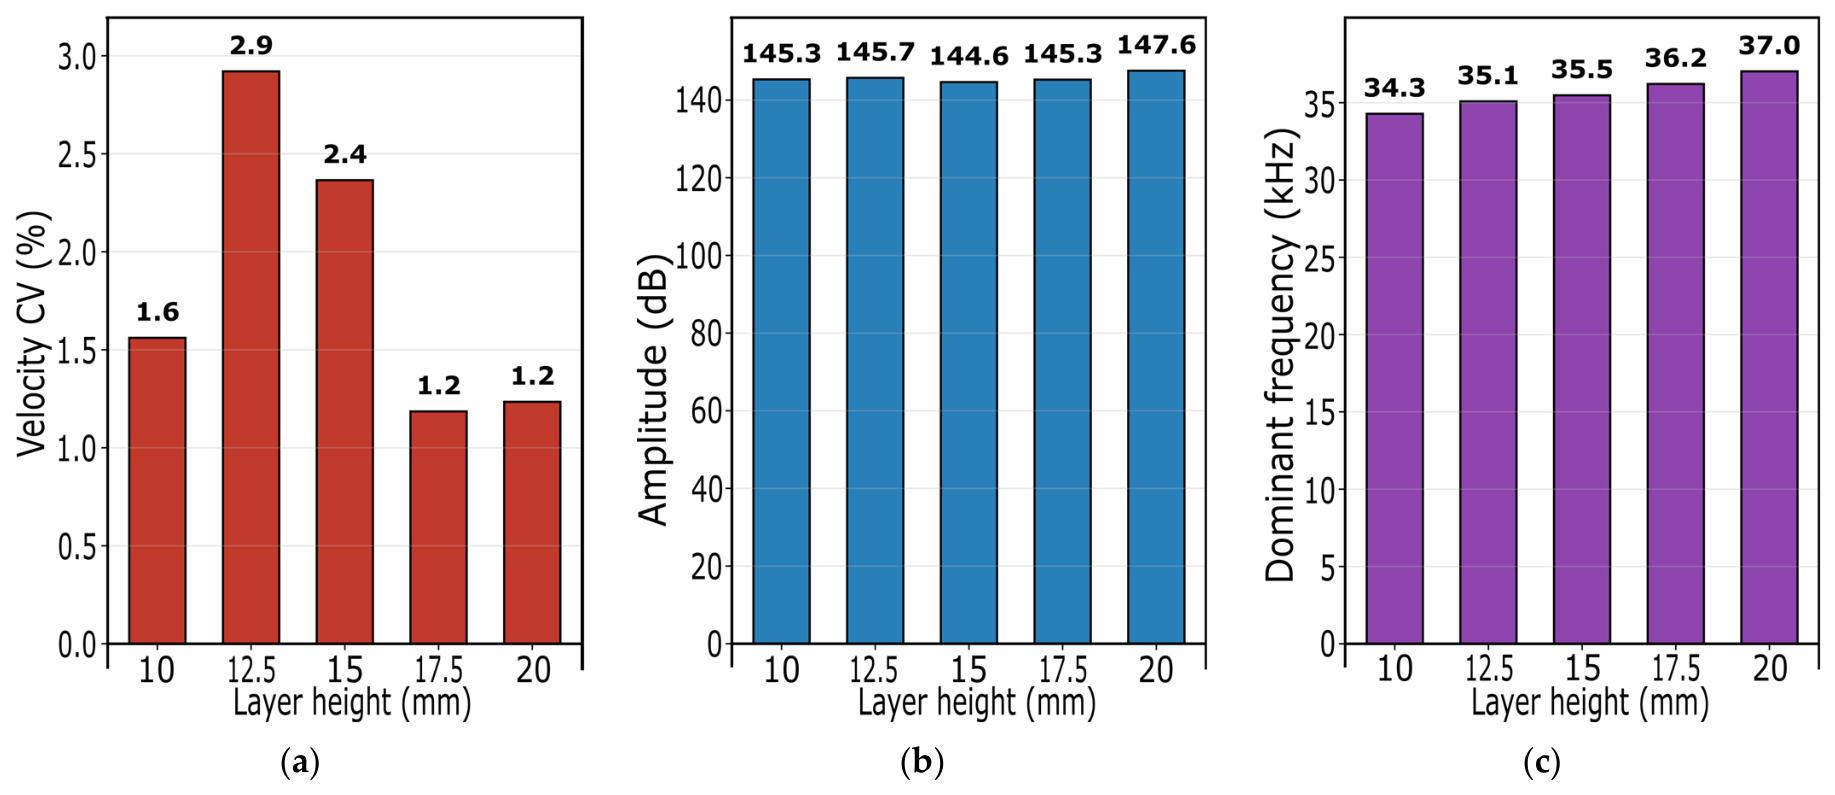
The Z-direction ultrasonic parameters are compared across layer heights in Figure 5. The coefficient of variation of Z-direction velocity exhibited a peak at 12.5 mm (2.9%) and 15 mm (2.4%), declining to 1.2% at 17.5 mm and 20 mm (Figure 5a). This inverted-V pattern, in which the ultrasonic CV peaks at the intermediate layer heights rather than at the thinnest layers with the most interfaces, indicates that the ultrasonic CV is not governed by the number of interlayer interfaces alone, as discussed in Section 4.2. The amplitude (Figure 5b) and dominant frequency (Figure 5c) showed only modest variation with layer height (144.6–147.6 dB and 34.3–37.0 kHz, respectively), indicating that layer height has a limited effect on overall signal attenuation in this range.
Figure 5.
Z-direction ultrasonic parameters: (a) Z-velocity CV; (b) Z-amplitude; (c) Z-frequency.
3.2. Compressive Strength
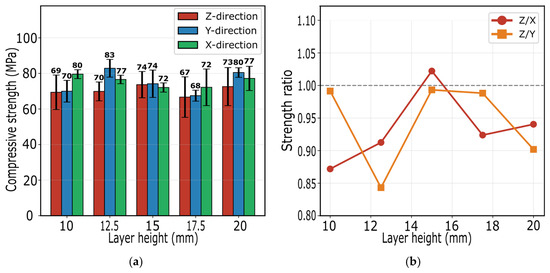
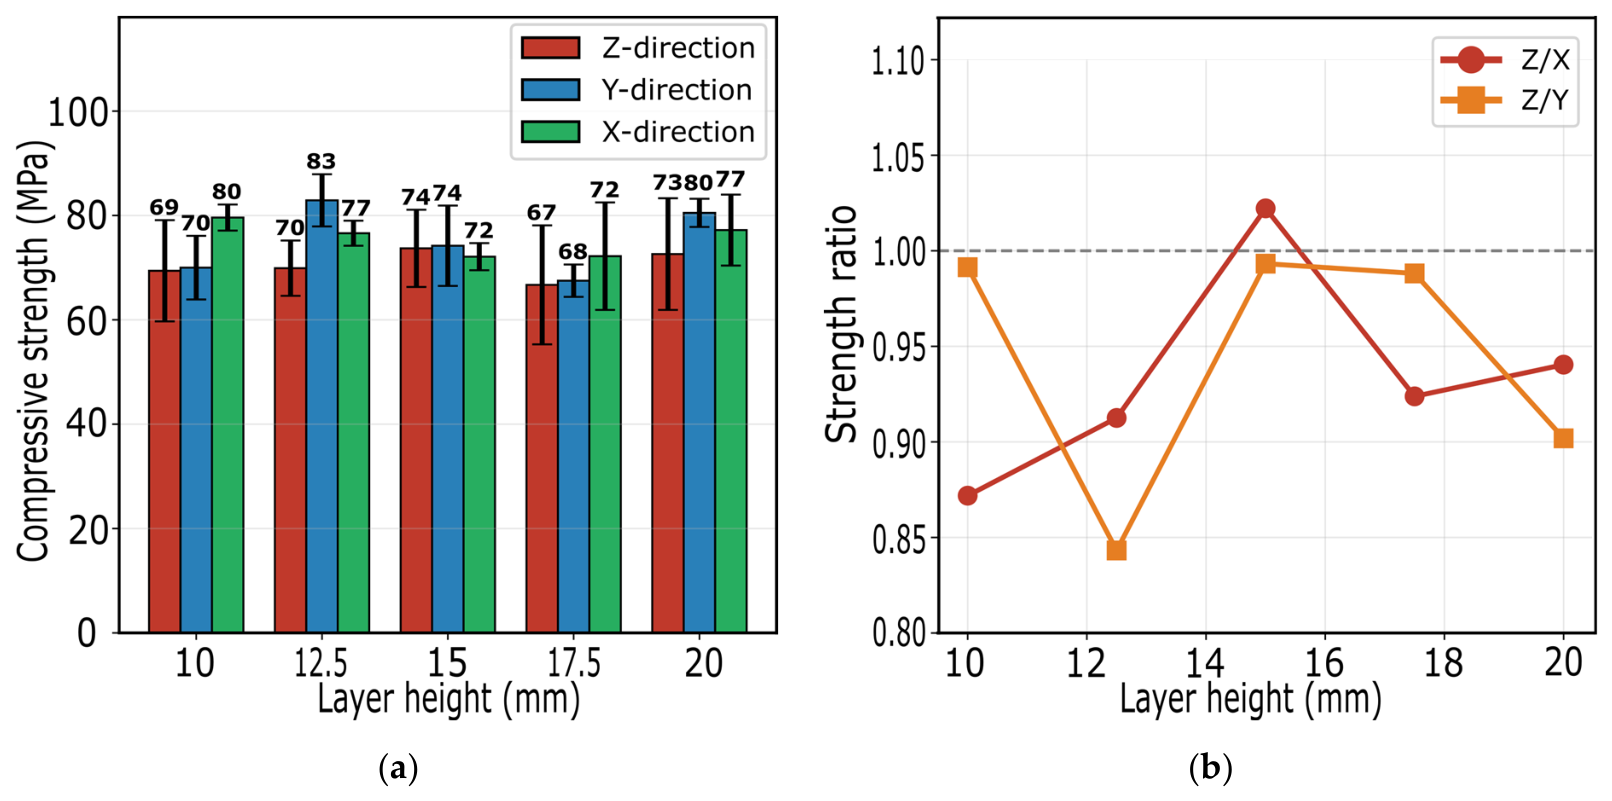
The three-directional compressive strengths and their anisotropy ratios are presented in Figure 6. Table 5 summarizes the compressive strength results. Three specimens (10 mm-Y1 at 28.9 MPa, 10 mm-Z3 at 33.5 MPa, 15 mm-Z2 at 15.1 MPa) were excluded from the statistical analysis. The outlier status of these specimens requires transparent justification. A Dixon Q test formally identified only 15 mm-Z2 (15.1 MPa) as a statistical outlier (Q = 0.733 > critical 0.71 at n = 5). The other two specimens (10 mm-Y1 and 10 mm-Z3) did not meet the Dixon Q statistical criterion but were nonetheless excluded because their strengths fell below 55% of the companion specimens within the same group, a magnitude of deviation considered physically unreasonable for representative material behavior. Post-failure examination showed that all three specimens exhibited failure morphology indistinguishable from their companions, so the exclusion was based on the magnitude of strength deviation combined with engineering judgment rather than on a distinct failure mechanism. The influence of this exclusion on the key findings is quantified in Section 3.6: when the three specimens are retained, the Z-direction strength CV increases from 13.9% to 29.1% (10 mm) and from 10.1% to 43.5% (15 mm), and the ultrasonic CV–strength CV correlation in the Z-direction is no longer observed (r = +0.067, p = 0.914). This exclusion and its consequences are therefore reported transparently.
Figure 6.
Compressive strength vs. layer height: (a) three-direction strength; (b) anisotropy ratios.
Table 5.
Compressive strength results.
One-way ANOVA revealed no statistically significant effect of layer height on compressive strength in any direction (Z-direction: F = 0.372, p = 0.825). The complete statistical analysis results are summarized in Table 6. This indicates that within the 10–20 mm range, layer height does not dominate the mean strength. Directional anisotropy was significant only at 12.5 mm layer height (ANOVA p = 0.034), where Y-direction strength (82.9 MPa) exceeded Z-direction (69.9 MPa). The Z/X strength ratio ranged from 0.87 to 1.02 across layer heights, with 10 mm showing the strongest anisotropy (Z/X = 0.87).
Table 6.
Statistical analysis summary.
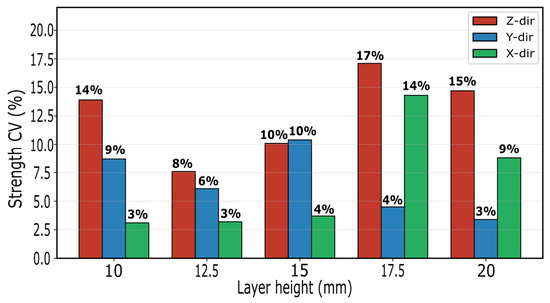
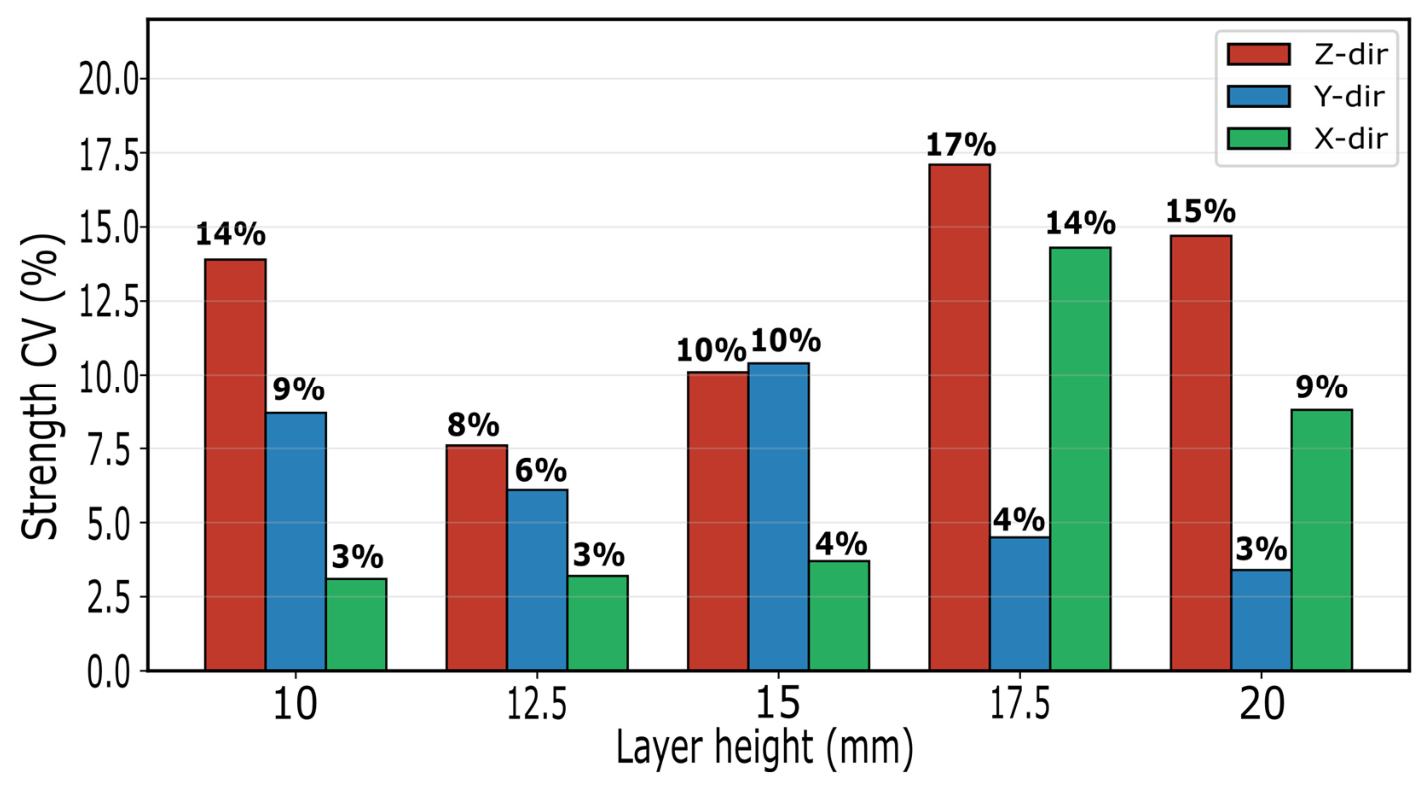
The coefficient of variation of strength showed a clear directional pattern (Figure 7), with Z-direction generally exhibiting the highest CV (7.6–17.1%), followed by Y (3.4–10.4%) and X (3.1–14.3%). This hierarchy is consistent with the likely heterogeneity of interlayer bond quality.
Figure 7.
Strength CV.
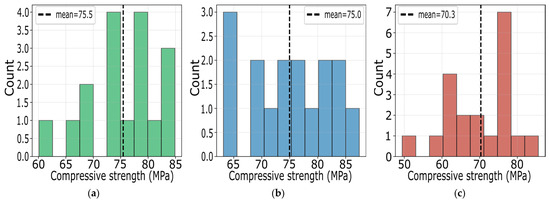
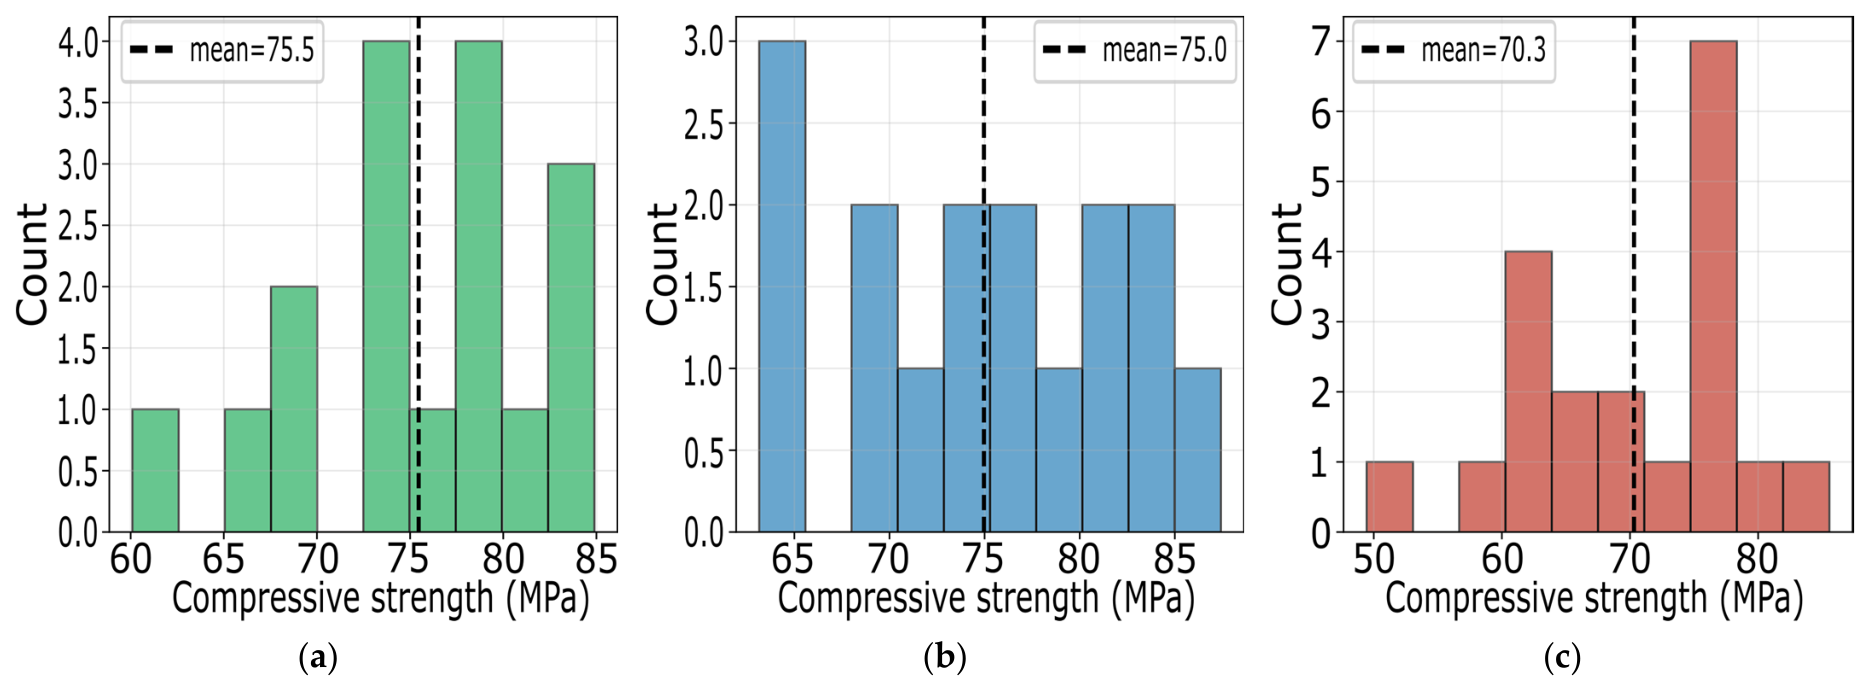
The distribution of compressive strengths in the three directions is shown in Figure 8. All three directions exhibit a slightly left-skewed distribution (skewness = −0.60 overall), indicating a tail of low-strength specimens. This left skew is consistent with the presence of occasional weak interfaces that reduce strength in a minority of specimens, without affecting the majority.
Figure 8.
Strength distribution by direction: (a) X-direction (CV = 8.4%); (b) Y-direction (CV = 10.1%); (c) Z-direction (CV = 12.6%).
3.3. Failure Modes
All 56 specimens were documented for failure-mode analysis (Table 7). Failure modes were classified qualitatively based on the dominant crack morphology observed in the multi-face post-failure documentation, following the approach of similar 3DCP studies. The failure was predominantly vertical splitting (cracks propagating along the loading direction), together with vertical-oblique compound cracking, local crushing, and oblique shear, indicating matrix-dominated failure. Because the classification is based on visual observation of surface cracks, it is reported here in qualitative terms rather than as quantitative proportions, consistent with the observability limitations discussed in Section 4.
Table 7.
Failure-mode characteristics.
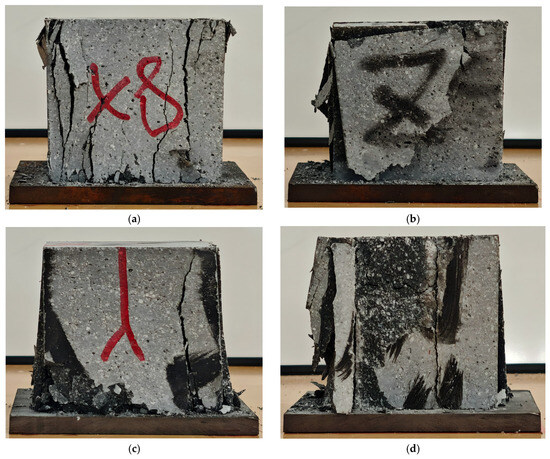
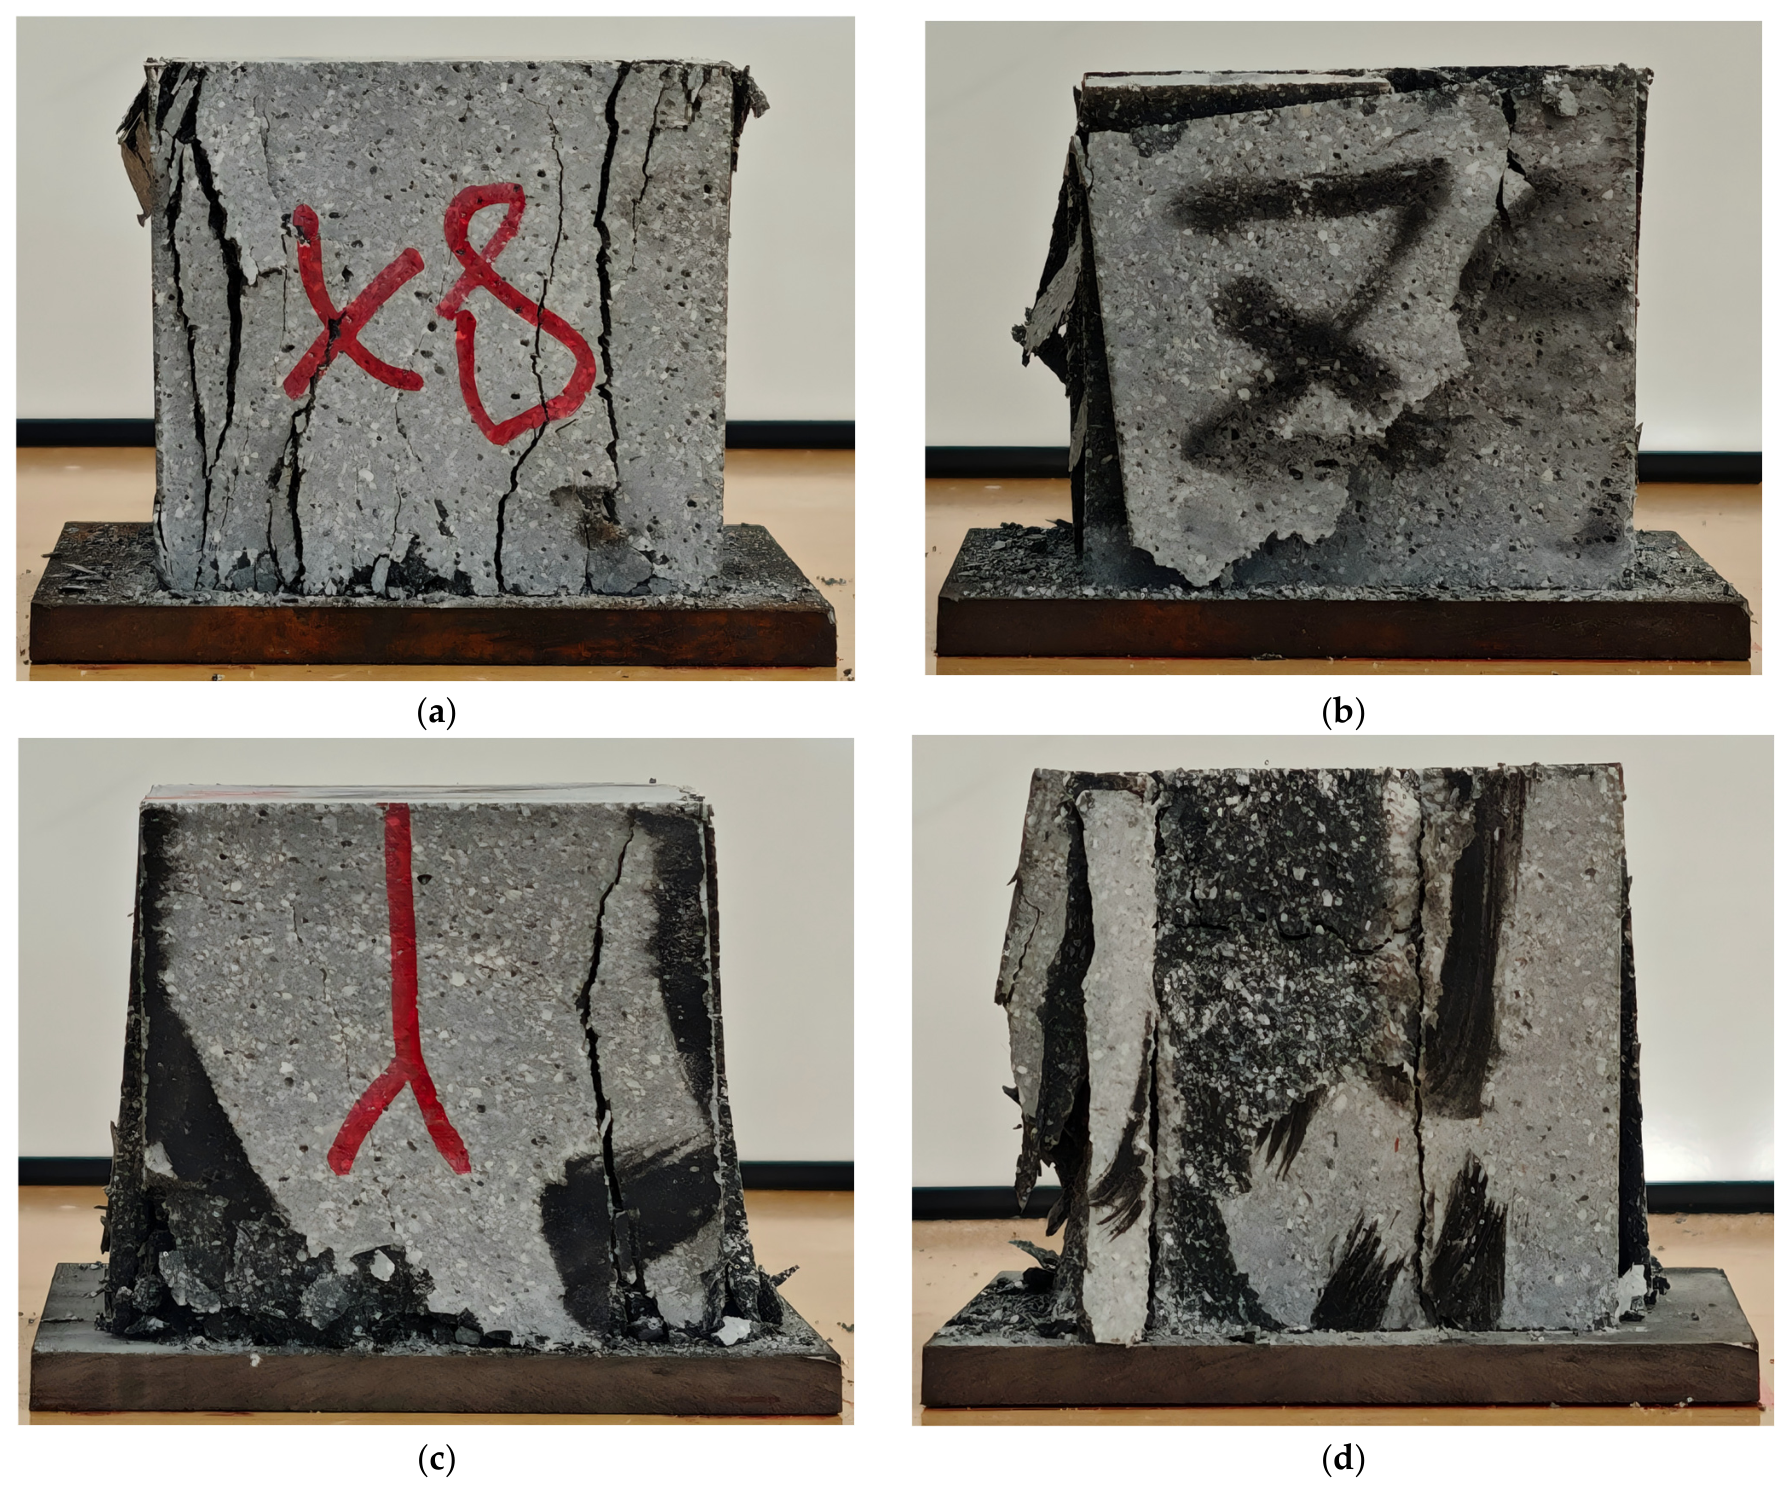
Representative failure morphologies for each dominant mode are shown in Figure 9: vertical splitting (specimen 12.5 mm-Z2), oblique shear (specimen 17.5 mm-Y3), end crushing (specimen 12.5 mm-Z1), and interface-related cracking (specimen 10 mm-X1).
Figure 9.
Representative failure modes of 3D-printed concrete (photos): (a) vertical splitting (12.5 mm-Z2, Y-Z face); (b) oblique shear (17.5 mm-Y3, X-Y face); (c) end-face crushing (12.5 mm-Z1, X-Z face); (d) interface-related (10 mm-X1, Y-X face).
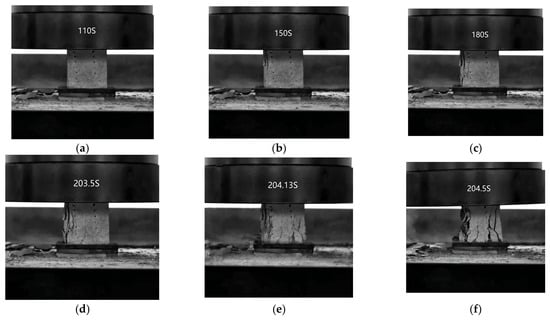
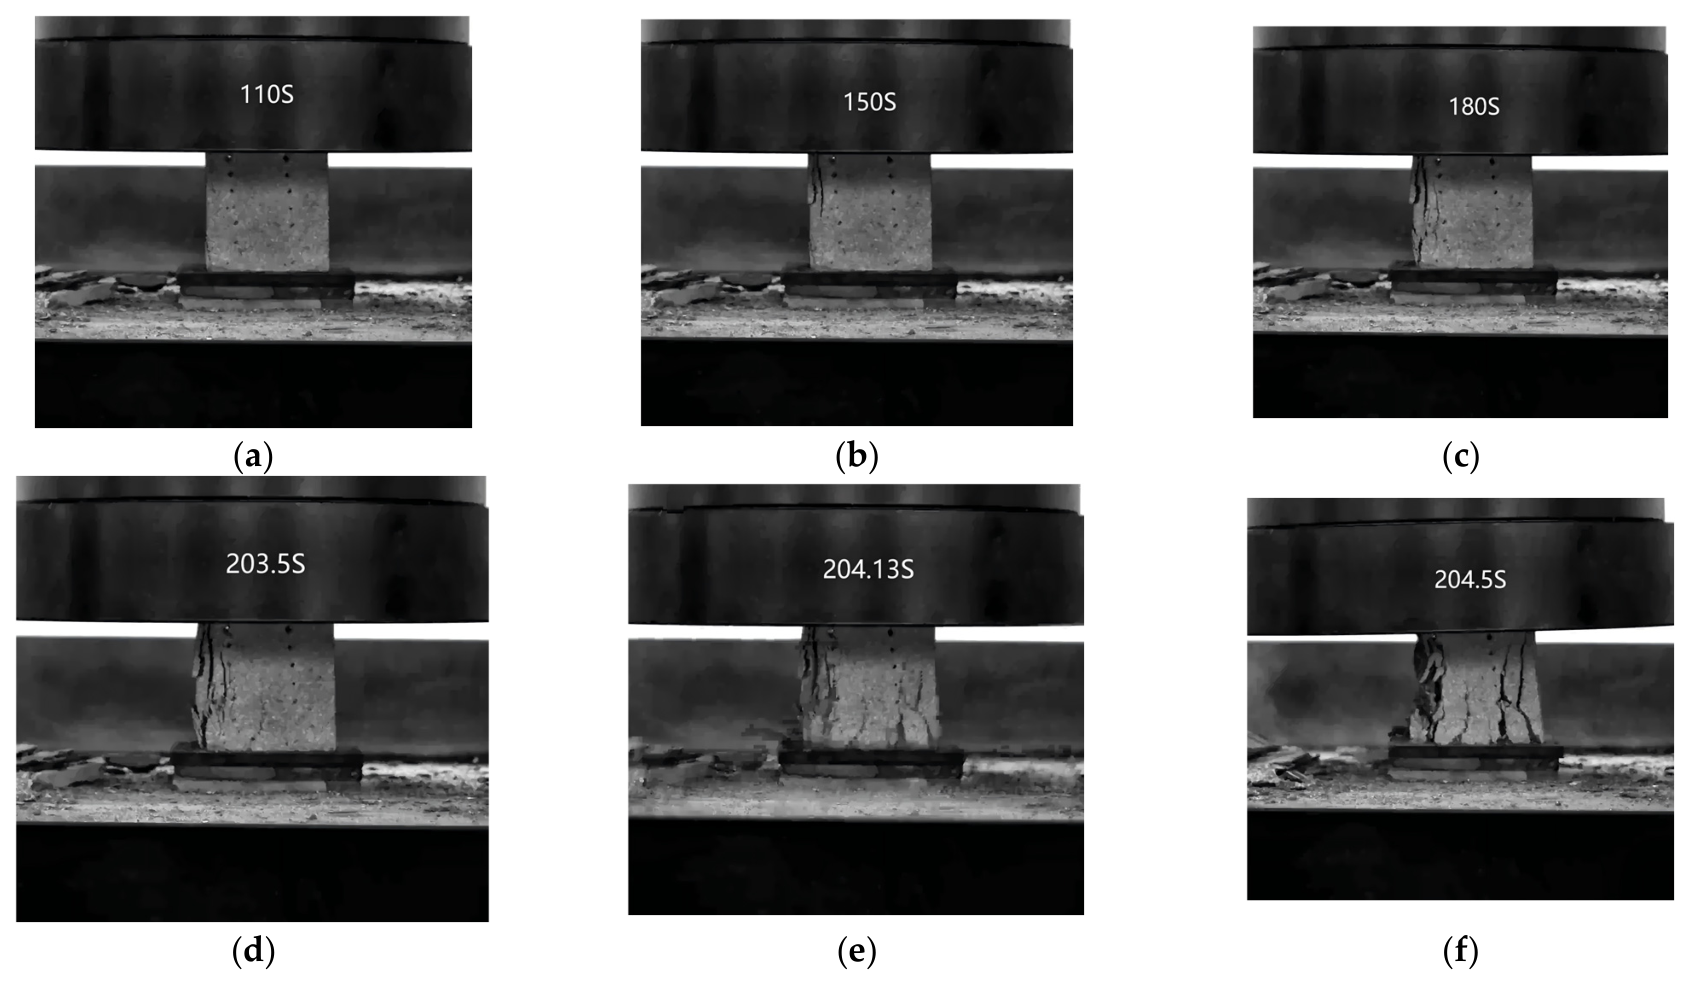
Figure 10 shows frames extracted from the high-speed camera recording of the failure process of specimen 10 mm-Z1 (10 mm layer height, Z-direction), which failed by vertical splitting: a first vertical crack became visible at approximately 110 s of loading and extended progressively; near the peak load (approximately 204 s), the crack opened abruptly, leading to splitting and collapse. The gradual crack extension followed by a brittle final split is consistent with the load-time curve behavior.
Figure 10.
High-speed failure sequence (specimen 10 mm-Z1): (a) 110 s (first vertical crack); (b) 150 s; (c) 180 s; (d) 203.5 s (splitting); (e) 204.13 s; (f) 204.5 s (collapse).
Interface-related cracking was positively identified only in the 10 mm layer specimens, where the thin layers (10 mm spacing) rendered the interfaces visually discernible on the fracture surfaces. Specimen 10 mm-X1 showed a crack developing along the interfilament interface; specimens 10 mm-Y1 and 10 mm-Y4 showed cracks propagating adjacent to native layer interfaces. For the 12.5–20 mm layer height range, interface participation could not be confirmed or excluded: at these larger layer spacings (12.5–20 mm), the relationship between crack paths and internal interfaces could not be reliably discerned by surface observation alone.
This limitation in observability should not be interpreted as evidence of absence of interface involvement in thicker layers. The positive identification of interface-related cracking at 10 mm, where the interlayer interface density is highest (9 interfaces in 90 mm), suggests that thin layers increase the likelihood of interface participation in failure paths, but microstructural techniques (e.g., SEM or X-ray CT) would be required to resolve interface involvement across the full layer height range. The three outlier specimens (28.9, 33.5, and 15.1 MPa) exhibited normal failure morphology indistinguishable from their companion specimens, indicating that their low strength may have originated from internal defects or cutting damage, although this could not be confirmed.
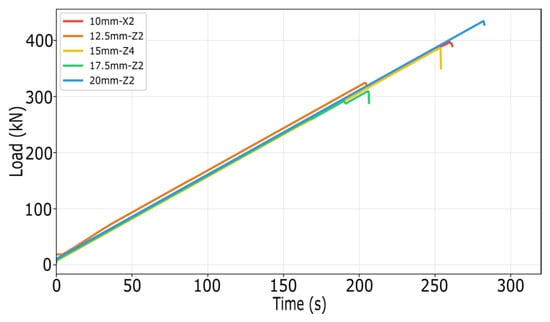
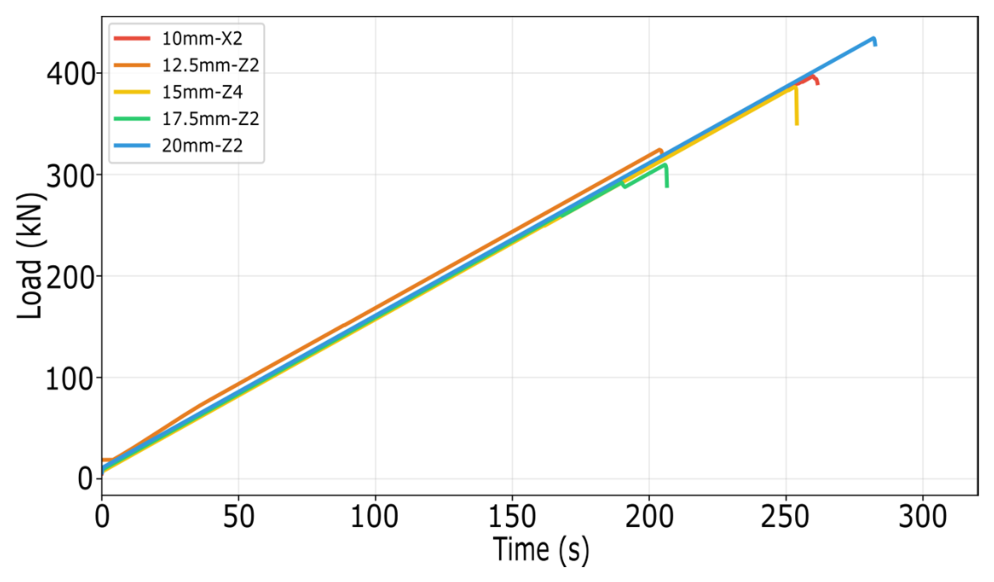
3.4. Load-Time Curve Analysis
Representative load-time curves are shown in Figure 11. The curves exhibited a consistent loading rate of 1.5 kN/s across the vast majority of specimens, confirming the force-control test procedure. Post-peak behavior was essentially brittle under force control, with the testing machine unloading immediately upon specimen failure. The peak load was reached at times proportional to the peak force, confirming rate consistency.
Figure 11.
Representative load-time curves.
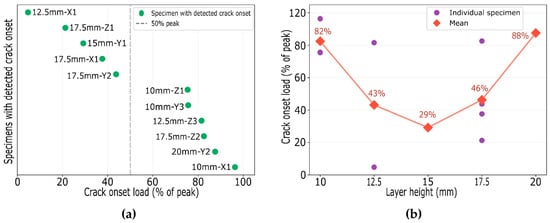
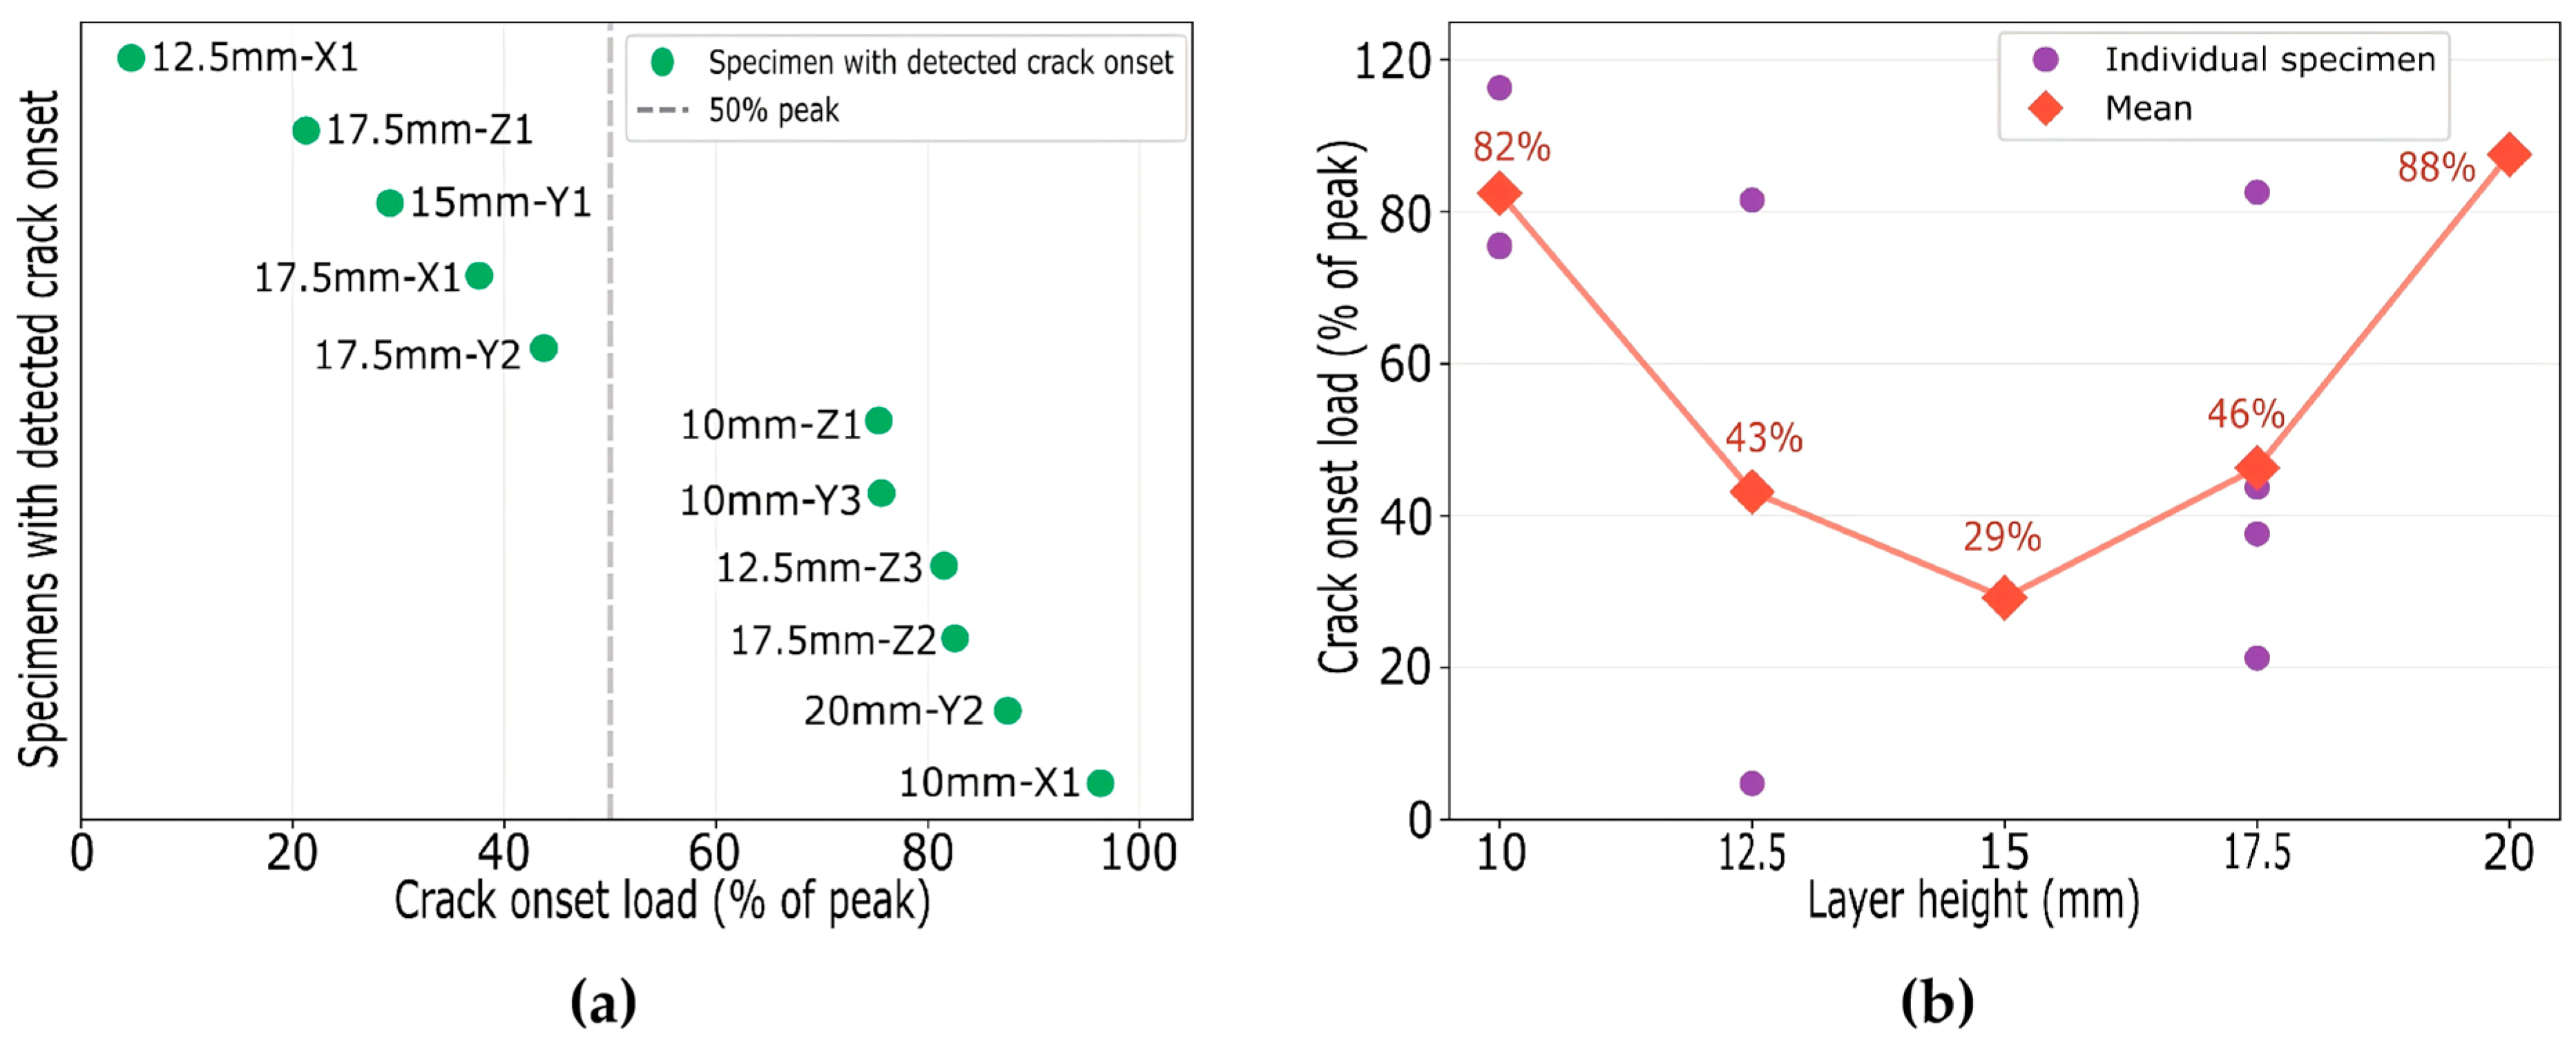
Slope-degradation analysis of the load-time curves identified pre-peak stiffness degradation in 11 of 56 specimens (20%). The crack-onset load, defined as the point where the instantaneous slope falls below 85% of the baseline stiffness for five consecutive samples, ranged from 5% to 96% of the peak load across the detected specimens. The distribution of crack-onset loads is shown in Figure 12a, and the layer-height grouping in Figure 12b.
Figure 12.
Crack onset analysis: (a) distribution (11 of 56 detected); (b) by layer height.
For example, specimen 17.5 mm-Z1 exhibited stiffness degradation at only 21% of peak load, which is consistent with, though not proof of, early damage accumulation and its below-average strength (49.4 MPa). Specimens such as 10 mm-X1 showed linear behavior until 96% of peak load, indicating delayed cracking. Under force control, the testing machine partially compensates for specimen stiffness changes, so the detected degradation points represent macroscopic cracking onset rather than micro-crack initiation; a majority of specimens (80%) did not exhibit detectable slope changes before peak load.
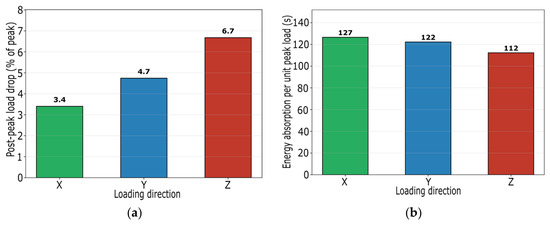
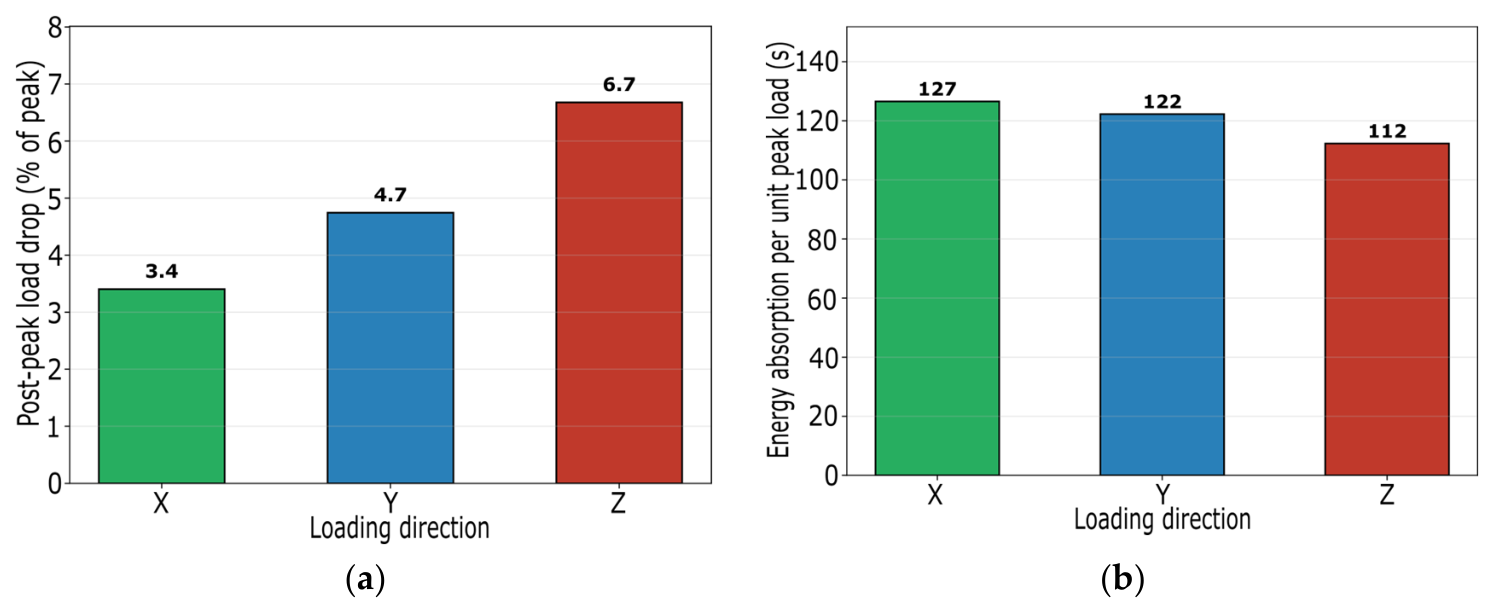
Beyond crack-onset detection, the load-time curves reveal directional differences in the brittle behavior of the printed concrete. The post-peak load drop within 0.5 s of the peak, reflecting the instantaneous load loss upon failure, averaged 3.4% of the peak load in the X-direction but 6.7% in the Z-direction (Figure 13a). Notably, the fraction of specimens exhibiting brittle failure (post-peak drop exceeding 10% of the peak) was 18% in the Z-direction (4 of 22) compared to only 6% in the X- and Y-directions (1 of 17 each). The energy absorbed up to the peak, normalized by the peak load, decreased from 126.6 s (X) to 112.3 s (Z) (Figure 13b), indicating that Z-direction specimens absorb less energy before failure, consistent with a more brittle, interface-influenced failure.
Figure 13.
Load-time curve characteristics: (a) post-peak drop; (b) energy absorption.
The crack-onset loads also exhibited a directional pattern: Z-direction specimens with detected crack onset clustered at either early (21% of peak) or late (75–83%) stages, whereas X- and Y-direction specimens showed a more continuous distribution. This early-late bimodal pattern in the Z-direction may reflect two distinct mechanisms: premature cracking at weak interfaces versus conventional matrix damage near the peak, although the small number of detected specimens limits definitive interpretation.
The crack-onset load as a percentage of peak load, for the 11 specimens with detected pre-peak stiffness degradation, is shown in Figure 12b. Three of the four specimens from the 17.5 mm layer height exhibited early degradation (21–44% of peak), whereas the 10 mm specimens all degraded late (>75% of peak). The remaining 45 specimens (80%) showed no detectable pre-peak stiffness change, consistent with predominantly linear behavior to peak under force control.
3.5. Density
The density of the specimens ranged from 2145 to 2181 kg/m3, with no systematic variation across layer heights (mean 2154–2170 kg/m3 per layer height). Pearson correlation analysis revealed no significant relationship between density and compressive strength (r = −0.074, p = 0.600), indicating that overall densification alone does not account for the observed strength variations.
3.6. Correlation Between Ultrasonic and Mechanical Properties
Pearson correlation analysis across the 15 (layer height × direction) pairs revealed no significant correlation between mean ultrasonic velocity and mean compressive strength (r = 0.225, p = 0.420). Similarly, amplitude and frequency showed no significant correlation with strength. The anisotropy ratio Z/X also showed no significant correlation with layer height (r = 0.427, p = 0.473), consistent with the ANOVA result that directional anisotropy was significant only at 12.5 mm.
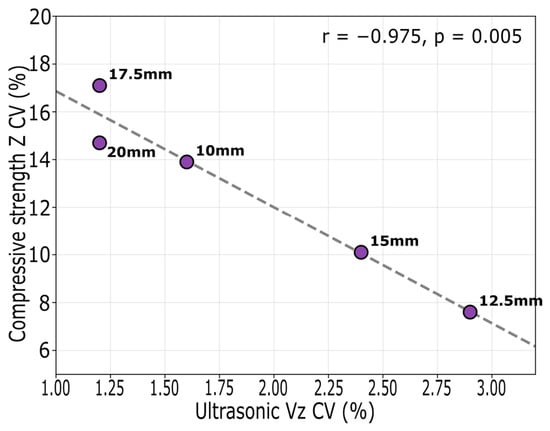
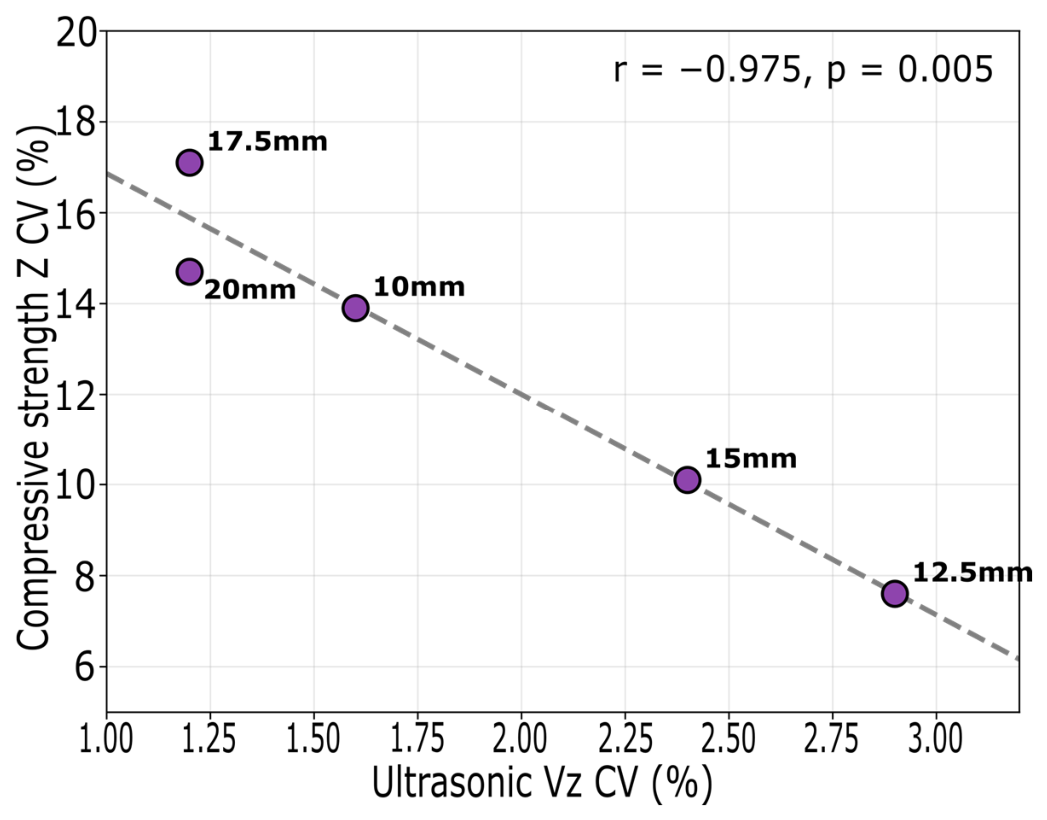
A negative correlation was observed between the CV of Z-direction ultrasonic velocity and the CV of Z-direction compressive strength across the five layer heights (r = −0.975, p = 0.005, Figure 14). It must be emphasized that this correlation is based on only five data points (one per layer height), each strength CV being itself computed from only three to five specimens, and is sensitive to both individual values and outlier exclusion. A leave-one-out analysis showed that the negative slope and its direction are largely retained when each layer height is omitted in turn (slope = −4.87, −4.83, −4.88, −4.30, and −5.42; R2 = 0.948, 0.886, 0.942, 0.985, and 0.989; r = −0.974, −0.941, −0.970, −0.993, and −0.995; p = 0.026, 0.059, 0.030, 0.007, and 0.005, when the 10, 12.5, 15, 17.5, and 20 mm data points are removed, respectively), although omitting the 12.5 mm point, which has the highest ultrasonic CV (2.9%), renders the association non-significant (p = 0.059), indicating that this point is influential. By contrast, the association is not robust to the inclusion of the three excluded specimens: when they are retained, the correlation collapses to r = +0.067 (p = 0.914), indicating that the negative association depends on the exclusion of specimens with anomalously low strength. The preliminary linear fit to this association is CVstrength ≈ 21.7 − 4.9·CVultrasonic (R2 = 0.95, n = 5, Figure 14). This association should therefore be regarded as an exploratory trend rather than an established relationship, and it requires verification with additional printed blocks. If confirmed, it would reveal a trade-off: layer heights with high ultrasonic CV (thin layers) may exhibit lower strength CV (more uniform behavior), while layer heights with low ultrasonic CV (thick layers) may exhibit higher strength CV (greater scatter).
Figure 14.
Ultrasonic CV vs. strength CV.
4. Discussion
4.1. Layer Height and Mean Strength: An Absence of Dominant Effect
The statistical analysis demonstrated that within the 10–20 mm range, layer height does not significantly influence mean compressive strength in any direction. This finding differs from that of Nair et al. [18], who reported that compressive strength decreased with increasing layer height in their specimens. The absence of a significant layer-height effect in the present study may reflect differences in material formulation, printing parameters, or the narrow layer-height range examined (10–20 mm), and is consistent with the interpretation that, at these layer heights with a short constant interlayer time interval (approximately 45 s), far below the interlayer delay levels shown to significantly weaken interlayer bonding in previous studies [6,19], the interface quality remains sufficient for the mean strength to be dominated by the base material rather than by interface defects.
The only significant anisotropy was observed at 12.5 mm, where Y-direction (across the filaments) strength exceeded Z-direction (across layers) by approximately 19%. This may reflect the specific interface density and stress state at this intermediate layer height, and is consistent with the influence of deposition method reported by Dey et al. [20].
4.2. The Quantity–Quality Trade-Off of Interlayer Interfaces
An exploratory negative correlation was observed between ultrasonic CV and strength CV in the Z-direction across the five layer heights (r = −0.975, p = 0.005). If confirmed with additional data, this would reveal a tentative trade-off governing interlayer bond behavior:
- Thin layers (10–12.5 mm): More interfaces per unit height, but each interface is more uniformly formed, consistent with Kul et al. [21], who found that reducing layer height compresses the layers and reduces interlayer void volume. The ultrasonic CV did not, however, increase monotonically with interface number: the 10 mm layers (the most interfaces) showed a low ultrasonic CV (1.6%), whereas the 12.5 mm layers showed the highest ultrasonic CV (2.9%). Correspondingly, the 12.5 mm layers showed the lowest strength CV (7.6%), while the 10 mm layers retained a higher strength CV (13.9%).
- Thick layers (17.5–20 mm): Fewer interfaces, but greater variation in surface conditions between deposition events. This yields low ultrasonic CV (few interfaces → fewer acoustic discontinuities) but high strength CV (variable bond quality → scattered strength).
- With a constant 30 mm nozzle diameter, the contact condition between successive layers and the interfacial porosity may also vary with layer height. In particular, the self-weight of the upper layers may contribute to the compaction of the layers below, an effect whose magnitude would depend on the individual layer thickness and the number of stacked layers. Because interfacial porosity, void content, and contact quality were not directly characterized in this study, these effects are presented here as proposed mechanisms to be verified by microstructural techniques (e.g., SEM or X-ray CT) in future work, rather than as demonstrated phenomena.
This trade-off can be expressed as a preliminary linear relationship between the two coefficients of variation in the Z-direction (Figure 14):
CVstrength ≈ 21.7 − 4.9 · CVultrasonic (R2 = 0.95, n = 5)
The interpretation of this negative slope carries an important, counter-intuitive implication for ultrasonic assessment of 3DCP. Conventionally, a high scatter in ultrasonic velocity is associated with poor material quality. For the present interlayer assessment, however, the ultrasonic CV did not scale with the number of interlayer interfaces, so that it cannot be regarded as a direct indicator of interface density; it may instead be governed by the spatial arrangement of the interfaces along the propagation path, although this mechanism cannot be resolved from the present measurements. Nonetheless, a low ultrasonic CV in the thicker layers may mask a small number of weak interfaces that produce scattered, potentially low, strengths. From a quality-control standpoint, this implies that low ultrasonic CV, rather than high, may warrant attention for potential weak interfaces in 3DCP elements, although this interpretation requires verification with additional layer heights and microstructural evidence.
This trade-off also has direct engineering implications. The mean strength may be similar across layer heights, but the reliability differs: thin layers offer more predictable behavior, while thick layers introduce greater uncertainty due to potential weak spots.
As a related but non-independent observation, the number of supplementary specimens required during testing is broadly consistent with the measured variability: the 12.5 mm layer height, which exhibited the lowest strength variability (CV = 3.2–7.6%) and the highest ultrasonic CV (2.9%), required no supplementary specimens, whereas layer heights with greater strength variability (e.g., 17.5 mm, CV up to 17.1%) required additional specimens to confirm whether observed low strengths were genuine outliers. Because the decision to add specimens was made subjectively during testing, this observation is reported only as a qualitative consistency check and should not be regarded as an independent indicator of interlayer bond uniformity.
4.3. Failure Modes and Interface Involvement
The failure was predominantly vertical splitting and vertical-oblique compound cracking, indicating that crack propagation in these 3DCP specimens occurred mainly through the matrix rather than as large-scale interfacial debonding. The three outlier specimens (28.9, 33.5, and 15.1 MPa) exhibited normal failure morphology indistinguishable from their companion specimens, indicating that their low strength cannot be attributed to a distinct interfacial failure mechanism observable at the surface. The underlying cause (e.g., internal defects or cutting damage) could not be confirmed without microstructural examination.
Interface-related cracking was positively identified only in the 10 mm layer specimens, where the thin layer spacing (10 mm) rendered the interfaces visually discernible on fracture surfaces. At this layer height, the high interlayer interface density (nine interfaces in 90 mm) was also associated with the strongest anisotropy observed (Z/X = 0.87). Whether the visible interface-related cracking reflects a systematic influence of interface density on failure paths, or is simply an artifact of the better visibility at 10 mm spacing, cannot be resolved from the present surface observations. However, an important observation limitation must be acknowledged: for layer heights of 12.5–20 mm, interface participation could not be confirmed or excluded by surface observation, because the larger layer spacing makes it difficult to discern whether a crack follows an internal interface. The absence of reported interface-related cracking in thicker layers is therefore a limitation of observability rather than definitive evidence of its absence. Resolving the interface involvement across all layer heights would require microstructural techniques such as SEM or X-ray CT.
The dominant failure mode exhibited a tentative mechanistic relationship with strength behavior. Specimens classified as vertical splitting showed the lowest mean strength among all failure-mode groups (62.3 MPa) and the highest variability (CV = 26%), whereas oblique shear failure (observed only at the 17.5 mm layer height) showed the lowest variability (CV = 10%). This pattern is consistent with the fracture mechanics of these specimens. Under axial compression, Poisson expansion generates transverse tensile stresses perpendicular to the loading direction. In 3DCP, the interlayer and interfilament interfaces constitute transverse defect zones (micro-pores, imperfect contact) that act as crack-initiation sites: once the transverse tensile stress reaches the local interfacial strength, a vertical splitting crack nucleates at the defect. Because the spatial distribution of interfacial defects is stochastic, the nucleation location (and hence the splitting strength) varies randomly among specimens, producing the high strength variability of the vertical splitting group. In contrast, oblique shear failure (double-cone or inverted-V pattern) is governed by the shear resistance of the matrix material, following Mohr–Coulomb behavior, and does not depend on randomly distributed interface defects. Its appearance only at the 17.5 mm layer height, where the interlayer interface density is low (5 interfaces in 90 mm) and interface effects are correspondingly weak, indicates that shear-dominated failure emerges when the material approaches a more homogeneous, defect-free state. This mechanistic interpretation links the failure mode, the interface density (and hence the layer height), and the strength variability into a coherent picture: interface-rich thin layers promote stochastic defect-initiated splitting with low and scattered strength, whereas interface-poor thick layers permit shear-dominated failure with more consistent strength. These associations should be regarded as exploratory given the limited number of specimens per mode and the qualitative nature of the failure-mode classification.
4.4. Ultrasonic CV as a Non-Destructive Indicator
The significant correlation between ultrasonic CV and strength CV, combined with the directional hierarchy of both parameters (Z > Y > X), suggests that ultrasonic CV may, with further validation, serve as a tentative non-destructive proxy for interlayer bond uniformity. This has practical value for field quality assessment of 3DCP structures, where destructive sampling is costly and surface inspection cannot reveal internal interface conditions.
However, ultrasonic velocity did not predict mean compressive strength in 3DCP (r = 0.225, p = 0.420). Ultrasonic testing should therefore be viewed as a tool for identifying spatial variability and potential weak zones, rather than for direct strength prediction. This distinction is important for avoiding misinterpretation of UPV data in engineering practice.
4.5. Engineering Implications
The findings of this study suggest several practical recommendations:
- Layer height selection involves a reliability-efficiency trade-off, and interacts with nozzle geometry as noted by Muy et al. [22]: Thin layers (10–12.5 mm) offer more uniform mechanical behavior at the cost of printing efficiency. Thick layers (17.5–20 mm) improve efficiency but require more rigorous quality verification.
- Z-direction is the critical direction for quality control: The highest spatial variability consistently occurred in the Z-direction, making it the priority direction for non-destructive assessment.
- Ultrasonic CV may provide a tentative quality indicator: Scanning the Z-direction with UPV and computing the CV can identify structures or regions with high interface variability, guiding targeted destructive sampling or remediation.
- Structural application favors compression-dominated elements: Since the interlayer (Z) direction is the least reliable, printed concrete is best suited to components loaded primarily in compression with the principal stress oriented within the printing plane (X–Y) rather than across the layer interfaces; applications involving Z-direction tension or flexure would require enhanced interlayer bonding or reinforcement.
4.6. Limitations
Several limitations should be acknowledged. First, each layer height was represented by a single printed block, and the numerous ultrasonic measurements and cube tests were obtained from that same block. These within-block measurements do not constitute independent replicates of the printing process; consequently, they overstate the effective sample size, and comparisons across layer heights cannot fully separate the effect of layer height from inter-block variability (including variability between the three mixing batches). The layer-height-dependent trends (including the ultrasonic CV–strength CV association in the Z-direction) should therefore be interpreted as exploratory rather than definitive. Second, the natural curing conditions (rather than controlled laboratory curing) may introduce environmental variability. Third, the ultrasonic CV–strength CV correlation is based on five data points (one per layer height), which provides limited statistical power despite the strong correlation coefficient. This association should be regarded as a trend observation that warrants verification with a larger number of printed blocks. Fourth, surface-based failure-mode observation cannot fully resolve whether cracks follow internal interfaces, which would require microstructural techniques such as SEM or X-ray CT. Fifth, the extrusion screw speed (from 60 rpm to about 100 rpm) and the traverse speed (6000–7000 mm/min) were adjusted together with layer height to maintain the required extrusion conditions, so that the effect of layer height is confounded with these extrusion-parameter changes and the observed differences cannot be attributed to layer height alone. Finally, the load-time curves obtained under force control do not capture the complete post-peak softening behavior.
5. Conclusions
This study systematically investigated the effect of layer height (10–20 mm) on the multi-directional compressive strength, ultrasonic properties, failure modes, and damage evolution of 3D-printed concrete. The following conclusions can be drawn:
- Layer height does not significantly influence mean compressive strength in any direction within the 10–20 mm range (ANOVA p = 0.825). Directional anisotropy was significant only at 12.5 mm layer height.
- The spatial variability of strength follows a directional hierarchy (Z > Y > X), with the Z-direction (across the layer interfaces) consistently showing the highest coefficient of variation (7.6–17.1%), consistent with the likely heterogeneity of interlayer bond quality.
- An exploratory negative correlation was observed between ultrasonic CV and strength CV in the Z-direction (r = −0.975, p = 0.005), tentatively suggesting a quantity–quality trade-off: the 12.5 mm layers combined the highest ultrasonic CV with the lowest strength CV (7.6%), whereas the 10 mm layers (the most interfaces) retained a higher strength CV (13.9%); the thick layers showed lower ultrasonic CV but greater strength variability (14.7–17.1%). This association is based on five data points, is not robust to the inclusion of the three excluded specimens (r = +0.067, p = 0.914), and requires verification with additional printed blocks before it can be treated as established.
- Failure is predominantly matrix-dominated, with vertical splitting and vertical-oblique compound cracking as the main modes, accompanied by local crushing and oblique shear. Interface-related cracking was positively identified only in the 10 mm layer specimens where interfaces were visually discernible. For thicker layers, interface participation could not be confirmed or excluded by surface observation.
- Ultrasonic CV shows potential as a non-destructive indicator of interlayer bond uniformity, complementing but not replacing strength testing. With further validation across a larger number of printed blocks, it may provide a complementary non-destructive indicator for identifying spatial variability in 3DCP structures.
- The results tentatively suggest that layer height selection in 3DCP involves a reliability-efficiency trade-off: thin layers (10–12.5 mm) may offer more predictable behavior, while thick layers (17.5–20 mm) improve printing efficiency but may require more rigorous quality verification, particularly in the Z-direction. These observations should be regarded as exploratory pending verification across a larger number of printed blocks.
Author Contributions
Conceptualization, F.Y. and M.F.; methodology, F.Y. and X.W.; software, F.Y.; validation, X.W. and L.H.; formal analysis, F.Y.; investigation, F.Y., X.W. and L.H.; resources, M.F.; data curation, F.Y.; writing—original draft preparation, F.Y.; writing—review and editing, X.W., L.H. and M.F.; visualization, F.Y.; supervision, M.F.; project administration, M.F.; funding acquisition, F.Y. and M.F. All authors have read and agreed to the published version of the manuscript.
Funding
This research was funded by the Science and Technology Guiding Project of the Jiangsu Provincial Construction System (number: 2023ZD044), Jiangsu Provincial Industry-University-Research Cooperation Project (2025) (number: BY20250540), the Integrated Innovation–Entrepreneurship Team for Building 3D Printing Technology and Application (number: YXZJ0000908), and the Jiangsu Provincial Higher Vocational College Intelligent Construction 3D Technology Application Engineering Research and Development Center.
Data Availability Statement
The original contributions presented in this study are included in the article. Further inquiries can be directed to the corresponding author.
Acknowledgments
During the preparation of this work, the authors used AI-assisted tools for language editing and data visualization assistance. After using these tools, the authors reviewed and verified the content and take full responsibility for the content of this publication.
Conflicts of Interest
Authors Xingyu Wang, Lifang Han and Mingyang Feng were employed by the company China Construction Eighth Engineering Division Corp., Ltd. The remaining authors declare that the research was conducted in the absence of any commercial or financial relationships that could be construed as a potential conflict of interest.
Abbreviations
The following abbreviations are used in this manuscript:
| 3DCP | 3D concrete printing |
| ANOVA | analysis of variance |
| CV | coefficient of variation |
| UPV | ultrasonic pulse velocity |
References
- Zhao, H.; Wang, Y.; Liu, X.; Wang, X.; Chen, Z.; Lei, Z.; Zhou, Y.; Singh, A. Review on solid wastes incorporated cementitious material using 3D concrete printing technology. Case Stud. Constr. Mater. 2024, 21, e03676. [Google Scholar] [CrossRef] [Scilit]
- Panda, B.; Paul, S.C.; Tan, M.J. Anisotropic mechanical performance of 3D printed fiber reinforced sustainable construction material. Mater. Lett. 2017, 209, 146–149. [Google Scholar] [CrossRef] [Scilit]
- Wolfs, R.J.M.; Bos, F.P.; Salet, T.A.M. Hardened properties of 3D printed concrete: The influence of process parameters on interlayer adhesion. Cem. Concr. Res. 2019, 119, 132–140. [Google Scholar] [CrossRef] [Scilit]
- Arunothayan, A.R.; Nematollahi, B.; Ranade, R.; Bong, S.H.; Sanjayan, J.G.; Khayat, K.H. Fiber orientation effects on ultra-high performance concrete formed by 3D printing. Cem. Concr. Res. 2021, 143, 106384. [Google Scholar] [CrossRef] [Scilit]
- Surehali, S.; Tripathi, A.; Neithalath, N. Anisotropy in Additively Manufactured Concrete Specimens under Compressive Loading—Quantification of the Effects of Layer Height and Fiber Reinforcement. Materials 2023, 16, 5488. [Google Scholar] [CrossRef] [Scilit]
- Aminpour, N.; Memari, A.M. Analysis of anisotropic behavior in 3D concrete printing for mechanical property evaluation. J. Build. Eng. 2025, 99, 111652. [Google Scholar] [CrossRef] [Scilit]
- Rehman, A.U.; Kim, J.H. 3D concrete printing: A systematic review of rheology, mix designs, mechanical, microstructural, and durability characteristics. Materials 2021, 14, 3800. [Google Scholar] [CrossRef] [Scilit]
- Xu, X.; Ran, B.; Jiang, N.; Xu, L.; Huan, P.; Zhang, X.; Li, Z. A systematic review of ultrasonic techniques for defects detection in construction and building materials. Measurement 2024, 226, 114181. [Google Scholar] [CrossRef] [Scilit]
- Anoni, L.G.; Haach, V.G.; Khazanovich, L. Image reconstruction in concrete ultrasound tomography: A systematic review. Constr. Build. Mater. 2024, 441, 137472. [Google Scholar] [CrossRef] [Scilit]
- Sun, W.; Hou, S.; Fan, J.; Wu, G.; Ma, F. Ultrasonic computed tomography-based internal-defect detection and location of underwater concrete piers. Smart Mater. Struct. 2023, 32, 125021. [Google Scholar] [CrossRef] [Scilit]
- Zhang, L.; Qiao, C.; Jia, S.; Zeng, J.; Li, H.; Zhang, T.; Wu, S. Imaging of inclusions in concrete with enhanced low-frequency ultrasound tomography. Sens. Actuators A Phys. 2025, 386, 116324. [Google Scholar] [CrossRef] [Scilit]
- Skibicki, S.; Dvořák, R.; Pazdera, L.; Topolář, L.; Kocáb, D.; Alexa, M.; Cendrowski, K.; Hoffmann, M. Anisotropic mechanical properties of 3D printed mortar determined by standard flexural and compression test and acoustic emission. Constr. Build. Mater. 2024, 452, 138957. [Google Scholar] [CrossRef] [Scilit]
- Han, L.; Yang, Y.; Lian, C.; Wang, J. Analysis of Concrete Building 3D Printing Technology and Its Line Width Control Method. Mod. Manuf. Technol. Equip. 2020, 56, 193–196. (In Chinese) [Google Scholar]
- JGJ/T 70-2009; Standard for Test Method of Basic Properties of Construction Mortar. Ministry of Housing and Urban-Rural Development of the People’s Republic of China: Beijing, China, 2009.
- T/CBMF 183-2022; Test Methods for Basic Mechanical Properties of 3D Printed Concrete. China Building Materials Federation: Beijing, China, 2022.
- T/CECS 21-2024; Technical Specification for Inspection of Concrete Defects by Ultrasonic Method. China Association for Engineering Construction Standardization: Beijing, China, 2024.
- ASTM C597-22; Standard Test Method for Ultrasonic Pulse Velocity Through Concrete. ASTM International: West Conshohocken, PA, USA, 2022.
- Nair, S.A.O.; Tripathi, A.; Neithalath, N. Constitutive response and failure progression in digitally fabricated (3D printed) concrete under compression and their dependence on print layer height. Constr. Build. Mater. 2024, 411, 134246. [Google Scholar] [CrossRef] [Scilit]
- Slavcheva, G.S.; Levchenko, A.V.; Shvedova, M.A.; Karakchi-ogly, D.R.; Babenko, D.S. Anisotropy in mechanical properties of 3D-printed layered concrete. Mag. Civ. Eng. 2024, 17, 12708. [Google Scholar]
- Dey, D.; Sahu, A.; Prakash, S.; Panda, B.N. A study into the effect of material deposition methods on hardened properties of 3D printed concrete. Mater. Today Proc. 2023, in press. [Google Scholar] [CrossRef] [Scilit]
- Kul, A.; Kocaer, Ö.; Lucas, S.S. Anisotropic characteristics of 3D-printed geopolymer mortars from end-of-life materials of construction industry. In Proceedings of the 4th RILEM International Conference on Concrete and Digital Fabrication (Digital Concrete 2024), Munich, Germany, 4–6 September 2024. [Google Scholar]
- Muy, Y.; Courard, L.; Bulteel, D.; Rémond, S.; Taleb, M.; El Cheikh, K.; Hubert, J. Influence of nozzle diameter on the anisotropy of compressive strength—Measured on 3D printing concrete designed with recycled fine aggregates. In Proceedings of the 4th RILEM International Conference on Concrete and Digital Fabrication (Digital Concrete 2024), Munich, Germany, 4–6 September 2024. [Google Scholar]

Disclaimer/Publisher’s Note: The statements, opinions and data contained in all publications are solely those of the individual author(s) and contributor(s) and not of MDPI and/or the editor(s). MDPI and/or the editor(s) disclaim responsibility for any injury to people or property resulting from any ideas, methods, instructions or products referred to in the content. |
© 2026 by the authors. Licensee MDPI, Basel, Switzerland. This article is an open access article distributed under the terms and conditions of the Creative Commons Attribution (CC BY) license.