Abstract
Ensuring the structural integrity of tower cranes is paramount for construction safety, yet jib lower chords—serving as trolley tracks—often undergo coupled wear–fatigue degradation that is rarely quantified in conventional service-life assessments. This study proposes a quantitative, maintenance-focused framework for integrity evaluation and life prediction of in-service tower cranes, validated through a decommissioned unit with 26 years of service in high-rise building construction. Through the integration of on-site construction operational statistics, ANSYS (Version 2022 R1, ANSYS, Inc., Canonsburg, PA, USA)—driven stress simulations, and rainflow counting, a multi-condition load spectrum was developed to quantify cumulative damage. Field measurements pinpointed Segment b03 as the critical damage zone, showcasing a maximum wear depth of 2.3 mm and roughly 30% thickness loss in the 20–30 m range, driven by stress concentration and high-frequency trolley movements during material handling. Theoretical fatigue life estimates of 42.1 years were revised to 24.1 years by incorporating wear geometry evolution and other degradation factors, resulting in a prediction error of approximately 7–8% relative to the actual service life. The proposed approach effectively bridges the gap between mechanical-based calculations and construction engineering practice, providing robust support for inspection scheduling, maintenance prioritization, and lifecycle management of aging tower cranes.
1. Introduction
Tower cranes are indispensable to modern construction; their structural integrity directly governs operational efficiency and worker safety. Rapid urbanization and the proliferation of high-rise projects subject these cranes to increasingly demanding service conditions, heightening the risk of structural fatigue failure [1]. Statistical data indicate that crane-related accidents account for approximately 28.17% of all accidents involving special equipment, with an associated fatality rate of 27.54% [2]. A significant proportion of these incidents is attributed to fatigue failure of critical load-bearing structural components [3]. Among all critical structural components, the lower chord of the tower crane jib fulfills two essential functions: it must withstand tensile stresses induced by lifting loads [4], while simultaneously serving as the running track for the luffing trolley (a traveling trolley running along the jib to adjust the load radius and thus the lifting moment), thereby subjecting it to sustained cyclic rolling contact loads [5]. Under complex operating conditions, the lower chord surface is susceptible to the coupled effects of fatigue cracking and wear degradation, positioning it as a critical vulnerability that directly influences the service life and safety performance of tower cranes.
Wheel–rail contact wear prediction is a critical technical requirement for rail-guided equipment, underpinning both operational safety and maintenance optimization. The Archard wear model, owing to its simplicity and generalizability, has been extensively applied in quantitative analyses [6]. For instance, Ramalho [7] applied the Archard model to investigate the friction and wear behavior of rail and wheel steels, while Wang et al. [8] integrated Archard’s law into support vector regression-based feature engineering for track wear prediction. Sui et al. [9] extended this framework to examine freight car tread wear under non-Hertzian contact conditions. These studies establish robust theoretical foundations for wear quantification in rolling contact systems, providing a methodological basis for the present investigation.
In parallel, methodologies for fatigue life assessment of crane structures have evolved considerably. Kettler et al. [10], Wu et al. [11], Hectors et al. [12], and Cleary et al. [13] developed analytical models addressing fatigue damage mechanisms in welded beams, concrete beams, and crane runway beams, respectively. Zhao et al. [14] elucidated the fatigue failure mechanism of metallurgical crane steel beams through fracture mechanics. Studies on wheel-induced fatigue cracking and wear have systematically investigated aspects ranging from track geometric deviations [15] and crack propagation modes [16] to localized failure life prediction [17]. Furthermore, research has demonstrated that the coupled effects of eccentric loading and global bending significantly compromise structural fatigue strength. Rykaluk et al. [18] demonstrated that crane wheel eccentric loads coupled with global beam bending generate Type I and Type II combined stress fields that significantly reduce web fatigue strength. Euler et al. [19] developed a fatigue load prediction methodology based on crane operation types, systematically incorporating dead weight, trolley weight, and lifted loads. These studies underscore the critical role of wheel pressure loading in fatigue life prediction.
Beyond runway girders and railway systems, limited research has examined tower crane-specific structural behavior. Jiang et al. [20] employed transient dynamic analysis to simulate moving trolley loads, assessing vibration characteristics and fatigue of critical components. Zhang et al. [21] conducted orthogonal experimental stress monitoring at tower bases and jib roots, establishing stress distributions across operating conditions. Feng et al. [22] investigated jib vibration and load oscillation phenomena under trolley motion. Hussain et al. [23] developed digital twin approaches integrating fatigue theory with machine learning for degradation prediction and preventive maintenance. While these contributions advance understanding of global structural dynamics and condition monitoring, they do not address the localized coupled wear–fatigue mechanisms in lower chords subjected to simultaneous tensile loading and cyclic rolling contact, leaving this critical degradation pathway largely unexplored.
Fatigue life prediction accuracy largely depends on the construction of representative load spectra. Field monitoring-based methods combined with rainflow counting offer high fidelity but are costly and pose safety risks during high-altitude data acquisition [24,25]. Conversely, finite-element-based approaches provide computational efficiency but insufficiently capture real operational variability. Recent studies have incorporated machine learning—including neural networks [26], support vector regressions [27], and stochastic sampling methods [28,29] to address load randomness and uncertainty, combining these with S-N curves [30] or Paris crack growth laws [31], combined with Miner cumulative damage formulations [32,33] for life prediction.
Furthermore, current methodologies for constructing load spectra face dual challenges: on one hand, approaches relying heavily on actual field measurements are time-consuming and pose considerable safety risks for high-altitude tower crane operations; on the other hand, studies with insufficient integration of real operational data that depend purely on simulation modeling limit the practical applicability and accuracy of the resulting load spectra.
Despite these advances, research has predominantly focused on overhead crane girders and railway tracks, while systematic investigations into the wear–fatigue interaction of tower crane lower chords remain virtually absent. To address these critical gaps, the main contributions of this study are as follows: (1) a quantitative wear–fatigue coupling framework is established using field data from a 26-year-old decommissioned crane; (2) a hybrid load spectrum generation method combining operational statistics and FEM is proposed; (3) the specific impact of wear geometry on stress concentration and residual life is quantified, bridging the gap between theoretical models and actual service states.
2. Field Investigation and Wear Characteristics of Tower Crane Jib
2.1. Structural Configuration of the Tower Crane Jib
As illustrated in Figure 1, the tower crane jib employs a truss configuration consisting of upper chords, lower chords, diagonal web members, and connecting joints. The lower chord serves dual functions: acting as a primary load-bearing element while simultaneously functioning as the operational runway for the luffing trolley. The trolley, equipped with wheel assemblies, traverses along the lower chord surface to enable luffing operations (Figure 2). A pulley block system mounted beneath the trolley connects to the lifting hook for payload handling. Wheel loads transmitted to the lower chord comprise three components: trolley self-weight, lifting tackle assembly weight, and hoisted payload, constituting the primary loading source for fatigue accumulation.

Figure 1.
The jib local structure of tower crane.

Figure 2.
The contact between the luffing trolley and the jib.
The investigated tower crane (Table 1) was manufactured by a Chinese construction machinery company and commissioned in 1999. Following a structural evaluation in 2018 revealing significant degradation, operational capacity was downgraded. The crane was eventually decommissioned in 2024 after 26 years of service without documented maintenance interventions. This long-service example provides valuable data for investigating structural degradation patterns and fatigue behavior under realistic operational conditions.

Table 1.
Parameters of the tower crane.
The load distribution characteristics of the tower crane jib are governed by moment equilibrium principles and structural stability constraints. As illustrated in Figure 3, the jib functions as a cantilever structure subjected to overturning moments that vary with the horizontal distance between the payload and the tower mast. In the single-line (SM) lifting system, maximum load capacity decreases from 5.0 t at 10 m radius to 2.6 t at 50 m; in the double-line (DM) system, capacity reduces from 10.0 t at 10 m to 2.3 t at 50 m. This distribution pattern arises from constant overturning moment limitations imposed by the counterweight system, maintaining an inversely proportional relationship between maximum allowable load and operating radius. The DM system demonstrates superior load-bearing capacity within the near operating range (10–30 m), though capacity differences between systems diminish at extended radii due to structural stability constraints. These characteristic distributions directly influence the operational load spectrum, resulting in high-frequency, low-amplitude cycles at extended jib lengths and low-frequency, high-amplitude cycles at shorter radii, thereby determining fatigue loading characteristics and stress distribution patterns in critical structural components.

Figure 3.
Hoisting—performance chart of tower crane.
2.2. Analytical Model of Trolley Wheel Pressure on the Lower Chord
Horizontal forces induced by crane operations are generally not decisive factors in the fatigue behavior of crane runway girders; therefore, their influence is excluded from this investigation. The fatigue loading acting on the lower chord of the tower crane jib is primarily attributed to wheel loads from the luffing trolley, as illustrated in Figure 4. The luffing trolley applies wheel pressure to the lower chord through four contact points. This study adopts several simplifying assumptions as follows: (i) a straight, geometrically ideal track configuration; (ii) symmetric and uniform load distribution between left and right wheels; and (iii) negligible overall deformation of the jib structure. Under these conditions, only the direct wheel pressure transmitted to the lower chord is considered in the analysis. Based on site observations, heavy-load lifts are typically well-balanced using standardized rigging, while noticeable eccentric lifts are infrequent and mostly associated with light loads; thus, the uniform-load assumption is adequate for the fatigue-governing cycles. The potential effects of track irregularities and wind are discussed in Section 7.

Figure 4.
Wheel pressure–load distribution of the luffing trolley.
As a typical cantilever structure—with one end fixed to the tower body and the other end free—the tower crane jib exhibits distinct load transfer mechanisms compared to conventional bridge cranes. As the luffing trolley traverses along the jib, the generated wheel pressure demonstrates longitudinal asymmetric distribution characteristics, particularly pronounced near the jib base, where support rigidity constraints and reduced moment arm length result in amplified wheel pressure effects. The trolley wheel pressure is modeled as concentrated loads acting on the contact points, representing the combined effects of both the hoisting load and the trolley structure’s self-weight, as expressed by the following Equations (1) and (2).
where is the wheel pressure exerted by the luffing trolley on the lower chord, is the self-weight of the luffing trolley and its hoisting mechanism, is the hoisting load under the current working condition, is the number of the wheels, n = 4. is the total wheel load, is the total jib length, is the displacement of the luffing trolley relative to the jib base, is the dynamic load factor, is the moment correction factor accounting for the additional bending moment induced by the structural deformation of the jib, typically taken as 1.05.
2.3. Definition of Representative Operating Conditions and Duty Cycles
As shown in Figure 5, the tower crane working cycle comprises four operational phases with distinct loading characteristics. During the lifting phase (a), the trolley positioned near the tower structure gradually lifts the load, resulting in incremental increases in wheel pressure on the lower chord. In the luffing and transport phase (b), the trolley moves along the lower chord pathway while maintaining constant load magnitude; however, geometric configuration changes induce dynamic variations in wheel pressure distribution and track surface stress patterns. The unloading phase (c) involves lowering the load at the designated position, creating an abrupt load discontinuity that constitutes a critical fatigue-inducing event due to the significant stress range. During the empty return phase (d), the trolley repositions under minimal loading conditions with only self-weight and frictional resistance, forming the lower stress boundary of the cycle. This four-phase sequence establishes the fundamental framework for fatigue load spectrum development, with each phase contributing unique loading characteristics essential for cumulative damage assessment.
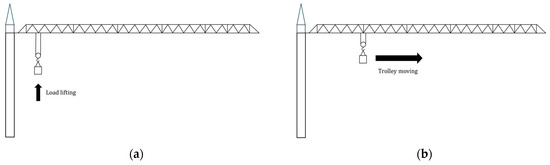

Figure 5.
A complete working cycle of the tower crane (a) lifting phase; (b) luffing and transport phase; (c) unloading phase; (d) empty return phase.
2.4. Field Investigation and Measurement of Lower Chord Wear
The tower crane jib investigated in this study consists of six jib segments (b01–b06) connected by pins, shown in Figure 6, with segments b01–b04 each measuring 10 m and terminal segments b05–b06 each measuring 5 m, totaling a 50 m structural span. Trolley motion limiters constrain the effective working envelope to approximately 2–48 m from the tower centerline. Field inspection revealed extensive mechanical wear along the lower chord surfaces throughout all jib segments, extending from b01’s proximal end to b06’s distal terminus. The wear zone exhibits a characteristic 45 mm width corresponding precisely to trolley wheel contact dimensions, with a distinctive parabolic depth distribution profile featuring maximum wear at the longitudinal centerline and progressive reduction toward lateral boundaries.
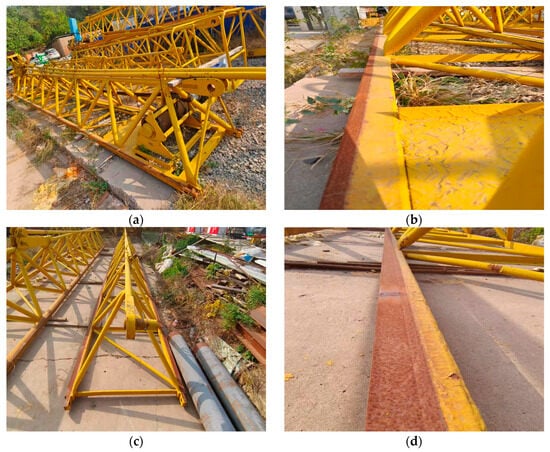
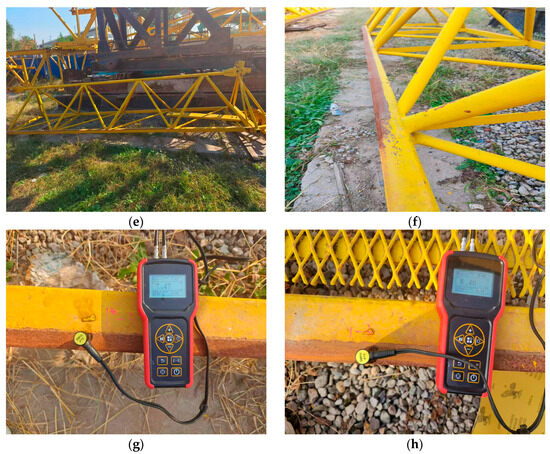
Figure 6.
Field photographs of the jib with different jib segments. (a,b) The overall view and wear details of the b01 segment; (c,d) the overall view and wear details of the b03 segment; (e,f) the overall view and wear details of the b06 segment; (g,h) the measurement process.
Thickness measurements were conducted per JGJ/T189–2009 [34] using calibrated ultrasonic gauges ET39 0(Beijing Timesun Measurement and Control Technology Co., Ltd., Beijing, China) and SW-6510S (Dongguan Sndway Electronic Co., Ltd., Dongguan, China) models. A systematic measurement grid was deployed on the port and starboard surfaces of each jib segment (Figure 7), with triplicate measurements at each node and arithmetic means as representative values. The coordinate origin was defined at the jib root adjacent to the operator’s cabin. Wear degree was quantified by subtracting the thickness values of corroded-but-unworn areas from corroded-and-worn areas at identical longitudinal positions. The bilateral network enables characterization of longitudinal wear trends and lateral variations across the wheel contact zone.
Figure 7.
Measurement method (a) a schematic diagram of the worn and corroded area; (b) a distribution diagram of measurement points.
Measurement results (Figure 8) reveal three distinct degradation zones correlated with jib distance. The proximal region (0–20 m) exhibits rapid wear progression from 10% to 30%, attributed to maximum bending moments and contact stresses from the cantilever configuration combined with high operational frequency. When contact stresses exceed material yield strength, surface microplastic deformation accelerates abrasive wear and fatigue damage interaction. The intermediate region (20–30 m) maintains elevated wear despite reduced bending moments due to operational condition convergence. Composite damage occurs through repetitive loading cycles and continuous abrasive wear, with peak values reaching 30% near the 30 m mark. Segment b03 within this zone experiences convergence of load gradients and operational frequencies, creating a dual-stress environment: peak stresses from high-frequency maneuvers and sustained low-amplitude stresses from extended operations. This establishes b03 as the critical fatigue–wear coupling section, warranting detailed analysis. The distal region (>30 m) exhibits reduced contact frequency and structural stress under predominantly light-load operations. While instantaneous wear rates decrease, residual stress from long-term cyclic loading maintains gradual degradation. This superposition establishes b03 as the primary fatigue–wear coupling control section, exhibiting the most severe degradation and warranting detailed fatigue–wear damage analysis.

Figure 8.
The variation of wear depth at different measuring points.
3. Global Finite Element Model of the Tower Crane
The finite element model is illustrated in Figure 9. The investigated tower crane features a 50 m truss jib comprising six modular segments (b01–b06): b01–b04 span 10 m each, while b05–b06 measure 5 m each. The jib structure consists of upper chords, lower chords, and web members fabricated from angle and channel steel sections. The trolley operates via a four-wheel configuration on the lower chord surface with approximately 45 mm contact width. Q235 steel was employed with an elastic-perfect plastic constitutive model: linear elastic response up to yield strength, then perfectly plastic flow. This formulation is appropriate as fatigue occurs primarily in the elastic regime while contact-induced plasticity remains minimal (<2% strain), where Q235 exhibits negligible hardening.
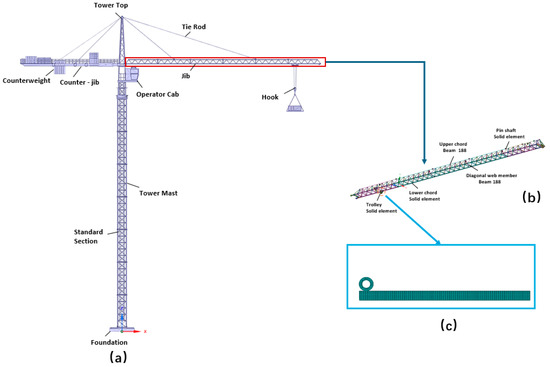
Figure 9.
Finite element mesh model (a) tower crane global model; (b) detailed model of the jib; (c) detailed contact model between the wheel and the jib.
A global ANSYS model was constructed using BEAM188 elements for the tower mast, jib, and counterweight arm, and LINK180 elements for tension members. Fixed constraints were applied at the tower base with rigid joints at the tower-jib connection. Preliminary stress analysis identified segment b03 as the critical zone with maximum stress concentration and severe wear potential. Two refined models were developed for the b03 analysis. The ANSYS model employed SOLID186 elements, and a hexahedral-dominant swept mesh with a nominal element size of approximately 2 mm was applied in the wheel–lower chord contact region to improve contact convergence and stress accuracy. Multi-point constraint (MPC) coupling ensured displacement compatibility between beam and solid elements, providing detailed stress distributions for fatigue assessment.
An Abaqus (Version 2024, Dassault Systèmes Simulia Corp., Johnston, RI, USA) model was developed for wear simulation utilizing C3D8 elements with adaptive UMESHMOTION and the ALE method to track progressive geometry changes. Mesh refinement adopted 2 mm elements in the contact zone and 8–10 mm in the surrounding regions. A dynamic amplification factor of 1.1 was applied to trolley loads. Convergence analysis confirmed stress deviations below 8%.
4. Wear Damage Analysis Under Service Conditions
4.1. Abaqus-Based Wear Simulation Setup
Abaqus simulations investigated the relationship between load cycles and wear progression using a refined local model. The simplified 3D wheel–rail contact model (Figure 10) represents the critical wear region at the jib segment b03 terminus (30 m from the root), encompassing a 1250 mm section containing measurement points 3–5 where maximum wear was observed.

Figure 10.
Simple contact model between the wheel and the jib.
Trolley wheels were modeled as cast iron, and the jib structure as Q235 steel (Table 2), both discretized using 8-node hexahedral elements (C3D8). Surface-to-surface contact algorithms governed wheel–rail interaction through a two-stage analysis: normal load application under four operational conditions, followed by rolling wear simulation under preloaded states.
Table 2.
Material parameters.
Assuming negligible speed variations, a constant trolley velocity of 30 m/min (rated luffing speed) was applied. Hertzian contact pressures were extracted using the UMESHMOTION subroutine, and corresponding wear depths were calculated via the implemented wear model. After each wear increment, nodal coordinates were updated using Arbitrary Lagrangian–Eulerian (ALE) mesh adaptation to maintain mesh quality.
The simulation was iteratively repeated to capture cyclic loading behavior, enabling quantitative correlation between cycle count and maximum wear depth under realistic operational conditions.
4.2. Hertz’s Theory and Archard Model
Based on Hertzian contact theory, this study investigates the contact stress distribution between the luffing trolley and the jib and quantifies the wear on the lower chord surface using the Archard wear model. The fundamental equation describing this pressure distribution is provided below.
According to the Hertzian contact theory (Figure 11), Equation (3) shows the contact stress distribution, where is the maximum value of contact normal stress and is the radius of the contact area.
where is normal line load; is the composite elastic modulus of the two contact bodies; and is the equivalent radius of curvature of the contact components.
where represents Poisson’s ratio of the cylindrical body; represents Poisson’s ratio of the planar body; is the elastic modulus of the cylindrical body; and is the elastic modulus of the planar body.
where is the radius of curvature of the cylindrical surface and is the radius of curvature of the planar surface.

Figure 11.
Hertzian contact diagram.
From Equation (7), the wheel–rail contact forms a cylinder-to-plane configuration, where the rail surface, with its effectively infinite curvature radius relative to the wheel , allows the wheel radius to govern the effective curvature in Hertzian analysis. Hertzian contact theory was employed to validate the finite element contact model prior to wear simulation. For the wheel–rail configuration under the applied load, Hertzian theory provides an analytical benchmark for maximum contact pressure distribution. Figure 12 presents the comparison between Hertzian theoretical predictions and finite element results along the contact width. For validation purposes, a normal load of 4.61 MPa is applied, corresponding to a maximum contact stress of 200 MPa. Using the Hertz contact Equations (3)–(7), the contact radius is calculated as a = 14.7 mm, which serves as the reference value for subsequent finite element mesh refinement and contact stress verification. The Hertzian solution yielded a maximum contact stress of 198.65 MPa, while the FEM-computed peak contact stress showed excellent agreement with a deviation within 3%. It verifies the accuracy of the contact model, laying a foundation for subsequent wear calculations.
where is the volume of material wear; is the relative sliding distance; is the wear coefficient; is a normal contact load; and is the material hardness.

Figure 12.
Comparison of contact stress distribution between the FEM and Hertzian theory.
Through deformation derivation, a modified form of the Archard formula can be obtained, with the derivation process differentiating both sides of Equation (8) as follows:
Dividing both sides of Equation (9) by an infinitesimal area , we obtain the following:
Let and substituting it into Equation (10):
where denotes the nodal wear depth increment and represents the nodal normal contact stress. Equation (11) indicates a proportional relationship between wear depth increment and sliding distance, local contact pressure , and material wear coefficient . The literature values for cast iron–carbon steel pairs under dry friction conditions range from 10−7 to 10−6 [35]. Considering the open-air operating environment of tower cranes, where intermittent moisture may provide boundary lubrication but abrasive contaminants (dust/sand) can accelerate material removal, the upper-bound value was adopted as a conservative engineering choice. Using the Archard model, the relationship between maximum wear depth and cycle count under different operating conditions was calculated, and curve plotting was performed through fitting.
4.3. Wear Evolution Results and Model Validation
From the data in Figure 13, the total cycle count under individual operating conditions conforms to crane working class standards (100,000–200,000 cycles). Measured data exhibit strong agreement with simulation results during initial wear development (<20,000 cycles), demonstrating the model’s capability to accurately capture stress concentration effects. In the high-cycle regime (>50,000 cycles), measured wear depths are slightly lower than simulation predictions due to idealized modeling conditions. Specifically, real-world factors such as track surface roughness, random dynamic impacts due to wind loads, and inevitable trolley wheel misalignments introduce variabilities that are not fully captured in the simplified finite element model. The normalized plot (Figure 13c) reveals that the wear trajectories under different loads (2–10 t) collapse onto a consistent master curve. This strongly suggests that the governing degradation mechanism is uniform across the load spectrum.

Figure 13.
The relationship between the number of cycles and the maximum wear depth under different loads: (a) contact stress distribution; (b) absolute wear evolution; (c) dimensionless degradation trend.
4.4. Wear-Based Life Assessment of the Lower Chord
A crane working cycle is defined as the complete operational sequence as follows: lifting a load, rotating to the designated position, unloading, and returning to the original position without a load. The wear simulation analysis examines the relationship between maximum wear depth and cycle count under specific loading conditions during repetitive operations, where one complete round trip constitutes one cycle.
This tower crane has accumulated 3195 operational days with approximately 383,400 total cycles. The scrapping criterion is established at a wear depth of 2.3 mm. Given the relatively low self-weight of the unloaded trolley, wear on the jib’s bottom chord during no-load return trips is considered negligible and excluded from the analysis.
As shown in Table 3, a comparison between simulation results and actual operational statistics demonstrates that the proportional distributions of 4 t, 2 t, 2.5 t, and 10 t loading conditions closely match field data, thereby validating both the simulation accuracy and the appropriateness of the established working condition parameters.
Table 3.
The ultimate number of cycles under different loads.
5. Fatigue Damage Analysis Under Hybrid Load Spectra
5.1. Stress Time–History Extraction Under Representative Working Conditions
To clarify the transition from wear simulation to fatigue life evaluation, Figure 14 summarizes the complete integration workflow of the proposed framework.
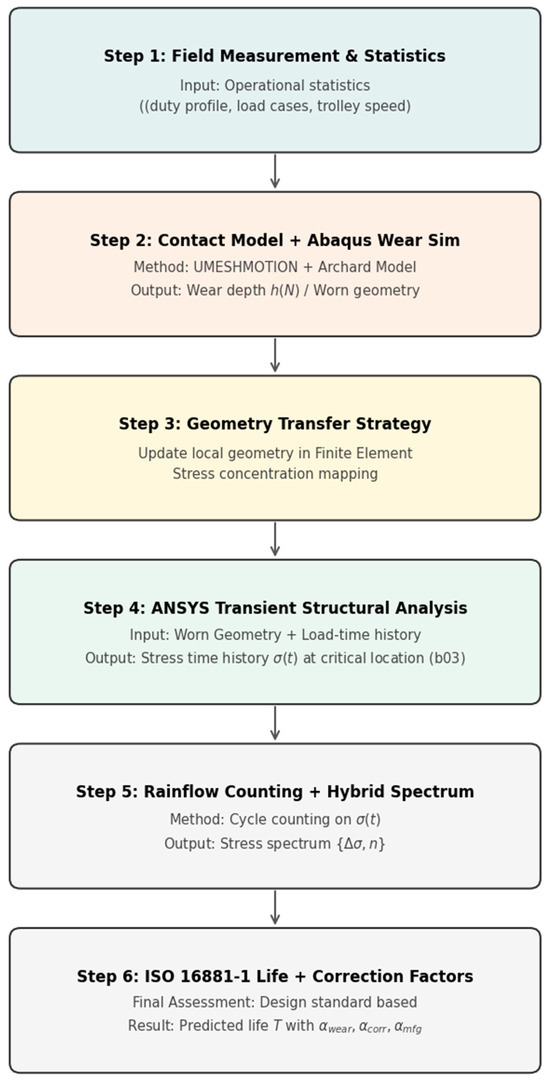
Figure 14.
Workflow of the proposed wear–fatigue coupled life prediction framework.
Based on wear analysis and operational records, the wear simulation outputs the worn geometry, which is transferred to the structural model to update the local geometry. Under the same duty cycle loading derived from wheel pressures, the updated geometry leads to a modified stress time history that is then used for rainflow counting and life evaluation.
Four representative working conditions (Figure 15) were established to capture typical load–radius combinations in construction scenarios, providing a foundation for subsequent fatigue analysis.


Figure 15.
Four representative working conditions (a) standard medium-load operation; (b) extended reach light load operation; (c) intermediate range cyclic operation; (d) proximity heavy-load operation. Each subfigure illustrates a complete operational cycle including lifting, luffing, unloading, and empty return.
Working Condition 1 Figure 15a: Transport of 4 t payloads from 2 m to 30 m radius for positioning medium-weight structural components, including precast elements and steel reinforcement. This represents the most frequent scenario during typical building construction.
Working Condition 2 Figure 15b: Transport of 2 t lightweight materials to a maximum reach of ~50 m for placing auxiliary components such as reinforcement bundles and support brackets. Despite the reduced payload, the extended moment arm generates significant base moments.
Working Condition 3 Figure 15c: Transport of 2.5 t loads within a 20–45 m radius through repetitive short-distance cycles, supporting rapid material handling for slab construction and formwork repositioning. This condition features moderate radii with high cycle frequencies.
Working Condition 4 Figure 15d: Transport of a maximum 10 t capacity to ~10 m radius for installing primary structural elements, including main beams and heavy precast components. This represents the most severe loading scenario, generating peak structural stresses, though occurring infrequently.
As illustrated in Figure 15, for each representative working condition shown in subfigures (a)–(d), the operational cycle of the tower crane consists of four sequential phases: (i) lifting, (ii) luffing with trolley travel, (iii) unloading, and (iv) empty return. During operational cycles under these conditions, stress characteristics vary distinctly across phases. In the lifting phase at a fixed radius, lower chord stress increases sharply from no load to peak levels, with maximum bending moment at the jib root and rapid stress rise near the trolley position. During luffing, both the jib bending moment and lower chord tensile stress increase with radius. Trolley rolling intensifies local wear, with segment b03 becoming a stress hotspot due to its location in the primary bending zone and frequent wheel contact, exhibiting accelerated wear and fatigue accumulation. In the unloading phase, lower chord tensile stress drops abruptly after load release, with potential structural vibration during elastic recovery. During empty return, jib stress remains minimal, though trolley movement maintains repeated rolling contact on the lower chord, generating low-amplitude stress cycles contributing marginally to fatigue accumulation.
The operating mode proportions (40%, 38%, 20%, and 2%) adopted in this study were extracted from the long-term operational records of a single, multi-year in-service tower crane at a specific construction site and therefore represent a case-specific duty load spectrum. To apply the proposed framework to other crane types or construction sites, users should derive site-specific proportions from (i) crane task logs and lifting records, (ii) dispatch databases, or (iii) short-term monitoring and then construct the hybrid spectrum following the same rainflow-counting procedure. This ensures that the spectrum reflects local project characteristics (load distribution, wind exposure, and operational habits).
Based on the aforementioned four representative operating conditions, transient mechanical simulation analysis (see Figure 16) was conducted using the established finite element model to simulate a complete working cycle of the luffing trolley, comprising lifting, luffing transport, unloading, and empty return phases under different operating conditions and varying loads. Stress time-history curves were extracted from the maximum wear region of jib segment b03, yielding the stress variation characteristics at measurement points 3–5 under the four operating conditions, as illustrated in the following Figure 17 and Table 4.

Figure 16.
Deformation contour of the crane jib.

Figure 17.
Time-stress history curves under different working conditions (a) Condition 1 standard medium load; (b) Condition 2 extended-reach light load; (c) Condition 3 intermediate range cyclic; (d) Condition 4 proximity heavy load; (e) single peak load cycles.
Table 4.
Result of FEM calculation.
5.2. Construction of Hybrid Load Spectrum
To achieve comprehensive fatigue characteristics analysis, this study employs two differentiated methodologies to construct hybrid load spectra based on extracted stress-time history curves. The simplified peak extraction method identifies and superposes primary stress peaks from time-history data, significantly enhancing computational efficiency while maintaining analytical accuracy for complex stress patterns within reasonable bounds. Conversely, the comprehensive peak extraction method incorporates all identifiable stress peaks and corresponding amplitudes from complete time-history records, enabling more precise characterization of load spectrum parameters and ensuring capture of minor stress fluctuations that contribute to cumulative fatigue damage.
The generated load spectra serve as fundamental input datasets for fatigue life prediction calculations, effectively characterizing stress distribution patterns under diverse operational scenarios encompassing heavy-load and light-load conditions along with their associated cyclic loading effects. Figure 18 presents comparative analytical results. These two types of stress spectra enable in-depth investigation of stress evolution patterns under different operating conditions and serve as input parameters for subsequent load spectra, providing critical data support for quantitatively evaluating the influence of different loading scenarios on the fatigue performance of tower cranes and calculating fatigue life.
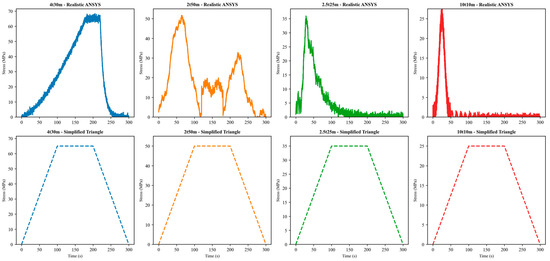
Figure 18.
Comparison between realistic ANSYS load cycles and simplified triangular load cycles.
According to comprehensive field statistics and operational documentation throughout the service lifecycle, the daily operational cycles and annual working days from initial commissioning to final decommissioning were systematically documented for this tower crane, as illustrated in Figure 19. Statistical analysis reveals an average of approximately 120 operational cycles per day, with an annual average of 280 working days during active service periods. Utilizing the established daily cycle frequency data and the proportion of different working conditions, two distinct methodologies were implemented to stochastically generate stress spectra corresponding to the initial two-hour operational period of daily service.

Figure 19.
(a) Daily work cycle records and (b) annual working days records.
Figure 20 illustrates the comparative results, where (a) presents the stress spectrum derived from the simplified peak extraction method and (b) displays the spectrum obtained through the comprehensive approach. Subsequent fatigue life calculations were conducted utilizing these established stress spectra as input parameters.

Figure 20.
Two load spectra in the first hours: (a) simplified stress spectrum and (b) realistic Ansys stress spectrum.
The simplified spectrum method can be used for rapid screening when monitoring data are limited. The comprehensive method is recommended for final assessment, maintenance planning, and safety-critical decisions because it preserves the stress-range distribution and captures damage contributions from high-amplitude cycles. In practice, we recommend using the simplified method as a first pass estimate; if the life difference between the two methods exceeds 10%, the comprehensive method should be adopted.
5.3. Life Calculation and Analysis
The rainflow counting method was employed to extract stress spectra from simulated stress-time histories at critical locations. This standard cycle-counting technique decomposes variable amplitude loading into discrete stress cycles, each characterized by stress amplitude (Δσ/2) and mean stress (σm), where Δσ represents the stress range between peak and valley. Identified cycles were classified into 8 discrete amplitude levels.
Representative daily load spectra were constructed by proportionally combining 2 h stress histories from each working condition according to operational frequencies: 40% for Condition 1, 38% for Condition 2, 20% for Condition 3, and 2% for Condition 4. The resulting two-dimensional load spectrum (Figure 21) characterizes stress distribution patterns for fatigue life calculations.

Figure 21.
Two types of daily two-dimensional load spectra: (a) simplified load spectrum and (b) realistic ANSYS load spectrum.
According to ISO 16881-1 [36], the fatigue failure of wheel–rail contact is caused by the rolling contact force and the cumulative damage effect. The contact force can be calculated from the stress spectrum using Equation (12). Based on the principle of contact mechanics, the stress spectrum from finite element analysis results was used to calculate the contact force spectrum, which can be expressed as follows:
where is the maximum contact stress; is the equivalent radius of curvature; is the effective contact width; and is the equivalent elastic modulus. The equivalent elastic modulus considering both wheel and rail materials is calculated in Equation (13).
Considering the material properties, geometric parameters, and contact conditions, the contact force spectrum factor is constructed according to ISO 16881-1, as shown in Equation (14).
where is the contact force spectrum factor; is the total number of rolling contacts; is the individual contact force; is the maximum design contact force; and is the contact exponent defined as 3.33 according to ISO16881-1.
The total number of rolling contacts is calculated based on the working cycle characteristics of the bottom chord trolley in Equation (15).
where is the total number of wheels passing through the contact point and is the number of working cycles during the design life.
The relative total rolling contact number is defined as the ratio of total contacts to reference contacts in Equation (16).
where = 6.4 × 10⁶ is the reference contact number specified in the standard.
The contact force history parameter comprehensively reflects the combined effect of load spectrum and contact frequency on fatigue as follows:
The reference contact force represents fatigue strength characteristic value under 6.4 × 10⁶ rolling contacts with 90% survival rate. For non-surface-hardened materials, it is calculated in Equation (18).
where: is the unit-consistent hardness; is the wheel diameter; = 0.3 is the Poisson’s ratio for steel.
The ultimate design contact force, considering various influence factors, is shown in Equation (19).
where = 1.1 is the fatigue contact resistance factor; is the combined influence factor; and = is the load history correction factor. Then, is the theoretical fatigue life calculated using ISO 16881-1 as follows:
Based on calculations in accordance with Equation (20), the theoretical fatigue lives of the two load spectra were determined and compared. The results are shown in Table 5: the theoretical fatigue life of Load Spectrum A is 42.1 years, while that of Load Spectrum B is 38.9 years, representing an 8.2% reduction in service life. Evidently, the multi-peak load spectrum is more capable of reflecting the actual situation. The service life range calculated using the simplified load spectrum is more lenient. In practical situations, calculations should be performed using the more unfavorable conditions.
Table 5.
Theoretical life calculation under different load spectra.
6. Integrated Comparison of Wear- and Fatigue-Based Life Predictions
According to the standard Crane Design Specification (GB/T 3811-2008) [37], the cyclic service classes of cranes are presented in Table 6. With a total cycle count of approximately 380,000, this tower crane falls into the U5 category for daily service class. ISO 16881-1 provides theoretical fatigue life under ideal conditions. However, practical engineering applications require consideration of additional factors that influence actual service performance. Based on engineering practice and relevant standards, the corrected fatigue life can be expressed as follows:
where is the wear influence factor; is the corrosion influence factor; and is the manufacturing quality factor.
Table 6.
Crane usage classification.
For tower cranes operating in typical outdoor environments with moderate corrosion exposure (corrosivity category C3 according to ISO 12944-2) [38], = 0.90 is recommended. According to IIW [39] recommendations and AWS D1.1 Structural Welding Code [40], adopted 0.85.
Field inspection indicates a maximum wear depth of mm at the critical segment b03. The nominal original flange thickness of the lower chord is mm; therefore, the remaining effective thickness ratio is as follows:
In addition to the effective section reduction, the parabolic wear groove may introduce a mild local stress amplification due to non-uniform geometry and load transfer. This effect is represented by an engineering stress amplification factor . Considering that the measured groove depth is relatively small compared with the flange thickness, we adopt a mild amplification of . Accordingly, the wear correction factor is estimated as
Corrosion and manufacturing influences are treated separately through and . A sensitivity study (Table 7) is further provided to quantify how variations in these correction factors affect the predicted service life.
Table 7.
Sensitivity analysis of correction factors.
As detailed in Table 7, the predicted fatigue life ranges from 22.5 to 25.7 years under varying scenarios, with all deviations from the actual service life remaining within 13.5%. Notably, while Case 1 yields the highest numerical accuracy (−1.1%), the Baseline scenario is adopted as the standard recommendation. It provides a more conservative estimate (24.1 years), offering a necessary safety margin for engineering applications while maintaining high predictive reliability.
The corrected fatigue lives incorporating these three parameters are presented in Table 8. The corrected fatigue life calculation results closely align with actual operational years. The prediction error relative to the actual service life is calculated as follows: , which demonstrates the engineering accuracy of the proposed method. This bridges the gap between theoretical calculations and engineering practice while comprehensively accounting for multiple degradation mechanisms. This approach provides a more conservative and reliable basis for maintenance planning and service life determination of tower cranes.
Table 8.
Corrected fatigue life.
7. Conclusions
This study establishes an integrated wear–fatigue assessment framework for tower crane lower chords through field measurements, numerical simulations, and life prediction analysis. The developed methodology addresses a critical research gap in lower chord track systems and provides practical tools for service life evaluation of aging crane structures. The key findings and contributions are summarized as follows:
- (1)
- Field investigations identified segment b03 as the critical failure zone with 30% maximum degradation, exceeding allowable limits. This localized damage results from stress concentration, operational frequency peaks within the 20–30 m range, and cyclic loading, challenging uniform degradation assumptions and enabling targeted inspection strategies
- (2)
- Through numerical simulation coupling ALE adaptive mesh technology with the Archard wear model in ABAQUS, the relationship between operational load cycles and the progressive evolution of wear depth was successfully quantified. This approach effectively reproduced the correlation between actual wear depth and cyclic loading in different conditions, providing quantitative reference data for the subsequent determination of wear correction coefficients.
- (3)
- Two differentiated load spectrum methodologies integrating ANSYS transient analysis, rainflow counting, and operational statistics successfully reconstructed stress states under diverse operating conditions, compensating for unmeasurable stress data from the decommissioned crane and establishing a quantitative foundation for accurate fatigue life prediction.
- (4)
- Based on ISO 16881-1 standards and the aforementioned fatigue–wear analysis, theoretical fatigue lives of 42.1/38.9 years were corrected to 24.1/22.3 years using wear (= 0.75), corrosion (= 0.9), and manufacturing ( = 0.85) factors. This correction framework bridges theoretical calculations and engineering practice, providing conservative guidance for service life determination.
- (5)
- The research provides actionable insights for enhancing the safety and maintenance of tower cranes in high-demand construction environments. A comprehensive mitigation strategy is proposed, encompassing the following: (i) enhanced monitoring protocols for intermediate jib sections; (ii) material upgrading of segment b03 using higher-strength or wear-resistant alloy steels; (iii) replacement of traditional wheels with polyurethane alternatives to reduce rail damage; and (iv) implementation of regular non-destructive testing procedures. These integrated measures ensure long-term reliable operation while significantly mitigating safety risks related to structural failure.
The developed methodology establishes an effective technical framework for assessing the service life of in-service tower cranes, contributing to enhanced safety standards and maintenance optimization in demanding operational environments. The research provides both theoretical foundations and practical tools for engineers engaged in tower crane structural integrity assessment and life cycle management.
Limitations and Future Research Directions
While the proposed framework effectively quantifies coupled wear–fatigue degradation, several limitations should be acknowledged.
First, the validation relies on a single decommissioned tower crane. Although the selected case is representative of high-rise construction, the universality of the adopted duty-profile parameters (e.g., the specific operating mode proportions) requires verification against a broader dataset covering diverse crane models, sites, and operator behaviors. Second, to establish a computationally tractable baseline model, certain simplifying assumptions were adopted, including idealized track conditions and a sequential offline update of wear geometry. Consequently, high-frequency dynamic effects related to evolving track roughness, vibration, and occasional asymmetric loading are not explicitly captured in the current implementation. Third, key parameters—such as the wear coefficient and stress amplification factors—were determined based on literature guidance and engineering calibration. While the sensitivity analyses provided in this revision quantify their influence, dedicated experimental calibration and multi-condition validation would further reduce predictive uncertainty.
Future work will focus on the following: (1) establishing a multi-crane database and applying statistical learning methods to derive fleet-level duty spectra with quantified uncertainty; (2) incorporating stochastic track roughness to enable probabilistic life prediction under realistic operational variability; and (3) integrating data-driven approaches, such as machine learning (ML) algorithms, to support real-time spectrum generation and predictive maintenance based on live monitoring data.
Author Contributions
Y.X.: Writing—review and editing, funding acquisition, and conceptualization. Z.W.: Writing—original draft, validation, software, formal analysis, and data curation. M.M.: Supervision and investigation. X.H.: Project administration. B.C.: Investigation. All authors have read and agreed to the published version of the manuscript.
Funding
This work was supported by the National Natural Science Foundation of China (Grant No. 51905028).
Institutional Review Board Statement
Not applicable.
Informed Consent Statement
Not applicable.
Data Availability Statement
Data are contained within the article.
Conflicts of Interest
Author Xiaoyu Han was employed by the company Beijing Cogent Engineering Technical Inspection Co., Ltd. The remaining authors declare that the research was conducted in the absence of any commercial or financial relationships that could be construed as a potential conflict of interest.
References
- Gu, J.; Qin, Y.; Xia, Y.; Wang, J.; Gao, H.; Jiao, Q. Failure analysis and prevention for tower crane as sudden unloading. J. Fail. Anal. Prev. 2021, 21, 1590–1595. [Google Scholar] [CrossRef]
- State Administration for Market Regulation of the People’s Republic of China. Notice on the Safety Status of Special Equipment in 2023; State Administration for Market Regulation: Beijing, China, 2024.
- Lee, J.; Phillips, I.; Lynch, Z. Causes and prevention of mobile crane-related accidents in South Korea. Int. J. Occup. Saf. Ergon. 2022, 28, 469–478. [Google Scholar] [CrossRef]
- Zhu, C.; Zhao, Y.; Li, B. The Force State Analysis of the Lower Chord Shear Pin of the Inverted Triangle Hoisting Arm of a Large Tower Crane. In Proceedings of the International Scientific Conference Civil Engineering and Buildings Services, Brașov, Romania, 7–8 November 2024; pp. 152–165. [Google Scholar]
- Liu, F.; Yang, J.; Wang, J.; Liu, C.; Wang, X. Effect on tower crane structural vibration under the lifting-luffing coupling condition. J. Mech. Sci. Technol. 2023, 37, 4935–4947. [Google Scholar] [CrossRef]
- Liu, B.; Bruni, S.; Lewis, R. Numerical calculation of wear in rolling contact based on the Archard equation: Effect of contact parameters and consideration of uncertainties. Wear 2022, 490, 204188. [Google Scholar] [CrossRef]
- Ramalho, A. Wear modelling in rail–wheel contact. Wear 2015, 330, 524–532. [Google Scholar] [CrossRef]
- Wang, J.; Su, Y.; Subramaniam, N.A.; Pang, J.H.L. Archard model guided feature engineering improved support vector regression for rail wear analysis. Eng. Fail. Anal. 2022, 137, 106248. [Google Scholar] [CrossRef]
- Sui, S.; Wang, K.; Ling, L.; Chen, Z. Effect of wheel diameter difference on tread wear of freight wagons. Eng. Fail. Anal. 2021, 127, 105501. [Google Scholar] [CrossRef]
- Kettler, M.; Derler, C.; Schörghofer, A.; Macho, C.; Unterweger, H. Laboratory and numerical tests on real crane runway girder with box section. J. Constr. Steel Res. 2019, 160, 540–558. [Google Scholar] [CrossRef]
- Wu, B.; Tang, Y.; Li, Z.; Tang, K. Fatigue damage accumulation modelling of critical components subjected to moving crane loads in reinforced-concrete industrial buildings. Eng. Fail. Anal. 2021, 119, 104951. [Google Scholar] [CrossRef]
- Hectors, K.; Chaudhuri, S.; De Waele, W. Fracture mechanics and hot spot stress-based fatigue life calculation: Case study for a crane runway girder. Fatigue Fract. Eng. Mater. Struct. 2022, 45, 2662–2675. [Google Scholar] [CrossRef]
- Cleary, G.; Eamon, C.; Siavashi, S.; Nosoudi, A. Analytical model for determining electric overhead traveling crane skewing forces on crane runways. J. Struct. Eng. 2025, 151, 04024189. [Google Scholar] [CrossRef]
- Zhao, X.; Jin, N.; Liu, X.; Shi, Z. Fatigue failure analysis of steel crane beams with variable-section supports. Eng. Fail. Anal. 2022, 136, 106217. [Google Scholar] [CrossRef]
- Kulka, J.; Mantic, M.; Fedorko, G.; Molnar, V. Failure analysis of increased rail wear of 200 tons foundry crane track. Eng. Fail. Anal. 2016, 67, 1–14. [Google Scholar] [CrossRef]
- Rettenmeier, P.; Roos, E.; Weihe, S.; Schuler, X. Assessment of mixed mode crack propagation of crane runway girders subjected to cyclic loading. Eng. Fract. Mech. 2016, 153, 11–24. [Google Scholar] [CrossRef]
- Wei, G.; Yin, Q.; Zhao, Y.; Dang, Z.; Lu, Z. Fatigue failure analysis and life prediction of wheel load local area of ladle crane. Meas. Sci. Technol. 2024, 35, 126120. [Google Scholar] [CrossRef]
- Rykaluk, K.; Marcinczak, K.; Rowiński, S. Fatigue hazards in welded plate crane runway girders-Locations, causes and calculations. Arch. Civ. Mech. Eng. 2018, 18, 69–82. [Google Scholar] [CrossRef]
- Euler, M.; Taylor, C. Fatigue action on crane runway beams. J. Constr. Steel Res. 2021, 181, 106476. [Google Scholar] [CrossRef]
- Jiang, H.; Jiang, X. Fatigue life prediction for tower cranes under moving load. J. Mech. Sci. Technol. 2023, 37, 6461–6466. [Google Scholar] [CrossRef]
- Zhang, Q.; Mei, B.; Yang, H.; Hu, X.; An, W.; Yue, Y.; Xu, Y.; Wang, Z. Stress Measurement and Analysis of Structural Parameters of Flat Arm Tower Crane Under Different Working Conditions. Buildings 2025, 15, 1137. [Google Scholar] [CrossRef]
- Feng, R.; Zhang, E.; Dong, M. Jib vibration and payload swing of tower cranes in the case of trolley motion. Arab. J. Sci. Eng. 2021, 46, 12179–12191. [Google Scholar] [CrossRef]
- Hussain, M.; Ye, Z.; Chi, H.-L.; Hsu, S.-C. Predicting degraded lifting capacity of aging tower cranes: A digital twin-driven approach. Adv. Eng. Inform. 2024, 59, 102310. [Google Scholar] [CrossRef]
- Pelayo, F.; Rodríguez, C.; Canteli, A. Failure and repair analysis of a runway beam: Influence of the standard applied to lifetime prediction. Eng. Fail. Anal. 2015, 56, 89–97. [Google Scholar] [CrossRef]
- Lehner, P.; Krejsa, M.; Pařenica, P.; Křivý, V.; Brožovský, J. Fatigue damage analysis of a riveted steel overhead crane support truss. Int. J. Fatigue 2019, 128, 105190. [Google Scholar] [CrossRef]
- Zuo, Y.; Zhao, F.; Yang, K.; Yang, R. Fatigue Life Assessment of Tower Crane Based on Neural Network to Obtain Stress Spectrum. Preprint 2021. [Google Scholar] [CrossRef]
- Dong, Q.; Yu, Y.; Xu, G. Fatigue residual life estimation of jib structure based on improved v-SVR algorithm obtaining equivalent load spectrum. Fatigue Fract. Eng. Mater. Struct. 2020, 43, 1083–1099. [Google Scholar] [CrossRef]
- Dong, Q.; Xu, G.; Ren, H.; Wang, A. Fatigue remaining life estimation for remanufacturing truck crane Jib structure based on random load spectrum. Fatigue Fract. Eng. Mater. Struct. 2017, 40, 706–731. [Google Scholar] [CrossRef]
- Wu, Q.; Zhao, Y.; Liu, X. Fatigue life prediction of metal materials under random loads based on load spectrum extrapolation. Int. J. Fatigue 2024, 187, 108473. [Google Scholar] [CrossRef]
- Ávila, G.; Palma, E.; De Paula, R. Crane girder fatigue life determination using SN and LEFM methods. Eng. Fail. Anal. 2017, 79, 812–819. [Google Scholar] [CrossRef]
- Li, Y.; Jin, A.; Dai, Y.; Yang, D.; Zheng, B. Prediction of remaining fatigue life of in-service bridge cranes. Appl. Sci. 2023, 13, 12250. [Google Scholar] [CrossRef]
- Guo, Y.; Rao, G.; Dang, Z.; Zhang, R.; Luo, H.; Yuan, R. Fracture mechanism analysis and life-prolonging investigation of butt weld for ladle crane. Eng. Fail. Anal. 2025, 172, 109389. [Google Scholar] [CrossRef]
- Hectors, K.; De Waele, W. Modeling nonlinear fatigue damage accumulation in a welded runway girder. Procedia Struct. Integr. 2020, 28, 239–252. [Google Scholar] [CrossRef]
- JGJ/T189–2009; Ministry of Housing and Urban-Rural Development of China, Technical Specification for Safety Assessment of Construction Lifting Machinery. China Architecture & Building Press: Beijing, China, 2009.
- Hirasata, K.; Hayashi, K.; Inamoto, Y. Friction and wear of several kinds of cast irons under severe sliding conditions. Wear 2007, 263, 790–800. [Google Scholar] [CrossRef]
- ISO 16881-1:2024; International Organization for Standardization, Cranes—Design Principles for Loads and Load Combinations—Part 1: General. ISO: Geneva, Switzerland, 2024.
- GB/T 3811-2008; Standardization Administration of China, Design Rules for Cranes. Standards Press of China: Beijing, China, 2008.
- ISO 12944-2:2017; International Organization for Standardization, Paints and Varnishes—Corrosion Protection of Steel Structures by Protective Paint Systems—Part 2: Classification of Environments. ISO: Geneva, Switzerland, 2017.
- IIW-2259-15; International Institute of Welding, Recommendations for Fatigue Design of Welded Joints and Components. IIW: Paris, France, 2016.
- AWS D1.1/D1.1M:2020; American Welding Society, Structural Welding Code—Steel. American Welding Society: Miami, FL, USA, 2020.


Disclaimer/Publisher’s Note: The statements, opinions and data contained in all publications are solely those of the individual author(s) and contributor(s) and not of MDPI and/or the editor(s). MDPI and/or the editor(s) disclaim responsibility for any injury to people or property resulting from any ideas, methods, instructions or products referred to in the content. |
© 2026 by the authors. Licensee MDPI, Basel, Switzerland. This article is an open access article distributed under the terms and conditions of the Creative Commons Attribution (CC BY) license.