


Abstract
Rainfall-induced failures in red clay slopes are common, yet the coupled influence of soil structure degradation and rainfall temporal patterns on slope hydromechanical behavior remains poorly understood. This study advances the understanding by investigating a cut slope failure in Yunnan through integrated field monitoring, laboratory testing, and numerical modeling. Key advancements include: (1) elucidating the coupled effect of structure degradation on both shear strength reduction and hydraulic conductivity alteration; (2) systematically quantifying the impact of rainfall temporal patterns beyond total rainfall; and (3) providing a mechanistic explanation for the critical role of early-peak rainfall. Mechanical and hydrological parameters were obtained from intact and remolded samples, with soil-water retention estimated via pedotransfer functions. A hydro-mechanical finite element model of the slope was constructed and calibrated using recorded rainfall, displacement data and failure surface. Six simulation scenarios were designed by combining three strength conditions (intact at natural water content, intact at saturation, remolded at natural water content) with two hydraulic conductivity values (intact vs. remolded). Additionally, four synthetic rainfall patterns, including uniform, peak-increasing, peak-decaying and bell-shaped rainfall, were simulated to evaluate their influence on pore water pressure development and slope stability. Results show remolding reduced hydraulic conductivity 4.7-fold, slowing wetting front advance and increasing shallow pore water pressure. Intact soil facilitated deeper drainage, elevating pressure near the soil-rock interface. Strength reduction induced by structure degradation (water saturating and remolding) enlarged the slope deformation zone by 1.5 times under same hydraulic conductivity. Simulations using saturated intact strength best matched field observations. The results from this specific slope indicate that strength parameters primarily control stability, while permeability affects deformation depth. Simulations considering different rainfall patterns indicate that slope stability depends more critically on the temporal distribution of rainfall intensity than on the total amount. Overall, peak-decaying rainfall led to the most rapid rise in pore water pressure, earliest instability and lowest failure rainfall threshold, whereas peak-increasing rainfall showed the opposite trends. Our findings outline a practical framework for assessing red clay slope stability during rainfall. This framework recommends using saturated intact strength parameters in stability analysis. It highlights the important influence of rainfall temporal patterns, especially those with an early peak, on failure timing and rainfall threshold.
1. Introduction
Red clay is a widespread Quaternary soil with complex origins. In the study area of Yunnan Province, it often exhibits mixed sedimentary and residual characteristics, formed through chemical weathering of carbonate rocks alongside alluvial and eluvial processes [1,2,3,4,5]. It is widely distributed worldwide, including the southern provinces of Hunan, Yunnan, Guangxi and Guizhou in China [2,6,7,8]. Red clay often has high plasticity, fine particles and a large void ratio. Its shear strength decreases rapidly when the water content increases [8]. These basic features make the soil sensitive to rainfall infiltration. Red clay slope failure occurs frequently during or after rainfall, especially on cutting slopes along roads and villages [9,10,11,12,13]. Such failures threaten traffic and nearby houses. A clear, project-oriented understanding of the failure mechanism is therefore needed.
In recent decades, many studies have examined how rainfall affects the stability of red clay slopes. Field monitoring links rainfall with surface and subsurface deformation, groundwater level, and pore-water pressure, and helps outline overall patterns [14,15,16]. Laboratory model tests provide intuitive observations under controlled conditions and have been used to discuss deformation, wetting-front evolution and stability changes [17,18,19,20,21], although material and boundary simplifications limit realism [12,22]. Numerical simulations are widely applied because they are efficient and flexible; they can trace pore-pressure buildup, moisture change, deformation and stability indices [23,24,25,26,27,28]. However, studies that combine field monitoring, laboratory testing, and numerical simulations to investigate the failure mechanisms of red clay slopes remain scarce.
In addition, compared to other soil types, red clay often exhibits a pronounced structure characterized by bonding and aggregation [29,30]. This structure, typically formed through cementation by iron, aluminum or calcium oxides and/or carbonates contributes to higher peak strength, higher stiffness and greater apparent cohesion under dry conditions [2,3,17]. Furthermore, in situ red clay is often highly fissured, and these fissures provide preferential pathways for rainwater infiltration, which facilitates rapid infiltration during rainfall events [2,6,31,32,33]. Under external disturbances such as loading, excavation, or wetting, part of this structure can be degraded. Soil structure degradation herein refers to the deterioration of the soil’s natural fabric, including the loss of cementation bonds and the collapse of aggregates. The degradation of red clay structure can greatly change the soil mechanical and hydrological behaviors, serving as a critical factor influencing slope stability [14,31,33]. However, the impact of this soil structure degradation on slope hydrology and stability remains poorly understood. Critically, beyond intrinsic soil properties, the temporal pattern of rainfall, such as peak intensity, duration and antecedent rainfall, also plays a decisive role in slope hydrology [34,35,36]. Different rainfall types (e.g., uniform, peak-advanced, or peak-delayed) can significantly alter the moisture migration and pressure distribution within red clay slopes, thereby influencing the timing and mode of instability [35,37,38]. Moreover, as climate change has become increasingly frequent in recent years, rainfall patterns in China have undergone noticeable year-to-year variations [37,38]. However, how these changes in rainfall types affect the stability of red clay slopes remains poorly understood.
The objective of this work is to reveal the failure mechanism of red clay slopes under rainfall and to quantify the influence of both soil structure degradation and rainfall patterns on slope hydrology and stability. To achieve this, we prepared intact and remolded soil specimens from in situ samples collected from a case slope in Yunnan and measured their mechanical and hydrological properties experimentally. These parameters were then incorporated into a hydro-mechanical model of the slope, which was built based on field geometry and recorded rainfall data. Multiple rainfall pattern scenarios were designed to evaluate their specific influence on slope behavior. The simulation results, integrating structural degradation and rainfall variability, were validated against measured displacement data and the observed failure surface.
2. Study Area and Site Conditions
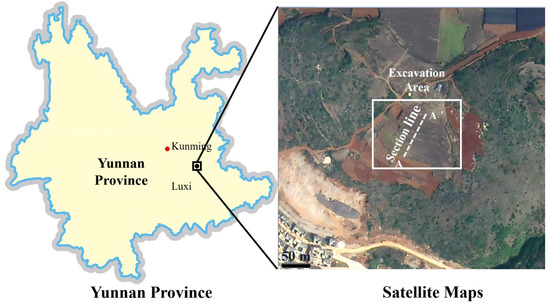
The case slope is located at the Yongning Interchange, approximately 1.5 km west of Yongning Township in Luxi County, Yunnan Province (Figure 1). The area lies within the composite zone of the eastern limb of the Yunnan Arc-shaped Structure, the western segment of the Nanling E-W Complex Tectonic Belt, and the Wenshan Giant Rotational Tectonic System. Although no major faults were identified within the immediate study area, the F2 Fault (Chengzicun-Shezhe Fault), a secondary thrust fault, is developed about 0.4 km southeast of the site. This fault has a width of approximately 15 m and primarily influences Middle Triassic Gejiu Formation (T2g) dolomitic limestone. The geomorphology is characterized by karst peak-cluster depressions with gentle slopes. The ground elevation ranges from 1609.7 m to 1632.9 m, with a relative height difference of 23.2 m. The region has a southern temperate climate with a mean annual temperature of 15.2 °C and average annual rainfall between 900 mm and 1000 mm, concentrated mainly in the summer months. Hydrologically, the area belongs to the Pearl River system, with the Nanpan River as the main trunk stream. Surface runoff is primarily rainfall-fed, and groundwater converges into deep karst conduits, eventually discharging into the Nanpan River.
Figure 1.
Location maps of the slope case.
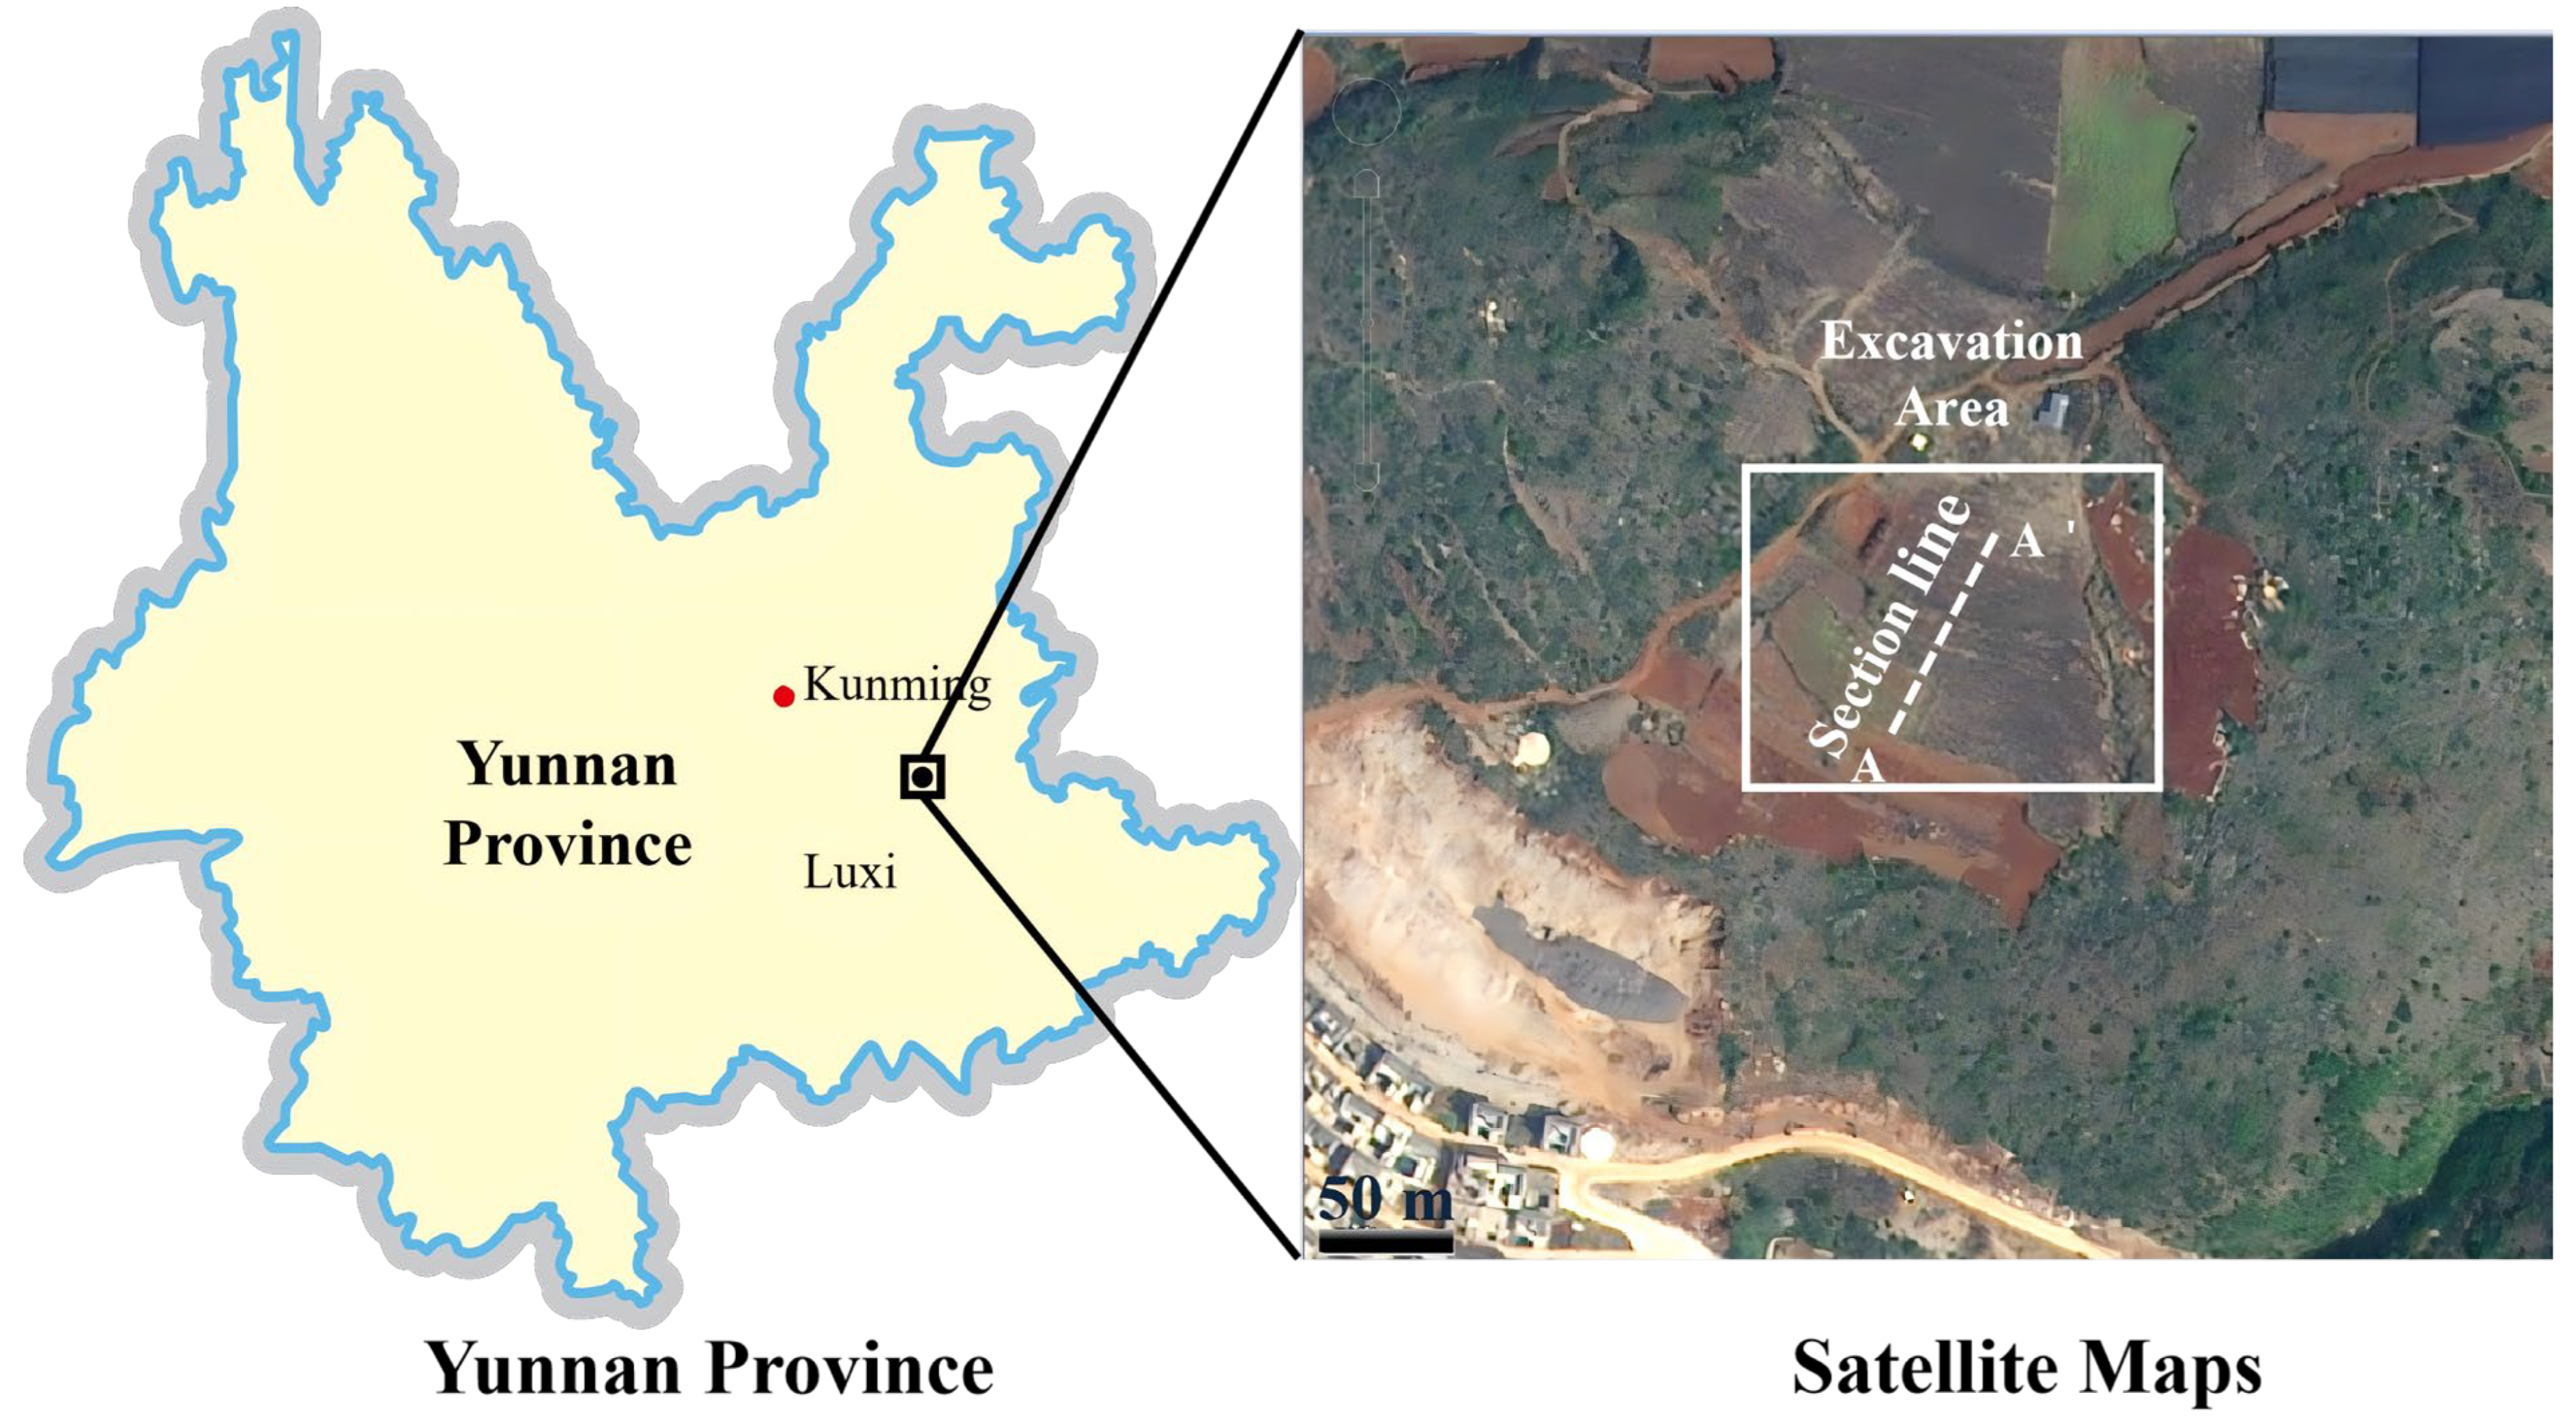
The Yongning Intercut formed a cutting slope through the excavated area shown in Figure 1. Among these, section A–A′ featured a thick accumulation of red clay before excavation (Figure 2), which appeared brownish-red, with a thickness of approximately 5–30 m and a natural slope angle of about 35°. The underlying bedrock consists of moderately weathered dolomitic limestone, with a bedding attitude of 220° ∠45°. The stable groundwater level is mainly confined within the bedrock at a depth of about 35 m; no perennial groundwater table was observed within the red clay layer. The excavation depth at section A–A′ was 40.75 m, resulting in a two-stage cut slope with each slope angle at 53° and a total slope height of 43 m. Due to the substantial thickness of the red clay, a layer approximately 4–5 m thick remained covering the bedrock after excavation. The slope excavation was completed in April 2025. Starting in August, as multiple red clay cut slopes in the region experienced sliding failures, the construction team began installing surface displacement monitoring points (Codes: D1, D2, D3) at the crest, mid-slope platform and toe on August 6. The coordinates of these points relative to the lower-left corner of Figure 2 are D1 (11.1, 46.5) m, D2 (31.2, 25.7) m, and D3 (45.8, 7.6) m. Displacement measurements were conducted using a total station instrument (e.g., Leica TS09 Plus) with an angular accuracy of 1″ and distance measurement accuracy of ±(1 mm + 1.5 ppm), providing millimeter-level precision. On August 12, following a heavy rainfall event, a shallow failure occurred within the red clay layer (Figure 2a), with an average thickness of the slid mass of about 2–3 m. After the failure, the construction team promptly removed the slipped material and implemented an anchor-frame beam system for stabilization (Figure 2b,c).
Figure 2.
Cross-section A–A′ and some photos (a) Failure of the upper-step slope; (b,c) Anchor-frame beam construction after slope failure; (d) in situ soil sample.
3. Materials and Methods
3.1. Experimental Test
The in situ soil samples were collected from the opposite side of the excavated slope at a depth of 0.5 m below the surface (Figure 2d). The intact samples, measuring approximately 20 cm × 20 cm × 20 cm, exhibited a brownish-red color and showed slight weathering cracks. To minimize moisture loss and structural disturbance during transportation, each sample was tightly wrapped in plastic film immediately after extraction, with the top and bottom surfaces clearly marked. In this study, ‘intact samples’ refer to specimens collected with minimal disturbance to preserve the natural soil structure, including features like cracks and bonds. ‘Remolded samples’ were reconstituted from intact soil by breaking down the structure through mixing, then compacted to match the dry density and initial water content of the intact samples. These represent end-members: intact samples simulate in situ conditions with preserved structure, while remolded samples simulate fully degraded structure. However, field behavior after excavation or rainfall likely lies between these extremes due to factors like partial saturation, localized disturbance, and progressive wetting. This simplification helps isolate the effects of structure degradation in controlled tests. The basic physical properties of the soil samples are summarized in Table 1.
Table 1.
Basic physical properties of red clay.
A series of tests was carried out to characterize the hydraulic and mechanical properties of both intact and remolded red clay from the case slope. The soil-water retention curve (SWRC) for the soil sample was estimated using the pedotransfer function method to improve efficiency, while saturated hydraulic conductivity was measured with a laboratory permeameter. Shear strength parameters were determined through direct shear tests on both intact and remolded samples. Note that all remolded soil specimens had the same dry density and initial water content as the intact soil.
3.1.1. Hydrological Properties
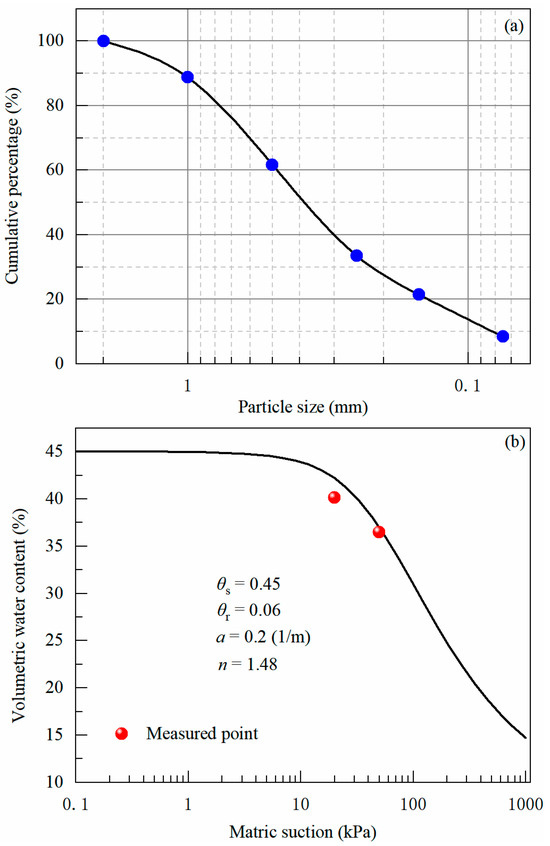
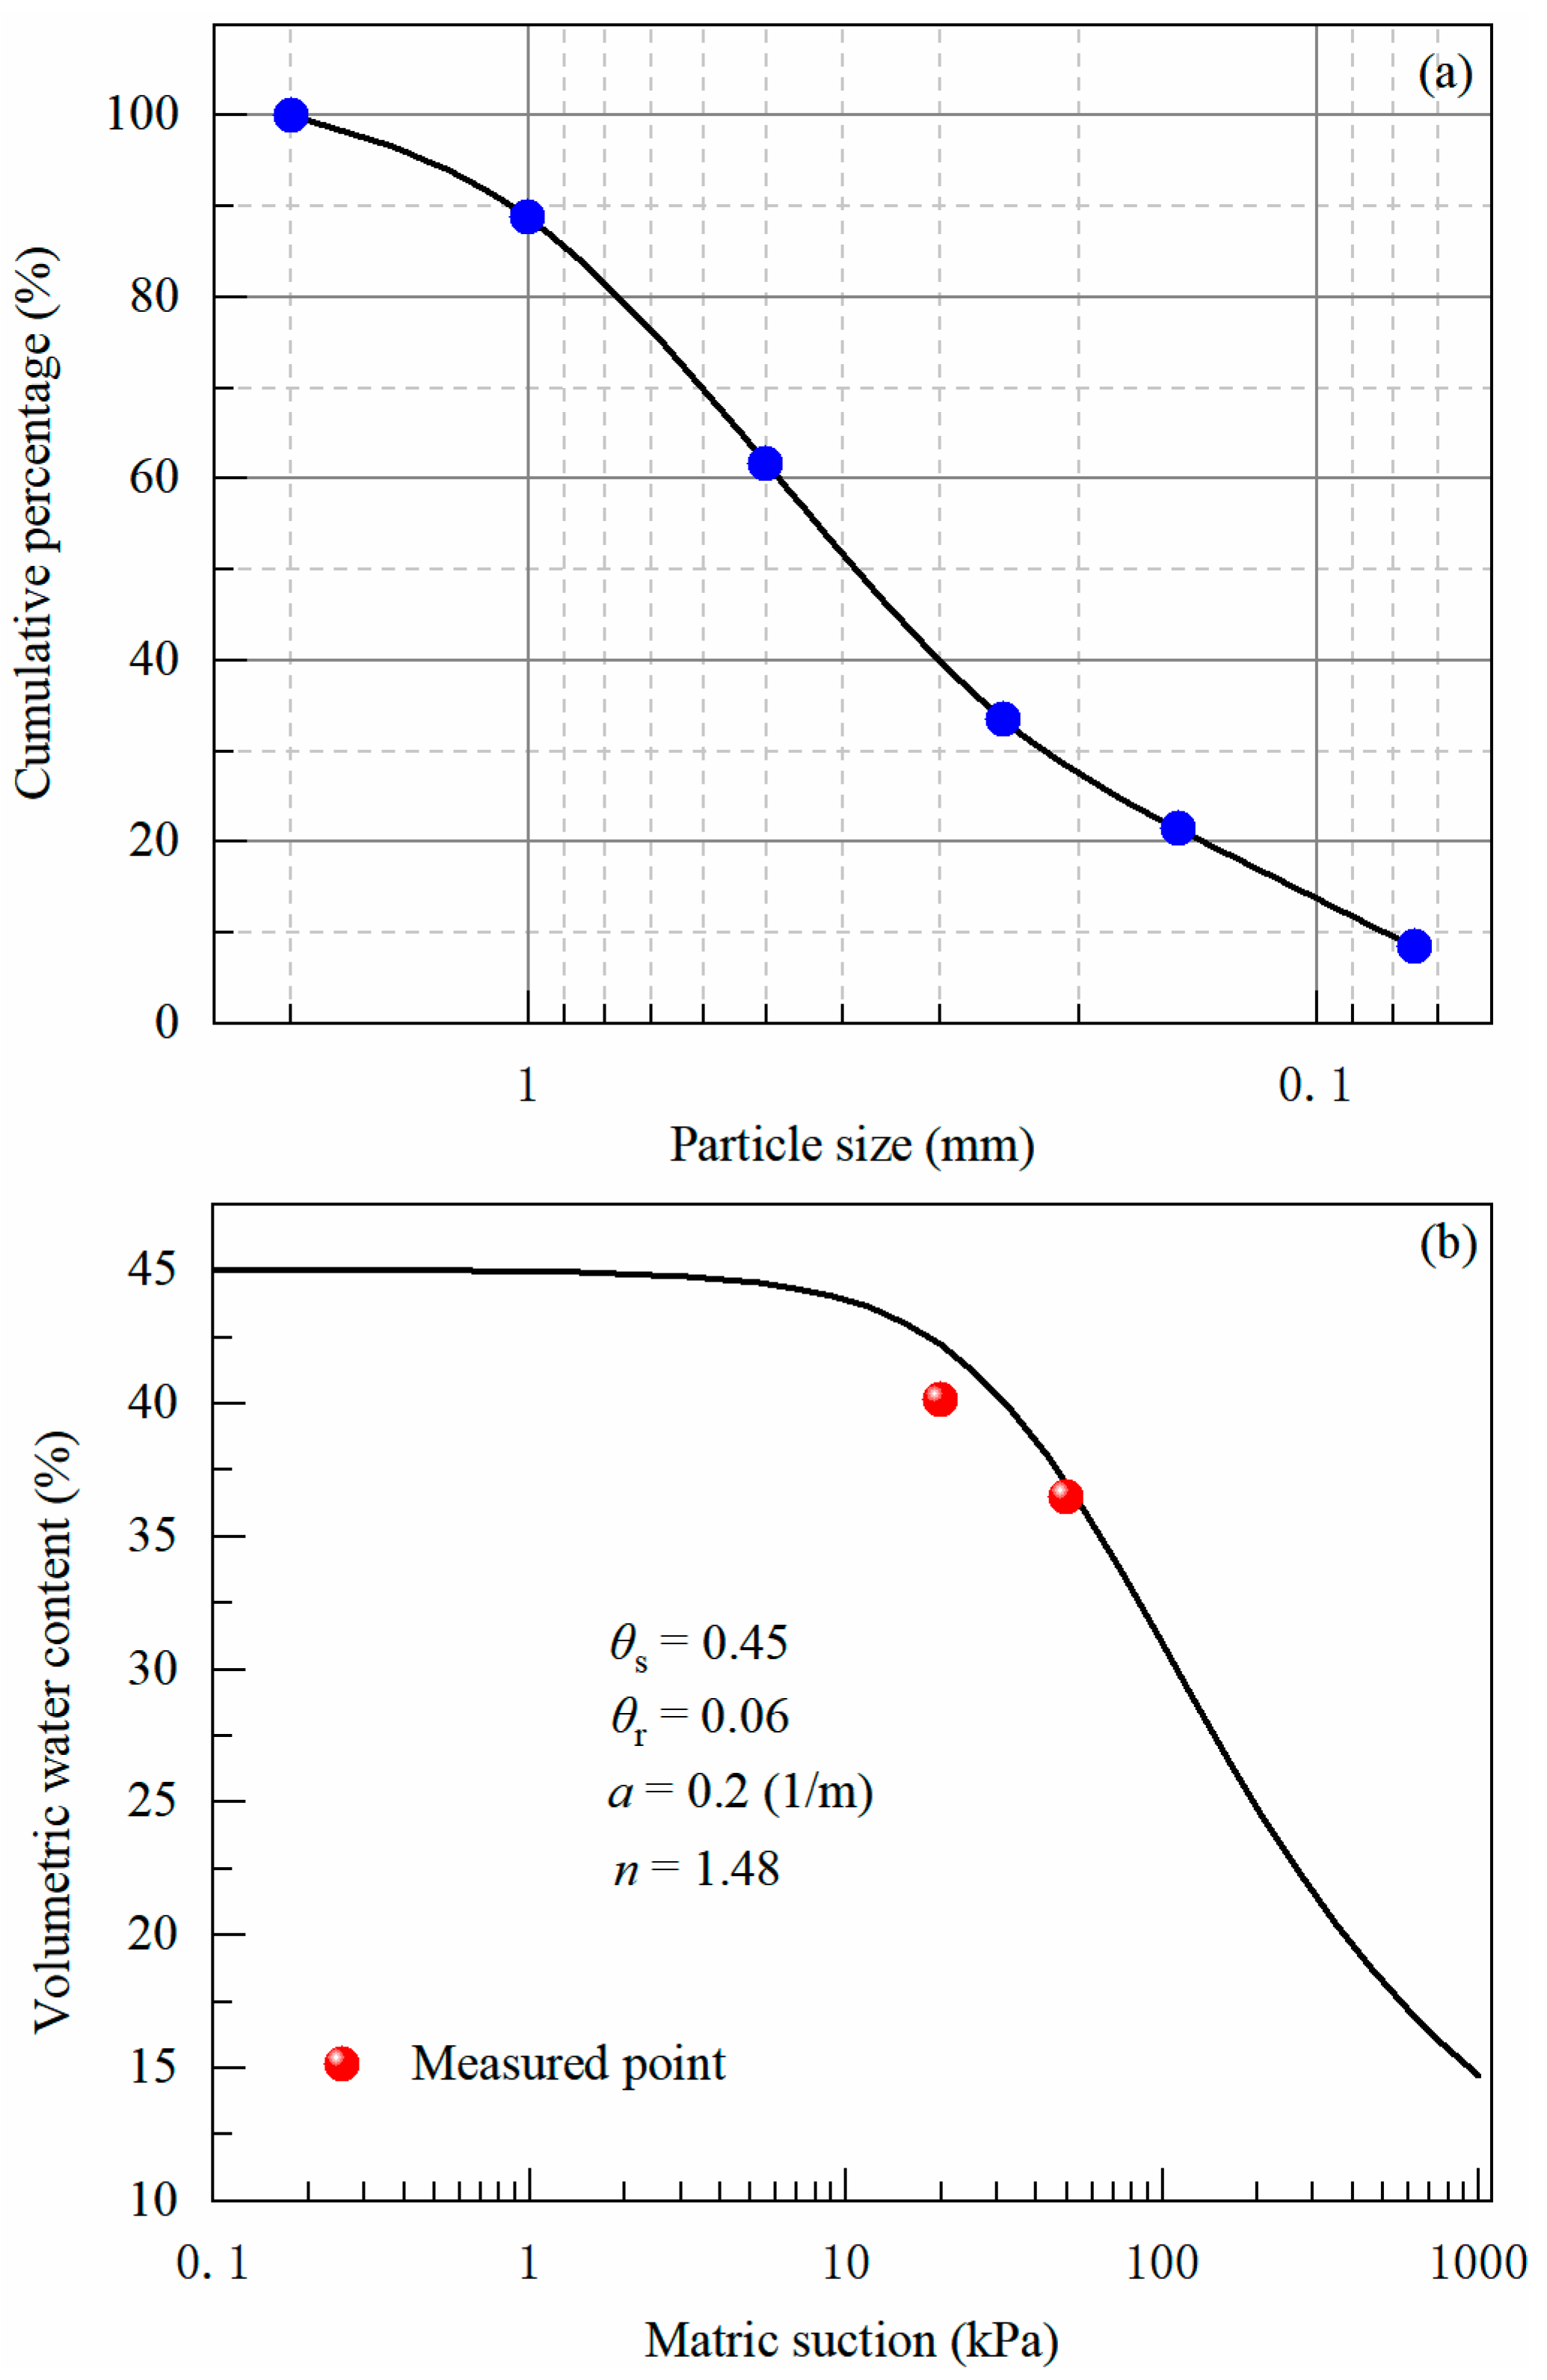
Hydrological characteristics include the soil-water retention curve (SWRC) and hydraulic conductivity. Conventional measurement of the SWRC via the pressure plate method typically requires several months to achieve equilibrium, making the process highly time-consuming. Accordingly, this study adopted pedotransfer functions (PTFs) for inversely estimating the SWRC. PTFs predict hydraulic parameters using readily available soil properties, including particle size distribution and bulk density. While PTF-derived estimates are generally less accurate than direct measurements, they offer an efficient and feasible approach for determining soil hydraulic properties when experimental data are limited. To validate the PTF-estimated SWRC, the volumetric water content was experimentally measured at matric suctions of 10 kPa and 35 kPa using the pressure plate method. The results show reasonable agreement with the predicted curve. We argue that using the SWRC of the remolded soil prepared at the same initial dry density as the intact soil is sufficient to reflect its water retention characteristics for this study. This is because the key hydrological contrast lies in permeability rather than water retention. In particular, the “Rosetta” model implemented in RETC software v1 [39] was applied following a hierarchical approach based on textural composition (i.e., sand, silt, and clay percentages) to predict the parameters of the Mualem–van Genuchten water retention model. The particle size distribution and the corresponding estimated SWRC are illustrated in Figure 3.
Figure 3.
Particle size distribution curve (a) and estimated SWRC using pedotransfer function (b).
Saturated hydraulic conductivity was further measured for both intact and remolded soil specimens via laboratory falling-head permeability tests. The remolded samples were consistently prepared to match the dry density and initial moisture content of the intact soil. The petroleum jelly was used to seal the gaps between the soil and the sampler. This step prevents preferential flow along the side walls. All specimens were saturated using a vacuum saturation procedure for 24 h. The tests were performed at a controlled temperature of 20 degrees Celsius. We tested three replicates for each soil state to ensure reliability. The saturated hydraulic conductivity of intact samples is 5.63 ± 0.55 × 10⁻⁶ m/s. The conductivity of remolded samples is 1.20 ± 0.10 × 10⁻⁶ m/s. The higher conductivity in intact samples is likely due to the preservation of natural micro cracks and structural pores.
3.1.2. Mechanical Properties
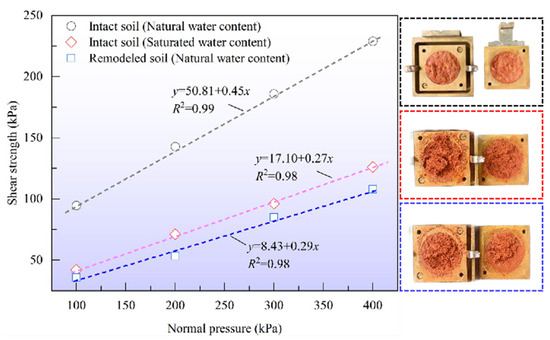
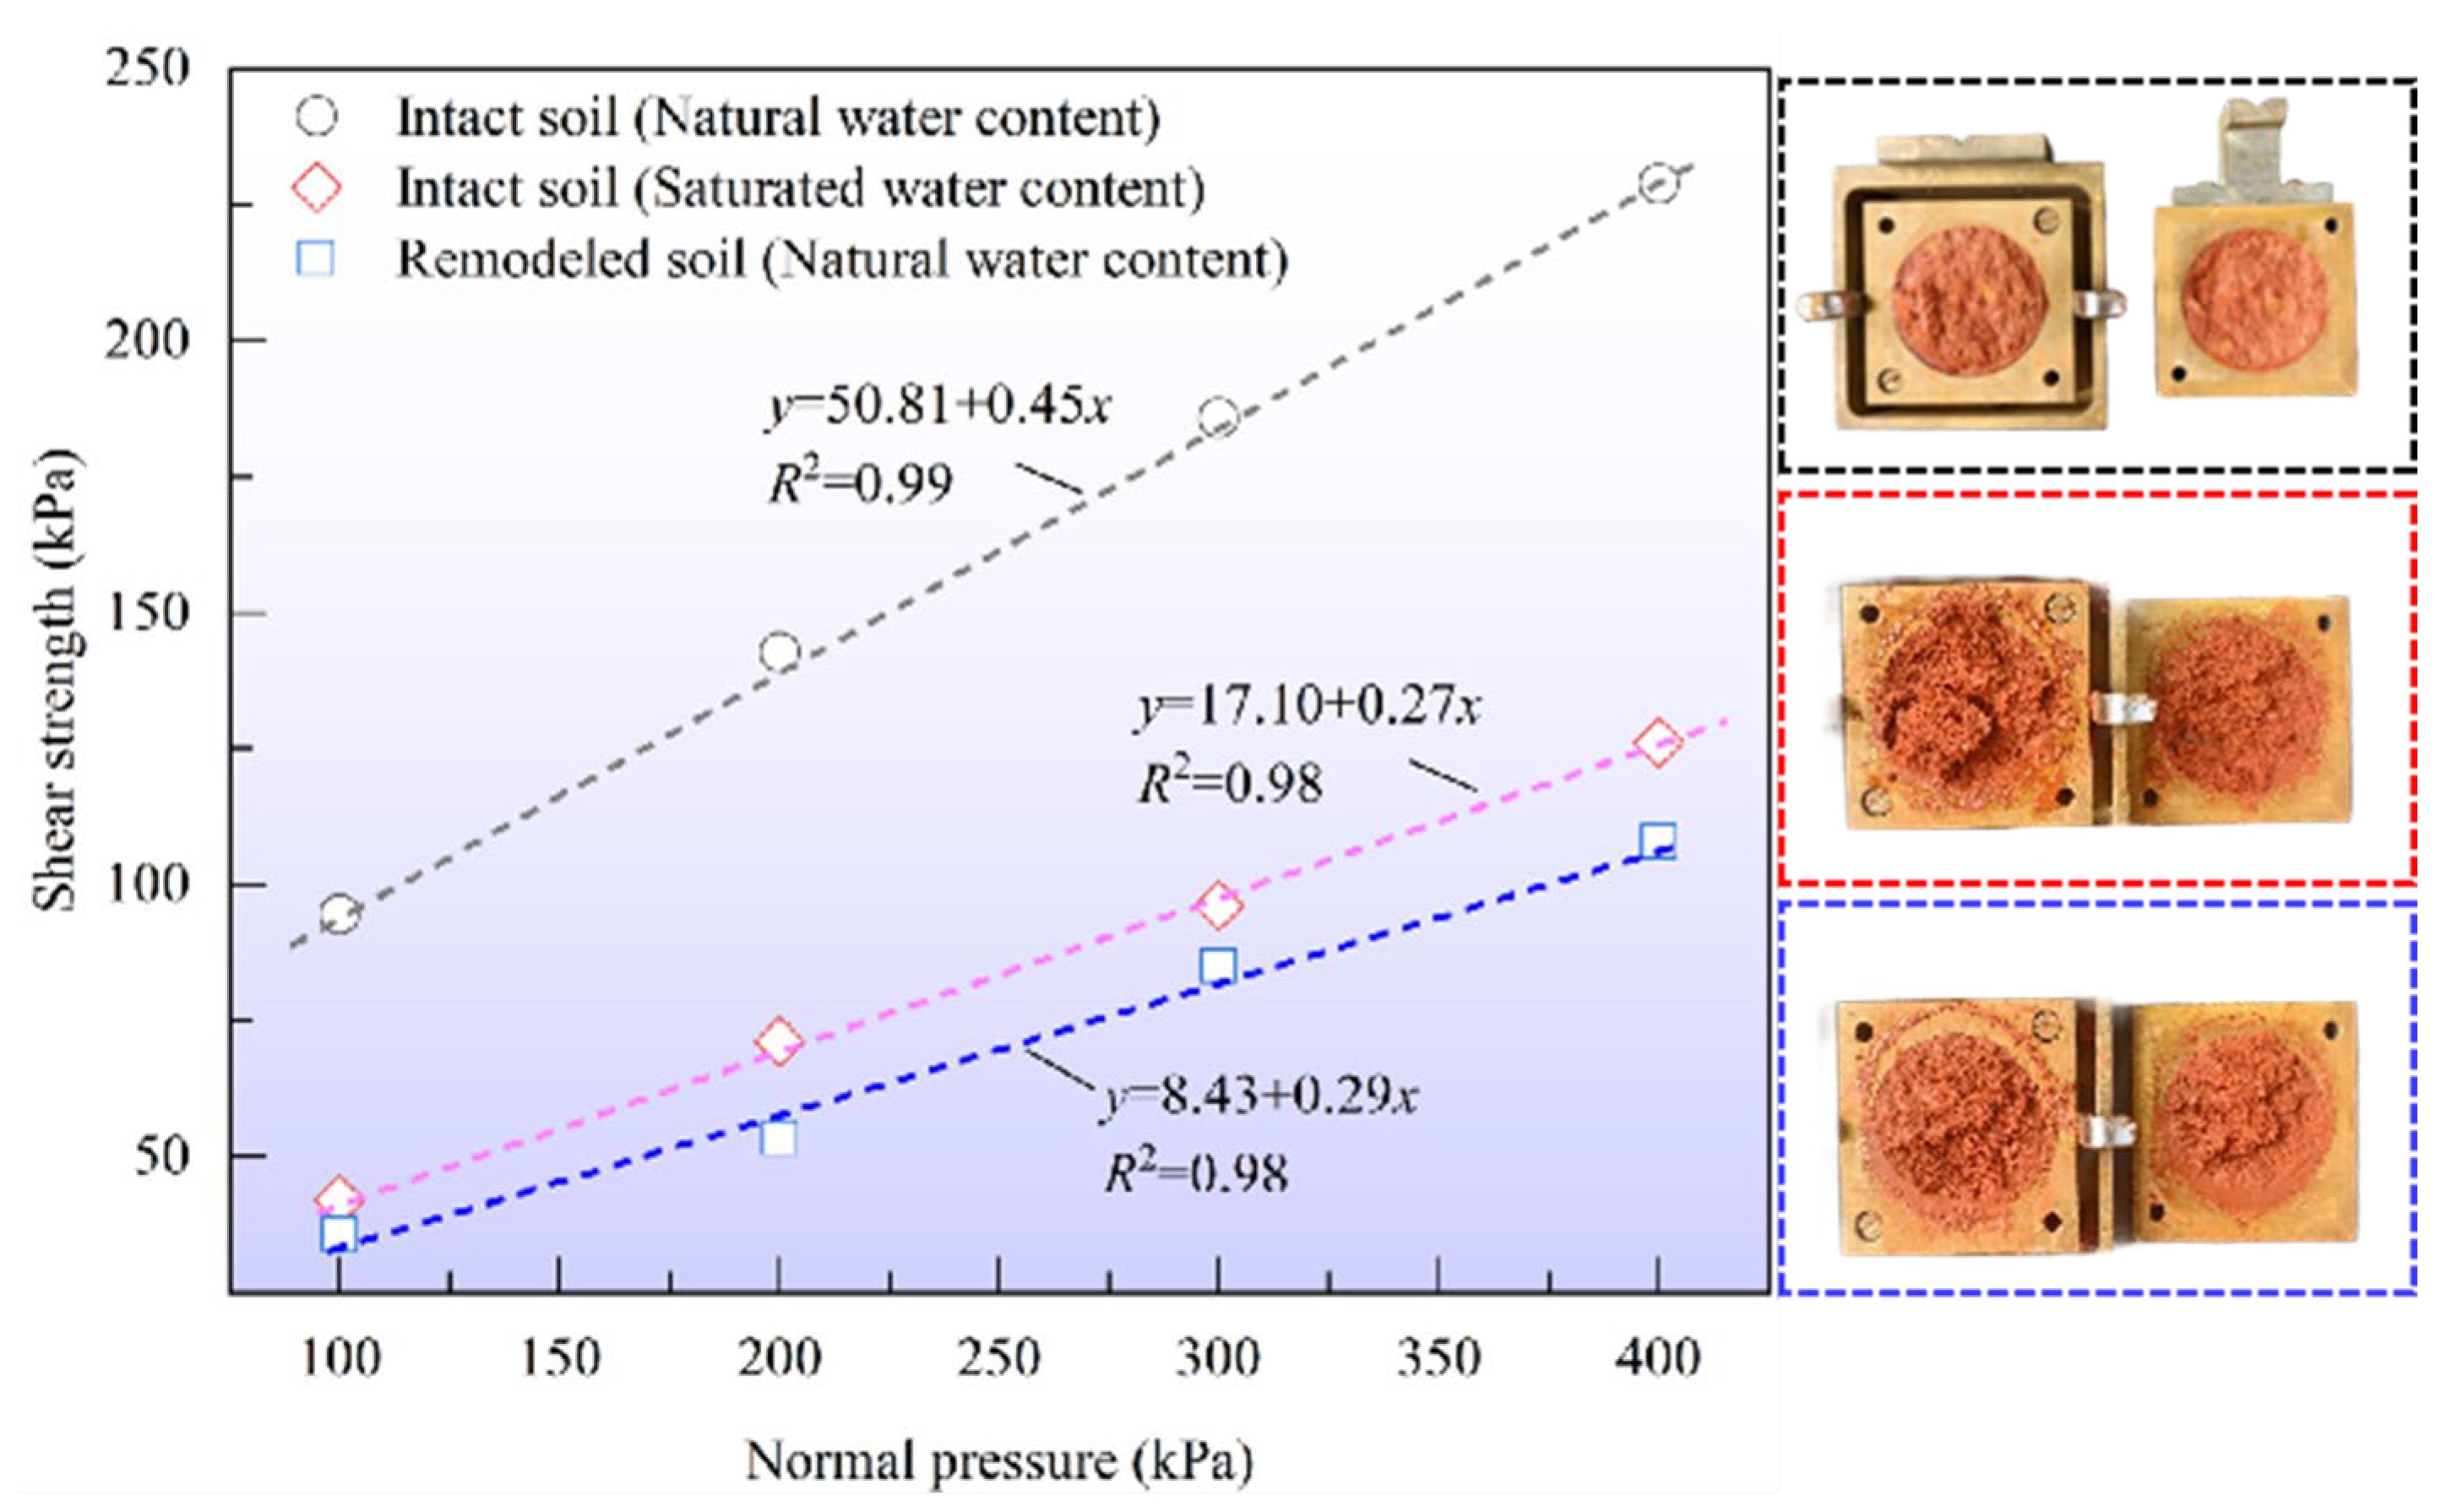
Eight intact soil samples measuring 61.8 mm in diameter and 20 mm in height were prepared to derive shear strength parameters under natural and saturated water content. These tests were performed using a shear box apparatus with dimensions of 70 mm × 70 mm × 20 mm. The samples were sheared under vertical stresses of 100 kPa, 200 kPa, 300 kPa and 400 kPa. Shearing was conducted at a constant rate of 0.05 mm/min until a critical horizontal displacement of 12 mm was reached. The cohesion and friction angle of the intact soil sample under natural and saturated water content, determined by fitting the vertical stress–shear strength relationship (Figure 4), were found to be (50.8 kPa, 24.2°) and (17.1 kPa, 15.2°), respectively. An identical number of remolded soil samples were prepared and tested under the same conditions to evaluate the strength properties after soil structure disruption. The cohesion and friction angle of the remodeled soil samples were measured to be 8.4 kPa and 16.2°.
Figure 4.
Fitting results of normal stress versus shear strength for the intact and remodeled soil samples.
3.2. Numerical Simulation
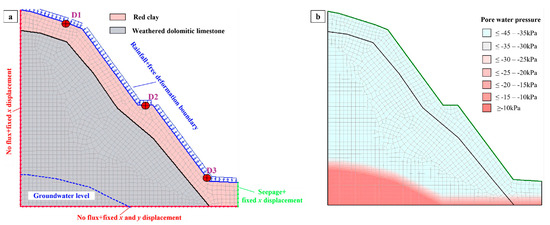
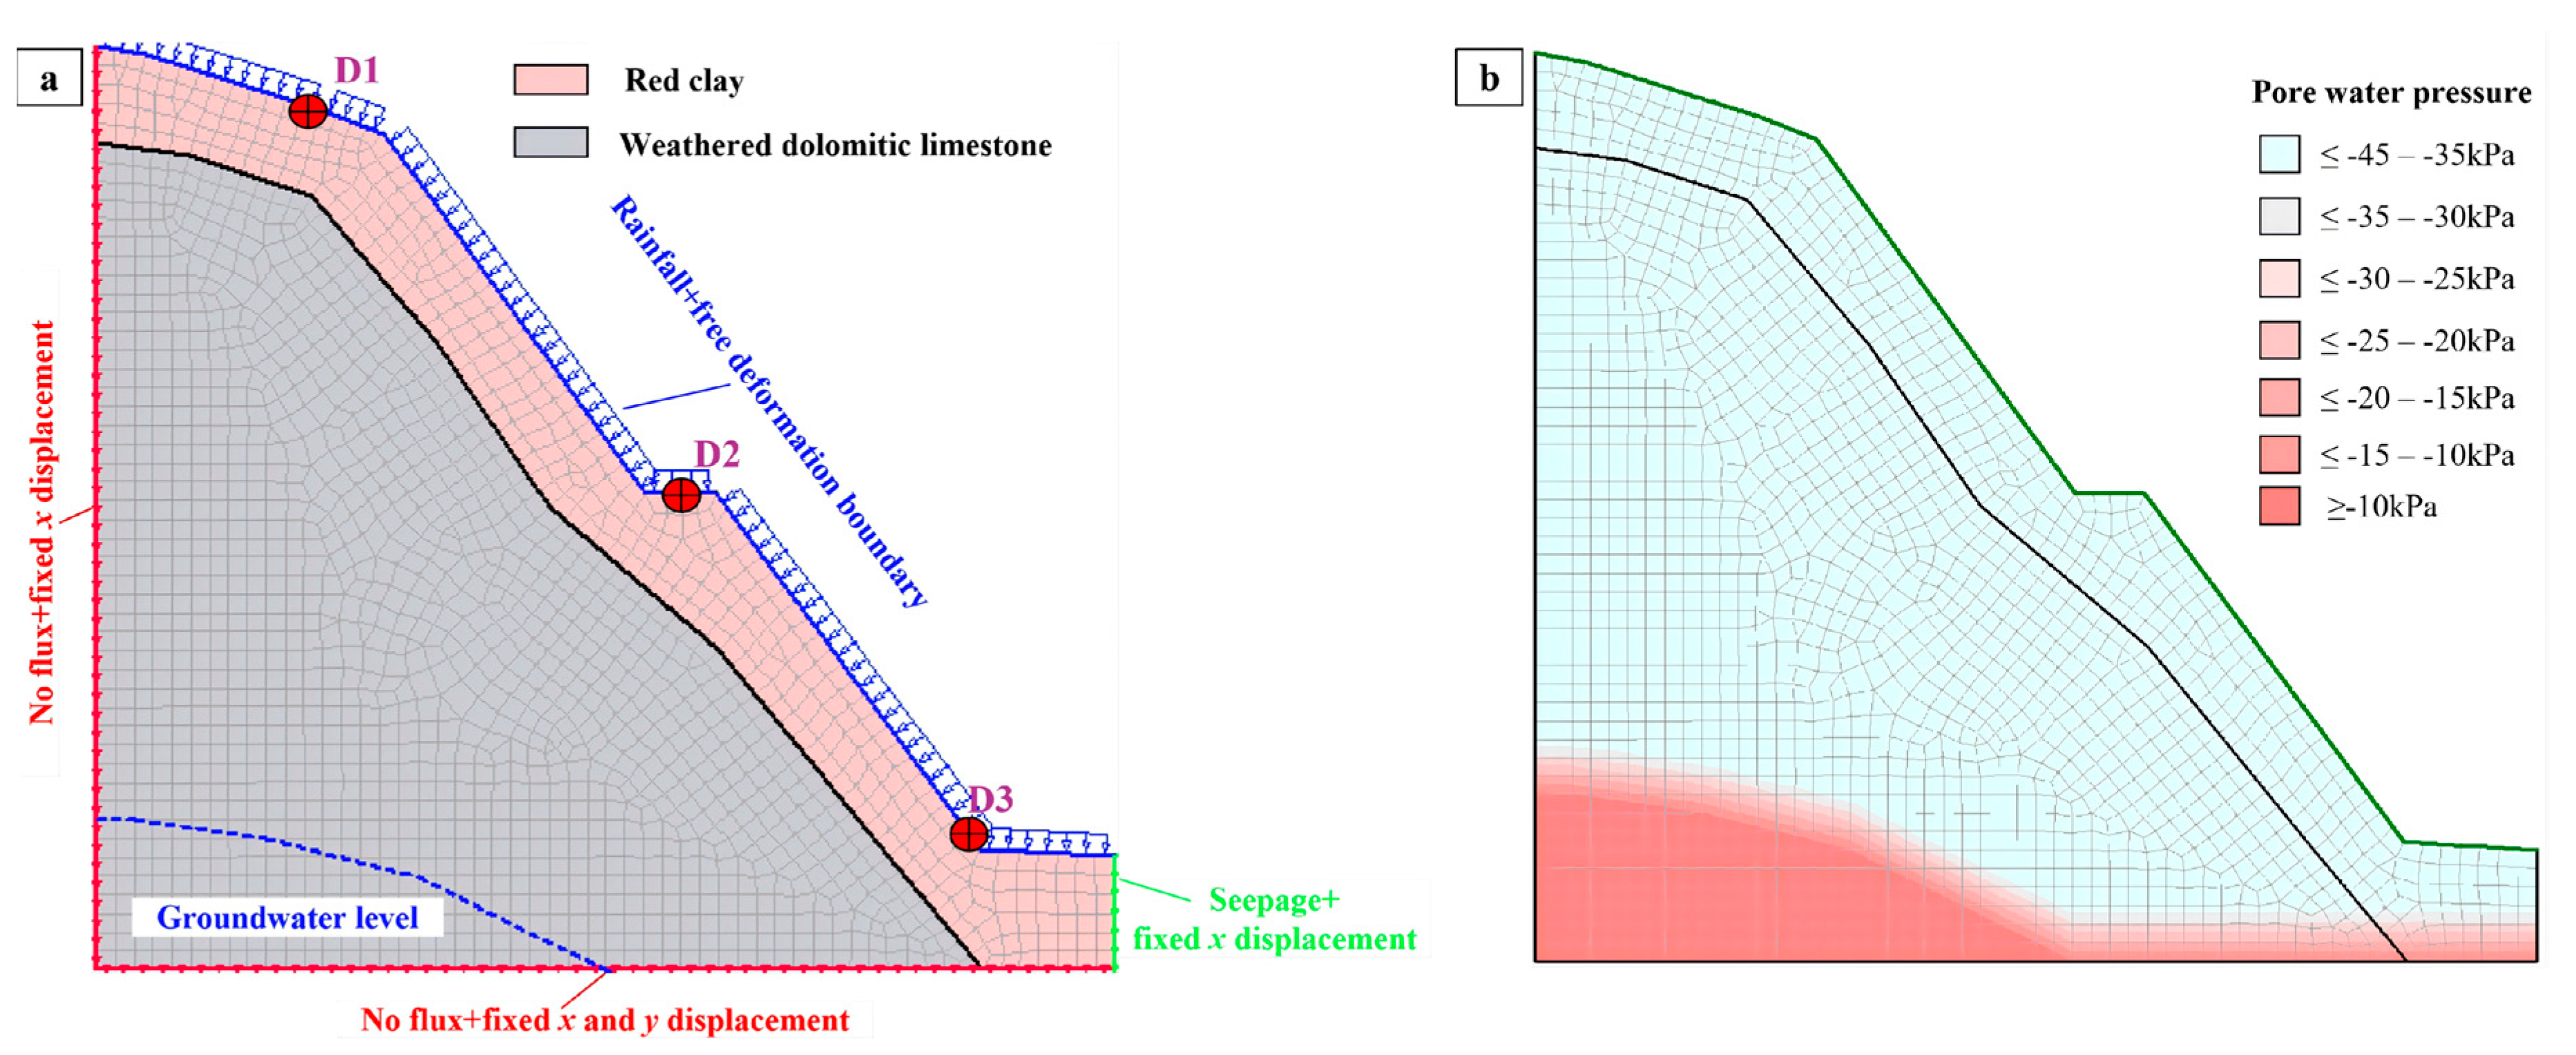
Based on the investigation findings, section A–A′ was chosen as a representative geological profile to simulate the evolution process of the slope failure. As illustrated in Figure 5, a two-dimensional finite element model integrating hydromechanical behavior was established in GeoStudio, utilizing the Sigma/W, Seep/W, and Slope/W modules. The model consisted of 1584 elements, with a time step of 0.07 days. Convergence criteria were set as a displacement tolerance of 0.001 m and a pressure head difference tolerance of 0.005 m, ensuring robust numerical stability. Given the field-observed failure surface (Figure 2a), the critical slip surface was directly specified in the analysis rather than using an automatic search algorithm, allowing for precise comparison with field data. The slope stability, expressed in terms of the factor of safety (Fs), was evaluated through the limit equilibrium method [40,41] and applied to stress results derived from Sigma/W, following the FLEM approach [40,41]. While effective for determining a global factor of safety, this approach is sensitive to the selected constitutive model and parameters and cannot fully capture the progressive failure process. The Mohr-Coulomb elastoplastic model was used to characterize the mechanical behavior of the red clay. This model was selected because its parameters (cohesion, friction angle) are directly obtained from our laboratory shear tests. This allows a clear comparison between intact and remolded soil strengths. The model can effectively capture the key shear strength reduction caused by rainwater infiltration. However, the model has limitations. It cannot fully represent the anisotropy and progressive damage of structured clay. This simplification is acknowledged, but the model is suitable for simulating the overall slope stability under rainfall. The Mualem-van Genuchten model characterized the soil-water retention. The corresponding hydrological and mechanical parameters are listed in Table 2. It should be noted that the properties assigned to the bedrock were determined based on local empirical knowledge, taking into account its actual influence on slope failure. For example, since the bedrock in this case primarily functions as an aquiclude, its hydraulic parameters were defined to resemble those of a low-permeability clay with high density.
Figure 5.
Set−up of the numerical model. (a) Boundary setting; (b) initial distribution of pore water pressure.
Table 2.
Mechanical and hydrological parameters in the numerical model.
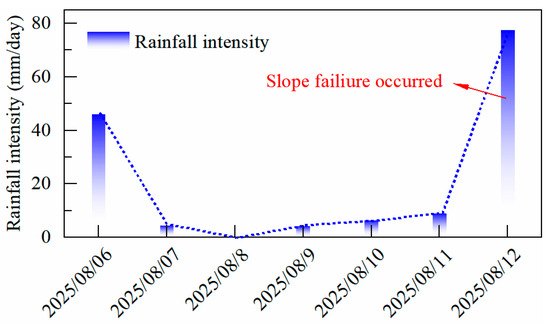
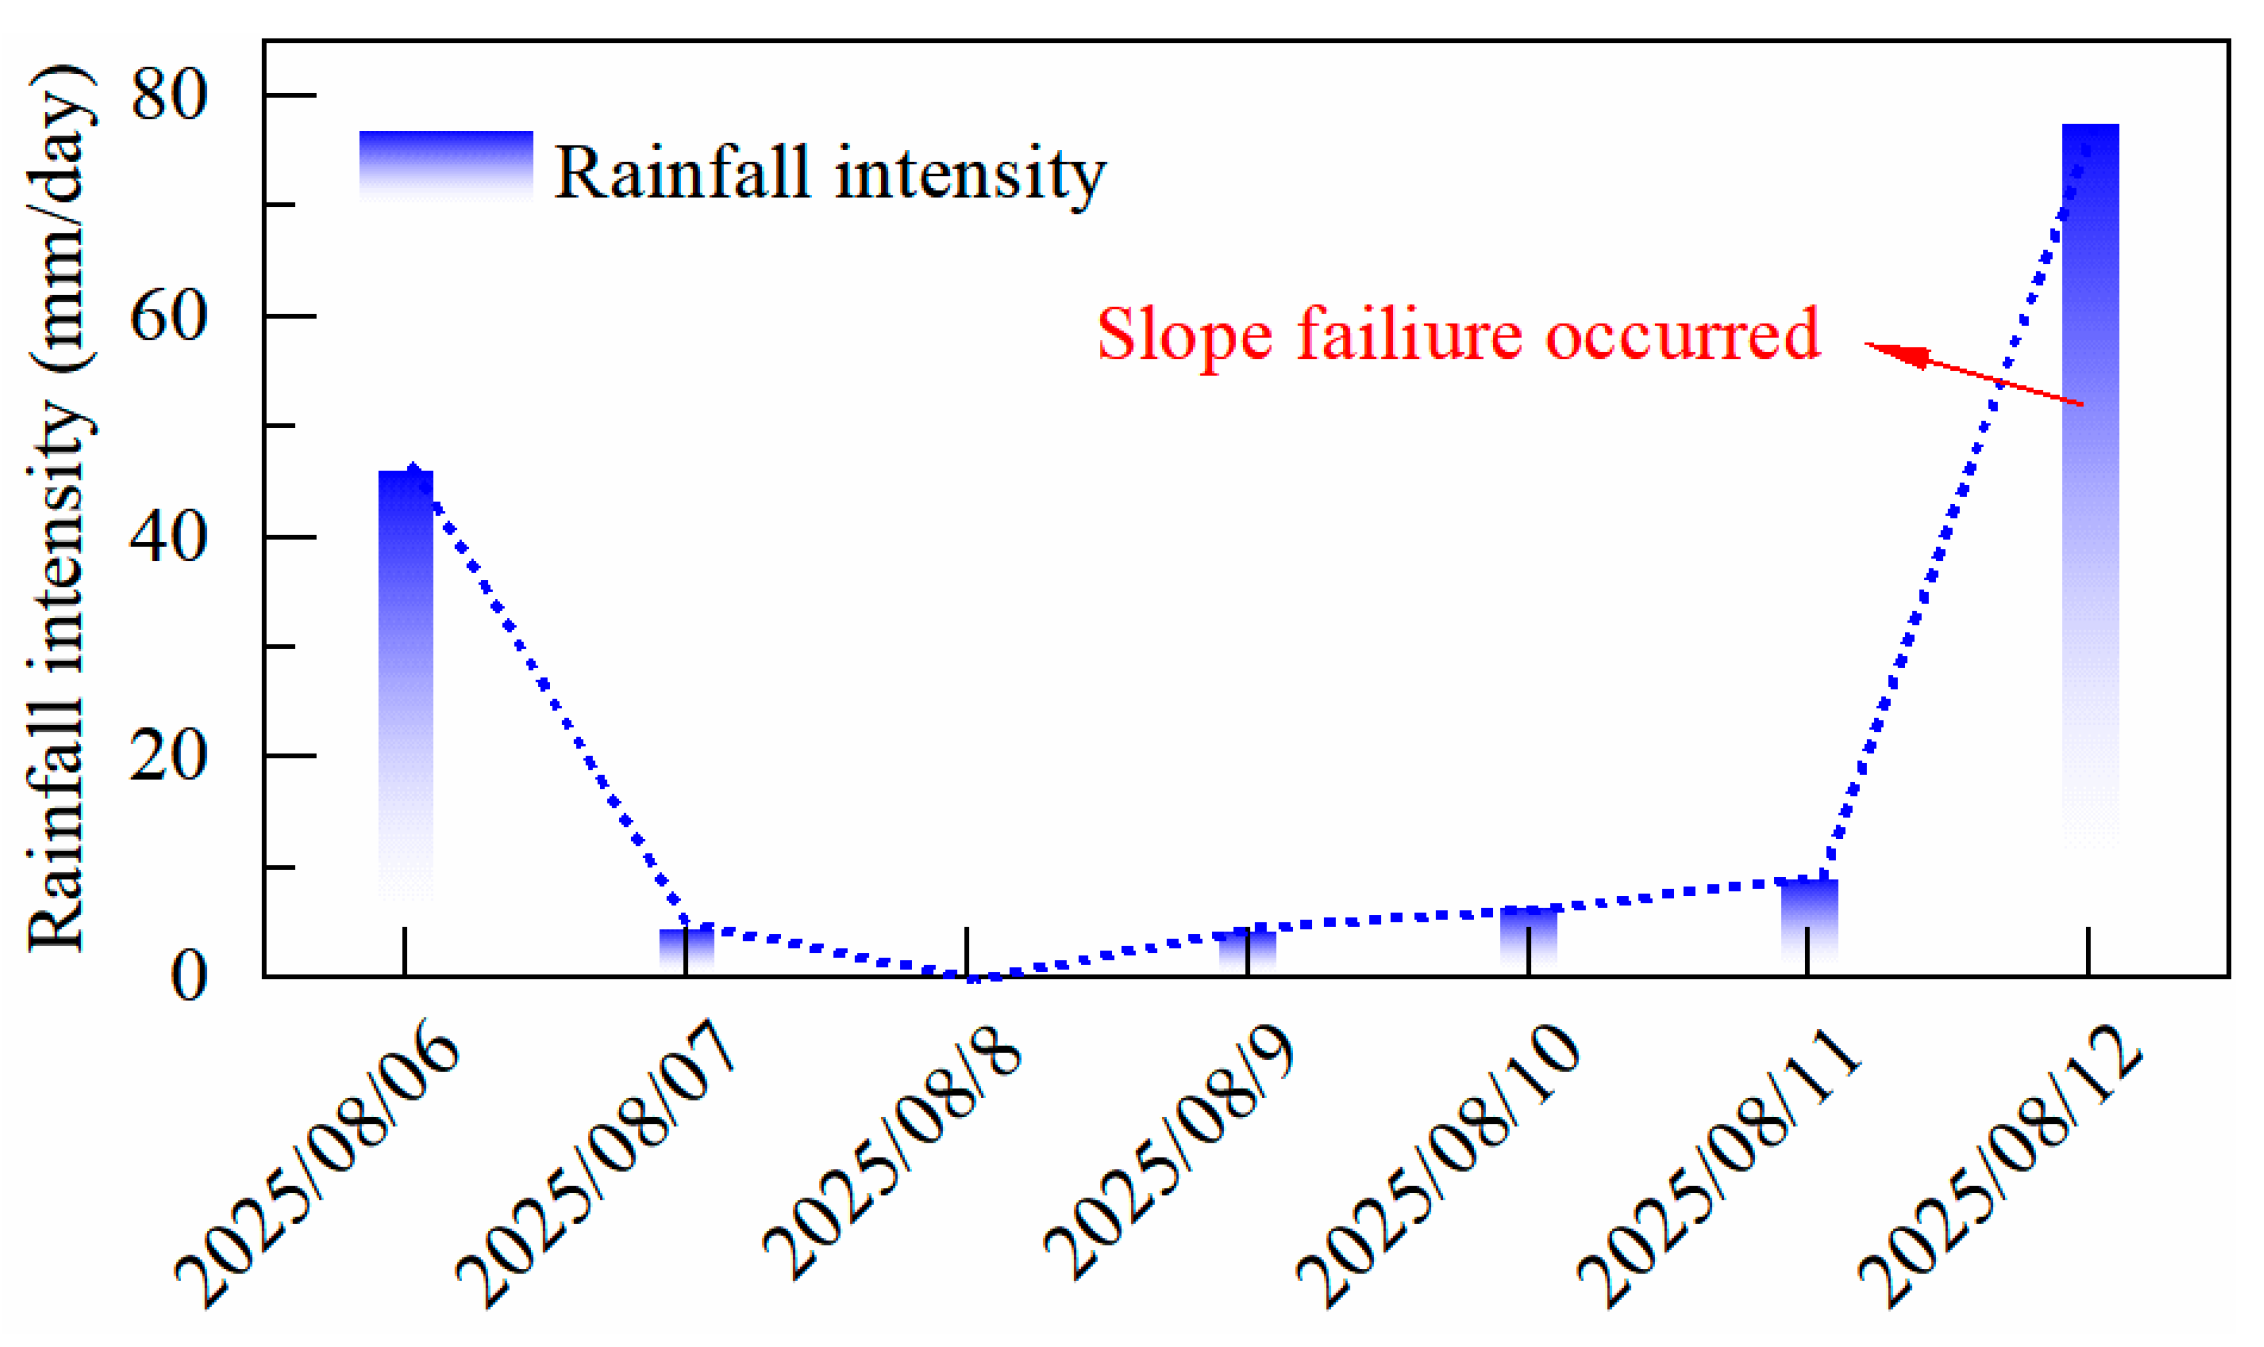
Boundary conditions for the mechanical model were specified as follows: the top surface was free; the left and right boundaries were restricted in the x-direction; and the bottom was fixed in both x and y directions. For the hydrological model, the top boundary was assigned a flux condition corresponding to the recorded one-week rainfall, as shown in Figure 6, the left and bottom edges were treated as no-flow boundaries, the right side was set as a free drainage (seepage) boundary. Three surface monitoring points were defined to compare simulated horizontal displacements with field measurements.
Figure 6.
One-week rainfall records before the slope failure.
To quantify the influence of soil structure degradation on the slope stability, the hydrological and mechanical parameters from both intact and remodeled soil samples were adopted in the numerical model (Table 2), respectively. Meanwhile, four comparative cases were established to investigate the sensitivity of slope deformation and stability to the degradation of strength and hydraulic conductivity:
- Case #1: Intact soil hydraulic conductivity + Intact soil strength parameters (under natural water content).
- Case #2: Intact soil hydraulic conductivity + Remodeled soil strength parameters (under natural water content).
- Case #3: Remodeled soil hydraulic conductivity + Intact soil strength parameters (under natural water content).
- Case #4: Remodeled soil hydraulic conductivity + Remodeled soil strength parameters (under natural water content).
- Case #5: Intact soil hydraulic conductivity + Intact soil strength parameters (under saturated water content).
- Case #6: Remodeled soil hydraulic conductivity + Intact soil strength parameters (under saturated water content).
4. Results and Analysis
4.1. Slope Hydrology
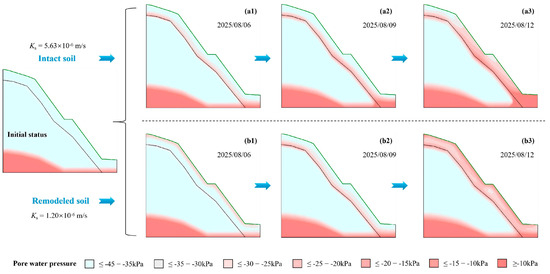
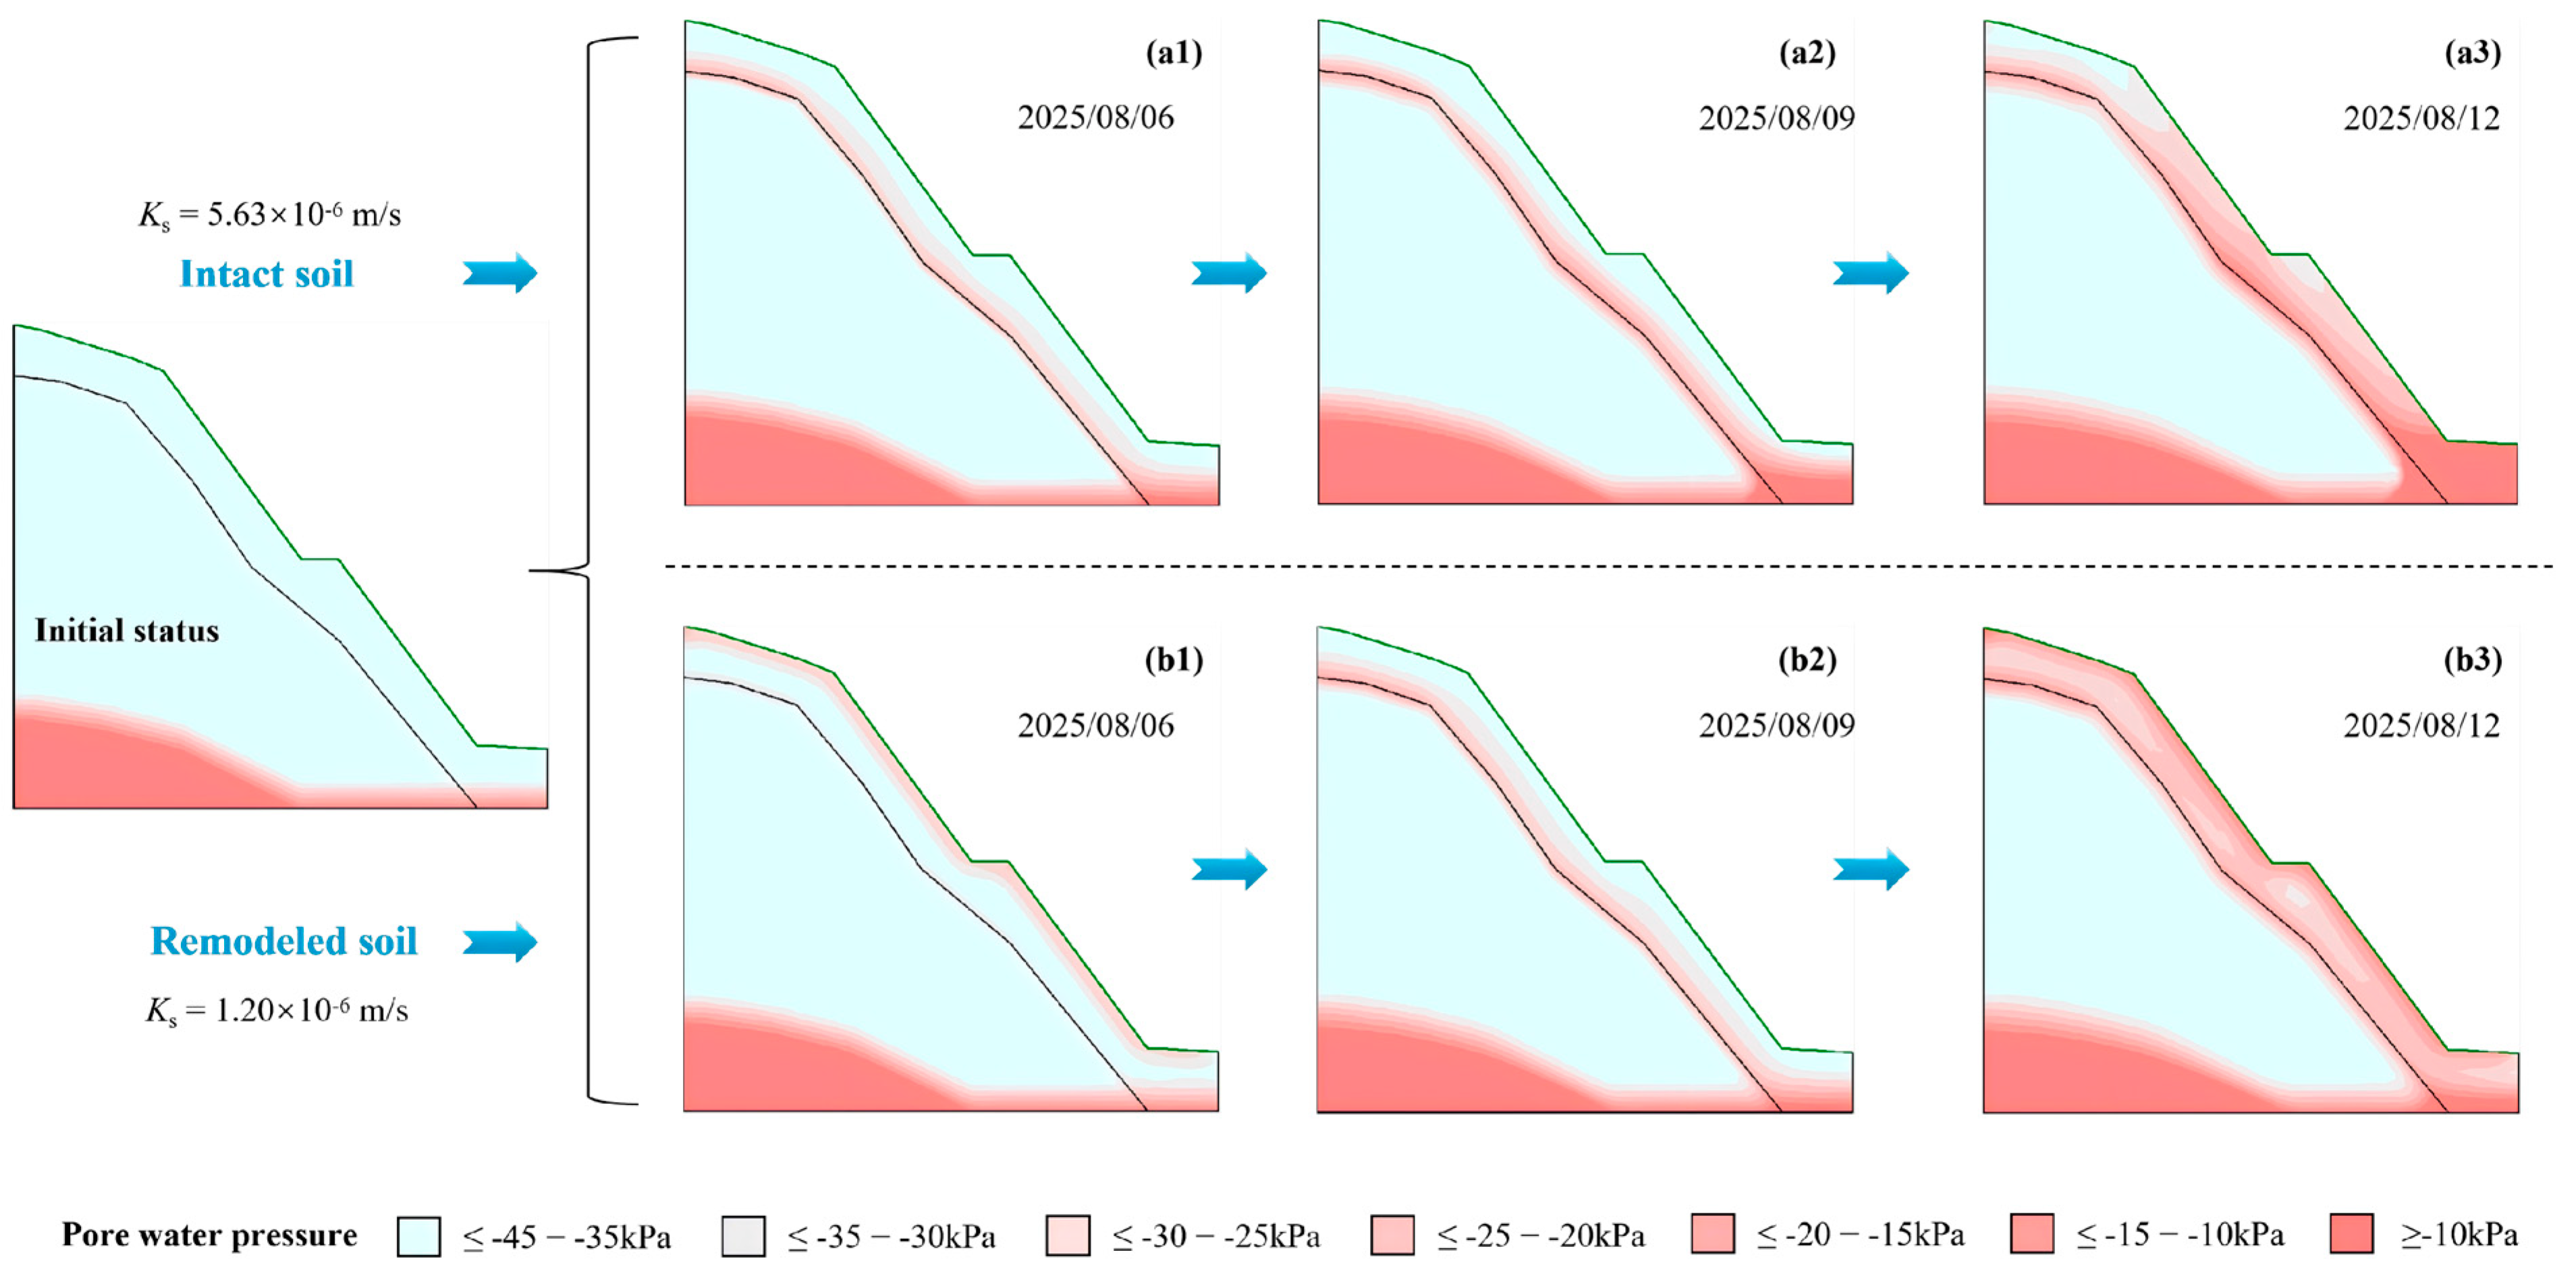
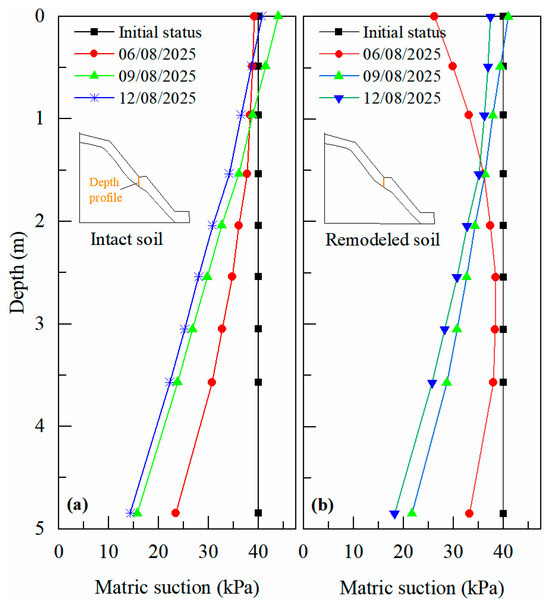
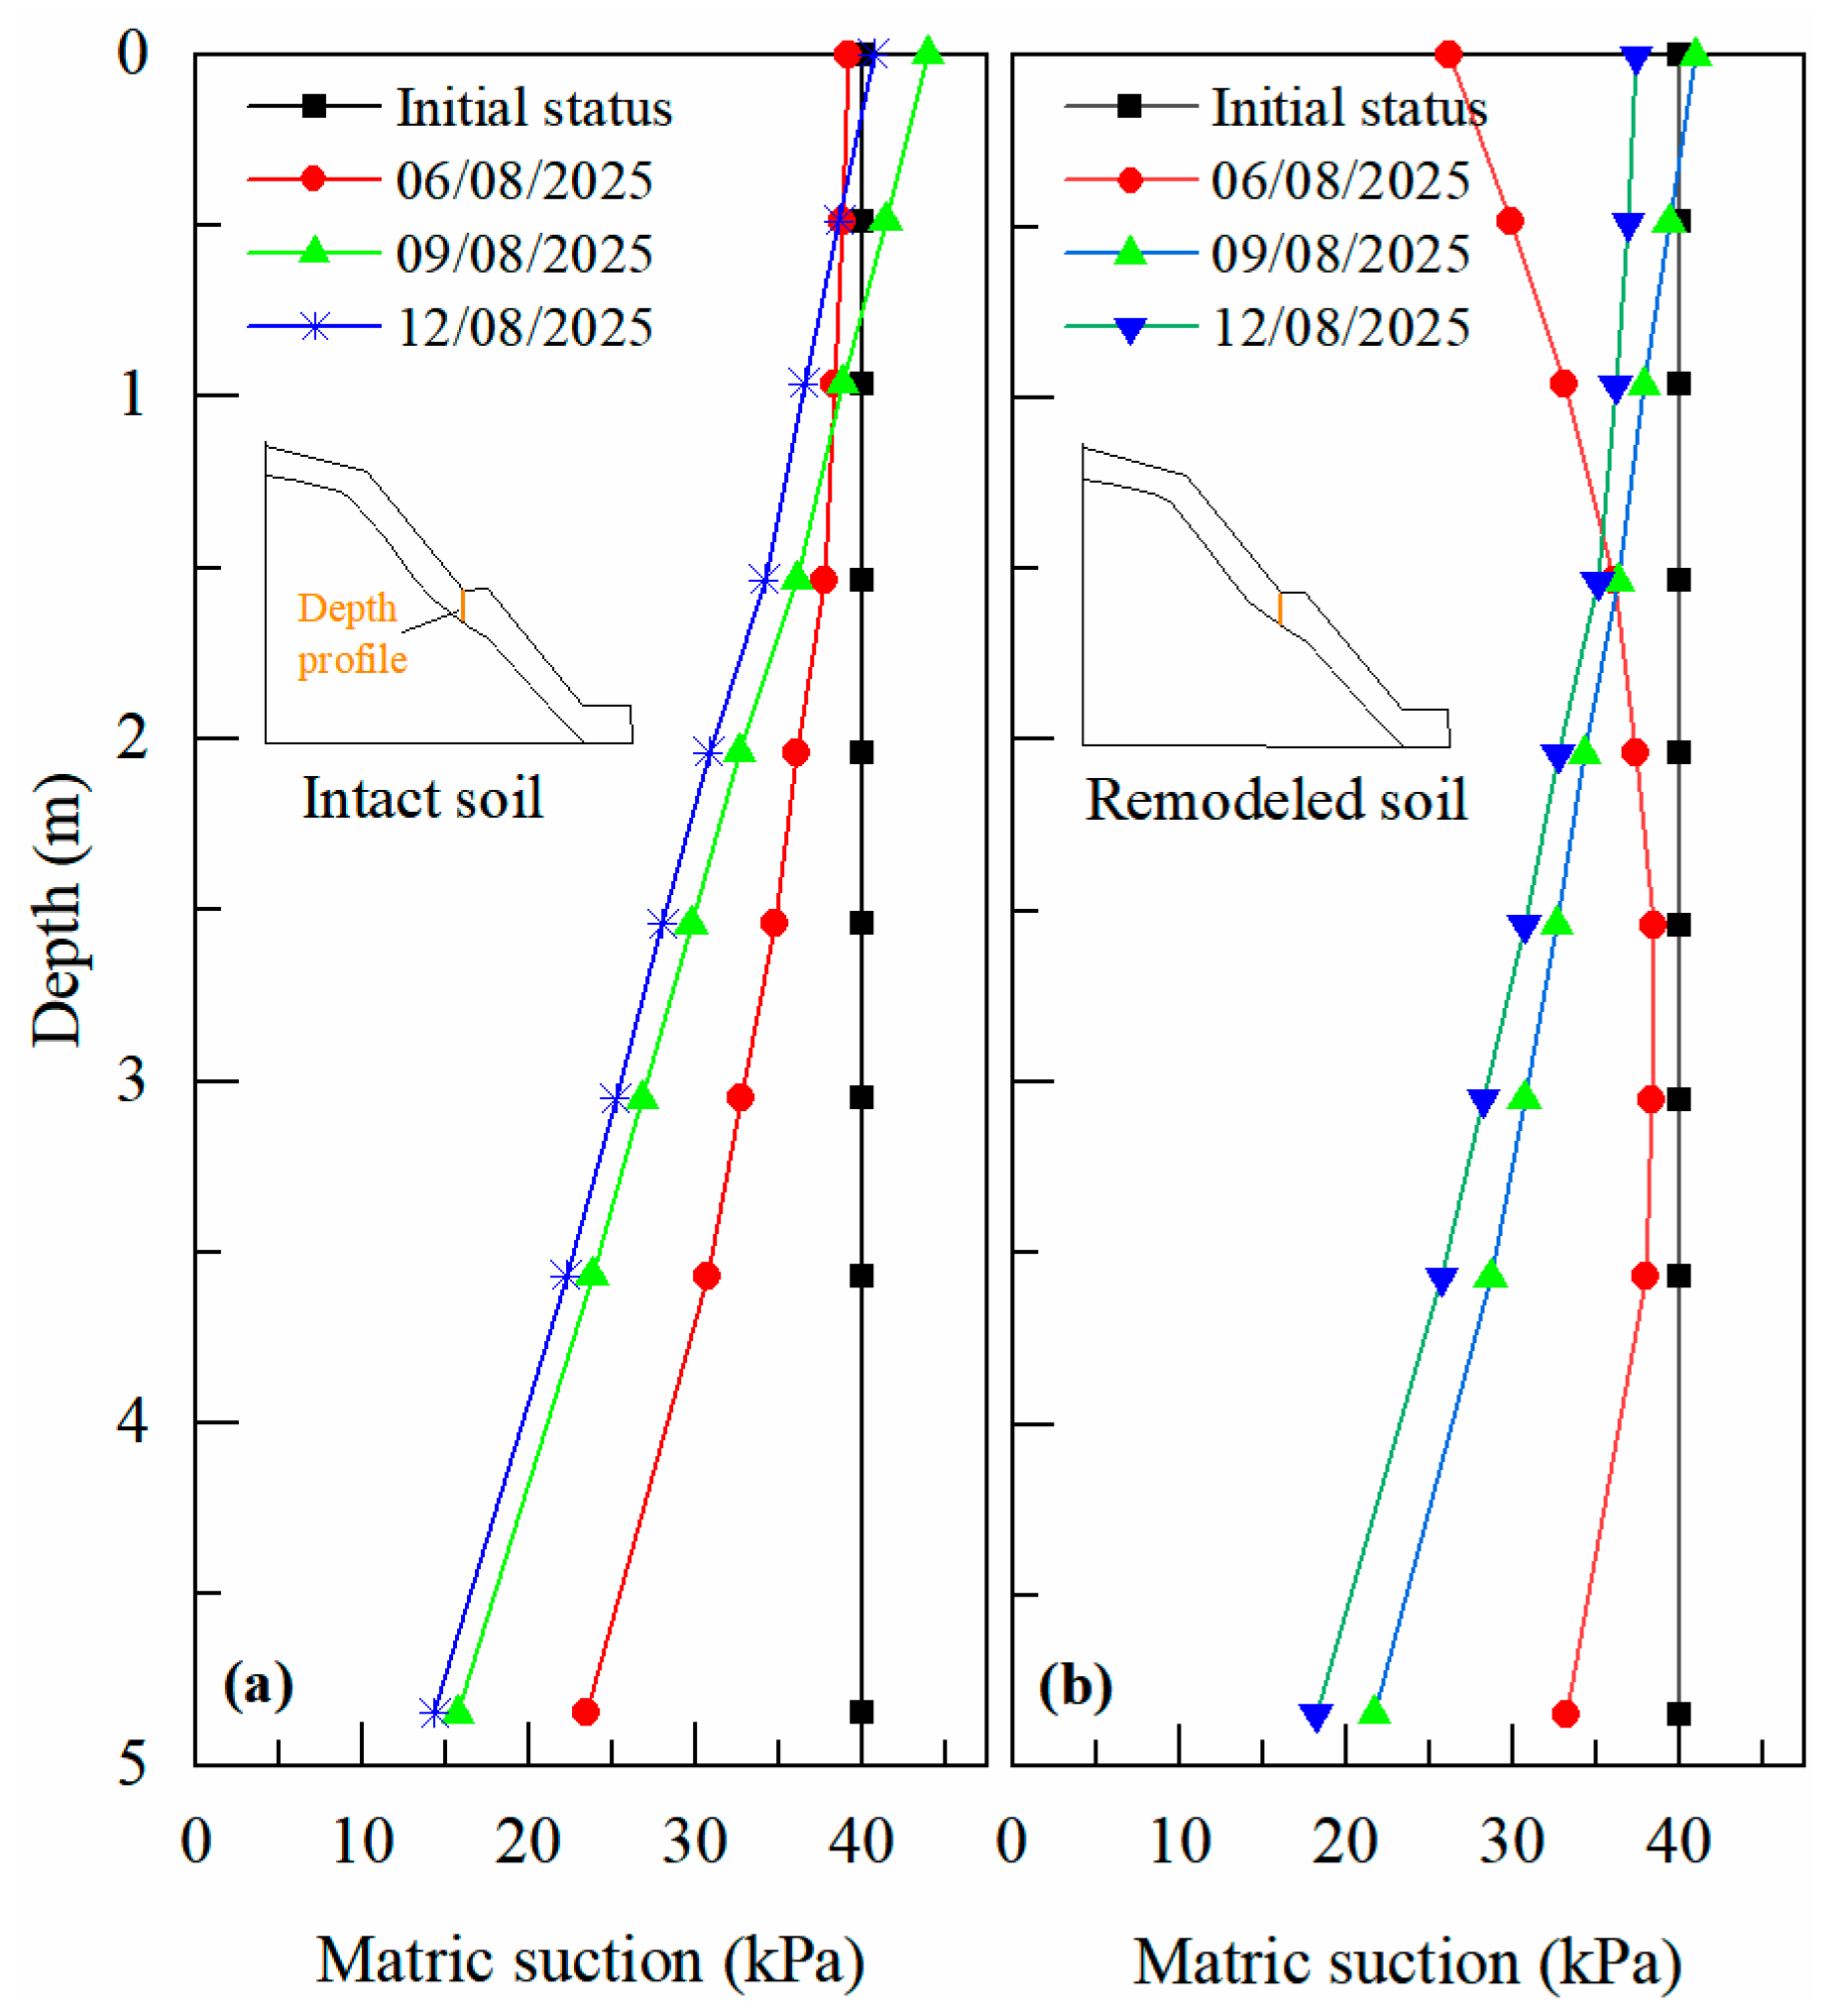
Figure 7 illustrates the dynamic evolution of pore water pressure within the red clay slope under rainfall conditions. Compared to the intact soil (Ks = 5.63 × 10⁻⁶ m/s), the remolded soil (Ks = 1.20 × 10⁻⁶ m/s) exhibits a approximately 4.7-fold reduction in saturated hydraulic conductivity due to the destruction of its soil structure and the disappearance of preferential flow paths. This difference in permeability significantly influences the distribution and evolution of pore water pressure within the slope. Additionally, Figure 8 provides quantitative data on the depth-matric suction profiles in the mid-slope for both intact and remolded soil, further elucidating their contrasting hydrological responses. Initially, both soil types exhibit negative pore water pressures, indicating unsaturated conditions. As rainfall progresses, the wetting front advances more slowly in the remolded soil. During the first rainfall event on 6 August 2025, the wetting front in the remolded soil reached only 1.5 m depth, whereas in the intact soil, it had already penetrated to the soil-rock interface. By 12 August 2025, an extensive region of near-saturated conditions with high pore water pressure developed within the remolded soil slope. In contrast, the higher permeability of the intact soil allowed moisture to migrate downward more rapidly, thereby alleviating pore water pressure buildup in shallow layers. However, higher pore water pressures were observed near the soil-rock interface in the intact soil.
Figure 7.
Cloud graphs of slope pore water pressure evolution (a1–a3,b1–b3).
Figure 8.
Depth-matric suction profile in the mid-slope of the intact and remodeled soil. (a) Intact soil slope; (b) Remodeled soil slope.
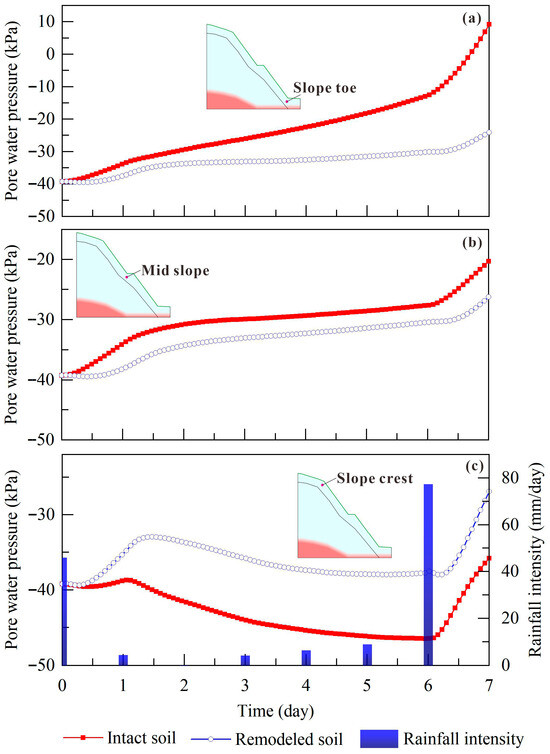
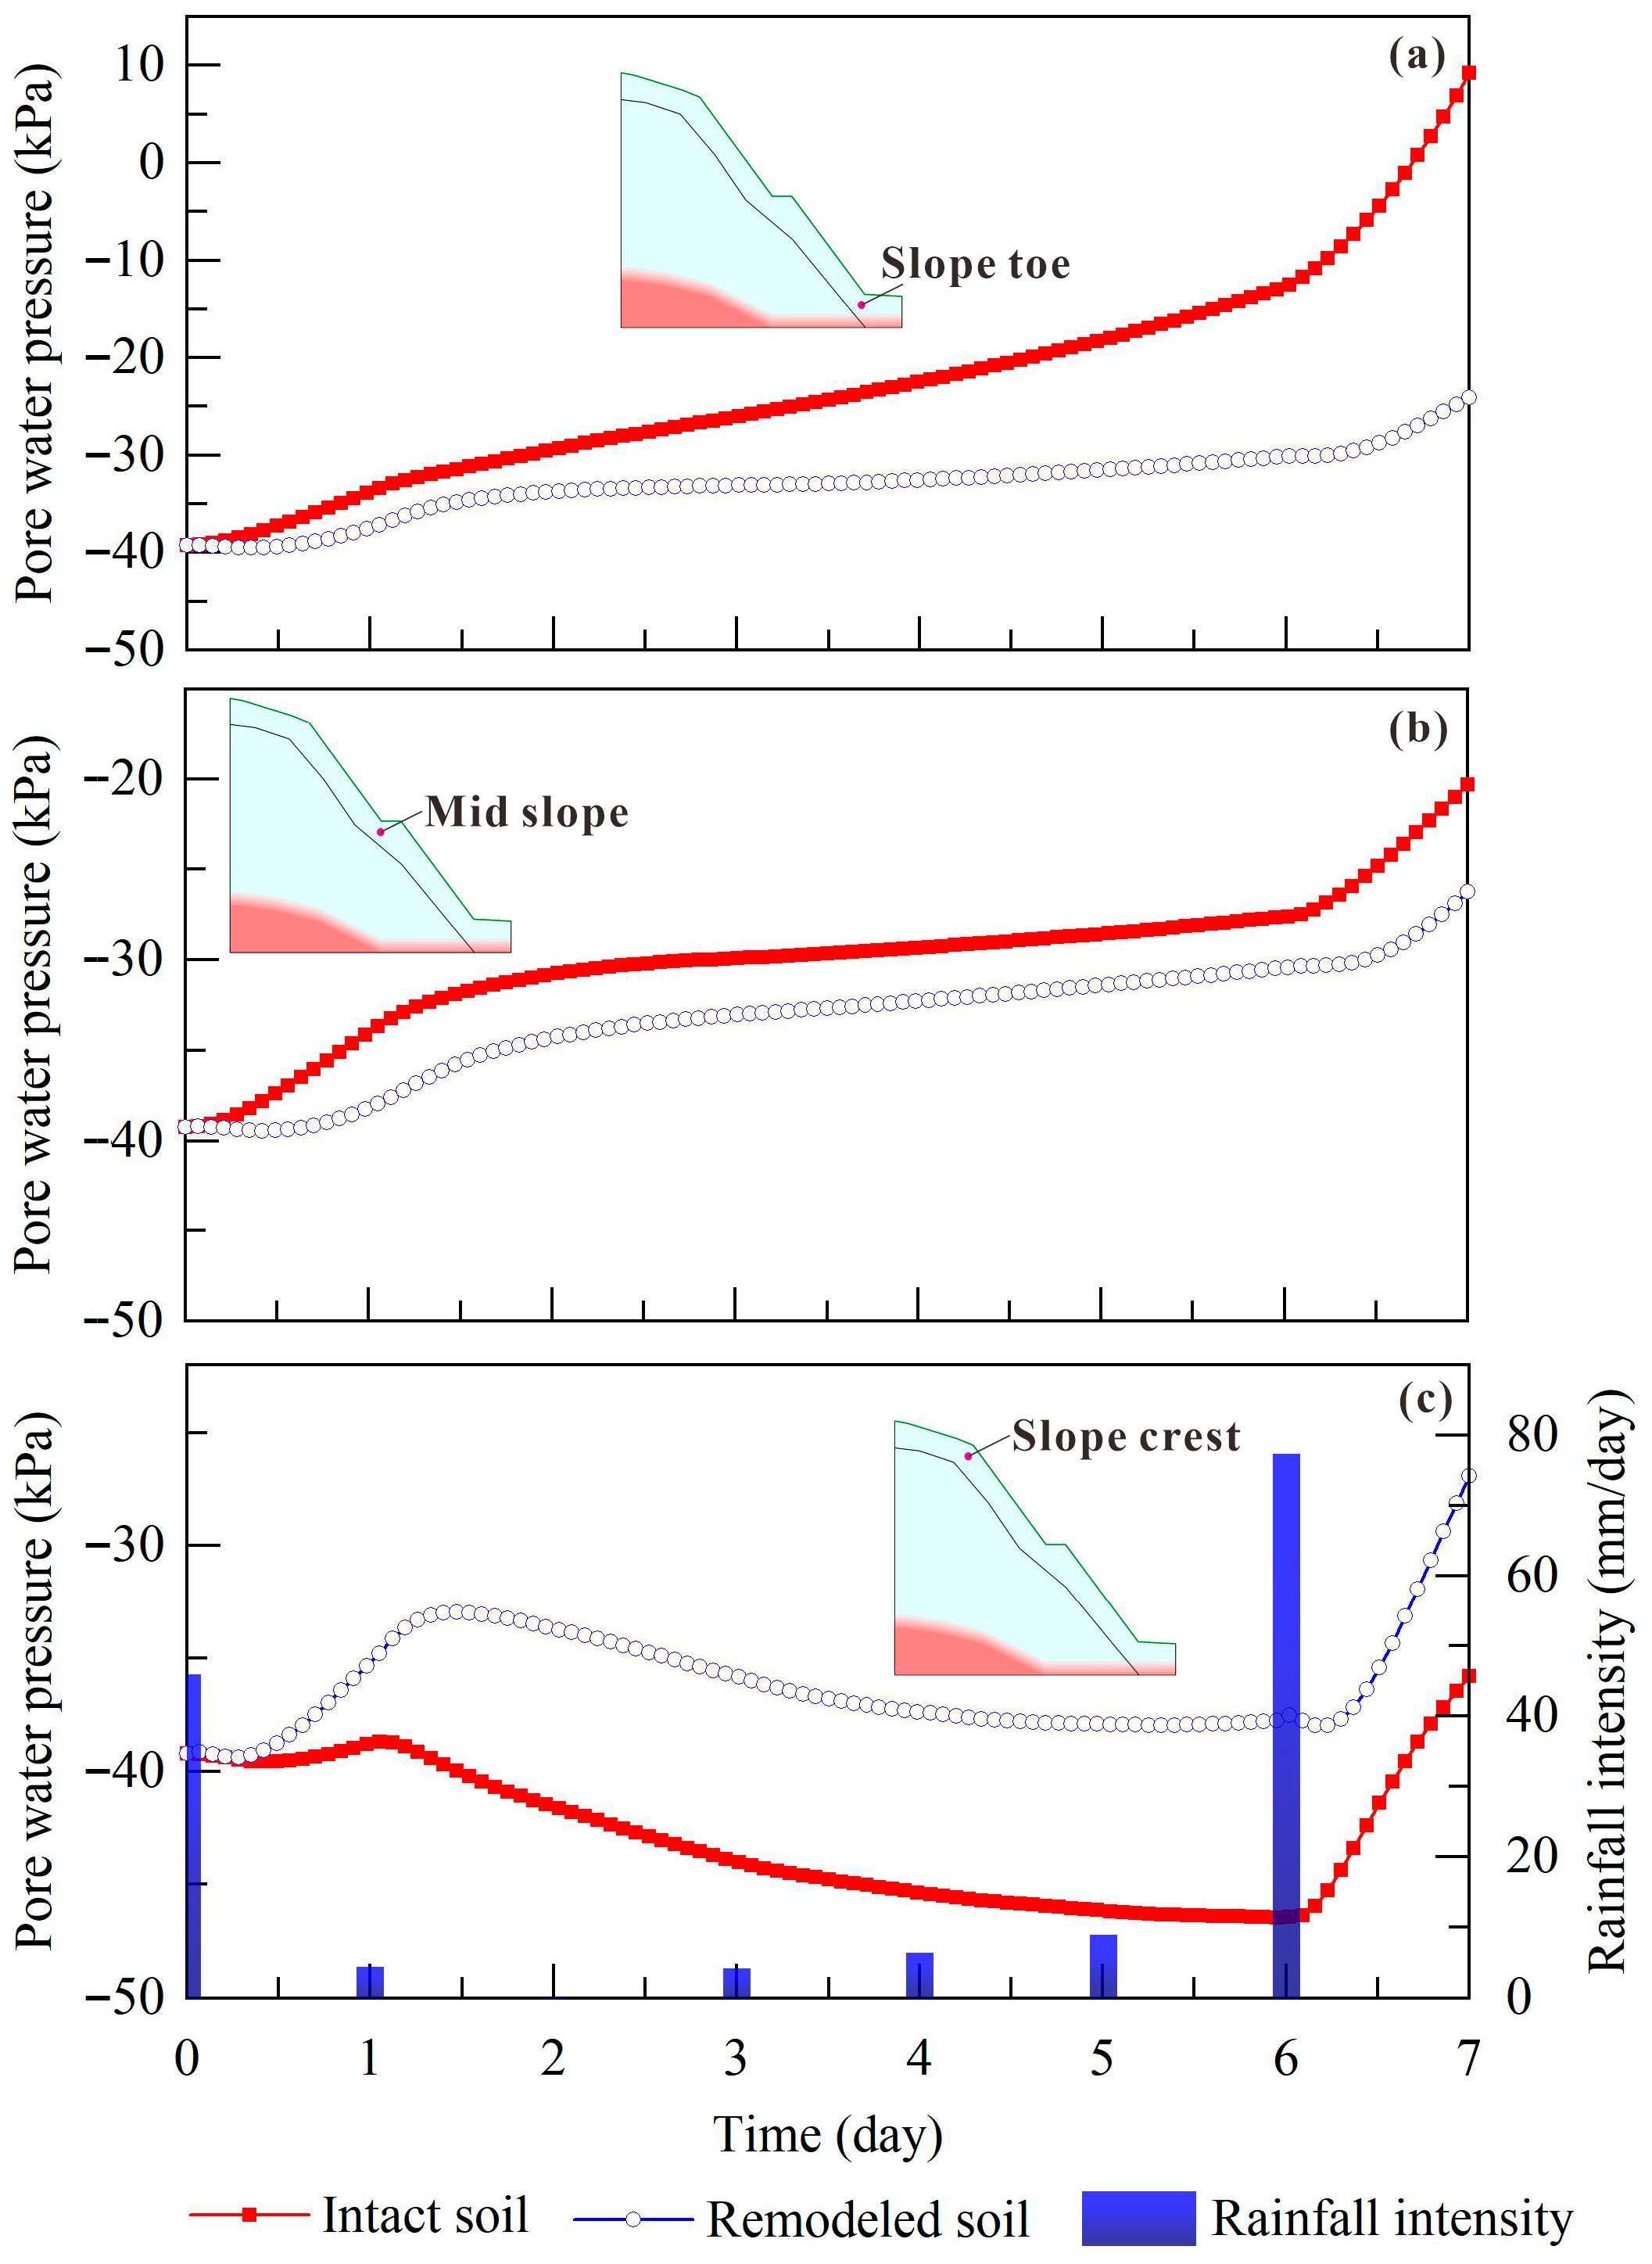
Furthermore, Figure 9 compares the temporal variations in pore water pressure (pore water pressure) at three key locations (slope toe, mid-slope and slope crest) at a depth of 1.5 m below the surface. Overall, the intact soil slope exhibits a more rapid and pronounced response to rainfall, whereas the remolded soil slope shows significantly delayed and attenuated reactions. This discrepancy stems from their 4.7-fold difference in saturated hydraulic conductivity. Owing to its higher permeability, the slope toe of intact soil, serving as a convergence zone for subsurface lateral flow, experienced a pore water pressure increase of nearly 50 kPa after rainfall, indicating the formation of a transient saturated zone. In contrast, although the pore water pressure at the slope toe of remolded soil also increased, both the magnitude and rate of change were considerably lower than those in the intact soil. The final pressure remained at a relatively high negative value (approximately −20 kPa), suggesting limited infiltration capacity, with most rainfall likely converting into surface runoff or lateral interflow. The mid-slope region exhibited pore water pressure responses similar to those at the toe in both soil types, though the difference between intact and remolded soils was less pronounced. This can be attributed to the high permeability of the intact soil, which prevents significant water retention at this position, as moisture continues to drain toward the toe, thereby reducing the disparity in pore water pressure between the two materials. The pore water pressure variation at the slope crest further supports these observations. On one hand, the high permeability of the intact soil facilitates rapid drainage of rainwater toward the toe. On the other hand, limited recharge from subsurface lateral flow in the overlying soil layer results in consistently lower pore water pressure in the intact soil compared to the remolded soil throughout the rainfall period.
Figure 9.
Variation curves of pore water pressure at different slope positions. (a) Slope toe; (b) Mid slope; (c) Slope crest.
4.2. Slope Deformation and Stability
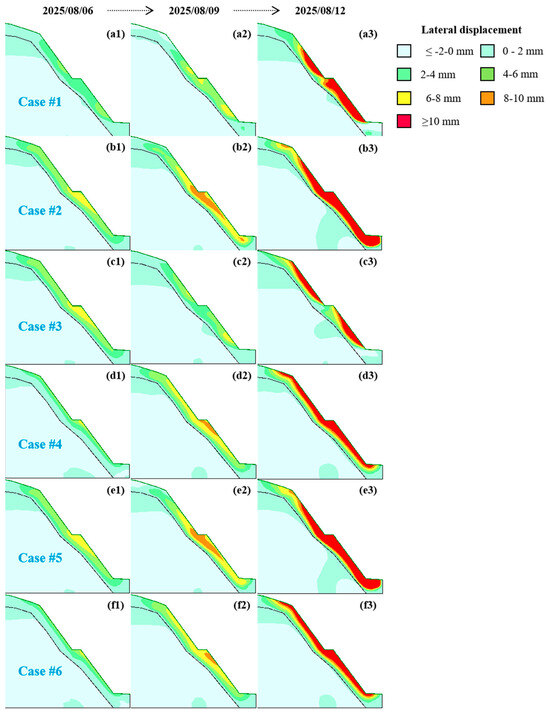
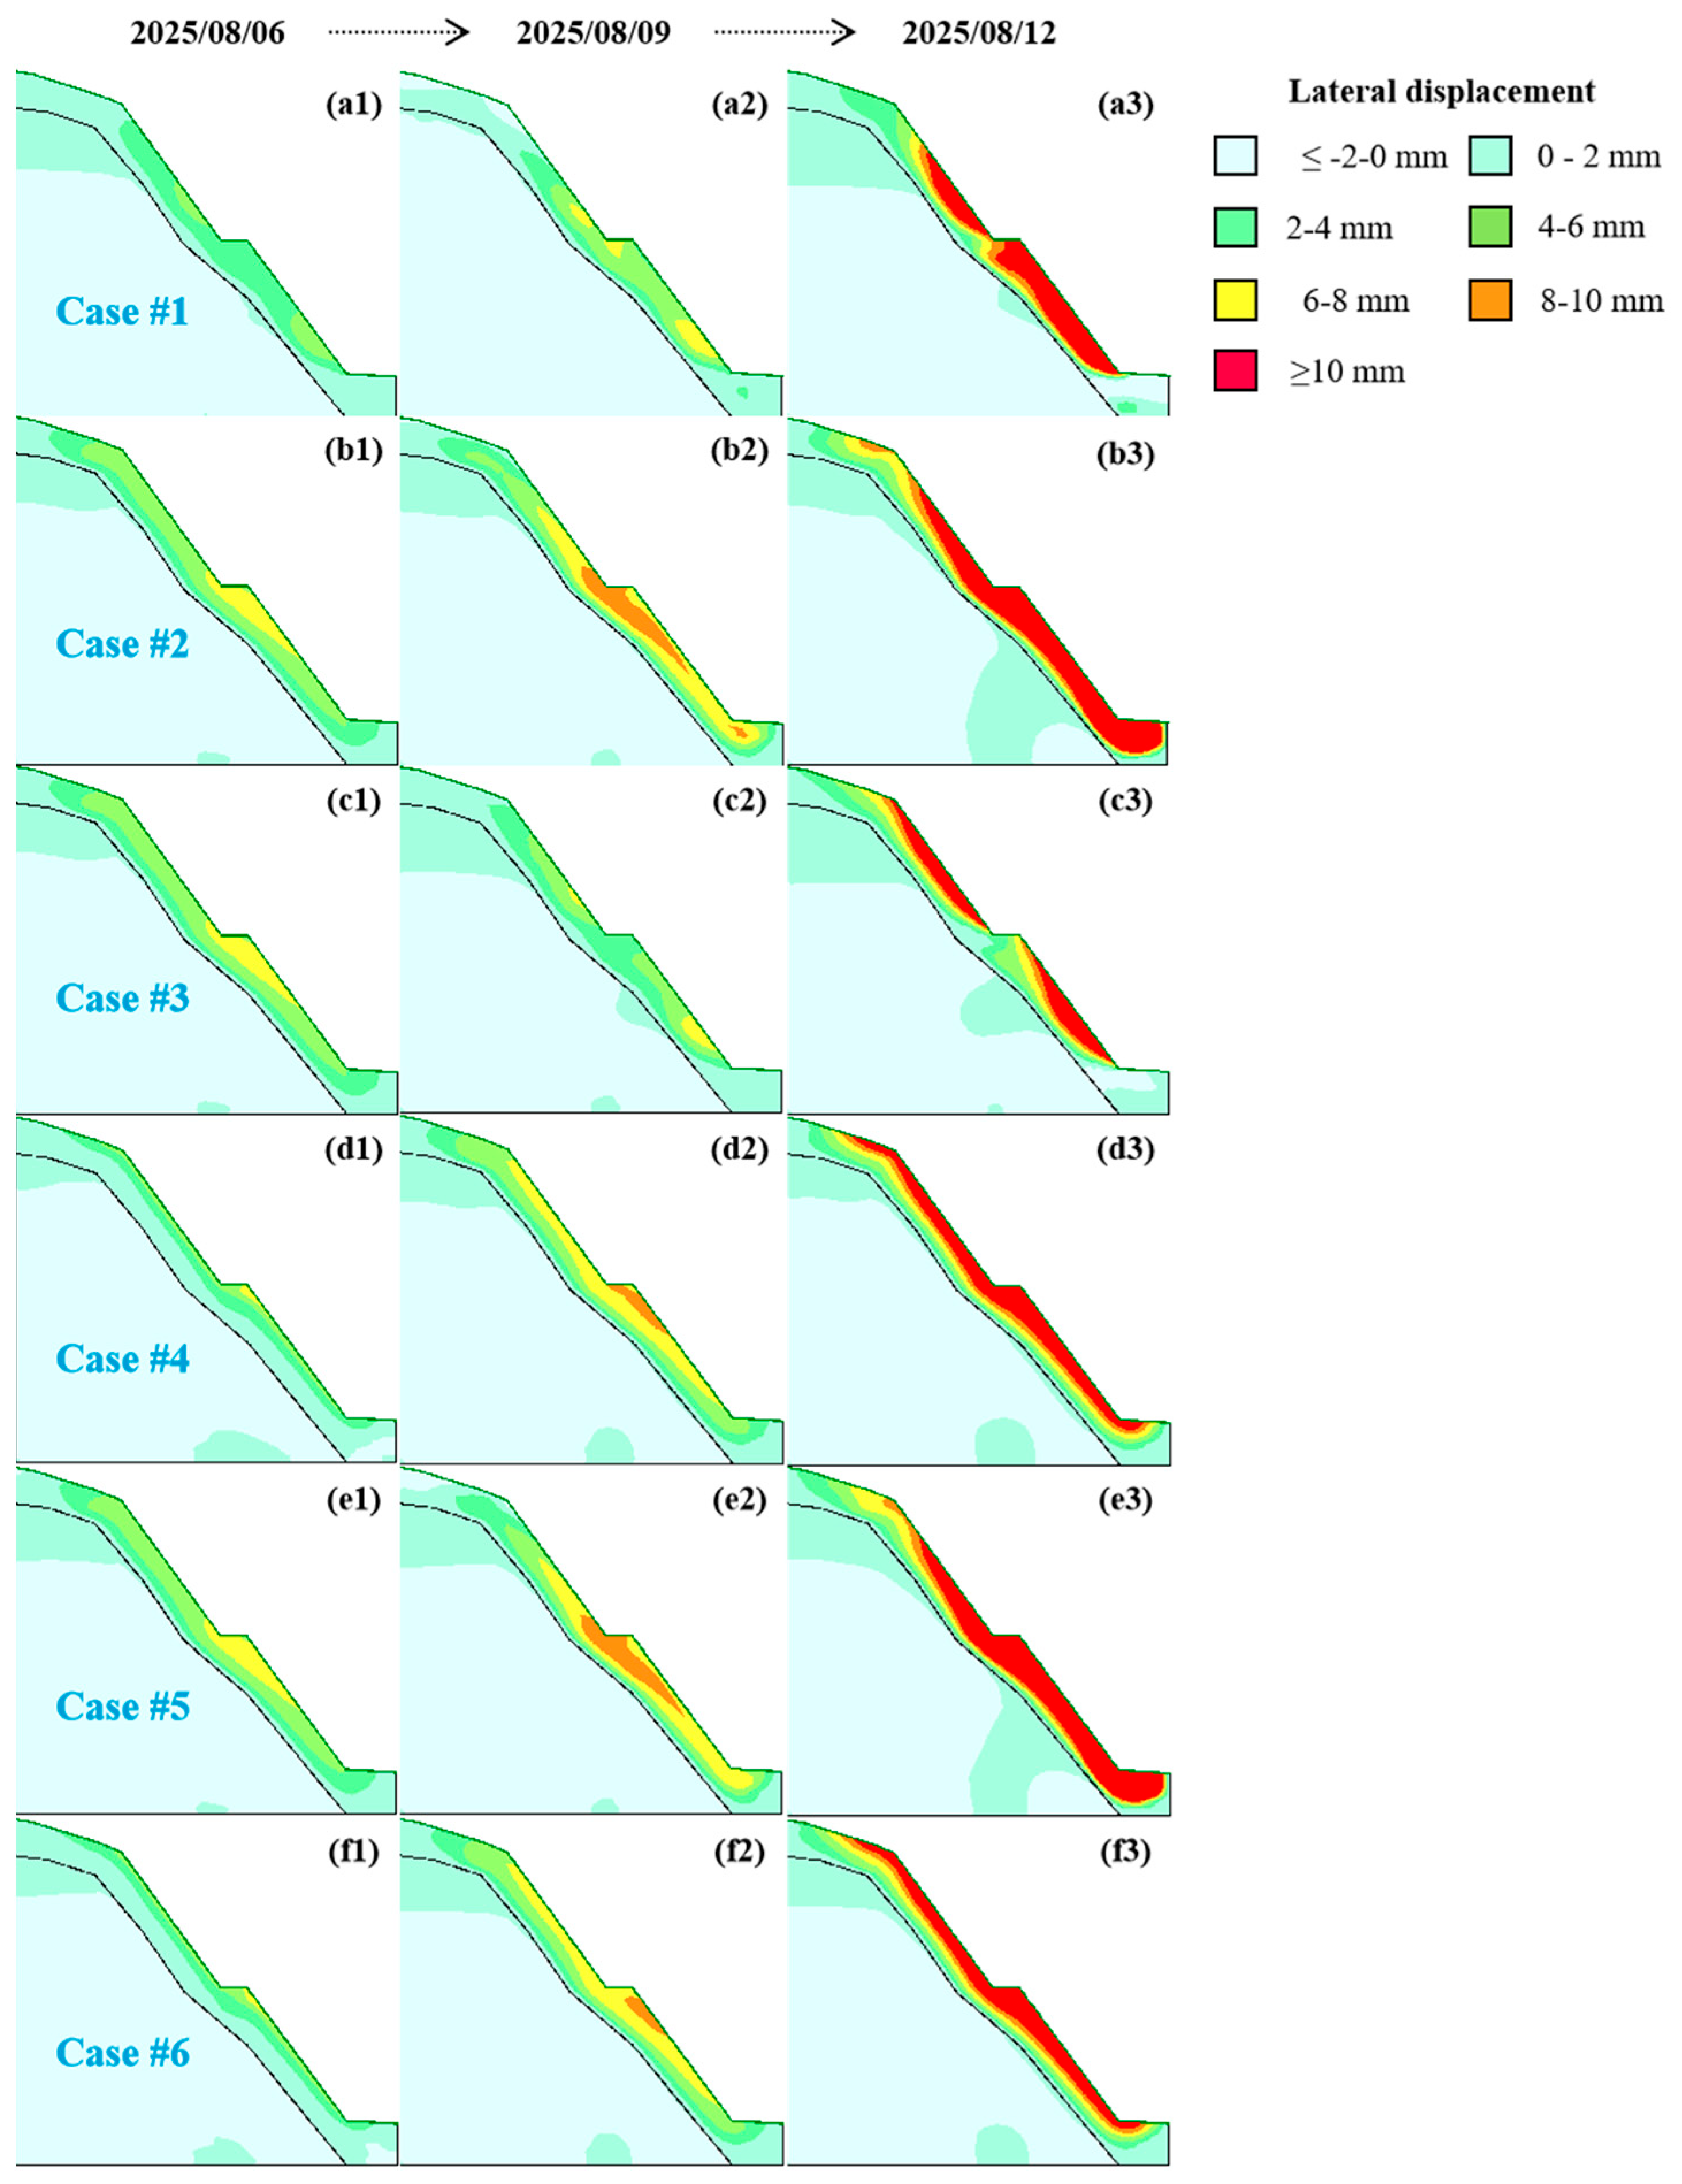
Figure 10 presents the spatiotemporal evolution of lateral displacement within the slope under six different scenarios. Cases #1, #2 and #5 represent simulations using the hydraulic conductivity of the intact soil combined with the natural strength of the intact soil, the strength of the remolded soil and the post-saturation strength, respectively. Cases #3, #4, and #6 correspond to simulations using the hydraulic conductivity of the remolded soil with the same three strength parameters. Overall, slope deformation initiates in shallow layers and progressively develops toward deeper zones. Significant deformation begins near the mid-slope bench and gradually extends toward both the slope crest and toe. The intense rainfall event of 77 mm/day on August 12 markedly accelerated overall deformation, resulting in extensive areas of pronounced displacement.
Figure 10.
Cloud graphs of lateral displacement under different cases. (a1–a3) Case #1; (b1–b3) Case #2; (c1–c3) Case #3; (d1–d3) Case #4; (e1–e3) Case #5; (f1–f3) Case #6.
Notable differences in the magnitude and depth of deformation were observed among the cases. Under identical strength parameters, the high permeability of the intact soil in Cases #1, #2 and #5 facilitated deeper water migration toward the toe, triggering soil softening within a certain depth at the middle-lower part of the slope toe. Consequently, these cases exhibited more localized and deeper deformation zones compared to Cases #3, #4 and #6, where deformation was predominantly concentrated in shallow layers. This observation aligns with the pore water pressure distribution patterns described in Section 4.1. Under the same permeability conditions, as the soil structure degraded and shear strength diminished, the deformed zone in Cases #2 and #5 progressively expanded upward, forming interconnected areas of significant deformation. The final area of pronounced deformation in these cases was 1.5 times larger than that in Case #1. However, the difference between Case #2 and Case #5 was relatively small. Considering their strength parameters, it can be inferred that the deformation of the red clay slope is more sensitive to changes in the internal friction angle than to cohesion. When the cohesion decreases due to saturation, there appears to be a cohesion threshold below which its influence on slope deformation diminishes significantly. Furthermore, the comparative results suggest that while high permeability may exacerbate local deformation depth, the loss of soil strength remains the fundamental trigger for large-scale shallow sliding.
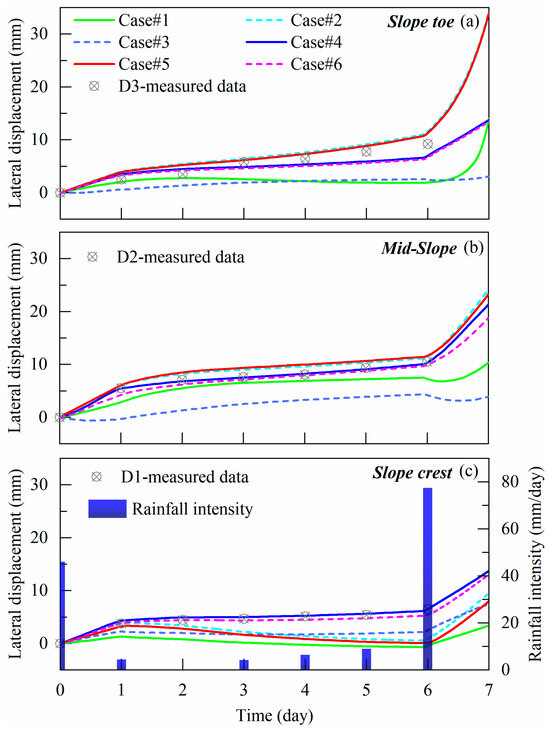
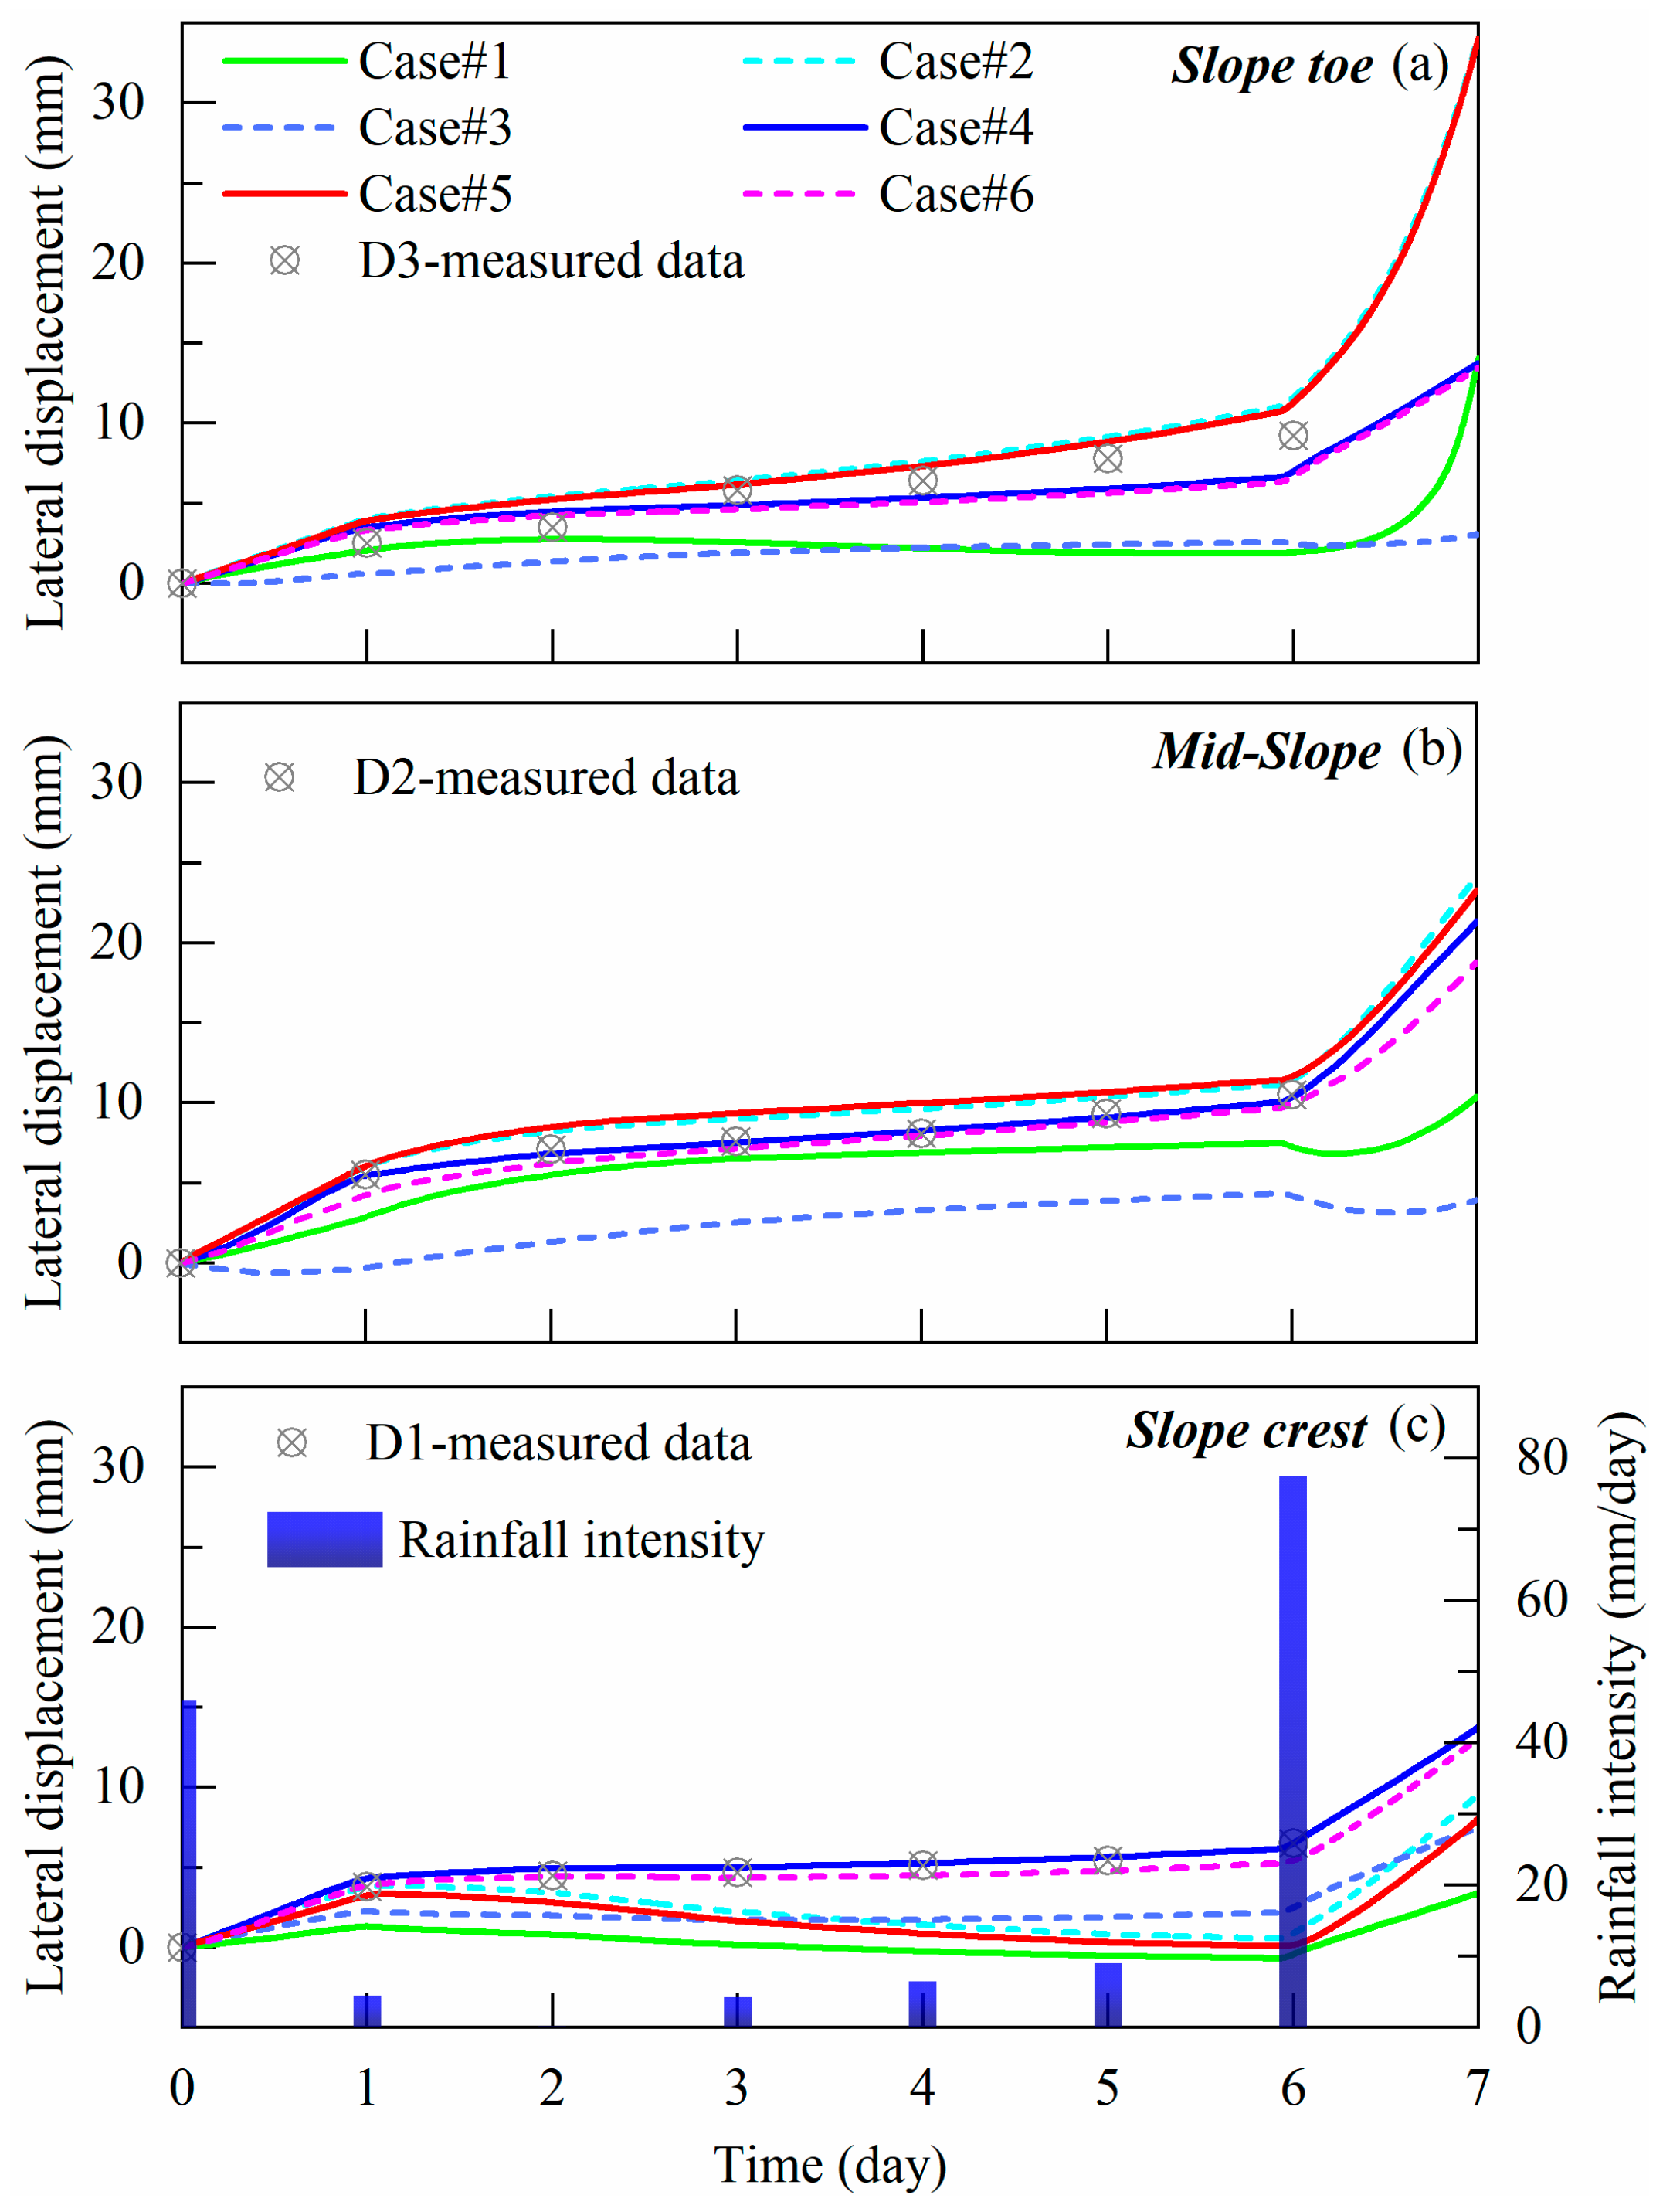
Figure 11 further compares the field-measured and simulated lateral displacements at three critical surface locations: the slope toe, mid-slope and slope crest. All cases exhibited a clear step-like increase in displacement in response to the 77 mm/day rainfall event on August 12. Deformation was most pronounced at the slope toe and progressively developed toward the crest, demonstrating a typical progressive failure mechanism. The simulated curves showed good agreement with the measured data in terms of variation trends, confirming the model’s effectiveness in capturing the deformation behavior of the red clay slope under rainfall conditions. A quantitative goodness-of-fit analysis further substantiates this agreement, with key metrics summarized in Table 3. The results indicate that the model accuracy is spatially dependent, showing excellent performance at the slope toe (D3) and mid-slope (D2) for specific parameter sets. In particular, Cases #2 and #6 yielded the closest displacement magnitudes to the monitoring data (e.g., at D3, Case #2 RMSE = 1.529 mm, R = 0.984; Case #6 RMSE = 1.453 mm, R = 0.952), indicating that strength degradation due to water-induced softening of the soil structure was a major factor contributing to deformation and instability during this rainfall event. The slightly higher discrepancies observed at the slope crest (D1) are likely attributable to the complex boundary conditions and greater sensitivity to parameter selection in this region.
Figure 11.
Variation in simulated and measured lateral displacement at different slope positions (a) Slope toe; (b) Mid-slope; (c) Slope crest.
Table 3.
Goodness-of-fit metrics between simulated and monitored lateral displacements.
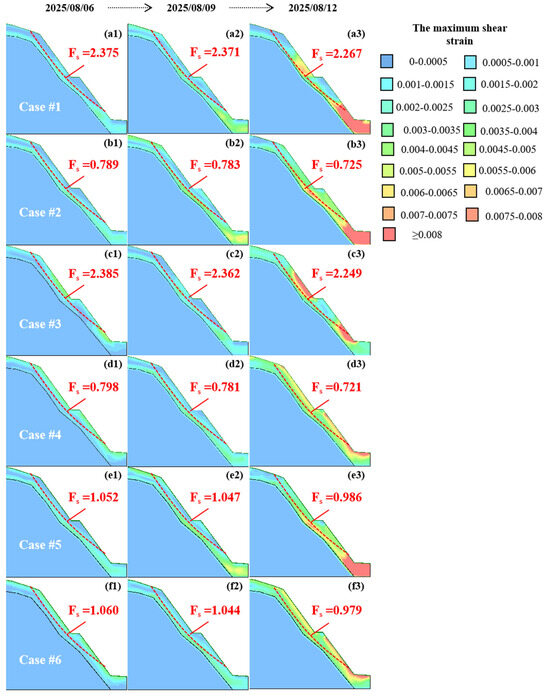
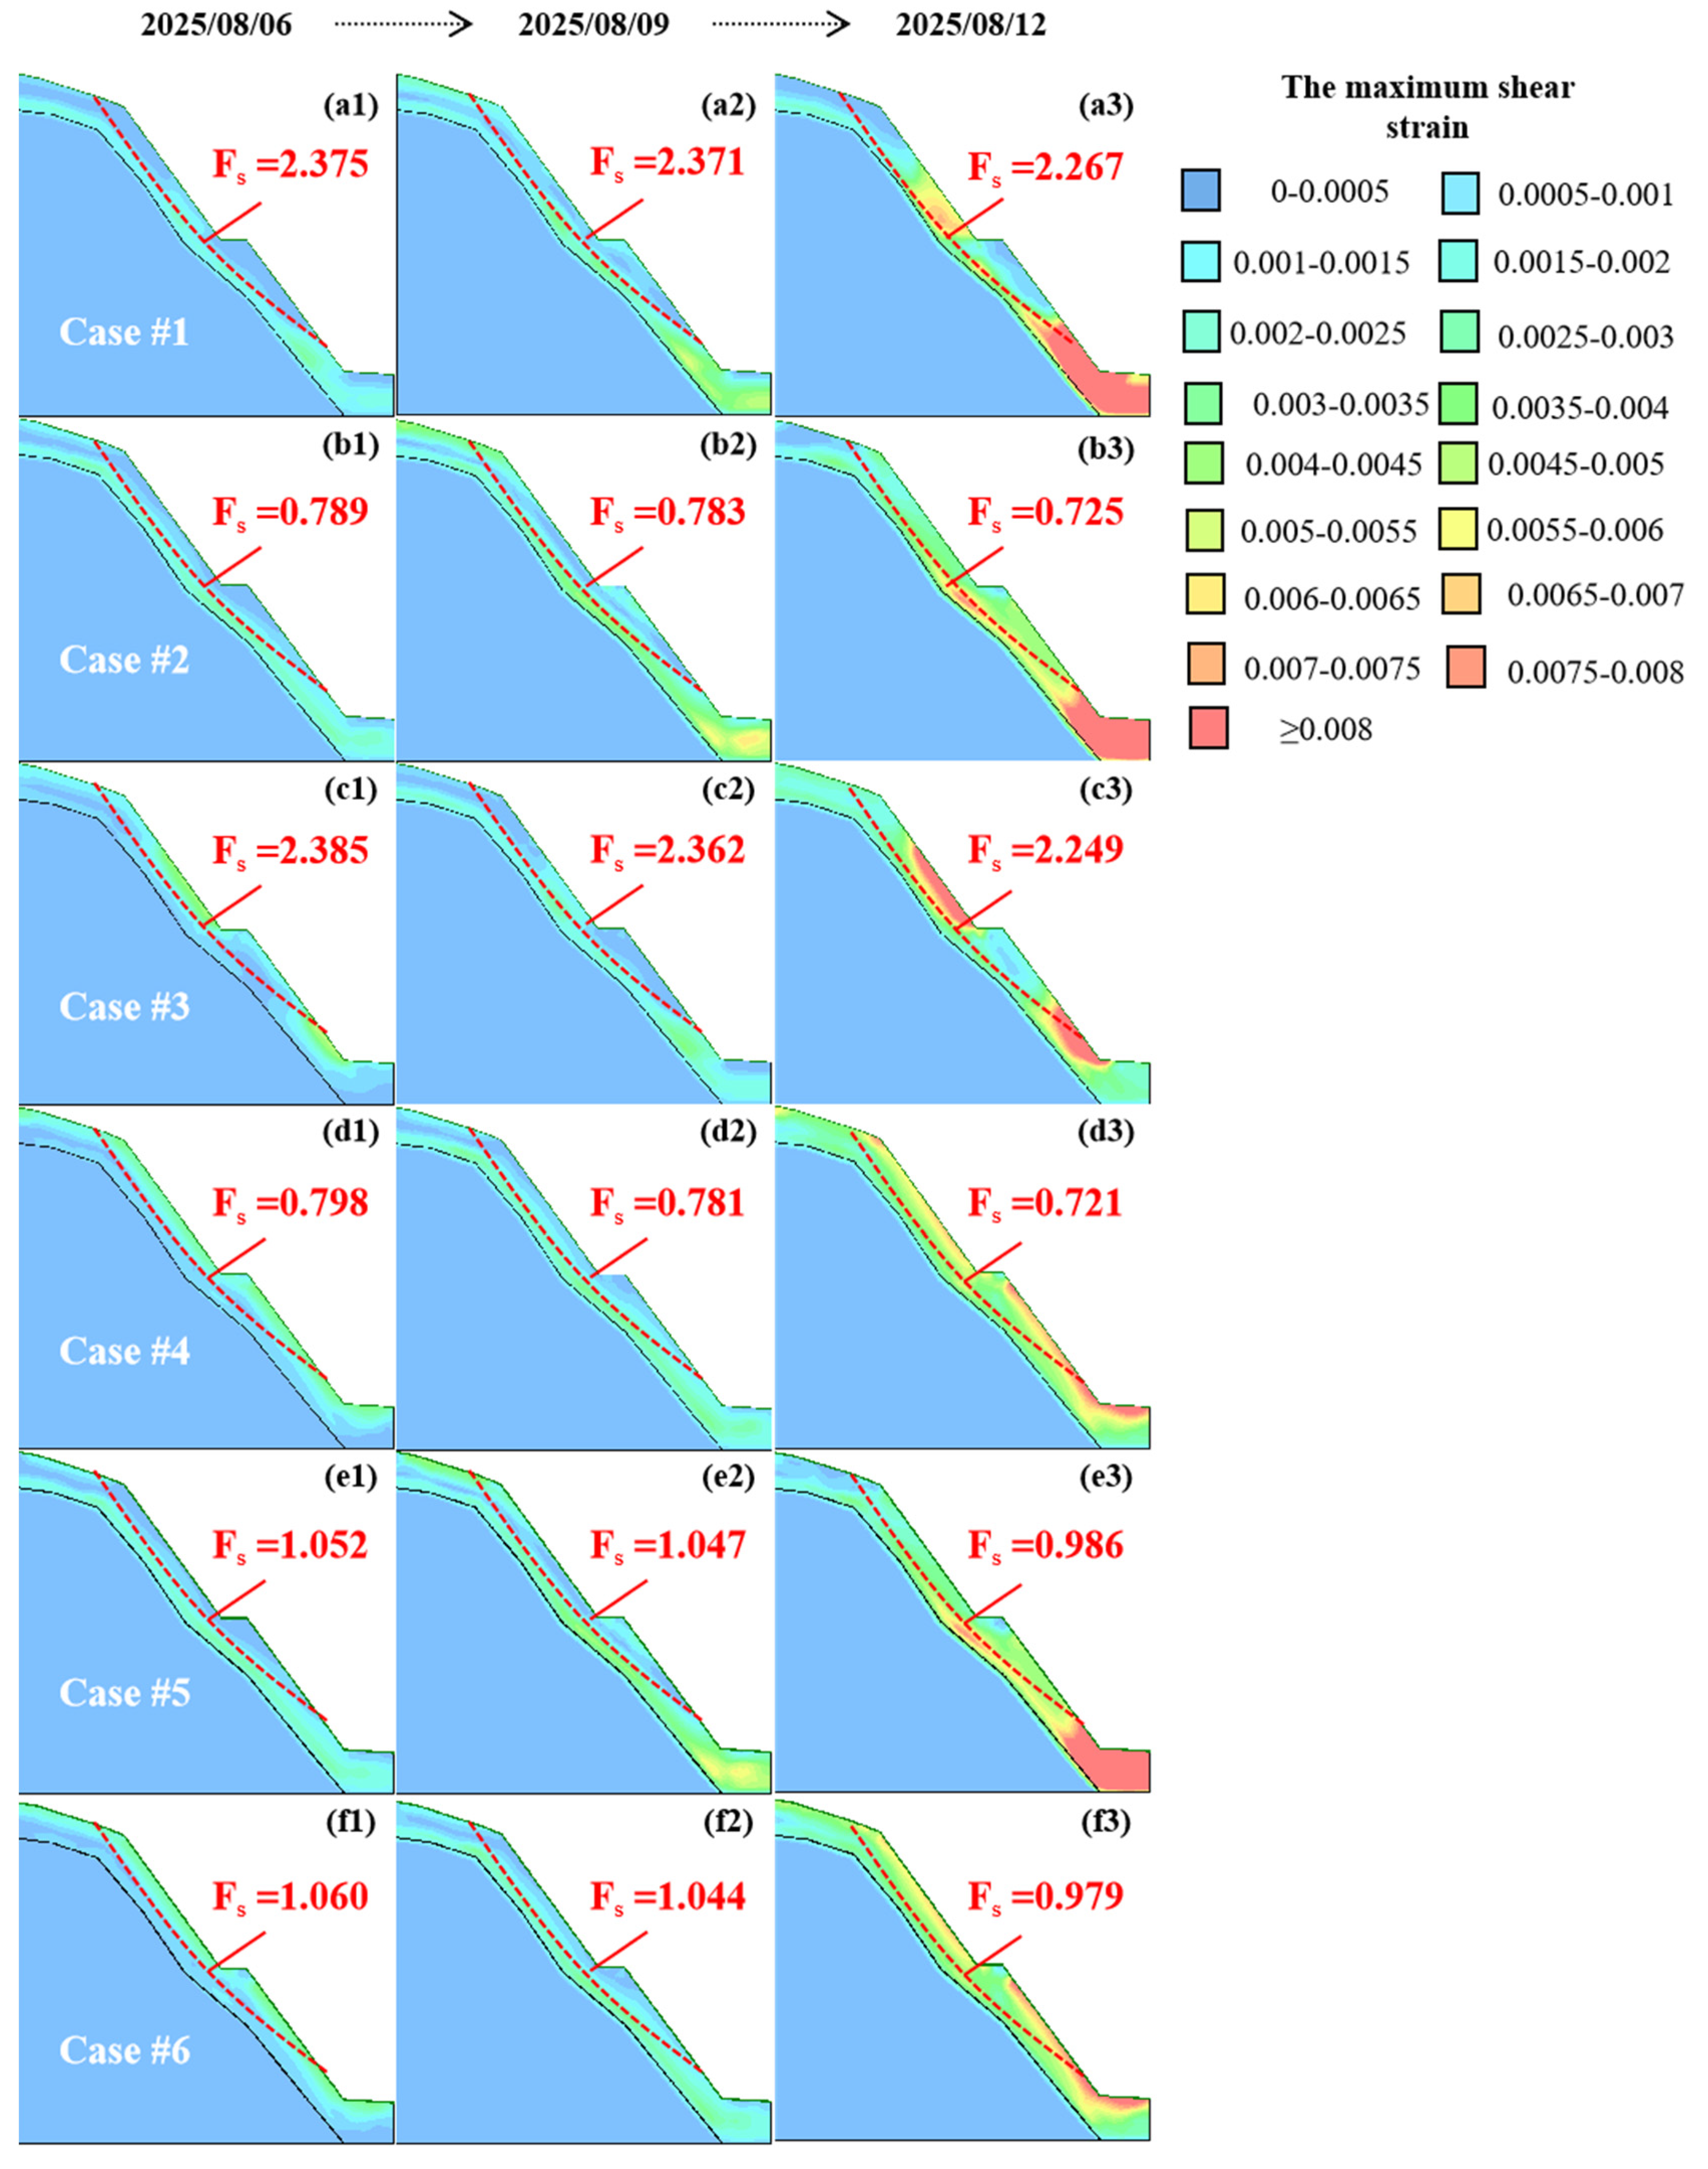
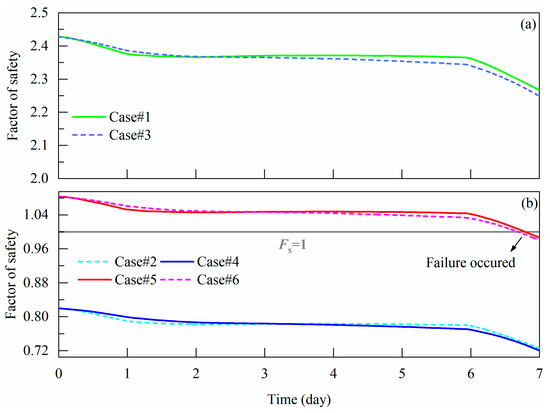
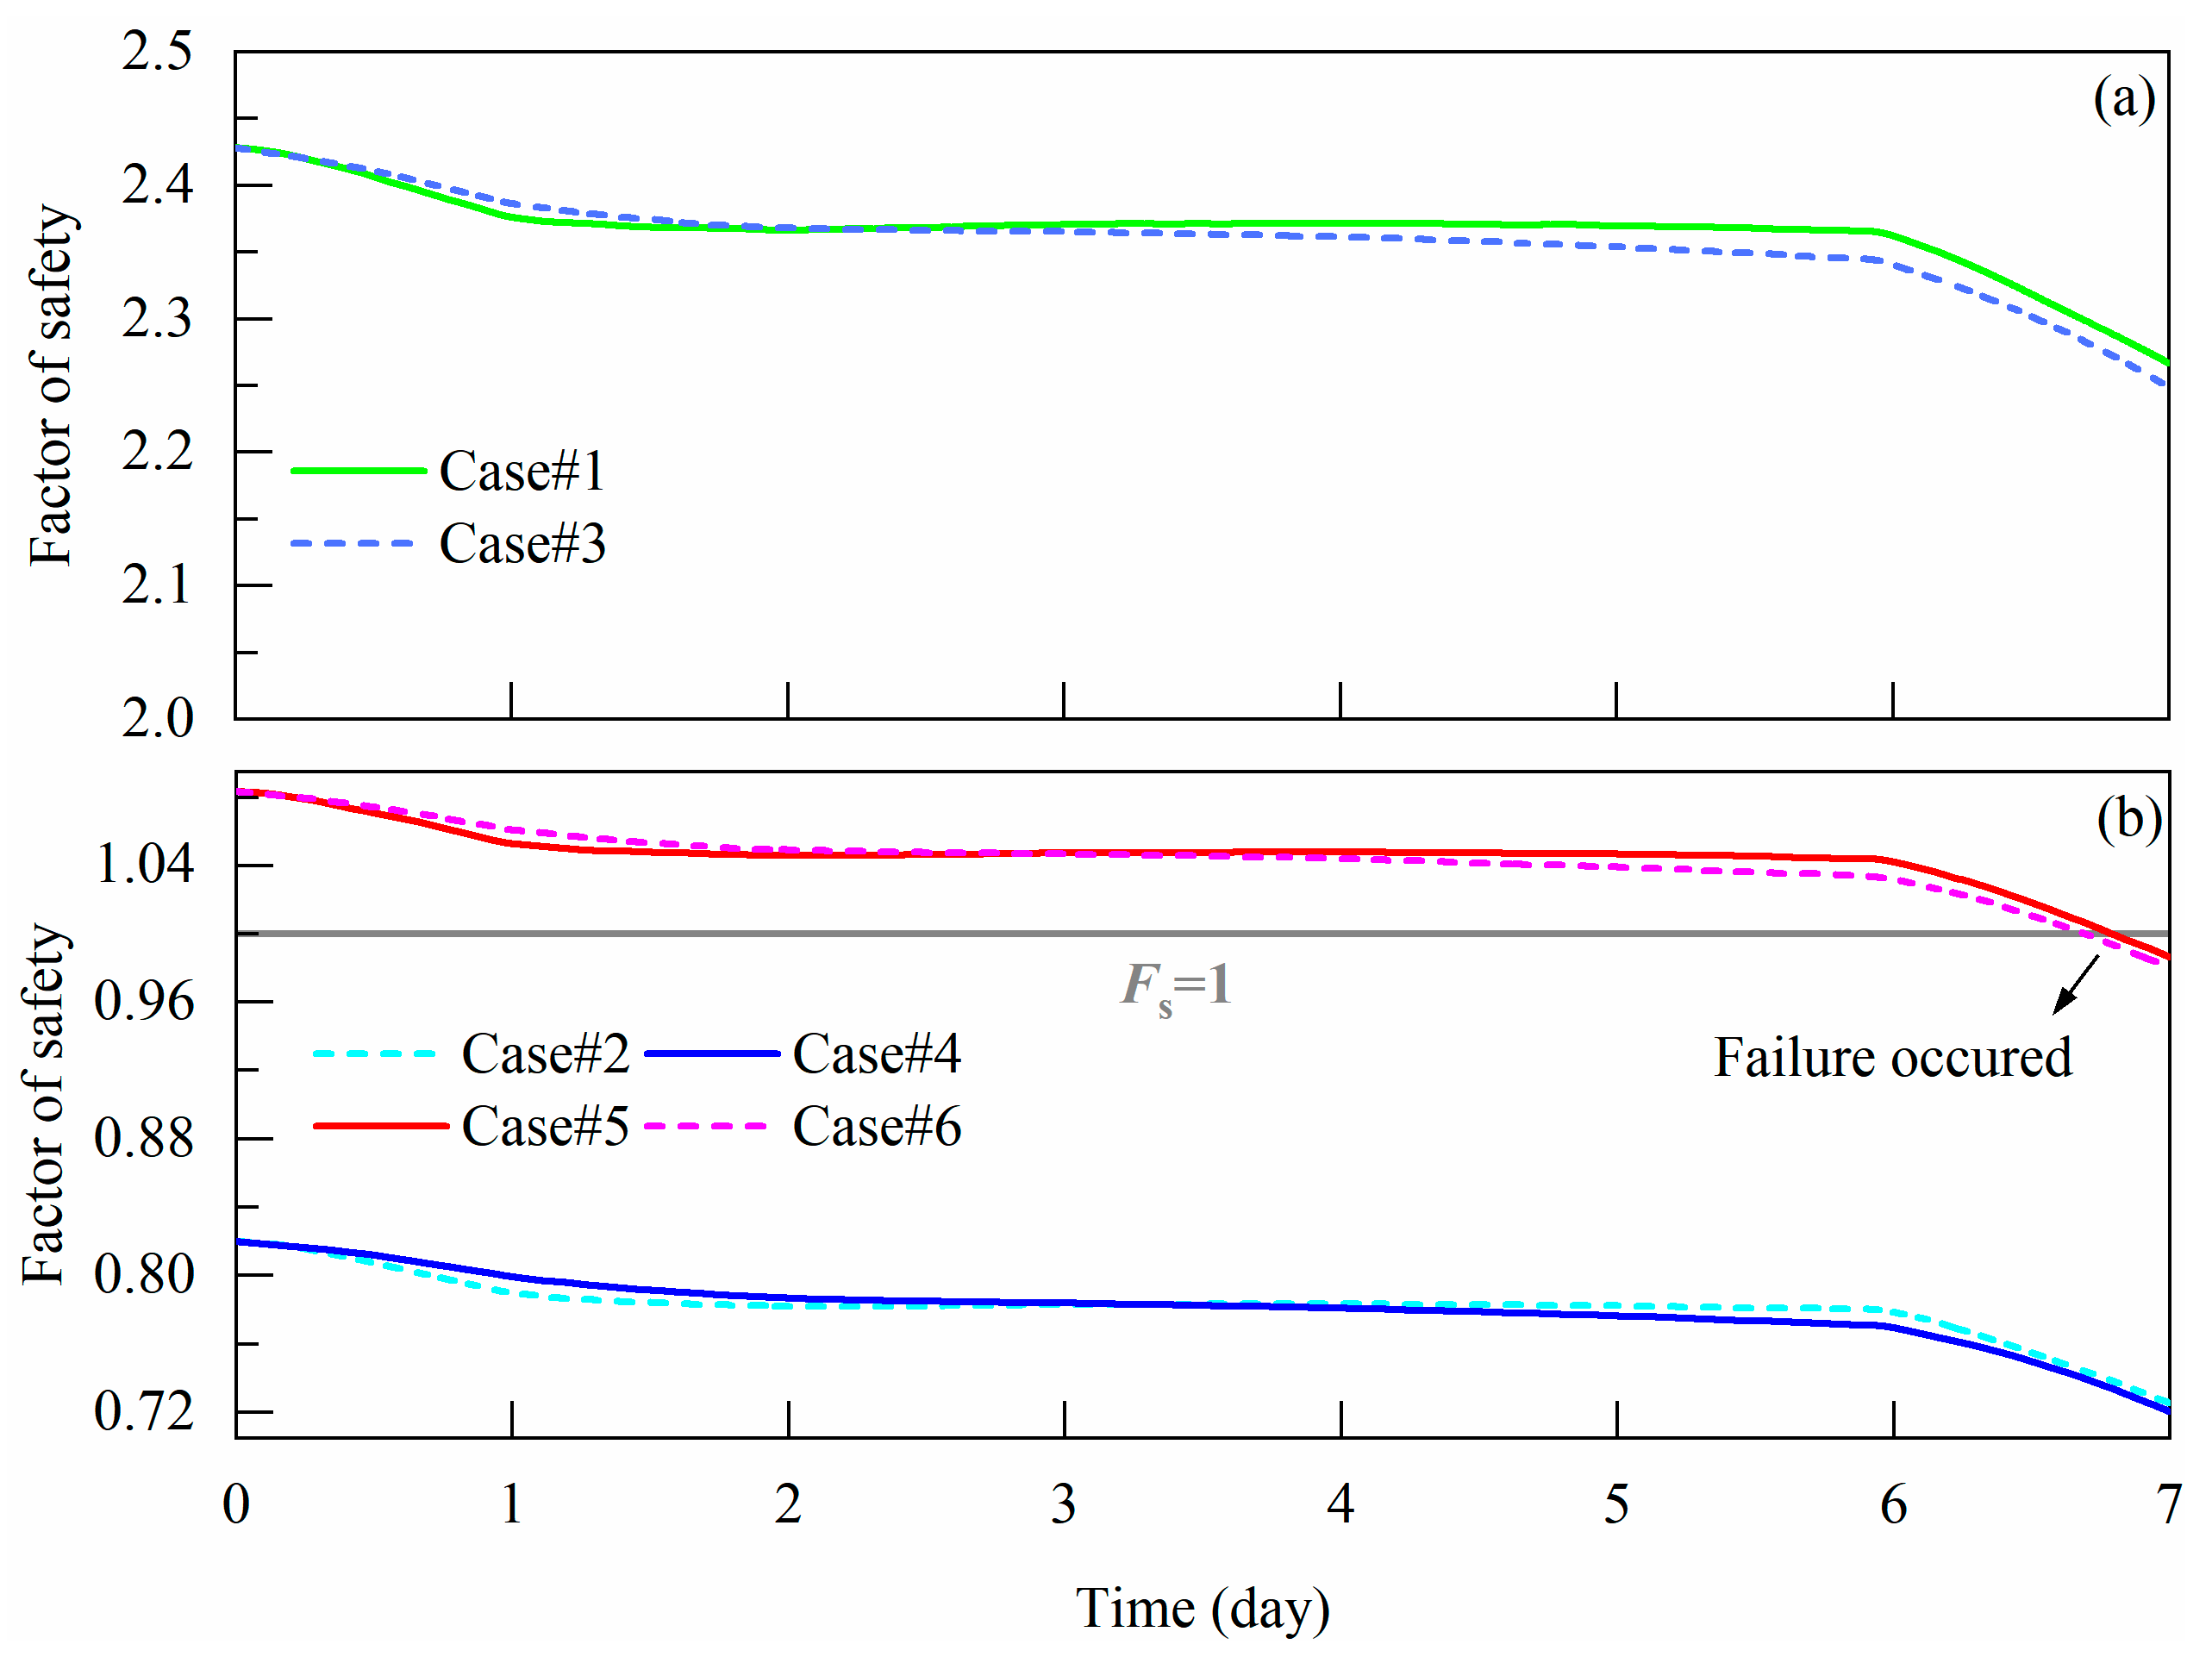
Figure 12 illustrates the spatiotemporal distribution of the maximum shear strain within the slope under six different scenarios, along with the corresponding factor of safety (Fs) for the actual slip surface. Overall, the distribution pattern of the maximum shear strain is consistent with that previously observed in the displacement contour plots. Fs of the slip surface is primarily governed by the strength parameters, with permeability exerting a comparatively minor influence. A further examination of the time-history curves of the Fs across different cases (Figure 13) reveals a consistent decreasing trend in Fs as rainfall progresses. The most pronounced reductions occurred following the two heavy rainfall events on August 6 and August 12. This behavior is principally attributed to the increase in pore water pressure within the unsaturated soil, which reduces the effective stress and consequently diminishes the shear strength of the soil, leading to a decrease in anti-sliding force and thus a lower Fs. Consequently, the variation in the Fₛ exhibits a strong negative correlation with the changes in pore water pressure described earlier. This result underscores that changes in pore water pressure in unsaturated soils are a critical indicator of slope stability.
Figure 12.
Cloud graphs of the maximum shear strain under different cases (a1–a3,b1–b3,c1–c3,d1–d3,e1–e3,f1–f3).
Figure 13.
Variation in factor of safety under different cases (a,b).
Furthermore, the Fs curves also demonstrate that the Fs is predominantly controlled by the strength parameters, with permeability playing a secondary role. It is also evident that employing the strength parameters of the intact soil at its natural water content (Cases #1 and #3) leads to a significant overestimation of the Fs. Conversely, using the strength parameters of the remolded soil at its natural water content (Cases #2 and #4) results in a considerable underestimation. Only when the parameters of the intact soil under saturated conditions are applied (Cases #5 and #6) do the calculations accurately capture the slope instability observed after the rainfall event on 12 August.
Based on the aforementioned results, it can be inferred that for red clay slopes, the strength softening induced by structural degradation during rainfall is the primary cause of instability and failure. The extent of this degradation depends on the degree of saturation and the duration of saturation, and is generally less severe than that of completely remolded soil with fully destroyed structure. Therefore, it is recommended that for stability calculations of red clay slopes under rainfall conditions, the strength parameters of the intact soil in a saturated state should be prioritized for use. However, it is crucial to emphasize that this recommendation is context-dependent. The practice may be acceptable primarily for short-term stability assessment following excavation, particularly in scenarios similar to the one studied: slopes composed of structured red clay subject to short-duration, high-intensity rainfall events. Conversely, the risks of applying this approach universally must be acknowledged. For long-term stability analysis, or in slopes with effective drainage measures or markedly different geological histories, relying solely on these parameters could lead to non-conservative designs as it may not account for long-term strength reduction. Therefore, engineers should exercise caution and consider the specific geological conditions, timeframes, and potential for long-term strength loss when generalizing this recommendation.
5. Effects of Rainfall Pattern on Slope Hydrology and Stability
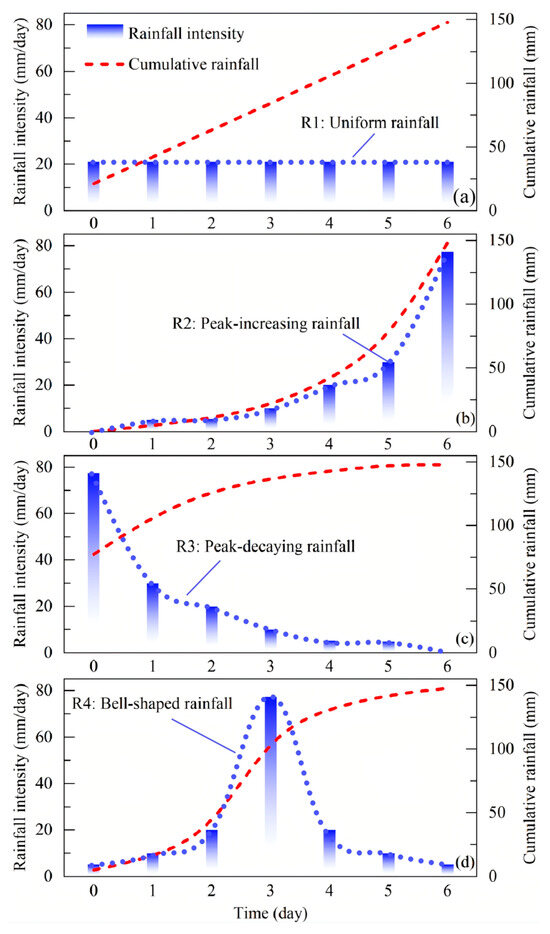
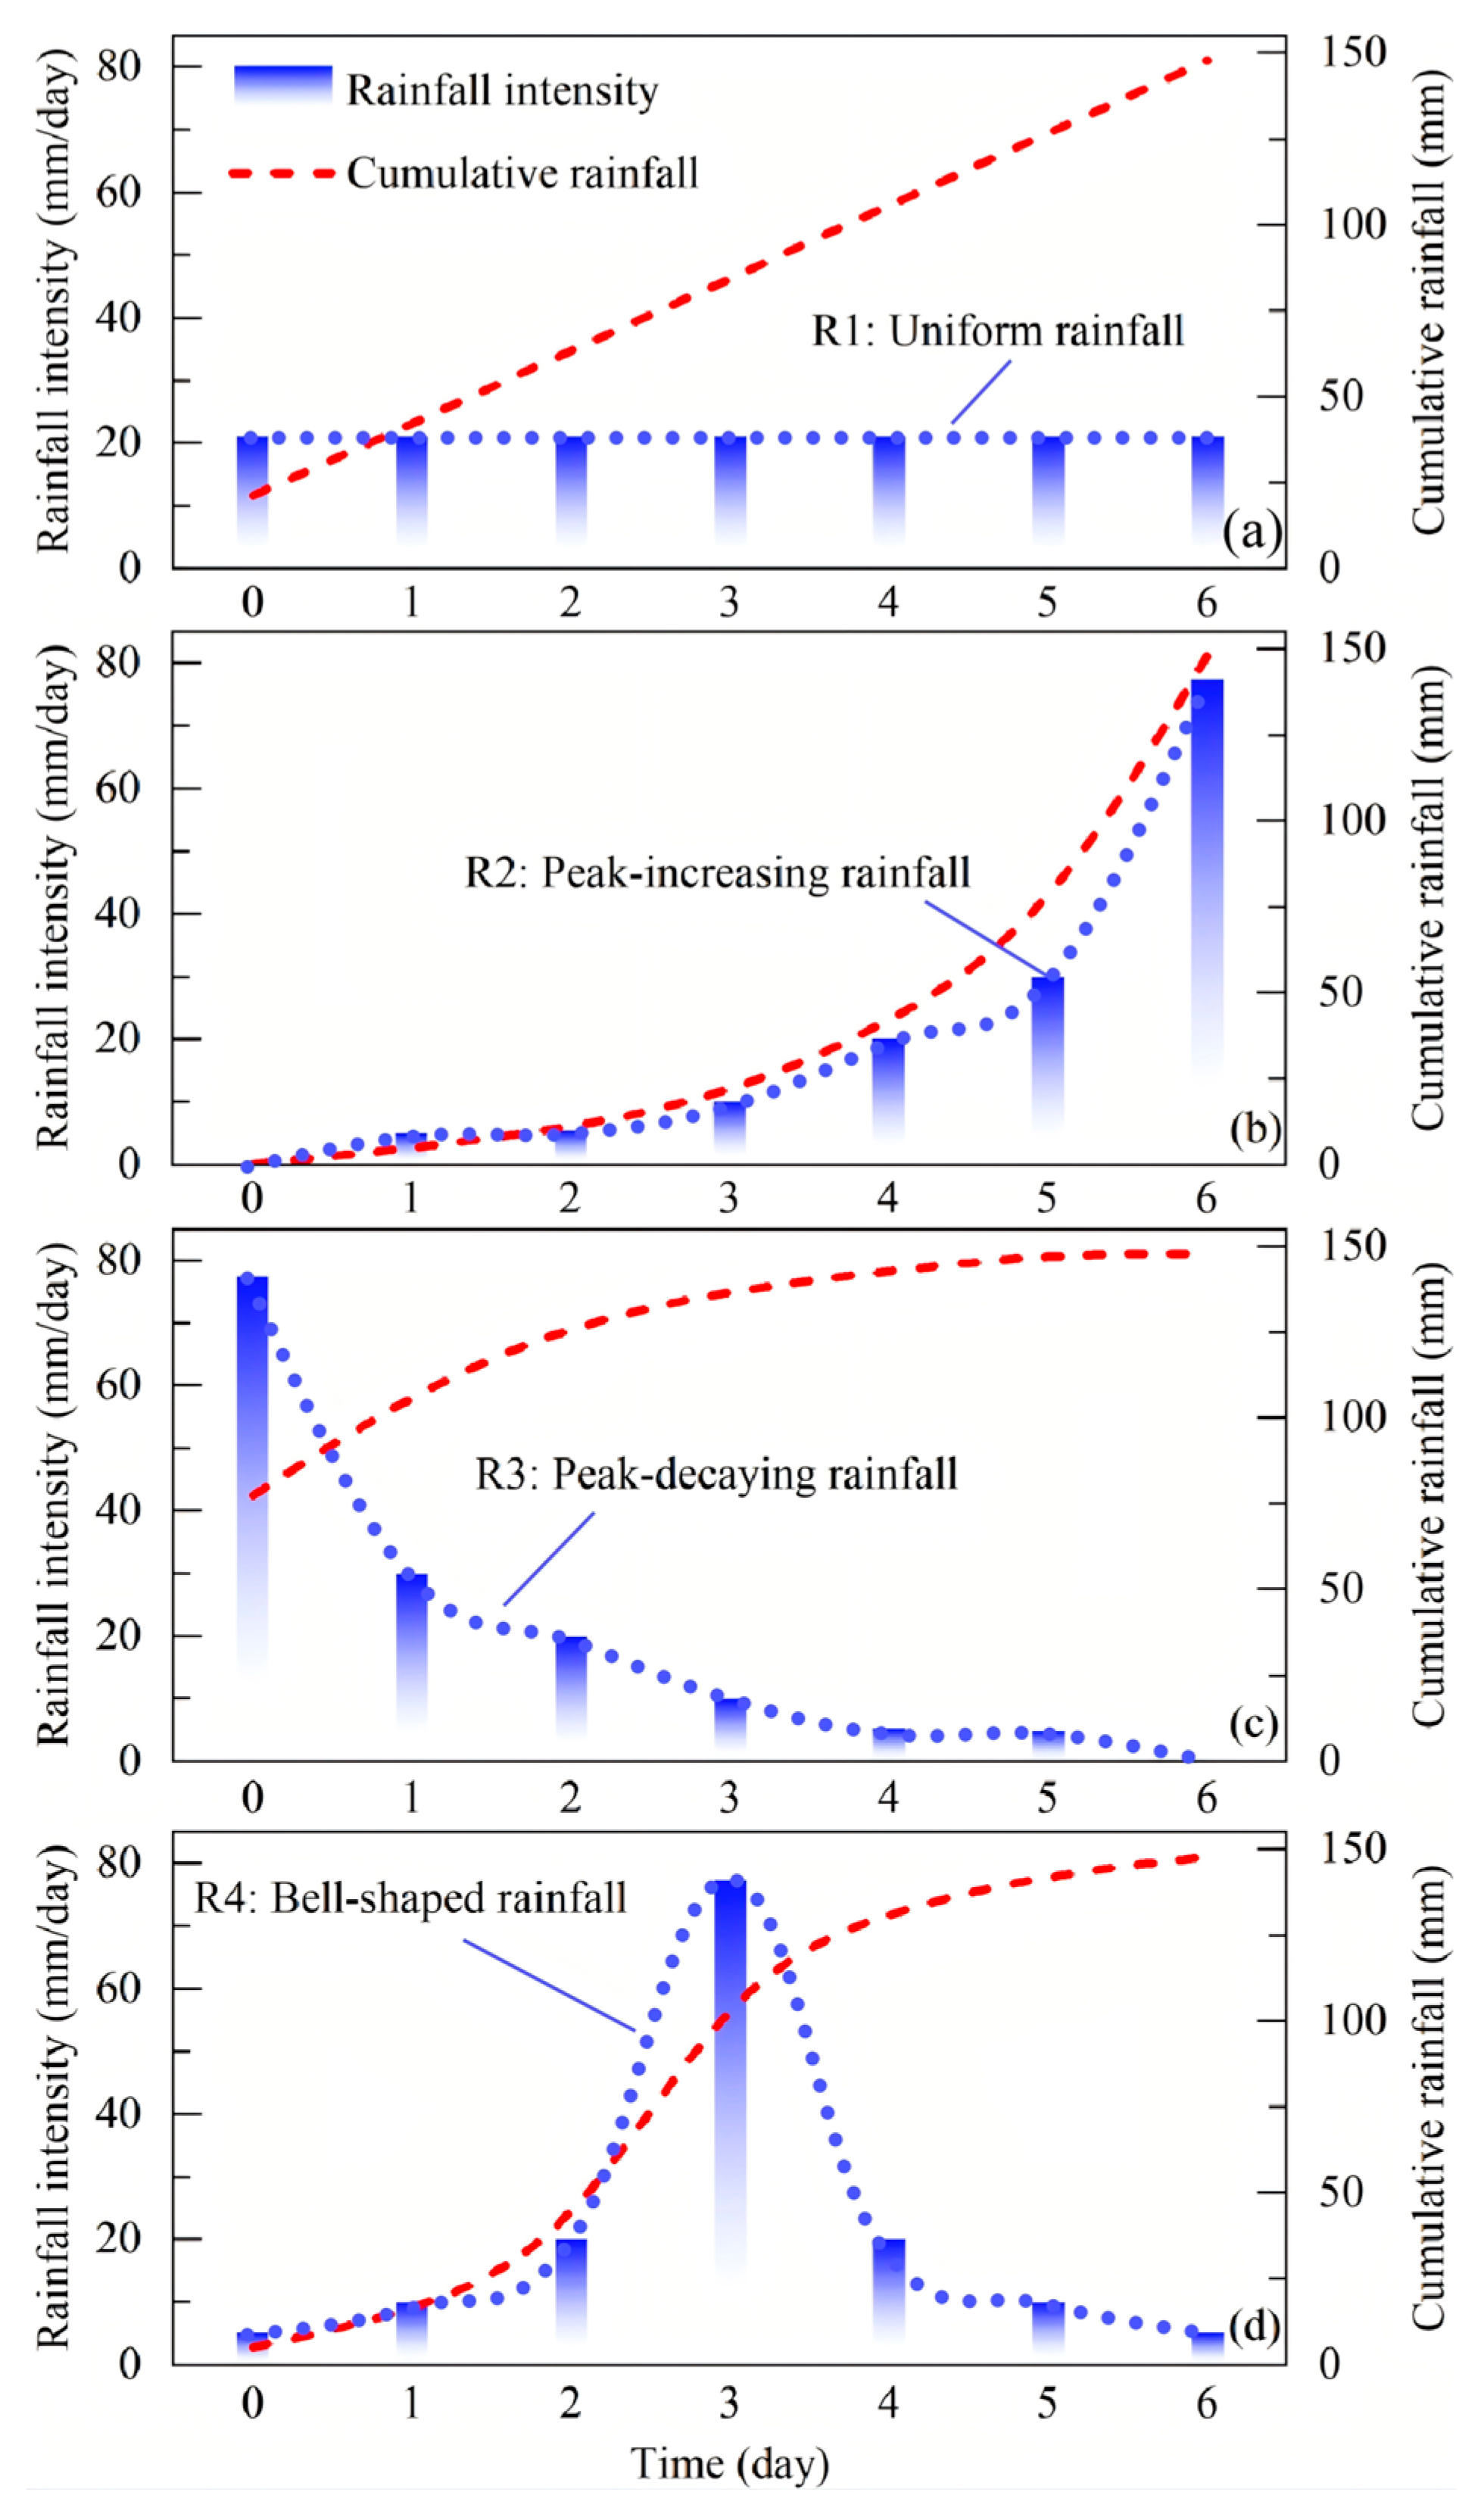
Based on the analysis of the hydrological processes and stability of red clay slopes under actual rainfall conditions in the preceding sections, it has been established that strength softening resulting from soil structure degradation is the primary mechanism leading to slope failure. Given the variability of natural rainfall patterns and their differing impacts on hydrological responses and slope stability, this section investigates pore water pressure variations and safety factors under four distinct idealized rainfall types. The design of these rainfall sequences, particularly the ‘early-peak’ pattern (R2), is informed by studies of regional storm processes in Yunnan, which indicate that extreme precipitation events in this area are often characterized by prominent intensity peaks and significant randomness, especially in high-elevation regions [42]. As illustrated in Figure 14, these rainfall types include: uniform rainfall (R1, Figure 14a), peak-increasing rainfall (R2, Figure 14b), peak-decaying rainfall (R3, Figure 14c) and bell-shaped rainfall (R4, Figure 14d). The total rainfall amount, peak intensity and duration remain consistent with the actual rainfall event, i.e., 147.83 mm, 77.45 mm/day, over 6 days. The actual rainfall pattern is denoted as R0 in this section. All mechanical and hydraulic parameters used in this section are derived from saturated intact soil samples (i.e., case #5).
Figure 14.
Designed rainfall pattern (a) uniform rainfall; (b) peak-increasing rainfall; (c) peak-decaying rainfall; (d) bell-shaped rainfall.
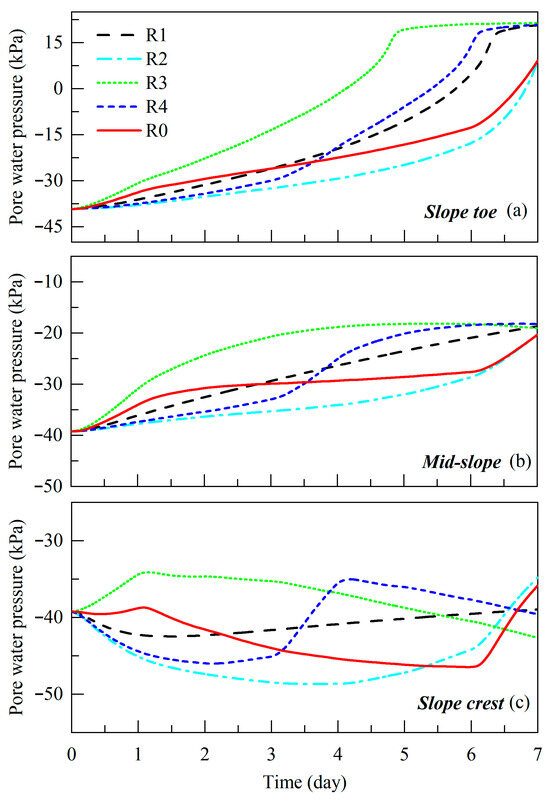
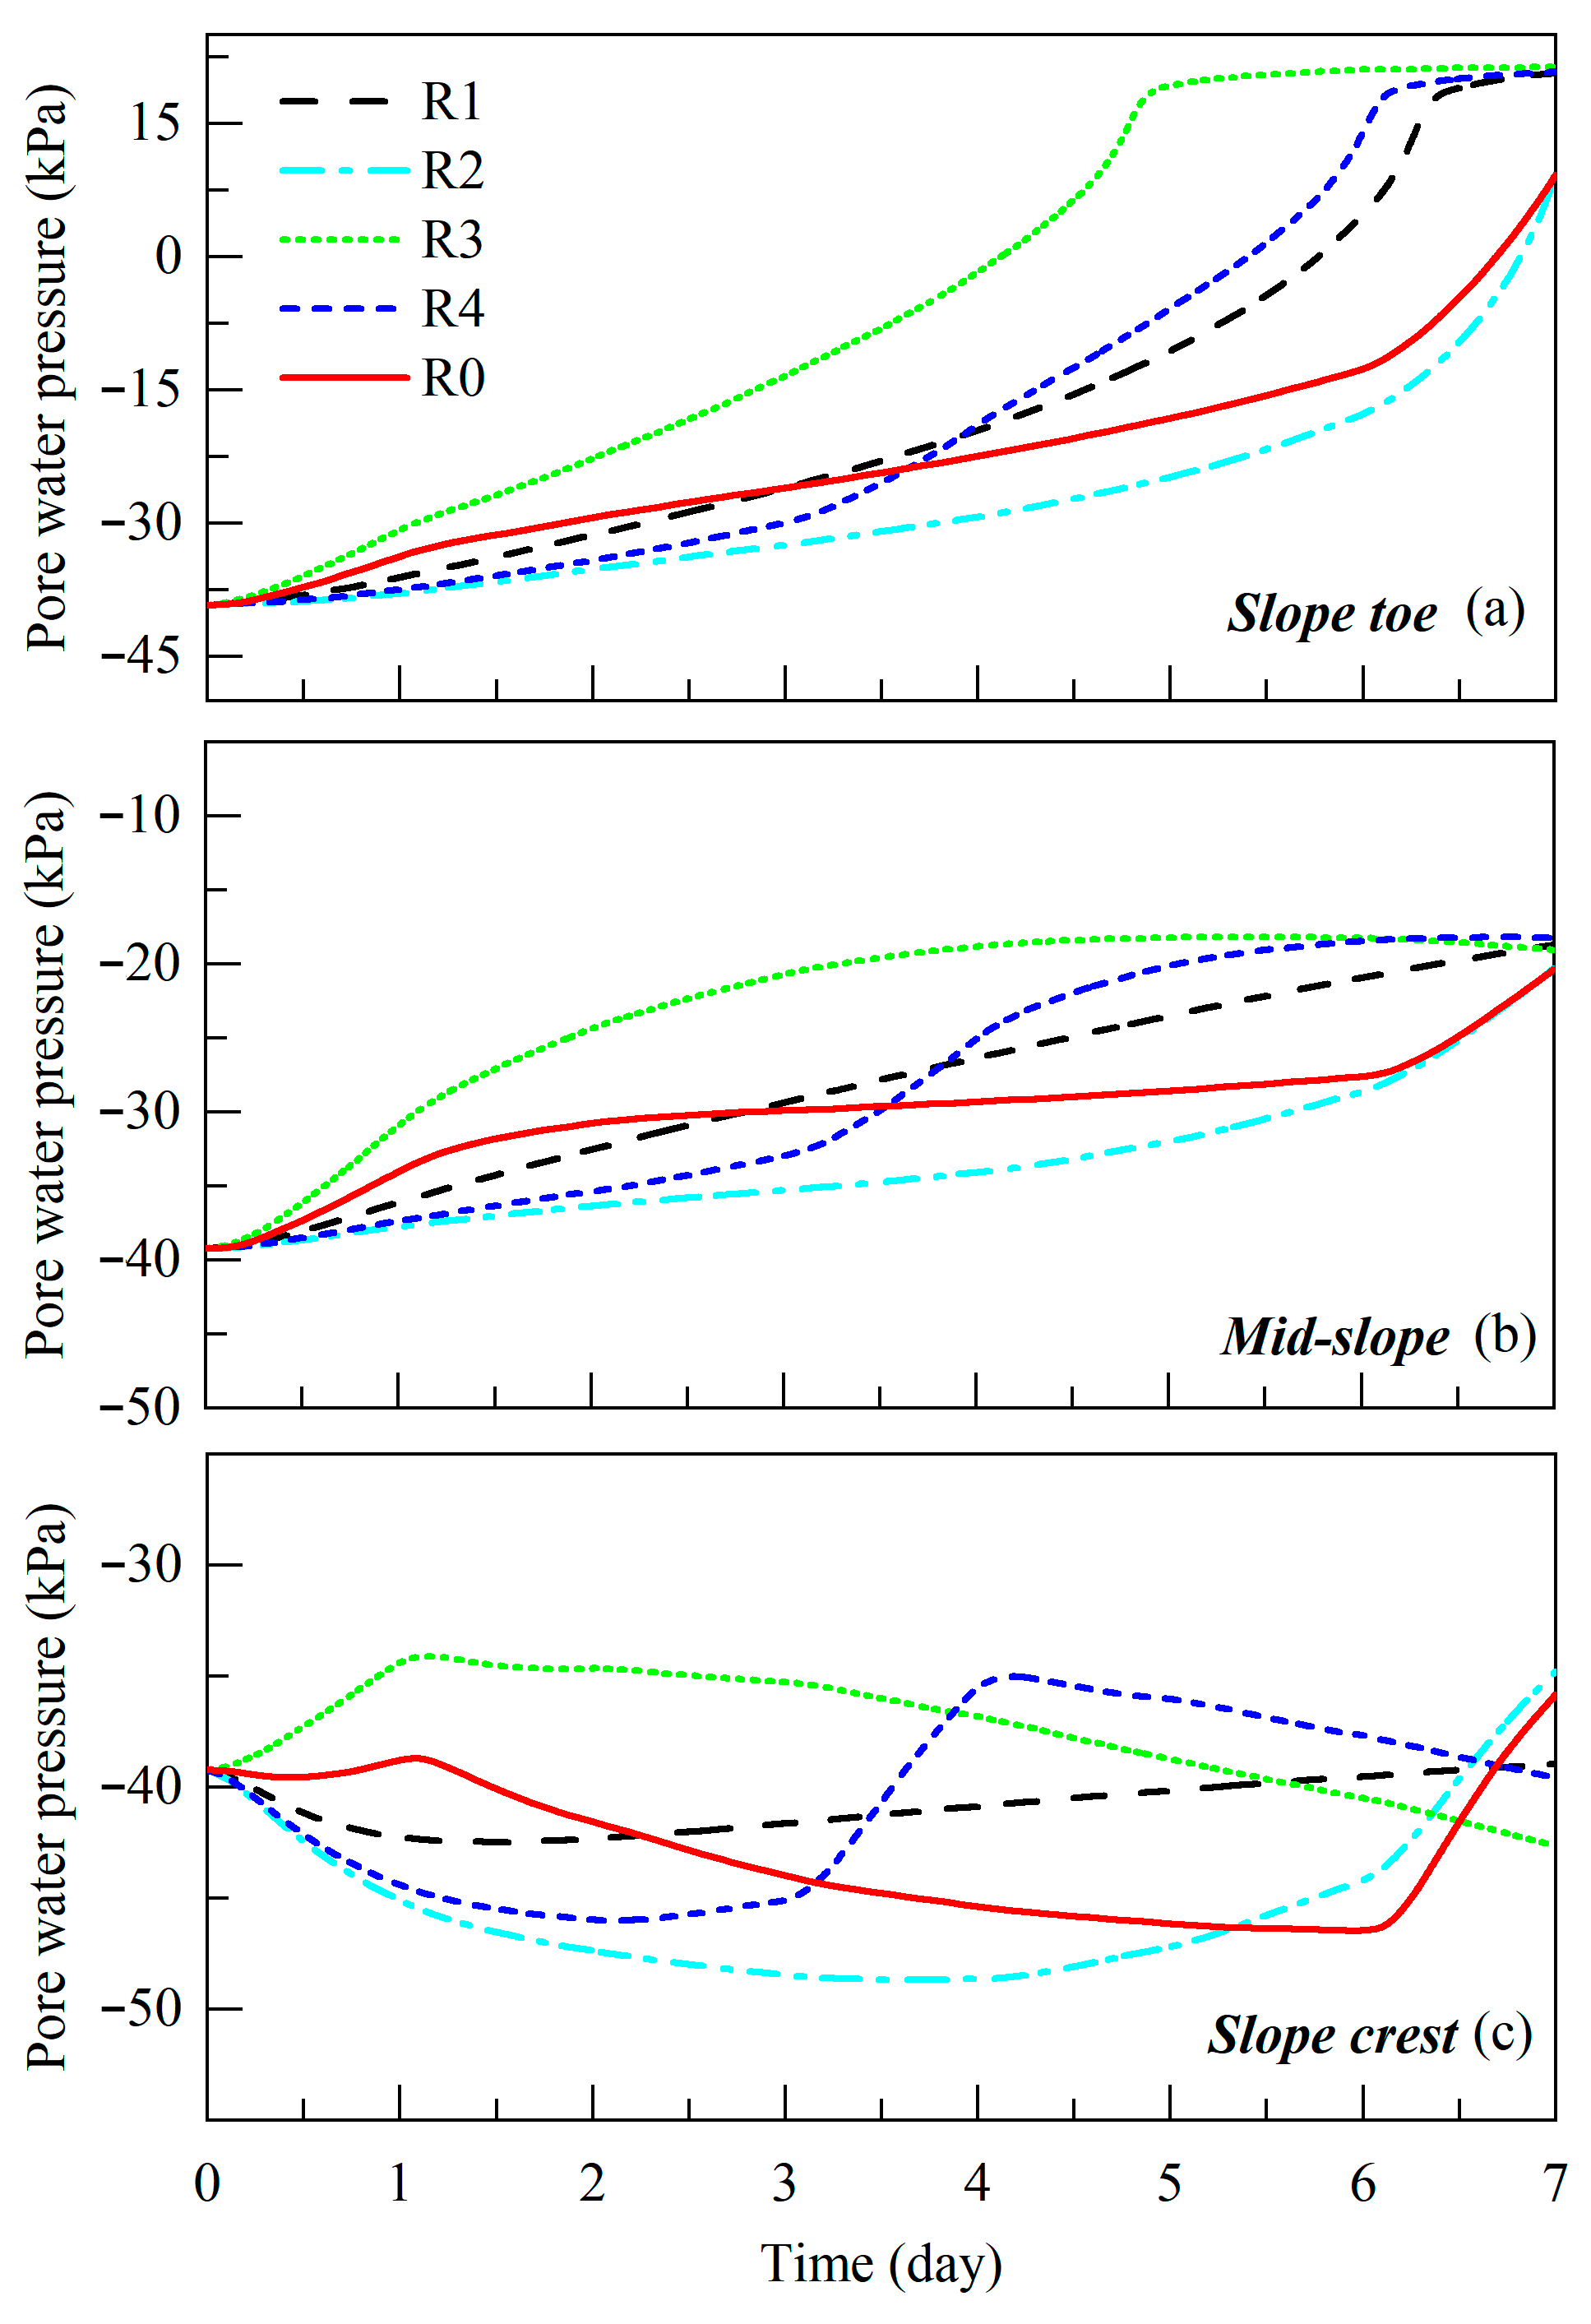
As shown in Figure 15, the pore water pressure responses at different slope locations vary considerably across rainfall types. The slope toe, acting as a convergence zone for subsurface flow, exhibits the most rapid increase in pore water pressure under R3 conditions, followed by R4 and R1, while R2 produces the slowest response. Upon cessation of rainfall, the final pore water pressure values under R3, R4 and R1 converge around 15 kPa, whereas under R2 it remains around 7.5 kPa, closer to that observed under R0. This divergence is primarily attributable to differences in antecedent soil moisture conditions caused by the timing of peak rainfall intensity. Under R3, intense initial rainfall rapidly elevates the overall water content of the slope, reducing negative pore pressure and bringing the instantaneous permeability closer to the saturated hydraulic conductivity. This, in turn, facilitates deeper and faster infiltration of subsequent rainfall. In contrast, R2’s delayed peak results in lower initial moisture content and hydraulic conductivity, retarding water migration toward the toe and yielding a notably smaller and slower pressure increase. The bell-shaped rainfall (R4) shows an intermediate behavior: its pore pressure rise initially lags behind R1 and overlaps with R2, but accelerates markedly after the peak, eventually surpassing R1. The mid-slope responses resemble those at the slope toe but with smaller differences in final pore pressure, suggesting that this transitional zone reaches a relatively stable water storage state regardless of rainfall type, indicating low sensitivity of final pore pressure to rainfall temporal patterns under constant total rainfall. The response at the slope crest differs markedly from the toe and mid-slope: significant pore pressure increase at 1.5 m depth occurs only under R0 and R3, which have high initial intensity. Under R1, R2 and R4, limited infiltration recharge from the surface or upslope results in continuously decreasing pore pressure until later rainfall intensification. Interestingly, unlike at the slope toe, the final pore pressure at the crest is higher under R0 and R2 than under R1, R3 and R4, with R3 yielding the lowest value. This indicates that for the crest location, an earlier rainfall peak leads to lower final pore water pressure. The physical mechanism for this counterintuitive result lies in the water balance at the crest, a location prone to surface runoff. The extremely high initial intensity of R3 likely exceeded the local infiltration capacity, causing a portion of the early, intense rainfall to be lost as surface runoff rather than infiltrating. In contrast, the more moderate intensities of R0 and R2 allowed for nearly complete and steady infiltration over time. Consequently, the net cumulative infiltration at the crest was lower for R3, resulting in a lower final pore water pressure. This underscores how rainfall temporal distribution critically alters the runoff-infiltration partition, especially at drainage-efficient slope positions.
Figure 15.
Variation in pore water pressure at different slope positions under different rainfall patterns (a) slope toe; (b) mid-slope; (c) slope crest.
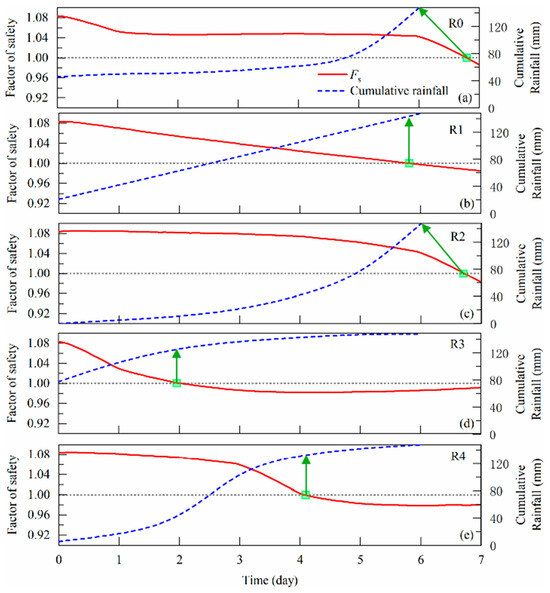
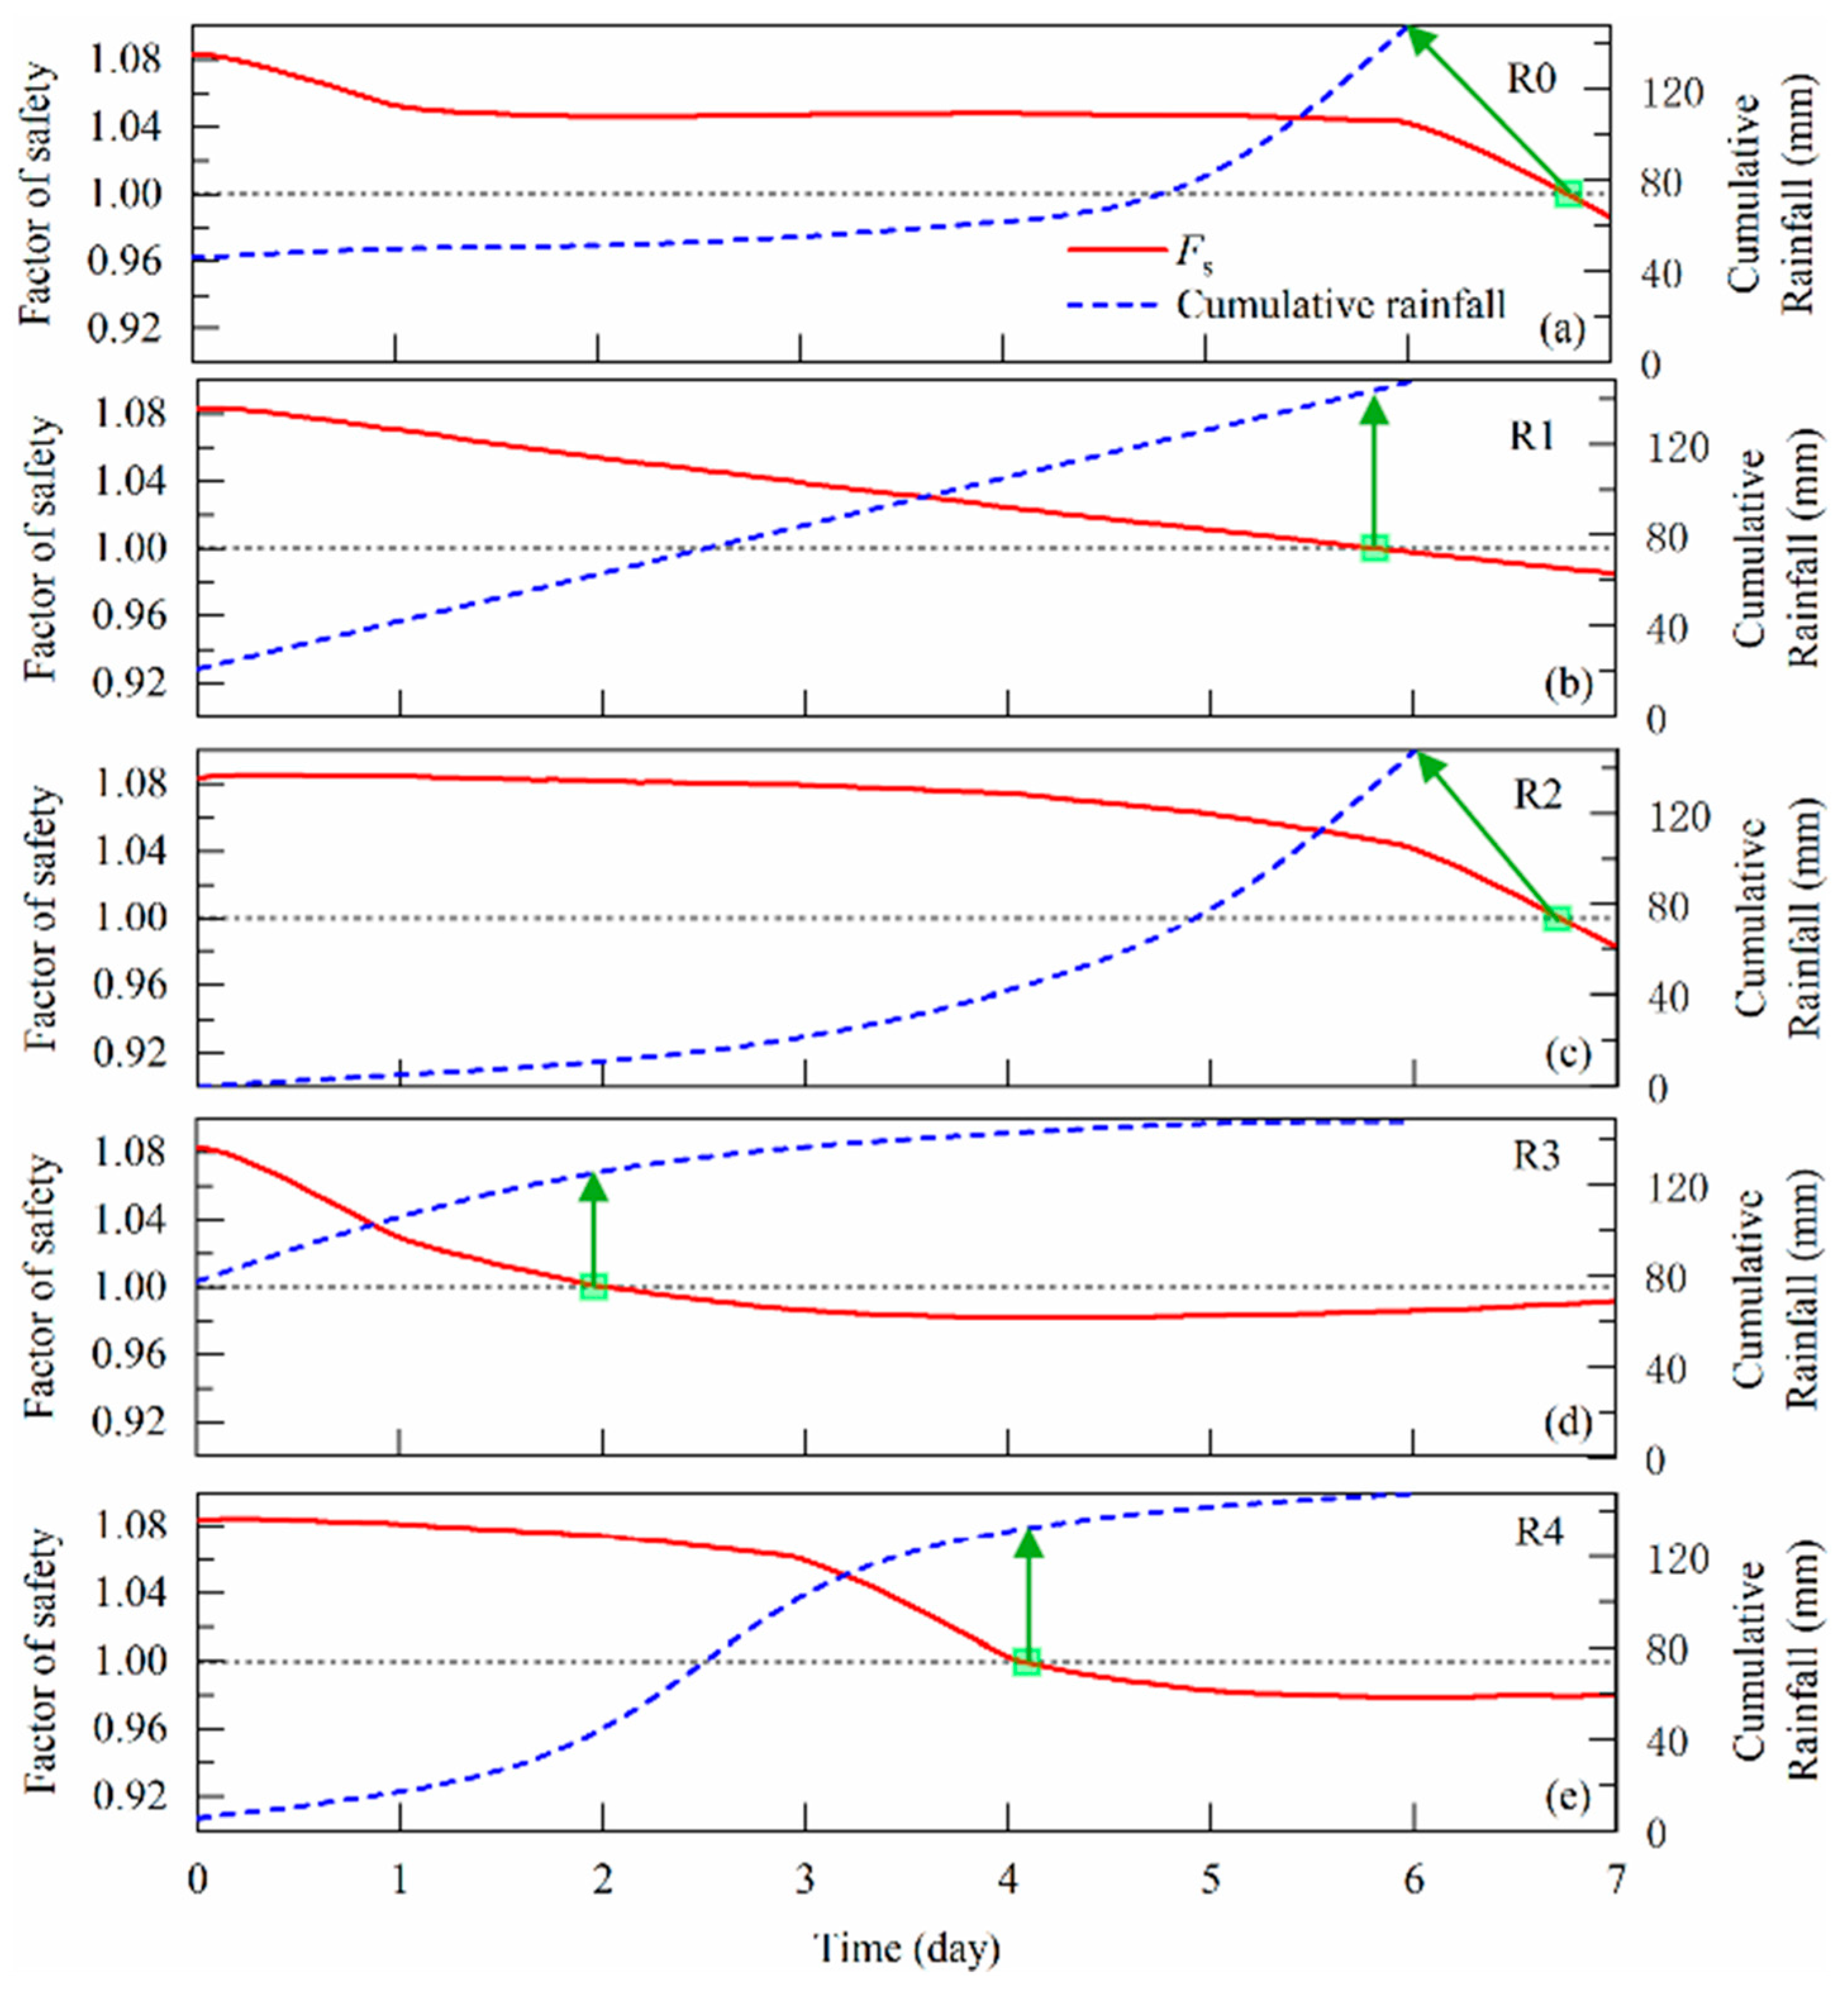
Finally, Figure 16 illustrates the temporal variation in the slip surface Fs relative to cumulative rainfall for different rainfall types. Under R0 and R2, the safety factor drops below 1.0 after all rainfall has ceased, suggesting a rainfall threshold of 147.83 mm for slope failure. For R1, instability occurs slightly before the final rainfall event, corresponding to a threshold of approximately 140 mm. Under R3, failure occurs significantly earlier, with a threshold of only 127 mm, while R4 induces failure later than R3 but earlier than R1, with a threshold of 132 mm. These findings demonstrate that slope stability is controlled not only by the total rainfall amount but also, more critically, by the temporal distribution of rainfall intensity. Overall, the timing of slope instability shifts with the temporal position of the rainfall peak, and the rainfall threshold required to trigger failure decreases as the peak occurs earlier. This behavior can be attributed to the fact that early high-intensity rainfall (such as R3) rapidly increases the degree of saturation and causes loss of matric suction, thereby triggering strong preferential flow effects that significantly lower the rainfall threshold for instability (127 mm).
Figure 16.
Variation in factor of slope safety under different rainfall patterns (a) realistic rainfall; (b) uniform rainfall; (c) peak-increasing rainfall; (d) peak-decaying rainfall; (e) bell-shaped rainfall.
The results provide an important supplement to traditional rainfall threshold-based methods for predicting slope stability. Conventional approaches often rely on total rainfall or average intensity for risk assessment, whereas this study confirms that ignoring the temporal dynamics of rainfall may lead to serious misjudgment of slope safety. The numerical results demonstrate that rainfall sequences with an early intensity peak (e.g., peak-decaying pattern R3) accelerate slope failure compared to late-peak events. A plausible mechanistic interpretation is that an initial high-intensity rainfall event rapidly diminishes matric suction in the upper soil profile. This not only initiates an immediate loss of shear strength but also enhances the hydraulic connectivity, facilitating a deeper and quicker penetration of the subsequent wetting front. In contrast, a late-peak pattern results in more progressive saturation, potentially allowing partial dissipation of pore pressures and delaying the formation of a continuous slip surface. Therefore, the sequencing of rainfall exerts a primary control on the timing of instability by modulating the efficiency of pore-pressure buildup. Consequently, rainfall types with early peak intensity (e.g., R3 and R4) intensify slope instability risk by facilitating preferential flow and sustaining zones of high pore water pressure. Therefore, throughout the entire life cycle of slope engineering, including design, construction, and maintenance, it is essential to incorporate representative hyetographs based on local meteorological characteristics, in addition to total rainfall amount, for dynamic stability evaluation. This sensitivity to the temporal pattern of a driving force is analogous to findings in other stability problems; for instance, Bennouna et al. [43] demonstrated that the orientation of seismic loading is a critical factor controlling wedge stability in fractured rock, identifying specific directions that minimize the safety factor. Furthermore, we recommend that future risk assessment models for red clay slopes should integrate rainfall pattern parameters to establish more comprehensive early warning systems. For instance, when forecasts indicate an early-peak rainfall pattern, slope protection and monitoring measures should be activated in advance, even if the predicted total rainfall does not exceed conventional warning thresholds. Furthermore, probabilistic methods, such as the copula-based error modeling demonstrated by Dwinagara et al. [44], which improves inverse-velocity-based failure forecasts [45,46], could be integrated with our hydro-mechanical simulations to enhance the reliability of slope risk assessments.
6. Conclusions
This study investigates the coupled effects of soil structure degradation and rainfall patterns on the hydro-mechanical behavior and stability of a red clay cut slope in Yunnan, China. Its novel aspects lie in elucidating the coupling between strength and permeability changes due to structure degradation, and in systematically linking rainfall temporal patterns to failure mechanisms. The major conclusions are as follows:
- (1)
- Soil structure degradation dominates distribution of slope pore water pressure via its coupled effect on hydraulic properties. Remolding due to disturbance reduces the saturated hydraulic conductivity by approximately 4.7 times, significantly slowing rainwater infiltration, prolonging the duration of shallow pore water pressure buildup, and promoting the development of transient saturated zones. In contrast, the intact soil facilitates deeper water migration, resulting in elevated pore water pressures near the soil-rock interface.
- (2)
- Strength parameters control stability, while permeability influences deformation characteristics. Strength softening induced by structural degradation is the primary cause of slope instability. A reduction in strength enlarges the deformation zone by about 1.5 times under the same permeability conditions. Permeability contrasts mainly affect the depth and distribution of deformation. The use of saturated intact soil strength parameters allows the most accurate simulation of slope failure timing and extent.
- (3)
- Rainfall temporal pattern critically influences stability thresholds. The timing and magnitude of slope instability are strongly controlled by the temporal distribution of rainfall intensity. Peak-decaying rainfall causes the most rapid pore water pressure rise, the earliest instability and the lowest rainfall threshold (127 mm). In contrast, peak-increasing rainfall delays failure occurrence. The overall stability response depends more on rainfall temporal patterns than on total rainfall amount.
- (4)
- A practical framework is proposed for slope stability assessment and early warning. It is recommended to use saturated intact soil strength parameters for stability analysis. Rainfall patterns, especially those with early peaks, must be incorporated into risk assessments. Future risk assessment models for red clay slopes should integrate rainfall pattern parameters to establish more comprehensive early warning systems; for instance, when forecasts indicate an early-peak rainfall pattern, slope protection and monitoring measures should be activated in advance, even if the predicted total rainfall does not exceed conventional warning thresholds. Permeability variability can be treated as a secondary factor.
This study underscores the combined role of soil structural degradation and rainfall temporal distribution in triggering red clay slope failures. The findings provide theoretical and practical support for slope engineering design, risk assessment, and emergency mitigation. However, it should be noted that the present analysis is deterministic, establishing a clear cause-and-effect understanding of the key mechanisms. The inherent uncertainty in geotechnical parameters suggests that future work incorporating probabilistic methods (e.g., Monte Carlo simulation) would be a valuable extension to translate these findings into quantified reliability assessments for early warning systems.
Author Contributions
J.X.: Conceptualization, Methodology, numerical modeling, Writing—Original Draft; S.H.: Conceptualization, Writing—Review & Editing; J.Z.: Data source, Experiment design; Y.S.: Sampling, Monitoring data; H.L.: Sampling, Monitoring data; J.S.: Resources, Writing—Review & Editing; P.J.: Resources, Writing—Review & Editing; Y.L.: Supervision, Writing—Review & Editing. All authors have read and agreed to the published version of the manuscript.
Funding
This work was financially supported by the National Natural Science Foundation of China (Grant No. 42407204), Postdoctoral Fellowship Program of CPSF (Grant No. GZC20232473), China Postdoctoral Science Foundation Funded Project (Grant No. 2024M763062) and Hubei Postdoctoral Innovation Talent Support Project (Grant No. 2024HBBHCXA088).
Data Availability Statement
Enquiries about data availability should be directed to the authors.
Acknowledgments
The authors would like to thank the editor and anonymous reviewers for their valuable comments that substantially improved this paper.
Conflicts of Interest
Authors Jianbo Xu, Jianjun Song and Ping Jiang were employed by the company China First Metallurgical Group Co., Ltd. The remaining authors declare that the research was conducted in the absence of any commercial or financial relationships that could be construed as a potential conflict of interest.
References
- D’Angelo, B.; Bruand, A.; Qin, J.T.; Peng, X.H.; Hartmann, C.; Sun, B.; Hao, H.T.; Rozenbaum, O.; Muller, F. Origin of the high sensitivity of Chinese red clay soils to drought: Significance of the clay characteristics. Geoderma 2014, 223, 46–53. [Google Scholar] [CrossRef] [Scilit]
- Jiao, W.; Zhang, M.; Li, P.; Xie, J.; Pang, H.; Liu, F.; Yang, L. Evolution model and failure mechanisms of rainfall-induced cracked red clay slopes: Insights from Xinshao County, China. J. Mt. Sci. 2024, 21, 867–881. [Google Scholar] [CrossRef] [Scilit]
- Li, L.F.; Gong, W.L.; Deng, H.L.; Zhang, X.H.; Li, G. Distribution Pattern of Anchorage Stress and Water Sensitivity Analysis of Red Clay. Shock. Vib. 2020, 2020, 6272576. [Google Scholar] [CrossRef] [Scilit]
- Liu, B.C.; Wang, L.Y.; Yang, B. Study on Crack Development in Red Clay from Guangxi Guilin with Different Clay Grain Content. Sustainability 2022, 14, 13104. [Google Scholar] [CrossRef] [Scilit]
- Xue, K.X.; Wang, S.F.; Hu, Y.X.; Li, M.D. Creep Behavior of Red-Clay Under Triaxial Compression Condition. Front. Earth Sci. 2020, 7, 345. [Google Scholar] [CrossRef] [Scilit]
- Gao, Q.F.; Zeng, L.; Shi, Z.N. Effects of desiccation cracks and vegetation on the shallow stability of a red clay cut slope under rainfall infiltration. Comput. Geotech. 2021, 140, 104436. [Google Scholar] [CrossRef] [Scilit]
- Huang, F.M.; Tang, C.H.; Jiang, S.H.; Liu, W.P.; Chen, N.; Huang, J.S. Influence of heavy rainfall and different slope cutting conditions on stability changes in red clay slopes: A case study in South China. Environ. Earth Sci. 2022, 81, 384. [Google Scholar] [CrossRef] [Scilit]
- Yang, L.; Kaisheng, C.; Mengfei, L.; Yingchao, W. Study on failure of red clay slopes with different gradients under dry and wet cycles. Bull. Eng. Geol. Environ. 2020, 79, 4609–4624. [Google Scholar] [CrossRef] [Scilit]
- Lian, B.; Wang, X.; Liu, K.; Hu, S.; Feng, X. A mechanical insight into the triggering mechanism of frequently occurred landslides along the contact between loess and red clay. Sci. Rep. 2021, 11, 17556. [Google Scholar] [CrossRef] [Scilit]
- Luo, Y.; Hou, X.Y.; Zhang, J.M.; Wang, Y.J.; Hu, M.J.; Jiang, G.S.; Tang, C.S. Exploring the effects of weather-driven dynamics of desiccation cracks on hydrological process of expansive clay slope: Insights from physical model test. J. Hydrol. 2025, 656, 133011. [Google Scholar] [CrossRef] [Scilit]
- Shi, J.S.; Wu, L.Z.; Qu, Y.X.; Li, B.; Wu, S.R. Neogene clay and its relation to landslides in the southwestern Loess Plateau, China. Environ. Earth Sci. 2018, 77, 204. [Google Scholar] [CrossRef] [Scilit]
- Zhang, J.M.; Luo, Y.; Zhou, Z.; Chong, L.; Victor, C.; Zhang, Y.F. Effects of preferential flow induced by desiccation cracks on slope stability. Eng. Geol. 2021, 288, 106164. [Google Scholar] [CrossRef] [Scilit]
- Zhang, J.M.; Luo, Y.; Zhou, Z.; Victor, C.; Duan, M.D. Research on the rainfall-induced regional slope failures along the Yangtze River of Anhui, China. Landslides 2021, 18, 1801–1821. [Google Scholar] [CrossRef] [Scilit]
- Chen, K.S. Field Test Research on Red Clay Slope under Atmospheric Action. Adv. Civ. Eng. 2021, 2021, 6668979. [Google Scholar] [CrossRef] [Scilit]
- He, K.; Guo, L.; Chen, W. Research on displacement dynamic evaluation and forecast model of colluvial landslides induced by rainfall. Chin. J. Rock Mech. Eng. 2015, 34, 4204–4215. [Google Scholar]
- Luo, Y.; Zhang, J.M.; Zhou, Z.; Jiang, G.S.; Duan, M.D. Effects of improper emergency mitigations on a large-scale landslide triggered by road excavation: A case study of the Fengping landslide, Hubei province, China. Bull. Eng. Geol. Environ. 2024, 83, 258. [Google Scholar] [CrossRef] [Scilit]
- Liu, Y.; Chen, K.; Lyu, M.; MU, R. Model experiment of response of red clay slope under dry-wet cycle. Water Resour. Hydropower Eng. 2018, 49, 193–203. [Google Scholar]
- Wu, L.Z.; Zhang, L.M.; Zhou, Y.; Xu, Q.; Yu, B.; Liu, G.G.; Bai, L.Y. Theoretical analysis and model test for rainfall-induced shallow landslides in the red-bed area of Sichuan. Bull. Eng. Geol. Environ. 2018, 77, 1343–1353. [Google Scholar] [CrossRef] [Scilit]
- Xie, C.; Ni, P.; Xu, M.; Mei, G.; Zhao, Y. Combined measure of geometry optimization and vegetation for expansive soil slopes. Comput. Geotech. 2020, 123, 103588. [Google Scholar] [CrossRef] [Scilit]
- Zhang, C.; Yin, Y.; Yan, H.; Zhu, S.; Li, B.; Hou, X.; Yang, Y. Centrifuge modeling of multi-row stabilizing piles reinforced reservoir landslide with different row spacings. Landslides 2023, 20, 559–577. [Google Scholar] [CrossRef] [Scilit]
- Zhang, H.; Yang, J.; Wang, L.; Xu, Y. Model test on the dynamic characteristics of crack formation in expansive soil slopes under alternate drying and wetting. Acta Geotech. 2023, 18, 2097–2115. [Google Scholar] [CrossRef] [Scilit]
- Hao, M.; Xu, Q.; Yang, L.; Yang, X.; Zhou, J. Physical modeling and movement mechanism of landslide-debris avalanches. Rock Soil Mech. 2014, 35, 127–132. [Google Scholar]
- Ishii, Y.; Ota, K.; Kuraoka, S.; Tsunaki, R. Evaluation of slope stability by finite element method using observed displacement of landslide. Landslides 2012, 9, 335–348. [Google Scholar] [CrossRef] [Scilit]
- Kim, M.S.; Onda, Y.; Kim, J.K.; Kim, S.W. Effect of topography and soil parameterisation representing soil thicknesses on shallow landslide modelling. Quat. Int. 2015, 384, 91–106. [Google Scholar] [CrossRef] [Scilit]
- Lanni, C.; McDonnell, J.; Hopp, L.; Rigon, R. Simulated effect of soil depth and bedrock topography on near-surface hydrologic response and slope stability. Earth Surf. Process. Landf. 2013, 38, 146–159. [Google Scholar] [CrossRef] [Scilit]
- Wu, W.; Xu, C.; Wang, X.; Tian, Y.; Deng, F. Landslides triggered by the 3 August 2014 Ludian (China) M w 6.2 earthquake: An updated inventory and analysis of their spatial distribution. J. Earth Sci. 2020, 31, 853–866. [Google Scholar] [CrossRef] [Scilit]
- Yang, L.; Zhang, M.; Jiao, W.Z.; Wu, Y.Y.; Zhang, C.Y.; Wang, Z.B. Influence of intergranular friction weakening on rock avalanche dynamics. Comput. Geotech. 2023, 159, 105440. [Google Scholar] [CrossRef] [Scilit]
- Zhang, J.; Zhu, D.; Zhang, S.H. Shallow slope stability evolution during rainwater infiltration considering soil cracking state. Comput. Geotech. 2020, 117, 103285. [Google Scholar] [CrossRef] [Scilit]
- Louati, F.; Trabelsi, H.; Jamei, M.; Taibi, S. Impact of wetting-drying cycles and cracks on the permeability of compacted clayey soil. Eur. J. Environ. Civ. Eng. 2021, 25, 696–721. [Google Scholar] [CrossRef] [Scilit]
- Lyu, H.B.; Gu, J.X.; Li, W.J.; Liu, F.B. Analysis of compressibility and mechanical behavior of red clay considering structural strength. Arab. J. Geosci. 2020, 13, 411. [Google Scholar] [CrossRef] [Scilit]
- Chen, K.-S. The evolution of cracks in red clay under wet and dry cycles and its influence on shear strength. IOP Conf. Ser. Earth Env. Sci. 2020, 525, 012161. [Google Scholar] [CrossRef] [Scilit]
- Ma, H.Y.; Pei, C.L.; Huang, R.J.; Xu, S. Crack Evolution and Strength Attenuation of Red Clay under Dry-Wet Cycles. J. Mater. Civ. Eng. 2024, 36, 04024045. [Google Scholar] [CrossRef] [Scilit]
- Li, Y.; Zhang, K.; Liu, B.; Pan, Z. On the decay of strength in Guilin red clay with cracks. Fract. Struct. Integr. 2015, 9. [Google Scholar]
- Rahardjo, H.; Li, X.; Toll, D.; Leong, E. The effect of antecedent rainfall on slope stability. Geotech. Geol. Eng. 2001, 19, 371–399. [Google Scholar] [CrossRef] [Scilit]
- Rahimi, A.; Rahardjo, H.; Leong, E.C. Effect of Antecedent Rainfall Patterns on Rainfall-Induced Slope Failure. J. Geotech. Geoenviron. Eng. 2011, 137, 483–491. [Google Scholar] [CrossRef] [Scilit]
- Zhang, Z.P.; Fu, X.D.; Sheng, Q.A.; Yin, D.W.; Zhou, Y.Q.; Huang, J.H. Effect of Rainfall Pattern and Crack on the Stability of a Red Bed Slope: A Case Study in Yunnan Province. Adv. Civ. Eng. 2021, 2021, 6658211. [Google Scholar] [CrossRef] [Scilit]
- Fu, G.B.; Yu, J.J.; Yu, X.B.; Ouyang, R.L.; Zhang, Y.C.; Wang, P.; Liu, W.B.; Min, L.L. Temporal variation of extreme rainfall events in China, 1961–2009. J. Hydrol. 2013, 487, 48–59. [Google Scholar] [CrossRef] [Scilit]
- Jiang, W.Z.; Tan, Y. Characterization of intra-event patterns of heavy rainfall events in China during 2008–2019 by machine learning. Theor. Appl. Climatol. 2025, 156, 372. [Google Scholar] [CrossRef] [Scilit]
- Schaap, M.G.; Leij, F.J.; van Genuchten, M.T. Rosetta: A computer program for estimating soil hydraulic parameters with hierarchical pedotransfer functions. J. Hydrol. 2001, 251, 163–176. [Google Scholar] [CrossRef] [Scilit]
- Pasternack, S.C.; Gao, S. Numerical-Methods in the Stability Analysis of Slopes. Comput. Struct. 1988, 30, 573–579. [Google Scholar] [CrossRef] [Scilit]
- Griffiths, D.V.; Lane, P.A. Slope stability analysis by finite elements. Geotechnique 1999, 49, 387–403. [Google Scholar] [CrossRef] [Scilit]
- Yang, P.W.; Zhou, D.; Ji, W.J.; Ma, S.Y.; Luo, M.; Li, M. Temporal and spatial characteristics of regional rainstorm processes in Yunnan province. J. Meteorol. Environ. 2024, 40, 83–90. [Google Scholar]
- Bennouna, R.; Ouadif, L.; Akhssas, A.; Skali, S.A.; Boulaid, G. Wedge stability analysis in fractured soft rock slopes for different orientations of seismic components. Min. Miner. Depos. 2024, 18, 1–8. [Google Scholar] [CrossRef] [Scilit]
- Dwinagara, B.; Vergiagara, V.; Uurlu, M.F. Enhancing slope failure forecasting model by implementing Archimedean copula to model the error-term. Min. Miner. Depos. 2024, 18, 26–33. [Google Scholar] [CrossRef] [Scilit]
- Yin, X.; Cheng, S.; Yu, H.; Pan, Y.; Liu, Q.; Huang, X.; Gao, F.; Jing, G. Probabilistic assessment of rockburst risk in TBM-excavated tunnels with multi-source data fusion. Tunn. Undergr. Space Technol. 2024, 152, 105915. [Google Scholar] [CrossRef] [Scilit]
- Yin, X.; Gao, F.; Chen, Z.; Pan, Y.; Liu, Q.; Cheng, S. Intelligent multi-channel classification of microseismic events upon TBM excavation. J. Rock Mech. Geotech. Eng. 2025, 17, 7056–7077. [Google Scholar] [CrossRef] [Scilit]

Disclaimer/Publisher’s Note: The statements, opinions and data contained in all publications are solely those of the individual author(s) and contributor(s) and not of MDPI and/or the editor(s). MDPI and/or the editor(s) disclaim responsibility for any injury to people or property resulting from any ideas, methods, instructions or products referred to in the content. |
© 2026 by the authors. Licensee MDPI, Basel, Switzerland. This article is an open access article distributed under the terms and conditions of the Creative Commons Attribution (CC BY) license.