


Abstract
To address the lack of accurate strength evaluation methods of the TMS concrete, this study focused on establishing a multi-age correlation model between the RS and CS of the TMS concrete. Sixteen groups of the TMS concrete with differentiated mix proportions were designed, and XRF/XRD techniques were used to characterize the chemical and mineral compositions of the TMS. RS and CS tests were conducted on standard cubic specimens at 3 d, 7 d, and 28 d ages, and linear, quadratic polynomial, and exponential functions were adopted for fitting analysis. The optimal model for each age was screened using the coefficient of determination, F-test, Akaike information criterion, and Bayesian information criterion. To verify the model and eliminate size effect interference, a large-scale plate specimen was fabricated for tests. Results showed that the correlation between RS and CS of the TMS concrete varied with age. Linear function was optimal for 3 d, quadratic polynomial function for 7 d, and exponential function for 28 d. All models passed the F-test. The relative errors of the piecewise model in large-scale specimen verification were stably controlled within 5.0%, meeting engineering-allowable error requirements. Crucially, the validation confirmed that the size effect is negligible for TMS concrete components within the investigated mix proportion range, eliminating the need for size correction factors. Consequently, this model can be directly applied to the non-destructive strength testing of TMS concrete prepared with P.O 42.5 Portland cement at 3 d, 7 d, and 28 d ages without the need for parameter adjustment regarding component dimensions.
1. Introduction
The rebound method is widely used in concrete strength testing due to its convenience and non-destructiveness. It lies in the inherent positive correlation between concrete RS and CS [1,2,3,4,5]. During the concrete hardening process, hydration products of cement such as C-S-H gel and ettringite synchronously enhance the surface compactness and internal structural bearing capacity. This synergistic evolution law of physical and mechanical properties enables the indirect calculation of the CS through RS. The correlation model linking RS and CS serves as the core carrier for the engineering application of this method. An accurate model can convert convenient non-destructive testing data into reliable strength evaluation results, which not only avoids the damage to structures caused by traditional destructive testing but also greatly improves testing efficiency [6,7,8,9,10]. Therefore, it occupies an irreplaceable position in concrete engineering quality acceptance and service performance evaluation.
To enhance the predictive accuracy of RS-CS models, recent research has broadly focused on two primary dimensions: advanced mathematical methodologies and the influence of physical factors. In terms of mathematical modeling, Chen et al. [11] conducted regression analysis to establish linear, polynomial, power, exponential, and logarithmic equations, while also investigating the accuracy of different hammers and regional representativeness. Kovler et al. [12] explored the influence of water–binder ratios and hammer types (Schmidt vs. Leeb), finding that while Schmidt RS varies with w/b, Leeb RS provides consistent predictions. To address uncertainty, Tao et al. [13] proposed a full-probability conversion model based on Copula functions and Bayesian inference. Furthermore, Toghroli et al. [14] utilized ANFIS to optimize variable selection for health monitoring. Concurrently, researchers have sought to refine models by incorporating physical constraints and local calibration. Brozovsky [15] systematically elaborated that parent rock strength significantly affects test accuracy, whereas particle gradation is negligible for high-strength aggregates. Liang et al. [16] and Zhou et al. [17] investigated environmental and composite factors, finding that short-term carbonation may increase RS for high-strength concrete and that RS stabilizes with curing time in combined ultrasonic-rebound evaluations. Shang et al. [18] and Yuan et al. [19] emphasized the value of local or special curves over general ones, with Yuan et al. [19] noting that the incorporation of fly ash and slag promotes RS increase. Yan et al. [20] further confirmed that strength calculated by the rebound method is generally conservative. However, a critical limitation of these advanced mathematical approaches [11,12,13,14,15,16,17,18,19,20] is that they often assume a universal material behavior, failing to account for the specific physico-chemical signatures of novel aggregates.
With the increasing shortage of natural sand resources and the strengthening of ecological protection policies, manufactured sand has become a crucial alternative to natural sand in concrete engineering [21,22,23,24,25]. Tuff, a typical pyroclastic rock with medium–low hardness, is easy to process into manufactured sand, showing significant application potential in construction fields [26]. However, TMS has unique chemical compositions and mineral components, which lead to differences in hydration characteristics and strength development laws of TMS concrete compared with conventional manufactured sand concrete. This makes the existing rebound–compressive strength correlation models inapplicable to the TMS concrete, resulting in difficulties in rapid and accurate non-destructive evaluation of the TMS concrete strength in engineering [27,28,29,30]. Consequently, the strength development and surface hardening mechanisms of TMS concrete differ fundamentally from those of ordinary concrete. Standard models, which lack parameters to capture this active interface evolution, are inapplicable.
To fill these gaps, this study systematically explored the multi-age RS-CS correlation mechanism of TMS concrete. Through multi-group mix proportion tests and multi-indicator model optimization, a piecewise function model suitable for different ages was established. Large-scale specimen tests were further carried out to verify the model and eliminate size effect interference, providing a reliable theoretical basis and engineering application method for the non-destructive strength evaluation of TMS concrete.
2. Experimental Materials and Methods
2.1. Material Performance
2.1.1. TMS
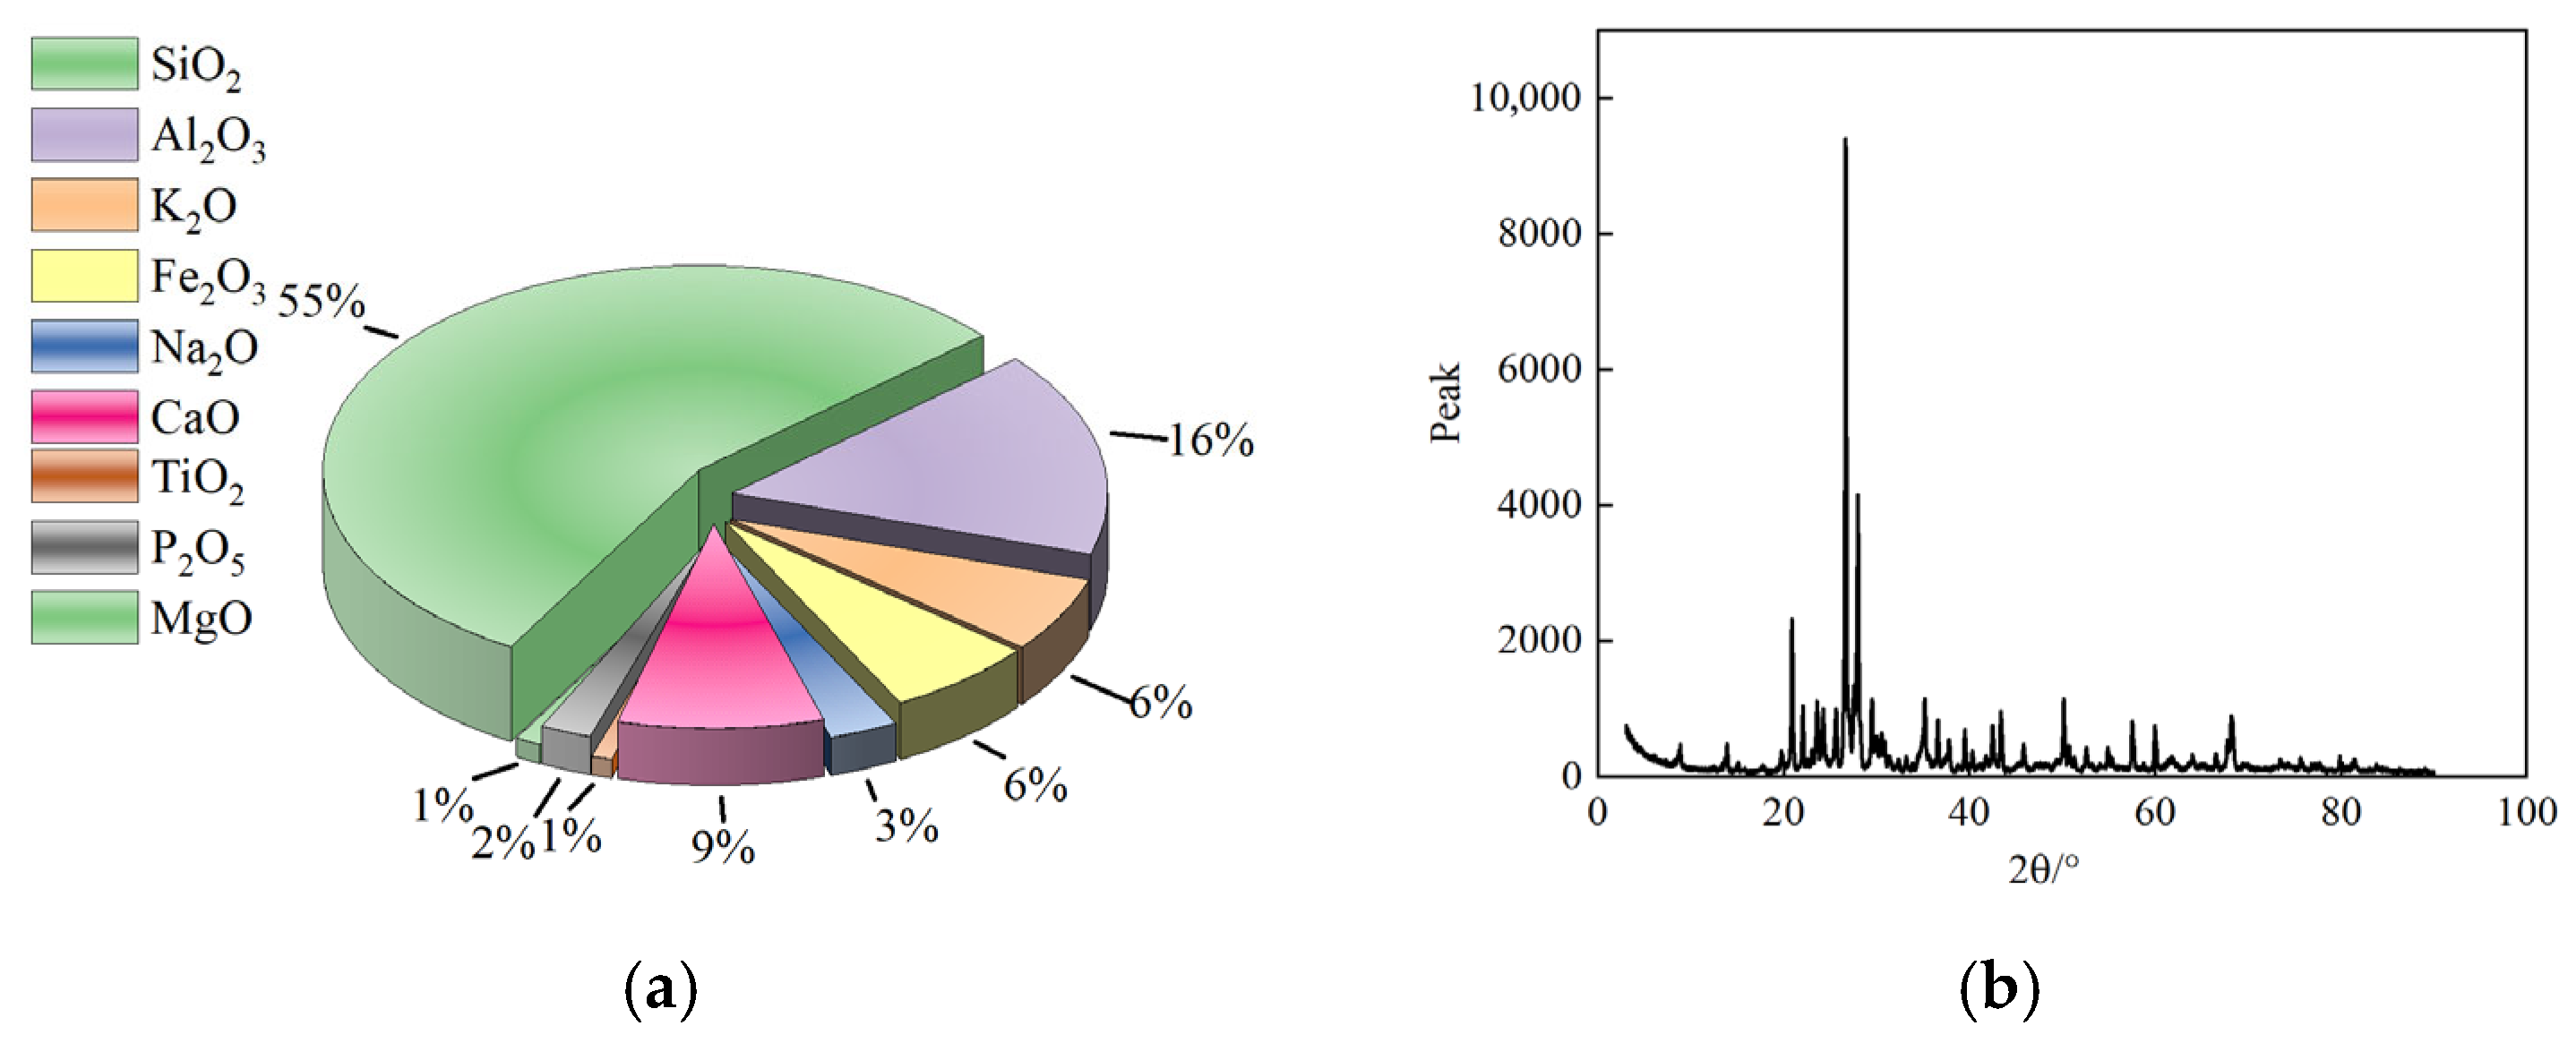
The TMS used in this experiment conforms to the requirements for sand specified in the GB/T 14684 [31]. To systematically clarify its intrinsic material properties, the XRF and XRD techniques are employed to conduct analytical tests on chemical composition and mineral composition. Figure 1 presents the XRF test results of the TMS. The chemical composition is dominated by aluminosilicates, with SiO2 having the highest proportion at 55.48%. Possessing dual properties of inertness and reactivity, SiO2 primarily plays a physical skeleton role; its particles fill internal pores of cement paste to form a continuous spatial network structure, which inhibits drying shrinkage and prolongs durability. However, the critical distinction of TMS lies in its high Al2O3 content (16.29%) and the presence of active feldspar minerals (e.g., 29.1% albite). Unlike inert quartz, the Al-O bonds in these components react chemically with CaO (8.87%) released during cement hydration. This reaction generates calcium aluminate hydrate, an early-strength phase that precipitates rapidly and accelerates setting. Furthermore, CaO regulates the pH to provide an alkaline environment, promoting pozzolanic reactions that generate C-S-H gel. The unique interplay between this accelerated early hardening (due to Al2O3) and the subsequent long-term pore filling (due to SiO2 and Fe2O3) creates a complex surface hardening process. Specifically, Fe2O3 (6.47%) particles enhance the ITZ compactness and reduce permeability. Consequently, this multi-stage microstructural evolution leads to a surface hardening process (measured by RS) that deviates from the bulk strength development (CS) of ordinary concrete, justifying the need for a specialized correlation model.
Figure 1.
The results of the XRF. (a) Chemical composition; (b) X-ray diffraction spectrum.
For the XRD test results of TMS, the Rietveld full-spectrum fitting analysis method was adopted to realize the quantitative analysis of mineral composition, as shown in Table 1. This method achieves precise estimation of the relative content of each mineral by finely analyzing the peak position, peak intensity, and peak shape of the XRD diffraction pattern, which can eliminate the interference of peak overlapping. The XRD analysis results show that the mineral composition of the TMS is dominated by quartz, albite, and plagioclase. Among them, quartz is an inert mineral with stable chemical properties, which can enhance the physical and mechanical stability of TMS and prevent volume changes in concrete. Albite and plagioclase belong to the feldspar mineral group; due to the presence of active Al-O bonds, they can undergo a slow pozzolanic reaction in an alkaline hydration environment, generating a small amount of C-S-H gel, which further strengthens the interfacial bonding performance between TMS and cement paste.
Table 1.
The results of the XRD.
2.1.2. Others
As the core component of the cementitious system in concrete, cement generates hydration products such as the C-S-H gel and calcium aluminate hydrate through hydration reaction, which are the main sources of concrete strength and durability. P.O 42.5 ordinary Portland cement (Ningbo) was selected in this experiment. This type of cement features moderate hydration rate, stable strength development and strong adaptability, and is widely used in manufactured sand concrete projects. Notably, the type and strength grade of Portland cement are key factors affecting hydration kinetics and microstructural evolution. Higher strength grade cements typically promote faster strength growth and higher surface hardness, which may shift the RS-CS correlation curve upwards. Conversely, cements with different compositions or lower strength grades may alter the early hydration kinetics, affecting the relationship at 3 d and 7 d ages. By fixing the cement type, this study eliminates the variability induced by cementitious materials, focusing on the specific contribution of TMS properties to the strength correlation [32,33,34].
Its key physical and mechanical properties are shown in Table 2, and all parameters meet the requirements of GB 175 [35], providing basic guarantee for the mechanical properties and volume stability of concrete.
Table 2.
Performance of cement.
The selection of water reducer directly affects the workability and mechanical properties of concrete. Polycarboxylate high-efficiency water reducer was adopted in this experiment. This type of water reducer disperses cement particles through the dual effects of molecular adsorption and electrostatic repulsion, which can effectively reduce the unit water consumption of concrete while improving the fluidity and wrapping property of the paste. According to the test results in accordance with GB 8076 [36], the chloride ion content of this water reducer is only 0.058%, which can avoid the risk of steel corrosion caused by chloride ions; the water reduction rate reaches 28%, which can significantly optimize the workability of concrete and reduce the dosage of cementitious materials; the bleeding rate ratio is 11%, indicating that the concrete paste has excellent water retention, which can reduce the internal porosity; the air content is 2.0%, and the appropriate air content can improve the frost resistance of concrete without causing strength loss due to excessively high air content.
As the skeleton support of concrete, the gradation continuity of coarse aggregate directly affects the compactness of concrete and the performance of interfacial transition zone. To optimize the aggregate gradation, a dual-particle size gradation scheme was adopted in this experiment: small-size coarse aggregate (4.75~16 mm) and large-size coarse aggregate (16~26.5 mm) were mixed in a reasonable proportion. Through complementary particle gradation to fill voids, the unit water consumption and cementitious material dosage of concrete were reduced. According to the test results in accordance with JTG/T 3650 [37], the bulk density of the two particle sizes of coarse aggregates is 2656 kg/m3, indicating good compactness of particle arrangement; the mud content is only 0.6%, which can avoid the adverse effects of mud impurities on cement hydration and interface bonding; the content of flat and elongated particles is 4.4%, which can ensure the mechanical stability of the aggregate skeleton and reduce stress concentration; the crushing value is 10%, reflecting the high strength and strong anti-crushing ability of the aggregate itself, which provides support for the overall mechanical properties of concrete.
To improve the workability of concrete, reduce hydration heat, and enhance long-term durability, a composite mineral admixture scheme of fly ash and slag was adopted in this experiment. The morphological effect of fly ash can optimize the fluidity of concrete paste, while the active effect of slag can undergo secondary reaction with cement hydration products to generate additional C-S-H gel. The synergistic effect of the two can realize the dual improvement of concrete workability and durability. Among them, all performance indicators of fly ash meet the requirements of GB/T 1596 [38]. The fineness is 23.4%, loss on ignition is 1.72%, water demand ratio is 96%, and 28 d activity index is 80%, which has a good pozzolanic activity and workability improvement effect. The performance of slag meets the requirements of GB/T 18046 [39]. Its density is 3.09 g/cm3, specific surface area is 410 m2/kg, 7 d activity index is 97%, and flow ratio is 100%. It can significantly improve the early strength and interface compactness of concrete.
2.2. Experimental Plan
2.2.1. Experimental Design
To obtain more abundant gradient data of concrete compressive strength and establish a more accurate correlation model between compressive and rebound strengths, combined with the characteristics of the TMS, a total of 16 groups of differentiated concrete mix proportions were designed, as shown in Table 3. The selection of 16 mix proportions is based on an L16(45) orthogonal array design, which allows for the systematic investigation of 5 key factors. The rationality and statistical sufficiency of the L16 design have been rigorously verified in previous study [40]. Variance analysis and range analysis demonstrated that the orthogonal array effectively captures the level combinations of the influencing factors and ensures that the primary effects and significant interactions are statistically detectable.
Table 3.
Concrete mix proportion.
Among them, the mass ratio of cement, mineral admixture, and coarse aggregate is set to 1:0.82:7.35, which not only ensures the sufficiency of hydration reaction in the cementitious system but also improves the compactness of concrete through aggregate gradation optimization. The dosage of polycarboxylate-based high-efficiency water reducer is fixed at 2% of the cement mass; by stabilizing the water reduction rate, it ensures the consistency of workability of concrete with different strength grades and avoids interference of workability differences on rebound test results. A dual-particle size gradation scheme was adopted for coarse aggregate, with the mass ratio of small-size to large-size coarse aggregate being 1:2.34. Through complementary particle filling, the internal porosity is reduced, the stability of the skeleton structure of concrete with different strength gradients is maintained consistently, and the additional impact of aggregate gradation on the strength–rebound correlation law is minimized.
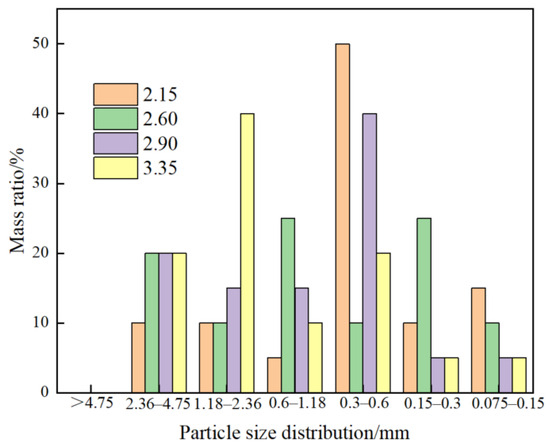
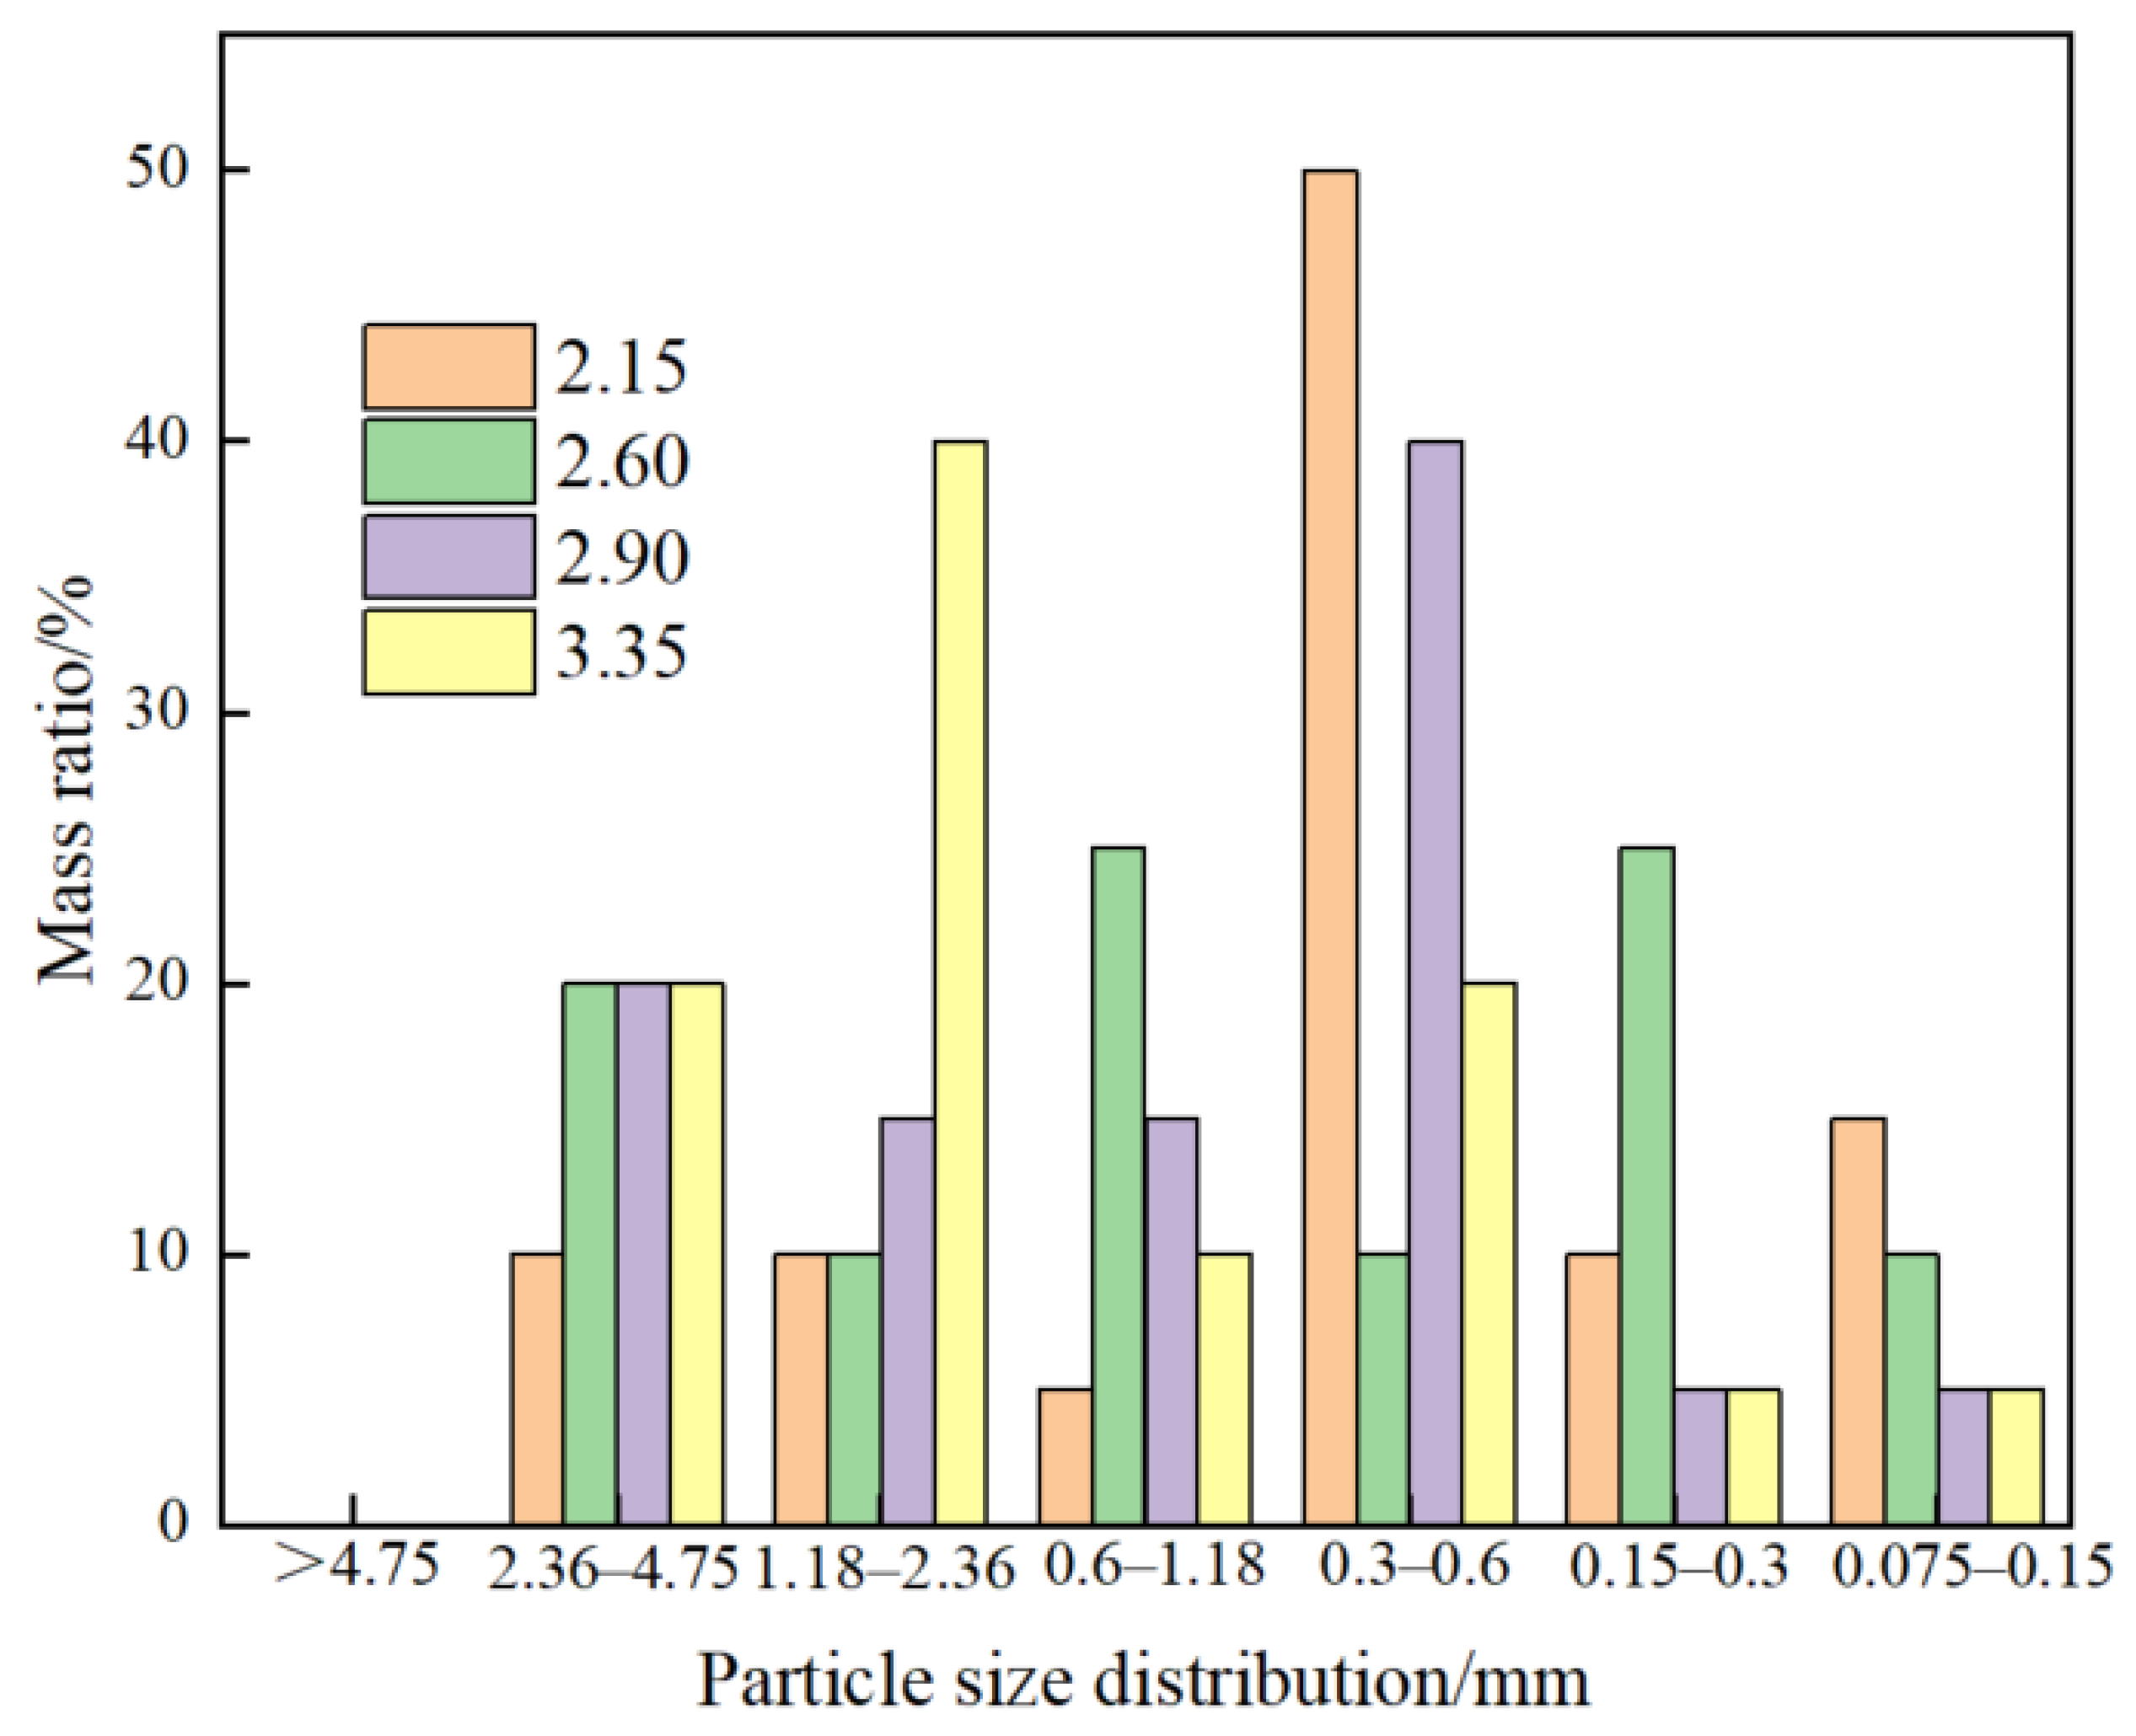
To further expand the range of compressive strength gradients, prior to the experiment, the TMS was subjected to graded sieving using a standard sieve shaker in accordance with GB/T 14684 [31]. Multiple groups of TMS samples with different fineness moduli were obtained by adjusting the sieve gradation, and the particle gradation composition corresponding to each fineness modulus is shown in Figure 2.
Figure 2.
TMS particle size distribution with different fineness moduli.
2.2.2. Preparation and Maintenance
To ensure the reliability and repeatability of test data, three 150 mm × 150 mm × 150 mm standard cubic specimens were fabricated for each mix proportion, which were used for subsequent compressive strength and rebound strength tests. The entire specimen fabrication process was strictly carried out in accordance with GB/T 50081 [41]. First, in accordance with the mix proportions shown in Table 3, cement, mineral admixtures, coarse aggregate, TMS, and mixing water were weighed separately using an electronic balance with an accuracy of 0.1 kg. The polycarboxylate-based high-efficiency water reducer was dosed at 2% of the cement mass, mixed and stirred evenly with the mixing water in advance to ensure full dissolution of the water reducer. Subsequently, a forced concrete mixer was used for mixing. The aggregate, cement, and mineral admixtures were dry-mixed uniformly, and then the mixed solution of water and water reducer was added for wet mixing until uniformity was achieved. The dry mixing time was not less than 120 s, and the wet mixing time was not less than 180 s, until the concrete mixture exhibited uniform color, no segregation, and no bleeding. After mixing, molds were selected. The inner walls of the molds were cleaned and coated with a thin layer of engine oil as a release agent. The mixture was poured into the molds in two layers, with each layer height accounting for approximately 1/2 of the mold height. Each layer was vibrated uniformly using an inserted vibrator until the surface was flushed with paste and no obvious bubbles escaped, with the vibration time controlled at 20–30 s per layer. Finally, a straightedge was used to scrape off the excess mixture, and a trowel was used to compact and smooth the surface.
The entire specimen curing process was performed in accordance with GB/T 50081 [41]. After fabrication, the specimens were placed indoors together with the molds for initial curing at a temperature of 20 ± 5 °C and relative humidity ≥ 50% for 24 h. During this period, collision and vibration of the molds were avoided to ensure the stable initial setting and hardening of the concrete. After initial curing, the molds were carefully removed to prevent damage to the specimen edges and corners. Immediately after demolding, the appearance of the specimens was inspected, and those with defects such as chipped edges, cracks, and surface honeycombing were rejected. If the number of defective specimens exceeded one per group, the group of specimens was remanufactured. Subsequently, the qualified specimens were placed in a standard curing box, with the curing conditions controlled at a temperature of (20 ± 2) °C and relative humidity ≥ 95%. The specimens were placed on brackets to avoid direct contact with the inner wall of the curing box or other specimens, ensuring uniform humidity around the specimens. When the specimens were cured to the ages of 3 d, 7 d, and 28 d, they were taken out for rebound value testing and compressive strength testing.
2.2.3. Rebound and Compressive Strengths
To save test costs, the RS and CS tests are carried out simultaneously. After the specimens are cured to the ages of 3 d, 7 d, and 28 d, the RS test is first conducted in accordance with JGJ/T 23 [42], and then the compressive strength test is performed in accordance with GB 50081 [41].
- (1)
- Pre-test preparation
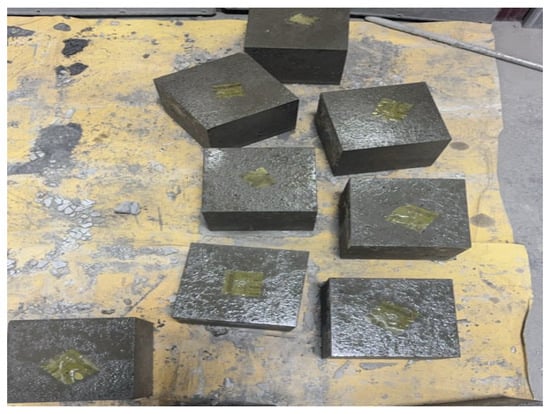
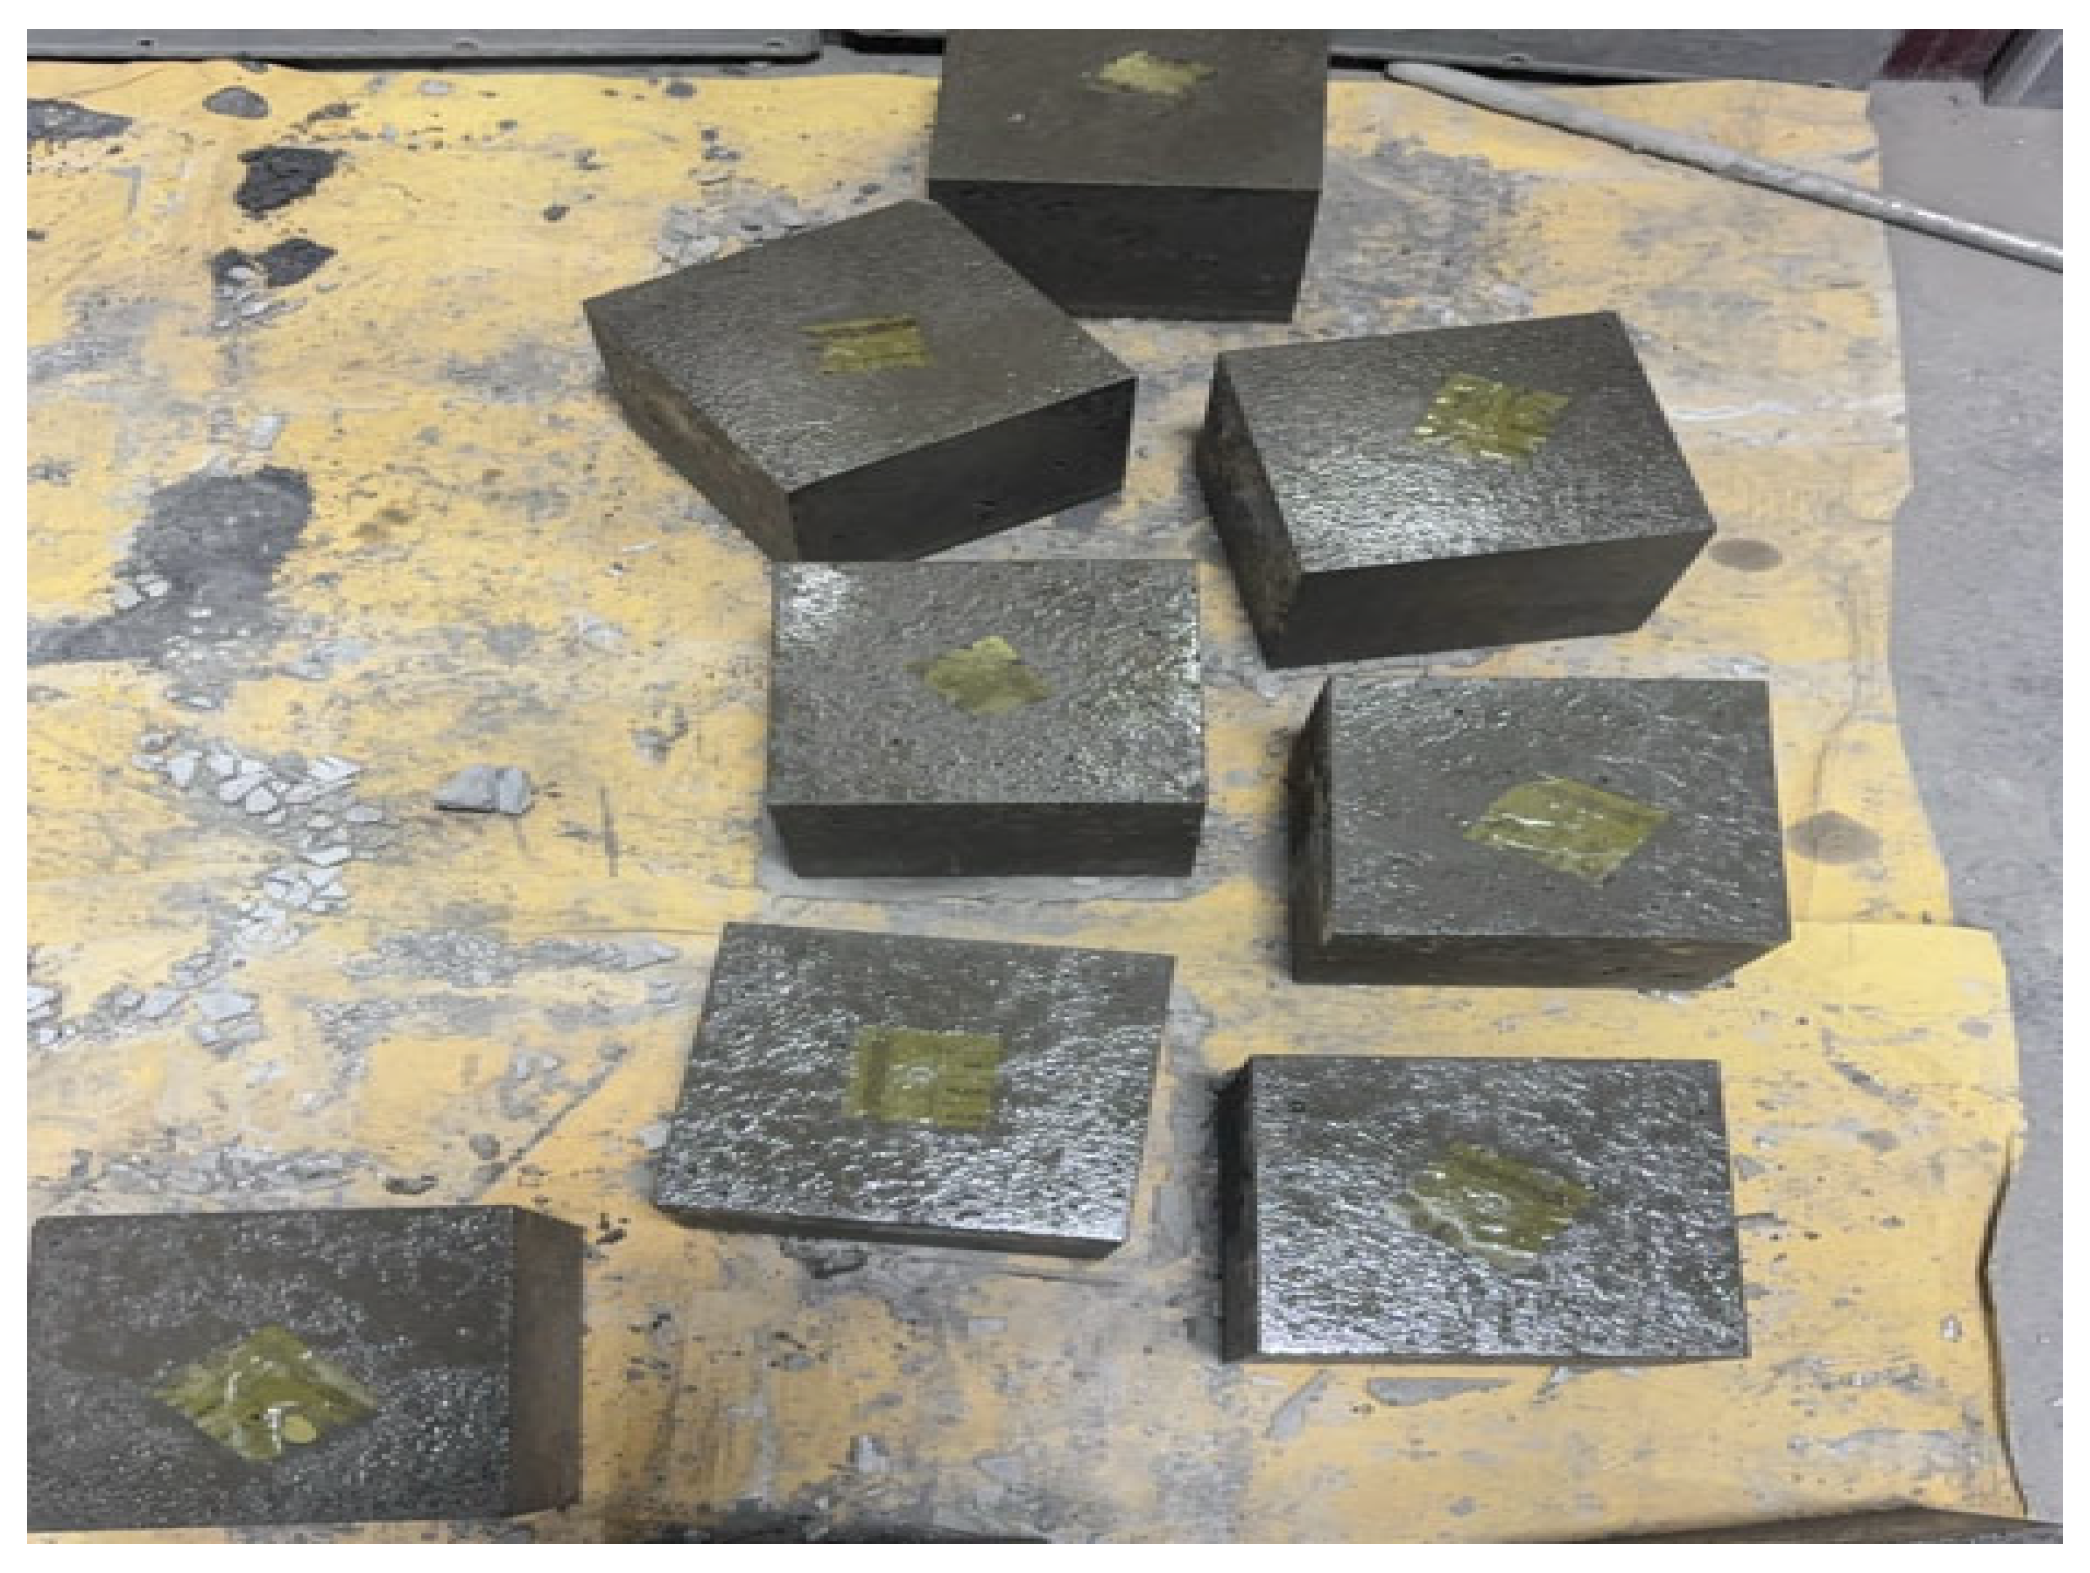
Specimens reaching the target age are taken out of the standard curing box, and their surface moisture and stains are wiped clean with a dry rag. These specimens are then placed in a laboratory environment with a temperature of 20 °C and allowed to stand for 2~4 h, to ensure the surface temperature of the specimens is consistent with the ambient temperature, thus avoiding test errors caused by temperature differences, as shown in Figure 3. A vernier caliper is used to recheck the dimensions of the specimens, and an appearance inspection is conducted simultaneously.
Figure 3.
Specimen standing.
- (2)
- Rebound strength test
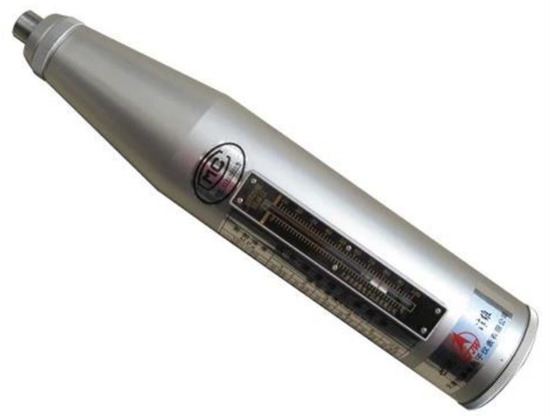
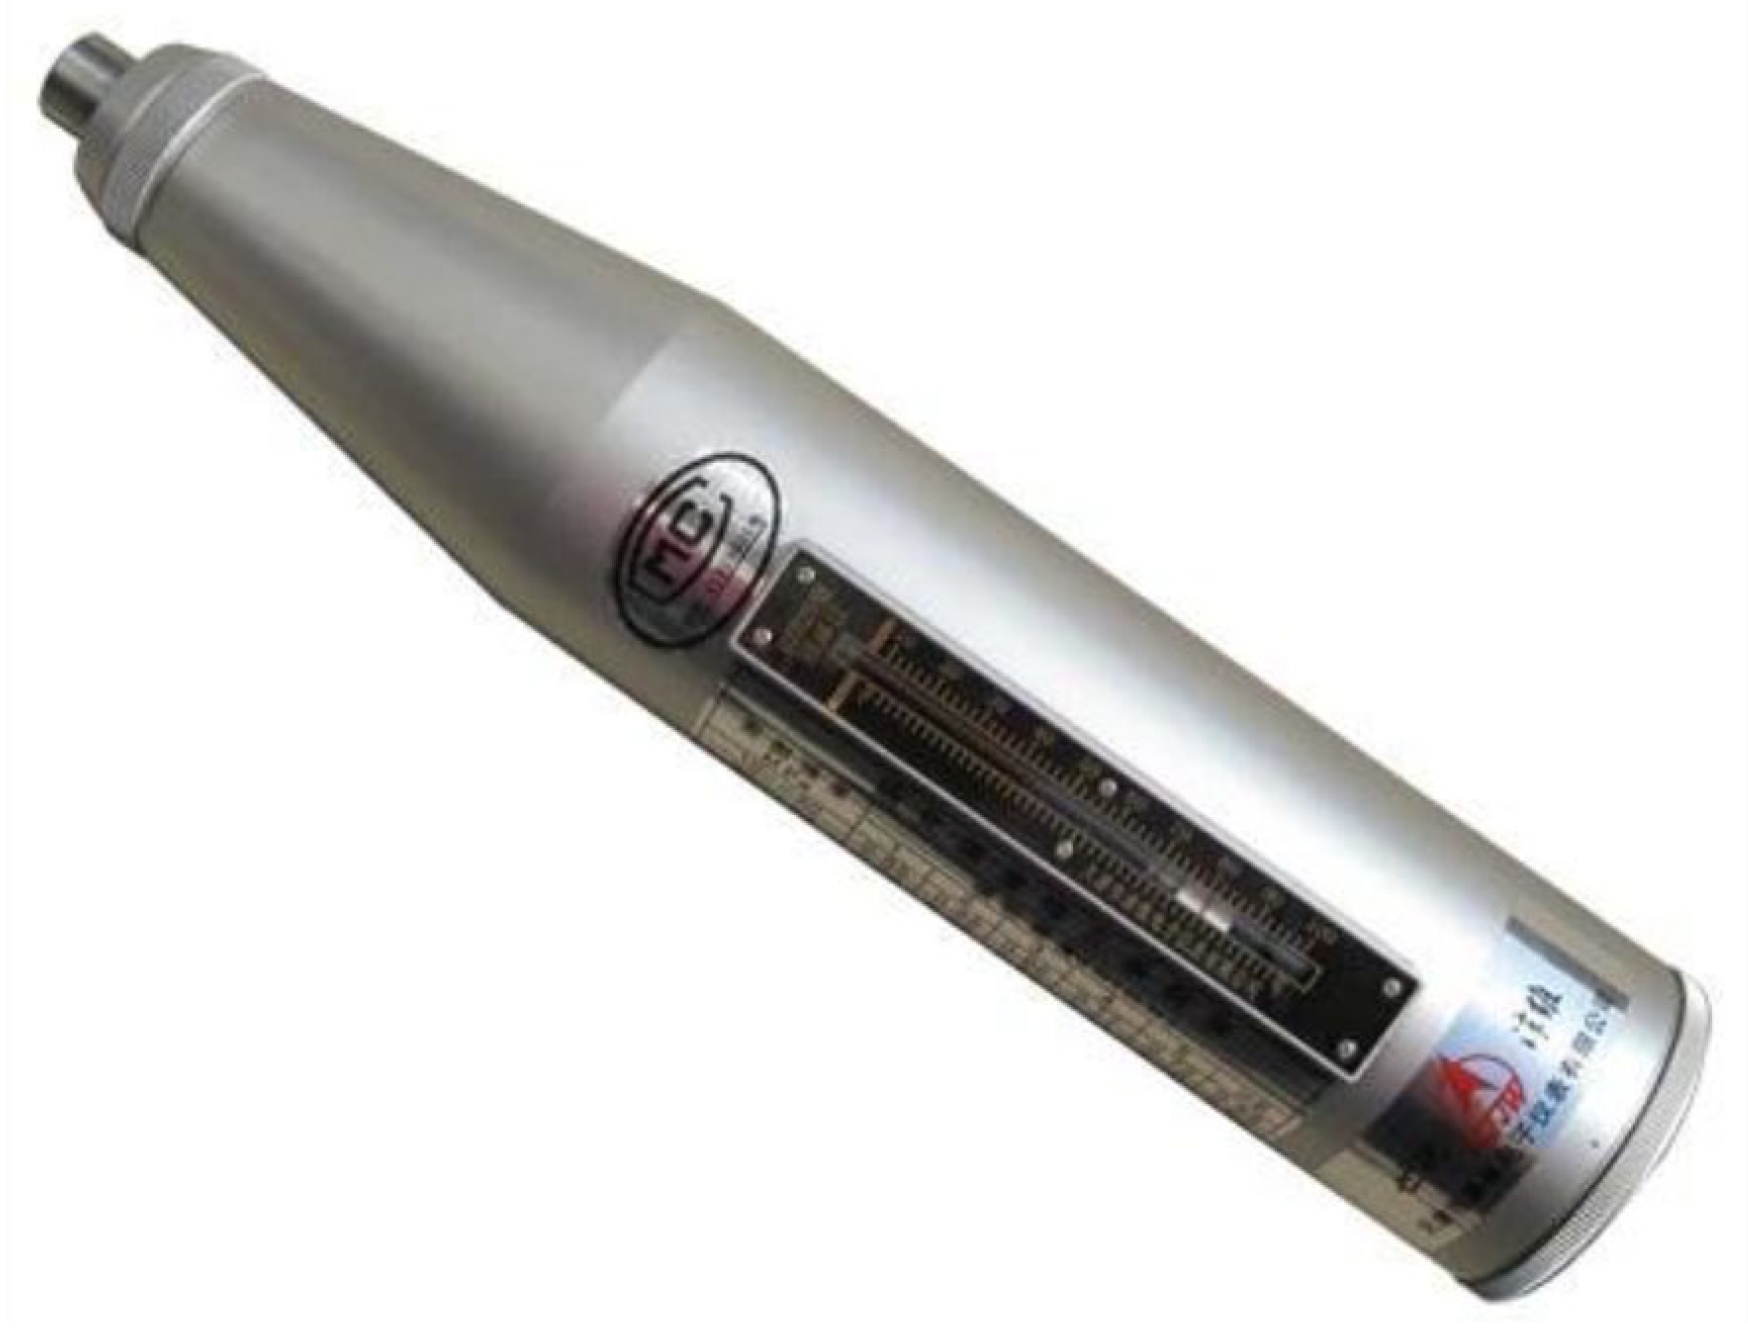
Before the RS test, align the rebound hammer (Figure 4) vertically with the center of the standard anvil. Press the rebound hammer gently to extend the impact rod and make it prop against the anvil, then press the impact rod back with uniform force. After the impact hammer unhooks and strikes, read the RS value. Conduct the impact continuously 3 times, and take the average value of the last 2 RS values as the calibration value. Check whether the impact rod of the rebound hammer is flexible, whether the pointer returns to zero, and whether the dial is clear, so as to ensure that the impact hammer moves without jamming and the end of the impact rod is free from deformation. Take the side face of the 150 mm × 150 mm specimen as the test surface, and select 2 opposite side faces of each specimen as effective test surfaces. Divide one test area on each test surface, and the distance from the edge of the test area to the corner of the specimen shall not be less than 20 mm. If there are defects on the specimen surface, the test area shall be reselected or the specimen shall be rejected.
Figure 4.
Rebound tester.
During the test, the axis of the rebound hammer shall always be perpendicular to the test surface of the specimen. The tester shall stand stably, keep the arms naturally relaxed, and apply force uniformly to avoid the rebound hammer tilting or excessive force causing the impact direction to deviate. When striking, push the rebound hammer toward the test surface quickly and stably to make the impact rod contact the test surface closely and keep perpendicular. After the impact is completed, release the rebound hammer slowly and read the rebound strength indicated by the pointer. Arrange 16 impact points evenly in each test area, and no repeated impact is allowed on the same impact point. Read the value immediately after each impact. After completing the impact of 16 points continuously, eliminate the 3 maximum values and 3 minimum values, and take the arithmetic average of the remaining 10 rebound values as the average rebound value of the test area, as shown in Equation (1).
where RS is the rebound strength, Ri is the rebound strength of the i-th effective hit point, and n is the number of effective impact points calculated.
- (3)
- Compressive strength test
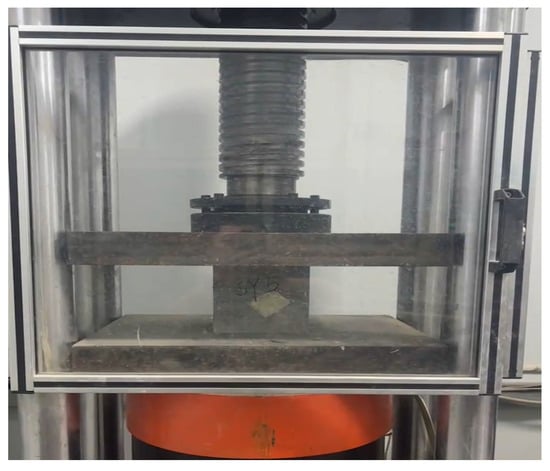
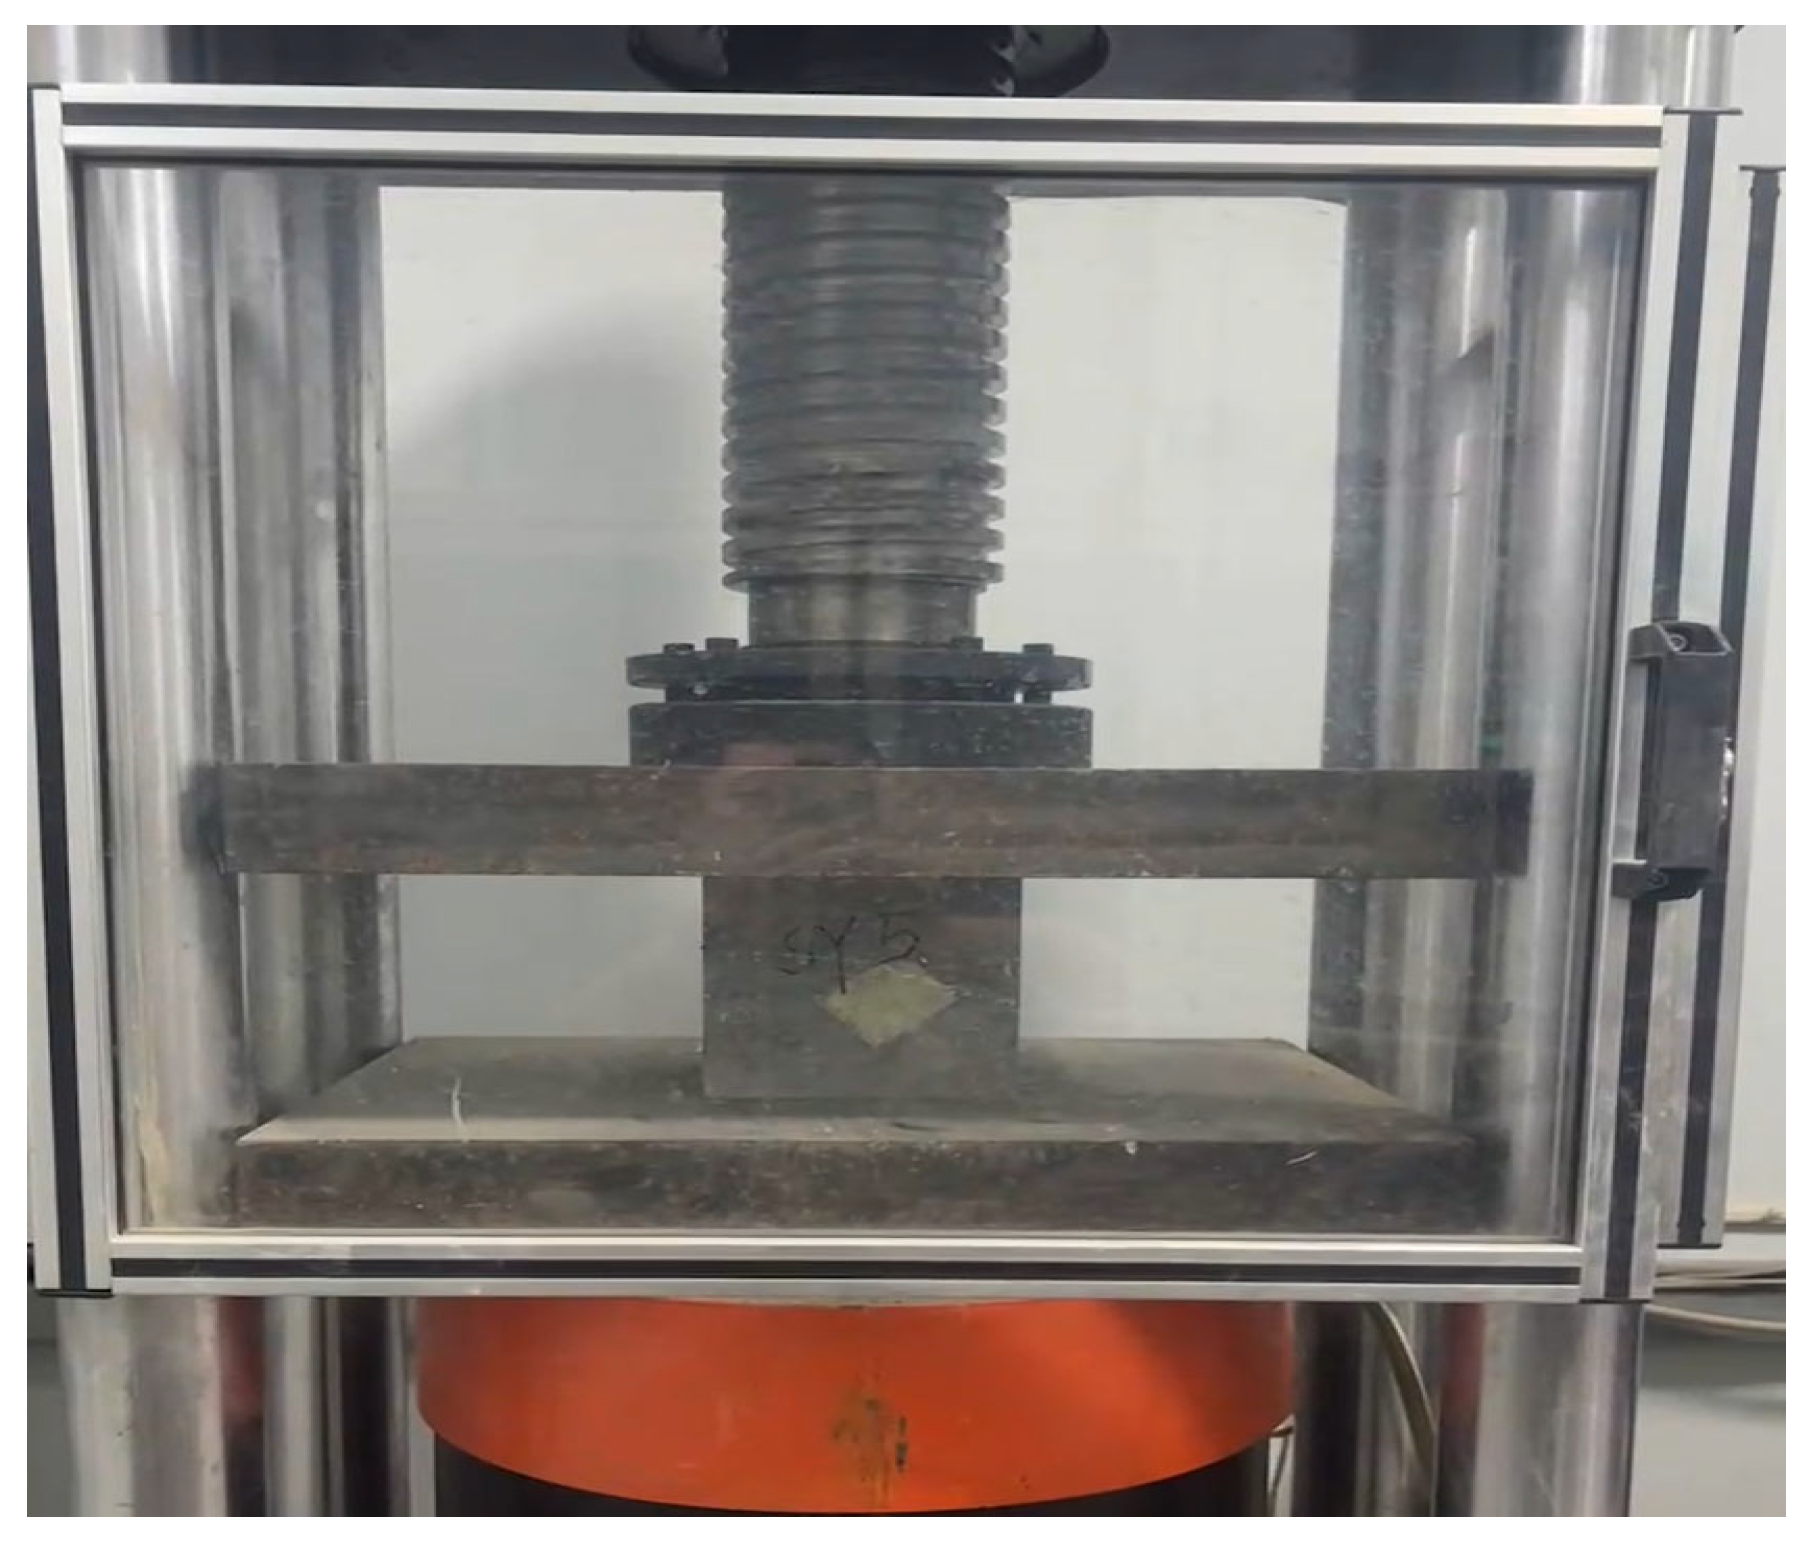
The specimens are placed at the center of the lower bearing plate of the compression testing machine. Continuous loading is applied until the specimens fail, when obvious cracks appear on the specimen surface, and the load starts to decrease. Loading is continued until the specimens are completely damaged, as shown in Figure 5. The maximum load at the time of specimen failure is recorded.
Figure 5.
Compressive strength test.
The cubic compressive strength of concrete is calculated according to Equation (2), and the average value of three specimens is taken as the final representative value of the compressive.
where CS is the compressive strength, F is the maximum load in the test, and A is the area of the specimen.
2.3. Comparsion Method of Models
In the performance comparison of fitting models, the R2 is a commonly used indicator to measure a model ability to explain observed data. The closer its value is to 1, the better the model fits the existing data. However, relying solely on R2 to judge model quality has significant limitations, which are particularly prominent in engineering multi-factor modeling.
To address the above shortcomings, this study employs the AIC and BIC for systematic model evaluation. Both methods quantify model quality using information loss as the core indicator, and establish a balance mechanism between model goodness-of-fit and complexity by introducing parameter penalty terms. They not only avoid overfitting caused by pursuing high R2 but also prevent underfitting due to overly simple models. As classic methods in statistical modeling, regression analysis, and machine learning, AIC and BIC can accurately screen out the optimal model with strong interpretability and excellent generalization ability from multiple candidate models, providing more reliable model support for engineering issues.
2.3.1. AIC
The core essence of the AIC is to inversely quantify the information loss of a model through the degree of support that the model provides for observed data, and this degree of support is measured by the likelihood function. In brief, the likelihood function describes the probability of the occurrence of observed data under the premise that the model parameters are known, and its logic is exactly the opposite of that of the probability function; the latter infers the probability of parameters based on known data, while the former infers the possibility of data occurrence based on known parameters. For continuous observed data, if the model error is assumed to follow a normal distribution, the mathematical expression of the likelihood function is shown in Equation (3).
where L is likelihood value, θ is the model parameter vector, y is observed data vector, n is sample size, yi is measured value of the i-th, is model predicted value of the i-th, and σ is standard deviation of model error.
Since the likelihood function adopts a multiplicative form, direct calculation is prone to overflow due to excessively small values, leading to calculation failure. To address this, a natural logarithm transformation is applied to convert the multiplicative operation into an additive operation, and the log-likelihood function is finally obtained, as shown in Equation (4).
Based on the concept of entropy in information theory, define model information loss as the sum of fitting loss and complexity penalty. Through further derivation of the log-likelihood function, the basic formula of AIC is finally obtained, as shown in Equation (5).
Among them, k represents the total number of independent parameters to be estimated in the model, including the independent variable coefficients and the intercept term.
It can be seen from the formula logic that the value of AIC comprehensively reflects the fitting effect and simplicity of the model: the better the fitting and the more concise the parameters, the smaller the AIC value, which means the more excellent the comprehensive performance of the model.
2.3.2. BIC
The core essence of the BIC is to quantify the superiority of a model by evaluating its posterior probability given observed data, rooted in Bayes’ theorem. This posterior probability, reflecting the credibility of the model being true when data is known, is jointly determined by the model fitting ability and structural simplicity, with the likelihood function serving as the fundamental metric for measuring fitting performance, just as in AIC. In brief, the BIC inherits the use of the likelihood function to characterize data-model matching, but differs fundamentally in its theoretical underpinning: it focuses on maximizing the model’s posterior probability rather than minimizing information loss, as shown in Equation (6).
The smaller the BIC value, the higher the posterior probability of the model, indicating that it is more likely to be the true model that conforms to the data generation mechanism. Notably, compared with AIC, BIC shows a more obvious preference for simple models, especially in large-sample scenarios, as the penalty for complex models is significantly amplified by the ln(n) term, effectively avoiding overfitting caused by excessive pursuit of fitting accuracy.
3. Results and Discussion
3.1. Correlation Model
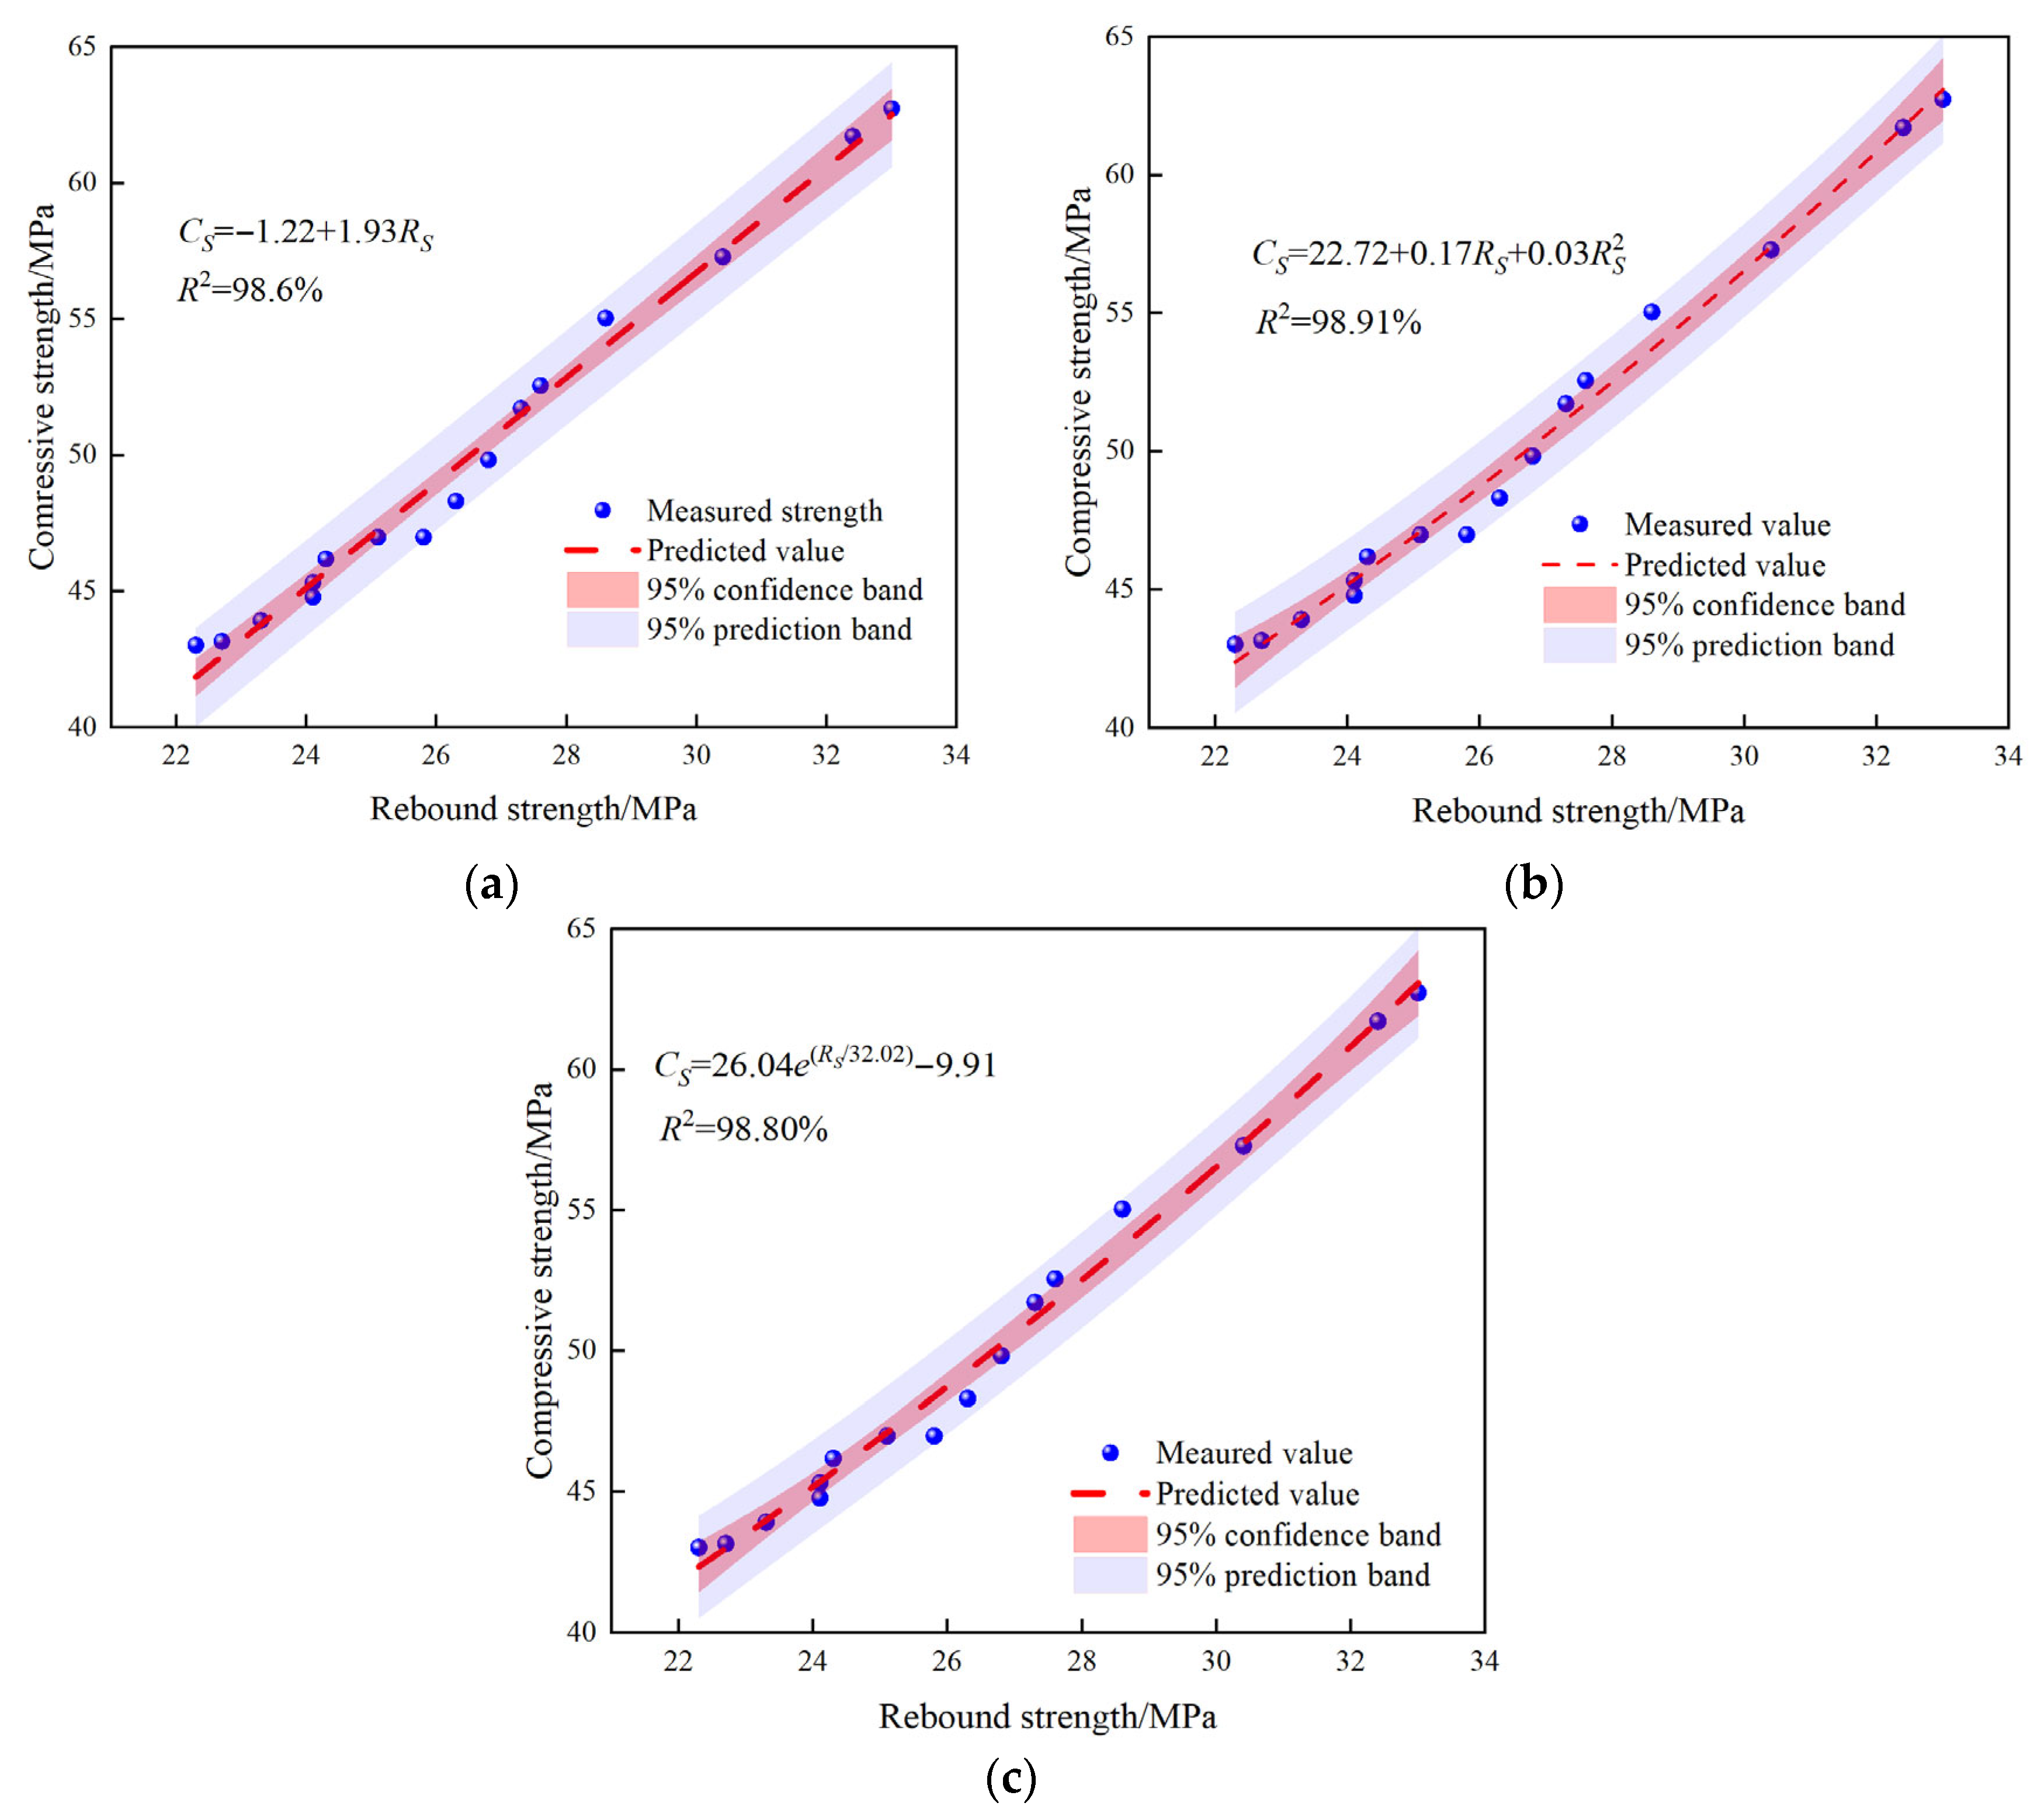
Taking 16 groups of the TMS concrete specimens as research samples, the rebound strength and compressive strength at 3 d, 7 d, and 28 d ages are collected. For the compressive strength, the arithmetic mean of the strengths of three specimens in each group is adopted; for the rebound strength, the average rebound value of two test areas on each specimen was first calculated, and then the average of the rebound strength from three specimens is taken as the representative rebound value of the group. Combined with the hydration reaction law of concrete, the material characteristics of the TMS, and the intrinsic correlation between rebound values and compressive strength values, three mathematical models, linear function, quadratic polynomial, and exponential function, are used for fitting analysis.
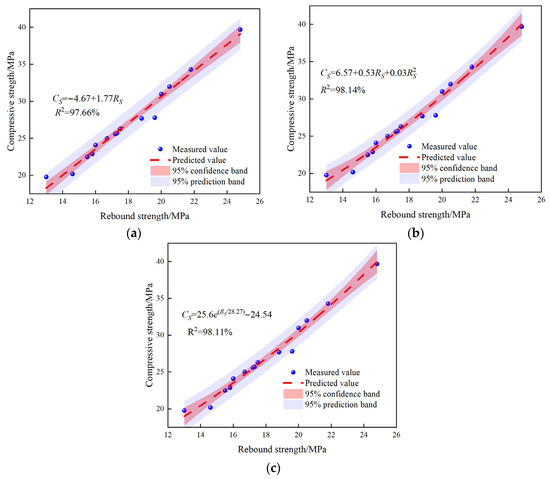
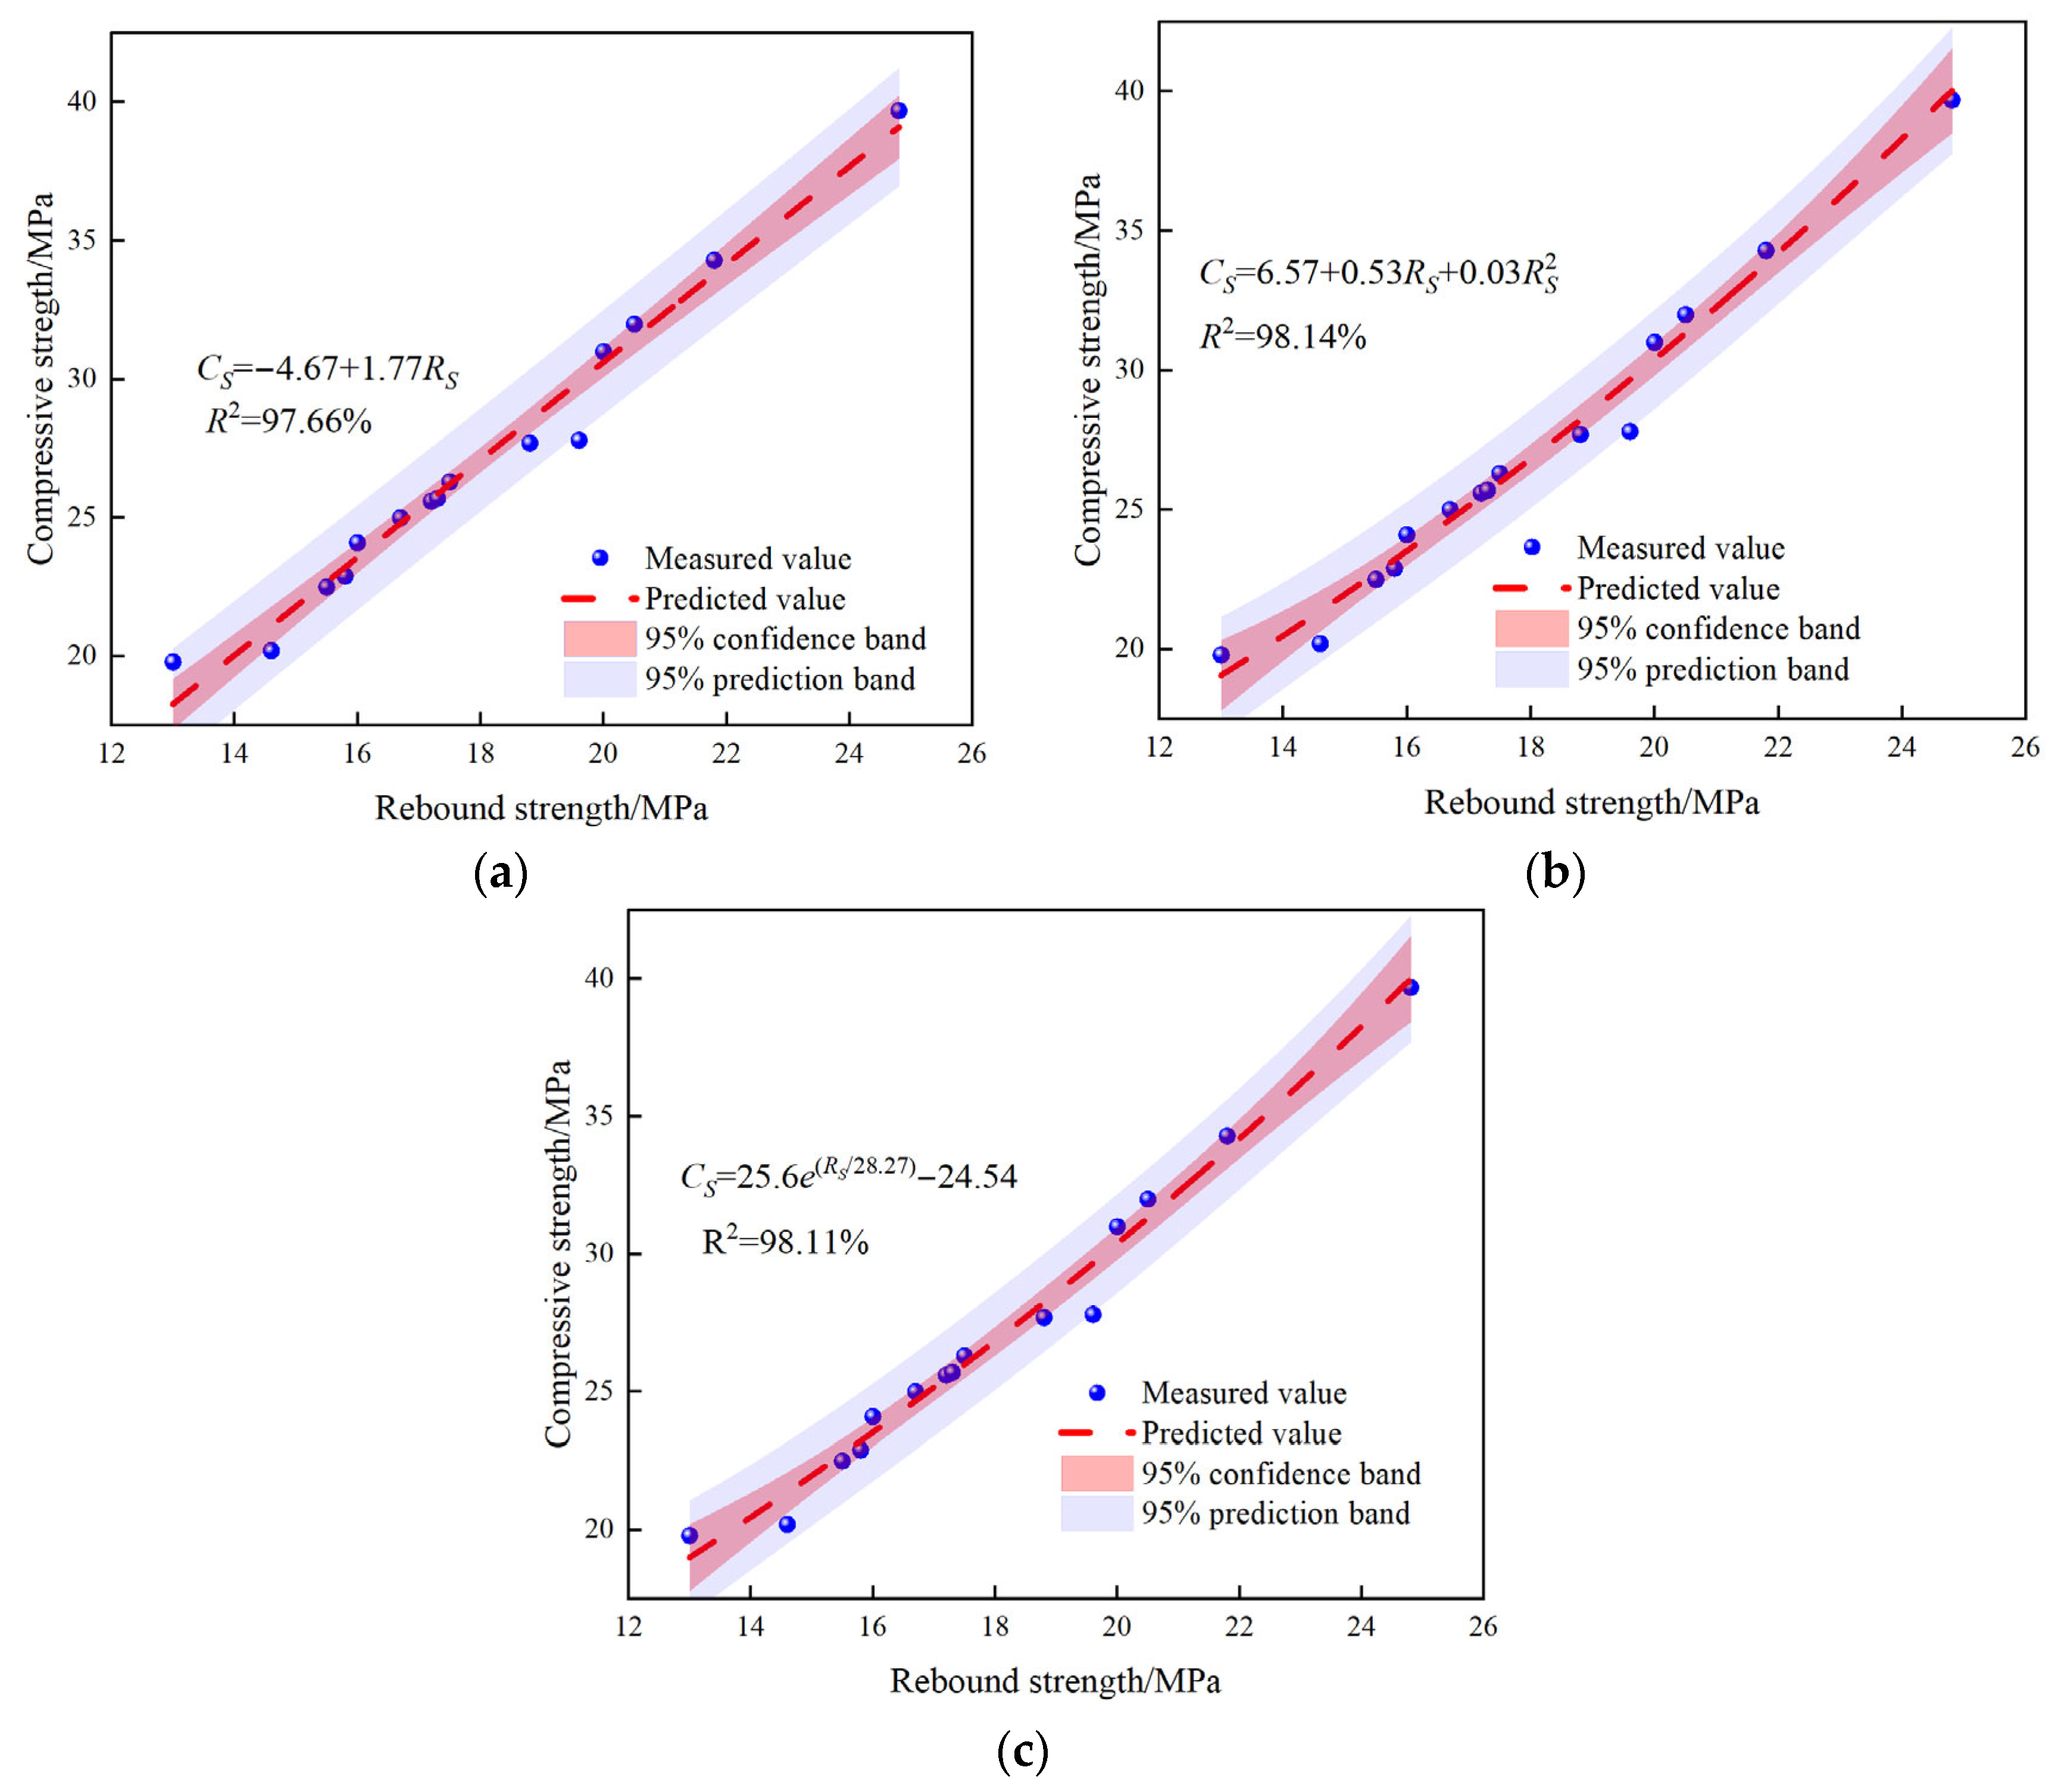
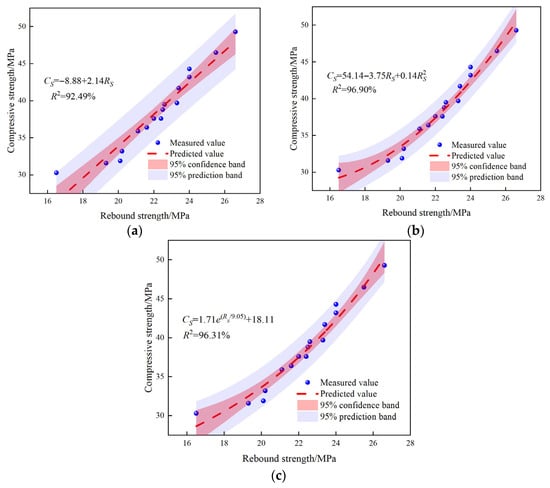
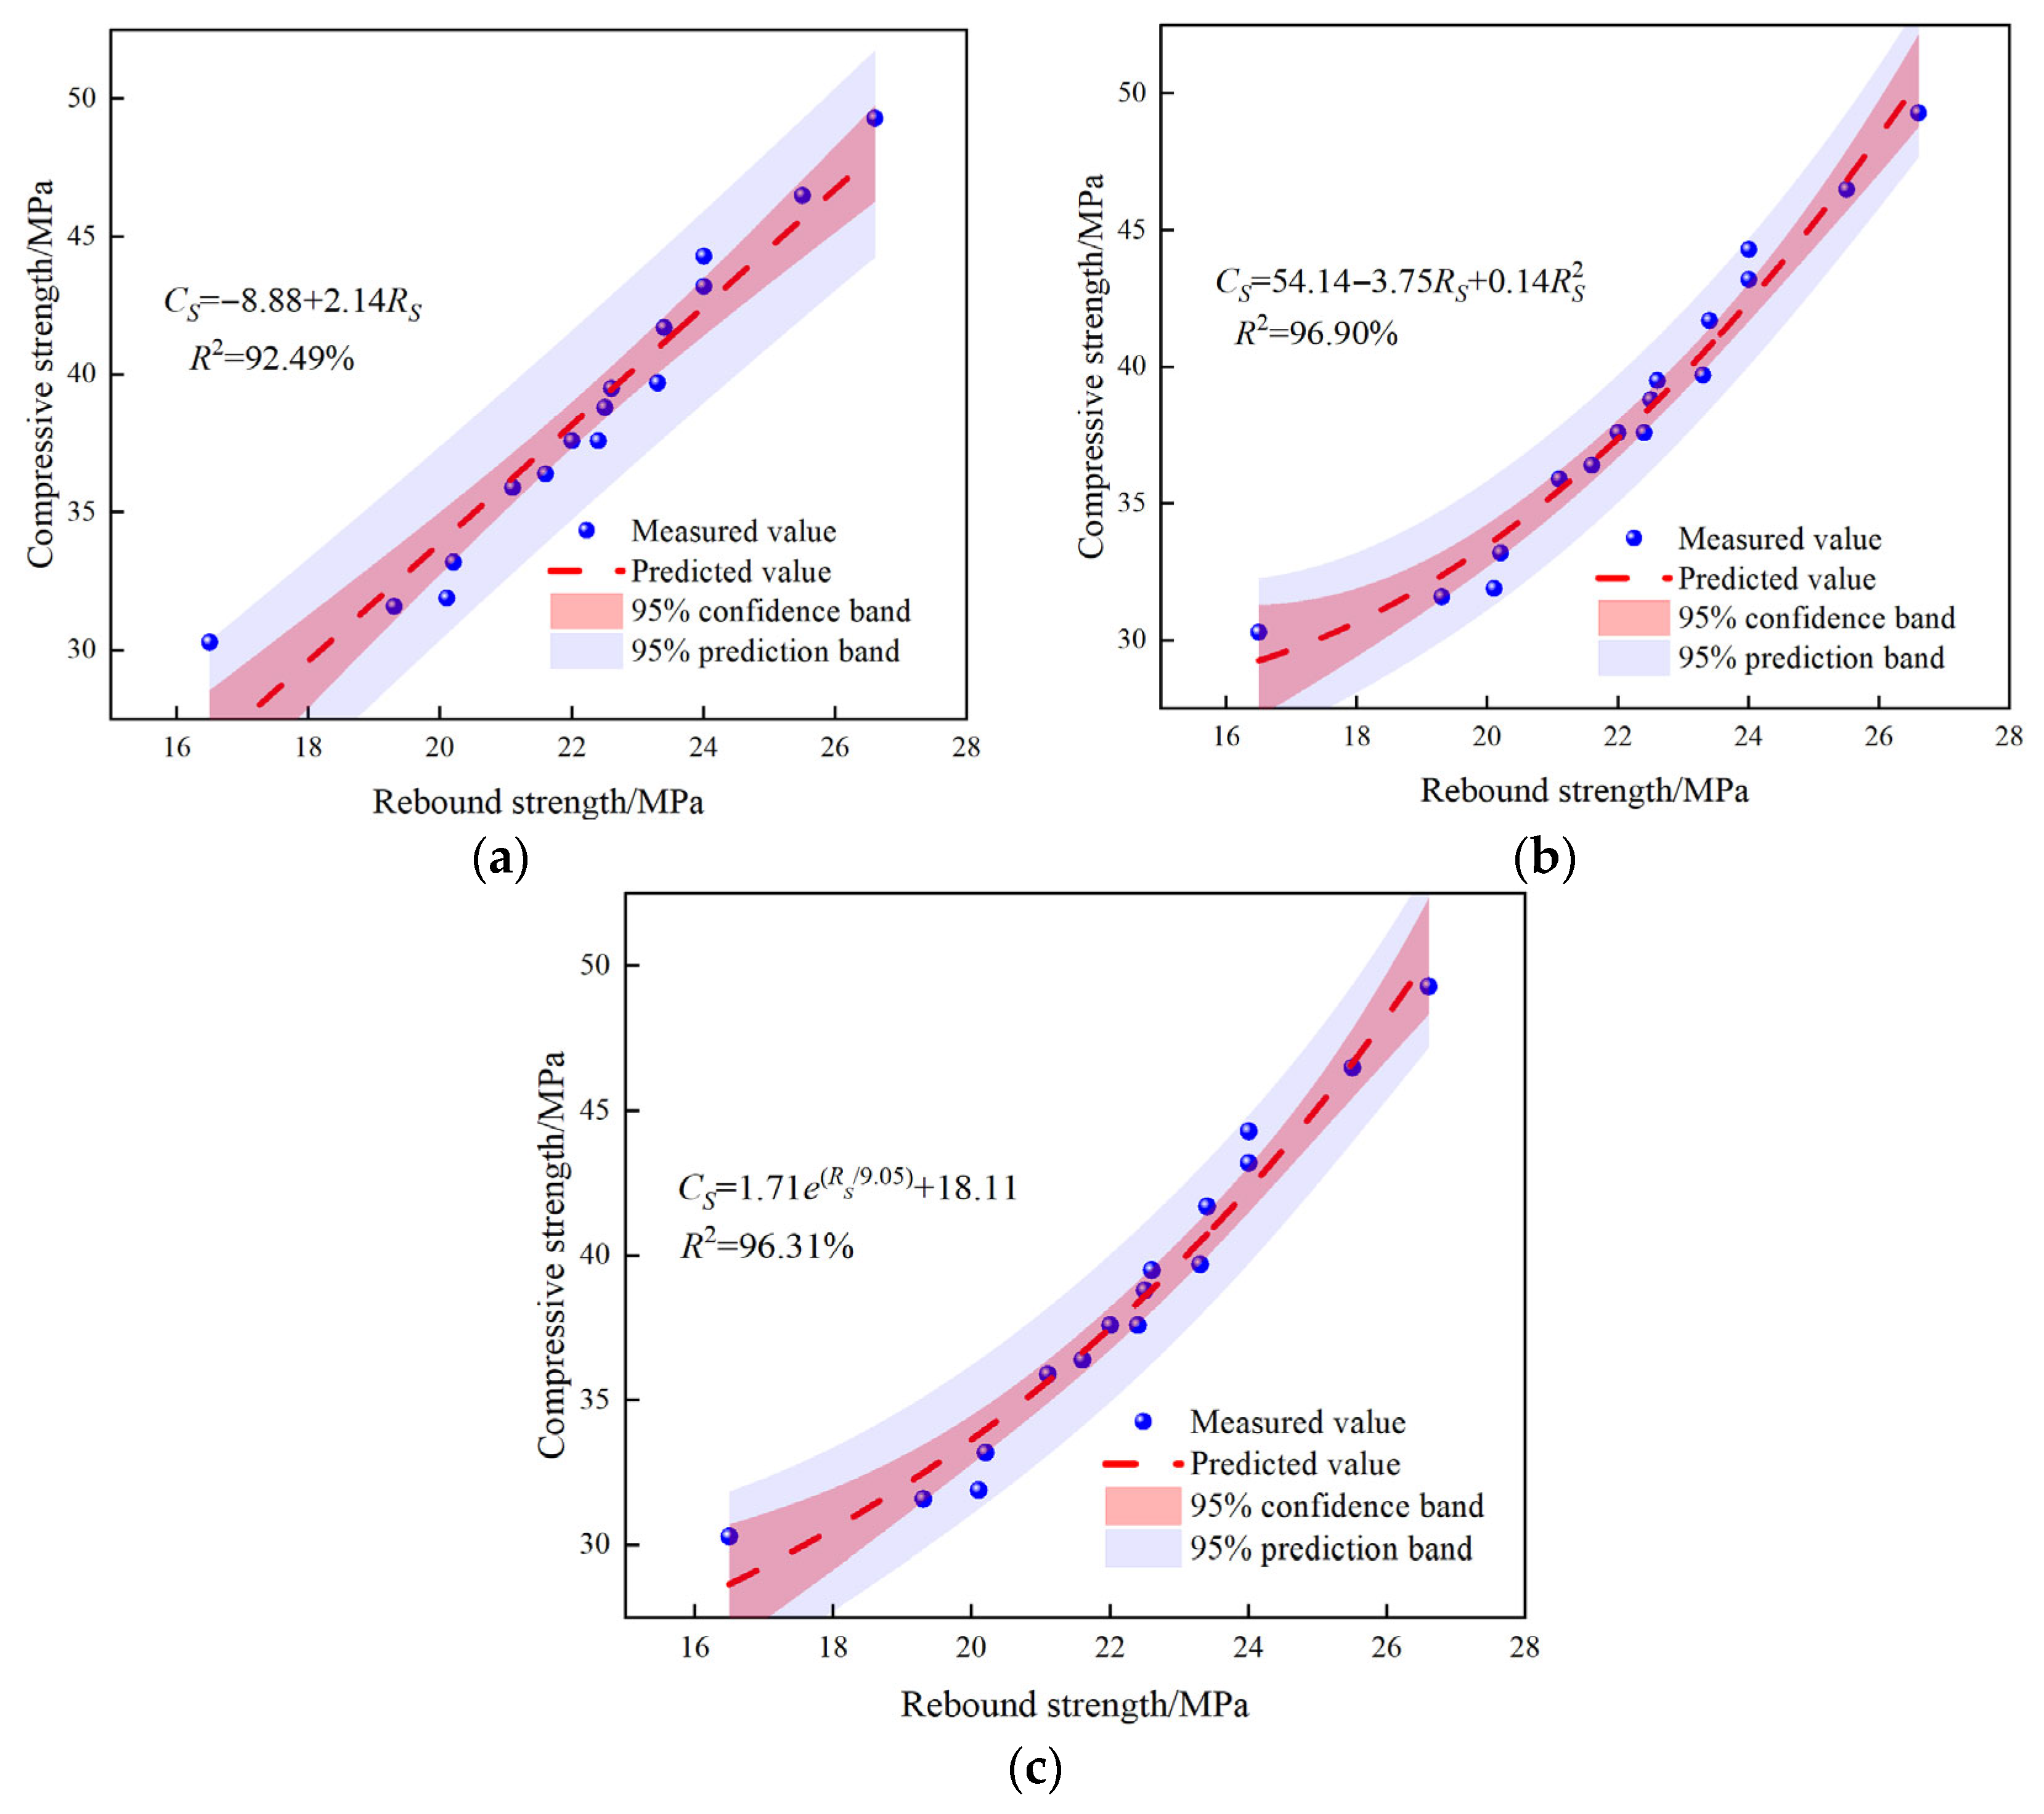
Figure 6, Figure 7 and Figure 8, respectively, illustrate the functional fitting relationships between the compressive strength and rebound strength of concrete at three critical ages. In terms of fitting accuracy, the R2 of all models stably exceeds 92%, demonstrating excellent goodness of fit.
Figure 6.
Three d related models. (a) Linear fitting; (b) quadratic polynomial fitting; (c) exponential fitting.
Figure 7.
Seven d related models. (a) Linear fitting; (b) quadratic polynomial fitting; (c) exponential fitting.
3.2. F-Test
A high R2 can only reflect the goodness of fit to the existing sample data, but cannot verify the statistical significance of the fitting relationship, that is, whether the correlation between rebound strength and compressive strength is an accidental phenomenon, or whether the model truly captures the inherent law between them. Without rigorous statistical testing, spurious fitting may occur, thereby reducing the reliability and promotion value of the model in engineering practice. As a core statistical method for verifying the overall significance of regression models, the F-test aims to confirm whether the explanatory effect of the independent variable on the dependent variable in the constructed fitting model is statistically meaningful, i.e., whether the model is overall significant.
Figure 8.
Twenty-eight d related models. (a) Linear fitting; (b) quadratic polynomial fitting; (c) exponential fitting.
The F-statistic is defined as the ratio of the mean square of regression (MSR) to the mean square of error (MSE), as shown in Equation (7).
where SSR is the sum of squares of regression, SSE is the sum of squares of error, n is the sample size, and k is the number of independent variables in the model.
H0:
All regression coefficients of the model are 0, i.e., the independent variableRShas no significant explanatory effect on the dependent variableCS, and the model is overall insignificant;
H1:
At least one regression coefficient of the model is not 0, i.e., the independent variableRShas a significant explanatory effect on the dependent variableCS, and the model is overall significant.
After calculating the F-statistic, it is compared with the critical value (Fcr) corresponding to the degrees of freedom, residual degree of freedom, and significance level (α = 0.05) in the F-distribution table.
If F > Fcr and p < 0.05, the null hypothesis (H0) is rejected, and the model is considered overall significant; otherwise, the null hypothesis (H0) is accepted, and the model is considered overall insignificant.
Based on the original data of rebound strength and compressive strength of concrete at 3 d, 7 d, and 28 d, as well as the respective fitting formulas, the F-statistic and p-value of each model were calculated using MATLAB software (2024a), and the test results are summarized in Table 4. The results show that the linear, quadratic polynomial, and exponential fitting functions at the three ages can all significantly capture the inherent correlation between CS and RS, and the models are overall significant.
Table 4.
F-test results.
3.3. Model Evaluation
Table 5 summarizes the comprehensive evaluation results of each fitting model across different ages. Combined with the fitting mechanism and statistical test conclusions presented earlier, it can be clearly observed that the correlation between rebound strength and compressive strength of TMS concrete is best adapted to linear fitting at 3 d, quadratic polynomial fitting at 7 d, and exponential fitting at 28 d. Therefore, in practical engineering applications, differentiated fitting functions should be adopted for TMS concrete at the three critical age, and a piecewise function model should be established to achieve accurate estimation of the full-age strength, as shown in Equation (8).
Table 5.
Evaluation results of correlation models.
The micro-mechanism of concrete strength development determines the correlation mode between the RS and CS, while the mathematical characteristics of different functions precisely match the correlation laws of each age.
The 3 d age is in the early stage of hydration. The clinker minerals (C3S, C3A) in cement have just initiated hydration reactions, and the generated calcium silicate hydrate (C-S-H) gel and ettringite (AFt) are small in quantity and loosely distributed, resulting in high internal porosity and poor structural uniformity of concrete. Meanwhile, the stone powder effect of the TMS has not been fully exerted, leading to a synchronous and approximately linear growth relationship between RS, which reflects surface hardness and CS, reflecting the overall mechanical properties. With the continuous generation of hydration products, the surface hardness of concrete increases linearly, and the overall compressive strength also grows linearly, without obvious inflection points or saturation trends, showing a simple monotonic increasing characteristic. Therefore, linear fitting is the most suitable choice. From a mechanical perspective, early-stage concrete behaves as a porous and relatively homogeneous elastoplastic body. At this stage, the elastic modulus is low; both surface hardness and internal CS are directly limited by the quantity of primary hydration products. Since no complex mechanical gradients have yet formed within the internal structure, the mechanical response of the surface and the internal body is linearly proportional. RS directly reflects the linear growth of CS.
The 7 d age enters the accelerated hydration stage. The degree of cement hydration increases rapidly, a large amount of C-S-H gel is generated and interweaves into a continuous network, the internal porosity of concrete decreases significantly, and the rate of structural densification accelerates. At this time, the stone powder effect of TMS is fully manifested: stone powder particles fill capillary pores and optimize the aggregate-paste ITZ, resulting in asynchrony between the growth rates of RS and CS. In the early stage, RS grows slowly; in the later stage, RS increases rapidly, while CS maintains an accelerated growth trend. This leads to a nonlinear inflection point characteristic of slow first and then fast in the correlation between RS and CS. At this time, the correlation is no longer a constant rate growth, and the inflection point characteristic of the quadratic polynomial function can accurately capture this rate change, making it the optimal fitting choice for the 7 d age. The non-linearity at this stage stems primarily from the mechanical evolution of the aggregate-paste ITZ. As the mineral components in the TMS, such as quartz and albite, interact with the cement matrix, the ITZ becomes significantly densified. This physical filling effect causes the growth rate of surface stiffness to surpass that of volumetric strength, creating a physical inflection point. The quadratic term captures this acceleration of surface hardness relative to compressive strength induced by the improvement in interfacial mechanical properties, reflecting the optimization of internal stress transmission mechanisms.
The 28-day age is characterized by near-saturated hydration. The degree of cement hydration approaches the limit, C-S-H gel forms a dense and continuous spatial network, the internal porosity of concrete drops to a low level, and strength growth slows down and gradually approaches the limit value. The interface optimization and pore-filling effects of TMS have reached the optimal state: the growth of RS gradually saturates, while CS still grows slowly but with a significantly reduced growth rate, showing a correlation mode of RS growth to CS slowly approaching the limit value. The asymptotic saturation characteristic of the exponential function can precisely match this law, so exponential fitting is the most reasonable choice for the 28 d age. Mechanically, by this stage, the elastic modulus of the concrete surface has approached its physical limit. The surface layer responds to the impact of the rebound hammer like a near-rigid body, causing the growth of RS to tend towards an asymptotic saturation. However, due to the continuation of internal chemical bonding, the CS continues to grow, but at a significantly reduced rate. The exponential function accurately describes this physical decoupling phenomenon.
3.4. Model Validation
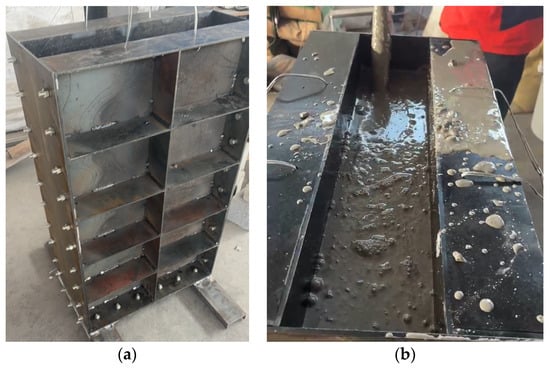
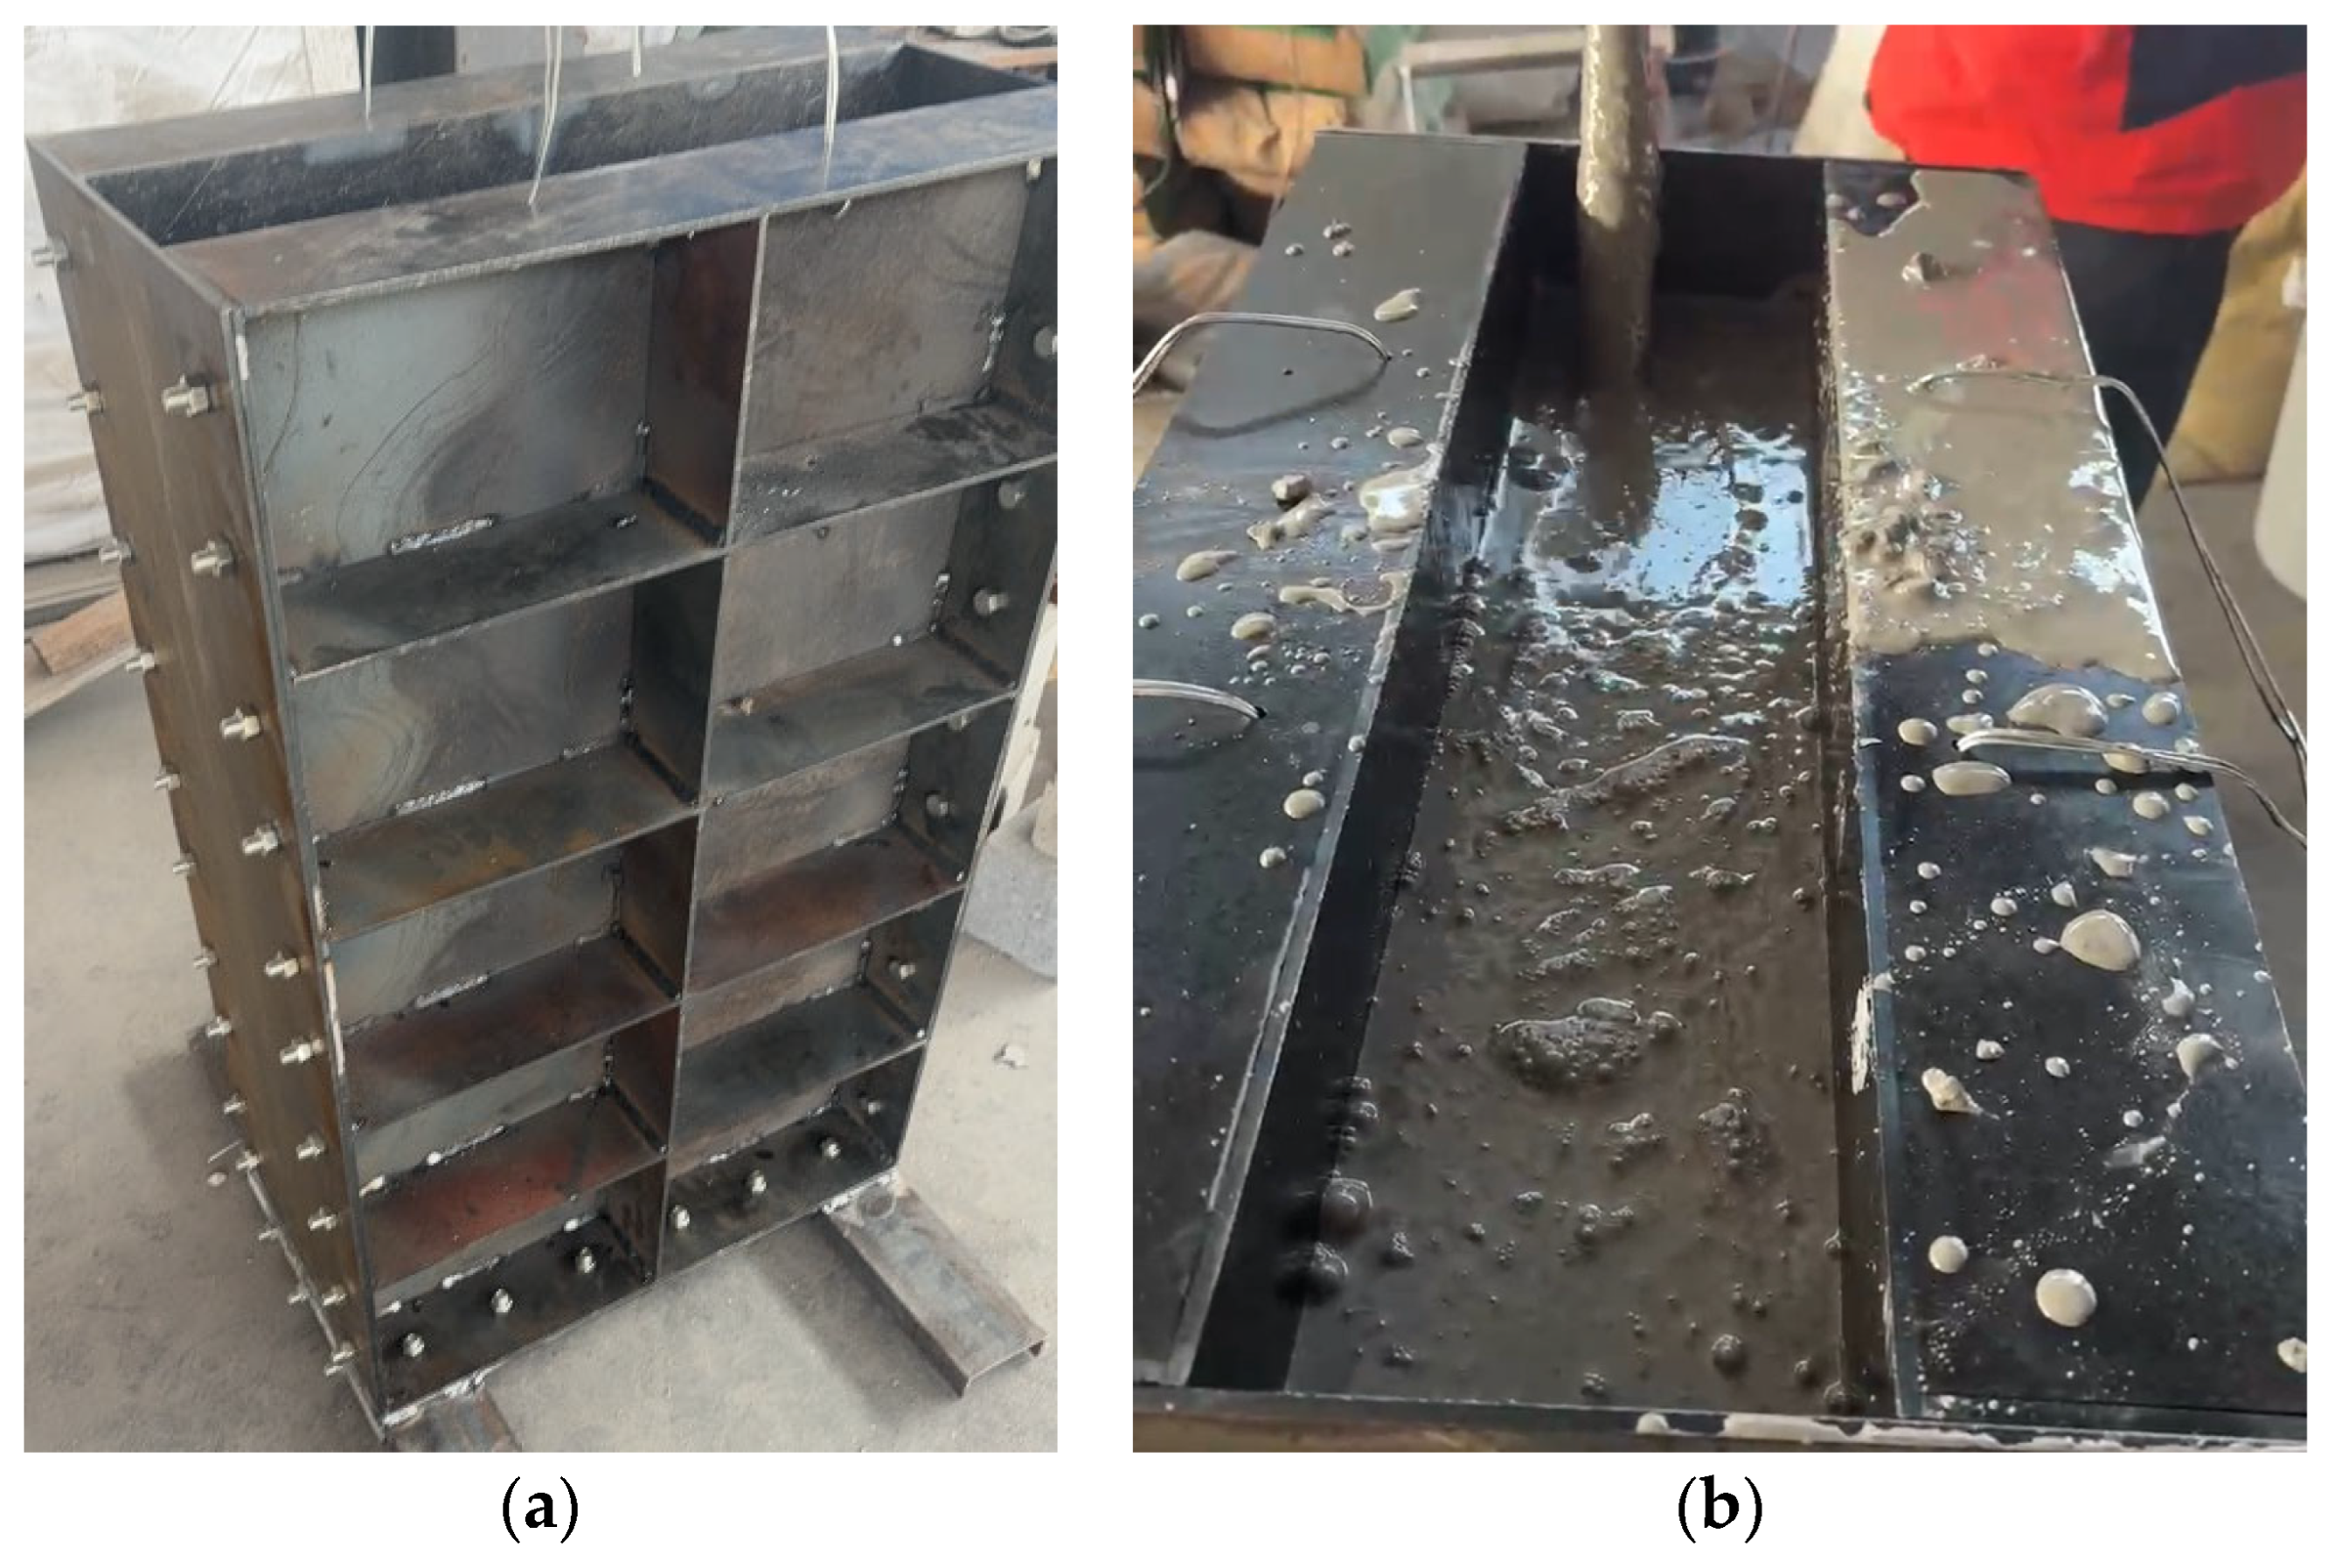
To verify the established strength correlation model of the TMS concrete and eliminate the interference of size effect on the verification results, plate specimens with dimensions of 1 m × 0.6 m × 0.15 m were fabricated for testing, as shown in Figure 9. For each group, three 150 mm × 150 mm × 150 mm standard cubic specimens were set as references to form a control group with the large-sized plate specimens; the detailed mix proportion parameters of the TMS concrete are presented in Table 6. All specimens were cured in a standard curing room with a temperature of (20 ± 2) °C, and a relative humidity of ≥95%. Tests for RS and CS were conducted after curing to three key ages: 3 d, 7 d, and 28 d. The data is shown in Table 7.
Figure 9.
Plate specimens. (a) Steel formwork; (b) concreting.
Table 6.
Mix proportion of plate specimen.
Table 7.
Mechanical properties of specimen.
The relative errors of the TMS concrete specimens are stably controlled within 5.0%, which fully complies with the engineering allowable error. The above results confirm that the piecewise function models established for the 3 d, 7 d, and 28 d ages have achieved the engineering application standard in terms of prediction accuracy. No parameter adjustment for large-sized components is required for this model, and it can be directly applied to the non-destructive strength testing of TMS concrete in engineering practice, providing a reliable basis for rapid and efficient strength evaluation.
3.5. Applicability of the Model
Although the proposed model demonstrates good accuracy and statistical significance, based on the experimental design and obtained results, its validity is restricted to specific parameters and curing ages. The applicability is defined as follows: (1) water-binder ratio is 0.35 to 0.44; (2) fineness modulus of the TMS is 2.15 to 3.35; (3) stone powder content is 0% to 6%; (4) The mineral admixtures consist of fly ash and slag, with a fly ash-to-slag ratio varying from 2:8 to 8:2. While the chemical composition of mineral admixtures (e.g., SiO2 and Al2O3 content) dictates pozzolanic reactivity, the materials used in this experiment met the requirements of GB/T 1596 [38] and GB/T 18046 [39]. It is noted that the model has not yet incorporated other admixtures such as condensed silica fume or metakaolin, whose higher specific surface area and reactivity may alter the correlation; thus, the current applicability is specifically for the fly ash and slag system investigated herein. (5) Cement: P.O 42.5 ordinary Portland cement was selected. Furthermore, the model is valid for concrete curing ages between 3 days and 28 days. As the kinetics of hydration and strength development may change after 28 days, this model may not be suitable for predicting concrete strength exceeding 28 days.
4. Conclusions
This study systematically investigated the correlation between RS and CS of TMS concrete, clarified the influence mechanism of age and size effect on the model, and obtained the following key conclusions:
- (1)
- The RS-CS correlation of TMS concrete has obvious age differentiation. First, 3 d TMS concrete is in the early hydration stage, with synchronous linear growth of RS and CS, so the linear model is optimal; 7 d concrete enters the accelerated hydration stage, and the asynchronous growth of RS and CS leads to a non-linear inflection point, which is best fitted by the quadratic polynomial model; 28 d concrete is in the near-saturated hydration stage, and the asymptotic saturation of RS and CS is accurately described by the exponential model.
- (2)
- The established piecewise model has high reliability and statistical significance. All optimal models pass the F-test (p < 0.001), and show the minimum AIC and BIC values at the corresponding ages, indicating excellent fitting accuracy and generalization ability.
- (3)
- Verification with large-scale plate specimen showed that the relative errors within the ±5% engineering allowable error range. The model does not require parameter adjustment for large-sized components and can be directly used for non-destructive strength testing of TMS concrete in engineering.
- (4)
- The current model is validated for concrete ages of 3 d, 7 d, and 28 d, which align with the critical quality control checkpoints mandated by the design unit for the target project. However, it is noted that the model does not cover intermediate ages or later ages. Therefore, further research is required to investigate the strength development laws of TMS concrete at these intermediate and later ages to provide a comprehensive basis for long-term strength assessment. Additionally, future studies can expand the mix proportion range and environmental conditions to enhance the model’s adaptability, and combine machine learning methods to establish a more intelligent and accurate TMS concrete strength evaluation system.
Author Contributions
Conceptualization, P.H.; methodology, P.H.; software, M.L. and S.W.; validation, M.L. and S.W.; formal analysis, M.L.; investigation, M.L. and R.L.; resources, M.L. and C.Y.; data curation, J.L. and Z.W.; writing—original draft preparation, M.L.; writing—review and editing, P.H. and C.Y.; visualization, X.J. and Q.Y.; supervision, P.H.; project administration, M.L.; funding acquisition, S.W. All authors have read and agreed to the published version of the manuscript.
Funding
The APC was funded by Jiangsu ZYZ Intelligent Operation & Maintenance Institute Co., Ltd.
Data Availability Statement
The original contributions presented in this study are included in the article. Further inquiries can be directed to the corresponding author.
Acknowledgments
The authors gratefully appreciate the financial support of the Ningbo Yongtaiwen Transportation Development Co., Ltd.
Conflicts of Interest
The authors declare that this study received funding from Jiangsu ZYZ Intelligent Operation & Maintenance Institute Co., Ltd. and Ningbo Yongtaiwen Transportation Development Co., Ltd. The funder was not involved in the study design, collection, analysis, interpretation of data, the writing of this article, or the decision to submit it for publication.
Abbreviations
The following abbreviations are used in this manuscript:
| TMS | Tuff manufactured sand |
| RS | Rebound strength |
| CS | Compressive strength |
| XRF | X-ray fluorescence |
| XRD | X-ray diffraction |
| C-S-H | Calcium Silicate Hydrate |
| ANFIS | Adaptive neuro-fuzzy inference systems |
| AIC | Akaike information criterion |
| R2 | Coefficient of determination |
| BIC | Bayesian information criterion |
| ITZ | Interfacial transition zone |
References
- Rong, H.; Qian, C.X.; Gao, L.X.; Han, J.D.; Wang, C.H. The Testing Strength Curves of Lightweight Aggregate Concrete by Rebound Method and Ultrasonic-rebound Combined Method. J. Wuhan Univ. Technol.-Mater. Sci. Ed. 2011, 26, 1010–1017. [Google Scholar] [CrossRef] [Scilit]
- Wu, Y.; Huang, J.K.; Lou, X.A. Non-destructive testing method on the compressive strength of ice materials based on the rebound method. Arch. Civ. Mech. Eng. 2023, 23, 234. [Google Scholar] [CrossRef] [Scilit]
- Tao, J.J.; Ren, S.C.; Ma, W.W.; Yan, P.P.; Cao, Y.; Xiong, B.B. Investigation of the Spatial Variability and Correlation in Concrete in Structures Using the Rebound Method. ASCE-ASME J. Risk Uncertain. Eng. Syst. Part A-Civ. Eng. 2025, 11, 04025041. [Google Scholar] [CrossRef] [Scilit]
- Park, J.; An, G.H.; Young, J.; Suk, L.J. Evaluation of Concrete Freeze and Thaw Resistance by Measuring Surface Rebound Value and Relative Dynamic Modulus of Elasticity. J. Korean Recycl. Constr. Resour. Inst. 2022, 9, 419–424. [Google Scholar]
- Li, Z.F.; Zhu, Y.W.; Xu, C.G.; Yang, K.W.; Xu, X.B.; Fang, H.J. Rebound Calculation for Deep Excavation in Soft Soil Based on Rebound-Recompression Method. Sustainability 2023, 15, 10019. [Google Scholar] [CrossRef] [Scilit]
- Masi, A.; Chiauzzi, L. An experimental study on the within-member variability of in situ concrete strength in RC building structures. Constr. Build. Mater. 2013, 47, 951–961. [Google Scholar] [CrossRef] [Scilit]
- Guo, J.B.; Yu, H.F.; Ma, H.Y.; Chang, Y.; Mei, Q.Q.; Zhang, Y. Compressive Strength of Basic Magnesium Sulfate Cement Coral Aggregate Concrete (MCAC) on Non-Destructive Testing. J. Wuhan Univ. Technol.-Mater. Sci. Ed. 2024, 38, 1086–1095. [Google Scholar] [CrossRef] [Scilit]
- Saleem, M. Assessing the load carrying capacity of concrete anchor bolts using non-destructive tests and artificial multilayer neural network. J. Build. Eng. 2020, 30, 101260. [Google Scholar] [CrossRef] [Scilit]
- Kothandaraman, S.; Kandasamy, S. The effect of controlled permeable formwork liner on the mechanical properties of concrete. Mater. Struct. 2016, 49, 4737–4747. [Google Scholar] [CrossRef] [Scilit]
- Ahmed, H.; Tiznobaik, M.; Huda, S.B.; Islam, M.S.; Alam, M.S. Recycled aggregate concrete from large-scale production to sustainable field application. Constr. Build. Mater. 2020, 262, 119979. [Google Scholar] [CrossRef] [Scilit]
- Chen, J.M.; Jin, Q.; Dong, B.L.; Dong, C. Research on the Rebound Hammer Testing of High-Strength Concrete’s Compressive Strength in the Xinjiang Region. Building 2024, 13, 2905. [Google Scholar] [CrossRef] [Scilit]
- Kovler, K.; Wang, F.Z.; Muravin, B. Testing of concrete by rebound method: Leeb versus Schmidt hammers. Mater. Struct. 2018, 51, 138. [Google Scholar] [CrossRef] [Scilit]
- Tao, J.J.; Fu, X.; Ren, S.C. Full probability conversion model for predicting concrete compressive strength using the rebound method. Probabilistic Eng. Mech. 2025, 79, 103730. [Google Scholar] [CrossRef] [Scilit]
- Toghroli, A.; Darvishmoghaddam, E.; Zandi, Y.; Parvan, M.; Safa, M.; Abdullahi, M.M.; Heydari, A.; Wakil, K.; Gebreel, S.A.M.; Khorami, M. Evaluation of the parameters affecting the Schmidt rebound hammer reading using ANFIS method. Comput. Concr. 2018, 21, 525–530. [Google Scholar]
- Brozovsky, J. High-strength concrete—NDT with rebound hammer: Influence of aggregate on test results. Nondestruct. Test. Eval. 2014, 29, 255–268. [Google Scholar] [CrossRef] [Scilit]
- Liang, J.L.; Lin, J.W.; Lv, J.L.; Zheng, S.Y.; Rong, H.L.; Yang, X.L. Research on Rebound Strength Measurement Curve of Modified Carbonation Depth of Machine-Made Sand Concrete. J. Mater. Civ. Eng. 2024, 36, 05024004. [Google Scholar] [CrossRef] [Scilit]
- Zhou, T.G.; Zhang, H.Y.; Li, B.Y.; Zhang, L.Y.; Tan, W. Evaluation of compressive strength of cement-stabilized rammed earth wall by ultrasonic-rebound combined method. J. Build. Eng. 2023, 68, 106121. [Google Scholar] [CrossRef] [Scilit]
- Shang, H.S.; Yi, T.H.; Yang, L.S. Experimental Study on the Compressive Strength of Big Mobility Concrete with Nondestructive Testing Method. Adv. Mater. Sci. Eng. 2012, 2012, 345214. [Google Scholar] [CrossRef] [Scilit]
- Yuan, W.; Yang, R.F.; Yu, J.Y.; Han, X.J. Experimental Study on Special Testing Strength Curve for Compressive Strength Evaluation by Rebound Method. Adv. Mater. Sci. Eng. 2021, 2021, 8413010. [Google Scholar] [CrossRef] [Scilit]
- Yan, J.C.; Liu, K.H.; Zou, C.Y.; Mo, Y.L.; Ou, J.P. Comparison of Evaluation Tests for Compressive Strength of Structural Concrete. Period. Polytech.-Civ. Eng. 2020, 64, 387–395. [Google Scholar] [CrossRef] [Scilit]
- Zhang, Y.Z.; Gu, L.Y.; Zhang, Q.L. Durability of manufactured sand concrete in atmospheric acidification environment. Case Stud. Constr. Mater. 2023, 17, e01613. [Google Scholar] [CrossRef] [Scilit]
- Du, B.; Xiang, T.Y.; Huang, Z.H. Research on Creep Application of High-strength Concrete with Manufactured Sand for Bridge Use. Agro Food Ind. Hi-Tech 2017, 28, 3064–3067. [Google Scholar]
- Pilegs, M.; Gardner, D.; Lark, R. An Investigation into the Use of Manufactured Sand as a 100% Replacement for Fine Aggregate in Concrete. Materials 2016, 9, 440. [Google Scholar] [CrossRef] [Scilit] [PubMed]
- Xu, X.B.; Xie, J.C.; Tang, Y.S.; Luo, L.F.; Chen, Z.; Li, J.W. Experimental Study and Machine Learning-Based Prediction of the Abrasion Resistance of Manufactured Sand Concrete. Buildings 2024, 14, 3433. [Google Scholar] [CrossRef] [Scilit]
- Zhang, M.M.; Xu, J.; Li, M.; Yuan, X.S. Influence of Stone Powder Content from Manufactured Sand Concrete on Shrinkage, Cracking, Compressive Strength, and Penetration. Buildings 2023, 13, 1833. [Google Scholar] [CrossRef] [Scilit]
- Wang, X.; Zhang, W.H.; Zhang, Y.S.; Qiao, H.X.; Xue, C.Z.; Mundia, M.M.; An, B.F. Research on the green preparation of manufactured sand by tuff produced in Gansu China and its influence on the properties of concrete. Constr. Build. Mater. 2023, 409, 133794. [Google Scholar] [CrossRef] [Scilit]
- Li, H.J.; Wang, Z.; Huang, F.L.; Yi, Z.L.; Xie, Y.J.; Sun, D.Y.; Sun, R.R. Impact of different lithological manufactured sands on high-speed railway box girder concrete. Constr. Build. Mater. 2020, 230, 116943. [Google Scholar] [CrossRef] [Scilit]
- Xiang, Y.; Zhao, H.T.; Hu, D.K.; Yun, W.R.; Wang, Y.; Xu, W. Hydration characteristics of cementitious materials with manufactured sand from various lithologies and differential effect of CaO-MgO blend expansion agent. Constr. Build. Mater. 2024, 433, 136773. [Google Scholar] [CrossRef] [Scilit]
- Ma, R.; Zhang, L.F.; Chen, Z.G.; Miao, C.B.; Zhang, C.Y.; Fan, T.F.; Zhang, J.Q.; Qian, X.Q. Utilization of solid waste from tunnel excavation as manufactured sand with different lithology and pre-washing process for preparation of eco-friendly ultra-high performance concretes: Properties and microstructural analysis. J. Build. Eng. 2024, 82, 108252. [Google Scholar] [CrossRef] [Scilit]
- Ma, F.R.; Zhang, Y.S.; Qiao, H.X.; Liu, H.X. Multiscale modeling of compressive strength degradation in manufactured sand concrete: Linking pore structure evolution to salt freeze-thaw damage. J. Build. Eng. 2025, 111, 113428. [Google Scholar] [CrossRef] [Scilit]
- GB/T 14684; Sand for Construction. AQSIQ: Beijing, China, 2022.
- Yang, F.; Ma, Y.; Li, L.C.; Liu, S.; Hai, R.; Zhu, Z.Y. Early-Age Behaviour of Portland Cement Incorporating Ultrafine Recycled Powder: Insights into Hydration, Setting, and Chemical Shrinkage. Materials 2024, 17, 5551. [Google Scholar] [CrossRef] [Scilit] [PubMed]
- Chen, J.C.; Xie, B.; Lu, Z.Y.; He, S.H.; Ma, S.Q. Early Hydration Characteristics and Kinetics Model of Ordinary Portland Cement-Calcium Sulfoaluminate Cement Composites. Materials 2025, 18, 2559. [Google Scholar] [CrossRef] [Scilit]
- Zhan, P.M.; Wang, J.; Yu, W.W.; Deng, Z.Z.; She, A.M.; Zuo, J.Q.; Li, W.G.; Xu, J. Insights into the hydration kinetics, microstructure and early strength of Portland cement containing synthetic C-S-H/PCE nanocomposites. Cem. Concr. Compos. 2025, 157, 105886. [Google Scholar] [CrossRef] [Scilit]
- GB 175; Common Portland Cement. AQSIQ: Beijing, China, 2023.
- GB8076; Concrete admixture. AQSIQ: Beijing, China, 2008.
- JTG/T 3650; Technical Specifications for Construction of Highway Bridges and Culverts. Ministry of Transport: Beijing, China, 2020.
- GB/T 1596; Fly Ash Used for Cement and Concrete. AQSIQ: Beijing, China, 2017.
- GB/T 18046; Ground Granulated Blast Furnace Slag Used for Cement, Mortar, and Concrete. AQSIQ: Beijing, China, 2017.
- Zhang, H.T.; Liu, Z.G.; Wang, Z.E.; Yang, C.Q.; Zhang, Z.T.; Lang, D.W.; Hou, P.; Luo, J.J.; Zhang, Y.H. Orthogonal Experiment on the Mechanical Properties of Tuff Mechanism Sand Concrete. Buildings 2025, 15, 4465. [Google Scholar] [CrossRef] [Scilit]
- GB/T 50081; Standard for Test Method of Concrete Physical and Mechanical Properties. Ministry of Housing and Urban-Rural Development: Beijing, China, 2018.
- JGJ/T 23; Technical Specification for Inspection of Concrete Compressive Strength by Rebound Method. Ministry of Housing and Urban-Rural Development: Beijing, China, 2011.

Disclaimer/Publisher’s Note: The statements, opinions and data contained in all publications are solely those of the individual author(s) and contributor(s) and not of MDPI and/or the editor(s). MDPI and/or the editor(s) disclaim responsibility for any injury to people or property resulting from any ideas, methods, instructions or products referred to in the content. |
© 2026 by the authors. Licensee MDPI, Basel, Switzerland. This article is an open access article distributed under the terms and conditions of the Creative Commons Attribution (CC BY) license.