


Abstract
In earthquake-prone regions, improving the seismic performance of bridge abutments is crucial for ensuring the overall safety and resilience of transportation infrastructure. In this study, a novel shallow foundation abutment with anchor plates and steel bundles is proposed. Quasi-static tests incorporating soil–abutment interaction were conducted on a novel shallow foundation abutment and on a conventional abutment to evaluate and compare their seismic performance. The experimental results, including failure mechanism, hysteretic behavior, backbone curve, stiffness, and damping ratio, were analyzed. The findings indicate that the inclusion of anchor plates and steel bundles effectively restricts abutment rotation and significantly enhances its ultimate bearing capacity, with an observed increase of up to 96%. The secant stiffness of the novel shallow foundation abutment is consistently greater than that of a conventional abutment, being on average 20.9% higher before a loading displacement of 20 mm. Moreover, its energy dissipation capacity surpasses that of the common abutment after a loading displacement of 8 mm. Overall, the participation of anchor plates and steel bundles substantially improves the seismic resistance of the soil–abutment interaction system. The conclusions of this study provide valuable guidance for the design, promotion, and practical application of shallow foundation abutments with anchor plates and steel bundles in seismically active areas.
1. Introduction
The abutment plays a crucial role in the functionality and safety of a bridge, which not only supports the upper structure and connects the embankment, but also resists the soil pressure behind it. Damage to abutments has been observed in many earthquakes, e.g., the 1976 Tangshan earthquake [1], the 1999 Chi-Chi earthquake, and the 2008 Wenchuan earthquake [2]. The investigation of seismic damage indicates that the rotation of an abutment and lateral movement towards the water side are common modes of abutment damage. The impact on the abutment by the main girders generates larger passive soil pressure on the abutment, which pushes the lower part of the abutment further towards the water side because the top of the abutment is restrained by the superstructure [3]. Similar seismic damage was also observed in the 2010 Chile earthquake [4].
The seismic issue of abutments has attracted the attention of scholars after the Tangshan earthquake. Wilson et al. proposed a simplified spring model to simulate the interaction between abutments and embankments [5]. A nonlinear dynamic time history analysis of bridges with the participation of seat-type abutments was performed by Stergios [6]. The study showed that the strong participation of the abutment and the backfill soil can effectively reduce the seismic demand of bridges. Ady et al. investigated the sensitivity of bridge seismic response with respect to three different abutment modeling approaches [7]. Cheng et al. performed numerical studies on the interaction between an embankment, abutment, and foundation [8] and concluded that the abutment overall slid away from the embankment accompanied by outward inclination. Su et al. studied the earthquake-induced permanent deformation of an abutment and proposed a coupling analytical method to calculate the seismic displacement for the abutment [9]. The above research aimed to study the interaction behavior of abutments, embankments, and superstructures through numerical simulation.
The rotation of an abutment and lateral movement towards the water side often result in collisions between the upper beam and the abutment. Pounding may cause severe local damage to girder ends and in some circumstances may be one of the primary reasons for girder collapses [10]. Therefore, research on pounding at joints of girders and abutments has been extensively conducted. Li et al. investigated a longitudinal seismic pounding effect between a beam and an abutment [11]. The results show that the pounding between the beam and the abutment will increase the risk of beam fall. Deng et al. studied pounding effects at the expansion joints of long-span bridges [12]. Maragakis and Jennings researched pounding of a skew bridge and concluded that the impact between the deck and the abutment contributed to the planar rigid body rotation of the deck [13]. Won et al. conducted studies on pounding response at deck–abutment joints through numerical simulation [14,15]. The influence of the pounding effect on expansion joints on the seismic response of a rigid frame continuous girder bridge was studied by Wu [16,17]. Jiao et al. investigated the seismic behavior of a curved bridge considering the soil–abutment–superstructure interaction [18]. The pounding effect at the abutment of a rigid frame bridge was analyzed during an earthquake by Xu [19]. Seyyed investigated the interactive roles of pounding between the deck and abutments for the seismic vulnerability of multispan box girder highway bridges [20]. Other scholars have also conducted valuable research on the pounding issue of abutments [21,22].
Some experimental studies on pounding between girders and abutments have been conducted. He et al. studied the seismic response of an abutment based on shaking table tests [23]. It was found that the earthquake caused rotation and lateral movement towards the water side of the abutment. Zhu et al. implemented a shake table test on the pounding of girders to verify the finite element model [24]. Yang et al. researched the seismic behavior of an existing bridge subjected to the earthquake-induced lateral movement of soft clay soil by a dynamic centrifuge experiment. [25]. The experimental result showed that a collision between the bridge abutment and the girder occurred under the effect of the lateral movement of the soft clay layer.
Pounding between bridge segments has been a subject of debate among researchers, sparking a significant amount of research on its causes and consequences. However, in current research, studies on the seismic performance of abutments mainly focus on the simulation of the interaction between the abutment, the embankment, and the beam, as well as the pounding between the beam and the abutment. Studies on measures for improving the seismic performance of abutments are still limited.
The shallow foundation abutment is a form adopted in railway and highway bridges in China. In this paper, two scale models are designed and manufactured. These are the ordinary abutment and the shallow foundation abutment with anchor plates and steel bundles. Quasi-static tests on scaled models are performed to investigate their failure modes, hysteretic behavior, backbone curve, stiffness, and damping ratio. Finally, the concluding remarks on the cyclic response of the shallow foundation abutment with anchor plates and steel bundles are given. The experimental results provide an important basis for the application of the shallow foundation abutment with anchor plates and steel bundles in a railway bridge.
2. Test Setup
2.1. Specimen Description
Considering factors such as laboratory site conditions, model fabrication capabilities, and loading equipment constraints, two specimens were designed and constructed with a model similarity ratio of 1/10 based on an existing bridge and tested at the structural laboratory of Lanzhou Jiaotong University. The artificial mass similitude law based on the Buckingham Π theorem, which neglects gravitational similitude, has been widely applied in seismic simulation experiments [26]. In this study, dimensional analysis is employed to establish the similitude conditions for the model test. The seismic response of the structure can be expressed by the following two basic functions.
where σ represents the normal stress of the structure; L represents the size of the structure; E represents the Young’s modulus of concrete; ν represents the Poisson ratio of concrete; η represents the reinforcement ratio of the member; c represents the cohesion of soil; φ represents the internal friction angle of the soil; ρ represents the volume density of the material; P is the concentrated load applied to the top of the structure; and u represents the structural displacement.
Taking L and P as the basic parameters, other variables can be expressed as the following functions through dimensional analysis:
In this experiment, all the dimensions of the model are maintained at a consistent similarity ratio, that is, the similarity ratio of the model was . This means that . When , other similarity constants of the model are calculated according to Formula (3) and presented in Table 1. According to , it can be calculated that , which means that the concentrated force applied on the top of the models is of the prototype. Similarly, based on , it can be calculated that , which means the displacement of the models is of the prototype. It should be noted that since the model and prototype utilize soil with similar mechanical properties, it is challenging to maintain an exact scaling relationship for bulk density. It should be noted that the unit weight of the model soil is difficult to satisfy the L times relationship due to the similar mechanical properties of the soil for the model and the prototype. During testing, the soil was compacted as much as possible; however, this still inevitably resulted in a deficiency in vertical stress within the model ground soil.
Table 1.
Model similarity ratio.
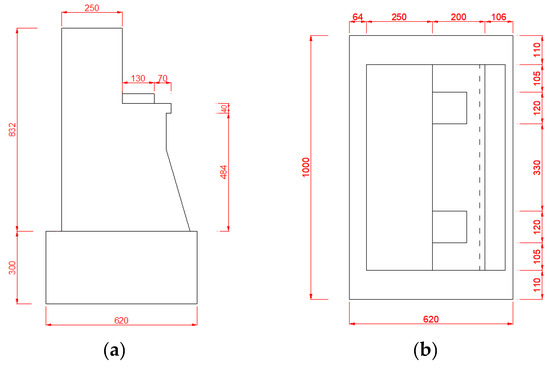
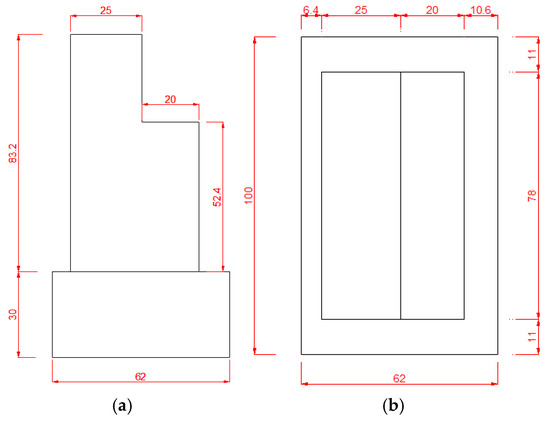
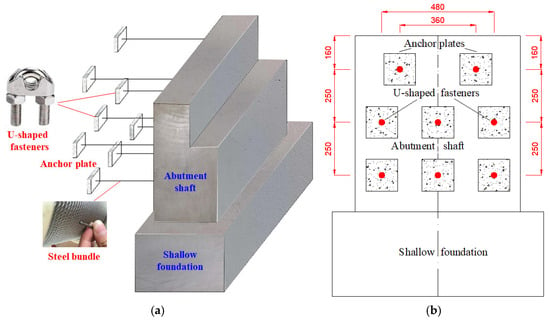
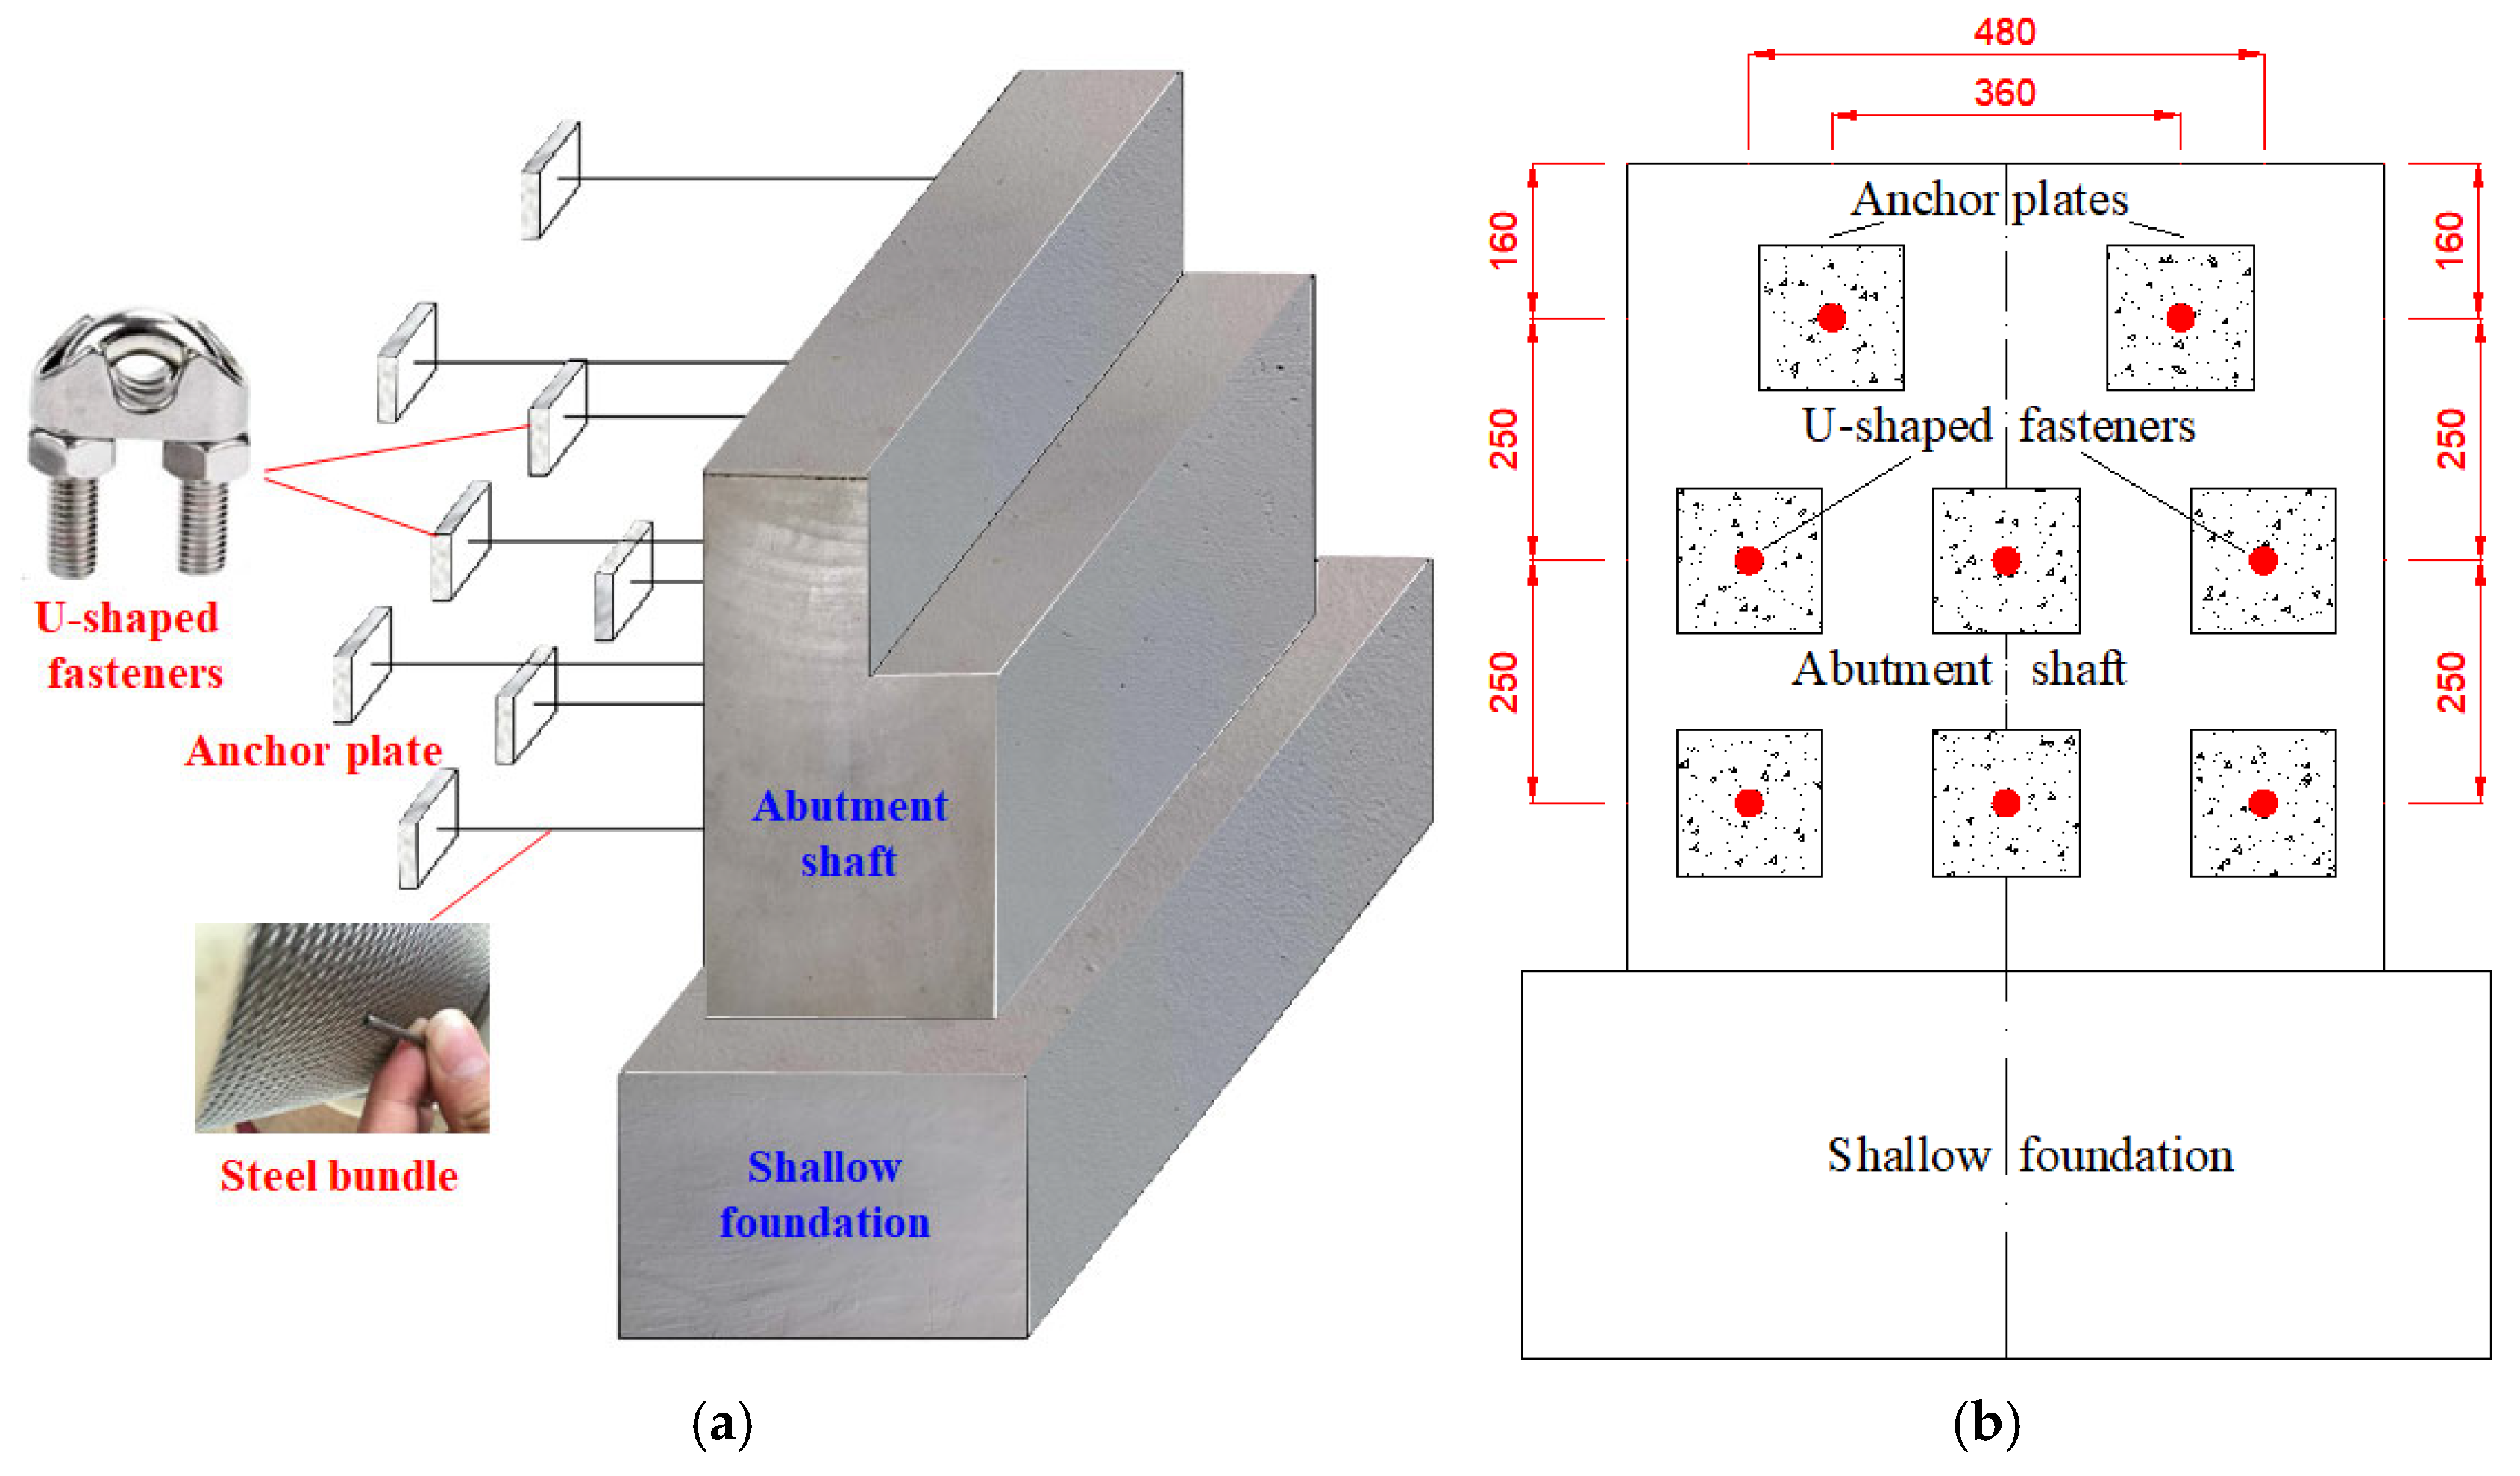
The prototype comes from a railway bridge in China and is scaled down based on a generalized Π theorem. The specimens were labeled P-1 and P-2. They have the same geometric dimensions, except that model P-2 is equipped with anchor plates and steel bundles. As shown in Figure 1, the dimensions of the prototype for the abutment are given in detail. The sizes of the model P-1 are shown in Figure 2. The front wall of the model is made straight and the bedding stone is not poured in order to facilitate production. Figure 3 shows the layout of model P-2. The back of the model is pulled by eight steel bundles with a 5 mm diameter. One end of the steel bundle is anchored to the back of the model, and the other end is anchored to prefabricated anchor plates. Both ends of each steel bundle are fixed to the back of the platform and the anchor plate through U-shaped fasteners. The anchor plates are made of concrete with a size of 20 cm × 20 cm × 7 cm (length × width × thickness) which are arranged in three layers with two blocks on the top and three blocks each on the bottom two layers. The anchor plates are staggered in the vertical plane in order to prevent stress concentration. The length of the steel bundles is 70 cm, 60 cm, and 50 cm from top to bottom.
Figure 1.
Detailed sizes of the prototype (unit: cm): (a) side view; (b) top view.
Figure 2.
Detailed sizes of the model (unit: cm): (a) side view; (b) top view.
Figure 3.
The layout of model P-2: (a) side view; (b) dorsal view (unit: cm).
2.2. Material Parameters
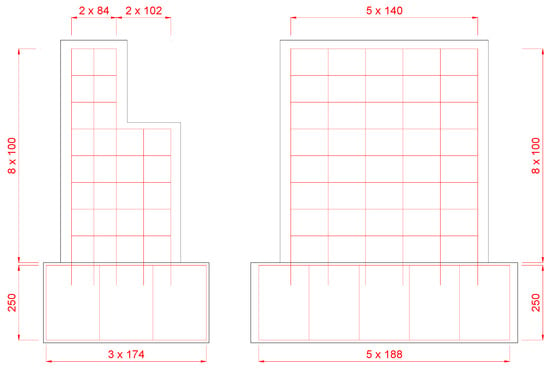
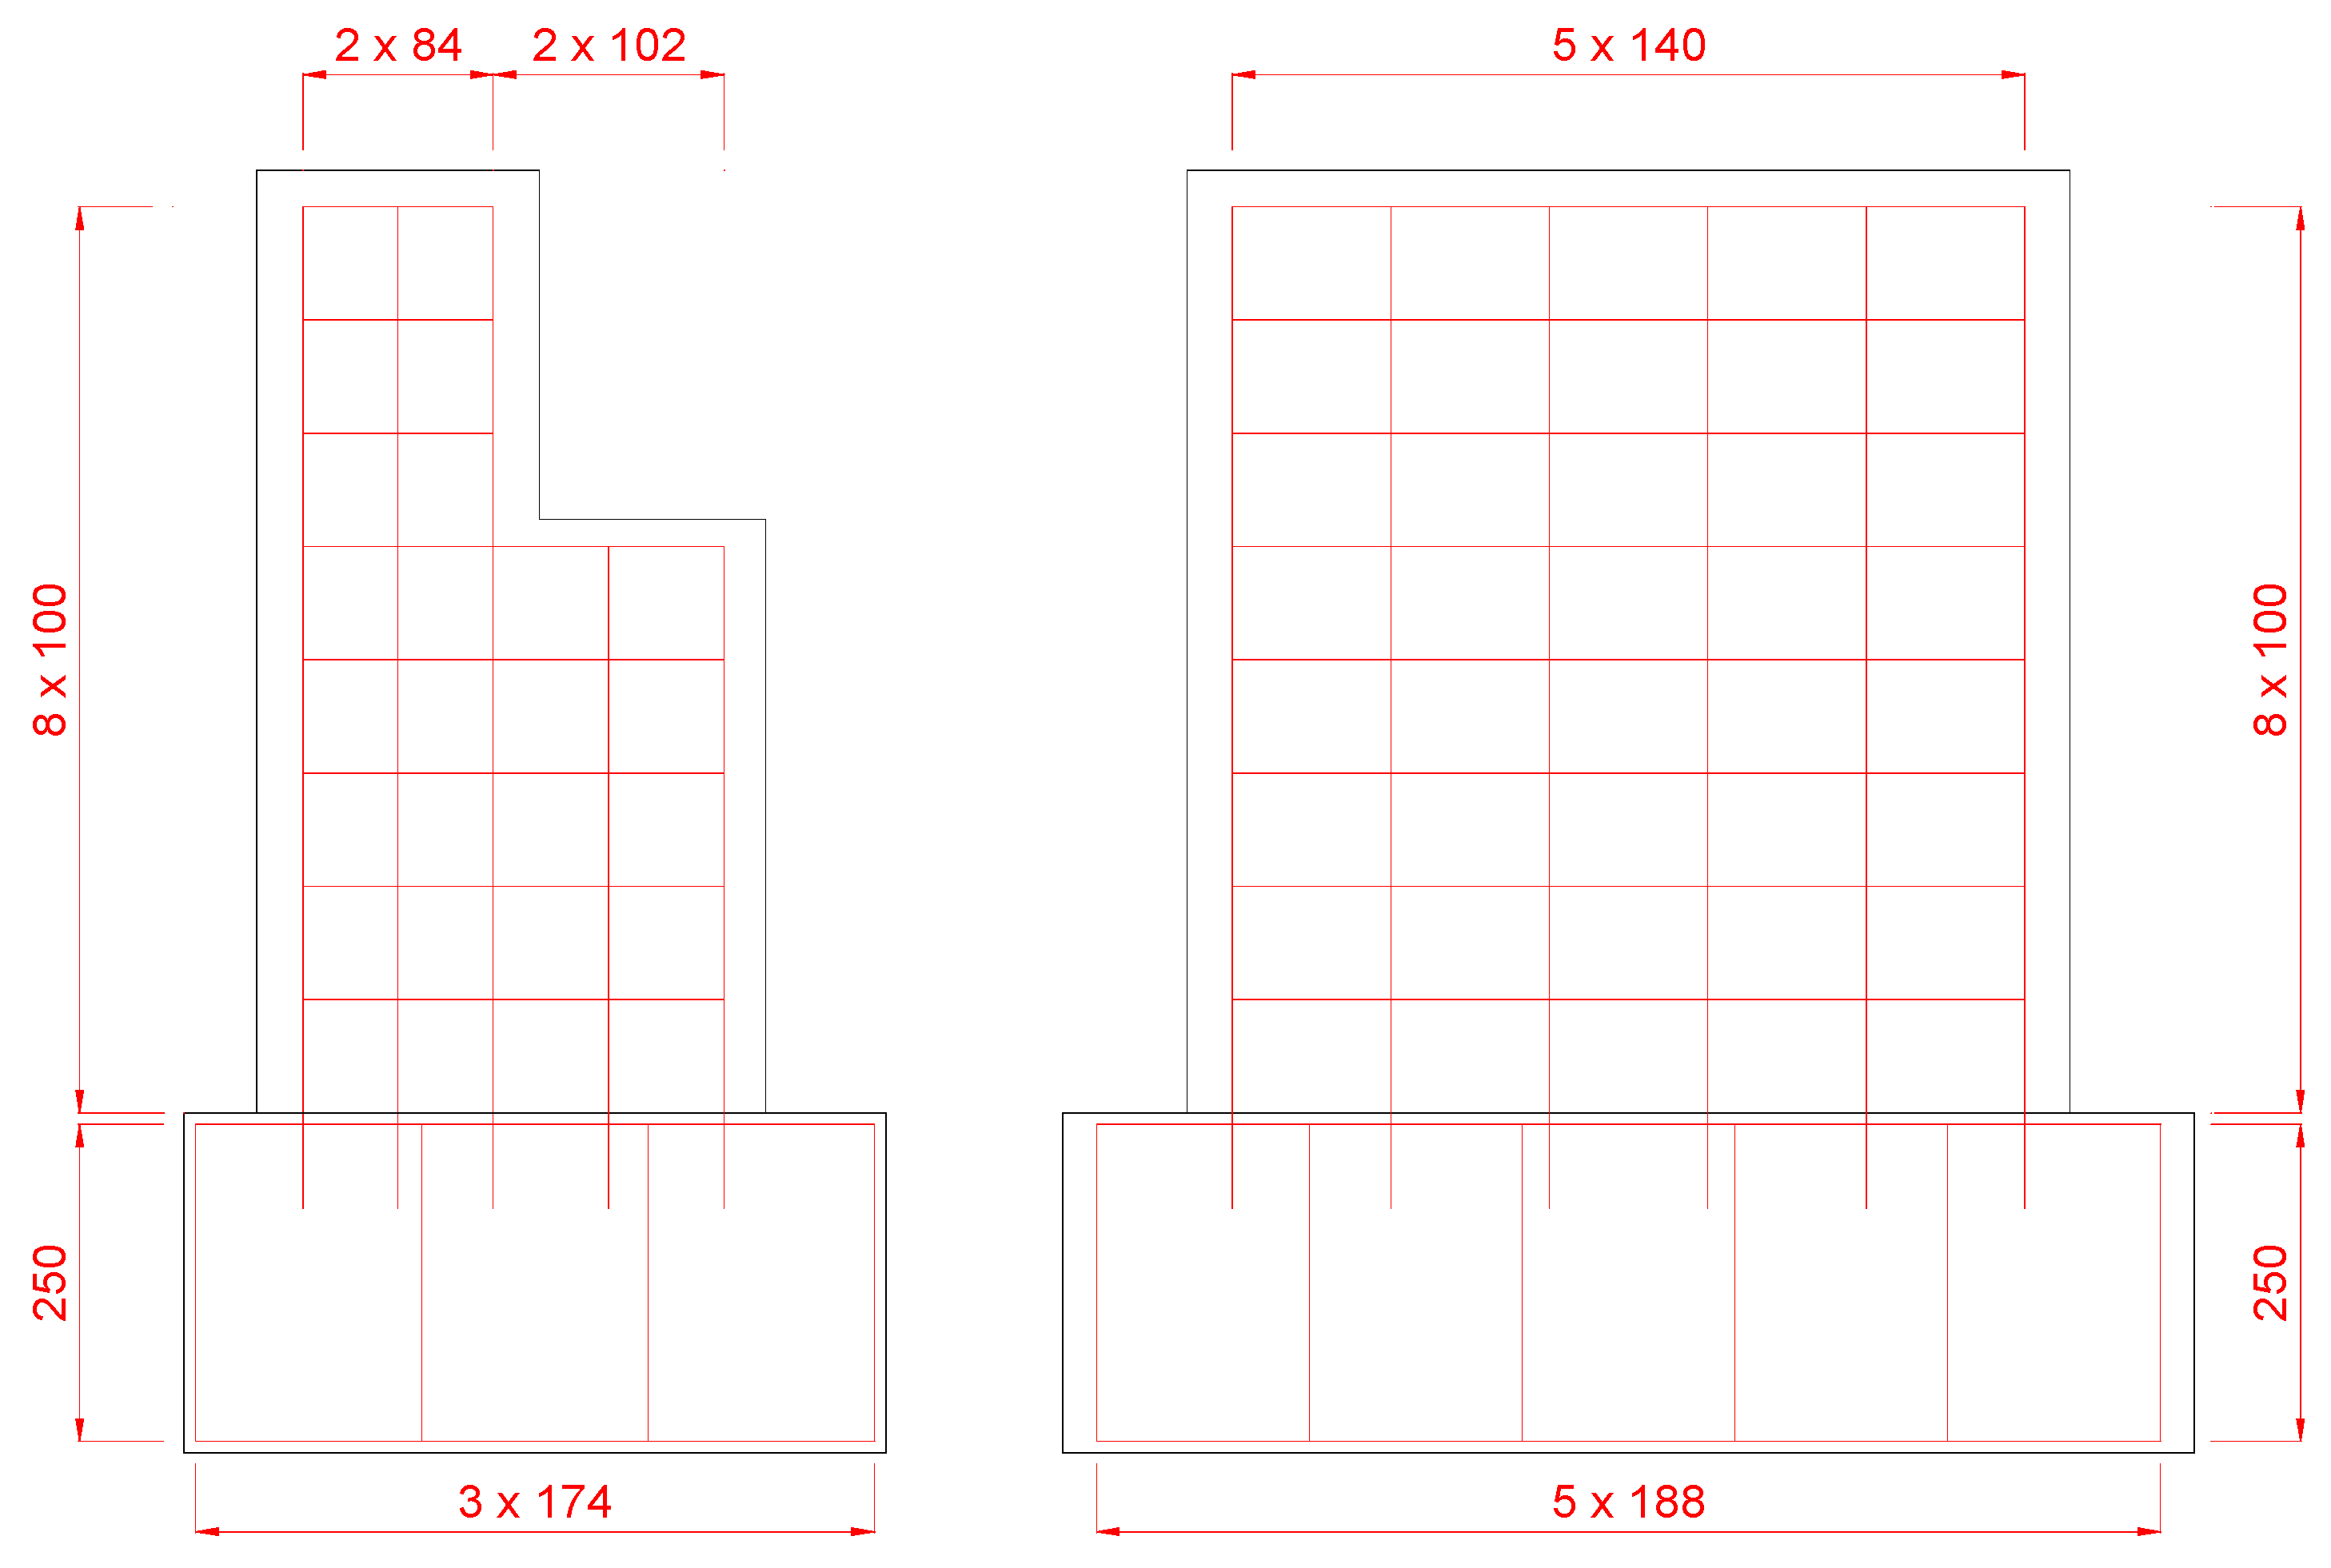
The material properties of the concrete used in the specimens are obtained by the test. C30 grade concrete is used for the reinforced concrete abutment. Cubes with a length of one edge of 150 mm are used to measure the concrete compression strength [27]. The 28-day compressive strength of the concrete cube is 31.8 MPa. Tensile tests are used to determine the strength of steel reinforcing bars [28]. The yield strength of the longitudinal bar is 339 MPa and the ultimate tensile strength is 461 MPa. The corresponding values of stirrup are 243 MPa and 361 MPa. The reinforcement arrangement of the model is shown in Figure 4. Stirrups of 6 mm in diameter with an equal spacing of 100 mm are arranged in the abutment shaft, and with an equal spacing of 250 mm in the foundation. The abutment and foundation are made of 8 mm longitudinal steel bars.
Figure 4.
Reinforcement arrangement of the model (unit: mm).
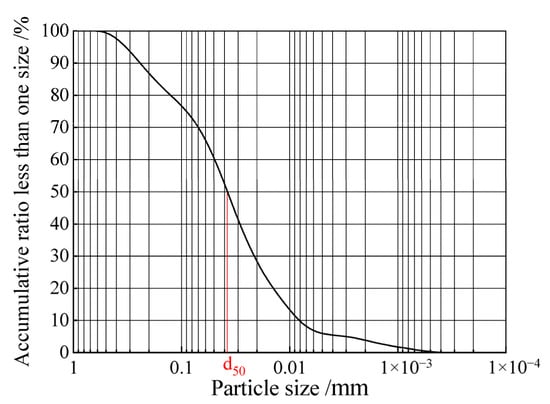
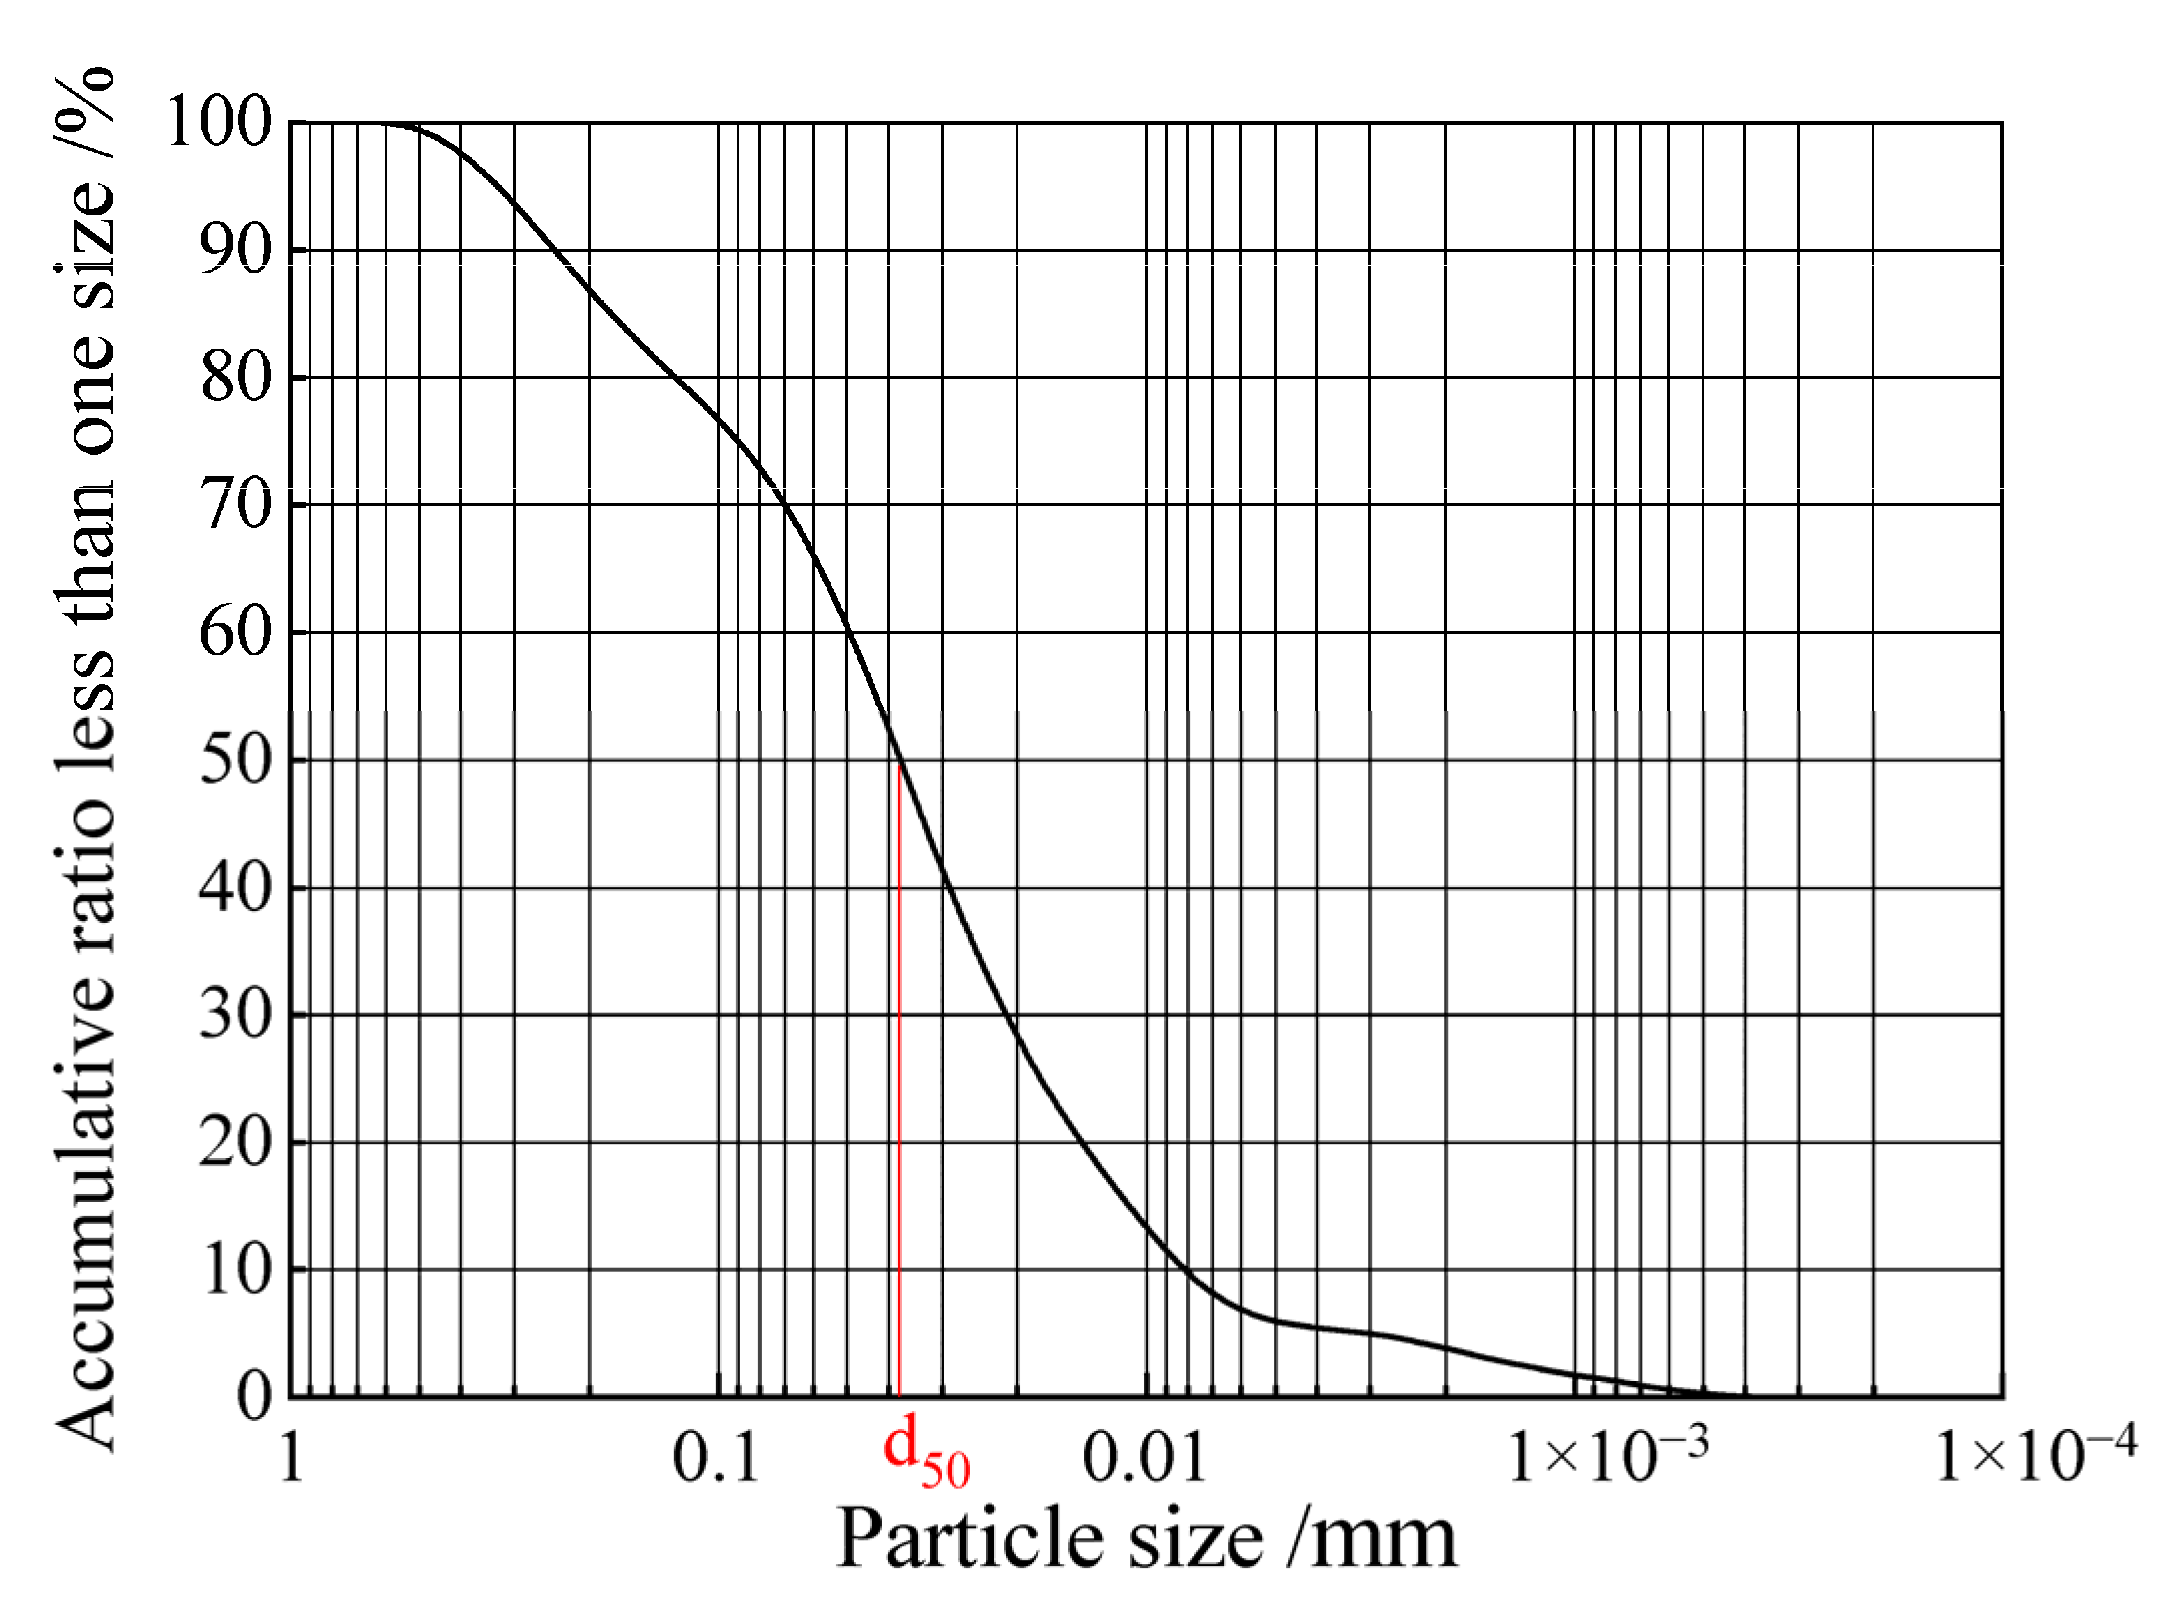
The soil is collected from northwest China. The particle size distribution of the soil used in this experiment is shown in Figure 5, which is measured through a geotechnical test according to the geotechnical test method standard [29]. The soil is classified as silty clay according to the code for the rock and soil classification of railway engineering [30]. Before filling, the soil is crushed and evenly watered, then compacted in layers. The basic physical properties of the soil are summarized in Table 2.
Figure 5.
Soil particle distribution.
Table 2.
Physical and mechanical parameters of ground soil.
The steel bundle used in the test consists of 7 strands of thin steel strands. Each strand is made of 19 steel wires. The diameter of the steel bundle is 5 mm. According to the method of breaking tensile test for steel wire ropes [31], a tensile test of steel bundles is performed. The experimental results show that the breaking force of the steel bundle is 17 kN.
2.3. Model Development
In the test, the fabrication and assembly of the models is conducted as follows:
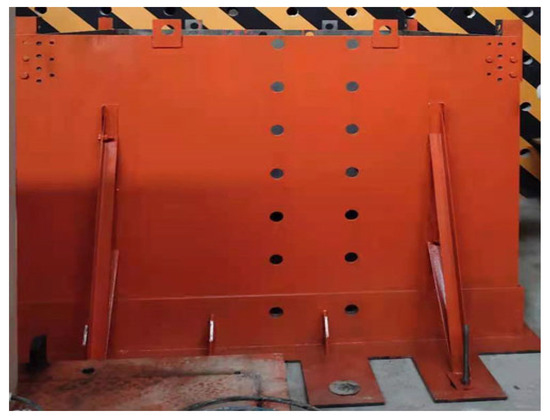
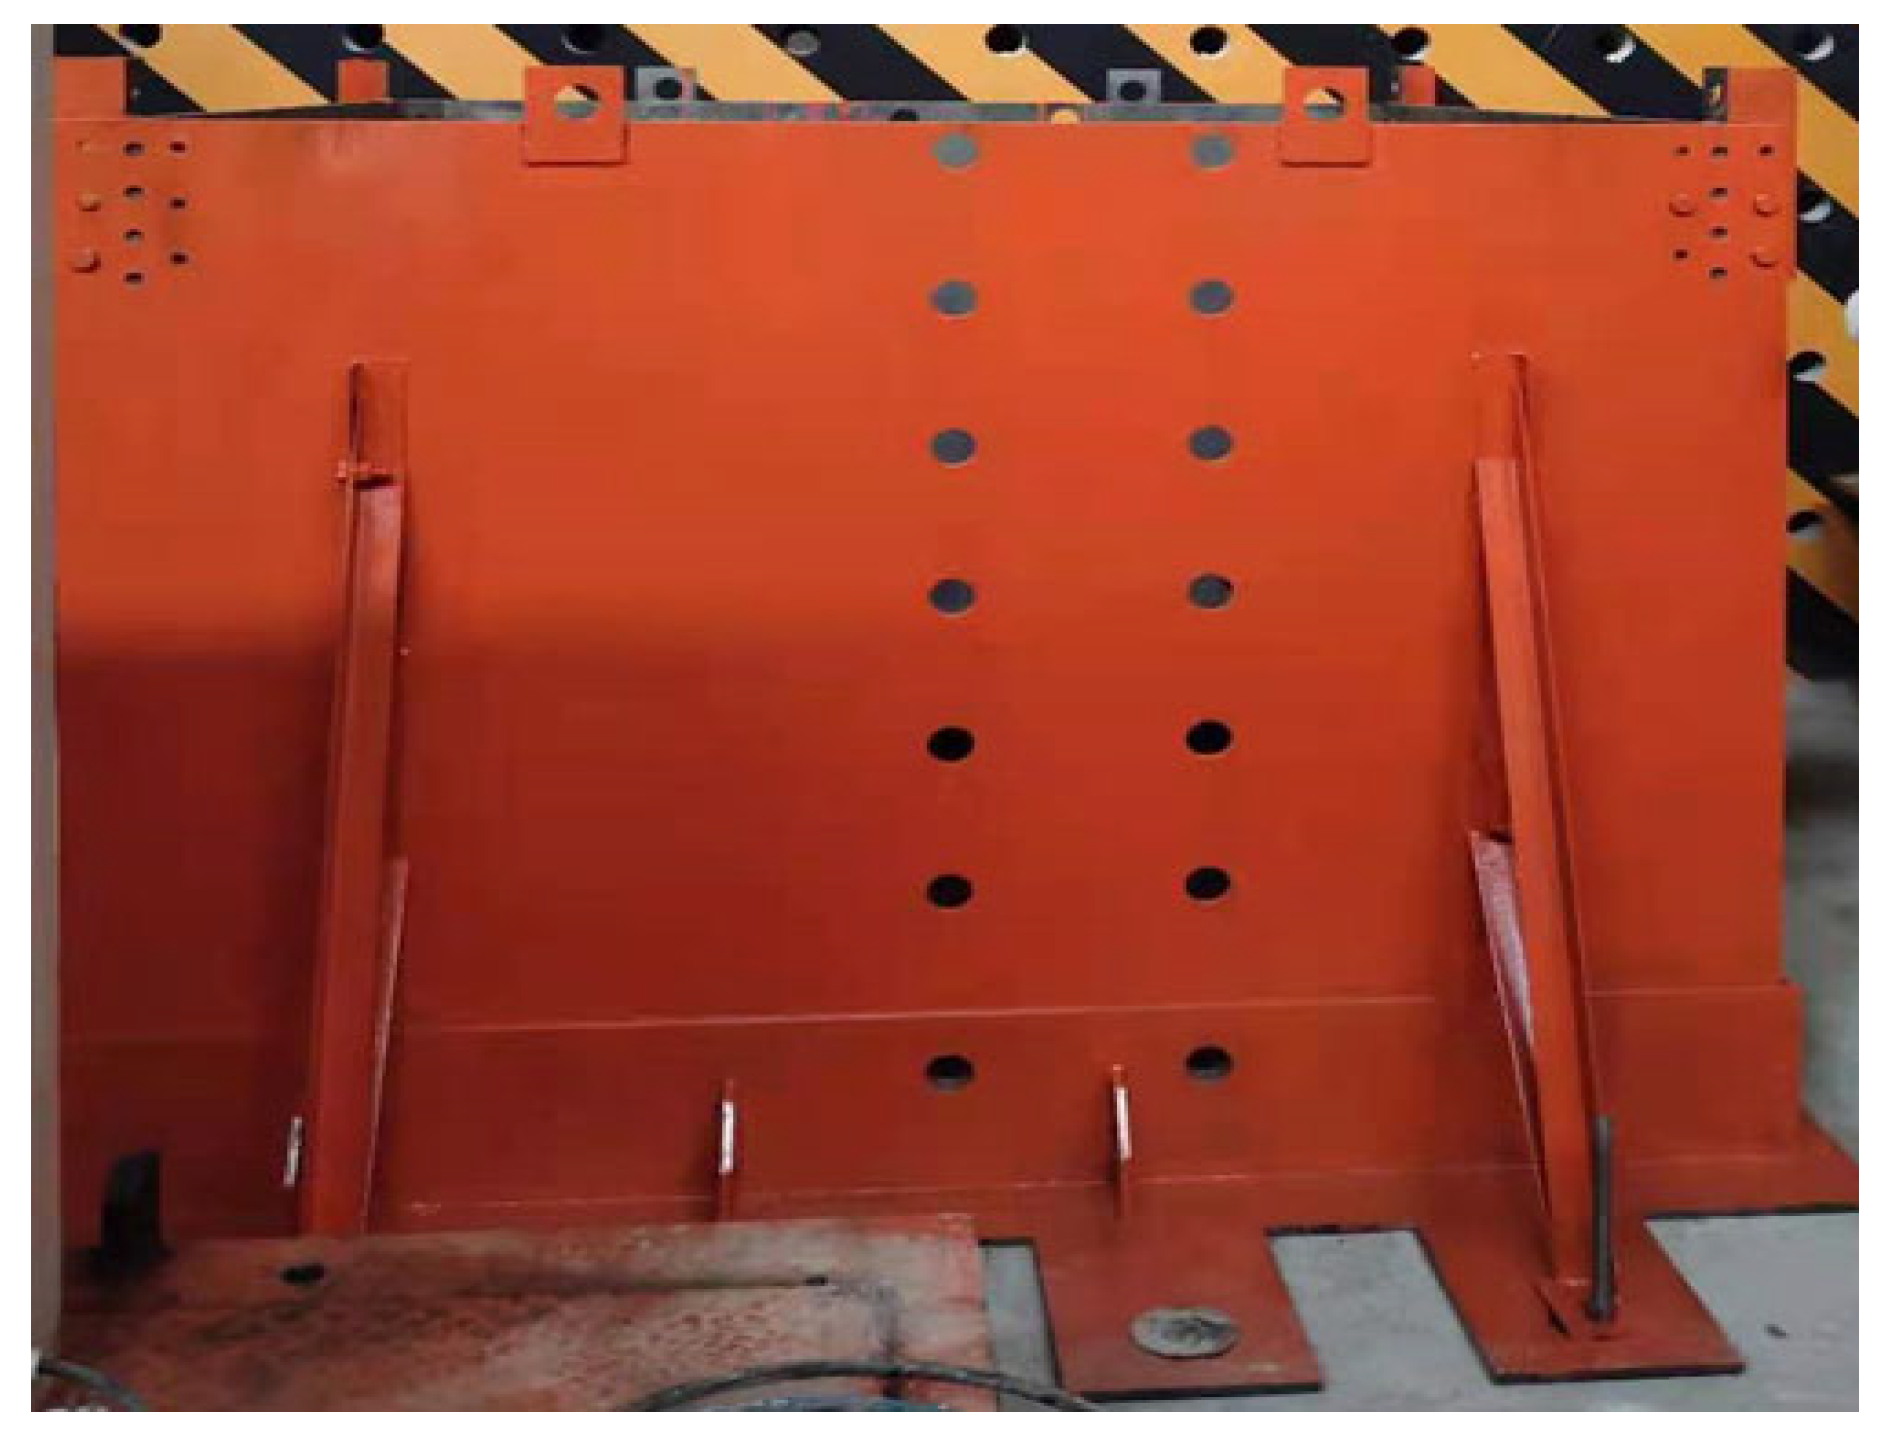
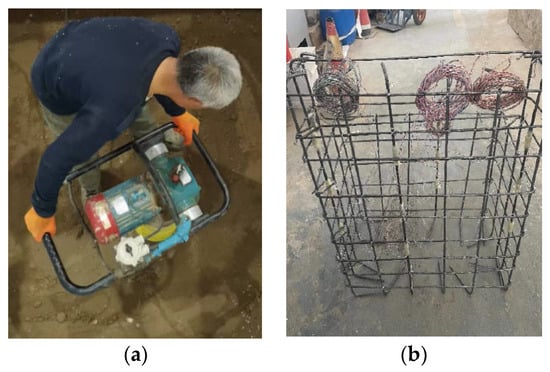
(1) Preparation and tamping of ground soil. First, a pre-designed and custom-made steel model box is installed on the laboratory floor to constrain soil, as shown in Figure 6. A 10 cm thick layer of polystyrene foam board is installed along the inner walls of the model box. Due to its relatively low stiffness, this approach effectively minimizes boundary effects within the container during testing. The model box is fixed to the laboratory floor by 12 screws with a diameter of 80 mm. To increase the stability of the soil box, four diagonal braces are added in the loading direction. The soil is filled into the soil box and tamped using an electric compactor, as shown in Figure 7a. To ensure compactness, the tamping thickness of each layer is controlled within 25 cm until the bottom elevation of the foundation.
Figure 6.
Steel model box.
Figure 7.
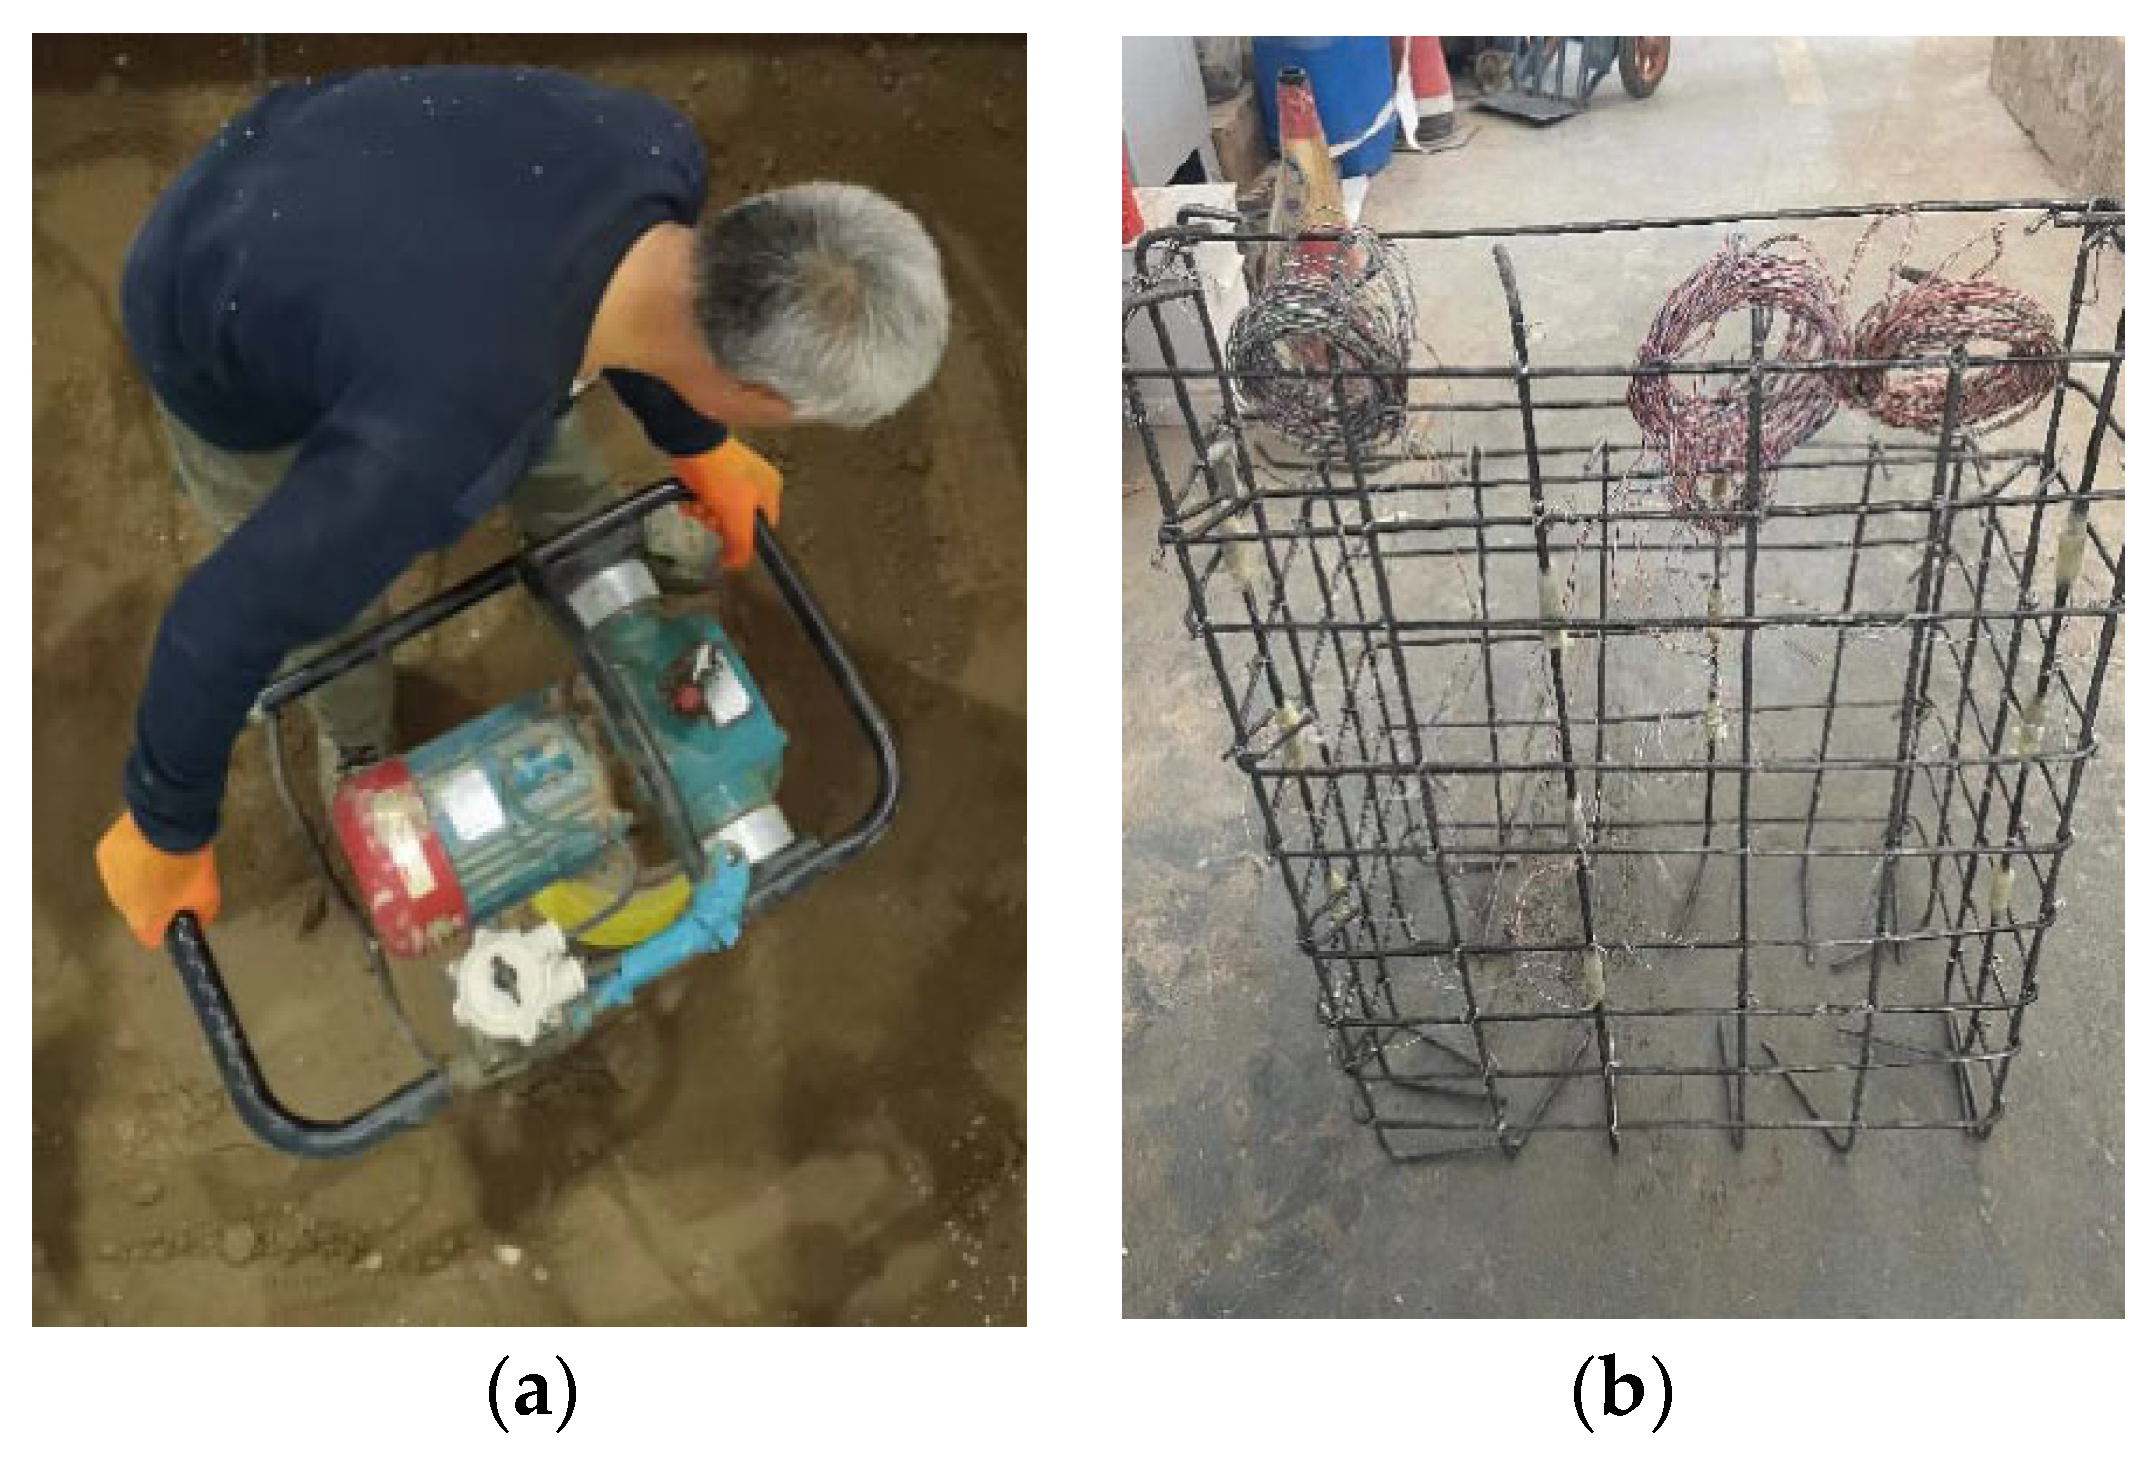
Compaction of soil and binding of steel cage: (a) compaction of soil; (b) binding of steel cage.
(2) Steel cage fabrication. As shown in Figure 7b, the steel cages of the abutments and foundations are strapped by stirrups with a diameter of 6 mm and longitudinal bars with 8 mm.
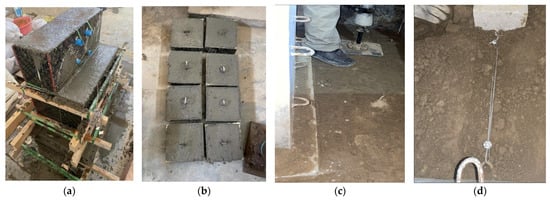
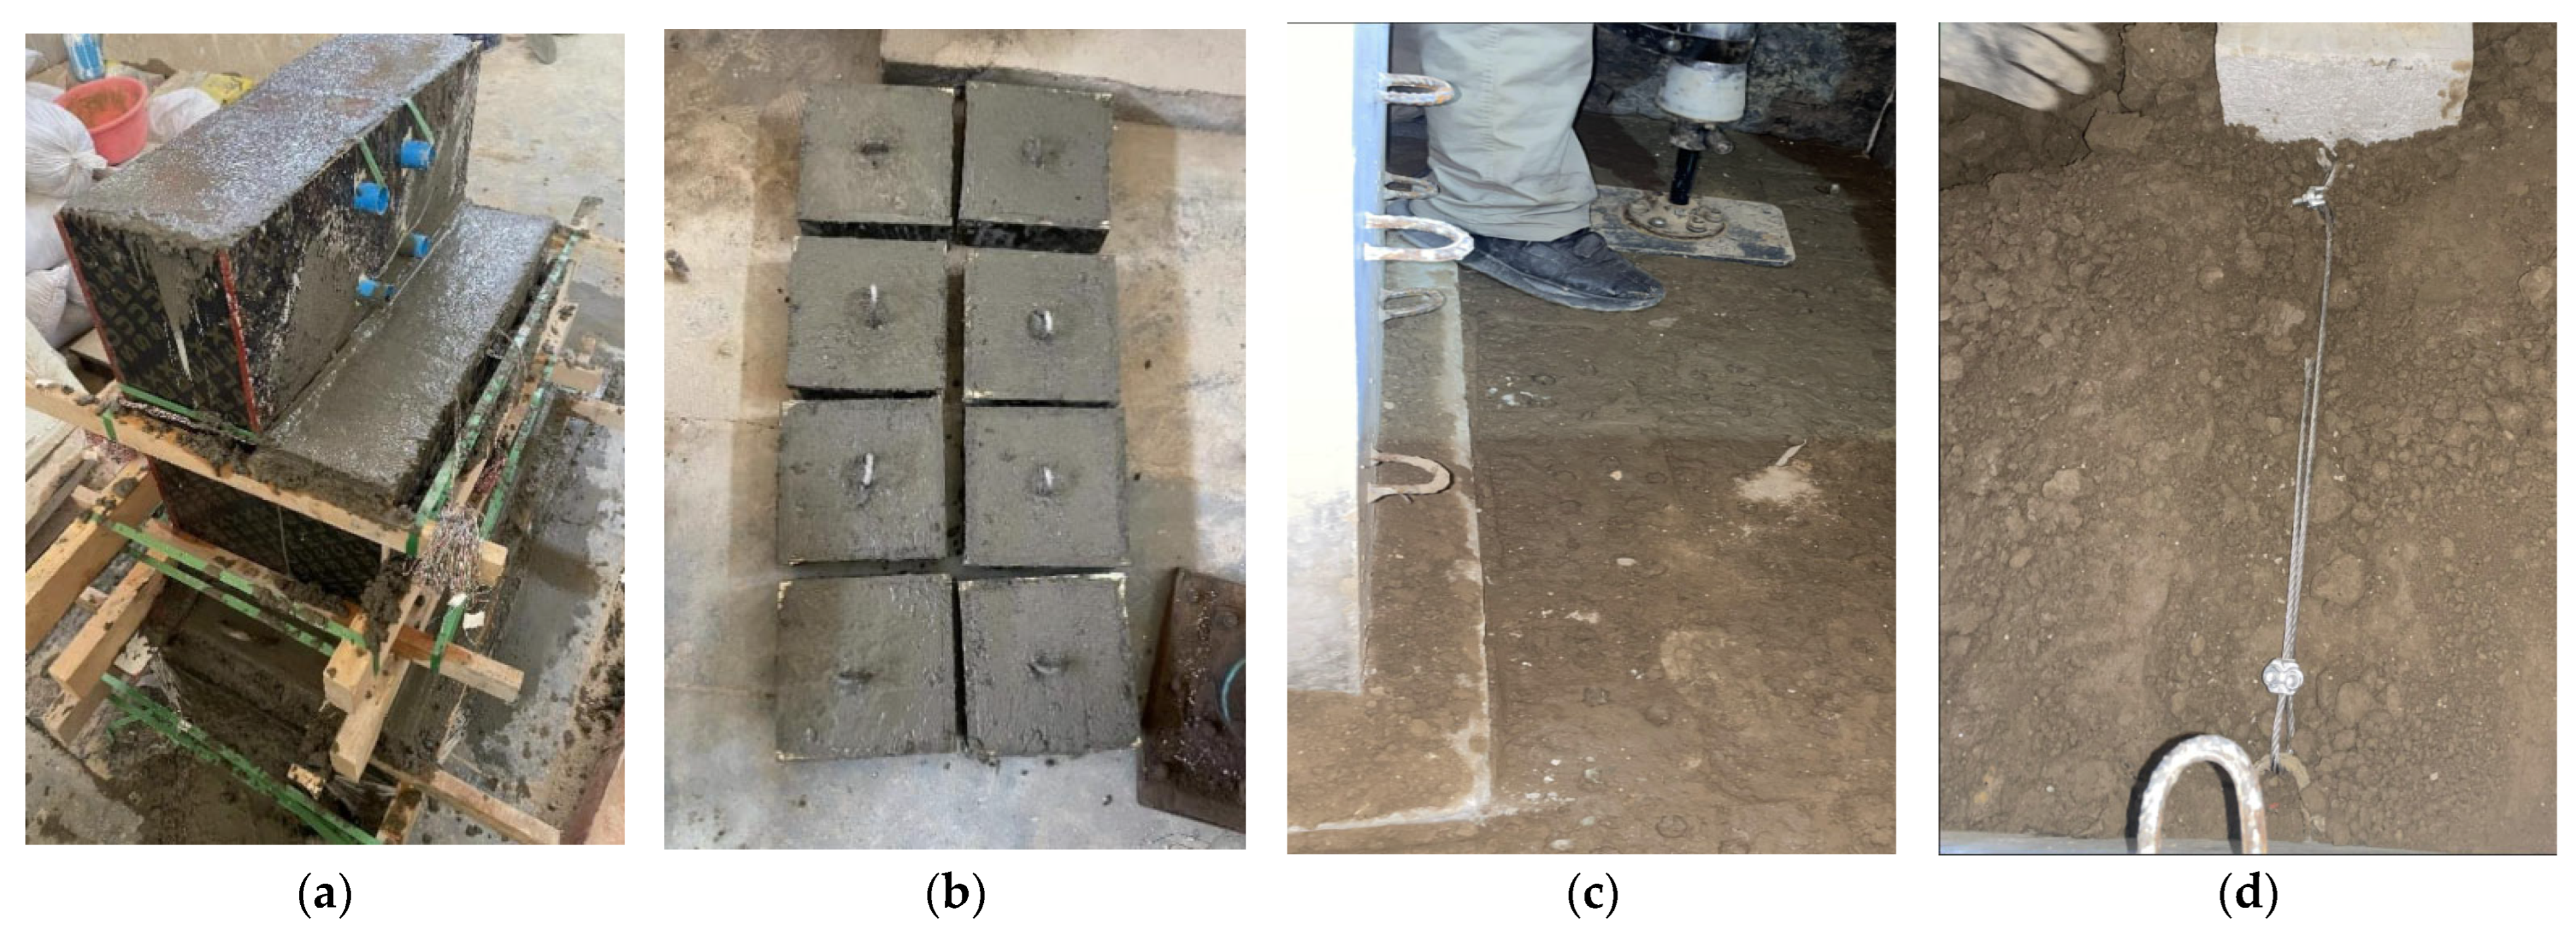
(3) Concrete pouring for abutment and foundation. The concrete of the abutment and foundation is poured on the laboratory ground outside the model box, as shown in Figure 8a. Before being hoisted, the concrete is cured for 28 days until it reached the designed strength. It should be noted that during the concrete pouring, U-shaped rings made of steel bar are pre-embedded at the designed positions of the abutment back for connecting U-shaped fasteners. U-shaped fasteners are used to connect steel bundles on the back side of the abutment.
Figure 8.
Pouring and installation of the model: (a) concrete pouring for abutment and foundation; (b) prefabrication of anchor plates; (c) installation of abutment; (d) installation of anchor plates and steel bundles.
(4) Prefabrication of anchor plates. Figure 8b shows the prefabricated anchor plates. The anchor plates are also poured with C30 concrete. U-shaped rings made of steel bar are also pre-embedded on the anchor plates to connect the steel bundles in the subgrade.
(5) Installation of abutment. After the soil in the model box is compacted to the designed elevation, the prefabricated abutment is hoisted into the designed positions within the box, as shown in Figure 8c. Then, the foundation soil around the abutment is filled and compacted with an electric tamper. To ensure compactness, the thickness of each layer for compaction is controlled within 20 cm.
(6) Installation of anchor plates and steel bundles. Figure 8c,d shows the installation process of the anchor plates and steel bundles. To ensure the compactness of the soil around the anchor plates, the foundation pits for the anchor plates are excavated and the anchor plates are buried after the soil is compacted to the designed elevation. Then, the ends of the steel bundles are connected to the U-shaped fasteners located on the abutment back and the anchor plate. After the steel bundles and anchor plates have been installed, the soil continues to be compacted to the designed elevation.
2.4. Loading System of the Experiment
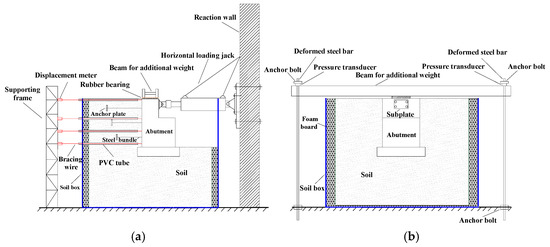
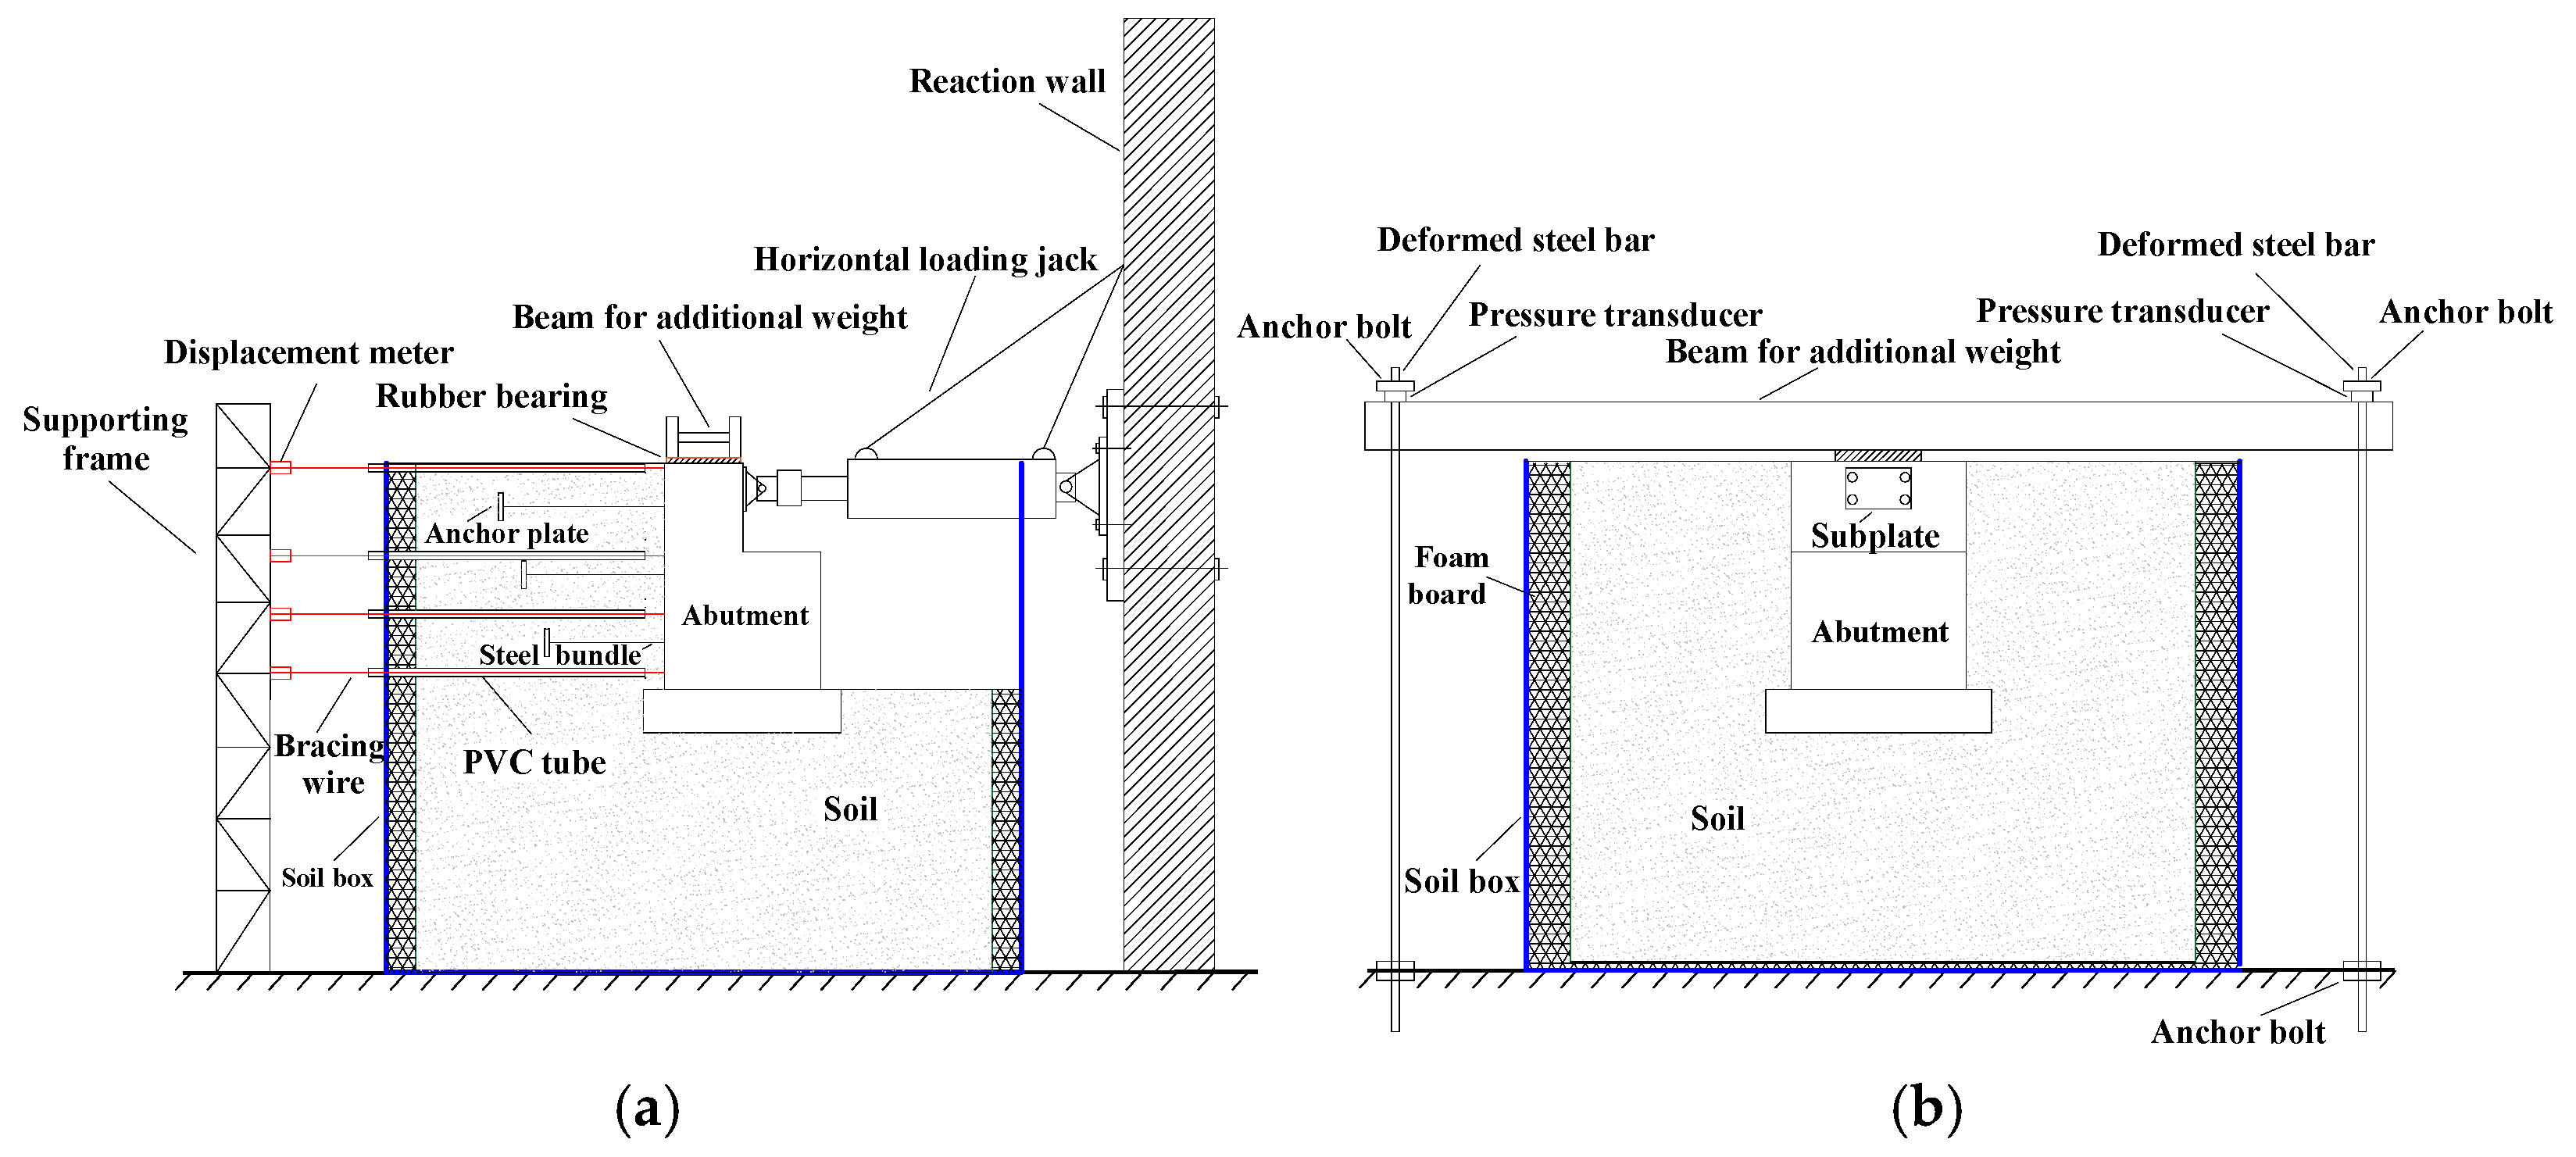
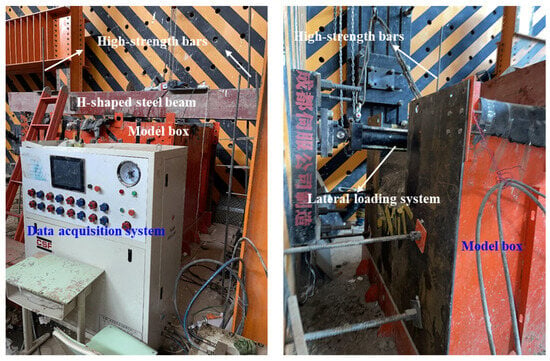
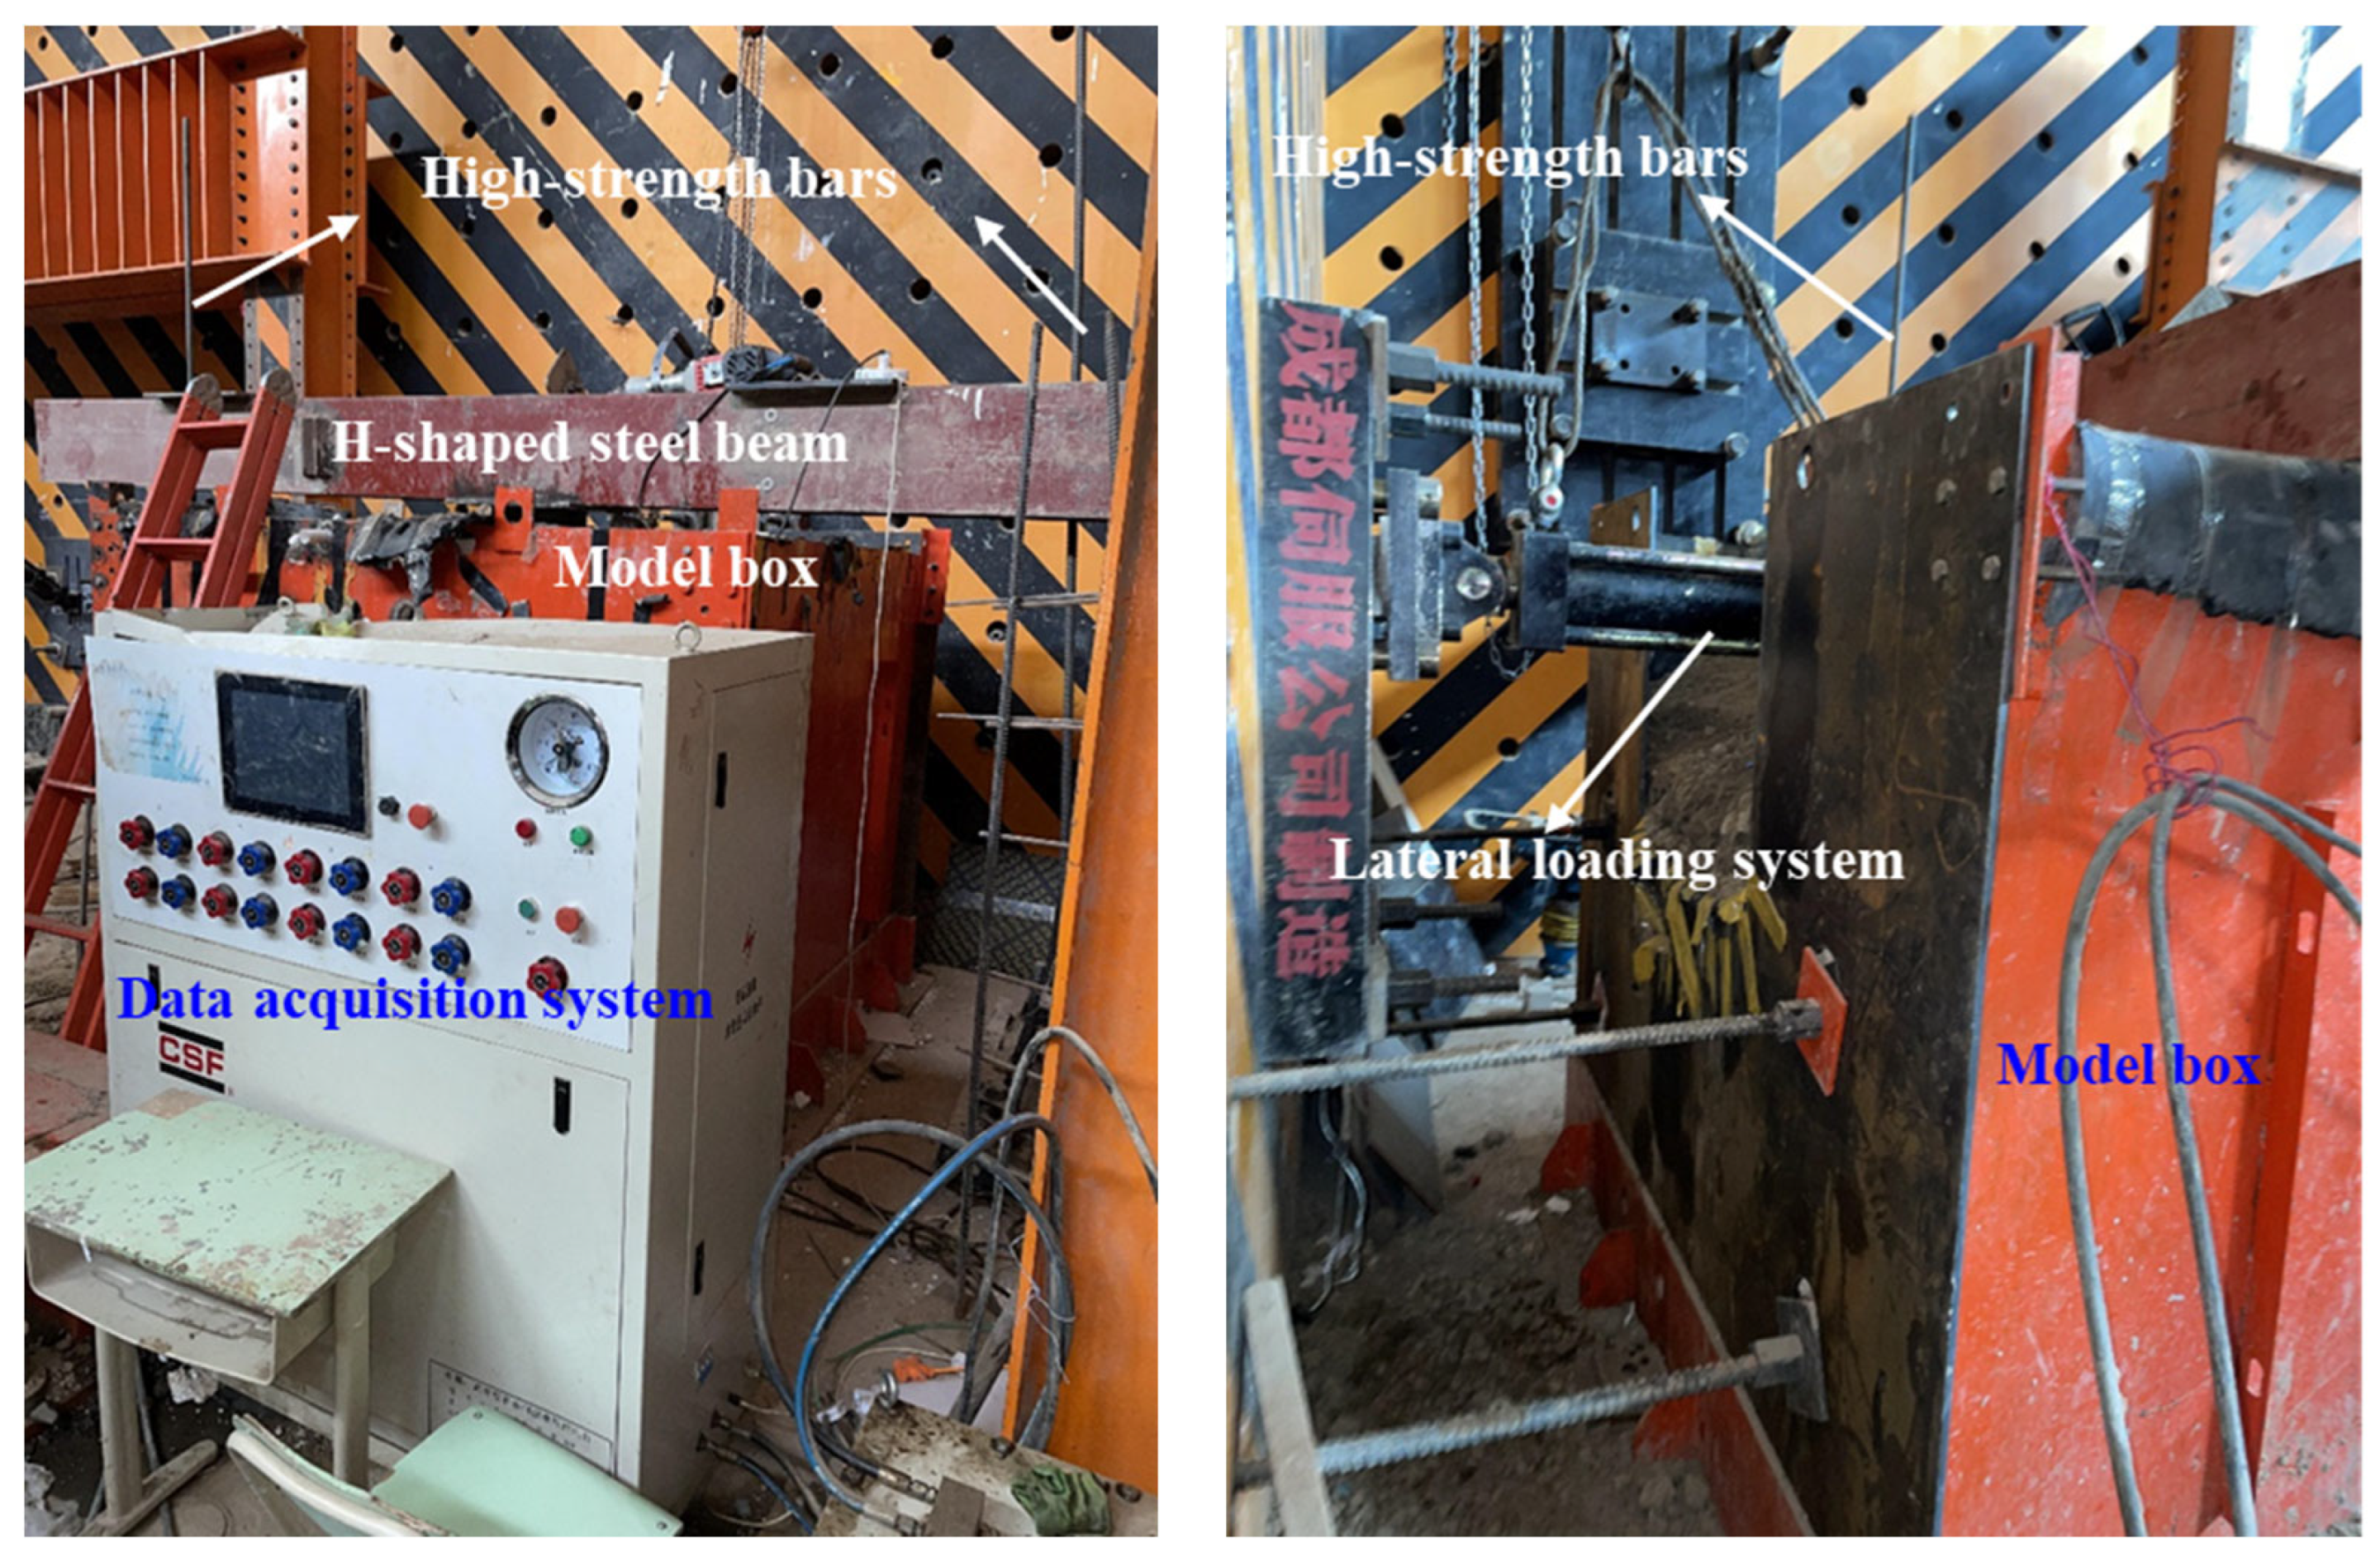
After the model installation is completed, the test setups will be installed. The test setups consist of a loading system and a data collection system. Figure 9 shows the loading system of the quasi-static test. The loading system is composed of horizontal loading apparatus and vertical loading apparatus. The horizontal loading apparatus consists of a servo-controlled hydraulic actuator which exerts a horizontal load on the model, as shown in Figure 9a. The lateral actuator is capable of providing a load capacity of ±300 kN and a displacement of ±200 mm. The vertical loading system is shown in Figure 9b. An H-shaped steel beam and two high-strength bars with anchor bolts constitute the vertical loading apparatus, which applies vertical load by tightening the bolt. The vertical load is measured by pressure transducers installed at the top of the high-strength bars.
Figure 9.
Loading system for quasi-static tests: (a) lateral loading apparatus; (b) vertical loading apparatus.
In order to represent the dead load from the bridge deck, a vertical load is applied to the top of the abutment throughout the test by the vertical loading system. The vertical load applied at the top of the model is 52 kN. The vertical load is calculated based on the actual dead load at the top of the prototype abutment and measured through the pressure transducers in the process of experiments. The loading system layout is illustrated in Figure 10.
Figure 10.
Layout of the loading system.
2.5. Loading Protocol
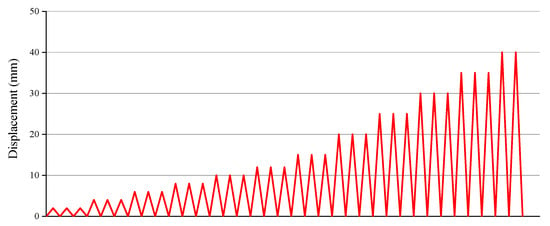
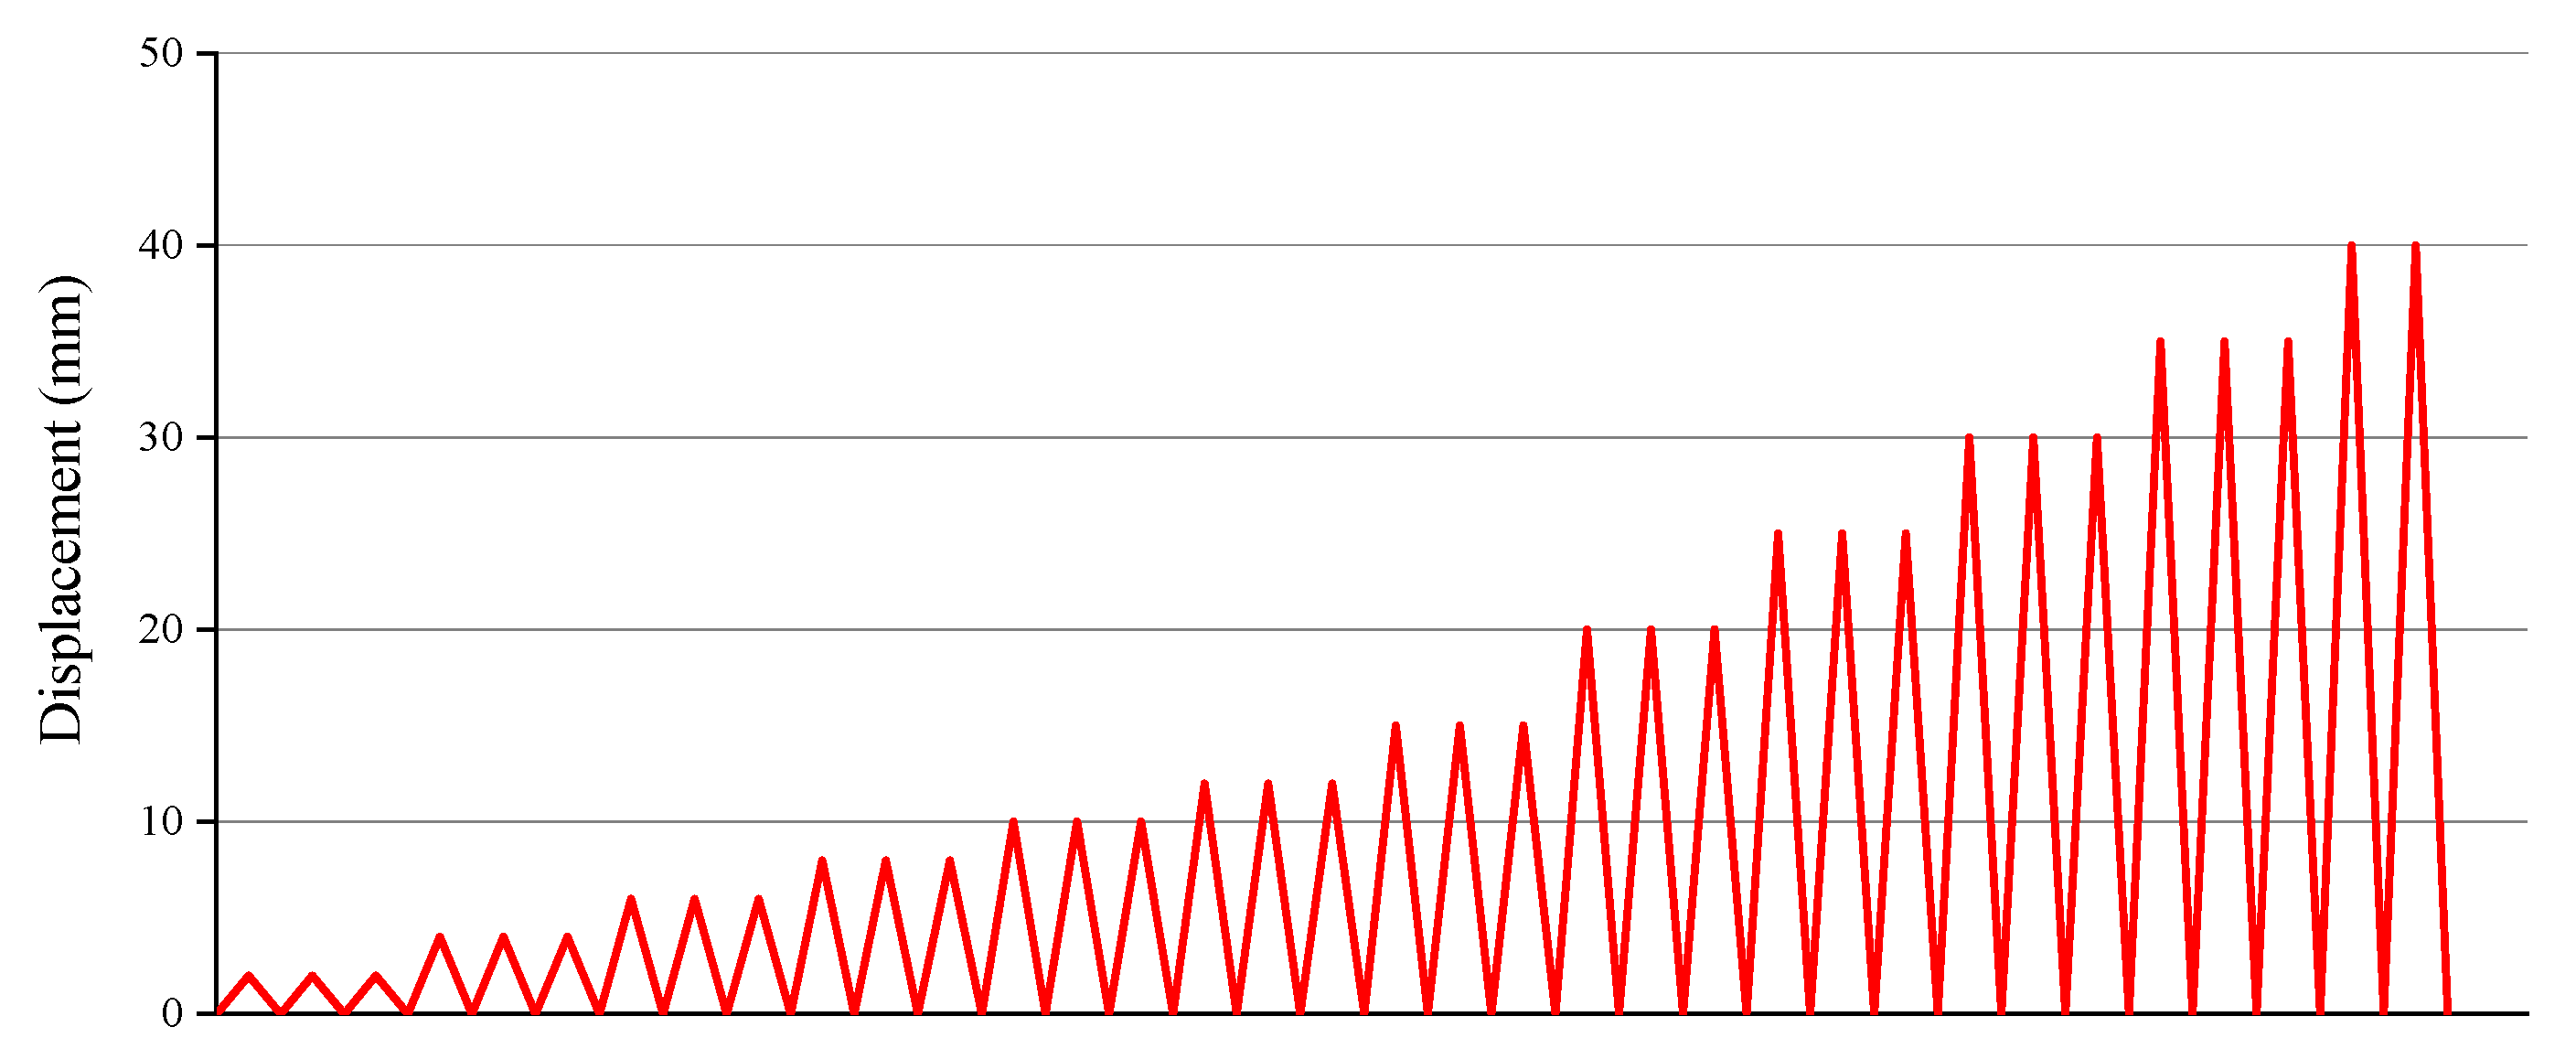
To simulate the horizontal reciprocating movement caused by earthquake load, the reciprocating load is applied to the specimens by displacement control in this test. In the model P-1, the displacement is loaded step by step according to a step size of 2 mm until a total of 18 mm is reached. In the model P-2, the lateral loading protocol consists of two stages: (1) the first phase includes 2 mm, 4 mm, 6 mm, 8 mm, 10 mm, 12 mm, and 15 mm; (2) the second phase is 15 mm to 40 mm with an increment of 5 mm. It should be noted that since the function of the anchor plates and steel bundles is to prevent the abutment from overturning towards the front of the abutment under seismic force, the displacement load in this experiment is only applied towards the front of the abutment. As shown in Figure 11, the cycle displacement load consists of several incremental displacement loading steps and each displacement loading step has three equal displacement cycles.
Figure 11.
Displacement history with displacement control method.
2.6. Measuring Sensors
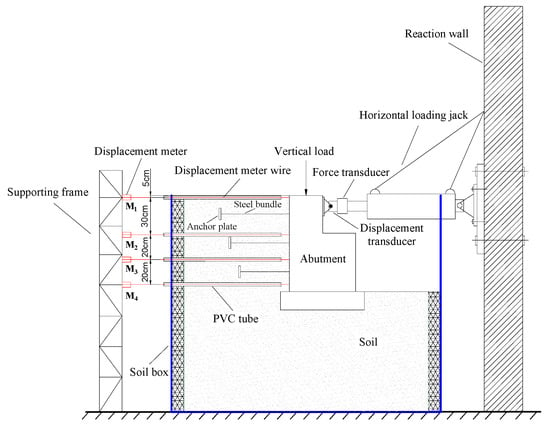
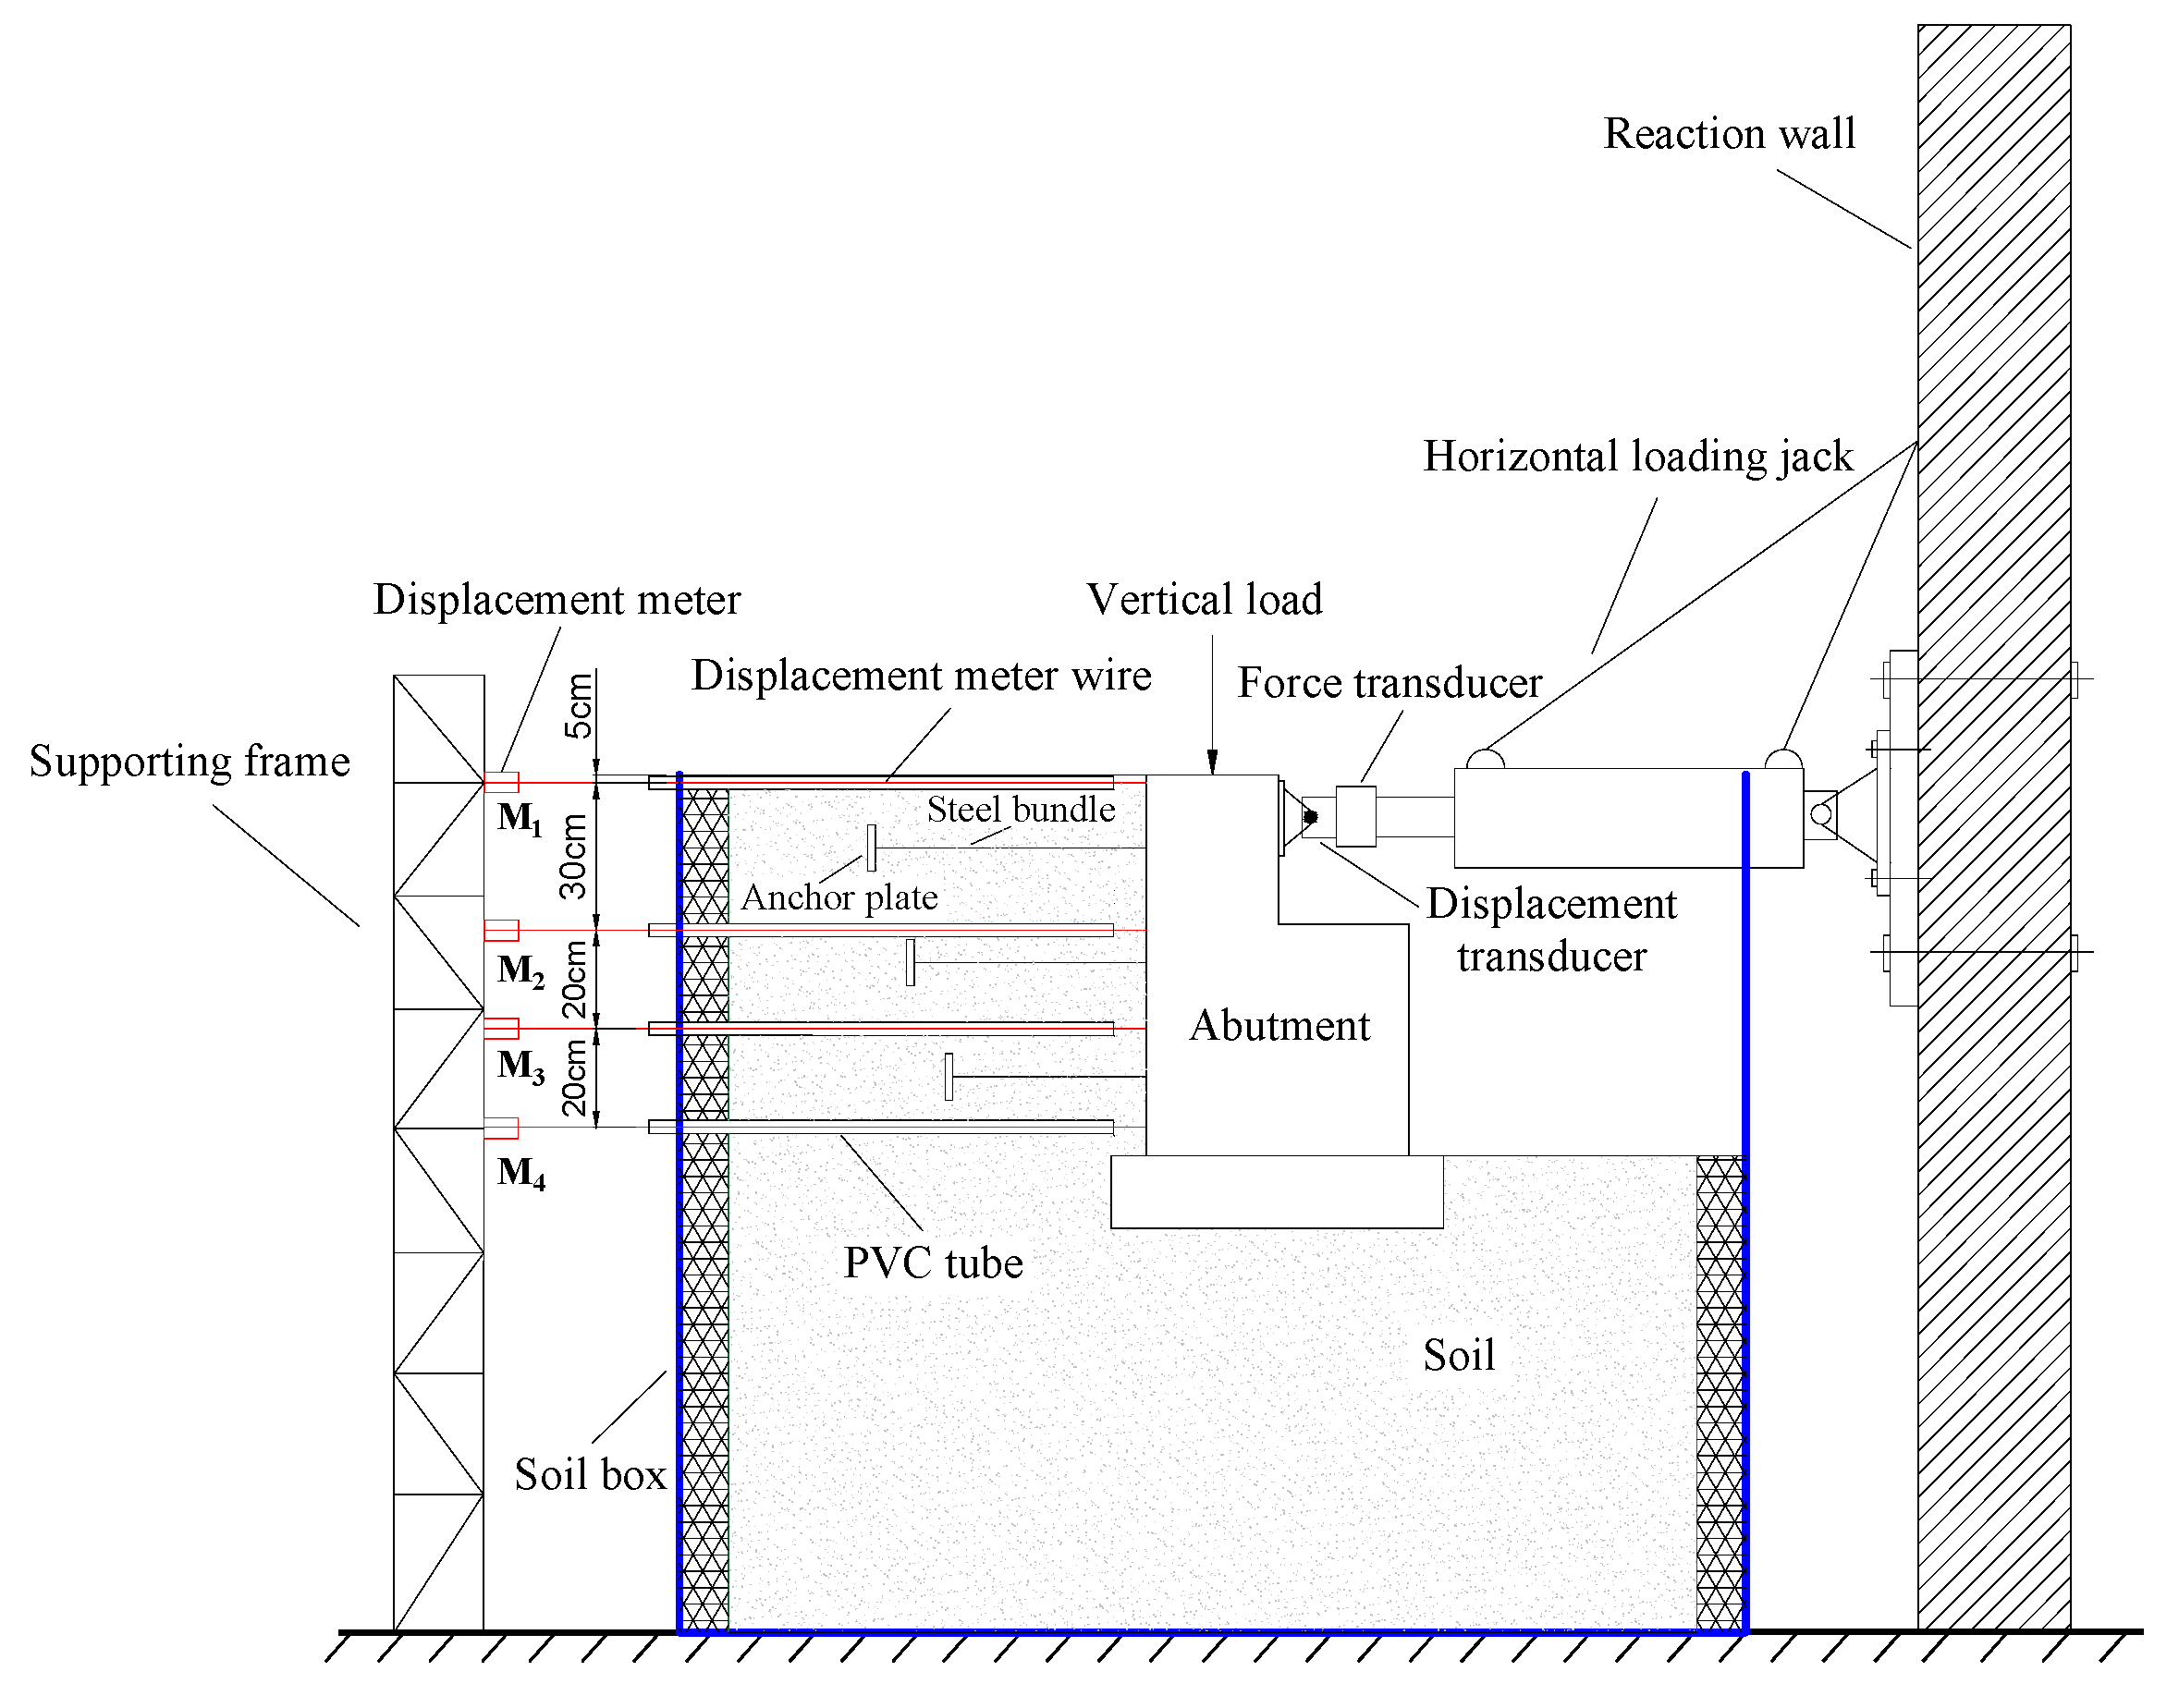
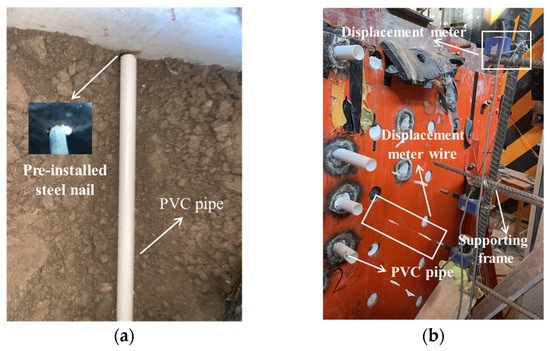
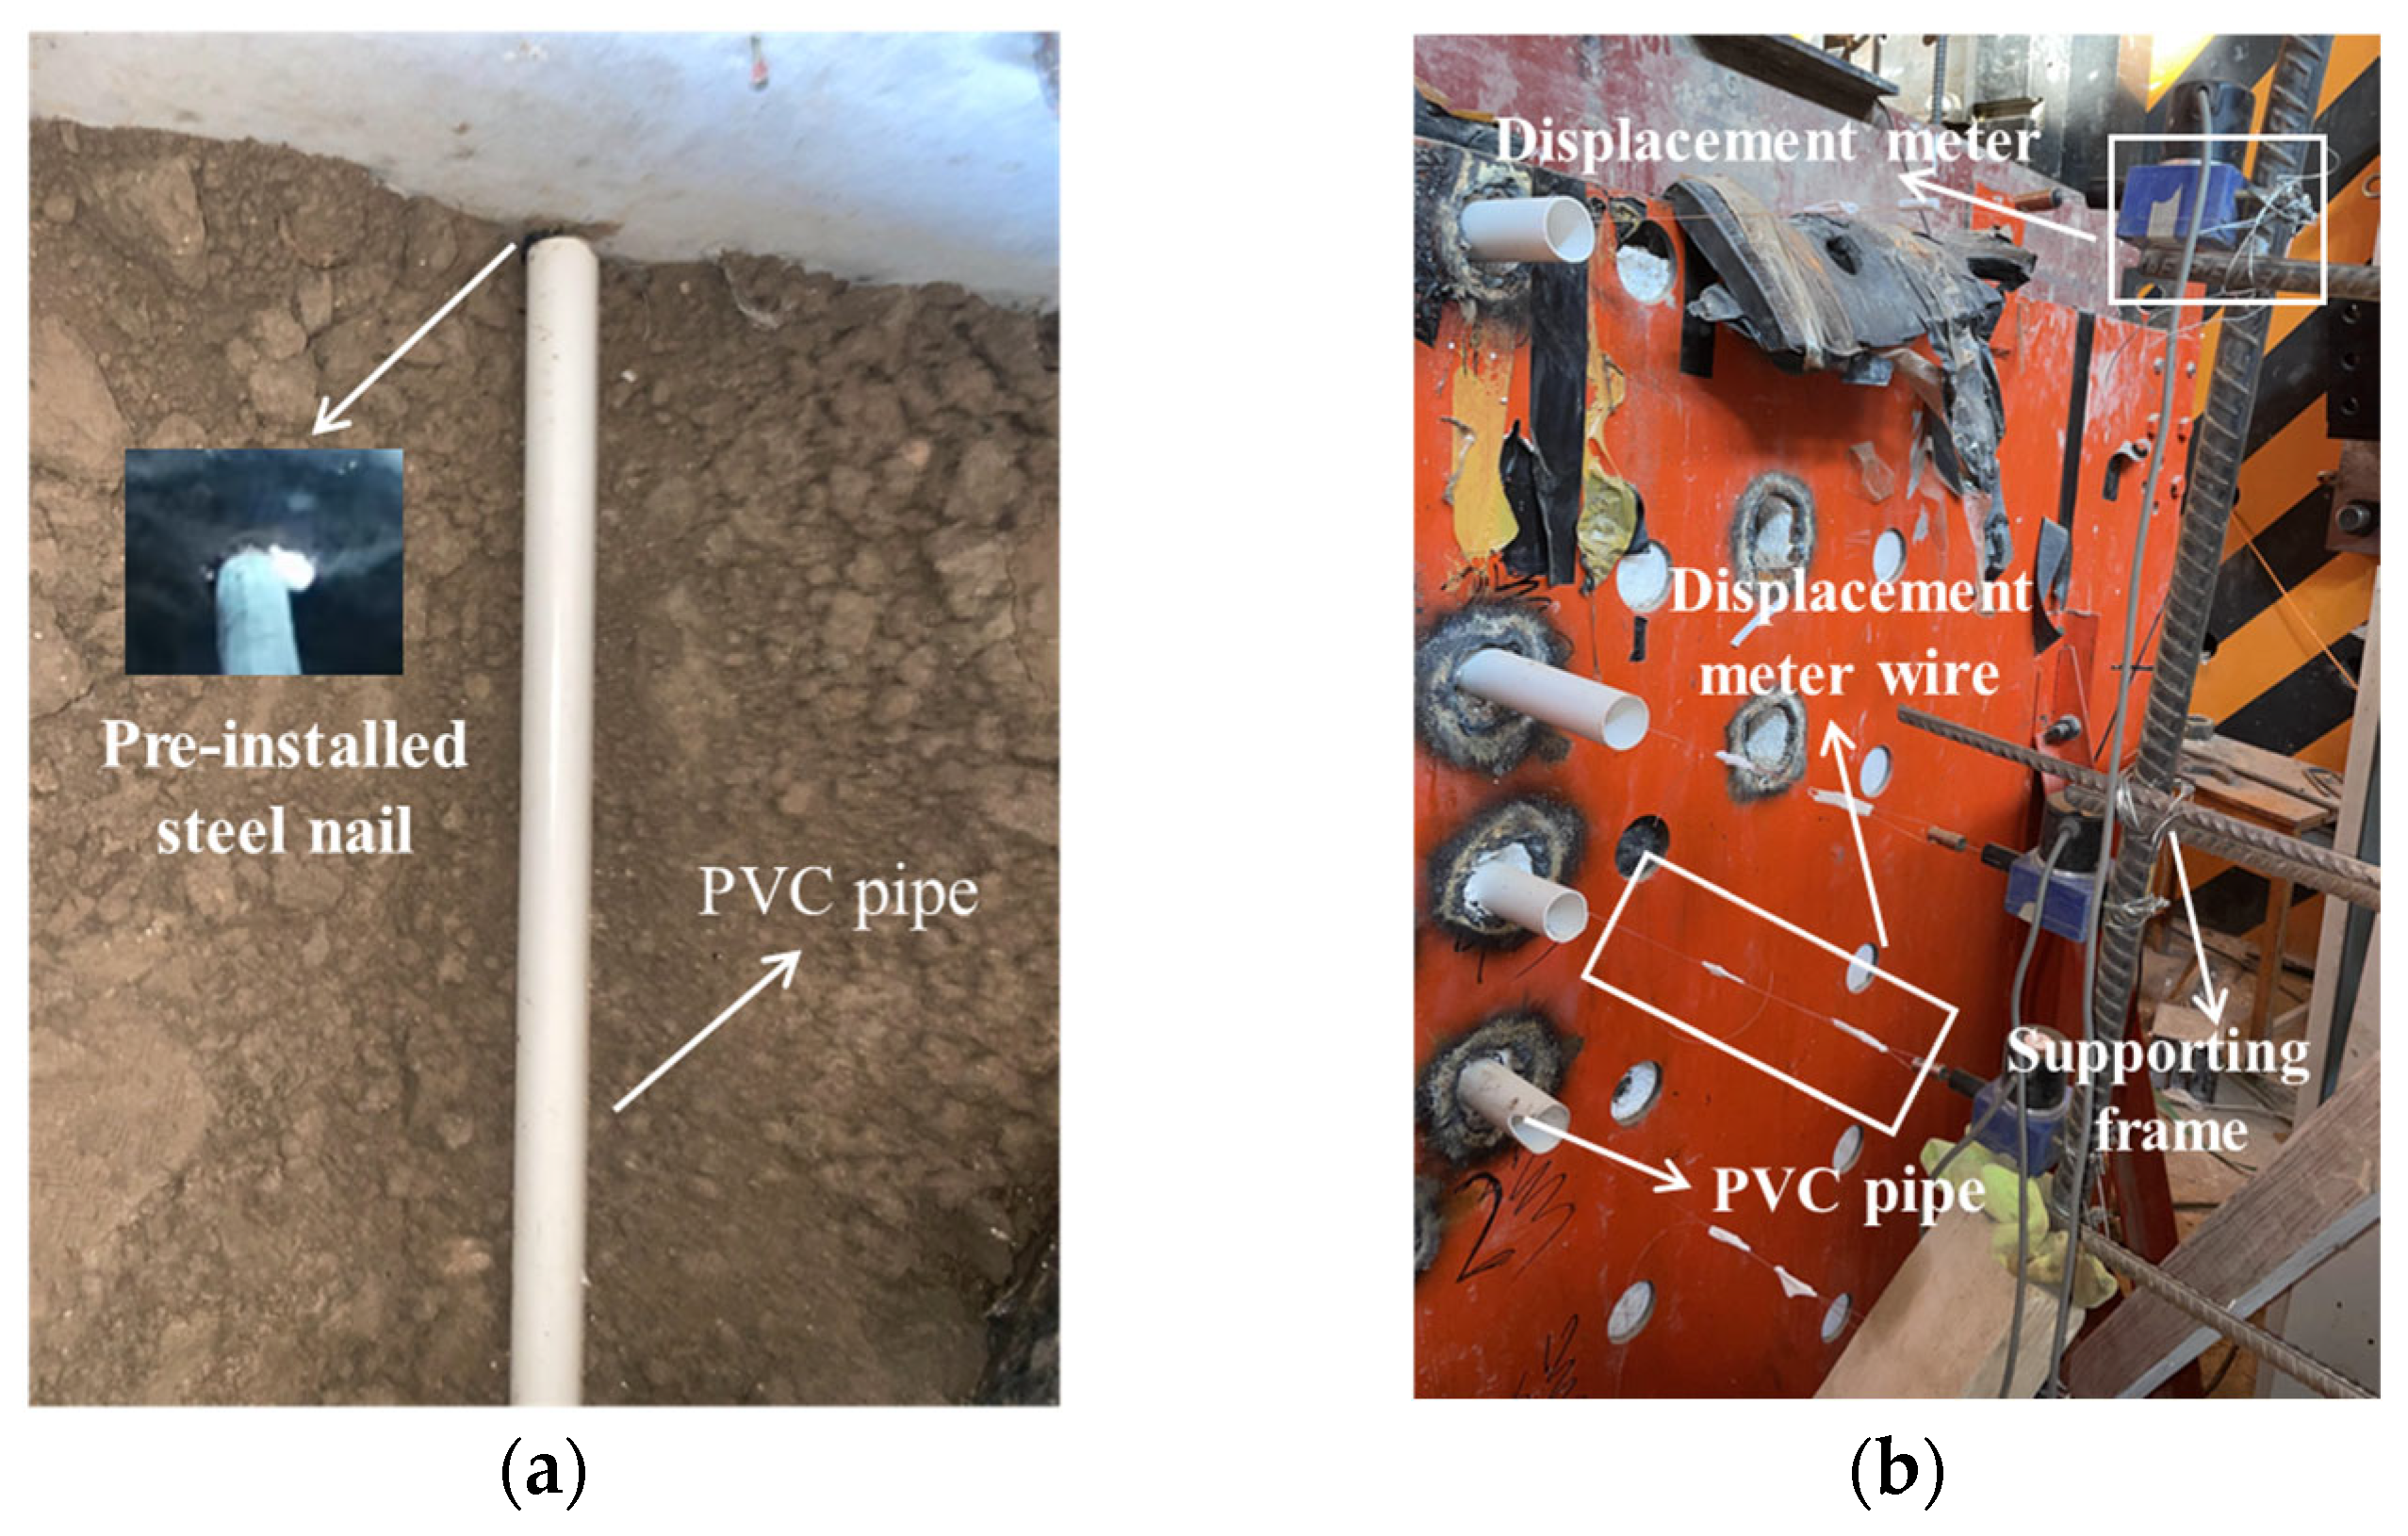
The arrangement of the sensors is shown in Figure 12. The force–displacement relationship at the top of the abutment and the displacement of the abutment back are the important parameters that need to be measured in this experiment. The force–displacement relationship at the top of the front wall for the abutment is obtained by the horizontal loading apparatus and data acquisition system. The displacement and the horizontal force are measured, respectively, by the displacement transducer and the force transducer embedded within the horizontal loading device. To measure the horizontal displacement of the back for the abutment along its depth, four displacement meters are installed on the back of the abutment. The distances from the four displacement meters to the top of the back for the abutment are 5 cm, 35 cm, 55 cm, and 75 cm, respectively, and numbered as M1, M2, M3, and M4 sequentially. In addition, a set of testing equipment is adopted in order to eliminate the influence of friction between the wire of displacement meters and the soil during the experiment, as shown in Figure 13. The wire of the displacement meter is connected to the measuring point and displacement meter. In order to eliminate the influence of the soil on the displacement wire, a PVC pipe is buried into the foundation soil to protect the wire. The measuring points on the abutment back are specially treated to prevent the PVC pipe from making contact with the back of the abutment (Figure 13a). The displacement meters are installed on the shelf outside the soil container.
Figure 12.
Layout of the measuring sensors.
Figure 13.
Measurement device of lateral displacement for the back of abutment: (a) PVC pipe; (b) displacement meters.
3. Analysis of Test Results
3.1. Specimen Failure Characteristics
3.1.1. Failure Characteristics of Specimen P-1
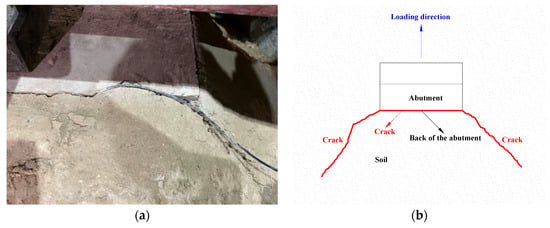
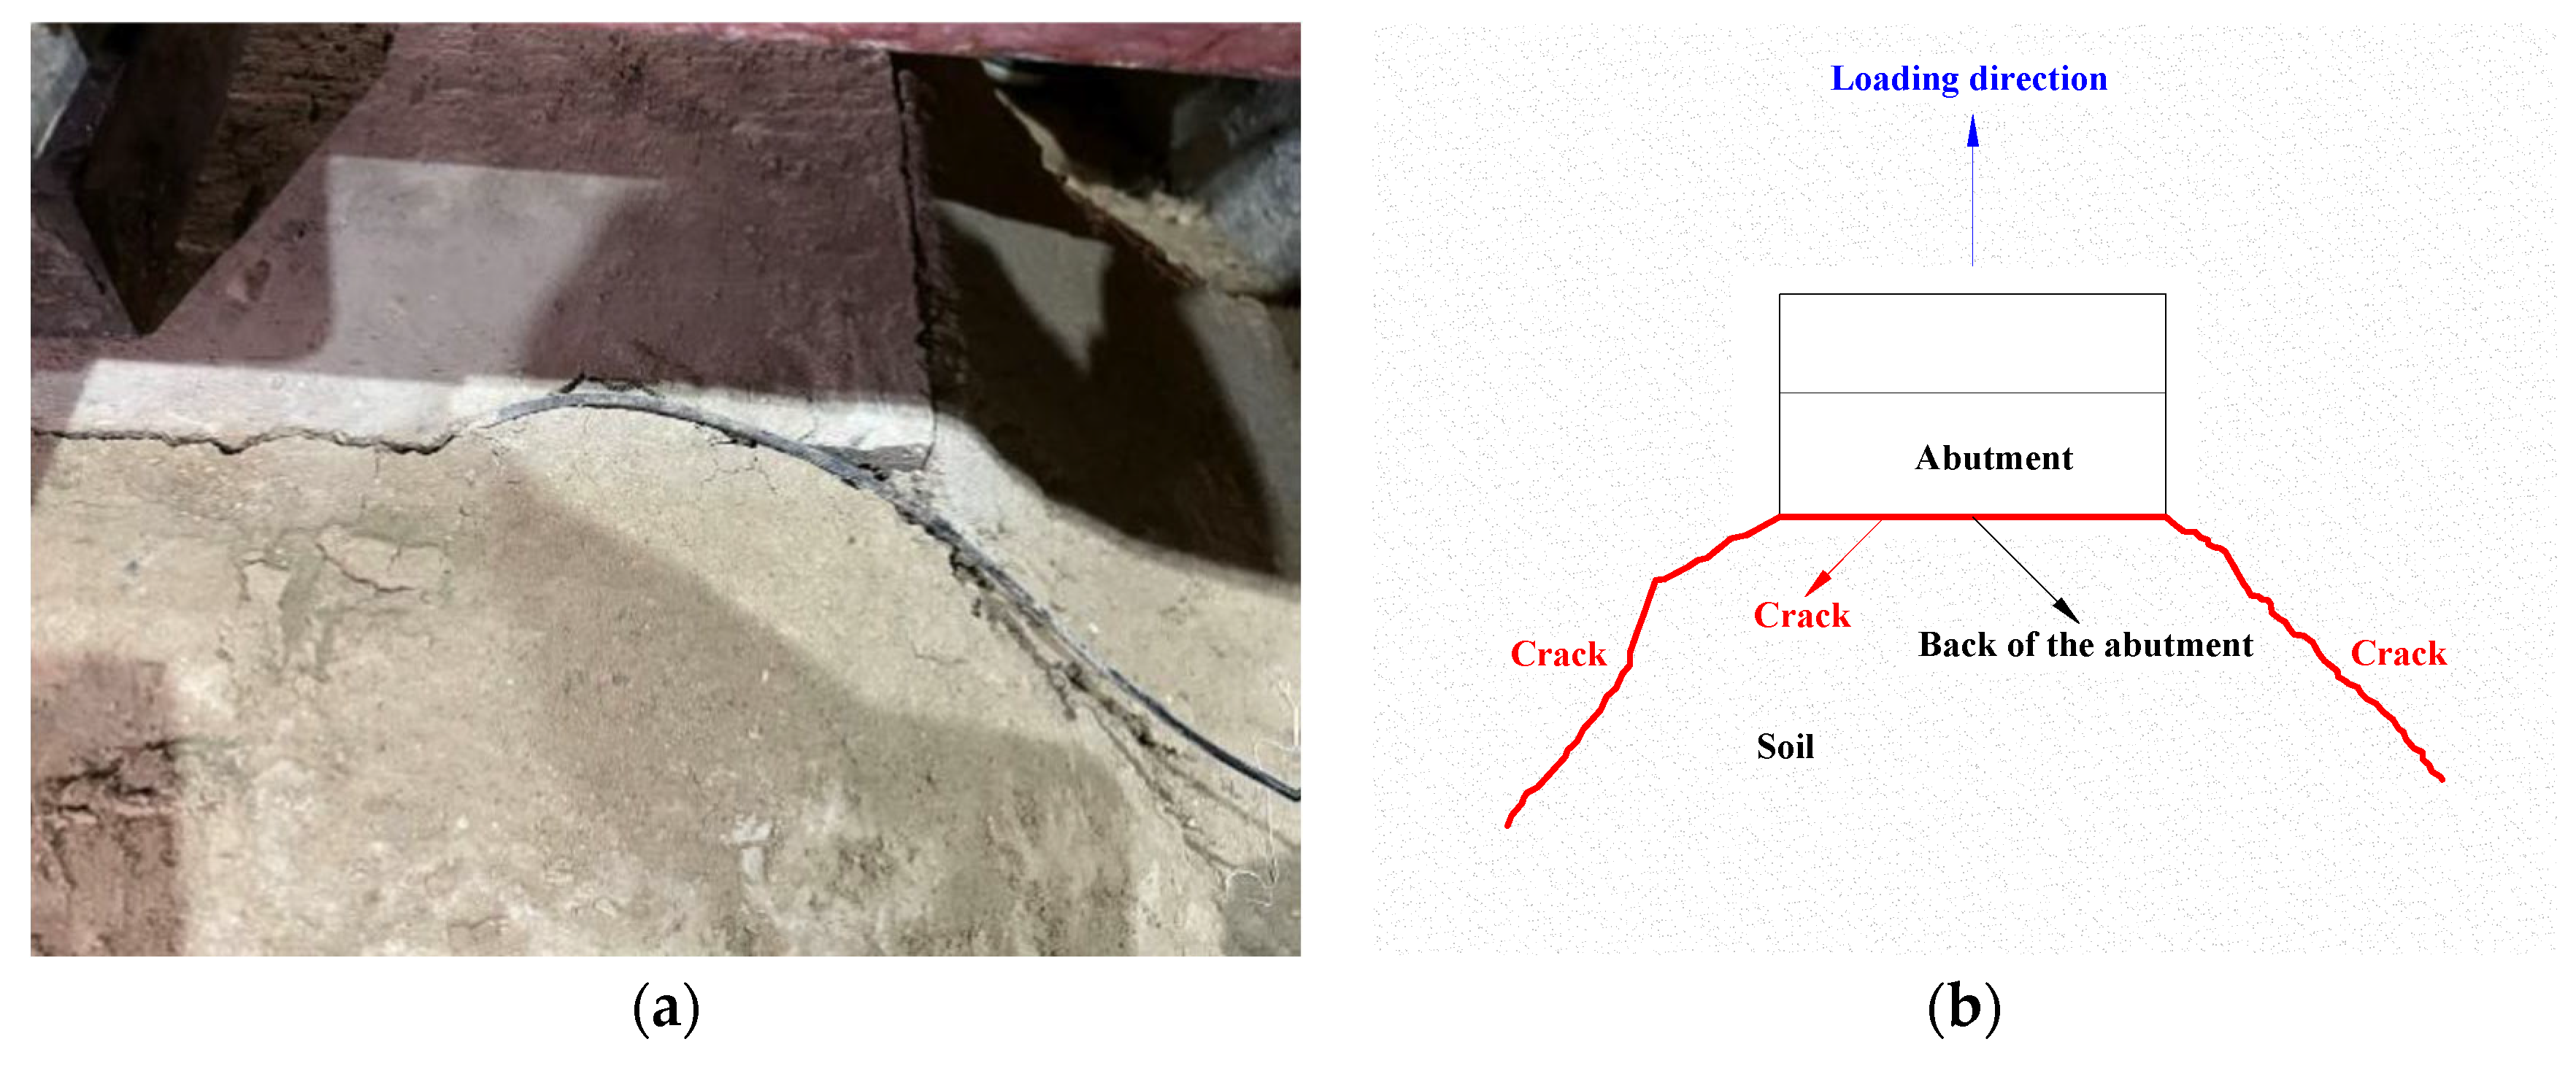
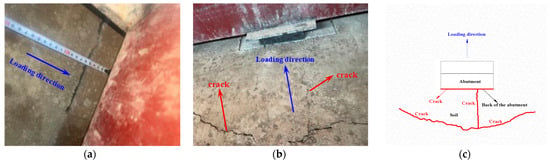
When the loading displacement reaches 4 mm, a minor crack appears between the back of the abutment and the soil at the top surface of the specimen soil. The cracks grow in depth and width continuously with the increasing loading displacement. As shown in Figure 14a, the crack extends in 45 degree directions towards the rear of the abutment as the loading displacement increases to 8 mm. When the load displacement reaches 18 mm, the test is terminated because the bearing capacity of the specimen drops to 83.2% of its ultimate bearing capacity. Figure 14b shows the surface crack distribution of the specimen soil. In addition, the concrete of specimen P-1 after excavation is observed. It can be discovered that the abutments themselves are not damaged.
Figure 14.
The soil surface crack of specimen P-1 observed during the test: (a) the actual picture of the crack; (b) diagram of crack distribution.
3.1.2. Failure Characteristics of Specimen P-2
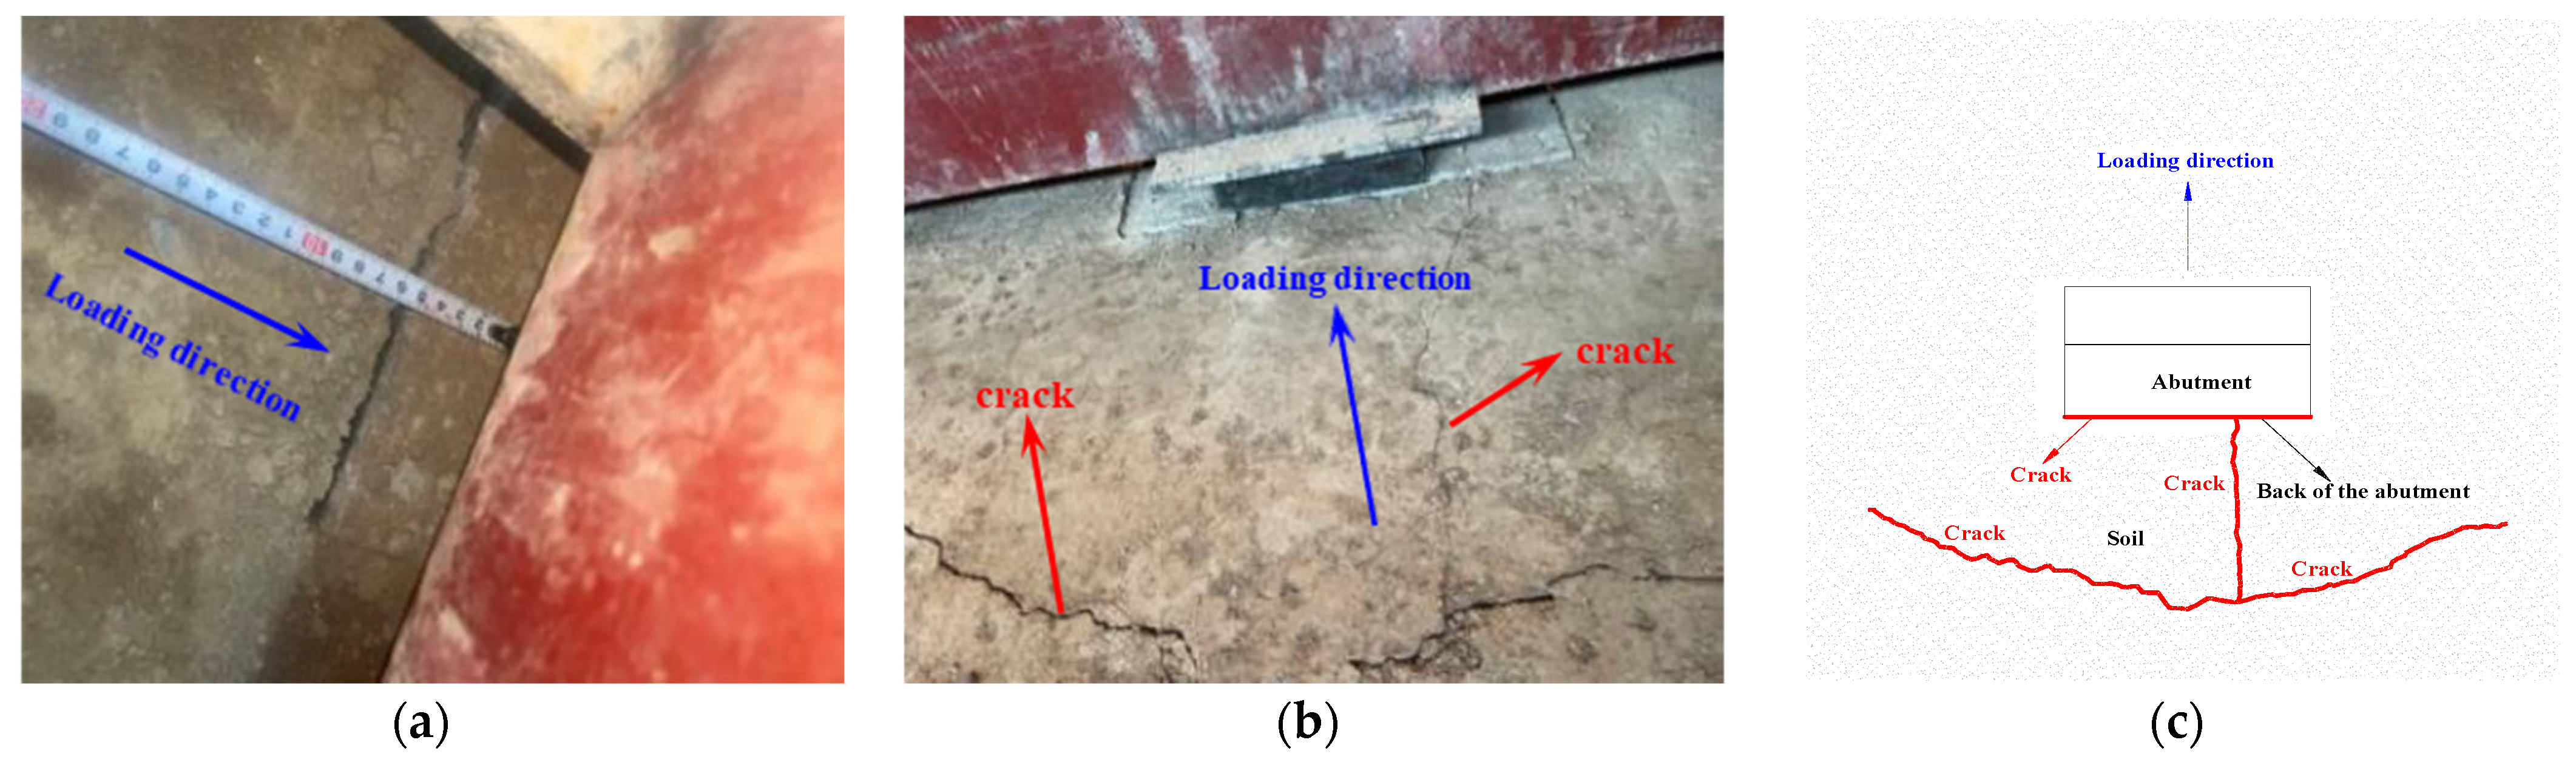
As shown in Figure 15a, a minor crack is observed between the back of specimen P-2 and the soil at the top surface of the specimen soil as the loading displacement reaches 4 mm. The crack width begins to widen with the increasing loading displacement. When the load displacement reaches 8 mm, a tiny crack parallel to the loading direction appears on the surface of the backfill at the back of the abutment, as shown in Figure 15b. This indicates that the steel bundles begin to bear tension when the displacement load reaches 8 mm. As the load displacement reaches 25 mm, a crack is observed on the surface of the backfill 70 cm away from the back of the abutment and perpendicular to the loading direction, as shown in Figure 15b,c. With the increase in displacement, the soil at the area of the anchor plate undergoes compressive failure, and the expansion rate of the cracks behind the abutment begins to increase. When loaded to 40 mm, the test is terminated with the fracture of a steel bundle. Figure 15c shows the crack distribution of the surface soil for specimen P-2.
Figure 15.
The soil surface crack of specimen P-2 observed during the test: (a) the crack at the back of the abutment; (b) surface cracks of the backfill soil behind the abutment; (c) diagram of crack distribution.
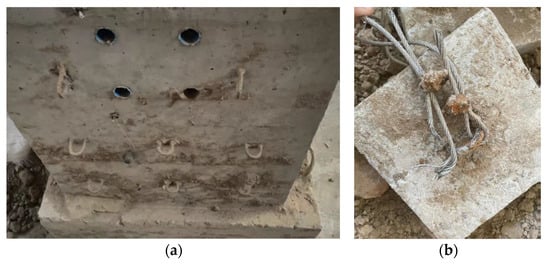
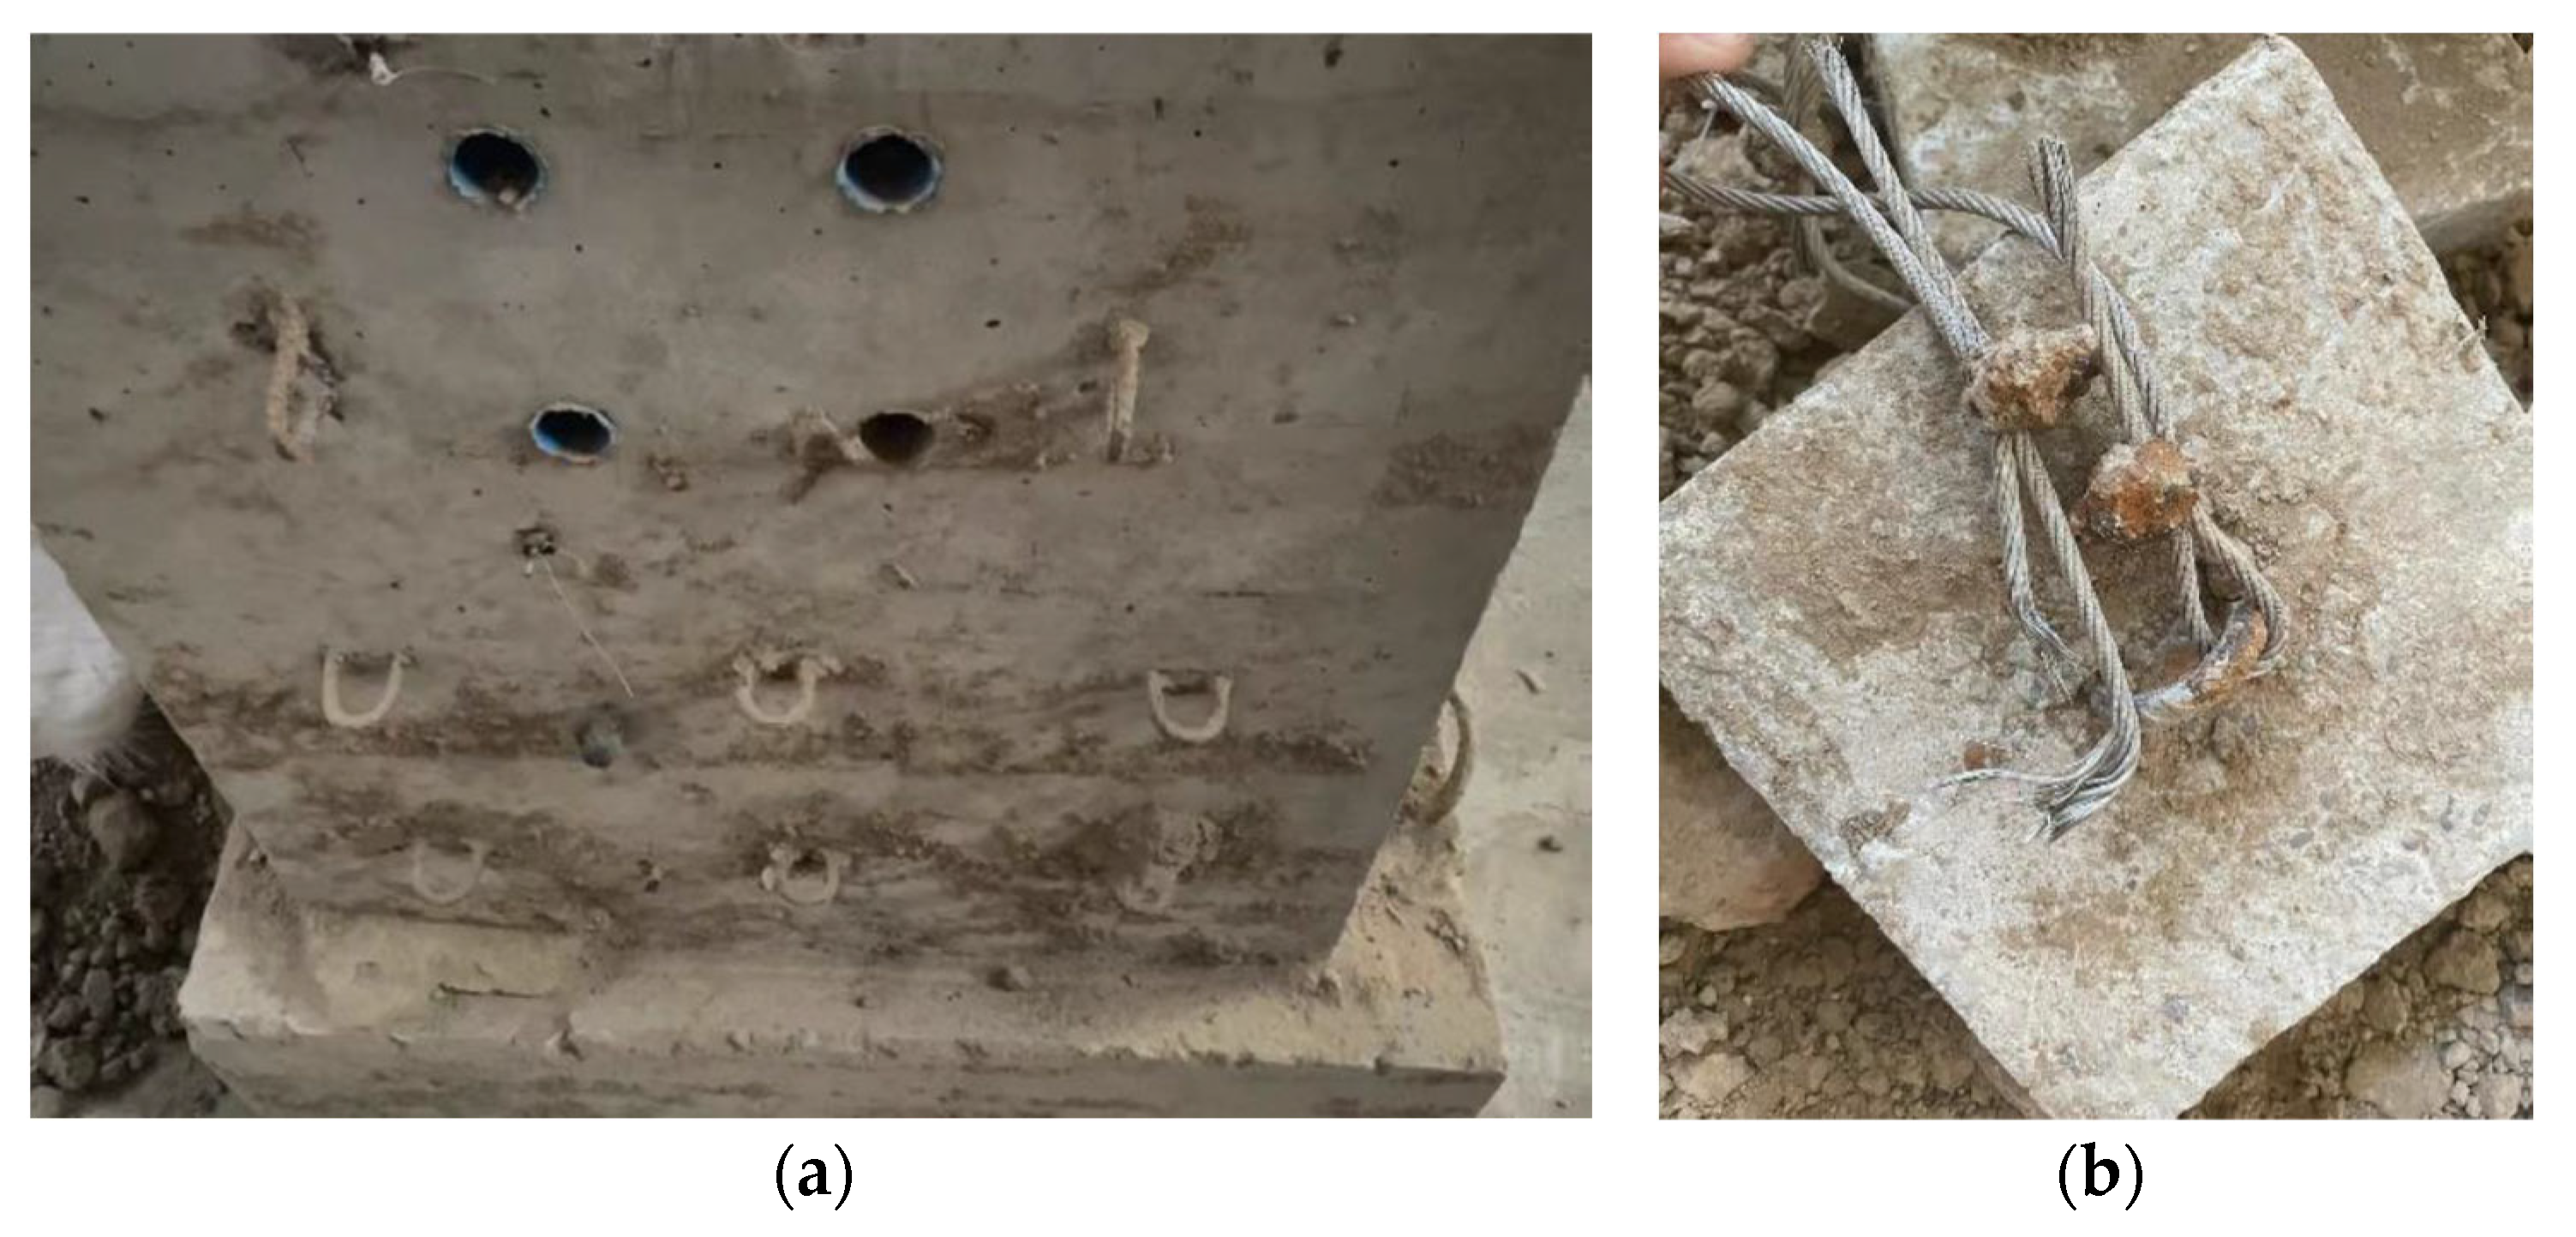
Figure 16 shows the phenomenon of specimen P-2 after excavation. As seen in Figure 16, the abutment and anchor plate of specimen P-2 are not damaged, but some of the steel bundles have been broken.
Figure 16.
Phenomenon of specimen P-2 after excavation: (a) abutment after excavation; (b) anchor plate and steel bundle after excavation.
By comparing and analyzing the failure phenomena of the two specimens, it can be observed that the participation of the anchor plates and steel bundles causes the soil within a certain area behind the abutment to bear the tensile force exerted by the steel bundles and the bearing capacity of the abutment is enhanced.
3.2. Displacement Distribution of Two Specimens
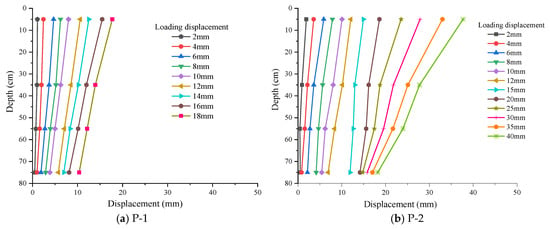
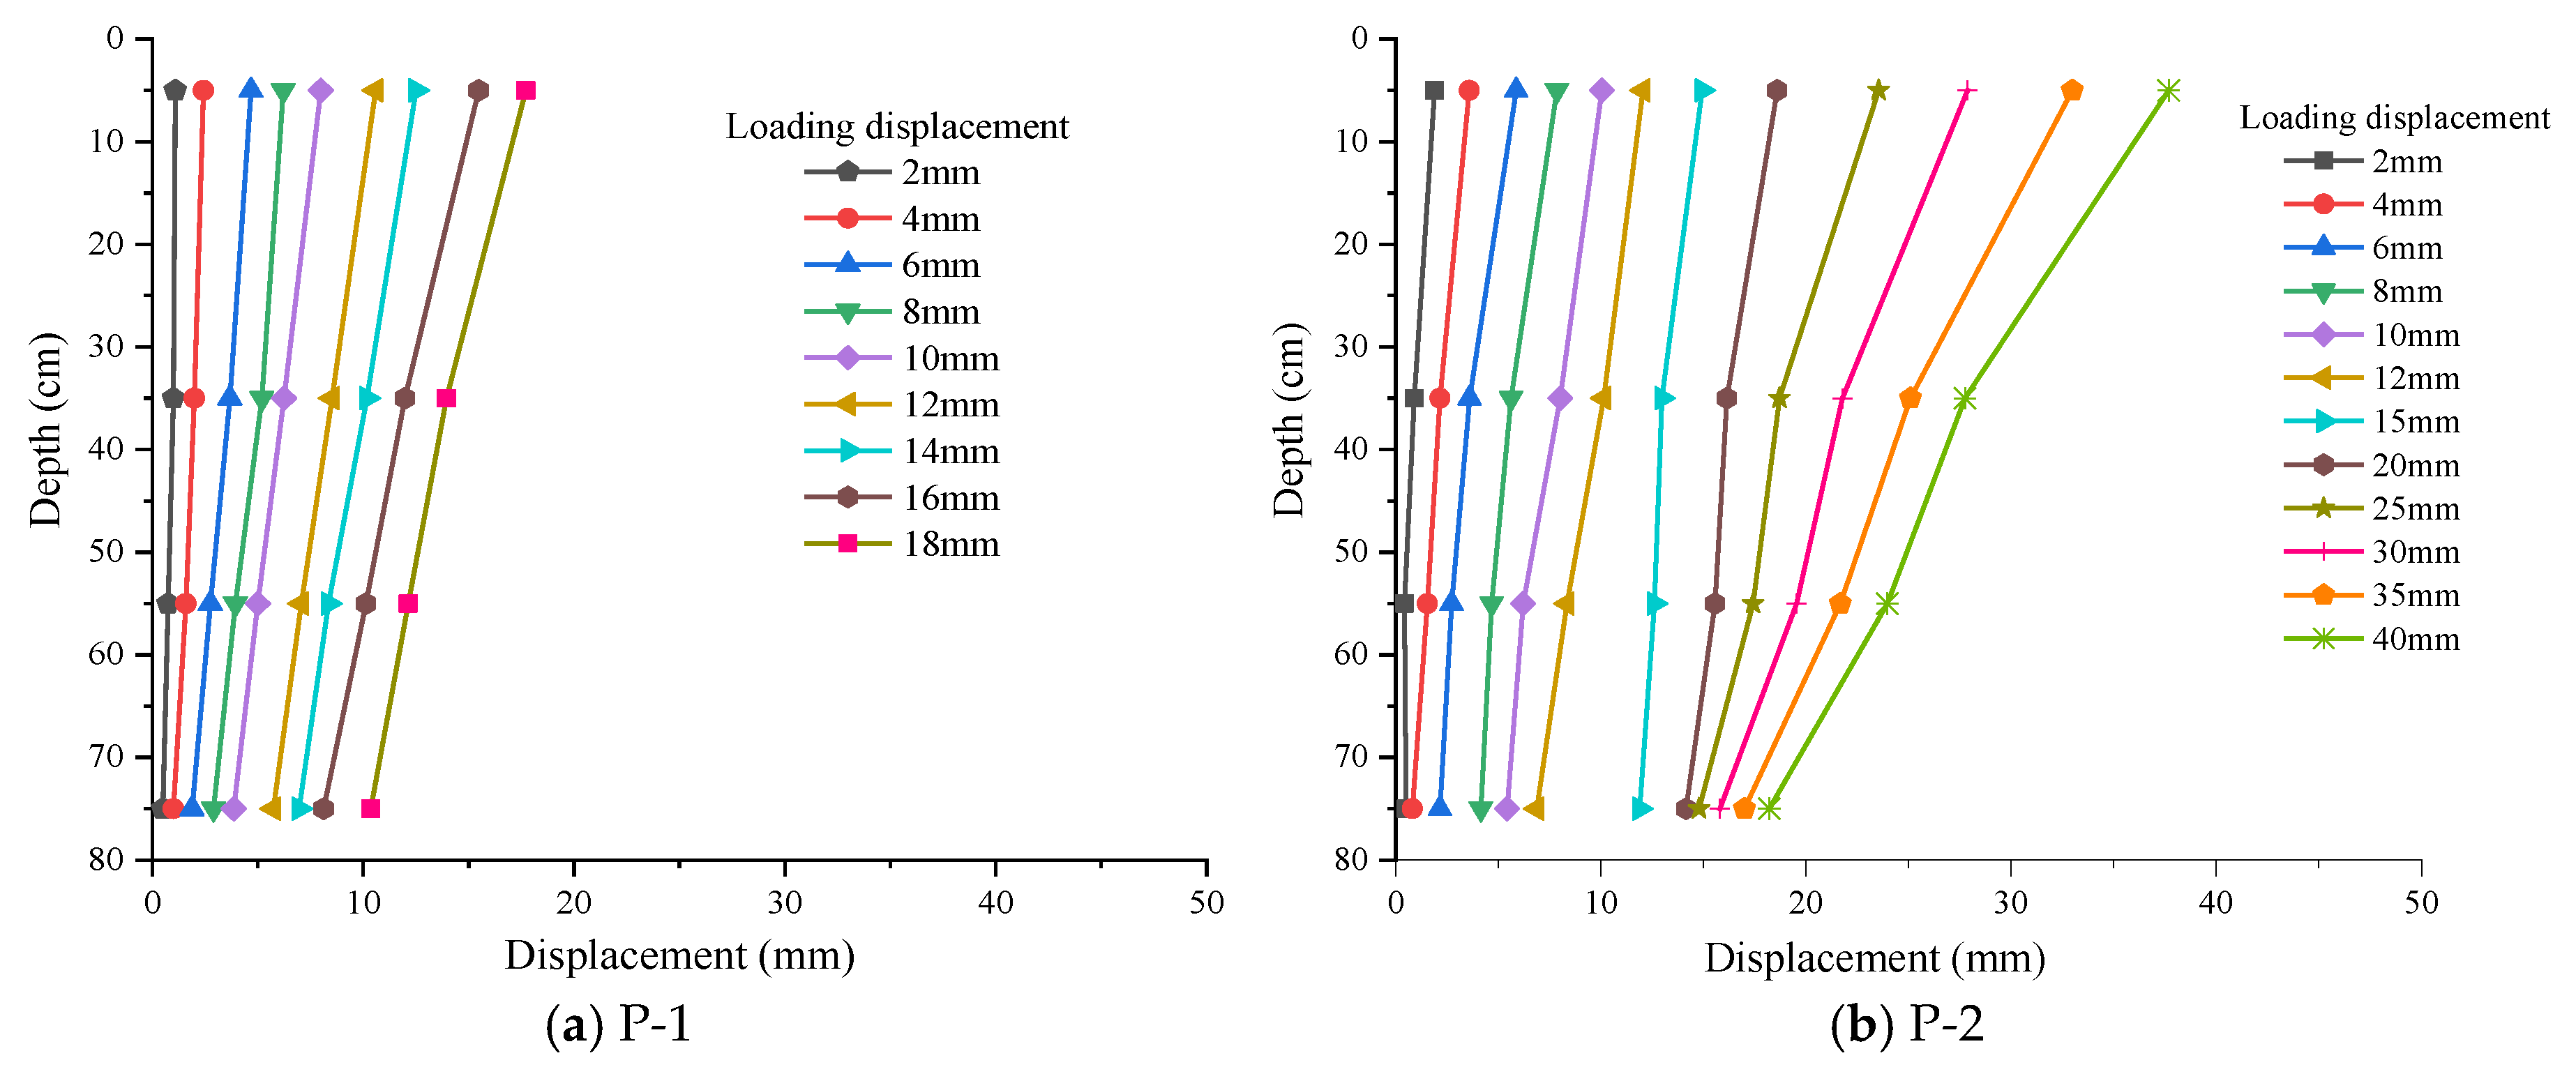
This section analyzes the displacement of the two specimens along the depth of the abutment backside. The horizontal displacement for each measuring point of the two specimens is plotted in Figure 17a,b. It can be seen from Figure 17 that the two abutments are rigid without any deformation during the displacement loading. This conclusion is consistent with the observed phenomena of specimens after excavation.
Figure 17.
Displacement distributions of two specimens under different loading displacements.
The rotation angle is an important indicator for measuring the displacement of the abutment. The rotation angles of the two specimens are calculated using Formula (4).
where θ represents the rotation angle of the abutment; represents the horizontal displacement of the displacement meter ; is the horizontal displacement of the displacement meter ; and h represents the vertical height difference between the displacement meters and .
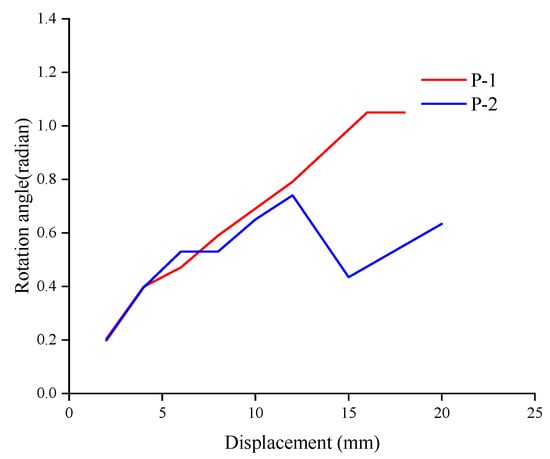
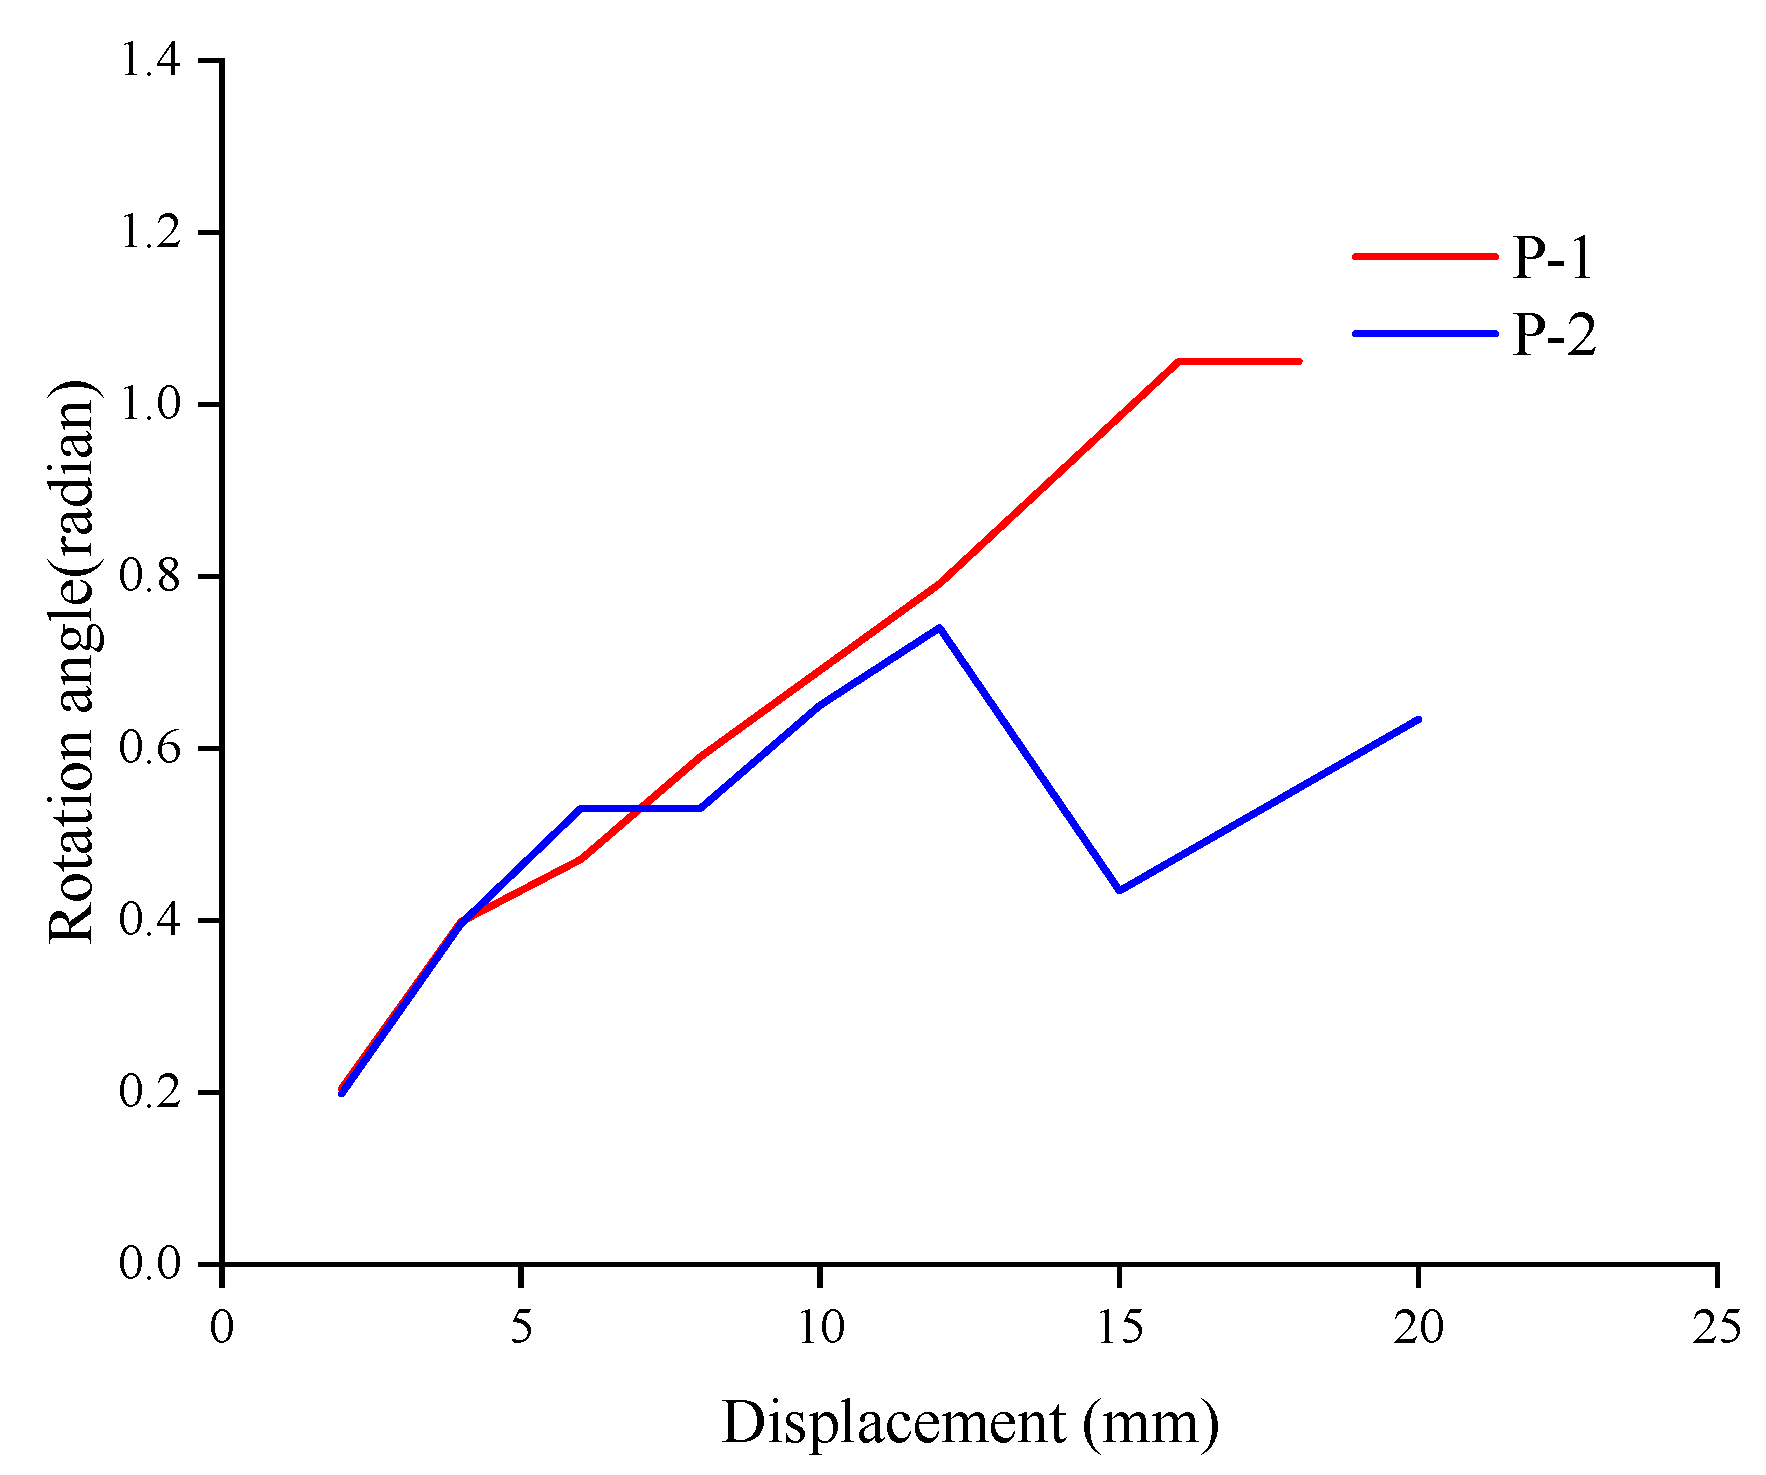
Figure 18 shows the rotation angle θ of two specimens with respect to the loading displacement. It should be noted that only the abutment rotation angles before the 20 mm loading displacement are listed for the purpose of comparison. It can be observed that before the 6 mm loading displacement, the rotation angles of the two abutments did not differ significantly, and the maximum difference was only 0.06 radian. However, the rotation angle of specimen P-2 is smaller than that of specimen P-1 after a 6 mm loading displacement. This indicates that the participation of the anchor plates and steel bundles can effectively restrict abutment rotation.
Figure 18.
Rotation angle of two specimens.
3.3. Hysteresis Curve
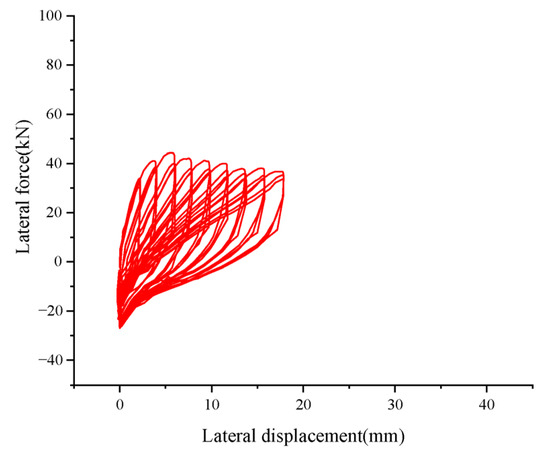
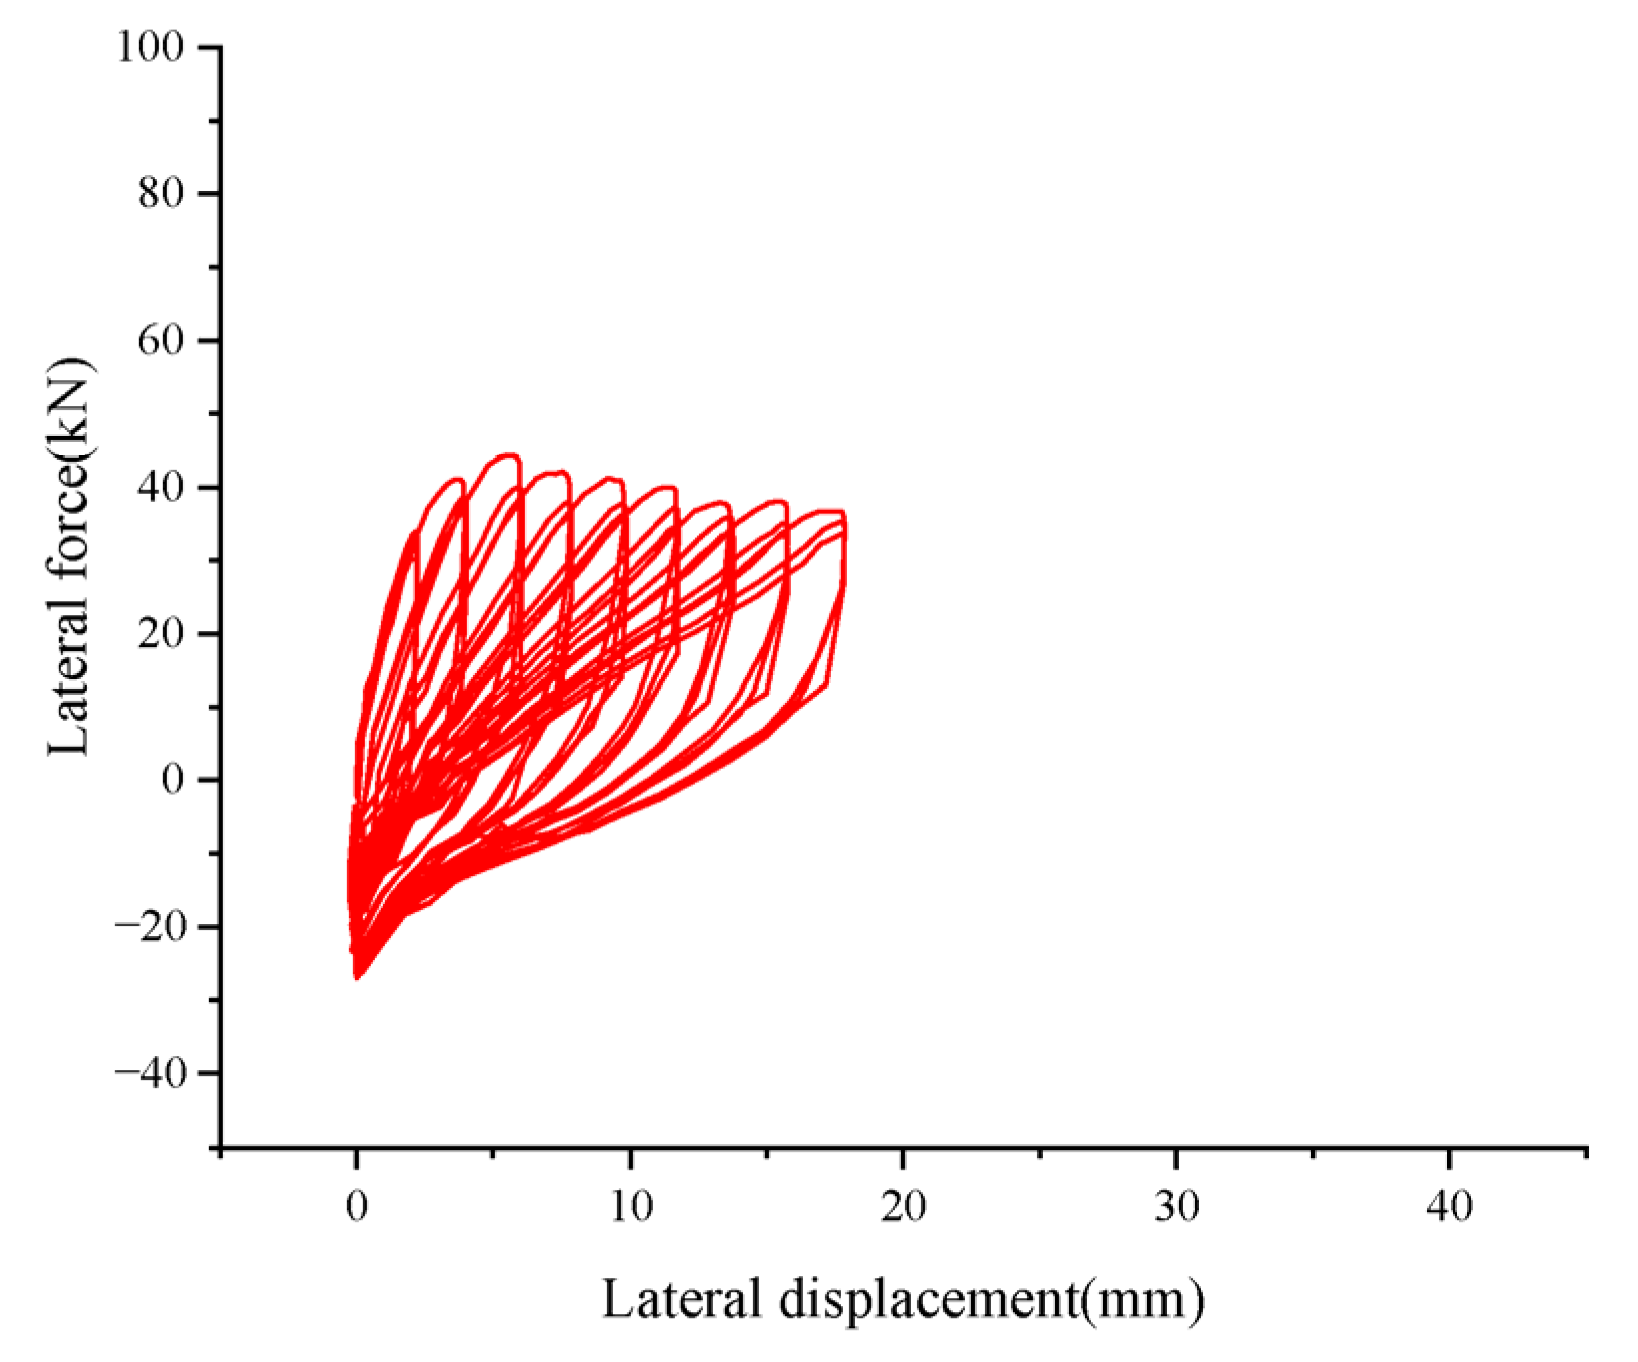
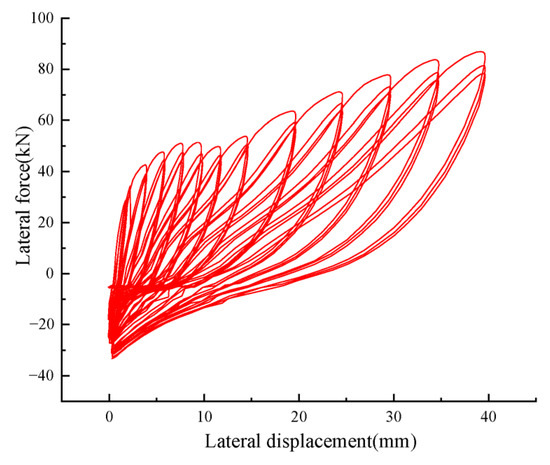
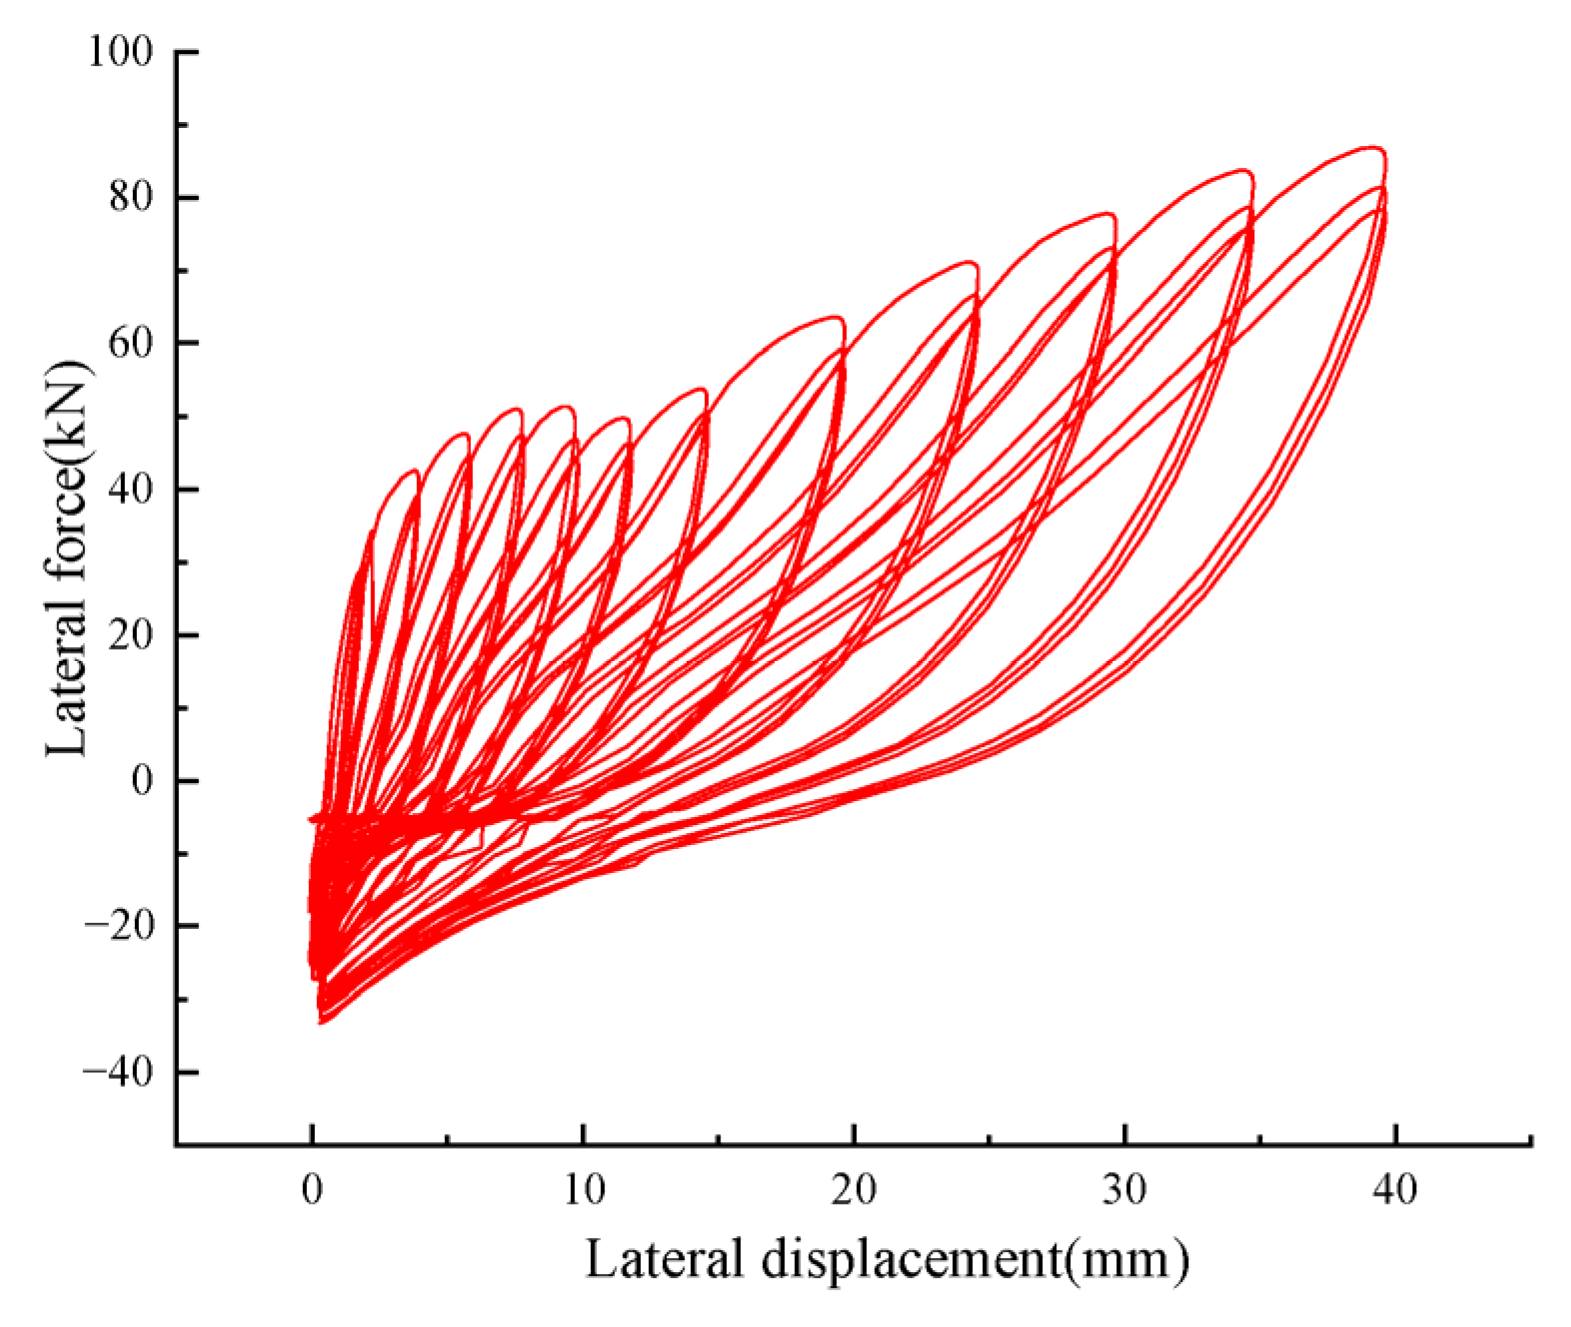
The force–displacement relationship curve of the abutment top is called the hysteresis curve, also known as the restoring force curve. It is obtained under the action of cyclic reciprocating loads and can reflect the deformation characteristics, stiffness degradation, and energy dissipation caused by the reciprocating force. Figure 19 and Figure 20, respectively, represent the hysteresis curves of specimens P-1 and P-2. It should be noted that since the function of the anchor plates is to prevent the abutment from overturning towards the front of the abutment under seismic force, the displacement load in this experiment is only applied towards the front of the abutment. It can be observed that the bearing capacities of the two specimens do not differ significantly before the 6 mm loading displacement. However, the bearing capacity of specimen P-2 significantly increased after a 6 mm loading displacement. In addition, it can be observed that a negative horizontal force appears on the hysteresis curve in the later stage of loading. This is mainly because a certain degree of collapse occurred in the backfill of the abutment during the later stage of loading.
Figure 19.
Hysteretic curves of the model P-1.
Figure 20.
Hysteretic curves of the model P-2.
By analysing the hysteresis curves of the two specimens, it can be observed that the hysteresis loops of the two models are relatively full during the initial stage of the loading and become pinched in the later stage. This indicates that the abutment–soil interaction system remains elastic at the initial loading stage and has a good energy consumption capacity. With increasing loading displacement, the systems display the obvious pinched hysteretic loops, which are attributed to the separation and uplift between abutment and soil.
In addition, comparing specimens P-1 and P-2, it can be seen that the hysteretic loop shape and peak lateral force changed with the presence or absence of steel bundles. The involvement of steel bundles significantly increases the peak lateral force of the specimen and slows the hysteresis loop pinching. This indicates that the steel bundle can not only enhance the bearing capacity of soil–abutment interaction system but also increase its energy dissipation capacity.
3.4. Skeleton Curves
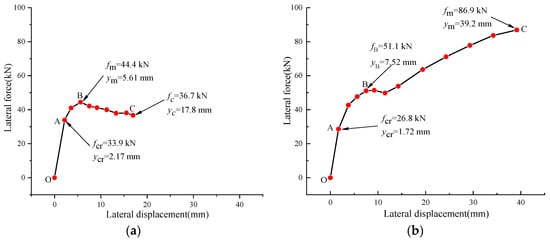
The envelope of the lateral force–displacement relationship curve for the specimen is called a skeleton curve, also known as a backbone curve. It can reflect the mechanical properties of the structure under cyclic loading. A skeleton curve can be drawn by extracting the maximum load value of the hysteresis loop under different load displacements. Figure 21 shows the load–displacement backbone curve of the specimens. It can be observed that the skeleton curve can be divided into multilinear curves. To compare the mechanical properties of the two specimens quantitatively, the key points on the skeleton curve are marked and their values are listed in Table 3. As seen in Figure 21, the skeleton curve of specimen P-1 can be divided into three stages. The first stage is the linear elastic stage (O-A) up to 2 mm, the second stage is the elastoplastic stage (A-B), which is started from 4 mm to the ultimate load-bearing capacity. The elastic stage (O-A) is characterized by a linear increase in load with displacement. During the elastoplastic stage (A-B), the stiffness of the specimens decreases gradually due to the cracking of foundation soil. In the third stage (B-C), the soil–abutment interaction system began to fail and the load-bearing capacity of the specimen descended. It is worth noting that the skeletal curve of specimen P-2 is also divided into three stages; however, its third stage (B-C) is ascending on the whole, unlike specimen P-1. This indicates that the participation of the anchor plate and the steel bundle significantly enhanced the bearing capacity of the abutment. It should be noted that the bearing capacities of the two specimens are not significantly different before the 8 mm displacement load. However, the bearing capacity of specimen P-2 is significantly greater than that of specimen P-1 after the 8 mm displacement load.
Figure 21.
Skeleton curves of the models: (a) P-1; (b) P-2.
Table 3.
The elastic critical and ultimate load values of the two specimens.
The elastic critical load , the ultimate load , the elastic critical deformation , and the maximum deformation of P-1 and P-2 are listed in Table 3. The elastic critical load is defined as the load at the end point (the point A) of the elastic stage (O-A) on the backbone curve. The ultimate load is defined as the load at the highest point on the backbone curve.
As shown in Table 3, the elastic critical load and critical deformation of specimen P-1 are 33.9 kN and 2.17 mm, respectively, while the values for specimen P-2 are 26.8 kN and 1.72 mm accordingly. The ultimate load and maximum deformation of specimen P-1 are 44.4 kN and 5.61 mm, while they are 86.9 kN and 39.2 mm for specimen P-2. It can be observed that the elastic critical load of the two models does not show significant differences, while the ultimate load of specimen P-2 is 96% greater than specimen P-1. This further indicates that the bearing capacity of the abutment is significantly increased due to the addition of anchor plates and steel bundles.
3.5. Equivalent Stiffness Calculation
The degradation of the structural stiffness is an important aspect reflecting the degradation of the seismic performance of the structure under the action of the low reciprocating load. The secant stiffness is used to analyze the stiffness degradation of the specimen under the displacement loads in this experiment. The secant stiffness of the abutment–soil interaction system can be calculated as follows:
where represents the peak point load corresponding to the maximum positive load displacement at different loading stages. represents the maximum positive displacement corresponding to the peak point load. It should be noted that since this test is conducted only under a forward direction, the secant stiffness was calculated using only and .
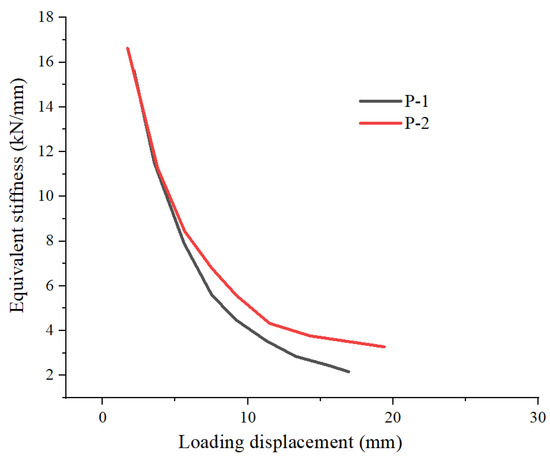
Figure 22 shows the secant stiffness of the two specimens calculated according to Formula (5). It should be noted that only the secant stiffness before the 20 mm loading displacement are listed for the purpose of comparison. As seen from Figure 22, the changing trend of the secant stiffness of the two specimens is the same during the entire loading process and decreases in a nonlinear manner with the increase in loading displacement. The degradation of stiffness is relatively serious in the initial loading stage and the degradation rate is slowed down in the later loading stage. Overall, the stiffness of specimen P-2 degrades slowly, while the stiffness of specimen P-1 degrades faster. That indicates that the participation of anchor plates and steel bundles improves the stiffness of the abutment–soil interaction system.
Figure 22.
Secant stiffness of the specimens.
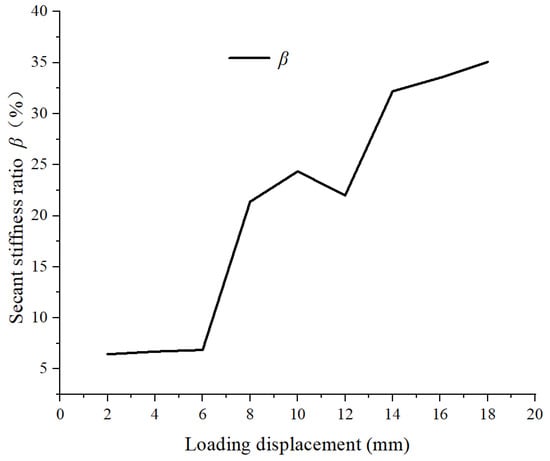
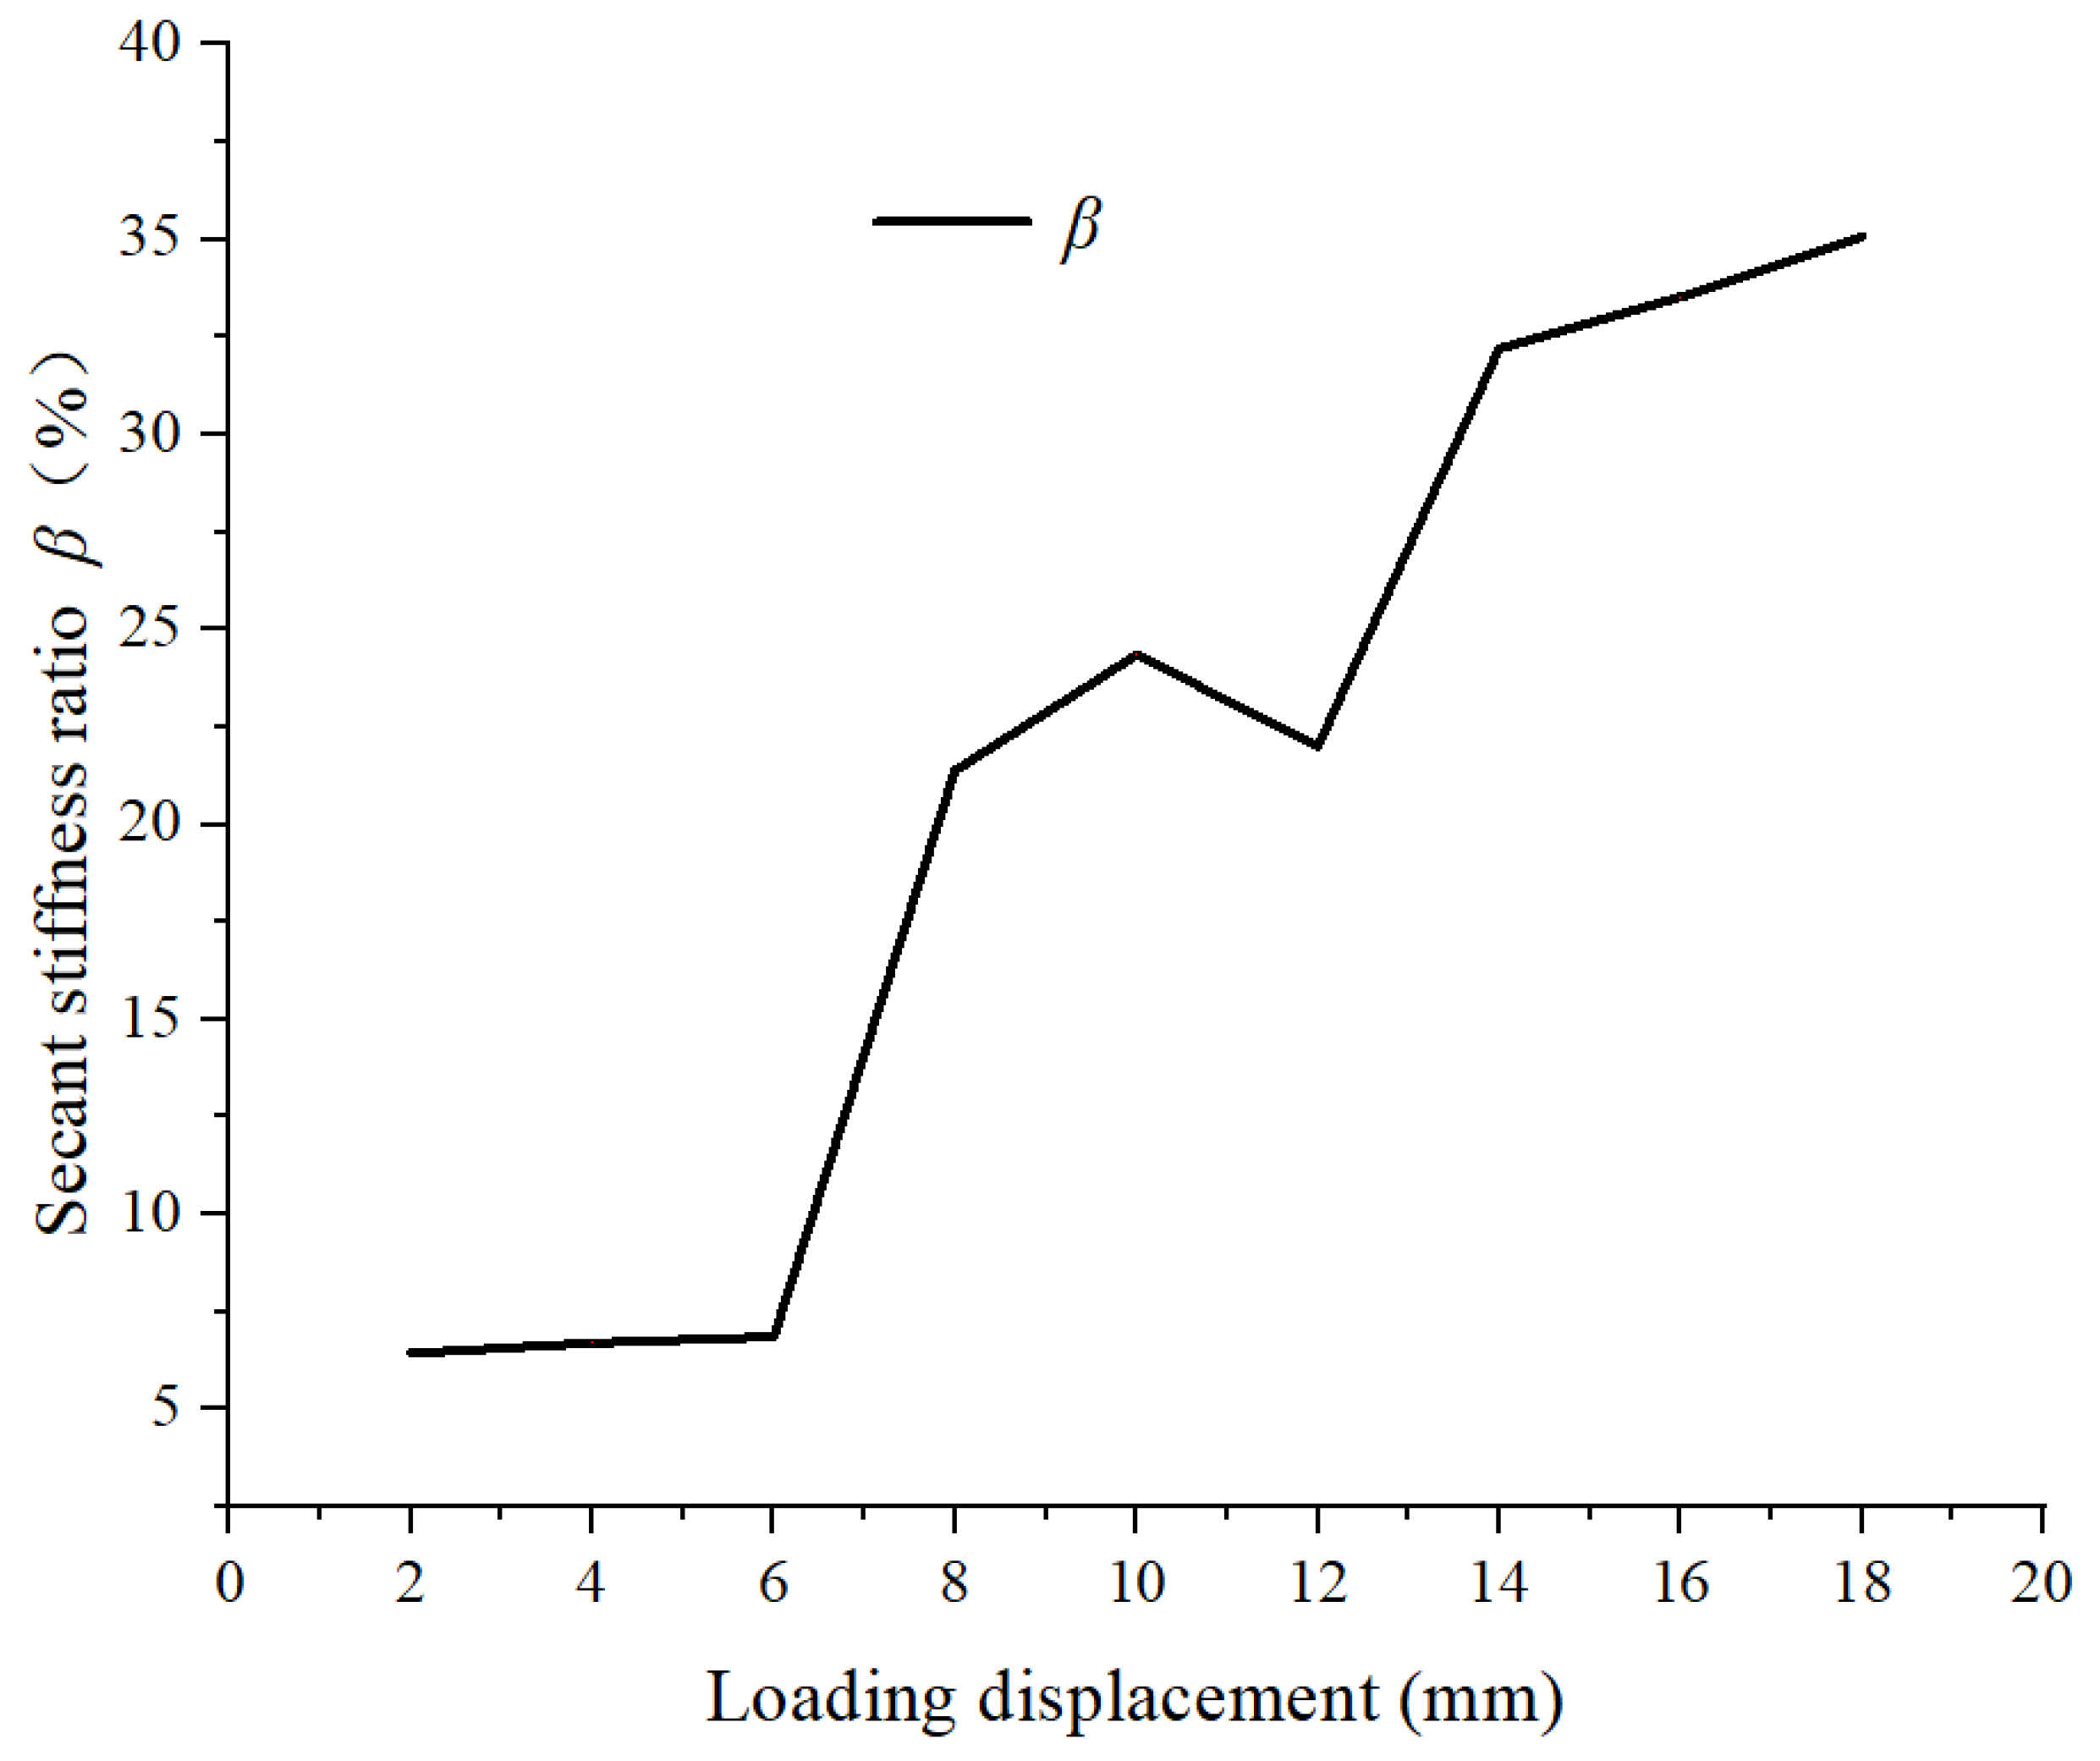
The ratio β of the secant stiffness of specimen P-2 to P-1 is calculated based on Equation (6) and plotted in Figure 23. It can quantitatively analyze the influence of anchor plates and steel bundles on the degradation of the abutment–soil interaction system stiffness.
where represents the secant stiffness of specimen P-2. represents the secant stiffness of specimen P-1.
Figure 23.
The secant stiffness ratio of the specimens.
Figure 23 indicates that the value of β shows an upward trend as the load displacement increases. It increases from an initial 6.4% to a final 35.1% before the displacement load of 18 mm and has an added average value of 20.9%. This further illustrates that the participation of anchor plates and steel bundles decreases the degradation of the abutment–soil interaction system stiffness.
3.6. Equivalent Viscous Damping Ratio
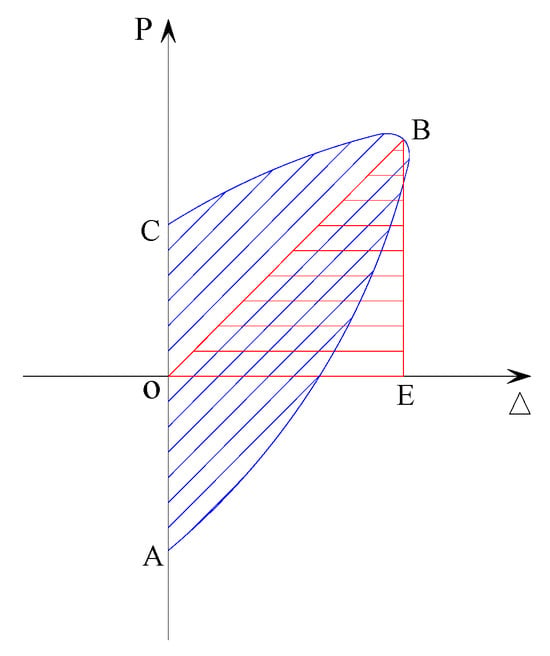
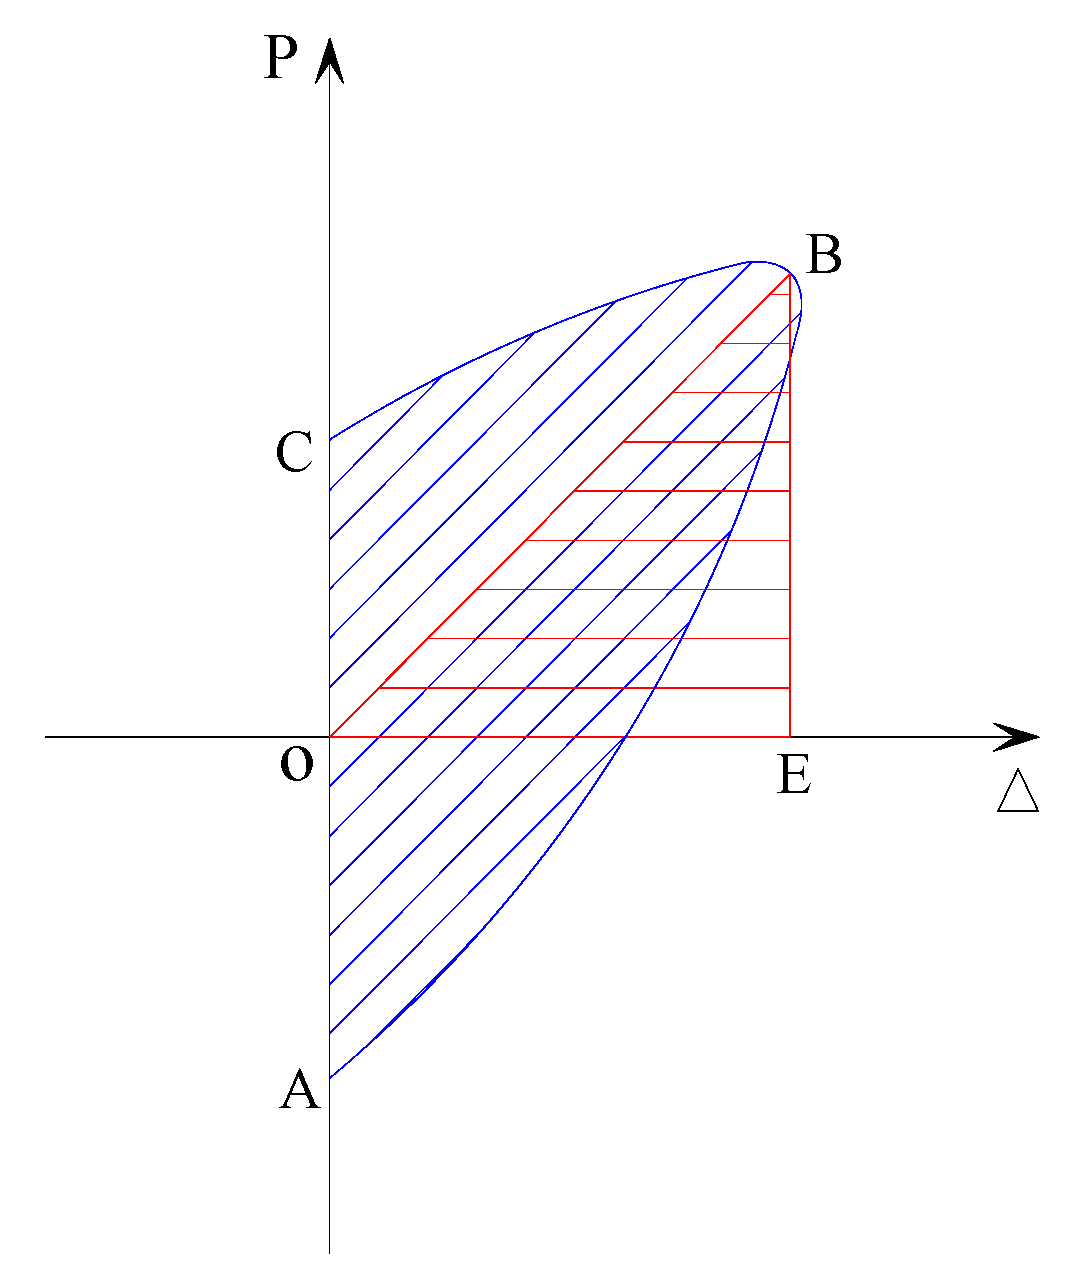
The equivalent viscous damping coefficient is one of the important indexes for evaluating the seismic performance of the abutment–soil interaction system. As seen in Figure 24, can be calculated using Equation (7) using the hysteresis loop corresponding to each level of displacement load.
where SOABC is the area of the positive hysteresis loop that represents energy dissipated in each positive cycle. SOEB is the area of the triangle OEB, which reflects the elastic strain energy measured at the peak displacement of the same cycle.
Figure 24.
Typical hysteretic loop.
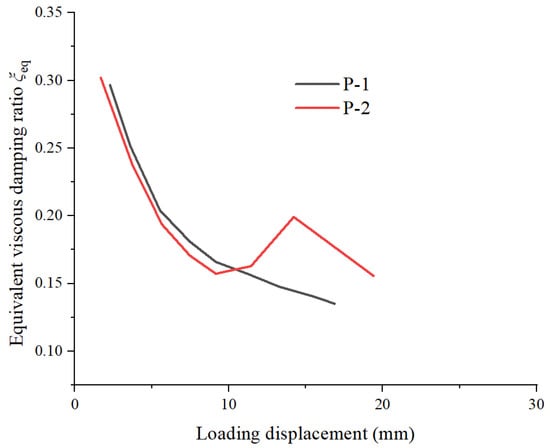
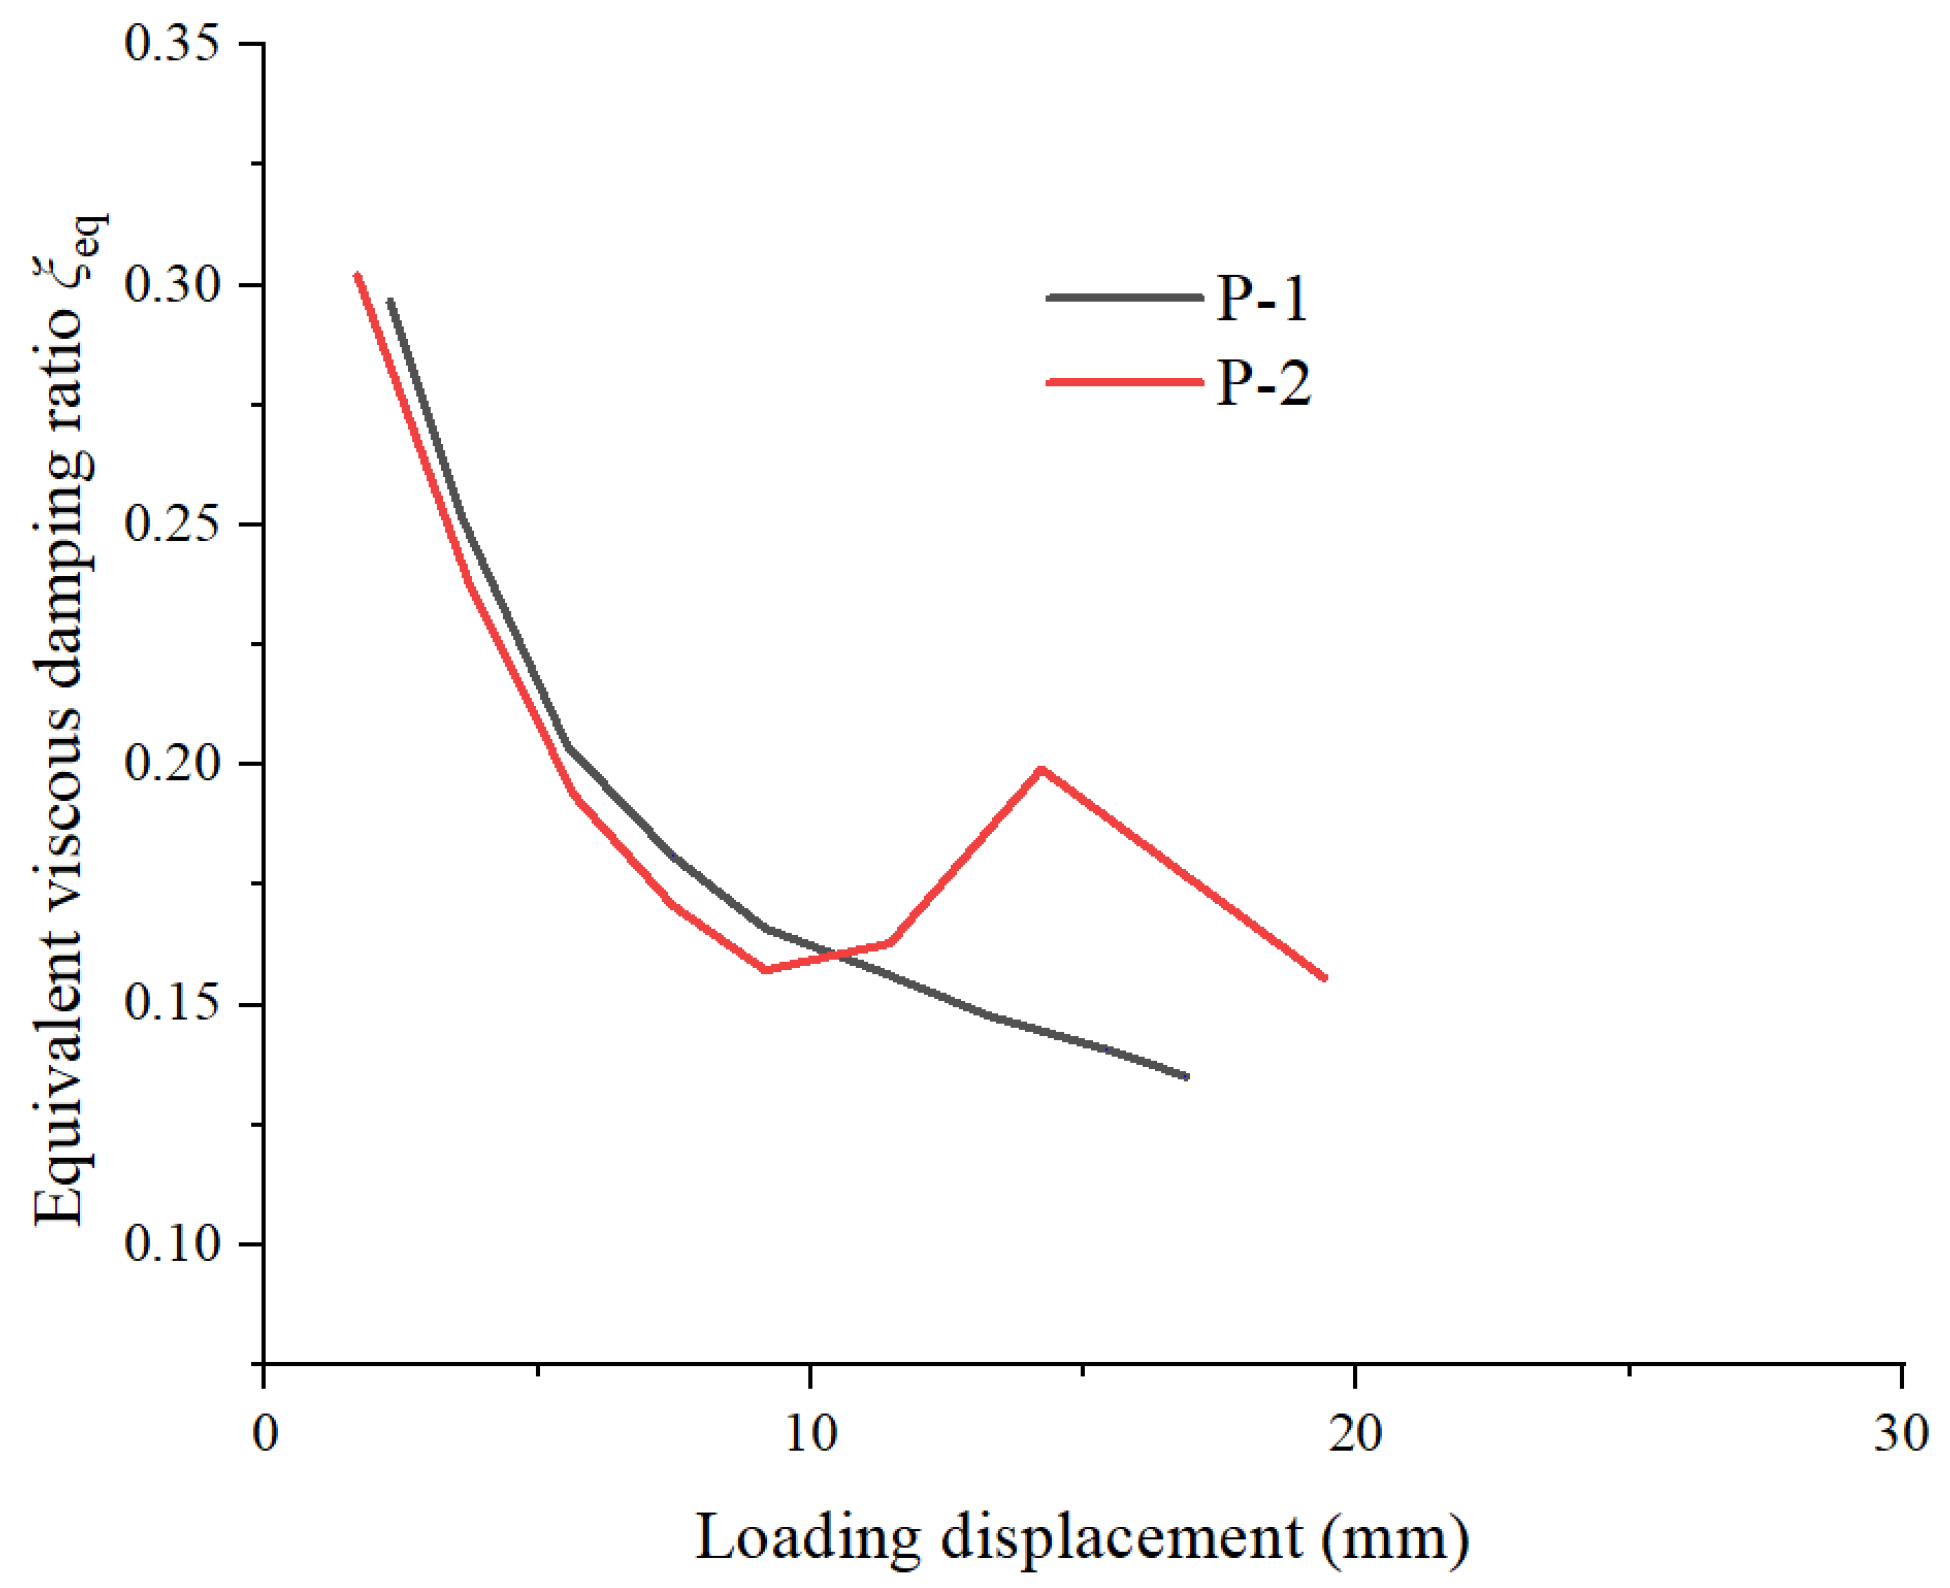
Figure 25 shows the variation curve of the equivalent viscous damping ratio for the two specimens. It should be noted that only the equivalent viscous damping ratio before the 20 mm loading displacement are listed for the purpose of comparison. The equivalent viscous damping ratio of the two specimens generally decreases with the increase in the displacement. This is because the structure of soil is destroyed with the increase in loading displacement. Overall, the value of for the two specimens is not significantly different before the 8 mm displacement load. However, the of specimen P-2 is greater than that of P-1 after the 8 mm displacement load. This is because the steel bundles do not undergo pre-tensioning and start working after an 8 mm displacement load. It can be seen that the participation of anchor plates and steel bundles can improve the energy dissipation capacity of a soil–abutment interaction system.
Figure 25.
Equivalent viscous damping ratio of the two specimens.
4. Conclusions
This paper has proposed a novel shallow foundation abutment and conducts an experimental study on the seismic performance of this type of abutment. Two 1/10 scaled specimens were designed to study the impact of an anchor plate and steel bundle on the seismic performance of shallow foundation abutments. Based on the analysis and comparison of the quasi-static test results of two specimens, the following comments are offered:
(1) Soil cracks in the soil backfill behind the abutment are observed for the two specimens. Based on the analysis, it is found that the soil within a certain range behind the abutment with the anchor plates and steel bundles has a positive effect on improving the seismic performance of the abutment. This is mainly because the participation of the anchor plates and steel bundles enables more soil behind the abutment to be involved in working, thereby enhancing the seismic resistance of the abutment.
(2) The two specimens show rigid body motion without signs of damage or failure throughout the entire loading process; however, the rotation angle of the abutment with the anchor plate and steel bundle is smaller than that of the common abutment after a 6 mm loading displacement. This indicates that the participation of the anchor plate and steel bundle can effectively restrict abutment rotation.
(3) Comparing the bearing capacity of the two abutment types, it can be seen that the abutment with the anchor plate and steel bundle has an excellent bearing capacity, and the ultimate load of the abutment can be increased by 96% due to the implantation of the anchor plate and steel bundle. This indicates that the bearing capacity of the abutment is significantly improved due to the addition of the anchor plate and steel bundle.
(4) The results show that the changing trend of the secant stiffness of the two specimens is the same during the loading process and decreases in a nonlinear manner with the increase in loading displacement. However, the secant stiffness of the abutment with the anchor plate and steel bundle before a 20 mm loading displacement is greater than that of the common abutment, and the stiffness degradation of the former is slower than that of the latter during the loading course. In addition, the ratio β of secant stiffness of specimen P-2 to P-1 shows an upward trend as the load displacement increases and increases from an initial 6.4% to a final 35.1% before the displacement load of 18 mm with an added average value of 20.9%. This further illustrates that the participation of the anchor plate and steel bundle decreases the degradation of the abutment–soil interaction system stiffness.
(5) The abutment–soil interaction system remains elastic at the initial loading stage. Attributed to the separation and uplift between abutment and soil, the systems display obvious pinched hysteretic loops and the energy consumption capacity decreases with increasing loading displacement. However, the energy dissipation capacity of the abutment with the anchor plate and steel bundle is superior to that of the common abutment after the 8 mm loading displacement. The participation of an anchor plate and steel bundle can improve the energy dissipation capacity of a soil–abutment interaction system.
Author Contributions
Methodology, Y.W., X.C. and J.L.; Formal analysis, X.Z.; Investigation, H.M., Y.W., J.L. and M.D.; Resources, Y.W.; Data curation, M.D. and C.D.; Writing—original draft, H.M., Q.L. and C.D.; Writing—review and editing, Y.W., X.Z. and X.C.; Funding acquisition, Y.W. All authors have read and agreed to the published version of the manuscript.
Funding
This research is supported by the National Natural Science Foundation of China (Grant Nos. 52178142 and 52578585), the Science and Technology Program of Gansu Province—Natural Science Foundation (Nos. 24JRRG024 and 23JRRA1807), the Doctoral Research Initiation Grant Program of He Xi University (No. KYQD2023017), and the University Teacher Innovation Fund Project of Gansu Province (No. 2026A-178).
Data Availability Statement
The original contributions presented in this study are included in the article. Further inquiries can be directed to the corresponding author.
Acknowledgments
The China University Students’ Innovation and Entrepreneurship Training Program Project (Nos. 202410740021 and S202210740052).
Conflicts of Interest
The authors declare no conflicts of interest.
References
- Liu, H.X. The Damage Caused by the Tangshan Earthquake; Seismological Press: Beijing, China, 1986. [Google Scholar]
- Li, J.Z.; Peng, T.B.; Xu, Y. Damage investigation of girder bridges under the Wenchuan earthquake and corresponding seismic design recommendations. Earthq. Eng. Eng. Vib. 2008, 7, 337–344. [Google Scholar] [CrossRef] [Scilit]
- Han, Q.; Du, X.; Liu, J.; Li, Z.; Li, L.; Zhao, J. Seismic damage of highway bridges during the 2008 Wenchuan earthquake. Earthq. Eng. Eng. Vib. 2009, 8, 263–273. [Google Scholar] [CrossRef] [Scilit]
- Frank, S.; Galo, V.; Jorge, A. Seismic damage to bridges during the 27 February 2010 Magnitude 8.8 Chile earthquake. Earthq. Spectra 2012, 28, 301–315. [Google Scholar] [CrossRef] [Scilit]
- Wilson, J.C.; Tan, B.S. Bridge abutment: Formulation of simple model for earthquake response analysis. J. Eng. Machanics 1990, 116, 1828–1837. [Google Scholar] [CrossRef] [Scilit]
- Mitoulis, S.A. Seismic design of bridges with the participation of seat-type abutments. Eng. Struct. 2012, 44, 222–233. [Google Scholar] [CrossRef] [Scilit]
- Aviram, A.; Mackie, K.R.; Stojadinovic, B. Effect of abutment modeling on the seismic response of bridge structures. Earthq. Eng. Eng. Vib. 2008, 7, 395–402. [Google Scholar] [CrossRef] [Scilit]
- Cheng, Z.M.; Wei, H.W. Analysis of abutment-embankment-foundation interaction system subjected to seismic load. J. Railw. Sci. Eng. 2020, 17, 2225–2234. [Google Scholar]
- Su, Q.; Zhong, B.; Bai, H.; Zhang, W.C.; Huang, J.J. Coupling calculation of seismic displacement of bridge abutment based on failure mechanism of slope. China Civ. Eng. J. 2010, 43, 567–572. [Google Scholar]
- Li, B.; Bi, K.; Chouw, N.; Butterworth, J.W.; Hao, H. Effect of abutment excitation on bridge pounding. Eng. Struct. 2013, 54, 57–68. [Google Scholar] [CrossRef] [Scilit]
- Li, X.L.; Sun, Z.G.; Wang, D.S.; Shi, Y. Effect of abutment excitation on bridge pounding. J. Chang. Univ. 2015, 35, 76–82. [Google Scholar] [CrossRef] [Scilit]
- Deng, Y.L.; Lei, F.; He, X.J. Research on pounding effects at the expansion joints of long-span bridge under earthquakes with interaction between of soil, abutments and superstructure considered. China J. Highw. Transp. 2015, 28, 44–51. [Google Scholar]
- Maragakis, E.A.; Jennings, P.C. Analytical models for the rigid body motions of skew bridges. Earthq. Eng. Struct. Dynam. 1987, 15, 923–944. [Google Scholar]
- Won, J.H.; Mha, H.S.; Cho, K.I.; Kim, S.H. Effects of the restrainer upon bridge motions under seismic excitations. Eng. Struct. 2008, 30, 3532–3544. [Google Scholar] [CrossRef] [Scilit]
- Dimitrakopoulos, E.G. Seismic response analysis of skew bridges with pounding deck–abutment joints. Eng. Struct. 2011, 33, 813–826. [Google Scholar] [CrossRef] [Scilit]
- Wu, X.G.; Wei, J.J.; Hu, K.J.; Zhang, W.T. Seismic response analysis of abutment-approach bridge-rigid frame continuous girder bridge system considering collision effect. Eng. J. Wuhan Univ. 2023, 56, 429–439. [Google Scholar]
- Wei, J.J.; Wu, X.G.; Lu, W.; Yan, W.D.; Hu, K.J. Study on damping measures of abutment-approach bridge-rigid frame continuous girder bridge structural system considering collision effect near fault area. J. Cent. South Univ. 2023, 54, 238–248. [Google Scholar]
- Jiao, C.Y.; Lu, Z.M.; Long, P.H.; Shi, X.P.; Hou, S.W. Study on seismic behavior of curved bridge considering soil-abutment-superstructure interaction. J. Vib. Shock 2018, 37, 99–106. [Google Scholar]
- Xu, L.Q.; Wei, X.L. Analysis of the pounding effects countermeasures at the abutment of a rigid-frame bridge with high, double thin-walled piers during earthquakes. China Earthq. Eng. J. 2017, 39, 425–433. [Google Scholar]
- Moayyedi, S.A.; Rezaei, H.; Kalantari, A.; Jankowski, R. Effects of deck-abutment pounding on the seismic fragility curves of box-girder highway bridges. J. Earthq. Eng. 2024, 28, 2188–2217. [Google Scholar]
- Li, W.S.; Liu, Z.; Freddi, F. Non-smooth dynamic analysis of curved bridges considering the earthquake-induced end-pounding. Eng. Struct. 2023, 289, 116320. [Google Scholar]
- Mujtaba, A.; Yukihide k Nawawi, C. Numerical simulation of impact effect for damage assessment of highway bridge abutments. J. Earthq. Eng. 2025, 26, 30–45. [Google Scholar]
- He, D.X. Theory and method of seismic design of bridge abutment. World Earthq. Eng. 1991, 50, 1–15. [Google Scholar]
- Zhu, P.; Abe, M.; Fujino, Y. Modelling three-dimensional non-linear seismic performance of elevated bridges with emphasis on pounding of girders. Earthq. Eng. Struct. Dynam. 2002, 31, 1891–1913. [Google Scholar] [CrossRef] [Scilit]
- Yang, Y.; Tanimoto, S.; Kiriyama, T. Experimental study of the seismic behavior of an existing bridge abutment located on soft clay deposits. J. Soils Struct. 2020, 17, e269. [Google Scholar] [CrossRef] [Scilit]
- Sonin, A.A. A generalization of the Π-theorem and dimensional analysis. Proc. Natl. Acad. Sci. USA 2004, 101, 8525–8526. [Google Scholar] [CrossRef] [Scilit] [PubMed]
- GB/T 50081; Standard for Test Methods of Concrete Physical and Mechanical Properties. Ministry of Housing and Urban-Rural Development of the People’s Republic of China: Beijing, China, 2019.
- GB/T 228.1; Metallic Materials-Tensile Testing—Part 1: Method of Test at Room Temperature. General Administration of Quality Supervision, Inspection and Quarantine of the People’s Republic of China: Beijing, China, 2022.
- GB/T 50123; Standard for Geotechnical Testing Method. Ministry of Housing and Urban-Rural Development of the People’s Republic of China: Beijing, China, 2019.
- TB 10077; Code for Rock and Soil Classification of Railway Engineering. National Railway Administration of the People’s Republic of China: Beijing, China, 2019.
- GB/T 8358-2023; Steel Wire Ropes-Determination of Breaking Force. State Administration for Market Regulation: Beijing, China, 2023.

Disclaimer/Publisher’s Note: The statements, opinions and data contained in all publications are solely those of the individual author(s) and contributor(s) and not of MDPI and/or the editor(s). MDPI and/or the editor(s) disclaim responsibility for any injury to people or property resulting from any ideas, methods, instructions or products referred to in the content. |
© 2026 by the authors. Licensee MDPI, Basel, Switzerland. This article is an open access article distributed under the terms and conditions of the Creative Commons Attribution (CC BY) license.