


Abstract
As marine engineering advances, the deformation and load-bearing performance of uplift piles in calcareous sand under sustained loading have become increasingly important to the long-term performance of marine foundations. Static uplift tests and sustained-load model tests were conducted in calcareous sand to examine the effects of pile surface roughness and sand gradation. The time-dependent evolution of pile-head displacement, uplift deformation stiffness, pile axial force, and shaft resistance was investigated, and the displacement–time responses were fitted using the Burgers model. The results showed that pile-head creep displacement under sustained uplift loading developed through two stages: primary creep and steady-state creep. Greater pile surface roughness and well-graded calcareous sand effectively limited long-term displacement. Under the maximum sustained loads, uplift deformation stiffness decreased by 27.4–43.0% over 21 d. At the maximum sustained-load level, pile axial force decreased progressively with increasing embedment depth. The time-dependent redistribution of axial force occurred mainly in the upper and middle portions of the pile and gradually stabilized after 3–7 d, with the redistribution becoming more pronounced as pile surface roughness increased. At the same load level, shaft resistance in the peak zone increased with the duration of sustained loading and gradually stabilized. This increase was more pronounced for piles with rougher surfaces, whereas well-graded calcareous sand facilitated the stable mobilization of shaft resistance. The Burgers model accurately captured the creep behavior of the model piles, with coefficients of determination (R2) exceeding 0.967 in all test cases.
1. Introduction
Since the beginning of the 21st century, the continued development of marine resources, island and reef construction, and nearshore infrastructure has increased attention to the time-dependent bearing behavior and long-term safety of pile foundations in reclaimed ground composed of calcareous sand. Calcareous sand, the principal fill material used in coral reef reclamation projects, consists predominantly of biogenic fragments derived from corals, shells, and other marine organisms and is characterized by irregular particle shapes, high intraparticle porosity, and high crushability [1,2,3]. Compared with terrigenous quartz sand, calcareous sand particles exhibit lower strength and greater susceptibility to breakage, resulting in more complex stress-transfer behavior at the pile–soil interface. Consequently, conventional empirical methods for designing piles in siliceous sand cannot be directly applied to calcareous sand [4,5].
In recent years, extensive experimental research has been conducted on the bearing behavior of pile foundations in calcareous sand. Based on direct shear tests on calcareous sand–steel plate interfaces, Kou et al. [6] demonstrated that both steel surface roughness and calcareous sand particle size significantly affected the interfacial shear behavior. Feng et al. [7] investigated the effects of surface roughness and temperature on the shear behavior of calcareous sand–steel interfaces. Wang et al. [8] reported that vertical cyclic loading induced cumulative settlement and load redistribution in calcareous sand, with decreasing shaft resistance and increasing base resistance. Wan et al. [9,10] investigated the bearing behavior of shaft post-grouted piles through model tests under axial compression and lateral loading. They found that shaft post-grouting improved the pile–sand interface conditions and enhanced both the axial and lateral bearing performance of the piles. Wei et al. [11] conducted oblique uplift tests on model piles in calcareous sand and investigated the effects of load inclination and relative density on pile-head deformation, internal forces within the pile, and ultimate uplift capacity. Peng et al. [12] showed that particle interlocking enhanced uplift capacity, whereas corner breakage contributed to abrupt failure in calcareous sand. Wang et al. [13] and Chen et al. [14] found that increasing sand density enhanced the uplift capacity of piles in calcareous sand. Fang et al. [15] investigated the effects of moisture conditions on the uplift behavior of root piles in coral sand. Ouyang et al. [16] identified relative density, embedment depth, and installation method as important factors affecting the vertical bearing behavior of piles in calcareous sand. Collectively, these studies have improved the understanding of the load-bearing mechanisms of piles in calcareous sand. However, most have focused on bearing capacity, deformation, and load-transfer behavior under short-term static loading, whereas the time-dependent bearing behavior of pile foundations in calcareous sand remains insufficiently understood.
The bearing behavior of pile foundations is strongly time-dependent; however, previous studies have focused primarily on piles installed in clay, silt, and conventional sand. Using an effective-stress framework, Li et al. [17] developed a method for predicting the time-dependent capacity of jacked piles in clay that accounts for the installation-induced stress history of the surrounding soil, dissipation of excess pore water pressure, and thixotropic effects at the pile–soil interface. Cui et al. [18] developed a model to predict the long-term load–settlement response and time-dependent capacity of driven piles that accounts for the viscoplasticity and aging of the surrounding clay, as well as softening at the pile–soil interface. Zhou et al. [19] developed a method for predicting the time-dependent bearing capacity of jacked piles that accounts for installation-induced disturbance, thixotropic recovery, and reconsolidation of the surrounding structured clay. Based on uplift tests on model piles following different setup periods, Yang et al. [20] found that thixotropic recovery of the structured clay in the Zhanjiang Formation contributed to increases in shaft resistance and uplift capacity. Jiu et al. [21] reported that soil stress history and pile surface roughness significantly influenced the time-dependent bearing behavior of jacked piles in saturated silt. Multi-site field uplift tests conducted by Carroll et al. [22] showed that pile material, surface roughness, corrosion, and sand properties jointly governed the aging-induced capacity gain of driven piles. Through large-scale model tests, Manthey et al. [23] found that the axial capacity of open-ended steel pipe piles in sand increased markedly with the time elapsed after installation and identified the influence of sand density on pile aging. Although these studies have examined the time-dependent bearing behavior of piles in conventional clay, silt, and sand, corresponding research on uplift piles in calcareous sand remains limited.
To address this research gap, laboratory model tests were conducted to investigate the static uplift behavior of single model piles in calcareous sand and their time-dependent response under different sustained load levels. The effects of pile surface roughness and sand gradation on the evolution of pile-head displacement, uplift deformation stiffness, pile axial force, and shaft resistance were analyzed. The Burgers model was then used to fit the displacement–time curves. The findings may inform the design and construction of pile foundations in calcareous sand.
2. Laboratory Model Tests
2.1. Calcareous Sand
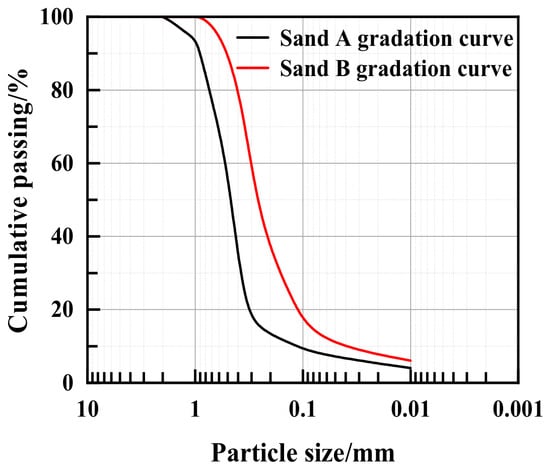
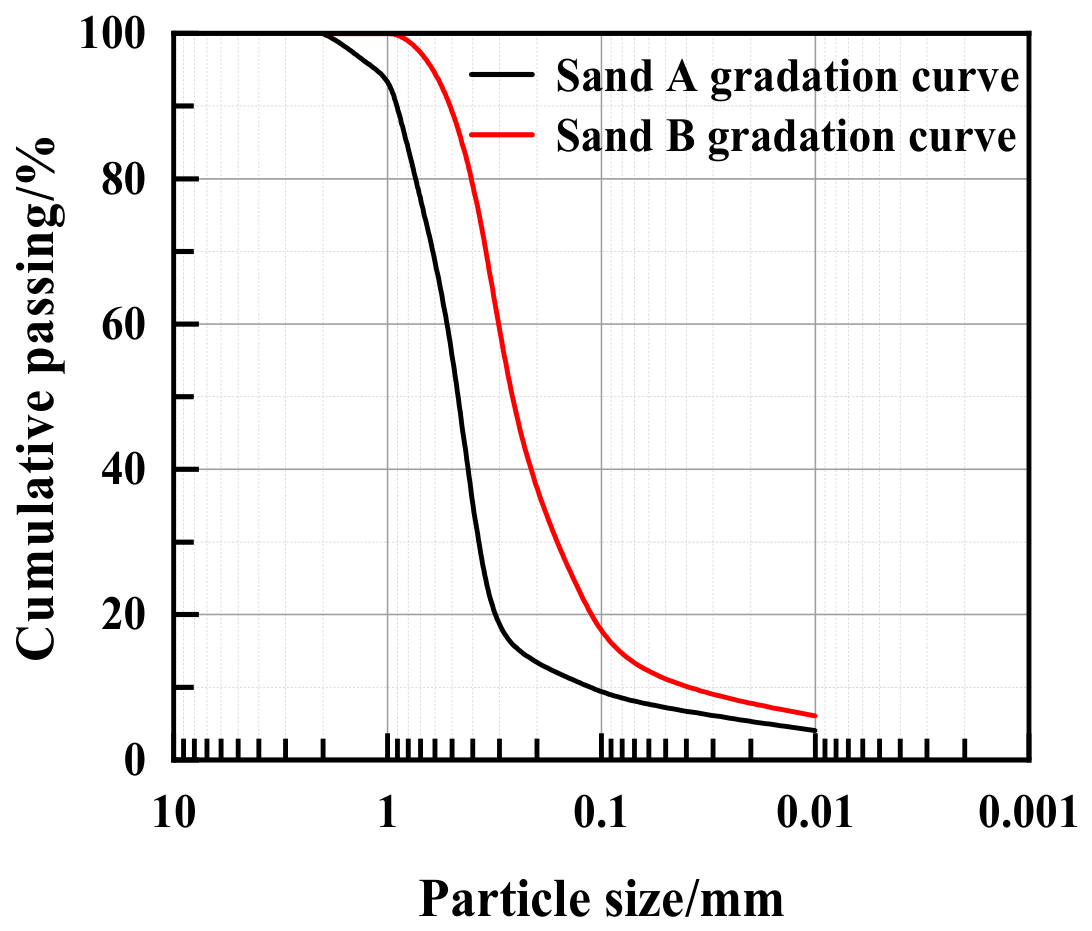
The foundation material used in the tests was collected from a coral reef and comprised a loose, uncemented deposit of coral detritus. Two calcareous sands with different particle-size distributions were used as foundation materials and designated Sand A and Sand B. Coarse particles larger than 2 mm were removed by standard sieving. The basic physical properties of the two sands were then determined and are presented in Figure 1 and Table 1. Sand A was classified as poorly graded medium sand, whereas Sand B was classified as well-graded medium sand.
Figure 1.
Particle-size distribution curves of the calcareous sands used in this study.
Table 1.
Physical properties of the calcareous sands used in this study.
2.2. Model Pile and Test Chamber
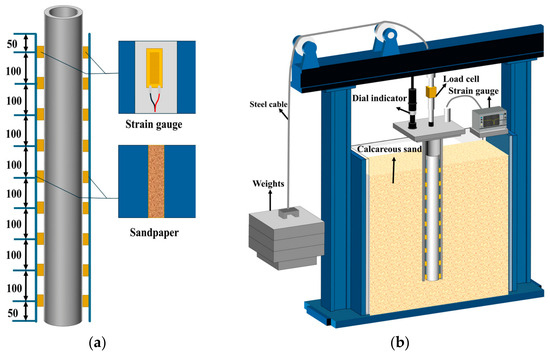
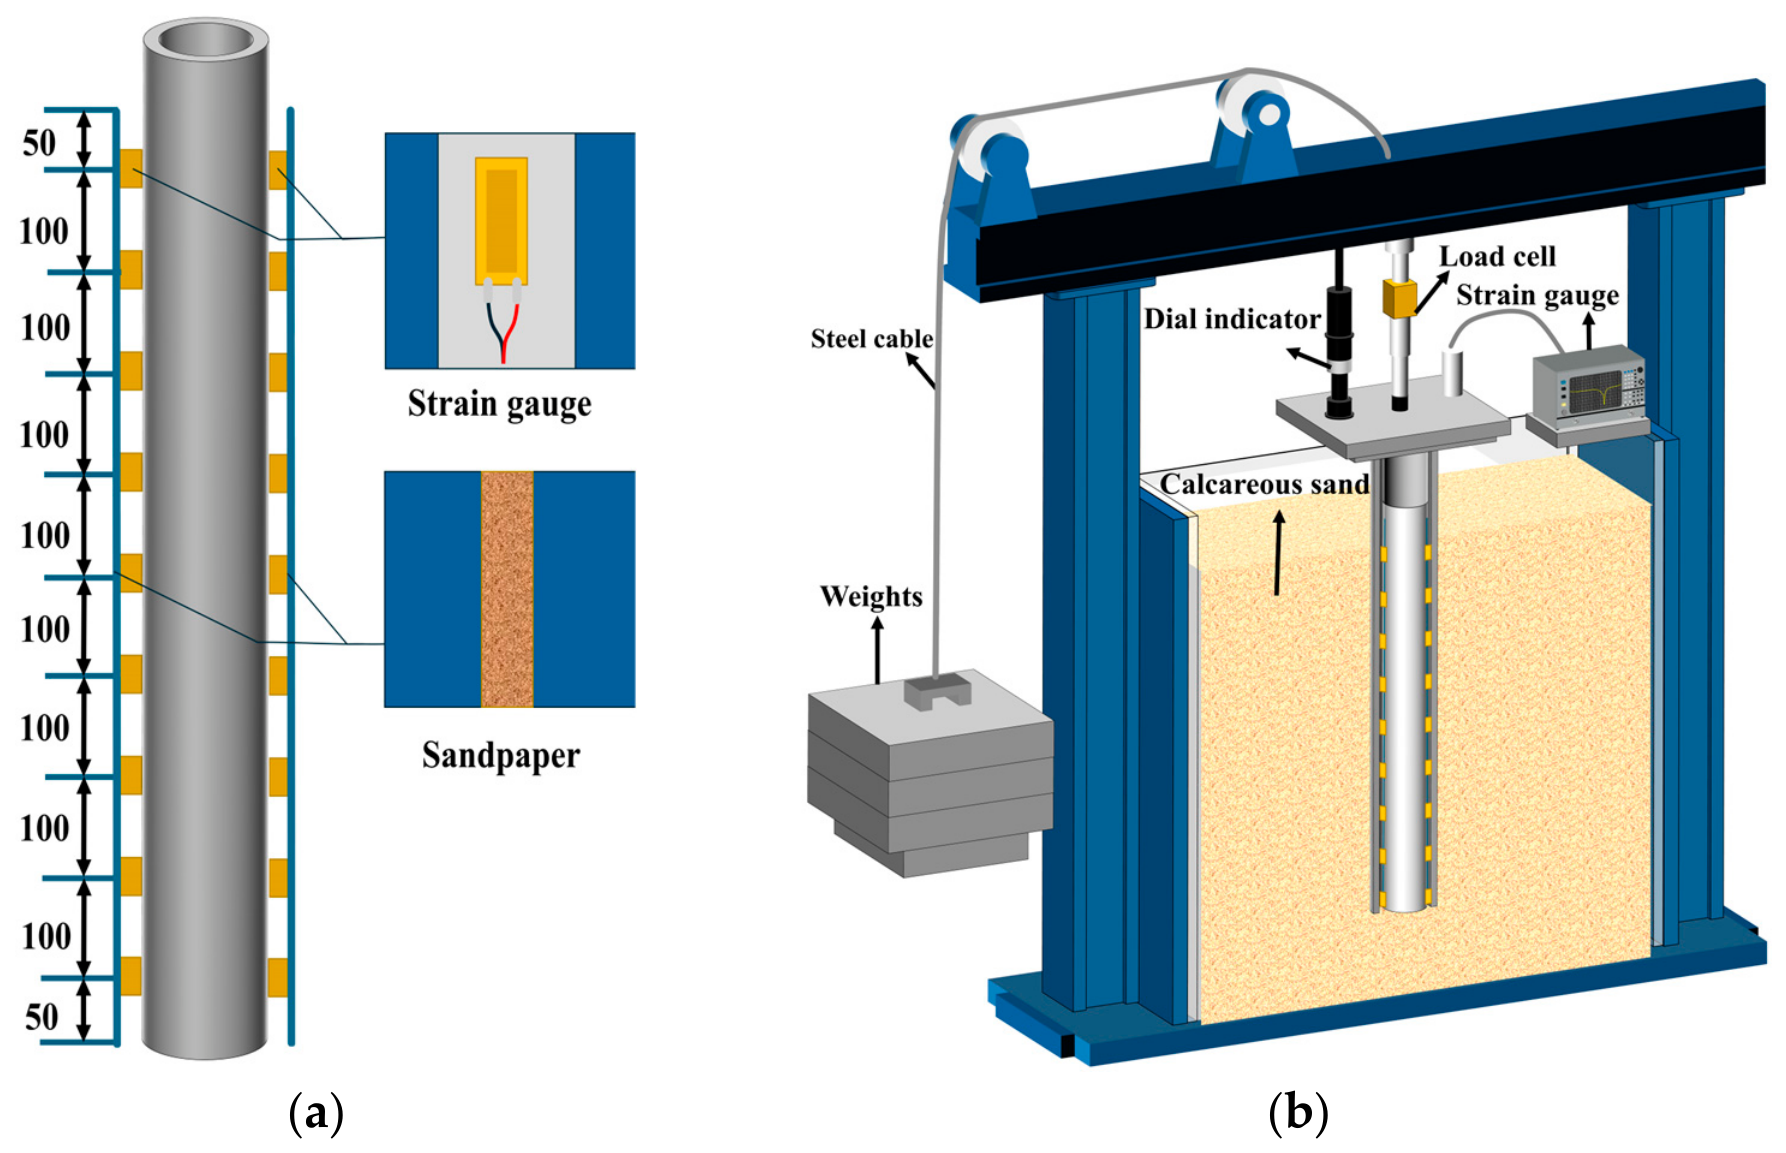
Based on the practical engineering conditions, the prototype uplift pile was a 27 m long steel pipe pile with a diameter of 0.9 m and an elastic modulus of 210 GPa. Based on similitude principles, a geometric similarity ratio of 1:30 was adopted for the model pile. A polyvinyl chloride (PVC) pipe with an elastic modulus of 3 GPa was used as the model pile. The model pile had an embedment depth of 900 mm and a diameter of 30 mm. Starting at the pile toe, strain gauges were bonded symmetrically to opposite sides of the outer pile wall using cyanoacrylate adhesive. The gauge lead wires were routed through predrilled holes into the pile cavity and led out of the pile. A layer of epoxy resin was applied over each strain gauge, and sandpaper was bonded to the outer surface of the pile shaft.
The test chamber had clear internal dimensions of 1000 × 500 × 1800 mm (length × width × height). Its frame was constructed from square steel sections and tempered-glass panels, and one side was fitted with a movable access door. During testing, the model pile was positioned at the center of the chamber. The sand layer beneath the pile toe was 10D thick, and the minimum clearance between the outer pile surface and the inner chamber wall was 7.8D, where D is the model pile diameter. Moreover, the pile diameter exceeded 30 times the median particle size of the sand. Accordingly, boundary and particle-size effects in the model tests were considered negligible [24,25,26]. A schematic of the test chamber and model pile is shown in Figure 2.
Figure 2.
Schematic of the model pile and test chamber. (a) Model pile; (b) test chamber.
2.3. Measurement System
Pile-head displacement was measured using a digital dial indicator. Load and strain data were acquired using a GGD-330 measurement controller and a BZ2205C programmable static resistance strain meter, respectively. BX/BF120-5AA strain gauges with a resistance of 120 Ω were used.
2.4. Test Program
2.4.1. Pile Installation Method
A pre-embedding method was adopted for pile installation. For each layer, a fixed mass of calcareous sand (77.0 kg for Sand A and 70.9 kg for Sand B) was weighed using an electronic balance and spread uniformly. The sand was statically compacted using a wooden plate and leveled using a spirit level. The compacted thickness of each layer was strictly controlled at 10 cm to achieve the target relative density (Dr = 42% ± 2%). When the sand bed reached a height of 30 cm, the pile was accurately positioned at the predetermined location, with its axis deviation limited to 0.5% of L, where L is the pile length. Sand placement and compaction then continued until the specified filling height was reached.
2.4.2. Loading System
A pulley–deadweight loading system was used to provide clearly defined load levels and reduce experimental errors. Loading was applied sequentially at 0.3 Qu → 0.5 Qu → 0.7 Qu → 0.9 Qu, where Qu is the ultimate uplift capacity of the model pile. Pile-head displacement and pile-shaft strain were recorded immediately after each load level was applied and subsequently at 5 min intervals. When the pile-head displacement rate remained below 0.1 mm/h for 2 consecutive hours, the pile-head displacement was considered stable, and measurements were thereafter recorded once daily. Each load increment was maintained for 21 days, after which the next load increment was applied to the same pile.
2.4.3. Test Matrix
The tests were designed primarily to investigate the effects of pile surface roughness and calcareous sand particle-size distribution on the time-dependent bearing behavior of the model piles. The test matrix is presented in Table 2. The normalized roughness (Rn), listed in Table 2, was calculated using Equation (1).
where Rmax is the maximum height difference in the roughness profile on the sandpaper surface, and d50 is the median particle size of the calcareous sand used in the tests.
Rn = Rmax/d50
Table 2.
Test matrix.
The maximum height differences in the roughness profiles on the sandpaper surfaces were measured using a high-precision three-dimensional scanner. The measured Rmax values were 0.0065 mm for the 2000-grit sandpaper, 0.045 mm for the 320-grit sandpaper, and 0.260 mm for the 80-grit sandpaper. Following the classification proposed by Paikowsky [27], Rn values of 0.02 and 0.5 were adopted as the boundaries between different interface roughness categories. Accordingly, the model pile surfaces were classified into three roughness categories: smooth, semi-rough, and rough.
3. Results and Discussion
3.1. Determination of the Ultimate Uplift Capacity of the Model Piles
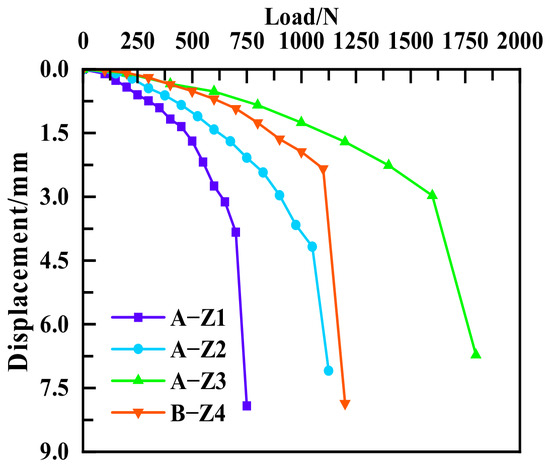
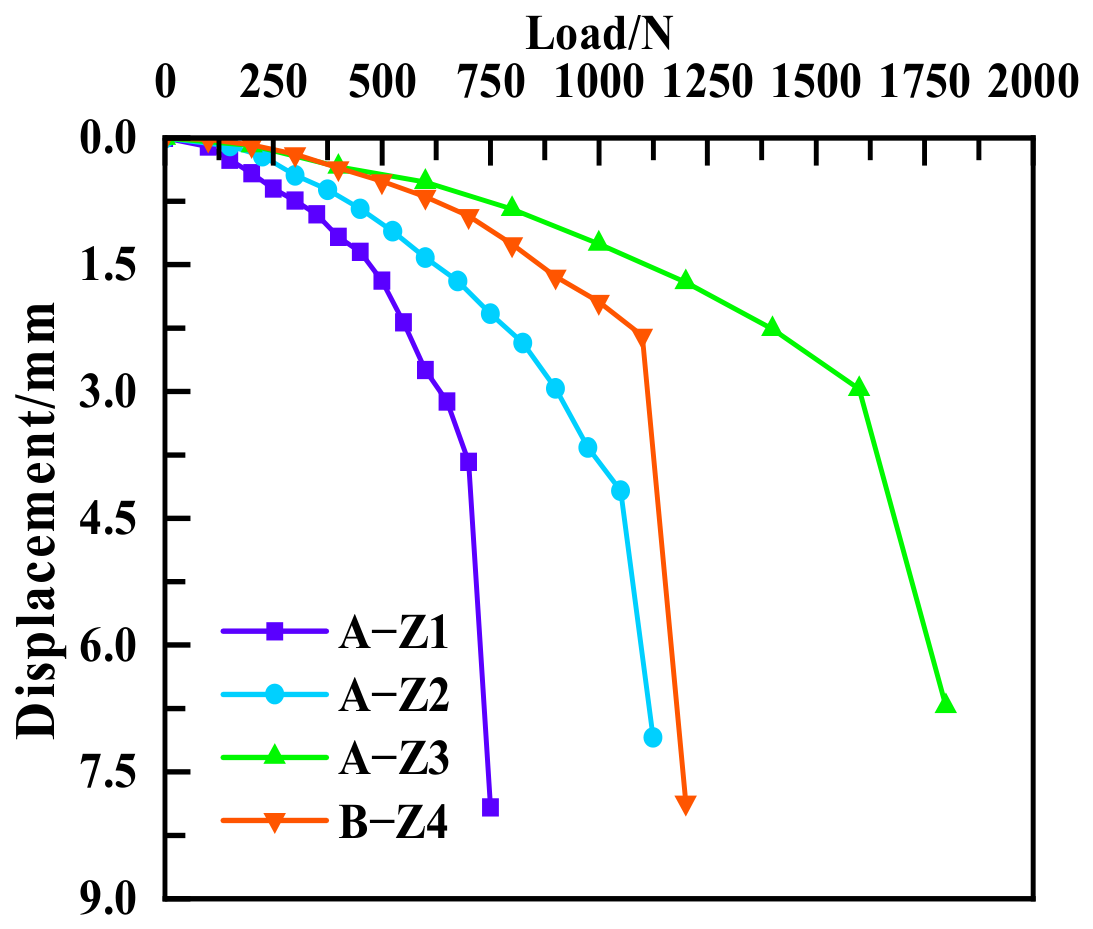
In accordance with the requirements of the relevant standard [28], uplift load tests were conducted on the model piles, and the resulting load–displacement curves are shown in Figure 3. Each curve exhibits a distinct inflection point, at which the pile-head displacement increases abruptly. For this response, the load corresponding to the onset of the abrupt increase in displacement was taken as the ultimate uplift capacity. The resulting values are summarized in Table 3.
Figure 3.
Load–displacement curves of the model piles.
Table 3.
Ultimate uplift capacity of the model piles.
3.2. Time-Dependent Analysis of Pile-Head Displacement
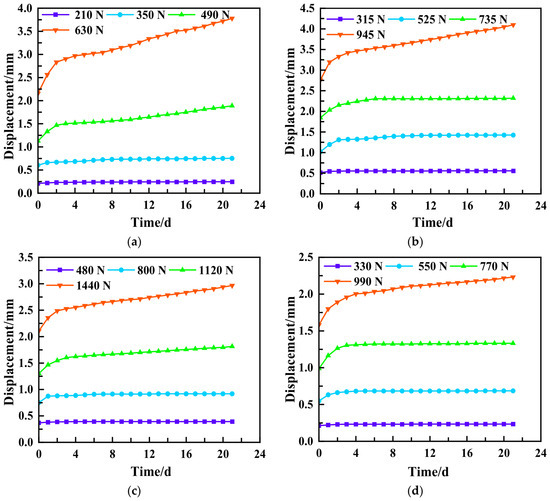
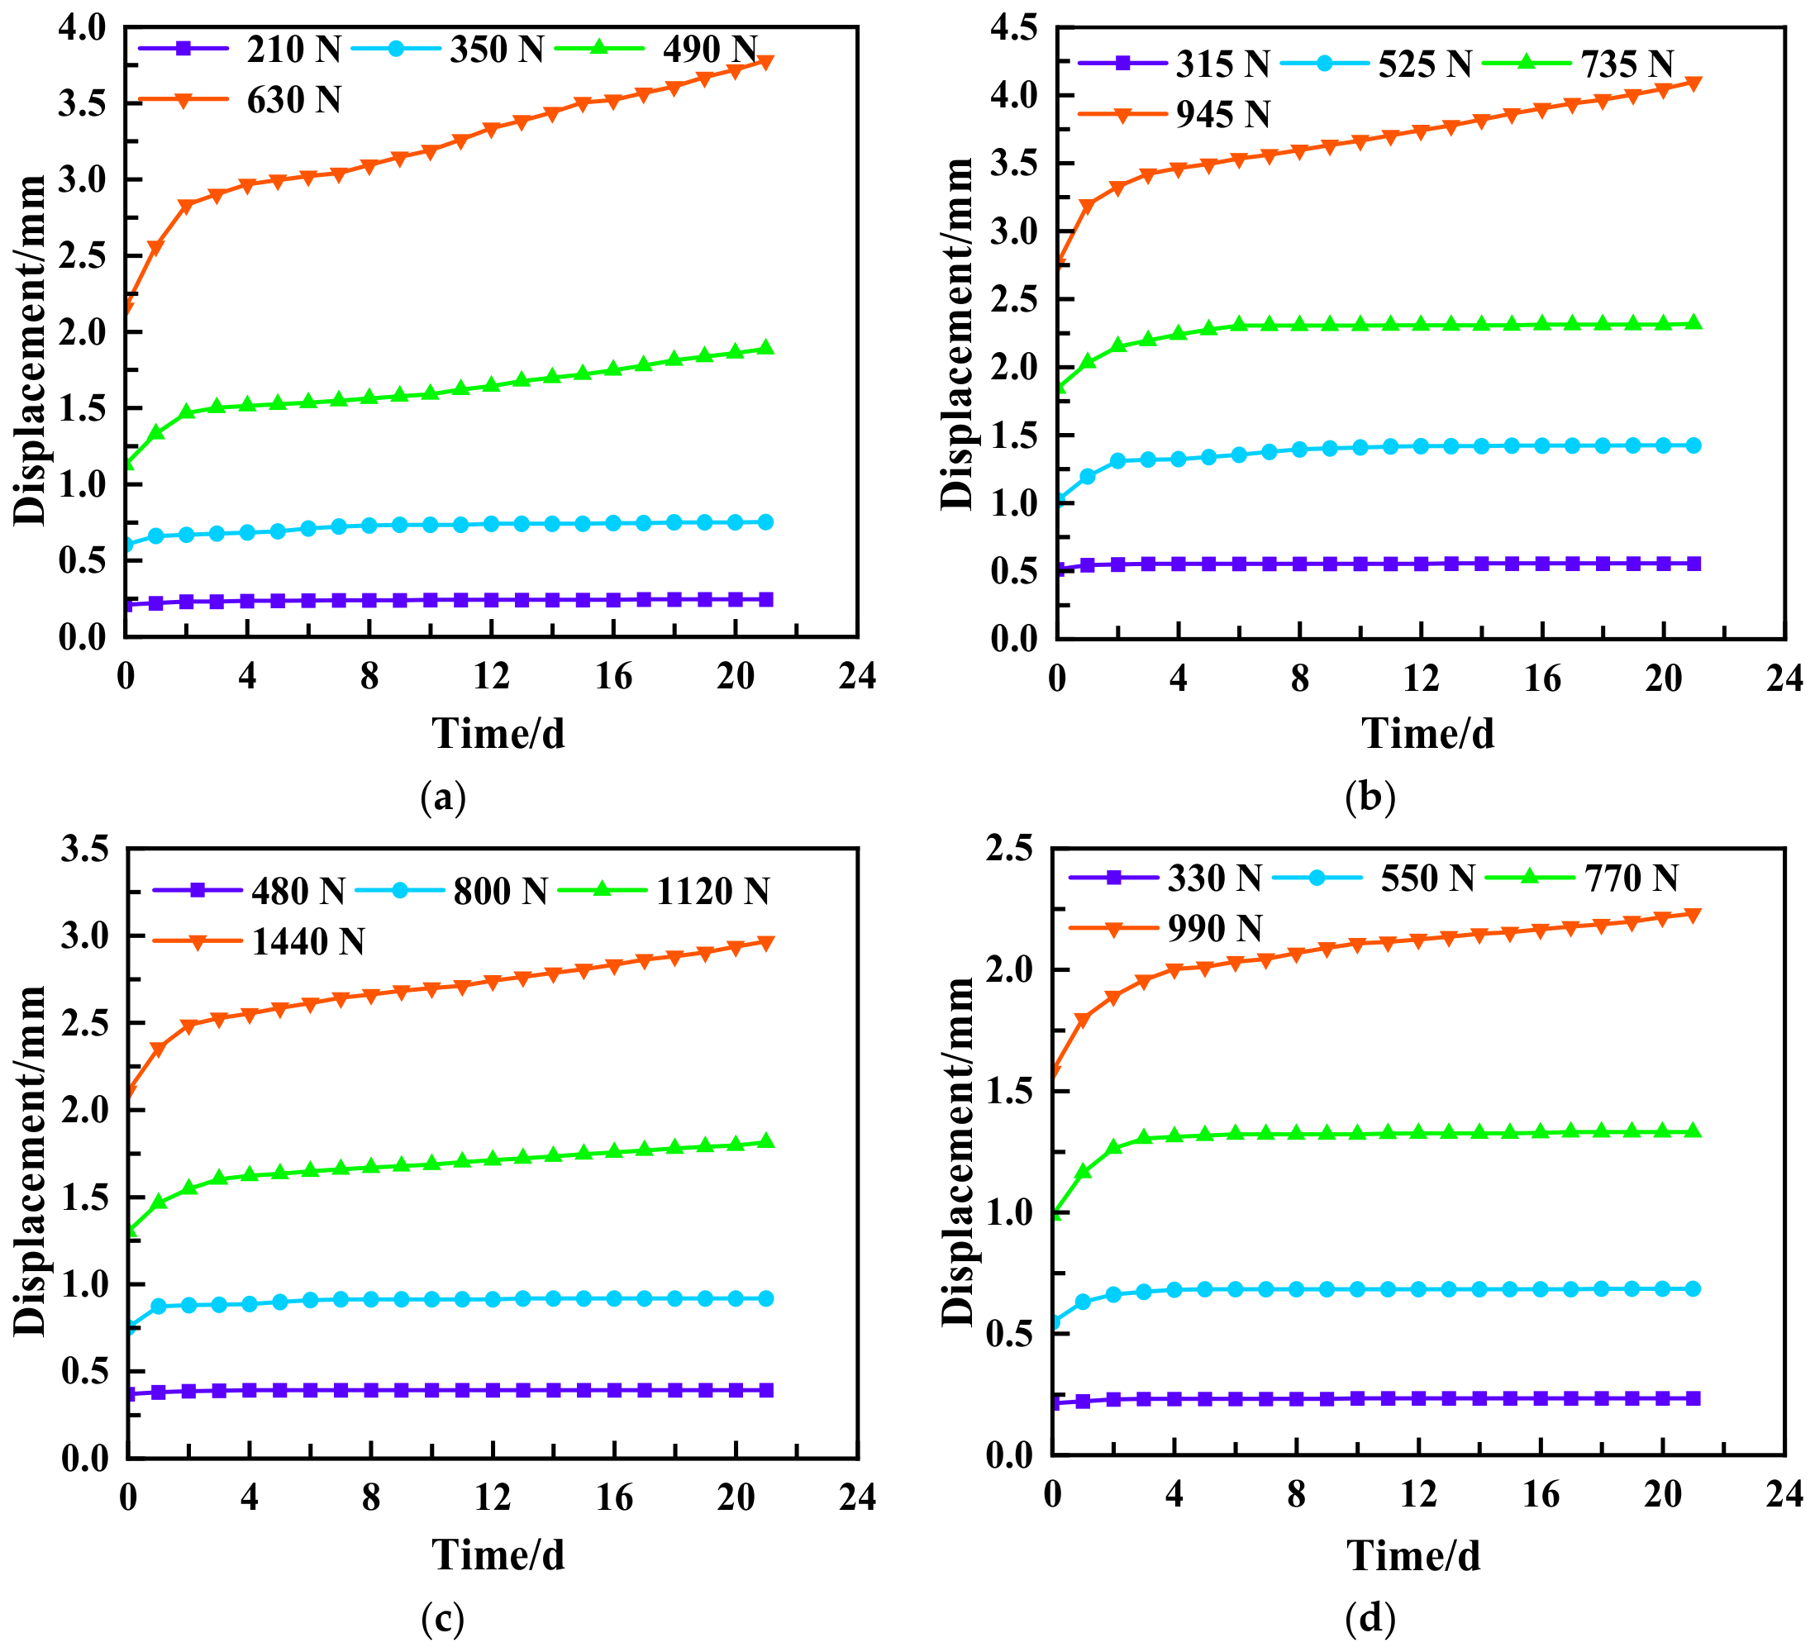
Sustained uplift loading tests were conducted on four model piles at different load levels, and the resulting displacement–time curves are shown in Figure 4. As shown in the figure, the pile-head displacement of all four model piles increased with the duration of sustained loading under each constant uplift load, although the rate of displacement increase differed markedly among the load levels. At low load levels, most of the pile-head displacement occurred rapidly during the initial loading period, after which the curves gradually flattened, exhibiting distinct primary creep characteristics. As the load level increased, the displacement increased approximately linearly with time after the primary creep stage, indicating both primary and steady-state creep. For example, under 210 N, the displacement of A-Z1 increased from 0.209 to 0.244 mm, corresponding to an increment of only 0.035 mm. The negligible subsequent increase indicated that the pile remained in the primary creep stage. When the load increased to 490 N, the displacement continued to increase slowly after 3 d, and the displacement–time curve exhibited a slight upward trend with a discernible slope, indicating the occurrence of both primary and steady-state creep. Under 630 N, the displacement–time curve exhibited a pronounced upward trend, and the displacement reached 3.781 mm at 21 d, approaching the ultimate pile-head displacement. This result indicated that shear slip and creep continued to develop at the pile–sand interface under the high load level. A-Z2, A-Z3, and B-Z4 exhibited similar behavior. Because the four load levels were applied sequentially to the same model pile, the response at each higher load level inevitably included the cumulative influence of the preceding sustained-loading stages. Therefore, the differences among the load levels reflect the combined effects of the current load magnitude and the previous loading history, rather than the effect of load level alone.
Figure 4.
Pile-head displacement–time curves of the model piles. (a) A-Z1; (b) A-Z2; (c) A-Z3; (d) B-Z4.
Pile surface roughness and the particle-size distribution of the calcareous sand significantly affected the long-term displacement of the model piles. A-Z1, A-Z2, and A-Z3 corresponded to smooth, semi-rough, and rough interfaces, respectively. Under the highest sustained load level, the actual load applied to A-Z3 was 1440 N, considerably greater than the 630 N applied to A-Z1; nevertheless, its pile-head displacement at 21 d remained smaller than that of A-Z1. This result indicated that a rougher interface enhanced the mobilization of pile–sand interface resistance, thereby effectively limiting long-term uplift displacement. A-Z2 and B-Z4 both had semi-rough interfaces but were embedded in calcareous sands with different particle-size distributions. The final displacement of B-Z4 at each load level was generally smaller than that of A-Z2. The smaller displacement of B-Z4 is consistent with previous studies showing that particle-size distribution affects particle packing and the shear behavior of calcareous sand–structure interfaces [6]. However, because A-Z2 and B-Z4 also differed in normalized roughness, this difference cannot be attributed solely to particle-size distribution.
Overall, the pile-head displacement of uplift piles in calcareous sand exhibited pronounced time dependence under different load levels. Higher load levels resulted in greater instantaneous pile-head displacement and long-term creep displacement. Greater pile surface roughness strengthened pile–sand interlocking and suppressed the development of long-term displacement. Well-graded calcareous sand enhanced confinement around the pile through more effective void filling, interparticle interlocking, and densification, thereby reducing the long-term displacement of the model pile.
3.3. Isochronous Load–Displacement Curves and Time-Dependent Uplift Stiffness
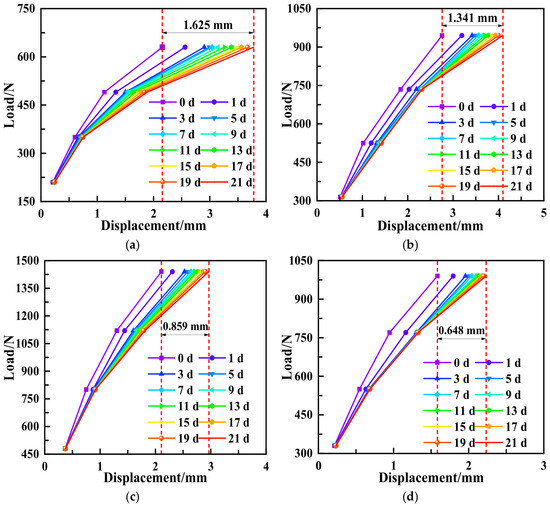
For each load level, pile-head displacements recorded at the same elapsed holding times were used to construct the isochronous load–displacement curves of the four model piles (Figure 5). The higher-load segments had lower slopes, indicating larger displacement increments per unit increase in load. For a given pile and load, the curves shifted toward greater displacement with increasing holding time. Curves at different times remained close together at lower loads but separated markedly at higher loads. The spacing between adjacent curves narrowed at later times, indicating slower displacement growth, although displacement continued to accumulate through day 21.
Figure 5.
Isochronous load–displacement curves. (a) A-Z1; (b) A-Z2; (c) A-Z3; (d) B-Z4.
For the three piles tested in Sand A, the pile-head displacement increments from 0 to 21 d under their respective maximum sustained loads were 1.625, 1.341, and 0.859 mm for A-Z1, A-Z2, and A-Z3, respectively. Although A-Z3 sustained the highest load, its pile-head displacement at 21 d was smaller than those of A-Z1 and A-Z2. This result is consistent with greater pile surface roughness limiting displacement accumulation under the present test conditions. A-Z2 and B-Z4 both had 320-grit sandpaper surfaces but were tested in poorly graded Sand A and well-graded Sand B, respectively. Under their respective maximum sustained loads, B-Z4 exhibited a smaller displacement increment from 0 to 21 d than A-Z2. This difference may be related to sand gradation, although the two piles also differed in normalized interface roughness.
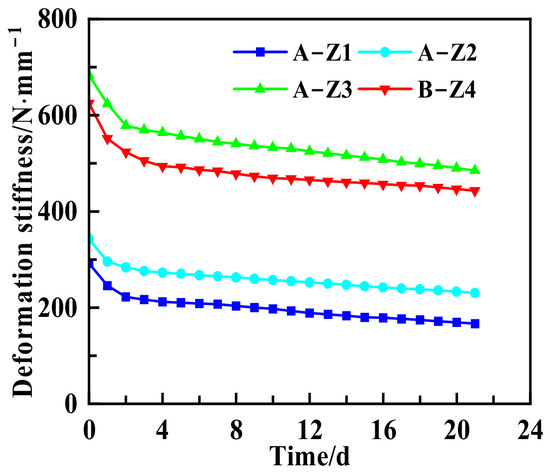
Figure 6 shows the variation in uplift deformation stiffness with time for the four model piles under their respective maximum load levels. Over 21 d, the stiffness of A-Z1, A-Z2, A-Z3, and B-Z4 decreased from 293, 350, 684, and 625 N/mm to 167, 232, 488, and 454 N/mm, respectively. The corresponding reductions were 43.0%, 33.8%, 28.7%, and 27.4%. For all four piles, stiffness decreased rapidly during the initial holding period and more slowly thereafter. The curves were still declining gradually at 21 d.
Figure 6.
Uplift deformation stiffness–time curves.
For A-Z1, A-Z2, and A-Z3, all tested in Sand A, stiffness at 21 d increased and the relative reduction decreased as pile surface roughness increased. Under the same relative load level in this test series, the rougher pile–sand systems therefore showed greater resistance to displacement accumulation. B-Z4 had a higher stiffness and a smaller relative reduction at 21 d than A-Z2. However, the two piles differed in both sand gradation and normalized interface roughness, so this difference cannot be attributed to gradation alone. Overall, the decline in stiffness is consistent with the continued increase in pile-head displacement described above and reflects the deformation of the pile–sand system under sustained loading.
3.4. Internal Force Distribution in the Model Piles
3.4.1. Time-Dependent Behavior of Axial Force in the Model Piles at the Maximum Load Level
At the maximum load level, strain variations in the model piles were monitored at different times, and the pile axial force was calculated using Equation (2):
where Ni is the axial force at section i of the model pile, Ep is the elastic modulus of the pile material, Ai is the cross-sectional area at section i, and εi is the axial strain of the pile shaft at section i.
Ni = EpAiεi
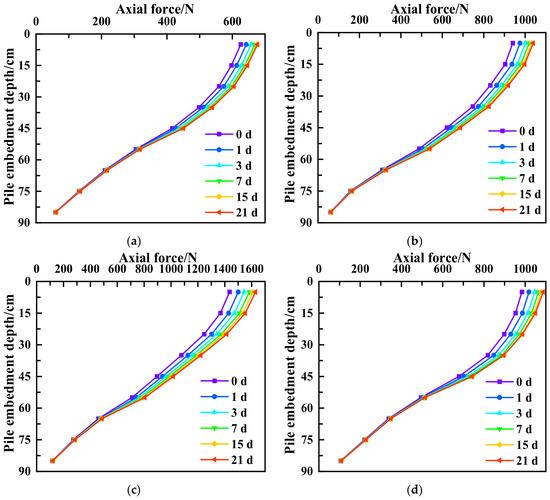
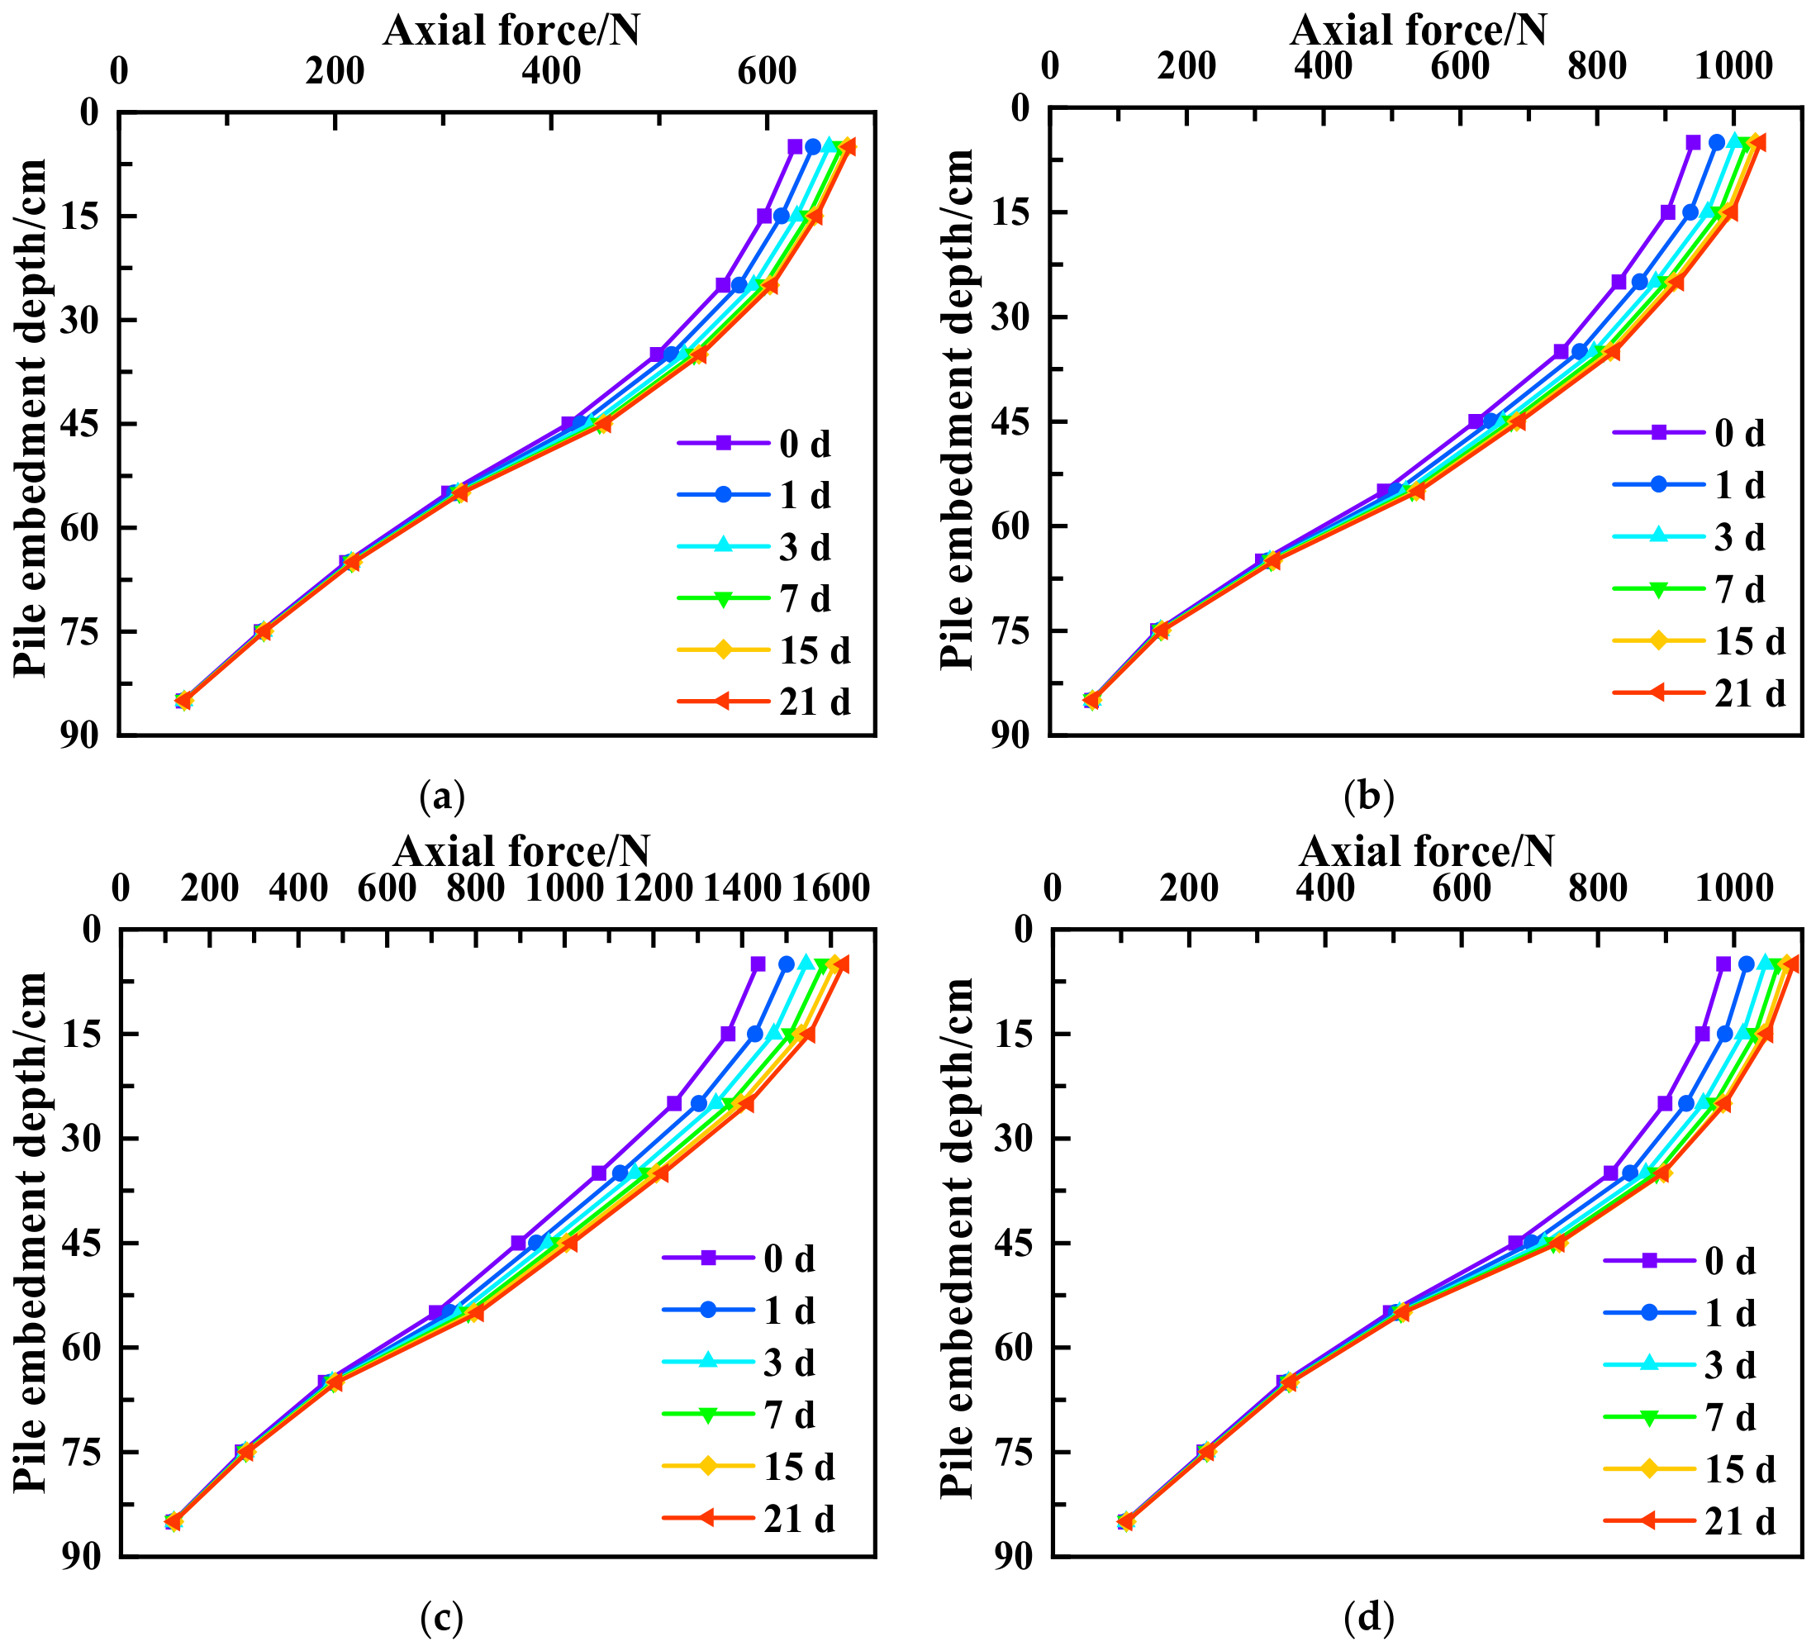
Figure 7 presents the variation in pile axial force with embedment depth at different times. At the maximum load level, the axial force in all four model piles decreased progressively from the pile head toward the pile toe, consistent with the typical load-transfer behavior of uplift piles. From 0 to 21 d, the overall shapes of the axial-force profiles remained essentially unchanged, indicating that sustained loading did not alter the fundamental pattern of load transfer from the pile head toward the pile toe. However, the axial forces in the upper and middle portions of the piles changed appreciably with sustained-loading duration, whereas only minor changes occurred near the pile toe. For example, at an embedment depth of 5 cm, the axial forces in A-Z1 and A-Z3 increased from initial values of 625 and 1436 N to 652 and 1609 N at 21 d, corresponding to increases of 4.32% and 12.04%, respectively. Most of the time-dependent changes in the axial-force profiles occurred during the early stage of sustained loading, with the most pronounced changes occurring during the first 3–7 d. After 7 d, the profiles gradually converged, indicating that the pile–sand system evolved from rapid interfacial adjustment toward a relatively stable load-transfer state. Previous studies have demonstrated that creep of the soil surrounding the pile, particle crushing, and localized changes in soil fabric can modify the stress state around the pile and consequently redistribute axial force along the pile shaft [12,29].
Figure 7.
Variation in axial force with depth in the model piles at different times. (a) A-Z1; (b) A-Z2; (c) A-Z3; (d) B-Z4.
Pile surface roughness had a pronounced effect on the time-dependent redistribution of pile axial force. A-Z1, A-Z2, and A-Z3 were embedded in Sand A and had normalized roughness values, Rn, of 0.013, 0.098, and 0.565, respectively. As pile surface roughness increased, the separation among the axial-force profiles obtained at different times generally became more pronounced in the upper and middle portions of the piles. This indicated that pile–sand load transfer at rougher interfaces was more sensitive to sustained-loading duration. This behavior can be attributed to the enhanced mechanical interlocking and particle wedging between the calcareous sand particles and the pile surface with greater surface roughness, which promotes the progressive mobilization of the shear zone surrounding the pile during continued relative displacement. This behavior is consistent with previous interface shear studies showing that surface roughness significantly affects the shear resistance of calcareous sand–structure interfaces [6,7].
The particle-size distribution of calcareous sand also affected the time-dependent axial load-transfer behavior. A-Z2 and B-Z4 both had surfaces covered with 320-grit sandpaper and were embedded in poorly graded Sand A and well-graded Sand B, respectively. As shown in Figure 7b,d, the axial-force profiles of B-Z4 at different times were generally more closely clustered during the later stage of sustained loading. This indicated that, under the test conditions investigated, well-graded calcareous sand helped maintain a more stable pile–sand load-transfer state. This behavior can be attributed primarily to the more effective void filling and interparticle interlocking among particles of different sizes, which form a more densely packed granular skeleton around the pile, enhance radial confinement, and restrict continued slip at the pile–sand interface. It should be noted that although A-Z2 and B-Z4 used the same 320-grit sandpaper, the d50 values of Sand A and Sand B were 0.46 and 0.27 mm, respectively. According to Equation (1), the corresponding normalized roughness values were 0.098 and 0.166. Therefore, strictly speaking, the differences between the two sets of profiles reflected the coupled effects of particle-size distribution and normalized interface roughness and should not be attributed solely to particle-size distribution [5].
Overall, pile axial force in uplift piles embedded in calcareous sand exhibited pronounced attenuation with depth and time-dependent redistribution. Long-term sustained loading primarily redistributed the axial force in the upper and middle portions of the piles, with most changes occurring during the early loading stage and gradually stabilizing after 3–7 d. Greater pile surface roughness strengthened interfacial shearing and increased the sensitivity of load transfer to sustained-loading duration, whereas a well-graded particle-size distribution promoted the formation of a more stable granular skeleton and load-transfer path in the sand surrounding the pile.
3.4.2. Time-Dependent Behavior of Shaft Resistance in the Model Piles at the Maximum Load Level
At the maximum load level, the shaft resistance mobilized along each pile segment was determined from the difference in pile axial force between adjacent measurement sections. The shaft resistance was calculated using the following equation:
where qi is the average unit shaft resistance along pile segment i, Ni and Ni+1 are the axial forces at sections i and i + 1, respectively, D is the model pile diameter, and ΔL is the distance between the two sections.
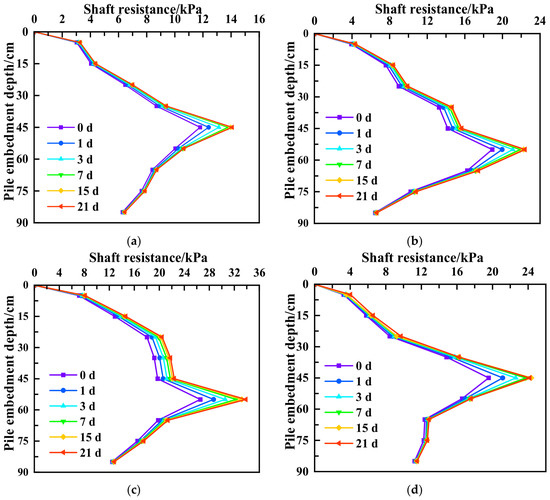
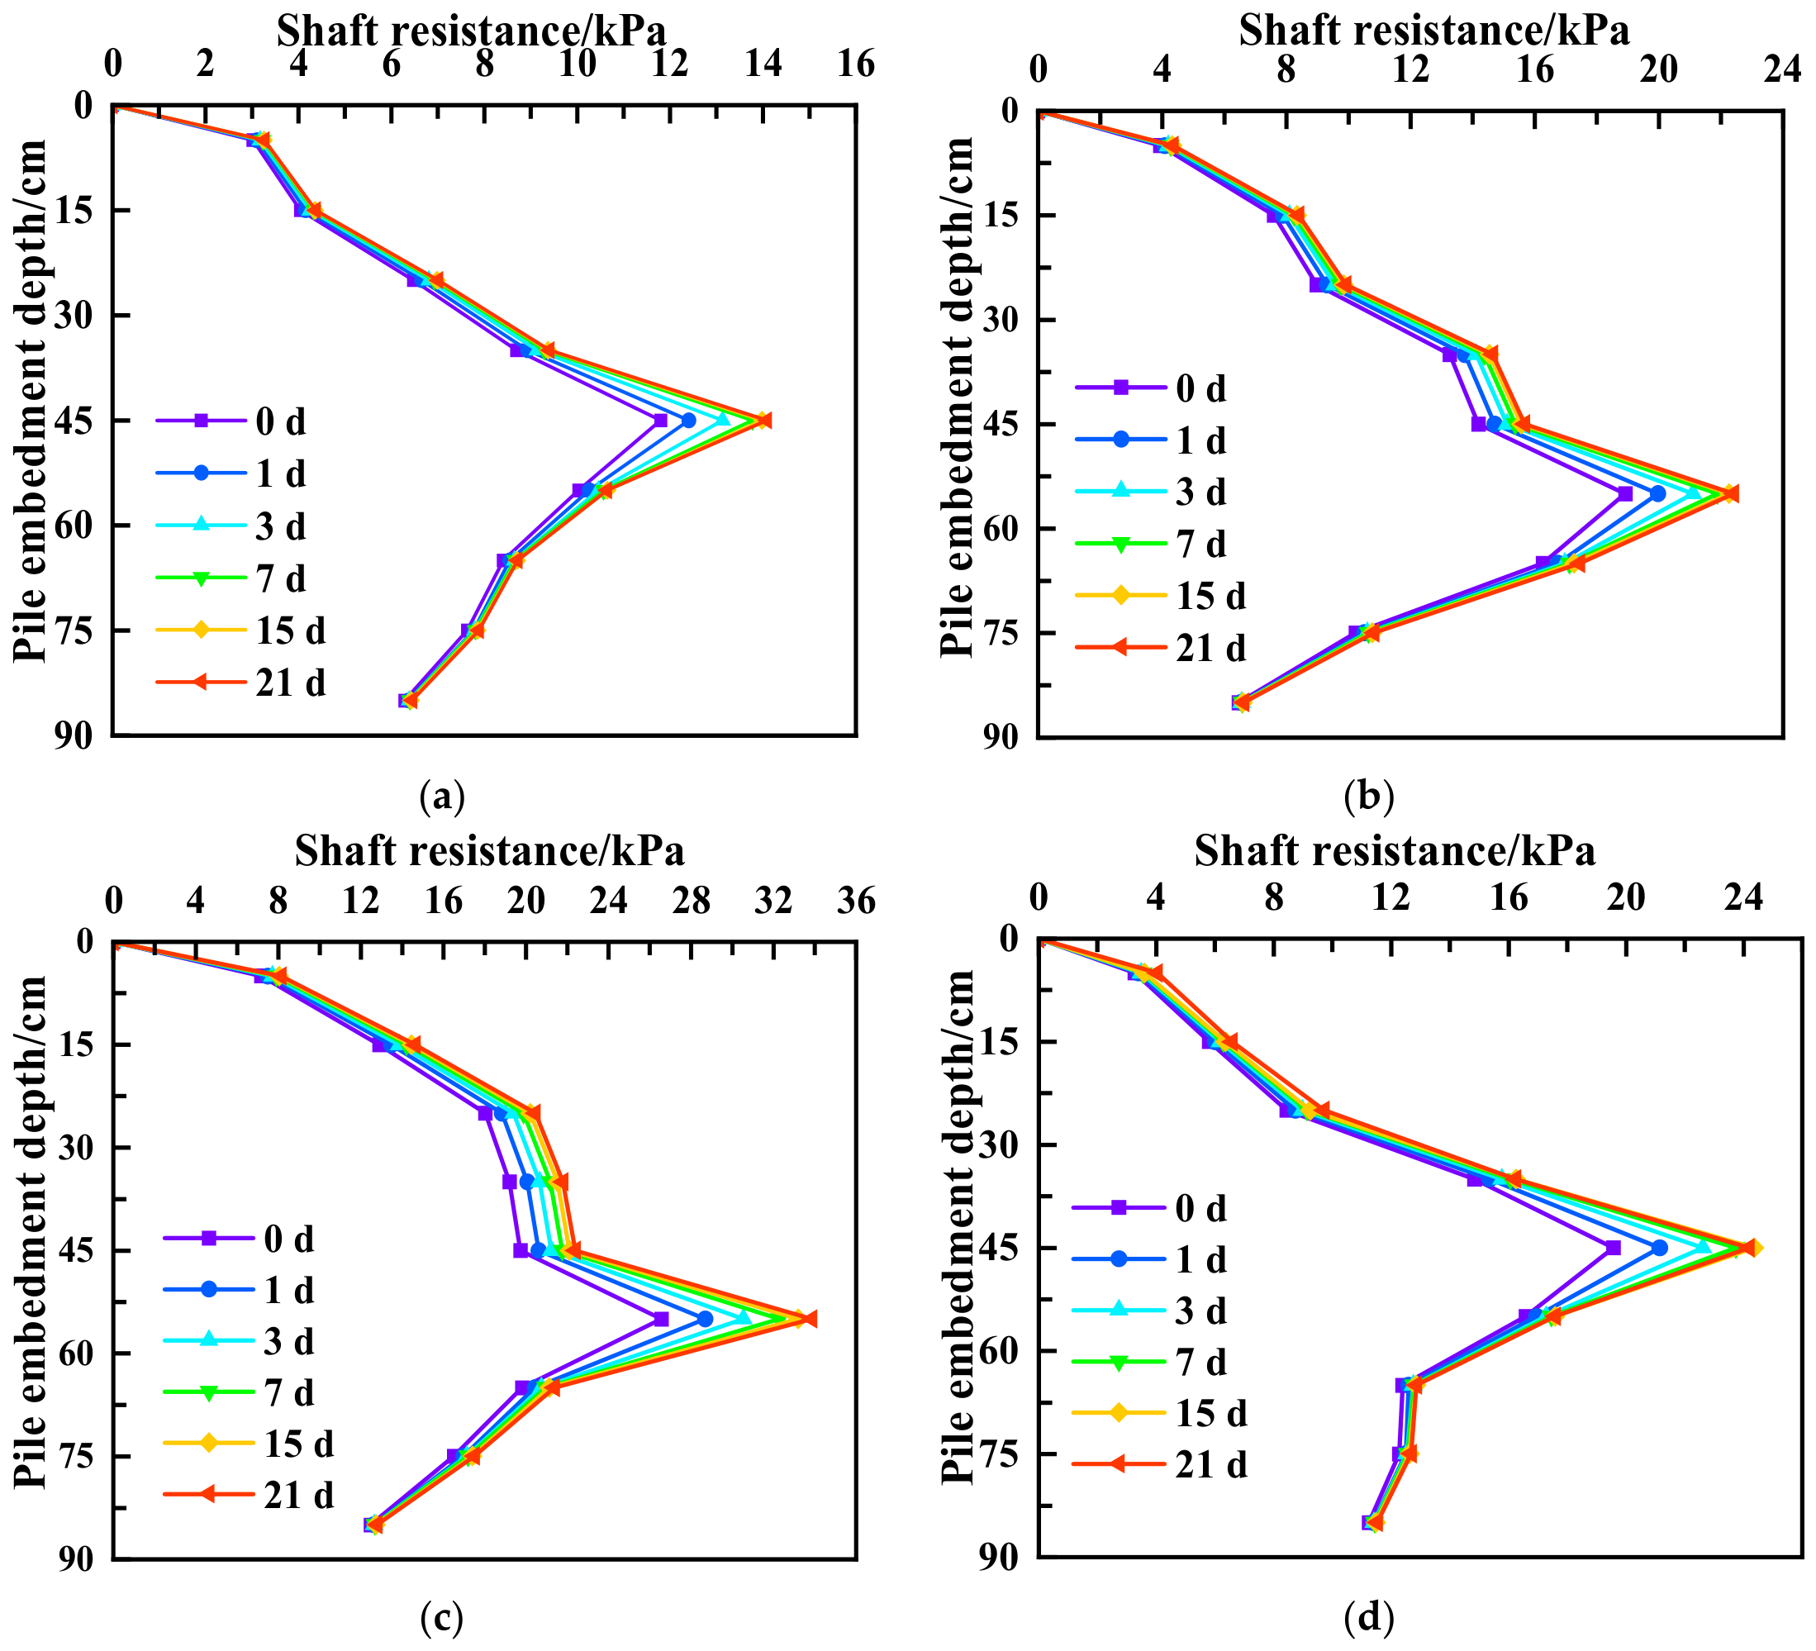
Figure 8 presents the shaft-resistance profiles with depth at different times. At the maximum load level, the shaft resistance of all four model piles exhibited a markedly nonuniform distribution with depth. It was relatively low near the pile head, increased progressively with depth, reached a peak at an embedment depth of 45–55 cm, and then decreased toward the pile toe. From 0 to 21 d, the fundamental distribution pattern remained unchanged. However, shaft resistance in the peak zone increased moderately with sustained-loading duration and gradually stabilized after 3–7 d. Accordingly, the time-dependent evolution of shaft resistance under sustained uplift loading can be divided into three stages: early redistribution, progressive mobilization in the peak zone, and subsequent stabilization. This evolution was closely associated with the time-dependent changes in pile-head displacement and pile axial force. During the initial loading stage, relative pile–sand displacement developed rapidly, initiating the mobilization of interfacial shear resistance. As sustained loading continued, the pile–sand load-transfer state gradually adjusted, which allowed further mobilization of shaft resistance in the peak zone.
Figure 8.
Variation in shaft resistance with depth in the model piles at different times. (a) A-Z1; (b) A-Z2; (c) A-Z3; (d) B-Z4.
Pile surface roughness significantly affected the time-dependent mobilization of shaft resistance. Comparisons among A-Z1, A-Z2, and A-Z3 showed that as Rn increased from 0.013 to 0.565, shaft resistance generally increased, and its time-dependent changes became more pronounced in the peak zone along the middle and lower portions of the piles. This result is consistent with previous interface shear studies showing that increasing surface roughness enhances the shear resistance of calcareous sand–structure interfaces [6,7]. Particle rearrangement and particle crushing were not directly investigated in the present tests. Therefore, their possible roles in pile–calcareous sand interaction are discussed only with reference to previous studies [12].
Particle-size distribution also affected the measured time-dependent shaft-resistance response. Compared with A-Z2, B-Z4 exhibited a relatively more stable load-transfer response during the later stage of sustained loading. Interface dilation and particle breakage were not directly measured in the present tests; therefore, their evolution could not be quantitatively determined. Previous large-scale interface shear tests have shown that particle-size distribution significantly affects the shear strength and particle breakage of calcareous sand–structure interfaces. Particle rearrangement and interlocking contribute to the initial dilative response, whereas progressive particle breakage can reduce dilation and promote contraction [30]. These findings provide a possible particle-scale explanation for the present observations. However, because A-Z2 and B-Z4 also differed in normalized interface roughness, the measured differences should be regarded as the coupled effects of particle-size distribution and interface roughness.
Overall, the shaft resistance of uplift piles in calcareous sand exhibited pronounced depth- and time-dependent behavior. Its peak occurred mainly along the middle and lower portions of the pile, and its evolution under sustained loading was characterized by early redistribution, enhancement in the peak zone, and subsequent stabilization. Greater pile surface roughness promoted the mobilization of interfacial resistance and made its time-dependent redistribution more pronounced, whereas a well-graded particle-size distribution facilitated the formation of a more stable granular skeleton around the pile. Therefore, evaluations of the long-term bearing performance of uplift piles should not assume that shaft resistance is uniformly distributed along the pile and independent of time.
3.5. Creep Model for the Model Piles
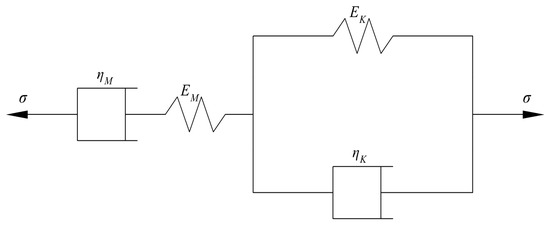
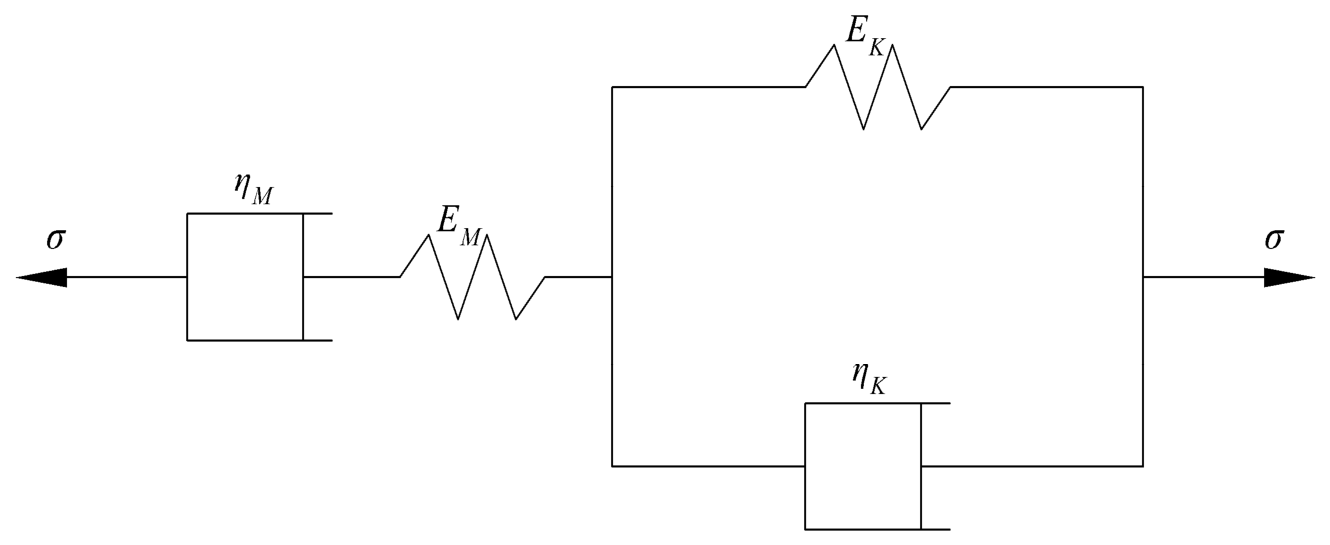
The test results indicate that the creep response of the model piles can be represented by the Burgers model, which consists of a Maxwell element and a Kelvin–Voigt element connected in series, as illustrated in Figure 9.
Figure 9.
Burgers model.
Let σM and εM denote the stress and strain of the Maxwell element, respectively; σK and εK denote the stress and strain of the Kelvin–Voigt element, respectively; and σ and ε denote the total stress and strain of the Burgers model, respectively. The corresponding relationships are given by Equation (4).
The Maxwell model consists of a Newtonian dashpot (N element) and a Hookean spring (H element) connected in series. Its creep equation is given by Equation (5).
The Kelvin–Voigt model consists of a Newtonian dashpot (N element) and a Hookean spring (H element) connected in parallel. Its creep equation is given by Equation (6).
Substituting Equations (5) and (6) into Equation (4) yields the creep equation of the Burgers model, as expressed in Equation (7).
where EM and EK are the elastic moduli of the springs in the Maxwell and Kelvin–Voigt elements, respectively; ηM and ηK are the viscosity coefficients of the dashpot elements; and t is the elapsed loading time.
In the present tests, the model pile was subjected to a constant load Q, and its creep displacement is denoted by S(t). The creep equation can therefore be rewritten as Equation (8). Defining L = 1/EM, P = 1/ηM, U = 1/EK, and V = EK/ηK, Equation (8) can be simplified to Equation (9).
S(t) = Q[L + Pt + U(1 − e−Vt)]
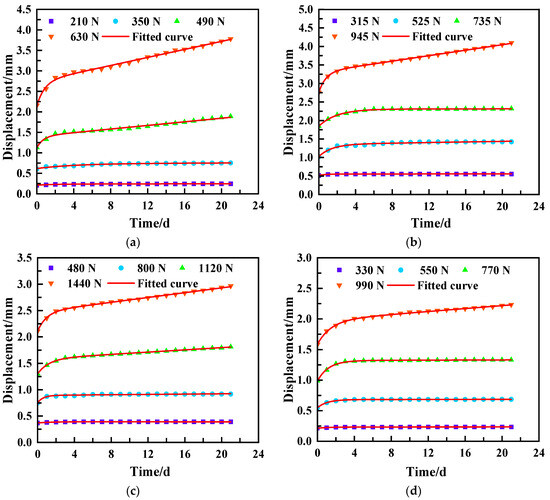
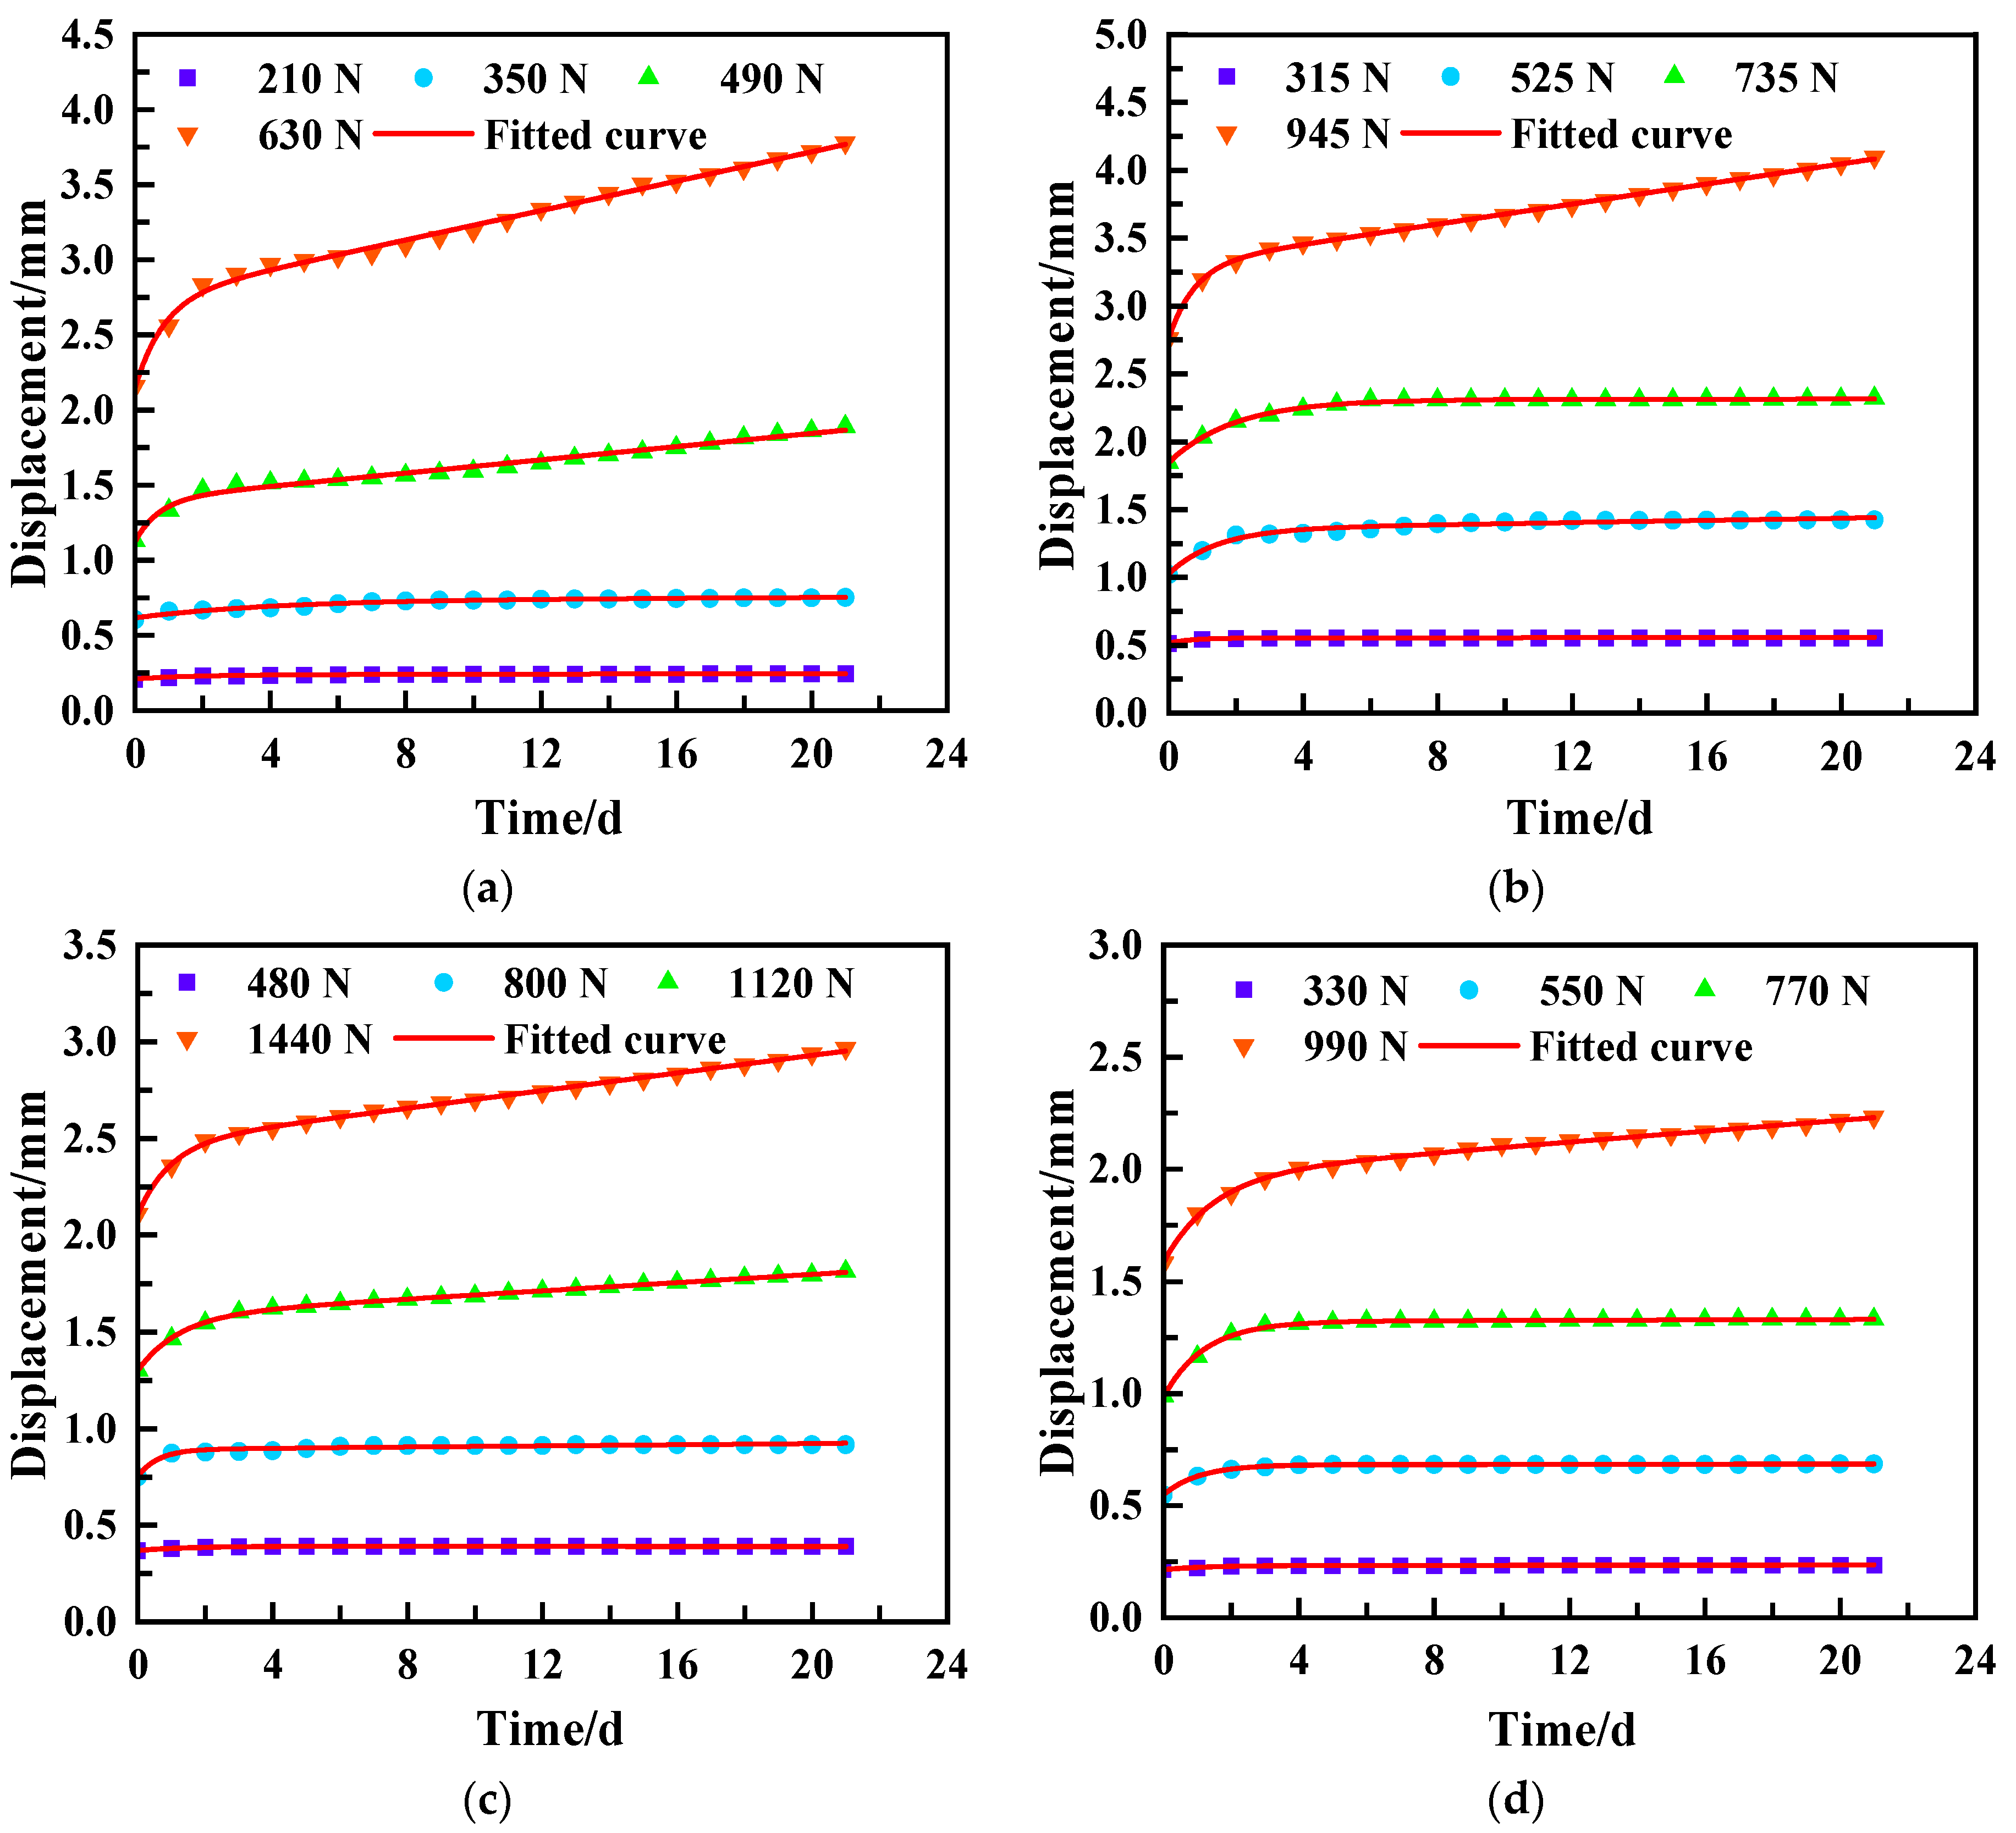
Equation (9) was used to fit the displacement–time curves of the model piles at different load levels, as shown in Figure 10. The curves fitted using the Burgers model showed good overall agreement with the experimental measurements. At all load levels, the model effectively captured the complete time-dependent evolution of pile-head displacement, including the rapid initial increase in displacement and the subsequent progressive reduction in displacement rate as the creep response approached a relatively stable state.
Figure 10.
Fitted displacement–time curves of the model piles. (a) A-Z1; (b) A-Z2; (c) A-Z3; (d) B-Z4.
The Burgers-model parameters obtained from the fitting are presented in Table 4, Table 5, Table 6 and Table 7. The coefficient of determination, R2, exceeded 0.967 for every test group, and the fitted mechanical parameters generally decreased with increasing uplift load. Because the same model pile was used throughout the loading sequence, these variations reflect the combined effects of the increasing load level and the accumulated loading history from the preceding stages.
Table 4.
Fitted Burgers-model parameters for A-Z1.
Table 5.
Fitted Burgers-model parameters for A-Z2.
Table 6.
Fitted Burgers-model parameters for A-Z3.
Table 7.
Fitted Burgers-model parameters for B-Z4.
4. Conclusions
- (1)
- Uplift piles in calcareous sand exhibited pronounced time-dependent displacement under sustained uplift loading, with pile-head displacement progressing through primary and steady-state creep stages. Increasing pile surface roughness and using a well-graded particle-size distribution both effectively reduced long-term displacement.
- (2)
- The slopes of the isochronous load–displacement curves decreased as the load increased. At a given load, the curves shifted toward larger displacements as the holding time increased, while the spacing between successive curves narrowed at later times. Under their respective maximum sustained loads, the uplift deformation stiffness decreased by 27.4–43.0% over 21 d, with the reduction being smaller for rougher piles in Sand A.
- (3)
- At the maximum load level, pile axial force decreased progressively with embedment depth. Sustained loading primarily redistributed the axial force in the upper and middle portions of the pile, with the distribution stabilizing after 3–7 d. Greater pile surface roughness enhanced the time-dependent redistribution of load, whereas a well-graded particle-size distribution helped maintain a stable load-transfer path.
- (4)
- At the maximum load level, shaft resistance increased with embedment depth to a peak at approximately 45–55 cm and then decreased toward the pile toe. Within this peak zone, shaft resistance generally increased with sustained-loading duration and gradually stabilized after 3–7 d. This time-dependent increase was more pronounced for piles with rougher surfaces.
- (5)
- The Burgers model effectively described the displacement–time relationship of uplift piles in calcareous sand. As the pile-head load increased, the elastic moduli and viscosity coefficients in the Burgers model generally decreased, indicating that the pile–sand system became less resistant to long-term deformation.
5. Limitations and Future Work
- (1)
- Each load stage lasted 21 d. Model-scale and boundary effects and the use of dry, medium-dense sand limit the extrapolation of the observed 3–7 d stabilization to field piles. Future work will include longer-duration and field-scale tests.
- (2)
- Sequential loading on the same pile, without separate specimens for each load level or replicate tests, confounded loading-history effects and prevented assessment of repeatability. Future tests will use independent, replicated piles.
- (3)
- The A-Z2/B-Z4 comparison partly confounded particle-size distribution with normalized interface roughness, while interface dilation, particle rearrangement, and breakage were not directly measured. Future tests will match normalized roughness and include post-test particle analyses.
Author Contributions
Conceptualization, B.T. and P.Q.; methodology, X.W.; validation, X.W., P.Q. and B.T.; resources, B.T.; data curation, P.Q.; writing—original draft preparation, P.Q.; writing—review and editing, X.W.; supervision, B.T.; funding acquisition, B.T. All authors have read and agreed to the published version of the manuscript.
Funding
This research was funded by the National Natural Science Foundation of China (42367020).
Data Availability Statement
The data presented in this study are available on request from the corresponding author.
Conflicts of Interest
The authors declare no conflicts of interest.
References
- Wu, Y.; Li, N.; Wang, X.; Cui, J.; Chen, Y.; Wu, Y.; Yamamoto, H. Experimental investigation on mechanical behavior and particle crushing of calcareous sand retrieved from South China Sea. Eng. Geol. 2021, 280, 105932. [Google Scholar] [CrossRef] [Scilit]
- Wei, H.; Yin, M.; Zhao, T.; Yan, K.; Shen, J.; Meng, Q.; Wang, X.; He, J. Effect of particle breakage on the shear strength of calcareous sands. Mar. Geophys. Res. 2021, 42, 23. [Google Scholar] [CrossRef] [Scilit]
- Wei, H.; Liu, H.; Zhao, T.; Zhang, S.; Ma, L.; Yin, M.; Meng, Q. Particle breakage and morphology changes of calcareous sands under one-dimensional compression loading. Mar. Geophys. Res. 2022, 43, 45. [Google Scholar] [CrossRef] [Scilit]
- Pei, H.-M.; Wang, D. Shear strength and dilatancy of calcareous sand in the South China Sea. China Ocean Eng. 2022, 36, 781–790. [Google Scholar] [CrossRef] [Scilit]
- Gao, Y.; Guo, Z.; Yuan, Q. Pile driving and the setup effect and underlying mechanism for different pile types in calcareous sand foundations. J. Mar. Sci. Eng. 2024, 12, 133. [Google Scholar] [CrossRef] [Scilit]
- Kou, H.-L.; Diao, W.-Z.; Zhang, W.-C.; Zheng, J.-B.; Ni, P.; Jang, B.-A.; Wu, C. Experimental study of interface shearing between calcareous sand and steel plate considering surface roughness and particle size. Appl. Ocean Res. 2021, 107, 102490. [Google Scholar] [CrossRef] [Scilit]
- Feng, W.-Q.; Zhang, T.-Y.; Li, Y.-X.; Xu, D.-S. Experimental study of interface performance between calcareous sand and steel pile with different surface roughness and temperatures. Ocean Eng. 2024, 292, 116469. [Google Scholar] [CrossRef] [Scilit]
- Wang, S.; Lei, X.; Meng, Q.; Xu, J.; Wang, M.; Guo, W. Model tests of single pile vertical cyclic loading in calcareous sand. Mar. Georesour. Geotechnol. 2021, 39, 670–681. [Google Scholar] [CrossRef] [Scilit]
- Wan, Z.; Liu, H.; Zhou, F.; Dai, G. Axial bearing mechanism of post-grouted piles in calcareous sand. Appl. Sci. 2022, 12, 2731. [Google Scholar] [CrossRef] [Scilit]
- Wan, Z.; Dai, G.; Gong, W. Study on the response of postside-grouted piles subjected to lateral loading in calcareous sand. Acta Geotech. 2022, 17, 3099–3115. [Google Scholar] [CrossRef] [Scilit]
- Wei, H.; Li, X.; Li, W.; Li, X.; Yang, M.; Chen, Y. Oblique tensile tests on model anchor piles in calcareous sand deposits. Ocean Eng. 2024, 291, 116285. [Google Scholar] [CrossRef] [Scilit]
- Peng, Y.; Yin, Z.-Y.; Yang, F.; Qu, L.; Ding, X. Analysis of the effect of breakable particle corners on uplift pile–soil interaction behaviors in calcareous sand. Acta Geotech. 2024, 19, 7307–7328. [Google Scholar] [CrossRef] [Scilit]
- Wang, Z.; Fang, X.; Li, Y.; Shen, C.; Hu, F.; Zhou, G. Investigation into pullout characteristics of root piles within coral sand foundations at varied relative compaction. Mar. Georesour. Geotechnol. 2024, 42, 1586–1601. [Google Scholar] [CrossRef] [Scilit]
- Chen, Y.; Yang, M.; Wei, H.-Z.; Li, W.-C.; Meng, Q.-S. Experimental study on axial tension response of model monopile in calcareous sand. Rock Soil Mech. 2018, 39, 2851–2857. (In Chinese) [Google Scholar]
- Fang, X.; Wang, Z.; Shen, C.; Chen, C.; Yao, Z. Study on the pullout bearing characteristics of root piles in coral sand foundations under different water content states. Appl. Ocean Res. 2024, 146, 103962. [Google Scholar] [CrossRef] [Scilit]
- Ouyang, H.; Dai, G.; Gong, W. Analysis of influencing factors of penetration mechanism and vertical bearing characteristics of monopile in calcareous sand: Laboratory model testing and in-situ testing. Soil Dyn. Earthq. Eng. 2024, 180, 108577. [Google Scholar] [CrossRef] [Scilit]
- Li, L.; Li, J.; Sun, D.; Zhang, L. Time-dependent bearing capacity of a jacked pile: An analytical approach based on effective stress method. Ocean Eng. 2017, 143, 177–185. [Google Scholar] [CrossRef] [Scilit]
- Cui, J.; Li, J.; Zhao, G. Long-term time-dependent load-settlement characteristics of a driven pile in clay. Comput. Geotech. 2019, 112, 41–50. [Google Scholar] [CrossRef] [Scilit]
- Zhou, P.; Li, J.; Li, L.; Liu, G.; Li, P. Investigation of the time-dependent bearing capacity of a jacked pile in saturated structured clays. Comput. Geotech. 2023, 161, 105599. [Google Scholar] [CrossRef] [Scilit]
- Yang, Y.; Tang, B.; Wang, Y.; Huang, X.; Yu, Z. Research on the time-dependent behavior of uplift piles in structured clay foundations in Zhanjiang Formation. Appl. Sci. 2025, 15, 3814. [Google Scholar] [CrossRef] [Scilit]
- Jiu, Y.-Z.; Zhang, X.-Y.; Zhu, Y.-Z.; Zhang, Z.; Tian, G.-H. Study on time effect of residual pressure and bearing characteristics of jacked pile in saturated silt foundation. Sci. Rep. 2022, 12, 20525. [Google Scholar] [CrossRef] [Scilit] [PubMed]
- Carroll, R.; Carotenuto, P.; Dano, C.; Salama, I.; Silva, M.; Rimoy, S.; Gavin, K.; Jardine, R. Field experiments at three sites to investigate the effects of age on steel piles driven in sand. Géotechnique 2020, 70, 469–489. [Google Scholar] [CrossRef] [Scilit]
- Manthey, S.; Vogt, S.; Cudmani, R.; Kidane, M. Experimental study on the time-dependent resistance of open-ended steel piles in sand. Geotechnics 2024, 4, 985–1006. [Google Scholar] [CrossRef] [Scilit]
- Qin, Y.; Meng, Q.; Wang, R.; Zhu, C. A study on bearing characteristics of single pile in calcareous sand based on model experiment. Rock Soil Mech. 2015, 36, 1714–1720. (In Chinese) [Google Scholar]
- Zhang, H.; Gao, R.; Luo, H.; Chen, P.; Liu, H. Study on the side friction resistance capacity of prefabricated pipe piles in coral reef strata. Front. Earth Sci. 2025, 12, 1481614. [Google Scholar] [CrossRef] [Scilit]
- Jiang, H.; Wang, R.; Lü, Y.-H.; Meng, Q. Test study of model pile in calcareous sands. Rock Soil Mech. 2010, 31, 780–784. (In Chinese) [Google Scholar]
- Paikowsky, S.G.; Player, C.M.; Connors, P.J. A dual interface apparatus for testing unrestricted friction of soil along solid surfaces. Geotech. Test. J. 1995, 18, 168–193. [Google Scholar] [CrossRef] [Scilit]
- JGJ 94-2008; Technical Code for Building Pile Foundations. China Architecture & Building Press: Beijing, China, 2008. (In Chinese)
- Lu, Y.; Li, S.; Ma, L.; Wang, Q.; He, C.; Bai, Y. Piles with different thicknesses and heights in backfill field considering time effect analysis of mechanical characteristics. Sci. Technol. Eng. 2022, 22, 9288–9295. (In Chinese) [Google Scholar]
- Liu, R.; Zhu, W.; Shi, Y.; Cao, Y.; Wei, L.; Sun, C.; Zheng, X. Unified gradation index (Sm) for shear mechanics and particle breakage at calcareous sand–structure interfaces. Sci. Rep. 2026, 16, 1131. [Google Scholar] [CrossRef] [Scilit] [PubMed]

Disclaimer/Publisher’s Note: The statements, opinions and data contained in all publications are solely those of the individual author(s) and contributor(s) and not of MDPI and/or the editor(s). MDPI and/or the editor(s) disclaim responsibility for any injury to people or property resulting from any ideas, methods, instructions or products referred to in the content. |
© 2026 by the authors. Licensee MDPI, Basel, Switzerland. This article is an open access article distributed under the terms and conditions of the Creative Commons Attribution (CC BY) license.