


Abstract
Accurate service life (SL) data for building components are a critical yet poorly constrained input for life cycle assessment (LCA). Reference service life (RSL) values published in national frameworks are typically derived from technical standards rather than empirical observation. This paper compares two independent, methodologically aligned empirical datasets for windows, heating systems, and roofs for Belgium and The Netherlands. SL distributions are estimated using Weibull survival analysis, selected with AICc model comparison, and differences between survival functions are assessed using a Bonferroni-corrected Log-Rank test. Estimates are benchmarked against Belgian and Dutch RSLs. Two sets of insights emerge. First, on SL estimates: robust cross-national divergence is found only for flat roofs, is sensitivity-dependent for windows and pitched roofs and could not be assessed for heating systems due to incompatible definitions across surveys. Second, on survey methodology: both datasets query a single renovation cycle, biasing SL estimates towards longer values, particularly for shorter-lived components, underscoring that definitional alignment and multi-cycle survey design are essential for valid cross-national comparison. Together with the empirical SL estimates, these methodological lessons, of broader relevance beyond the present datasets, provide practical input for LCA and renovation planning in Belgium and The Netherlands, and guide future survey-based SL research.
1. Introduction
For decades, the construction sector and the built environment have been identified as major consumers of natural resources and energy [1,2,3]. Greenhouse gas (GHG) emissions associated with material extraction, the manufacturing of construction products, and the construction and renovation of buildings are estimated to contribute approximately 5–12% of national GHG emissions in developed countries [4]. Additionally, this sector represents the largest source of local waste generation [5,6]. Driven by population and economic growth, the resource demand and environmental impact of the building sector are expected to increase significantly in the coming decades [7,8]. In response, increasing emphasis is being placed on a holistic evaluation of buildings’ environmental performance.
The European Standard EN 15978 [9] provides a methodological framework for assessing the environmental performance of buildings based on life cycle assessment (LCA). The standard distinguishes four life cycle stages: (1) the product stage, encompassing raw material extraction, transportation, and manufacturing; (2) the construction process stage, including transportation to the site, installation, and construction; (3) the use stage, comprising maintenance, repair, replacement, and refurbishment; and (4) the end-of-life stage, involving deconstruction, demolition, waste processing, and disposal.
A critical parameter within the LCA framework is this last stage, namely the service life of buildings and their constituent components. Former studies have indicated that variations in service life significantly influence life cycle embodied energy when the service life is extended [10,11]. In the international standard ISO 15686-1, service life (SL) is defined as the “period of time after installation during which a building or its parts meet or exceed performance requirements” [12]. Recent research emphasizes that building components are frequently replaced well before actual technical failure occurs. To address this, modern frameworks embrace a broader perspective that distinguishes between structural degradation and functional obsolescence, recognizing that a component’s lifecycle is often cut short by non-technical factors. Consequently, the contemporary definition of service life accounts for premature replacements driven by esthetic decay, changing occupant expectations, evolving regulatory standards, and energy-retrofit requirements within circular economy models [13,14]. However, empirical data on material flows during the use stage of the building remain scarce [15,16,17]. As a result, LCA studies often employ a Reference Service Life (RSL), which refers to the expected lifespan of a building or component under standardized in-use conditions [12]. Despite its usefulness, RSL data vary widely across sources, regions, and building types, limiting comparability [18,19,20]. Currently, there is no universally accepted consensus on the average service life of building materials or components [21,22,23]. Moreover, many studies and assessments still rely on generalized estimates of building-level service life, rather than evaluating the SL of individual elements. This approach assumes that buildings from the same construction era and geographic region use similar materials. However, buildings vary significantly in composition, geometry, structural design, and material specifications. Therefore, the SL must be assessed on a component-by-component basis [24]. A second common assumption is that all buildings of a given period follow uniform replacement cycles. Yet, buildings often undergo substantial changes in form, function, and occupancy over time—changes that may be as impactful as the original construction [25]. Furthermore, component service life is influenced by numerous factors, including material properties, design quality, workmanship, maintenance, environmental exposure, and even trends or users [22,26,27,28]. These complexities cast doubt on simple correlations between the age of a building or its components and their replacement timing.
Due to the complexity of the subject, the comparison of obtained service life is proved to be challenging [22]. The applied measure to express the service life in years varies, e.g., mean versus median. Additionally, the element to which the mentioned service life refers has not always the same level of detail, e.g., roof in general versus pitched and flat roof, roof in general versus roof materials such as concrete tiles, ceramic tiles, …. Even the method by which the service life is gathered causes differences in results, e.g., via empirical studies versus technical standards versus prediction [29]. Therefore, a general consensus about the service life of a specific building element is missing.
Potrč et al. identify three principal approaches to estimating component RSL [18]:
- Engineering-based assessment, which evaluates the physical durability of materials under mechanical and environmental loads.
- The factor method, formalized in ISO 15686-1, adjusts an RSL based on seven modifiers: component quality (A), design level (B), execution quality (C), indoor environment (D), outdoor environment (E), in-use conditions (F), and maintenance level (G). Applications of this method have been demonstrated in several studies [16,26].
- Empirical observation, which uses real-world data on component performance and longevity. These studies based on sampling tend to provide more realistic results [23]. While highly accurate, this method is also data-intensive and often limited to specific components or regions [30,31].
In this paper, two independent, yet methodologically aligned, empirical observations of the SLs for three key residential building elements (windows, heating systems, and roofs) are compared for the context of Belgium and The Netherlands, addressing the following research questions:
- Do the SLs of different building elements significantly differ within a specific country?
- Does the service life of a given building element vary across countries?
- How do empirically observed service lives compare to the RSLs commonly used in each country?
By comparing the obtained SL of an empirical study with the SL of a similar observational study, our understanding of SL in general and of the empirical observation methodology will be enhanced. The findings offer practical implications for improving the accuracy of LCA calculations and contribute to more reliable forecasting in renovation and replacement planning. Moreover, the outcome supports the development of evidence-based environmental policies by critically assessing the alignment between empirical data and theoretical benchmarks. Finally, this paper provides a significant contribution to the academic field by simultaneously testing long-standing assumptions across multiple building elements and national contexts.
2. Materials and Methods
In theory, the SL refers to the period of time between construction and the end of delivering the acceptable minimum requirements. In practice, a replacement or renovation of a building element is recognized as the end of the element’s SL. Recently, reuse of building elements is increasingly stimulated, either as a whole or as parts for another product. However, the reuse of building elements is still low [32], and the potential is difficult to interpret and could be even misleading [33]. In this paper, the SL corresponds to the number of years between the installation of a building element and its replacement, regardless of the reason for it or regardless of the functionality or performance of the element. Therefore, in this paper the terms “service life”, “life span” and “lifetime” of building elements are considered to be equivalent. So, possible reuse is not taken into consideration.
In this paper, two independent datasets of SL of windows, heating systems, and roofs are compared. An empirical study among Belgian homeowners (1) performed by Essencia Marketing is the main subject, further referred to as EMS [34]. A second source is a similar study among Dutch homeowners (2) owned by Bouwkennis, further referred to as BKS [35].
2.1. Essencia Marketing Survey (EMS)
Essencia Marketing, a marketing agency specialized in the construction sector, yearly executes an online survey among homeowners to quantify and specify the construction materials used during the service life of buildings. Since 2012, the Essencia marketing survey has been launched every year in mid-December, questioning the respondents on their renovation activity between 1/1/xxxx and 31/12/xxxx. Yearly, approximately 4500 respondents—selected to be representative of the Belgian population in terms of age, region, and education—are invited to participate, sharing information on their living situation (e.g., region, type of dwelling, building period, ownership, …) and renovation activities undertaken during the preceding year. Specific groups, such as tenants, apartment owners, and owners of houses built within the last five years, are excluded to ensure data relevance. The Essencia Marketing survey examines 22 distinct renovation activities, classified into three categories: Structural (e.g., roof), Energy-related (e.g., window and heating system) and Other (e.g., electricity). Activities related to decoration or finishing are excluded from the analysis [36]. Since the Essencia Marketing survey questions whether the renovation work is permitted or not, a validation check of the dataset is enabled. The ‘official’ renovation rate in Belgium of 0.74% for renovations with a building permit, as outlined in the Renovation Pact, is reconstructed with the Essencia data, enhancing its reliability [37].
The survey instrument developed by Essencia Marketing Services (EMS) is centered on renovation activity carried out within a given reference year. To facilitate the analysis of service life, the 2023 and 2024 survey waves additionally queried respondents regarding a prior replacement or reinstallation of four building elements: windows, central heating systems, heating distribution elements, and roof covering. For each element, respondents were presented with four response options: (1) specifying the year of one replacement or reinstallation; (2) indicating that, to their knowledge, no prior replacement had taken place; (3) acknowledging that a replacement had occurred but that the precise timing was unknown; or (4) declaring ignorance of the element’s replacement history. To enhance the reliability of this research on SL, responses of type 3 and 4 are not further included in this study.
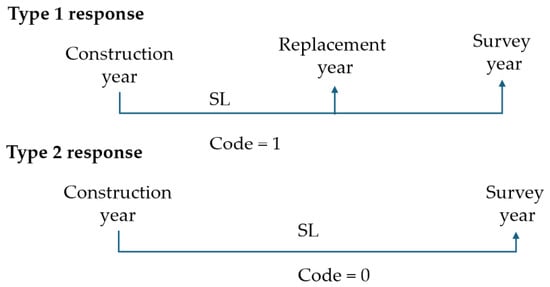
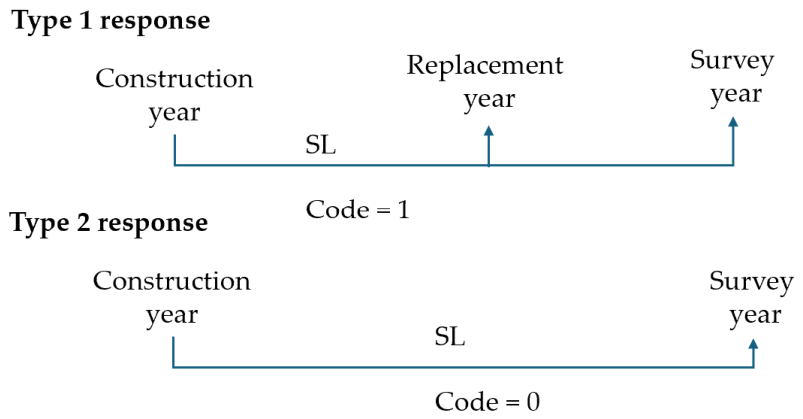
For the study of the Belgian context, the data from 2023 and 2024 are used. The outcome of interest is the SL of the specified building elements. This SL is calculated for building elements that are replaced (response type 1) and for buildings that are not replaced (response type 2). For response type 1, the service life is obtained by calculating the renovation year minus the installation year. The installation year is equal to the construction year of the building since only one replacement cycle is indicated. Since the event (the replacement) took place, responses of type 1 are coded “1”. For response type 2, the ongoing service life is calculated as the construction year of the building minus the survey year. Since the building element is still in service, this response type is therefore censored and coded “0”. For approximately 11% of the respondents that was not able to indicate a precise year of construction, the construction of the building is asked in periods of 10 years, and the middle value is retained as the construction year. Respondents who were not able to mention the construction period of their property are screened out. Service lives exceeding 100 years are seen as unrealistic and are therefore omitted.
A graphical presentation of the calculation of SL is given in Figure 1.
Figure 1.
Graphical presentation of the calculation of service life.
When combined with general dwelling characteristics collected elsewhere in the survey, notably construction year or period and roof type, these retrospective items permit the calculation of service life for the building elements concerned. Three methodological constraints, however, circumscribe the resulting estimates.
- Only one former replacement is questioned, meaning that elements subject to multiple replacement cycles over their service history cannot be fully reconstructed.
- The renovation activity questioned relates to replacements as well as additional installations (e.g., when extra living space is constructed).
- Extra information on material, technical performance, brand, … is asked for the newly installed materials. Details of the old, replaced material are absent.
For the period 2023–2024, a total of 4894 questionnaires were obtained, of which 4521 could identify the building period of their property. In 2096 of the residences, the windows were replaced; 1858 of the respondents were censored, indicating that no replacement took place. Additionally, 1929 provided information on heating production and 1366 were coded “0”, while for heating distribution, 1459 reported a replacement and 1918 did not. Regarding roofs, 1112 respondents indicated a roof renovation, while 2295 did not have one.
2.2. Bouwkennis Survey (BKS)
Bouwkennis, a construction-focused marketing agency in The Netherlands, conducts yearly online research among Dutch households to question the performed renovation activities. A database with data on detailed renovations between January 2023 and March 2024 was handed over by BKS to the author. For that period, a total of 4344 respondents were obtained. After excluding apartment inhabitants and tenants, 2721 respondents were retained who also indicated the building period of their property.
Likewise, in the Belgian study, the SL is obtained by calculating the renovation year minus the installation year. The installation year is equal to the construction year of the building when no replacement is indicated. Since the installation year is questioned in categories, the middle value is retained as the installation year. Unfortunately, the emphasis of the Dutch survey lies on recent renovations; therefore, the oldest category refers to “before 2010”, with no further details given. This category has a substantial share for roofs (38%) and windows (34%). For heating systems, it only accounts for 16%. In order not to lose the responses of the category “before 2010”, the SL for this category is obtained by calculating the average of the known SL of each building element per building period of 20 years, thereby replacing the unknown SL “before 2010”. For example, for buildings constructed between 1951 and 1970, the average of the given SL for windows is 56 years. Therefore, for windows with responses indicating a replacement before 2010 and being built between 1951 and 1970, an SL of 56 years is computed. This cohort-mean substitution assigns a representative duration to the group of censored “before 2010” cases within a given construction period; it is not intended to reconstruct the exact calendar year of an individual replacement. To investigate the effect of this calculation method, a sensitivity analysis is performed in Section 4.3, comparing the main BKS calculation against two alternative treatments of the “before 2010” category, carried through both the internal Dutch comparisons and the Belgium-Netherlands cross-country comparisons reported in Section 3. The evaluation is based on the Log-Rank test, with Bonferroni-corrected p-values.
- (1)
- A first alternative calculation, referred to as BKS1_2005, assumes an overall renovation year of 2005. The SL is calculated as the building year minus the renovation year of 2005.
- (2)
- In a second alternative calculation, referred to as BKS2_before 2010 excl, the SL is calculated by omitting the response category “before 2010”, resulting in fewer observed renovations.
Similar to the Belgian study, replacements are coded “1” and non-replacements are coded “0”. In 1394 cases, the windows were replaced, while for 1289 cases no replacement took place. A total of 871 respondents reported a roof renovation, while 1672 did not. The heating system was renewed in 2011 cases, and 581 were coded “0”. Additionally, no calculation of SL was made for respondents who did not know whether the building element had been replaced or who could not indicate the replacement year. SL values exceeding 100 years are considered unrealistic and are therefore omitted.
An overview of the two studies, their resemblance and their differences, is shown in Table 1.
Table 1.
Overview of the 2 empirical studies.
After screening the questionnaires and datasets of EMS and BKM, we conclude that both studies are similar, but 2 major differences need special attention in the analysis, namely the grouping of the renovation year “before 2010” and the non-separation of the heating system in BKS. Nevertheless, to elaborate our knowledge on SL, an attempt to compare the obtained SL of the two independent studies is relevant.
2.3. Statistical Methods
The SL of the selected building components is evaluated through the Survival analysis platform in JMP [38]. This method produces survival curves, which graphically represent the probability of an element not having been replaced over time (code = 0), thus offering insights into the patterns of replacement (i.e., absence of an observed replacement event) of building components. Following the operational definition of service life adopted in this study, “survival” refers strictly to the absence of an observed replacement event and does not imply that the component remained functional, esthetically acceptable, or in continuous use up to that point. A comparative goodness-of-fit assessment across multiple candidate distributions (normal, lognormal, logistic, loglogistic, Weibull, SEV and Frechet) was followed, with model selection guided by the corrected Akaike Information Criterion (AICc). For each building component, the candidate lifetime distributions were ranked by the corrected Akaike Information Criterion (AICc), and relative support was quantified following the conventional thresholds proposed by Burnham and Anderson [39,40], where a ΔAICc below 2 indicates comparable support between models and a ΔAICc above 10 indicates essentially no support for the alternative model relative to the best-supported one. Across all nine components examined, the (threshold) Weibull distribution obtained the lowest AICc and carried the highest Akaike weight (range 0.78 to 1.00), with the second-best candidate distribution trailing by ΔAICc ≥ 2.81 in every case. Therefore, the Weibull distribution, originally developed to model material fatigue and failure times in engineering systems [41,42], can also be seen as the reference model for SL estimation across the building components examined in this study.
From the fitted model, JMP Pro (version 17) derives key SL metrics including percentile estimates, median life, and associated confidence intervals, enabling probabilistic statements about component or system longevity. Although survival analysis has been predominantly applied in biomedical research [43] and, more recently, in economic and actuarial studies [44], it has proven equally applicable in the built environment for evaluating the longevity of construction elements [45]. The survival analysis facilitates the understanding of empirical data on the absence of observed replacement events for building elements, especially in long-term observational or survey-based studies.
In this study, the service life analysis is applied to the two empirical datasets from distinct national contexts, Belgium and The Netherlands. Each building component (windows, heating systems, roofs) is analyzed independently. For each, survival times are reported at the 25th, 50th, and 75th percentiles, representing the time at which 25%, 50%, and 75% of the components have been replaced, respectively. The resulting survival curves illustrate the cumulative proportion of components that remain unreplaced (in situ) over a given time span. In this context, “survival” denotes the absence of an observed replacement event, not continued functional performance. Consequently, the curves reflect the increasing probability of renovation or replacement with aging components. This form of survival analysis is particularly valuable for life cycle assessment, building maintenance planning, and policy development related to sustainability and resource efficiency in the construction sector.
To assess the statistical significance of differences in survival distributions between different building elements within the same country or between countries considering the same building element, the Log-Rank test is employed. The Log-Rank test is appropriate for detecting differences in the survival curves and is widely used in engineering reliability studies [46]. A critical limitation, however, is that the Log-Rank test indicates whether survival between two groups is significantly different, but does not indicate how different they are. Additionally, the resulting p-values were corrected for multiple testing using the Bonferroni method (p_adjusted = min(p_raw × 4, 1) and compared against α = 0.05 [47]. All comparisons that were statistically significant before correction remained significant afterwards, indicating that the reported differences in survival distributions are robust to correction for multiple testing. For the extended BKS analysis reported in Section 4.3, in which each of the four building elements is compared between EMS and three alternative treatments of the Dutch “before 2010” category, a separate correction family of m = 12 tests is defined (p_adjusted = min(p_raw × 12, 1)), kept distinct from the m = 8 family used for the internal BKS sensitivity comparisons.
Besides the cross-country comparison, a confrontation with the respective published RSL is performed. To support the industry with the calculation of the environmental impact of their products, in most countries a uniform method based on European legislation is provided. In this paper, the information on the RSL of the two principal institutions for Belgium and The Netherlands is used. An overview is given in Table 2.
Table 2.
Overview of RSL (in y) for Belgium and The Netherlands per building element.
- For Belgium, TOTEM, Tool to Optimize the Total Environmental Impact of Materials, is a tool developed by the 3 regional governments to evaluate and optimize the ecological footprint of buildings, so far on a voluntary basis [48]. This tool measures the environmental impact for various environmental impact indicators through LCA, in line with European standards for LCA of building materials and constructions (EN15804+A2, EN 15978, EN 15643 and EN 15941). Based on environmental background data (i.e., generic or manufacturer-specific), predefined scenarios, and building definition, the impact of the whole building is calculated over a reference study period of 60 years. This implies that the operational energy use, maintenance and replacement cycles are considered over 60 years [49].
- For The Netherlands, calculating environmental performance is mandatory in civil and utility construction according to the Building Decree. The method is described in the Environmental Performance Assessment Method for Construction Works, a standardized measurement method based on the European standard EN 15804. The results are gathered in the Dutch Environmental Database (Nationale Milieudatabank or NMD in short) [50]. This database consists of environmental declarations that contain general information about products, including name, service life and functional unit. They also contain environmental information that has been obtained via an LCA.
The published RSL of the discussed building elements are given at a more detailed level by material, application, or type, without providing a general SL. A substantial difference between the levels is noted.
2.4. Declaration on the Use of Generative Artificial Intelligence Tools
During the preparation of this paper, the authors used Claude Sonnet 4.6 to enhance the readability and language of the manuscript, to ensure compliance with English spelling and grammar and to support the interpretation and discussion of statistical results. The authors have reviewed and validated the output and take full responsibility for the published research findings.
3. Results
For each building element, survival times are reported at the 25th, 50th, and 75th percentiles and this is done for the Belgian (EMS) and the Dutch context (BKS). Confidence intervals (CI) are reported for each estimate. Survival curves are provided for each building element.
3.1. Windows
The estimated service life distributions for windows are presented in Table 3 and graphically shown in Figure 2. In Belgium, 25% of windows are replaced within 35 years of installation; in The Netherlands, this threshold is reached after 38 years. Median SLs, the point at which 50% of windows have been replaced, are 49 years for Belgium and 52 years for The Netherlands. At the upper end of the distribution, 25% of windows remain unreplaced after 64 years in Belgium and after 67 years in The Netherlands.
Table 3.
Survival times for windows for Belgium and The Netherlands.
Figure 2.
Survival curves of windows for EMS and BKS.
Compared to EMS, BKS produces consistently higher estimates, with no overlap in confidence intervals relative to EMS. This divergence is confirmed by the Log-Rank test, which indicates a statistically significant difference between the survival functions of BKS and those of EMS (p < 0.001, Bonferroni-corrected p < 0.001). However, in a practical application, e.g., LCA calculation or a real-life situation, the three-year difference between the Belgian and the Dutch context is negligible.
Table 4 shows that both TOTEM and NMD report material-specific RSLs for windows rather than a single element-level value, a differentiation corroborated by the broader literature [30,51,52]. NMD even distinguishes wooden window frames in ‘wood’ and ‘hardwood’, which leads to a substantial difference in RSL. Consistent with published sources, aluminum windows are assigned longer RSLs than wood or PVC frames. Since window material was not captured as a variable in either survey, no direct comparison is possible. However, it is noticed that the lower boundary corresponds well with RSL for wood and PVC, and the upper boundaries are similar to the RSL of aluminum windows in Belgium and of aluminum and hardwood windows in The Netherlands. The empirical component-level estimates fall within or overlap the broad ranges spanned by material-specific national RSL values; however, because window material was not recorded, direct material-matched validation of the RSL values is not possible.
Table 4.
Reference service life for windows in Belgium (TOTEM) and The Netherlands (NMD).
3.2. Heating Systems
Considering heating systems, both national institutions distinguish heating production and heating distribution by reporting very different RSLs (Table 5).
Table 5.
Reference service life for heating systems divided into production and distribution for Belgium and The Netherlands.
Further analysis shows that heating systems are typically composed of three main components—heat distribution (e.g., radiators or piping), heat production (e.g., boilers or heat pumps), and fuel storage—each of which is often assigned a different RSL [29]. TOTEM estimates a service life of 20 years for production equipment and 60 years for distribution systems. NMD reports 15 to 25 years for heating production elements and 35 to 50 years for heating distribution purposes. Another source, the ASHRAE database, which is an empirical, international industry-developed source, also distinguishes various components of heating systems, including heating units, heat pumps, cooling pumps, and control systems [53]. For boiler-based systems, ASHRAE reports a median RSL ranging from 18.5 to 25 years, with heat exchangers replaced, on average, between 17 and 51.5 years. These findings underscore the importance of clearly defining the components considered in both empirical studies and reference sources.
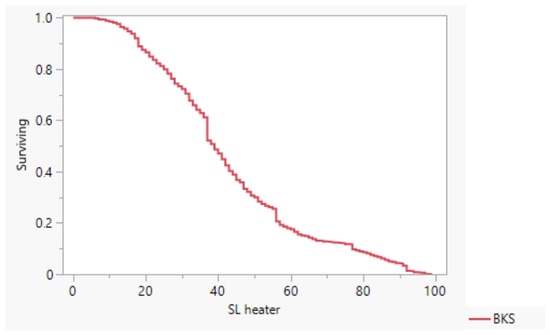
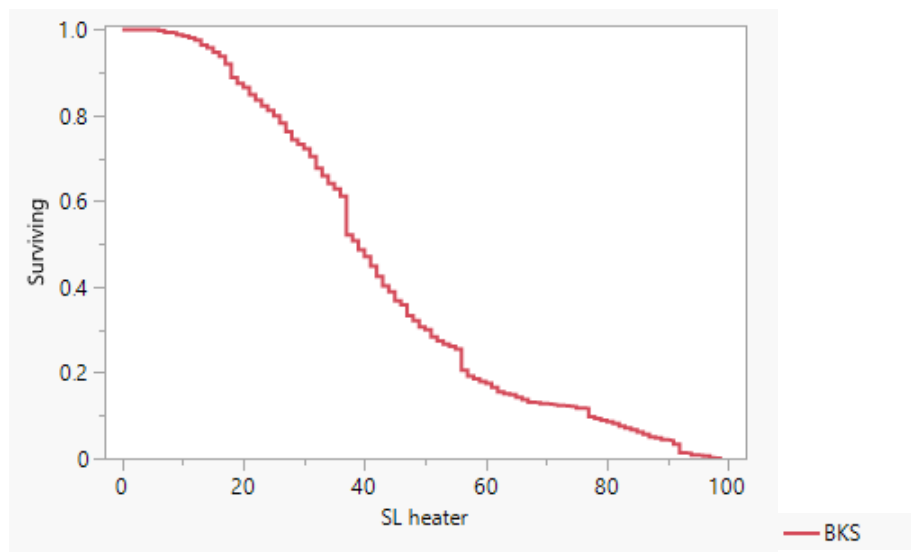
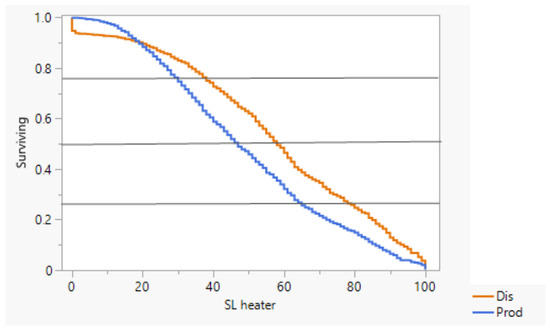
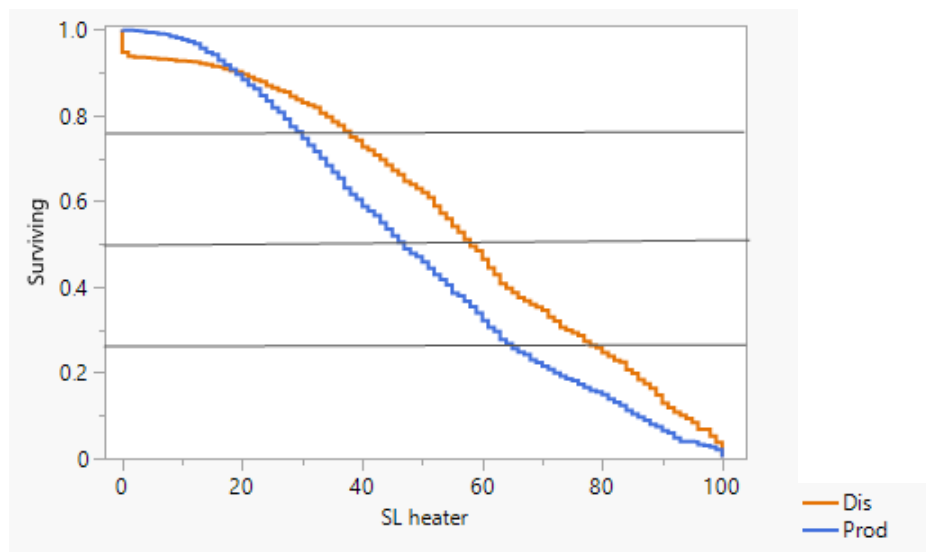
Benchmarking the nationally published RSLs with the empirical findings in Table 6 proves challenging due to a lack of uniform definitions. In the EMS, respondents were asked separately about the heat production system, e.g., boiler or heat pump (EMSP), and about the heating distribution elements, such as radiators (EMSD), though piping was excluded. No distinction was made between boilers and heat pumps within the production category. By contrast, the BKS asked respondents generally about ‘the heater’ without further specification, leaving the component boundary open to individual interpretation. A graphical presentation of the survival curves are shown in Figure 3 and Figure 4.
Table 6.
Survival times for heating production (EMSP) and heating distribution (EMSD) for Belgium and heating systems for The Netherlands (BKS).
Figure 3.
Survival curves of heating systems in general for The Netherlands.
Figure 4.
Survival curves of heating production and heating distribution for Belgium.
As with the published RSLs of TOTEM, the Belgian empirical results report a substantial difference in service life between heating production and distribution components, with distribution elements exhibiting a longer service life. However, this is where the correspondence between RSL benchmarks and empirical findings for Belgium ends. Whereas TOTEM prescribes an RSL of 20 years for the heating production component, the empirical evidence indicates that in practice these components remain unreplaced considerably longer, with only 25% replaced before 31 years and 25% still unreplaced after 66 years. The empirical findings for heating distribution elements align more closely with the RSL of more than 60 years, as the median survival time for EMSD indicates that 50% of components are replaced after 59 years and still 25% remain unreplaced even after 80 years. This distributional spread likely reflects the considerable heterogeneity within this component category; for instance, the material durability and replacement drivers of a radiator element differ substantially from those of an underfloor heating distribution system, which is embedded in the floor.
For The Netherlands, the NMD reference database specifies an RSL of 15 to 25 years for heating production and 35 to 50 years for distribution, depending on different systems. As the BKS study recorded heating system replacement as a single, undifferentiated event, direct comparison with component-level RSL benchmarks is methodologically problematic. Furthermore, cross-national comparison with the Belgian results is precluded by this definitional incompatibility, as the Dutch survival times are much lower than the Belgian EMSP and EMSD estimates. Consequently, due to the absence of a clear component-level definition, the BKS data do not substantively contribute to the empirical evidence base on service lives of heating systems.
3.3. Roof
Table 7 shows that both TOTEM and NMD report markedly different RSLs for pitched and flat roofs. Typically, pitched roofs are estimated to last over 50 years, whereas flat roofs generally have a lifespan ranging from 30 to 50 years. The differences provided by NMD are related to different roof materials (e.g., clay tiles are acknowledged with longer RSL than concrete tiles). In the literature, similar life spans are found for pitched and flat roofs, in a European but also international context [25,51,52].
Table 7.
Reference service life for roofs for Belgium and The Netherlands.
Given the differences per type of roof in existing literature, the same detailed analysis was performed for the Belgian and Dutch data and is shown in Table 8 and Table 9 for the survival times and in Figure 5 and Figure 6 for the survival curves.
Table 8.
Survival times for pitched roofs for Belgium and The Netherlands.
Table 9.
Survival times for flat roofs in Belgium and The Netherlands.
Figure 5.
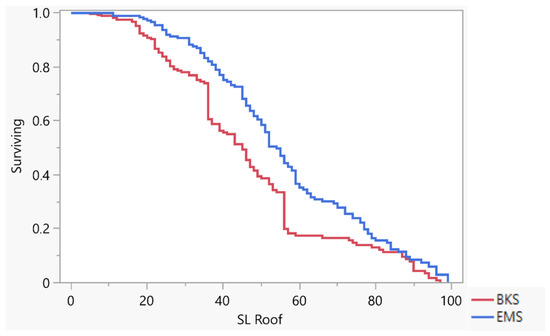
Survival curves of pitched roofs for Belgium and The Netherlands.
Figure 6.
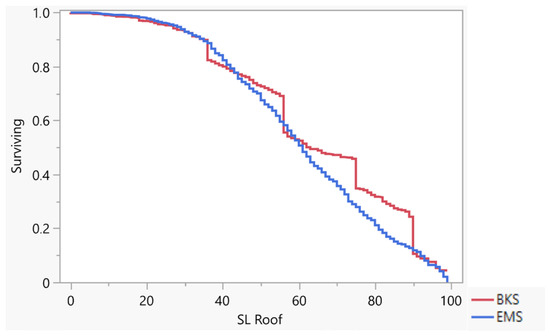
Survival curves of flat roofs for Belgium and The Netherlands.
The national institutions commonly report RSL for pitched roofs in the range of 50 to 100 years, depending on the covering material. The empirical median and third quantile estimates fall within this broad range; however, because roof-covering material was not recorded in either survey, direct material-matched validation is not possible. Median SL for pitched roofs is 61 years for EMS and 64 years for BKS, a 3-year difference; the confidence intervals for the median narrowly fail to overlap ([60–62] vs. [63–66]). Cross-country comparisons by the Log-rank test reveal a statistically significant difference in the survival functions between BKS and EMS (p = 0.004). Even with the Bonferroni correction, the significance remains (p = 0.0144).
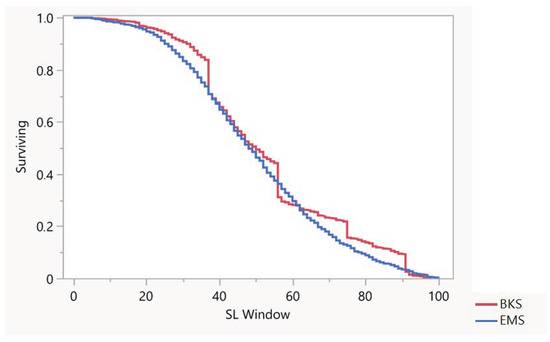
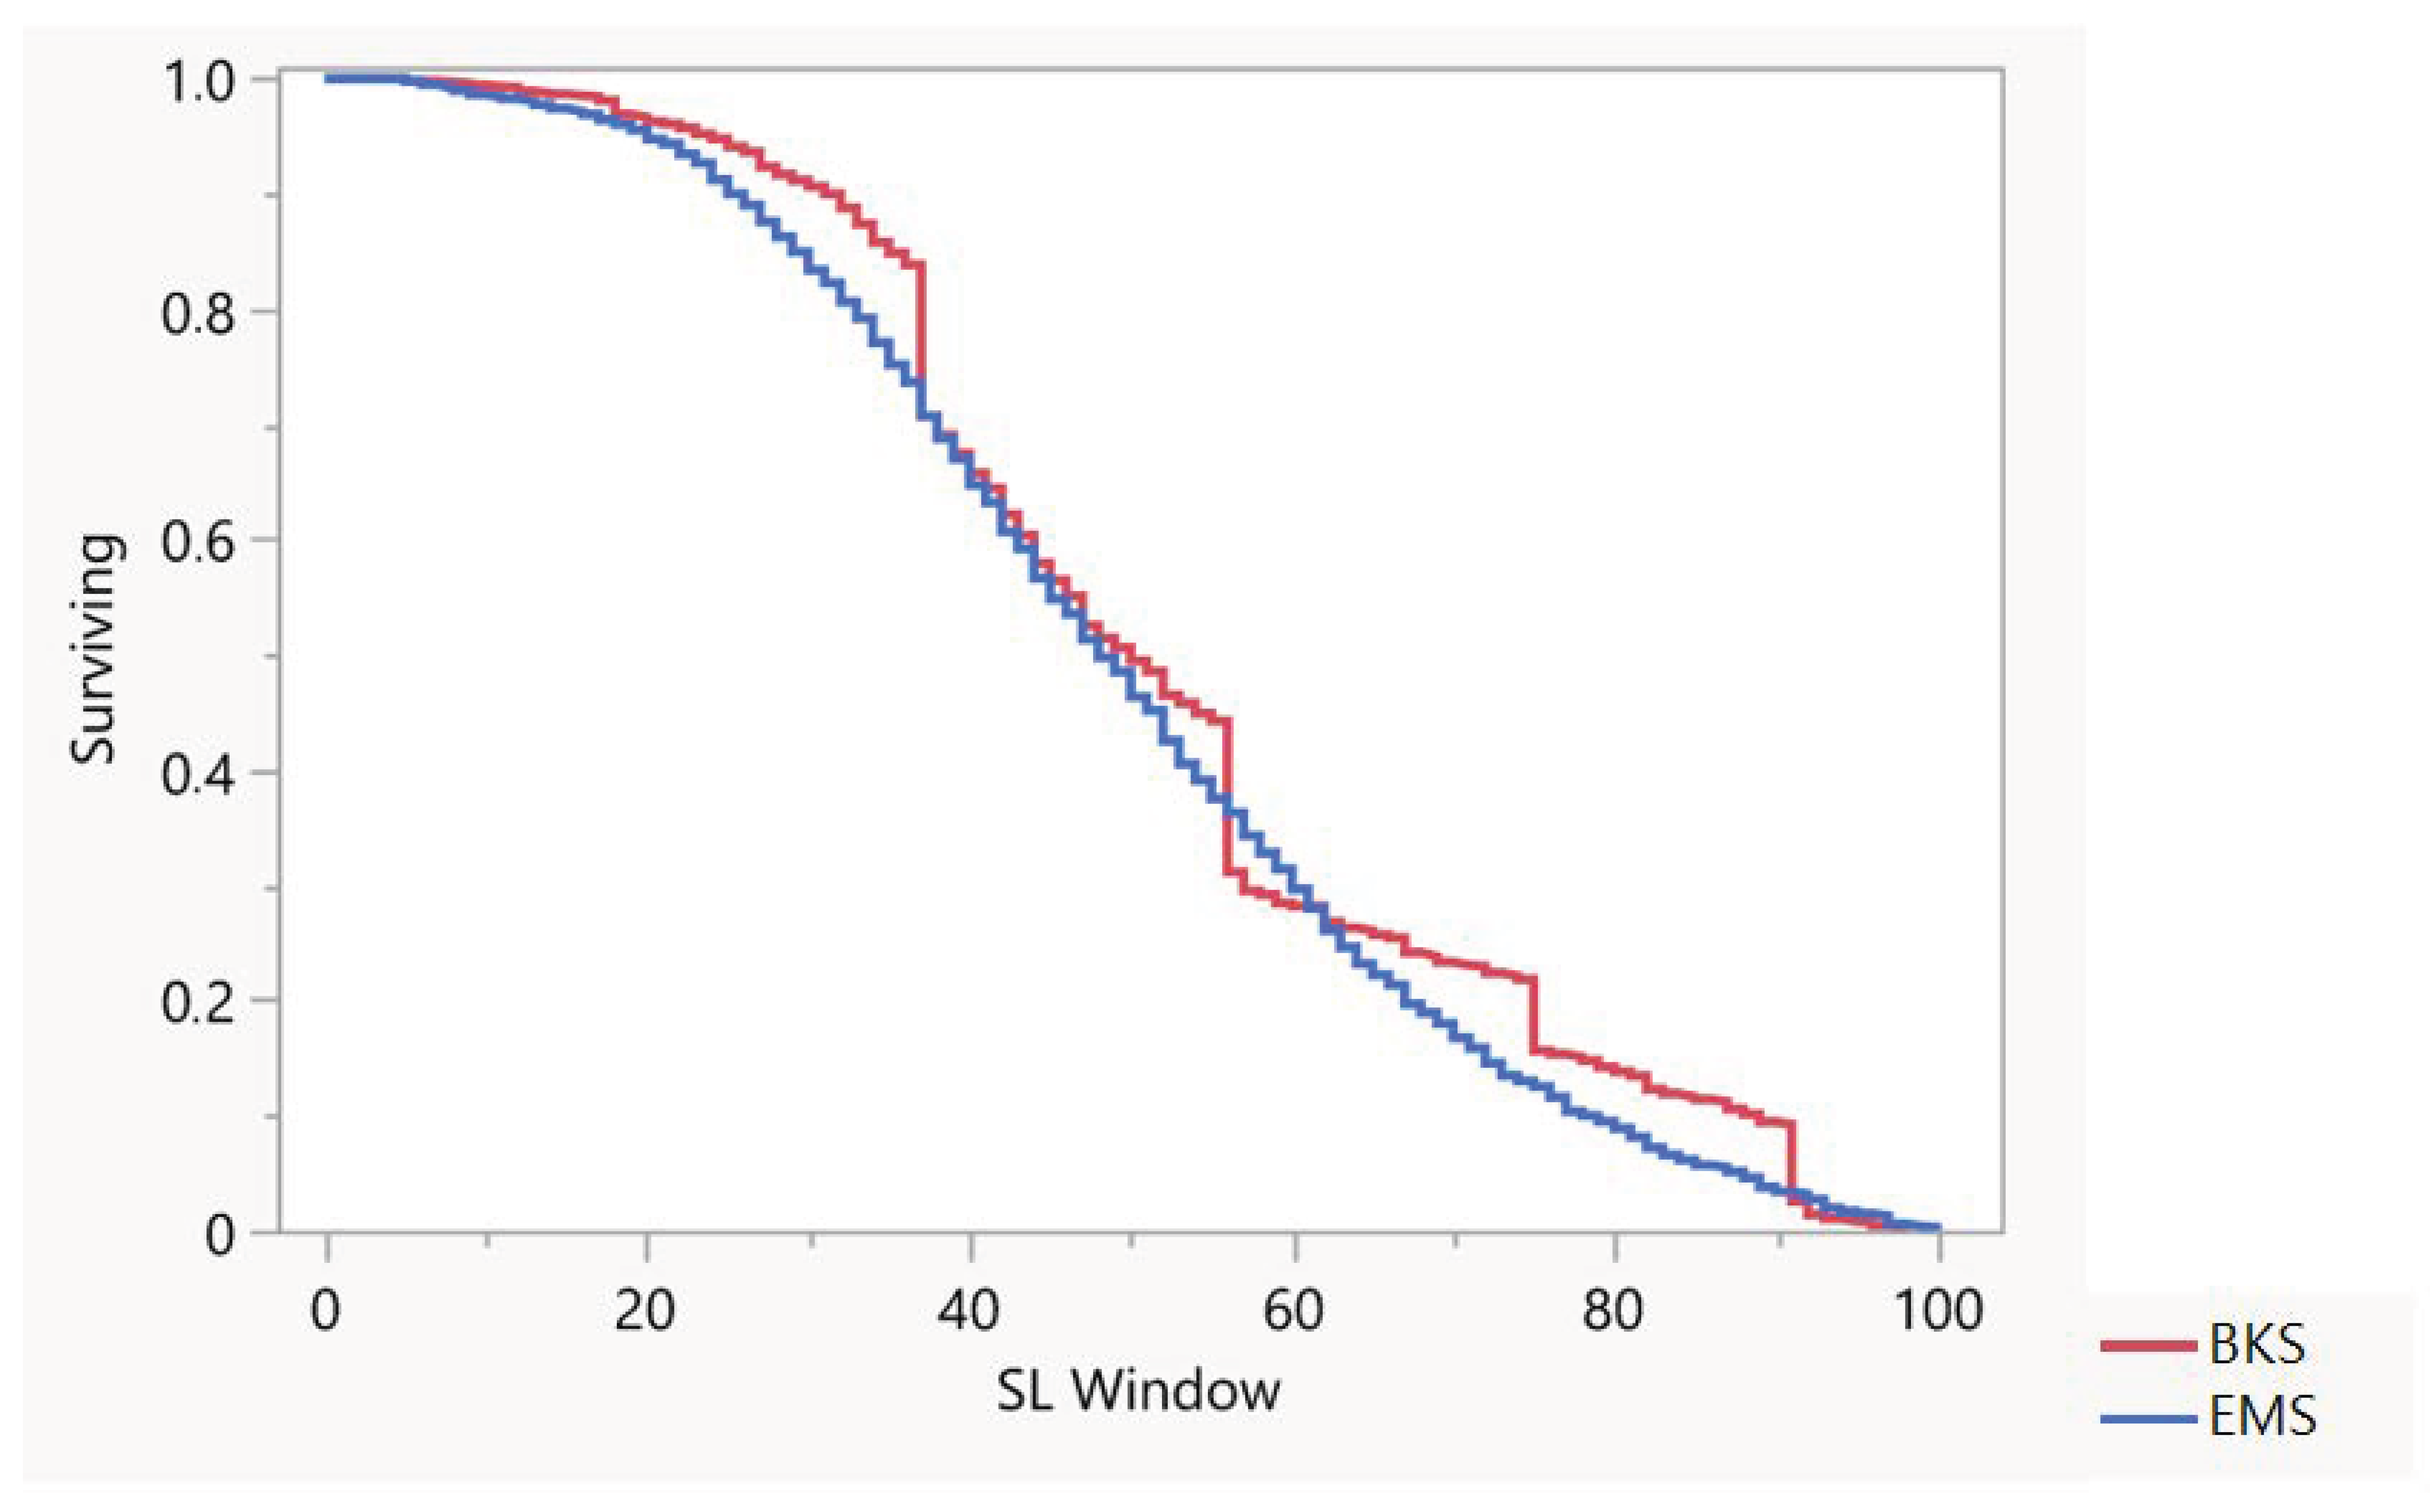
For flat roofs, the Belgian TOTEM set the RSL at 30 years, substantially below the empirically observed median of 56 years and the 75th percentile of 72 years. In The Netherlands, the RSL ranges from 30 to 50 years, corresponding to the first and second quantiles of BKS. However, 25% of the flat roof covering is still not replaced after 61 years. The Log-rank test shows a significant difference between the Belgian and Dutch results, with BKS and EMS p = 0.0003. After the Bonferroni correction, the difference remains significant (p = 0.0012).
3.4. Windows, Heating Systems and Roofs in Belgium
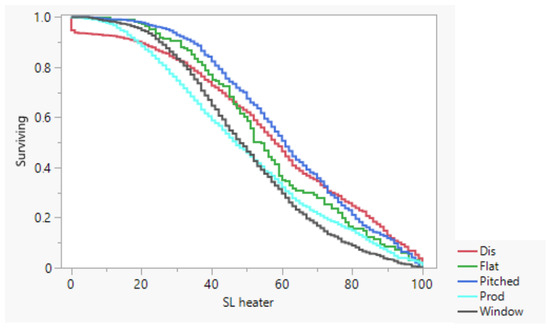
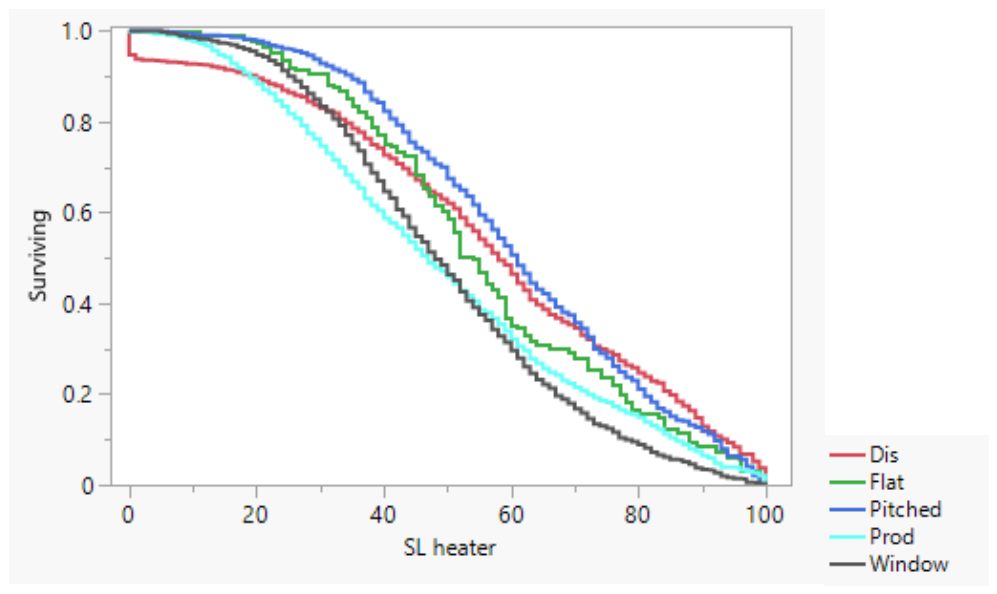
To address the first research question, the SL estimates for all three building elements, with details where possible, are compared within the Belgian context (Table 10, Figure 7). Visual inspection of the survival curves already suggests that all distributions differ substantially. The confidence intervals only show overlap across heating distribution and flat roof for the first and second quantiles. This is supported by the Log-Rank test indicating no significant difference in survival function between these building elements, with p = 0.3943. All other survival functions tested significantly different from each other. This result corroborates prior studies arguing that the uniform assignment of a single service life value to an entire building introduces systematic errors into LCA calculations, underscoring the importance of disaggregated, component-level service life estimation [19]. Furthermore, detailing within one building element is advised, such as pitched and flat roofs or heating production and heating distribution.
Table 10.
Survival times and confidence intervals for window (1), heating production (2), heating distribution (3), pitched (4) and flat roof (5) for Belgium.
Figure 7.
Survival curves of building elements for Belgium: Window, heating production (Prod), heating distribution (Dis), pitched roof (Pitched) and flat roof (Flat).
4. Discussion
4.1. Importance of Materials
A fundamental finding that emerges from the present cross-national study is that the SL of a building component cannot be reduced to a single, element-level average. Both the Belgian and Dutch reference frameworks already acknowledge this by publishing RSLs at the level of the material rather than the element alone. The absence of material data in the present surveys constitutes a notable limitation. However, some LCA calculations refer to a general SL since no further information on the material used is available. Nevertheless, this study indicates the importance of materials in future survey instruments. Such information would enable stratified survival analyses that map more naturally onto the material-specific RSL values used in LCA tools such as TOTEM and NMD.
4.2. Correspondence of RSLs with Empirical Results
The present study demonstrates that, for windows and pitched roofs, the empirical SL estimates fall within the broad ranges of RSLs published by TOTEM and NMD. Because material type was not recorded in either survey, however, this indicates overlap rather than validation of the RSL values; incorporation of material data in future survey design would be required to test this alignment directly.
For heating systems, however, this correspondence is less evident. Data from the EMS, which distinguishes between heat production and heat distribution components, indicate that installations exhibit considerably longer service lives than those specified in the RSLs. In the case of The Netherlands, a direct comparison is precluded by ambiguities in definitional boundaries. Nevertheless, empirical evidence from both countries consistently shows that heating systems remain unreplaced beyond their prescribed RSLs. This does not necessarily indicate that the installations continue to function at their original performance level. Rather, it reflects the absence of an observed replacement event, and questions arise regarding their ongoing thermal efficiency over time. It would therefore be premature to conclude that RSLs for heating systems should be revised upward without first obtaining more granular longitudinal data on efficiency degradation across the service life. Moreover, since both studies query only a single replacement cycle, the obtained SL estimates may appear longer than they actually are. This risk is particularly relevant for components with life cycles of around 20 years, where an earlier replacement could easily be overlooked by respondents. In addition, replacing a heat production system is a relatively straightforward undertaking. The outcome of these SL estimates may therefore be biased towards longer values, particularly for older buildings.
A comparable pattern is observed for flat roofs, where service lives recorded in both Belgium and The Netherlands systematically exceed the corresponding RSLs. In this instance, however, concerns about performance loss are less salient: if a flat roof covering had failed functionally, replacement would in all likelihood have been undertaken. Likewise, the heating production system, as well as a flat roof covering, is easily replaceable. Therefore, an additional replacement cycle could be missed since only one renovation is questioned. On this basis, no comment can be given on the national RSL, but additional research needs to include multiple renovation cycles.
4.3. Influence of Calculation Methods on Empirical SL Estimates
A distinctive methodological challenge encountered in the Dutch dataset is the truncation of historical renovation data at the year 2010. Respondents who indicated that their last replacement occurred before 2010 could not specify a precise year, which precluded direct calculation of the service life for a substantial share of the sample: 34% of window observations, 38% of roof observations, and 16% of heating system observations fell into this open-ended category. To address this, BKS replaces the unknown service life values with the cohort-specific mean SL calculated from observations where the replacement year is known, stratified by construction period. This approach captures the central tendency of replacement behavior within each construction era. However, mean imputation artificially reduces the variation in the dataset. Secondly, single imputation procedures commonly result in p-values that are too small, meaning that the precision of study associations is systematically overestimated [54,55].
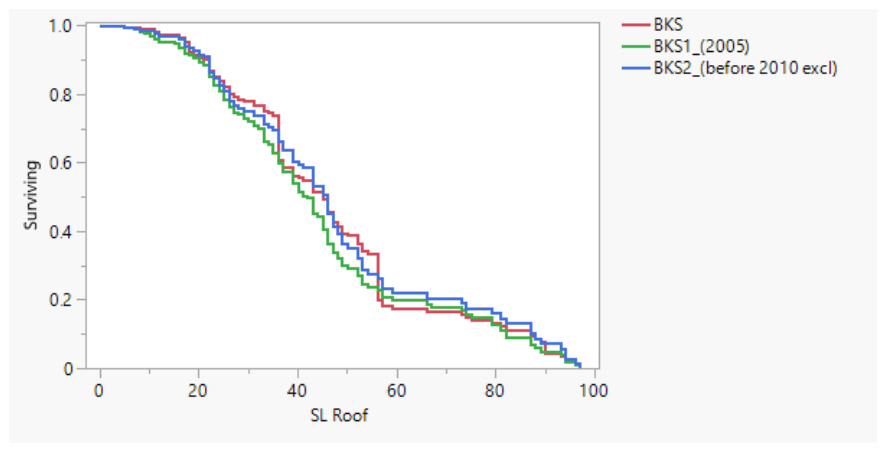
To capture the uncertainty introduced by mean imputation, two distinct sensitivity calculations were performed, namely BKS1_2005 and BKS2_before 2010 excl. In BKS1_2005, every “before 2010” response was replaced by a fixed replacement year of 2005. In BKS2_before 2010 excl., such responses were omitted entirely, resulting in a lower response rate. An overview of the obtained SL estimates and the number of replacements is provided in Table 11. A graphical presentation of the SL can be found in Appendix A.
Table 11.
Survival times for The Netherlands according to calculation method, BKS (average SL); BKS1_2005 and BKS2_before 2010 excl.
As a sensitivity analysis, survival distributions for the main dataset (BKS), which imputes “before 2010” responses using the average replacement year per building period, were compared against the two alternative panels for each building component using the Log-Rank test. Because all eight resulting comparisons shared the common BKS reference dataset, the resulting p-values were corrected for multiple testing using the Bonferroni method (p_adjusted = min(p_raw × 8, 1) and compared against α = 0.05.
After correction, the fixed-year imputation (BKS1_2005) produces systematically shorter median SL estimates than BKS for windows and heating systems, by 3 years, a difference that remained statistically significant after correction (adjusted p < 0.0008 for windows and adjusted p = 0.042 for heating systems) but is practically negligible in magnitude. The omission approach (BKS2_before 2010 excl) closely reproduces the BKS estimates for these two components (adjusted p = 1.000 for both) despite its smaller sample size, supporting the robustness of the main dataset’s imputation method. For pitched roofs, the pattern reversed: the borderline difference against BKS1_2005 observed before correction (p = 0.0437) was no longer significant after correction (adjusted p = 0.350), while BKS2_before 2010 excl yielded a markedly longer median SL than BKS, 7 years, that remained significant after correction (adjusted p = 0.004), plausibly reflecting a selective loss of earlier replacement events among the omitted “before 2010” responses in this longer-lived component. Flat roof estimates were unaffected by the choice of imputation method (adjusted p = 1.000 for both comparisons), though this component’s small sample size limits the precision of this comparison.
Overall, these results support the robustness of the BKS dataset’s imputation approach for windows, heating systems and flat roofs, where both sensitivity variants produced either negligible or non-significant differences from the main estimates. For pitched roofs, SL estimates show greater sensitivity to how ambiguous “before 2010” responses are treated. This corresponds to the component with both the longest median service life and the highest share of excluded “before 2010” responses (39%), consistent with the expectation that longer-lived components are replaced less frequently and are more likely to have been replaced before 2010. This is best interpreted as a data-completeness limitation that scales with component SL, rather than as evidence against the BKS imputation method itself.
To determine whether the cross-country conclusions reported in Section 3 are similarly robust to the treatment of the “before 2010” category, the same three BKS calculations (BKS, BKS1_2005, and BKS2_before 2010 excl) were each compared against EMS using the Log-Rank test, applying the same Bonferroni correction procedure described in Section 2.3 to a separate family of m = 12 tests (four building elements × three BKS treatments).
For windows, EMS differs significantly from BKS (p < 0.001, Bonferroni-corrected p < 0.001) and from BKS2_before 2010 excl (p = 0.0003, corrected p = 0.0036), but not from BKS1_2005 (p = 0.9437, corrected p = 1.000). For pitched roofs, the same pattern is observed: EMS differs significantly from BKS (p = 0.0036, corrected p = 0.0432) and from BKS2_before 2010 excl (p < 0.001, corrected p < 0.001), but not from BKS1_2005 (p = 0.3253, corrected p = 1.000). For flat roofs, EMS differs significantly from all three treatments (BKS: p = 0.0003, corrected p = 0.0036; BKS1_2005: p < 0.001, corrected p < 0.001; BKS2_before 2010 excl: p = 0.0013, corrected p = 0.0156). For heating systems, EMS also differs significantly from all three treatments (p < 0.001 in each case, corrected p < 0.001), although, as noted in Section 3.2, this comparison remains confounded by the definitional incompatibility between the two surveys and should not be interpreted as evidence of a genuine national difference.
Two distinct patterns therefore emerge. For flat roofs and, with the caveat above, heating systems, the cross-country difference is robust to the treatment of the Dutch “before 2010” responses: EMS differs significantly from BKS regardless of which imputation approach is used. For windows and pitched roofs, by contrast, the significant difference obtained with the main BKS calculation and with the exclusion approach (BKS2_before 2010 excl) disappears when the censored responses are instead assigned a fixed replacement year of 2005 (BKS1_2005). For these two elements, whether Belgium and The Netherlands are concluded to differ depends in part on how the open-ended Dutch response category is treated. This dependence is compounded, for pitched roofs, by the fact that the main EMS-BKS comparison itself is close to the correction threshold (corrected p = 0.0432) and would not survive a more conservative family definition or multiplicity method. Independently of this significance classification, the practical magnitude of the difference is limited: median SL for pitched roofs is 61 years for EMS versus 64 years for BKS, a 3-year difference with narrowly non-overlapping confidence intervals ([60–62] vs. [63–66]). Taken together, these results indicate that the cross-country conclusions of this study survive the uncertainty in the Dutch “before 2010” dates for flat roofs, but are sensitivity-dependent for windows and pitched roofs, a limitation that should be read alongside the broader survey-design recommendations discussed below.
However, future survey instruments should include multi-year breakdowns for historical renovation dates rather than open-ended categories, and should ideally ask respondents to specify the installation year of the current element rather than deriving it as a residual from the building’s construction period. Such design improvements would reduce the need for post hoc imputation strategies and reduce the methodological uncertainty that currently limits the comparability of empirical SL estimates across studies.
4.4. Cross-Regional Comparability: Belgium, The Netherlands and Switzerland
The present study provides empirical evidence for Belgium and The Netherlands. Another reference is drawn from the Swiss SHEDS study by Sébastien et al. [56], which applied a methodologically analogous survival analysis to a household survey conducted in 2017–2018 among approximately 2500 owner-occupying Swiss homeowners. The RSL for Switzerland is found in CRB, the national competence center for standards in construction and real estate [57].
In Table 12 and Table 13, the empirical results and RSL’s of windows and heating systems for the three countries are overviewed. Considering the heating system, the SHED study questioned the heating system in general, although the author remarks that “some respondents might confuse the heat production system with the entire heating system”. Since the SHEDS study does not distinguish between pitched and flat roofs, this building element is left out.
Table 12.
Survival times for windows and heating systems for Belgium, The Netherlands and Switzerland.
Table 13.
RSL for windows, heating systems and roofs for Belgium, The Netherlands and Switzerland.
For windows, the three national contexts display remarkable convergence at the median. The Belgian and Dutch datasets yield a median SL around 50 years. Sébastien et al. report a Swiss median of 35 years. A value that is considerably lower but aligns precisely with the specified RSL by the Swiss CRB norm. For heating systems, regional comparability is substantially weaker, partially due to definition differences. The Belgian dataset yields a median SL of 47 years for heat production and 59 for heat distribution, while the Dutch BKS dataset produces a median of 41 years. The Swiss data report a median of approximately 28 years. Again, considerably lower than both Western neighbors, although higher than the RSL of heat production of CRB (20 years average). Sébastien et al. attribute this to an increasing concern about heating fuels and energy-saving objectives. However, the unclear definition of heating systems has probably compromised the results, with some respondents also indicating heating distribution replacements, which have considerably longer SL. This definition differences make direct comparison hazardous, rendering the derivation of a single cross-national median for heating systems methodologically indefensible.
Beyond definitional and methodological factors, at least three structural characteristics distinguish the three national building contexts and plausibly account for the observed SL differences. First, building stock age distributions differ markedly. Belgium’s pre-war building stock is proportionally larger than those of The Netherlands and Switzerland [58,59,60], implying that a greater share of Belgian dwellings have already undergone multiple renovation cycles. Second, climatic environments diverge: Switzerland’s alpine and pre-alpine zones impose materially different weathering demands on façades, roofs, and windows compared to the temperate maritime climates of Belgium and The Netherlands. Third, construction traditions and material preferences differ substantially across the three countries. These material-level differences may plausibly contribute to the differences in empirically observed SL distributions, although this relationship was not directly tested and would require material-specific data to confirm.
The central question, whether generalized cross-national service lives can be derived, must therefore be answered with qualified skepticism. This aligns with the assessment of Silva and de Brito [23], who, in their critical literature review of building envelope service life studies, conclude that regionally calibrated empirical estimates consistently outperform generic tabulated values for LCA accuracy. They are also consistent with the position of Goulouti et al. [22], who demonstrate through sensitivity analysis that SL uncertainty is among the most influential sources of variability in building LCA outcomes. The present three-country comparison adds an international dimension to this literature by demonstrating that neighboring countries exhibit significant differences in empirical SL distributions, whether this is due to definitional, methodological, or structural factors. This finding cautions against the uncritical adoption of SL values derived in one national context for use in LCA calculations performed in another. It further argues for the development of multi-country empirical SL databases, ideally structured by material type, as the most reliable foundation for European-scale environmental performance assessment of the building stock.
4.5. Reliability of Results for Flat Roofs
The empirical SL estimates for roofs, particularly flat roofs, deviate substantially from the nationally published RSLs, raising concerns about the reliability of the results. While empirical data are generally considered more accurate due to their ability to reflect the influence of multiple contextual factors, they are not without limitations. Survey-based data collection, in particular, may introduce uncertainty, as respondents without technical expertise may report service life based on personal expectations or subjective satisfaction rather than actual material degradation. This can result in over- or underestimation of the true service life of building components [23]. Furthermore, it is important to acknowledge that the number of observations for flat roofs in the survey is significantly lower than for pitched roofs, which may further compromise the reliability and representativeness of the findings. In general, the literature suggests that as sample sizes increase, the estimated service life values tend to converge with average values reported in previous studies [23]. Finally, because only one renovation cycle is queried, short-lived building elements, such as flat roofs, are disproportionately affected, and the resulting estimates are likely biased towards longer SL values. Therefore, caution is warranted in interpreting the flat roof data, and additional research with larger and more renovation cycles is recommended to validate these results.
5. Conclusions
This paper presents the lessons from a comparison of two independent, methodologically aligned, but not identical, empirical datasets on the SL of windows, heating systems, and roofs in Belgian and Dutch residential buildings. Weibull survival analysis, selected on the basis of corrected Akaike Information Criterion (AICc) comparison across candidate distributions, was applied to survey data from the Essencia Marketing Survey (EMS, Belgium) and the Bouwkennis Survey (BKS, The Netherlands). For The Netherlands, two additional calculation methods (BKS1_2005 and BKS2_before 2010 excl) were applied as a sensitivity analysis to address a structural truncation in historical renovation data. Differences between survival functions throughout this study were assessed using a Bonferroni-corrected Log-Rank test. These estimates were subsequently benchmarked against the RSLs published by the Belgian TOTEM tool and the Dutch National Environmental Database (NMD).
For windows, the Belgian and Dutch datasets yield median SLs of approximately 49–52 years, which fall within the broad range of RSLs reported by TOTEM and NMD across material types (approximately 40 to 75 years, depending on frame material). Although the Log-Rank test indicates a statistically significant difference between the two countries, the practical magnitude of this difference, approximately three years, is negligible for LCA and renovation-planning purposes. Because window material was not recorded in either survey, however, these results indicate overlap with, rather than validation of, the national material-specific RSLs.
For heating systems, meaningful cross-national comparison is precluded by definitional incompatibility: the EMS explicitly distinguished heat production (boiler or heat pump) from distribution (radiators), whereas BKS queried respondents on “the heater” as a single, undifferentiated component. This ambiguity is compounded by the fact that TOTEM and NMD themselves assign markedly different RSLs to production and distribution components. A further limitation concerns the survey design itself: because respondents were asked about only a single renovation cycle, replacements of shorter-lived components such as heat production equipment, with life cycles of approximately 20 years, are more likely to have gone unreported than those of longer-lived elements. As a result, the empirically observed SL for heat production is likely biased towards longer values than are actually representative. Before any recommendation to revise the RSLs upward can be made, the survey instrument itself would need to be adjusted to capture multiple renovation cycles, allowing this bias to be quantified and corrected for.
For pitched roofs, the empirically observed SLs (median 61–64 years) broadly corroborate the RSLs published by TOTEM and NMD (≥50 years), while a statistically significant difference between Belgium and The Netherlands persists after Bonferroni correction, but this result did not hold under all BKS treatment methods (Section 4.3) and should therefore be interpreted with caution. For flat roofs, the Belgian dataset yields a median SL of 56 years, substantially exceeding the TOTEM RSL of 30 to 40 years, while the Dutch BKS estimate (median 46 years) is more moderate and falls within the NMD range. This country difference also remains significant after correction. As flat roofs are the shorter-lived of the two roof types considered here, their empirically observed SL is more susceptible than that of pitched roofs to the survey’s single-renovation-cycle design, whereby earlier replacements are more easily overlooked by respondents, biasing the resulting estimates towards longer values than are actually representative. Given this, together with the relatively small flat-roof sample sizes, these findings warrant some caution and call for dedicated empirical research on flat-roof replacement behavior.
Considered together, the evidence assembled here shows that drawing firm, generalisable conclusions on empirical SL is inherently difficult: genuine cross-national divergence is strongest for roofs, negligible in practice for windows despite formal statistical significance, and cannot even be assessed for heating systems given incompatible component definitions. To test whether these cross-national conclusions depend on how the Dutch survey’s open-ended “before 2010” responses were treated, the EMS-BKS comparison was repeated using two alternative BKS calculations for each element; this confirmed that the divergence for flat roofs is robust to this uncertainty, but for windows and pitched roofs the significant difference is not observed under all treatments, so the corresponding conclusions should be interpreted with caution. This more cautious reading, rather than a blanket claim of significant differences across building elements, better reflects the actual strength of the evidence obtained.
Yet where substantive conclusions remain absent, this study offers clear methodological lessons, and it is here that its main added value to the field lies. Meaningful cross-national comparison of empirical SL data requires that definitions, level of detail, and analytical approach be closely aligned between datasets. Where they are not, as for heating systems, comparison becomes unreliable regardless of sample size or statistical technique. The sensitivity analysis comparing BKS, BKS1_2005 and BKS2_before 2010 excl further underscores that the design of the retrospective installation and replacement question is a critical determinant of data quality in survey-based SL research, particularly for longer-lived components where historical replacement events are more likely to fall into open-ended response categories. Similarly, the fact that both surveys question only a single renovation cycle was shown to bias empirical SL estimates towards longer values, an effect most pronounced for shorter-lived components and elements. The absence of material-type data in both surveys constitutes a further limitation, since SL is known to vary substantially by material within a single component category; without this information, empirical estimates and their comparison across countries remain only partially informative. Future survey instruments should therefore adopt multi-year temporal breakdowns for historical renovation events, capture multiple renovation cycles where feasible, query the installation year of the current element directly rather than deriving it residually from the building construction period, and include material-type variables to enable more granular and reliable SL estimation.
Author Contributions
Conceptualization, B.G. and G.V.; methodology, B.G. and V.V.; validation, B.G. and V.V.; formal analysis, B.G.; writing—original draft preparation, B.G.; writing—review and editing, G.V.; visualization, B.G.; supervision, G.V. All authors have read and agreed to the published version of the manuscript.
Funding
This research received no external funding.
Data Availability Statement
Restrictions apply to the availability of these data since the data were obtained from Essencia Marketing, a privately owned marketing agency. The data are only available upon request and after consideration. Requests to access the datasets should be directed to bieke.gepts@essencia.be.
Conflicts of Interest
Author Bieke Gepts was employed by the company Essencia Marketing. The remaining authors declare that the research was conducted in the absence of any commercial or financial relationships that could be construed as a potential conflict of interest.
Abbreviations
The following abbreviations are used in this manuscript:
| SL | Service Life |
| LCA | Life Cycle Analysis |
| RSL | Reference Service Life |
| EMS | Essencia Marketing Survey |
| BKS | Bouwkennis Survey |
| TOTEM | Tool to Optimize the Total Environmental Impact of Materials |
| NMD | Nationale Milieudatabank |
Appendix A
Figure A1.
Service life of windows.
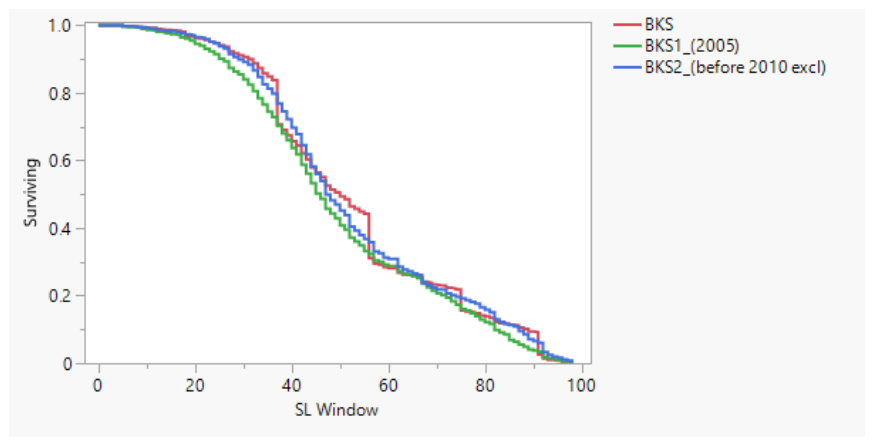
Figure A2.
Service life of heating systems.
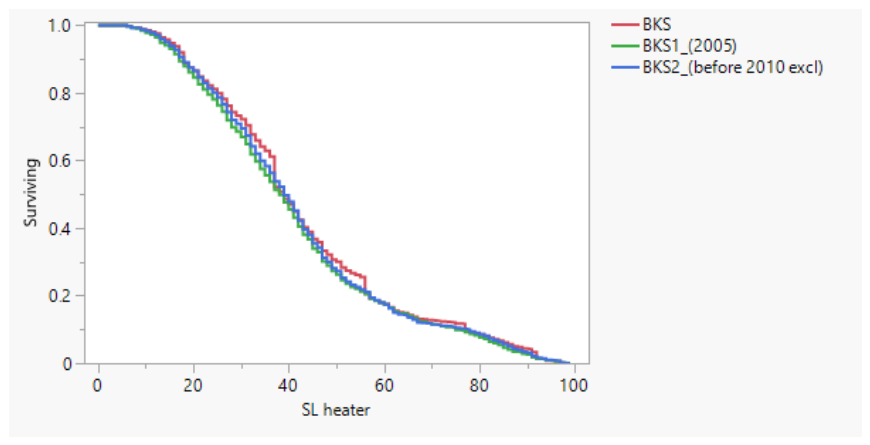
Figure A3.
Service life of pitched roofs.
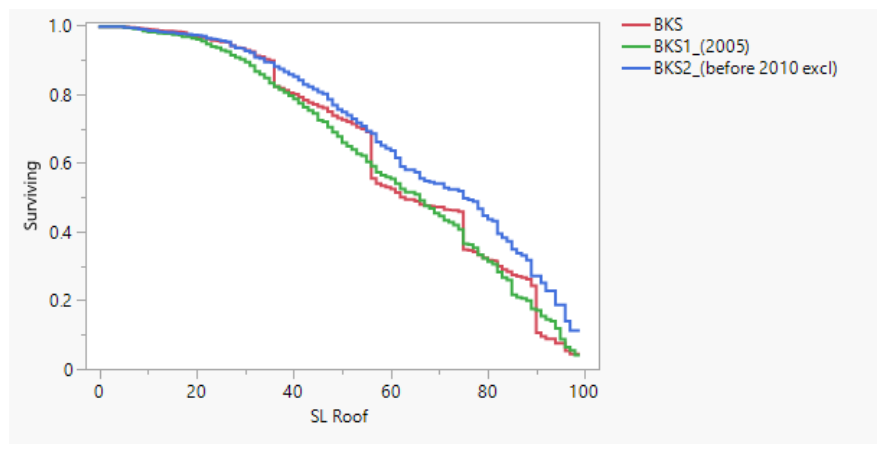
Figure A4.
Service life of flat roofs.
References
- Allwood, J.M.; Ashby, M.F.; Gutowski, T.G. Worrell, Material efficiency: A white paper. Resour. Conserv. Recycl. 2011, 55, 362–381. [Google Scholar] [CrossRef] [Scilit]
- UNEP. Guidelines on Education Policy for Sustainable Built Environments; UNEP: Nairobi, Kenya, 2010. [Google Scholar]
- European Commission: Directorate-General for Climate Action. Going Climate-Neutral by 2050: A Strategic Long-Term Vision for a Prosperous, Modern, Competitive and Climate-Neutral EU Economy; European Commission: Directorate-General for Climate Action: Brussels, Belgium, 2019. [Google Scholar] [CrossRef]
- IEA. Tracking Clean Energy Progress 2023; IEA: Paris, France, 2023; Available online: https://www.iea.org/reports/tracking-clean-energy-progress-2023 (accessed on 20 May 2025).
- Athanassiadis, A.; Bouillard, P.; Crawford, R.H.; Khan, A.Z. Towards a Dynamic Approach to Urban Metabolism: Tracing the Temporal Evolution of Brussels’ Urban Metabolism from 1970 to 2010. J. Ind. Ecol. 2017, 21, 307–319. [Google Scholar] [CrossRef] [Scilit]
- Eurostat. Share of Energy from Renewable Sources. 2023. Available online: https://ec.europa.eu/eurostat/databrowser/view/NRG_IND_REN__custom_1934914/bookmark/table?lang=en&bookmarkId=c8f7f73e-f9a2-4f42-af05-d6e19ad99cb5 (accessed on 31 October 2023).
- Fishman, T.; Schandl, H.; Tanikawa, H. Stochastic Analysis and Forecasts of the Patterns of Speed, Acceleration, and Levels of Material Stock Accumulation in Society. Environ. Sci. Technol. 2016, 50, 3729–3737. [Google Scholar] [CrossRef] [Scilit]
- IPCC. Climate Change 2022. Mitigation of Climate Change. 2022. Available online: https://www.ipcc.ch/report/ar6/wg3/downloads/report/IPCC_AR6_WGIII_FullReport.pdf (accessed on 21 May 2025).
- NBN EN 15978:2012; Sustainability of Construction Works—Assessment of Environmental Performance of Buildings—Calculation Method. National Standards Authority of Ireland: Santry, Dublin, 2012.
- Francart, N.; Widström, T.; Malmqvist, T. Influence of methodological choices on maintenance and replacement in building LCA. Int. J. Life Cycle Assess. 2021, 26, 2109–2126. [Google Scholar] [CrossRef] [Scilit]
- Hoxha, E.; Habert, G.; Lasvaux, S.; Chevalier, J.; Le Roy, R. Influence of construction material uncertainties on residential building LCA reliability. J. Clean. Prod. 2017, 144, 33–47. [Google Scholar] [CrossRef] [Scilit]
- ISO 15686-1:2011; Buildings and Constructed Assets—Service Life Planning Part 1: General Principles and Framework. International Organization for Standardization: Geneva, Switzerland, 2022. Available online: https://www.iso.org/standard/45798.html (accessed on 12 May 2025).
- Silva, A.; de Brito, J.; Thomsen, A.; Straub, A.; Prieto, A.J.; Lacasse, M.A. Causal Effects between Criteria That Establish the End of Service Life of Buildings and Components. Buildings 2022, 12, 88. [Google Scholar] [CrossRef] [Scilit]
- de Castro, W.V.; Ferreira, C.; Barrelas, J.; Gaspar, P.L.; Mendes, M.P.; Silva, A. Maintenance as an Opportunity to Improve Residential Buildings’ Energy Efficiency: Evaluation of Life-Cycle Costs. Buildings 2026, 16, 1551. [Google Scholar] [CrossRef] [Scilit]
- Giorgi, S.; Lavagna, M.; Campioli, A. Life Cycle Assessment of building end of life. In Proceedings of the Life Cycle Thinking in Decision-Making for Sustainability: From Public Policies to Private Businesses, Messina, Italy, 11–12 June 2018. [Google Scholar]
- Straub, A. Estimating the Service Lives of Building Products in Use. J. Civ. Eng. Archit. 2015, 9, 331–340. [Google Scholar] [CrossRef] [Scilit]
- Janjua, S.Y.; Sarker, P.K.; Biswas, W.K. Impact of service life on the environmental performance of buildings. Buildings 2019, 9, 9. [Google Scholar] [CrossRef] [Scilit]
- Obrecht, T.P.; Kunič, R.; Jordan, S.; Legat, A. Roles of the reference service life (RSL) of buildings and the RSL of building components in the environmental impacts of buildings. IOP Conf. Ser. Earth Environ. Sci. 2019, 323, 012146. [Google Scholar] [CrossRef] [Scilit]
- Rauf, A.; Crawford, R.H. Building service life and its effect on the life cycle embodied energy of buildings. Energy 2015, 79, 140–148. [Google Scholar] [CrossRef] [Scilit]
- Nwodo, M.N.; Anumba, C.J. A review of life cycle assessment of buildings using a systematic approach. Build. Environ. 2019, 162, 106290. [Google Scholar] [CrossRef] [Scilit]
- Alexander, M.; Beushausen, H. Durability, service life prediction, and modelling for reinforced concrete structures-review and critique. Cem. Concr. Res. 2019, 122, 17–29. [Google Scholar] [CrossRef] [Scilit]
- Goulouti, K.; Padey, P.; Galimshina, A.; Habert, G.; Lasvaux, S. Uncertainty of building elements’ service lives in building LCA & LCC: What matters? Build. Environ. 2020, 183, 106904. [Google Scholar] [CrossRef] [Scilit]
- Silva, A.; de Brito, J. Service life of building envelopes: A critical literature review. J. Build. Eng. 2021, 44, 102646. [Google Scholar] [CrossRef] [Scilit]
- Janjua, S. Sustainability Implication of Residential Building Materials Considering Service Life Variability. Ph.D. Thesis, Curtin University, Perth, Australia, 2021. [Google Scholar]
- Stephan, A.; Crawford, R.H. A multi-scale life-cycle energy and greenhouse-gas emissions analysis model for residential buildings. Archit. Sci. Rev. 2013, 57, 39–48. [Google Scholar] [CrossRef] [Scilit]
- Marteinsson, B. Service Life Estimation in the Design of Buildings: A Development of the Factor Method; University of Gävle: Gävle, Sweden, 2005; Available online: https://www.researchgate.net/publication/279491512_Service_life_estimation_in_building_design_A_development_of_the_factor_method (accessed on 7 May 2025).
- Eriksson, L.S.; Lidelöw, S. Maintaining or replacing a building’s windows: A comparative life cycle study. Int. J. Build. Pathol. Adapt. 2024, 43, 766–786. [Google Scholar] [CrossRef] [Scilit]
- Volland, B.; Farsi, M.; Lasvaux, S.; Padey, P. Service Life of Building Elements: An Empirical Investigation; IRENE Working Paper, No.20-02; University of Neuchâtel, Institute of Economic Research (IRENE): Neuchâtel, Switzerland, 2020. [Google Scholar]
- Silva, A.; de Brito, J. Prediction of Service Life of Building Materials & Components. 2021. Available online: https://cibworld.org/cib-commissions/w080-prediction-of-service-life-of-building-materials-and-components/ (accessed on 7 May 2025).
- Fernandes, D.; de Brito, J.; Silva, A. Methodology for service life prediction of window frames. Can. J. Civ. Eng. 2019, 46, 1010–1020. [Google Scholar] [CrossRef] [Scilit]
- Ramos, R.; Silva, A.; de Brito, J.; Gaspar, P.L. Methodology for the service life prediction of ceramic claddings in pitched roofs. Constr. Build. Mater. 2018, 166, 386–399. [Google Scholar] [CrossRef] [Scilit]
- Gobbo, É.; Nia, E.M.; Straub, A.; Stephan, A. Exploring the effective reuse rate of materials and elements in the construction sector. J. Build. Eng. 2024, 98, 111344. [Google Scholar] [CrossRef] [Scilit]
- Etienne, D.; Lisa, W.; Laetitia, D. Evaluating “reuse” in the current LCA framework—Impact of reuse and reusability in different life cycle stages. IOP Conf. Ser. Earth Environ. Sci. 2022, 1078, 012015. [Google Scholar] [CrossRef] [Scilit]
- Essencia Marketing, Renovatieonderzoek. 2021. Available online: http://essenciamarketing.be/en/page/market-information-construction-Belgium (accessed on 1 May 2025).
- Bouwkennis, Renovatieonderzoek. 2024. Available online: www.bouwkennis.nl (accessed on 13 May 2025).
- Gepts, B.; Meex, E.; Nuyts, E.; Knapen, E.; Verbeeck, G. Existing databases as means to explore the potential of the building stock as material bank. IOP Conf. Ser. Earth Environ. Sci. 2019, 225, 012002. [Google Scholar] [CrossRef] [Scilit]
- Gepts, B.; Nuyts, E.; Verbeeck, G. Renovation rate as a tool towards achieving SDGs 11 and 13. IOP Conf. Ser. Earth Environ. Sci. 2020, 588, 042010. [Google Scholar] [CrossRef] [Scilit]
- Sas Institute, JMP. 2021. Available online: https://www.jmp.com/en_be/home.html (accessed on 7 February 2025).
- Burnham, K.P.; Anderson, D.R. Multimodel Inference. Sociol. Methods Res. 2004, 33, 261–304. [Google Scholar] [CrossRef] [Scilit]
- Wagenmakers, E.-J.; Farrell, S. AIC model selection using Akaike weights. Psychon. Bull. Rev. 2004, 11, 192–196. [Google Scholar] [CrossRef] [Scilit]
- Weibull, W. A Statistical Distribution Function of Wide Applicability. J. Appl. Mech. 1951, 18, 293–297. [Google Scholar] [CrossRef] [Scilit]
- Gómez, Y.M.; Gallardo, D.I.; Marchant, C.; Sánchez, L.; Bourguignon, M. An In-Depth Review of the Weibull Model with a Focus on Various Parameterizations. Mathematics 2023, 12, 56. [Google Scholar] [CrossRef] [Scilit]
- Bradburn, M.J.; Clark, T.G.; Love, S.B.; Altman, D.G. Survival Analysis Part II: Multivariate data analysis—An introduction to concepts and methods. Br. J. Cancer 2003, 89, 431–436. [Google Scholar] [CrossRef] [Scilit]
- Mikulec, A.; Misztal, M. Does the type of business activity and the enterprise location affect a firm’s survival? Econometrics 2018, 22, 23–40. [Google Scholar] [CrossRef] [Scilit][Green Version]
- Durmisevic, E. Transformable Building Structures: Design for Disassembly as a Way to Introduce Sustainable Engineering to Building Design & Construction; Delft University of Technology: Delft, Netherlands, 2006. [Google Scholar]
- Xing, X.; Xing, A.; Natarajan, K.; Chu, H.; Lin, L.; Tong, J. An alternative method for assessing the fragility of survival analysis results: A proof-of-concept study based on the log-rank test. Am. J. Epidemiol. 2026, 195, 1175–1181. [Google Scholar] [CrossRef] [Scilit]
- Dunn, O.J. Multiple Comparisons among Means. J. Am. Stat. Assoc. 1961, 56, 52–64. [Google Scholar] [CrossRef]
- OVAM. Totem—Tool to Optimise the Total Environmental impact of Materials. 2011. Available online: https://www.totem-building.be/welcome.xhtml (accessed on 15 May 2025).
- Mouton, L.; Allacker, K.; Crawford, R.; Trigaux, D. Mouton, Life Cycle Cnvironmental Benchmarks for New-Built Belgian Residential Buildings—A Comparison of Bottom-Up and Top-Down Approaches; KU Leuven: Leuven, Belgium, 2025. [Google Scholar]
- Stichting Nationale Milieudatabase (NMD). Nationale Milieudatabase. 2025. Available online: https://milieudatabase.nl/nl/milieuprestatie/ (accessed on 22 July 2025).
- BBSR. Bundesinstitut für Bau-, Nutzungsdauern von Bauteilen für Lebenszyklusanalysen. 2011. Available online: https://www.nachhaltigesbauen.de/fileadmin/pdf/baustoff_gebauededaten/BNB_Nutzungsdauern_von_Bauteilen__2011-11-03.pdf (accessed on 16 May 2025).
- Robati, M.; Daly, D.; Kokogiannakis, G. A method of uncertainty analysis for whole-life embodied carbon emissions (CO2-e) of building materials of a net-zero energy building in Australia. J. Clean. Prod. 2019, 225, 541–553. [Google Scholar] [CrossRef] [Scilit]
- ASHRAE. ASHRAE Owning and Operating Cost Database: Service Life. 2002. Available online: https://costdatabase.ashrae.org/system_service_life.asp?selected_system_type=5 (accessed on 16 May 2025).
- Sterne, J.A.C.; White, I.R.; Carlin, J.B.; Spratt, M.; Royston, P.; Kenward, M.G.; Wood, A.M.; Carpenter, J.R. Multiple imputation for missing data in epidemiological and clinical research: Potential and pitfalls. BMJ 2009, 338, b2393. [Google Scholar] [CrossRef] [Scilit]
- Donders, A.R.T.; van der Heijden, G.J.M.G.; Stijnen, T.; Moons, K.G.M. Review: A gentle introduction to imputation of missing values. J. Clin. Epidemiol. 2006, 59, 1087–1091. [Google Scholar] [CrossRef] [Scilit]
- Sébastien, L.; Giorgi, M.; Lesage, J.; Wagner, G.; Favre, D.; Padey, P.; Perisset, B.; Goulouti, K.; Farsi, M.; Volland, B.; et al. DUREE Project: Analysis of Lifetimes of Building Elements in the Literature and in Renovation Practices and Sensitivity Analyses on Building LCA & LCC; SFOE: Bern, Switzerland, 2019; pp. 1–202. Available online: https://www.aramis.admin.ch/Texte/?ProjectID=38626 (accessed on 16 May 2025).
- CRB. Grundlagen für die Planung der Lebenszykluskosten, Swiss Research Centre for Rationalization in Building and Civil Engineering. 2012. Available online: https://www.crb.ch/fr (accessed on 16 May 2025).
- FOD Economie, Gebouwenpark. 2025. Available online: https://bestat.statbel.fgov.be/bestat/crosstable.xhtml?view=dade64a8-39c8-498e-9736-16a27ef618a0 (accessed on 26 June 2025).
- Centraal Bureau voor Statistiek, Voorraad Woningen. 2025. Available online: https://opendata.cbs.nl/#/CBS/nl/dataset/82550NED/table?searchKeywords=voorraad%20woningen (accessed on 29 July 2025).
- Federal Statistical Office. Buildings by Period of Construction, (24AD). Available online: https://www.bfs.admin.ch/bfs/en/home/statistics/construction-housing/buildings/period.assetdetail.32381395.html (accessed on 20 May 2025).

Disclaimer/Publisher’s Note: The statements, opinions and data contained in all publications are solely those of the individual author(s) and contributor(s) and not of MDPI and/or the editor(s). MDPI and/or the editor(s) disclaim responsibility for any injury to people or property resulting from any ideas, methods, instructions or products referred to in the content. |
© 2026 by the authors. Licensee MDPI, Basel, Switzerland. This article is an open access article distributed under the terms and conditions of the Creative Commons Attribution (CC BY) license.