1. Introduction
Architectural decorative motifs are visual objects with clear recognition value in the image archives of traditional vernacular dwellings. Compared with general building façades or spatial layouts, decorative motifs are usually embedded in specific architectural components at a relatively small scale [
1]. They reveal craft lines, material textures, and compositional relationships, while also recording the component system and visual order of traditional dwellings. Guanzhong traditional vernacular dwellings preserve relatively complete local building experience. Their architectural decoration is commonly attached to parts such as gatehouses, screen walls, gable end piers, doors and windows, door pillow stones, column bases, tile ends, and roof ridges, forming a motif image system characterized by spatial attachment [
2]. These motifs are not isolated patterns. Together with architectural components, courtyard entrances, wall boundaries, and roof nodes, they constitute architectural surfaces that can be observed, recorded, and classified. Therefore, image recognition of architectural decorative motifs in Guanzhong traditional vernacular dwellings can improve the efficiency of organizing field image materials and provide basic data support for the digital documentation, typological statistics, and image retrieval of decorative motifs in traditional dwellings [
3,
4].
From an international perspective, digital documentation has become an important technical basis for cultural heritage conservation and management. Remondino and Rizzi emphasized that reality-based documentation can provide reliable visual and spatial records for heritage sites, while Remondino further discussed the role of photogrammetry and 3D scanning in heritage recording and modeling [
5,
6]. In the field of architectural heritage management, H-BIM studies have also shown that structured digital information is useful for documenting, organizing, and reusing heritage data [
7]. These studies indicate that image-based recognition is not only a classification task, but also a supporting technique for heritage information organization and digital documentation.
During preliminary field investigations, the research team found that image acquisition was often affected by shooting distance, lighting conditions, component height, and viewing angle [
8]. These factors resulted in cluttered backgrounds, inconsistent scales, and unclear boundaries. At the same time, as the components of traditional dwellings have long been exposed to the natural environment, weathering, spalling, occlusion, and contamination are common, further weakening the lines, contours, and categorical features of the motifs [
9]. These field conditions create difficulties in subsequent image organization and make automated motif recognition necessary for improving efficiency and consistency.
In recent years, deep learning methods have been applied to cultural heritage image analysis, historic architectural component recognition, and the detection of surface deterioration in buildings [
10]. Fiorucci et al. reviewed machine learning applications in cultural heritage and pointed out that classification, retrieval, and visual analysis have become important directions in computational heritage studies [
11]. For architectural heritage images, Llamas et al. applied deep learning techniques to classify architectural heritage elements and demonstrated that CNN-based image classification can support the organization of architectural image archives [
12]. More recently, Croce et al. explored the use of artificial intelligence for architectural heritage classification in an H-BIM context, showing that visual classification can assist semi-automatic heritage reconstruction and information modeling [
13]. Existing studies have generally followed two technical pathways. One relies mainly on classification networks such as CNN [
14], ViT [
15], and Swin Transformer [
16], using whole image input or manually cropped images for category prediction. The other uses semantic segmentation, instance segmentation, or visual foundation models to extract possible target regions from complex images. These methods provide useful technical references for architectural heritage image recognition. However, when whole field images are directly fed into a classification network, the model is often affected by large wall surfaces, component edges, shadows, and damaged textures. This can lead to unstable feature extraction, increased computational redundancy, and a higher rate of misrecognition. It is therefore necessary to develop a recognition method for architectural decorative motifs in complex scene images.
To address these issues, this study constructs a sequential recognition workflow for architectural decorative motifs in Guanzhong traditional vernacular dwellings. The workflow combines non-motif candidate training, SAM-based candidate generation, spatial-prior filtering, semantic aggregation, Swin Transformer classification, and confidence-based rejection to improve recognition stability in complex field images.
The main contributions of this study are as follows:
A dataset of architectural decorative motif images from Guanzhong traditional vernacular dwellings is constructed. Non-motif regions such as wall joints, brick joints, stains, shadows, and weathered wood textures are incorporated into the sample system, in order to reflect the practical problem that motifs and background textures are often mixed in field images of architectural heritage.
This study does not aim to propose a new general-purpose segmentation or detection model. Its contribution lies in adapting foundation-model candidate generation to complex architectural heritage field images through a dual-branch workflow that combines macroscopic candidate-region anchoring with fine-grained motif classification. The workflow integrates spatial-prior filtering, semantic aggregation, long-tailed performance evaluation, and confidence-based rejection to improve recognition stability under complex field backgrounds.
Component-level grouped test-set evaluation, module configuration analysis, and complete-field-image expert verification are conducted to verify the effectiveness of the proposed method in organizing architectural decorative motifs in traditional vernacular dwellings.
2. Research Object and Sample Construction
2.1. Research Object and Image Sources
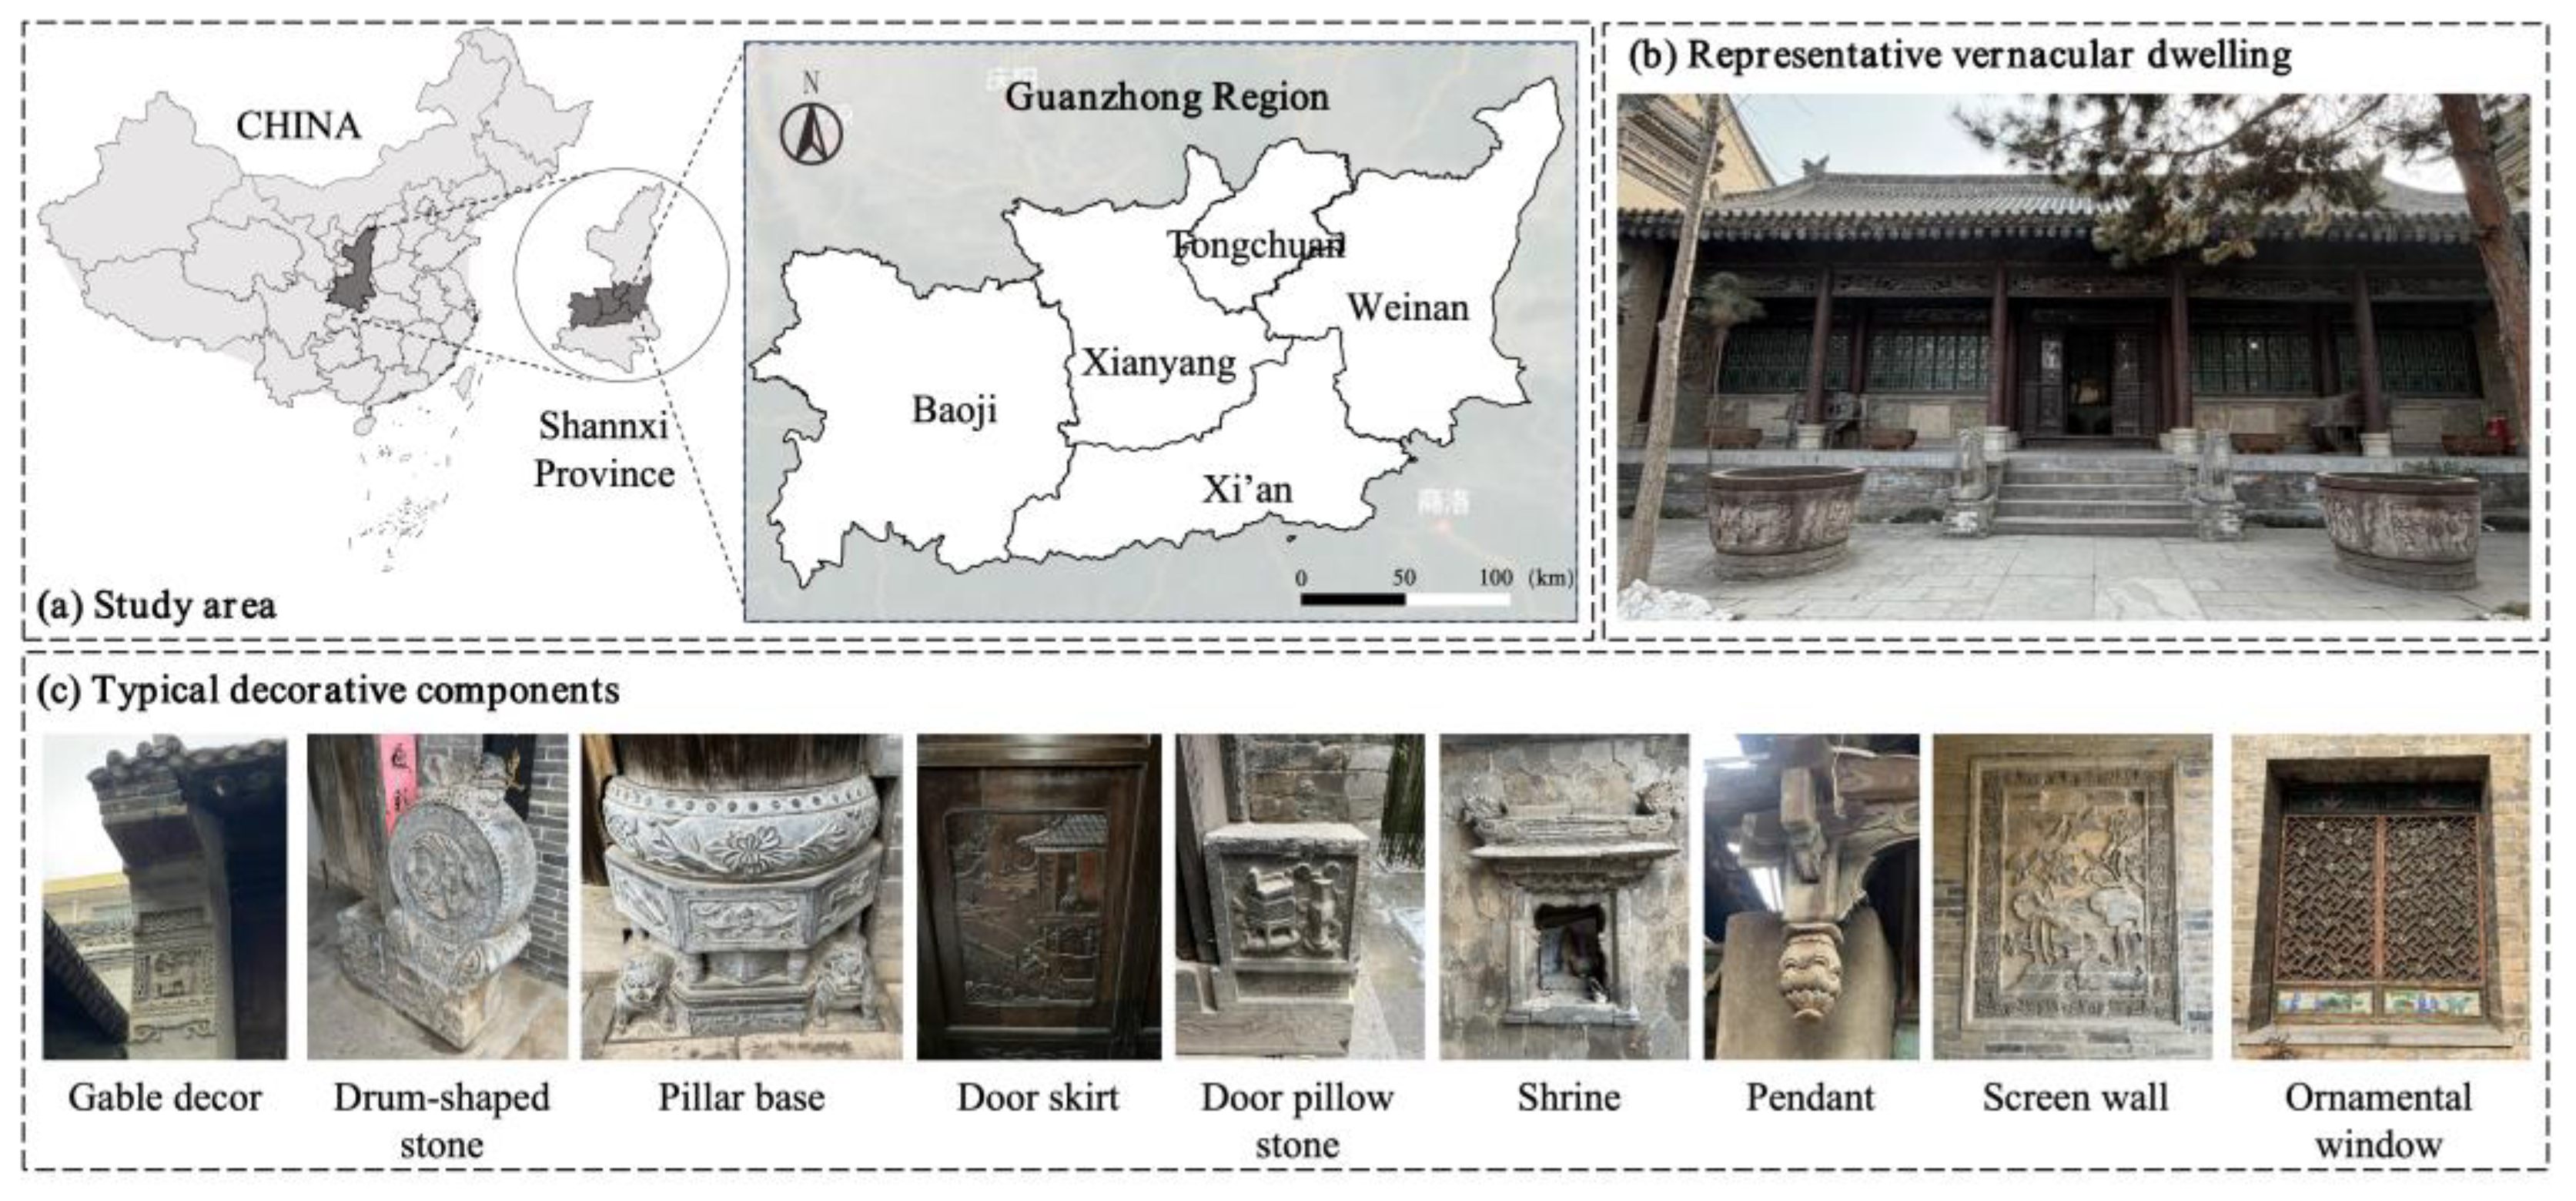
From January to March 2026, the research team conducted field investigations of traditional dwellings in Shaanxi Province. The study area covered five cities in the Guanzhong region, namely Xi’an, Baoji, Xianyang, Weinan, and Tongchuan (
Figure 1). Traditional dwellings in this region are widely distributed, and the preservation conditions of their decorative components vary considerably. These characteristics make the region suitable for reflecting the difficulties of motif recognition under complex conditions.
The research images consist of three levels: complete building photographs, architectural component photographs, and cropped local motif images. Complete images were used to record the dwelling environment and the spatial context of architectural components. Component images were used to identify the parts to which the motifs were attached. Cropped local images served as the basic sample units for model training, validation, and testing. The samples were classified according to five fields, namely city, district or county, dwelling, component name, and specific motif. This classification structure ensures source traceability and facilitates the subsequent indexing, retrieval, and archival management of decorative images from traditional vernacular dwellings. The samples were mainly collected from decorative components such as screen walls, gable end piers, doors and windows, door pillow stones, column bases, tile ends, and roof ridges. The component types include entrance decorations that can be clearly identified at close range, as well as small scale local motifs that are more strongly affected by viewing angle and preservation condition.
After screening, cropping, merging, and manual annotation, the dataset contained 47 traditional dwellings and 4706 annotated image samples. These samples were organized into 164 annotated categories, including 163 architectural decorative motif categories and one non-motif background category. To clarify the long-tailed distribution of the dataset,
Table 1 reports the number of samples in each first-level category, the number of second-level categories, and the minimum, maximum, mean, and median number of samples per category. Non-motif candidates mainly include wall joints, brick joints, stains, shadows, weathered wood textures, damaged stone surfaces, and blank wall surfaces. They were introduced as negative samples for rejection training to reduce the probability that invalid textures would be misidentified as decorative motifs. Rare categories were retained to preserve the diversity of Guanzhong vernacular decorative motifs.
2.2. Image Preprocessing
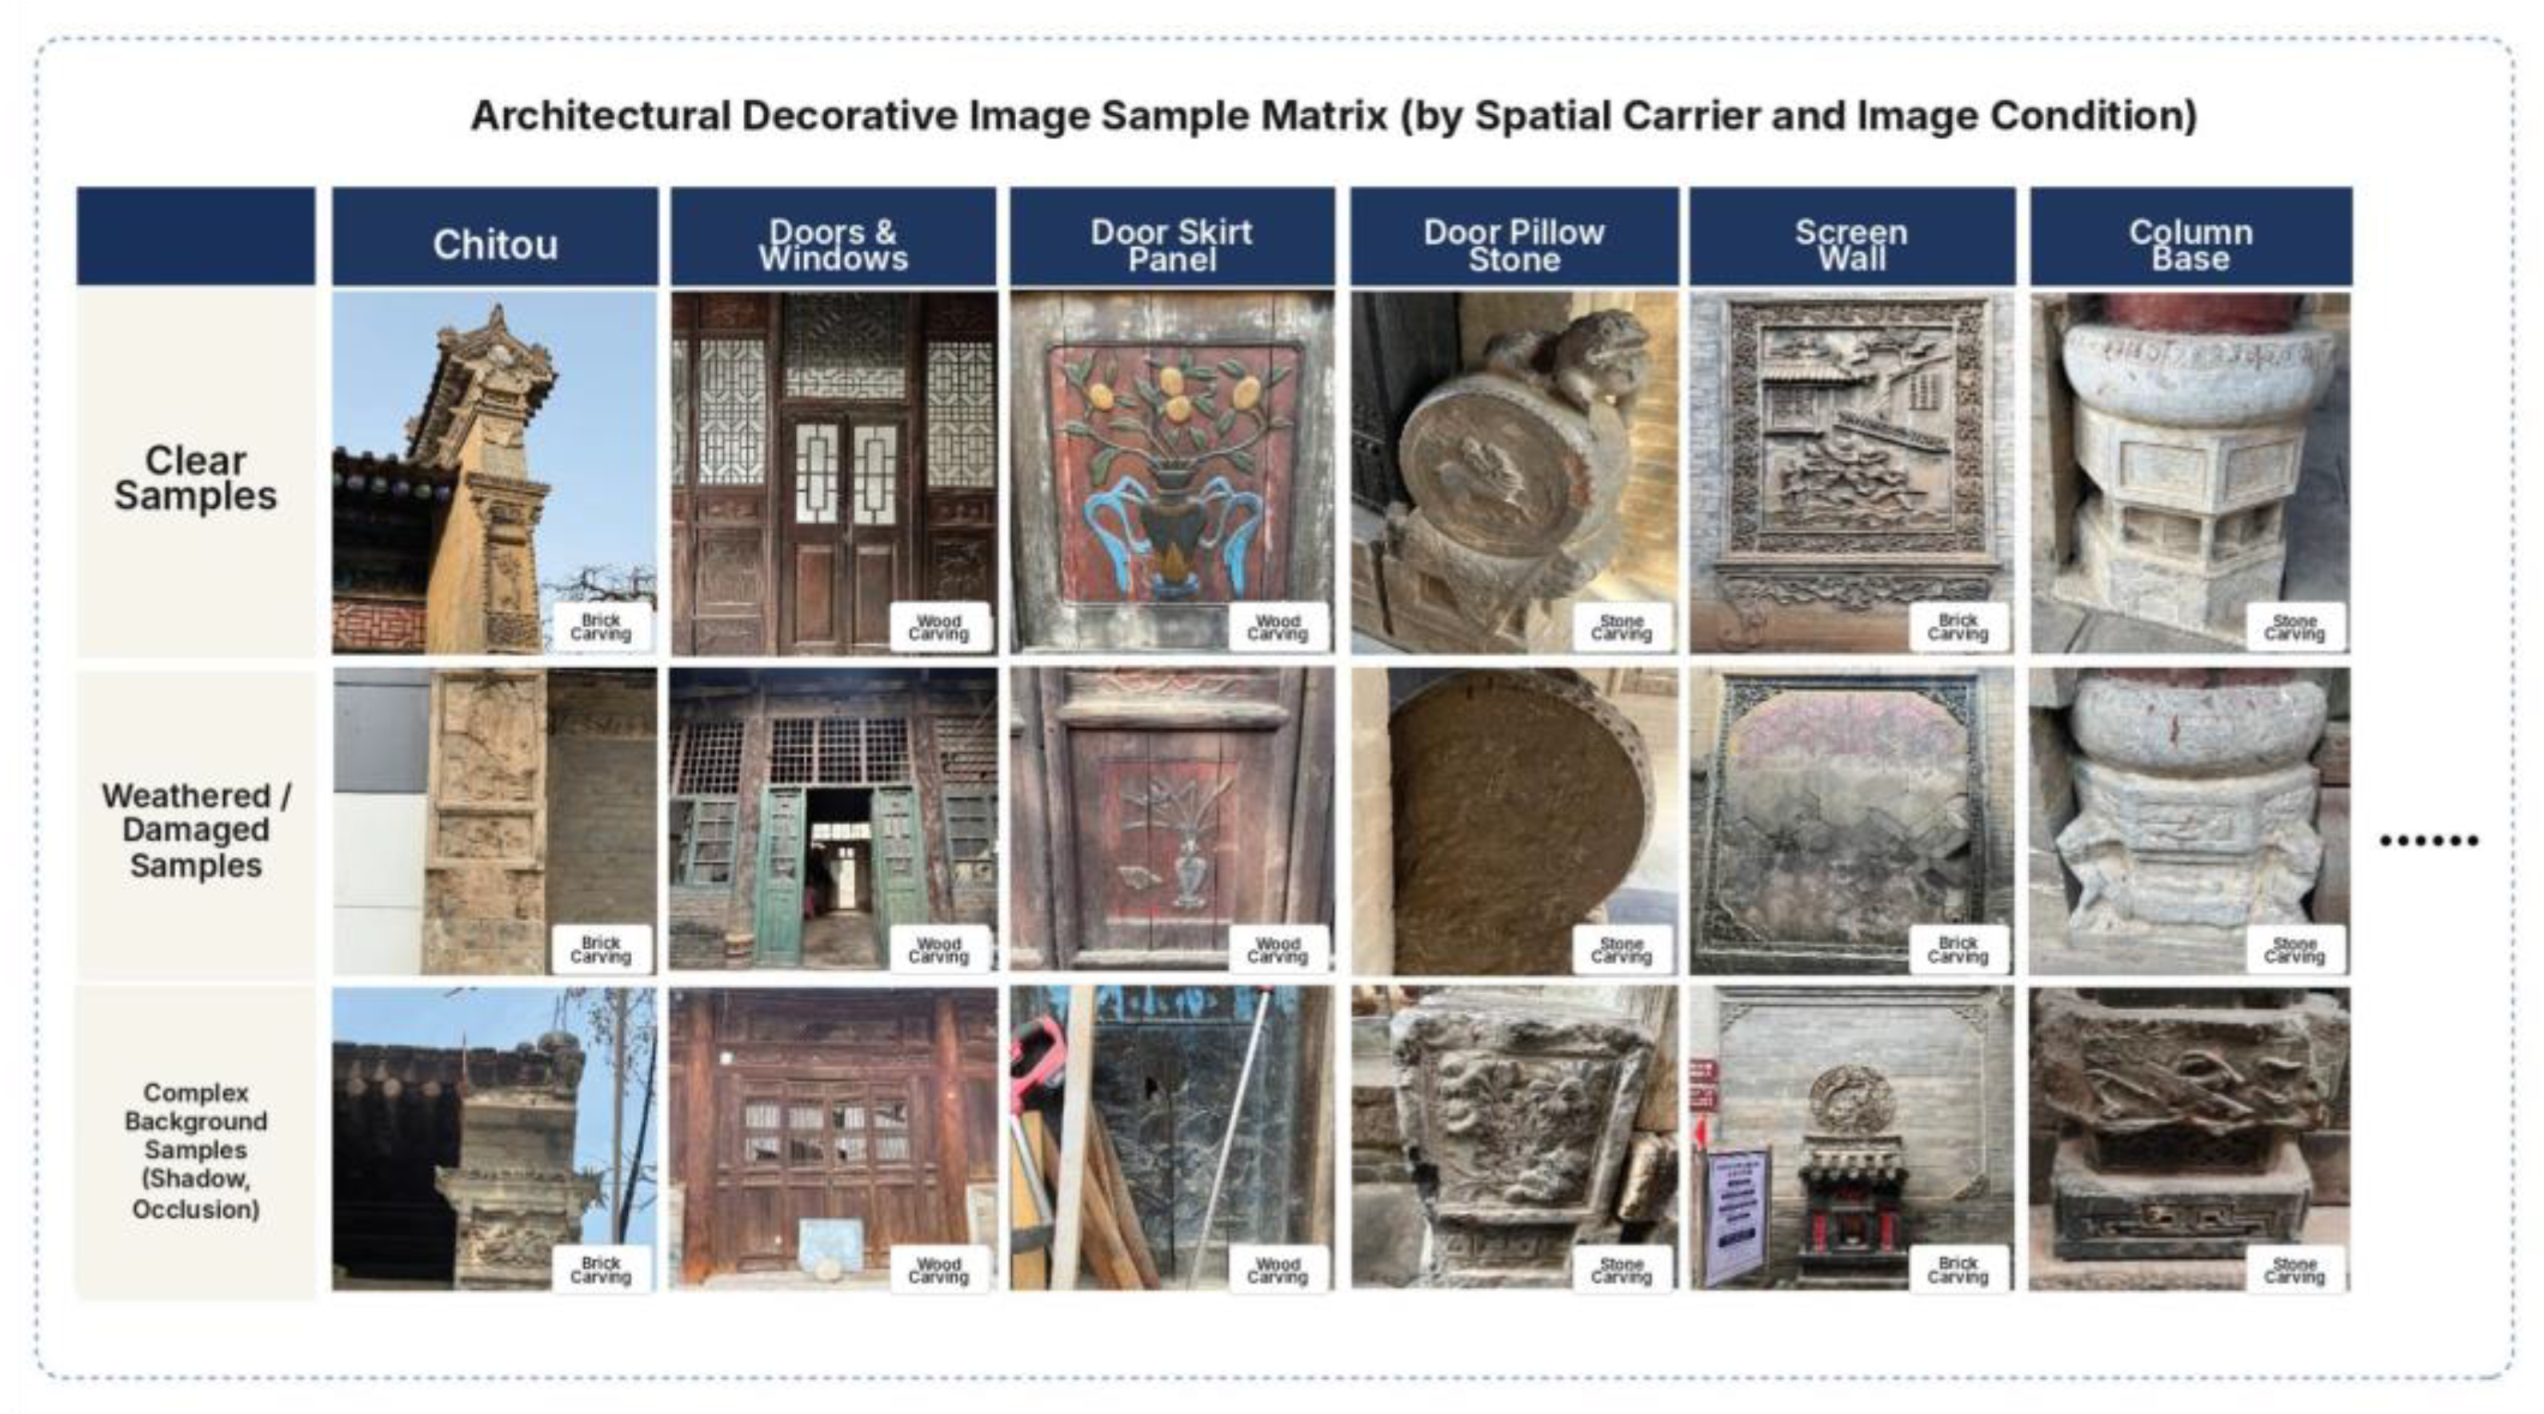
Since the field collected images differed in shooting distance, viewing angle, illumination, and preservation condition (
Figure 2), all samples were preprocessed in a unified manner before training. Images with severe blurring, overexposure, repeated shooting, missing subjects, or motif boundaries that were difficult to distinguish were first removed [
17]. Samples with clear component sources and relatively identifiable motif subjects were retained. For damaged or occluded samples, images were retained when the main features could still be recognized. Samples whose categories could not be confirmed were excluded from the training data. The cropped images were uniformly resized to an RGB format of 224 × 224 × 3. To improve robustness under field conditions, ColorJitter and Random Erasing were used during training. ColorJitter was used to simulate outdoor illumination variation, while Random Erasing was used to simulate partial occlusion, stains, and local physical damage. Rotation and perspective transformation were not used, as they may alter the symbolic orientation and compositional order of architectural motifs.
2.3. Classification System and Annotation Rules
Considering the large number of architectural decorative motif categories in Guanzhong traditional vernacular dwellings, the uneven distribution of samples, and the morphological similarity among some categories, this study adopted a two level classification system to organize motif labels. The first level consists of broad thematic categories, mainly used for category statistics, confusion matrix aggregation, and result interpretation. The second level consists of specific motif names, which serve as the primary label system for model training and testing. Motif category recognition in this study was mainly conducted based on 163 specific categories of architectural decorative motifs. In addition, one non-motif background category was included for rejection training and misrecognition control. Therefore, the complete annotation system contained 164 categories, comprising 163 motif categories and one non-motif category. The non-motif category was not used for typological interpretation, but was used to help the model distinguish decorative motifs from invalid background textures.
The first level included eight categories: plant motifs, animal motifs, human figure motifs, object motifs, character motifs, geometric motifs, composite motifs, and background regions without motifs. For images containing multiple thematic elements, if one element occupied the dominant position, the image was annotated according to that primary element. If multiple elements jointly formed a complete symbolic composition, the image was classified as a composite motif, and the main constituent elements were recorded in the second level label. During annotation, each image sample was assigned a first level category, a second level category, a component location, and an image ID. The second level categories were used for model training and testing, while the first level categories were used for category statistics, confusion matrix aggregation, and result interpretation. Samples with damaged boundaries or partial occlusion were retained when their main features remained identifiable. Samples with severely missing subjects, indeterminable categories, or potential annotation ambiguity were excluded from the valid motif categories. Through these rules, this study preserved fine grained motif information while establishing a stable label system suitable for recognition tasks involving complex field images.
2.4. Setting of Non-Motif Candidate Region Samples
Misrecognition in complex field images arises not only from the similarity among motif categories, but also from texture interference in non-motif regions. Wall cracks, brick joints, spalled surfaces, water stains, shadows, weathered wood textures, and cluttered backgrounds often present distinct edges or linear textures, making them easily confused with categories such as scroll motifs, water wave motifs, and fret patterns. To reduce false positive predictions, this study introduced non-motif candidate region samples. These samples were not included as architectural decorative motif categories for typological statistics. They were mainly used for candidate region rejection training, enabling the model to learn the features of invalid regions such as wall joints, shadows, stains, spalled surfaces, and natural material textures [
18].
3. Recognition Method for Architectural Decorative Motifs
3.1. Overall Framework of the Method
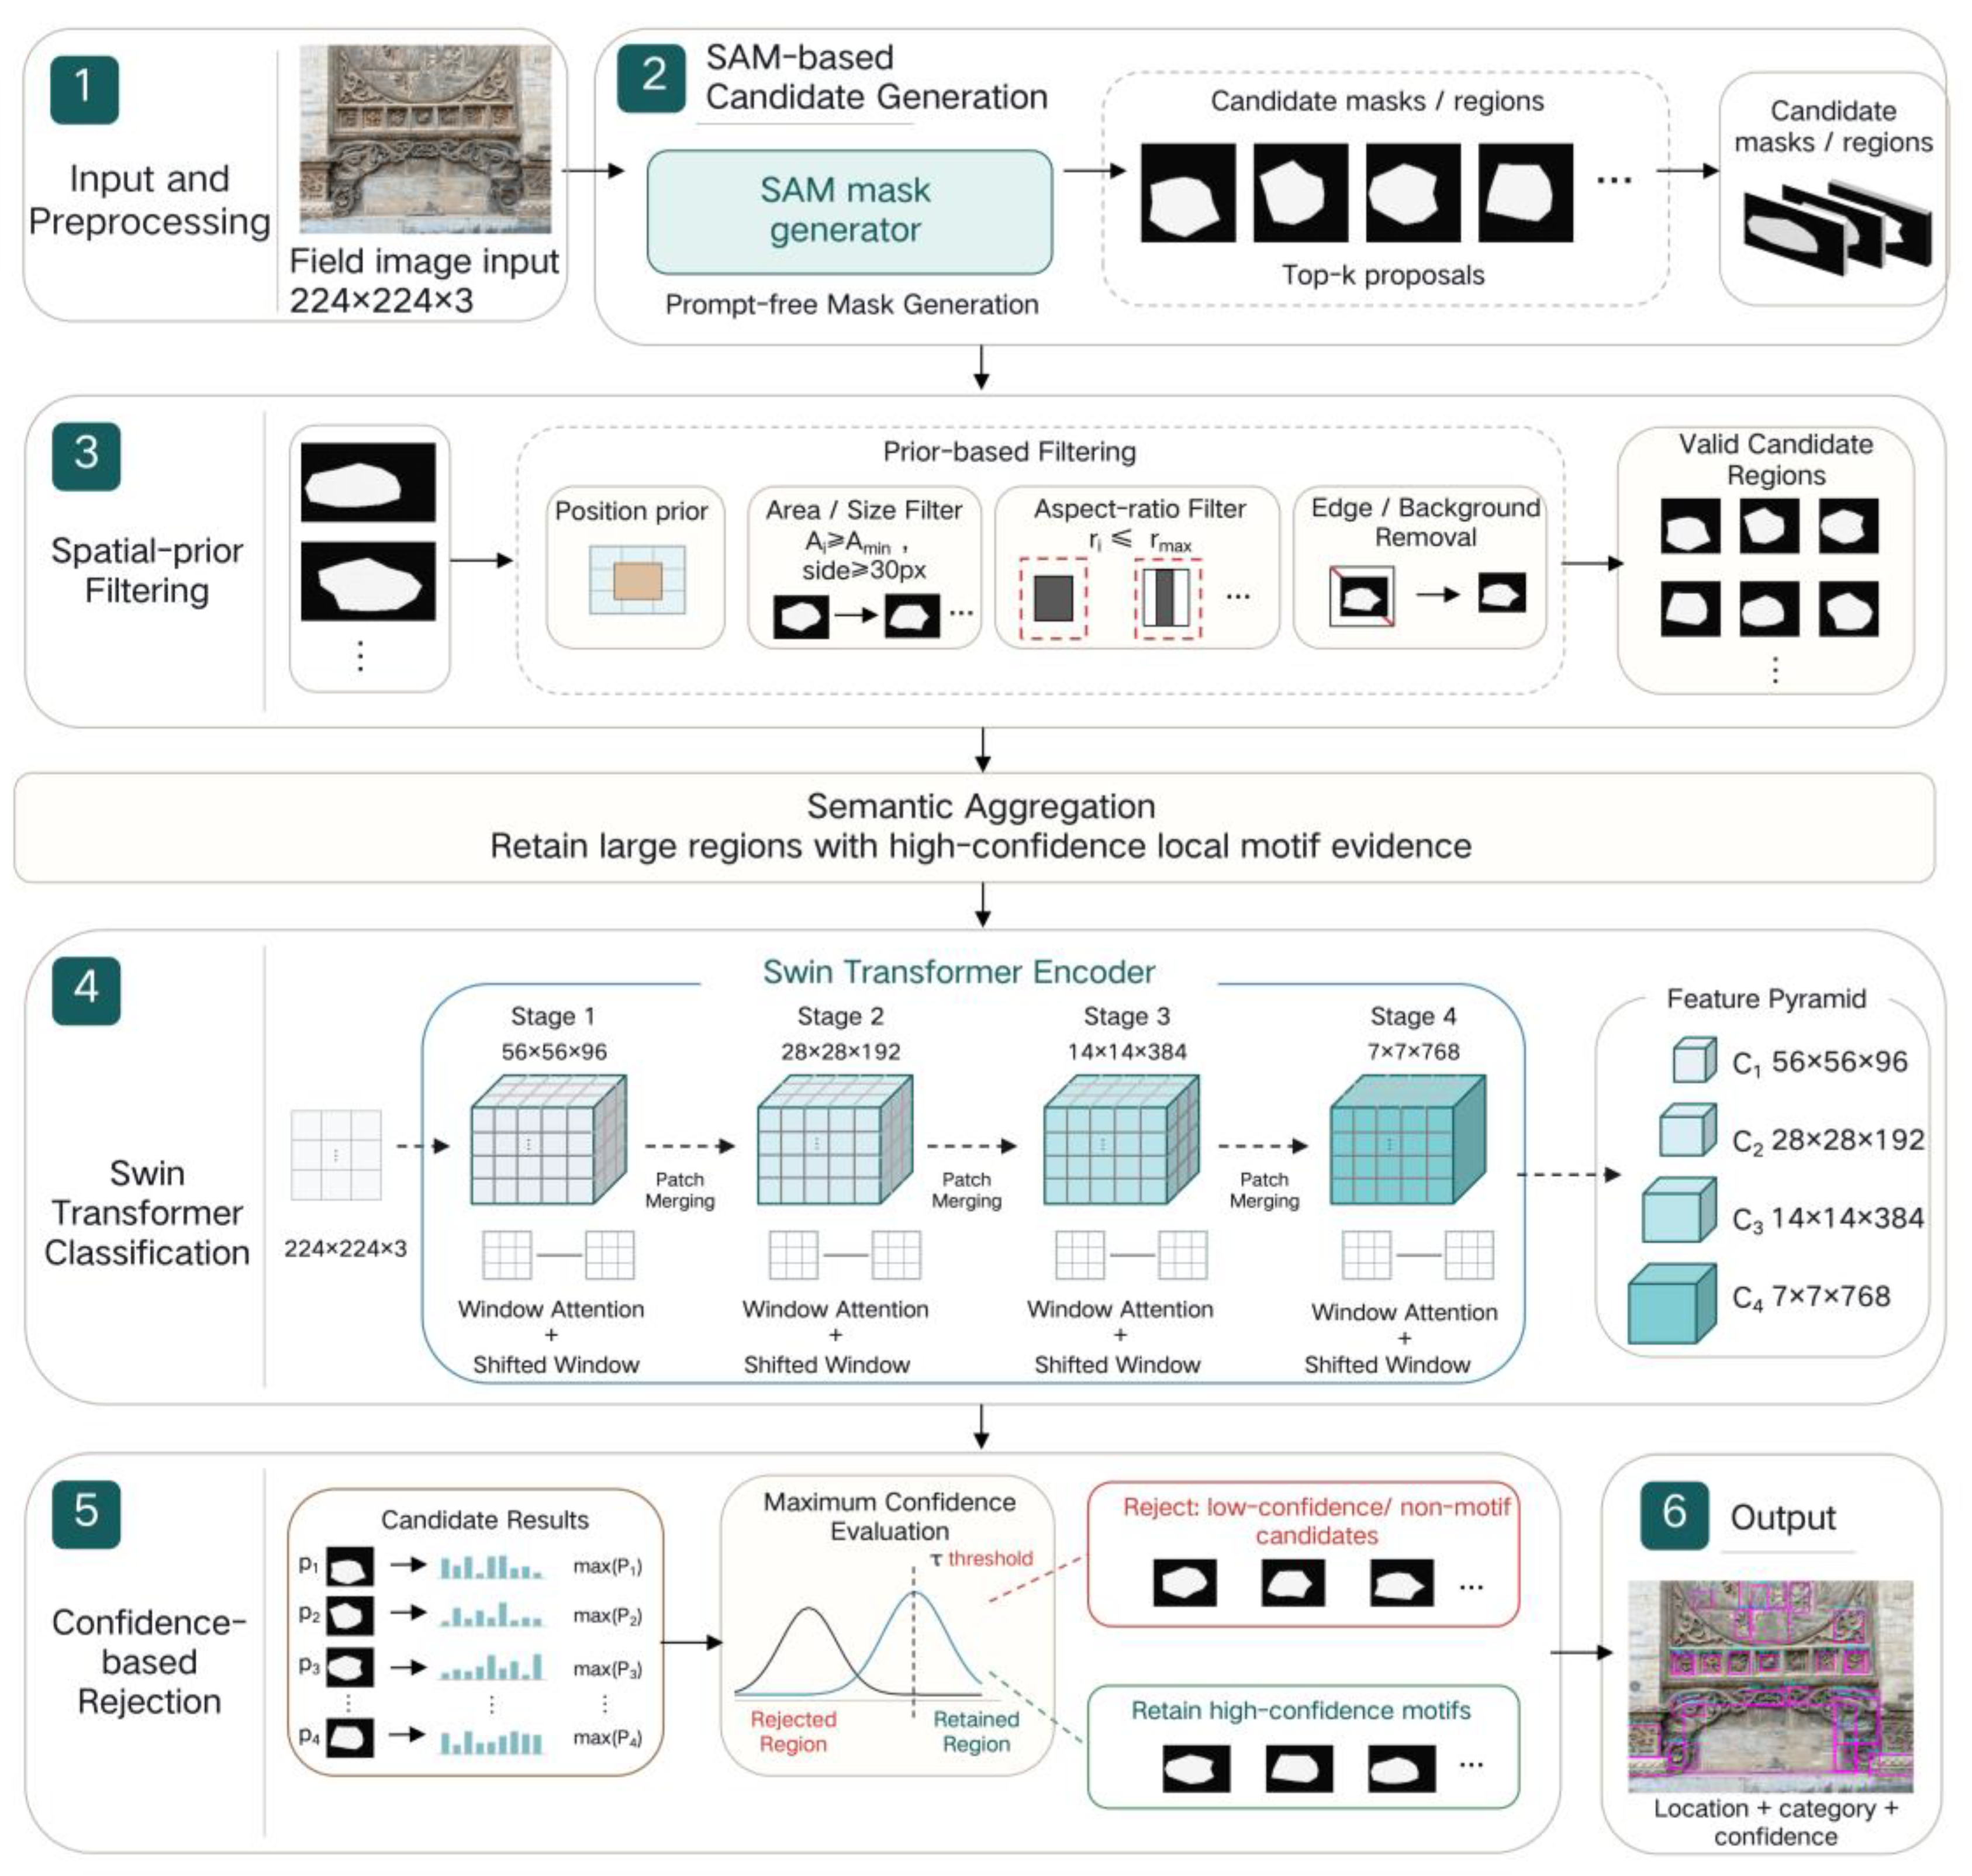
The overall workflow of the proposed method is shown in
Figure 3. To reduce the influence of different shooting conditions on model input, scale and color normalization were first applied to the images of Guanzhong traditional vernacular dwellings. SAM was then introduced to generate potential motif candidate regions from complete images, allowing the recognition process to focus first on local areas that may contain decorative motifs. Since wall backgrounds, cracks, shadows, and fragmented textures may still be included in the candidate regions, spatial-prior filtering based on minimum candidate area, minimum side length, aspect ratio, and SAM stability was further used to remove invalid candidate masks. Large candidate regions were not removed by a fixed maximum-area threshold, but were further verified through semantic aggregation. This step removed invalid regions that clearly did not conform to the morphological characteristics of decorative motifs. The filtered candidate regions were cropped into local images and input into the Swin Transformer classification network. Through its hierarchical feature representation capability, the network extracted both local texture features and overall structural information of the motifs, and then predicted category probabilities. Low-confidence candidate results were further removed through the maximum-confidence-based rejection mechanism. The final output included the candidate region location, motif category, and prediction confidence.
3.2. Field Image Preprocessing
To reduce the influence of input differences in field collected images on subsequent candidate region segmentation and classification recognition, scale normalization and color normalization were applied to the images.
For scale normalization, the original image is defined as follows, where
H and
W denote the image height and width, respectively.
To control GPU memory consumption and reduce scale differences caused by different shooting distances, when the long side of an image exceeded the preset threshold
L, the image size was adjusted through proportional scaling.
where
is the scaling factor, and
denotes the normalized input image. For color normalization, the RGB channels were standardized as follows.
where
denotes the pixel value of the
c-th color channel, and
and
denote the mean and standard deviation of the corresponding channel, respectively.
After scale and color normalization, the image was input into the candidate region segmentation module.
3.3. SAM Based Candidate Region Segmentation
To reduce the uncertainty caused by whole image classification, this study introduced SAM as the candidate region generation module [
19].
SAM was used to perform full-image candidate region generation on field-collected images. In this study, the SAM model was implemented using the ViT-B checkpoint (sam_vit_b_01ec64.pth). The automatic mask generator parameters were set as follows: points_per_side = 32, pred_iou_thresh = 0.88, stability_score_thresh = 0.92, and min_mask_region_area = 200. Other parameters followed the default settings of the SAM automatic mask generator.
The number of generated masks varied across images depending on component scale, surface texture complexity, carving density, and background fragmentation. These candidate masks were then passed to the subsequent filtering and semantic aggregation modules. This setting allowed the system to generate sufficiently dense candidate regions while reducing unstable masks caused by low-quality segmentation proposals.
where
denotes the set of candidate masks, and
denotes the
-th candidate region. Each candidate mask corresponds to a potential visual region in the image.
3.4. Spatial Prior Filtering
The candidate masks generated by SAM contain a large number of non-motif regions. If these regions are directly input into the classification network, they may increase invalid computation and cause non-motif regions to be misidentified as decorative motifs. To reduce such interference, this study introduced a spatial-prior filtering step after candidate region generation. The filtering process mainly considered candidate area, side length, aspect ratio, and morphological stability.
For each candidate mask
mi, its bounding box is extracted as:
where
and
denote the coordinates of the upper-left corner of the bounding box, and
and
denote its width and height, respectively. Let
denote the area of the i-th candidate mask. In the revised workflow, the area constraint was implemented as an absolute pixel threshold rather than a fixed area-ratio threshold. This setting was adopted because field images varied substantially in shooting distance, component scale, and motif size. A strict area-ratio threshold may remove small but valid decorative motifs. Therefore, candidate masks with an area smaller than 200 pixels were removed. In addition, candidate boxes with a width or height smaller than 30 pixels were excluded because they usually corresponded to tiny fragments, noise, or incomplete texture regions.
The minimum area constraint is expressed as:
where
denotes the area of the i-th candidate mask, and
was set to 200 pixels in the implementation.
The aspect ratio constraint was used to remove elongated regions such as wall cracks, brick joints, and shadow lines. The aspect ratio of the candidate box is defined as:
When > , the candidate region was regarded as an elongated invalid region and was removed. In this study, was set to 4.0.
The morphological stability constraint was used to remove unstable or fragmented masks. In the revised implementation, this constraint was implemented through SAM stability_score_thresh. Candidate masks with a stability score lower than 0.92 were removed. This setting helped exclude fragmented regions such as cracks, spalled edges, and scattered stains.
The final threshold settings used in the revised pipeline are summarized in
Table 2.
To further quantify the effect of spatial-prior filtering, this study recorded the number of candidate masks before and after filtering on the complete field-image subset. The SAM automatic mask generator produced an average of 55.33 ± 23.73 raw candidate masks per image. After applying the spatial-prior filtering rules, including minimum candidate area, minimum side length, aspect-ratio constraint, and SAM stability filtering, the average number of retained masks was reduced to 34.13 ± 16.03 per image. These statistics show that the spatial-prior filtering stage removed fragmented or geometrically invalid regions before the subsequent semantic aggregation and classification stages.
As shown in
Table 2, the revised pipeline uses absolute minimum-size constraints, aspect-ratio filtering, and SAM stability filtering. A fixed maximum area threshold was not used; instead, large candidate regions were further verified through semantic aggregation based on high-confidence local motif predictions.
Based on these settings, candidate filtering was implemented as a sequential screening process rather than a single rigid mathematical rule. Invalid small, elongated, or unstable masks were removed, while large candidate regions were further verified through semantic aggregation to avoid incorrectly discarding valid decorative regions with large or irregular spatial scales.
3.5. Swin Transformer Based Motif Classification
In this study, the candidate regions were cropped into local images and input into the Swin Transformer classification network for motif category prediction. The recognition of architectural decorative motifs in Guanzhong traditional vernacular dwellings depends on two types of information. The first includes detailed features such as carved lines, edge contours, material textures, and local damage. The second includes structural features such as symmetrical composition, continuous textures, compositional relationships, and overall shape [
20]. Swin Transformer extracts detailed information through local window attention and establishes connections between adjacent regions through the shifted window mechanism. It is therefore suitable for processing motif images in which local textures and overall structures coexist.
Let the classification network be
, and let the candidate motif image be
. The network output can be expressed as:
where
denotes the category score vector output by the classification network. The prediction probability of each category is obtained through the Softmax function:
where
,
denotes the total number of motif categories, and
denotes the probability that the candidate region belongs to the
i-th motif category. The model obtains the predicted category of the candidate region according to the category probability distribution, and then passes the result to the subsequent confidence based rejection module.
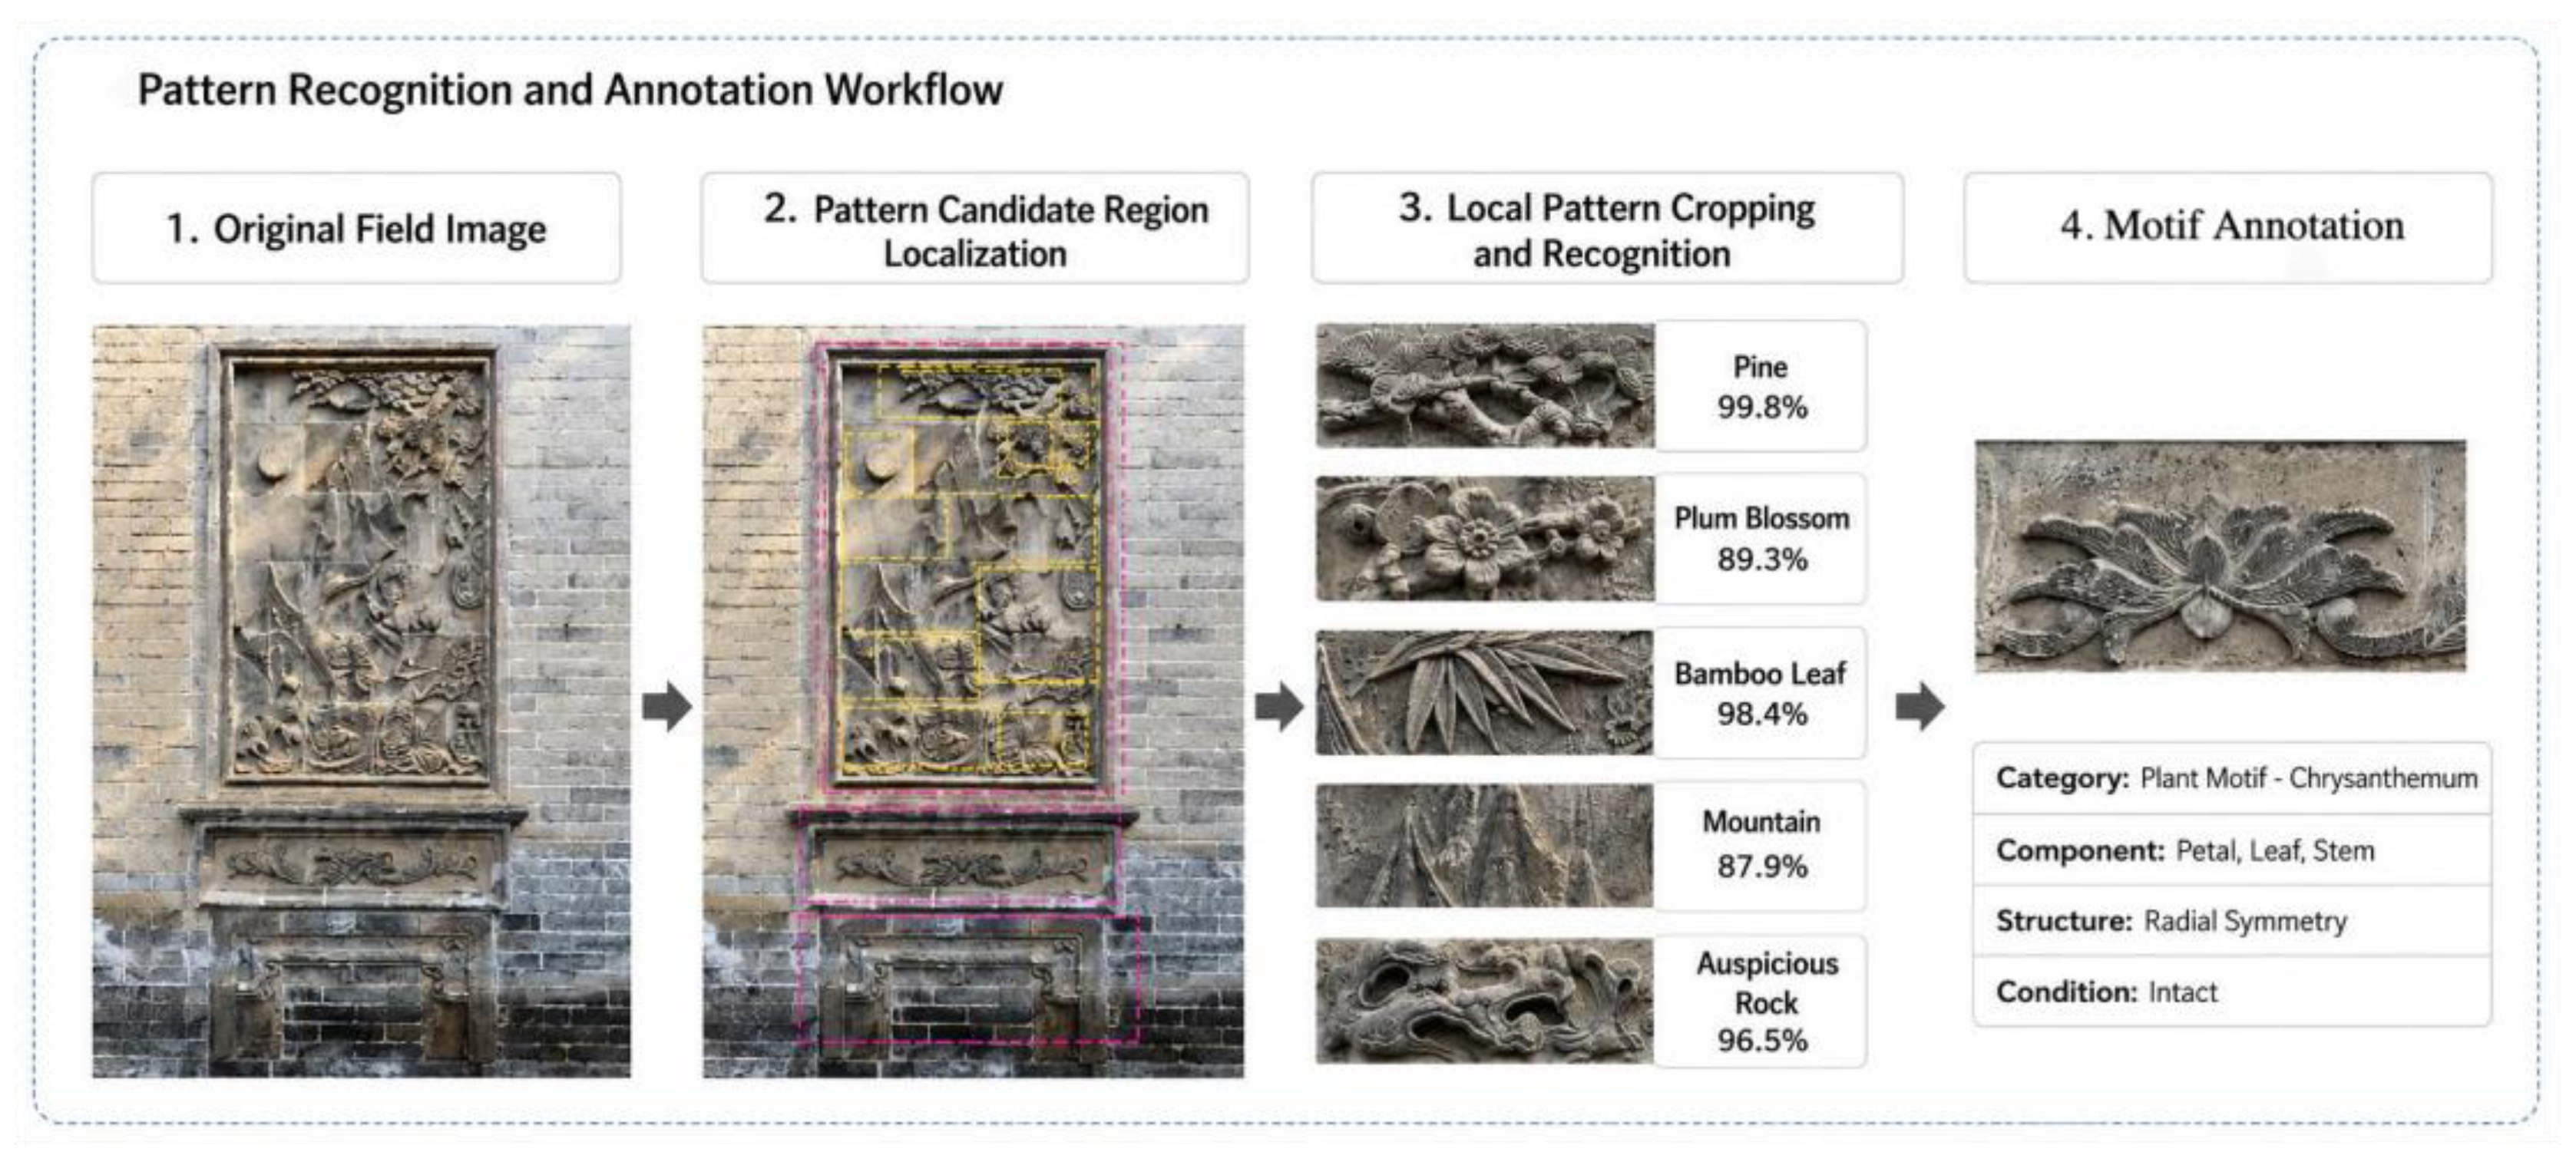
Through the above processing, the motif recognition task is transformed from direct classification of field collected images into local classification at the candidate region level (
Figure 4).
3.6. Maximum Confidence Based Rejection Mechanism
After candidate region generation and spatial prior filtering, a small number of non-motif regions may still enter the classification network. These regions often have strong edge or texture features and may therefore be assigned to a certain motif category during classification. To reduce this type of misrecognition, this study introduced a maximum confidence based rejection mechanism after classification output to filter low confidence candidate results.
For a candidate region
, the classification network outputs the category probability distribution
. The maximum prediction probability is defined as:
The corresponding predicted category is:
When
is lower than the preset threshold
, the model is considered insufficiently reliable in assigning a category to the candidate region, and the system classifies it as background or an invalid region. When
is greater than or equal to
, the candidate region is retained and its predicted category is output. This rule can be expressed as:
where
τ denotes the maximum confidence rejection threshold, and non-motif denotes a non-motif candidate region or an invalid texture region. The confidence rejection threshold
τ was selected on the validation set by comparing macro F1-score, false-positive rate, and candidate recall under different thresholds. In this study, two confidence thresholds were used according to the scale of recognition targets. For macroscopic component anchoring, the confidence threshold was set to
τ = 0.85. For microscopic motif recognition, the confidence threshold was set to
τ = 0.80. These thresholds were selected according to validation-set performance and were used to balance valid motif retention and non-motif texture rejection. Since category-specific thresholds may introduce instability for rare motif categories, this study adopted unified thresholds and discusses adaptive thresholding as a future improvement. This mechanism reduces false-positive predictions from non-motif textures such as cracks, stains, shadows, and damaged surfaces.
4. Experimental Design and Results
4.1. Experimental Settings and Dwelling-Level Grouped Split
The experiments in this study were conducted using Python 3.11 and PyTorch 2.7.1 with CUDA 11.8 acceleration on an NVIDIA GeForce RTX 4090 GPU (NVIDIA Corporation, Santa Clara, CA, USA). SAM was implemented using the publicly released Segment Anything ViT-B checkpoint, and the YOLOv8 baseline was implemented using YOLOv8n in the Ultralytics YOLOv8 framework. All input images were resized to 224 × 224 × 3 before being fed into the classification network. Cross-Entropy Loss was used for model training, and macro-averaged Precision, Recall, and F1-score were reported to reduce the dominance of frequent categories in performance interpretation. The initial learning rate was set to 1 × 10
−4, and a cosine annealing strategy was adopted to adjust the learning rate. The batch size was set to 32, and the model was trained for 100 epochs.
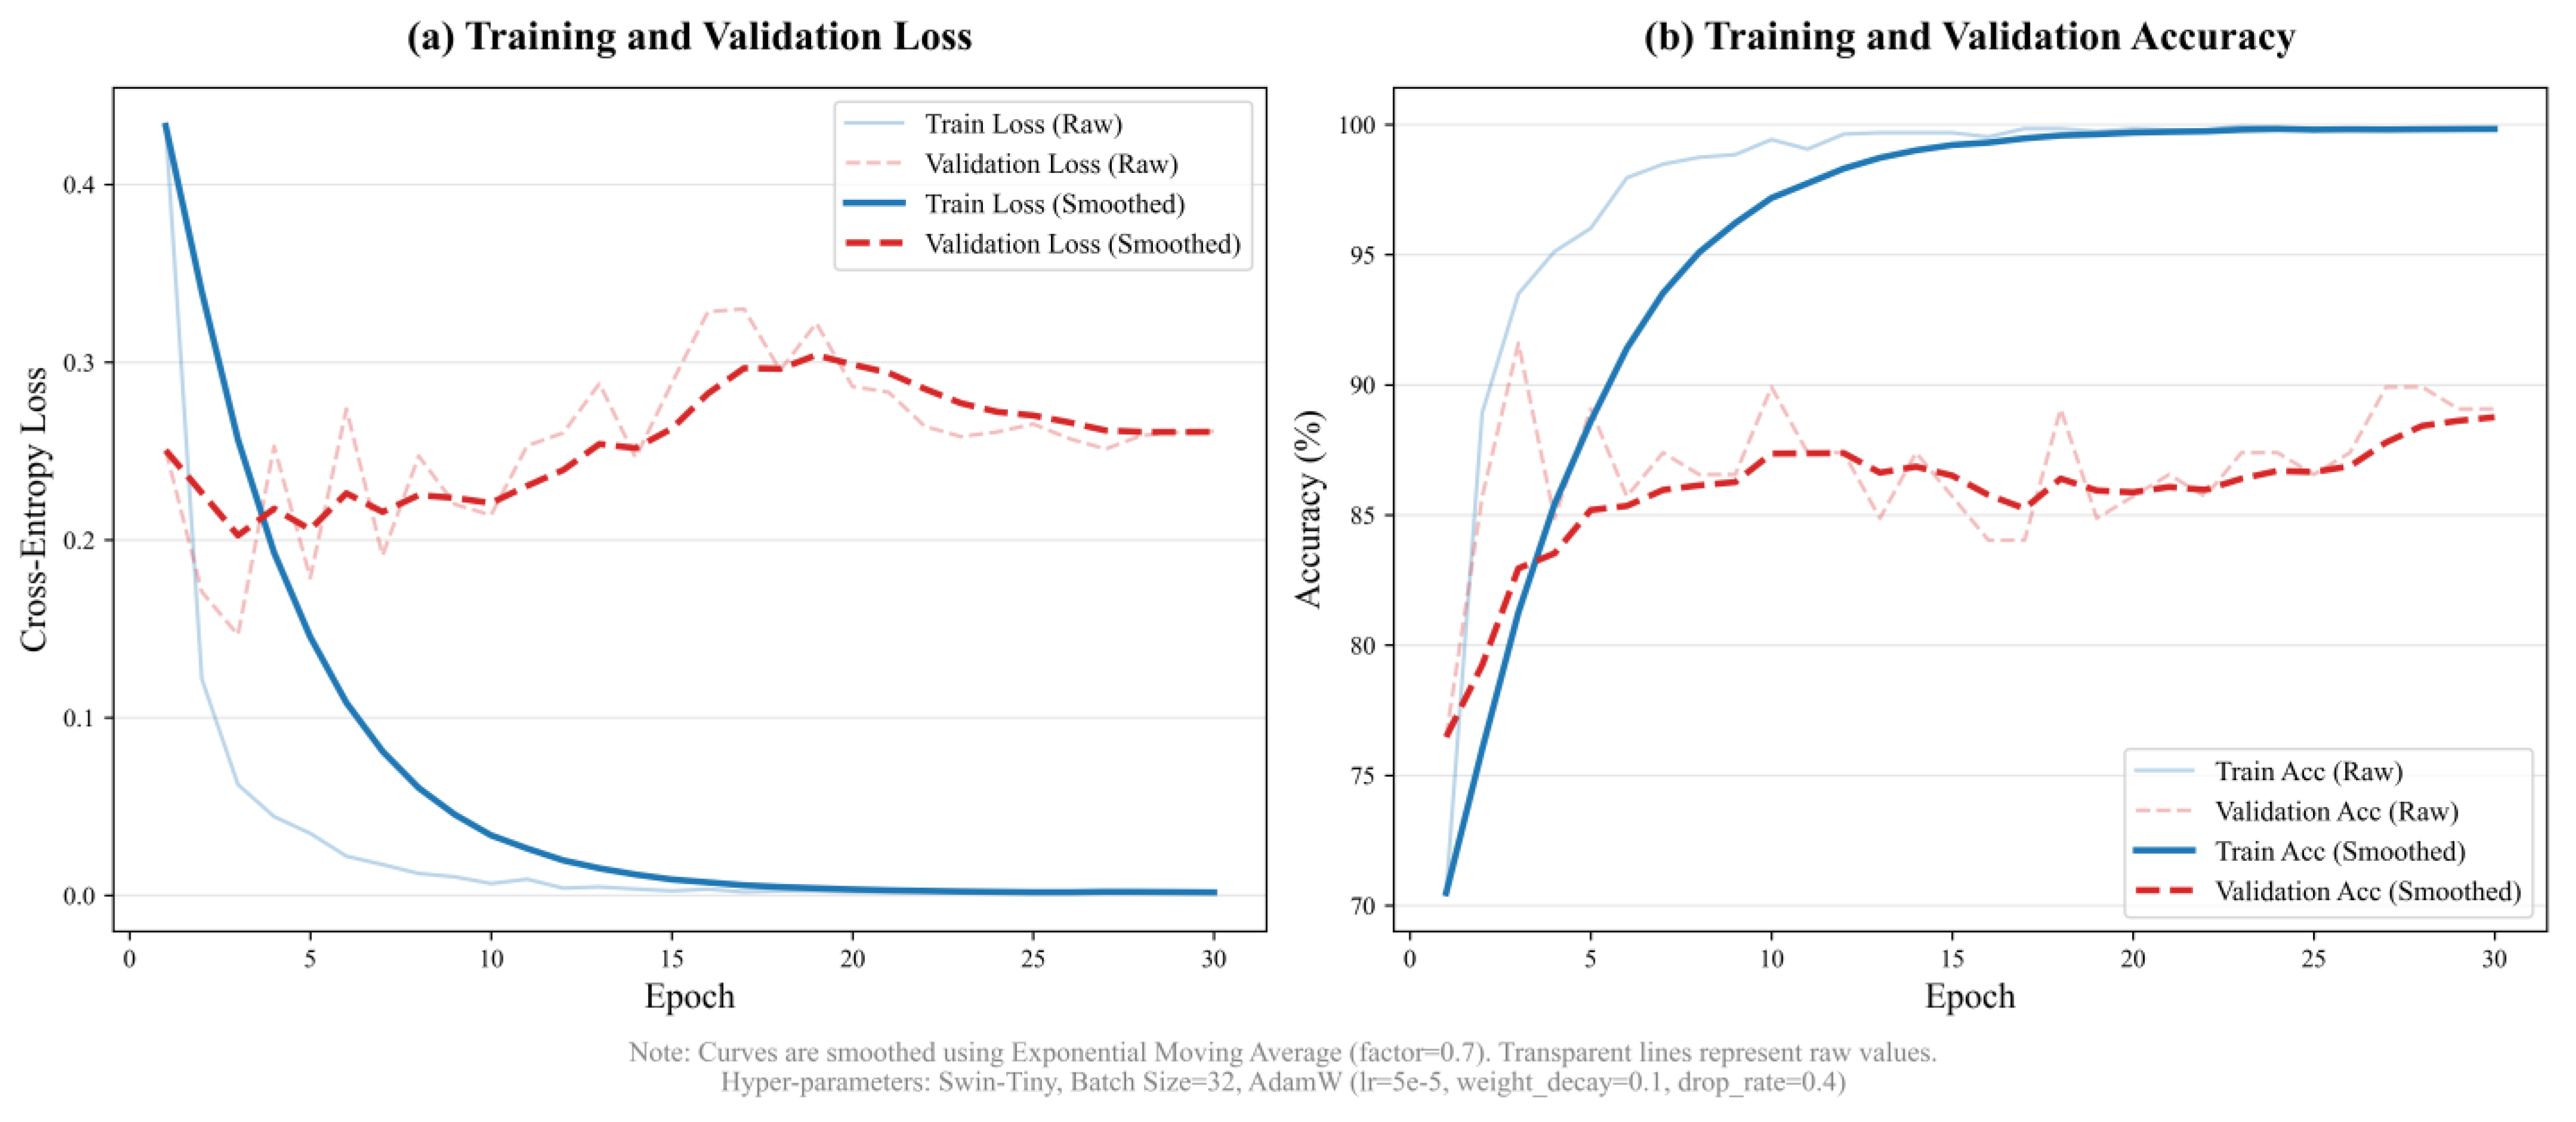
Figure 5 shows the training and validation curves during the first 30 epochs, when the main convergence process occurred. During training, the optimal model parameters were saved according to the macro F1-score on the validation set and the change in validation loss.
To avoid information leakage caused by visually similar images from the same dwelling, component, or motif instance, the experiments were reorganized using a dwelling-level grouped split. All images collected from the same dwelling were assigned to only one subset. For the component-level grouped evaluation, the training set contained 17 dwellings and 2091 images, the validation set contained 6 dwellings and 121 images, and the test set contained 10 held-out dwellings and 351 images. This split refers to the component-level experimental subset used for grouped evaluation, rather than to the entire field-image archive. This grouped split provides a stricter evaluation setting than the previous random split because the test samples come from dwellings that were not seen during training or validation.
The training and validation curves for the component-level anchoring classifier are shown in
Figure 5. The classifier converged rapidly during the main training stage, and the validation accuracy remained relatively stable after the early epochs, indicating that the model reached a stable training state under the revised grouped-split setting.
4.2. Evaluation Metrics
The proposed workflow was evaluated at three levels. First, training and validation curves were used to observe the convergence behavior of the classifier. Second, component-level recognition was evaluated on the dwelling-level grouped test set to examine cross-dwelling generalization. Third, the complete workflow was evaluated on full field images using expert verification.
Cross-Entropy Loss was used for multi-class classification. It is defined as:
where
denotes the number of classes,
is the one-hot encoded ground-truth label, and
denotes the predicted probability of class k.
For the component-level evaluation, Accuracy was calculated as the micro-averaged accuracy over all test samples:
where
denotes the total number of test samples,
denotes the ground-truth label,
denotes the predicted label, and
is an indicator function.
For each valid component class
, Precision, Recall, and F1-score were calculated as:
where
,
, and
denote the true positives, false positives, and false negatives of class
, respectively.
The macro-averaged Precision, Recall, and F1-score were calculated as:
where
denotes the number of valid component classes. The non-motif category was used during rejection training and false-positive control, but it was excluded from the macro-averaged component recognition metrics. This setting was adopted to evaluate the recognition performance of valid decorative components without inflating the results through the background class.
For complete field-image evaluation, this study used the Expert-Verified Localized Hit Rate (EV-LHR):
where
denotes the number of expert-verified localized-hit cases, and
denotes the total number of complete field images evaluated.
4.3. Candidate Generation and Spatial Filtering Statistics
To quantify the behavior of the SAM candidate-generation stage, this study recorded the number of candidate masks before and after spatial-prior filtering on the complete field-image subset. The SAM automatic mask generator produced an average of 55.33 ± 23.73 raw candidate masks per image. After applying spatial-prior filtering based on minimum candidate area, minimum side length, aspect-ratio constraint, and SAM stability filtering, the average number of retained masks was reduced to 34.13 ± 16.03 per image.
These statistics indicate that the spatial-prior filtering stage removed fragmented or geometrically invalid regions before the subsequent semantic aggregation and classification stages. Since semantic aggregation was used as a subsequent confidence-based verification process rather than as a fixed mask-count filtering threshold, this study reports the quantitative reduction before and after the explicit spatial-prior filtering stage.
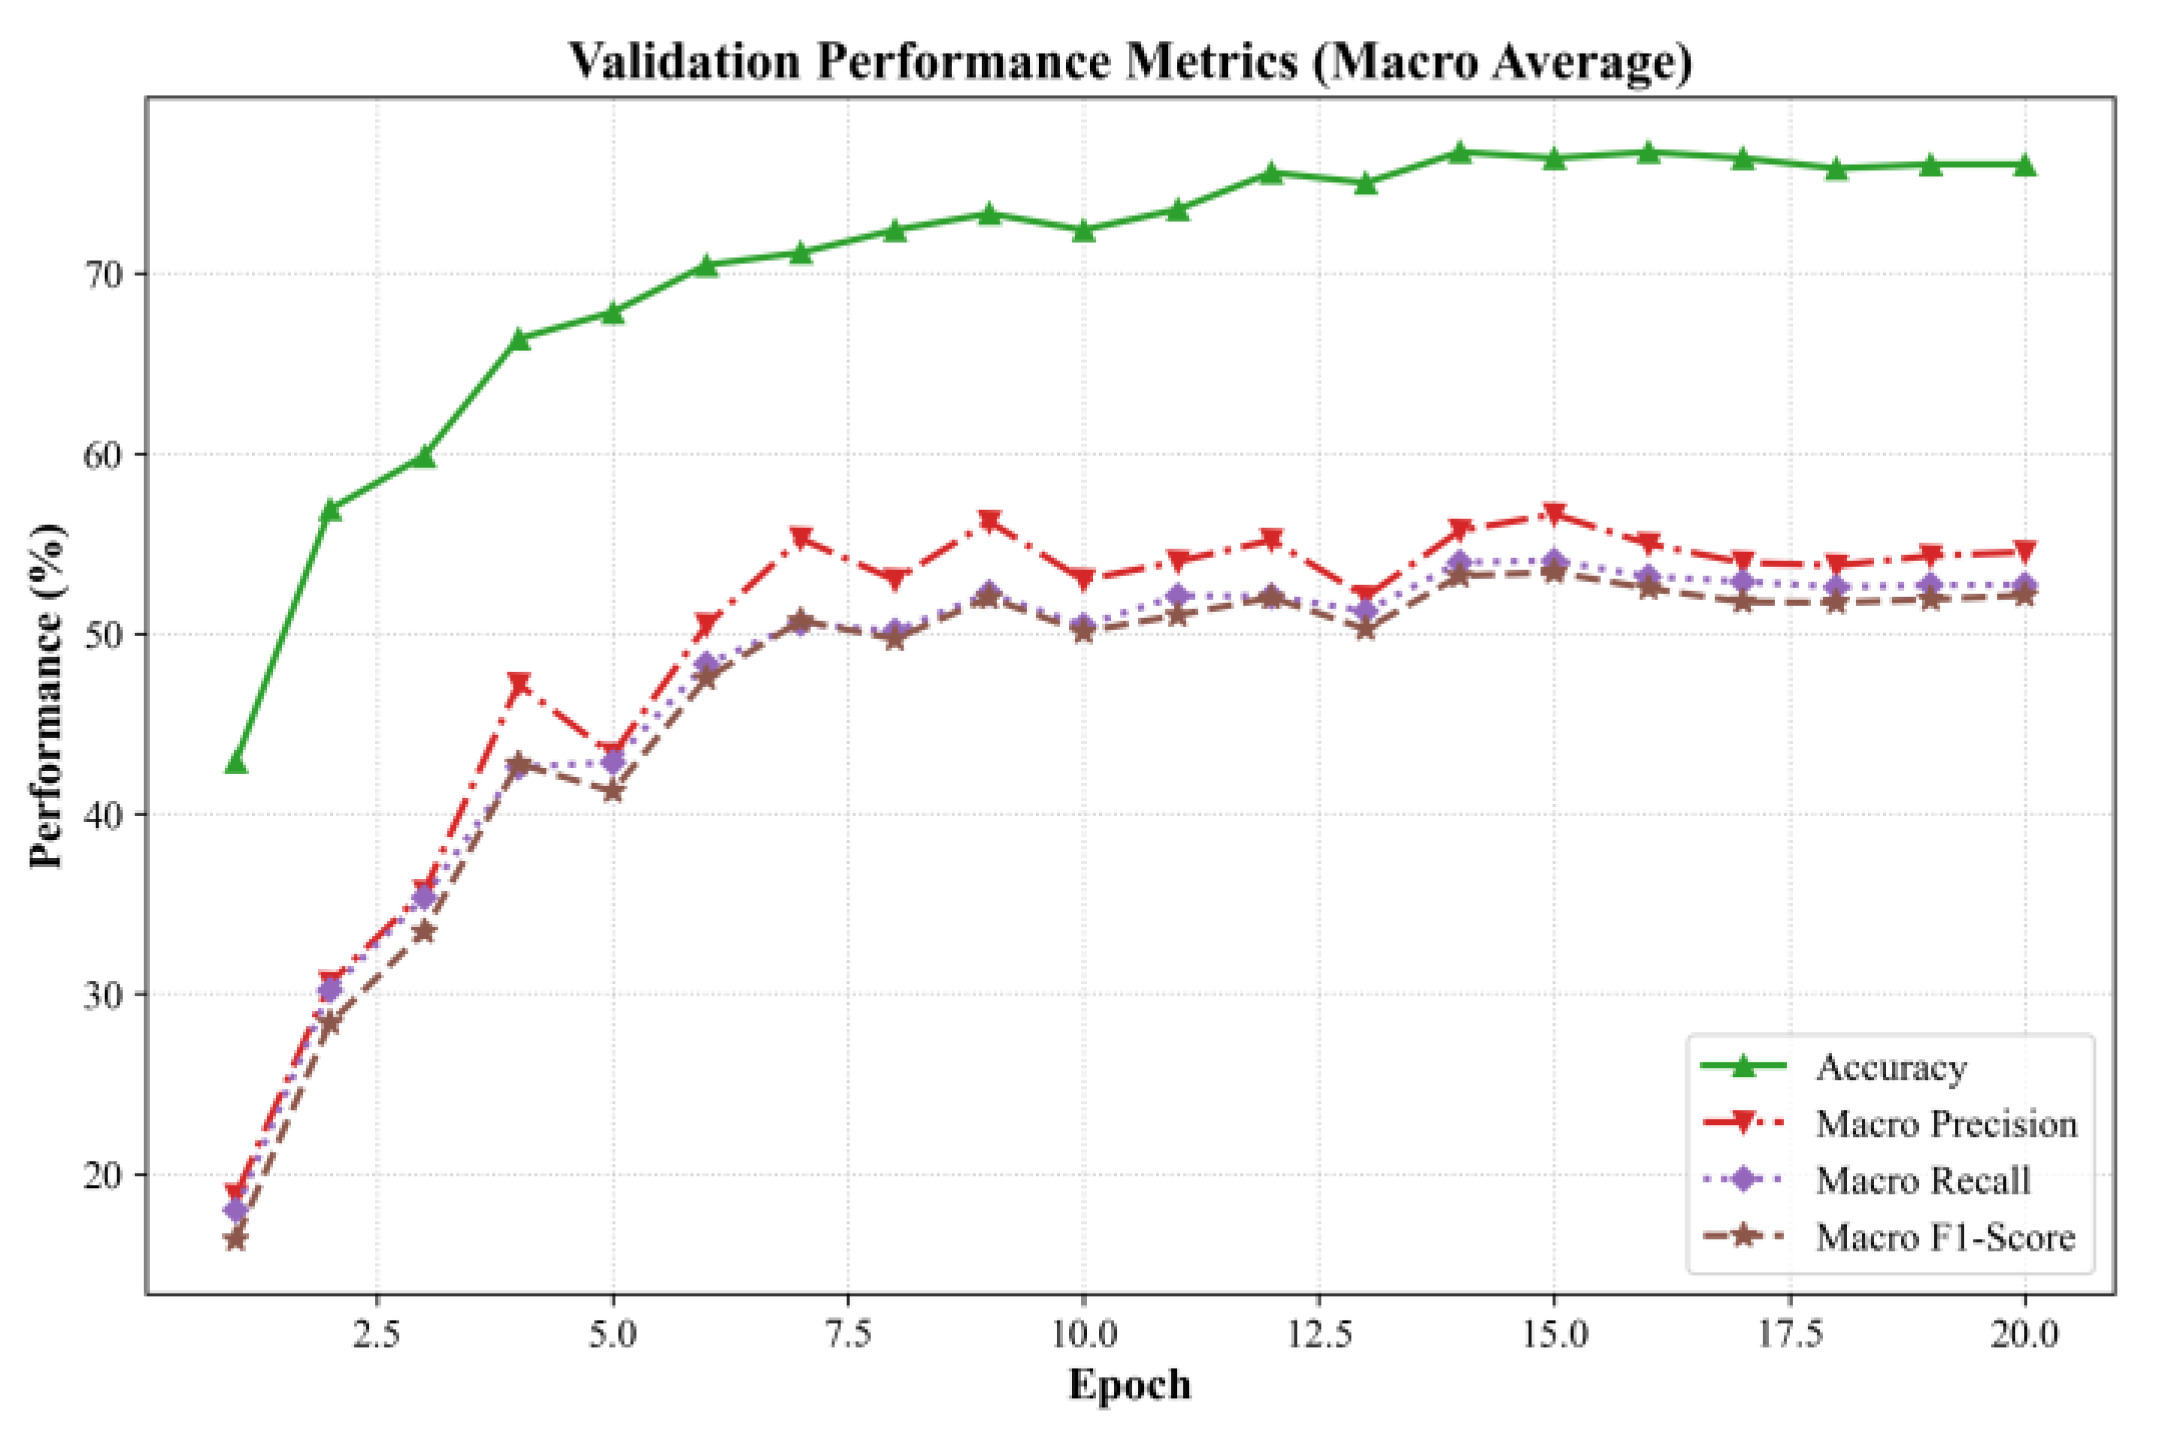
The validation performance curves for fine-grained motif recognition are shown in
Figure 6. The overall validation accuracy was consistently higher than the macro-averaged metrics, indicating that frequent categories contributed more strongly to the overall accuracy, while rare motif categories reduced macro Precision, macro Recall [
21], and macro F1-score. Therefore, macro-averaged metrics were used together with Accuracy to provide a more balanced evaluation under the long-tailed category distribution [
22].
4.4. Component-Level Test-Set Evaluation
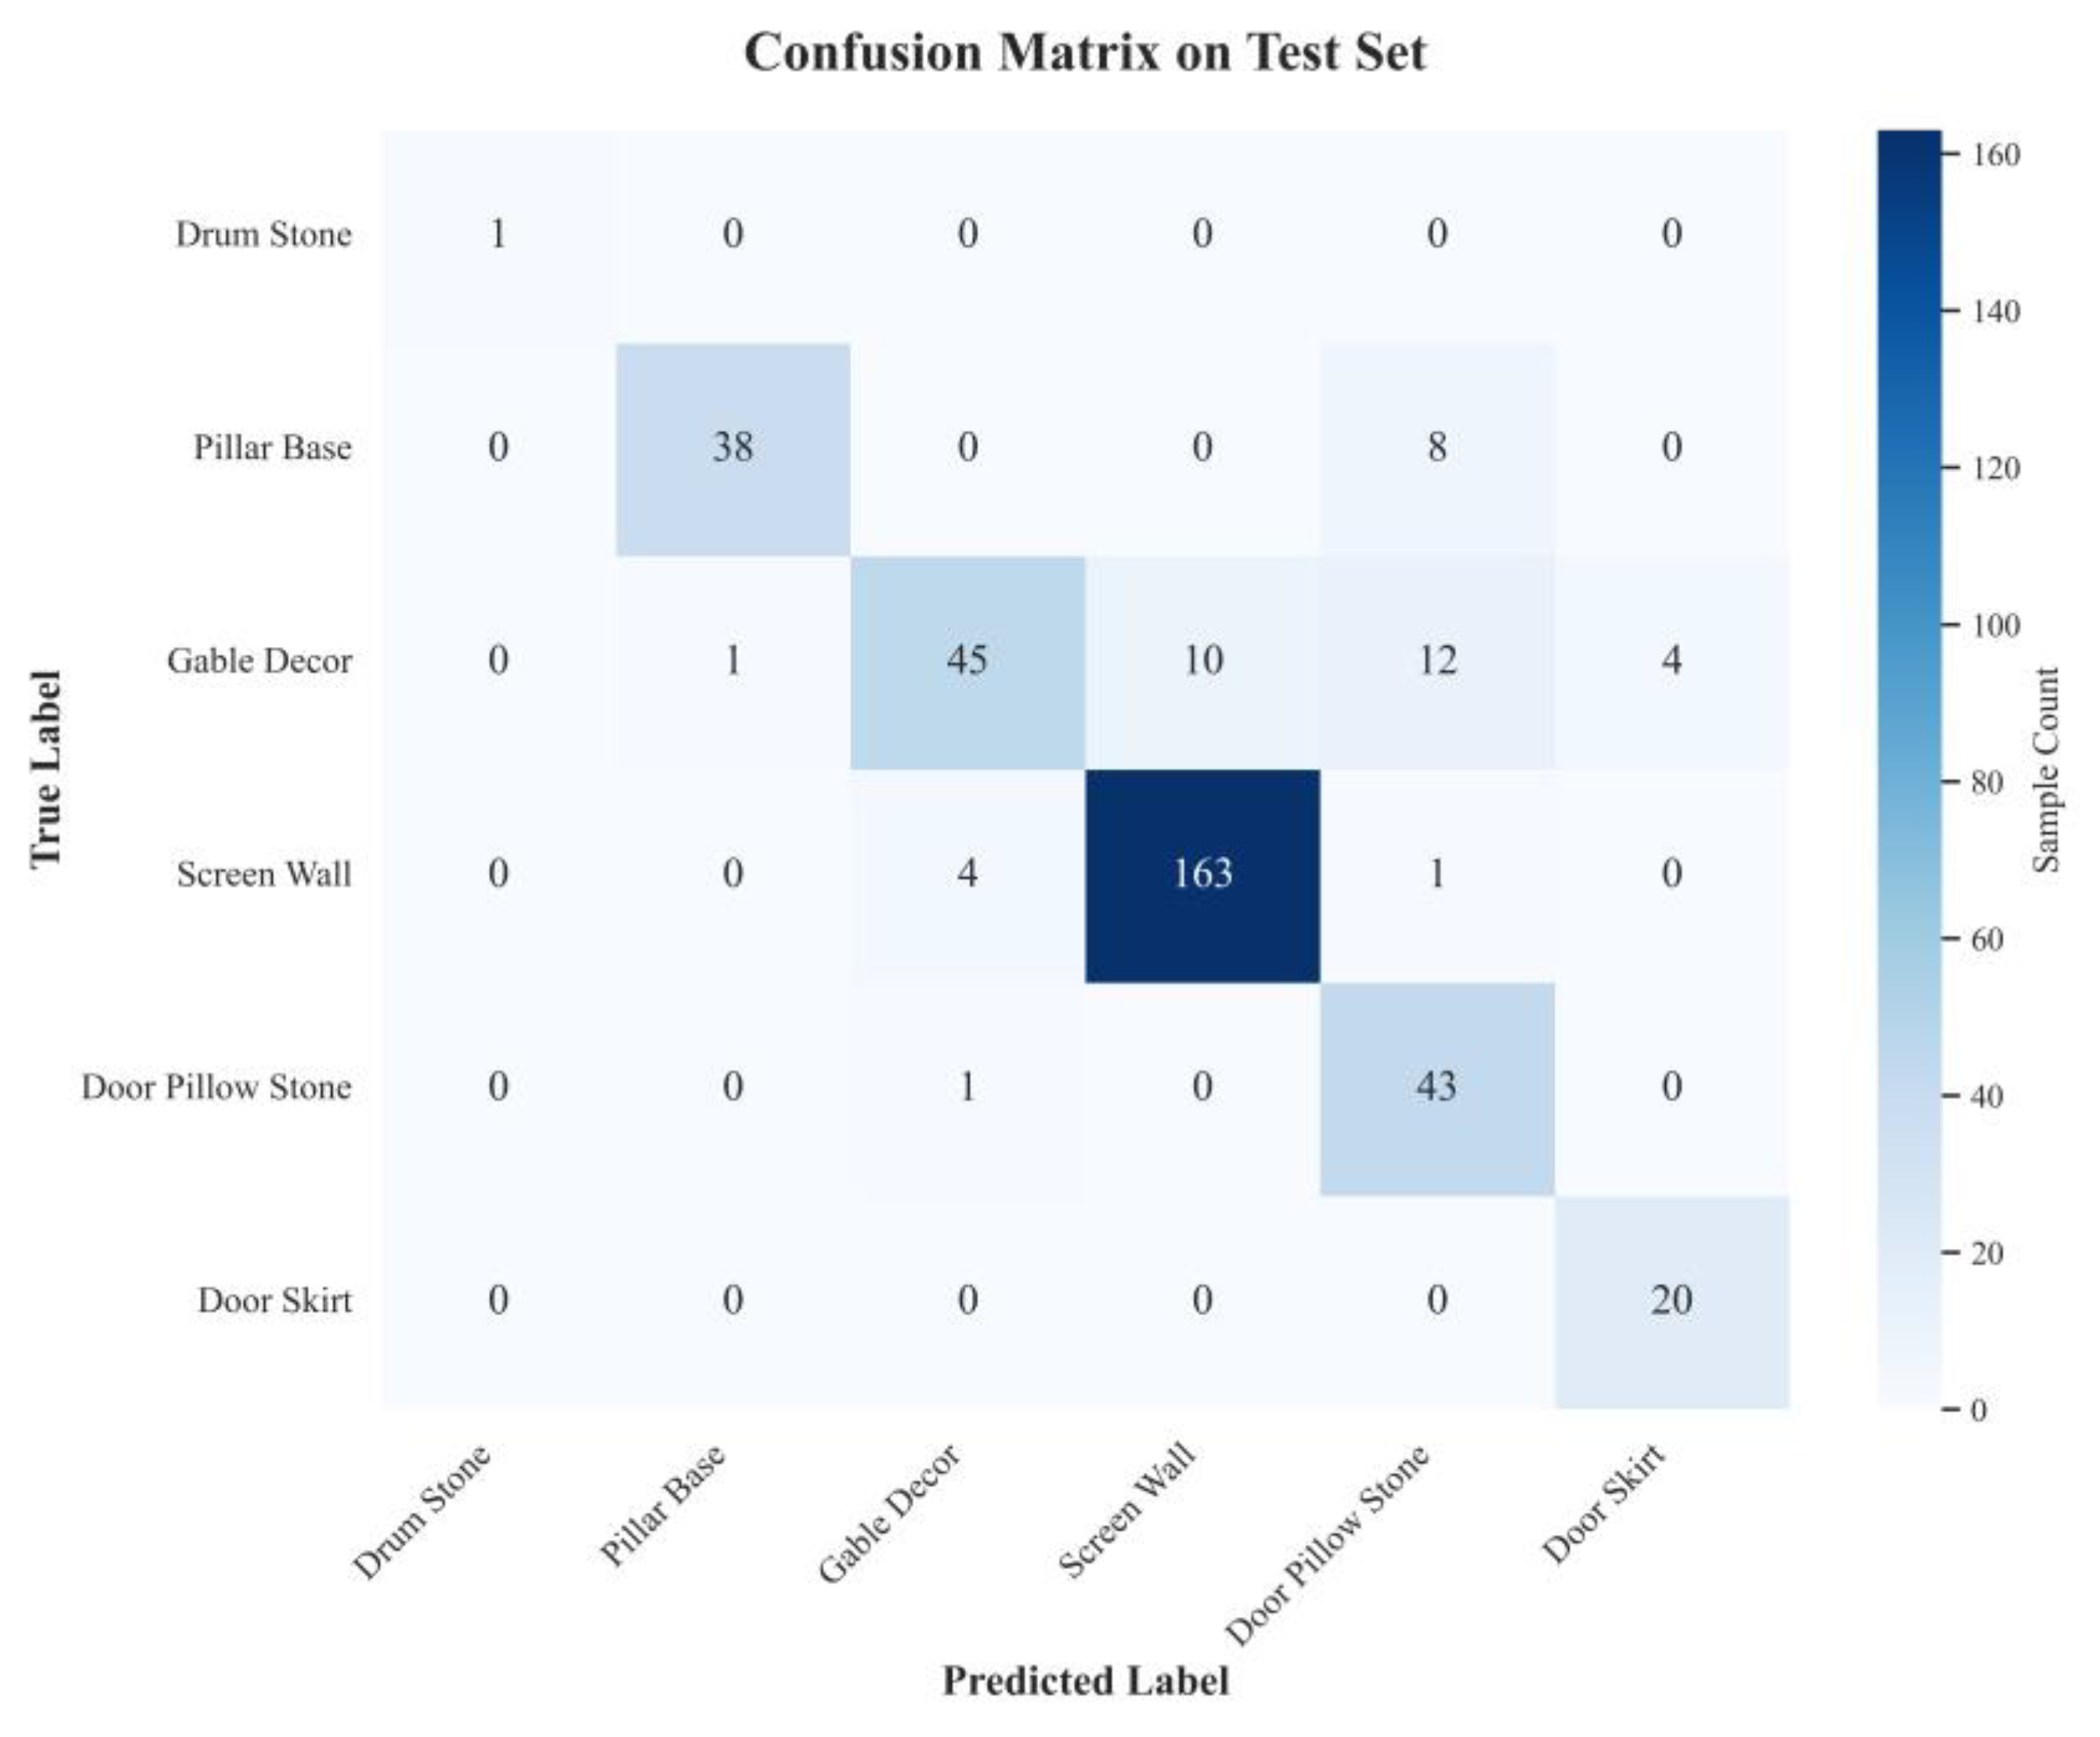
The component-level recognition performance was recalculated under the dwelling-level grouped test split. The test set contained 351 component-level samples from 10 held-out dwellings and covered six major decorative component categories: drum stone, pillar base, gable decor, screen wall, door pillow stone, and door skirt.
Table 3 reports the class-wise performance and overall metrics.
As shown in
Table 3, the proposed method achieved a micro-averaged Accuracy of 88.32%, a macro Precision of 88.70%, a macro Recall of 89.98%, and a macro F1-score of 88.22%. These values replace the previous results obtained under the earlier random split and provide a stricter evaluation of cross-dwelling generalization.
The corresponding component-level confusion matrix is shown in
Figure 7. This confusion matrix was computed strictly on the dwelling-level grouped test set, rather than on the validation set or the full evaluated dataset. Most samples were concentrated along the diagonal. The main errors occurred between gable decor, screen wall, and door pillow stone, which may be related to their similar carved surfaces and spatial attachment characteristics in field images.
4.5. Complete Field-Image Evaluation
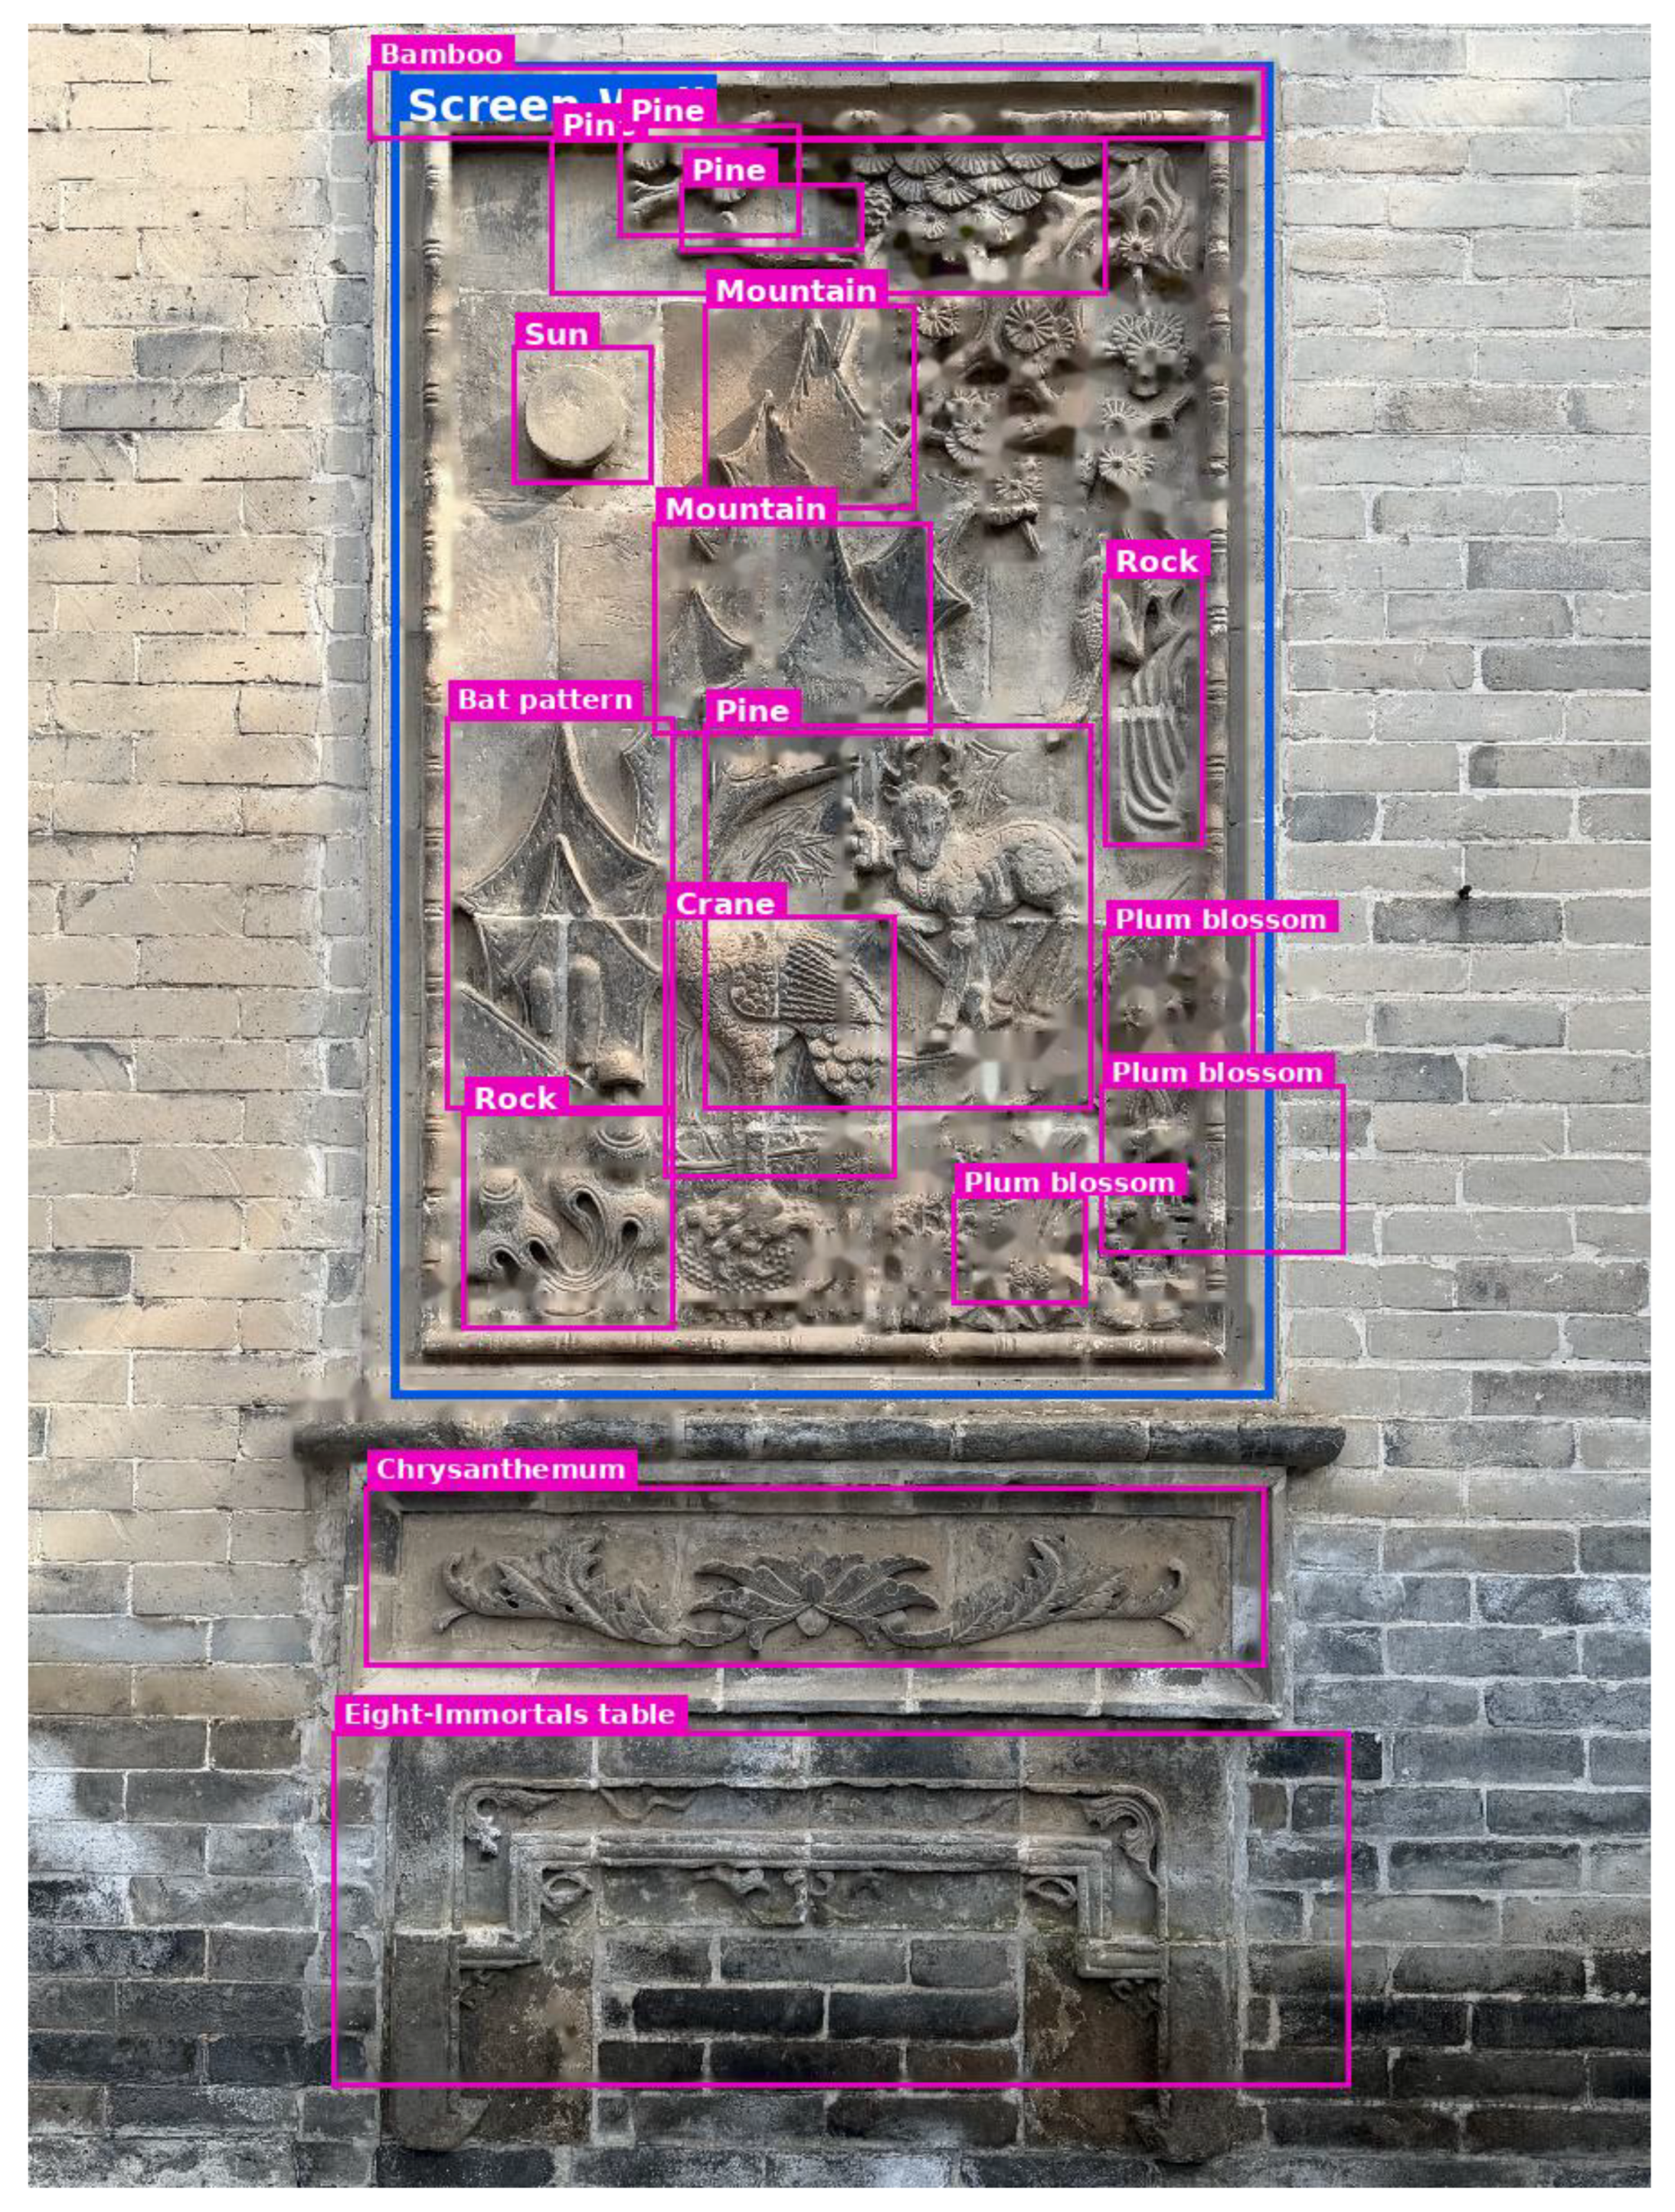
To evaluate whether the proposed workflow can operate on complete field images rather than only cropped samples, this study further tested 60 complete field images. These images covered typical decorative components, including screen walls, gable decor, door pillow stones, pillar bases, and door skirts, and included common field interferences such as weathering, occlusion, shadows, wall seams, damaged textures, and background clutter. A typical recognition result is shown in
Figure 8.
For the complete-field-image evaluation, EV-LHR was calculated through a blind expert-verification protocol. A single senior domain expert in architectural heritage documentation independently evaluated the localized outputs. The expert only viewed the images with predicted boxes and was not informed whether each result was generated by YOLOv8n or by the proposed method. A prediction was counted as a localized hit when the output region covered the main decorative component or motif area and excluded excessive background interference, such as blank walls, wall seams, shadows, and damaged textures. Since the evaluation was conducted by one expert, inter-rater agreement metrics such as Cohen’s kappa and disagreement-resolution procedures were not applicable.
For the YOLOv8 baseline, the YOLOv8n variant was used because of its lightweight structure and efficient inference speed. The model was trained for 30 epochs. Its bounding boxes were automatically generated from the first-stage pipeline as high-confidence pseudo-labels through semantic aggregation, without manual bounding-box annotation. During testing, the confidence threshold was set to 0.15 to maximize the recall of the baseline model, and the IoU threshold for non-maximum suppression was set to 0.45. YOLOv8n was evaluated on the same 60 complete field images as the proposed method.
YOLOv8n was evaluated on the same 60 complete field images as the proposed method. The 95% confidence intervals were calculated using the binomial proportion method. The evaluation results are shown in
Table 4.
The proposed workflow achieved an EV-LHR of 68.3% with a 95% confidence interval of 56.6–80.0%, outperforming YOLOv8n by 10.0 percentage points under the same complete-field-image evaluation setting. These results indicate that the proposed method provides more stable macroscopic anchoring in complete field images with wall textures, shadows, weathering, and background interference.
4.6. Module Configuration
To clarify the structure of the proposed workflow,
Table 5 summarizes the modules included in each configuration. This table is used to explain the functional composition of the pipeline rather than to report detection-style ablation metrics. Since dense bounding-box or pixel-level annotations were not available for all complete field images, mIoU, AP50, and AP75 were not reported in this study.
As shown in
Table 5, the proposed workflow combines SAM-based candidate generation, spatial-prior filtering, semantic aggregation, Swin Transformer classification, and confidence-based rejection. These modules jointly support candidate localization, invalid-region suppression, and final category prediction.
4.7. Limitations
This study still has several limitations. First, dense bounding-box or pixel-level annotations were not available for all complete field images, so detection-style metrics such as mIoU, AP50, and AP75 could not be systematically reported. Second, the complete-field-image evaluation subset contained only 60 images, which limits the statistical generalizability of EV-LHR. Third, EV-LHR is an expert-defined metric, although blind expert verification and confidence intervals were used to reduce subjectivity. Fourth, the full dataset cannot be publicly released because it contains private dwellings, sensitive heritage locations, and unpublished field photographs. Finally, the dataset still has a long-tailed category distribution, and rare motifs remain more difficult to recognize than frequent categories.
5. Conclusions
This study addressed the recognition of decorative motifs in the image based documentation of traditional vernacular architectural heritage. A dataset of architectural decorative motif images from Guanzhong traditional vernacular dwellings was constructed, and a recognition workflow combining SAM-based candidate generation, spatial-prior filtering, semantic aggregation, Swin Transformer classification, and confidence-based rejection was proposed. The workflow reduces interference from non-motif regions such as wall joints, stains, shadows, and weathered textures.
The experimental results show that, under the dwelling-level grouped split, the proposed method achieved a micro-averaged component-level Accuracy of 88.32% and a macro F1-score of 88.22% over valid component classes. The expert-verified evaluation on 60 complete field images further showed an EV-LHR of 68.3%, outperforming the YOLOv8n baseline by 10.0 percentage points. These results indicate that the workflow has practical value for organizing motif regions in complex field images and can provide technical support for the digital documentation, image retrieval, and conservation management of architectural decorative motifs in traditional vernacular dwellings.
In practical architectural heritage documentation, the proposed workflow can be used as a semi-automatic tool for organizing field images and generating motif-level visual indexes. The system is suitable for batch processing of field photographs, but manual verification remains necessary for rare motifs, heavily damaged components, and ambiguous symbolic compositions. In terms of deployment, the main computational cost is concentrated in SAM-based candidate generation, while the classification and rejection stages are relatively lightweight. When transferred to other regions or other types of architectural heritage motifs, the workflow may require re-annotation of local motif categories, adjustment of spatial-prior thresholds, and additional training samples for region-specific decorative forms.